A Differential Phase-Modulated Interferometer with Rotational ...
Upload
independentCategory
view
3download
0
Asymmetry in the F1-ATPase and Its Implications for theRotational Cycle
Sean X. Sun,* Hongyun Wang,y and George Osterz
*Department of Mechanical Engineering and Whitaker Institute of Biomedical Engineering, Johns Hopkins University, Baltimore, Maryland;yDepartment of Applied Mathematics and Statistics, Jack Baskin School of Engineering, University of California, Santa Cruz, California;and zDepartment of Molecular and Cellular Biology and College of Natural Resources, University of California, Berkeley, California
ABSTRACT ATP synthase uses a rotary mechanism to carry out its cellular function of manufacturing ATP. The centralg-shaft rotates inside a hexameric cylinder composed of alternating a- and b-subunits. When operating in the hydrolysis directionunder high frictional loads and low ATP concentrations, a coordinated mechanochemical cycle in the three catalytic sites of theb-subunits rotates the g-shaft in three 1208 steps. At low frictional loads, the 1208 steps alternate with three ATP-independentsubsteps separated by ;308. We present a quantitative model that accounts for these substeps and show that the observedpauses are due to 1), the asymmetry of the F1 hexamer that produces a propeller-like motion of the power-stroke and 2), therelatively tight binding of ADP to the catalytic sites.
INTRODUCTION
ATP synthase consists of two rotary motors connected by an
elastic shaft (the g-subunit). The Fo subunit is driven by
a transmembrane proton-motive force that, under normal
circumstances, drives the rotation of the g-shaft to release
newly synthesized ATP from the three catalytic sites in the
F1 hexamer. Figs. 1 a and 2 a show the F1 hexamer in cross-
section and top views.
Rotation of the F1 motor was first visualized by attaching
a fluorescent actin filament to the g-shaft (Noji et al., 1997;
Adachi et al., 2000). More recent experiments reduced the
frictional drag on the rotationbyusing40-nmgoldbeads to tag
the g-shaft (Yasuda et al., 2001). These experiments revealed
that each 1208 rotationwas broken into a 908 substep followed
by a 308 substep. Moreover, the dwell time between the 908
and 308 substeps was independent of ATP concentration, but
the dwell time between the 308 and 908 substeps was ATP-
concentration dependent. Here we describe a new mathemat-
ical model that quantitatively explains these new observa-
tions.
The mechanical escapement that drives rotation of the
g-shaft could only bededuced afterWalker’s group succeeded
in capturing the atomic structure of the F1 motor in several
chemical states along the hydrolysis pathway (Abrahams
et al., 1994; Shirakihara et al., 1997; Menz et al., 2001).
Interpolating between the crystal structures demonstrated
that the eccentric g-shaft was driven by sequential hinge-
bending motions of the b-subunits, in which the upper part
of the b-subunit bent ;308 with respect to the lower part
(Wang and Oster, 1998; Oster and Wang, 2000a). A helix-
turn-helix (HTH) motif at the tip of the b-subunit pushes
against the eccentric g-shaft, rotating it much like turning the
crank on an automobile jack (see Fig. 1 b).A striking feature of the F1 motor was its extremely high
efficiency (Yasuda et al., 1998; Wang and Oster, 2001). This
can only be achieved if the torque generated by the motor is
nearly constant, a deduction consistent with direct obser-
vations (Kinosita et al., 1999). Further analysis, coupled with
molecular dynamics studies, led to the conclusion that the
power-stroke that drives the bending of the b-subunit is
driven mostly, if not entirely, by the progressive binding of
ATP to the catalytic site (Wang and Oster, 1998; Oster and
Wang, 2000a; Antes et al., 2003; Sun et al., 2003). The hy-
drolysis step weakens the binding of products to the cat-
alytic site sufficiently for them to be released so that the
cycle can be repeated. The unisite kinetics, coupled with the
high efficiency, suggested that the power-stroke proceeded
in two steps. Nucleotide binding drives the primary power-
stroke to bend the b-subunit. But during that motion, elastic
energy is stored in the b-sheet whose loops grasp the
nucleotide (Sun et al., 2003). A secondary recoil power-
stroke releases this stored energy to aid the primary power-
stroke of the adjacent b-subunit.
A MODEL FOR THE F1 MOTOR
To formulate the model quantitatively, the nucleotide hydrolysis cycles must
be coupled to the conformational motions of the protein. Each of the three
catalytic sites progress through four occupancy states (Wang and Oster,
1998; Oster and Wang, 2000a), as
Empty $ ATPBound $ ADP:Pi $ ADP $ Empty: (1)
At any instant, the a3b3 hexamer is in one of 43 ¼ 64 possible states. The
progress of the three reactions can be pictured as hopping in a 4 3 4 3 4
periodic lattice according to the Markov model, where
drðsiÞdt
¼ Kðu; si�1; si11Þ � rðsiÞ i ¼ 1; 2; 3: (2)
Here si denotes the occupancy state of b-subunit i; r(si) denotes a vector
containing the probabilities of subunit i being in states si ¼ E, T, DP, and D;
Submitted September 9, 2003, and accepted for publication December 11,
2003.
Address reprint requests to George Oster, University of California, Dept. of
Molecular and Cellular Biology and ESPM, 201 Wellman Hall, Berkeley,
CA 94720-3112. Tel.: 510-642-5277; Fax: 510-642-7428; E-mail: goster@
nature.berkeley.edu.
� 2004 by the Biophysical Society
0006-3495/04/03/1373/12 $2.00
Biophysical Journal Volume 86 March 2004 1373–1384 1373

u is the rotational angle of the g-shaft; and K is the transition matrix. The
transition rates in K are obtained by modifying the unisite kinetics to their
multisite values as described in the Appendix.
The rotation of the g-shaft plays a central role in coordinating the
chemical states, and its motion can be described by a collection of Langevin
equations of the form
zdu
dt¼ � @
@uCðu; s1; s2; s3Þ � fLoad 1 fBðtÞ; (3)
where z is the viscous drag coefficient on the g-shaft (z is large for the actin
filament experiments and small for the bead experiments); fLoad is the load
torque from an external conservative force (e.g., a laser trap); fB(t) is the
Brownian torque due to thermal fluctuations; and C(u,s1,s2,s3) is the
potential driving rotation of the g-shaft (i.e., �@C/@u is the motor driving
torque). The driving potential is the sum of the potentials from the three
b-subunits as
Cðu; s1; s2; s3Þ ¼ Vs1ðuÞ1Vs2ðu1 2p=3Þ1Vs3ðu� 2p=3Þ:
The potential caused by one b is one of the four potentials (VE, VT, VDP, and
VD). Thus at any instant, the composite potential C(u,s1,s2,s3) is one of 64
possible functions.
The four potentials characterizing each b are shown in Fig. 2, and the
regions where the chemical transitions between potentials can occur are
shown as shaded contour paths. The details of the driving potentials are
given in the Appendix, along with the complete forms of the equations and
the numerical method of solution. Briefly, the functional forms of the
potentials are obtained by invoking the high efficiency of the F1 motor
(Kinosita et al., 2000; Oster andWang, 2000b) to model each b as a constant
force elastic element in the bending angle, f. The high efficiency of the F1motor also implies a tight mechanical coupling between b and g. A simple
mechanical linkage gives a function that relates f with the rotation angle, u.
In this fashion, the bending force generated at the catalytic site of each b is
converted into potentials driving the rotation of g. It is important to point out
that the actual functional form of the potentials is not critical so long as their
relative depths and general shape are similar to the form we propose.
The general shapes of the individual potentials from each b can be
understood by considering the b-subunits as elastic bodies with their
equilibrium positions dictated by the identity of the nucleotides in the
binding pocket. For VT, VDP, and VD, the nucleotides interact strongly with
the pocket so that the lowest energy configuration is the closed position. For
VE, i.e., without the nucleotide closing the pocket, the b-subunit prefers to be
in the open position. Furthermore, inasmuch as the escapement tightly
couples the bending of the b-subunit to the rotation of the g-subunit and the
position of g uniquely defines the conformation of b, all the potentials are
2p-periodic.
The asymmetry of the power-stroke arises because of the asymmetric
construction of the hexamer subunits. Each catalytic site lies at the interface
between a- and b-subunits and the locus of the hinge-bending motion is
around the b-sheet whose loops grasp the nucleotide (Sun et al., 2003).
Consequently, the bending motion of each b-subunit is not directed toward
the center axis of the hexamer, but has a small propeller component of its
motion toward the adjacent a-subunit. We have deduced from the in-
terpolated structures that the bending motion of each b is directed slightly
off center, at an angular position 1508 when b is completely closed. Thus the
maxima of VE and the minima of VT are at 1508 rather than at 1808.
We obtain the depth of VE from the free energy computed from the unisite
kinetics (Weber and Senior, 1997; Al-Shawi et al., 1989). There are two free
energy drops: DG ¼ 14 kBT upon ATP binding and 10 kBT upon product
release. We attribute the first drop to the power-stroke driven by ATP
binding (see below), and the second drop to the recoil power-stroke as the
b-subunit unbends to its open configuration. During ATP binding, 14 kBT of
the 24 kBT ATP-binding free energy is delivered directly to turn the g-shaft
and the remaining 10 kBT is stored as elastic energy when the b-subunit is
maximally bent. Thus the depth of VT(u) is 14 kBT and the depth of VE(u) is
10 kBT. The bending of the b-subunit is driven by the progressive annealing
of hydrogen bonds between ATP and the catalytic site. This generates
a nearly constant bending torque on the b-subunit (Oster and Wang,
2000a,b; Antes et al., 2003; Lutkenhaus and Sundaramoorthy, 2003). The
high efficiency of the motor requires that the motor torque in Eq. 3 is nearly
constant (Wang and Oster, 2001; Oster and Wang, 2000b). Therefore, the
slope of VT(u) is nearly constant over most of its descent. The shapes of
potentials are determined by the crankshaft escapement that converts the
bending of the b into the rotation of the g-shaft. In the Appendix we give the
trigonometric forms of the potentials plotted in Fig. 2.
The complete shape of VDP(u) corresponding to bound products in the
catalytic site is unknown. However, we need only consider its shape near the
minima of VT (see Fig. 2 B) because transitions between the T and DP states
can only take place when ATP is tightly bound (i.e., at the minima of VT).
Moreover, the equilibrium constant between T $ DP is close to unity.
Therefore,VDP lies very close toVT near itsminimum.We have approximated
VDP by a curve that nearly coincides with VT near its minimum. The exact
shape of VDP away from this segment does not affect any of our conclusions.
Finally, we estimate the depth of VD by scaling VT by a factor, VD(u) ¼aVT(u), where a is approximately two-thirds, since the interaction of ADP
FIGURE 1 Schematic of ATP synthase.
(a) Cross section of the F1 assembly
showing the b-subunit bending to turn
the g-shaft. (b) Cartoon showing the
escapement for the F1 motor. Bending of
the b-subunits is driven by the sliding of
the P-loop over the ATP phosphates. The
helix-turn-helix at the C-terminal tip of the
b-subunit pushes on the eccentric g-shaft
to produce the rotary torque.
1374 Sun et al.
Biophysical Journal 86(3) 1373–1384

with the catalytic site should be weaker than ATP due to one less phosphate,
so the total number of hydrogen bonds is reduced from �18 to �12 (Antes
et al., 2003). Thus, after hydrolysis, ADP is still held rather tightly; we will
see that this leads to one of the pauses observed experimentally.
At any position during the rotation, the total driving potential in Eq. 3 is
the sum of the individual contributions from three b-subunits. This is
represented schematically in Fig. 2 as three legs, spaced 1208 apart, moving
on one set of four potentials. The model Eqs. 2 and 3 are solved numerically
where all parameter values are determined from the experimental data and
tabulated as described in the Appendix.
Finally, specific interactions between the rotating g-shaft and the b-
subunits are required to regulate binding of nucleotide and release of
products, analogous to the camshaft on a gasoline engine. We refer to these
interactions as binding and release gates. They are achieved via several
critical residues on the g, found in mutation experiments (Nakamoto et al.,
2000, 1999). In Fig. 3 we show the spatial relationships of these critical
residues with b-subunits. The critical residues are in two groups separated in
angular position by ;1008. The residues make contact with two HTH
domains in different regions of the b-subunit. These HTH domains are
connected to the catalytic site via the b-sheet so that when they interact with
FIGURE 2 (A) Top view of the F1 hexamer showing the
alternating a- and b-subunits encircling the central g-shaft.
The catalytic sites are numbered. Sequential bending of
each b-subunit toward a point ;1508 across the diameter
drives the rotation of the g-shaft. (B) The g-shaft is driven
by the coordinated bending of the three b-subunits, each
of which could be one of four potentials, one for each
occupancy state, VE, VT, VDP, and VD. The total torque is
given by the sum of the potentials at the three leg positions
spaced 1208 apart. The first set of legs shows the system
just after ATP binding in site 1 at the beginning of its
power-stroke. Site 3 has just released its Pi, site 2 is empty
and aiding site 1 during its recoil power-stroke. The second
set of legs shows the system at a pause position just before
ADP release from site 3. Site 2 is empty and has finished its
recoil power-stroke. Site 1 is near the end of its primary
power-stroke and contributes a positive driving torque; it is
balanced by the negative torque from site 3 in D state. The
positive torque from site 1 drives the opening of site 3,
which promotes ADP release from site 3. Upon the ADP
release from site 3, site 1 finishes its primary power-stroke
and drives the system to a position where site 2 waits ATP
binding. The separations between the curves corresponds
to the experimental conditions: [ATP] ¼ 2 3 10�3 M,
[ADP] ¼ 1 3 10�7 M, and [Pi] ¼ 1 3 10�4 M.
F1-ATPase Pauses 1375
Biophysical Journal 86(3) 1373–1384

the g-shaft, ADP release and ATP binding can occur. From the mutation
studies and the predictions of our model, we believe that gMet-23 is critical
for triggering ADP release; gArg-104 and gGlu-105 are critical for
triggering ATP binding as shown in Fig. 3. We now demonstrate that the
model reproduces virtually all of the available experimental data.
RESULTS
We first calculated the rotational speed of the F1 motor under
various load conditions and nucleotide concentrations. Fig.
4, top, shows the model results compared to the experiments
when an actin filament is attached to the g-shaft (Yasuda
et al., 1998). Subsequent experiments employed a small
bead attached to the g-shaft (Yasuda et al., 2001). As the
drag coefficient is reduced dramatically (with small beads),
the rotational speed saturates even for high ATP concentra-
tions, as shown in Fig. 4, middle. At 2 mM ATP, the
rotation is limited by ATP binding; at 2 mM ATP, it is
limited by ADP release. Fig. 4, bottom, shows the rotation
rate as a function of ATP concentration for a 40-nm bead and
for a 1-mm actin filament. The rate-limiting process at high
viscous loads is the mechanical step of completing the
power-stroke, whereas at low viscous loads, chemical steps
are rate-limiting—i.e., waiting for ATP to bind (at low ATP
concentration) or waiting for ADP release (at high ATP
concentration). Next we show how the interplay between
these two rate-limiting chemical steps is responsible for the
observed rotational substeps.
The substeps observed under low viscous loading provide
important new insights into the operation of the F1 motor.
Fig. 5, a and b, shows two typical trajectories at high and lowATP concentrations. At 2 mM ATP, the rate-limiting step of
ADP release gives rise to pauses in the rotation of the g-shaft
at relative angles of 908, 2108, and 3308, whereas at 20 mM
ATP additional pauses appear at 08, 1208, and 2408, as
catalytic sites await the arrival of ATP. Since the experi-
ments only give the relative positions of the pauses, we
redefine the u ¼ 08 position as the (most likely) beginning
position of power-stroke as shown in Fig. 5 d (u ¼ 08 in Fig.
5 corresponds to u ¼ 308 in Fig. 2). Fig. 5c shows computed
histograms of the pauses at several ATP concentrations. At 2
mM ATP the pauses are centered at 908; at 20 mm ATP there
are two peaks at 908 and 1208; and at 2 mM, the pauses are
centered at 1208. Both the trajectories and the histograms
agree with the experimental results (Yasuda et al., 2001).
Fig. 5 d summarizes the sequence of events responsible for
the pauses; their mechanical basis can be understood from
Fig. 2 B. First consider the case when the ATP concentration
is high. When the g-shaft is at u ¼ 08, the progressive
binding of ATP at site 1 is driving a power-stroke that, if
unhindered, would turn the g-shaft to u ¼ 1208 (1508 across
the diameter from site 1, which is at u ¼ �308 in Fig. 5).
However, ADP bound at site 3 stalls out the power-stroke at
u ¼ 908. (Fig. 2 B, the second set of three legs, shows when
the slope of VT is equal to the negative slope in VD.) When
the ADP is released, the driving potential for site 3 switches
from VD!VE and site 1 can complete the power-stroke to u
¼ 1208, now assisted by site 3’s recoil power-stroke. At u ¼1208 ATP immediately binds to site 2 commencing its
power-stroke. When the ATP concentration is low, an
additional pause takes place at u ¼ 1208 whereas site 2 waits
for ATP binding. This sequence of events completely
explains the observed pauses in the g-shaft’s rotation. At
2 mM ATP, the timescale for ATP binding is very short and
only the ADP release step is observed (Fig. 5 c, top panel).At 20 mM ATP, the timescales for ATP binding and ADP
release are comparable, and two pauses appear in the
histogram (Fig. 5 c, middle panel). At 2 mM ATP the pause
is dominated by the waiting time for ATP binding.
The complete agreement between the predictions of the
model and the experiments demonstrates that the observed
pauses are due to the asymmetry in the structure of the
b-subunits. Because the bending motion is off-center, the
minima of the elastic energy potentials for the T, DP, and Dstates are offset from 1808, to ;1508 (Fig. 2). If the bending
FIGURE 3 The g-shaft triggers ATP
binding and ADP release via specific
interactions with two HTH domains (in
red) of b. The residue gMet-23 is 1008 (in
angular position) ahead of the residues
gArg-104 and gGlu-105. Therefore, we
infer that gMet-23 triggers ADP release,
and gArg-104 and gGlu-105 trigger ATP
binding.
1376 Sun et al.
Biophysical Journal 86(3) 1373–1384

FIGURE 4 (Top) Model predictions for the actin
filament rotation experiments at various ATP concen-
trations. The theoretical results are the solid lines and the
experimental measurements are the symbols. (Lines and
symbols of the same color are for the same ATP
concentration.) In these experiments the rotational speed
is limited by the viscous drag force on the actin filament.
(Middle) Nanometer-sized beads have very small drag
coefficients, close to the unloaded conditions. The model
prediction (solid lines) and the experimental results
(symbols) show that the rotational speed saturates to
a maximum speed at very small friction coefficients. The
rotational speed at these conditions is limited by the
kinetics of ATP binding and ADP release. (Bottom)Rotational speed versus ATP concentration for actin (red
lines and symbols) and 40-nm beads (blue line and
symbols). The lines are model results. The symbols are
experimental results. The model correctly predicts the
rotational speed over the range of ATP concentrations in
experiments.
F1-ATPase Pauses 1377
Biophysical Journal 86(3) 1373–1384
motion were toward the center of the hexamer, then the
minima of the elastic potentials would be at 1808 and the
double peaks in the histogram at 20 mM would be absent.
The angular position where the motor is awaiting ATP
binding and the position where it is waiting for ADP release
would be indistinguishable, leaving but a single peak at all
ATP concentrations.
Before ADP is released, the pause at u¼ 908 corresponds to
an occupancy state of (T, E, D) in sites (1, 2, 3) as shown
in Fig. 5 d. This occupancy state corresponds precisely to
Walker’s original F1-ATPase structure. Our model suggests
that Walker’s structure corresponds to the 908 paused
configuration in the Kinosita/Yoshida single molecule
experiments. The model agrees completely with recent fluo-
rescence resonance energy transfer measurements of F1 by
Yasuda and co-workers, where they concluded that theg-shaft
in the ATP-waiting state is ;30–408 (in the direction of
rotation) from that inWalker’s structure (Yasuda et al., 2003).
The combined experimental and theoretical evidence indicate
thatWalker’s structure corresponds to thepre-ADPrelease state.
DISCUSSION
Recent molecular dynamics studies reinforce the major
assumptions of the model:
1. The power-stroke is generated by progressive binding of
ATP to the catalytic sites that drives the hinge-bending
motion of the b-subunits that in turn drive the rotation of
the g-shaft (Oster and Wang, 2000a; Antes et al., 2003).
2. At the same time, the bending of the b-subunit deforms
the b-sheet adjacent to the catalytic site. This de-
formation stores elastic energy in the sheet that is
released to drive a recoil power-stroke. This accounts for
the two free energy drops observed in the unisite kinetics.
Themodel demonstrates that the rotational pauses observed in
the Yasuda and co-workers’ experiments are quantitatively
explained by the tight binding of ADP and two intrinsic
asymmetries in the F1 motor (Yasuda et al., 2003). First, the
catalytic site and the power-stroke motion in the a3b3
hexamer have an inherent handedness such that the power-
stroke driven by the bending b-subunit has an offset of;308.
This biases the direction of rotation because the bending
motion of each b-subunit is tightly coupled to the eccentric
g-shaft. Second, the g-shaft itself must regulate the binding
and release of nucleotides via asymmetric interactions withb.
In summary, the mechanochemical model presented here
quantitatively explains all of the mechanochemical behavior
of the F1 motor. We have emphasized that asymmetry
inherent in the structure of F1 and the power-stroke is the
explanation for the observed pauses. The nearly constant
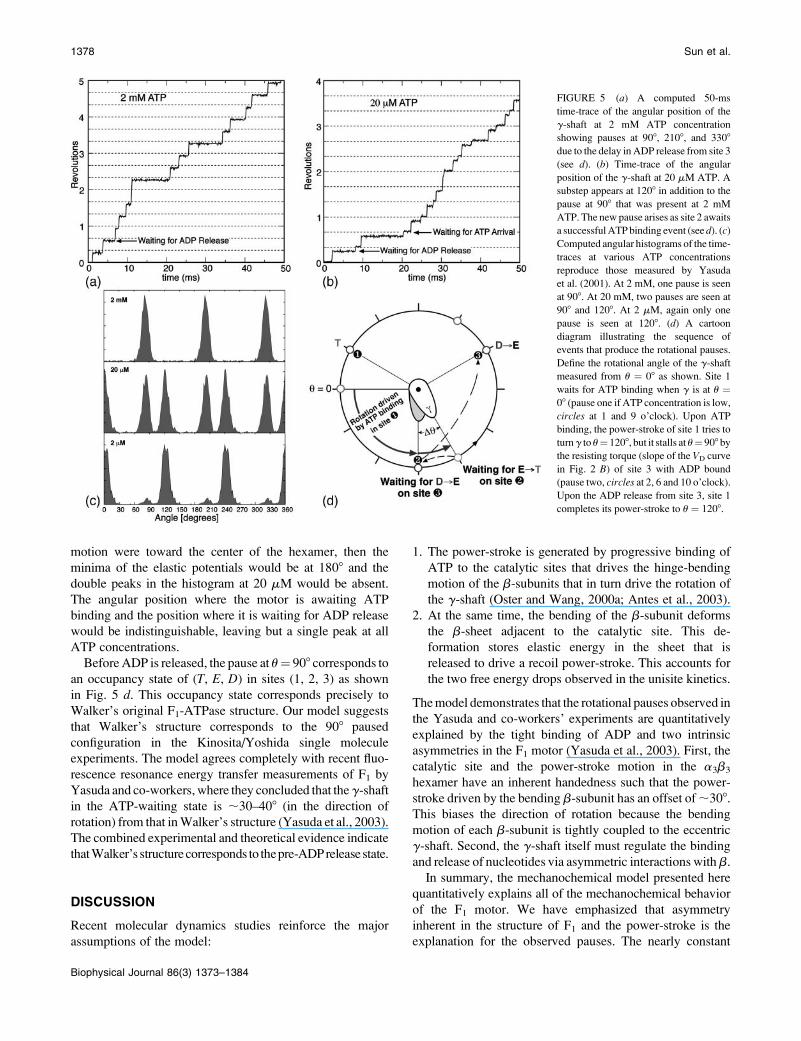
FIGURE 5 (a) A computed 50-ms
time-trace of the angular position of the
g-shaft at 2 mM ATP concentration
showing pauses at 908, 2108, and 3308
due to the delay in ADP release from site 3
(see d). (b) Time-trace of the angular
position of the g-shaft at 20 mM ATP. A
substep appears at 1208 in addition to the
pause at 908 that was present at 2 mM
ATP. The new pause arises as site 2 awaits
a successful ATPbinding event (see d). (c)
Computed angular histograms of the time-
traces at various ATP concentrations
reproduce those measured by Yasuda
et al. (2001). At 2 mM, one pause is seen
at 908. At 20 mM, two pauses are seen at
908 and 1208. At 2 mM, again only one
pause is seen at 1208. (d) A cartoon
diagram illustrating the sequence of
events that produce the rotational pauses.
Define the rotational angle of the g-shaft
measured from u ¼ 08 as shown. Site 1
waits for ATP binding when g is at u ¼08 (pause one if ATP concentration is low,
circles at 1 and 9 o’clock). Upon ATP
binding, the power-stroke of site 1 tries to
turng tou¼1208, but it stalls at u¼ 908 by
the resisting torque (slope of the VD curve
in Fig. 2 B) of site 3 with ADP bound
(pause two, circles at 2, 6 and 10 o’clock).
Upon the ADP release from site 3, site 1
completes its power-stroke to u ¼ 1208.
1378 Sun et al.
Biophysical Journal 86(3) 1373–1384

torque generated by the motor requires ADP release and
subsequent ATP binding to only occur at specific angular
positions of g relative to b, and in the correct direction of
rotation. Thus the rotating g-shaft acts as a timing cam
ensuring that the exhaust and intake parts occur in the right
phase of the hydrolysis cycle. Ourmodel should be contrasted
with the kinetic model of Gao et al. (2003) where a different
set of kinetic states are considered. Our model is consistent
with the kinetic data on F1 as well as single molecule
measurements. When driven in reverse by the Fo motor, F1synthesizes ATP from ADP and phosphate. By adding an
external load torque to the model, it is possible to drive F1 in
reverse and synthesize ATP. However, there is evidence that
the e-subunit changes conformation significantly under these
conditions (Cipriano et al., 2002; Kato-Yamada and Yoshida,
2003). Consequently, the driving potentials we have used in
the model are not applicable in the reverse direction. Our
analysis of ATP synthesis will be presented elsewhere.
APPENDIX A: MATHEMATICAL MODELING OFTHE F1 MOTOR
We model the rotational dynamics of the F1 motor by a high friction
Langevin equation coupled to Markov equations describing chemical
transitions in the catalytic site. These equations generate individual
trajectories of the F1 motor, i.e., time series of the angular position of the
shaft, u, and the sequence of chemical changes in the three b-subunits. Each
of the b-subunits in the a3b3 hexamer can be in any of four occupancy states
(E, T, DP, or D). Thus the composite F1 motor can be in any one of 43 ¼64 [ N occupancy states. We label the composite chemical state using the
index s. Transitions between these states are modeled as Markov processes
governed by transitions rates kss9. (Note kss9 is related to but not the same as
the measured reaction rates such as kE!T. The relationship is given in Eq.
B11.) We write the Markov equations describing the transitions as
drsðuÞdt
¼ +N
s9¼1
kss9ðuÞ � rs9ðuÞ; (A1)
where rs(u) denotes the population density in the r-th chemical state when
the g-shaft is fixed at rotational position u. The sequence of chemical states
is specified by a triplet of occupancy states. For example,
s ¼ 1 ¼ ðE;E;EÞ2 ¼ ðT;E;EÞ3 ¼ ðD;E;EÞ
..
.
N ¼ ðD;D;DÞ
: (A2)
The time-evolution of Eq. A1 can be solved using kinetic Monte Carlo. The
system progresses through a 4 3 4 3 4 periodic cubic lattice where each
vertex labels one of the 64 possible states. The kinetic transition matrix kss9determines the stochastic trajectories through this lattice. In our model, each
transition step involves a change in only one of the catalytic sites. For
example, (E, DP, E) ! (E, D, E) can be achieved in one transition step, but
(E, DP, E)!(E, D, T) requires at least two transition steps.
The evolution in chemical state-space is coupled to the Langevin equation
governing the rotation of the g-shaft,
zdu
dt¼ � @Cðu;sÞ
@u� fload 1 fBðtÞ; (A3)
where s is the composite chemical state of F1 (i.e., the states of three
catalytic sites). z is the apparent viscous drag on the g-shaft that is varied to
model different attached objects. (See Appendix B, Kinetics, for a more
detailed discussion.) @C(u,s)/@u is the total motor torque driving the rotation
of the g-shaft, whereC(u;s) is the potential corresponding to chemical state
s. The total driving potential consists of contributions from three b-subunits.
In our model, the angular position of the g-shaft determines uniquely the
bending angles of the three b-subunits, and the three b-subunits are 1208
apart. Therefore, the total elastic potential can be written as
Cðu;sÞ ¼ Vs1ðu� 2p=3Þ1Vs2ðuÞ1Vs3ðu1 2p=3Þ:(A4)
Here s1, s2, and s3 are the chemical states of three catalytic sites, i.e., s ¼ (s1,
s2, s3). For example, if s ¼ (E, T, D), then
Cðu; ðE; T;DÞÞ ¼ VEðu� 2p=3Þ1VTðuÞ1VDðu1 2p=3Þ:(A5)
Ensembles of stochastic angular trajectories from Eqs. A1 and A3 can be
averaged to obtain the rotational speed of F1 motor. Alternatively, one can
directly solve for the probability density of the g-shaft position, rs(u). The
governing equation for the probability density is the high-friction limit of
the Fokker-Planck equation (Risken, 1989). The time-evolution of the
probability density is given by
@rsðu; tÞ@t
¼ 1
z
@
@u
@Cðu;sÞ@u
1 fload
� �rsðuÞ
� �1D
@2rsðuÞ@u
2
1 +N
s9¼1
kss9ðuÞrs9; (A6)
where rs(u,t),s ¼ 1, 2, ��� 64 is the angular probability density for the sth
state. D is the diffusion constant given by D ¼ kBT/z. The transition matrix
kss9 is the same matrix appearing in Eq. A1.
In most instances, we are interested in the steady-state situation where
rs(u, t) is not changing in time. This is obtained from the solution of Eq. A6
with the time-derivative set to equal zero. Quantities such as the average
rotational speed, fluxes between different states, and site occupancies all can
be computed from the steady-state probability densities rs(u).
The method of solution for Eq. A6 has been published elsewhere
(Mogilner et al., 2002; Wang et al., 2003); here we summarize the method.
Since Eq. A6 is invariant under a rotation that permutes the labels on the
sites, it is sufficient to solve for rs(u) only in the interval from 0 to 1208. We
discretize the angular interval in increments of size Du. We label the
probability density of the sth chemical state at nth angular interval as rs,n.
Eq. A6 can be discretized as
@rs;n
@t¼ Fs;n�1rs;n�1 � ½Bs;n 1Fi;n�rs;n 1Bs;n11rs;n11
1 +N
s9¼1
kss9;nrs9;n; (A7)
where Fs,n is the forward transition rate from interval n to n1 1 and Bs,n is
the reverse transition rate from interval n to n � 1. Since these transition
rates obey detailed-balance, we have the condition
Fs;n
Bs;n11
¼ expCðun;sÞ �Cðun11;sÞ
kBT
� �: (A8)
The jump rates Fs,n and Bs,n, determined from detailed-balance condition
and local approximate solutions (Mogilner et al., 2002), are given by
Fs;n ¼D
Du2
Cðun11;sÞ �Cðun;sÞexp½ðCðun11;sÞ �Cðun;sÞÞ=kBT� � 1
;
F1-ATPase Pauses 1379
Biophysical Journal 86(3) 1373–1384

Bs;n11 ¼ � D
Du2
Cðun11;sÞ �Cðun;sÞexp½�ðCðun11;sÞ �Cðun;sÞÞ=kBT� � 1
:
(A9)
Eq. A7 has the form
@r
@t¼ K � r; (A10)
where r is a vector containing rs,n. The matrix K contains chemical
transition rates kss9 and the angular jump rates, Fs,n and Bs,n. The steady-
state solution for rs,n is the nontrivial solution of Eq. A10 with the left-
hand side set to zero. To obtain individual trajectories of the F1 system
progressing through (s,u) space, we perform a kinetic Monte Carlo
simulation in (s,n) state-space. Starting at state (s,n), random numbers are
drawn from an exponential distribution
PðDtÞ ¼ expð�rs;nDtÞ; (A11)
rs;n ¼ +ðs9;mÞ6¼ðs;nÞ
Kðs;nÞ!ðs9;mÞ; (A12)
where rs,n is the rate of jumping out of state (s,n). The random number Dt isthe time needed to make a transition from state (s,n) to a different state. An
additional random number determines the identity of the destiny state from
the ratio
Pðdestiny ¼ ðs9;mÞÞ ¼ Kðs;nÞ!ðs9;mÞ
rs;n: (A13)
Iteration of this process gives a trajectory through the (s,u) space.
Experiments measure u as a function of time. The experimental apparatus
has finite time resolution ranging from 0.0001 s to 0.004 s (Noji et al., 1997;
Yasuda et al., 2001). We mimic the experimental time-trace by averaging the
Monte Carlo trajectory over intervals corresponding to the experimental
time resolution. The time-traces displayed in the main text are determined in
this fashion.
For a given set of driving potentials, Vsi ðuÞ, and kinetic transition rates,
kss9, the mathematical steps outlined here give the measurable quantities
such as time-traces and rotational speeds. The remaining sections describe
how structural and physical considerations fix the model parameters.
APPENDIX B: CONSTRUCTION OF THE MODEL
The kinematics of F1
The mechanical motion of F1 during the power-stroke was analyzed by
Wang and Oster (1998). Here, we summarize their interpolation procedure.
The structures of Walker (Abrahams et al., 1994) show that the F1 hexamer
is approximately sixfold symmetric at the N-terminal end. Ca atoms of
b-GLU26 (Bovine convention) from the bottom portion of the subunits
provide a fixed frame from which a cylindrical coordinate system can be
constructed as shown in Fig. 6. Every atom in the a3b3 hexamer is assigned
a coordinate in the cylindrical coordinate system. The hydrolysis cycle in
each catalytic site proceeds through the states E!T!DP!D!E. Walker’s
structures for the b-subunits are configurations along this cycle. To find the
conformational change connecting one configuration to the next, the
positions of the atoms are linearly interpolated within the cylindrical
coordinate system. For example, since bE goes to bT, coordinates of atoms
in bE and bT are endpoints of interpolation from E!T. Similar procedure is
carried out for all the other subunits within the Walker structures.
The interpolation reveals that the b-subunits undergo a hinge-bending
motion during the transition from E to T. The bend is centered at a b-sheet
directly behind the catalytic site (Sun et al., 2003). The a-subunits remain
relatively stationary during the interpolated motion. During the bending
motion, the helix-turn-helix (HTH) motif at the C-terminal end of the
b-subunit impacts the eccentric g-shaft so that a torque is applied to the
shaft. In contrast, when b proceeds from T!D (bypassing DP for the
moment), very little conformational change is observed. This suggests that
the chemical changes in the catalytic site from T!DP!D do not directly
contribute to the power-stroke. The final step from D!E again produces
a conformational change resembling the reverse of E!T. We interpret this
motion as a recoil step where the deformed b-sheet acts as a spring tending
to restore the b-subunit to its open conformation after the hydrolysis
products are released (Sun et al., 2003). These conformational motions
constitute the kinematic basis for our dynamical model.
Dynamics of F1 motor
Elastic potentials
The elastic potential functions that drive the bending motion of the
b-subunits are derived from free energy changes of the complete hexamer
(Sun et al., 2003). In principle, these functions could be obtained frommolec-
ular dynamics simulations. However, without resorting to this level of detail,
we derive the elastic potentials from a simple mechanical model that satisfies
certain structural constraints. First, we assume that the bending motion of
the b-subunit is tightly coupled to the rotational angle of the g-shaft. This
ensures that the bending coordinate, f, maps one-to-one onto the rotational
angle, u. Fig. 7 shows the relationship between the bending angle f and the
shaft rotation angle u. Second, in accord with the assumptions in the Binding
Zipper model (Oster and Wang, 2000a), the power-stroke is driven by the
progressive formation of hydrogen-bonds between the catalytic site and
the nucleotide. Therefore, we take the elastic potential as a function of the
bending angle f to be (see Fig. 7)
VsiðfÞ ¼ fsif; (B1)
where fsi is the force constant with respect to f for the occupancy state si.The sign of fsi determines whether the b-subunit prefers to be closed or open.
When b is closed, the angle f is;508; when b is open, the angle f is;808.
FIGURE 6 The cylindrical coordinate system used for interpolation. The
N-terminal portion of chains D–F (from PDB 1BMF) is nearly sixfold
symmetrical. Ca atoms from Glu-26 are used to define a cylindrical
coordinate system depicted in the graph. Each atom in the b-subunit is
assigned a coordinate (r, u, z) in this coordinate system.
1380 Sun et al.
Biophysical Journal 86(3) 1373–1384

Thus, the allowed range, Df, is;308. When si is equal to T, DP, or D state,
the b-subunit prefers to be closed. When si ¼ E, the b-subunit prefers to be
open. That is, fT[ 0, fDP[ 0, fD[ 0, and fE\ 0.
To transform the elastic potentials in f into potentials as functions of the
shaft angle u, a mechanical escapement is required, i.e., a geometric
relationship between f and u. This is obtained as follows. In Fig. 7 the three
driving pistons representing the b-subunits are 1208 apart. The upper portion
of the piston represents the C-terminal domain of the b-subunit that impacts
the g-shaft. The length of this piston, R, is assumed to be fixed. As the
b-subunit bends, the projection of R in the plane perpendicular to z is L(u).
The geometric relationship between L and u is
LðuÞ ¼ffiffiffiffiffiffiffiffiffiffiffiffiffiffiffiffiffiffiffiffiffiffiffiffiffiffiffiffiffiffiffiffiffiffiffiffiffiffiffiffiffir2
1 1 r2
2 � 2r1r2cosðuÞq
� r1; (B2)
where r1¼ 5 nm and r2¼ 1 nm. (In this equation, L increases as u goes from
0 to p.) But, from Fig. 7 b, we have
LðfÞR cosðfÞ: (B3)
Setting Eq. B2 equal to Eq. B3 gives the desired relationship between u and
f. Fig. 7 d is a plot of f vs. cos(u), showing that f is a nearly linear function
of cos(u). Thus, we shall set f ¼ c1 cos(u) and write Vsi as a linear function
of cos(u),
VsiðuÞ ¼ fsi cosðuÞ: (B4)
We use fT ¼ fDP ¼ 7 kBT, fD ¼ 5 kBT, and fE ¼ �5 kBT. This set of values isselected so that the depth of VT and VDP is 14 kBT and the depth of VD and VE
is 10 kBT, in accordance with the Binding Zipper model (Oster and Wang,
2000a). For ATP binding, 15–17 hydrogen bonds are eventually formed
between ATP and the binding pocket (Antes et al., 2003). The free energy
change for forming these hydrogen bonds is�24 kBT. In the bending motion
of the b-subunit, 10 kBT of the 24 kBT-binding free energy is stored as elastic
strain energy in the deformed b-sheet. The remaining 14 kBT directly drives
the rotation of g. The 10 kBT stored elastic energy drives the recoil power-
stroke after ADP release when the catalytic site is empty. Thus, the depth of
VT is 14 kBT and the depth of VE is 10 kBT.
The transitions between the T and DP states can only take place when
ATP is tightly bound (i.e., at the minima of VT). Thus, we need only the
shape of VDP near the minima of VT. The equilibrium constant between states
T andDP is close to unity (Boyer, 1993). VDP should be very close to VT near
its minima. We choose fDP ¼ fT. The shape of VDP away from its minima is
irrelevant. Because the interaction of ADP with the catalytic site is weaker
than that of ATP, we make the depth of VD 10 kBT. This completely specifies
the elastic potentials for the four occupancy states.
Asymmetry of the power-stroke
Closer examination of the power-stroke motion reveals that the motion of the
C-terminal HTH domain that drives the g-shaft is not directed along the
diameter toward 1808. Rather, the propeller-like motion of the power-stroke
is directed slightly off center, toward �1508. To model this effect in the
elastic potential, the same functional form for the Vsi ðuÞvalues are taken,
with u replaced by u(u) where u(u) models the propeller bias:
uðuÞ ¼ 180
150u if 0# u# 150
uðuÞ ¼ 180
210u1 180 1� 150
210
� �if 150# u# 360:
(B5)
The elastic potentials Vsi ðuÞ are replaced by Vsi ðuðuÞÞ. By scaling the angleslinearly, theminimum(andmaximum) of the elastic potential is constructed to
be at 1508. This completely specifies the elastic potential for a single b-
subunit as a function of the g-shaft angle u. No additional modifications in the
potential are necessary to produce the correct hydrolysis and synthesis rates.
FIGURE 7 (a) Diagram of the F1 subunit
viewed from the top (membrane side) showing
the three b-subunits whose bending drives the
rotation of the g-shaft. The b-subunits are
shown schematically as three rods. (b) A stick
model illustrating the geometric relationship
between the angle, f, of the bending of the
b-subunit and the length, L, of the HTH lever
arm on b. (c) The relationship between L and u
as the power-stroke goes from 0 to p. The
perspective is from the top of F1 so that the axis
in the z direction is out of the figure. Each
bending b-subunit, viewed from above, acts
like a radial driving piston on the eccentric
portion of the g-shaft. (d) The bending angle f
is nearly a linear function of cos(u).
F1-ATPase Pauses 1381
Biophysical Journal 86(3) 1373–1384

Since there is a one-to-one mapping between the angle f of b and the
angular position u of g, the location of the shaft completely specifies the
mechanical state of the F1 motor. Of all the different states of each b-subunit,
the conformation is most open near u ¼ 08 and most closed near u ¼ 1508.
By the threefold symmetry of the a3b3 hexamer, the total elastic potential
on the g-shaft due to the action of all three b-subunits is the sum of the
individual contributions
Cðu; s1; s2; s3Þ ¼ Vs1ðu� 2p=3Þ1Vs2ðuÞ1Vs3ðu1 2p=3Þ:(B6)
The actual potentials of the individual b-subunits are plotted in the main text.
It is important to note that the power-stroke experienced by g is
a combination of two contributions. The main contribution comes from
the bending b-subunit after binding ATP. Additional contributions come
from the recoil of the E state after ADP is released. Furthermore, if a
b-subunit is in the D state, it resists the rotation of g. The resistance from the
D state is the origin of one of the pauses seen in the experiments.
Kinetics
The reaction rates for the hydrolysis cycle are denoted as kE!T, etc. The
transition rates depend on the mechanical state of the b-subunit, f(u), and
the chemical state of the adjacent catalytic sites. The exact dependence of the
transition rates are not available, and so our parameters derive from several
experimental observations.
First, experiments show that the hydrolysis and synthesis rates are
enhanced by many orders of magnitude when more than one catalytic site is
occupied by nucleotides (Senior, 1992; Weber and Senior, 1997). Thus,
there is a cooperative effect during the F1 chemical cycle such that the
reaction rates in each catalytic site is effected dramatically by adjacent sites.
The exact mechanism of this enhancement is uncertain. To model this rate
enhancement, we take several factors into consideration. Since chemical
transition rates are inversely proportional to the exponential of the free
energy difference between the reactant and the transition state, these rates
may be enhanced by either a lowering of the transition state free energy or
a raising of the reactant free energy. We write the multisite rates as
ksi!s9iðu; si�1; si11Þ ¼ k
u
si!s9i3Mðsi�1; si11Þ3 gðuÞ
3 expDEðuÞkBT
� �;
ks9i!siðu; si�1; si11Þ ¼ ku
s9i!si3Mðsi�1; si11Þ3 gðuÞ
3 expDE9ðuÞkBT
� �; (B7)
where ku is the unisite reaction rate measured by Senior (1992) (see Table 1).
The dependence of M, g(u), DE(u), and DE9(u) on (si11, si�1) is shown in
Table 2. The exponential factors DE(u) and DE9(u) are the elastic energy
contributions to the rate; they account for increase/decrease in the reaction
rates as functions of u. For example, ATP release rate increases as b
becomes open. DE(u) and DE9(u) satisfy
DEðuÞ � DE9ðuÞ ¼ ½ðVsiðuÞ � Vsi
ðusiÞ� � ½ðVs9i
ðuÞ � Vs9iðus9i
Þ�;(B8)
where uE ¼ 08 and uT ¼ uDP ¼ uD ¼ 1508. Eq. B8 fixes the energetic
differences between the driving potentials to approximately satisfy unisite
kinetics
ku
si!s9i
ku
s9i!si
¼ expVsiðusiÞ � Vs9iðus9iÞ
kBT
� �: (B9)
Together, Eqs. B7–B9 ensure that the reaction rates satisfy the detailed-
balance condition,
ksi!s9iðu; si11; si�1Þ
ks9i!siðu; si11; si�1Þ
¼ expVsi
ðuÞ � Vs9iðuÞ
kBT
� �: (B10)
Several critical residues for the rate enhancement have been identified. It
appears certain residues on the g-shaft and the a-subunit side of the binding
pocket are critical for achieving the observed rate enhancement (Nakamoto
et al., 2000, 1999). The enhancement must involve elastic strains induced by
nucleotide binding and rotation of the g-shaft. Without detailed information
on the exact function of these residues, the enhancement factors M are
phenomenological and are made to agree with available experimental results.
The transition rates appearing in Eq. A1 are directly related to the rates
defined in Table 2. Since chemical changes can only occur in one site at
a time, we have
kðE;E;EÞ!ðT;E;EÞ ¼ kE!Tðu� 2p=3; E; EÞkðE;E;EÞ!ðE;T;EÞ ¼ kE!Tðu; E; EÞkðE;E;EÞ!ðE;E;TÞ ¼ kE!Tðu1 2p=3; E; EÞ
..
.
(B11)
This completely specifies our transition matrix, kss9.
Gates
The assumptions stated above specify the approximate dependence of
transition rates on u. To achieve the correct rotation speeds, the binding
of ATP and release of ADP must be triggered at specific positions of the
g-shaft. For ATP binding, the transition from E!T does not become
appreciable until slightly after u ¼ 08. If binding occurred at u ¼ 08, there is
appreciable probability that the power-stroke would be reversed. Thus,
binding and release gates are necessary to ensure the asymmetry of the
power-stroke. Similarly, for ADP release, the transition rates must not
become appreciable until the catalytic site is sufficiently strained. The effect
of switches on the transition rates is contained in the function g(u) in Eq. B7for the transition rate derived from the VD elastic potential.
There is experimental evidence that the position of the g-shaft is crucial in
the enhancement of hydrolysis rates. Mutation studies of amino acid residues
along g have identified several critical positions (Nakamoto et al., 2000,
1999). Substitution of these critical amino acids results in a dramatic
reduction in the overall hydrolysis rate. Examining the sequence of in-
terpolated structures reveals that these critical residues make contact with
two regions on the b-subunit. The first region is the HTH domain at the
C-terminal end of b; this is the place where b impacts the g-shaft. Clearly,
disturbing this region affects the power-stroke motion. The second region is
another HTH domain directly behind the ATP binding pocket. Both of these
HTH domains lie within loops emanating from the same b-sheet whose
loops grasp the nucleotide (Sun et al., 2003). Thus, chemical transitions in
the binding pocket are directly coupled to the angular position of the g-shaft
primarily through elastic stress passing these contact regions. Our model
takes this structural information into account.
TABLE 1 Unisite reaction rate measured by Senior (1992)
for Escherichia coli
Unisite rates of E. coli Value
kuE!T [ATP] 3 1.1 3 105 s�1
kuT!E 2.5 3 10�5 s�1
kuT!DP 1.2 3 10�1 s�1
kuDP!T 4.3 3 10�2 s�1
kuDP!D 1.2 3 10�3 s�1
kuD!DP [Pi] 3 4.8 3 10�4 s�1
kuD!E 1.6 3 10�3 s�1
kuE!D [ADP] 3 1.8 3 102 s�1
1382 Sun et al.
Biophysical Journal 86(3) 1373–1384

Mechanism of multisite rate enhancement
An interesting aspect of the model is that to reproduce the experimental
rotation rates, all of the chemical transition rates must be enhanced by at
least 103, and some steps are enhanced by 108! These enhancement factors
are necessary so that no one chemical step is rate-limiting. (Senior, in 1992,
first estimated the enhancement factors and pointed out that the rate of all
chemical steps are increased.)
In addition to the requirement that more than one catalytic site must be
occupied, two additional ingredients are necessary. First, the presence of the
g-shaft is necessary for the multisite rate enhancement. Second, an arginine
residue from the a-subunit part of the binding pocket is also crucial.
Mutation of this particular residue reduces the overall rate to unisite
conditions. The enhancement factors in Table 2 implicitly take these two
factors into account. First, the angular switches that determine where the
chemical transition can occur reflect of the influence of g. Thus if g is not in
the correct position relative to the b-values, the chemical transition cannot
occur. Second, the enhancement factor M is a crude model for the effect of
the arginine residue on the catalytic site. When the catalytic site is occupied,
stress from binding of nucleotide radiates out through the adjacent a-subunit
to the adjacent site. The path of this stress must pass through the essential
a-arginine. The net effect of this stress is to lower the barrier for hydrolysis
and enhance the rate by a factor represented byM. The nature of the reaction
barrier and a detailed account of the reaction mechanism will be discussed in
a forthcoming article.
The viscous drag coefficient on g
We assume that the viscous drag coefficient in Eq. A3 is dominated by the
viscous friction experience by the objects attached to the g-shaft. For
example, when an actin filament is attached,
z ¼ 4phl3
f
3logðlf=2rfÞ � 0:447; (B12)
where lf and rf are the length and radius of the actin filament, respectively,
and h is the viscosity of water. For fluorescent beads we use
z ¼ 10:5phR3
B; (B13)
where RB is the radius of the bead. For beads of 40 nm in diameter, z ¼2.563 10�4 pN nm s (Yasuda et al., 2001). Experimental measurements of
the rotation speed are also reported as a function of this external drag.
The actual drag experienced by the g-shaft is a sum of the external drag
from the attached objects and the internal friction from the motion of g
relative to b. Thus, neglecting any hydrodynamic coupling, we may write
z ¼ zm 1 zl; (B14)
where zl is the drag from the external load coming from the attached actin or
gold beads, and zl varies with the size of the attached load; and zm is the
internal friction of the motor, and zm is a constant during changing
experimental conditions. When actin filaments are attached, the external
drag is much larger than the internal friction, i.e., zl � zm. Therefore, the
total drag experienced by g is dominated by zl. However, for small gold
beads, it is not clear that the external friction is much greater than internal
friction. Perhaps for the smallest beads, zm � zl. In this case, the total drag
coefficient must include contributions from both. In Fig. 4 of the main text,
the rotational speed levels off as a function of the external drag. However, it
is not correct to explain this behavior by assuming zm � zl, so that the total
friction is essentially constant in this region. The leveling-off behavior has
more to do with the chemical reaction rates being the rate-limiting steps.
S.S. and G.O. were supported by National Institutes of Health grant
GM59875-02, and H.Y. was supported by National Science Foundation
grant DMS-0077971.
REFERENCES
Abrahams, J., A. Leslie, R. Lutter, and J. Walker. 1994. Structure at 2.8 Aresolution of F1-ATPase from bovine heart mitochondria. Nature.370:621–628.
Adachi, K., R. Yasuda, H. Noji, H. Itoh, Y. Harada, M. Yoshida, and K.Kinosita, Jr. 2000. Stepping rotation of F1-ATPase visualized throughangle-resolved single fluorophore imaging. Proc. Natl. Acad. Sci. USA.97:7243–7247.
Al-Shawi, M., D. Parsonage, and A. Senior. 1989. Kinetic characterizationof the unisite catalytic of seven b-subunit mutant of F1-ATPase fromEscherichia coli. J. Biol. Chem. 264:15376–15383.
Antes, I., D. Chandler, H. Wang, and G. Oster. 2003. The unbinding ofATP from the catalytic site of F1-ATPase. Biophys. J. 85:695–706.
Boyer, P. 1993. The binding change mechanism of ATP synthase—someprobabilities and possibilities. Biochim. Biophys. Acta. 1140:215–250.
Cipriano, D. J., Y. M. Bi, and S. D. Dunn. 2002. Genetic fusion of globularproteins to the epsilon-subunit of the Escherichia coli ATP syn-thase—implications for in vivo rotational catalysis and epsilon-subunitfunction. J. Biol. Chem. 277:16782–16790.
Gao, Y. Q., W. Yang, R. A. Marcus, and M. Karplus. 2003. A model for thecooperative free energy transduction and kinetics of ATP hydrolysis byF1-ATPase. Proc. Natl. Acad. Sci. USA. 100:11339–11344.
Kato-Yamada, Y., and M. Yoshida. 2003. Isolated epsilon subunit ofthermophilic-F1-ATPase binds ATP. J. Biol. Chem. 278:36013–36016.
Kinosita, K., R. Yasuda, and H. Noji. 1999. Essays in Biochemistry, Vol.35. G. B. S. Higgins, editor. Portland Press, London, UK.
TABLE 2 Parameters for the kinetic rates list the multisite enhancement factors and elastic contributions to the transition rates
Rate M(si�1,si11) Switches Elastic contribution
kE!T M ¼1 if si11 ¼ si�1 ¼ E
36:4 if otherwise
�g ¼
1 if 308\u\608
0 if otherwise
�DEðuÞ ¼ VEðuÞ � VEð0ÞDE9ðuÞ ¼ VTðuÞ � VTð150ÞkT!E
kT!DP M ¼1 if si11 ¼ si�1 ¼ E
8:53 106
if otherwise
�g ¼
1 if 908\u\2108
0 if otherwise
�DEðuÞ ¼ �½VTðuÞ � VTð150Þ�DE9ðuÞ ¼ �½VTðuÞ � VTð150Þ��½VTðuÞ � VTð150Þ�1 ½VDPðuÞ � VDPð150Þ�
kDP!T
kDP!D M ¼1 if si11 ¼ si�1 ¼ E
8:63 106
if otherwise
�g ¼
1 if 1208\u\2408
0 if otherwise
�DEðuÞ ¼ �½VDPðuÞ � VDPð150Þ�DE9ðuÞ ¼ �½VDPðuÞ � VDPð150Þ��½VDPðuÞ � VDPð150Þ�1 ½VDðuÞ � VDð150Þ�
kD!DP
kD!E M ¼1 if si11 ¼ si�1 ¼ E
53 108
if otherwise
�g ¼
1 if 2408\u\3308
0 if otherwise
�DEðuÞ ¼ �½VEðuÞ � VEð0Þ�1½VDðuÞ � VDð150Þ� � ½VEðuÞ � VEð0Þ�DE9ðuÞ ¼ �½VEðuÞ � VEð0Þ�
kE!D
F1-ATPase Pauses 1383
Biophysical Journal 86(3) 1373–1384

Kinosita, K., R. Yasuda, H. Noji, and K. Adachi. 2000. A rotary molecularmotor that can work at near 100% efficiency. Philos. Trans. Biol. Sci.355:473–490.
Lutkenhaus, J., and M. Sundaramoorthy. 2003. MinD and the role of thedeviant Walker A motif, dimerization and membrane binding inoscillation. Mol. Microbiol. 48:295–303.
Menz, R., J. Walker, and A. Leslie. 2001. Structure of bovine mitochondrialF1-ATPase with nucleotide bound to all three catalytic sites: implicationsfor the mechanism of rotary catalysis. Cell. 106:331–341.
Mogilner, A., H. Wang, T. Elston, and G. Oster. 2002. Molecular motors:theory and experiment. In Computational Cell Biology. C. Fall, E.Marland, J. Wagner, and J. Tyson, editors. Springer-Verlag, New York.
Nakamoto, R., C. Ketchum, and M. Al-Shawi. 1999. Rotational coupling inthe FoF1 ATP synthase. Annu. Rev. Biophys. Biomol. Struct. 28:205–234.
Nakamoto, R., C. Ketchum, P. Kuo, Y. Peskova, and M. Al-Shawi. 2000.Molecular mechanism of rotational catalysis in the FoF1 ATP synthase.Biochim. Biophys. Acta. 1458:289–299.
Noji, H., R. M. Yasuda, M. Yoshida, and K. Kinosita. 1997. Directobservation of the rotation of F1-ATPase. Nature. 386:299–302.
Oster, G., and H. Wang. 2000a. Reverse engineering a protein: themechanochemistry of ATP synthase. Biochim. Biophys. Acta. 332:459–469.
Oster, G., and H. Wang. 2000b. Why is the efficiency of the F1-ATPase sohigh? J. Bioenerg. Biomembr. 332:459–469.
Risken, H. 1989. The Fokker-Planck Equation. Springer-Verlag, Berlin,Heidelberg, Germany.
Senior, A. 1992. Catalytic sites of Escherichia coli F1-ATPase. J. Bioenerg.Biomembr. 24:479–483.
Shirakihara, Y., A. Leslie, J. Abrahams, J. Walker, T. Ueda, Y. Sekimoto,M. Kambera, K. Saika, Y. Kagawa, and M. Yoshida. 1997. The crystalstructure of the nucleotide-free a3b3 subcomplex of F1-ATPase from thethermophilic Bacillus PS3 is a symmetric trimer. Structure. 5:825–836.
Sun, S., D. Chandler, A. R. Dinner, and G. Oster. 2003. Elastic energystorage in b-sheets with application to F1-ATPase. Eur. Biophys. J. 32:676–683.
Yasuda, R., H. Noji, K. Kinosita, and M. Yoshida. 1998. F1-ATPase isa highly efficient molecular motor that rotates with discrete 1208 steps.Cell. 93:1117–1124.
Yasuda, R., H. Noji, M. Yoshida, K. Kinosita, and H. Ito. 2001. Resolu-tion of distinct rotational substeps by submillisecond kinetic analysis ofF1-ATPase. Nature. 410:898–904.
Yasuda, R., C. Ketchum, K. Adachi, H. Noji, H. Itoh, and K. Kinosita, Jr.2003. The ATP-waiting conformation of rotating F1-ATPase revealed bysingle-pair fluorescence resonance energy transfer. Proc. Natl. Acad. Sci.USA. 100:9314–9318.
Wang, H., and G. Oster. 1998. Energy transduction in F1 motor of ATPsynthase. Nature. 396:279–282.
Wang, H., and G. Oster. 2001. The Stokes Efficiency for molecular motorsand its applications. Eur. Phys. Lett. 57:134–140.
Wang, H., C. S. Peskin, and T. C. Elston. 2003. A robust numericalalgorithm for studying biomolecular transport processes. J. Theor. Biol.221:491–511.
Weber, J., and A. Senior. 1997. Catalytic mechanisms of F1-ATPase.Biochim. Biophys. Acta. 1319:19–58.
1384 Sun et al.
Biophysical Journal 86(3) 1373–1384
Copyright © 2022 FDOKUMEN