ASSOCIATION OF GREATER MANCHESTER AUTHORITIES
230
ASSOCIATION OF GREATER MANCHESTER AUTHORITIES GREATER MANCHESTER TRANSPORTATION UNIT TRANSPORT STATISTICS GREATER MANCHESTER 2007 SUMMARY This report presents results of GMTU’s traffic and transport monitoring during 2007. These include: • trends in Local Transport Plan indicators • countywide traffic growth • daily, weekly and seasonal flow profiles on motorways and A roads • traffic growth by district • comparison of local and national traffic growth • traffic and pedestrian activity in key centres • trends in countywide rail and Metrolink patronage • trends in bus service supply • background information GMTU Report 1387 E Ellis, A Castle D Weston, J Morewood, R Boncinelli, J Randle November 2008
-
Upload
khangminh22 -
Category
Documents
-
view
2 -
download
0
Transcript of ASSOCIATION OF GREATER MANCHESTER AUTHORITIES
ASSOCIATION OF GREATER MANCHESTER AUTHORITIES
GREATER MANCHESTER TRANSPORTATION UNIT
TRANSPORT STATISTICS GREATER MANCHESTER 2007
SUMMARY
This report presents results of GMTU’s traffic and transport monitoring during 2007. These include:
• trends in Local Transport Plan indicators
• countywide traffic growth
• daily, weekly and seasonal flow profiles on motorways and A roads
• traffic growth by district
• comparison of local and national traffic growth
• traffic and pedestrian activity in key centres
• trends in countywide rail and Metrolink patronage
• trends in bus service supply
• background information
GMTU Report 1387 E Ellis, A Castle D Weston, J Morewood, R Boncinelli, J Randle November 2008
ACKNOWLEDGEMENTS
We acknowledge the assistance of GMPTE in providing all the bus service supply data and the Highways Agency for providing automatic traffic counter data on motorways.
Version No.
Purpose/ Changes Author Date Changed
Date Issued To Whom
1 First Release A Castle et al 01/11/2008 01/11/2008
All enquiries to: Greater Manchester Transportation Unit 1st Floor Salisbury House Granby Row Manchester M1 7AH Telephone: 0161 455 2062 Internal Tel; 815 2062 Fax: 0161 455 2071 e-mail: [email protected] website: http://www.gmtu.gov.uk/
The Greater Manchester Transportation Unit provides a strategic and local transportation service to and on behalf of the ten district councils of
Greater Manchester. The unit is funded by the ten districts and attached to Manchester City Council as lead authority.

GMTU Report 1387 Foreword
FOREWORD The Greater Manchester Transportation Unit provides a comprehensive service in all aspects of transportation for the ten local authority districts in Greater Manchester. The work of the unit includes the core services of traffic monitoring, and maintenance and analysis of the unit's traffic accident database. This report forms part of the traffic monitoring service to districts and as such maintains the series of annual reports for Greater Manchester begun in 1983. It is available as an Adobe Acrobat file and on the GMTU website (www.gmtu.gov.uk) for those who would like an electronic version. This report does not include detailed traffic flow information for individual road links. Instead, separate reports have again been produced for each district, incorporating all the traffic flow information for that district. All of the road traffic data used in the production of the annual reports are available for district use. The results of manual counts can be obtained through interrogation of the map based data retrieval system GMCOUNTS. Also, road casualty data can be obtained from GMTU’s Geographic Information System – GMAPS and Microsoft Access Database - GMAXI. Information on Greater Manchester Local Transport Plan (GMLTP) targets and indicators is subject to approval by the Department for Transport (DfT) and may be revised as part of the LTP performance management process. Information in this report is correct as at 31 October 2008 and any future updates will be made available on the electronic version.

GMTU Report 1387 Contents
C O N T E N T S Page
(i)
EXECUTIVE SUMMARY ............................................................................................11 LOCAL TRANSPORT PLAN INDICATORS......................................................11
BEST VALUE INDICATORS..............................................................................13BV 223: Principal Road Condition ......................................................................13BV 224a: Non-principal Classified Road Condition.............................................13BV 224b: Unclassified Road Condition...............................................................14BV 187: Principal Footway Condition .................................................................14BV 99i: Road Safety – All KSI.............................................................................15BV 99ii: Road Safety – Child KSI........................................................................16BV 99iii: Road Safety – Slight Casualties ...........................................................17BV 102a: Bus Patronage ....................................................................................18BV 102b: Rail Patronage ....................................................................................19BV 102c: Metrolink Patronage ............................................................................20BV 104: Bus Satisfaction (residents) ..................................................................21OTHER LTP MANDATORY INDICATORS........................................................22LTP 1a: Accessibility (Households) ....................................................................22LTP 1b: Accessibility (Jobseekers).....................................................................23LTP 2: Area Wide Road Traffic...........................................................................24LTP 3: Cycling ....................................................................................................25LTP 4: Mode Share of Journeys to School .........................................................26LTP 5a: Bus Punctuality of Timetabled Services ................................................27LTP 5b: Bus Reliability of Timetabled Services ..................................................28LTP 6a: Peak Traffic Flow to Regional Centre....................................................29LTP 6b: Peak Traffic Flow to Other Key Centres................................................30LTP 7: Congestion..............................................................................................31LTP 8a: Air Quality (Concentration of NO2 at Worst Case Receptor Sites in Each District’s AQMA) .................................................................................................32LTP 8b: Local Traffic Emissions - Tonnes NOX Emitted from Road Transport on Major Roads in Each District ..............................................................................32LOCAL HEADLINE LTP INDICATORS.............................................................34LTP 9: Climate Change ......................................................................................34LTP 10a: Accessible Infrastructure (Buses)........................................................35LTP 10b: Accessible Infrastructure (Bus Stops) .................................................36LTP 10c: Accessible Infrastructure (Rail Stations)..............................................36LTP 10d: Accessible Infrastructure (Pedestrian Crossings)................................37LTP 10e: Accessible Infrastructure (Public Rights of Way).................................38LTP 11: Walking .................................................................................................39LTP 12a: Modal Share to Regional Centre .........................................................40LTP 12b: Modal Share to Other Key Centres .....................................................41LTP 12c: Modal Share to Manchester Airport.....................................................42
2 ROAD TRAFFIC.................................................................................................43MOTORWAY TRAFFIC......................................................................................45Traffic Growth on Motorways 2006-2007............................................................45Changes in Motorway Weekday Traffic Flow Profiles 2006-2007.......................46Peak Hour to Peak Period Ratios on Motorways................................................48Traffic Flows on Motorways in 2007 ...................................................................48

GMTU Report 1387 Contents
C O N T E N T S Page
(ii)
24-Hour Traffic Flow Profiles on Motorways in 2007 ..........................................49Daily Traffic Flow Indices on Motorways in 2007................................................51Daily Variation on Motorways by Time Period ....................................................52Monthly Traffic Flow Indices on Motorways in 2007 ...........................................53A ROAD TRAFFIC .............................................................................................54Traffic Growth on A Roads 2006-2007 ...............................................................54Changes in A Road Weekday Traffic Flow Profiles 2006-2007 ..........................54Peak Hour to Peak Period Ratios on A Roads ...................................................5624-Hour Traffic Flow Profiles on A Roads in 2007..............................................57Daily Traffic Flow Indices on A Roads in 2007 ...................................................59Daily Variation on A Roads by Time Period........................................................60Monthly Traffic Flow Indices on A Roads in 2007...............................................61B ROAD TRAFFIC .............................................................................................62Traffic Growth on B Roads 2006-2007 ...............................................................62Changes in B Road Weekday Traffic Profiles 2006-2007...................................62Peak Hour to Peak Period Ratios on B Roads ...................................................64MINOR ROAD TRAFFIC....................................................................................65Traffic Growth on Minor Roads 2006-2007.........................................................65Changes in Minor Road Weekday Traffic Profiles 2006-2007 ............................65COMPARISONS OF TRAFFIC AND GROWTH ................................................66Comparison of National and Local Growth in Traffic Flows 1993-2007 ..............66Composition of Motorway, A Road, B Road and Minor Road Traffic 1999-2007 68Average Hourly Flows on Motorways, A, B and Minor Roads in 2007................70Traffic Growth on A Roads and B Roads Combined 2006-2007 ........................72Traffic Growth on A Roads and B Roads by District 2006-2007 .........................72Annual Vehicle Kilometres on Motorways, A Roads and B Roads in 2007 ........73Annual Vehicle Kilometres on A Roads and B Roads by District in 2007 ...........74Trends in Greater Manchester Vehicle Kilometres on Motorways, A and B Roads 1993-2007 ..........................................................................................................75National and Local Vehicle Kilometres 1993 – 2007 ..........................................76Congestion Monitoring: Average Journey Time Rates 2003/04 – 2006/07.........77
3 KEY CENTRE MONITORING ............................................................................79Introduction to Key Centre Monitoring ................................................................81Bolton Key Centre ..............................................................................................82Bury Key Centre .................................................................................................84Manchester Key Centre ......................................................................................86Oldham Key Centre ............................................................................................88Rochdale Key Centre .........................................................................................90Salford Key Centre - Eccles................................................................................92Stockport Key Centre..........................................................................................94Tameside Key Centre – Ashton-under-Lyne.......................................................96Trafford Key Centre - Altrincham ........................................................................98Wigan Key Centre ............................................................................................100
4 OTHER ROAD TRAFFIC STATISTICS ...........................................................103Car Occupancy.................................................................................................105Walking.............................................................................................................106

GMTU Report 1387 Contents
C O N T E N T S Page
(iii)
Cycling..............................................................................................................110Cycle Flows on Major Roads ............................................................................112Automatic Cycle Counts ...................................................................................114Carriage of Cycles on Trains ............................................................................118Cycle Training in Schools .................................................................................119
5 PUBLIC TRANSPORT.....................................................................................121RAIL PATRONAGE .........................................................................................123Rail Passenger Counts.....................................................................................123Rail Patronage by Corridor ...............................................................................127METROLINK PATRONAGE ............................................................................133Metrolink Passenger Counts 2007....................................................................133The Altrincham Line..........................................................................................135The Bury Line ...................................................................................................137The Eccles Line ................................................................................................139BUS SERVICE SUPPLY..................................................................................144Annualised Bus Mileage ...................................................................................144Annualised Bus Mileage by District ..................................................................146Commercial and Subsidised Bus Mileage ........................................................147Analysis by Time of Day and Day of Week.......................................................148Bus Mileage by Operator ..................................................................................152Market Share of Operating Groups...................................................................153Bus Registration Changes 2002-2007..............................................................154
6 BACKGROUND INFORMATION .....................................................................155Retail Price Index .............................................................................................157Fuel Prices........................................................................................................158Public Transport Fares .....................................................................................159Car Parking Provision and Charges in Greater Manchester .............................161Personal Travel –Metropolitan Area Statistics 2007 .........................................165Road Vehicles ..................................................................................................168Weekly Earnings...............................................................................................168Air Transport.....................................................................................................169Road Lengths in Greater Manchester 2007......................................................171Population of Greater Manchester....................................................................172Greater Manchester Local Highway Authorities Transport Capital Allocation...173Highway Schemes............................................................................................176Major Public Transport Schemes......................................................................183BV 106: New Homes on Previously Developed Land.......................................184Weather Data ...................................................................................................184
APPENDIX 1 TRAFFIC COUNT FACTORS...........................................................187APPENDIX 2 SOME RECENT GMTU PUBLICATIONS ..........................................17

GMTU Report 1387 List of Tables
(iv)
L I S T O F T A B L E S Page
EXECUTIVE SUMMARY
Table 1 Percentage Changes in 12-Hour Traffic Flows on a Sample of Motorways, A Roads and B Roads between 2006 and 2007 .........5
1. LOCAL TRANSPORT INDICATORS Table 1.1 BV 223 – Principal Road Condition .................................................13 Table 1.2 BV 224a –Non-principal Classified Road Condition .........................13 Table 1.3 BV 224b –Unclassified Classified Road Condition ...........................14 Table 1.4 BV 187 – Principal Footway Condition ............................................14 Table 1.5 BV 99i – All KSI ..............................................................................15 Table 1.6 BV 99ii – Child KSI .........................................................................16 Table 1.7 BV 99iii – Slight Casualties .............................................................17 Table 1.8 BV 102a – Bus Patronage ..............................................................18 Table 1.9 BV 102b – Rail Patronage ..............................................................19 Table 1.10 BV 102c – Metrolink Patronage.....................................................20 Table 1.11 BV 104 – Bus Satisfaction .............................................................21 Table 1.12 LTP 1a – Accessibility (Households) .............................................22 Table 1.13 LTP 1b – Accessibility (Jobseekers)..............................................23 Table 1.14 LTP 2 – Area Wide Road Traffic....................................................24 Table 1.15 LTP 3 – Cycling .............................................................................25 Table 1.16 LTP 4 – Mode Share of Journeys to School (%car).......................26 Table 1.17 LTP5a – Bus Punctuality (Timetabled) ..........................................27 Table 1.18 LTP 5b – Bus Reliability (Timetabled) ...........................................28 Table 1.19 LTP 6a – Peak Traffic Flow (Regional Centre) ..............................29 Table 1.20 LTP 6b – Peak Traffic Flow (Other Key Centres) ..........................30 Table 1.21 LTP 7 – Congestion.......................................................................31 Table 1.22 LTP 8b – Local Traffic Emissions ..................................................32 Table 1.23 LTP 9 – Climate Change ...............................................................34 Table 1.24 LTP 10a – Accessible Infrastructure (Buses) ................................35 Table 1.25 LTP 10b – Accessible Infrastructure (Bus Stops) ..........................36 Table 1.26 LTP 10c – Accessible Infrastructure (Rail Stations).......................36 Table 1.27 BV 10d – Accessible Infrastructure (Pedestrian Crossings) ..........37 Table 1.28 BV 10e – Accessible Infrastructure (PRoW)..................................38 Table 1.29 LTP 11 – Walking ..........................................................................39 Table 1.30 LTP 12a – Modal Share to Regional Centre..................................40 Table 1.31 LTP 12b – Modal Share to Other Key Centres ..............................41 Table 1.32 LTP 12c – Modal Share to Manchester Airport..............................422. ROAD TRAFFIC Table 2.1 Percentage Changes in Average Flows on 11 Motorway Links
Between 2006 and 2007 ..............................................................45
GMTU Report 1387 List of Tables
(v)
L I S T O F T A B L E S Page
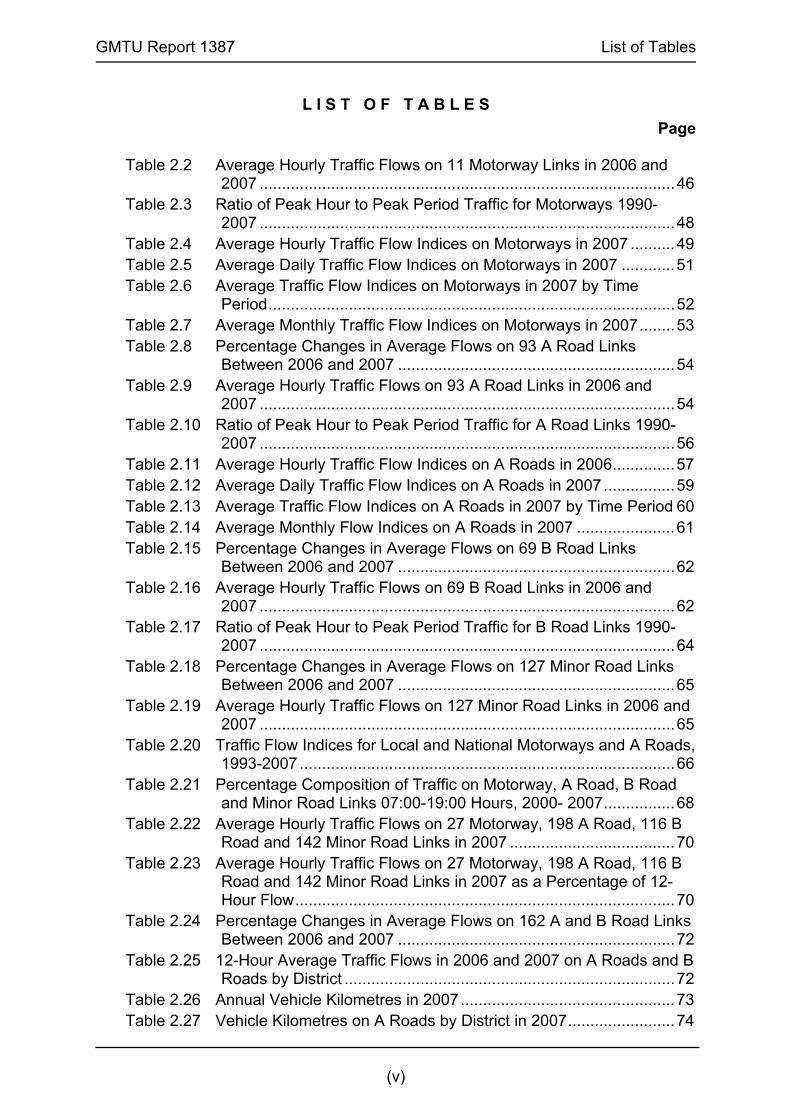
Table 2.2 Average Hourly Traffic Flows on 11 Motorway Links in 2006 and 2007 .............................................................................................46
Table 2.3 Ratio of Peak Hour to Peak Period Traffic for Motorways 1990- 2007 .............................................................................................48
Table 2.4 Average Hourly Traffic Flow Indices on Motorways in 2007 ..........49 Table 2.5 Average Daily Traffic Flow Indices on Motorways in 2007 ............51 Table 2.6 Average Traffic Flow Indices on Motorways in 2007 by Time
Period...........................................................................................52 Table 2.7 Average Monthly Traffic Flow Indices on Motorways in 2007........53 Table 2.8 Percentage Changes in Average Flows on 93 A Road Links
Between 2006 and 2007 ..............................................................54 Table 2.9 Average Hourly Traffic Flows on 93 A Road Links in 2006 and
2007 .............................................................................................54 Table 2.10 Ratio of Peak Hour to Peak Period Traffic for A Road Links 1990-
2007 .............................................................................................56 Table 2.11 Average Hourly Traffic Flow Indices on A Roads in 2006..............57 Table 2.12 Average Daily Traffic Flow Indices on A Roads in 2007 ................59 Table 2.13 Average Traffic Flow Indices on A Roads in 2007 by Time Period 60 Table 2.14 Average Monthly Flow Indices on A Roads in 2007 ......................61 Table 2.15 Percentage Changes in Average Flows on 69 B Road Links
Between 2006 and 2007 ..............................................................62 Table 2.16 Average Hourly Traffic Flows on 69 B Road Links in 2006 and
2007 .............................................................................................62 Table 2.17 Ratio of Peak Hour to Peak Period Traffic for B Road Links 1990-
2007 .............................................................................................64 Table 2.18 Percentage Changes in Average Flows on 127 Minor Road Links
Between 2006 and 2007 ..............................................................65 Table 2.19 Average Hourly Traffic Flows on 127 Minor Road Links in 2006 and
2007 .............................................................................................65 Table 2.20 Traffic Flow Indices for Local and National Motorways and A Roads,
1993-2007 ....................................................................................66 Table 2.21 Percentage Composition of Traffic on Motorway, A Road, B Road
and Minor Road Links 07:00-19:00 Hours, 2000- 2007................68 Table 2.22 Average Hourly Traffic Flows on 27 Motorway, 198 A Road, 116 B
Road and 142 Minor Road Links in 2007 .....................................70 Table 2.23 Average Hourly Traffic Flows on 27 Motorway, 198 A Road, 116 B
Road and 142 Minor Road Links in 2007 as a Percentage of 12-Hour Flow.....................................................................................70
Table 2.24 Percentage Changes in Average Flows on 162 A and B Road Links Between 2006 and 2007 ..............................................................72
Table 2.25 12-Hour Average Traffic Flows in 2006 and 2007 on A Roads and B Roads by District ..........................................................................72
Table 2.26 Annual Vehicle Kilometres in 2007................................................73 Table 2.27 Vehicle Kilometres on A Roads by District in 2007........................74

GMTU Report 1387 List of Tables
(vi)
L I S T O F T A B L E S Page
Table 2.28 Vehicle Kilometres on B Roads by District in 2007........................74 Table 2.29 Trends in Vehicle Kilometres (millions) 1993-2007 by Vehicle Type
and Road Class............................................................................75 Table 2.30 National and Local Vehicle Kilometres (millions) by Road Class
1993-2007 ....................................................................................76 Table 2.31 Average Journey Time Rates Greater Manchester 2006/07 .........773. KEY CENTRE MONITORING Table 3.1 Bolton Key Centre Vehicle Counts 1997, 1998, 2001, 2004 and
2007 .............................................................................................82 Table 3.2 Car and Public Transport Trips into Bolton Key Centre .................83 Table 3.3 Car and Non-Car Trips into Bolton Key Centre .............................83 Table 3.4 Bury Key Centre Inbound Vehicles 1997, 1999, 2002 and 2005 ...84 Table 3.5 Car and Public Transport Trips into Bury Key Centre....................85 Table 3.6 Car and Non-Car Trips into Bury Key Centre ................................85 Table 3.7 Manchester Key Centre Cordon Counts 1997, 1999, 2002, 2005
and 2006 ......................................................................................86 Table 3.8 Car and Public Transport Trips into Manchester Key Centre ........87 Table 3.9 Car and Non-Car Trips into Manchester Key Centre.....................87 Table 3.10 Oldham Key Centre Inbound Cordon Counts 1997, 1998, 2001,
2004 & 2007.................................................................................88 Table 3.11 Car and Public Transport Trips into Oldham Key Centre...............89 Table 3.12 Car and Non-Car Trips into Oldham Key Centre ...........................89 Table 3.13 Rochdale Key Centre Inbound Cordon Counts 1997, 1999, 2002,
2005 and 2008 .............................................................................90 Table 3.14 Car and Public Transport Trips into Rochdale Key Centre ............91 Table 3.15 Car and Non-Car Trips into Rochdale Key Centre ........................91 Table 3.16 Eccles Key Centre Inbound Cordon Counts 1997, 2001, 2004 &
2007 .............................................................................................92 Table 3.17 Car and Public Transport Trips into Eccles Key Centre.................93 Table 3.18 Car and Non-Car Trips into Eccles Key Centre .............................93 Table 3.19 Stockport Key Centre Cordon Counts 1997, 2000, & 2003-2007 -
inbound ........................................................................................94 Table 3.20 Car and Public Transport Trips into Stockport Key Centre ............95 Table 3.21 Car and Non-Car Trips into Stockport Key Centre ........................95 Table 3.22 Ashton Key Centre Inbound Cordon Counts 1997, 1998, 2001,
2004 & 2007.................................................................................96 Table 3.23 Car and Public Transport Trips into Ashton Key Centre ................97 Table 3.24 Car and Non-Car Trips into Ashton Key Centre ............................97 Table 3.25 Altrincham Key Centre Inbound Cordon Counts 1997, 1999, 2002,
2005 and 2008 .............................................................................98 Table 3.26 Car and Public Transport Trips into Altrincham Key Centre ..........99 Table 3.27 Car and Non-Car Trips into Altrincham Key Centre.......................99

GMTU Report 1387 List of Tables
(vii)
L I S T O F T A B L E S Page
Table 3.28 Wigan Key Centre Inbound Vehicles 1997, 2000, 2003 and
2006 ...........................................................................................100 Table 3.29 Car and Public Transport Trips into Wigan Key Centre ...............101 Table 3.30 Car and Non-Car Trips into Wigan Key Centre ...........................1014. OTHER ROAD TRAFFIC STATISTICS Table 4.1 Average Peak and Off-Peak Car Occupancy at 10 Sites in Greater
Manchester ................................................................................105 Table 4.2 Key Centre Cordon Pedestrian Flows AM Peak Period (07:30-
09:30) .........................................................................................106 Table 4.3 Key Centre Cordon Pedestrian Flows Off-Peak Period (10:00-
12:00) .........................................................................................107 Table 4.4 Key Pedestrian Route and Cordon Site Automatic Pedestrian Count
(APC) Data 2007........................................................................108 Table 4.5 Key Pedestrian Route and Cordon Site APC Data 2005 - 2007..109 Table 4.6 Key Centre Cordon Cycle Flows AM Peak Period (07:30-09:30) 110 Table 4.7 Key Centre Cordon Cycle Flows Off-Peak Period (10:00-12:00).111 Table 4.8 Average and Highest 12-Hour Two-way Cycle Flows on A and B
Roads in Each District, 2007 ......................................................112 Table 4.9 Pedal Cycle Kilometres on A & B Roads 2001-2007...................113 Table 4.10 Average Hourly Profile at ACC “Commuting” Sites in 2007.........114 Table 4.11 Average Hourly Profile at ACC “Leisure” Sites in 2007 ...............115 Table 4.12 Daily Indices at ACC “Commuting” Sites in 2007 ........................116 Table 4.13 Daily Indices at ACC “Leisure” Sites in 2007...............................116 Table 4.14 Monthly Indices at ACC “Commuting” Sites in 2007....................117 Table 4.15 Monthly Indices at ACC “Leisure” Sites in 2007 ..........................117 Table 4.16 Cycles Carried on Trains (Single Day 07:30 to 13:30) 2003 -
2007 ...........................................................................................118 Table 4.17 On-road cycle training by district .................................................119 Table 4.18 Off-road cycle training by district .................................................1195. PUBLIC TRANSPORT Table 5.1 Boarders and Alighters at 60 Rail Stations Surveyed in 2007 .....124 Table 5.2 Manchester Bound Boarders by Corridor 1991 and 1998-2007
(excluding the Eccles Corridor) Peak Period (07:30-09:30) .......127 Table 5.3 Manchester Bound Boarders by Corridor 1991 and 1998 to 2007
(excluding the Eccles Corridor) Off Peak Period (09:30-13:30)..128 Table 5.4 Manchester Bound Boarders at Ashton-under-Lyne Corridor
Stations 1991 and 1998 to 2007 – Peak Period (07:30-09:30) ..130 Table 5.5 Manchester Bound Boarders at Ashton-under-Lyne Corridor
Stations 1991 and 1998 to 2007 – Off-Peak Period (09:30-13:30)..............................................................................130
GMTU Report 1387 List of Tables
(viii)
L I S T O F T A B L E S Page
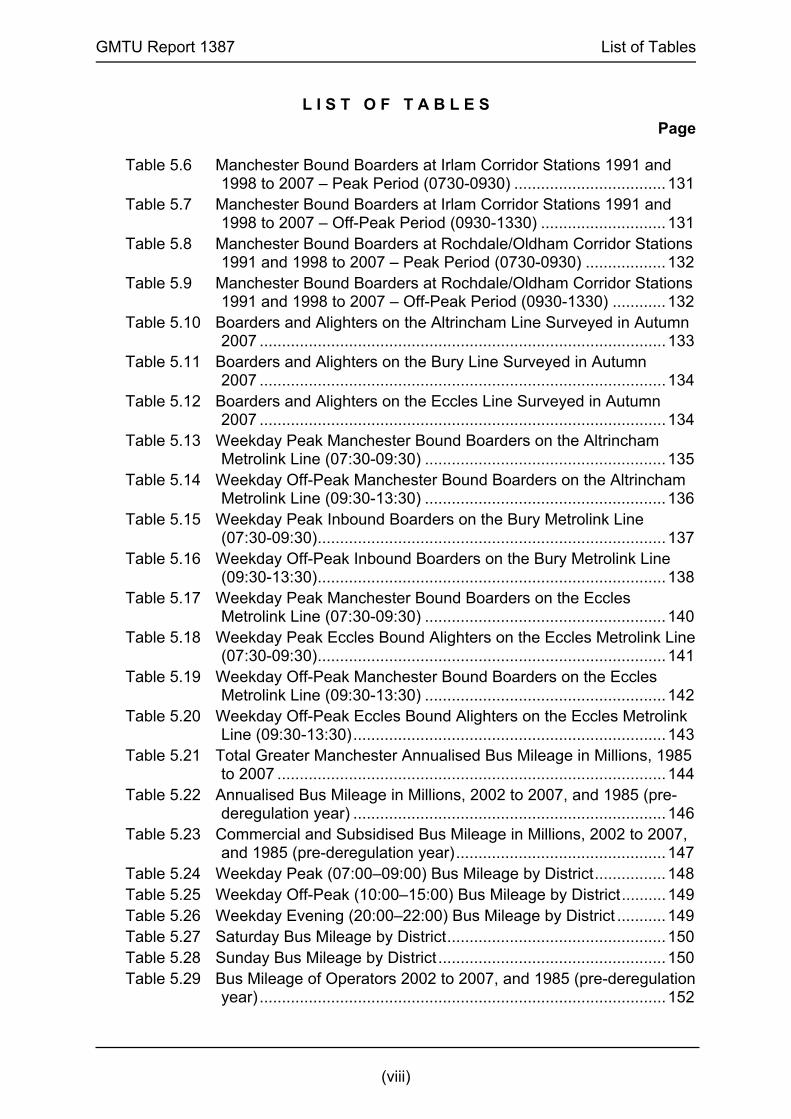
Table 5.6 Manchester Bound Boarders at Irlam Corridor Stations 1991 and 1998 to 2007 – Peak Period (0730-0930) ..................................131
Table 5.7 Manchester Bound Boarders at Irlam Corridor Stations 1991 and 1998 to 2007 – Off-Peak Period (0930-1330) ............................131
Table 5.8 Manchester Bound Boarders at Rochdale/Oldham Corridor Stations 1991 and 1998 to 2007 – Peak Period (0730-0930) ..................132
Table 5.9 Manchester Bound Boarders at Rochdale/Oldham Corridor Stations 1991 and 1998 to 2007 – Off-Peak Period (0930-1330) ............132
Table 5.10 Boarders and Alighters on the Altrincham Line Surveyed in Autumn 2007 ...........................................................................................133
Table 5.11 Boarders and Alighters on the Bury Line Surveyed in Autumn 2007 ...........................................................................................134
Table 5.12 Boarders and Alighters on the Eccles Line Surveyed in Autumn 2007 ...........................................................................................134
Table 5.13 Weekday Peak Manchester Bound Boarders on the Altrincham Metrolink Line (07:30-09:30) ......................................................135
Table 5.14 Weekday Off-Peak Manchester Bound Boarders on the Altrincham Metrolink Line (09:30-13:30) ......................................................136
Table 5.15 Weekday Peak Inbound Boarders on the Bury Metrolink Line (07:30-09:30)..............................................................................137
Table 5.16 Weekday Off-Peak Inbound Boarders on the Bury Metrolink Line (09:30-13:30)..............................................................................138
Table 5.17 Weekday Peak Manchester Bound Boarders on the Eccles Metrolink Line (07:30-09:30) ......................................................140
Table 5.18 Weekday Peak Eccles Bound Alighters on the Eccles Metrolink Line (07:30-09:30)..............................................................................141
Table 5.19 Weekday Off-Peak Manchester Bound Boarders on the Eccles Metrolink Line (09:30-13:30) ......................................................142
Table 5.20 Weekday Off-Peak Eccles Bound Alighters on the Eccles Metrolink Line (09:30-13:30)......................................................................143
Table 5.21 Total Greater Manchester Annualised Bus Mileage in Millions, 1985 to 2007 .......................................................................................144
Table 5.22 Annualised Bus Mileage in Millions, 2002 to 2007, and 1985 (pre-deregulation year) ......................................................................146
Table 5.23 Commercial and Subsidised Bus Mileage in Millions, 2002 to 2007, and 1985 (pre-deregulation year)...............................................147
Table 5.24 Weekday Peak (07:00–09:00) Bus Mileage by District................148 Table 5.25 Weekday Off-Peak (10:00–15:00) Bus Mileage by District..........149 Table 5.26 Weekday Evening (20:00–22:00) Bus Mileage by District ...........149 Table 5.27 Saturday Bus Mileage by District.................................................150 Table 5.28 Sunday Bus Mileage by District ...................................................150 Table 5.29 Bus Mileage of Operators 2002 to 2007, and 1985 (pre-deregulation
year) ...........................................................................................152

GMTU Report 1387 List of Tables
(ix)
L I S T O F T A B L E S Page
Table 5.30 Market Share of Bus Mileage of Operating Groups with more than 2% of Market Share in either 2006 or 2007................................153
Table 5.31 Bus Registration Changes November 2001 – October 2007.......1546. BACKGROUND INFORMATION Table 6.1 Retail Price Index (All Items) 1987-2007 – Base Jan 1987 =
100 .............................................................................................157 Table 6.2 The Cost of Fuel per Litre 1991-2007..........................................158 Table 6.3 Public Transport Peak Fares for Average Journeys 1991 to
2007 ...........................................................................................160 Table 6.4 Public Transport Off-Peak Fares for Average Journeys 1991 to
2007 ...........................................................................................160 Table 6.5 Public Car Parks in Key Centres 2007 (excluding contract only car
parks) .........................................................................................161 Table 6.6 Number of Spaces Available in Public Car Parks by Key Centre
2002 to 2007 ..............................................................................162 Table 6.7 Average Prices in Public Car Parks by Key Centre 2002 to
2007 ...........................................................................................163 Table 6.8 Usual Method of Travel to Work by Region of Workplace –
Metropolitan Areas: Autumn 2006 (%) .......................................165 Table 6.9 Time Taken to Travel to Work by Region of Workplace –
Metropolitan Areas: Autumn 2006..............................................165 Table 6.10 Average time taken to travel to work (minutes) by mode–
Metropolitan Areas: Autumn 2006..............................................166 Table 6.11 Trips per person per year by main mode of travel – Metropolitan
Areas: 2003-2005.......................................................................166 Table 6.12 Average distance travelled by main mode of travel – Metropolitan
Areas: 2003-2005.......................................................................166 Table 6.13 Average number of trips per person per year by purpose –
Metropolitan Areas: 2003-2005 ..................................................167 Table 6.14 Trips to and from school by main mode and region of residence –
Metropolitan Areas: 2003-2005 ..................................................167 Table 6.15 Motor vehicles (thousands) licensed by taxation class –
Metropolitan Areas: 2006 ...........................................................168 Table 6.16 Mean gross weekly earnings – Metropolitan Area: 1999-2006....168 Table 6.17 Air Transport Statistics – Comparisons of Manchester and UK
Trends........................................................................................170 Table 6.18 Road Lengths in Greater Manchester 2007 (kilometres) .............171 Table 6.19 The Registrar General’s Mid-Year Estimates of Population
(Thousands) ...............................................................................172 Table 6.20 Indices of Population Change (1971-2006) .................................172 Table 6.21 Total Capital Provision to Individual Districts 2000/1 to 2010/11
£ million ......................................................................................173 Table 6.22 Greater Manchester LTP Settlement 2008/09 (£ million).............174

GMTU Report 1387 List of Tables
(x)
L I S T O F T A B L E S Page
Table 6.23 Greater Manchester LTP Settlement 2009/10 (£ million).............174 Table 6.24 Greater Manchester LTP Settlement 2010/11 (£ million).............175 Table 6.25 Highway Schemes over £1 Million completed 1986-
Spring 2008................................................................................176 Table 6.25 (cont.) Highway Schemes over £1 Million completed 1986- Spring
2008 ...........................................................................................177 Table 6.26 Major Public Transport Schemes over £5 million completed 1993-
2007 ...........................................................................................183 Table 6.27 BV 106 – Percentage of new homes built on previously developed
land ............................................................................................184

GMTU Report 1387 List of Figures
(xi)
L I S T O F F I G U R E S
Figure Page
EXECUTIVE SUMMARY
1 National and Local Growth in Traffic Flows 1993-2007 5
1 LOCAL TRANSPORT INDICATORS
1.1 BV99i: Road Safety – All KSI 151.2 BV99ii: Road Safety – Child KSI 161.3 BV99iii: Road Safety – Slight Casualties 171.4 BV102a: Bus Patronage 181.5 BV102b: Rail Patronage 191.6 BV102c: Metrolink Patronage 201.7 BV104: Bus Satisfaction (AGMA BV104 Survey) 211.8 LTP1a: Accessibility 221.9 LTP1b: Accessibility for Jobseekers 231.10 LTP2: Area Wide Road Traffic 241.11 LTP3: Cycling Index 251.12 LTP4: Percentage of Primary, Secondary and all Pupils
Travelling to School by Car 26
1.13 LTP5a: Bus Punctuality (timetabled) 271.14 LTP5b: Bus Reliability (timetabled) 281.15 LTP6a: Vehicles travelling towards the Regional Centre 291.16 LTP6b: Vehicles travelling towards Other Key Centres 301.17 LTP7: Congestion Travel Rate Person Journey Time
(minutes/mile) 31
1.18 LTP8b: Index of Nox Emissions from Major Roads 331.19 LTP9: Index of Carbon Emissions 341.20 LTP10a: Percentage of Wheelchair Accessible Buses 351.21 LTP10c: Percentage of Accessible Rail Stations 361.22 LTP11: Walking Trips 391.23 LTP12a: Non-car trips to Regional Centre 401.24 LTP12b: Non-car Use to Other Key Centres 411.25 LTP12c: Proportion of Vehicle Trips by Road Relative to the
Number of Air Passengers 42

GMTU Report 1387 List of Figures
(xii)
Figure Page
2 ROAD TRAFFIC
2.1 Average Hourly Traffic Flows on Motorways in 2006 and 2007 - All Motors
47
2.2 Average Hourly Traffic Flows on Motorways in 2006 and 2007 - All Goods
47
2.3 24-Hour Annual Average Weekday Flows on Motorways in Greater Manchester 2007
Insert after 48
2.4 Average Hourly Traffic Flow Indices on Motorways in 2007 502.5 Average Daily Traffic Flow Indices on Motorways in 2007 512.6 Average Monthly Traffic Flow Indices on Motorways in 2007 532.7 Average Hourly Traffic Flows on A Roads in 2006 and 2007 -
All Motors 55
2.8 Average Hourly Traffic Flows on A Roads in 2006 and 2007 - All Goods
55
2.9 Average Hourly Traffic Flow Profiles on A Roads in 2007 582.10 Average Daily Traffic Flow Indices on A Roads in 2007 592.11 Average Monthly Traffic Flow Indices on A Roads and
Motorways in 2007 61
2.12 Average Hourly Traffic Flows on B Roads in 2006 and 2007 - All Motors
63
2.13 Average Hourly Traffic Flows on B Roads in 2006 and 2007 - All Goods
63
2.14 National and Local Growth in Traffic Flows on Motorways 1993-2007
67
2.15 National and Local Growth in Traffic Flows on A Roads 1993-2007
67
2.16 Percentage Composition of 12-Hour Traffic Flows By Road Class in 2007
69
2.17 Average Hourly All Motor Traffic Flows on Motorways, A Roads, B Roads and Minor Roads in 2007
71
2.18 Average Hourly All Goods Vehicle Traffic Flows on Motorways, A Roads, B Roads and Minor Roads in 2007
71
2.19 Annual Vehicle Kilometres by Vehicle and Road Type in 2007 732.20 Indices of National and Local Vehicle Kilometres by Road Class
1993-2007 76
2.21 Change in Average Journey Time Rates (mins/mile) 2003/2004 to 2006/07 (Motorways)
77

GMTU Report 1387 List of Figures
(xiii)
Figure Page2.22 Change in Average Journey Time Rates (mins/mile) 2003/2004
to 2006/07 (A & B Roads) 78
2.23 Average Journey Time Rates 2004/05 to 2006/07 – Motorways and A & B Roads
78
4 OTHER ROAD TRAFFIC STATISTICS
4.1 Average Car Occupancies – 1994-2007 1054.2 Index of A & B Pedal Cycle Km 2001-2007 1134.3 Average Hourly Cycle Flow Profiles in 2007 1154.4 Average Daily Cycle Flow Indices in 2007 1164.5 Average Monthly Cycle Flow Indices in 2007 117
5 PUBLIC TRANSPORT
5.1 Rail and Metrolink Peak (07:30-09:30) Inbound Boarders at Stations inside the GMPTE Area 2005-2007
126
5.2 Indices of Peak and Off-Peak Trends in Inbound Boarders 1991-2007
128
5.3 Rail Peak Period Patronage by Corridor 1998 to 2007 1295.4 Rail Off-Peak Period Patronage by Corridor 1998 to 2007 1295.5 Manchester Bound Boarders on the Altrincham Line in the
Peak Period 135
5.6 Manchester Bound Boarders on the Altrincham Line in the Off-Peak Period
136
5.7 Manchester Bound Boarders on the Bury Line in the Peak Period
137
5.8 Manchester Bound Boarders on the Bury Line in the Off - Peak Period
138
5.9 Manchester Bound Boarders on the Eccles Line in the Peak Period
140
5.10 Eccles Bound Alighters on the Eccles Line in the Peak Period 1415.11 Manchester Bound Boarders on the Eccles Line in the Off-Peak
Period 142
5.12 Eccles Bound Alighters on the Eccles Line in the Off-Peak Period
143
5.13 Annualised Bus Mileage in Millions 1991-2007 and 1985 (pre-deregulation)
145
5.14 Commercial and Subsidised Bus Mileage in Millions 1991-2007 and 1985 (pre-deregulation)
145
GMTU Report 1387 List of Figures
(xiv)
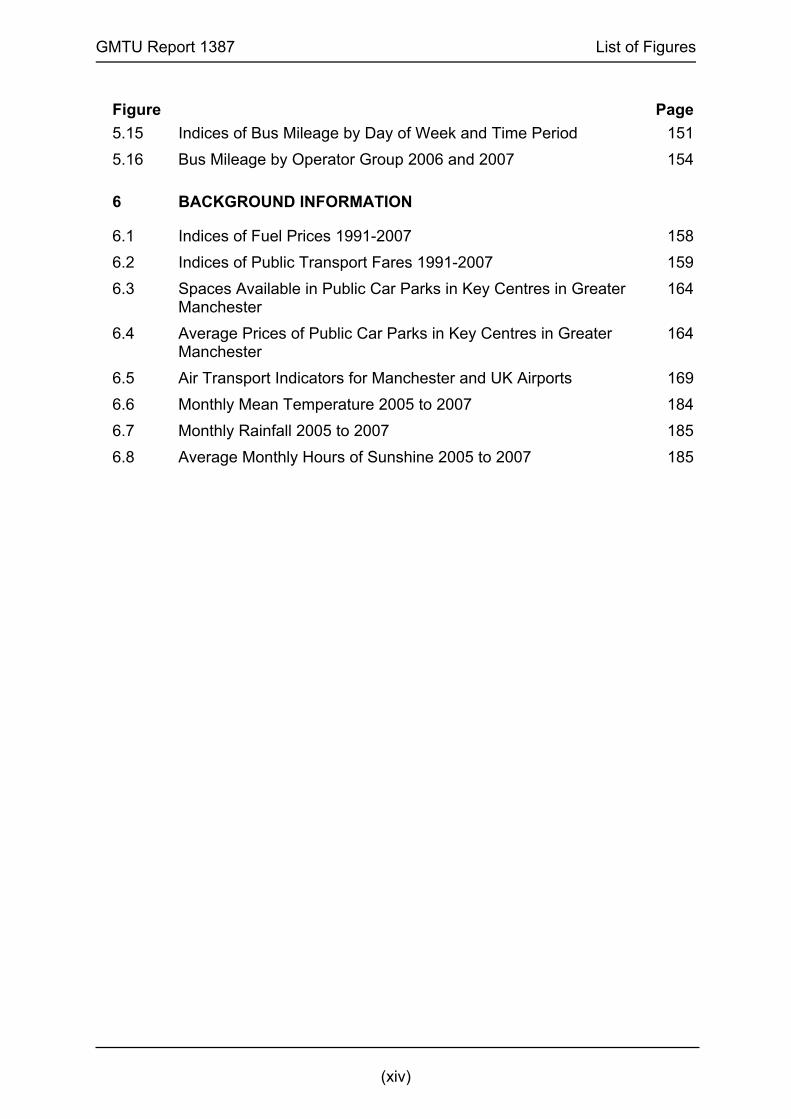
Figure Page5.15 Indices of Bus Mileage by Day of Week and Time Period 1515.16 Bus Mileage by Operator Group 2006 and 2007 154
6 BACKGROUND INFORMATION
6.1 Indices of Fuel Prices 1991-2007 1586.2 Indices of Public Transport Fares 1991-2007 1596.3 Spaces Available in Public Car Parks in Key Centres in Greater
Manchester 164
6.4 Average Prices of Public Car Parks in Key Centres in Greater Manchester
164
6.5 Air Transport Indicators for Manchester and UK Airports 1696.6 Monthly Mean Temperature 2005 to 2007 1846.7 Monthly Rainfall 2005 to 2007 1856.8 Average Monthly Hours of Sunshine 2005 to 2007 185

EXECUTIVE SUMMARY


GMTU Report 1387 Executive Summary
Page 3
TRANSPORT STATISTICS GREATER MANCHESTER 2007
EXECUTIVE SUMMARY
Local Transport Plan
Best Value, mandatory and local headline indicators for the second Greater Manchester Local Transport Plan (GMLTP2) are included in this report. In most instances, the indicators have a base of 2003/04, a target of 2010/11 and a trajectory of milestones to reach in the intervening years. Progress against these milestones is summarised here.
Maintenance (Best Value)
• We appear to have made good progress in maintaining principal roads and non-principal roads while results for maintaining unclassified roads, footway condition (BV 187), accessible pedestrian crossings (BV 165) and ease of use of Public Rights Of Way (PROW) (BV 178) are inconclusive. Inconsistencies in methodology, target setting and revisions to last year’s data make it difficult to form firm conclusions on progress.
Road Casualties (Best Value)
• Child killed and seriously injured (KSI) casualties (BV 99ii) and slight casualties (BV 99iii) are on track and, while we have not done as well as we would have hoped for on total KSI, the numbers are decreasing.
Public Transport (Best Value)
• Bus (BV102a), Rail (BV102b) and Metrolink (BV102c) patronage are all on track. Rail exceeded the target.
• The final target for bus satisfaction (BV 104) has been exceeded and revision
is being considered.
Road and Other Traffic (Mandatory)
• Area wide vehicle mileage (LTP2) is on track, and the number of cyclists in 2007 exceeded the final target meaning that LTP3 is well on track. Mode share of journey to schools (LTP4) is on the right track but has not quite met its yearly target. Peak period traffic flow to urban centres (LTP6) is on track and has in fact decreased. This is probably due in part to the recent increase in petrol prices. Congestion (LTP7) has also exceeded its target.
Public Transport (Mandatory)
• The percentage of households within 30 minutes of a category A interchange or Manchester City Centre by 08:45 (LTP1a) is still off track but has increased in the last year. The equivalent by 08:30 for jobseekers (LTP1b) is well on track following revisions in the DfT base data.

GMTU Report 1387 Executive Summary
Page 4
• The results of the bus punctuality indicators (LTP5) are inconclusive and subject to revision in future years.
Pollution (Mandatory)
• The index of change in the emissions of NOx from major roads (LTP8) was on track in 2006 but data is yet to be available for 2007.
Pollution (Headline)
• The index of change in the emissions of CO2 from major roads (LTP8) was on track in 2006 but data is yet to be available for 2007.
Public Transport (Headline)
• The percentage of wheelchair accessible buses (LTP10a) is on track. The percentage of accessible bus stops LTP10b now has trend information based on QBC data and is on track but accessible rail stations (LTP10c) are off track. Funding sources for LTP10c have been identified.
Road and Other Traffic (Headline)
• The numbers of people walking (LTP11) was on track last year. 2007 data from the National Travel Survey (NTS) is not yet available.
Modal share of trips to the regional centre, the modal share of trips to other
key centres (LTP12b) and Manchester Airport (LTP12a&c) are all on track.
Road Traffic
Traffic Flow Changes on Major Roads in Greater Manchester 2006-2007 Table 1 gives a summary of percentage changes in traffic flows in Greater Manchester between 2006 and 2007.
• There was a 1% increase in traffic flows on motorways, no increase on A roads and a 1% decrease on B roads between 2006 and 2007. Motorway flows were affected by roadworks on the southern section of the M60 near Stockport. Evidence from Automatic Traffic Counts (ATC) indicates that there were decreases in traffic flows on this section of the network and the M56.
• Traffic flows increased by 1% on minor roads.
• Light goods vehicle (LGV) flows increased but other goods vehicles (OGV) flows decreased on all classes of road.
• Pedal cycle flows have increased by 7% on A roads and 5% on B roads, but decreased by 2% on minor roads. Note, though, that as the flows are small, measured changes are less statistically reliable than for other vehicle types.

GMTU Report 1387 Executive Summary
Page 5
Table 1 Percentage Changes in 12-Hour Traffic Flows on a Sample of Motorways, A Roads and B Roads between 2006 and 2007
Road Class Cars LGV OGV Buses and Coaches
Motor Cycles
Pedal Cycles
All Motors
Motorways 1 3 -1 -28 -12 1 1 A Roads 0 3 -5 -6 -1 7 0 B Roads 0 1 -10 -11 5* 5* -1 Minor Roads 1 3 -2 -5* -4* -2* 1 * Flows are small and observed changes are consequently less statistically reliable
than on other roads
Longer Term National and Local Growth in Traffic Flows
• Indices of national and local growth in traffic flows on motorways and A roads since 1993 are illustrated in Figure 1.
• Traffic flows on national and local motorways both showed increases of 33% between 1993 and 2007. Growth on local motorways had been slower than nationally but, following the completion of the M60 ring in October 2000, began to rise more steeply in 2001 to exceed national levels by 2002. Local flows have levelled of in the last few years, partly due to long-term roadworks on the M60 junctions 5 to 8, now completed.
• Traffic flow levels on A roads locally have shown less increase than nationally since 1993 although both have been fairly static in the last 10 years.
Figure 1 National and Local Traffic Growth 1993 - 2007
100
105
110
115
120
125
130
135
140
1993 1994 1995 1996 1997 1998 1999 2000 2001 2002 2003 2004 2005 2006 2007
Year
Traf
fic F
low
Inde
x
Local Motorway National Motorway Local A Road National A Road
Index: 1993=100

GMTU Report 1387 Executive Summary
Page 6
Composition of Traffic
• In 2007 cars made up about 80% of all road traffic. The proportion of cars ranged from 74% on motorways to 84% on minor roads
• Motorways had a higher proportion of goods traffic than other roads. This relative difference increased with size of goods vehicle. Heavy goods vehicles with more than 4 axles accounted for 6.3% of traffic on motorways, 1.4% on A roads, 0.6% on B roads and 0.5% on minor roads.
Vehicle Kilometres on Motorways, A Roads and B Roads in Greater Manchester in 2007
• Motorways made up 12% of the major road network and carried 44% of traffic including 61% of goods vehicle traffic. The average annual flow per kilometre on motorways was 34.5 million vehicles.
• A roads made up 61% of the major road network and also carried 44% of traffic. The average annual flow per kilometre on A roads was 6.8 million vehicles.
• B roads made up 27% of the major road network and carried 11% of traffic. The average annual flow per kilometre on B roads was 4.0 million vehicles.
• Vehicle kilometres on major roads have increased by 21% since 1993 but this overall increase reflects increases of 50% on motorways compared with 5% on A roads.
Traffic Speeds
• Average morning peak hour speeds are 36 mph on GM motorways and 16 mph on built-up A and B roads.
• Average inter–peak speeds (1000-1600) are 50 mph on motorways and 19 mph on built-up A and B roads.
Key Centre Monitoring Traffic flows into Bolton town centre decreased in all time periods between
1997 and 2007. Between 2001 and 2007 car trips have decreased but non-car trips have increased. The total number of trips has decreased in all time periods.
Bury traffic flows decreased in all time periods between 1997 and 2005 and
particularly in the peak periods. Between 2002 and 2005 car trips have decreased but non-car trips have increased. Trips overall have increased slightly in the peak periods, but decreased in the off-peak.
Manchester traffic flows decreased in all time periods between 1997 and
2006. The improvements to the Manchester and Salford Inner Relief Route in 2002 and traffic management measures within the city centre have contributed to this. Both car and non-car trips have increased, particularly in the off-peak, between 2002 and 2006.
GMTU Report 1387 Executive Summary
Page 7
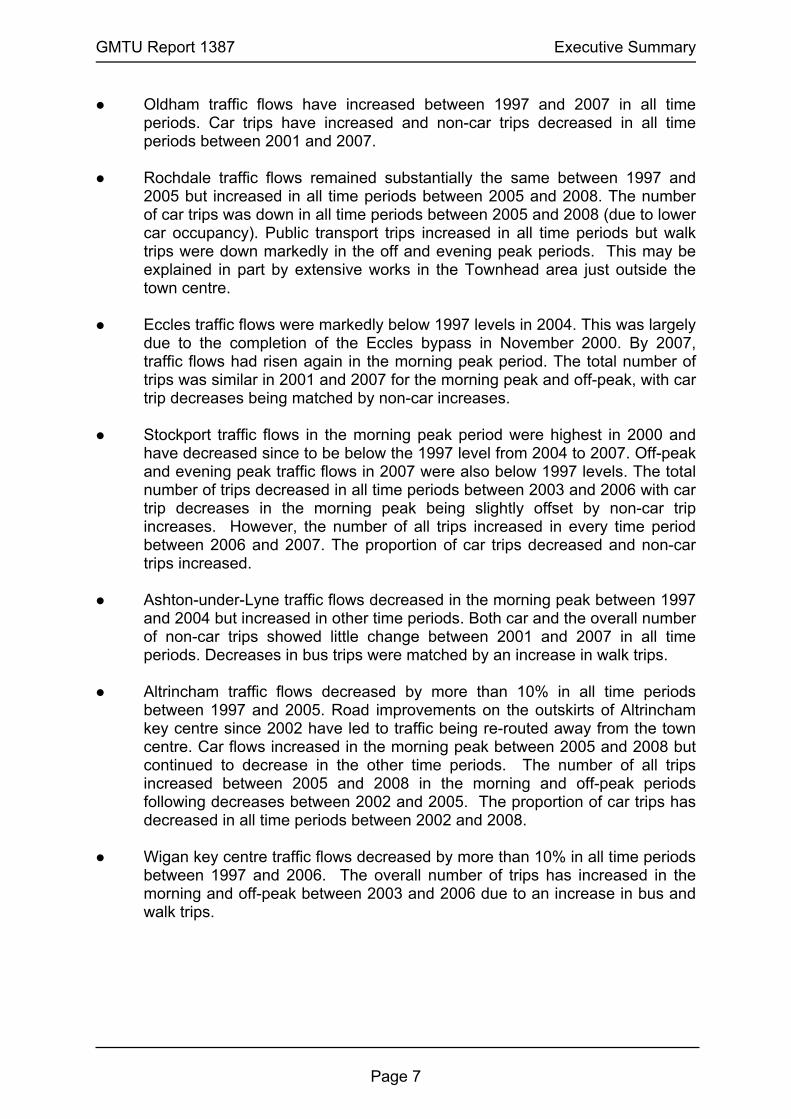
Oldham traffic flows have increased between 1997 and 2007 in all time periods. Car trips have increased and non-car trips decreased in all time periods between 2001 and 2007.
Rochdale traffic flows remained substantially the same between 1997 and
2005 but increased in all time periods between 2005 and 2008. The number of car trips was down in all time periods between 2005 and 2008 (due to lower car occupancy). Public transport trips increased in all time periods but walk trips were down markedly in the off and evening peak periods. This may be explained in part by extensive works in the Townhead area just outside the town centre.
Eccles traffic flows were markedly below 1997 levels in 2004. This was largely
due to the completion of the Eccles bypass in November 2000. By 2007, traffic flows had risen again in the morning peak period. The total number of trips was similar in 2001 and 2007 for the morning peak and off-peak, with car trip decreases being matched by non-car increases.
Stockport traffic flows in the morning peak period were highest in 2000 and
have decreased since to be below the 1997 level from 2004 to 2007. Off-peak and evening peak traffic flows in 2007 were also below 1997 levels. The total number of trips decreased in all time periods between 2003 and 2006 with car trip decreases in the morning peak being slightly offset by non-car trip increases. However, the number of all trips increased in every time period between 2006 and 2007. The proportion of car trips decreased and non-car trips increased.
Ashton-under-Lyne traffic flows decreased in the morning peak between 1997
and 2004 but increased in other time periods. Both car and the overall number of non-car trips showed little change between 2001 and 2007 in all time periods. Decreases in bus trips were matched by an increase in walk trips.
Altrincham traffic flows decreased by more than 10% in all time periods
between 1997 and 2005. Road improvements on the outskirts of Altrincham key centre since 2002 have led to traffic being re-routed away from the town centre. Car flows increased in the morning peak between 2005 and 2008 but continued to decrease in the other time periods. The number of all trips increased between 2005 and 2008 in the morning and off-peak periods following decreases between 2002 and 2005. The proportion of car trips has decreased in all time periods between 2002 and 2008.
Wigan key centre traffic flows decreased by more than 10% in all time periods
between 1997 and 2006. The overall number of trips has increased in the morning and off-peak between 2003 and 2006 due to an increase in bus and walk trips.

GMTU Report 1387 Executive Summary
Page 8
Other Traffic
Car Occupancy
Weekday surveys at 10 A road sites in 2007 showed that, between 08:00 and 09:00, 87% of cars had only a single occupant. This compares with 74% of driver only cars during the off-peak period (10:00-12:00).
Peak car occupancy has decreased from 1.22 persons/car in 2000 to 1.15 in
2007. Off-peak car occupancy has decreased from 1.36 to 1.30 though the overall trend is not as obviously downward as the peak hour trend.
Cycle Flows on Major Roads
Pedal cycle kilometres on A & B roads decreased by 17% between 2001 and 2004 but increased by 13% between 2004 and 2007.
Public Transport
Rail Patronage The number of rail passengers travelling towards Manchester City Centre
from stations in Greater Manchester during the morning peak period increased by 47% between 1991 and 2007.
The number of off-peak passengers more than doubled over the same period.
Both peak and off-peak patronage in Greater Manchester increased by 7%
between 2006 and 2007.
Metrolink Patronage
Weekday peak period (07:30-09:30) boarders on Manchester bound trams on the Bury line decreased by 12% between 2006 and 2007 to just under 2,700 passengers. Off-peak (09:30-13:30) boarders decreased by 1% to just below 2,800 passengers.
Inbound peak boarders on the Altrincham line decreased by 11% between
2006 and 2007 to just below 3,600 passengers. Off-peak boarders decreased by 4% to just below 3,500 passengers.
Both these lines were closed for major track upgrade work in the summer of
2007 and patronage has not fully recovered. There were also barrier problems on the Altrincham line that affected a few trams on the day of survey.
Peak boarders inbound to Manchester on the Eccles line increased by 9% to
almost 1,000 between 2006 and 2007. Peak alighters outbound from Manchester increased by 28% to almost 1,500 (the increase was predominantly at Exchange Quay). Off-peak boarders towards Manchester increased by 1% to just below 1,100 but alighters towards Eccles decreased by 7% to just below 1,100.

GMTU Report 1387 Executive Summary
Page 9
Bus Service Supply
Overall bus mileage decreased by 6% between 2006 and 2007 to 66.9 million miles. Some of this decrease relates to UK North services ceasing to operate.
Commercial bus mileage operated in 2007 (53.3 million miles) was below the
total mileage operated in 1985 before bus deregulation (65.3 million miles). 20% of Greater Manchester bus mileage is now subsidised.
Total weekday morning peak mileage decreased by 7% between 2006 and
2007 to be 90% of pre-deregulation mileage. Weekday off-peak mileage decreased by 5% between 2006 and 2007 but
remains 38% above that prior to deregulation. Saturday mileage decreased by 7% and is back at its pre-deregulation level.
Weekday evening and Sunday mileage are now considerably below pre-
deregulation levels. Both fell by 7% between 2006 and 2007 with evening mileage now 64% and Sunday mileage 77% of that prior to deregulation.
In 2007 Sunday mileage was only 43% of that on Saturday.
First and Stagecoach operator groups operated 70% of bus mileage in
Greater Manchester in 2007.


1 LOCAL TRANSPORT PLAN INDICATORS


GMTU Report 1387 Local Transport Plan
Page 13
BEST VALUE INDICATORS
BV 223: Principal Road Condition
1.1 Table 1.1 shows the proportion of principal roads where structural maintenance should be considered in each district (BV 223). Guidance for this indicator was amended in 2007. Consequently, districts have revised targets based on results obtained from following the new guidance and figures differ from those reported last year and from those set at the start of LTP2.
Table 1.1 BV 223 – Principal Road Condition
Actual (%) Target (%)
District 2007/08 2007/08 2008/09 2009/10 2010/11 Bolton 5 15 5 5 4 Bury 6 15 5 4 3 Manchester 6 10 10 9 9 Oldham 11 30 10 9 8 Rochdale 10 15 14 Salford 6 25 6 5 5 Stockport 5 10 10 10 10 Tameside 6 11 6 6 6 Trafford 9 14 Wigan 5 12 5 5 4
BV 224a: Non-principal Classified Road Condition
1.2 Table 1.2 shows the proportion of non-principal classified roads where structural maintenance should be considered in each district (BV 224a). As with BV 223, the guideline for this indicator was amended in 2007, and each district has revised its targets accordingly since the publication of the second Greater Manchester Local Transport Plan (GMLTP2).
Table 1.2 BV 224a –Non-principal Classified Road Condition
Actual (%) Target (%) District 2007/08 2007/08 2008/09 2009/10 2010/11 Bolton 8 22 7 7 6 Bury 9 21 9 8 7 Manchester 6 13 13 12 12 Oldham 12 25 12 11 11 Rochdale 11 20 19 Salford 8 30 8 7 7 Stockport 5 12 11 10 10 Tameside 7 14 7 7 6 Trafford 8 20 Wigan 4 12 4 3 3

GMTU Report 1387 Local Transport Plan
Page 14
BV 224b: Unclassified Road Condition
1.3 Table 1.3 shows the proportion of unclassified roads where structural maintenance should be considered in each district (BV 224b). Indicator guidance has been amended since the publication of GMLTP2 and districts have produced revised targets.
Table 1.3 BV 224b –Unclassified Classified Road Condition
Actual (%) Target (%) District 2007/08 2007/08 2008/09 2009/10 2010/11 Bolton 20 21 15 11 7 Bury 6 12 Manchester 9 15 14 14 13 Oldham 16 17 15 15 15 Rochdale 8 13 13 Salford 22 16 21 20 20 Stockport 10 10 10 10 10 Tameside 11 17 17 16 15 Trafford 9 12 11 11 11 Wigan 5 9 5 4 4
BV 187: Principal Footway Condition
1.4 Table 1.4 shows the proportion of category 1, 1a and 2 footways that may require maintenance to preserve serviceability in each district (BV 187). Many districts have set revised targets from those originally published in GMLTP2. The reasons for such revisions vary from district to district as measurement methods have improved.
Table 1.4 BV 187 – Principal Footway Condition
Actual (%) Target (%) District 2006/07 2007/08 2007/08 2008/09 2009/10 2010/11 Bolton 22 36 36 Bury 34 34 35 Manchester 24 19 14 Oldham 38 35 34 Rochdale 19 27 19 Salford 66 26 26 Stockport 25 22 23 Tameside 18 18 18 Trafford 18 8 13 Wigan 13 10 13
BV187 to be revised so not applicable.

GMTU Report 1387 Local Transport Plan
Page 15
BV 99i: Road Safety – All KSI
1.5 Table 1.5 & Figure 1.1 show the annual average number of KSI (killed or seriously injured) casualties for Greater Manchester (BV 99i) along with the targets set in GMLTP2.
1.6 After a slight increase in the annual average number of KSI casualties for the
period 2003-05, the 2004-06 and 2005-07 results marks a significant downturn. However, the indicator remains above target.
Table 1.5 BV 99i – All KSI
Actual Target Year KSI (annual ave) Index KSI (annual ave) Index
1994-98 1281 100 2001-04 1069 83 2002-04 1066 83 1066 83 2003-05 1073 84 991 77 2004-06 1019 80 922 72 2005-07 981 77 857 67 2006-08 797 62 2007-09 741 58 2008-10 689 54 2009-11 641 50
Figure 1.1 BV99i: Road Safety - All KSI
0
200
400
600
800
1000
1200
1400
2001-04 2002-04 2003-05 2004-06 2005-07 2006-08 2007-09 2008-10 2009-11
Year
Annu
al a
vera
ge N
o. K
SI
Actual Target 1994-98 Baseline
GMTU Report 1387 Local Transport Plan
Page 16
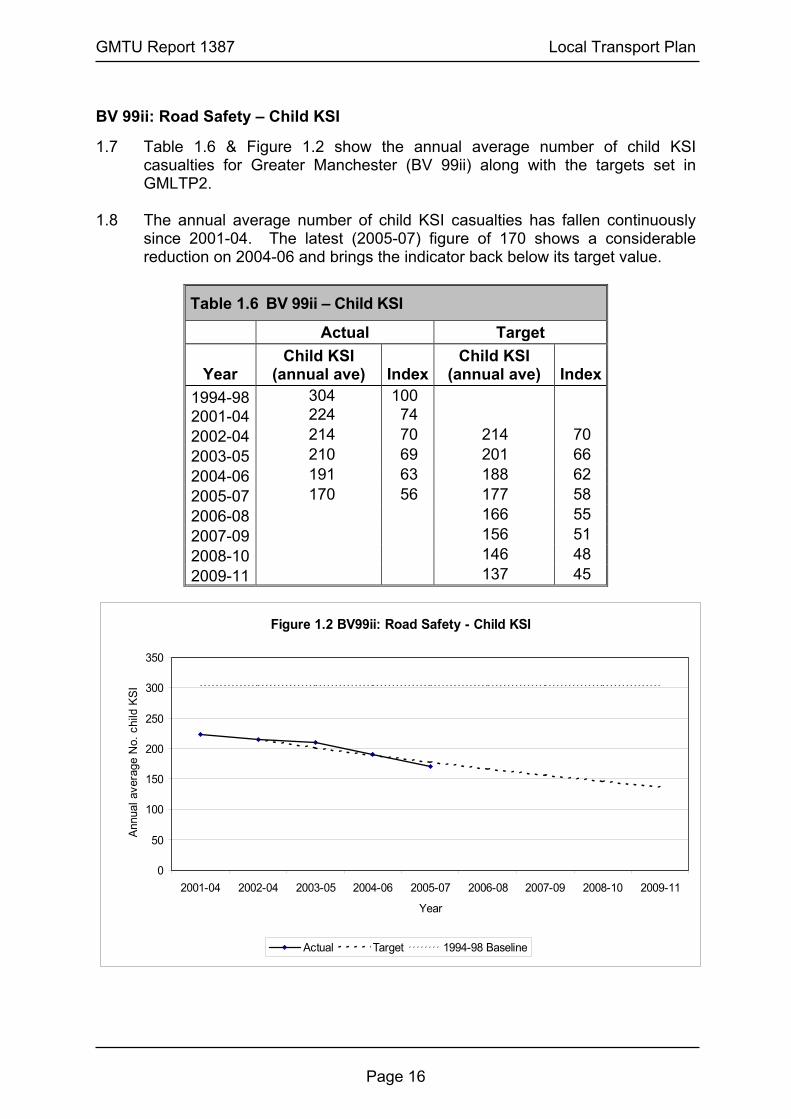
BV 99ii: Road Safety – Child KSI
1.7 Table 1.6 & Figure 1.2 show the annual average number of child KSI casualties for Greater Manchester (BV 99ii) along with the targets set in GMLTP2.
1.8 The annual average number of child KSI casualties has fallen continuously
since 2001-04. The latest (2005-07) figure of 170 shows a considerable reduction on 2004-06 and brings the indicator back below its target value.
Table 1.6 BV 99ii – Child KSI
Actual Target
Year Child KSI
(annual ave) IndexChild KSI
(annual ave) Index 1994-98 304 100 2001-04 224 74 2002-04 214 70 214 70 2003-05 210 69 201 66 2004-06 191 63 188 62 2005-07 170 56 177 58 2006-08 166 55 2007-09 156 51 2008-10 146 48 2009-11 137 45
Figure 1.2 BV99ii: Road Safety - Child KSI
0
50
100
150
200
250
300
350
2001-04 2002-04 2003-05 2004-06 2005-07 2006-08 2007-09 2008-10 2009-11
Year
Annu
al a
vera
ge N
o. c
hild
KSI
Actual Target 1994-98 Baseline
GMTU Report 1387 Local Transport Plan
Page 17
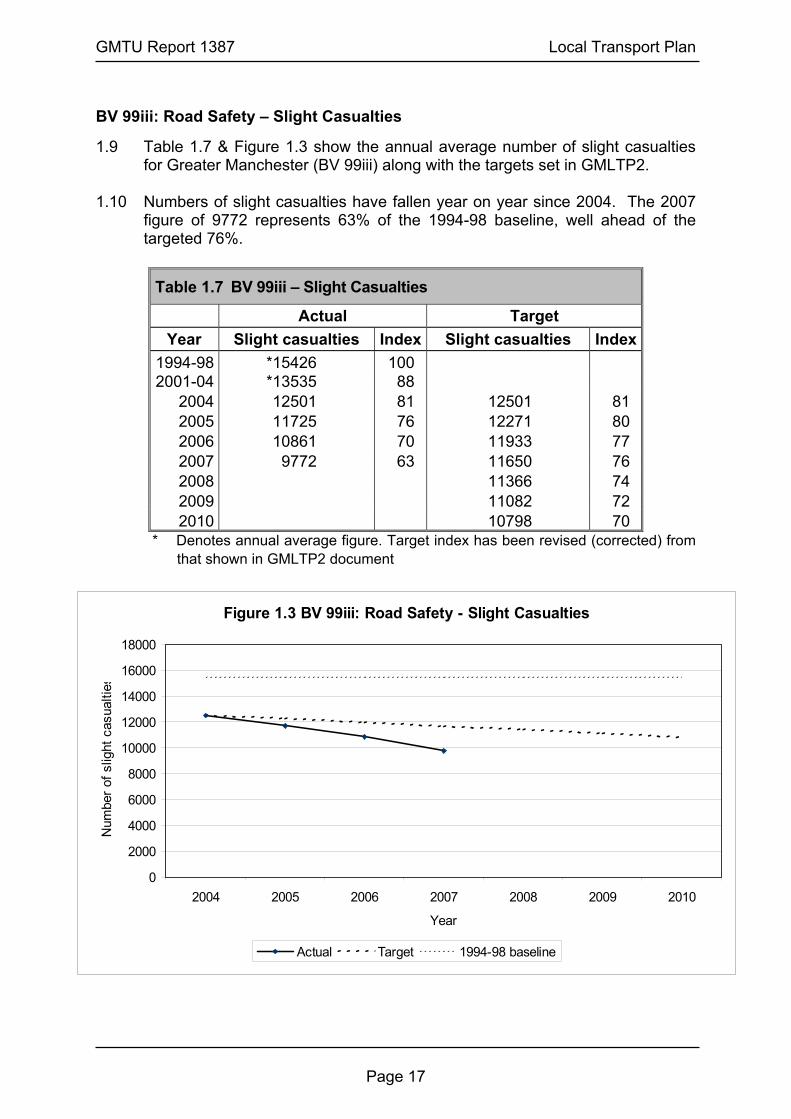
BV 99iii: Road Safety – Slight Casualties
1.9 Table 1.7 & Figure 1.3 show the annual average number of slight casualties for Greater Manchester (BV 99iii) along with the targets set in GMLTP2.
1.10 Numbers of slight casualties have fallen year on year since 2004. The 2007
figure of 9772 represents 63% of the 1994-98 baseline, well ahead of the targeted 76%.
Table 1.7 BV 99iii – Slight Casualties
Actual Target Year Slight casualties Index Slight casualties Index
1994-98 *15426 100 2001-04 *13535 88
2004 12501 81 12501 81 2005 11725 76 12271 80 2006 10861 70 11933 77 2007 9772 63 11650 76 2008 11366 74 2009 11082 72 2010 10798 70
* Denotes annual average figure. Target index has been revised (corrected) from that shown in GMLTP2 document
Figure 1.3 BV 99iii: Road Safety - Slight Casualties
0
2000
4000
6000
8000
10000
12000
14000
16000
18000
2004 2005 2006 2007 2008 2009 2010
Year
Num
ber o
f slig
ht c
asua
lties
Actual Target 1994-98 baseline

GMTU Report 1387 Local Transport Plan
Page 18
BV 102a: Bus Patronage
1.11 Table 1.8 & Figure 1.4 show the number of bus passenger trips in Greater Manchester (BV 102).
1.12 A range of values (based on confidence limits of 2%) has been agreed with DfT for the annual targets. Patronage for 2003/04 and 2005/06 has been revised since last year. The results indicate that the pre-2000 decrease in bus patronage has been arrested. Patronage has increased since 2005/06 and the 2006/07 figure is just inside the low target range.
Table 1.8 BV 102a – Bus Patronage
Actual Target Year Million Journeys Index Million Journeys Index
1991/92 269 120 1992/93 256 114 1993/94 249 111 1994/95 249 111 1995/96 236 105 1996/97 228 101 1997/98 227 101 1998/99 220 98 1999/00 215 96 2000/01 221 98 2001/02 223 99 2002/03 228 101 2003/04 *225 100 2004/05 218 97 219 97 2005/06 219 97 220 98 2006/07 223 99 228 101 2007/08 224 100 228 101 2008/09 228 102 2009/10 229 102 2010/11 230 102
* Denotes GMLTP2 baseline figure
Figure 1.4 BV 102a: Bus Patronage
150
170
190
210
230
250
270
290
1991
/92
1992
/93
1993
/94
1994
/95
1995
/96
1996
/97
1997
/98
1998
/99
1999
/00
2000
/01
2001
/02
2002
/03
2003
/04
2004
/05
2005
/06
2006
/07
2007
/08
2008
/09
2009
/10
2010
/11
Mill
ion
jour
neys
Actual LTP2 Target Low range High range

GMTU Report 1387 Local Transport Plan
Page 19
BV 102b: Rail Patronage
1.13 Table 1.9 & Figure 1.5 show the number of rail passenger trips in Greater Manchester. A range of values (based on confidence limits of 7.5%) has been agreed with DfT for the annual targets. Rail patronage has continued to increase since the publication of GMLTP2 and the 2007/8 figure is well ahead of target. GMPTE has set a stretched target due to milestones being exceeded and is giving consideration to stretching the target even further in light of this year’s increase.
Table 1.9 BV 102b – Rail Patronage
Actual Original Target GMPTE Stretched
Target
Year Million
Journeys IndexMillion
Journeys IndexMillion
Journeys Index 2001/02 17.0 97 2002/03 17.0 97 2003/04 *17.5 100 2004/05 18.1 103 18.1 103 2005/06 19.7 113 18.6 107 2006/07 20.7 118 19.1 109 2007/08 22.2 127 19.4 111 20.7 118 2008/09 19.6 112 21.0 120 2009/10 19.6 112 21.3 122 2010/11 19.6 112 21.7 124
* Denotes GMLTP2 baseline figure
Figure 1.5 BV102b: Rail Patronage
10.0
12.0
14.0
16.0
18.0
20.0
22.0
24.0
2001/02 2002/03 2003/04 2004/05 2005/06 2006/07 2007/08 2008/09 2009/10 2010/11
Mill
ion
Jour
neys
Actual OriginalTarget Low range (-7.5%) High range (+7.5%) Stretched Target

GMTU Report 1387 Local Transport Plan
Page 20
BV 102c: Metrolink Patronage
1.14 Table 1.10 & Figure 1.6 show the number of Metrolink passenger trips in Greater Manchester. A range of values (based on confidence limits of 5%) has been agreed with DfT for the annual targets. The 2007/08 figure is annualised based on November 2007 data and therefore does not reflect the dip in patronage caused by the Metrolink upgrade in Summer 2007.
Table 1.10 BV 102c – Metrolink Patronage
Actual Target Year Million Journeys Index Million Journeys Index
1991/92 7.5 40 1992/93 7.6 41 1993/94 11 59 1994/95 12.3 66 1995/96 12.7 68 1996/97 13.6 73 1997/98 13.8 74 1998/99 13.1 70 1999/00 14.2 76 2000/01 17.2 92 2001/02 18.3 98 2002/03 18.8 101 2003/04* 18.6 100 2004/05 19.5 105 19.5 105 2005/06 19.8 106 19.5 105 2006/07 19.9 107 19.5 105 2007/08 19.7 106 17.5 94 2008/09 19.5 105 2009/10 20.1 108 2010/11 20.7 111
* Denotes GMLTP2 baseline figure
Figure 1.6 BV102c: Metrolink Patronage
0
5
10
15
20
25
1991
/92
1992
/93
1993
/94
1994
/95
1995
/96
1996
/97
1997
/98
1998
/99
1999
/00
2000
/01
2001
/02
2002
/03
2003
/04
2004
/05
2005
/06
2006
/07
2007
/08
2008
/09
2009
/10
2010
/11
Mill
ion
jour
neys
Actual Target Low range (-5%) High range (+5%)

GMTU Report 1387 Local Transport Plan
Page 21
BV 104: Bus Satisfaction (residents)
1.15 Table 1.11 & Figure 1.7 show results from the triennial AGMA bus satisfaction survey (BV 104). The last survey results, for 2006/07, suggested that bus satisfaction among residents was increasing and exceeding the GMLTP2 trajectory.
Table 1.11 BV 104 – Bus Satisfaction Year Actual Index Target Index
2000/01 53% 2003/04 55% (GMLTP2 baseline) 55% 2006/07 61% 57% 2009/10 60%
Figure 1.7 BV104: Bus Satisfaction (AGMA BV104 Survey)
0%
10%
20%
30%
40%
50%
60%
70%
80%
90%
100%
2000/01 2003/04 2006/07 2009/10
% s
atis
fact
ion
Actual Target
GMTU Report 1387 Local Transport Plan
Page 22
OTHER LTP MANDATORY INDICATORS
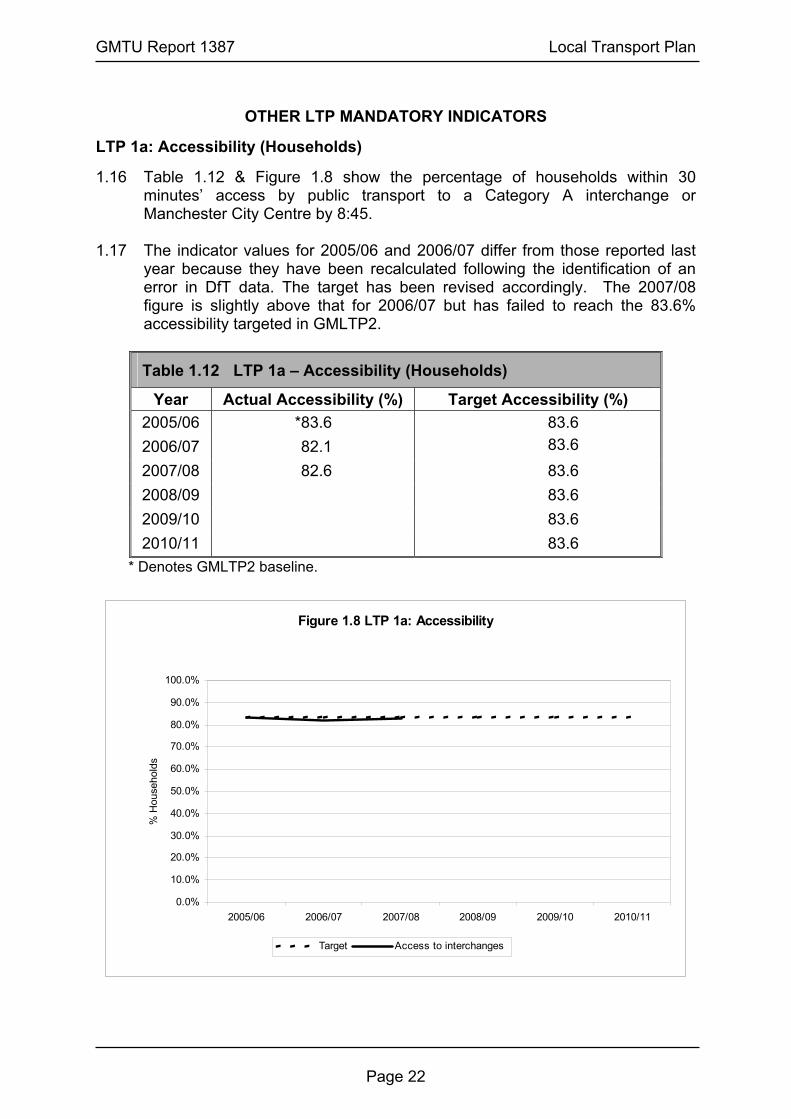
LTP 1a: Accessibility (Households)
1.16 Table 1.12 & Figure 1.8 show the percentage of households within 30 minutes’ access by public transport to a Category A interchange or Manchester City Centre by 8:45.
1.17 The indicator values for 2005/06 and 2006/07 differ from those reported last
year because they have been recalculated following the identification of an error in DfT data. The target has been revised accordingly. The 2007/08 figure is slightly above that for 2006/07 but has failed to reach the 83.6% accessibility targeted in GMLTP2.
Table 1.12 LTP 1a – Accessibility (Households)
Year Actual Accessibility (%) Target Accessibility (%) 2005/06 *83.6 83.6 2006/07 82.1 83.6 2007/08 82.6 83.6 2008/09 83.6 2009/10 83.6 2010/11 83.6
* Denotes GMLTP2 baseline.
Figure 1.8 LTP 1a: Accessibility
0.0%
10.0%
20.0%
30.0%
40.0%
50.0%
60.0%
70.0%
80.0%
90.0%
100.0%
2005/06 2006/07 2007/08 2008/09 2009/10 2010/11
% H
ouse
hold
s
Target Access to interchanges

GMTU Report 1387 Local Transport Plan
Page 23
LTP 1b: Accessibility (Jobseekers)
1.18 Table 1.13 & Figure 1.9 show the percentage of people in receipt of Jobseekers’ Allowance within 30 minutes’ access by public transport to a Category A interchange or Manchester City Centre by 8:00.
1.19 As with LTP 1a, the indicator values for 2005/06 and 2006/07 differ from those
reported last year because they have been recalculated following the identification of an error in DfT data. The target has been revised accordingly. The 2007/08 figure is slightly above that for 2006/07 and exceeds the 86.5% accessibility targeted in GMLTP2.
Table 1.13 LTP 1b – Accessibility (Jobseekers)
Year Actual Accessibility (%) Target Accessibility (%) 2005/06 *86.5% 86.5% 2006/07 86.9% 86.5% 2007/08 88.1% 86.5% 2008/09 86.5% 2009/10 86.5% 2010/11 86.5%
* Denotes GMLTP2 baseline.
Figure 1.9 LTP1b Accessibility for Jobseekers
50.0%
55.0%
60.0%
65.0%
70.0%
75.0%
80.0%
85.0%
90.0%
95.0%
100.0%
2005/06 2006/07 2007/08 2008/09 2009/10 2010/11
% jo
bsee
kers
Target Access to interchanges (Second LTP)
GMTU Report 1387 Local Transport Plan
Page 24
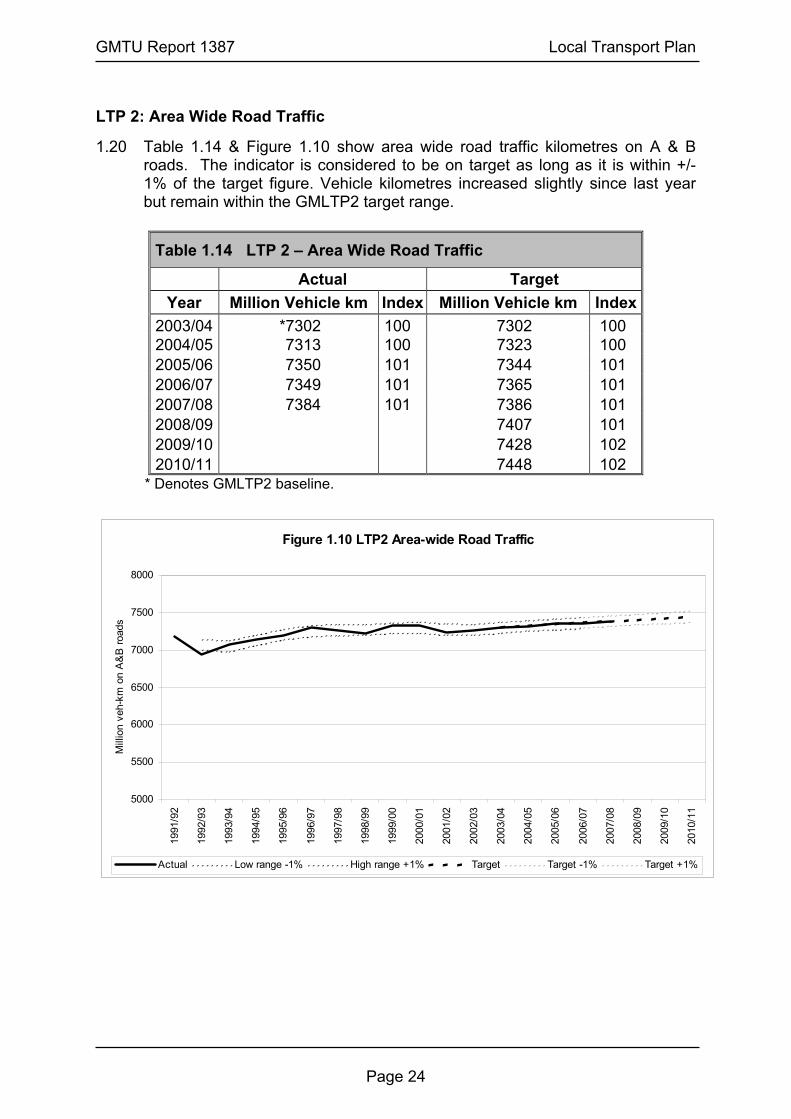
LTP 2: Area Wide Road Traffic
1.20 Table 1.14 & Figure 1.10 show area wide road traffic kilometres on A & B roads. The indicator is considered to be on target as long as it is within +/- 1% of the target figure. Vehicle kilometres increased slightly since last year but remain within the GMLTP2 target range.
Table 1.14 LTP 2 – Area Wide Road Traffic
Actual Target Year Million Vehicle km Index Million Vehicle km Index
2003/04 *7302 100 7302 100 2004/05 7313 100 7323 100 2005/06 7350 101 7344 101 2006/07 7349 101 7365 101 2007/08 7384 101 7386 101 2008/09 7407 101 2009/10 7428 102 2010/11 7448 102
* Denotes GMLTP2 baseline.
Figure 1.10 LTP2 Area-wide Road Traffic
5000
5500
6000
6500
7000
7500
8000
1991
/92
1992
/93
1993
/94
1994
/95
1995
/96
1996
/97
1997
/98
1998
/99
1999
/00
2000
/01
2001
/02
2002
/03
2003
/04
2004
/05
2005
/06
2006
/07
2007
/08
2008
/09
2009
/10
2010
/11
Mill
ion
veh-
km o
n A
&B
road
s
Actual Low range -1% High range +1% Target Target -1% Target +1%
GMTU Report 1387 Local Transport Plan
Page 25
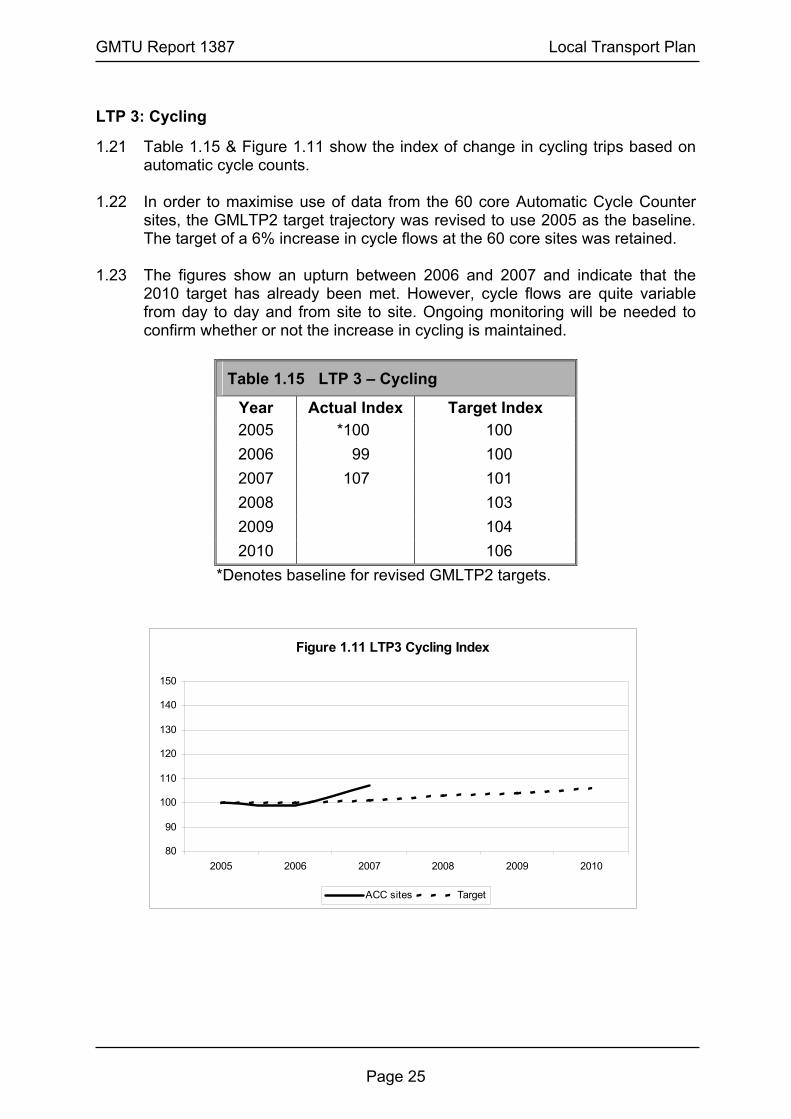
LTP 3: Cycling
1.21 Table 1.15 & Figure 1.11 show the index of change in cycling trips based on automatic cycle counts.
1.22 In order to maximise use of data from the 60 core Automatic Cycle Counter
sites, the GMLTP2 target trajectory was revised to use 2005 as the baseline. The target of a 6% increase in cycle flows at the 60 core sites was retained.
1.23 The figures show an upturn between 2006 and 2007 and indicate that the
2010 target has already been met. However, cycle flows are quite variable from day to day and from site to site. Ongoing monitoring will be needed to confirm whether or not the increase in cycling is maintained.
Table 1.15 LTP 3 – Cycling
Year Actual Index Target Index 2005 *100 100 2006 99 100 2007 107 101 2008 103 2009 104 2010 106
*Denotes baseline for revised GMLTP2 targets.
Figure 1.11 LTP3 Cycling Index
80
90
100
110
120
130
140
150
2005 2006 2007 2008 2009 2010
ACC sites Target

GMTU Report 1387 Local Transport Plan
Page 26
LTP 4: Mode Share of Journeys to School
1.24 Table 1.16 and Figure 1.12 show the baseline and 2007/08 percentages of (a)
primary school, (b) secondary school and (c) total school pupils travelling by car together with targets. These provisional figures are based solely on the 2007 and 2008 School Census returns and do not include any local ‘hands-up’ survey results. We have weighted the census results to reflect the number of pupils in each type of school and in each local authority. The target values have been adjusted to reflect the revised baseline figures and differ from those published last year. All figures are provisional pending approval of the methodology by DfT.
Table 1.16 LTP 4 – Mode Share of Journeys to School (%car) (a) Primary (b) Secondary (c) Total*
Year Actual Target Actual Target Actual Target 2006/07 40.1 40.1 16.7 16.7 29.1 29.1 2007/08 39.0 40.1 17.0 15.0 28.7 28.5 2008/09 40.1 13.8 28.0 2009/10 40.1 12.7 27.6 2010/11 40.1 12.7 27.6
Figure 1.12 LTP4 Percentage of Primary, Secondary and All Pupils Travelling to School by Car
0
5
10
15
20
25
30
35
40
45
2006/07 2007/08 2008/09 2009/10 2010/11
Year
Perc
enta
ge
PrimaryTarget
PrimaryActual
All Target
All Actual
SecondaryTarget
SecondaryActual

GMTU Report 1387 Local Transport Plan
Page 27
LTP 5a: Bus Punctuality of Timetabled Services
1.25 Table 1.17 & Figure 1.13 show the proportion of timetabled bus services running to timetable. The methodology has been amended since LTP2 submission to include all services rather than only subsidised ones.
Table 1.17 LTP5a – Bus Punctuality (Timetabled)
Year (%) running to
timetable Target (%)
2004/05 76 73 2005/06 78 75 2006/07 85 78 2007/08 84 83 2008/09 84 2009/10 85 2010/11 86
Figure 1.13 LTP 5: Bus Punctuality (timetabled)
70%
75%
80%
85%
90%
95%
100%
2004/05 2005/06 2006/07 2007/08 2008/09 2009/10 2010/11
% P
unct
ualit
y
Actual Target
GMTU Report 1387 Local Transport Plan
Page 28
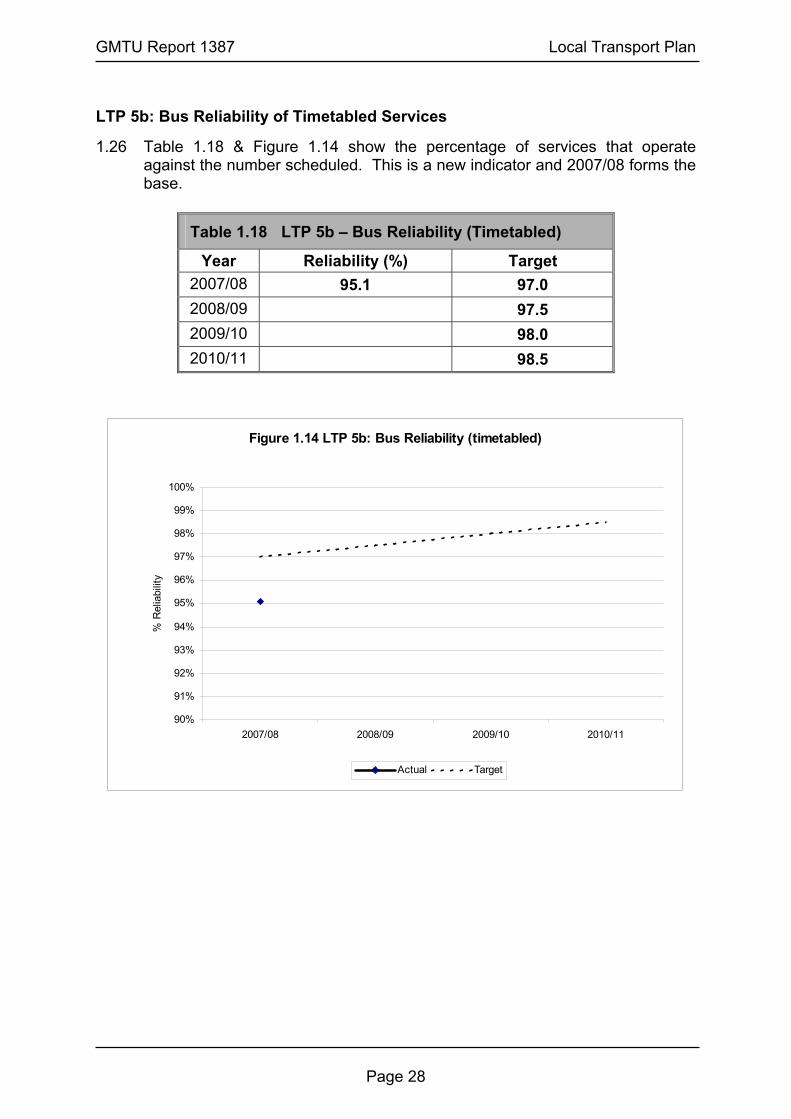
LTP 5b: Bus Reliability of Timetabled Services
1.26 Table 1.18 & Figure 1.14 show the percentage of services that operate against the number scheduled. This is a new indicator and 2007/08 forms the base.
Table 1.18 LTP 5b – Bus Reliability (Timetabled)
Year Reliability (%) Target 2007/08 95.1 97.0 2008/09 97.5 2009/10 98.0 2010/11 98.5
Figure 1.14 LTP 5b: Bus Reliability (timetabled)
90%
91%
92%
93%
94%
95%
96%
97%
98%
99%
100%
2007/08 2008/09 2009/10 2010/11
% R
elia
bilit
y
Actual Target

GMTU Report 1387 Local Transport Plan
Page 29
LTP 6a: Peak Traffic Flow to Regional Centre
1.27 GMLTP2 originally reported the numbers of vehicles crossing the Manchester regional centre cordon inbound between 07:30 and 09:30 on an average weekday based on manual counts. Additional automatic counters have now been established, allowing the indicator to be rebased on ATC data collected in 2007. Table 1.19 presents 2006/07 and 2007/08 data based on automatic traffic counts on an average weekday between 07:00 and 10:00 (in accordance with indicator guidance). Figure 1.15 illustrates the trend for the indicator. The 2010/11 target is maintenance of the base figure.
Table 1.19 LTP 6a – Peak Traffic Flow (Regional Centre)
Year Vehicles Index Target
2006/07 *34779 100 34779 2007/08 33970 98 34779 2008/09 34779 2009/10 34779 2010/11 34779
* Denotes new GMLTP2 baseline.
Figure 1.15 LTP6a Vehicles travelling towards the Regional Centre
0
5000
10000
15000
20000
25000
30000
35000
40000
2006/07 2007/08 2008/09 2009/10 2010/11
Year
Traf
fic F
low
All Vehs Target

GMTU Report 1387 Local Transport Plan
Page 30
LTP 6b: Peak Traffic Flow to Other Key Centres
1.28 GMLTP2 originally reported numbers of vehicles crossing key centre cordons inbound between 07:30 and 09:30 on an average weekday based on manual counts. Additional automatic counters have now been established allowing the indicator to be rebased on ATC data. Table 1.20 presents 2006/07 and 2007/08 data, based on automatic traffic counts on an average weekday between 07:00 and 10:00 (in accordance with indicator guidance) by district. Figure 1.16 illustrates the trend for the indicator.
1.29 The original GMLTP2 2010/11 target was to limit the increase in peak traffic
flow to 1% from the 2002/05 baseline. This is equivalent to a 0.66% increase between 2006/07 (the new baseline) and 2010/11.
Table 1.20 LTP 6b – Peak Traffic Flow (Other Key Centres)
Key Centre Vehicles (2006/07)
Vehicles (2007/08) % Change Target
(2010/11) Altrincham 3739 3889 4% 3764 Ashton 9039 8107 -10% 9099 Bolton 11205 10353 -8% 11280 Bury 4650 4955 7% 4681 Eccles 2544 2424 -5% 2561 Oldham 9008 8782 -3% 9068 Rochdale 5728 5833 2% 5766 Stockport 21066 21038 0% 21206 Wigan 3981 3886 -2% 4008 Total *70960 69267 -2% 71432
* Denotes new GMLTP2 baseline. 2006/07 data has been slightly revised since last reported.
Figure 1.16 LTP6b Vehicles travelling towards Other Key Centres
0
10000
20000
30000
40000
50000
60000
70000
80000
2006/07 2007/08 2008/09 2009/10 2010/11
Year
Traf
fic F
low
All Vehs Target

GMTU Report 1387 Local Transport Plan
Page 31
LTP 7: Congestion
1.30 The Greater Manchester congestion indicator is the average travel rate per person mile across the 15 target routes listed in GMLTP2 Technical Annex. Table 1.21 and Figure 1.17 show the base, 2006/07 and target values for Greater Manchester.
1.31 The indicator relates to the weekday time period 0730 to 0930 and is expressed in minutes per mile travelled. The production of the indicator value involves the combination of non-bus journey time data provided by the Department for Transport, with bus journey time and vehicle occupancy data from local surveys. The exact calculation is undertaken by the DfT. The baseline figure was derived from 2004/05 ITIS vehicle journey time data and bus journey time, bus patronage, other vehicle flow and occupancy data from local surveys in 2005/06. It differs from that published last year.
1.32 The derivation of the target value and trajectory is outlined in the Greater Manchester Congestion Target Delivery Plan, which has been approved by DfT. Also included in that document are individual plans for reducing congestion on each target route.
1.33 The baseline and 2006/07 figures have been published by the DfT in their Transport Statistics Bulletin ‘Road Traffic and Congestion in Great Britain Q1 2008’ May 2008.
Table 1.21 LTP 7 – Congestion
Actual Target
Year Travel Rate (min/mile)
Index Travel Rate (min/mile)
Index
Base 4.83 100.00 4.83 100.00 2006/07 4.67 96.69 4.84 100.25 2007/08 4.87 100.75 2008/09 4.88 101.00 2009/10 4.85 100.50 2010/11 4.83 100.00
Figure 1.17 LTP 7: Congestion Travel Rate Person Journey Time (minutes/mile)
3
3.5
4
4.5
5
5.5
6
Base 2006/07 2007/08 2008/09 2009/10 2010/11
min
utes
per
mile
Actual Target

GMTU Report 1387 Local Transport Plan
Page 32
LTP 8a: Air Quality (Concentration of NO2 at Worst Case Receptor Sites in Each District’s AQMA)
1.34 GMLTP2 anticipated a revision of the target based on a review of the issue following an extensive review of the EMIGMA emissions database and further Defra advice on the nature of the NOx to NO2 conversion relationship. The interim targets have been previously reported in GMLTP2.
1.35 It has now been decided that this measure will no longer be included as an LTP2 indicator both because of its complexity and because of the difficulty in quantifying and isolating out road traffic effects.
LTP 8b: Local Traffic Emissions - Tonnes NOX Emitted from Road Transport on Major Roads in Each District
1.36 Table 1.22 & Figure 1.18 show an index of change for tonnes NOX emitted from road transport on major roads in each district (modelled). Indices have been reported rather than actual tonnes NOX. With the exceptions of Wigan, Rochdale and Bury, local traffic emissions in each district have fallen in line or ahead of the GMLTP2 target trajectory. Overall Greater Manchester emissions have met the 2006 GMLTP2 target. A model incorporating 2007 emissions is not yet available (due Autumn 2008).
1.37 For this indicator, ‘actual’ emission figures represent the best computer-
modelled estimate. Such models are subject to continuous improvement. In order to glean a fair measure of change occurring over time (rather than simply changes due to model improvement) the model must be run for previous years in addition to the current year. Consequently, GMLTP2 targets reported as tonnes NOX are inevitably subject to change each time the model is updated. Presenting the GMLTP2 trajectory as an index will enable the presentation of consistent targets from year to year. The 2011 target remains, as reported in GMLTP2, a 39% reduction in emissions from a 2004 baseline.
Table 1.22 LTP 8b – Local Traffic Emissions
Actual Index Target Index District 2004 2005 2006 2006 2007 2008 2009 2010 2011Bolton 100 94 89 Bury 100 93 91 Manchester 100 93 87 Oldham 100 94 86 Rochdale 100 96 93 Salford 100 93 89 Stockport 100 94 88 Tameside 100 92 83 Trafford 100 93 83 Wigan 100 97 97
GM Total 100 94 89 89 83 78 72 67 61

GMTU Report 1387 Local Transport Plan
Page 33
Fig 1.18 LTP 8b: Index of NOx Emissions from Major Roads
0102030405060708090
100110
2004 2005 2006 2007 2008 2009 2010 2011
Inde
x (2
004
= ba
selin
e)
Actual LTP2 Target

GMTU Report 1387 Local Transport Plan
Page 34
LOCAL HEADLINE LTP INDICATORS
LTP 9: Climate Change
1.38 Table 1.23 & Figure 1.19 show an index of change for the number of tonnes CO2 (modelled) emitted annually from road transport on local roads. Bury, Rochdale, Salford and Wigan are above the limited increase targeted by GMLTP2 for 2006. As with LTP 8b, 2007 figures are not yet available.
1.39 As with LTP 8b, ‘actual’ carbon emission figures represent the best computer-
modelled estimate, which is subject to continuous improvement. In order to glean a fair measure of change over time, the best model at any given moment must be applied retrospectively to previous years in addition to the current year. Consequently, GMLTP2 targets reported as tonnes CO2 are subject to change each time the model is updated. Presenting the GMLTP2 trajectory as an index will enable the presentation of consistent targets from year to year. The GMLTP2 target remains, as previously reported, a limit of 4.5% in increased emissions between 2004 and 2011.
Table 1.23 LTP 9 – Climate Change
Actual Index Target Index District 2004 2005 2006 2006 2007 2008 2009 2010 2011
Bolton 100.0 98.7 100.7Bury 100.0 98.8 103.2Manchester 100.0 98.3 99.6Oldham 100.0 100.0 98.6Rochdale 100.0 100.6 104.3Salford 100.0 99.2 102.5Stockport 100.0 99.6 101.0Tameside 100.0 98.0 94.5Trafford 100.0 98.6 95.7Wigan 100.0 101.5 108.5
GM Total 100.0 99.4 101.4 101.3 101.9 102.6 103.2 103.9 104.5
Figure 1.19 LTP 9: Index of Carbon Emissions
0
20
40
60
80
100
2004 2005 2006 2007 2008 2009 2010 2011
Inde
x (2
004
= ba
selin
e)
Actual LTP Target

GMTU Report 1387 Local Transport Plan
Page 35
LTP 10a: Accessible Infrastructure (Buses)
1.40 Table 1.24 & Figure 1.20 show the proportion of wheelchair accessible buses. There has been a sharp increase in the percentage of accessible buses due to the introduction of low-floor buses by bus companies, particularly on QBC routes. Consequently, the 2007/08 result of 71.5% is well ahead of the GMLTP2 target.
Table 1.24 LTP 10a – Accessible Infrastructure (Buses)
Year Accessible Buses (%) Target (%) 2004/05 *41.8 41.8 2005/06 48.4 48.0 2006/07 64.5 54.0 2007/08 71.5 63.0 2008/09 69.0 2009/10 75.0 2010/11 81.0
* Denotes GMLTP2 baseline.
Figure 1.20 LTP 10a: Percentage of Wheelchair Accessible Buses
0%
10%
20%
30%
40%
50%
60%
70%
80%
90%
100%
2004/05 2005/06 2006/07 2007/08 2008/09 2009/10 2010/11
Acc
essi
ble
buse
s (%
)
Actual Target
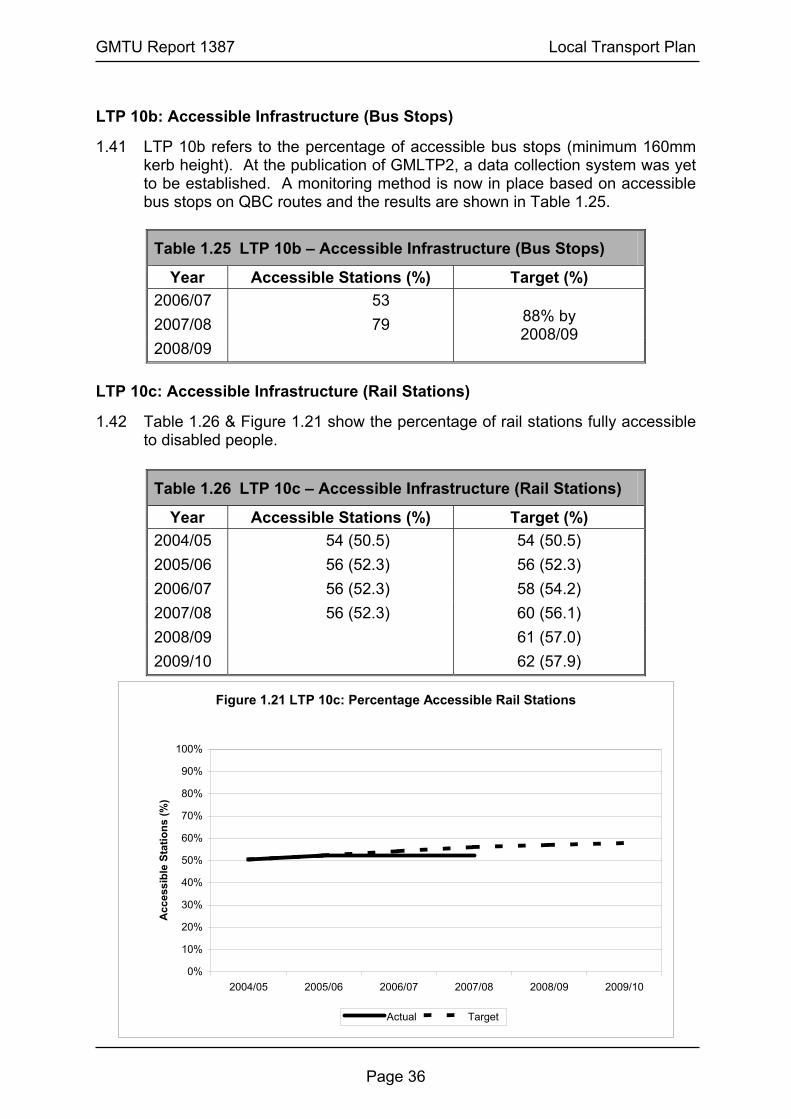
GMTU Report 1387 Local Transport Plan
Page 36
LTP 10b: Accessible Infrastructure (Bus Stops)
1.41 LTP 10b refers to the percentage of accessible bus stops (minimum 160mm kerb height). At the publication of GMLTP2, a data collection system was yet to be established. A monitoring method is now in place based on accessible bus stops on QBC routes and the results are shown in Table 1.25.
Table 1.25 LTP 10b – Accessible Infrastructure (Bus Stops)
Year Accessible Stations (%) Target (%) 2006/07 53 2007/08 79 2008/09
88% by 2008/09
LTP 10c: Accessible Infrastructure (Rail Stations)
1.42 Table 1.26 & Figure 1.21 show the percentage of rail stations fully accessible to disabled people.
Table 1.26 LTP 10c – Accessible Infrastructure (Rail Stations)
Year Accessible Stations (%) Target (%) 2004/05 54 (50.5) 54 (50.5) 2005/06 56 (52.3) 56 (52.3) 2006/07 56 (52.3) 58 (54.2) 2007/08 56 (52.3) 60 (56.1) 2008/09 61 (57.0) 2009/10 62 (57.9)
Figure 1.21 LTP 10c: Percentage Accessible Rail Stations
0%
10%
20%
30%
40%
50%
60%
70%
80%
90%
100%
2004/05 2005/06 2006/07 2007/08 2008/09 2009/10
Acc
essi
ble
Stat
ions
(%)
Actual Target
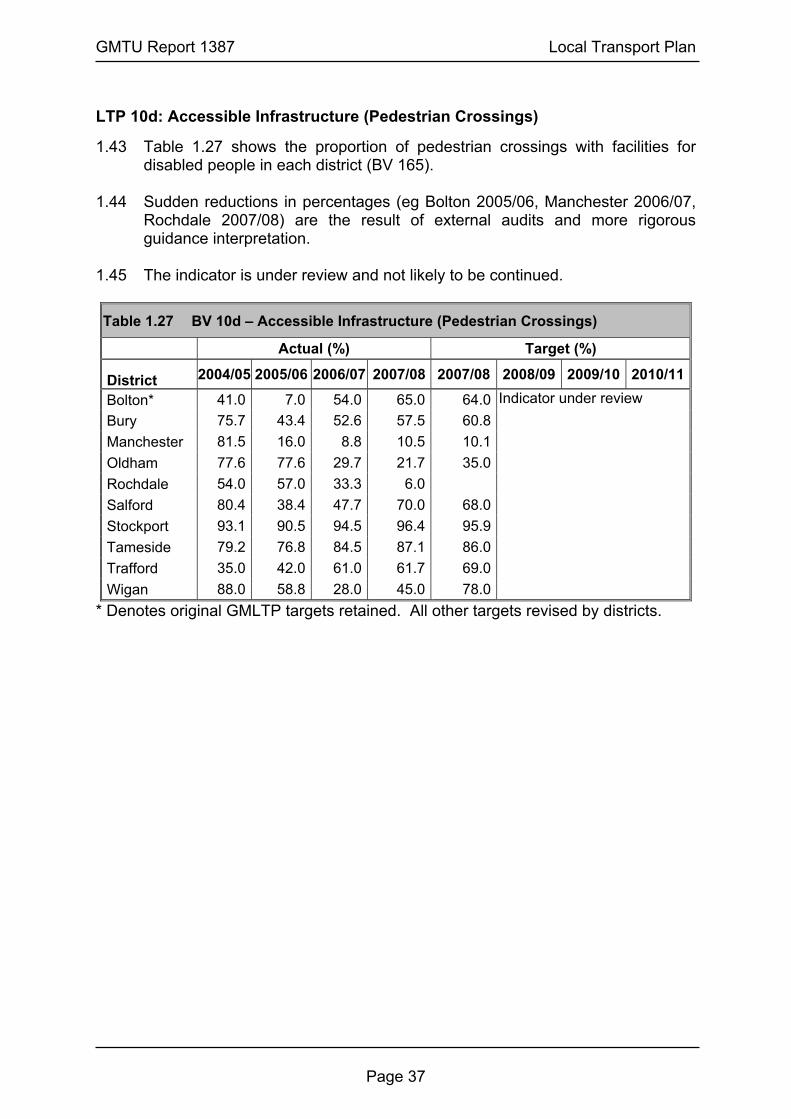
GMTU Report 1387 Local Transport Plan
Page 37
LTP 10d: Accessible Infrastructure (Pedestrian Crossings)
1.43 Table 1.27 shows the proportion of pedestrian crossings with facilities for disabled people in each district (BV 165).
1.44 Sudden reductions in percentages (eg Bolton 2005/06, Manchester 2006/07,
Rochdale 2007/08) are the result of external audits and more rigorous guidance interpretation.
1.45 The indicator is under review and not likely to be continued.
Table 1.27 BV 10d – Accessible Infrastructure (Pedestrian Crossings)
Actual (%) Target (%)
District 2004/05 2005/06 2006/07 2007/08 2007/08 2008/09 2009/10 2010/11
Bolton* 41.0 7.0 54.0 65.0 64.0Bury 75.7 43.4 52.6 57.5 60.8Manchester 81.5 16.0 8.8 10.5 10.1Oldham 77.6 77.6 29.7 21.7 35.0Rochdale 54.0 57.0 33.3 6.0Salford 80.4 38.4 47.7 70.0 68.0Stockport 93.1 90.5 94.5 96.4 95.9Tameside 79.2 76.8 84.5 87.1 86.0Trafford 35.0 42.0 61.0 61.7 69.0Wigan 88.0 58.8 28.0 45.0 78.0
Indicator under review
* Denotes original GMLTP targets retained. All other targets revised by districts.
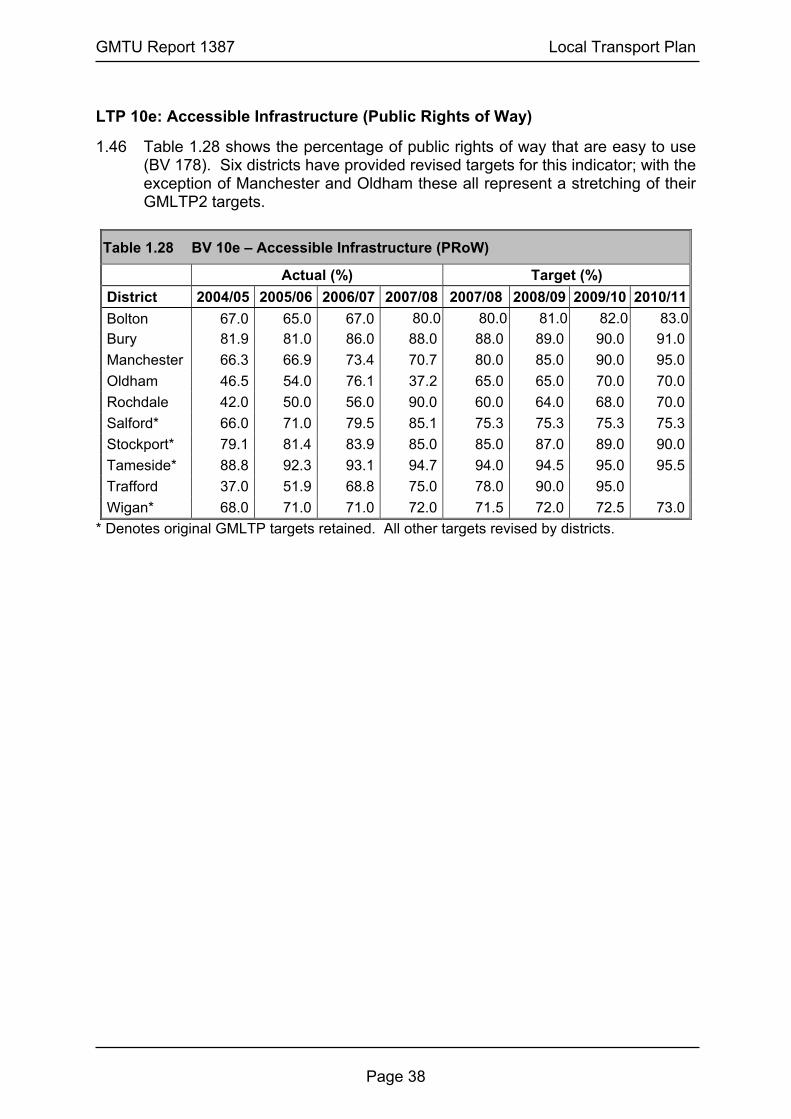
GMTU Report 1387 Local Transport Plan
Page 38
LTP 10e: Accessible Infrastructure (Public Rights of Way)
1.46 Table 1.28 shows the percentage of public rights of way that are easy to use (BV 178). Six districts have provided revised targets for this indicator; with the exception of Manchester and Oldham these all represent a stretching of their GMLTP2 targets.
Table 1.28 BV 10e – Accessible Infrastructure (PRoW)
Actual (%) Target (%) District 2004/05 2005/06 2006/07 2007/08 2007/08 2008/09 2009/10 2010/11Bolton 67.0 65.0 67.0 80.0 80.0 81.0 82.0 83.0Bury 81.9 81.0 86.0 88.0 88.0 89.0 90.0 91.0Manchester 66.3 66.9 73.4 70.7 80.0 85.0 90.0 95.0Oldham 46.5 54.0 76.1 37.2 65.0 65.0 70.0 70.0Rochdale 42.0 50.0 56.0 90.0 60.0 64.0 68.0 70.0Salford* 66.0 71.0 79.5 85.1 75.3 75.3 75.3 75.3Stockport* 79.1 81.4 83.9 85.0 85.0 87.0 89.0 90.0Tameside* 88.8 92.3 93.1 94.7 94.0 94.5 95.0 95.5Trafford 37.0 51.9 68.8 75.0 78.0 90.0 95.0 Wigan* 68.0 71.0 71.0 72.0 71.5 72.0 72.5 73.0
* Denotes original GMLTP targets retained. All other targets revised by districts.
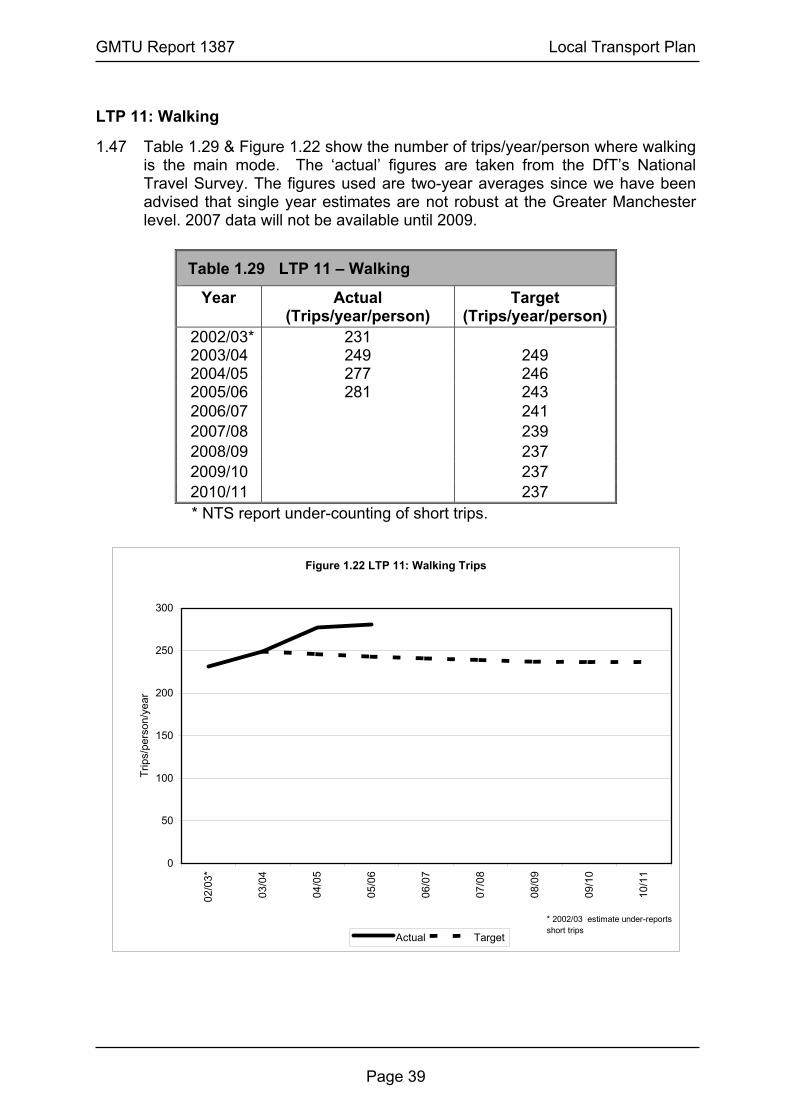
GMTU Report 1387 Local Transport Plan
Page 39
LTP 11: Walking
1.47 Table 1.29 & Figure 1.22 show the number of trips/year/person where walking is the main mode. The ‘actual’ figures are taken from the DfT’s National Travel Survey. The figures used are two-year averages since we have been advised that single year estimates are not robust at the Greater Manchester level. 2007 data will not be available until 2009.
Table 1.29 LTP 11 – Walking
Year Actual (Trips/year/person)
Target (Trips/year/person)
2002/03* 231 2003/04 249 249 2004/05 277 246 2005/06 281 243 2006/07 241 2007/08 239 2008/09 237 2009/10 237 2010/11 237 * NTS report under-counting of short trips.
Figure 1.22 LTP 11: Walking Trips
0
50
100
150
200
250
300
02/0
3*
03/0
4
04/0
5
05/0
6
06/0
7
07/0
8
08/0
9
09/1
0
10/1
1
Trip
s/pe
rson
/yea
r
Actual Target
* 2002/03 estimate under-reports short trips
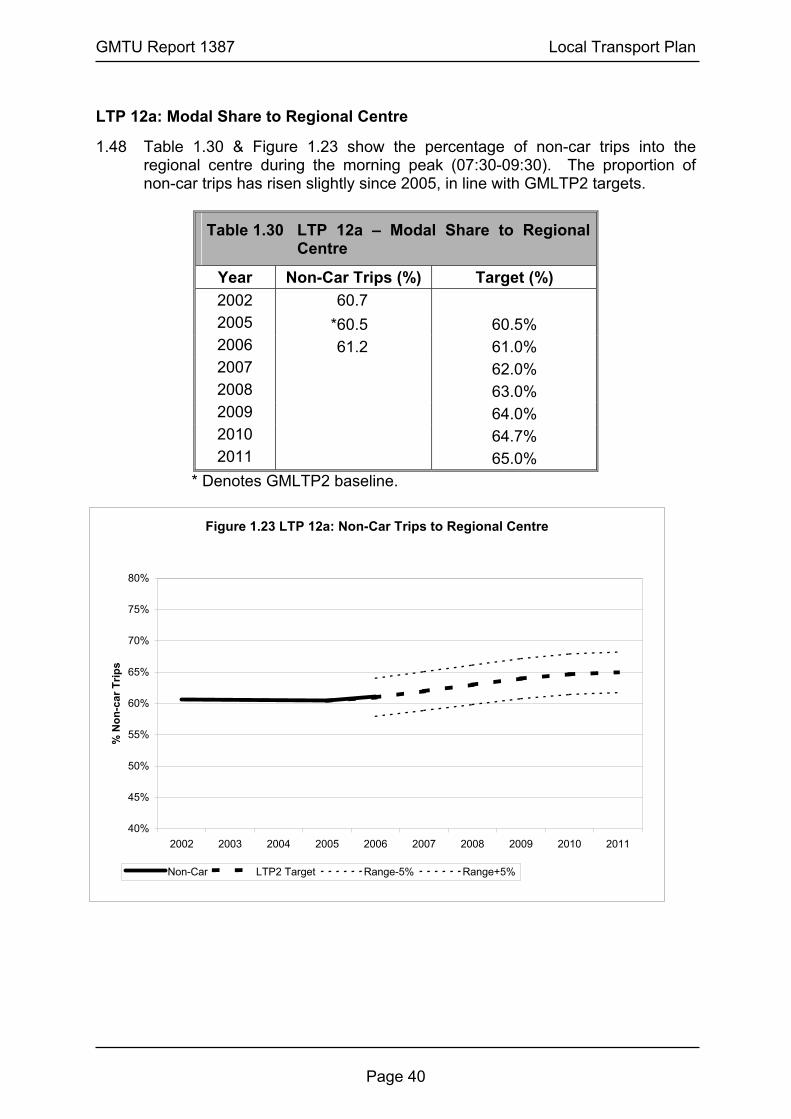
GMTU Report 1387 Local Transport Plan
Page 40
LTP 12a: Modal Share to Regional Centre
1.48 Table 1.30 & Figure 1.23 show the percentage of non-car trips into the regional centre during the morning peak (07:30-09:30). The proportion of non-car trips has risen slightly since 2005, in line with GMLTP2 targets.
Table 1.30 LTP 12a – Modal Share to Regional Centre
Year Non-Car Trips (%) Target (%) 2002 60.7 2005 *60.5 60.5% 2006 61.2 61.0% 2007 62.0% 2008 63.0% 2009 64.0% 2010 64.7% 2011 65.0%
* Denotes GMLTP2 baseline.
Figure 1.23 LTP 12a: Non-Car Trips to Regional Centre
40%
45%
50%
55%
60%
65%
70%
75%
80%
2002 2003 2004 2005 2006 2007 2008 2009 2010 2011
% N
on-c
ar T
rips
Non-Car LTP2 Target Range-5% Range+5%
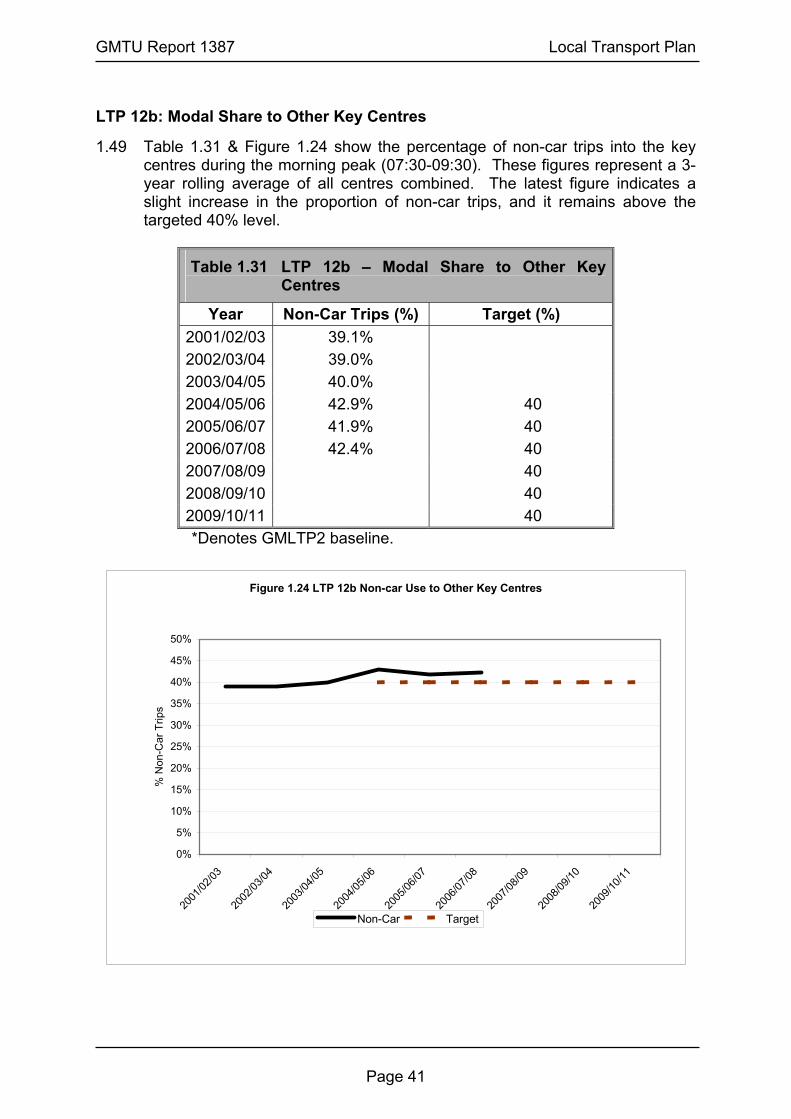
GMTU Report 1387 Local Transport Plan
Page 41
LTP 12b: Modal Share to Other Key Centres
1.49 Table 1.31 & Figure 1.24 show the percentage of non-car trips into the key centres during the morning peak (07:30-09:30). These figures represent a 3-year rolling average of all centres combined. The latest figure indicates a slight increase in the proportion of non-car trips, and it remains above the targeted 40% level.
Table 1.31 LTP 12b – Modal Share to Other Key Centres
Year Non-Car Trips (%) Target (%) 2001/02/03 39.1% 2002/03/04 39.0% 2003/04/05 40.0% 2004/05/06 42.9% 40 2005/06/07 41.9% 40 2006/07/08 42.4% 40 2007/08/09 40 2008/09/10 40 2009/10/11 40 *Denotes GMLTP2 baseline.
Figure 1.24 LTP 12b Non-car Use to Other Key Centres
0%
5%
10%
15%
20%
25%
30%
35%
40%
45%
50%
2001
/02/03
2002
/03/04
2003
/04/05
2004
/05/06
2005
/06/07
2006
/07/08
2007
/08/09
2008
/09/10
2009
/10/11
% N
on-C
ar T
rips
Non-Car Target

GMTU Report 1387 Local Transport Plan
Page 42
LTP 12c: Modal Share to Manchester Airport
1.50 Table 1.32 & Figure 1.25 show the ratio of vehicle trips by road to Manchester Airport to the overall number of passengers using Manchester airport. The target is for a 4% fall in the number of vehicle trips per passenger between 2005 and 2011.
Table 1.32 LTP 12c – Modal Share to Manchester Airport
Year Actual (Vehicle Trips per Passenger)
Target (Vehicle Trips per Passenger)
2003 1.43 1.48 2004 1.37 1.46 2005 1.33 *1.44 2006 1.33 1.43 2007 1.34 1.42 2008 1.40 2009 1.40 2010 1.39 2011 1.38
*Denotes GMLTP2 baseline.
Figure 1.25 LTP 12c: Proportion of Vehicle Trips by Road Relative to the Number of Air Passengers
0.0
0.2
0.4
0.6
0.8
1.0
1.2
1.4
1.6
1.8
1995
1996
1997
1998
1999
2000
2001
2002
2003
2004
2005
2006
2007
2008
2009
2010
2011
2012
2013
2014
2015
Vehi
cle
trips
/pas
seng
er
Actual Target

2 ROAD TRAFFIC


GMTU Report 1387 Road Traffic
Page 45
MOTORWAY TRAFFIC
Traffic Growth on Motorways 2006-2007
2.1 Table 2.1 shows the percentage changes by time period, in average flows on 12 motorway links between 2006 and 2007. The links included in the analysis are:
• M6 junctions 25 to 26 and 26 to 27 • M56 junction 6 to 7 • M60 junctions 16 to 17, 17 to 18,19 to 20, 20 to 21 and 22 to 23, 24 to 25 • M62 junction 18 to 19, 20 to 21.
2.2 The small number of sites means that the data is less reliable the more it is disaggregated by time period and/or vehicle class. The increase in all motors of 1% over the 12-hour period is confirmed by analysis of ATC data at equivalent sites in 2006 and 2007.
Table 2.1 Percentage Changes in Average Flows on 11 Motorway Links Between 2006 and 2007
Time Period Cars LGV OGV Buses and Coaches
Motor Cycles All Motors
07:00-10:00 -4 -3 1 -39 -9 -3 10:00-16:00 3 6 -1 -27 -16 3 16:00-19:00 2 3 -2 -19 -8 2 07:00-19:00 1 3 -1 -28 -12 1 08:00-09:00 -6 -1 2 -32 -11 -4 17:00-18:00 3 7 -4 -23 -6 3

GMTU Report 1387 Road Traffic
Page 46
Changes in Motorway Weekday Traffic Flow Profiles 2006-2007
2.3 Table 2.2 shows average weekday traffic flows by hour on 11 motorway links in 2006 and 2007 together with the percentage changes in flows. The all motors and all goods profiles are illustrated in Figures 2.1 and 2.2.
Table 2.2 Average Hourly Traffic Flows on 11 Motorway Links in 2006 and 2007
2006 2007
Start Hour Cars
Light Goods
Vehicles
Other Goods
Vehicles All
Motors Cars Light Goods
Vehicles
Other Goods
Vehicles All
Motors 07:00 7202 1643 965 9861 6935 (-4) 1539 (-6) 997 (3) 9512 (-4)08:00 7155 1319 955 9478 6748 (-6) 1304 (-1) 977 (2) 9069 (-4)09:00 5464 1207 1136 7861 5433 (-1) 1215 (1) 1110 (-2) 7794 (-1)10:00 4523 1112 1106 6791 4554 (1) 1176 (6) 1180 (7) 6952 (2)11:00 4282 1172 1140 6642 4512 (5) 1202 (3) 1134 (-1) 6889 (4)12:00 4618 1091 1122 6876 4595 (0) 1220 (12) 1125 (0) 6973 (1)13:00 4767 1163 1173 7156 4907 (3) 1250 (7) 1165 (-1) 7363 (3)14:00 4842 1250 1179 7330 5069 (5) 1343 (7) 1077 (-9) 7529 (3)15:00 5516 1411 1057 8043 5880 (7) 1465 (4) 1040 (-2) 8433 (5)16:00 7406 1516 836 9813 7437 (0) 1492 (-2) 838 (0) 9816 (0)17:00 8082 996 612 9752 8318 (3) 1063 (7) 587 (-4) 10022 (3)18:00 6769 589 509 7920 7029 (4) 634 (8) 490 (-4) 8199 (4)Total 70628 14468 11791 97524 71417 (1) 14904 (3) 11720 (-1) 98549 (1)Note: The figures in brackets are the percentage changes between 2006 and 2007.
Figures may not sum due to rounding. The average link flows are pertinent to the eleven measured links only and not to the motorway network as a whole

GMTU Report 1387 Road Traffic
Page 47
Figure 2.1 Average Hourly Traffic Flows on Motorways in 2006 & 2007 - All Motors
0
12
34
56
78
910
11
0700 0800 0900 1000 1100 1200 1300 1400 1500 1600 1700 1800
Time of Day (Hour Beginning)
No
of V
ehic
les
(Tho
usan
ds)
2006 2007
No. on top of column is % change since 2006
-42
-12 4 1 3 3
5
0 3
4
-4
Figure 2.2 Average Hourly Traffic Flows on Motorways in 2006 and 2007 - All Goods
0123456789
1011
07:00 08:00 09:00 10:00 11:00 12:00 13:00 14:00 15:00 16:00 17:00 18:00
Time of Day (Hour Beginning)
No
of V
ehic
les
(Tho
usan
ds)
2006 2007
No. on top of column is % change since 2006
-3 0 6 1 6 3 0 1 -13
2
-1

GMTU Report 1387 Road Traffic
Page 48
Peak Hour to Peak Period Ratios on Motorways
2.4 Table 2.3 shows peak hour and peak period traffic flow ratios for motorway links surveyed between 1990 and 2007.
Table 2.3 Ratio of Peak Hour to Peak Period Traffic for Motorways 1990-2007
Year Number of Sites 08:00 – 09:00 07:00 – 10:00
17:00 – 18:00 16:00 – 19:00
1990 21 0.38 0.38 1991 15 0.38 0.37 1992 19 0.37 0.37 1993 22 0.37 0.37 1994 37 0.36 0.37 1995 39 0.36 0.37 1996 40 0.36 0.37 1997 29 0.36 0.37 1998 25 0.36 0.36 1999 42 0.36 0.36 2000 48 0.35 0.36 2001 51 0.36 0.37 2002 43 0.36 0.37 2003 37 0.35 0.36 2004 36 0.35 0.35 2005 21 0.36 0.36 2006 22 0.35 0.36 2007 27 0.35 0.36
Note: For ease of comparison with other road classes, the morning peak hour quoted is 08:00-09:00. The true peak flow on most motorways occurs 07:00-08:00 (see Figure 2.4).
Traffic Flows on Motorways in 2007
2.5 Figure 2.3 shows the average 24-hour weekday flow of motor vehicles on each link of Greater Manchester’s motorway network. The flows are either automatic traffic counts or estimates based on 12-hour manual classified counts undertaken as part of GMTU’s countywide monitoring programme. The manual counts have been factored using the 12 to 24-hour factors given in Appendix 1.
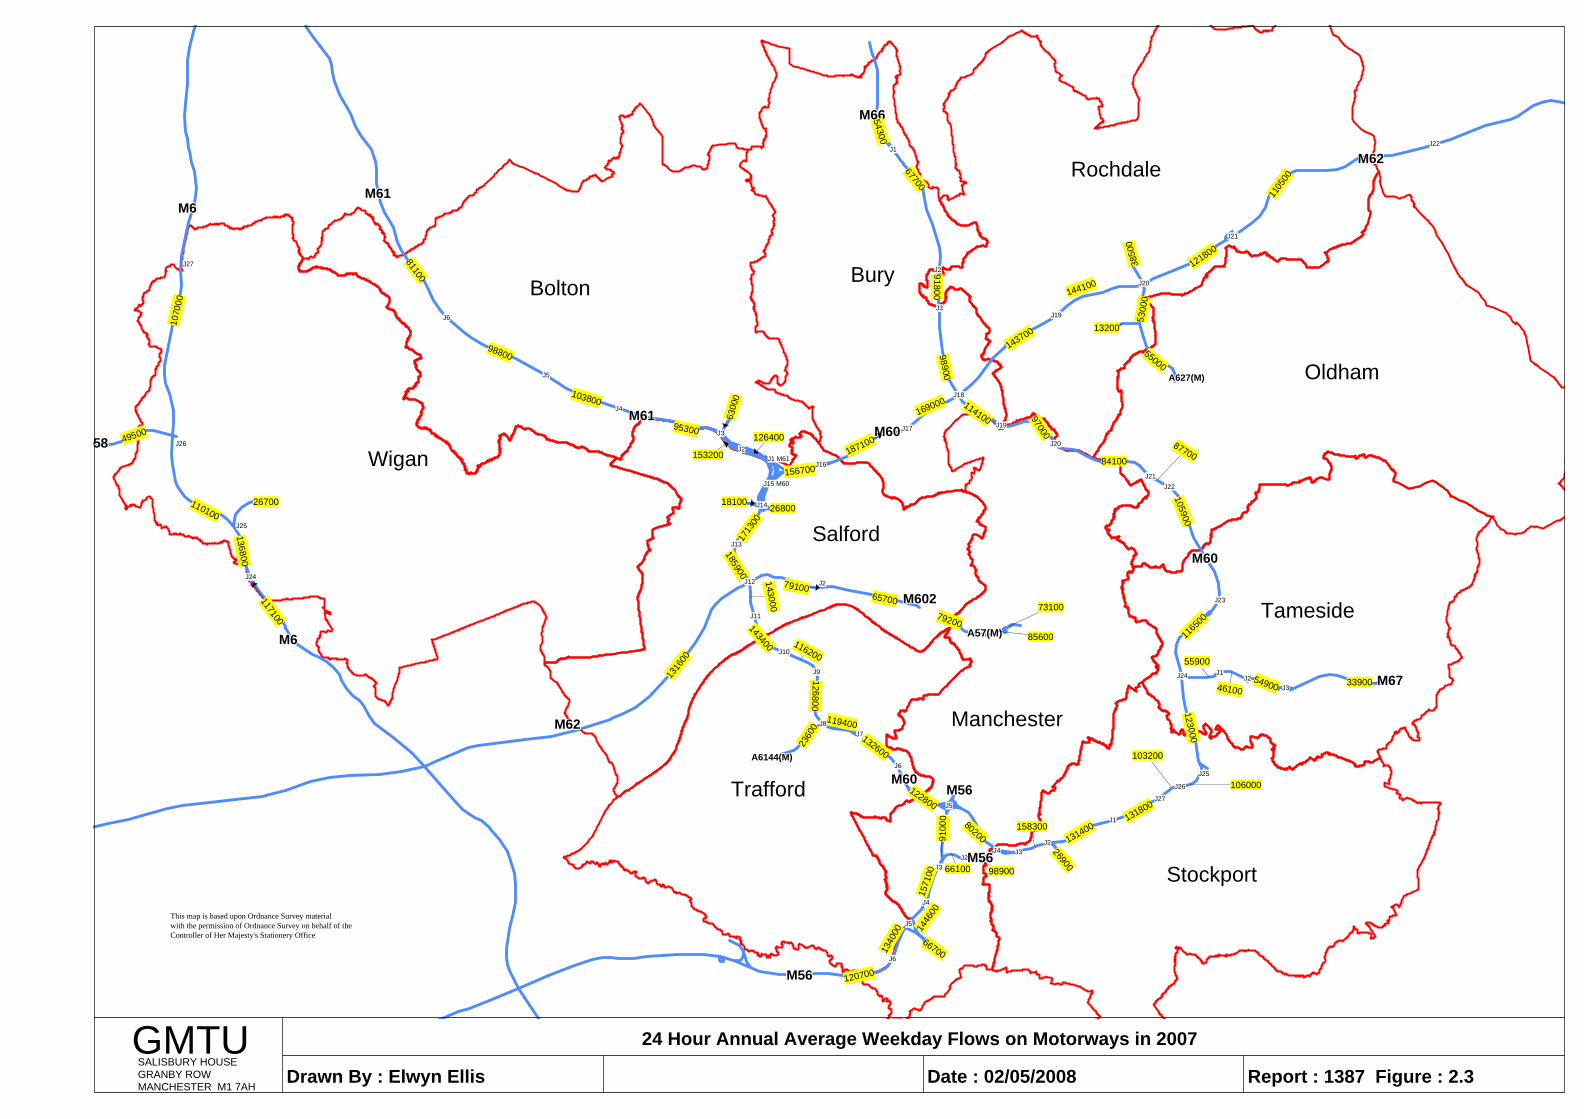
M60M60M60M60M60M60M60M60M60M60M60M60M60M60M60M60M60M60M60M60M60M60M60M60M60
M67M67M67M67M67M67M67M67M67M67M67M67M67M67M67M67M67M67M67M67M67M67M67M67M67
M62M62M62M62M62M62M62M62M62M62M62M62M62M62M62M62M62M62M62M62M62M62M62M62M62
A627(M)A627(M)A627(M)A627(M)A627(M)A627(M)A627(M)A627(M)A627(M)A627(M)A627(M)A627(M)A627(M)A627(M)A627(M)A627(M)A627(M)A627(M)A627(M)A627(M)A627(M)A627(M)A627(M)A627(M)A627(M)
M60M60M60M60M60M60M60M60M60M60M60M60M60M60M60M60M60M60M60M60M60M60M60M60M60
M602M602M602M602M602M602M602M602M602M602M602M602M602M602M602M602M602M602M602M602M602M602M602M602M602
A57(M)A57(M)A57(M)A57(M)A57(M)A57(M)A57(M)A57(M)A57(M)A57(M)A57(M)A57(M)A57(M)A57(M)A57(M)A57(M)A57(M)A57(M)A57(M)A57(M)A57(M)A57(M)A57(M)A57(M)A57(M)
M56M56M56M56M56M56M56M56M56M56M56M56M56M56M56M56M56M56M56M56M56M56M56M56M56
M56M56M56M56M56M56M56M56M56M56M56M56M56M56M56M56M56M56M56M56M56M56M56M56M56
M60M60M60M60M60M60M60M60M60M60M60M60M60M60M60M60M60M60M60M60M60M60M60M60M60
M66M66M66M66M66M66M66M66M66M66M66M66M66M66M66M66M66M66M66M66M66M66M66M66M66
M62M62M62M62M62M62M62M62M62M62M62M62M62M62M62M62M62M62M62M62M62M62M62M62M62
M56M56M56M56M56M56M56M56M56M56M56M56M56M56M56M56M56M56M56M56M56M56M56M56M56
A6144(M)A6144(M)A6144(M)A6144(M)A6144(M)A6144(M)A6144(M)A6144(M)A6144(M)A6144(M)A6144(M)A6144(M)A6144(M)A6144(M)A6144(M)A6144(M)A6144(M)A6144(M)A6144(M)A6144(M)A6144(M)A6144(M)A6144(M)A6144(M)A6144(M)
M61M61M61M61M61M61M61M61M61M61M61M61M61M61M61M61M61M61M61M61M61M61M61M61M61
M6M6M6M6M6M6M6M6M6M6M6M6M6M6M6M6M6M6M6M6M6M6M6M6M6
M61M61M61M61M61M61M61M61M61M61M61M61M61M61M61M61M61M61M61M61M61M61M61M61M61M6M6M6M6M6M6M6M6M6M6M6M6M6M6M6M6M6M6M6M6M6M6M6M6M6
58585858585858585858585858585858585858585858585858
Salford
Rochdale
J3
J3
J27
J26
J3
J11 7920085600
73100
5300
0
144100
13200
3850
0
143700
121800
1070
00
81100
66100 98900
802009100
0
1571
00
158300
122800
1446
00
1340
00
66700
120700
126800
119400
2360
0
116200
132600
26900
131400131800
103200
106000
123000
4610054900
55900
1165
00
33900
55000
1105
00
54300
67700
126400
156700
6300
0
153200
95300
1713
00
18100
185900
79100
143000
65700
98900
169000 114100
1316
00
98800
103800
187100
97000
143400
105900
87700
91800
136800
117100
110100
49500
Bolton Bury
Manchester
Oldham
Stockport
Tameside
Trafford
WiganJ15 M60
J1 M61
J24J2
J13
J14
J16
J18
J10
J9
J2
J3
J4
J5
J6
J27
J26
J25
J8J7
J6
J5
J4J2
J4
J5
J6
J25
J24
J23
J22J21
J20
J19
J3
J2
J1
J19
J20
J21
J2
J2
J1
J1
J17
J12
J22
2670026800
84100
Drawn By : Elwyn Ellis Date : 02/05/2008 Report : 1387 Figure : 2.3
24 Hour Annual Average Weekday Flows on Motorways in 2007GMTUSALISBURY HOUSEGRANBY ROWMANCHESTER M1 7AH
This map is based upon Ordnance Survey materialwith the permission of Ordnance Survey on behalf of theController of Her Majesty's Stationery Office


GMTU Report 1387 Road Traffic
Page 49
24-Hour Traffic Flow Profiles on Motorways in 2007
2.6 Data from 30 two-way continuous automatic traffic counts on motorways have been analysed to provide the daily profiles in Table 2.4. Flows affected by bank and school holidays, roadworks and unusual events were excluded from the analysis. Figure 2.4 shows the profiles expressed as a percentage of the 24-hour average weekday flow.
Table 2.4 Average Hourly Traffic Flow Indices on Motorways in 2007
Hour Beginning % of 24 Hour Flow
Weekday % of 24 Hour Flow
Saturday % of 24 Hour Flow
Sunday 00:00 0.6 1.3 1.6 01:00 0.4 0.8 1.0 02:00 0.3 0.6 0.7 03:00 0.4 0.7 0.7 04:00 0.7 0.9 0.8 05:00 1.6 1.3 1.0 06:00 4.7 2.3 1.6 07:00 8.0 3.4 2.1 08:00 7.6 4.5 2.6 09:00 6.2 5.6 4.1 10:00 5.4 6.8 5.9 11:00 5.4 7.7 7.5 12:00 5.6 8.0 8.2 13:00 5.8 7.9 8.3 14:00 6.1 7.2 8.0 15:00 6.8 6.9 7.7 16:00 7.8 6.9 7.9 17:00 7.8 6.9 7.3 18:00 6.3 5.9 6.6 19:00 4.2 4.6 5.3 20:00 2.9 3.4 4.2 21:00 2.2 2.4 3.1 22:00 1.8 2.2 2.3 23:00 1.2 1.9 1.6

GMTU Report 1387 Road Traffic
Page 50
Figure 2.4 Average Hourly Traffic Flow Indices on Motorways in 2007
0
1
2
3
4
5
6
7
8
9
10
0 1 2 3 4 5 6 7 8 9 10 11 12 13 14 15 16 17 18 19 20 21 22 23
Time (Hour Beginning)
% o
f 24
Hou
r Ave
rage
Wee
kday
Flo
w
Weekday Saturday Sunday
Hourly profile based on 30 two-way sites.
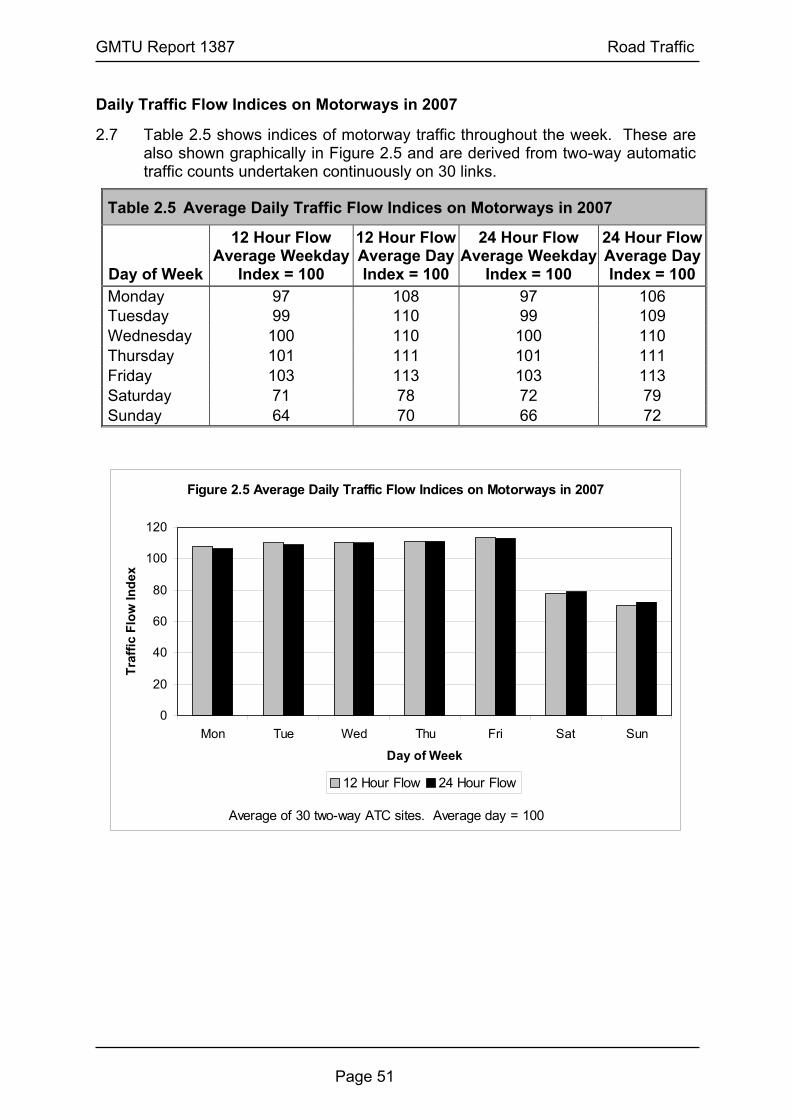
GMTU Report 1387 Road Traffic
Page 51
Daily Traffic Flow Indices on Motorways in 2007
2.7 Table 2.5 shows indices of motorway traffic throughout the week. These are also shown graphically in Figure 2.5 and are derived from two-way automatic traffic counts undertaken continuously on 30 links.
Table 2.5 Average Daily Traffic Flow Indices on Motorways in 2007
Day of Week
12 Hour Flow Average Weekday
Index = 100
12 Hour Flow Average Day Index = 100
24 Hour Flow Average Weekday
Index = 100
24 Hour Flow Average Day Index = 100
Monday 97 108 97 106 Tuesday 99 110 99 109 Wednesday 100 110 100 110 Thursday 101 111 101 111 Friday 103 113 103 113 Saturday 71 78 72 79 Sunday 64 70 66 72
Figure 2.5 Average Daily Traffic Flow Indices on Motorways in 2007
0
20
40
60
80
100
120
Mon Tue Wed Thu Fri Sat Sun
Day of Week
Traf
fic F
low
Inde
x
12 Hour Flow 24 Hour Flow
Average of 30 two-way ATC sites. Average day = 100

GMTU Report 1387 Road Traffic
Page 52
Daily Variation on Motorways by Time Period
2.8 Table 2.6 gives a more detailed breakdown of the variation in traffic flows in individual time periods for each day of the week.
Table 2.6 Average Traffic Flow Indices on Motorways in 2007 by Time Period
Time of Day Time Period Mon Tue Wed Thu Fri Sat Sun 07:00-10:00 100 101 101 101 97 45 27 10:00-16:00 96 97 98 100 109 91 85 16:00-19:00 98 101 101 101 98 65 66
Within the normal
working day 07:00-19:00 97 99 100 100 103 71 64 07:00-08:00 100 100 101 101 98 31 18 08:00-09:00 100 101 102 101 97 43 24 16:00-17:00 98 101 100 101 100 64 67 Peak periods
17:00-18:00 100 102 101 101 96 65 64 Outside the
normal working day
00:00-07:00 and
19:00-24:00 95 98 101 103 104 76 74
All Day 00:00-24:00 97 99 100 101 103 72 66 Note: Indices for each time period are based on an average weekday flow index of 100
for the time period.

GMTU Report 1387 Road Traffic
Page 53
Monthly Traffic Flow Indices on Motorways in 2007
2.9 Monthly indices of 12 and 24-hour flows based on average monthly weekday flows at 30 two-way motorway sites are given in Table 2.7 and illustrated in Figure 2.6.
Table 2.7 Average Monthly Traffic Flow Indices on Motorways in 2007
Month 12 Hour Flow Average
Month Index = 100 24 Hour Flow Average
Month Index = 100 January 96 94 February 98 97 March 100 99 April 101 101 May 100 100 June 101 102 July 100 101 August 101 101 September 102 103 October 102 102 November 101 102 December 102 102
Note: Based on ATC data from 30 two-way motorway sites in 2007.
Figure 2.6 Average Monthly Traffic Flow Indices on Motorways in 2007
0
20
40
60
80
100
120
Jan Feb Mar Apr May Jun Jul Aug Sep Oct Nov Dec
Month
Traf
fic F
low
Inde
x
12 Hour Flow Index 24 Hour Flow Index

GMTU Report 1387 Road Traffic
Page 54
A ROAD TRAFFIC
Traffic Growth on A Roads 2006-2007
2.10 Table 2.8 shows the percentage changes, by time period, in average flows on 93 A road links throughout the county between 2006 and 2007. The figures are based on manual classified counts.
Table 2.8 Percentage Changes in Average Flows on 93 A Road Links Between 2006 and 2007
Time Period Cars LGV OGV
Buses and
CoachesMotor Cycles
Pedal Cycles
All Motors
07:00-10:00 2 1 -2 -4 3 7 1 10:00-16:00 1 3 -5 -8 -5 0 0 16:00-19:00 -1 2 -14 -4 0 13 -1 07:00-19:00 0 3 -5 -6 -1 7 0 08:00-09:00 1 -2 -3 -3 0 10 0 17:00-18:00 -1 1 -15 -4 0 17 -1
Changes in A Road Weekday Traffic Flow Profiles 2006-2007
2.11 Table 2.9 shows average weekday traffic flows by hour on 93 A road links in 2006 and 2007 together with the percentage change in flow since 2006. The all motors and all goods profiles are illustrated in Figures 2.7 and 2.8.
Table 2.9 Average Hourly Traffic Flows on 93 A Road Links in 2006 and 2007 2006 2007
Start Hour Cars
Light Goods
Vehicles
Other Goods
Vehicles All
Motors Cars
Light Goods
Vehicles
Other Goods
Vehicles All
Motors 07:00 1207 206 53 1505 1242 (3) 212 (3) 52 (-2) 1545 (3)08:00 1441 196 63 1741 1451 (1) 193 (-2) 61 (-3) 1746 (0)09:00 1121 199 74 1433 1133 (1) 205 (3) 74 (0) 1449 (1)10:00 931 199 75 1238 933 (0) 199 (0) 75 (0) 1238 (0)11:00 958 196 76 1261 976 (2) 207 (6) 72 (-5) 1284 (2)12:00 1058 185 66 1341 1062 (0) 191 (3) 67 (2) 1350 (1)13:00 1114 189 70 1406 1116 (0) 199 (5) 65 (-7) 1411 (0)14:00 1120 198 71 1427 1125 (0) 205 (4) 68 (-4) 1433 (0)15:00 1266 205 62 1577 1271 (0) 209 (2) 56 (-10) 1573 (0)16:00 1477 202 44 1768 1469 (-1) 210 (4) 40 (-9) 1761 (0)17:00 1604 147 26 1817 1587 (-1) 148 (1) 22 (-15) 1797 (-1)18:00 1342 98 16 1489 1340 (0) 99 (1) 13 (-19) 1483 (0)Total 14638 2219 698 18001 14706 (0) 2277 (3) 663 (-5) 18070 (0)
Note: The figures in brackets are the percentage changes between 2006 and 2007.

GMTU Report 1387 Road Traffic
Page 55
Figure 2.7 Average Hourly Traffic Flows on A Roads in 2006 and 2007 - All Motors
0
500
1000
1500
2000
2500
07:00 08:00 09:00 10:00 11:00 12:00 13:00 14:00 15:00 16:00 17:00 18:00
Time of Day (Hour Beginning)
No.
of V
ehic
les
2006 2007
No. on top of column is % change since 2006
30
10 2 1 0 0
00 -1
0
Figure 2.8 Average Hourly Traffic Flows on A Roads in 2006 and 2007 - All Goods
0
500
1000
1500
2000
2500
07:00 08:00 09:00 10:00 11:00 12:00 13:00 14:00 15:00 16:00 17:00 18:00
Time of Day (Hour Beginning)
No.
of V
ehic
les
2006 2007
No. on top of column is % change since 2006
2 -2 2 0 3 3 2 1 -1 2 -2 -2

GMTU Report 1387 Road Traffic
Page 56
Peak Hour to Peak Period Ratios on A Roads
2.12 Table 2.10 shows peak hour to peak period traffic flow ratios for A Road links surveyed between 1990 and 2007.
Table 2.10 Ratio of Peak Hour to Peak Period Traffic for A Road Links 1990- 2007
Year Number of Sites 08:00 – 09:00 07:00 – 10:00
17:00 – 18:00 16:00 – 19:00
1990 185 0.39 0.37 1991 173 0.39 0.37 1992 180 0.40 0.37 1993 205 0.39 0.35 1994 196 0.39 0.37 1995 289 0.39 0.37 1996 185 0.39 0.37 1997 192 0.39 0.36 1998 225 0.38 0.36 1999 246 0.39 0.36 2000 239 0.38 0.37 2001 287 0.38 0.36 2002 255 0.38 0.36 2003 229 0.38 0.36 2004 204 0.37 0.36 2005 213 0.38 0.36 2006 135 0.37 0.36 2007 198 0.37 0.36

GMTU Report 1387 Road Traffic
Page 57
24-Hour Traffic Flow Profiles on A Roads in 2007
2.13 Table 2.11 gives profiles of hourly traffic flow based on automatic traffic counter data. Flows affected by bank and school holidays, roadworks and unusual events have been excluded from this analysis. Figure 2.9 shows the profiles expressed as a percentage of the 24-hour average weekday flow.
Table 2.11 Average Hourly Traffic Flow Indices on A Roads in 2006
Hour Beginning % of 24-Hour Flow
Weekday % of 24-Hour Flow
Saturday % of 24-Hour Flow
Sunday 00:00 0.6 1.6 2.1 01:00 0.3 1.1 1.5 02:00 0.3 0.9 1.3 03:00 0.2 0.7 1.0 04:00 0.4 0.6 0.7 05:00 1.0 0.8 0.7 06:00 3.0 1.5 1.1 07:00 6.9 2.5 1.6 08:00 7.7 4.0 2.1 09:00 6.2 5.4 3.8 10:00 5.4 6.6 6.1 11:00 5.7 7.6 7.7 12:00 6.1 8.1 9.0 13:00 6.2 8.0 9.3 14:00 6.3 7.7 9.0 15:00 6.9 7.4 8.4 16:00 7.8 7.1 7.5 17:00 8.0 6.6 6.3 18:00 6.6 5.7 5.7 19:00 4.9 4.8 4.6 20:00 3.5 3.8 3.7 21:00 2.7 2.8 2.9 22:00 2.1 2.5 2.2 23:00 1.3 2.2 1.6
Notes: Traffic flows are based on data from 51 two-way ATC sites on A roads throughout the county in 2007. Percentages may not sum to 100 due to rounding.

GMTU Report 1387 Road Traffic
Page 58
Figure 2.9 Average Hourly Traffic Flow Indices on A Roads in 2007
0
1
2
3
4
5
6
7
8
9
0 1 2 3 4 5 6 7 8 9 10 11 12 13 14 15 16 17 18 19 20 21 22 23Time (Hour Beginning)
% o
f 24
Hou
r Ave
rage
Wee
kday
Flo
w
Weekday Saturday SundayHourly profile based on 51 two-way sites.
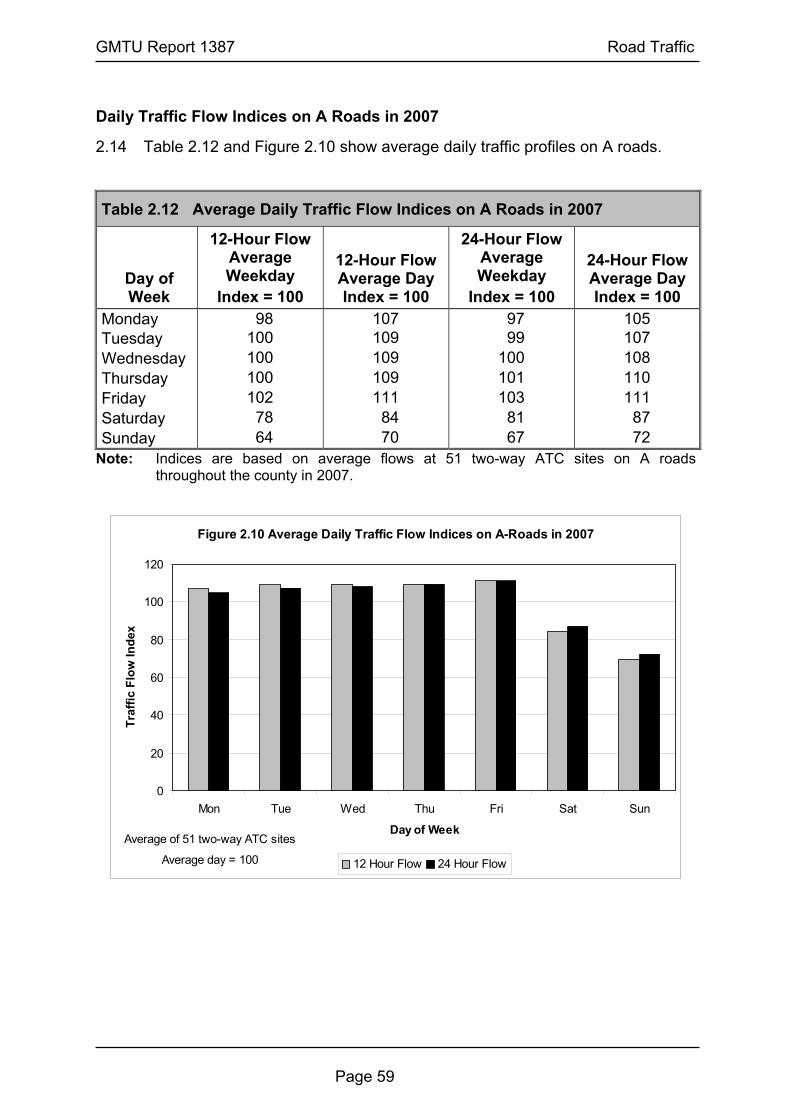
GMTU Report 1387 Road Traffic
Page 59
Daily Traffic Flow Indices on A Roads in 2007
2.14 Table 2.12 and Figure 2.10 show average daily traffic profiles on A roads.
Table 2.12 Average Daily Traffic Flow Indices on A Roads in 2007
Day of Week
12-Hour Flow Average Weekday
Index = 100
12-Hour Flow Average Day Index = 100
24-Hour Flow Average Weekday
Index = 100
24-Hour Flow Average Day Index = 100
Monday 98 107 97 105 Tuesday 100 109 99 107 Wednesday 100 109 100 108 Thursday 100 109 101 110 Friday 102 111 103 111 Saturday 78 84 81 87 Sunday 64 70 67 72
Note: Indices are based on average flows at 51 two-way ATC sites on A roads throughout the county in 2007.
Figure 2.10 Average Daily Traffic Flow Indices on A-Roads in 2007
0
20
40
60
80
100
120
Mon Tue Wed Thu Fri Sat Sun
Day of Week
Traf
fic F
low
Inde
x
12 Hour Flow 24 Hour Flow
Average of 51 two-way ATC sites
Average day = 100

GMTU Report 1387 Road Traffic
Page 60
Daily Variation on A Roads by Time Period
2.15 Table 2.13 gives a more detailed breakdown of the variation in weekday flow in individual time periods.
Table 2.13 Average Traffic Flow Indices on A Roads in 2007 by Time Period
Time of Day Time Period Mon Tue Wed Thu Fri Sat Sun 07:00-10:00 99 101 101 100 98 47 25 10:00-16:00 97 98 99 99 107 100 90 16:00-19:00 98 101 101 102 97 72 59
Within the normal
working day 07:00-19:00 98 100 100 100 102 78 64 07:00-08:00 99 101 101 100 98 30 16 08:00-09:00 100 101 101 100 98 43 19 16:00-17:00 98 100 100 101 101 75 66
Peak periods
17:00-18:00 100 102 101 101 96 69 54 Outside the
normal working day
00:00-07:00 and
19:00-24:00 92 97 99 105 106 92 77
All Day 00:00-24:00 97 99 100 101 103 81 67 Note: Indices for each time period are relative to an average weekday flow index of 100
for the time period.
Indices are based on average flows at 51 two-way ATC sites on A roads throughout the county in 2007.
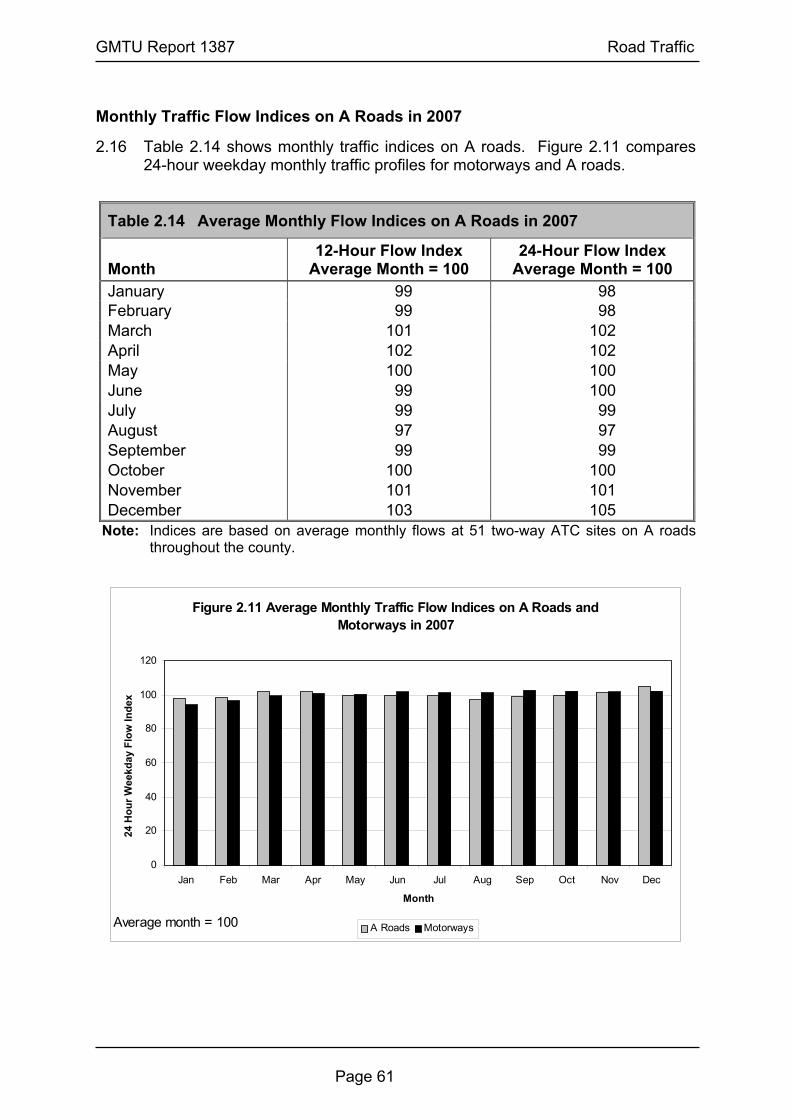
GMTU Report 1387 Road Traffic
Page 61
Monthly Traffic Flow Indices on A Roads in 2007
2.16 Table 2.14 shows monthly traffic indices on A roads. Figure 2.11 compares 24-hour weekday monthly traffic profiles for motorways and A roads.
Table 2.14 Average Monthly Flow Indices on A Roads in 2007
Month 12-Hour Flow Index
Average Month = 100 24-Hour Flow Index
Average Month = 100 January 99 98 February 99 98 March 101 102 April 102 102 May 100 100 June 99 100 July 99 99 August 97 97 September 99 99 October 100 100 November 101 101 December 103 105
Note: Indices are based on average monthly flows at 51 two-way ATC sites on A roads throughout the county.
Figure 2.11 Average Monthly Traffic Flow Indices on A Roads and Motorways in 2007
0
20
40
60
80
100
120
Jan Feb Mar Apr May Jun Jul Aug Sep Oct Nov Dec
Month
24 H
our W
eekd
ay F
low
Inde
x
A Roads MotorwaysAverage month = 100

GMTU Report 1387 Road Traffic
Page 62
B ROAD TRAFFIC
Traffic Growth on B Roads 2006-2007
2.17 Table 2.15 shows the percentage changes by time period, in average traffic flows on 69 B road links between 2006 and 2007. The figures are based on manual classified counts undertaken throughout the county.
Table 2.15 Percentage Changes in Average Flows on 69 B Road Links Between 2006 and 2007
Time Period Cars LGV OGV
Buses and
CoachesMotor Cycles
Pedal Cycles
All Motors
07:00-10:00 -1 -1 -10 -11 0 10 -2 10:00-16:00 0 2 -10 -12 4 4 -1 16:00-19:00 1 1 -9 -9 5 4 0 07:00-19:00 0 1 -10 -11 5 5 -1 08:00-09:00 -2 -1 -8 -15 0 0 -2 17:00-18:00 1 7 0 -7 14 0 1
Changes in B Road Weekday Traffic Profiles 2006-2007
2.18 Table 2.16 shows average hourly traffic flows on 69 B road links in 2006 and 2007 together with the percentage change in flow since 2006. The all motors and all goods profiles are illustrated in Figures 2.12 and 2.13.
Table 2.16 Average Hourly Traffic Flows on 69 B Road Links in 2006 and 2007 2006 2007
Start Hour Cars
Light Goods
Vehicles
Other Goods
VehiclesAll
Motors Cars
Light Goods
Vehicles
Other Goods
Vehicles All
Motors 07:00 691 113 22 849 683 (-1) 112 (-1) 20 (-9) 837 (-1)08:00 933 120 26 1105 916 (-2) 119 (-1) 24 (-8) 1081 (-2)09:00 669 120 31 842 659 (-1) 117 (-3) 28 (-10) 824 (-2)10:00 558 114 31 722 552 (-1) 110 (-4) 29 (-6) 708 (-2)11:00 592 114 33 757 580 (-2) 113 (-1) 28 (-15) 737 (-3)12:00 651 103 28 800 631 (-3) 106 (3) 25 (-11) 780 (-3)13:00 658 109 28 814 665 (1) 114 (5) 26 (-7) 822 (1)14:00 673 111 28 835 681 (1) 118 (6) 26 (-7) 845 (1)15:00 792 116 24 958 800 (1) 118 (2) 22 (-8) 963 (1)16:00 901 121 18 1066 905 (0) 119 (-2) 17 (-6) 1066 (0)17:00 999 90 9 1119 1008 (1) 96 (7) 9 (0) 1133 (1)18:00 801 58 5 882 801 (0) 58 (0) 4 (-20) 879 (0)Total 8915 1290 285 10748 8880 (-0) 1299 (1) 256 (-10) 10675 (-1)
Note: The figures in brackets are the percentage changes between 2006 and 2007.

GMTU Report 1387 Road Traffic
Page 63
Figure 2.12 Average Hourly Traffic Flows on B Roads in 2006 and 2007 - All Motors
0
200
400
600
800
1000
1200
1400
07:00 08:00 09:00 10:00 11:00 12:00 13:00 14:00 15:00 16:00 17:00 18:00
Time of Day (Hour Beginning)
No.
of V
ehic
les
2006 2007
No. on top of column is % change since 2006
-1
-2
-2-2 -3 -3 1
1
10
01
Figure 2.13 Average Hourly Traffic Flows on B Roads in 2006 and 2007 - All Goods
0
200
400
600
800
1000
1200
1400
07:00 08:00 09:00 10:00 11:00 12:00 13:00 14:00 15:00 16:00 17:00 18:00
Time of Day (Hour Beginning)
No.
of V
ehic
les
2006 2007
No. on top of column is % change since 2006
-2 -3 -3 -3 -5 -4 -2 -2 -3 -1 0 0

GMTU Report 1387 Road Traffic
Page 64
Peak Hour to Peak Period Ratios on B Roads
2.19 Table 2.17 shows peak hour and peak period traffic flow ratios for all B road links surveyed between 1990 and 2007.
Table 2.17 Ratio of Peak Hour to Peak Period Traffic for B Road Links 1990-2007
Year Number of Sites 08:00 – 09:00 07:00 – 10:00
17:00 – 18:00 16:00 – 19:00
1990 85 0.41 0.37 1991 100 0.41 0.37 1992 76 0.42 0.37 1993 84 0.41 0.35 1994 102 0.42 0.37 1995 75 0.41 0.37 1996 83 0.41 0.37 1997 94 0.41 0.37 1998 71 0.42 0.37 1999 87 0.41 0.37 2000 53 0.40 0.37 2001 76 0.40 0.37 2002 104 0.40 0.37 2003 101 0.40 0.36 2004 97 0.40 0.37 2005 68 0.39 0.36 2006 85 0.40 0.37 2007 116 0.40 0.37

GMTU Report 1387 Road Traffic
Page 65
MINOR ROAD TRAFFIC
Traffic Growth on Minor Roads 2006-2007
2.20 Table 2.18 shows the average percentage changes by time period, in average traffic flows on 127 minor roads between 2006 and 2007. The percentage change in vehicle flows other than car and LGV should be treated with caution since they are based on very low flows, which are subject to greater percentage variability than higher flows.
Table 2.18 Percentage Changes in Average Flows on 127 Minor Road Links Between 2006 and 2007
Time Period Cars LGV OGV
Buses and
CoachesMotor Cycles
Pedal Cycles
All Motors
07:00-10:00 1 5 8 -5 0 0 1 10:00-16:00 2 2 -2 -5 0 -6 1 16:00-19:00 1 3 -9 -11 -11 -6 1 07:00-19:00 1 3 -2 -5 -4 -2 1 08:00-09:00 0 9 13 -11 0 0 1 17:00-18:00 1 3 0 0 0 0 1
Changes in Minor Road Weekday Traffic Profiles 2006-2007
2.21 Table 2.19 shows average hourly traffic flows on 127 minor road links in 2006 and 2007 together with the percentage change in flow since 2006.
Table 2.19 Average Hourly Traffic Flows on 127 Minor Road Links in 2006 and 2007
2006 2007
Start Hour Cars
Light Goods
Vehicles
Other Goods
Vehicles All
Motors Cars
Light Goods
Vehicles
Other Goods
Vehicles All
Motors 07:00 268 43 7 326 272 (1) 44 (2) 7 (0) 331 (2)08:00 418 47 8 483 420 (0) 51 (9) 9 (13) 490 (1)09:00 281 44 9 342 282 (0) 44 (0) 10 (11) 344 (1)10:00 219 40 10 276 221 (1) 41 (2) 11 (10) 280 (1)11:00 236 41 10 294 242 (3) 41 (0) 10 (0) 300 (2)12:00 254 38 8 308 259 (2) 40 (5) 8 (0) 314 (2)13:00 266 39 9 322 265 (0) 41 (5) 9 (0) 322 (0)14:00 266 39 9 323 270 (2) 41 (5) 8 (-11) 327 (1)15:00 350 45 8 414 360 (3) 44 (-2) 7 (-13) 421 (2)16:00 381 47 6 445 384 (1) 49 (4) 5 (-17) 447 (0)17:00 427 40 3 480 432 (1) 41 (2) 3 (0) 484 (1)18:00 332 26 2 367 338 (2) 26 (0) 2 (0) 372 (1)Total 3697 488 89 4379 3745 (1) 502 (3) 87 (-2) 4434 (1)
Note: The figures in brackets are the percentage changes between 2006 and 2007.

GMTU Report 1387 Road Traffic
Page 66
COMPARISONS OF TRAFFIC AND GROWTH
Comparison of National and Local Growth in Traffic Flows 1993-2007
2.22 Indices of local and national growth in traffic flows are given in Table 2.20 and illustrated in Figures 2.14 and 2.15.
Table 2.20 Traffic Flow Indices for Local and National Motorways and A Roads, 1993-2007
Motorways A Roads Year Local National Local National 1993 100 100 100 100 1994 100 103 102 102 1995 104 106 102 104 1996 109 111 102 105 1997 114 114 103 105 1998 114 118 103 105 1999 118 120 104 105 2000 118 120 103 105 2001 121 123 102 105 2002 126 125 102 105 2003 128 126 103 105 2004 133 129 103 106 2005 132 130 102 105 2006 132 132 102 106 2007 133 133 102 104
Notes:
1993-2007 National Data based on average 24-hour daily traffic flow data for urban A Roads published in Table 2.1 Road Traffic Statistics 2007, Traffic, Speeds and Congestion.
Local figures are based on 12-hour average weekday flows on a sample of links throughout Greater Manchester.

GMTU Report 1387 Road Traffic
Page 67
Figure 2.14 National and Local Growth in Traffic Flows on Motorways 1993 - 2007
100
105
110
115
120
125
130
135
140
145
150
1993 1994 1995 1996 1997 1998 1999 2000 2001 2002 2003 2004 2005 2006 2007
Year
Traf
fic F
low
Inde
x
Local Growth (12 Hour Weekday) National Growth (24 Hour Day)Index: 1993=100
Figure 2.15 National and Local Growth in Traffic Flows on A Roads 1993 - 2007
100
105
110
115
120
125
130
135
140
145
150
1993 1994 1995 1996 1997 1998 1999 2000 2001 2002 2003 2004 2005 2006 2007
Year
Traf
fic F
low
Inde
x
Local Growth (12 Hour Weekday) National Growth (24 Hour Day)
Index: 1993=100

GMTU Report 1387 Road Traffic
Page 68
Composition of Motorway, A Road, B Road and Minor Road Traffic 1999-2007
2.23 Table 2.21 shows the percentage composition of traffic on motorway, A road, B road and minor road links between 1999 and 2007. The percentage composition for 2007 is illustrated in Figure 2.16.
Table 2.21 Percentage Composition of Traffic on Motorway, A Road, B Road and Minor Road Links 07:00-19:00 Hours, 2000- 2007
Vehicle Type
Cars LGV OGV1 OGV2
Buses and
CoachesMotor Cycles
Pedal Cycles
Motorways 2000 74.8 13.0 5.1 (45) 6.3 (55) 0.4 0.3 - 2001 75.3 13.0 4.9 (45) 6.0 (55) 0.4 0.3 - 2002 75.3 13.3 4.7 (44) 6.0 (56) 0.4 0.3 - 2003 75.9 13.1 4.4 (43) 5.9 (57) 0.4 0.1 - 2004 74.4 13.8 4.6 (42) 6.5 (58) 0.4 0.1 - 2005 75.4 13.0 4.5 (41) 6.5 (59) 0.4 0.3 - 2006 73.7 14.8 4.4 (41) 6.4 (59) 0.4 0.3 - 2007 74.1 14.6 4.4 (41) 6.3 (59) 0.3 0.3 -
A Roads 2000 79.7 12.4 3.2 (67) 1.6 (33) 1.9 0.7 0.5 2001 80.4 11.8 3.0 (68) 1.4 (32) 2.2 0.7 0.5 2002 80.8 11.8 2.9 (68) 1.4 (32) 1.9 0.7 0.5 2003 81.2 11.7 2.8 (66) 1.4 (34) 1.7 0.7 0.4 2004 80.9 12.0 2.8 (65) 1.5 (35) 1.8 0.6 0.4 2005 80.7 12.2 2.8 (66) 1.4 (34) 1.8 0.6 0.4 2006 80.8 12.3 2.6 (66) 1.3 (34) 1.9 0.6 0.5 2007 80.7 12.8 2.5 (65) 1.4 (35) 1.6 0.6 0.5
B Roads 2000 81.9 11.6 2.4 (75) 0.8 (25) 2.2 0.6 0.7 2001 82.3 11.2 2.3 (77) 0.7 (23) 2.2 0.7 0.8 2002 83.1 10.8 2.0 (75) 0.7 (25) 2.0 0.7 0.8 2003 82.5 11.3 2.0 (74) 0.7 (26) 2.1 0.7 0.7 2004 82.2 11.4 2.1 (76) 0.7 (24) 2.3 0.6 0.7 2005 82.3 11.6 2.1 (72) 0.8 (28) 2.0 0.6 0.7 2006 82.2 11.8 2.0 (75) 0.7 (25) 2.1 0.5 0.8 2007 82.6 12.0 1.7 (75) 0.6 (25) 1.8 0.5 0.8
Minor Roads 2000 83.5 10.4 2.0 (77) 0.6 (23) 1.7 0.5 1.2 2001 82.8 10.8 2.1 (78) 0.6 (22) 1.8 0.6 1.2 2002 83.4 10.7 2.0 (75) 0.7 (25) 1.5 0.6 1.2 2003 84.3 10.3 1.8 (74) 0.6 (26) 1.4 0.6 1.0 2004 83.6 10.9 1.8 (74) 0.6 (26) 1.4 0.6 1.0 2005 84.1 10.7 1.7 (75) 0.6 (25) 1.4 0.6 1.0 2006 83.8 10.9 1.5 (76) 0.5 (24) 1.8 0.6 1.0 2007 84.0 11.1 1.4 (76) 0.5 (24) 1.7 0.5 0.8
Notes: LGV = Light Goods Vehicles with 2 axles OGV1 = Medium Goods Vehicles with 2 axles and Heavy Goods Vehicles with 3 axles OGV2 = Heavy Goods Vehicles with 4+ axles Figures in parentheses are the percentage splits between OGV1 and OGV2. OGV1 and OGV2 split is used in the DfT’s cost benefit analysis program (COBA) and the Transport Economics Note (TEN). Figures may not add to 100% due to rounding.

GMTU Report 1387 Road Traffic
Page 69
Figure 2.16 Percentage Composition of 12 Hr Traffic Flows by Road Class in 2007
74.180.7 82.6 84.0
14.6 12.8 12.0 11.14.4 2.5 1.7 1.4
6.31.4 0.6 0.50.6 2.6 3.1 3.0
0
10
20
30
40
50
60
70
80
90
100
Motorways A Roads B Roads Minor Roads
Perc
ent
Cars LGV OGV1 OGV2 Others

GMTU Report 1387 Road Traffic
Page 70
Average Hourly Flows on Motorways, A, B and Minor Roads in 2007
2.24 Table 2.22 shows average hourly flows in 2007 on 27 motorway, 198 A road, 116 B and 142 minor road links that were unaffected by roadworks. Table 2.23 shows the hourly traffic flows as a percentage of the 12-hour flow. All motors and all goods flows are illustrated in Figure 2.17 and 2.18.
Table 2.22 Average Hourly Traffic Flows on 27 Motorway, 198 A Road, 116 B Road and 142 Minor Road Links in 2007
Motorways A Roads B Roads Minor Roads Start Hour Cars Goods
All Motors Cars Goods
All Motors Cars Goods
All Motors Cars Goods
All Motors
07:00 6052 2099 8195 1221 273 1530 569 110 699 299 54 36308:00 5937 1860 7837 1449 270 1756 784 122 927 453 64 52809:00 4664 1908 6609 1108 287 1427 569 126 712 316 60 38410:00 4063 1925 6027 920 277 1225 480 120 615 250 57 31511:00 3956 1926 5918 969 282 1279 505 120 640 271 56 33512:00 4190 1911 6134 1050 259 1337 553 113 681 294 53 35413:00 4441 1962 6439 1104 268 1401 574 118 708 300 55 36314:00 4601 2008 6652 1118 278 1428 588 122 728 303 54 36715:00 5258 2034 7337 1259 274 1568 699 119 838 396 56 46316:00 6794 1855 8700 1479 261 1779 784 117 923 423 59 49217:00 7325 1317 8693 1592 177 1805 873 88 981 472 47 52918:00 6089 903 7035 1319 116 1463 702 54 770 375 30 412Total 63369 21707 85574 14588 3020 18000 7681 1327 9222 4153 645 4905
Table 2.23 Average Hourly Traffic Flows on 27 Motorway, 198 A Road, 116 B Road and 142 Minor Road Links in 2007 as a Percentage of 12-Hour Flow
Motorways A Roads B Roads Minor Roads Start Hour Cars Goods
All Motors Cars Goods
All Motors Cars Goods
All Motors Cars Goods
All Motors
07:00 9.6 9.7 9.6 8.4 9.0 8.5 7.4 8.3 7.6 7.2 8.4 7.4 08:00 9.4 8.6 9.2 9.9 8.9 9.8 10.2 9.2 10.1 10.9 9.9 10.8 09:00 7.4 8.8 7.7 7.6 9.5 7.9 7.4 9.5 7.7 7.6 9.3 7.8 10:00 6.4 8.9 7.0 6.3 9.2 6.8 6.2 9.0 6.7 6.0 8.8 6.4 11:00 6.2 8.9 6.9 6.6 9.3 7.1 6.6 9.0 6.9 6.5 8.7 6.8 12:00 6.6 8.8 7.2 7.2 8.6 7.4 7.2 8.5 7.4 7.1 8.2 7.2 13:00 7.0 9.0 7.5 7.6 8.9 7.8 7.5 8.9 7.7 7.2 8.5 7.4 14:00 7.3 9.3 7.8 7.7 9.2 7.9 7.7 9.2 7.9 7.3 8.4 7.5 15:00 8.3 9.4 8.6 8.6 9.1 8.7 9.1 9.0 9.1 9.5 8.7 9.4 16:00 10.7 8.5 10.2 10.1 8.6 9.9 10.2 8.8 10.0 10.2 9.1 10.0 17:00 11.6 6.1 10.2 10.9 5.9 10.0 11.4 6.6 10.6 11.4 7.3 10.8 18:00 9.6 4.2 8.2 9.0 3.8 8.1 9.1 4.1 8.3 9.0 4.7 8.4 Total 100.0 100.0 100.0 100.0 100.0 100.0 100.0 100.0 100.0 100.0 100.0 100.0

GMTU Report 1387 Road Traffic
Page 71
Figure 2.17 Average Hourly All Motor Traffic Flows on Motorways, A Roads, B Roads and Minor Roads in 2007
0
1000
2000
3000
4000
5000
6000
7000
8000
9000
10000
07:00 08:00 09:00 10:00 11:00 12:00 13:00 14:00 15:00 16:00 17:00 18:00
Time of Day (Hour Beginning)
No
of V
ehic
les
M A B Minor
Figure 2.18 Average Hourly All Goods Vehicle Traffic Flows on Motorways, A Roads and B Roads in 2007
0
250
500
750
1000
1250
1500
1750
2000
2250
07:00 08:00 09:00 10:00 11:00 12:00 13:00 14:00 15:00 16:00 17:00 18:00
Time of Day (Hour Beginning)
No.
of V
ehic
les
M A B Minor

GMTU Report 1387 Road Traffic
Page 72
Traffic Growth on A Roads and B Roads Combined 2006-2007
2.25 Table 2.24 shows the average traffic flows for cars, light goods, other goods and all motors in 2006 and 2007 for different time periods. The flows are based on a sample of 162 A and B road links throughout the county. The percentage changes between years are also shown.
Table 2.24 Percentage Changes in Average Flows on 162 A and B Road Links Between 2006 and 2007
2006 2007
Time Period Cars LGV OGV All
Motors Cars LGV OGV All
Motors 07:00-10:00 3139 495 143 3877 3158 (1) 499 (1) 138 (-3) 3889 (0)10:00-16:00 5371 956 315 6816 5387 (0) 983 (3) 296 (-6) 6827 (0)16:00-19:00 3690 372 63 4219 3680 (0) 379 (2) 55 (-13) 4205 (0)07:00-19:00 12201 1823 522 14912 12225 (0) 1860 (2) 490 (-6) 14921 (0)08:00-09:00 1224 164 47 1470 1223 (0) 162 (-1) 45 (-4) 1463 (0)17:00-18:00 1346 123 19 1520 1340 (0) 126 (2) 16 (-16) 1514 (0)
Note: Percentage changes between 2006 and 2007 are shown in parentheses.
Traffic Growth on A Roads and B Roads by District 2006-2007
2.26 Average traffic flows by district on A and B roads combined are shown in Table 2.25.
Table 2.25 12-Hour Average Traffic Flows in 2006 and 2007 on A Roads and B Roads by District
2006 2007 District and No. of Links Counted Cars LGV OGV
All Motors Cars LGV OGV
All Motors
Bolton 18 13967 2259 654 17239 14127 (1) 2327 (3) 605 (-7) 17380 (1)Bury 11 14171 1950 429 16921 14339 (1) 1991 (2) 393 (-8) 17087 (1)Manchester 24 14539 1804 498 17488 14224 (-2) 1896 (5) 485 (-3) 17225 (-2)Oldham 17 9683 1550 483 12038 9658 (-0) 1584 (2) 441 (-9) 11986 (-0)Rochdale 12 11172 1606 366 13500 11344 (2) 1676 (4) 360 (-2) 13687 (1)Salford 16 11135 1866 633 14122 11417 (3) 1885 (1) 539 (-15) 14077 (0)Stockport 16 14333 2015 572 17250 14290 (0) 2059 (2) 564 (-1) 17227 (0)Tameside 16 11950 2119 707 15067 12157 (2) 2225 (5) 711 (1) 15357 (2)Trafford 16 10536 1405 355 12534 10433 (-1) 1399 (0) 308 (-13) 12383 (-1)Wigan 16 9411 1615 452 11836 9623 (2) 1498 (-7) 418 (-8) 11891 (0)GM Ave 162 12201 1823 522 14912 12225 (0) 1860 (2) 490 (-6) 14921 (0)
Note: Percentage changes between 2006 and 2007 are shown in parentheses.

GMTU Report 1387 Road Traffic
Page 73
Annual Vehicle Kilometres on Motorways, A Roads and B Roads in 2007
2.27 Table 2.26 and Figure 2.19 show annual vehicle kilometres in Greater Manchester in 2007 by road class and vehicle type.
Table 2.26 Annual Vehicle Kilometres in 2007
Vehicle Kilometres (Millions)
Road Type Length Car LGV OGV All
Goods All
Motors
Annual Flow/Km (Millions)
Motorway (incl A627(M)) 171 4409 844 612 1456 5899 34.5A Roads 861 5022 580 179 759 5890 6.8B Roads 374 1302 134 27 161 1494 4.0Motorways and A Roads 1032 9431 1424 791 2215 11788 11.4Motorways, A and B Roads 1406 10733 1559 818 2377 13282 9.4
Notes:
These figures are based on manual classified link counts undertaken on each link of the network, factored to the current year (2006) where appropriate.
Road lengths are based on the link lengths of a model road network and may differ slightly from other sources, e.g. Greater Manchester Network Information System (GMNIS) and as quoted by DfT form R199b.
Minor roads are not included.
Figure 2.19 Annual Vehicle Kilometres by Vehicle and Road Type in 2007
4409
5022
1302844
580134
612179 27
0
1000
2000
3000
4000
5000
6000
Motorways A Roads B Roads
Road Class
Vehi
cle
Kilo
met
res
(mill
ions
)
Cars Lgv Ogv

GMTU Report 1387 Road Traffic
Page 74
Annual Vehicle Kilometres on A Roads and B Roads by District in 2007
2.28 Tables 2.27 and 2.28 show annual vehicle kilometres and average daily flows per link on the A and B road network by district.
Table 2.27 Vehicle Kilometres on A Roads by District in 2007
Vehicle Kilometres (Millions)
District Length Car LGV OGV All
GoodsAll
Motors
Average Annual Daily
Flow/Km
Bolton 101 622 75 20 95 728 19700 Bury 55 320 33 9 42 369 18400 Manchester 116 871 89 27 116 1012 23900 Oldham 98 393 49 15 64 466 13000 Rochdale 80 385 45 12 57 450 15400 Salford 87 591 72 25 97 699 22000 Stockport 84 562 56 18 74 646 21100 Tameside 65 312 39 13 53 372 15700 Trafford 58 369 40 13 53 429 20300 Wigan 117 595 80 28 109 717 16800 GM 861 5022 580 179 759 5890 18700
Note: The vehicle kilometres are based on 12-hour manual classified traffic counts that have been factored to give annual average daily flows on each link of the network. Figures for Oldham and Rochdale exclude A627(M).
Table 2.28 Vehicle Kilometres on B Roads by District in 2007
Vehicle Kilometres (Millions)
District Length Car LGV OGV All
GoodsAll
Motors
Average Daily Flow/Km
(7 day 24-hour)Bolton 46 150 16 3 19 173 10300 Bury 33 92 9 2 11 104 8600 Manchester 36 150 14 3 16 172 13100 Oldham 30 80 10 2 12 93 8500 Rochdale 23 84 9 2 11 97 11600 Salford 29 100 10 2 12 114 10800 Stockport 36 151 15 3 17 172 13100 Tameside 32 101 12 3 15 119 10200 Trafford 52 188 16 4 20 211 11100 Wigan 56 206 22 5 27 238 11600 GM 374 1302 134 27 161 1494 10900

Trends in Greater Manchester Vehicle Kilometres on Motorways, A and B Roads 1993-2007 2.29 Table 2.29 shows trends in vehicle kilometres between 1993 and 2007
Table 2.29 Trends in Vehicle Kilometres (millions) 1993-2007 by Vehicle Type and Road Class All Motorways
Year Car LGV OGV All Index Year Car LGV OGV All Index 1993 8784 1009 1016 10994 100 1993 2843 418 637 3925 1001994 8904 1028 1052 11162 102 1994 2900 433 673 4025 1031995 9160 1049 1038 11432 104 1995 3076 463 677 4245 1081996 9362 1075 1013 11632 106 1996 3164 488 654 4335 1101997 9482 1087 1038 11777 107 1997 3293 503 685 4510 1151998 9554 1111 1002 11840 108 1998 3394 528 668 4620 1181999 9720 1203 887 11997 109 1999 3449 577 611 4672 1192000 9723 1270 857 12043 110 2000 3473 611 595 4716 1202001 10104 1313 864 12482 114 2001 3909 678 621 5246 1342002 10332 1364 853 12747 116 2002 4096 720 628 5482 1402003 10409 1372 834 12807 116 2003 4133 721 612 5505 1402004 10489 1434 867 12978 118 2004 4231 763 633 5665 1442005 10662 1437 823 13113 119 2005 4361 759 604 5763 1472006 10615 1515 827 13144 120 2006 4322 820 613 5795 1482007 10733 1559 818 13282 121 2007 4409 844 612 5899 150
A Roads B Roads1993 4695 475 321 5618 100 1993 1246 116 58 1451 1001994 4730 477 321 5655 101 1994 1274 118 58 1482 1021995 4788 471 306 5687 101 1995 1296 115 55 1500 1031996 4882 474 305 5780 103 1996 1316 113 54 1517 1051997 4873 469 300 5751 102 1997 1316 115 53 1516 1041998 4853 468 283 5715 102 1998 1307 115 51 1505 1041999 4949 505 233 5804 103 1999 1322 121 43 1521 1052000 4941 536 220 5819 104 2000 1309 123 42 1508 1042001 4927 519 206 5779 103 2001 1268 116 37 1457 1002002 4958 526 191 5800 103 2002 1279 118 34 1465 1012003 4993 530 191 5834 104 2003 1282 121 32 1468 1012004 4972 546 201 5834 104 2004 1287 126 33 1479 1022005 5002 550 188 5858 104 2005 1299 128 31 1492 1032006 5003 565 184 5867 104 2006 1290 130 30 1482 1022007 5022 580 179 5890 105 2007 1302 134 27 1494 103
GM
TU R
eport 1387 R
oad Traffic
Page 75
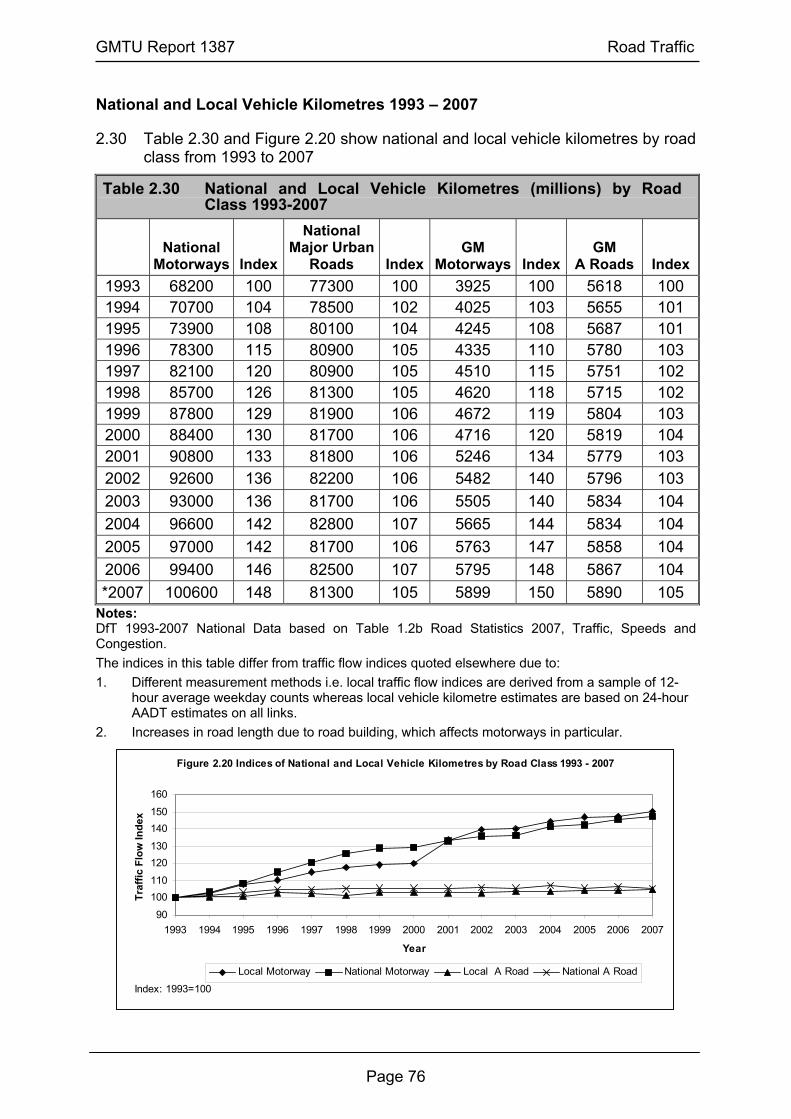
GMTU Report 1387 Road Traffic
Page 76
National and Local Vehicle Kilometres 1993 – 2007
2.30 Table 2.30 and Figure 2.20 show national and local vehicle kilometres by road class from 1993 to 2007
Table 2.30 National and Local Vehicle Kilometres (millions) by Road Class 1993-2007
National
Motorways Index
National Major Urban
Roads IndexGM
Motorways Index GM
A Roads Index 1993 68200 100 77300 100 3925 100 5618 100 1994 70700 104 78500 102 4025 103 5655 101 1995 73900 108 80100 104 4245 108 5687 101 1996 78300 115 80900 105 4335 110 5780 103 1997 82100 120 80900 105 4510 115 5751 102 1998 85700 126 81300 105 4620 118 5715 102 1999 87800 129 81900 106 4672 119 5804 103 2000 88400 130 81700 106 4716 120 5819 104 2001 90800 133 81800 106 5246 134 5779 103 2002 92600 136 82200 106 5482 140 5796 103 2003 93000 136 81700 106 5505 140 5834 104 2004 96600 142 82800 107 5665 144 5834 104 2005 97000 142 81700 106 5763 147 5858 104 2006 99400 146 82500 107 5795 148 5867 104 *2007 100600 148 81300 105 5899 150 5890 105
Notes: DfT 1993-2007 National Data based on Table 1.2b Road Statistics 2007, Traffic, Speeds and Congestion. The indices in this table differ from traffic flow indices quoted elsewhere due to: 1. Different measurement methods i.e. local traffic flow indices are derived from a sample of 12-
hour average weekday counts whereas local vehicle kilometre estimates are based on 24-hour AADT estimates on all links.
2. Increases in road length due to road building, which affects motorways in particular.
Figure 2.20 Indices of National and Local Vehicle Kilometres by Road Class 1993 - 2007
90
100110
120130
140150
160
1993 1994 1995 1996 1997 1998 1999 2000 2001 2002 2003 2004 2005 2006 2007
Year
Traf
fic F
low
Inde
x
Local Motorway National Motorway Local A Road National A Road
Index: 1993=100

GMTU Report 1387 Road Traffic
Page 77
Congestion Monitoring: Average Journey Time Rates 2003/04 – 2006/07
2.31 Table 2.31 shows average journey time rates and average speeds on motorways and on A and B roads with 30 mph speed limits in Greater Manchester for 2006/07. Rates are broken down by Motorway and A & B road and are given for six time periods. Data is from the Mott MacDonald CJAMS System based on vehicle tracker data used under licence from ITIS Holdings. Figures are the average for the 12-month period running from September 2006 to August 2007.
Table 2.31 Average Journey Time Rates Greater Manchester 2006/07
Motorways A & Roads (30 mph) Time Period mins/mile (mph) mins/mile (mph)
0700-1000 1.48 (41) 3.27 (18) 0800-0900 1.65 (36) 3.72 (16) 1000-1600 1.20 (50) 3.08 (19) 1700-1800 1.55 (39) 3.53 (17) 1600-1900 1.45 (41) 3.38 (18) 0700-1900 1.32 (45) 3.18 (19)
2.32 Figures 2.21 – 2.22 present a historical trend of this journey time data from
2003/04 – 2006/07 for motorways and A & B roads respectively. 2.33 Figure 2.23 shows a daily (07:00-19:00) profile of average journey time rates
by motorway and A & B roads for 2004/05, 2005/06 and 2006/07.
Figure 2.21 Change in Average Journey Time Rates (mins/mile)2003-2004 to 2006-2007 (Motorways)
1.41
1.57
1.15
1.40
1.301.26
1.50
1.68
1.21
1.48
1.381.33
1.50
1.68
1.21
1.55
1.441.35
1.48
1.65
1.20
1.55
1.45
1.32
0.0
0.2
0.4
0.6
0.8
1.0
1.2
1.4
1.6
1.8
2.0
0700-1000 0800-0900 1000-1600 1700-1800 1600-1900 0700-1900
Time Period
Jour
ney
Tim
e ra
te -
min
s/m
ile (s
peed
- m
ph)
2003-2004 2004-2005 2005-2006 2006-2007
(60mph)
(50mph)
(40mph)
(30mph)
Source: Journey time information derived from the Mott MacDonald CJAMS system based on historic vehicle tracker data used under licence from ITIS holdings

GMTU Report 1387 Road Traffic
Page 78
Figure 2.22 Change in Average Journey Time Rates (mins/mile)2003-2004 to 2006-2007 (A & B Roads)
3.10
3.49
2.91
3.283.12 3.02
3.25
3.69
3.03
3.443.26
3.143.31
3.78
3.09
3.543.40
3.213.27
3.72
3.08
3.533.38
3.18
0
0.5
1
1.5
2
2.5
3
3.5
4
4.5
0700-1000 0800-0900 1000-1600 1700-1800 1600-1900 0700-1900
Time Period
Jour
ney
Tim
e ra
te -
min
s/m
ile (s
peed
- m
ph)
2003-2004 2004-2005 2005-2006 2006-2007
(20mph)
(30mph)
(15mph)
Source: Journey time information derived from the Mott MacDonald CJAMS system based on historic vehicle tracker data used under licence from ITIS holdings
Figure 2.23 Average Journey Time Rates 2004/05 - 2006/07 Motorways and A & B Roads
0
0.5
1
1.5
2
2.5
3
3.5
4
4.5
07:0
007
:15
07:3
007
:45
08:0
008
:15
08:3
008
:45
09:0
009
:15
09:3
009
:45
10:0
010
:15
10:3
010
:45
11:0
011
:15
11:3
011
:45
12:0
012
:15
12:3
012
:45
13:0
013
:15
13:3
013
:45
14:0
014
:15
14:3
014
:45
15:0
015
:15
15:3
015
:45
16:0
016
:15
16:3
016
:45
17:0
017
:15
17:3
017
:45
18:0
018
:15
18:3
018
:45
Time Period
Jour
ney
time
rate
- m
ins/
mile
(spe
ed -
mph
)
M 2004-2005 M 2005-2006 M 2006-2007 A&B 2004-2005 A&B 2005-2006 A&B 2006-2007
(20mph)
(15mph)
(30mph)
(60mph)
(40mph)
Source: Journey time information derived from the Mott MacDonald CJAMS system based on historic vehicle tracker data used under licence from ITIS holdings
Motorways
A & B Roads

3 KEY CENTRE MONITORING

GMTU Report 1387 Key Centre Monitoring
Page 81
Introduction to Key Centre Monitoring
3.1 Traffic and rail counts were conducted on a cordon around each of the 10 key centres in Greater Manchester in 1997. Since then, three or four centres have been surveyed annually with each centre being surveyed on a three yearly cycle to monitor progress towards key objectives in the Greater Manchester Local Transport Plan (GMLTP) and this continues for GMLTP2. It has been decided that from April 2008 every key centre will be surveyed annually.
3.2 Stockport MBC has allocated funds from a performance monitoring programme that, together with SEMMMS and LTP funding, has allowed annual monitoring of Stockport key centre each Autumn since 2004. Similarly, Manchester was surveyed in March 2006 as part of Manchester City Council’s second local performance service agreement (LPSA2) and this will be repeated in 2008.
3.3 Bury was last surveyed in 2005, Wigan and Manchester were last surveyed in Spring 2006, Bolton, Ashton-under-Lyne, Oldham and Eccles were last surveyed in Spring 2007, Stockport was last surveyed in Autumn 2007 and Altrincham and Rochdale were surveyed in Spring 2008.
3.4 Tables providing a summary of road traffic and modal share trends are presented here. It should be noted that CPS (Continuous Passenger Sampling) data has been used to estimate bus trips. This data is not designed to give an accurate picture of bus passenger at a local level but has been the only data available. From April 2008 bus occupancy surveys will be undertaken annually at each key centre. Further details of the surveys conducted for each centre are shown in the Transport Statistics reports for the relevant districts.
3.5 The exact locations of the cordons and the extent of the areas they encompass have an influence on both the total volume of traffic and the relative proportions of each mode of travel. Therefore comparisons between centres should be treated with caution.
3.6 For each key centre, more detailed information and a map showing the location of the cordon are given in the latest individual GMTU Transport Statistics report for the relevant district.

GMTU Report 1387 Key Centre Monitoring
Page 82
Bolton Key Centre
3.7 Table 3.1 gives the total traffic crossing the Bolton key centre cordon in 1997, 1998, 2001, 2004 & 2007 together with an index of change. Table 3.2 shows modal share of car and pt trips crossing the cordon for the same years. Table 3.3 shows modal share of car and non-car (pt, walk and cycle) trips since 2001.
3.8 Car trips were estimated using the vehicle count in table 3.1 multiplied by an average car occupancy estimated from a survey of the busiest sites in Bolton key centre. Bus patronage is derived using CPS data collected from February in the year preceding the survey year to January in the survey year factored to an average weekday. Rail patronage is a count of people leaving Bolton rail station. Walk and pedal cycle trips are counts of people entering the key centre both on and off-road.
Table 3.1 Bolton Key Centre Vehicle Counts 1997, 1998, 2001, 2004 and 2007
Cars LGV OGV Buses M/C P/C All 1997 7626 726 288 514 43 74 92741998 7741 689 232 508 39 73 92842001 7907 802 160 485 37 63 94542004 7343 675 130 407 39 58 86522007 7444 697 143 416 38 77 8815
07:30-09:30
2007/1997 0.98 0.96 0.50 0.81 0.88 1.04 0.95
1997 6499 613 264 549 27 19 79811998 6232 648 273 492 17 15 76882001 6320 774 195 445 19 21 77742004 5903 622 138 412 31 32 7138
2007 5461 647 167 452 24 22 6773
10:00-12:00
2007/1997 0.84 1.06 0.63 0.82 0.89 1.16 0.85
1997 6527 503 141 549 34 49 78031998 5998 563 136 484 28 38 72482001 6524 641 79 443 31 43 77612004 4953 501 63 411 28 60 60162007 5803 532 53 424 40 67 6919
16:00-18:00
2007/1997 0.89 1.06 0.38 0.77 1.18 1.37 0.89

GMTU Report 1387 Key Centre Monitoring
Page 83
Table 3.2 Car and Public Transport Trips into Bolton Key Centre
Car Trips Bus Trips Rail Trips Car + PT Trips Time Period Year Number Index Number Index Number Index Number Index % car % PT
1997 10032 100 5029 100 452 100 15513 100 65 35 1998 10168 101 4650 92 538 119 15356 99 66 34 2001 10365 103 4442 88 429 95 15236 98 68 32 2004 9326 93 3435 68 429 95 13190 85 71 29
07:30-09:30
2007 9603 96 4083 81 822 182 14508 94 66 34 1997 9492 100 5022 100 406 100 14920 100 64 36 1998 9114 96 4068 81 488 120 13670 92 67 33 2001 9210 97 3937 78 394 97 13541 91 68 32 2004 8914 94 3173 63 396 98 12483 84 71 29
10:00-12:00
2007 7755 82 4906 98 610 150 13271 89 58 42 1997 8911 100 2003 100 798 100 11712 100 76 24 1998 8182 92 2280 114 887 111 11349 97 72 28 2001 8901 100 2036 102 1086 136 12023 103 74 26 2004 6874 77 1536 77 882 111 9292 79 74 26
16:00-18:00
2007 8182 92 2128 106 1063 133 11373 97 72 28
Table 3.3 Car and Non-Car Trips into Bolton Key Centre
Year Car Bus Rail Cycle Walk Total % Car % Non-Car2001 10365 4442 429 63 2220 17519 59 41 2004 9326 3435 429 58 2486 15734 59 41 2007 9603 4083 822 77 2090 16675 58 42
07:30-09:30
2007/2001 0.93 0.92 1.92 1.22 0.94 0.95 2001 9210 3937 394 23 2191 15755 58 42 2004 8914 3173 396 32 2911 15426 58 42 2007 7755 4906 610 22 2330 15623 50 50
10:00-12:00
2007/2001 0.84 1.25 1.55 0.96 1.06 0.99 2001 8901 2036 1086 45 1281 13349 67 33 2004 6874 1536 882 60 1913 11265 61 39 2007 8182 2128 1063 67 1646 13086 63 37
16:00-18:00
2007/2001 0.92 1.05 0.98 1.49 1.28 0.98

GMTU Report 1387 Key Centre Monitoring
Page 84
Bury Key Centre
3.9 Table 3.4 gives the total traffic crossing the Bury key centre cordon in 1997, 1999, 2002 and 2005 together with an index of change. Table 3.5 shows modal share of car and public transport trips crossing the cordon for the same years. Table 3.6 shows modal share of car and non-car (pt, walk and cycle) trips since 2002
3.10 Car trips were estimated using the vehicle count in table 3.4 multiplied by an average car occupancy estimated from a survey of the busiest sites in Bury key centre. Bus patronage is derived using CPS data collected from February in the year preceding the survey year to January in the survey year factored to an average weekday. Metrolink patronage is a count of people leaving Bury Interchange. Walk and pedal cycle trips are counts of people entering the key centre both on and off-road.
Table 3.4 Bury Key Centre Inbound Vehicles 1997, 1999, 2002 and 2005 Cars LGV OGV Buses M/C P/C All
1997 3960 328 146 248 10 32 47281999 3714 333 86 240 16 41 44302002 3733 293 69 237 23 18 43732005 3493 331 105 204 20 43 4196
07:30-09:30
2005/1997 0.88 1.01 0.72 0.82 2.00 1.34 0.891997 3551 332 149 265 13 15 43371999 3504 357 105 240 9 11 42262002 3914 374 107 255 15 7 46722005 3551 394 86 222 9 21 4283
10:00-12:00
2005/1997 1.00 1.19 0.58 0.84 0.69 1.40 0.991997 3424 190 70 247 22 25 39851999 3076 232 34 238 15 31 36262002 3264 220 43 222 17 14 37802005 2976 239 15 184 9 19 3442
16:00-18:00
2005/1997 0.87 1.26 0.21 0.74 0.41 0.76 0.86
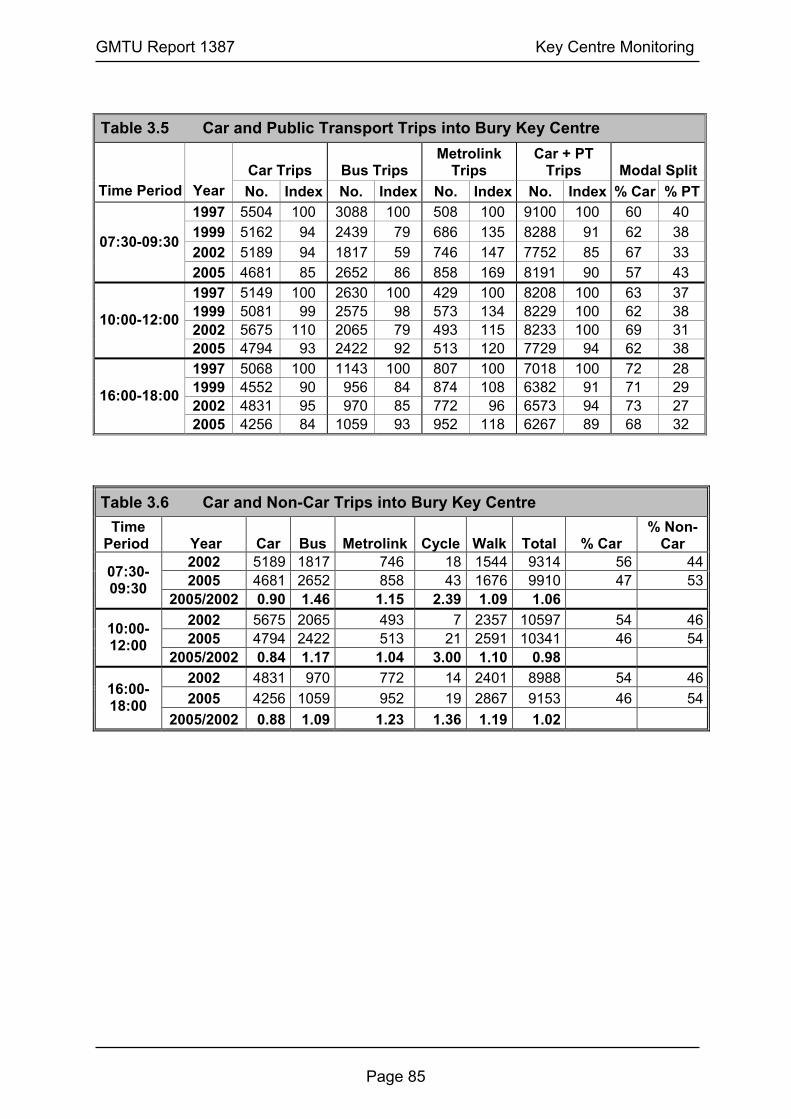
GMTU Report 1387 Key Centre Monitoring
Page 85
Table 3.5 Car and Public Transport Trips into Bury Key Centre
Car Trips Bus Trips Metrolink
Trips Car + PT
Trips Modal SplitTime Period Year No. Index No. Index No. Index No. Index % Car % PT
1997 5504 100 3088 100 508 100 9100 100 60 40 1999 5162 94 2439 79 686 135 8288 91 62 38 2002 5189 94 1817 59 746 147 7752 85 67 33
07:30-09:30
2005 4681 85 2652 86 858 169 8191 90 57 43 1997 5149 100 2630 100 429 100 8208 100 63 37 1999 5081 99 2575 98 573 134 8229 100 62 38 2002 5675 110 2065 79 493 115 8233 100 69 31
10:00-12:00
2005 4794 93 2422 92 513 120 7729 94 62 38 1997 5068 100 1143 100 807 100 7018 100 72 28 1999 4552 90 956 84 874 108 6382 91 71 29 2002 4831 95 970 85 772 96 6573 94 73 27
16:00-18:00
2005 4256 84 1059 93 952 118 6267 89 68 32
Table 3.6 Car and Non-Car Trips into Bury Key Centre Time
Period Year Car Bus Metrolink Cycle Walk Total % Car % Non-
Car 2002 5189 1817 746 18 1544 9314 56 442005 4681 2652 858 43 1676 9910 47 5307:30-
09:30 2005/2002 0.90 1.46 1.15 2.39 1.09 1.06
2002 5675 2065 493 7 2357 10597 54 462005 4794 2422 513 21 2591 10341 46 54
10:00-12:00
2005/2002 0.84 1.17 1.04 3.00 1.10 0.98 2002 4831 970 772 14 2401 8988 54 462005 4256 1059 952 19 2867 9153 46 5416:00-
18:00 2005/2002 0.88 1.09 1.23 1.36 1.19 1.02

GMTU Report 1387 Key Centre Monitoring
Page 86
Manchester Key Centre
3.11 Table 3.7 gives the total traffic crossing the Manchester key centre cordon in 1997, 1999, 2002, 2005 and 2006 together with an index of change. Table 3.8 shows modal share of car and public transport trips crossing the cordon for the same years. Table 3.9 shows modal share of car and non-car (pt, walk and cycle) trips since 2002
3.12 Car trips were estimated using the vehicle count in table 3.7 multiplied by an average car occupancy estimated from a survey of the busiest sites in Manchester key centre. Bus patronage is derived using CPS data collected from February in the year preceding the survey year to January in the survey year factored to an average weekday. Rail patronage is a count of people leaving platforms at Victoria, Piccadilly, Oxford Road, Deansgate and Salford Central. Metrolink patronage is estimated from boarding and alighting counts at stations on the Bury, Altrincham and Eccles lines in the November preceding the survey year. Walk and pedal cycle trips are counts of people entering the key centre both on and off-road.
3.13 The Manchester and Salford Inner Relief Route was completed in 2002 and this, together with traffic management changes within the cordon, has contributed to the reduction in road traffic entering the key centre.
Table 3.7 Manchester Key Centre Cordon Counts 1997, 1999, 2002, 2005 and 2006
Cars LGV OGV Buses M/C P/C All 1997 27989 2004 815 1079 281 704 32872 1999 29194 2255 730 1053 276 645 34154 2002 25980 2201 469 985 290 509 30434 2005 27139 2079 561 1000 277 562 31618 2006 24968 2136 450 1019 231 435 28804
07:30-09:30
2006/1997 0.89 1.07 0.55 0.94 0.82 0.62 0.88 1997 14312 2008 973 973 208 285 18759 1999 14242 2137 842 1096 148 232 18697 2002 13303 1999 615 1023 138 184 17262 2005 12526 2067 607 1101 85 234 16620 2006 13057 2085 500 1083 75 128 16800
10:00-12:00
2006/1997 0.91 1.04 0.51 1.11 0.36 0.45 0.90

GMTU Report 1387 Key Centre Monitoring
Page 87
Table 3.8 Car and Public Transport Trips into Manchester Key Centre
Car Trips Bus Trips Rail Trips Metrolink
Trips Car + PT
Trips Modal Split
Time Period Year No Index No Index No Index No Index No Index % Car % PT1997 34426 100 20441 100 9699 100 5875 100 70441 100 49 51 1999 35909 104 17771 87 13419 138 6319 108 73418 104 49 51 2002 31955 93 20390 100 16612 171 6301 107 75258 107 42 58 2005 32567 95 19939 98 16743 173 6556 112 75805 108 43 57
07:30-09:30
2006 32958 96 20242 99 17950 185 6048 103 77198 110 43 57 1997 18892 100 10657 100 3618 100 2549 100 35716 100 53 47 1999 18799 100 9801 92 5144 142 2737 107 36481 102 52 48 2002 17560 93 10877 102 6287 174 2408 94 37132 104 47 53 2005 16159 86 11106 104 6429 178 2451 96 36144 101 45 55
10:00-12:00
2006 18541 98 12463 117 6938 192 2801 110 40743 114 46 54
Table 3.9 Car and Non-Car Trips into Manchester Key Centre
Time Period Year Car Bus Rail Metrolink Cycle Walk Total % Car
% Non-Car
2002 31955 20390 16612 6301 509 5597 81364 39 612005 32567 19939 16743 6556 562 6023 82390 40 602006 32958 20242 17950 6048 435 7203 84836 39 61
07:30-09:30
2006/2002 1.03 0.99 1.08 0.96 0.85 1.29 1.04 2002 17560 10877 6287 2408 184 3158 40474 43 572005 16159 11106 6429 2451 234 3852 40231 40 602006 18541 12463 6938 2801 128 3449 44320 42 58
10:00-12:00
2006/2002 1.06 1.15 1.10 1.16 0.70 1.09 1.10

GMTU Report 1387 Key Centre Monitoring
Page 88
Oldham Key Centre
3.14 Table 3.10 gives the total traffic crossing the Oldham key centre cordon in 1997, 1998, 2001, 2004 and 2007 together with an index of change. Table 3.11 shows modal share of car and public transport trips crossing the cordon for the same years. Table 3.12 shows modal share of car and non-car (pt, walk and cycle) trips since 2001
3.15 Car trips were estimated using the vehicle count in table 3.10 multiplied by an average car occupancy estimated from a survey of the busiest sites in Oldham key centre. Bus patronage is derived using CPS data collected from February in the year preceding the survey year to January in the survey year factored to an average weekday. Rail patronage is a count of people leaving Oldham Mumps station and entering the key centre. Walk and pedal cycle trips are counts of people entering the key centre both on and off-road.
Table 3.10 Oldham Key Centre Inbound Cordon Counts 1997, 1998, 2001, 2004 & 2007
Cars LGV OGV BusesMotor Cycle
Pedal Cycle All
1997 5970 590 187 337 25 53 7148 1998 6382 539 203 363 26 40 7597 2001 5127 500 109 269 29 24 6058 2004 6111 546 121 336 30 27 7171 2007 6757 697 160 308 34 31 7987
07:30- 09:30
2007/1997 1.13 1.18 0.86 0.91 1.36 0.58 1.12 1997 4879 566 202 331 7 15 5979 1998 4497 537 199 340 22 43 5723 2001 3871 503 92 294 7 2 4769 2004 4494 522 116 348 12 16 5508 2007 5610 638 159 330 23 16 6776
10:00- 12:00
2007/1997 1.15 1.13 0.79 1.00 3.29 1.07 1.13 1997 4819 453 112 337 16 42 5756 1998 4986 399 89 355 15 52 5930 2001 4495 400 46 300 15 20 5276 2004 4706 416 52 310 21 36 5541 2007 6278 582 59 291 38 28 7276
16:00-18:00
2007/1997 1.30 1.28 0.53 0.86 2.38 0.67 1.26

GMTU Report 1387 Key Centre Monitoring
Page 89
Table 3.11 Car and Public Transport Trips into Oldham Key Centre
Car Trips Bus Trips Rail Trips Car + PT Trips Time Period Year Number Index Number Index Number Index Number Index % Car % PT
1997 7613 100 4349 100 79 100 12041 100 63 371998 8156 107 3816 88 101 128 12073 100 68 322001 6556 86 3560 82 105 133 10221 85 64 362004 8005 105 3386 78 79 100 11470 95 70 30
07:30-09:30
2007 9054 119 2855 66 87 110 11996 100 75 251997 7196 100 4387 100 33 100 11616 100 62 381998 7770 108 3844 88 42 127 11656 100 67 332001 5682 79 3778 86 49 148 9509 82 60 402004 6606 92 3100 71 24 73 9730 84 68 32
10:00-12:00
2007 8527 118 2910 66 36 109 11473 99 74 241997 6898 100 2055 100 106 100 9059 100 76 241998 7132 103 2128 104 138 130 9398 104 76 242001 6400 93 1923 94 232 219 8555 94 75 252004 6824 99 1965 96 58 55 8847 98 77 23
16:00-18:00
2007 9166 133 1375 67 128 121 10669 118 86 14
Table 3.12 Car and Non-Car Trips into Oldham Key Centre
Time Period Year Car Bus Rail Cycle Walk Total % Car
% Non-Car
2001 6556 3560 105 24 1237 11482 57 432004 8005 3386 79 27 1359 12856 62 382007 9054 2855 87 31 1576 13603 67 33
07:30-09:30
2007/2001 1.38 0.80 0.83 1.29 1.27 1.18 2001 5682 3778 49 2 2038 11549 49 512004 6606 3100 24 16 2463 12209 54 462007 8527 2910 36 16 2408 13897 61 39
10:00-12:00
2007/2001 1.50 0.77 0.73 8.00 1.18 1.20 2001 6400 1923 232 20 1616 10191 63 372004 6824 1965 58 36 1884 10767 63 372007 9166 1375 128 28 1636 12333 74 26
16:00-18:00
2007/2001 1.43 0.72 0.55 1.40 1.01 1.21

GMTU Report 1387 Key Centre Monitoring
Page 90
Rochdale Key Centre
3.16 Table 3.13 gives the total traffic crossing the Rochdale key centre cordon in 1997, 1999, 2002, 2005 and 2008 together with an index of change. Table 3.14 shows modal share of car and public transport trips crossing the cordon for the same years. Table 3.15 shows modal share of car and non-car (pt, walk and cycle) trips since 2002
3.17 Car trips were estimated using the vehicle count in table 3.13 multiplied by an average car occupancy estimated from a survey of the busiest sites in Rochdale key centre. Bus patronage from 1997 to 2005 was derived using CPS data collected from February in the year preceding the survey year to January in the survey year factored to an average weekday. In 2008 it has been derived from bus occupancy surveys. The two methodologies were found to be comparable in Rochdale and no adjustments to previous years’ figures have been made. Rail patronage is a count of people leaving Rochdale station. Walk and pedal cycle trips are counts of people entering the key centre both on and off-road.
Table 3.13 Rochdale Key Centre Inbound Cordon Counts 1997, 1999, 2002, 2005 and 2008
Time Period Year Cars LGV OGV Buses M/C P/C All
1997 3671 307 137 251 12 30 4408 1999 3673 326 83 261 14 32 4389 2002 3813 361 78 263 27 21 4563 2005 3757 335 88 198 10 24 4412 2008 3868 364 87 221 12 16 4568
07:30-09:30
2008/1997 1.05 1.19 0.64 0.88 1.00 0.53 1.04 1997 3433 332 125 208 10 17 4125 1999 3754 376 75 231 20 11 4467 2002 3785 372 91 253 22 12 4535 2005 3470 315 79 187 24 15 4090 2008 3486 384 75 198 4 10 4157
10:00-12:00
2008/1997 1.02 1.16 0.60 0.95 0.40 0.59 1.01 1997 3188 282 46 240 20 26 3802 1999 3101 230 30 255 14 28 3658 2002 3506 260 19 262 13 19 4079 2005 3140 252 15 203 13 13 3636 2008 3395 313 30 210 10 13 3971
16:00-18:00
2008/1997 1.06 1.11 0.65 0.88 0.50 0.50 1.04

GMTU Report 1387 Key Centre Monitoring
Page 91
Table 3.14 Car and Public Transport Trips into Rochdale Key Centre
Car Trips Bus Trips Rail Trips Car + PT
Trips Modal Split Time Period Year No Index No Index No Index No Index % Car % PT
1997 4993 100 1821 100 80 100 6894 100 72 28 1999 4995 100 1655 91 100 125 6750 98 74 26 2002 5186 104 1527 84 104 130 6817 99 76 24 2005 5110 102 2034 112 134 168 7278 106 70 30
07:30-09:30
2008 4951 99 2175 119 152 190 7278 106 68 32 1997 4978 100 1875 100 115 100 6968 100 71 29 1999 5443 109 1446 77 74 64 6963 100 78 22 2002 5488 110 1509 80 70 61 7067 101 78 22 2005 4962 100 1464 78 84 73 6510 93 76 24
10:00-12:00
2008 4671 94 2068 110 105 91 6844 98 68 32 1997 4846 100 1324 100 215 100 6385 100 76 24 1999 4714 97 1213 92 335 156 6262 98 75 25 2002 5329 110 1219 92 441 205 6989 109 76 24 2005 4679 97 1027 78 379 176 6085 95 77 23
16:00-18:00
2008 4244 88 1350 102 510 237 6104 96 70 30
Table 3.15 Car and Non-Car Trips into Rochdale Key Centre Time
Period Year Car Bus Rail Cycle Walk Total % Car % Non-
Car 2002 5186 1527 104 21 1080 7918 65 352005 5110 2034 134 24 1256 8558 60 402008 4951 2175 152 16 1368 8662 57 43
07:30-09:30
2008/2002 0.95 1.42 1.46 0.76 1.27 1.09 2002 5488 1509 70 12 1738 8817 62 382005 4962 1464 84 15 2151 8676 57 432008 4671 2068 105 10 1319 8173 57 43
10:00-12:00
2008/2002 0.85 1.37 1.50 0.83 0.76 0.93
2002 5329 1219 441 19 1059 8067 66 342005 4679 1027 379 13 1118 7216 65 352008 4244 1350 510 13 827 6944 61 39
16:00-18:00
2008/2002 0.80 1.11 1.16 0.68 0.78 0.86

GMTU Report 1387 Key Centre Monitoring
Page 92
Salford Key Centre - Eccles
3.18 Table 3.16 gives the total traffic crossing the Eccles key centre cordon in 1997, 2001, 2004 and 2007 together with an index of change. Table 3.17 shows modal share of car and public transport trips crossing the cordon for the same years. Table 3.18 shows modal share of car and non-car (pt, walk and cycle) trips since 2001
3.19 Car trips were estimated using the vehicle count in table 3.16 multiplied by an average car occupancy estimated from a survey of the busiest sites in Eccles key centre. Bus patronage is derived using CPS data collected from February in the year preceding the survey year to January in the survey year factored to an average weekday. Rail patronage is a count of people leaving Eccles rail station. Metrolink patronage is a count of people leaving Eccles Metrolink station. Walk and pedal cycle trips are counts of people entering the key centre both on and off-road.
3.20 The completion of the Eccles Bypass in November 2000 has contributed to the reduction in traffic crossing the cordon.
Table 3.16 Eccles Key Centre Inbound Cordon Counts 1997, 2001, 2004 & 2007
Time Period Year Cars LGV OGV Buses M/C P/C All
1997 2536 331 133 177 32 74 32832001 1829 253 85 170 15 30 23822004 1315 156 32 126 11 23 16632007 1423 204 33 129 12 41 1842
07:30-09:30
2007/1997 0.56 0.62 0.25 0.73 0.38 0.55 0.561997 2167 225 192 161 16 24 27842001 1609 280 84 214 15 20 22222004 1600 162 34 139 8 19 19622007 1545 210 23 136 11 36 1961
10:00-12:00
2007/1997 0.71 0.93 0.12 0.84 0.69 1.50 0.701997 2410 255 94 187 30 88 30642001 1730 195 49 234 62 39 23092004 1634 158 11 123 19 18 19632007 1324 143 8 147 12 41 1675
16:00-18:00
2007/1997 0.55 0.56 0.09 0.79 0.40 0.47 0.55

GMTU Report 1387 Key Centre Monitoring
Page 93
Table 3.17 Car and Public Transport Trips into Eccles Key Centre
Car Trips Bus Trips Rail Trips Metrolink Trips
Car+PT Trips Modal Split
Time Period Year No. Index No. Index No. Index No. Index No. Index % Car % PT
1997 3452 100 918 100 39 100 - - 4409 100 78 222001 2490 72 518 56 23 59 54 100 3086 70 81 192004 1687 49 660 72 46 118 88 163 2481 56 68 32
07:30-09:30
2007 1779 52 881 96 37 95 172 319 2869 65 62 381997 3181 100 1080 100 11 100 - - 4272 100 74 262001 2362 74 699 65 8 73 73 100 3142 74 75 252004 2367 74 325 30 12 109 85 116 2789 65 85 15
10:00-12:00
2007 2240 70 880 81 6 55 117 160 3243 76 69 311997 3782 100 546 100 37 100 - - 4365 100 87 132001 2715 72 370 68 43 116 166 100 3294 75 82 182004 2392 63 441 81 54 146 221 133 3109 71 77 23
16:00-18:00
2007 1893 50 559 102 40 108 306 184 2798 64 68 32
Table 3.18 Car and Non-Car Trips into Eccles Key Centre Time
Period Year Car Bus Rail Metrolink Cycle Walk Total % Car % Non-
Car 2001 2490 518 23 54 30 855 3970 63 37 2004 1687 660 46 88 23 855 3359 50 50 2007 1779 881 37 172 41 975 3885 46 54
07:30-09:30
2007/2001 0.71 1.70 1.61 3.19 1.37 1.14 0.98 2001 2362 699 8 73 20 1826 4988 47 53 2004 2367 325 12 85 19 1826 4634 51 49 2007 2240 880 6 117 36 1819 5098 44 56
10:00-12:00
2007/2001 0.95 1.26 0.75 1.60 1.80 1.00 1.02 2001 2715 370 43 166 39 1251 4584 59 41 2004 2392 441 54 221 18 1251 4377 55 45 2007 1893 559 40 306 41 1301 4140 46 54
16:00-18:00
2007/2001 0.70 1.51 0.93 1.84 1.05 1.04 0.90 Note: Pedestrians not counted in 2001. 2004 estimate used
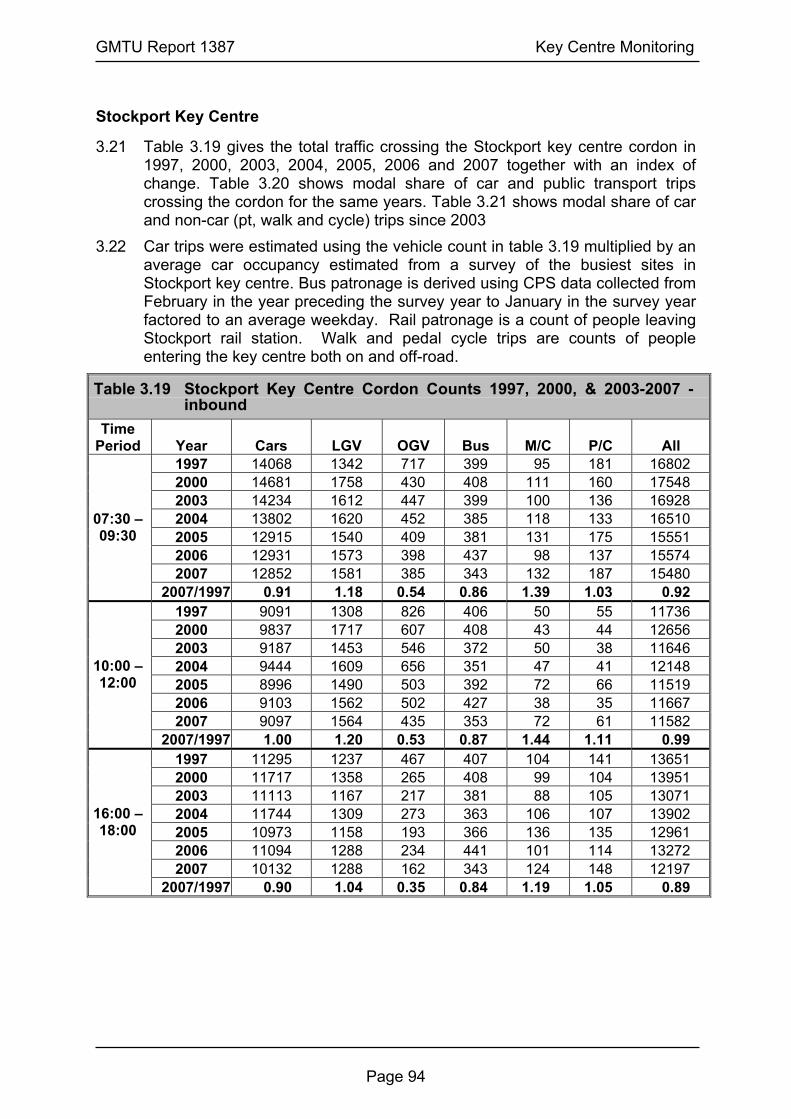
GMTU Report 1387 Key Centre Monitoring
Page 94
Stockport Key Centre
3.21 Table 3.19 gives the total traffic crossing the Stockport key centre cordon in 1997, 2000, 2003, 2004, 2005, 2006 and 2007 together with an index of change. Table 3.20 shows modal share of car and public transport trips crossing the cordon for the same years. Table 3.21 shows modal share of car and non-car (pt, walk and cycle) trips since 2003
3.22 Car trips were estimated using the vehicle count in table 3.19 multiplied by an average car occupancy estimated from a survey of the busiest sites in Stockport key centre. Bus patronage is derived using CPS data collected from February in the year preceding the survey year to January in the survey year factored to an average weekday. Rail patronage is a count of people leaving Stockport rail station. Walk and pedal cycle trips are counts of people entering the key centre both on and off-road.
Table 3.19 Stockport Key Centre Cordon Counts 1997, 2000, & 2003-2007 - inbound
Time Period Year Cars LGV OGV Bus M/C P/C All
1997 14068 1342 717 399 95 181 16802 2000 14681 1758 430 408 111 160 17548 2003 14234 1612 447 399 100 136 16928 2004 13802 1620 452 385 118 133 16510 2005 12915 1540 409 381 131 175 15551 2006 12931 1573 398 437 98 137 15574 2007 12852 1581 385 343 132 187 15480
07:30 – 09:30
2007/1997 0.91 1.18 0.54 0.86 1.39 1.03 0.92 1997 9091 1308 826 406 50 55 11736 2000 9837 1717 607 408 43 44 12656 2003 9187 1453 546 372 50 38 11646 2004 9444 1609 656 351 47 41 12148 2005 8996 1490 503 392 72 66 11519 2006 9103 1562 502 427 38 35 11667 2007 9097 1564 435 353 72 61 11582
10:00 – 12:00
2007/1997 1.00 1.20 0.53 0.87 1.44 1.11 0.99 1997 11295 1237 467 407 104 141 13651 2000 11717 1358 265 408 99 104 13951 2003 11113 1167 217 381 88 105 13071 2004 11744 1309 273 363 106 107 13902 2005 10973 1158 193 366 136 135 12961 2006 11094 1288 234 441 101 114 13272 2007 10132 1288 162 343 124 148 12197
16:00 – 18:00
2007/1997 0.90 1.04 0.35 0.84 1.19 1.05 0.89

GMTU Report 1387 Key Centre Monitoring
Page 95
Table 3.20 Car and Public Transport Trips into Stockport Key Centre
Car Trips Bus Trips Rail Trips Car + PT Trips Time Period Year No Index No Index No Index No Index % Car % PT
1997 17163 100 5044 100 836 100 23043 100 74 26 2000 17911 104 4942 98 955 114 23808 103 75 25 2003 17365 101 4633 92 613 73 22611 98 77 23 2004 17391 101 4610 91 747 89 22748 99 76 24 2005 16273 95 5822 115 1030 123 23125 100 70 30 2006 15776 92 4019 80 1107 132 20902 91 75 25
07:30-09:30
2007 15679 91 4421 88 1210 145 21310 92 74 26 1997 12364 100 4610 100 535 100 17509 100 71 29 2000 13378 108 4986 108 410 77 18774 107 71 29 2003 12494 101 4485 97 357 67 17336 99 72 28 2004 13033 105 3817 83 356 43 17206 98 76 24 2005 12414 100 4078 88 535 100 17027 97 73 27 2006 11925 96 3814 83 594 111 16333 93 73 27
10:00-12:00
2007 12554 102 4993 108 459 86 18006 103 70 30 1997 15022 100 2834 100 1049 100 18905 100 79 21 2000 15584 104 2702 95 1032 98 19318 102 81 19 2003 14780 98 3431 121 691 66 18902 100 78 22 2004 15150 101 2987 105 997 119 19134 101 79 21 2005 14923 99 2687 95 1166 111 18776 99 79 21 2006 13978 93 2539 90 1236 118 17753 94 79 21
16:00-18:00
2007 13678 91 2677 94 1415 135 17770 94 77 23 Table 3.21 Car and Non-Car Trips into Stockport Key Centre
Time Period Year Car Bus Rail Cycle Walk Total % Car
% Non-Car
2003 17365 4633 613 136 1996 24743 70 30 2004 17391 4610 747 133 1771 24652 71 29 2005 16273 5822 1030 198 2140 25463 64 36 2006 15776 4019 1107 157 2196 23255 68 32 2007 15679 4421 1210 187 2258 23755 66 34
07:30-09:30
2007/2003 0.90 0.95 1.97 1.38 1.13 0.96 2003 12494 4485 357 38 1507 18881 66 34 2004 13033 3817 356 41 1343 18590 70 30 2005 12414 4078 535 77 1782 18886 66 34 2006 11925 3814 594 45 1589 17967 66 34 2007 12554 4993 459 61 1314 19381 65 35
10:00-12:00
2007/2003 1.00 1.11 1.29 1.61 0.87 1.03 2003 14780 3431 691 105 1657 20664 72 28 2004 15150 2987 997 107 1392 20633 73 27 2005 14923 2687 1166 152 1264 20192 74 26 2006 13978 2539 1236 125 1389 19267 73 27 2007 13678 2677 1415 148 1590 19508 70 30
16:00-18:00
2007/2003 0.93 0.78 2.05 1.41 0.96 0.94
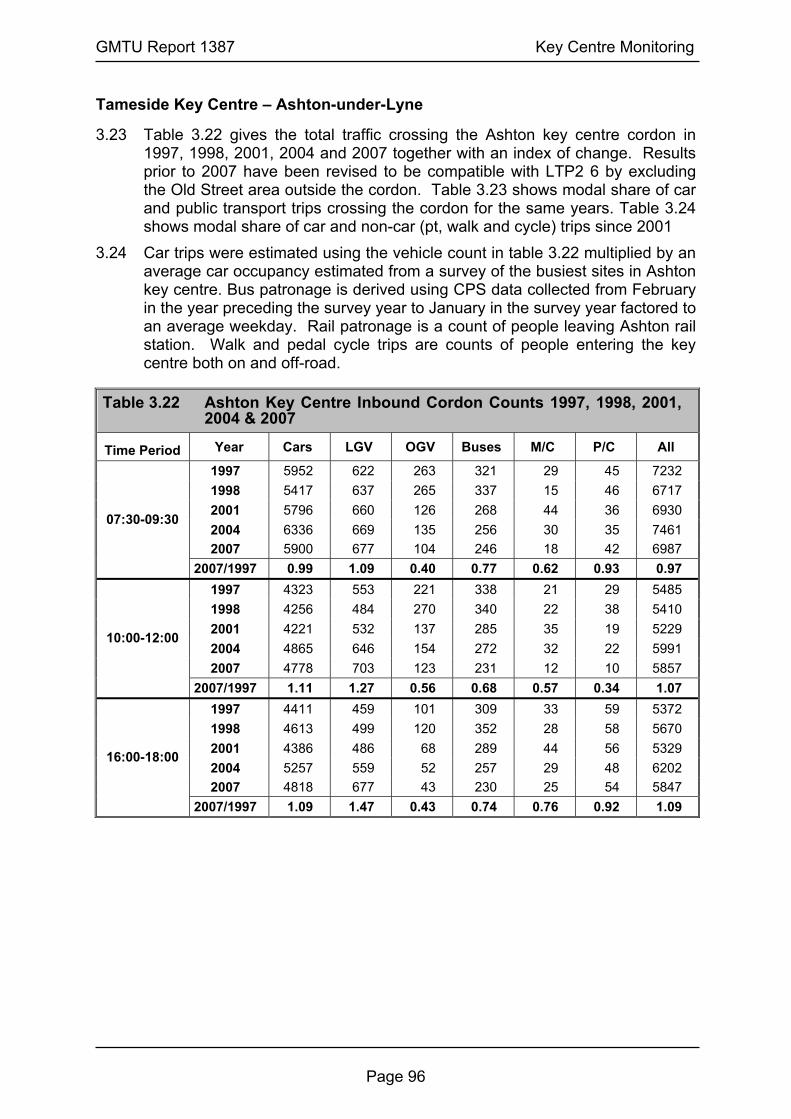
GMTU Report 1387 Key Centre Monitoring
Page 96
Tameside Key Centre – Ashton-under-Lyne
3.23 Table 3.22 gives the total traffic crossing the Ashton key centre cordon in 1997, 1998, 2001, 2004 and 2007 together with an index of change. Results prior to 2007 have been revised to be compatible with LTP2 6 by excluding the Old Street area outside the cordon. Table 3.23 shows modal share of car and public transport trips crossing the cordon for the same years. Table 3.24 shows modal share of car and non-car (pt, walk and cycle) trips since 2001
3.24 Car trips were estimated using the vehicle count in table 3.22 multiplied by an average car occupancy estimated from a survey of the busiest sites in Ashton key centre. Bus patronage is derived using CPS data collected from February in the year preceding the survey year to January in the survey year factored to an average weekday. Rail patronage is a count of people leaving Ashton rail station. Walk and pedal cycle trips are counts of people entering the key centre both on and off-road.
Table 3.22 Ashton Key Centre Inbound Cordon Counts 1997, 1998, 2001, 2004 & 2007
Time Period Year Cars LGV OGV Buses M/C P/C All
1997 5952 622 263 321 29 45 7232 1998 5417 637 265 337 15 46 6717 2001 5796 660 126 268 44 36 6930 2004 6336 669 135 256 30 35 7461 2007 5900 677 104 246 18 42 6987
07:30-09:30
2007/1997 0.99 1.09 0.40 0.77 0.62 0.93 0.97 1997 4323 553 221 338 21 29 5485 1998 4256 484 270 340 22 38 5410 2001 4221 532 137 285 35 19 5229 2004 4865 646 154 272 32 22 5991 2007 4778 703 123 231 12 10 5857
10:00-12:00
2007/1997 1.11 1.27 0.56 0.68 0.57 0.34 1.07 1997 4411 459 101 309 33 59 5372 1998 4613 499 120 352 28 58 5670 2001 4386 486 68 289 44 56 5329 2004 5257 559 52 257 29 48 6202 2007 4818 677 43 230 25 54 5847
16:00-18:00
2007/1997 1.09 1.47 0.43 0.74 0.76 0.92 1.09
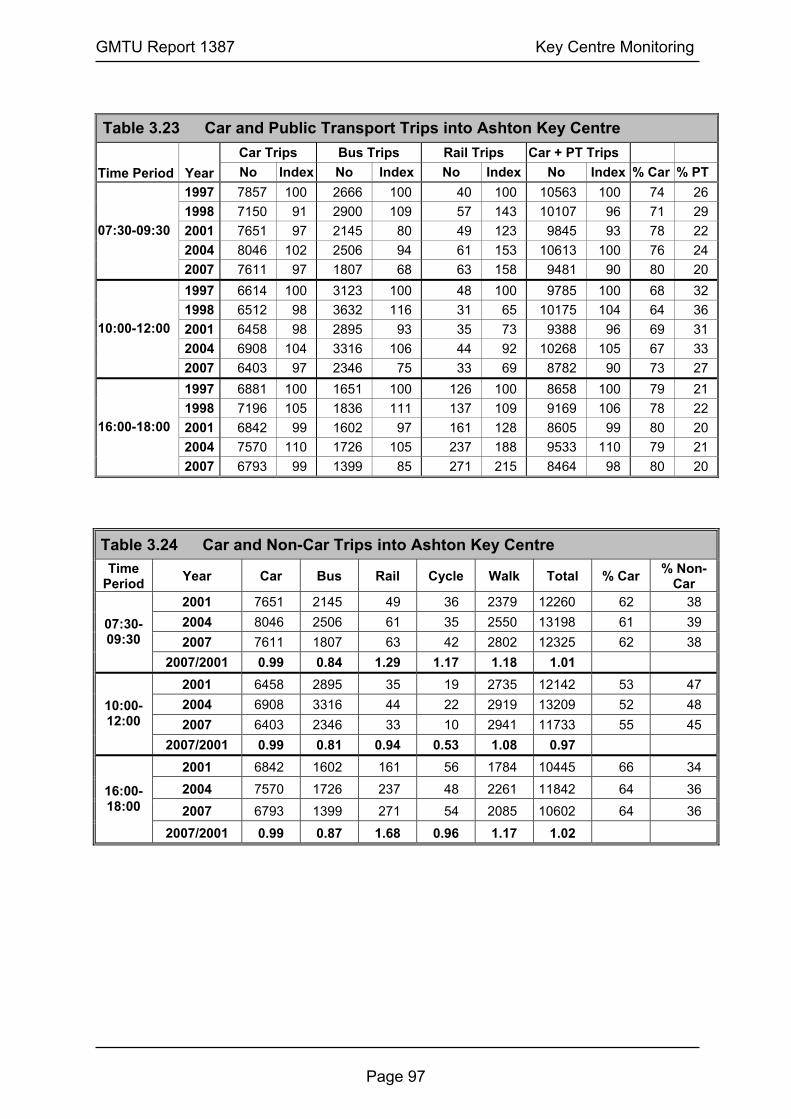
GMTU Report 1387 Key Centre Monitoring
Page 97
Table 3.23 Car and Public Transport Trips into Ashton Key Centre
Car Trips Bus Trips Rail Trips Car + PT Trips Time Period Year No Index No Index No Index No Index % Car % PT
1997 7857 100 2666 100 40 100 10563 100 74 26 1998 7150 91 2900 109 57 143 10107 96 71 29 2001 7651 97 2145 80 49 123 9845 93 78 22 2004 8046 102 2506 94 61 153 10613 100 76 24
07:30-09:30
2007 7611 97 1807 68 63 158 9481 90 80 20 1997 6614 100 3123 100 48 100 9785 100 68 32 1998 6512 98 3632 116 31 65 10175 104 64 36 2001 6458 98 2895 93 35 73 9388 96 69 31 2004 6908 104 3316 106 44 92 10268 105 67 33
10:00-12:00
2007 6403 97 2346 75 33 69 8782 90 73 27 1997 6881 100 1651 100 126 100 8658 100 79 21 1998 7196 105 1836 111 137 109 9169 106 78 22 2001 6842 99 1602 97 161 128 8605 99 80 20 2004 7570 110 1726 105 237 188 9533 110 79 21
16:00-18:00
2007 6793 99 1399 85 271 215 8464 98 80 20
Table 3.24 Car and Non-Car Trips into Ashton Key Centre
Time Period Year Car Bus Rail Cycle Walk Total % Car % Non-
Car 2001 7651 2145 49 36 2379 12260 62 38 2004 8046 2506 61 35 2550 13198 61 39 2007 7611 1807 63 42 2802 12325 62 38
07:30-09:30
2007/2001 0.99 0.84 1.29 1.17 1.18 1.01 2001 6458 2895 35 19 2735 12142 53 47 2004 6908 3316 44 22 2919 13209 52 48 2007 6403 2346 33 10 2941 11733 55 45
10:00-12:00
2007/2001 0.99 0.81 0.94 0.53 1.08 0.97 2001 6842 1602 161 56 1784 10445 66 34 2004 7570 1726 237 48 2261 11842 64 36 2007 6793 1399 271 54 2085 10602 64 36
16:00-18:00
2007/2001 0.99 0.87 1.68 0.96 1.17 1.02

GMTU Report 1387 Key Centre Monitoring
Page 98
Trafford Key Centre - Altrincham
3.25 Table 3.25 gives the total traffic crossing the Altrincham key centre cordon in 1997, 1999, 2002, 2005 and 2008 together with an index of change. Table 3.26 shows modal share of car and public transport trips crossing the cordon for the same years. Table 3.27 shows modal share of car and non-car (pt, walk and cycle) trips since 2002
3.26 Car trips were estimated using the vehicle count in table 3.25 multiplied by an average car occupancy estimated from a survey of the busiest sites in Altrincham key centre. Bus patronage from 1997 to 2005 was derived using CPS data collected from February in the year preceding the survey year to January in the survey year factored to an average weekday. In 2008 it has been derived from bus occupancy surveys. The two methodologies were found to be comparable in Altrincham and no adjustments to previous years’ figures have been made. Rail and Metrolink patronage is a count of people leaving Altrincham Interchange (excluding pedestrians walking through). Walk and pedal cycle trips are counts of people entering the key centre both on and off-road.
3.27 Traffic flows crossing the cordon have fallen since the completion of the Altrincham Eastern Improvement Route in October 2002.
Table 3.25 Altrincham Key Centre Inbound Cordon Counts 1997, 1999, 2002, 2005 and 2008
Cars LGV OGV Buses M/C P/C All 1997 3972 334 142 147 9 88 4692 1999 4308 321 145 150 19 71 5014 2002 4491 421 103 134 21 71 5241 2005 3534 343 88 109 17 79 4170 2008 3724 304 74 107 16 84 4309
07:30-09:30
2008/1997 0.94 0.91 0.52 0.73 1.78 0.95 0.92 1997 3516 341 167 134 21 89 4268 1999 3512 417 196 157 11 78 4371 2002 3339 468 129 112 13 50 4111 2005 3015 403 106 101 14 59 3698 2008 2482 412 110 104 6 38 3152
10:00-12:00
2008/1997 0.71 1.21 0.66 0.78 0.29 0.43 0.74 1997 3517 289 96 132 16 68 4118 1999 3563 245 75 135 20 59 4097 2002 3487 278 52 124 23 39 4003 2005 3150 249 22 98 12 44 3575 2008 2906 221 24 96 13 62 3322
16:00-18:00
2008/1997 0.83 0.76 0.25 0.73 0.81 0.91 0.81

GMTU Report 1387 Key Centre Monitoring
Page 99
Table 3.26 Car and Public Transport Trips into Altrincham Key Centre
Car Trips Bus Trips
Rail & Metrolink
Trips Car + PT
Trips Modal Split Time Period Year No Index No Index No Index No Index % Car % PT
1997 5044 100 1469 100 1217 100 7730 100 65 351999 5471 108 1769 120 1440 118 8680 112 63 372002 5704 113 1135 77 1204 99 8043 104 71 292005 4170 83 745 51 1347 111 6262 81 67 33
07:30-09:30
2008 4543 90 1050 71 1094 90 6687 87 68 321997 4500 100 953 100 661 100 6114 100 74 261999 4495 100 1174 123 519 79 6188 101 73 272002 4274 95 827 87 356 54 5457 89 78 222005 3829 85 608 64 317 48 4754 78 81 19
10:00-12:00
2008 3127 69 917 96 359 54 4403 72 71 291997 4713 100 482 100 890 100 6085 100 77 231999 4774 101 567 118 - - - - - -2002 4673 99 370 77 649 73 5692 94 82 182005 4158 88 401 83 677 76 5236 86 79 21
16:00-18:00
2008 3574 76 475 99 545 61 4595 76 78 22
Table 3.27 Car and Non-Car Trips into Altrincham Key Centre
Time Period
Year Car Bus Rail & Metrolink Cycle Walk Total % Car % Non-
Car 2002 5704 1135 1204 71 1898 10011 57 432005 4170 745 1347 79 2123 8464 49 512008 4543 1050 1094 84 2144 8915 51 49
07:30-09:30
2008/2002 0.80 0.92 0.91 1.18 1.13 0.89 2002 4274 827 356 50 2186 7693 56 442005 3829 608 317 59 1870 6683 57 432008 3127 917 359 38 2456 6897 45 55
10:00-12:00
2008/2002 0.73 1.11 1.01 0.76 1.12 0.90 2002 4673 370 649 39 1483 7214 65 352005 4158 401 677 44 1896 7176 58 422008 3574 475 545 62 2113 6769 53 47
16:00-18:00
2008/2002 0.76 1.28 0.84 1.59 1.42 0.94
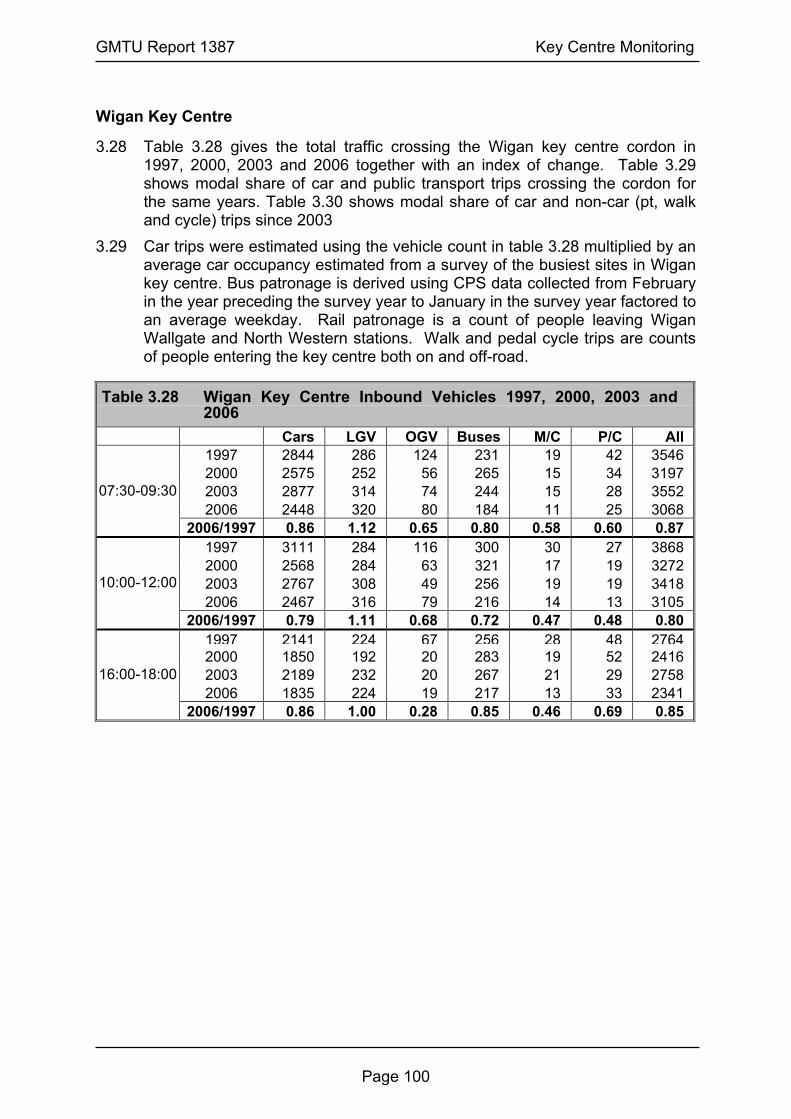
GMTU Report 1387 Key Centre Monitoring
Page 100
Wigan Key Centre
3.28 Table 3.28 gives the total traffic crossing the Wigan key centre cordon in 1997, 2000, 2003 and 2006 together with an index of change. Table 3.29 shows modal share of car and public transport trips crossing the cordon for the same years. Table 3.30 shows modal share of car and non-car (pt, walk and cycle) trips since 2003
3.29 Car trips were estimated using the vehicle count in table 3.28 multiplied by an average car occupancy estimated from a survey of the busiest sites in Wigan key centre. Bus patronage is derived using CPS data collected from February in the year preceding the survey year to January in the survey year factored to an average weekday. Rail patronage is a count of people leaving Wigan Wallgate and North Western stations. Walk and pedal cycle trips are counts of people entering the key centre both on and off-road.
Table 3.28 Wigan Key Centre Inbound Vehicles 1997, 2000, 2003 and 2006
Cars LGV OGV Buses M/C P/C All 1997 2844 286 124 231 19 42 3546 2000 2575 252 56 265 15 34 3197 2003 2877 314 74 244 15 28 3552 2006 2448 320 80 184 11 25 3068
07:30-09:30
2006/1997 0.86 1.12 0.65 0.80 0.58 0.60 0.87 1997 3111 284 116 300 30 27 3868 2000 2568 284 63 321 17 19 3272 2003 2767 308 49 256 19 19 3418 2006 2467 316 79 216 14 13 3105
10:00-12:00
2006/1997 0.79 1.11 0.68 0.72 0.47 0.48 0.80 1997 2141 224 67 256 28 48 27642000 1850 192 20 283 19 52 2416 2003 2189 232 20 267 21 29 2758 2006 1835 224 19 217 13 33 2341
16:00-18:00
2006/1997 0.86 1.00 0.28 0.85 0.46 0.69 0.85
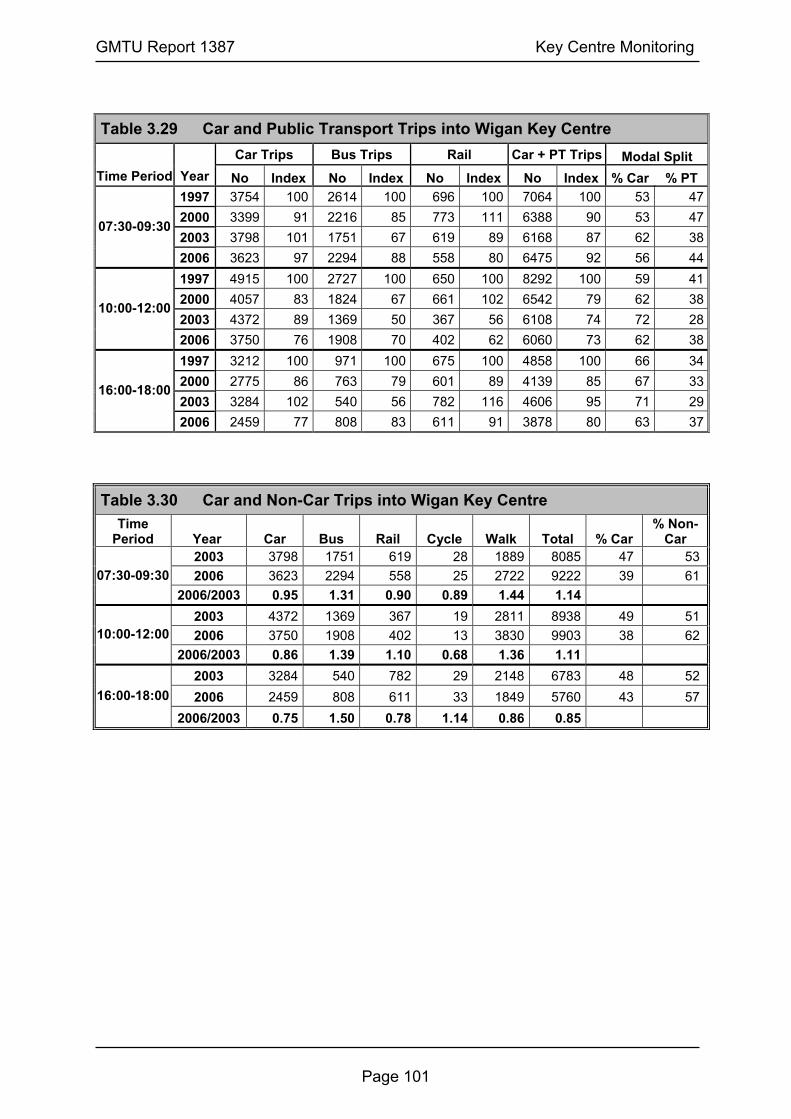
GMTU Report 1387 Key Centre Monitoring
Page 101
Table 3.29 Car and Public Transport Trips into Wigan Key Centre
Car Trips Bus Trips Rail Car + PT Trips Modal Split Time Period Year No Index No Index No Index No Index % Car % PT
1997 3754 100 2614 100 696 100 7064 100 53 472000 3399 91 2216 85 773 111 6388 90 53 472003 3798 101 1751 67 619 89 6168 87 62 38
07:30-09:30
2006 3623 97 2294 88 558 80 6475 92 56 441997 4915 100 2727 100 650 100 8292 100 59 412000 4057 83 1824 67 661 102 6542 79 62 382003 4372 89 1369 50 367 56 6108 74 72 28
10:00-12:00
2006 3750 76 1908 70 402 62 6060 73 62 381997 3212 100 971 100 675 100 4858 100 66 342000 2775 86 763 79 601 89 4139 85 67 332003 3284 102 540 56 782 116 4606 95 71 29
16:00-18:00
2006 2459 77 808 83 611 91 3878 80 63 37
Table 3.30 Car and Non-Car Trips into Wigan Key Centre
Time Period Year Car Bus Rail Cycle Walk Total % Car
% Non-Car
2003 3798 1751 619 28 1889 8085 47 532006 3623 2294 558 25 2722 9222 39 6107:30-09:30
2006/2003 0.95 1.31 0.90 0.89 1.44 1.14 2003 4372 1369 367 19 2811 8938 49 512006 3750 1908 402 13 3830 9903 38 6210:00-12:00
2006/2003 0.86 1.39 1.10 0.68 1.36 1.11 2003 3284 540 782 29 2148 6783 48 522006 2459 808 611 33 1849 5760 43 5716:00-18:00
2006/2003 0.75 1.50 0.78 1.14 0.86 0.85


4 OTHER ROAD TRAFFIC STATISTICS


GMTU Report 1387 Other Road Traffic Statistics
Page 105
Car Occupancy
4.1 Peak car occupancy surveys were undertaken at ten monitoring sites on A roads across Greater Manchester in the years 1984, 1989 to 2000, 2002 and 2004 to 2007. Off-peak surveys have been undertaken since 1994. Table 4.1 shows the results of these surveys in 2007 for the AM peak hour (08:00-09:00) and the off-peak period (10:00-12:00) respectively. Figure 4.1 shows trends in peak and off-peak car occupancy since 1994.
Table 4.1 Average Peak and Off-Peak Car Occupancy at 10 Sites in Greater Manchester
Average Occupancy % Single Occupant
Year AM Peak
(08:00-09:00) Off-Peak
(10:00-12:00) AM Peak
(08:00-09:00) Off-Peak
(10:00-12:00) 1984 (1) 1989 (2) 1990 1991 1992 1993 1994 1995 1996 1997 1998 1999 2000 2002 2004 2005 2006 2007
1.31 1.23 1.24 1.24 1.24 1.24 1.23 1.25 1.23 1.22 1.22 1.21 1.22 1.21 1.18 1.19 1.16 1.15
- - - - - -
1.40 1.37 1.30 1.33 1.32 1.33 1.36 1.30 1.27 1.30 1.31 1.30
76 81 81 80 80 80 81 80 81 82 83 83 83 83 85 84 86 87
- - - - - -
69 69 74 72 73 72 71 75 76 74 73 74
Notes: (1) based on 8 sites (2) Autumn surveys (all others in Spring)
Figure 4.1 Average Car Occupancies - 1994 to 2007
0.00
0.20
0.40
0.60
0.80
1.00
1.20
1.40
1.60
1994 1995 1996 1997 1998 1999 2000 2002 2004 2005 2006 2007
Year
Occ
upan
cy
AM Peak (08:00-09:00) Off-Peak (10:00-12:00)

GMTU Report 1387 Other Road Traffic Statistics
Page 106
Walking
4.2 Levels of walking are monitored in several ways for the Greater Manchester Local Transport Plan Walking Strategy.
4.3 Manual counts of pedestrian flows crossing a cordon of sites around each of the ten Key Centres began in 2001 to complement the surveys of travel by other modes of transport (see paragraph 3.1). The counts now form an integral part of the Key Centre Monitoring programme and are undertaken on the same three-year cycle. A summary of the pedestrian data collected in the morning and off-peak periods is shown in Tables 4.2 and 4.3.
Table 4.2 Key Centre Cordon Pedestrian Flows AM Peak Period (07:30-09:30)
2001 2002 2003 2004 2005 2006 2007 2008 No 2220 - - 2486 - - 2090
Bolton Index 100 - - 112 - - 94 No - 1796 - - 1676 - -
Bury Index - 100 - - 93 - - No - 5597 - - 6023 7203 -
Manchester Index - 100 - 108 129 - No 1237 - - 1359 - - 1576
Oldham Index 100 - - 110 - - 127 No - 1080 - - 1256 - - 1368
Rochdale Index - 100 - - 116 - - 127No - - - 855 - - 975
Eccles Index - - - 100 - - 114 No - - 1996 1771 2140 2196 2258
Stockport Index - - 100 89 107 110 113 No 2379 - - 2550 - - 2830
Ashton Index 100 - - 107 - - 119 No - 1898 - - 2123 - - 2144
Altrincham Index - 100 - - 112 - - 113No - - 1889 - - 2722 -
Wigan Index - - 100 - - 144 -
Note: Wigan pedestrian flows exclude Robin Park (305 in 2003, 208 in 2006)
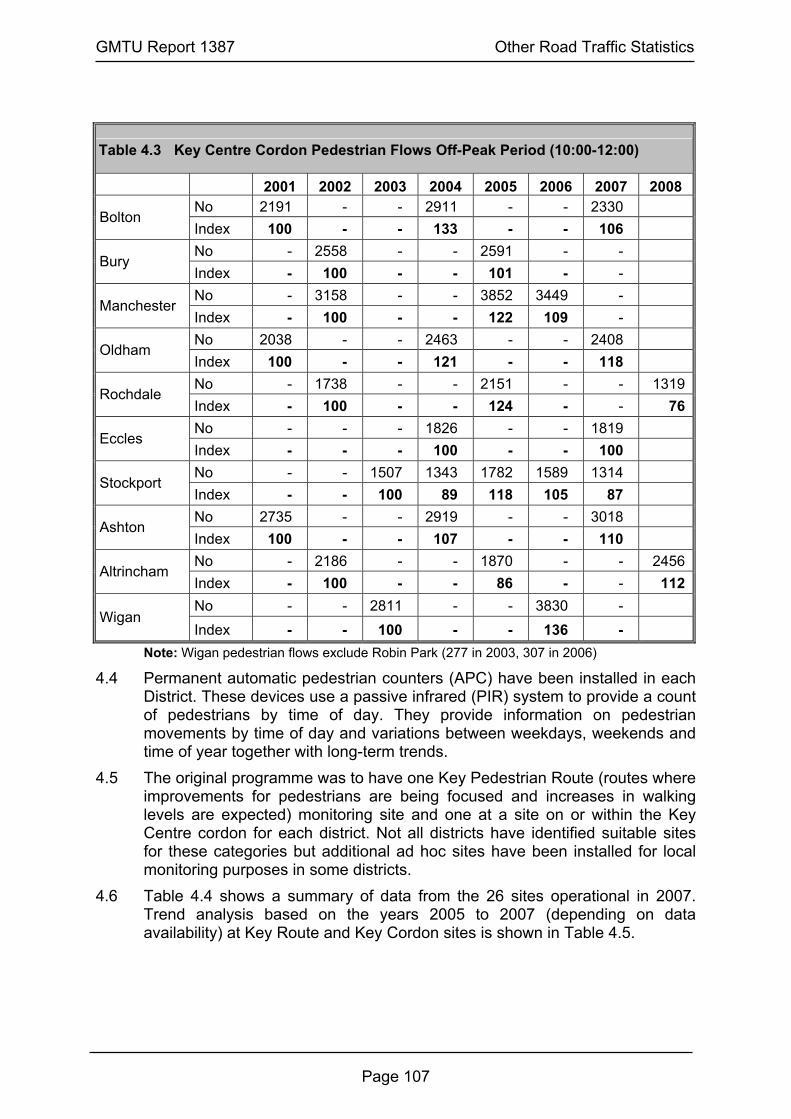
GMTU Report 1387 Other Road Traffic Statistics
Page 107
Table 4.3 Key Centre Cordon Pedestrian Flows Off-Peak Period (10:00-12:00)
2001 2002 2003 2004 2005 2006 2007 2008 No 2191 - - 2911 - - 2330
Bolton Index 100 - - 133 - - 106 No - 2558 - - 2591 - -
Bury Index - 100 - - 101 - - No - 3158 - - 3852 3449 -
Manchester Index - 100 - - 122 109 - No 2038 - - 2463 - - 2408
Oldham Index 100 - - 121 - - 118 No - 1738 - - 2151 - - 1319
Rochdale Index - 100 - - 124 - - 76No - - - 1826 - - 1819
Eccles Index - - - 100 - - 100 No - - 1507 1343 1782 1589 1314
Stockport Index - - 100 89 118 105 87 No 2735 - - 2919 - - 3018
Ashton Index 100 - - 107 - - 110 No - 2186 - - 1870 - - 2456
Altrincham Index - 100 - - 86 - - 112No - - 2811 - - 3830 -
Wigan Index - - 100 - - 136 -
Note: Wigan pedestrian flows exclude Robin Park (277 in 2003, 307 in 2006)
4.4 Permanent automatic pedestrian counters (APC) have been installed in each District. These devices use a passive infrared (PIR) system to provide a count of pedestrians by time of day. They provide information on pedestrian movements by time of day and variations between weekdays, weekends and time of year together with long-term trends.
4.5 The original programme was to have one Key Pedestrian Route (routes where improvements for pedestrians are being focused and increases in walking levels are expected) monitoring site and one at a site on or within the Key Centre cordon for each district. Not all districts have identified suitable sites for these categories but additional ad hoc sites have been installed for local monitoring purposes in some districts.
4.6 Table 4.4 shows a summary of data from the 26 sites operational in 2007. Trend analysis based on the years 2005 to 2007 (depending on data availability) at Key Route and Key Cordon sites is shown in Table 4.5.
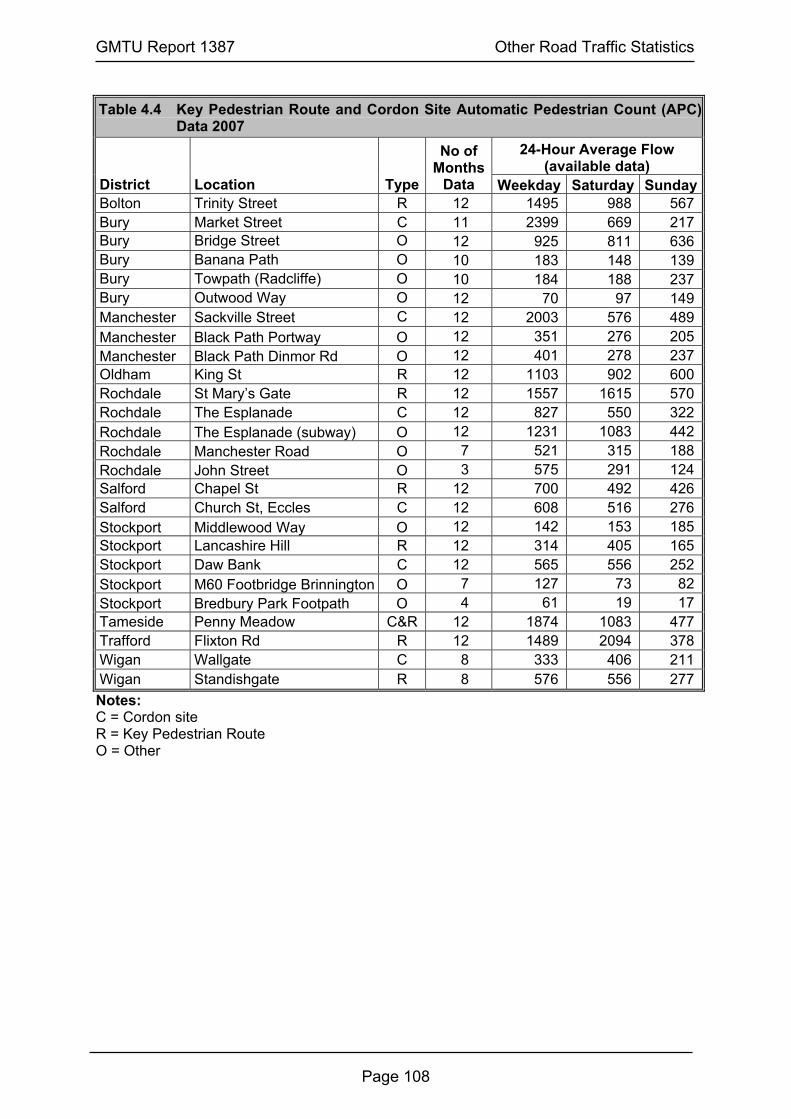
GMTU Report 1387 Other Road Traffic Statistics
Page 108
Table 4.4 Key Pedestrian Route and Cordon Site Automatic Pedestrian Count (APC) Data 2007
24-Hour Average Flow (available data)
District Location Type
No of Months
Data Weekday Saturday SundayBolton Trinity Street R 12 1495 988 567Bury Market Street C 11 2399 669 217Bury Bridge Street O 12 925 811 636Bury Banana Path O 10 183 148 139Bury Towpath (Radcliffe) O 10 184 188 237Bury Outwood Way O 12 70 97 149Manchester Sackville Street C 12 2003 576 489Manchester Black Path Portway O 12 351 276 205Manchester Black Path Dinmor Rd O 12 401 278 237Oldham King St R 12 1103 902 600Rochdale St Mary’s Gate R 12 1557 1615 570Rochdale The Esplanade C 12 827 550 322Rochdale The Esplanade (subway) O 12 1231 1083 442Rochdale Manchester Road O 7 521 315 188Rochdale John Street O 3 575 291 124Salford Chapel St R 12 700 492 426Salford Church St, Eccles C 12 608 516 276Stockport Middlewood Way O 12 142 153 185Stockport Lancashire Hill R 12 314 405 165Stockport Daw Bank C 12 565 556 252Stockport M60 Footbridge Brinnington O 7 127 73 82Stockport Bredbury Park Footpath O 4 61 19 17Tameside Penny Meadow C&R 12 1874 1083 477Trafford Flixton Rd R 12 1489 2094 378Wigan Wallgate C 8 333 406 211Wigan Standishgate R 8 576 556 277Notes: C = Cordon site R = Key Pedestrian Route O = Other
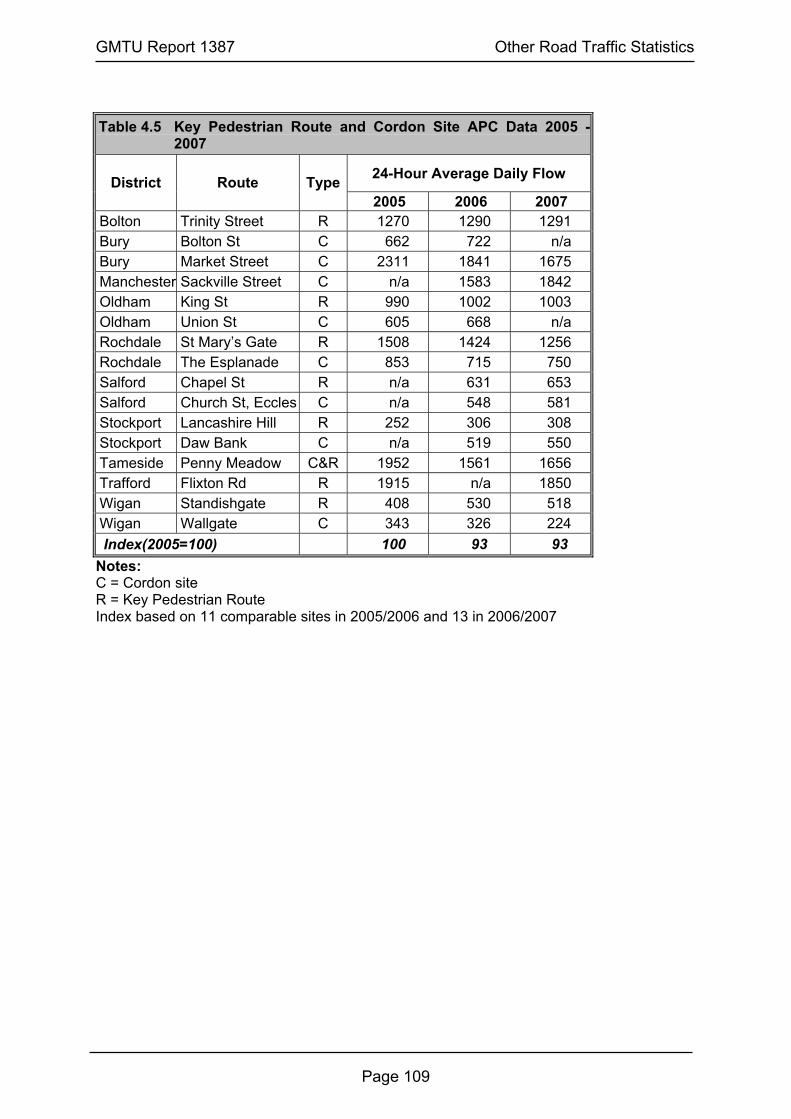
GMTU Report 1387 Other Road Traffic Statistics
Page 109
Table 4.5 Key Pedestrian Route and Cordon Site APC Data 2005 -
2007
24-Hour Average Daily Flow District Route Type2005 2006 2007
Bolton Trinity Street R 1270 1290 1291 Bury Bolton St C 662 722 n/a Bury Market Street C 2311 1841 1675 Manchester Sackville Street C n/a 1583 1842 Oldham King St R 990 1002 1003 Oldham Union St C 605 668 n/a Rochdale St Mary’s Gate R 1508 1424 1256 Rochdale The Esplanade C 853 715 750 Salford Chapel St R n/a 631 653 Salford Church St, Eccles C n/a 548 581 Stockport Lancashire Hill R 252 306 308 Stockport Daw Bank C n/a 519 550 Tameside Penny Meadow C&R 1952 1561 1656 Trafford Flixton Rd R 1915 n/a 1850 Wigan Standishgate R 408 530 518 Wigan Wallgate C 343 326 224 Index(2005=100) 100 93 93 Notes: C = Cordon site R = Key Pedestrian Route Index based on 11 comparable sites in 2005/2006 and 13 in 2006/2007

GMTU Report 1387 Other Road Traffic Statistics
Page 110
Cycling
4.7 Manual counts of cycle flows crossing a cordon of sites around each of the ten Key Centres are undertaken on a three-year cycle. A summary of the cycle data collected in the morning and off-peak periods since 2001 is shown in Tables 4.6 and 4.7.
Table 4.6 Key Centre Cordon Cycle Flows AM Peak Period (07:30-09:30)
2001 2002 2003 2004 2005 2006 2007 2008 No 63 - - 58 - - 77
Bolton Index 100 - - 92 - - 122 No - 18 - - 43 - -
Bury Index - 100 - - 239 - - No - 509 - - 562 435 -
Manchester Index - 100 - - 110 85 - No 24 - - 27 - - 31
Oldham Index 100 - - 113 - - 129 No - 21 - - 24 - - 16
Rochdale Index - 100 - - 114 - - 76 No 30 - - 23 - - 41
Eccles Index 100 - - 77 - - 137 No - - 136 133 198 157 187
Stockport Index - - 100 98 146 115 138 No 36 - - 35 - - 39
Ashton Index 100 - - 97 - - 108 No - 71 - - 79 - - 84
Altrincham Index - 100 - - 111 - - 118 No - - 28 - - 25 -
Wigan Index - - 100 - - 89 -
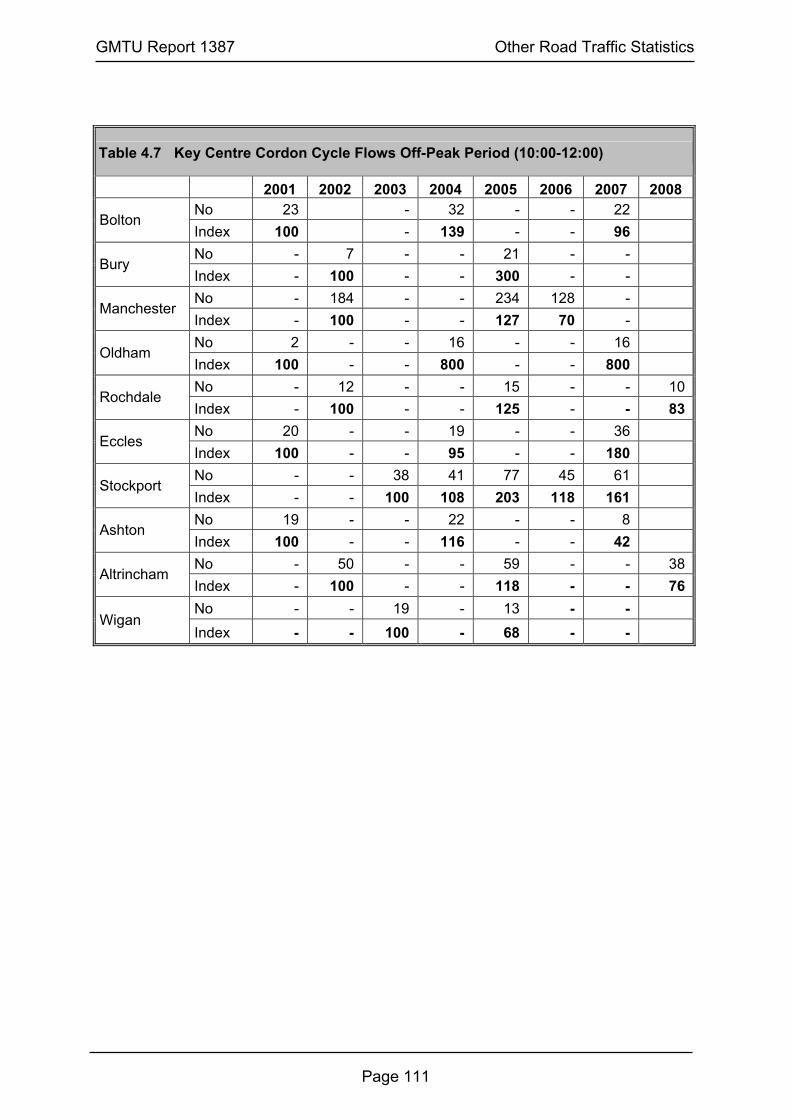
GMTU Report 1387 Other Road Traffic Statistics
Page 111
Table 4.7 Key Centre Cordon Cycle Flows Off-Peak Period (10:00-12:00)
2001 2002 2003 2004 2005 2006 2007 2008 No 23 - 32 - - 22
Bolton Index 100 - 139 - - 96 No - 7 - - 21 - -
Bury Index - 100 - - 300 - - No - 184 - - 234 128 -
Manchester Index - 100 - - 127 70 - No 2 - - 16 - - 16
Oldham Index 100 - - 800 - - 800 No - 12 - - 15 - - 10
Rochdale Index - 100 - - 125 - - 83No 20 - - 19 - - 36
Eccles Index 100 - - 95 - - 180 No - - 38 41 77 45 61
Stockport Index - - 100 108 203 118 161 No 19 - - 22 - - 8
Ashton Index 100 - - 116 - - 42 No - 50 - - 59 - - 38
Altrincham Index - 100 - - 118 - - 76No - - 19 - 13 - -
Wigan Index - - 100 - 68 - -

GMTU Report 1387 Other Road Traffic Statistics
Page 112
Cycle Flows on Major Roads
4.8 12-hour 2-way cycle flows on major road links in 2007 are presented in individual District reports.
4.9 By using the cycle flow on each link it has been possible to calculate an average cycle flow per link for each District. These averages, and the highest link flows in each District, are given in Table 4.8.
4.10 Since 2001, pedal cycle factors have been developed from automatic cycle counts to factor 12-hour 2-way cycle flows counted manually to 24-hour average daily flows. These have been combined with the length of each road link to give an estimate of pedal cycle kilometres travelled in a year. Table 4.9 and Figure 4.2 show the trend in pedal cycle kilometres travelled on A and B roads combined since 2001.
Table 4.8 Average and Highest 12-Hour Two-way Cycle Flows on A and B
Roads in Each District, 2007
District Road Class
Average 12-hr Cycle Flow
Highest 12-hr Cycle Flow Location of Highest Cycle Flow
Bolton A 58 165 A673 Chorley New Rd Horwich B 39 110 B6206 Higher Bridge St Bolton Bury A 69 224 A58 Bolton St Bury B 43 148 B6213 Crostons Rd Bury Manchester A 160 981 A34 Oxford Rd Manchester City Centre B 227 771 B5117 Oxford Rd Higher Education Precinct Oldham A 45 135 A62 Oldham Rd Failsworth B 32 93 B6393 Greengate Chadderton Rochdale A 52 120 A664 Rochdale Rd Middleton B 39 93 B6223 Drake St Rochdale Salford A 87 281 A6 Crescent Salford B 85 279 B5211 Redclyffe Rd Trafford Park Stockport A 76 304 A6 Wellington Rd North Heaton Chapel B 86 187 B5169 Broadstone Rd Heaton Chapel Tameside A 66 173 A6017 Stockport Rd Guide Bridge B 43 115 B6169 Shepley Rd Audenshaw Trafford A 141 314 A56 Chester Rd Stretford B 136 647 B5218 Chorlton Rd Old Trafford Wigan A 59 195 A49 Wallgate Wigan B 47 118 B5238 Poolstock Ln Worsley Mesnes
A 86 981 A34 Oxford Rd Manchester City Centre Greater Manchester B 87 771 B5117 Oxford Rd Higher Education Precinct

GMTU Report 1387 Other Road Traffic Statistics
Page 113
Table 4.9 Pedal Cycle Kilometres on A & B Roads 2001-2007
Pedal Cycle Kilometres (millions)
Year A Roads B Roads A & B Roads
A & B Road Index
2001 30.4 11.8 42.1 100 2002 27.6 11.0 38.6 92 2003 25.5 10.8 36.3 86 2004 24.3 10.6 34.9 83 2005 25.9 11.4 37.2 88 2006 25.7 11.5 37.2 88 2007 27.3 12.0 39.4 93
Figure 4.2 Index of A & B Road Pedal Cycle Km 2001-2007
0
20
40
60
80
100
120
2001 2002 2003 2004 2005 2006 2007
Year
Inde
x
A & B Road Pedal Cycle kmBase = 2001

GMTU Report 1387 Other Road Traffic Statistics
Page 114
Automatic Cycle Counts
4.11 GMTU have operated Automatic Cycle Counters (ACC) at a variety of on-road and off-road locations throughout Greater Manchester since 2001. Data from these are used to monitor the LTP, local strategies and transport schemes. In 2007 there were 65 operational sites.
4.12 These sites have been divided into those with a higher weekday than Saturday or Sunday flow (54 commuting sites) and a higher or the same Saturday or Sunday flow as the weekday flow (11 leisure sites). The two sets of sites have different hourly, daily and monthly profiles and these can be seen in Tables 4.10 to 4.15 and Figures 4.3 to 4.5.
4.13 Details of individual sites and cycle flows can be found in the respective Transport Statistics Reports for districts.
Table 4.10 Average Hourly Profile at ACC “Commuting” Sites in 2007
Hour Beginning % of 24-hr Flow
Weekday % of 24-hr Flow
Saturday % of 24-hr Flow
Sunday 00:00 0.7 1.5 1.2 01:00 0.5 1.2 0.9 02:00 0.4 1.1 0.7 03:00 0.3 0.7 0.6 04:00 0.6 1.0 0.9 05:00 2.2 2.0 1.5 06:00 4.2 3.0 1.9 07:00 8.1 4.3 3.2 08:00 8.7 4.9 3.7 09:00 6.1 5.6 6.0 10:00 4.6 6.3 7.0 11:00 4.7 7.3 7.6 12:00 4.9 8.0 8.1 13:00 5.3 7.5 8.0 14:00 5.7 7.4 7.9 15:00 6.5 6.9 8.0 16:00 8.1 6.7 7.1 17:00 9.3 6.3 6.4 18:00 6.5 5.3 5.5 19:00 4.1 3.9 4.1 20:00 3.1 3.0 3.1 21:00 2.4 2.5 2.7 22:00 2.1 2.0 2.4 23:00 1.0 1.4 1.4
Note: based on 54 sites

GMTU Report 1387 Other Road Traffic Statistics
Page 115
Table 4.11 Average Hourly Profile at ACC “Leisure” Sites in 2007
Hour Beginning % of 24-hr Flow
Weekday % 24-hr Flow
Saturday % 24-hr Flow
Sunday 00:00 0.3 0.3 0.3 01:00 0.2 0.3 0.2 02:00 0.1 0.2 0.1 03:00 0.1 0.2 0.1 04:00 0.3 0.4 0.1 05:00 1.1 1.0 0.3 06:00 1.8 0.9 0.3 07:00 6.3 2.2 1.1 08:00 5.2 3.4 2.8 09:00 4.1 4.0 5.3 10:00 4.2 6.0 8.2 11:00 4.9 6.4 9.6 12:00 5.6 8.3 9.8 13:00 5.8 8.6 9.8 14:00 7.0 10.9 11.5 15:00 8.0 12.6 11.3 16:00 9.8 10.4 9.3 17:00 10.4 8.1 7.0 18:00 9.3 6.0 4.8 19:00 7.3 4.3 3.7 20:00 4.6 2.6 2.3 21:00 2.2 1.6 1.0 22:00 0.9 0.9 0.7 23:00 0.6 0.4 0.3
Note: based on 11 sites
Figure 4.3 Average Hourly Cycle Flow Profiles in 2007
0.0
1.0
2.0
3.0
4.0
5.0
6.0
7.0
8.0
00:00
01:00
02:00
03:00
04:00
05:00
06:00
07:00
08:00
09:00
10:00
11:00
12:00
13:00
14:00
15:00
16:00
17:00
18:00
19:00
20:00
21:00
22:00
23:00
Time (Hour Beginning)
Hou
rly P
edal
Cyc
le F
low
Weekday Commuting Saturday Commuting Sunday Commuting
Weekday Leisure Saturday Leisure Sunday Leisure
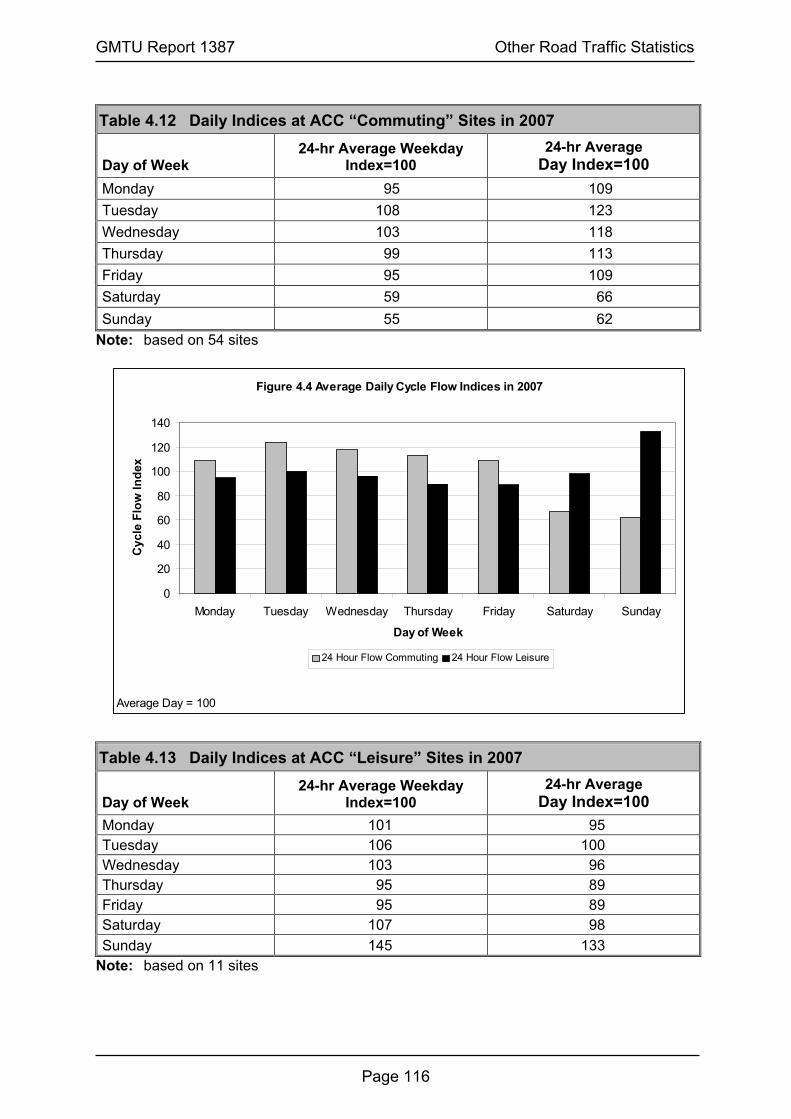
GMTU Report 1387 Other Road Traffic Statistics
Page 116
Table 4.12 Daily Indices at ACC “Commuting” Sites in 2007
Day of Week 24-hr Average Weekday
Index=100 24-hr Average
Day Index=100 Monday 95 109 Tuesday 108 123 Wednesday 103 118 Thursday 99 113 Friday 95 109 Saturday 59 66 Sunday 55 62
Note: based on 54 sites
Table 4.13 Daily Indices at ACC “Leisure” Sites in 2007
Day of Week 24-hr Average Weekday
Index=100 24-hr Average
Day Index=100 Monday 101 95 Tuesday 106 100 Wednesday 103 96 Thursday 95 89 Friday 95 89 Saturday 107 98 Sunday 145 133
Note: based on 11 sites
Figure 4.4 Average Daily Cycle Flow Indices in 2007
0
20
40
60
80
100
120
140
Monday Tuesday Wednesday Thursday Friday Saturday Sunday
Day of Week
Cyc
le F
low
Inde
x
24 Hour Flow Commuting 24 Hour Flow Leisure
Average Day = 100

GMTU Report 1387 Other Road Traffic Statistics
Page 117
Table 4.14 Monthly Indices at ACC “Commuting” Sites in 2007 Month 24-hr Ave Weekday Index=100 24-hr Ave Day Index=100 January 78 78 February 84 84 March 95 95 April 103 106 May 103 103 June 113 114 July 107 108 August 111 111 September 113 113 October 111 111 November 99 97 December 73 72
Note: based on 43 sites Table 4.15 Monthly Indices at ACC “Leisure” Sites in 2007 Month 24-hr Ave Weekday Index=100 24-hr Ave Day Index=100 January 50 51 February 53 63 March 80 82 April 140 148 May 128 122 June 143 145 July 119 116 August 161 147 September 109 108 October 92 97 November 60 62 December 47 47
Note: based on 10 sites.
Figure 4.5 Average Monthly Cycle Flow Indices in 2007
0
20
40
60
80
100
120
140
160
180
200
Jan Feb Mar Apr May Jun Jul Aug Sep Oct Nov Dec
Month
Cyc
le F
low
Inde
x
24 Hr Day Commuting 24 Hour Day LeisureAverage Day, Average Month =100

GMTU Report 1387 Other Road Traffic Statistics
Page 118
Carriage of Cycles on Trains
4.14 Table 4.16 compares the number of cycles carried on trains in the years 2003 to 2007. The numbers relate to cycles carried by passengers boarding and alighting trains on a single day in November between 07:30 and 13:30 at 42 of the busiest stations where GMTU surveys patronage every year.
Table 4.16 Cycles Carried on Trains (Single Day 07:30 to 13:30) 2003 - 2007
2003 2004 2005 2006 2007 Corridor and No of Stations B A B A B A B A B A
Wigan & Bolton 8 23 14 30 26 28 27 23 24 21 29Rochdale & Oldham 4 6 14 7 12 10 8 4 16 7 5Ashton 4 12 2 6 5 3 3 5 3 1 5Marple & Glossop 10 21 18 31 18 28 11 25 10 22 25Stockport 8 31 26 23 21 32 21 44 34 36 30Styal/Airport 5 5 2 5 5 5 3 8 8 12 14Irlam 2 4 4 6 7 8 3 8 3 12 3Eccles 1 1 0 1 1 0 1 0 3 0 2Total 42 103 80 109 95 114 77 117 101 111 113
Notes: B = Boarders A = Alighters

GMTU Report 1387 Other Road Traffic Statistics
Page 119
Cycle Training in Schools
4.15 Table 4.17 shows the number of year 5 pupils in 2006/07 and year 6 pupils in 2007/08 that received ‘on-road’ cycle training by district. This allows the proportion of Year 6 pupils in 2007/08 who have had ‘on-road’ cycle training to be calculated and this is also shown. It is assumed that all pupils who have had ‘on-road' cycle training have also received ‘off-road’ cycle training.
Table 4.17 On-road cycle training by district
District
Number of Year 5 children
trained in 2006/07
Number of Year 6 children
trained in 2007/08
Total number of Year 6 children
in 2007/08
Proportion receiving
training (%)
Bolton 0 793 3350 23.7 Bury 229 451 2080 32.7 Manchester 0 2424 5000 48.5 Oldham 201 305 2975 17.0 Rochdale 200 800 2800 35.7 Salford 136 358 2334 21.2 Stockport 1000 357 3100 43.8 Tameside 48 1550 26000 6.1 Trafford 0 1805 2720 66.4 Wigan 0 605 3692 16.4 GM Total 1814 9448 54051 20.8
Notes: 205 Year 3 pupils in Wigan also received ‘on-road’ training
4.16 Table 4.18 shows the number of year 5 pupils in 2006/07 and year 6 pupils in 2007/08 that have only received ‘off-road’ cycle training by district. This allows the proportion of Year 6 pupils in 2007/08 who have only received ‘off-road’ cycle training to be calculated and this is also shown.
Table 4.18 Off-road cycle training by district
District
Number of Year 5 children
trained in 2006/07
Number of Year 6 children
trained in 2007/08
Total number of Year 6
children in 2007/08
Proportion receiving
training (%)
Bolton 75 76 3350 4.5 Bury 0 0 2080 0.0 Manchester 0 0 5000 0.0 Oldham 0 0 2975 0.0 Rochdale 0 0 2800 0.0 Salford 0 0 2334 0.0 Stockport 0 0 3100 0.0 Tameside 0 0 26000 0.0 Trafford 0 0 2720 0.0 Wigan 0 43 3692 1.2 GM Total 75 119 54051 0.4


5 PUBLIC TRANSPORT


GMTU Report 1387 Public Transport
Page 123
RAIL PATRONAGE
Rail Passenger Counts
5.1 GMTU undertook counts of boarding and alighting rail passengers both inbound towards and outbound from Manchester City Centre in Autumn 2007 at a sample of stations throughout the county.
5.2 A total of 60 railway stations were surveyed. The stations were generally
selected to give the highest percentage of travellers on each corridor for the fewest stations counted. However, in order to update the factors used to estimate patronage for each corridor, surveys are undertaken at all stations on some lines each year. All stations on the Rochdale/Oldham, Irlam, and Ashton corridors were surveyed in 2007.
5.3 A summary of the results of all rail passenger counts undertaken in 2007 is
given in Table 5.1 and a diagram of the rail network in Greater Manchester is given in Figure 5.1. This diagram also shows the most recent count of peak period inbound boarders at each station.

GMTU Report 1387 Public Transport
Page 124
Table 5.1 Boarders and Alighters at 60 Rail Stations Surveyed in 2007
AM Peak 07:30-09:29 Off-Peak 09:30-13:29 Inbound Outbound Inbound Outbound Station Boarders Alighters Boarders Alighters Boarders Alighters Boarders AlightersAshton 221 32 44 47 193 54 30 91 Atherton 238 17 63 6 155 16 57 55 Bolton 1189 454 362 330 1079 399 366 597 Bramhall 183 6 11 28 91 5 2 26 Bredbury 107 8 12 30 102 7 7 25 Bromley Cross 215 28 19 138 81 5 7 25 Burnage 131 0 23 1 53 5 6 9 Castleton 93 15 9 7 54 12 15 27 Chassen Road 50 5 0 1 11 0 0 1 Cheadle Hulme 397 70 74 122 145 11 19 67 Daisy Hill 192 1 47 24 35 6 26 24 Davenport 179 60 2 7 72 18 9 33 Dean Lane 11 0 4 13 25 1 3 17 Derker 18 6 0 13 7 3 4 12 Eccles 20 22 7 22 26 6 11 15 Failsworth 45 1 6 4 20 2 8 5 Flixton 66 0 12 8 13 6 7 9 Flowery Field 112 19 4 35 59 1 9 21 Gatley 218 5 17 31 70 14 9 26 Glazebrook 20 0 6 0 2 0 5 2 Glossop 446 146 0 0 257 135 38 0 Gorton 58 15 6 8 41 10 5 12 Greenfield 177 1 20 5 83 0 5 19 Guide Bridge 146 53 17 15 83 18 12 34 Hadfield 252 0 0 21 149 0 0 62 Hazel Grove 515 20 4 30 182 4 3 73 Heald Green 243 7 52 104 111 11 12 52 Heaton Chapel 499 30 100 16 103 17 35 26 Hollinwood 24 6 7 13 18 1 2 4 Horwich Parkway 208 49 20 102 106 20 13 73 Humphrey Park 33 2 0 0 1 1 0 0 Irlam 170 18 17 28 45 17 23 18 Levenshulme 209 18 53 8 84 13 23 13 Littleborough 167 1 14 9 90 2 7 24 Lostock Junction 249 0 22 3 84 4 9 14 Manchester Airport 0 544 407 0 0 920 848 0 Marple 389 4 4 48 191 5 15 49 Mauldeth Road 161 4 28 6 113 3 8 28 Mills Hill 138 3 23 7 96 4 5 21 Milnrow 44 6 37 4 28 7 29 5 Mossley 220 2 13 8 95 2 4 28 Moston 28 1 5 9 39 5 8 13

GMTU Report 1387 Public Transport
Page 125
Table 5.1 Boarders and Alighters at 60 Rail Stations Surveyed in 2007
AM Peak 07:30-09:29 Off-Peak 09:30-13:29 Inbound Outbound Inbound Outbound New Hey 26 2 13 1 13 4 4 3 Oldham Mumps 128 39 11 38 138 32 43 84 Oldham Werneth 9 4 4 9 23 4 8 2 Reddish North 75 12 22 7 24 2 16 3 Rochdale 506 80 32 83 438 118 26 65 Romiley 240 11 34 20 146 7 11 30 Rose Hill 94 0 0 48 69 0 0 31 Salford Crescent 603 916 99 556 508 548 228 817 Shaw 170 4 5 21 142 10 29 74 Smithy Bridge 111 2 12 5 61 2 7 14 Stalybridge 643 49 102 31 253 62 54 45 Stockport 602 844 1036 429 516 614 732 295 Trafford Park 38 27 11 9 3 0 6 2 Urmston 169 30 29 24 84 17 28 42 Walkden 182 30 40 18 102 13 42 27 Wigan North Western 0 259 334 0 0 419 527 0 Wigan Wallgate 424 97 45 400 569 172 111 450 Woodsmoor 123 22 0 13 36 4 13 20
Notes:
1. Glossop outbound patronage refers to patronage to Hadfield 2. Manchester Airport patronage refers to patronage to and from Manchester Airport 3. Rochdale inbound patronage includes patronage via Oldham 4. Wigan North Western patronage refers to patronage to and from Wigan North Western. Only two AM
peak trains travelled inbound to Manchester. These had 33 boarders and 25 alighters. There was one train outbound from Manchester, this had 13 boarders and 38 alighters.

(
(
(
(
(
(
(
(
(
( (
(
(
(
(
((
(((
( (
( ( (
(
(
(
(
(
((
(
(
(
(
((
(
(
(
( (
(
((
(
(
(
(
(
(
(
((
(
(
(
(
(
(
(
(
(
((
(
(
(
(
(
(
(
(
(
(
(
(
(
(
(
(
((
(
(
(
(
(
(
((
(
((
(
(
(
(
(
(
(
(
(
(
(
(
(
((
((
(
(
(
((
((
(
(
(
(
(
((
(
(
(
(
(
((
(
(
(
((
((
(((
((
(
(
(
(
(
(
(
(
(
((
(
(
(
((
(
(
((
(
(
((
(
((
(
Urm
sto
n
Ne
whe
y
Altr
incha
m
Wig
an
No
rth W
este
rn
Hum
phre
yP
ark
Sa
lford
Ce
ntr
al
Altr
incha
m M
L
Na
vig
atio
n R
d M
L
33
16
7
50
6
93
28
44
26
17
0
12
8
9
24
45
11
17
7
22
0
64
32
21
36
39
13
2
52
11
91
46
85
8
38
9
94
24
01
07
75
2
38
34
31
1
51
5
17
9
18
3
39
7
60
2
49
9
20
9
24
3
21
8
11
9
13
1
16
1
35
86
8
37
6
40
8
69
4
20
48
01
47
32
81
00
10
1
17
0
66
50
16
93
33
8
17
16
31
48
42
41
01
11 1
92
23
81
82
30
41
21
5
11
89
31
29
27
13
7
95
51
4
50
4
42
5
25
1
22
6
15
6
26
7
25
0
71
61
44
6
25
2
84
20
18
11
1
13
8
11
2
11
43
21
60
3
24
9
12
3
40
7
76
99
37
3
98
93
24
60
45
83
99
75
20
8
25
23
De
ansga
te
Ho
llinw
oo
d
Ashto
n
Bre
dbury
Mid
dle
wo
od
Wa
llga
te
Ath
ert
on
Mo
ors
ide
Din
ting
Flo
we
ry F
ield
Ha
rbo
ur
City
Co
rnbro
ok
Little
bo
rough
Ca
stle
ton
Mo
sto
n
Sha
w
Gre
enfie
ld
Bri
nnin
gto
n
Ha
tte
rsle
y
Go
dle
y
Ro
se
Hill
Re
ddis
h N
ort
h
Be
lle V
ue
Wo
odle
y
Hyde
Ce
ntr
al
Hyde
No
rth
Da
ve
npo
rt
He
ato
n C
ha
pe
l
Le
ve
nshulm
eT
raff
ord
Ba
r
Bro
mle
y C
ross
Mo
se
s G
ate
Fa
rnw
ort
h Ke
ars
ley
Clif
ton
Wo
odla
nds R
d
Ha
dfie
ld
Ex
Buxt
on
De
rke
r
Sm
ithy B
ridge
Mill
s H
ill
Ryde
r B
row
Ha
ll It
h W
oo
d
Ha
g F
old
Sa
lford
Cre
sce
nt
Pic
ca
dill
y G
dns
Ex
Bra
dfo
rd
Ex
Hudde
rsfie
ld
Ex
Sto
keE
x C
rew
e
Ex
Cre
we
Ex
St
He
lens
Ex
Pre
sto
n
Ex
Liv
erp
oo
l
Ex
Bla
ckb
urn
Ancho
rage
Sa
lford
Qua
ys
Exc
ha
nge
Qua
y
Po
mo
na
Na
vig
atio
n R
d
Old
ha
m M
um
ps
We
rne
th
Bro
adbo
tto
m
Bra
mha
ll
Che
adle
Hulm
e
He
ald
Gre
en
Ga
tley
Ea
st
Did
sbury
Burn
age
Ma
uld
eth
Ro
ad
Str
etf
ord
Cha
sse
n R
oa
d
Pe
mbe
rto
n
Ga
thurs
t
Bla
ckr
od
Ra
dclif
fe
White
fie
ld
Be
sse
s
Pre
stw
ich
He
ato
n P
ark
Air
po
rt
Ex
Ne
wto
n
Ex
Pre
sto
n
La
ngw
ort
hy
Eccle
s M
etr
olin
k
La
dyw
ell
We
aste
Bro
adw
ay
Ho
rwic
h P
ark
wa
y
Pic
ca
dill
y
Miln
row
Fa
ilsw
ort
h
Ard
wic
kN
ew
ton
Fa
irfie
ldG
ort
on
Ma
rple
Ashbury
s
Eccle
s
Sa
le
Tra
ffo
rd P
ark
Pa
tric
roft
Wa
lkde
nS
win
ton
Bury
G M
ex
Apple
y B
ridge
Vic
tori
a
Guid
e B
ridge
Ex
She
ffie
ld
Oxf
ord
Rd
Ro
chda
le
De
an L
ane
Mo
ssle
y
Sta
lybri
dge
Ro
mile
y
Ha
zel G
rove
Sto
ckp
ort
Ha
le
Tim
pe
rle
y
Bro
okl
ands
Da
ne
Rd
Old
Tra
ffo
rdIr
lam
Flix
ton
Orr
ell
Ince
Hin
dle
y
Da
isy H
ill
Bo
lton
We
sth
oughto
n
Bo
wke
r V
ale
Cru
mpsa
ll
Bry
n
Glo
sso
p
Wo
odsm
oo
r
Ex
Che
ste
r
Ex
Wa
rrin
gto
n
Lo
sto
ck
Gla
zebro
ok
GM
TU
SA
LIS
BU
RY
HO
US
EG
RA
NB
Y R
OW
MA
NC
HE
ST
ER
M
1 7
AH
Dra
wn B
y :
Dan W
esto
nS
cale
: N
ot
To S
cale
Date
: 0
6/0
2/2
008
Fig
ure
: 5
.1
Rail
& M
etr
olin
k P
eak (
07:3
0-0
9:3
0)M
cr
Bound B
oard
ers
at
sta
tions insid
e t
he G
MP
TE
Are
a 2
005-2
007
Wig
an &
Bolton
Bury
Rochdale
&O
ldham
Eccle
s
Irla
m
Altrincham
Sty
al
Sto
ckport
Marp
le &
Glo
ssop
Ashto
n
Metr
olin
k
Inbound B
oard
ers
(1200
(600
(120

GMTU Report 1387 Public Transport
Page 127
Rail Patronage by Corridor
5.4 Tables 5.2 and 5.3 show the inbound (towards Manchester City Centre) rail boarders on each corridor in the years 1991 and 1998 to 2007 for the peak and off-peak periods respectively. Figure 5.2 illustrates trends in patronage for north side, south side and all Greater Manchester inbound rail boarders in the peak and off-peak periods from 1991 to 2007. The information for 1998 to 2007 is also shown graphically in Figures 5.3 and 5.4 by corridor.
5.5 Tables 5.4 to 5.9 show numbers of rail boarders travelling towards
Manchester City Centre on the Ashton, Irlam and Rochdale/Oldham corridors respectively. All stations on these corridors were counted in 2007.
Table 5.2 Manchester Bound Boarders by Corridor 1991 and 1998-2007 (excluding the Eccles Corridor) Peak Period (07:30-09:30)
Line/Corridor 1991 1998 1999 2000 2001 2002 2003 2004 2005 2006 2007 Wigan/Bolton 2541 2809 3306 3356 3624 2970 3338 3574 3898 3937 4444
Rochdale/Oldham 1200 1031 1268 1377 1383 1133 1322 1572 1619 1437 1518
Ashton 407 762 931 871 930 1046 1061 1230 1273 1268 1261
North Side Total 4148 4602 5505 5604 5937 5149 5721 6376 6790 6642 7223
Patronage Index 100 111 133 135 143 124 138 154 164 160 174
% Total Patronage 42 47 49 50 53 50 50 51 51 49 50
Marple/Glossop 2111 2033 2173 2280 2026 1793 2038 2270 2400 2335 2539
Stockport 2633 2242 2396 2175 2152 2218 2392 2216 2513 2576 2801
Styal Excl. Airport 505 499 523 568 550 460 616 709 802 807 884
Airport N/A 196 213 178 256 222 282 429 298 455 407
Irlam 411 305 367 366 369 380 399 399 483 607 546
South Side Total 5660 5275 5672 5567 5353 5073 5727 6023 6496 6780 7177
Patronage Index 100 93 100 98 95 90 101 106 115 120 127
% Total Patronage 58 53 51 50 47 50 50 49 49 51 50
Grand Total 9808 9877 11177 11171 11290 10222 11448 12399 13286 13422 14400
Patronage Index 100 101 114 114 115 104 117 126 135 137 147 Notes: Figures for 1991 are based on full counts at every station in each corridor. 1998 to 2007 figures are generally estimates based on all available station counts in each year. However, almost all stations in the GMPTE area have been counted in the last three years, the Marple/Glossop and Stockport lines in 2005, the Wigan/Bolton line in 2006, and the Rochdale/Oldham and Irlam lines in 2007. All stations on the Ashton line have been counted in 2005, 2006 and 2007. Manchester Airport rail station opened in 1993. Note on Industrial Action: There was sustained industrial action in 2002 by employees of First North Western and Arriva. While an attempt was made to avoid actual strike days the work to rule by First North Western staff in particular may have had an effect on passenger numbers.
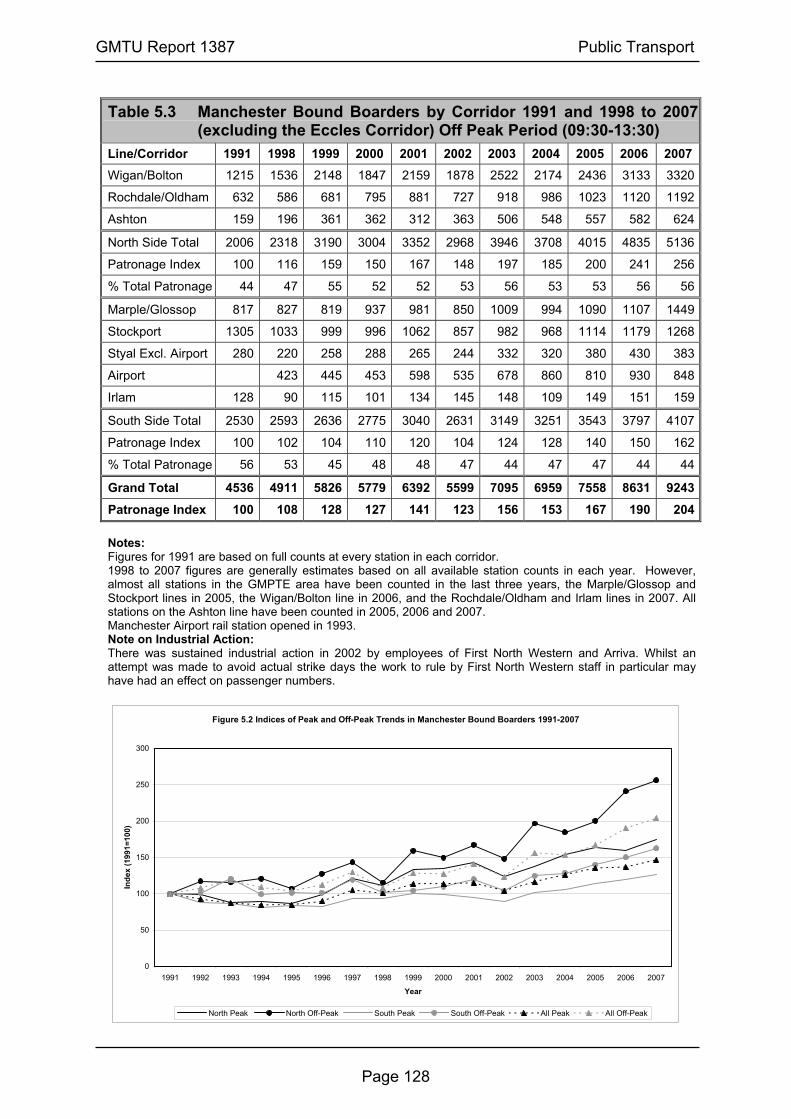
GMTU Report 1387 Public Transport
Page 128
Table 5.3 Manchester Bound Boarders by Corridor 1991 and 1998 to 2007
(excluding the Eccles Corridor) Off Peak Period (09:30-13:30) Line/Corridor 1991 1998 1999 2000 2001 2002 2003 2004 2005 2006 2007 Wigan/Bolton 1215 1536 2148 1847 2159 1878 2522 2174 2436 3133 3320
Rochdale/Oldham 632 586 681 795 881 727 918 986 1023 1120 1192
Ashton 159 196 361 362 312 363 506 548 557 582 624
North Side Total 2006 2318 3190 3004 3352 2968 3946 3708 4015 4835 5136
Patronage Index 100 116 159 150 167 148 197 185 200 241 256
% Total Patronage 44 47 55 52 52 53 56 53 53 56 56
Marple/Glossop 817 827 819 937 981 850 1009 994 1090 1107 1449
Stockport 1305 1033 999 996 1062 857 982 968 1114 1179 1268
Styal Excl. Airport 280 220 258 288 265 244 332 320 380 430 383
Airport 423 445 453 598 535 678 860 810 930 848
Irlam 128 90 115 101 134 145 148 109 149 151 159
South Side Total 2530 2593 2636 2775 3040 2631 3149 3251 3543 3797 4107
Patronage Index 100 102 104 110 120 104 124 128 140 150 162
% Total Patronage 56 53 45 48 48 47 44 47 47 44 44
Grand Total 4536 4911 5826 5779 6392 5599 7095 6959 7558 8631 9243
Patronage Index 100 108 128 127 141 123 156 153 167 190 204 Notes: Figures for 1991 are based on full counts at every station in each corridor. 1998 to 2007 figures are generally estimates based on all available station counts in each year. However, almost all stations in the GMPTE area have been counted in the last three years, the Marple/Glossop and Stockport lines in 2005, the Wigan/Bolton line in 2006, and the Rochdale/Oldham and Irlam lines in 2007. All stations on the Ashton line have been counted in 2005, 2006 and 2007. Manchester Airport rail station opened in 1993. Note on Industrial Action: There was sustained industrial action in 2002 by employees of First North Western and Arriva. Whilst an attempt was made to avoid actual strike days the work to rule by First North Western staff in particular may have had an effect on passenger numbers.
Figure 5.2 Indices of Peak and Off-Peak Trends in Manchester Bound Boarders 1991-2007
0
50
100
150
200
250
300
1991 1992 1993 1994 1995 1996 1997 1998 1999 2000 2001 2002 2003 2004 2005 2006 2007
Year
Inde
x (1
991=
100)
North Peak North Off-Peak South Peak South Off-Peak All Peak All Off-Peak

GMTU Report 1387 Public Transport
Page 129
Figure 5.3 Rail Peak Period Patronage by Corridor 1998 to 2007
0
500
1000
1500
2000
2500
3000
3500
4000
4500
1998 1999 2000 2001 2002 2003 2004 2005 2006 2007
Year
Man
ches
ter B
ound
Boa
rder
s (0
9:30
-13:
30) Wigan/Bolton
Stockport
Marple/Glossop
Rochdale/Oldham
Styal (inc. Airport)
Ashton
Irlam
Figure 5.4 Rail Off-Peak Period Patronage by Corridor 1998 to 2007
0
500
1000
1500
2000
2500
3000
3500
4000
4500
1998 1999 2000 2001 2002 2003 2004 2005 2006 2007
Year
Man
ches
ter B
ound
Boa
rder
s (0
9:30
-13:
30) Wigan/Bolton
Marple/Glossop
Stockport
Styal (inc. Airport)
Rochdale/Oldham
Ashton
Irlam
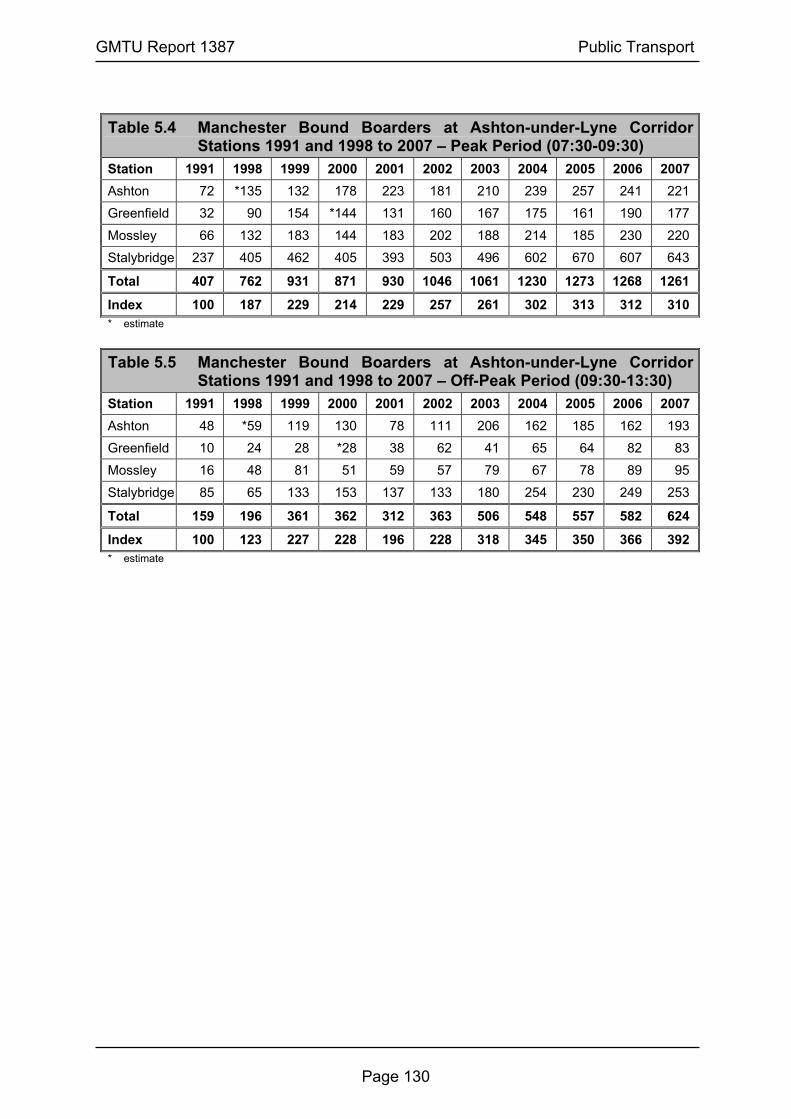
GMTU Report 1387 Public Transport
Page 130
Table 5.4 Manchester Bound Boarders at Ashton-under-Lyne Corridor
Stations 1991 and 1998 to 2007 – Peak Period (07:30-09:30) Station 1991 1998 1999 2000 2001 2002 2003 2004 2005 2006 2007 Ashton 72 *135 132 178 223 181 210 239 257 241 221
Greenfield 32 90 154 *144 131 160 167 175 161 190 177
Mossley 66 132 183 144 183 202 188 214 185 230 220
Stalybridge 237 405 462 405 393 503 496 602 670 607 643
Total 407 762 931 871 930 1046 1061 1230 1273 1268 1261
Index 100 187 229 214 229 257 261 302 313 312 310 * estimate
Table 5.5 Manchester Bound Boarders at Ashton-under-Lyne Corridor
Stations 1991 and 1998 to 2007 – Off-Peak Period (09:30-13:30) Station 1991 1998 1999 2000 2001 2002 2003 2004 2005 2006 2007 Ashton 48 *59 119 130 78 111 206 162 185 162 193
Greenfield 10 24 28 *28 38 62 41 65 64 82 83
Mossley 16 48 81 51 59 57 79 67 78 89 95
Stalybridge 85 65 133 153 137 133 180 254 230 249 253
Total 159 196 361 362 312 363 506 548 557 582 624
Index 100 123 227 228 196 228 318 345 350 366 392 * estimate

GMTU Report 1387 Public Transport
Page 131
Table 5.6 Manchester Bound Boarders at Irlam Corridor Stations 1991 and 1998 to 2007 – Peak Period (0730-0930)
Station 1991 1998 1999 2000 2001 2002 2003 2004 2005 2006 2007Chassen Road 36 25 26 36 50 Flixton 43 30 37 32 54 54 61 66 Glazebrook 28 19 21 13 20 Humphrey Park 38 19 17 32 33 Irlam 125 98 129 142 128 103 110 123 140 199 170 Trafford Park 10 10 8 19 38 Urmston 131 104 113 104 115 147 157 115 148 163 169 Total 411 305 369 399 546 Index 100 74 90 97 133
Table 5.7 Manchester Bound Boarders at Irlam Corridor Stations 1991 and 1998 to 2007 – Off-Peak Period (0930-1330)
Station 1991 1998 1999 2000 2001 2002 2003 2004 2005 2006 2007Chassen Road 16 5 13 5 11 Flixton 24 10 15 14 7 13 18 13 Glazebrook 4 3 5 1 2 Humphrey Park 11 2 8 2 1 Irlam 33 29 29 21 30 48 43 32 50 37 45 Trafford Park 10 4 7 3 3 Urmston 30 37 53 50 64 54 61 48 59 74 84 Total 128 90 134 109 159 Index 100 70 105 85 124
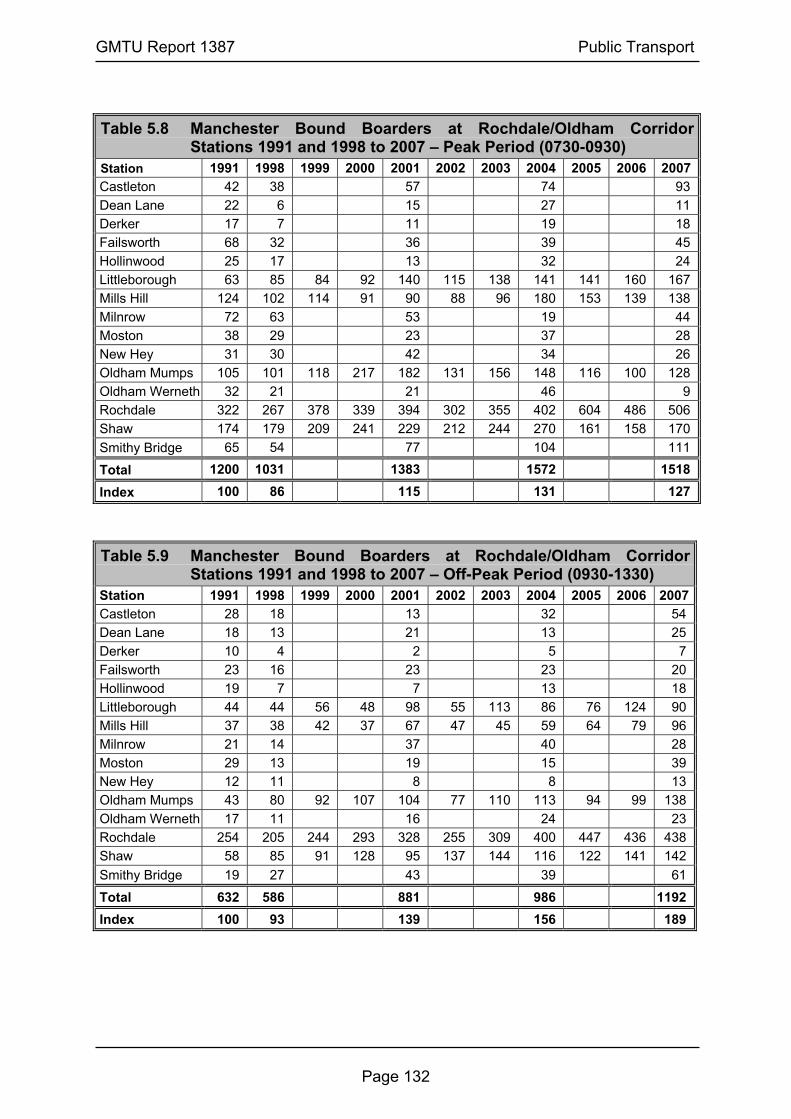
GMTU Report 1387 Public Transport
Page 132
Table 5.8 Manchester Bound Boarders at Rochdale/Oldham Corridor
Stations 1991 and 1998 to 2007 – Peak Period (0730-0930) Station 1991 1998 1999 2000 2001 2002 2003 2004 2005 2006 2007Castleton 42 38 57 74 93 Dean Lane 22 6 15 27 11 Derker 17 7 11 19 18 Failsworth 68 32 36 39 45 Hollinwood 25 17 13 32 24 Littleborough 63 85 84 92 140 115 138 141 141 160 167 Mills Hill 124 102 114 91 90 88 96 180 153 139 138 Milnrow 72 63 53 19 44 Moston 38 29 23 37 28 New Hey 31 30 42 34 26 Oldham Mumps 105 101 118 217 182 131 156 148 116 100 128 Oldham Werneth 32 21 21 46 9 Rochdale 322 267 378 339 394 302 355 402 604 486 506 Shaw 174 179 209 241 229 212 244 270 161 158 170 Smithy Bridge 65 54 77 104 111
Total 1200 1031 1383 1572 1518 Index 100 86 115 131 127 Table 5.9 Manchester Bound Boarders at Rochdale/Oldham Corridor
Stations 1991 and 1998 to 2007 – Off-Peak Period (0930-1330) Station 1991 1998 1999 2000 2001 2002 2003 2004 2005 2006 2007Castleton 28 18 13 32 54 Dean Lane 18 13 21 13 25 Derker 10 4 2 5 7 Failsworth 23 16 23 23 20 Hollinwood 19 7 7 13 18 Littleborough 44 44 56 48 98 55 113 86 76 124 90 Mills Hill 37 38 42 37 67 47 45 59 64 79 96 Milnrow 21 14 37 40 28 Moston 29 13 19 15 39 New Hey 12 11 8 8 13 Oldham Mumps 43 80 92 107 104 77 110 113 94 99 138 Oldham Werneth 17 11 16 24 23 Rochdale 254 205 244 293 328 255 309 400 447 436 438 Shaw 58 85 91 128 95 137 144 116 122 141 142 Smithy Bridge 19 27 43 39 61
Total 632 586 881 986 1192 Index 100 93 139 156 189

GMTU Report 1387 Public Transport
Page 133
METROLINK PATRONAGE
Metrolink Passenger Counts 2007
5.6 Counts of boarding and alighting passengers were undertaken at all Metrolink stations outside the Manchester City Centre ‘Central Zone’ in 2007. Passengers travelling both inbound towards and outbound away from Manchester were counted. Tables 5.10 to 5.12 give a summary of all Metrolink counts undertaken in Autumn 2007 on the Altrincham, Bury and Eccles lines respectively. Counts of inbound peak period boarders at each station are included in the diagram of the rail and Metrolink network (Figure 5.1).
Table 5.10 Boarders and Alighters on the Altrincham Line Surveyed in Autumn 2007
AM Peak 07:30-09:30 Mcr Bound Alt Bound Both Directions Station Boarders Alighters Boarders Alighters Boarders Alighters All Altrincham 868 0 0 949 868 949 1817 Navigation Road 376 10 41 145 417 155 572 Timperley 408 15 186 159 594 174 768 Brooklands 694 61 338 94 1032 155 1187 Sale 480 101 298 177 778 278 1056 Dane Road 147 16 65 34 212 50 262 Stretford 328 137 325 83 653 220 873 Old Trafford 100 133 91 259 191 392 583 Trafford Bar 101 77 99 280 200 357 557 Cornbrook Alt 50 117 103 37 153 154 307 Total 3552 667 1546 2217 5098 2884 7982
Off-peak 09:30-13:30 Mcr Bound Alt Bound Both Directions Station Boarders Alighters Boarders Alighters Boarders Alighters All Altrincham 952 0 0 666 952 666 1618 Navigation Road 238 65 80 172 318 237 555 Timperley 320 94 86 205 406 299 705 Brooklands 335 75 104 132 439 207 646 Sale 584 244 223 299 807 543 1350 Dane Road 102 23 33 65 135 88 223 Stretford 468 169 197 220 665 389 1054 Old Trafford 225 114 109 182 334 296 630 Trafford Bar 183 93 114 178 297 271 568 Cornbrook Alt 49 124 96 67 145 191 336 Total 3456 1001 1042 2186 4498 3187 7685

GMTU Report 1387 Public Transport
Page 134
Table 5.11 Boarders and Alighters on the Bury Line Surveyed in Autumn 2007AM Peak 07:30-09:30 Mcr Bound Bury Bound Both Directions Station Boarders Alighters Boarders Alighters Boarders Alighters All Bury Interchange 514 0 0 809 514 809 1323 Radcliffe 504 26 185 73 689 99 788 Whitefield 425 38 137 38 562 76 638 Besses O'th'Barn 251 14 85 15 336 29 365 Prestwich 226 51 130 168 356 219 575 Heaton Park 156 198 80 29 236 227 463 Bowker Vale 267 13 187 25 454 38 492 Crumpsall 250 60 135 84 385 144 529 Woodlands Road 71 14 62 74 133 88 221 Total 2664 414 1001 1315 3665 1729 5394
Off-peak 09:30-13:30 Mcr Bound Bury Bound Both Directions Station Boarders Alighters Boarders Alighters Boarders Alighters All Bury Interchange 960 0 0 1043 960 1043 2003 Radcliffe 288 143 179 132 467 275 742 Whitefield 267 90 151 122 418 212 630 Besses O'th'Barn 147 36 94 88 241 124 365 Prestwich 313 108 163 163 476 271 747 Heaton Park 136 74 132 53 268 127 395 Bowker Vale 184 45 101 69 285 114 399 Crumpsall 371 62 80 128 451 190 641 Woodlands Road 86 24 57 61 143 85 228 Total 2752 582 957 1859 3709 2441 6150
Table 5.12 Boarders and Alighters on the Eccles Line Surveyed in Autumn 2007
AM Peak 07:30-09:30 Mcr Bound Eccles Bound Both Directions Station Boarders Alighters Boarders Alighters Boarders Alighters All Eccles ML 373 0 0 90 373 90 463 Ladywell 98 1 14 67 112 68 180 Weaste 93 17 28 67 121 84 205 Langworthy 99 16 18 81 117 97 214 Broadway 24 32 10 88 34 120 154 Harbour City 60 32 1 221 61 253 314 Anchorage 45 37 18 219 63 256 319 Salford Quays 83 32 32 140 115 172 287 Exchange Quay 99 100 26 455 125 555 680 Pomona 0 2 0 8 0 10 10 Cornbrook Ecc 25 72 172 19 197 91 288 Total 999 341 319 1455 1318 1796 3114
Off-peak 09:30-13:30 Mcr Bound Eccles Bound Both Directions Station Boarders Alighters Boarders Alighters Boarders Alighters All Eccles ML 363 0 0 263 363 263 626 Ladywell 131 18 20 73 151 91 242 Weaste 81 37 54 43 135 80 215 Langworthy 83 36 53 68 136 104 240 Broadway 56 29 22 68 78 97 175 Harbour City 92 29 5 173 97 202 299 Anchorage 65 25 15 76 80 101 181 Salford Quays 76 22 33 102 109 124 233 Exchange Quay 110 14 21 145 131 159 290 Pomona 8 5 0 7 8 12 20 Cornbrook Ecc 21 63 151 28 172 91 263 Total 1086 278 374 1046 1460 1324 2784

GMTU Report 1387 Public Transport
Page 135
The Altrincham Line
5.7 The Altrincham rail line, operated by British Rail, closed in December 1991 and reopened on 15 June 1992 as Metrolink.
5.8 Counts of passengers boarding Manchester bound trams in 1992 and 1998 to 2007 are given in Tables 5.13 and 5.14. Patronage figures for the Altrincham rail line were last reported in GMTU Report 641 ‘Transport Statistics Greater Manchester 1999’.
5.9 Figures 5.5 and 5.6 show trends in peak and off-peak Manchester bound Metrolink patronage at each station. On the day of the 2007 counts, the Altrincham line was affected by a problem with a crossing barrier at Navigation Road, and four Altrincham bound trams turned at Timperley. The line was closed from July 2nd until August 28th 2007 for track upgrade work.
Table 5.13 Weekday Peak Manchester Bound Boarders on the Altrincham Metrolink Line (07:30-09:30)
Metrolink
Station 1992 1998 1999 2000 2001 2002 2003 2004 2005 2006 2007Altrincham 518 972 937 988 1000 762 776 831 893 933 868Navigation Rd 172 426 435 426 378 376 422 416 262 351 376Timperley 257 366 412 401 419 386 422 380 405 410 408Brooklands 403 659 636 637 646 676 690 664 746 933 694Sale 331 567 545 558 582 579 566 722 453 549 480Dane Rd 98 147 163 156 138 176 191 149 120 160 147Total 1779 3137 3128 3166 3163 2955 3067 3162 2879 3336 2973
Outer Area (Zones F and G)
Index 100 176 176 178 178 166 172 178 162 188 167Stretford 141 476 404 536 411 393 410 333 383 413 328Old Trafford 88 159 128 157 145 122 126 113 102 142 100Trafford Bar 63 163 175 149 134 133 170 154 122 151 101Cornbrook Alt* N/A N/A N/A 9 4 4 2 3 17 38 50Total 292 798 707 851 694 652 708 603 624 744 579
Inner Area (Zone E)
Index 100 273 242 291 238 223 242 207 214 255 198Total 2071 3935 3835 4017 3857 3607 3775 3765 3503 4080 3552All
Stations Index 100 190 185 194 186 174 182 182 169 197 172
* Cornbrook station opened in Dec. 1999 with the Eccles extension. Street access available only from Sept. 2005.
Figure 5.5 Manchester Bound Boarders on the Altrincham Line in the Peak Period
0
500
1000
1500
2000
2500
3000
3500
4000
4500
1998 1999 2000 2001 2002 2003 2004 2005 2006 2007
Year
Man
ches
ter B
ound
Boa
rder
s (0
730-
0930
)
All StationsOuter StationsInner Stations

GMTU Report 1387 Public Transport
Page 136
Table 5.14 Weekday Off-Peak Manchester Bound Boarders on the Altrincham
Metrolink Line (09:30-13:30) Metrolink Station 1992 1998 1999 2000 2001 2002 2003 2004 2005 2006 2007
Altrincham 692 726 1053 919 776 848 757 679 876 993 952Navigation Rd 108 126 227 184 201 156 194 201 168 224 238Timperley 181 215 265 267 229 267 236 259 312 311 320Brooklands 190 259 396 308 300 257 277 290 323 417 335Sale 371 450 634 555 527 478 476 508 543 587 584Dane Rd 75 85 104 108 103 86 110 85 121 120 102Total 1617 1861 2679 2341 2136 2092 2050 2022 2343 2652 2531
Outer Area
Index 100 115 166 145 132 129 127 125 145 164 157Stretford 159 362 528 419 443 394 401 382 395 475 468Old Trafford 150 200 214 196 206 213 215 233 255 204 225Trafford Bar 144 209 248 217 182 235 206 204 193 212 183Cornbrook Alt* N/A N/A N/A 21 13 9 11 17 32 54 49Total 453 771 990 853 844 851 833 836 875 945 925
Inner Area
Index 100 170 219 188 186 188 184 185 193 209 204Total 2070 2632 3669 3194 2980 2943 2883 2858 3218 3597 3456All
Stations Index 100 127 177 154 144 142 139 138 155 174 167* Cornbrook station opened in Dec. 1999 with the Eccles extension. Street
access available only from Sept. 2005.
Figure 5.6 Manchester Bound Boarders on the Altrincham Line in the Off-Peak Period
0
500
1000
1500
2000
2500
3000
3500
4000
4500
1998 1999 2000 2001 2002 2003 2004 2005 2006 2007
Year
Man
ches
ter B
ound
Boa
rder
s (0
930-
1330
)
All StationsOuter StationsInner Stations

GMTU Report 1387 Public Transport
Page 137
The Bury Line
5.10 The former Bury to Manchester rail line closed in August 1991 and reopened on 6 April 1992 as Metrolink.
5.11 Counts of peak period passengers boarding Manchester bound trams in 1992 and 1998 to 2007 are given in Tables 5.15 and 5.16. Figures 5.7 and 5.8 show trends in Manchester bound peak and off-peak patronage at each station. Patronage figures for the Bury rail line, before its conversion to Metrolink, can be found in GMTU Report 641 ‘Transport Statistics Greater Manchester 1999’. Bury Metrolink line was closed for major track upgrade work from the 29th of May until the 13th of September in 2007 for major track upgrade work.
Table 5.15 Weekday Peak Inbound Boarders on the Bury Metrolink Line (07:30-09:30)
Metrolink Station 1992 1998 1999 2000 2001 2002 2003 2004 2005 2006 2007
Bury 497 889 874 811 709 756 811 761 671 638 514Radcliffe 305 641 675 653 571 531 577 674 572 597 504Whitefield 237 383 374 478 390 418 421 402 405 477 425Besses o’th’ Barn 178 327 282 263 266 282 281 307 284 279 251Prestwich 162 365 354 406 279 266 259 289 221 257 226Heaton Park 91 218 212 175 181 158 155 242 173 152 156Total 1470 2823 2771 2786 2396 2411 2504 2675 2326 2400 2076
Outer Area)
Index 100 192 189 190 163 164 170 182 158 163 141Bowker Vale 190 318 320 300 292 272 212 293 265 273 267Crumpsall 251 359 413 305 292 234 249 228 239 287 250Woodlands Rd 55 107 84 75 68 68 73 74 68 59 71Total 496 784 817 680 652 574 534 595 572 619 588
Inner Area
Index 100 158 165 137 131 116 108 120 115 125 119Total 1966 3607 3588 3466 3048 2985 3038 3270 2898 3019 2664All
Stations Index 100 183 183 176 155 152 155 166 147 154 136
Figure 5.7 Manchester Bound Boarders on the Bury Line in the Peak Period
0
500
1000
1500
2000
2500
3000
3500
4000
1998 1999 2000 2001 2002 2003 2004 2005 2006 2007
Year
Man
ches
ter B
ound
Boa
rder
s (0
730-
0930
)
All StationsOuter StationsInner Stations

GMTU Report 1387 Public Transport
Page 138
Table 5.16 Weekday Off-Peak Inbound Boarders on the Bury Metrolink Line
(09:30-13:30) Metrolink
Station 1992 1998 1999 2000 2001 2002 2003 2004 2005 2006 2007Bury 732 926 1035 821 806 770 970 947 1137 961 960Radcliffe 188 240 276 240 228 236 263 276 326 276 288Whitefield 189 266 297 281 250 214 252 258 300 305 267Besses o’th’ Barn 126 147 137 141 128 136 148 143 141 155 147
Prestwich 256 338 328 343 318 269 284 301 314 304 313Heaton Park 101 127 164 161 123 136 143 93 114 130 136Total 1592 2044 2237 1987 1853 1761 2060 2018 2332 2131 2111
Outer Area
Index 100 128 141 125 116 111 129 127 146 134 133Bowker Vale 147 167 168 181 165 155 165 170 178 165 184Crumpsall 278 339 336 317 290 253 277 335 324 380 371Woodlands Rd 64 117 104 100 114 157 90 76 111 100 86Total 489 623 608 598 569 565 532 581 613 645 641
Inner Area
Index 100 127 124 122 116 116 109 119 125 132 131Total 2081 2667 2845 2585 2422 2326 2592 2599 2945 2776 2752All
Stations Index 100 128 137 124 116 112 125 125 142 133 132
Figure 5.8 Manchester Bound Boarders on the Bury Line in the Off-Peak Period
0
500
1000
1500
2000
2500
3000
3500
4000
1998 1999 2000 2001 2002 2003 2004 2005 2006 2007
Year
Man
ches
ter B
ound
Boa
rder
s (0
930-
1330
)
All StationsOuter StationsInner Stations
GMTU Report 1387 Public Transport
Page 139
The Eccles Line
5.12 The Metrolink extension to Salford Quays and Eccles opened in two stages. The first section to Broadway opened on 6 December 1999. The second section from Broadway to Eccles opened on 21 July 2000.
5.13 The Eccles line joins the Altrincham line at Cornbrook, which up until September 2005 was an interchange station only for passengers transferring between the two lines and had no pedestrian access.
5.14 Whereas the Bury and Altrincham lines have their main passenger flows to the regional centre in the morning peak, this is not true of the Eccles line, which serves Salford Quays. The following tables are therefore presented in a different format to the tabulations for the other Metrolink lines so that Manchester bound boarders and Eccles bound alighters can be identified.
5.15 Counts of peak period passengers boarding Manchester bound and alighting Eccles bound trams are given in Tables 5.17 and 5.18 for 2000 to 2007. Figures 5.9 and 5.10 show the corresponding trends in peak patronage at each station. Counts of off-peak passengers boarding Manchester bound and alighting Eccles bound trams are given in Tables 5.19 and 5.20 for 2000 to 2007. Figures 5.11 and 5.12 show the corresponding trends in off-peak patronage at each station.

GMTU Report 1387 Public Transport
Page 140
Table 5.17 Weekday Peak Manchester Bound Boarders on the Eccles
Metrolink Line (07:30-09:30)
Station 2000 2001 2002 2003 2004 2005 2006 2007Eccles 204 245 245 272 318 284 339 373Ladywell 29 62 76 99 111 105 110 98Weaste 38 57 54 53 72 102 106 93Langworthy 79 100 89 86 127 158 125 99Total 350 464 464 510 628 649 680 663
Outer Area
Index 100 133 133 146 179 185 194 189Broadway 8 4 5 3 3 14 12 24Harbour City 12 13 8 14 18 29 30 60Anchorage 42 39 41 45 43 38 46 45Salford Quays 51 62 49 85 66 78 74 83Exchange Quay 47 42 57 48 39 34 55 99Pomona 0 13 1 2 3 4 1 0Cornbrook Ecc 2 3 2 0 4 11 17 25Total 162 176 163 197 176 208 235 336
Inner Area
Index 100 109 101 122 109 128 145 207Total 512 640 627 707 804 857 915 999All Stations Index 100 125 122 138 157 167 179 195
Figure 5.9 Manchester Bound Boarders on the Eccles Line in the Peak Period
0
200
400
600
800
1000
1200
1400
1600
2000 2001 2002 2003 2004 2005 2006 2007
Year
Man
ches
ter b
ound
boa
rder
s (0
730-
0930
)
All StationsOuter StationsInner Stations

GMTU Report 1387 Public Transport
Page 141
Table 5.18 Weekday Peak Eccles Bound Alighters on the Eccles Metrolink
Line (07:30-09:30)
Station 2000 2001 2002 2003 2004 2005 2006 2007Eccles 81 77 110 88 97 94 95 90Ladywell 28 23 34 33 46 39 40 67Weaste 30 46 42 55 56 76 66 67Langworthy 23 18 29 26 82 74 98 81Total 162 164 215 202 281 283 299 305
Outer Area
Index 100 101 133 125 173 175 185 188Broadway 73 58 62 31 67 59 77 88Harbour City 96 116 81 139 163 164 181 221Anchorage 178 200 187 215 159 158 165 219Salford Quays 95 99 87 140 172 138 157 140Exchange Quay 204 314 387 395 322 335 233 455Pomona 8 36 5 25 10 3 6 8Cornbrook Ecc 29 16 21 24 14 23 21 19Total 683 839 830 969 907 880 840 1150
Inner Area
Index 100 123 122 142 133 129 123 168Total 845 1003 1045 1171 1188 1163 1139 1455All Stations Index 100 119 124 139 141 138 135 172
Figure 5.10 Eccles Bound Alighters on the Eccles Line in the Peak Period
0
200
400
600
800
1000
1200
1400
1600
2000 2001 2002 2003 2004 2005 2006 2007
Year
Eccl
es b
ound
alig
hter
s (0
730-
0930
)
All StationsInner StationsOuter Stations

GMTU Report 1387 Public Transport
Page 142
Table 5.19 Weekday Off-Peak Manchester Bound Boarders on the Eccles
Metrolink Line (09:30-13:30)
Station 2000 2001 2002 2003 2004 2005 2006 2007Eccles 221 242 323 262 265 296 395 363Ladywell 39 48 89 68 82 173 142 131Weaste 42 62 66 37 56 94 71 81Langworthy 55 58 69 68 73 124 100 83Total 357 410 547 435 476 687 708 658
Outer Area
Index 100 115 153 122 133 192 198 184Broadway 14 26 31 35 48 38 29 56Harbour City 41 49 39 39 30 45 65 92Anchorage 58 44 49 52 58 61 60 65Salford Quays 61 63 76 66 56 75 95 76Exchange Quay 70 76 92 99 66 93 95 110Pomona 7 3 3 18 14 12 3 8Cornbrook Ecc 2 4 0 2 0 9 19 21Total 253 265 290 311 272 333 366 428
Inner Area
Index 100 105 115 123 108 132 145 169Total 610 675 837 746 748 1020 1074 1086All Stations Index 100 111 137 122 123 167 176 178
Figure 5.11 Manchester Bound Boarders on the Eccles Line in the Off-Peak Period
0
200
400
600
800
1000
1200
2000 2001 2002 2003 2004 2005 2006 2007
Year
Man
ches
ter b
ound
boa
rder
s (0
930-
1330
)
All StationsOuter StationsInner Stations

GMTU Report 1387 Public Transport
Page 143
Table 5.20 Weekday Off-Peak Eccles Bound Alighters on the Eccles
Metrolink Line (09:30-13:30)
Station 2000 2001 2002 2003 2004 2005 2006 2007Eccles 139 157 223 174 224 199 355 263Ladywell 16 38 59 50 74 73 94 73Weaste 17 20 10 20 23 28 34 43Langworthy 27 18 36 32 49 82 76 68Total 199 233 328 276 370 382 559 447
Outer Area
Index 100 117 165 139 186 192 281 225Broadway 42 51 68 49 71 65 39 68Harbour City 71 167 145 198 129 282 168 173Anchorage 48 63 79 82 87 95 99 76Salford Quays 59 80 103 90 83 129 110 102Exchange Quay 104 122 135 168 127 111 103 145Pomona 7 2 5 6 11 19 6 7Cornbrook Ecc 22 13 20 14 19 33 37 28Total 353 498 555 607 527 734 562 599
Inner Area
Index 100 141 157 172 149 208 159 170Total 552 731 883 883 897 1116 1121 1046All Stations Index 100 132 160 160 163 202 203 189
Figure 5.12 Eccles Bound Alighters on the Eccles Line in the Off-Peak Period
0
200
400
600
800
1000
1200
2000 2001 2002 2003 2004 2005 2006 2007
Year
Eccl
es b
ound
alig
hter
s (0
930-
1330
)
All StationsInner StationsOuter Stations

GMTU Report 1387 Public Transport
Page 144
BUS SERVICE SUPPLY
Annualised Bus Mileage
5.16 GMTU maintained a database of bus service registrations until November 1997. Information in this section up to and including November 1997 has been produced from this database. Information after November 1997 has been supplied from a database maintained by Greater Manchester Passenger Transport Executive (GMPTE). GMTU and GMPTE worked closely to ensure that information from the two databases is consistent.
5.17 In the following tables, unless stated, bus mileage figures refer to annualised
mileages as of the first of November each year. The annualised mileage is calculated from registrations current on that date, i.e. as if all the registrations on that date were to continue running for one year. This is not necessarily the same as the actual mileage run, since operators amend some of their services during the year.
5.18 Table 5.21 shows an overview of annualised bus mileage immediately prior to
deregulation and thereafter. The percentage of total bus mileage that was subsidised (operated with financial support from Greater Manchester Passenger Transport Authority (GMPTA)) is shown in brackets for all years since deregulation. Figures 5.13 and 5.14 illustrate the trends.
Table 5.21 Total Greater Manchester Annualised Bus Mileage in Millions,
1985 to 2007 Year Commercial Subsidised (%) Total 1985 - - 65.3 1986 49.1 4.7 (9) 53.8 1987 72.1 8.9 (11) 81.0 1988 72.0 9.5 (12) 81.6 1989 71.5 11.2 (14) 82.7 1990 70.4 12.7 (15) 83.1 1991 69.1 12.8 (16) 82.0 1992 71.6 12.5 (15) 84.1 1993 74.8 11.7 (14) 86.6 1994 81.3 11.0 (12) 92.3 1995 74.1 12.5 (14) 86.1 1996 70.0 12.7 (15) 82.8 1997 67.1 12.0 (15) 79.1 1998 70.8 13.9 (16) 84.7 1999 68.6 12.3 (15) 80.9 2000 65.5 12.7 (16) 78.2 2001 67.2 14.3 (18) 81.5 2002 62.0 12.9 (17) 74.9 2003 58.6 13.4 (19) 72.0 2004 56.0 13.5 (19) 69.4 2005 55.7 14.7 (21) 70.4 2006 57.0 14.3 (20) 71.3 2007 53.3 13.7(20) 66.9
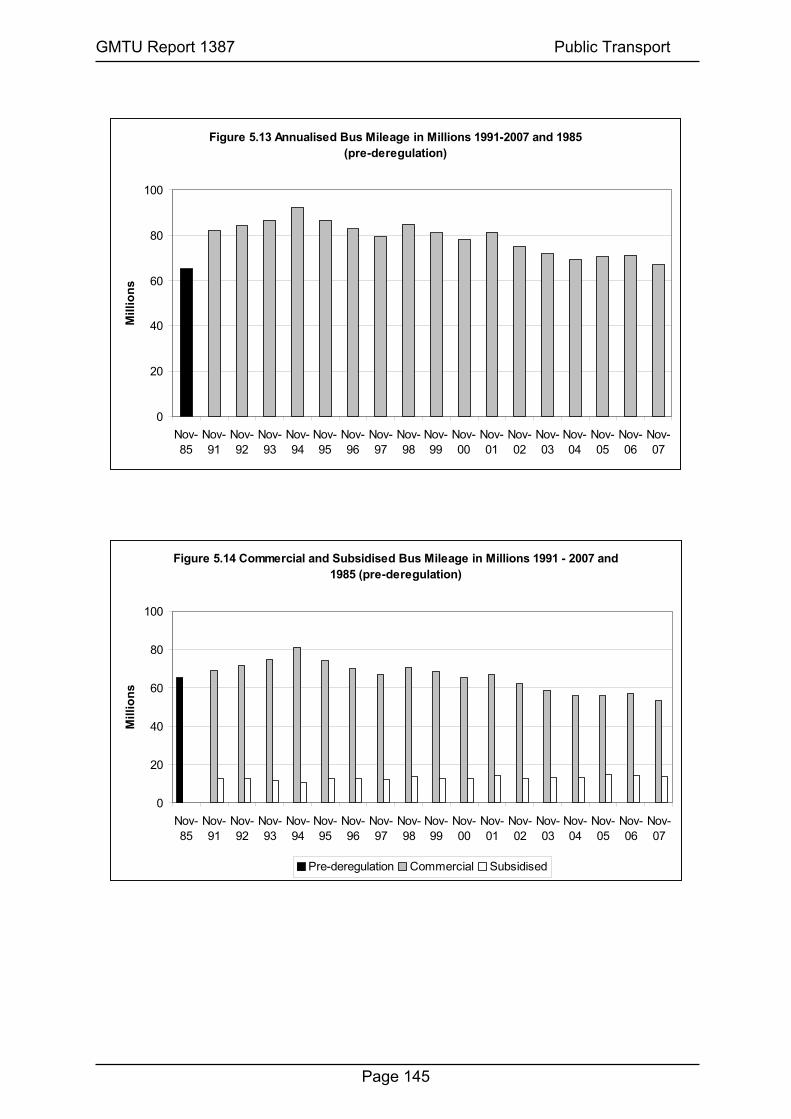
GMTU Report 1387 Public Transport
Page 145
Figure 5.13 Annualised Bus Mileage in Millions 1991-2007 and 1985 (pre-deregulation)
0
20
40
60
80
100
Nov-85
Nov-91
Nov-92
Nov-93
Nov-94
Nov-95
Nov-96
Nov-97
Nov-98
Nov-99
Nov-00
Nov-01
Nov-02
Nov-03
Nov-04
Nov-05
Nov-06
Nov-07
Mill
ions
Figure 5.14 Commercial and Subsidised Bus Mileage in Millions 1991 - 2007 and 1985 (pre-deregulation)
0
20
40
60
80
100
Nov-85
Nov-91
Nov-92
Nov-93
Nov-94
Nov-95
Nov-96
Nov-97
Nov-98
Nov-99
Nov-00
Nov-01
Nov-02
Nov-03
Nov-04
Nov-05
Nov-06
Nov-07
Mill
ions
Pre-deregulation Commercial Subsidised

GMTU Report 1387 Public Transport
Page 146
Annualised Bus Mileage by District
5.19 Table 5.22 shows the annualised bus mileage in each district for each November between 2002 and 2007, and for 1985.
Table 5.22 Annualised Bus Mileage in Millions, 2002 to 2007, and 1985 (pre-deregulation year)
District Nov 85 Nov 02 Nov 03 Nov 04 Nov 05 Nov 06 Nov 07Bolton 6.2 7.8 6.8 6.8 6.8 6.8 6.5 Bury 4.2 5.3 4.3 4.7 4.8 4.6 4.4 Manchester 18.5 20.2 19.8 19.2 19.5 20.5 17.9 Oldham 5.1 4.7 6.0 5.1 5.8 5.7 5.5 Rochdale 3.9 5.1 5.4 3.9 4.7 4.7 4.5 Salford 6.9 6.7 5.9 6.2 6.1 5.9 5.7 Stockport 5.1 6.5 6.2 6.2 5.8 6.7 6.0 Tameside 4.5 5.8 5.5 5.3 4.8 4.7 5.1 Trafford 4.5 5.1 4.9 4.7 4.7 4.7 4.5 Wigan 6.4 7.7 7.2 7.4 7.2 7.0 6.9 Total 65.3 74.9 72.0 69.4 70.4 71.3 66.9
Note: Sum of columns may not equal totals due to rounding.

GMTU Report 1387 Public Transport
Page 147
Commercial and Subsidised Bus Mileage
5.20 Table 5.23 shows the commercial and subsidised mileage in each Greater Manchester district for the years 2002 to 2007 and the total mileage operated in 1985.
Table 5.23 Commercial and Subsidised Bus Mileage in Millions, 2002 to 2007, and 1985 (pre-deregulation year)
Nov 02 Nov 03 Nov 04 Nov 05 Nov 06 Nov 07 District
Nov 85 Com Sub Com Sub Com Sub Com Sub Com Sub Com Sub
Bolton 6.2 6.8 1.0 5.7 1.1 5.6 1.2 5.5 1.3 5.6 1.2 5.4 1.1 Bury 4.2 4.4 0.9 3.7 0.6 3.8 0.9 3.9 0.9 3.7 0.9 3.5 0.9 Manchester 18.5 17.0 3.2 16.2 3.6 15.9 3.2 16.2 3.4 17.3 3.2 14.8 3.1 Oldham 5.1 3.3 1.4 4.7 1.3 3.8 1.3 4.3 1.5 4.2 1.5 4.1 1.3 Rochdale 3.9 4.3 0.8 4.6 0.8 3.0 0.8 3.4 1.3 3.6 1.1 3.4 1.1 Salford 6.9 5.7 1.0 4.8 1.1 5.0 1.2 5.0 1.1 4.7 1.2 4.5 1.1 Stockport 5.1 5.7 0.8 5.2 1.0 5.0 1.2 4.4 1.4 5.3 1.4 4.8 1.2 Tameside 4.5 4.6 1.2 4.4 1.1 4.1 1.1 3.7 1.2 3.5 1.2 3.7 1.4 Trafford 4.5 3.8 1.4 3.5 1.3 3.5 1.2 3.5 1.2 3.5 1.2 3.3 1.2 Wigan 6.4 6.5 1.2 5.8 1.4 6.0 1.4 5.8 1.4 5.7 1.4 5.7 1.2 Total Com/Sub 65.3 62.0 12.9 58.6 13.4 56.0 13.5 55.7 14.7 57.0 14.3 53.3 13.7
Total Mileage 65.3 74.9 72.0 69.4 70.4 71.3 66.9
Notes:
Com = Commercial Services run at the operators’ risk.
Sub = Subsidised Services run with the aid of subsidy from the GMPTA after competitive tendering.
Sum of columns may not equal totals due to rounding.

GMTU Report 1387 Public Transport
Page 148
Analysis by Time of Day and Day of Week
5.21 Tables 5.24 to 5.28 and Figure 5.15 show an analysis of bus mileage at different times of day and on different days of the week.
Table 5.24 Weekday Peak (07:00–09:00) Bus Mileage by District
District Nov 85 Nov 02 Nov 03 Nov 04 Nov 05 Nov 06 Nov 07
Index 07Bolton 2960 3680 3220 3390 3200 3190 3040 (88) 103 Bury 2060 2430 2010 2150 2180 2000 1900 (84) 92 Manchester 9850 8810 8660 8290 8610 8620 7710 (87) 78 Oldham 2570 2310 2940 2480 2770 2620 2490 (80) 97 Rochdale 1860 2470 2650 2100 2420 2210 2050 (81) 110 Salford 3230 3020 2610 2860 2690 2470 2320 (86) 72 Stockport 2630 3090 2910 2890 2830 3060 2650 (82) 101 Tameside 2290 2850 2670 2570 2400 2280 2410 (81) 105 Trafford 2350 2530 2350 2420 2240 2100 1920 (75) 82 Wigan 3000 3500 3270 3590 3490 3220 3150 (89) 105 Total 32800 34670 33280 32720 32820 31770 29640 - Index 100 106 101 100 100 97 90 - % Commercial Mileage - 86 86 83 82 83 84 -
Notes: Indices are based on Nov 85 = 100 Sum of columns may not equal totals due to rounding. Figures in parentheses give the percentage of mileage operated commercially in 2007

GMTU Report 1387 Public Transport
Page 149
Table 5.25 Weekday Off-Peak (10:00–15:00) Bus Mileage by District District Nov 85 Nov02 Nov 03 Nov 04 Nov 05 Nov 06 Nov 07 Index 07Bolton 5440 9470 8160 8040 8000 8050 7580 (87) 139 Bury 3970 6190 5160 5510 5550 5390 5110 (80) 129 Manchester 14600 21690 21480 20690 21330 21910 19490 (86) 134 Oldham 4120 5450 6920 6050 6800 6810 6470 (77) 157 Rochdale 3360 6450 6640 4780 5650 5510 5230 (78) 156 Salford 5910 7720 6870 7110 6880 6480 6240 (81) 106 Stockport 4370 7250 6810 6740 6290 7060 6390 (82) 146 Tameside 3700 6620 6400 6020 5370 5260 5630 (78) 152 Trafford 3870 5610 5260 5100 5280 5090 5030 (85) 130 Wigan 5750 9460 9020 9050 8720 8630 8640 (90) 150 Total 55090 85900 82730 79090 79870 80180 75810 Index 100 156 150 144 145 146 138 - % Commercial Mileage - 87 86 84 83 83 83 -
Notes: Indices are based on Nov 85 = 100 Sum of columns may not equal totals due to rounding. Figures in parentheses give the percentage of mileage operated commercially in 2007.
Table 5.26 Weekday Evening (20:00–22:00) Bus Mileage by District District Nov 85 Nov 02 Nov 03 Nov 04 Nov 05 Nov 06 Nov 07 Index 07Bolton 1250 840 750 730 770 790 770 (38) 62 Bury 740 580 460 500 540 500 510 (45) 69 Manchester 3860 3290 2930 2810 2860 3090 2520 (56) 65 Oldham 1120 570 740 620 720 710 650 (48) 58 Rochdale 730 500 560 360 540 540 560 (51) 77 Salford 1560 730 660 710 730 790 800 (49) 51 Stockport 1180 890 800 840 780 910 860 (60) 73 Tameside 930 790 680 670 650 650 710 (30) 76 Trafford 850 670 700 690 680 620 610 (27) 72 Wigan 1420 920 780 810 820 740 720 (23) 51 Total 13640 9780 9070 8740 9090 9350 8710 Index 100 72 66 64 67 69 64 % Commercial Mileage
- 55 49 51 46 49 46 -
Notes: Indices are based on Nov 85 = 100 Sum of columns may not equal totals due to rounding. Figures in parentheses give the percentage of mileage operated commercially in 2007.
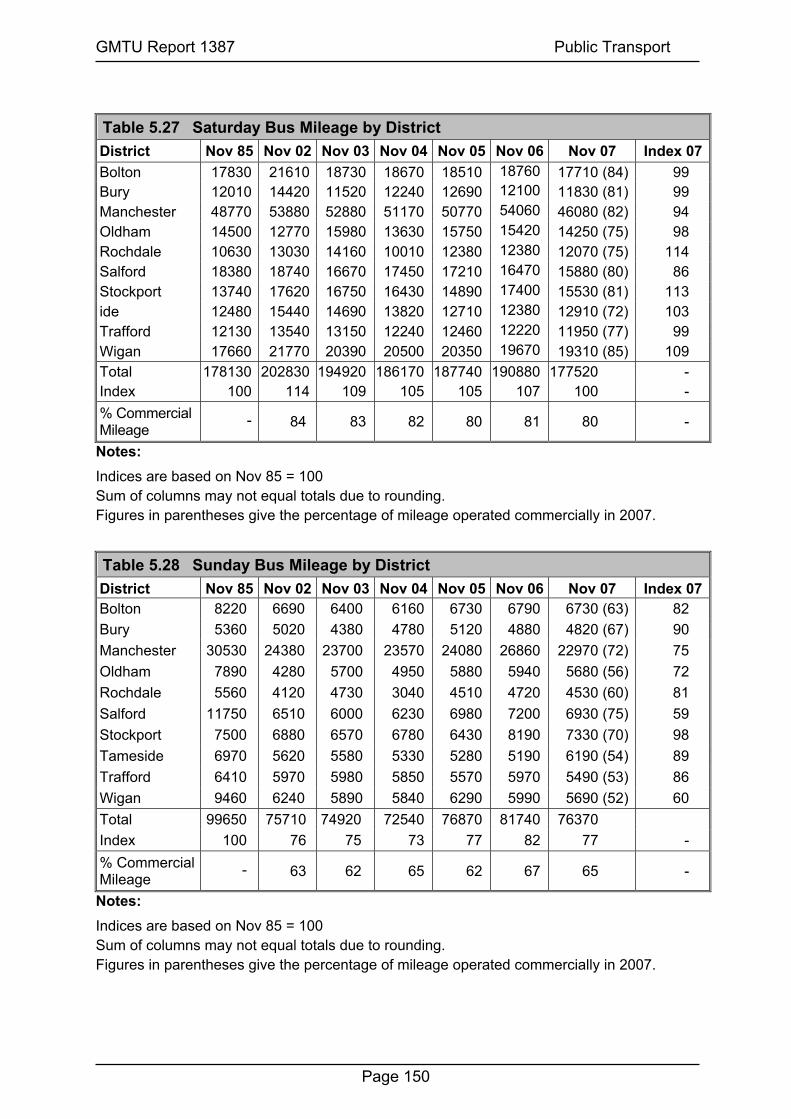
GMTU Report 1387 Public Transport
Page 150
Table 5.27 Saturday Bus Mileage by District District Nov 85 Nov 02 Nov 03 Nov 04 Nov 05 Nov 06 Nov 07 Index 07Bolton 17830 21610 18730 18670 18510 18760 17710 (84) 99 Bury 12010 14420 11520 12240 12690 12100 11830 (81) 99 Manchester 48770 53880 52880 51170 50770 54060 46080 (82) 94 Oldham 14500 12770 15980 13630 15750 15420 14250 (75) 98 Rochdale 10630 13030 14160 10010 12380 12380 12070 (75) 114 Salford 18380 18740 16670 17450 17210 16470 15880 (80) 86 Stockport 13740 17620 16750 16430 14890 17400 15530 (81) 113 ide 12480 15440 14690 13820 12710 12380 12910 (72) 103 Trafford 12130 13540 13150 12240 12460 12220 11950 (77) 99 Wigan 17660 21770 20390 20500 20350 19670 19310 (85) 109 Total 178130 202830 194920 186170 187740 190880 177520 - Index 100 114 109 105 105 107 100 - % Commercial Mileage
- 84 83 82 80 81 80 -
Notes: Indices are based on Nov 85 = 100 Sum of columns may not equal totals due to rounding. Figures in parentheses give the percentage of mileage operated commercially in 2007.
Table 5.28 Sunday Bus Mileage by District District Nov 85 Nov 02 Nov 03 Nov 04 Nov 05 Nov 06 Nov 07 Index 07Bolton 8220 6690 6400 6160 6730 6790 6730 (63) 82 Bury 5360 5020 4380 4780 5120 4880 4820 (67) 90 Manchester 30530 24380 23700 23570 24080 26860 22970 (72) 75 Oldham 7890 4280 5700 4950 5880 5940 5680 (56) 72 Rochdale 5560 4120 4730 3040 4510 4720 4530 (60) 81 Salford 11750 6510 6000 6230 6980 7200 6930 (75) 59 Stockport 7500 6880 6570 6780 6430 8190 7330 (70) 98 Tameside 6970 5620 5580 5330 5280 5190 6190 (54) 89 Trafford 6410 5970 5980 5850 5570 5970 5490 (53) 86 Wigan 9460 6240 5890 5840 6290 5990 5690 (52) 60 Total 99650 75710 74920 72540 76870 81740 76370 Index 100 76 75 73 77 82 77 - % Commercial Mileage
- 63 62 65 62 67 65 -
Notes: Indices are based on Nov 85 = 100 Sum of columns may not equal totals due to rounding. Figures in parentheses give the percentage of mileage operated commercially in 2007.

GMTU Report 1387 Public Transport
Page 151
Figure 5.15 Indices of Bus Mileage by Day of Week and Time Period
0
20
40
60
80
100
120
140
160
180
200
85 86 87 88 89 90 91 92 93 94 95 96 97 98 99 00 01 02 03 04 05 06 07
Year
Inde
x (1
985=
100) Weekday 10:00-15:00
SaturdayWeekday 07:00-09:00SundayWeekday 20:00-22:00

GMTU Report 1387 Public Transport
Page 152
Bus Mileage by Operator
5.22 Table 5.29 shows the trends in the bus mileage of the 10 companies operating more than one million miles per annum in Greater Manchester in 2007 (previous mileage operated by GM Buses is shown as a guide). Some operating companies belong to larger operating groups whose market share is examined in Table 5.30.
Table 5.29 Bus Mileage of Operators 2002 to 2007, and 1985 (pre-deregulation year)
Annualised mileage (million vehicle miles) Operator Nov 85 Nov 02 Nov 03 Nov 04 Nov 05 Nov 06 Nov 07GM Buses 63.4 - - - - - - First - 30.3 29.5 29.3 28.9 27.9 26.6 Stagecoach Manchester - 19.9 18.5 18.6 18.5 18.8 17.9 Arriva Manchester - 3.5 3.2 3.0 4.3 4.4 4.1 Arriva Liverpool - - - - 2.1 2.4 2.0 Rossendale Transport - 1.8 1.7 1.4 1.8 1.7 1.7 Bluebird - 1.3 1.4 1.5 1.4 1.6 1.7 South Lancs. Travel - 1.2 1.2 1.3 1.8 1.9 1.6 First Pioneer - 1.1 1.6 - 0.8 1.2 1.2 Maynes 0.4 1.1 1.2 1.1 1.1 1.1 1.0 Speedwellbus Limited - 0.1 0.2 0.4 0.6 0.7 1.0 Others 1.5 13.1 12.8 12.1 7.9 7.5 8.1 GM Total 65.3 74.9 72.0 69.4 70.4 71.3 66.9
Note: UK North ceased operating in December 2006
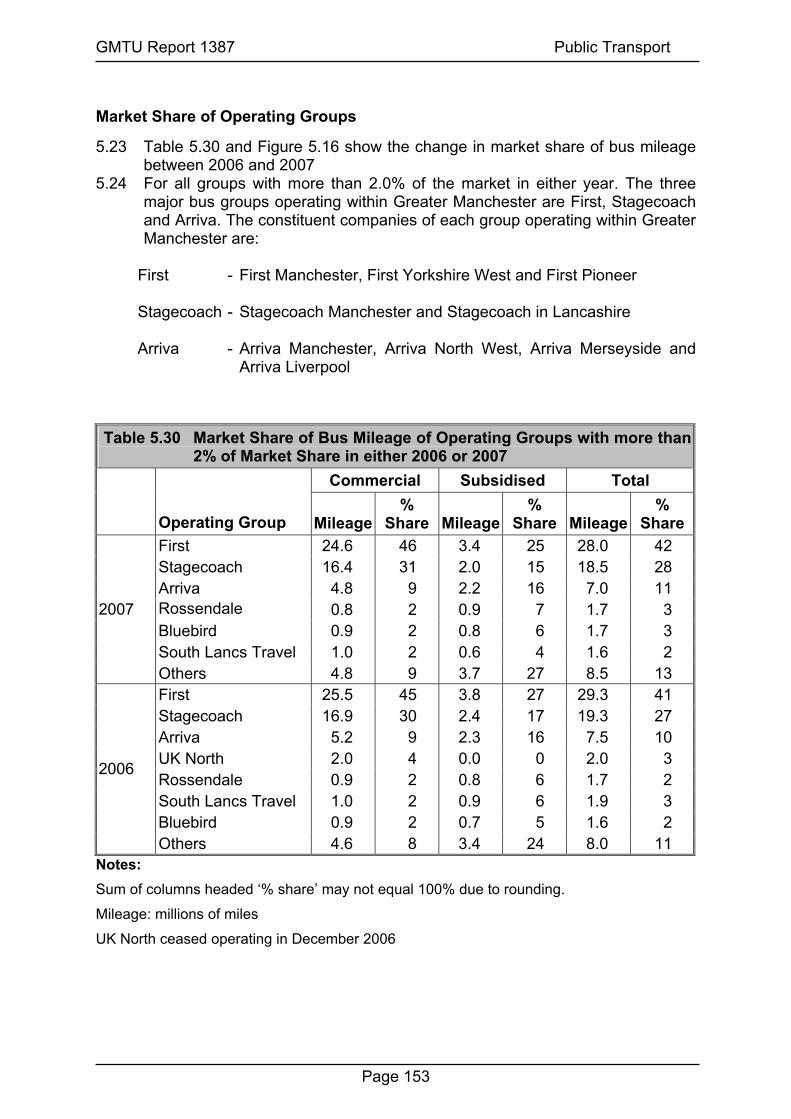
GMTU Report 1387 Public Transport
Page 153
Market Share of Operating Groups
5.23 Table 5.30 and Figure 5.16 show the change in market share of bus mileage between 2006 and 2007
5.24 For all groups with more than 2.0% of the market in either year. The three major bus groups operating within Greater Manchester are First, Stagecoach and Arriva. The constituent companies of each group operating within Greater Manchester are:
First - First Manchester, First Yorkshire West and First Pioneer Stagecoach - Stagecoach Manchester and Stagecoach in Lancashire Arriva - Arriva Manchester, Arriva North West, Arriva Merseyside and
Arriva Liverpool
Table 5.30 Market Share of Bus Mileage of Operating Groups with more than 2% of Market Share in either 2006 or 2007
Commercial Subsidised Total
Operating Group Mileage%
Share Mileage%
Share Mileage %
ShareFirst 24.6 46 3.4 25 28.0 42 Stagecoach 16.4 31 2.0 15 18.5 28 Arriva 4.8 9 2.2 16 7.0 11 Rossendale 0.8 2 0.9 7 1.7 3 Bluebird 0.9 2 0.8 6 1.7 3 South Lancs Travel 1.0 2 0.6 4 1.6 2
2007
Others 4.8 9 3.7 27 8.5 13 First 25.5 45 3.8 27 29.3 41 Stagecoach 16.9 30 2.4 17 19.3 27 Arriva 5.2 9 2.3 16 7.5 10 UK North 2.0 4 0.0 0 2.0 3 Rossendale 0.9 2 0.8 6 1.7 2 South Lancs Travel 1.0 2 0.9 6 1.9 3 Bluebird 0.9 2 0.7 5 1.6 2
2006
Others 4.6 8 3.4 24 8.0 11 Notes: Sum of columns headed ‘% share’ may not equal 100% due to rounding.
Mileage: millions of miles
UK North ceased operating in December 2006

GMTU Report 1387 Public Transport
Page 154
Bus Registration Changes 2002-2007
5.25 Table 5.31 shows the number of bus registration changes each year from November 2002 to October 2007.
Table 5.31 Bus Registration Changes November 2001 – October 2007 Nov 2002 to
Oct 2003 Nov 2003 to
Oct 2004 Nov 2004 to
Oct 2005 Nov 2005 to
Oct 2006 Nov 2006 to
Oct 2007 November 43 79 67 22 31 December 49 26 77 26 60 January 166 95 180 222 118 February 208 87 97 17 37 March 61 91 27 22 20 April 80 65 77 94 99 May 88 17 24 40 14 June 96 352 72 25 12 July 49 105 116 108 88 August 140 117 127 14 33 September 316 388 258 429 283 October 47 86 148 73 89 Total 1343 1508 1270 1092 884 Note:
Figures include cancellations and amendments as well as new registrations.
Figure 5.16 Bus Mileage by Operator Group in 2006 and 2007
42%
41%
28%
27%
10%
10% 3%
3%
2%
2%
3%
2%
2%
11%
13%
0 10 20 30 40 50 60 70 80
2006
2007
Millions of Miles
First Group Stagecoach Arriva UK North South Lancs Travel Rossendale Bluebird Others

6 BACKGROUND INFORMATION


GMTU Report 1387 Background Information
Page 157
Retail Price Index
Table 6.1 Retail Price Index (All Items) 1987-2007 – Base Jan 1987 = 100 Year and Index Quarterly RPI Year and Index Quarterly RPI
1987
101.9 100.3 101.9 102.1 103.2
1998 162.9 160.2 163.2 163.7 164.4
1988 106.8 103.7 106.2 107.4 109.9
1999 165.4 163.7 165.5 165.6 166.8
1989 115.2 111.7 114.9 115.7 118.3
2000 170.3 167.5 170.6 170.9 172.0
1990 126.2 120.4 126.0 128.1 130.1
2001 173.4 171.8 173.9 174.0 173.8
1991 133.5 130.8 133.6 134.2 135.5
2002 176.2 173.9 176.0 176.6 178.2
1992 138.5 136.2 139.1 139.0 139.6
2003 181.3 179.2 181.3 181.8 182.9
1993 140.7 138.7 140.9 141.3 141.8
2004 186.7 183.8 186.3 187.4 189.2
1994 144.2 142.0 144.5 144.6 145.5
2005 192.0 189.7 191.9 192.6 193.7
1995 149.2 146.8 149.5 149.9 150.7
2006 198.1 194.2 197.6 199.3 201.4
1996 152.7 150.9 152.8 153.1 154.0
2007 206.6 203.0 206.3 207.1 209.8
1997 157.5 154.9 156.9 158.4 159.7
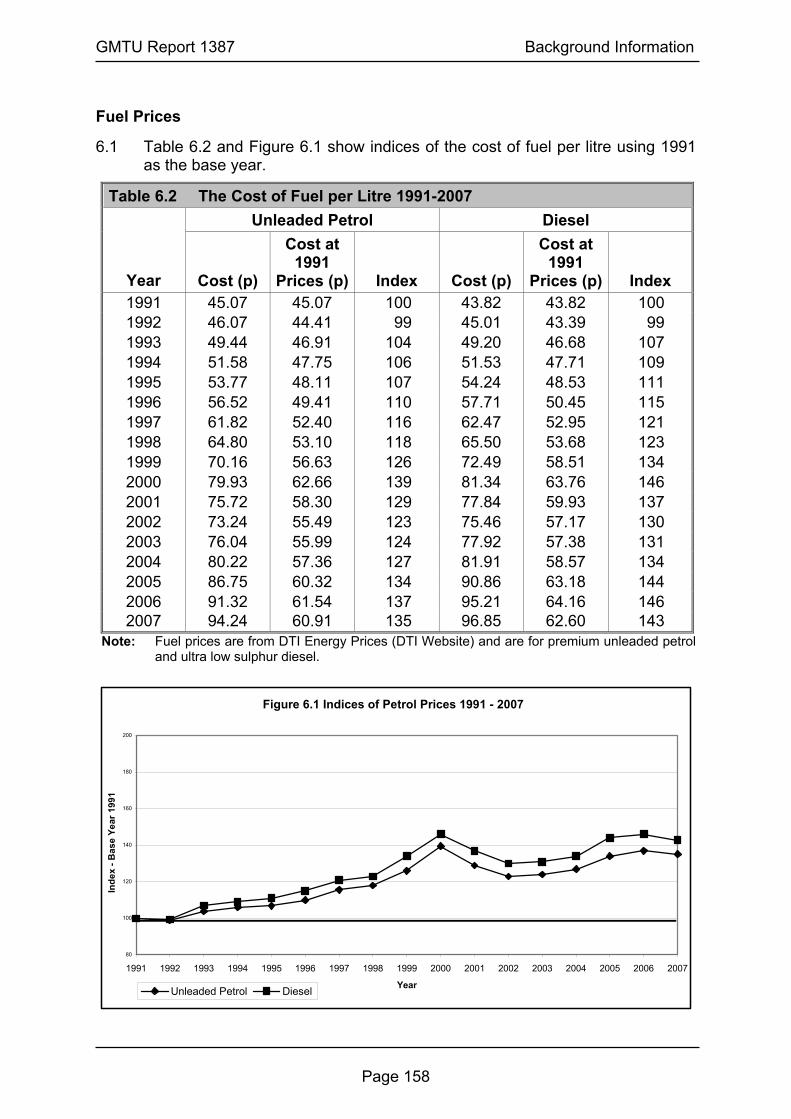
GMTU Report 1387 Background Information
Page 158
Fuel Prices
6.1 Table 6.2 and Figure 6.1 show indices of the cost of fuel per litre using 1991 as the base year.
Table 6.2 The Cost of Fuel per Litre 1991-2007 Unleaded Petrol Diesel
Year Cost (p)
Cost at 1991
Prices (p) Index Cost (p)
Cost at 1991
Prices (p) Index 1991 45.07 45.07 100 43.82 43.82 100 1992 46.07 44.41 99 45.01 43.39 99 1993 49.44 46.91 104 49.20 46.68 107 1994 51.58 47.75 106 51.53 47.71 109 1995 53.77 48.11 107 54.24 48.53 111 1996 56.52 49.41 110 57.71 50.45 115 1997 61.82 52.40 116 62.47 52.95 121 1998 64.80 53.10 118 65.50 53.68 123 1999 70.16 56.63 126 72.49 58.51 134 2000 79.93 62.66 139 81.34 63.76 146 2001 75.72 58.30 129 77.84 59.93 137 2002 73.24 55.49 123 75.46 57.17 130 2003 76.04 55.99 124 77.92 57.38 131 2004 80.22 57.36 127 81.91 58.57 134 2005 86.75 60.32 134 90.86 63.18 144 2006 91.32 61.54 137 95.21 64.16 146 2007 94.24 60.91 135 96.85 62.60 143
Note: Fuel prices are from DTI Energy Prices (DTI Website) and are for premium unleaded petrol and ultra low sulphur diesel.
Figure 6.1 Indices of Petrol Prices 1991 - 2007
80
100
120
140
160
180
200
1991 1992 1993 1994 1995 1996 1997 1998 1999 2000 2001 2002 2003 2004 2005 2006 2007
Year
Inde
x - B
ase
Year
199
1
Unleaded Petrol Diesel

GMTU Report 1387 Background Information
Page 159
Public Transport Fares
6.2 Tables 6.3 and 6.4 and Figure 6.2 show indices of peak and off-peak public transport fares relative to 1991 for an average journey by bus, Metrolink and rail. All fares have been adjusted for inflation to 1991 prices. Average journey lengths and fares were provided by GMPTE. As Metrolink did not begin operation until 1992, the quoted 1991 fare is the equivalent rail fare.
6.3 The average bus fare has been calculated by dividing the annual bus passenger revenue by the annual number of bus passenger journeys.
6.4 As the average Metrolink journey is 4.5 miles, which covers 3 Metrolink zones, the fare from Heaton Park to Manchester City Centre has been used as the representative fare. For train, the fare from Marple to Manchester City Centre was taken as typical, as this journey has the average journey length of 9.5 miles.
6.5 Return fares have been used to calculate the price indices for rail and Metrolink because this is the type of ticket most commonly purchased. In contrast, the average bus fare is for a single journey and includes concessionary fares.
Figure 6.2 Indices of Public Transport Fares 1991 - 2007
80
100
120
140
160
180
200
1991 1992 1993 1994 1995 1996 1997 1998 1999 2000 2001 2002 2003 2004 2005 2006 2007
Spring
Inde
x - B
ase
Year
199
1
Bus Metrolink Peak Rail Peak Metrolink Off Peak Rail Off Peak
Bus indices based on annual passenger revenue divided by annual number of passenger journeys. Rail/Metrolink indices based on return fares Pre 1992 Metrolink fare is Rail equivalent.

GMTU Report 1387 Background Information
Page 160
Table 6.3 Public Transport Peak Fares for Average Journeys 1991 to 2007 Bus (average revenue
per person per journey) Metrolink (3 zones, return) Rail (9.5 miles, return)
Year Cost (£)
Cost at 1991
Prices (£) Index Cost (£)
Cost at 1991
Prices (£) Index Cost (£)
Cost at 1991
Prices (£) Index 1991 0.36 0.36 100 1.80 (R) 1.80 100 2.70 2.70 100 1992 0.38 0.37 103 2.70 (M) 2.60 144 3.15 3.04 113 1993 0.43 0.41 114 2.70 (M) 2.56 142 3.25 3.08 114 1994 0.43 0.40 111 2.50 (M) 2.31 128 3.35 3.10 115 1995 0.44 0.39 108 2.60 (M) 2.33 129 3.45 3.09 114 1996 0.46 0.40 111 2.65 (M) 2.32 129 3.55 3.10 115 1997 0.46 0.39 108 2.80 (M) 2.37 132 3.70 3.14 116 1998 0.47 0.39 108 2.90 (M) 2.38 132 3.80 3.11 115 1999 0.49 0.40 111 3.80 (M) 3.07 171 3.90 3.15 117 2000 0.51 0.40 111 3.80 (M) 2.98 166 4.00 3.14 116 2001 0.54 0.42 117 3.80 (M) 2.93 163 4.00 3.08 114 2002 0.57 0.43 119 4.00 (M) 3.03 168 4.00 3.03 112 2003 0.58 0.43 119 4.00 (M) 2.95 164 4.00 2.95 109 2004 0.62 0.44 122 4.00 (M) 2.86 159 4.15 2.97 110 2005 0.68 0.47 131 4.20 (M) 2.92 162 4.30 2.99 111 2006 0.68 0.46 127 4.20 (M) 2.83 157 4.45 3.00 111 2007 0.71 0.46 127 4.30 (M) 2.78 154 4.65 3.00 111
Table 6.4 Public Transport Off-Peak Fares for Average Journeys 1991 to
2007 Bus (average revenue) Metrolink (3 zones, return) Rail (9.5 miles, return)
Year Cost (£)
Cost at 1991
Prices (£) Index Cost (£)
Cost at 1991
Prices (£) Index Cost (£)
Cost at 1991
Prices (£) Index 1991 0.36 0.36 100 1.10 (R) 1.10 100 1.60 1.60 100 1992 0.38 0.37 103 1.70 (M) 1.64 149 1.80 1.74 109 1993 0.43 0.41 114 1.70 (M) 1.61 146 1.80 1.71 107 1994 0.43 0.40 111 1.80 (M) 1.67 152 1.95 1.81 113 1995 0.44 0.39 108 1.90 (M) 1.70 155 2.05 1.83 114 1996 0.46 0.40 111 1.90 (M) 1.66 151 2.10 1.84 115 1997 0.46 0.39 108 2.00 (M) 1.70 155 2.15 1.82 114 1998 0.47 0.39 108 2.10 (M) 1.72 156 2.20 1.80 113 1999 0.49 0.40 111 2.50 (M) 2.02 184 2.20 1.78 111 2000 0.51 0.40 111 2.50 (M) 1.96 178 2.25 1.76 110 2001 0.54 0.42 117 2.50 (M) 1.92 175 2.25 1.73 108 2002 0.57 0.43 119 2.70 (M) 2.05 186 2.25 1.70 106 2003 0.58 0.43 119 2.70 (M) 1.99 181 2.25 1.66 104 2004 0.62 0.44 122 2.80 (M) 2.00 182 2.35 1.68 105 2005 0.68 0.47 131 2.90 (M) 2.02 183 2.45 1.70 106 2006 0.68 0.46 127 3.00 (M) 2.02 184 2.55 1.72 107 2007 0.71 0.46 127 3.00 (M) 1.94 176 2.65 1.71 107
Notes: Fares are at Spring of each year. The length of journey used is the average journey for the particular type of transport as provided in GMPTE literature. The bus fare is based on the annual average revenue per person for a single journey. In Metrolink fares, (R) indicates previous rail service (M) Metrolink service.
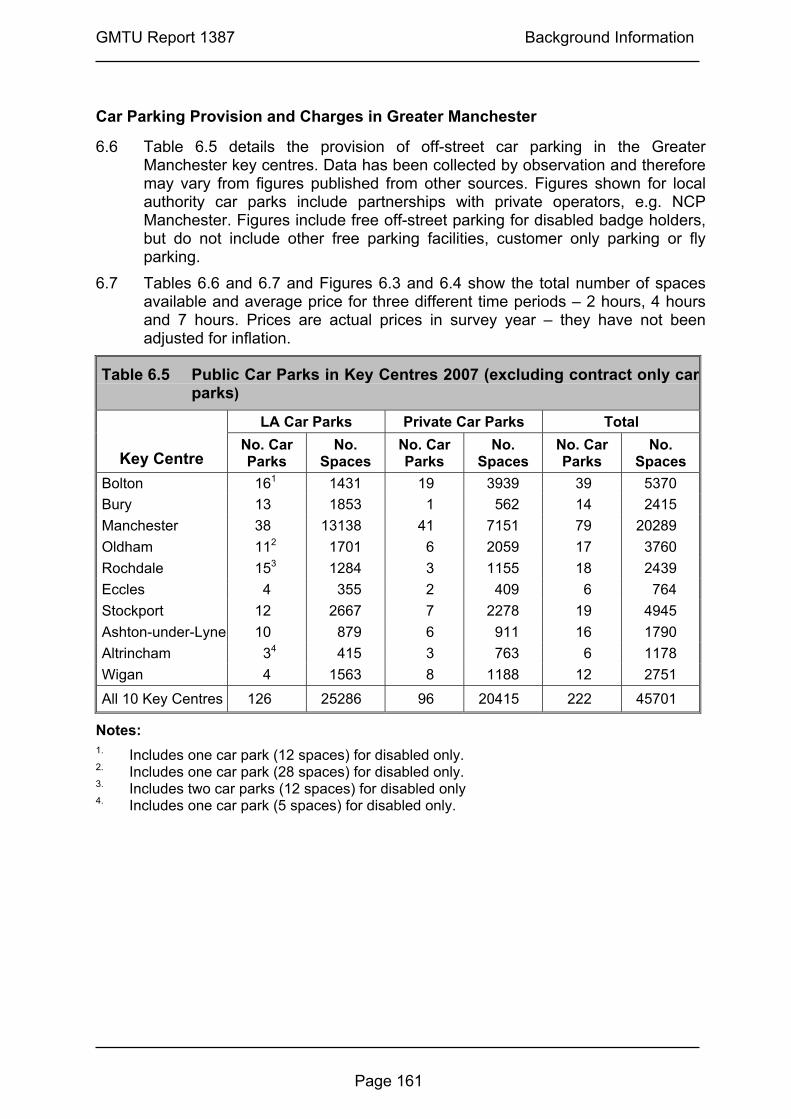
GMTU Report 1387 Background Information
Page 161
Car Parking Provision and Charges in Greater Manchester
6.6 Table 6.5 details the provision of off-street car parking in the Greater Manchester key centres. Data has been collected by observation and therefore may vary from figures published from other sources. Figures shown for local authority car parks include partnerships with private operators, e.g. NCP Manchester. Figures include free off-street parking for disabled badge holders, but do not include other free parking facilities, customer only parking or fly parking.
6.7 Tables 6.6 and 6.7 and Figures 6.3 and 6.4 show the total number of spaces available and average price for three different time periods – 2 hours, 4 hours and 7 hours. Prices are actual prices in survey year – they have not been adjusted for inflation.
Table 6.5 Public Car Parks in Key Centres 2007 (excluding contract only car parks)
LA Car Parks Private Car Parks Total
Key Centre No. Car Parks
No. Spaces
No. Car Parks
No. Spaces
No. Car Parks
No. Spaces
Bolton 161 1431 19 3939 39 5370 Bury 13 1853 1 562 14 2415 Manchester 38 13138 41 7151 79 20289 Oldham 112 1701 6 2059 17 3760 Rochdale 153 1284 3 1155 18 2439 Eccles 4 355 2 409 6 764 Stockport 12 2667 7 2278 19 4945 Ashton-under-Lyne 10 879 6 911 16 1790 Altrincham 34 415 3 763 6 1178 Wigan 4 1563 8 1188 12 2751 All 10 Key Centres 126 25286 96 20415 222 45701
Notes: 1. Includes one car park (12 spaces) for disabled only. 2. Includes one car park (28 spaces) for disabled only. 3. Includes two car parks (12 spaces) for disabled only 4. Includes one car park (5 spaces) for disabled only.

Table 6.6 Number of Spaces Available in Public Car Parks by Key Centre 2002 to 2007
2002 2003 2004 2005 2006 2007
Key CentreLength of Stay
Local Authority Private
Local Authority Private
Local Authority Private
Local Authority Private
Local Authority Private
Local Authority Private
2 hours 1576 3405 1535 3704 1446 3746 1407 3634 1400 4081 1431 3939 4 hours 1440 3301 1440 3600 1351 3642 1312 3634 1323 4081 1319 3359 Bolton 7 hours 1128 3301 1205 3600 1116 3642 1077 3634 1100 4081 1096 3359 2 hours 2116 572 2106 572 2153 572 2137 542 2005 542 1853 562 4 hours 2116 572 2106 572 2153 572 2137 542 2005 542 1853 562 Bury 7 hours 2116 572 2106 572 2153 572 2137 542 2005 542 1853 562 2 hours 13072 7946 13003 7974 12073 7586 11951 8219 14121 8077 13138 7151 4 hours 13072 7778 13003 7926 12073 7486 11951 8219 14121 8077 13124 7103 Manchester 7 hours 13072 7778 13003 7926 12073 7486 11951 8219 14121 8077 13124 7103 2 hours 1903 1530 1823 1530 1780 1937 1574 1910 1358 2075 1701 2059 4 hours 1843 1530 1763 1530 1641 1937 1435 1910 1219 2075 1556 2059 Oldham 7 hours 1843 1495 1763 1495 1641 1902 1435 1875 1219 2040 1556 2024 2 hours 1476 1714 1445 1158 1429 1158 1412 1088 1295 1156 1284 1155 4 hours 1476 1714 1445 1158 1429 1158 1429 1088 826 1156 841 1155 Rochdale 7 hours 1476 1714 1445 1158 1429 1158 1429 1088 826 1156 841 1155 2 hours 355 379 355 416 355 398 355 407 355 418 355 409 4 hours 355 29 355 29 355 29 355 29 355 29 355 29 Eccles 7 hours 355 29 355 29 355 29 355 29 355 29 355 29 2 hours 3197 2331 3061 2235 3100 2019 3118 2107 2724 2107 2667 2278 4 hours 3197 740 3061 814 3100 600 3118 545 2724 545 2646 545 Stockport 7 hours 3197 740 3061 814 3100 600 3118 545 2724 545 2646 545 2 hours 1056 1000 1056 1000 901 1000 904 891 901 911 879 911 4 hours 324 805 324 805 276 805 286 678 223 678 223 698 Ashton-under-
Lyne 7 hours 324 773 324 773 276 773 286 678 223 678 223 698 2 hours 906 1347 906 1347 906 1498 651 1133 415 1173 415 763 4 hours 836 722 836 722 836 778 651 1133 415 1173 415 763 Altrincham 7 hours 836 722 836 722 836 778 651 1133 415 1173 415 763 2 hours 2397 475 2377 509 1511 509 1563 525 1563 515 1563 1188 4 hours 2397 475 2377 509 1511 509 1563 525 1563 515 1563 1188 Wigan 7 hours 2397 475 2377 509 1511 509 1563 525 1563 515 1563 1188 2 hours 28054 20699 27667 20445 25654 20423 25072 20456 26137 21055 25286 20415 4 hours 27056 17666 26710 17665 24725 17516 24237 18303 24774 18871 23895 17461 TOTAL GM 7 hours 26744 17599 26475 17598 24490 17449 24002 18268 24551 18836 23672 17426
Note: Stockport LA spaces prior to 2006 include some contract parking at Civic Buildings and Regal House (approx 400 spaces in 2005)
Page 162
GM
TU R
eport 1387 Background Inform
ation

Table 6.7 Average Prices in Public Car Parks by Key Centre 2002 to 2007 2002 2003 2004 2005 2006 2007
Key Centre Length of
Stay Local
Authority Private Local
Authority Private Local
Authority Private Local
Authority Private Local
Authority Private Local
Authority Private 2 hours £1.33 £1.71 £1.35 £1.90 £1.35 £2.26 £1.36 £2.33 £1.46 £1.91 £1.50 £1.92 4 hours £2.34 £2.95 £2.30 £2.79 £2.32 £3.13 £2.30 £3.12 £2.37 £2.76 £2.43 £2.94 Bolton 7 hours £2.51 £3.85 £2.62 £3.92 £2.59 £4.42 £2.69 £4.42 £2.77 £3.91 £2.80 £4.33 2 hours £0.70 £1.00 £0.80 £1.30 £0.90 £1.00 £1.10 £1.50 £1.29 £1.70 £1.35 £1.80 4 hours £2.56 £2.50 £2.77 £2.50 £2.87 £2.00 £3.31 £2.00 £3.73 £2.20 £4.80 £2.30 Bury 7 hours £2.66 £10.00 £2.87 £10.00 £2.94 £10.00 £3.44 £10.00 £3.82 £10.00 £4.80 £10.00 2 hours £3.09 £3.09 £3.44 £3.67 £3.54 £4.03 £3.59 £3.45 £3.97 £3.83 £3.98 £3.89 4 hours £5.13 £3.57 £5.28 £4.33 £5.43 £4.62 £5.87 £4.53 £6.19 £4.97 £6.33 £4.70 Manchester 7 hours £7.96 £4.58 £8.10 £5.31 £8.51 £5.51 £9.01 £6.02 £9.68 £6.92 £10.43 £6.47 2 hours £1.18 £1.29 £1.14 £1.30 £1.18 £1.15 £1.38 £1.28 £1.57 £1.15 £1.60 £1.27 4 hours £2.05 £2.24 £2.09 £2.23 £2.09 £2.02 £2.39 £2.15 £2.77 £1.94 £2.86 £2.16 Oldham 7 hours £4.39 £5.86 £4.49 £5.80 £4.58 £5.02 £4.91 £5.04 £5.04 £4.62 £5.31 £4.84 2 hours £0.76 £0.50 £0.76 £1.00 £0.77 £1.00 £0.96 £1.00 £0.95 £1.06 £0.97 £1.06 4 hours £2.40 £2.22 £2.32 £1.95 £2.34 £2.01 £1.72 £2.01 £1.73 £2.01 £1.71 £2.01 Rochdale 7 hours £4.06 £5.00 £4.01 £6.75 £4.05 £6.81 £4.85 £7.12 £5.23 £6.83 £5.16 £6.83 2 hours £0.50 £2.00 £0.70 £1.07 £0.70 £1.07 £0.70 £1.06 £0.70 £1.09 £1.00 £1.07 4 hours £1.19 £2.00 £1.69 £2.00 £1.69 £1.79 £1.69 £1.79 £1.69 £2.55 £2.19 £2.00 Eccles 7 hours £3.68 £2.00 £3.87 £2.00 £3.87 £1.79 £3.87 £1.79 £3.87 £2.55 £4.06 £2.00 2 hours £1.00 £0.68 £1.04 £0.80 £0.96 £0.78 £0.93 £0.70 £1.37 £0.70 £1.47 £0.81 4 hours £2.53 £5.74 £2.56 £6.32 £2.54 £5.50 £2.89 £6.00 £3.02 £7.00 £3.25 £7.50 Stockport 7 hours £5.06 £5.74 £5.13 £6.32 £5.09 £5.50 £5.87 £6.00 £6.57 £7.00 £7.11 £7.50 2 hours £1.00 £1.02 £1.20 £1.33 £1.85 £1.35 £1.78 £1.72 £1.88 £1.78 £1.04 £1.78 4 hours £1.50 £1.76 £2.00 £2.48 £2.50 £2.49 £1.98 £3.79 £2.50 £3.91 £2.50 £3.80 Ashton-under-
Lyne 7 hours £2.00 £2.86 £2.50 £2.92 £3.50 £2.94 £2.77 £7.04 £3.50 £7.27 £3.50 £7.07 2 hours £1.06 £1.26 £1.06 £1.65 £0.78 £2.62 £0.73 £1.13 £0.86 £1.38 £1.04 £1.89 4 hours £3.07 £5.36 £2.77 £5.29 £2.48 £3.38 £2.31 £3.54 £2.76 £4.14 £2.75 £4.85 Altrincham 7 hours £5.17 £10.00 £5.17 £10.00 £5.17 £6.22 £3.86 £3.85 £4.89 £5.83 £4.87 £5.90 2 hours £1.15 £3.40 £1.20 £3.48 £1.20 £3.53 £1.20 £3.84 £1.28 £3.97 £1.30 £3.15 4 hours £2.62 £4.21 £2.50 £4.20 £2.50 £4.23 £2.50 £4.86 £2.66 £4.99 £2.70 £3.60 Wigan 7 hours £6.00 £4.21 £6.00 £4.27 £6.00 £4.31 £6.00 £4.42 £6.40 £4.54 £6.50 £4.53 2 hours £1.98 £2.12 £2.17 £2.33 £2.23 £2.55 £2.31 £2.34 £2.76 £2.40 £2.71 £2.42 4 hours £3.73 £3.68 £3.83 £3.66 £3.91 £3.62 £4.20 £3.74 £4.75 £3.86 £4.87 £3.78 TOTAL GM 7 hours £6.00 £5.21 £6.22 £5.41 £6.40 £5.34 £6.84 £5.63 £7.74 £5.97 £8.22 £5.90
Page 163
GM
TU R
eport 1387 Background Inform
ation

GMTU Report 1387 Background Information
Page 164
Figure 6.3 Spaces available in Public Car Parks in Key Centres in Greater Manchester
0
5000
10000
15000
20000
25000
30000
1997 1998 1999 2000 2001 2002 2003 2004 2005 2006 2007 1997 1998 1999 2000 2001 2002 2003 2004 2005 2006 2007
Year
Num
ber o
f spa
ces
2 hours 4 hours 7 hours
Local Authority Private
Figure 6.4 Average Prices of Public Car Parks in Key Centres in Greater Manchester
£0.00
£1.00
£2.00
£3.00
£4.00
£5.00
£6.00
£7.00
£8.00
£9.00
1997 1998 1999 2000 2001 2002 2003 2004 2005 2006 2007 1997 1998 1999 2000 2001 2002 2003 2004 2005 2006 2007
2 hours 4 hours 7 hours
Local Authority Private
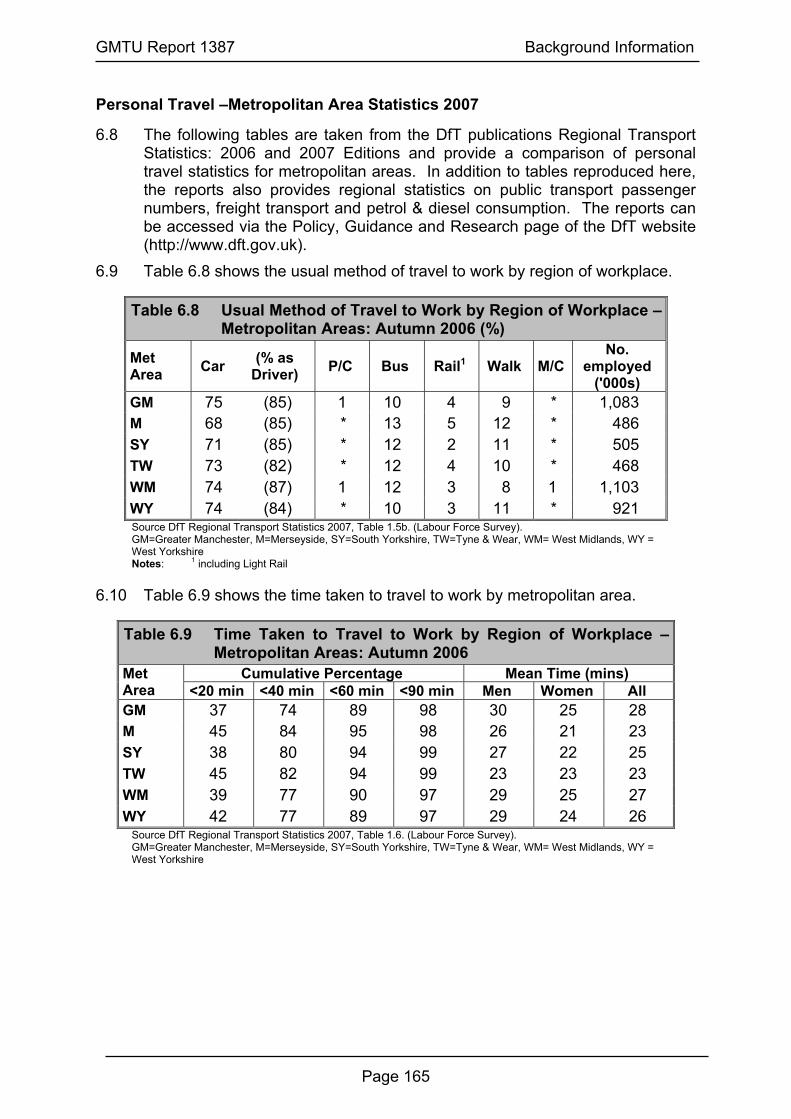
GMTU Report 1387 Background Information
Page 165
Personal Travel –Metropolitan Area Statistics 2007
6.8 The following tables are taken from the DfT publications Regional Transport Statistics: 2006 and 2007 Editions and provide a comparison of personal travel statistics for metropolitan areas. In addition to tables reproduced here, the reports also provides regional statistics on public transport passenger numbers, freight transport and petrol & diesel consumption. The reports can be accessed via the Policy, Guidance and Research page of the DfT website (http://www.dft.gov.uk).
6.9 Table 6.8 shows the usual method of travel to work by region of workplace.
Table 6.8 Usual Method of Travel to Work by Region of Workplace –Metropolitan Areas: Autumn 2006 (%)
Met Area Car (% as
Driver) P/C Bus Rail1 Walk M/C No.
employed ('000s)
GM 75 (85) 1 10 4 9 * 1,083 M 68 (85) * 13 5 12 * 486 SY 71 (85) * 12 2 11 * 505 TW 73 (82) * 12 4 10 * 468 WM 74 (87) 1 12 3 8 1 1,103 WY 74 (84) * 10 3 11 * 921 Source DfT Regional Transport Statistics 2007, Table 1.5b. (Labour Force Survey). GM=Greater Manchester, M=Merseyside, SY=South Yorkshire, TW=Tyne & Wear, WM= West Midlands, WY = West Yorkshire Notes: 1 including Light Rail
6.10 Table 6.9 shows the time taken to travel to work by metropolitan area.
Table 6.9 Time Taken to Travel to Work by Region of Workplace –Metropolitan Areas: Autumn 2006
Cumulative Percentage Mean Time (mins) Met Area <20 min <40 min <60 min <90 min Men Women All GM 37 74 89 98 30 25 28 M 45 84 95 98 26 21 23 SY 38 80 94 99 27 22 25 TW 45 82 94 99 23 23 23 WM 39 77 90 97 29 25 27 WY 42 77 89 97 29 24 26
Source DfT Regional Transport Statistics 2007, Table 1.6. (Labour Force Survey). GM=Greater Manchester, M=Merseyside, SY=South Yorkshire, TW=Tyne & Wear, WM= West Midlands, WY = West Yorkshire

GMTU Report 1387 Background Information
Page 166
6.11 Table 6.10 shows the average time taken to travel to work by mode and metropolitan area of workplace.
Table 6.10 Average time taken to travel to work (minutes) by mode–Metropolitan Areas: Autumn 2006
Met Area Car P/C Bus Rail1 Walk M/C All ModesGM 27 17 38 49 14 * 28
M 23 * 28 40 13 * 23 SY 23 * 36 43 15 * 25 TW 22 * 32 41 13 * 23 WM 26 17 36 55 14 19 27 WY 26 * 34 53 15 * 26
Source DfT Regional Transport Statistics 2007, Table 1.7. (Labour Force Survey). GM=Greater Manchester, M=Merseyside, SY=South Yorkshire, TW=Tyne & Wear, WM= West Midlands, WY = West Yorkshire Notes: 1 including Light Rail
6.12 Table 6.11 shows the average number of trips per person per year by main
mode of travel by metropolitan area for 2003-05.
Table 6.11 Trips per person per year by main mode of travel – Metropolitan Areas: 2003-2005
Met Area Walk Car dr Car pass Bus Other PT All ModesGM 264 427 252 87 33 1,086 M 252 412 212 98 39 1,034 SY 228 439 234 78 33 1,034 TW 281 363 220 116 50 1,048 WM 224 395 233 103 29 996 WY 230 392 225 77 31 970
Source DfT Regional Transport Statistics 2006, Table A3. (National Travel Survey).
6.13 Table 6.12 shows average number of miles travelled per year by mode and metropolitan area for 2003-05.
Table 6.12 Average distance travelled by main mode of travel –Metropolitan Areas: 2003-2005
Met Area Walk Car dr Car pass Bus Other PT All ModesGM 211 3,057 1,888 339 570 6,278 M 210 3,200 1,642 336 616 6,156 SY 180 3,846 2,177 318 604 7,363 TW 214 2,525 1,370 447 577 5,273 WM 177 2,784 1,749 417 571 5,838 WY 185 3,270 1,893 330 528 6,423
Source DfT Regional Transport Statistics 2006, Table A4. (National Travel Survey).
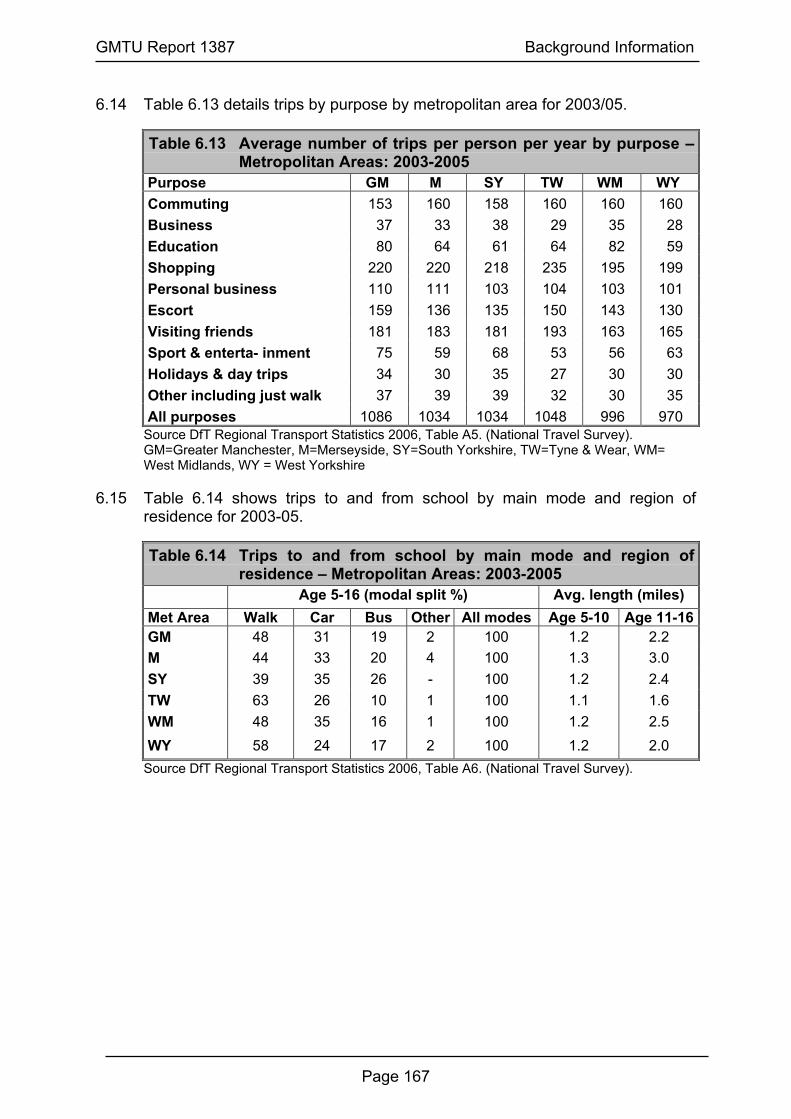
GMTU Report 1387 Background Information
Page 167
6.14 Table 6.13 details trips by purpose by metropolitan area for 2003/05.
Table 6.13 Average number of trips per person per year by purpose –Metropolitan Areas: 2003-2005
Purpose GM M SY TW WM WY Commuting 153 160 158 160 160 160 Business 37 33 38 29 35 28 Education 80 64 61 64 82 59 Shopping 220 220 218 235 195 199 Personal business 110 111 103 104 103 101 Escort 159 136 135 150 143 130 Visiting friends 181 183 181 193 163 165 Sport & enterta- inment 75 59 68 53 56 63 Holidays & day trips 34 30 35 27 30 30 Other including just walk 37 39 39 32 30 35 All purposes 1086 1034 1034 1048 996 970
Source DfT Regional Transport Statistics 2006, Table A5. (National Travel Survey). GM=Greater Manchester, M=Merseyside, SY=South Yorkshire, TW=Tyne & Wear, WM= West Midlands, WY = West Yorkshire
6.15 Table 6.14 shows trips to and from school by main mode and region of residence for 2003-05.
Table 6.14 Trips to and from school by main mode and region of residence – Metropolitan Areas: 2003-2005
Age 5-16 (modal split %) Avg. length (miles) Met Area Walk Car Bus Other All modes Age 5-10 Age 11-16GM 48 31 19 2 100 1.2 2.2 M 44 33 20 4 100 1.3 3.0 SY 39 35 26 - 100 1.2 2.4 TW 63 26 10 1 100 1.1 1.6 WM 48 35 16 1 100 1.2 2.5 WY 58 24 17 2 100 1.2 2.0
Source DfT Regional Transport Statistics 2006, Table A6. (National Travel Survey).
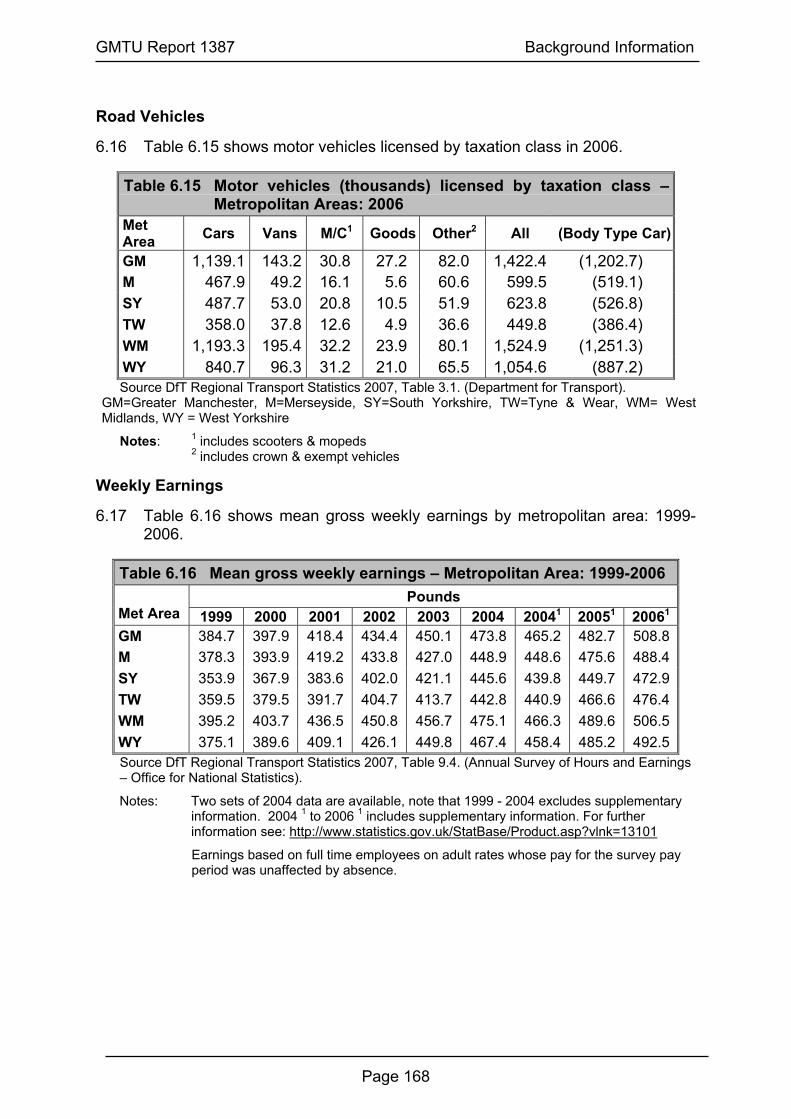
GMTU Report 1387 Background Information
Page 168
Road Vehicles
6.16 Table 6.15 shows motor vehicles licensed by taxation class in 2006.
Table 6.15 Motor vehicles (thousands) licensed by taxation class –Metropolitan Areas: 2006
Met Area Cars Vans M/C1 Goods Other2 All (Body Type Car)
GM 1,139.1 143.2 30.8 27.2 82.0 1,422.4 (1,202.7) M 467.9 49.2 16.1 5.6 60.6 599.5 (519.1) SY 487.7 53.0 20.8 10.5 51.9 623.8 (526.8) TW 358.0 37.8 12.6 4.9 36.6 449.8 (386.4) WM 1,193.3 195.4 32.2 23.9 80.1 1,524.9 (1,251.3) WY 840.7 96.3 31.2 21.0 65.5 1,054.6 (887.2) Source DfT Regional Transport Statistics 2007, Table 3.1. (Department for Transport).
GM=Greater Manchester, M=Merseyside, SY=South Yorkshire, TW=Tyne & Wear, WM= West Midlands, WY = West Yorkshire
Notes: 1 includes scooters & mopeds 2 includes crown & exempt vehicles
Weekly Earnings
6.17 Table 6.16 shows mean gross weekly earnings by metropolitan area: 1999-2006.
Table 6.16 Mean gross weekly earnings – Metropolitan Area: 1999-2006 Pounds
Met Area 1999 2000 2001 2002 2003 2004 20041 20051 20061
GM 384.7 397.9 418.4 434.4 450.1 473.8 465.2 482.7 508.8M 378.3 393.9 419.2 433.8 427.0 448.9 448.6 475.6 488.4SY 353.9 367.9 383.6 402.0 421.1 445.6 439.8 449.7 472.9TW 359.5 379.5 391.7 404.7 413.7 442.8 440.9 466.6 476.4WM 395.2 403.7 436.5 450.8 456.7 475.1 466.3 489.6 506.5WY 375.1 389.6 409.1 426.1 449.8 467.4 458.4 485.2 492.5Source DfT Regional Transport Statistics 2007, Table 9.4. (Annual Survey of Hours and Earnings – Office for National Statistics).
Notes: Two sets of 2004 data are available, note that 1999 - 2004 excludes supplementary information. 2004 1 to 2006 1 includes supplementary information. For further information see: http://www.statistics.gov.uk/StatBase/Product.asp?vlnk=13101
Earnings based on full time employees on adult rates whose pay for the survey pay period was unaffected by absence.

GMTU Report 1387 Background Information
Page 169
Air Transport
6.18 Table 6.17 shows landing and take-offs, passenger arrivals and departures and cargo handled for Manchester Airport and all UK airports between 1995 and 2006. Figure 6.5 illustrates these as indices.
Figure 6.5 Air Transport Indices for Manchester and UK Airports
90
100
110
120
130
140
150
160
170
180
190
200
1995 1996 1997 1998 1999 2000 2001 2002 2003 2004 2005 2006
Year
Inde
x 19
95=1
00
Mcr Aircraft Movements Mcr Passengers Mcr AirfreightUK Aircraft Movements UK Passengers UK Airfreight
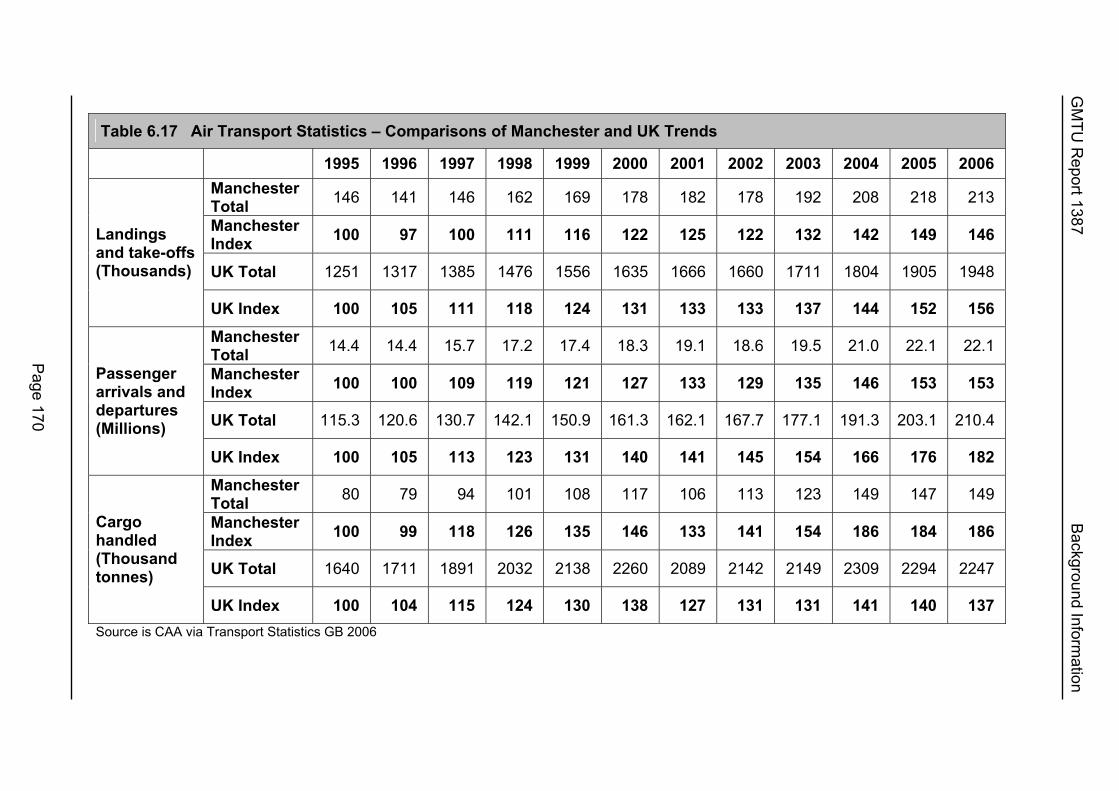
Table 6.17 Air Transport Statistics – Comparisons of Manchester and UK Trends
1995 1996 1997 1998 1999 2000 2001 2002 2003 2004 2005 2006 Manchester Total 146 141 146 162 169 178 182 178 192 208 218 213
Manchester Index 100 97 100 111 116 122 125 122 132 142 149 146
UK Total 1251 1317 1385 1476 1556 1635 1666 1660 1711 1804 1905 1948
Landings and take-offs (Thousands)
UK Index 100 105 111 118 124 131 133 133 137 144 152 156
Manchester Total 14.4 14.4 15.7 17.2 17.4 18.3 19.1 18.6 19.5 21.0 22.1 22.1
Manchester Index 100 100 109 119 121 127 133 129 135 146 153 153
UK Total 115.3 120.6 130.7 142.1 150.9 161.3 162.1 167.7 177.1 191.3 203.1 210.4
Passenger arrivals and departures (Millions)
UK Index 100 105 113 123 131 140 141 145 154 166 176 182
Manchester Total 80 79 94 101 108 117 106 113 123 149 147 149
Manchester Index 100 99 118 126 135 146 133 141 154 186 184 186
UK Total 1640 1711 1891 2032 2138 2260 2089 2142 2149 2309 2294 2247
Cargo handled (Thousand tonnes)
UK Index 100 104 115 124 130 138 127 131 131 141 140 137 Source is CAA via Transport Statistics GB 2006
Page 170
GM
TU R
eport 1387 Background Inform
ation

GM
TU R
eport 1387 Background Inform
ation
Road Lengths in Greater Manchester 2007
Table 6.18 Road Lengths in Greater Manchester 2007 (kilometres)
Trunk Principal B Roads C Roads U Roads Motorways Rural Urban Motorways Rural Urban Rural Urban Rural Urban Rural Urban All Roads
Bolton 18.3 0.0 0.0 0.0 27.2 74.2 12.3 36.7 26.8 20.1 45.3 728.3 989.2 Bury 20.7 0.0 0.0 0.0 6.0 49.1 3.0 29.0 0.5 37.1 40.4 509.6 695.4 Manchester 17.4 0.0 2.2 3.2 2.0 110.2 0.0 38.1 0.0 83.9 1.3 1107.0 1365.3 Oldham 6.6 0.2 4.0 0.0 39.5 54.6 5.0 26.2 1.6 30.0 70.6 595.2 833.5 Rochdale 24.2 0.0 0.0 0.0 15.5 64.1 3.5 20.5 23.2 11.1 40.9 595.7 798.7 Salford 30.1 0.0 0.0 0.0 3.3 84.2 1.2 30.5 25.2 3.4 0.0 616.5 794.4 Stockport 12.4 0.0 0.0 0.0 10.1 74.0 0.0 35.9 14.7 28.7 36.5 781.8 994.1 Tameside 15.3 2.1 1.1 0.0 3.5 59.6 0.0 30.8 0.3 37.1 33.8 582.8 766.4 Trafford 9.5 0.0 0.0 0.0 6.9 51.5 1.5 47.4 10.1 38.4 25.1 608.1 798.5 Wigan 16.7 0.0 0.0 0.0 30.0 86.6 11.2 43.5 35.2 32.5 56.9 827.3 1139.9
2.3 7.3 144.0 708.1 37.7 338.6 137.6 322.3 350.8 6952.3Greater Manchester 171.2 9.6 3.2 852.1 376.3 459.9 7303.1 9175.4
Notes: NB: The Trunk Motorway figures shown above are based on GMTU’s calculations. All other figures are based on road lengths published on the DfT’s website in October 2007. Urban roads are those within an urban area of 10,000 pop or more (1991 definition of urban settlement; 2001 National Census estimate). Rural roads are those outside an urban area. Motorways include "spurs" but exclude slip roads. Road lengths used in tables of vehicle kilometres differ slightly in this report as a simplified network has been used.
Page 171

GMTU Report 1387 Background Information
Page 172
Population of Greater Manchester
6.19 The Registrar General’s mid-year estimates of population for each district of Greater Manchester for the years 1971, 1981, 1991 and 1997-2006 are given in Table 6.19. The Office for National Statistics has recently revised the population estimates for 2002 to 2005. An estimate of household numbers from 1997 to 2004 (recently revised) is also given. Table 6.20 shows indices of population over time.
Table 6.19 The Registrar General’s Mid-Year Estimates of Population (Thousands)
1971 1981 1991 1997 1998 1999 2000 2001 2002 2003 2004 2005 2006Bolton 260.9 262.1 261.6 259.7 260.9 260.4 260.2 261.3 261.8 262.6 262.8 262.6 262.4Bury 175.7 177.1 178.3 179.7 180.6 181.0 180.9 180.7 181.2 181.9 181.7 182.4 182.9
Manchester 553.6 459.2 432.7 417.7 417.7 416.4 421.8 422.9 425.7 430.7 436.0 444.6 452.0
Oldham 224.9 221.4 218.5 218.9 218.7 218.4 218.1 218.5 218.4 218.6 219.0 219.5 219.6
Rochdale 204.3 208.2 203.9 204.0 204.5 204.9 206.1 206.4 206.4 207.1 206.7 206.6 206.5
Salford 281.5 249.2 230.8 223.9 221.6 220.0 218.7 217.0 216.1 216.5 216.1 216.7 218.0
Stockport 294.1 292.6 288.6 286.3 287.2 285.8 284.4 284.6 283.5 283.1 282.5 281.4 280.6
Tameside 222.0 218.6 218.0 216.1 214.9 213.6 212.9 213.1 213.4 213.7 213.9 213.8 214.4
Trafford 229.8 222.9 215.8 213.5 214.2 213.0 211.3 210.2 209.6 210.6 210.7 210.9 211.8
Wigan 303.3 307.0 305.6 302.1 301.7 302.0 302.0 301.5 301.9 303.1 303.9 304.8 305.5Greater Manchester 2750.1 2618.2 2553.6 2521.9 2521.9 2515.5 2516.3 2516.1 2518.1 2527.8 2533.5 2543.3 2553.8
Source: Population Estimates Unit, ONS: Crown Copyright. Note: Figures may not sum due to rounding Greater Manchester household numbers (thousands) * 1,027 1,029 1,028 1,033 1,052 1,061 1,071 1,078 - -
Source: DfT Regional Transport Statistics 2007, Table 9.2 (From: Dept. for Communities and Local Government).
Table 6.20 Indices of Population Change (1971-2006) 1971 1981 1991 1997 1998 1999 2000 2001 2002 2003 2004 2005 2006Bolton 100 100 100 100 100 100 100 100 100 101 101 101 101Bury 100 101 101 102 103 103 103 103 103 104 103 104 104
Manchester 100 83 78 75 75 75 76 76 77 78 79 80 82
Oldham 100 98 97 97 97 97 97 97 97 97 97 98 98
Rochdale 100 102 100 100 100 100 101 101 101 101 101 101 101
Salford 100 89 82 80 79 78 78 77 77 77 77 77 77
Stockport 100 99 98 97 98 97 97 97 96 96 96 96 95
Tameside 100 98 98 97 97 96 96 96 96 96 96 96 97
Trafford 100 97 94 93 93 93 92 91 91 92 92 92 92
Wigan 100 101 101 100 99 100 100 99 100 100 100 100 101Greater Manchester 100 95 93 92 92 91 91 91 92 92 92 92 93
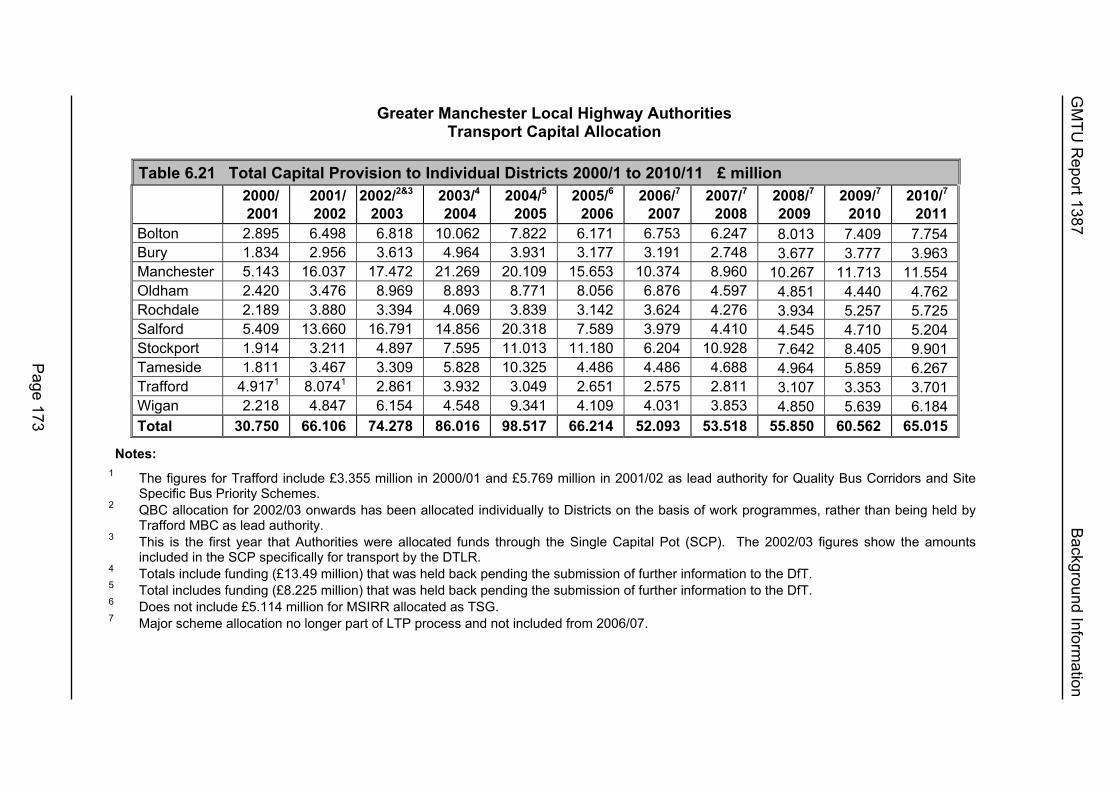
Greater Manchester Local Highway Authorities Transport Capital Allocation
Table 6.21 Total Capital Provision to Individual Districts 2000/1 to 2010/11 £ million
2000/ 2001
2001/ 2002
2002/2&3
2003 2003/4
2004 2004/5
2005 2005/6
2006 2006/7
2007 2007/7
2008 2008/7
2009 2009/7
2010 2010/7
2011 Bolton 2.895 6.498 6.818 10.062 7.822 6.171 6.753 6.247 8.013 7.409 7.754 Bury 1.834 2.956 3.613 4.964 3.931 3.177 3.191 2.748 3.677 3.777 3.963 Manchester 5.143 16.037 17.472 21.269 20.109 15.653 10.374 8.960 10.267 11.713 11.554 Oldham 2.420 3.476 8.969 8.893 8.771 8.056 6.876 4.597 4.851 4.440 4.762 Rochdale 2.189 3.880 3.394 4.069 3.839 3.142 3.624 4.276 3.934 5.257 5.725 Salford 5.409 13.660 16.791 14.856 20.318 7.589 3.979 4.410 4.545 4.710 5.204 Stockport 1.914 3.211 4.897 7.595 11.013 11.180 6.204 10.928 7.642 8.405 9.901 Tameside 1.811 3.467 3.309 5.828 10.325 4.486 4.486 4.688 4.964 5.859 6.267 Trafford 4.9171 8.0741 2.861 3.932 3.049 2.651 2.575 2.811 3.107 3.353 3.701 Wigan 2.218 4.847 6.154 4.548 9.341 4.109 4.031 3.853 4.850 5.639 6.184 Total 30.750 66.106 74.278 86.016 98.517 66.214 52.093 53.518 55.850 60.562 65.015
Notes: 1 The figures for Trafford include £3.355 million in 2000/01 and £5.769 million in 2001/02 as lead authority for Quality Bus Corridors and Site
Specific Bus Priority Schemes. 2 QBC allocation for 2002/03 onwards has been allocated individually to Districts on the basis of work programmes, rather than being held by
Trafford MBC as lead authority. 3 This is the first year that Authorities were allocated funds through the Single Capital Pot (SCP). The 2002/03 figures show the amounts
included in the SCP specifically for transport by the DTLR. 4 Totals include funding (£13.49 million) that was held back pending the submission of further information to the DfT. 5 Total includes funding (£8.225 million) that was held back pending the submission of further information to the DfT. 6 Does not include £5.114 million for MSIRR allocated as TSG. 7 Major scheme allocation no longer part of LTP process and not included from 2006/07.
Page 173
GM
TU R
eport 1387 Background Inform
ation

GMTU Report 1387 Background Information
Page 174
Table 6.22 Greater Manchester LTP Settlement 2008/09 (£ million)
Integrated Transport Block Maintenance
Local Authority Other SEMMMS
All Integrated Formula
PRN/ Exceptional
All Maintenance Total
Bolton 2.244 0.000 2.244 4.259 1.510 5.769 8.013Bury 1.488 0.000 1.488 1.689 0.500 2.189 3.677Manchester 4.584 1.464 6.048 3.869 0.350 4.219 10.267Oldham 1.925 0.000 1.925 2.231 0.695 2.926 4.851Rochdale 1.797 0.000 1.797 2.137 0.000 2.137 3.934Salford 2.261 0.000 2.261 2.127 0.157 2.284 4.545Stockport 2.156 2.928 5.084 2.056 0.502 2.558 7.642Tameside 1.725 1.146 2.871 2.093 0.000 2.093 4.964Trafford 1.640 0.000 1.640 1.467 0.000 1.467 3.107Wigan 2.449 0.000 2.449 2.401 0.000 2.401 4.850GMPTA 17.077 0.828 17.905 0.000 0.000 0.000 17.905Total 39.346 6.366 45.712 24.329 3.714 28.043 73.755
Notes: Other consists of minor works (£35.846 million) and GM Transport Infrastructure Fund (£3.5 million).
PRN refers to structural maintenance on the PRN. Exceptional refers the Exceptional Maintenance Scheme for Dan Bank Slope in Stockport (£502,013).
Extra funds not included above are:- 1. Specific Road Safety Grant capital (£664,000) to fund safety camera operation, the road safety
central team, publicity campaigns & resource development. 2. Transport Resource Grant consisting of Specific Road Safety Grant revenue £2.986 million and
Detrunked Roads Maintenance revenue Stockport (£311,000) Tameside (£52,000).
Table 6.23 Greater Manchester LTP Settlement 2009/10 (£ million)
Integrated Transport Block Maintenance
Local Authority Other SEMMMS
All Integrated Formula
PRN/ Exceptional
All Maintenance Total
Bolton 2.381 0.000 2.381 4.028 1.000 5.028 7.409Bury 1.578 0.000 1.578 1.699 0.500 2.199 3.777Manchester 4.862 1.503 6.365 4.256 1.092 5.348 11.713Oldham 2.041 0.000 2.041 2.399 0.000 2.399 4.440Rochdale 1.906 0.000 1.906 2.351 1.000 3.351 5.257Salford 2.370 0.000 2.370 2.340 0.000 2.340 4.710Stockport 2.287 3.006 5.293 2.261 0.851 3.112 8.405Tameside 1.830 1.176 3.006 2.303 0.550 2.853 5.859Trafford 1.739 0.000 1.739 1.614 0.000 1.614 3.353Wigan 2.598 0.000 2.598 2.641 0.400 3.041 5.639GMPTA 17.904 0.850 18.754 0.000 0.000 0.000 18.754Total 41.496 6.535 48.031 25.892 5.393 31.285 79.316
Notes: Other consists of minor works (£38.846 million) and GM Transport Infrastructure Fund (£3.5 million).
PRN refers to structural maintenance on the PRN. Exceptional refers the Exceptional Maintenance Scheme for Dan Bank Slope in Stockport (£850,783).
Extra funds not included above are:- 1. Specific Road Safety Grant capital (£754,000) to fund safety camera operation, the road safety
central team, publicity campaigns & resource development. 2. Transport Resource Grant consisting of Specific Road Safety Grant revenue £3.387 million and
Detrunked Roads Maintenance revenue Stockport (£319,000) Tameside (£53,000).

GMTU Report 1387 Background Information
Page 175
Table 6.24 Greater Manchester LTP Settlement 2010/11 (£ million)
Integrated Transport Block Maintenance
Local Authority Other SEMMMS
All Integrated Formula
PRN/ Exceptional
All Maintenance Total
Bolton 2.525 0.000 2.525 4.229 1.000 5.229 7.754Bury 1.674 0.000 1.674 1.789 0.500 2.289 3.963Manchester 5.156 1.504 6.660 4.894 0.000 4.894 11.554Oldham 2.165 0.000 2.165 2.597 0.000 2.597 4.762Rochdale 2.021 0.000 2.021 2.704 1.000 3.704 5.725Salford 2.513 0.000 2.513 2.691 0.000 2.691 5.204Stockport 2.426 3.008 5.434 2.601 1.866 4.467 9.901Tameside 1.941 1.177 3.118 2.599 0.550 3.149 6.267Trafford 1.845 0.000 1.845 1.856 0.000 1.856 3.701Wigan 2.756 0.000 2.756 3.028 0.400 3.428 6.184GMPTA 18.776 0.851 19.627 0.000 0.000 0.000 19.627Total 43.798 6.539 50.338 28.988 5.316 34.304 84.642
Notes: Other consists of minor works (£40.299 million) and GM Transport Infrastructure Fund (£3.5 million).
PRN refers to structural maintenance on the PRN. Exceptional refers the Exceptional Maintenance Scheme for Dan Bank Slope in Stockport (£1.866 million).
Extra funds not included above are:- 1. Specific Road Safety Grant capital (£784,000) to fund safety camera operation, the road safety
central team, publicity campaigns & resource development. 2. Transport Resource Grant consisting of Specific Road Safety Grant revenue £3.526 million and
Detrunked Roads Maintenance revenue Stockport (£327,000) Tameside (£54,000).

GMTU Report 1387 Background Information
Page 176
Highway Schemes
Table 6.25 Highway Schemes over £1 Million completed 1986- Spring 2008
Authority Name/Description Cost £M
Opening Date
Stockport Tameside Stockport Manchester/ Salford Trafford Manchester Salford Department of Transport
Southern Link Rd (B5465 St Marys Way) A new single carriageway link 0.8 km providing a link between Hall St (A626) and Wellington Rd South (A6). Hyde Town Centre Bypass (A627 Clark Way) A new route comprising 0.8 km new dual carriageway and 0.5 km single carriageway widening of existing roads providing a northern bypass between Manchester Rd and Market St. A626 Diversion Stockport (A626 St Marys Way) A new wide single carriageway link 0.9 km long between Hall St A626 and the M63 (now M60)/A626 roundabout. A6042 Manchester and Salford Inner Relief Route Blackfriars Rd - Jubilee St New dual carriageway link 0.6 km long which includes a new bridge across the River Irwell between Manchester and Salford linking Blackfriars Rd (A6041) and Great Ducie St (A56). A6144(M) Carrington Spur A new single carriageway motorway link (A6144 (M)) linking the M63 Junction 6 (now M60 Jn 8) to Carrington Ln (A6144). A5103 Princess Rd Improvement, Moss Side Widening to dual carriageway standard of the final 1 km section of the A5103 between the M56 and Manchester City Centre, concluding with changes to Greenheys Ln junction. A6042 Manchester and Salford Inner Relief Route Blackfriars Rd - Gore St A new dual carriageway link 0.5 km long between Chapel St (A6) and Blackfriars Rd (A6041). M62 Eastbound Climbing Lane (Junctions 21 to 22)
1.2
1.9
3.4
4.6
7.1
2.9
5.1
3.8
06/86
07/86
12/86
03/87
12/87
03/88
08/88
12/88

GMTU Report 1387 Background Information
Page 177
Table 6.25 (cont.) Highway Schemes over £1 Million completed 1986- Spring 2008
Authority Name/Description Cost £M
Opening Date
Salford Department of Transport Manchester Manchester/ Salford Wigan Manchester Bolton
A57 Regent Rd Improvement M602 to Water St Widening of dual carriageway standard of 1.5 km of Regent Rd (A57) between the M602 and the Regional Centre. M63/M66 Portwood - Denton A new dual 3-lane carriageway route linking the M63 at Portwood at the southern end, to the M67 at Denton at the northern end. This is the last but one section of the Manchester Outer Ring Road (now M60 Jns 24-27). A6042 Manchester and Salford Inner Relief Route Cheetham Hill Rd - Jubilee St Widening of 0.3 km of New Bridge St to dual carriageway standard between Great Ducie St (A56) and Cheetham Hill Rd (A665). Manchester and Salford Inner Relief Route A57 Regent Rd - A56 Chester Rd (Phase 1) Improvement at the junction of Regent Rd (A57) and Water St (A6143). Wigan Inner Relief Road A49 River Way/Central Park Way A new route comprising new dual carriageway, new single carriageway and improvements to existing roads to provide a bypass to the A49 around Wigan town centre between Wallgate to the south and Wigan Ln to the north. A665 Manchester and Salford Inner Relief Route Redhill St - Fairfield St Widening of dual carriageway standard of 0.5 km of the A665 Great Ancoats St and Pin Mill Brow including a new junction arrangement at the Pin Mill Brow (A665) and Ashton Old Rd (A635). A666 St. Peter's Way Extension/A673 Topp Way Dualling Dual carriageway extension (0.7 km long) to A666 St. Peter's Way and addition of second carriageway to 0.5 km long A673 Topp Way in the north of Bolton town centre.
6.6
50.1
1.1
1.2
14.8
6.5
5.2
07/89
04/89
06/89
07/89
10/89
10/89
11/89

GMTU Report 1387 Background Information
Page 178
Table 6.25 (cont.) Highway Schemes over £1 Million completed 1986- Spring 2008
Authority Name/Description Cost £M
Opening Date
Department of Transport Salford Wigan Bury Bolton Tameside Manchester
M63 Widening (Junctions 1 to 7) Widening of the M63 from dual 2-lane carriageway to dual 3-lane carriageway in four separate stages (now M60 Jns 7-12). A5063 Trafford Rd Improvement, M602 - The Quays Widening of dual carriageway standard of 0.8 km of A5063 Trafford Road between the Salford Quays Development and the M602. A572 Bradshawgate Diversion, Leigh Spinning Jenny Way A 1.5 km long single carriageway bypass to the A572 Bradshawgate, Leigh, which is a major shopping street. A665 Blackburn St Diversion, Radcliffe Pilkington Way Dual carriageway bypass of Radcliffe town centre between Blackburn St/Stand Ln junction and Blackburn St/Darbyshire St junction. A58 Cricketers Way Single carriageway bypass of Westhoughton town centre. A635 Manchester Rd - A6017 Stockport Rd - William St Gyratory Signalised gyratory system using modified existing road network. Manchester Intermediate Ring Road - A6010 Stage 1, Phases 1&2, Kirkmanshulme Ln to Pottery Ln (Alan Turing Way) Phase 1 Dual carriageway section of the Intermediate Ring Road between Kirkmanshulme Ln and the A57 Hyde Rd. Phase 2 Dual carriageway section between A57 Hyde Rd and Pottery Ln.
51.8
4.5
4.7
7.9
4.0
2.9
6.8
03/90
06/90
06/90
06/91
09/91
10/91
03/92

GMTU Report 1387 Background Information
Page 179
Table 6.25 (cont.) Highway Schemes over £1 Million completed 1986- Spring 2008
Authority Name/Description Cost £M
Opening Date
Salford Stockport Stockport Manchester Wigan Manchester Oldham Oldham
A57 Cadishead Way Stage 1 Boysnope Wharf to Brinell Drive (North). A single 2 lane carriageway bypassing Irlam. Brinksway Bridge – 40 metre span, weathering steel structure Brinksway Phase I and Phase II A new dual carriageway bridge over the River Mersey and improvements to access to the Travis Brow Interchange and Kings Valley Development north of the river. A6/A57(M) Mancunian Way A major junction improvement involving the conversion of the former A6/A57(M) roundabout to a grade separated signalised junction with A57(M) dual carriageway flyover. A579 Lowton St Mary's Bypass A new 1.2 km long wide single carriageway link between the A572 and A580(T) forming a southern extension to Atherleigh Way, Leigh. Manchester Airport Access Roads - Stage 1 and Stage 2 Widening of existing Outwood Ln roundabout to improve capacity and a grade separated access to new Terminal 2 from M56 Spur. Broadgate Spine Road New road between A663 Broadway and Foxdenton Ln. A62 Manchester St/Manchester Rd Improvement Scheme Upgrading the existing single carriageway road to a 1.5 mile dual carriageway from South St to Oldham Way to cater for growth in traffic when the Manchester Outer Ring Road is completed.
13.2
1.9
4.5
16.3
4.8
5.5
2.5
17.7
03/92
04/92
07/92
08/92
12/92
04/93
09/93
12/93

GMTU Report 1387 Background Information
Page 180
Table 6.25 (cont.) Highway Schemes over £1 Million completed 1986- Spring 2008
Authority Name/Description Cost £M
Opening Date
Department of Transport Salford/ Trafford/ TPDC Department of Transport Stockport Stockport/ Cheshire Stockport/ Cheshire Salford Manchester Manchester Stockport/ Cheshire
M62 Junctions 14 to 17 Widening of the carriageway to dual four lanes (now M60 Jns 14-17). A576 Centenary Way including Centenary Bridge A5081 Park Way/M602 Link Rd - Eccles Relief Rd New dual carriageway road connecting Trafford Park with M602 at Eccles including new bridge across the Manchester Ship Canal. Scheme includes the dualling of Tenax Rd and part of Guiness Rd. M56 Junctions 4 to 6 Widening of the carriageway to dual four lanes. A626 Tiviot Way Bridge Replacement bridge – 30 metre span A34 Handforth/Wilmslow Bypass Stage 1 A dual carriageway bypass road for Handforth and Wilmslow also providing access to the new retail centre at Handforth Dean. A555 Manchester Airport Eastern Link Rd (Central Section) A dual carriageway 3.9 km long between B5358 Wilmslow Road and A5102 Woodford Road A57 Cadishead Way Stage 2 Phase 1 Extending Stage 1 of the scheme southwards to Brinell Drive (south) through Northbank Industrial Estate. Manchester Hulme Strategic Roads Greenheys Ln West, Chichester Rd, Old Birley St A6010 Intermediate Ring Rd Stage 2A and 2B Alan Turing Way Completion of dual carriageway A34 Handforth Wilmslow Bypass Stage 2 A dual carriageway bypass road for Wilmslow.
14.5
36.0
11.8
1.9
90.2
11.8
2.5
2.3
43.0
28.0
08/94
12/94
12/94
12/94
10.95
10/95
10/95
09/96
08/96
12/96

GMTU Report 1387 Background Information
Page 181
Table 6.25 (cont.) Highway Schemes over £1 Million completed 1986- Spring 2008
Authority Name/Description Cost £M
Opening Date
Manchester Trafford Park UDC Trafford Salford/ Trafford Salford/ Manchester Oldham Wigan Salford DETR DETR
Stretford Road, Hulme Reopening of Stretford Rd through Hulme A5081 Wharfside Way Eastern Spinal Route Improvements M60 – White City Interchange. A56 Bridgewater Way/White City Interchange New 2.0 km dual carriageway road connecting White City Interchange to A56 at Cornbrook. A5063 Trafford Rd Improvements The Quays – White City Manchester and Salford Inner Relief Route, A57 Regent Rd to A56 Chester Rd, Phase 2 Stages 1&2 Improvements to the A57/A56 junction, incorporating an underpass for the A57, traffic signals in the redesigned roundabout with pedestrian and cycle facilities, the removal of the A56 flyover, and widening to dual carriageway between A56 and A57 Regent Rd/A6042 Water St junction. A62 Oldham Way/A62 Manchester Rd Improvements to pedestrian and cycle crossings together with highway improvements. A49 Saddle Junction, Robin Park Signalised gyratory Eccles Bypass 1 km single carriageway bypassing town centre M60 J25-1 ‘MORRIS’ Widening M60 J18 ‘MORRIS’ Roundabout improvement and provision of free flow lane.
2.6
18.0
35.2
24.0
14.1
7.3
1.8
2.2
5.8
9.0
08/97
02/98
02/98
05/98
06/99
12/99
09/00
11/00
10/00
10/00
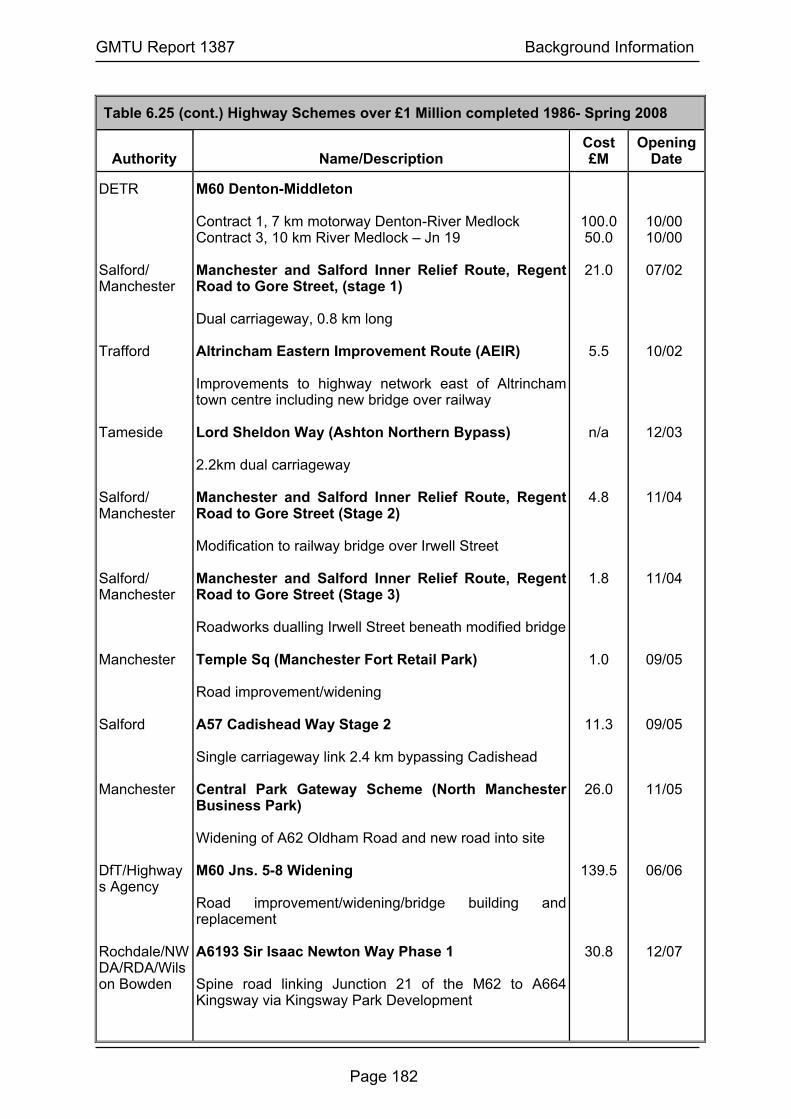
GMTU Report 1387 Background Information
Page 182
Table 6.25 (cont.) Highway Schemes over £1 Million completed 1986- Spring 2008
Authority Name/Description Cost £M
Opening Date
DETR Salford/ Manchester Trafford Tameside Salford/ Manchester Salford/ Manchester Manchester Salford Manchester DfT/Highways Agency Rochdale/NWDA/RDA/Wilson Bowden
M60 Denton-Middleton Contract 1, 7 km motorway Denton-River Medlock Contract 3, 10 km River Medlock – Jn 19 Manchester and Salford Inner Relief Route, Regent Road to Gore Street, (stage 1) Dual carriageway, 0.8 km long Altrincham Eastern Improvement Route (AEIR) Improvements to highway network east of Altrincham town centre including new bridge over railway Lord Sheldon Way (Ashton Northern Bypass) 2.2km dual carriageway Manchester and Salford Inner Relief Route, Regent Road to Gore Street (Stage 2) Modification to railway bridge over Irwell Street Manchester and Salford Inner Relief Route, Regent Road to Gore Street (Stage 3) Roadworks dualling Irwell Street beneath modified bridge Temple Sq (Manchester Fort Retail Park) Road improvement/widening A57 Cadishead Way Stage 2 Single carriageway link 2.4 km bypassing Cadishead Central Park Gateway Scheme (North Manchester Business Park) Widening of A62 Oldham Road and new road into site M60 Jns. 5-8 Widening Road improvement/widening/bridge building and replacement A6193 Sir Isaac Newton Way Phase 1 Spine road linking Junction 21 of the M62 to A664 Kingsway via Kingsway Park Development
100.0 50.0
21.0
5.5
n/a
4.8
1.8
1.0
11.3
26.0
139.5
30.8
10/00 10/00
07/02
10/02
12/03
11/04
11/04
09/05
09/05
11/05
06/06
12/07

GMTU Report 1387 Background Information
Page 183
Table 6.25 (cont.) Highway Schemes over £1 Million completed 1986- Spring 2008
Authority Name/Description Cost £M
Opening Date
Bury Derby Way Link Road Single carriageway link 300m between Rochdale Road and Moorgate
10.0 02/08
Major Public Transport Schemes
Table 6.26 Major Public Transport Schemes over £5 million completed 1993-2007
Authority Name/Description Cost £M Opening
Date GMPTA Airport Rail Link
Northern Chord & additional rolling stock
15.0 03/93
GMPTA/British Rail/Airport/ Cheshire/ERDF
Airport Rail Link Southern Chord
6.0 01/96
GMPTA/Private/ERDF/Salford/ DETR
Metrolink Phase 2 Manchester to Salford Quays and Eccles
148.0 07/00
GMPTA Middleton Bus Station 5.3 08/05
GMPTA/Manchester/ERDF
Central Park Gateway Scheme (North Manchester Business Park) Metrolink Station and bridges
10.8 11/05
GMPTA Shudehill Interchange Bus Station/ Metrolink Interchange (opened March 2004) and multi-storey car park (opened December 2005)
28.0 01/06
GMPTA Salford Central Station Phase 1 Redevelopment
5.0 12/07

GMTU Report 1387 Background Information
Page 184
BV 106: New Homes on Previously Developed Land
6.20 Table 6.27 shows the percentage of new homes built on previously developed
land by each district.
Table 6.27 BV 106 – Percentage of new homes built on previously developed land
District 2001/02 2002/03 2003/04 2004/05 2005/06 2006/07 2007/08Bolton 78.0 83.0 82.00 78.0 87.0 96.0 91.0 Bury 76.1 85.5 93.50 91.0 85.0 86.0 96.0 Manchester 91.0 95.0 89.20 93.5 90.0 92.0 94.0 Oldham 80.0 86.6 84.00 84.0 85.0 82.0 93.0 Rochdale 79.0 66.0 77.00 57.0 80.0 87.0 N/a Salford 97.0 99.0 99.00 94.3 87.8 91.2 99.0 Stockport 93.0 97.2 98.50 92.7 98.9 98.4 *97.1 Tameside 69.1 63.9 74.00 79.2 84.9 80.3 75.8 Trafford 78.0 90.5 91.00 92.0 76.0 81.0 72.0 Wigan 75.7 64.6 50.00 67.1 88.0 96.0 92.0
Notes: Rochdale data not available in 2007/08. Stockport data April –Sep only
Weather Data
6.21 Figures 6.6 to 6.8 present summaries of average temperature, rainfall and hours of sunshine at the Meteorological Office weather station in Woodford, Greater Manchester for 2005 to 2007.
Figure 6.6 Monthly Mean Temperature 2005 to 2007
0.02.04.06.08.0
10.012.014.016.018.020.022.0
Jan Feb Mar Apr May Jun Jul Aug Sep Oct Nov Dec
O c
entig
rade
2005 2006 2007

GMTU Report 1387 Background Information
Page 185
Figure 6.7 Monthly Rainfall 2005 to 2007
0.0
20.0
40.0
60.0
80.0
100.0
120.0
140.0
Jan Feb Mar Apr May Jun Jul Aug Sep Oct Nov Dec
mm
2005 2006 2007
Figure 6.8 Average Monthly Hours of Sunshine 2005 to 2007
0
50
100
150
200
250
Jan Feb Mar Apr May Jun Jul Aug Sep Oct Nov Dec
Hou
rs
2005 2006 2007


APPENDIX 1 TRAFFIC COUNT FACTORS


GMTU Report 1387 Traffic Count Factors
A1.1
Introduction
The GMTU Traffic Counts System (COUNTS) incorporates factors which are applied to single day counts to produce estimates of annual average flows. Three types of factor are involved. These are: (i) Split-shift to 12-hour factors which are used to estimate single day 12-hour vehicle-specific flows from shorter period counts. These factors are calculated from all available 12-hour continuous counts held on the COUNTS system;
(ii) Factors to estimate average 12, 16, 18 and 24-hour flows from 12-hour
counts. These are based on all available data from continuous Automatic Traffic Counting (ATC) sites throughout the county;
(iii) Year to year factors. A new year to year factor is added each year and factors (i) and (ii) have been updated periodically as new data has become available. This appendix presents factors that have been produced from 2006 (split shift) and 2007 (12-hour to longer period) data. These are applied to counts in 2008. Factors currently applied to earlier counts are available on request.

GMTU Report 1387 Traffic Count Factors
A1.2
Traffic Count Factors A. Split Shift to 12-Hour The factors and their associated standard deviations were derived from 12 hour manual classified counts undertaken at 23 motorway, 122 A road and 157 B, C or U road sites throughout the county during 2006. All sites were 2-way.
12-Hour Flow = AM Peak 2-Hour Count x A1 Estimate
+ Off-Peak 2-Hour Count x A2 or A3
+ PM Peak 2-Hour Count x A4 Factors to estimate 12-hour motor vehicle counts to average 12, 16, 18 and 24-hour motor vehicle flows and the standard deviations of the estimates were derived from 2007 Automatic Traffic Count (ATC) data at 32 two-way motorway and 64-two way non-motorway sites throughout the county. B. 12-Hour to 12-Hour Annual Average Weekday (AAWT)
12-Hour Annual Average 12-Hour Flow Weekday Estimate = weekday (W) x B (W,M)
month (M) C. 12-Hour to 16-Hour Annual Average Weekday (AAWT)
16-Hour Annual Average 12-Hour Flow Weekday Estimate = weekday (W) x C (W,M)
month (M) D. 12-Hour to 18-Hour Annual Average Weekday (AAWT)
18-Hour Annual Average 12-Hour Flow Weekday Estimate = weekday (W) x D (W,M)
month (M) E. 12-Hour to 24-Hour Annual Average Weekday Traffic (AAWT)
24-Hour Annual Average 12-Hour Flow Weekday Estimate = weekday (W) x E (W,M)
month (M) F. 12-Hour to 24-Hour Annual Average Daily Traffic (AADT)
24-Hour Annual Average 12-Hour Flow Day Estimate = weekday (W) x F (W,M)
month (M) G. Year to Year Factors
Indices of motor vehicle traffic growth since 1979 are provided to allow counts to be factored to a common base.

GMTU Report 1387 Traffic Count Factors
A1.3
A Split Shift to 12-Hour Factors 1. Factors
Road Class Time Period Car LGV OGV Buses
Motor Cycle
Pedal Cycle
All Motor Vehicles
A1 07:30-09:30 1.424 1.567 1.539 1.686 1.352 1.455A2 10:00-12:00 3.318 3.181 2.949 3.533 4.047 3.237
A3 12:00-14:00 3.090 3.260 2.968 3.959 3.991 3.094Motorways
A4 16:00-18:00 1.435 1.241 1.306 1.453 1.417 1.403
A1 07:30-09:30 1.364 1.464 1.507 1.446 1.454 1.558 1.383A2 10:00-12:00 3.466 2.992 2.748 3.531 5.442 4.190 3.327
A3 12:00-14:00 2.978 3.172 3.178 3.756 3.493 3.528 3.015A Roads
A4 16:00-18:00 1.432 1.280 1.227 1.404 1.401 1.424 1.409
A1 07:30-09:30 1.316 1.441 1.446 1.370 1.393 1.437 1.334A2 10:00-12:00 3.548 3.057 2.840 3.194 3.935 3.713 3.415
A3 12:00-14:00 3.061 3.232 3.179 3.236 2.888 3.264 3.082B C U Roads
A4 16:00-18:00 1.429 1.305 1.145 1.275 1.402 1.479 1.410
2. Standard Deviations Associated with Factors
Road Class Time Period Car LGV OGV Buses
Motor Cycle
Pedal Cycle
All Motor Vehicles
A1 07:30-09:30 0.082 0.108 0.053 0.362 0.187 0.076A2 10:00-12:00 0.368 0.286 0.243 1.736 1.736 0.282
A3 12:00-14:00 0.203 0.295 0.165 1.238 3.877 0.160Motorways
A4 16:00-18:00 0.061 0.047 0.086 0.336 0.268 0.051
A1 07:30-09:30 0.062 0.109 0.176 0.222 0.393 0.799 0.062A2 10:00-12:00 0.336 0.284 0.481 1.587 3.496 3.202 0.268
A3 12:00-14:00 0.165 0.277 0.470 1.697 2.180 2.220 0.145A Roads
A4 16:00-18:00 0.075 0.078 0.163 0.284 0.370 0.442 0.068
A1 07:30-09:30 0.088 0.231 0.435 0.334 0.715 0.734 0.089A2 10:00-12:00 0.467 0.550 1.305 1.714 2.900 2.627 0.391
A3 12:00-14:00 0.280 0.743 1.388 1.494 2.044 2.524 0.262B C U Roads
A4 16:00-18:00 0.104 0.163 0.249 0.274 0.697 0.691 0.098
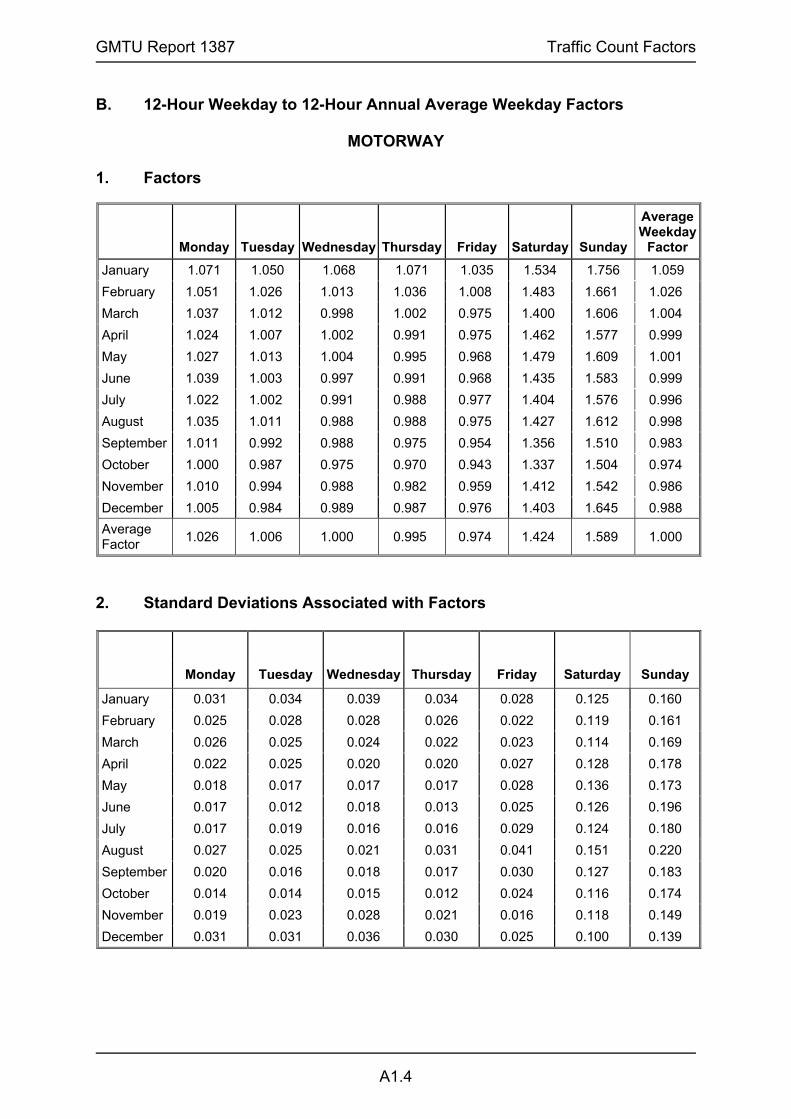
GMTU Report 1387 Traffic Count Factors
A1.4
B. 12-Hour Weekday to 12-Hour Annual Average Weekday Factors MOTORWAY 1. Factors
Monday Tuesday Wednesday Thursday Friday Saturday Sunday
Average Weekday
Factor January 1.071 1.050 1.068 1.071 1.035 1.534 1.756 1.059 February 1.051 1.026 1.013 1.036 1.008 1.483 1.661 1.026 March 1.037 1.012 0.998 1.002 0.975 1.400 1.606 1.004 April 1.024 1.007 1.002 0.991 0.975 1.462 1.577 0.999 May 1.027 1.013 1.004 0.995 0.968 1.479 1.609 1.001 June 1.039 1.003 0.997 0.991 0.968 1.435 1.583 0.999 July 1.022 1.002 0.991 0.988 0.977 1.404 1.576 0.996 August 1.035 1.011 0.988 0.988 0.975 1.427 1.612 0.998 September 1.011 0.992 0.988 0.975 0.954 1.356 1.510 0.983 October 1.000 0.987 0.975 0.970 0.943 1.337 1.504 0.974 November 1.010 0.994 0.988 0.982 0.959 1.412 1.542 0.986 December 1.005 0.984 0.989 0.987 0.976 1.403 1.645 0.988 Average Factor 1.026 1.006 1.000 0.995 0.974 1.424 1.589 1.000
2. Standard Deviations Associated with Factors
Monday Tuesday Wednesday Thursday Friday Saturday Sunday
January 0.031 0.034 0.039 0.034 0.028 0.125 0.160 February 0.025 0.028 0.028 0.026 0.022 0.119 0.161 March 0.026 0.025 0.024 0.022 0.023 0.114 0.169 April 0.022 0.025 0.020 0.020 0.027 0.128 0.178 May 0.018 0.017 0.017 0.017 0.028 0.136 0.173 June 0.017 0.012 0.018 0.013 0.025 0.126 0.196 July 0.017 0.019 0.016 0.016 0.029 0.124 0.180 August 0.027 0.025 0.021 0.031 0.041 0.151 0.220 September 0.020 0.016 0.018 0.017 0.030 0.127 0.183 October 0.014 0.014 0.015 0.012 0.024 0.116 0.174 November 0.019 0.023 0.028 0.021 0.016 0.118 0.149 December 0.031 0.031 0.036 0.030 0.025 0.100 0.139

GMTU Report 1387 Traffic Count Factors
A1.5
B 12-Hour Weekday to 12-Hour Annual Average Weekday Factors NON-MOTORWAY 1. Factors
Monday Tuesday Wednesday Thursday Friday Saturday Sunday
Average Weekday
Factor January 1.037 1.022 1.020 1.027 1.006 1.392 1.702 1.022 February 1.032 1.012 1.003 1.021 0.997 1.350 1.652 1.012 March 1.022 1.004 0.992 0.995 0.977 1.313 1.628 0.998 April 1.010 0.989 0.984 0.983 0.970 1.328 1.607 0.987 May 1.021 0.998 0.996 0.994 0.978 1.394 1.650 0.997 June 1.042 1.018 1.011 1.008 0.992 1.338 1.671 1.014 July 1.031 1.012 1.007 1.004 0.996 1.334 1.655 1.009 August 1.092 1.057 1.041 1.044 1.040 1.451 1.755 1.054 September 1.032 1.013 1.013 1.010 0.994 1.340 1.628 1.012 October 1.016 1.002 0.996 0.995 0.980 1.313 1.566 0.998 November 1.013 0.998 0.989 0.988 0.972 1.313 1.594 0.992 December 0.982 0.975 0.971 0.970 0.959 1.291 1.608 0.971 Average Factor 1.021 1.003 0.998 0.997 0.982 1.329 1.623 1.000
2. Standard Deviations Associated with Factors
Monday Tuesday Wednesday Thursday Friday Saturday Sunday
January 0.032 0.030 0.028 0.035 0.033 0.347 0.448 February 0.027 0.030 0.027 0.029 0.029 0.321 0.447 March 0.032 0.038 0.034 0.032 0.034 0.308 0.447 April 0.024 0.032 0.025 0.024 0.027 0.356 0.426 May 0.030 0.022 0.020 0.020 0.025 0.319 0.426 June 0.024 0.024 0.024 0.022 0.027 0.292 0.493 July 0.035 0.032 0.033 0.032 0.043 0.301 0.411 August 0.156 0.100 0.104 0.128 0.113 0.387 0.395 September 0.035 0.032 0.034 0.033 0.037 0.331 0.491 October 0.028 0.026 0.029 0.029 0.026 0.254 0.418 November 0.027 0.030 0.035 0.031 0.032 0.286 0.427 December 0.049 0.051 0.049 0.041 0.044 0.280 0.424
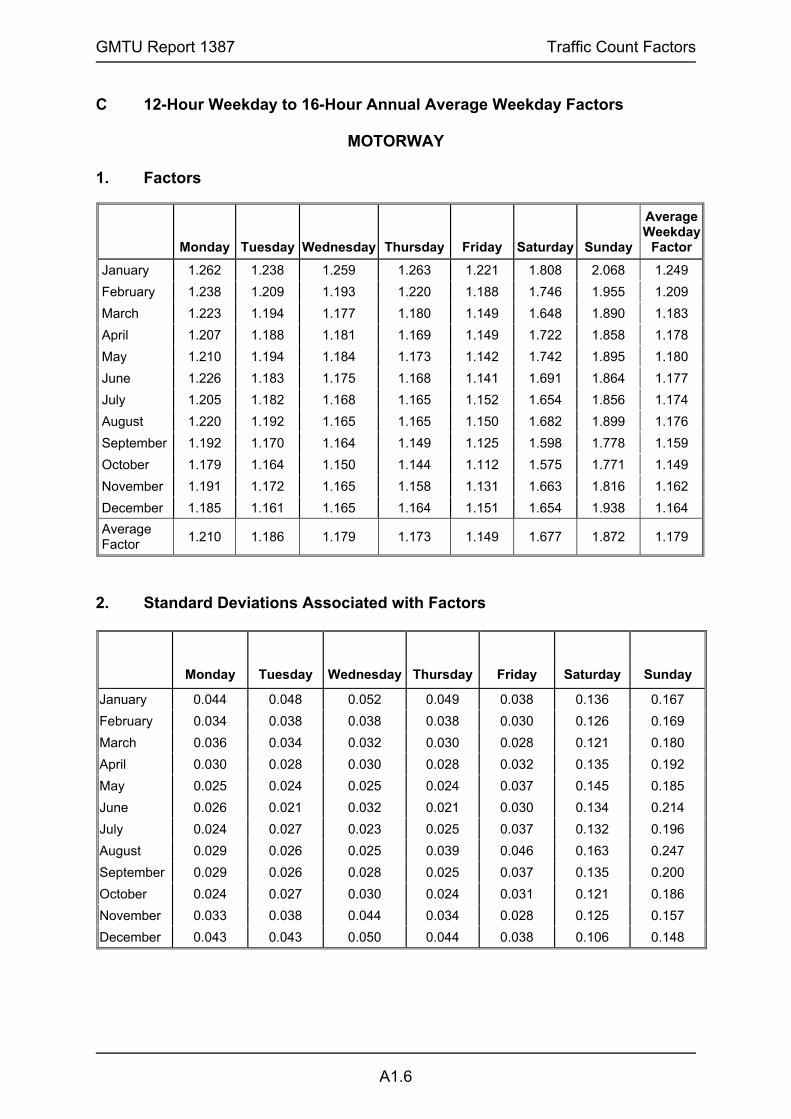
GMTU Report 1387 Traffic Count Factors
A1.6
C 12-Hour Weekday to 16-Hour Annual Average Weekday Factors MOTORWAY 1. Factors
Monday Tuesday Wednesday Thursday Friday Saturday Sunday
Average Weekday
Factor January 1.262 1.238 1.259 1.263 1.221 1.808 2.068 1.249 February 1.238 1.209 1.193 1.220 1.188 1.746 1.955 1.209 March 1.223 1.194 1.177 1.180 1.149 1.648 1.890 1.183 April 1.207 1.188 1.181 1.169 1.149 1.722 1.858 1.178 May 1.210 1.194 1.184 1.173 1.142 1.742 1.895 1.180 June 1.226 1.183 1.175 1.168 1.141 1.691 1.864 1.177 July 1.205 1.182 1.168 1.165 1.152 1.654 1.856 1.174 August 1.220 1.192 1.165 1.165 1.150 1.682 1.899 1.176 September 1.192 1.170 1.164 1.149 1.125 1.598 1.778 1.159 October 1.179 1.164 1.150 1.144 1.112 1.575 1.771 1.149 November 1.191 1.172 1.165 1.158 1.131 1.663 1.816 1.162 December 1.185 1.161 1.165 1.164 1.151 1.654 1.938 1.164 Average Factor 1.210 1.186 1.179 1.173 1.149 1.677 1.872 1.179
2. Standard Deviations Associated with Factors
Monday Tuesday Wednesday Thursday Friday Saturday Sunday
January 0.044 0.048 0.052 0.049 0.038 0.136 0.167 February 0.034 0.038 0.038 0.038 0.030 0.126 0.169 March 0.036 0.034 0.032 0.030 0.028 0.121 0.180 April 0.030 0.028 0.030 0.028 0.032 0.135 0.192 May 0.025 0.024 0.025 0.024 0.037 0.145 0.185 June 0.026 0.021 0.032 0.021 0.030 0.134 0.214 July 0.024 0.027 0.023 0.025 0.037 0.132 0.196 August 0.029 0.026 0.025 0.039 0.046 0.163 0.247 September 0.029 0.026 0.028 0.025 0.037 0.135 0.200 October 0.024 0.027 0.030 0.024 0.031 0.121 0.186 November 0.033 0.038 0.044 0.034 0.028 0.125 0.157 December 0.043 0.043 0.050 0.044 0.038 0.106 0.148

GMTU Report 1387 Traffic Count Factors
A1.7
C. 12-Hour Weekday to 16-Hour Annual Average Weekday Factors NON-MOTORWAY 1. Factors
Monday Tuesday Wednesday Thursday Friday Saturday Sunday
Average Weekday
Factor January 1.222 1.205 1.202 1.211 1.187 1.636 1.997 1.205 February 1.215 1.194 1.182 1.202 1.173 1.585 1.938 1.194 March 1.205 1.184 1.170 1.173 1.151 1.543 1.911 1.176 April 1.190 1.166 1.160 1.158 1.143 1.559 1.886 1.163 May 1.203 1.176 1.174 1.171 1.152 1.637 1.936 1.175 June 1.229 1.200 1.192 1.188 1.169 1.573 1.961 1.195 July 1.216 1.193 1.187 1.183 1.174 1.568 1.943 1.190 August 1.287 1.246 1.227 1.231 1.225 1.705 2.062 1.243 September 1.217 1.194 1.195 1.190 1.171 1.574 1.909 1.193 October 1.197 1.180 1.174 1.172 1.154 1.545 1.839 1.176 November 1.194 1.176 1.167 1.166 1.146 1.543 1.872 1.169 December 1.156 1.149 1.144 1.142 1.129 1.516 1.886 1.143 Average Factor 1.204 1.183 1.176 1.176 1.158 1.562 1.905 1.179
2. Standard Deviations Associated with Factors
Monday Tuesday Wednesday Thursday Friday Saturday Sunday
January 0.048 0.047 0.044 0.052 0.045 0.372 0.474 February 0.039 0.046 0.043 0.044 0.037 0.342 0.478 March 0.045 0.053 0.048 0.048 0.046 0.329 0.476 April 0.043 0.051 0.044 0.045 0.041 0.379 0.454 May 0.046 0.041 0.039 0.037 0.037 0.339 0.449 June 0.038 0.040 0.040 0.039 0.037 0.309 0.526 July 0.051 0.050 0.052 0.052 0.057 0.321 0.436 August 0.184 0.120 0.124 0.152 0.132 0.420 0.422 September 0.046 0.045 0.047 0.047 0.043 0.353 0.525 October 0.042 0.045 0.049 0.045 0.036 0.275 0.445 November 0.048 0.054 0.058 0.054 0.051 0.304 0.452 December 0.070 0.075 0.073 0.063 0.062 0.296 0.450

GMTU Report 1387 Traffic Count Factors
A1.8
D. 12-Hour Weekday to 18-Hour Annual Average Weekday Factors MOTORWAY 1. Factors
Monday Tuesday Wednesday Thursday Friday Saturday Sunday
Average Weekday
Factor January 1.303 1.278 1.300 1.304 1.260 1.867 2.135 1.290 February 1.279 1.249 1.232 1.260 1.227 1.803 2.019 1.249 March 1.263 1.233 1.216 1.219 1.186 1.702 1.951 1.222 April 1.247 1.226 1.220 1.207 1.187 1.778 1.918 1.217 May 1.250 1.233 1.222 1.211 1.179 1.799 1.956 1.219 June 1.266 1.222 1.214 1.207 1.179 1.746 1.925 1.216 July 1.244 1.221 1.207 1.204 1.190 1.708 1.917 1.213 August 1.259 1.231 1.203 1.203 1.188 1.737 1.961 1.214 September 1.231 1.208 1.202 1.187 1.161 1.650 1.836 1.197 October 1.217 1.201 1.187 1.181 1.148 1.626 1.828 1.186 November 1.230 1.211 1.203 1.196 1.168 1.717 1.875 1.201 December 1.224 1.199 1.203 1.202 1.188 1.708 2.001 1.203 Average Factor 1.249 1.225 1.217 1.211 1.186 1.732 1.933 1.217
2. Standard Deviations Associated with Factors
Monday Tuesday Wednesday Thursday Friday Saturday Sunday
January 0.048 0.052 0.057 0.053 0.041 0.142 0.170 February 0.038 0.042 0.042 0.041 0.035 0.131 0.172 March 0.039 0.039 0.037 0.035 0.032 0.124 0.184 April 0.033 0.035 0.033 0.034 0.034 0.140 0.197 May 0.028 0.027 0.028 0.027 0.041 0.149 0.188 June 0.027 0.024 0.036 0.026 0.034 0.137 0.220 July 0.028 0.030 0.026 0.030 0.041 0.136 0.201 August 0.032 0.030 0.030 0.043 0.049 0.168 0.253 September 0.033 0.029 0.033 0.029 0.040 0.140 0.207 October 0.028 0.033 0.034 0.029 0.036 0.124 0.190 November 0.037 0.043 0.049 0.040 0.033 0.129 0.161 December 0.048 0.047 0.056 0.049 0.043 0.110 0.152

GMTU Report 1387 Traffic Count Factors
A1.9
D. 12-Hour Weekday to 18-Hour Annual Average Weekday Factors NON-MOTORWAY 1. Factors
Monday Tuesday Wednesday Thursday Friday Saturday Sunday
Average Weekday
Factor January 1.270 1.252 1.248 1.258 1.233 1.698 2.071 1.251 February 1.260 1.239 1.227 1.247 1.217 1.643 2.008 1.239 March 1.251 1.229 1.215 1.218 1.195 1.602 1.981 1.221 April 1.235 1.210 1.204 1.203 1.187 1.618 1.956 1.207 May 1.250 1.221 1.219 1.216 1.196 1.699 2.008 1.220 June 1.276 1.246 1.237 1.234 1.214 1.632 2.033 1.241 July 1.262 1.238 1.232 1.228 1.219 1.627 2.015 1.235 August 1.336 1.294 1.274 1.278 1.272 1.769 2.138 1.290 September 1.263 1.240 1.240 1.236 1.215 1.632 1.978 1.239 October 1.242 1.225 1.219 1.216 1.197 1.602 1.906 1.221 November 1.240 1.222 1.212 1.210 1.190 1.601 1.941 1.214 December 1.199 1.191 1.186 1.184 1.171 1.571 1.954 1.186 Average Factor 1.250 1.228 1.221 1.221 1.202 1.621 1.975 1.224
2. Standard Deviations Associated with Factors
Monday Tuesday Wednesday Thursday Friday Saturday Sunday
January 0.061 0.060 0.058 0.067 0.060 0.379 0.477 February 0.048 0.058 0.057 0.051 0.044 0.348 0.484 March 0.058 0.064 0.060 0.061 0.058 0.335 0.480 April 0.058 0.064 0.058 0.060 0.056 0.384 0.458 May 0.058 0.055 0.053 0.052 0.052 0.344 0.451 June 0.052 0.054 0.054 0.053 0.050 0.314 0.531 July 0.063 0.062 0.064 0.065 0.067 0.326 0.438 August 0.195 0.129 0.133 0.162 0.141 0.429 0.428 September 0.055 0.054 0.058 0.058 0.050 0.358 0.529 October 0.051 0.054 0.062 0.054 0.045 0.281 0.448 November 0.061 0.069 0.073 0.068 0.065 0.309 0.455 December 0.080 0.085 0.083 0.074 0.071 0.300 0.453
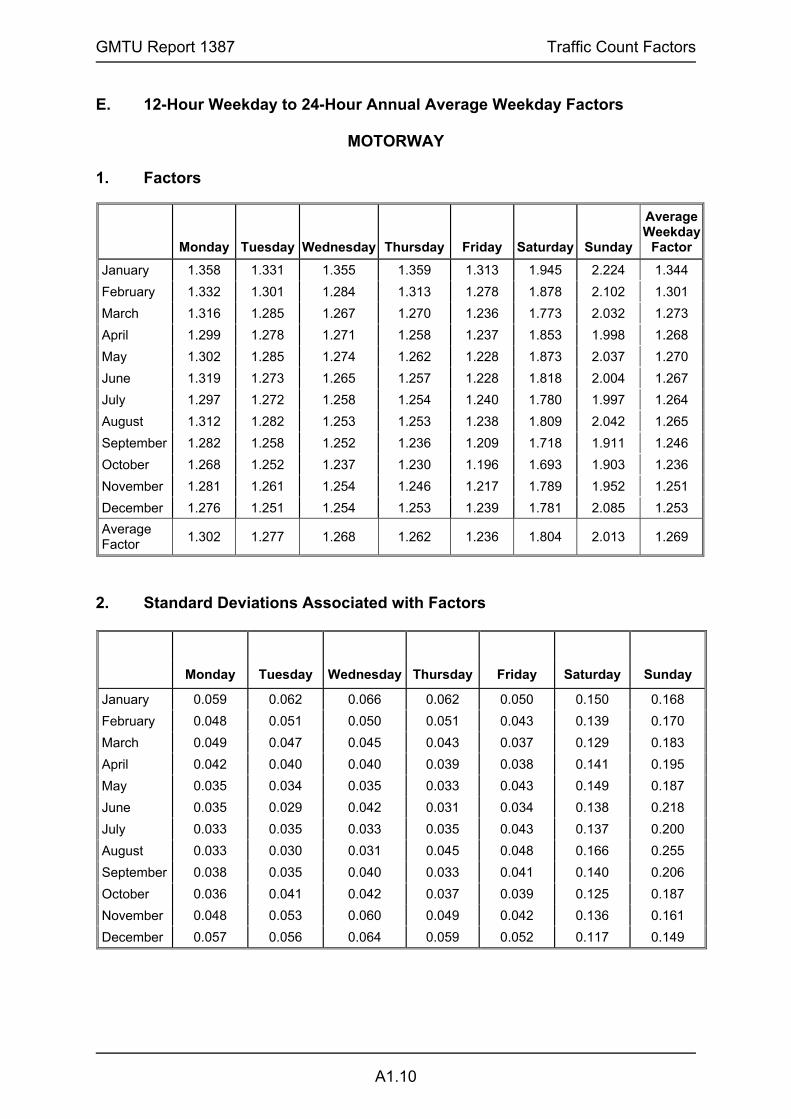
GMTU Report 1387 Traffic Count Factors
A1.10
E. 12-Hour Weekday to 24-Hour Annual Average Weekday Factors MOTORWAY 1. Factors
Monday Tuesday Wednesday Thursday Friday Saturday Sunday
Average Weekday
Factor January 1.358 1.331 1.355 1.359 1.313 1.945 2.224 1.344 February 1.332 1.301 1.284 1.313 1.278 1.878 2.102 1.301 March 1.316 1.285 1.267 1.270 1.236 1.773 2.032 1.273 April 1.299 1.278 1.271 1.258 1.237 1.853 1.998 1.268 May 1.302 1.285 1.274 1.262 1.228 1.873 2.037 1.270 June 1.319 1.273 1.265 1.257 1.228 1.818 2.004 1.267 July 1.297 1.272 1.258 1.254 1.240 1.780 1.997 1.264 August 1.312 1.282 1.253 1.253 1.238 1.809 2.042 1.265 September 1.282 1.258 1.252 1.236 1.209 1.718 1.911 1.246 October 1.268 1.252 1.237 1.230 1.196 1.693 1.903 1.236 November 1.281 1.261 1.254 1.246 1.217 1.789 1.952 1.251 December 1.276 1.251 1.254 1.253 1.239 1.781 2.085 1.253 Average Factor 1.302 1.277 1.268 1.262 1.236 1.804 2.013 1.269
2. Standard Deviations Associated with Factors
Monday Tuesday Wednesday Thursday Friday Saturday Sunday
January 0.059 0.062 0.066 0.062 0.050 0.150 0.168 February 0.048 0.051 0.050 0.051 0.043 0.139 0.170 March 0.049 0.047 0.045 0.043 0.037 0.129 0.183 April 0.042 0.040 0.040 0.039 0.038 0.141 0.195 May 0.035 0.034 0.035 0.033 0.043 0.149 0.187 June 0.035 0.029 0.042 0.031 0.034 0.138 0.218 July 0.033 0.035 0.033 0.035 0.043 0.137 0.200 August 0.033 0.030 0.031 0.045 0.048 0.166 0.255 September 0.038 0.035 0.040 0.033 0.041 0.140 0.206 October 0.036 0.041 0.042 0.037 0.039 0.125 0.187 November 0.048 0.053 0.060 0.049 0.042 0.136 0.161 December 0.057 0.056 0.064 0.059 0.052 0.117 0.149
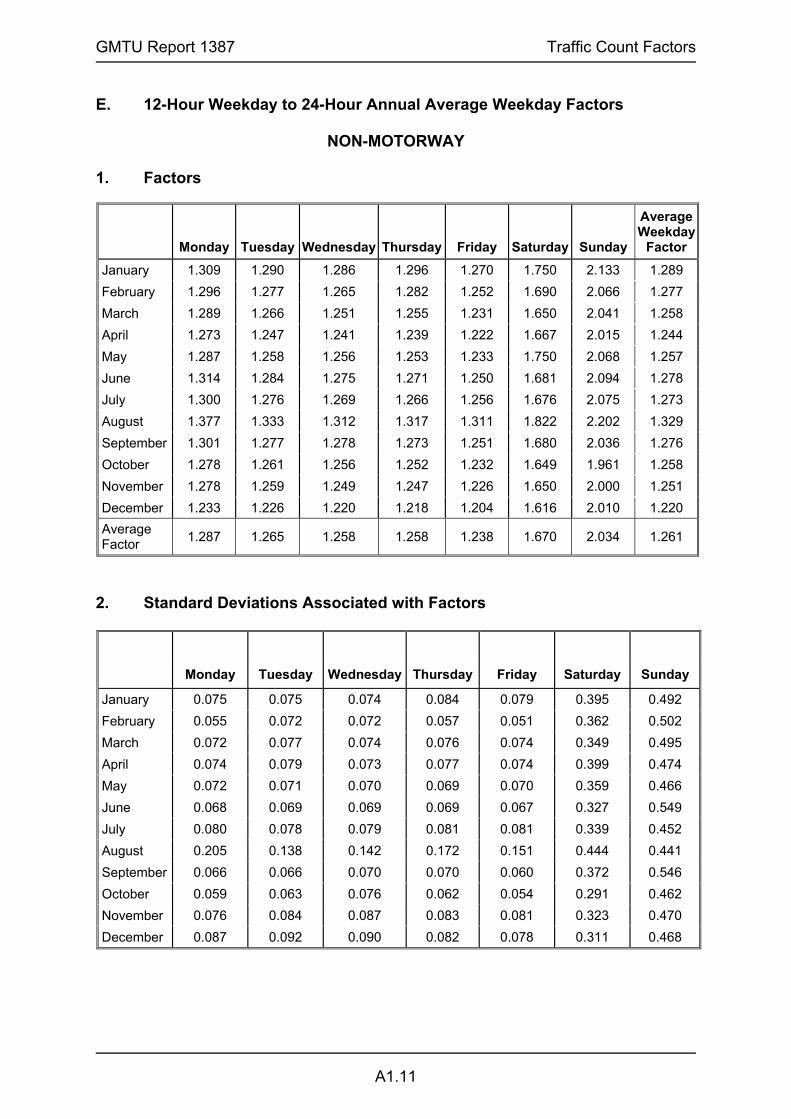
GMTU Report 1387 Traffic Count Factors
A1.11
E. 12-Hour Weekday to 24-Hour Annual Average Weekday Factors NON-MOTORWAY 1. Factors
Monday Tuesday Wednesday Thursday Friday Saturday Sunday
Average Weekday
Factor January 1.309 1.290 1.286 1.296 1.270 1.750 2.133 1.289 February 1.296 1.277 1.265 1.282 1.252 1.690 2.066 1.277 March 1.289 1.266 1.251 1.255 1.231 1.650 2.041 1.258 April 1.273 1.247 1.241 1.239 1.222 1.667 2.015 1.244 May 1.287 1.258 1.256 1.253 1.233 1.750 2.068 1.257 June 1.314 1.284 1.275 1.271 1.250 1.681 2.094 1.278 July 1.300 1.276 1.269 1.266 1.256 1.676 2.075 1.273 August 1.377 1.333 1.312 1.317 1.311 1.822 2.202 1.329 September 1.301 1.277 1.278 1.273 1.251 1.680 2.036 1.276 October 1.278 1.261 1.256 1.252 1.232 1.649 1.961 1.258 November 1.278 1.259 1.249 1.247 1.226 1.650 2.000 1.251 December 1.233 1.226 1.220 1.218 1.204 1.616 2.010 1.220 Average Factor 1.287 1.265 1.258 1.258 1.238 1.670 2.034 1.261
2. Standard Deviations Associated with Factors
Monday Tuesday Wednesday Thursday Friday Saturday Sunday
January 0.075 0.075 0.074 0.084 0.079 0.395 0.492 February 0.055 0.072 0.072 0.057 0.051 0.362 0.502 March 0.072 0.077 0.074 0.076 0.074 0.349 0.495 April 0.074 0.079 0.073 0.077 0.074 0.399 0.474 May 0.072 0.071 0.070 0.069 0.070 0.359 0.466 June 0.068 0.069 0.069 0.069 0.067 0.327 0.549 July 0.080 0.078 0.079 0.081 0.081 0.339 0.452 August 0.205 0.138 0.142 0.172 0.151 0.444 0.441 September 0.066 0.066 0.070 0.070 0.060 0.372 0.546 October 0.059 0.063 0.076 0.062 0.054 0.291 0.462 November 0.076 0.084 0.087 0.083 0.081 0.323 0.470 December 0.087 0.092 0.090 0.082 0.078 0.311 0.468
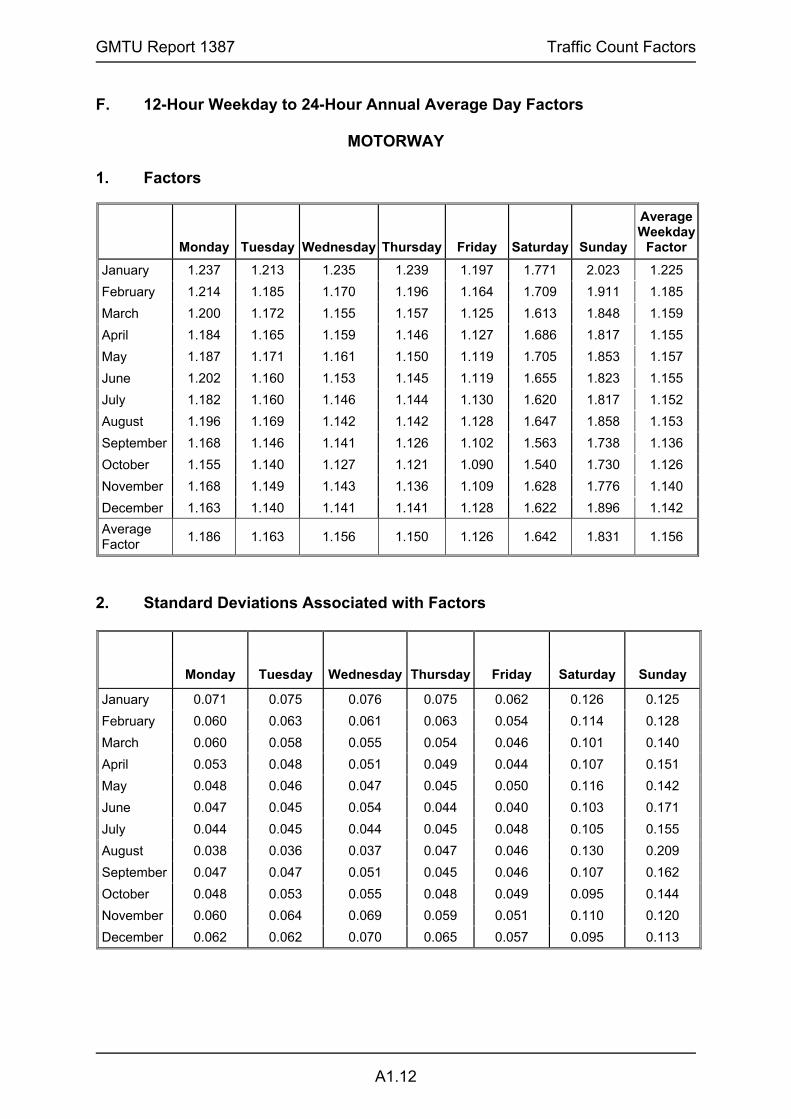
GMTU Report 1387 Traffic Count Factors
A1.12
F. 12-Hour Weekday to 24-Hour Annual Average Day Factors MOTORWAY 1. Factors
Monday Tuesday Wednesday Thursday Friday Saturday Sunday
Average Weekday
Factor January 1.237 1.213 1.235 1.239 1.197 1.771 2.023 1.225 February 1.214 1.185 1.170 1.196 1.164 1.709 1.911 1.185 March 1.200 1.172 1.155 1.157 1.125 1.613 1.848 1.159 April 1.184 1.165 1.159 1.146 1.127 1.686 1.817 1.155 May 1.187 1.171 1.161 1.150 1.119 1.705 1.853 1.157 June 1.202 1.160 1.153 1.145 1.119 1.655 1.823 1.155 July 1.182 1.160 1.146 1.144 1.130 1.620 1.817 1.152 August 1.196 1.169 1.142 1.142 1.128 1.647 1.858 1.153 September 1.168 1.146 1.141 1.126 1.102 1.563 1.738 1.136 October 1.155 1.140 1.127 1.121 1.090 1.540 1.730 1.126 November 1.168 1.149 1.143 1.136 1.109 1.628 1.776 1.140 December 1.163 1.140 1.141 1.141 1.128 1.622 1.896 1.142 Average Factor 1.186 1.163 1.156 1.150 1.126 1.642 1.831 1.156
2. Standard Deviations Associated with Factors
Monday Tuesday Wednesday Thursday Friday Saturday Sunday
January 0.071 0.075 0.076 0.075 0.062 0.126 0.125 February 0.060 0.063 0.061 0.063 0.054 0.114 0.128 March 0.060 0.058 0.055 0.054 0.046 0.101 0.140 April 0.053 0.048 0.051 0.049 0.044 0.107 0.151 May 0.048 0.046 0.047 0.045 0.050 0.116 0.142 June 0.047 0.045 0.054 0.044 0.040 0.103 0.171 July 0.044 0.045 0.044 0.045 0.048 0.105 0.155 August 0.038 0.036 0.037 0.047 0.046 0.130 0.209 September 0.047 0.047 0.051 0.045 0.046 0.107 0.162 October 0.048 0.053 0.055 0.048 0.049 0.095 0.144 November 0.060 0.064 0.069 0.059 0.051 0.110 0.120 December 0.062 0.062 0.070 0.065 0.057 0.095 0.113

GMTU Report 1387 Traffic Count Factors
A1.13
F. 12-Hour Weekday to 24-Hour Annual Average Day Factors
NON-MOTORWAY 1. Factors
Monday Tuesday Wednesday Thursday Friday Saturday Sunday
Average Weekday
Factor January 1.212 1.195 1.192 1.201 1.176 1.611 1.962 1.195 February 1.199 1.184 1.172 1.187 1.158 1.554 1.897 1.184 March 1.195 1.174 1.160 1.163 1.141 1.519 1.876 1.166 April 1.179 1.155 1.149 1.148 1.132 1.532 1.852 1.152 May 1.192 1.166 1.163 1.160 1.141 1.610 1.901 1.164 June 1.218 1.190 1.182 1.178 1.159 1.549 1.924 1.185 July 1.205 1.182 1.176 1.173 1.163 1.543 1.910 1.179 August 1.276 1.235 1.217 1.220 1.214 1.678 2.029 1.232 September 1.206 1.184 1.184 1.180 1.158 1.546 1.870 1.183 October 1.184 1.168 1.164 1.159 1.141 1.522 1.806 1.166 November 1.184 1.167 1.158 1.156 1.137 1.520 1.839 1.160 December 1.141 1.134 1.130 1.128 1.114 1.487 1.847 1.129 Average Factor 1.193 1.173 1.167 1.166 1.148 1.538 1.871 1.169
2. Standard Deviations Associated with Factors
Monday Tuesday Wednesday Thursday Friday Saturday Sunday
January 0.101 0.101 0.099 0.107 0.100 0.305 0.363 February 0.076 0.097 0.097 0.080 0.070 0.273 0.377 March 0.095 0.099 0.097 0.098 0.093 0.266 0.370 April 0.099 0.103 0.099 0.102 0.095 0.301 0.354 May 0.095 0.096 0.095 0.092 0.089 0.270 0.343 June 0.093 0.093 0.094 0.093 0.087 0.245 0.412 July 0.099 0.099 0.100 0.101 0.098 0.256 0.334 August 0.203 0.145 0.149 0.174 0.153 0.356 0.343 September 0.087 0.087 0.091 0.092 0.075 0.280 0.409 October 0.082 0.087 0.099 0.083 0.074 0.229 0.344 November 0.101 0.108 0.110 0.106 0.102 0.245 0.348 December 0.100 0.104 0.103 0.097 0.089 0.228 0.344

GMTU Report 1387 Traffic Count Factors
A1.14
G Year to Year Factors
Indices of Traffic Flows by Vehicle Type Since 1979
Motorways
Year Cars LGV OGV Buses & Coaches
Motor Cycles
All Motors
1979 1.00 1.00 1.00 1.00 1.00 1.00 1980 1.06 1.01 1.01 1.05 1.19 1.03 1981 1.10 1.03 1.03 1.08 1.32 1.02 1982 1.15 1.05 1.05 1.13 1.38 1.09 1983 1.20 1.09 1.09 1.21 1.29 1.13 1984 1.26 1.16 1.14 1.35 1.21 1.17 1985 1.30 1.26 1.17 1.47 1.18 1.22 1986 1.36 1.40 1.19 1.62 1.14 1.28 1987 1.46 1.57 1.24 1.98 1.17 1.37 1988 1.57 1.75 1.31 2.31 1.15 1.48 1989 1.67 1.92 1.37 2.63 1.19 1.57 1990 1.75 2.00 1.40 2.77 1.22 1.63 1991 1.78 1.98 1.45 2.84 1.18 1.65 1992 1.87 2.13 1.41 2.98 1.19 1.73 1993 1.89 2.10 1.38 2.97 1.15 1.73 1994 1.87 2.12 1.52 3.21 1.04 1.73 1995 1.94 2.23 1.52 2.86 1.06 1.80 1996 2.04 2.38 1.50 3.15 1.15 1.88 1997 2.14 2.46 1.51 3.29 1.09 1.96 1998 2.16 2.51 1.50 3.32 1.23 1.98 1999 2.25 2.56 1.52 4.32 1.45 2.04 2000 2.25 2.64 1.50 3.93 1.51 2.04 2001 2.34 2.67 1.49 4.01 1.59 2.10 2002 2.43 2.80 1.50 3.73 1.65 2.18 2003 2.50 2.83 1.49 3.88 1.70 2.22 2004 2.60 3.02 1.56 4.35 1.56 2.31 2005 2.63 2.93 1.45 3.70 1.73 2.29 2006 2.60 3.11 1.42 3.48 1.78 2.29 2007 2.63 3.20 1.41 2.51 1.57 2.31

GMTU Report 1387 Traffic Count Factors
A1.15
Other Roads
Year Cars LGV OGV Buses & Coaches
Motor Cycles
All Motors
Pedal Cycles
1979 1.00 1.00 1.00 1.00 1.00 1.00 1.00 1980 1.02 0.99 0.99 0.97 1.02 1.03 1.09 1981 1.03 0.98 0.98 0.94 1.00 1.02 1.17 1982 1.05 0.98 0.98 0.91 0.98 1.04 1.24 1983 1.08 0.99 0.99 0.89 0.92 1.06 1.26 1984 1.12 1.02 1.01 0.89 0.90 1.09 1.24 1985 1.16 1.06 1.02 0.93 0.81 1.12 1.16 1986 1.21 1.16 1.06 1.03 0.76 1.18 1.16 1987 1.26 1.23 1.08 1.19 0.70 1.22 1.10 1988 1.30 1.30 1.10 1.35 0.66 1.26 1.07 1989 1.34 1.33 1.10 1.46 0.63 1.29 1.08 1990 1.37 1.39 1.09 1.54 0.58 1.31 1.05 1991 1.41 1.37 1.05 1.55 0.53 1.34 1.10 1992 1.39 1.37 0.95 1.60 0.47 1.32 1.12 1993 1.40 1.34 0.99 1.66 0.43 1.32 1.14 1994 1.42 1.38 1.01 1.78 0.40 1.34 1.08 1995 1.43 1.37 0.97 1.62 0.40 1.34 1.10 1996 1.44 1.36 0.95 1.58 0.38 1.35 1.17 1997 1.45 1.37 0.96 1.50 0.35 1.36 1.03 1998 1.45 1.37 0.93 1.50 0.35 1.36 0.94 1999 1.46 1.37 0.85 1.53 0.39 1.37 0.98 2000 1.45 1.40 0.85 1.50 0.42 1.36 0.92 2001 1.45 1.34 0.80 1.52 0.44 1.35 0.88 2002 1.45 1.34 0.74 1.50 0.45 1.35 0.81 2003 1.46 1.35 0.73 1.44 0.44 1.36 0.78 2004 1.46 1.39 0.76 1.43 0.42 1.36 0.75 2005 1.45 1.39 0.70 1.44 0.41 1.35 0.81 2006 1.45 1.42 0.67 1.44 0.39 1.35 0.82 2007 1.45 1.45 0.63 1.32 0.39 1.35 0.88


APPENDIX 2 SOME RECENT GMTU PUBLICATIONS


GMTU Report 1387 Some Recent GMTU Publications
A2.1
REPORTS No Title Author(s) Date
1125 Analysis of GMATS Data to Assess the Potential for P&R from South Manchester
P Bearon Apr 2006
1134 Analysis of GMATS Data to Assess the Potential for P&R from East Manchester
P Bearon Apr 2006
1136 Analysis of GMATS Data to Assess the Potential for P&R in the Oldham/Rochdale Corridor
P Bearon May 2006
1137 Road Casualty Statistics Greater Manchester 2005 D Chiu Jun 20061138 Transport Statistics Greater Manchester 2005 E Ellis et al Jun 20061139 Transport Statistics Bolton 2005 E Ellis et al Jul 20061140 Transport Statistics Bury 2005 E Ellis et al Jul 20061141 Transport Statistics Manchester 2005 E Ellis et al Jul 20061142 Transport Statistics Oldham 2005 E Ellis et al Jul 20061143 Transport Statistics Rochdale 2005 E Ellis et al Jul 20061144 Transport Statistics Salford 2005 E Ellis et al Jul 20061145 Transport Statistics Stockport 2005 E Ellis et al Jul 20061146 Transport Statistics Tameside 2005 E Ellis et al Jul 20061147 Transport Statistics Trafford 2005 E Ellis et al Jul 20061148 Transport Statistics Wigan 2005 E Ellis et al Jul 20061153 Analysis of GMATS Data to Assess the Potential for
P&R in the Leigh/Wigan Corridor P Bearon Jul 2006
1158 Chorlton QBC After Monitoring – Report of Surveys P Howarth Aug 20061183 Bus Lane Enforcement Monitoring – Report of
Before Study J C Mayoh Aug 2006
1192 Wigan Congestion Study P Bearon R Boncinelli
Sep 2006
1205 Bolton Casualty Research Project – Road Accident Casualty Trends Since 1994
D Chiu Oct 2006
1214 Analysis of Travel Survey Data to Assess the Potential for Park and Ride along the Bolton Corridor
P Bearon Mar 2007
1236 A62 Huddersfield Road QBC Scheme “Comparison of Before and After Data”
R Boncinelli Dec 2006
1238 School Travel Survey – Report of Survey Autumn 2006 (Hands Up Survey)
M White Jan 2007
1255 Results of Consultation on the Greater Manchester Cycling Strategy
A Castle Jan 2007
1257 A Before and After Analysis of Accidents at Puffin Crossings and at Signalised Junctions with Nearside Indicators
D Chiu Jan 2007
1258 Analysis of Travel Survey Data to Assess the Potential for Park and Ride along the Altrincham Corridor
P Bearon Mar 2007
1288 Road Casualty Statistics Greater Manchester 2006 D Chiu Jul 20071289 Transport Statistics Greater Manchester 2006 E Ellis et al Jul 20071290 Transport Statistics Bolton 2006 E Ellis et al Aug 2007

GMTU Report 1387 Some Recent GMTU Publications
A2.2
No Title Author(s) Date 1291 Transport Statistics Bury 2006 E Ellis et al Aug 20071292 Transport Statistics Manchester 2006 E Ellis et al Aug 20071293 Transport Statistics Oldham 2006 E Ellis et al Aug 20071294 Transport Statistics Rochdale 2006 E Ellis et al Aug 20071295 Transport Statistics Salford 2006 E Ellis et al Aug 20071296 Transport Statistics Stockport 2006 E Ellis et al Aug 20071297 Transport Statistics Tameside 2006 E Ellis et al Aug 20071298 Transport Statistics Trafford 2006 E Ellis et al Aug 20071299 Transport Statistics Wigan 2006 E Ellis et al Aug 20071304 Person Delay Surveys – Technical Review
Document D Holt Apr 2007
1310 Manchester Bus Lane Enforcement Monitoring After Study
P Howarth May 2007
1331 The Greater Manchester Emissions Inventory 2005 Update
I Hull T Morris K Fraser
Jul 2007
1333 Greater Manchester TIF Bid - SATURN Model Forecasting Report
John Wharf Mar 2008
1337 The Greater Manchester Emissions Inventory 2004 Update
I Hull Sep 2007
1342 Cycle Monitoring Greater Manchester Jan-July 2007 D Weston Oct 20071365 SEMMMS QBC Corridor H M60 Junction 1
Before/After Report P.Howarth Dec 2007
1366 Greater Manchester Cycling Progress Report E Ellis Dec 20071368 The Greater Manchester Emissions Inventory 2010
Forecast I Hull Dec 2007
1387 Transport Statistics Greater Manchester 2007 E Ellis et al Aug 20071388 Transport Statistics Bolton 2006 E Ellis et al Aug 20071389 Transport Statistics Bury 2006 E Ellis et al Aug 20071390 Transport Statistics Manchester 2006 E Ellis et al Aug 20071391 Transport Statistics Oldham 2006 E Ellis et al Aug 20071392 Transport Statistics Rochdale 2006 E Ellis et al Aug 20071393 Transport Statistics Salford 2006 E Ellis et al Aug 20071394 Transport Statistics Stockport 2006 E Ellis et al Aug 20071395 Transport Statistics Tameside 2006 E Ellis et al Aug 20071396 Transport Statistics Trafford 2006 E Ellis et al Aug 20071397 Transport Statistics Wigan 2006 E Ellis et al Aug 20071408 Casualty Statistics Greater Manchester 2007 (Main
Report) D Chiu et al Jul 2008
1409 Casualty Statistics Greater Manchester 2007 – Countywide Tabulations
D Chiu Jul 2008
1410 Casualty Statistics Greater Manchester 2007- D.Chiu Aug 2008

GMTU Report 1387 Some Recent GMTU Publications
A2.3
No Title Author(s) Date District Tabulations and Comparisons
1411 Additional analysis on freight and car movements across the Trafford Park key centre cordon
P Bearon D Nixon
Mar 2008
1412 Monthly Cycle Monitoring Greater Manchester 2007 D Weston Mar 20081414 SEMMMS Local Centre Activity Surveys
Comparison of 2005/06 and 2008-2009 Results R Boncinelli Mar 2008
1416 Trends in Car Journey Times on the 15 Target Congestion Routes 2003 to 2007
A Castle E Ellis
May 2008
1418 Summary of Congestion Monitoring Findings P Howarth J Wharf
Apr 2008