Association of consecutive Pi2-Ps6 band pulsations with earthward fast flows in the plasma sheet in...
53
©2014 American Geophysical Union. All rights reserved. Association of consecutive Pi2-Ps6 band pulsations with earthward fast flows in the plasma sheet in response to IMF variations Ching-Chang Cheng, 1* Ian R. Mann, 2 and Wolfgang Baumjohann 3 1 Department of Electronic Engineering, National Formosa University, Hu-Wei 63201, Taiwan 2 Department of Physics, University of Alberta, Edmonton, Alberta T6G 2J1, Canada 3 Space Research Institute, Austrian Academy of Sciences, Graz 8042, Austria Short title: CHENG ET AL.: CONSECUTIVE PI2-PS6 PULSATIONS Keyword: Pi2 pulsations; Ps6 pulsations; Fast flows; IMF variations *Corresponding author. Tel: 886-5-631-5688; fax: 886-5-631-5999 E-mail address: [email protected] This article has been accepted for publication and undergone full peer review but has not been through the copyediting, typesetting, pagination and proofreading process which may lead to differences between this version and the Version of Record. Please cite this article as doi: 10.1002/2013JA019275
Transcript of Association of consecutive Pi2-Ps6 band pulsations with earthward fast flows in the plasma sheet in...
©2014 American Geophysical Union. All rights reserved.
Association of consecutive Pi2-Ps6 band pulsations with earthward fast flows in the plasma sheet in response to IMF variations
Ching-Chang Cheng,1* Ian R. Mann,2 and Wolfgang Baumjohann
3
1Department of Electronic Engineering, National Formosa University, Hu-Wei 63201, Taiwan 2Department of Physics, University of Alberta, Edmonton, Alberta T6G 2J1, Canada 3
Space Research Institute, Austrian Academy of Sciences, Graz 8042, Austria
Short title: CHENG ET AL.: CONSECUTIVE PI2-PS6 PULSATIONS Keyword: Pi2 pulsations; Ps6 pulsations; Fast flows; IMF variations *Corresponding author. Tel: 886-5-631-5688; fax: 886-5-631-5999
E-mail address: [email protected]
This article has been accepted for publication and undergone full peer review but has not been through the copyediting, typesetting, pagination and proofreading process which may lead to differences between this version and the Version of Record. Please cite this article as doi: 10.1002/2013JA019275
©2014 American Geophysical Union. All rights reserved.
Abstract
On 11 March 2009, the H component had four consecutive bay-like variations accompanied
by positive and negative deflections in the D component across the Atlantic like those affected
by the substorm current wedge formation. A train of pulsations with a frequency range 2-10
mHz (referred to as Pi2-Ps6 band), sensed by THEMIS/CARISMA magnetometers, had
clearly three consecutive Pi2s followed by a Ps6 at low latitudes, but first Pi2 and then Ps6 at
high latitudes mixed with large-amplitude Ps6 at mid latitudes. The geostationary orbit
magnetometers sensed similar magnetic perturbations. THEMIS probes first observed
earthward fast flows, magnetic dipolarizations and modulated energetic particle fluxes at
~XGSM -9.2 RE, then at ~XGSM -7.5 RE for Pi2 and at ~XGSM -18.0 RE
only for Ps6. They
appeared during a very quiet period for northward IMF with a clock angle variation of
low-to-high and then low. The H spectrum shows two harmonic frequencies ~2-4 mHz and
~8-10 mHz but the D spectrum one dominant frequency ~2-4 mHz. Pi2 can result from a
combination of fast magnetospheric and plasmaspheric cavity resonances and Ps6 from a fast
magnetospheric cavity resonance. The surface waves at the interface separating braking
earthward fast flows from the ambient plasma convection region could lead to large-amplitude
Ps6 at mid latitudes. Hence, consecutive Pi2-Ps6 band pulsations can be associated with
earthward fast flows in the plasma sheet, expectedly driven by magnetotail reconnection
respectively in the near-Earth region and the distant-Earth one in response to IMF variations
as in the two-neutral-point model.
©2014 American Geophysical Union. All rights reserved.
1. Introduction
During substorm onsets, fast flows (or bursty bulk flows) and Pi2 pulsations can occur
with a relationship of cause and consequence in the magnetotail [e.g., Shiokawa et al., 1998].
Fast flows are commonly observed in the central plasma sheet and associated with the release
of stored energy in the magnetotail [e.g., Angelopoulos et al., 1994]. They are found to be
mostly directed earthward within the radial distance ~20 RE
To explain the double-onset observations [e.g., Mishin et al., 2001], Russell [2000]
extended the near-Earth neutral point model by Russell and McPherron [1973] which is
similar to the near-Earth neutral line (NENL) model but with emphasis on the role of the
distant neutral point. The neutral point model features the necessary localized nature of the
onset of time-varying reconnection at the near-Earth neutral point, especially as manifested in
fast flows. In the model, the interplay between near-Earth and distant neutral points in the
magnetotail creates two onsets, one when reconnection at the near-Earth neutral point first
begins on closed field lines within the plasma sheet, and one when the near-Earth neutral point
reaches the open flux of the tail lobes. The timing of the second substorm onset should be
controlled by the distant neutral point that in turn is controlled by the northward turning of the
IMF. This scenario under the IMF variation of north to south and north again, has been
confirmed as possible with the systematic observations of the IMF and consecutive Pi2 bursts
by Cheng et al. [2002a, 2002b]. By comparing THEMIS ground Pi2s to the wave-like
magnetic fluctuations observed by Cluster 4 in the south lobe, Cheng et al. [2011] further
[Baumjohann et al., 1990]. Pi2
pulsations are the impulsive and damped geomagnetic oscillations with a period 40-150s
(corresponding to a frequency band of 6-25 mHz) [Baumjohann and Glassmeier, 1984;
Yumoto, 1986; Olson, 1999 and references of therein]. In addition, they can successively occur
in a sequence [Saito, 1969; Clauer and McPherron, 1974] and in association with the
variations of the interplanetary magnetic field (IMF) as well [e.g., Cheng et al., 2005, 2009a,
2009b, 2011].
©2014 American Geophysical Union. All rights reserved.
demonstrated that two consecutive Pi2s have the spectral characteristics of the dominant
frequency band at the first onset becoming higher than that at the second onset during a
double-onset substorm associated with an IMF variation of north-to-south and north again.
Recently, Sutcliffe [2010] reported that Pi2 pulsations can occur at low latitudes during
IMF-northward, non-substorm intervals. By comparing to ground magnetometer
measurements at the footprints of Cluster probes, Keiling et al. [2006] also suggested that
Pi2-band magnetic variations in the magnetotail can be associated with pulsed reconnection
while the IMF in north. Keiling et al. argued that pulsed reconnection could excite Pi2-band
waves and directly control their frequency as well. However, they neither address how to let
pulsed-reconnection-driven Pi2 recur as Russell [2000] suggested nor delineate the wave
modes by which they can propagate to low latitudes from the magnetotail. Namely, the exact
generation and propagation mechanisms for recurrent Pi2s in the nightside magnetosphere are
not determined yet and still an important issue in magnetospheric physics.
On the other hand, a Pi2 can be accompanied by other long-period magnetic pulsations
during substorms. Some are in a period of 5 to 40 min and called Ps6 pulsations (or
disturbances) [Saito 1978; Connors et al., 2003]. From Figure 9 in Connors et al. [2003],
however, one can find out that after Pi2 onsets (marked by vertical lines) magnetic fields seem
to have perturbations varying from short periods to longer ones. The longer-period
perturbations having larger amplitude are Ps6s like those induced by auroral zone currents due
to relaxation of magnetic stress brought by earthward fast flows in the later time [cf. Vaivads
et al., 2001]. The short-period perturbations appear to have the same period slightly touching
5 min as ultra-low-frequency (ULF) waves driven by earthward fast flows in the magnetotail
reported by Volwerk et al. [2005]. Except for Ps6, there is nothing else in the literature that
describes this kind of nighttime pulsations associated with Pi2 onsets. For convenience of
notation, magnetic perturbations with periods longer than 150 s but less than 5 min are
referred to as Ps6 in this study.
©2014 American Geophysical Union. All rights reserved.
It is well known that ULF waves excited by the impulsive source inside or outside the
magnetoshpere can propagate across the magnetospheric cavity in fast modes and along the
geomagnetic field lines to the ground in shear Alfvén modes [see the review by Hughes, 1994].
At substorm onset, the braking of earthward fast flows can launch fast mode waves to bounce
between their source site and the Earth and be transmitted through the plasmapause to excite
magnetospheric cavity resonance modes during their duration time. Although the plasmapause
is not a fixed boundary, fast waves can be trapped in the plasmasphere due to plasma
injections brought by earthward fast flows and lead to plasmaspheric cavity resonances. If the
duration time of fast waves is long enough, cavity resonances can feature harmonic modes in
the magnetosphere and plasmasphere as well. Early ground and space observations showed
that Pi2 pulsations have harmonic frequencies in the power spectrum and are interpreted as
magnetospheric cavity resonance modes [e.g., Lin et al., 1991; Cheng et al., 1998 and
references of therein] or plasmaspheric cavity resonance modes [e.g., Cheng et al., 2000;
Takahashi et al., 2003 and references of therein]. Since the frequencies of cavity-resonance
modes are negatively correlated with the cavity size affected by geomagnetic activity,
magnetospheric cavity resonances have lower frequencies for the same harmonic than
plasmaspheric ones. Hence, magnetic pulsations with periods from 40 s to 150s and to ~5 min
such as Pi2 and Ps6 can simultaneously occur from high to low latitudes as magnetospheric
and plasmaspheric cavity resonances coexist.
Since Ps6 pulsations seem to be affected by a current system passing over auroral stations
related to substorms, Saito [1978] suggested that they can be due to two snake-like auroral
activations meandering both eastward and westward from the midnight site. Moreover, Ps6
pulsations look like those induced by passage of a spatially periodic wave presumably arising
from the Kelvin-Helmholtz instability (KHI). Connors and Rostoker [1993] showed that the
KHI is a plausible mechanism for Ps6s with required velocity shear located across the
interface separating the sunward convective flow in the plasma sheet and the region closer to
©2014 American Geophysical Union. All rights reserved.
the Earth where plasma flows are slow due to co-rotation. By analyzing both Cluster and
Double Star data, Volwerk et al. [2007] argued that the KHI development on the boundary of
earthward flow channel can drive growing hydromagnetic waves like those occurring at the
magnetopause and thus lead to fast flow braking in the near-Earth magnetotail through energy
conversion to KHI waves. Recently, Saka et al. [2012] suggested that periodic aurora surge
propagating eastward and westward at poleward boundary of auroral zone can be caused by
the generation of periodic burst of bi-directional flows (eastward/westward in dawn/dusk
sector) beyond geostationary altitudes. To our knowledge, few studies have shown the direct
link of consecutive pulsations with a frequency range from 2 to 10 mHz (referred to as
Pi2-Ps6 band) to braking of earthward fast flows resulting from the impulsive source in the
magnetotail. Thus, determining if braking earthward fast flows can successively result in
Pi2-Ps6 band pulsations is another major issue in magnetospheric physics.
Recent THEMIS mission has deployed auroral imagers, ground magnetometers (partly the
CARISMA stations) and space-borne measurements to investigate the Time History of Events
and Macroscale Interactions during Substorms [see Angelopoulos, 2008]. During the tail
orbiting phase, the THEMIS probes can detect fast flows, energetic particle fluxes and
hydromagnetic variations in the magnetotail while other magnetospheric disturbances can be
monitored by using auroral and/or magnetic measurements on the ground as well as other
conjunction probes. From 0120 UT to 0220 UT on 11 March 2009, consecutive pulsations
with a frequency band from 2 to 10 mHz occurred at the THEMIS/CARISMA magnetometers.
Noteworthy, these pulsations occurred at a time period of very quiet geomagnetic condition
under which the incident IMF was northward, Kyoto-AL and SYM-H indices respectively
remained ~ -10 nT and ~ -4 nT (see Figure 10 in the following section). Meanwhile,
THEMIS-A, THEMIS-C, THEMIS-D and THEMIS-E probes were in the near-Earth region of
the magnetotail except the THEMIS-B probe in the distant region. The geostationary satellites
GOES 11 and GOES 12 were moving to the dusk sector and into the pre-midnight sector,
©2014 American Geophysical Union. All rights reserved.
respectively. Figures 1a and 1b show the locations of four THEMIS probes, GOES 11 and
GOES 12 in GSM X-Y and X-Z coordinates during the time of interest. Three THEMIS
low-latitude stations are marked for reference. Hence, these well-coordinated space and
ground observations provide us an opportunity to attack two aforementioned issues.
2. Data Presentation
2.1. Ground Magnetic Measurements
Figure 2 shows the locations of the THEMIS/CARISMA stations marked with blue
asterisks and the INTERMAGNET magnetometers with red asterisks in addition to the
footprints of GOES 12 with a black delta, THEMIS-C with green deltas, THEMIS-D with
cyan deltas, THEMIS-E with blue deltas and THEMIS-A with magenta deltas using the
Tsyganenko [1989] model for reference. The detailed description of THEMIS stations and
instrumentations is respectively given by Russell et al. [2008] can be accessible at the website
(http://themis.ssl.berkeley.edu/instrument_gmags.shtml) as well. Note that the magnetometers
at FSIM, RANK, GILL and PINA are four of these stations operated by the Canadian Array
for Real-time Investigations of Magnetic Activity (CARISMA; www.carisma.ca - see Mann
et al., 2008).
Figure 3 shows the time series of the H, D and Z components with one-min resolution in
Greenland, Canada and Europe near the footprint meridian of THEMIS probes from 0120 UT
to 0220 UT on 11 March 2009. The H, D and Z components from high to low latitudes are
arranged as from the top to the bottom in Figure 3. According to Rostoker [2002], substorm
activity can be recognized from the growth-to-decay (or bay-like) variation in the H
component at auroral latitudes. From Figure 3a, one can see that from 0134 UT to 0210 UT,
the H component at IQA (corrected geomagnetic latitude lat. 72.0o) had a wider bay-like
variation superposed with periodic perturbations varying from short periods to longer ones as
observed by other stations. GDH (CGM lat. 75.1o) and THL (CGM lat. 75.1o) observed a
©2014 American Geophysical Union. All rights reserved.
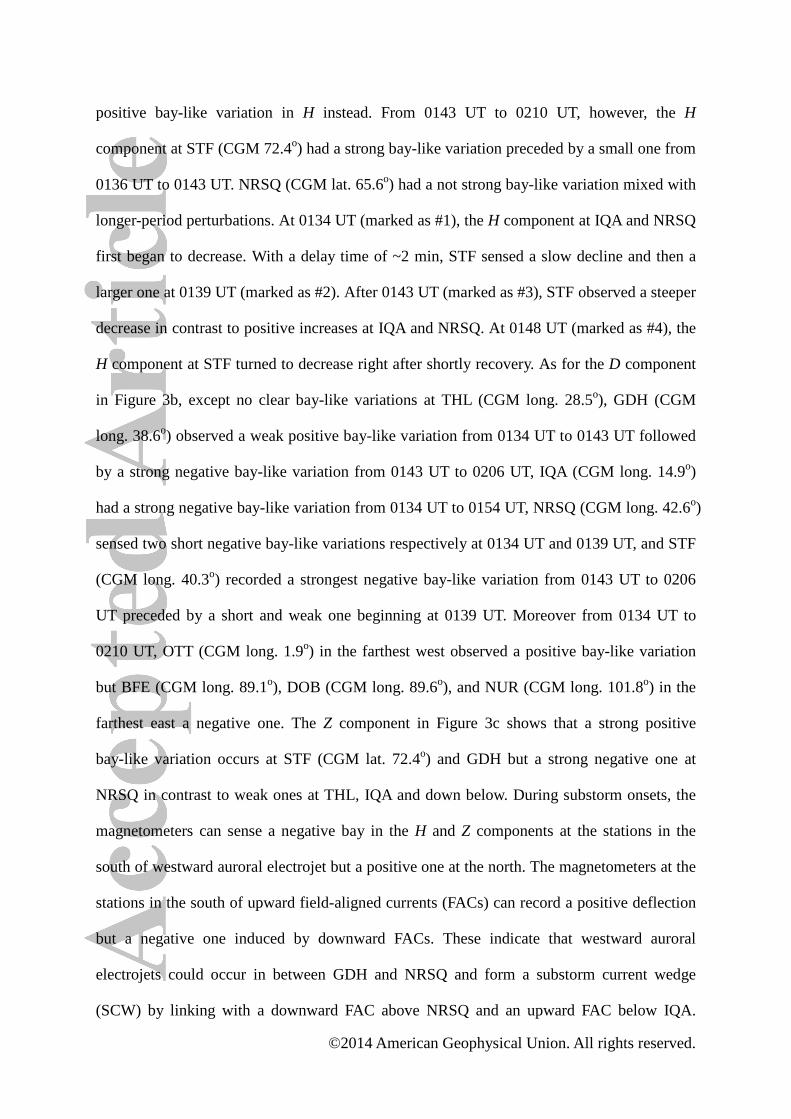
positive bay-like variation in H instead. From 0143 UT to 0210 UT, however, the H
component at STF (CGM 72.4o) had a strong bay-like variation preceded by a small one from
0136 UT to 0143 UT. NRSQ (CGM lat. 65.6o) had a not strong bay-like variation mixed with
longer-period perturbations. At 0134 UT (marked as #1), the H component at IQA and NRSQ
first began to decrease. With a delay time of ~2 min, STF sensed a slow decline and then a
larger one at 0139 UT (marked as #2). After 0143 UT (marked as #3), STF observed a steeper
decrease in contrast to positive increases at IQA and NRSQ. At 0148 UT (marked as #4), the
H component at STF turned to decrease right after shortly recovery. As for the D component
in Figure 3b, except no clear bay-like variations at THL (CGM long. 28.5o), GDH (CGM
long. 38.6o) observed a weak positive bay-like variation from 0134 UT to 0143 UT followed
by a strong negative bay-like variation from 0143 UT to 0206 UT, IQA (CGM long. 14.9o)
had a strong negative bay-like variation from 0134 UT to 0154 UT, NRSQ (CGM long. 42.6o)
sensed two short negative bay-like variations respectively at 0134 UT and 0139 UT, and STF
(CGM long. 40.3o) recorded a strongest negative bay-like variation from 0143 UT to 0206
UT preceded by a short and weak one beginning at 0139 UT. Moreover from 0134 UT to
0210 UT, OTT (CGM long. 1.9o) in the farthest west observed a positive bay-like variation
but BFE (CGM long. 89.1o), DOB (CGM long. 89.6o), and NUR (CGM long. 101.8o) in the
farthest east a negative one. The Z component in Figure 3c shows that a strong positive
bay-like variation occurs at STF (CGM lat. 72.4o) and GDH but a strong negative one at
NRSQ in contrast to weak ones at THL, IQA and down below. During substorm onsets, the
magnetometers can sense a negative bay in the H and Z components at the stations in the
south of westward auroral electrojet but a positive one at the north. The magnetometers at the
stations in the south of upward field-aligned currents (FACs) can record a positive deflection
but a negative one induced by downward FACs. These indicate that westward auroral
electrojets could occur in between GDH and NRSQ and form a substorm current wedge
(SCW) by linking with a downward FAC above NRSQ and an upward FAC below IQA.
©2014 American Geophysical Union. All rights reserved.
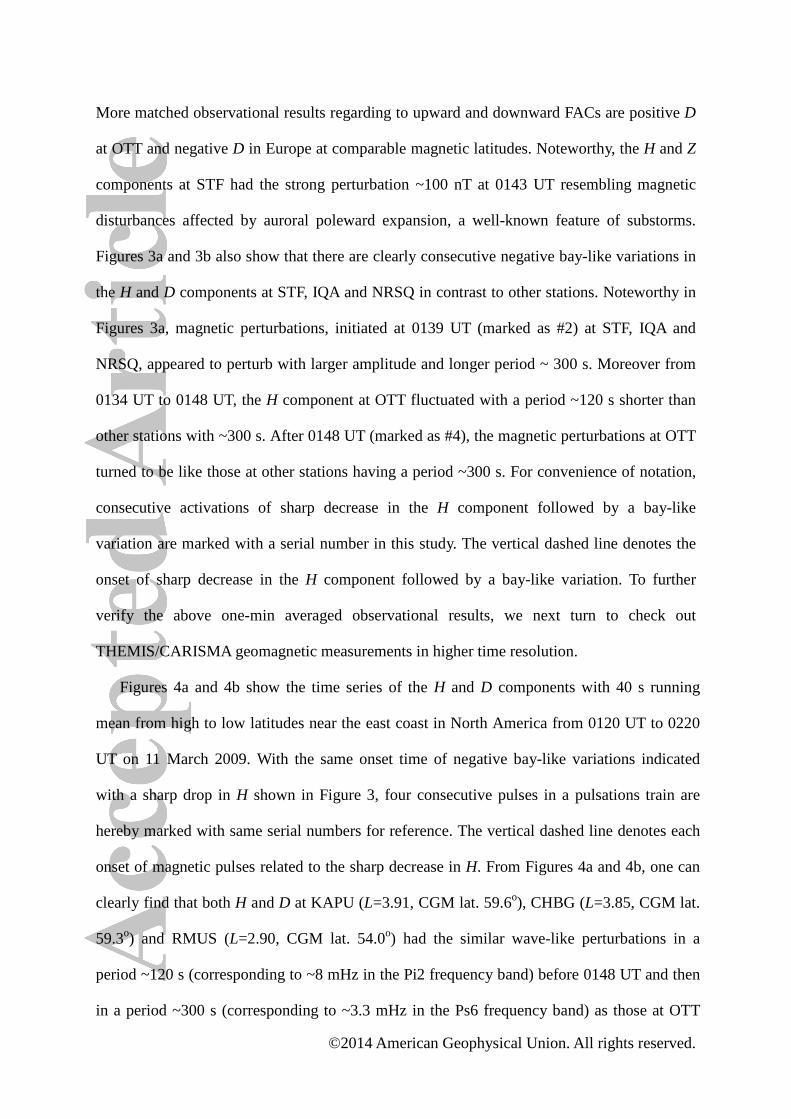
More matched observational results regarding to upward and downward FACs are positive D
at OTT and negative D in Europe at comparable magnetic latitudes. Noteworthy, the H and Z
components at STF had the strong perturbation ~100 nT at 0143 UT resembling magnetic
disturbances affected by auroral poleward expansion, a well-known feature of substorms.
Figures 3a and 3b also show that there are clearly consecutive negative bay-like variations in
the H and D components at STF, IQA and NRSQ in contrast to other stations. Noteworthy in
Figures 3a, magnetic perturbations, initiated at 0139 UT (marked as #2) at STF, IQA and
NRSQ, appeared to perturb with larger amplitude and longer period ~ 300 s. Moreover from
0134 UT to 0148 UT, the H component at OTT fluctuated with a period ~120 s shorter than
other stations with ~300 s. After 0148 UT (marked as #4), the magnetic perturbations at OTT
turned to be like those at other stations having a period ~300 s. For convenience of notation,
consecutive activations of sharp decrease in the H component followed by a bay-like
variation are marked with a serial number in this study. The vertical dashed line denotes the
onset of sharp decrease in the H component followed by a bay-like variation. To further
verify the above one-min averaged observational results, we next turn to check out
THEMIS/CARISMA geomagnetic measurements in higher time resolution.
Figures 4a and 4b show the time series of the H and D components with 40 s running
mean from high to low latitudes near the east coast in North America from 0120 UT to 0220
UT on 11 March 2009. With the same onset time of negative bay-like variations indicated
with a sharp drop in H shown in Figure 3, four consecutive pulses in a pulsations train are
hereby marked with same serial numbers for reference. The vertical dashed line denotes each
onset of magnetic pulses related to the sharp decrease in H. From Figures 4a and 4b, one can
clearly find that both H and D at KAPU (L=3.91, CGM lat. 59.6o), CHBG (L=3.85, CGM lat.
59.3o) and RMUS (L=2.90, CGM lat. 54.0o) had the similar wave-like perturbations in a
period ~120 s (corresponding to ~8 mHz in the Pi2 frequency band) before 0148 UT and then
in a period ~300 s (corresponding to ~3.3 mHz in the Ps6 frequency band) as those at OTT
©2014 American Geophysical Union. All rights reserved.
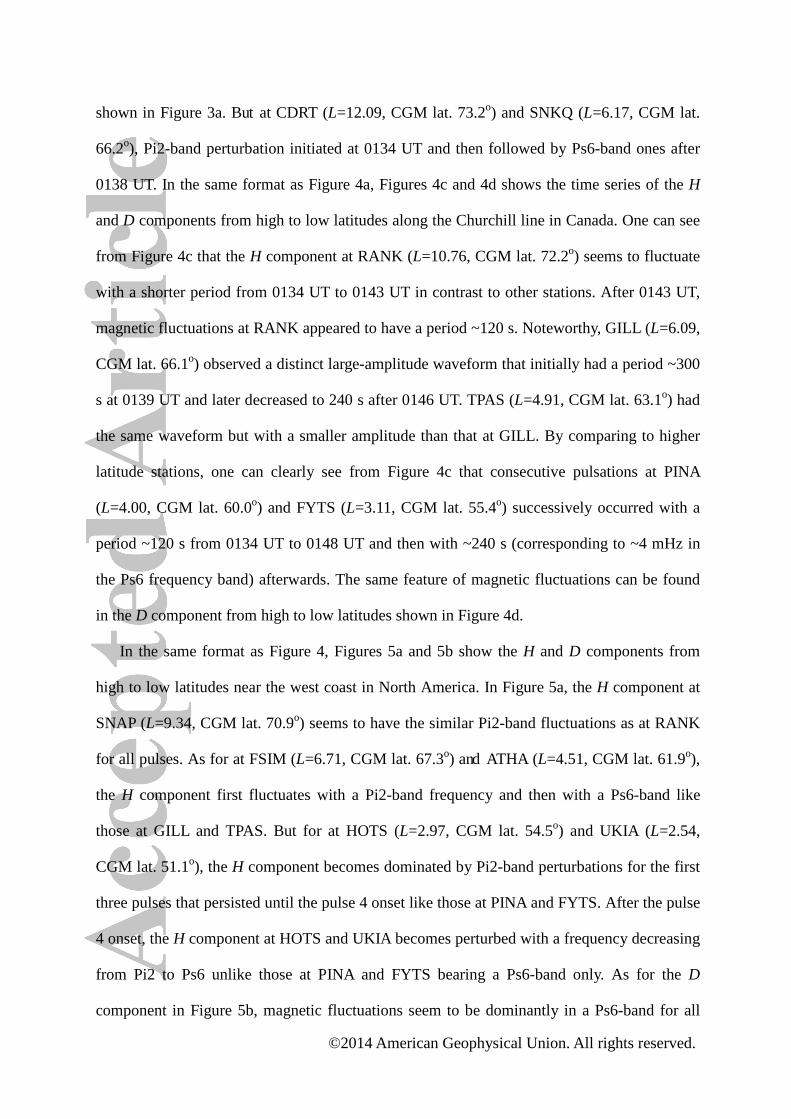
shown in Figure 3a. But at CDRT (L=12.09, CGM lat. 73.2o) and SNKQ (L=6.17, CGM lat.
66.2o), Pi2-band perturbation initiated at 0134 UT and then followed by Ps6-band ones after
0138 UT. In the same format as Figure 4a, Figures 4c and 4d shows the time series of the H
and D components from high to low latitudes along the Churchill line in Canada. One can see
from Figure 4c that the H component at RANK (L=10.76, CGM lat. 72.2o) seems to fluctuate
with a shorter period from 0134 UT to 0143 UT in contrast to other stations. After 0143 UT,
magnetic fluctuations at RANK appeared to have a period ~120 s. Noteworthy, GILL (L=6.09,
CGM lat. 66.1o) observed a distinct large-amplitude waveform that initially had a period ~300
s at 0139 UT and later decreased to 240 s after 0146 UT. TPAS (L=4.91, CGM lat. 63.1o) had
the same waveform but with a smaller amplitude than that at GILL. By comparing to higher
latitude stations, one can clearly see from Figure 4c that consecutive pulsations at PINA
(L=4.00, CGM lat. 60.0o) and FYTS (L=3.11, CGM lat. 55.4o
In the same format as Figure 4, Figures 5a and 5b show the H and D components from
high to low latitudes near the west coast in North America. In Figure 5a, the H component at
SNAP (L=9.34, CGM lat. 70.9
) successively occurred with a
period ~120 s from 0134 UT to 0148 UT and then with ~240 s (corresponding to ~4 mHz in
the Ps6 frequency band) afterwards. The same feature of magnetic fluctuations can be found
in the D component from high to low latitudes shown in Figure 4d.
o) seems to have the similar Pi2-band fluctuations as at RANK
for all pulses. As for at FSIM (L=6.71, CGM lat. 67.3o) and ATHA (L=4.51, CGM lat. 61.9o),
the H component first fluctuates with a Pi2-band frequency and then with a Ps6-band like
those at GILL and TPAS. But for at HOTS (L=2.97, CGM lat. 54.5o) and UKIA (L=2.54,
CGM lat. 51.1o), the H component becomes dominated by Pi2-band perturbations for the first
three pulses that persisted until the pulse 4 onset like those at PINA and FYTS. After the pulse
4 onset, the H component at HOTS and UKIA becomes perturbed with a frequency decreasing
from Pi2 to Ps6 unlike those at PINA and FYTS bearing a Ps6-band only. As for the D
component in Figure 5b, magnetic fluctuations seem to be dominantly in a Ps6-band for all
©2014 American Geophysical Union. All rights reserved.
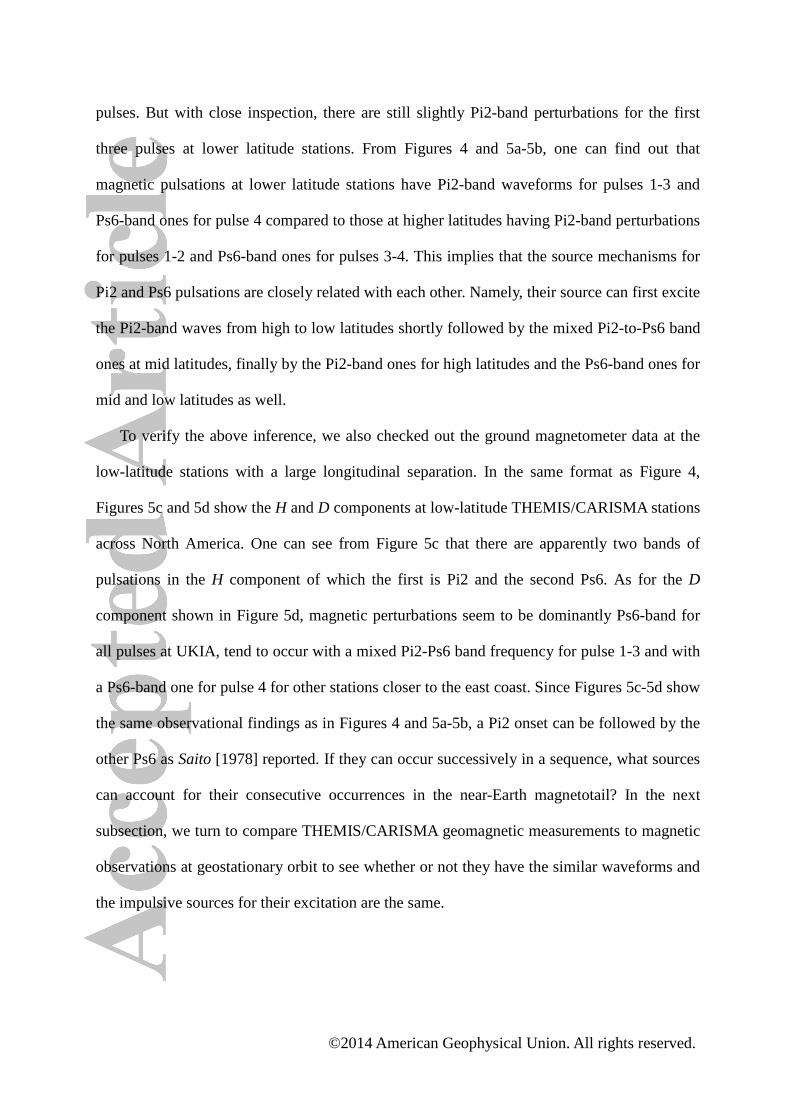
pulses. But with close inspection, there are still slightly Pi2-band perturbations for the first
three pulses at lower latitude stations. From Figures 4 and 5a-5b, one can find out that
magnetic pulsations at lower latitude stations have Pi2-band waveforms for pulses 1-3 and
Ps6-band ones for pulse 4 compared to those at higher latitudes having Pi2-band perturbations
for pulses 1-2 and Ps6-band ones for pulses 3-4. This implies that the source mechanisms for
Pi2 and Ps6 pulsations are closely related with each other. Namely, their source can first excite
the Pi2-band waves from high to low latitudes shortly followed by the mixed Pi2-to-Ps6 band
ones at mid latitudes, finally by the Pi2-band ones for high latitudes and the Ps6-band ones for
mid and low latitudes as well.
To verify the above inference, we also checked out the ground magnetometer data at the
low-latitude stations with a large longitudinal separation. In the same format as Figure 4,
Figures 5c and 5d show the H and D components at low-latitude THEMIS/CARISMA stations
across North America. One can see from Figure 5c that there are apparently two bands of
pulsations in the H component of which the first is Pi2 and the second Ps6. As for the D
component shown in Figure 5d, magnetic perturbations seem to be dominantly Ps6-band for
all pulses at UKIA, tend to occur with a mixed Pi2-Ps6 band frequency for pulse 1-3 and with
a Ps6-band one for pulse 4 for other stations closer to the east coast. Since Figures 5c-5d show
the same observational findings as in Figures 4 and 5a-5b, a Pi2 onset can be followed by the
other Ps6 as Saito [1978] reported. If they can occur successively in a sequence, what sources
can account for their consecutive occurrences in the near-Earth magnetotail? In the next
subsection, we turn to compare THEMIS/CARISMA geomagnetic measurements to magnetic
observations at geostationary orbit to see whether or not they have the similar waveforms and
the impulsive sources for their excitation are the same.
©2014 American Geophysical Union. All rights reserved.
2.2. Geostationary Observations
In this subsection, we continue to check out if the similar magnetic variations occurred at
geostationary orbit at the onset time of ground pulsations. From 0120 UT and 0220 UT,
GOES 11 moved in the late afternoon sector in the time corresponding to from 1620 LT to
1720 LT. And GOES 12 orbited into the pre-midnight sector in the time corresponding to from
2020 LT to 2120 LT. Note that the vertical dashed line in Figure 6 denotes the onset time of
ground pulsations. The magnetic field at GOES 11 and GOES 12 is defined as: Hp,
perpendicular to the satellite orbital plane (or parallel to the Earth spin axis in the case of a
zero degree inclination orbit); He, perpendicular to Hp and directed earthwards; and Hn,
perpendicular to Hp and directed eastwards. Note that the magnetic data at GOES 11 and
GOES 12 available for this event study are one-min averaged. From Figure 6b, one can see
that after the pulse 2 onset, magnetic fluctuations in the Hn component at GOES 11 look
similar to those at THEMIS/CARISMA mid-latitude stations with a Ps6-band frequency. This
frequency feature also can be found in the He component at GOES 12. The last two panels of
Figure 6 show that the Hn and Hp components at GOES 12 appear to have Pi2-band
perturbations at the onset of pulses 1-2 and Ps6-band ones after the pulse 3 onset as found in
THEMIS/CARISMA stations at L~6. With comparison of Figure 6b to Figures 6d-f, one can
identify that the amplitude of magnetic perturbations at GOES 11 is smaller than that at GOES
12. These observational results at geostationary orbit are consistent with the above inference
using THEMIS/CARISMA magnetometer data during the time of interest. It suggests that the
impulsive sources for excitation of Pi2 and Ps6 pulsations are likely the same and located in
the magnetotail as well. In the next subsection, we browse the in-situ observations by
THEMIS probes moving beyond geostationary orbit to see if three typical disturbances, such
as fast flows, magnetic dipolarizations, and energetic particle fluxes, caused by the impulsive
source in the magnetotail, occurred at the onset time of ground pulsations.
©2014 American Geophysical Union. All rights reserved.
2.3. Magnetotail Observations
Figure 7a shows the magnetic field in the magnetotail respectively observed by
THEMIS-C at ~XGSM -18.0 RE, THEMIS-D at ~XGSM -9.2 RE, THEMIS-E at ~XGSM -7.6
RE, and THEMIS-A at ~XGSM -7.5 RE
In the same time format as Figure 7a, Figure 7b shows that the ion flow velocity observed
by THEMIS-C, THEMIS-D, THEMIS-E and THEMIS-A probes. One can see from Figure 7b
that the earthward ion flow velocity at THEMIS-D suddenly increased to ~600 km/s in the
Vx_GSM component before the pulse 1 onset only. In 1 min after the pulse 1 onset, both
THEMIS-D and THEMIS-A probes observed the same flow variation pattern of first
earthward and then tailward. Like the magnetic field measurement, three components of the
ion flow velocity detected by THEMIS-C do not have any significant flow activations at the
onset of pulses 1-3. After the pulse 4 onset, however, the ion flow at THEMIS-C became
earthward and enhanced to a speed of ~400 km/s. On the contrary, there were no clear flows
from 0130 UT to 0206 UT on 11 March 2009. More
detailed locations of four THEMIS probes in GSM coordinates can refer to Figure 1. One can
clearly see from Figure 7a that THEMIS-D first observed strong fluctuations like the ones
caused by magnetic dipolarizations at ~0134 UT the onset of pulse 1. THEMIS-E and
THEMIS-A probes detected the similar magnetic fluctuations in ~3 min later. Moreover, the
Bz component at THEMIS-E and THEMIS-A sharply decreased at the pulse 1 onset and
shortly after 1 min drastically increased and followed by large-amplitude wave-like
fluctuations for ~3 min. There were no strong magnetic variations recorded by THEMIS-C at
the pulse 1-3 onset. But at the pulse 4 onset, THEMIS-C detected not strong but clear
dipolization-like magnetic fluctuations not sensed by THEMIS-D, THEMIS-E and
THEMIS-A. These observational results suggest that THEMIS-D, THEMIS-E and
THEMIS-A were in the upward FAC zone and THEMIS-C near midnight and farther out
during the time of interest.
©2014 American Geophysical Union. All rights reserved.
activities at THEMIS-D, THEMIS-E and THEMIS-A. For further verification of fast flows
being earthward and not field-aligned, we also followed Angelopoulos et al. [1994] to
calculate Vperp_xGSM, the x component of the ion flow velocity perpendicular to the ambient
magnetic field. One can also see from Figure 7b that at THEMIS-D, THEMIS-E and
THEMIS-A, the variation of Vperp_xGSM is almost the same as Vx_GSM for the first three
pulses. This implies that the ambient magnetic field did become dipolarized at the near-Earth
magnetotail after the pulse 1 onset. But for THEMIS-C at the pulse 4 onset, the magnitude of
Vperp_xGSM became less than Vx_GSM. It may be that magnetic dipolarization was not
strong and offset by tail-like and/or field-aligned movement in the distant-Earth magnetotail.
These observations suggested that the impulsive source for fast flows at all pulse onsets could
be magnetic reconnection close to THEMIS-D at ~XGSM -9.2 RE and beyond THEMIS-C at
~XGSM -18.0 RE
We further check out the energetic particle observations in the magnetotail by THEMIS
probes. Figure 8 shows the spectral plots of the energetic electron fluxes detected by
THEMIS-C, THEMIS-D, THEMIS-E and THEMIS-A from 0120 UT to 0220 UT on 11
March 2009. One can see from Figure 8 that the energetic electron fluxes at THEMIS-D
became strongly wave-like modulated prior to the pulse 1 onset and remained after the pulse 4
onset. In ~1 min after the pulse 1 onset, THEMIS-E and THEMIS-A probes simultaneously
observed energetic electron flux enhancements bearing wave modulations in a shorter
frequency than those at THEMIS-D. Unlike other probes, the energetic electron fluxes at
THEMIS-C began to decline prior to the pulse 1 onset and suddenly had two intermittent
enhancements after the pulse 4 onset. These observations suggest that THEMIS-D remained
in the plasma sheet during the time of interest. THEMIS-C was initially in the plasma sheet
prior to the pulse 1 onset, later orbited into the south lobe (or due to the plasma sheet flaring)
and observed the energetic electron flux enhancements after the pulse 4 onset. THEMIS-E and
THEMIS-A probes were not in the plasma sheet in the beginning due to magnetotail thinning
, respectively.
©2014 American Geophysical Union. All rights reserved.
but later appeared to be inside after the pulse 1 onset and stayed through the end of the time of
interest. For justification, we also inspected the energetic ion fluxes detected by THEMIS
probes. In the same format as Figure 8, Figure 9 shows that THEMIS-C observed depletion of
the energetic ion fluxes during a time interval between pulses 1 and 4 followed by two
intermittent enhancements as in the energetic electron fluxes after the onset of pulse 4. The
energetic ion fluxes at THEMIS-D, THEMIS-E and THEMIS-A probes had wave-like
modulations like those found in the energetic electron flux data after the onset of pulse 1.
Moreover, both THEMIS-E and THEMIS-A probes detected other energetic ion injections
appeared amid already existent ion fluxes prior to the pulse 1 onset. These observational
results are consistent with the inference from the energetic electron flux data. As a result, the
impulsive source for the energetic electron and ion flux enhancements can be located in
between THEMIS-C and THEMIS-D probes for pulses 1-3 and beyond the THEMIS-C
location for pulse 4. This confirms the inference of their source locations in the magnetotail
based on the magnetic field and fast flow observations in the plasma sheet. One may argue
that flow channels can be localized in local time. If it is the case, their source sites should be
in the different local time sectors. As shown in Figure 1, however, near- and distant-Earth
THEMIS probes were at the different XGSM but almost at the same YGSM and ZGSM.
Moreover from Figure 7b, one can see that the ion flow velocity flows have larger +x
component than other components. Namely, fast flows can move earthward in the same local
time sector except at the different XGSM. Until now, no other substorm models propose the
impulsive sources initiating earthward fast flows to be located at both near- and distant-Earth
regions in the magnetotail as Russell [2000] suggested. Hence as in the Russell [2000] model,
it is plausible that the impulsive source for pulses 1-3 could be magnetic reconnection
occurring at the near-Earth neutral point in the magnetotail and the one for pulse 4 at the
distant neutral point.
©2014 American Geophysical Union. All rights reserved.
2.4. Solar Wind Observations and Geomagnetic Indices
To see if the occurrence of consecutive Pi2 and Ps6 pulsations is associated with the IMF
variations, we have looked at the solar wind data just in front of the Earth’s magnetopause.
The incident IMF observed by the ACE satellite at XGSM ~240 RE in the upstream region is
mimicked as propagating to 1 AU just in front of bow shock (corresponding to XGSM ~17.0
RE) with minimum variance analysis [e.g., Weimer et al., 2003]. Figures 10a, 10b and 10c
show the IMF By, the IMF Bz, and the IMF clock angle sensed by the ACE satellite in the
upstream region shifted to the location of the Earth at 1 AU and by the Cluster 4 probe (the
one most close to the Earth) at XGSM ~18.0 RE from 0100 UT to 0200 UT on 11 March 2009.
By mapping the ground pulsation onset timing to the satellite observations, one can find from
Figures 10a and 10b that the IMF variations in the upstream region shifted to 1 AU appear to
be the same as observed by Cluster 4 during the time of interest. Since the IMF Bz was above
zero line most of the time, one may argue that the IMF was in north. As shown in Figure 10c,
however, the IMF clock angle initially was around zero and shortly turned to -90 degree and
stayed until the onset of pulses 1-3 and afterward returned to zero degree prior to the onset of
pulse 4. By contrast, one can also see from Figures 10a and 10b that the duration time of IMF
By below -2 nT at ACE is longer than that at Cluster 4. During the time of interest, ACE was
located in the afternoon sector and Cluster 4 in the morning sector. The IMF structure can be
compressed and deformed as the solar wind spirally moves close to the Earth’s magnetopause.
It is the reason why the time of the sharp drop in IMF By and Bz at Cluster 4 can be later than
that at 1 AU. This suggests that the IMF clock angle appears to have a variation cycle of
north-to-south and north again for ground pulsation onsets like the event studied by Cheng et
al. [2011]. In addition, Figure 10d shows that the solar wind dynamic pressure stayed around
1.4 nPa without any sharp change in the magnitude. From Figures 10e and 10f, one can see
that Kyoto-AL and SYM-H indices respectively remained ~ -10 nT and ~ -4 nT during the time
of interest. These observations suggest that consecutive Pi2 and Ps6 pulsations can occur
©2014 American Geophysical Union. All rights reserved.
regardless of the solar wind dynamic pressure variation and under northward-IMF,
non-substorm intervals as Sutcliffe [2010] called. According to Russell et al. [2003], the
maximum reconnection rate can occur for a low clock angle that is away from due south.
Hence, the occurrence of consecutive Pi2 and Ps6 pulsations can be due to magnetotail
reconnection in association with the IMF variations.
3. Spectral Analysis
Since the spectral analysis of geomagnetic pulsations can provide the information of their
source mechanisms and locations, we turn to perform the fast Fourier transformation (FFT) of
consecutive pulsations at the THEMIS/CARISMA stations shown in section 2 in this section.
In this study, the source site for three consecutive Pi2 pulses can be close to one another since
their time separation is less than 3 min equivalent to the traveling time between the Earth and
the plasma sheet during substorm onsets [Takahashi et al., 1999]. The perturbed H and D
spectrums are obtained by removing the ambient magnetic filed and running mean with three
spectral frequencies for two 10-min intervals of which one is 0134-0144 UT (i.e. the duration
time of pulses 1-3) and the other 0148-0158 UT (i.e. the duration time of pulse 4). Figure 11
shows the spectrum of perturbed H and D components near the east coast in North America
and the Churchill line in Canada for pulses 1-3 and 4. Figure 11a shows that for pulses 1-3
and 4, there are two dominant peaks in the H component from SNKQ down to RMUS except
CDRT with one dominant peak. For pulses 1-3, the first dominant frequency at SNKQ is ~3
mHz, but other stations ~4 mHz and the second dominant frequency is ~9-10 mHz
(corresponding to Pi2-band). As for pulse 4, the first dominant frequency is ~4 mHz the same
for pulses 1-3 at all stations. Figure 11b shows that for pulses 1-3, there are two dominant
peaks in the D component at ~3-4 mHz (corresponding to Ps6-band) for the stations below
CDRT having one dominant peak at ~4 mHz. As for pulse 4, two dominant peaks at ~4 mHz
and ~8 mHz only appear at SNKQ in contrast to others with one dominant peak at ~4 mHz.
©2014 American Geophysical Union. All rights reserved.
From Figure 11c, one can see that there are two dominant peaks in the H component in the
Churchill line for both time intervals from high to low latitudes. For pulses 1-3, the first
dominant frequency is about 3-4 mHz and the second one ~9-10 mHz. The similar spectral
feature can also be found from the pulse 4 spectrum. By contrast, the Pi2-band spectral
frequency of pulses 1-3 becomes higher than that for pulse 4. As for the Ps6-band spectral
frequency, most stations observe no clear difference between pulses 1-3 and 4 except at GILL
and TPAS where pulses 1-3 has a higher frequency with 1 mHz over pulse 4. From Figure 11d,
one can find that there are two dominant peaks in the D component at RANK, TPAS and
PINA in contrast to just one at GILL and FYTS. The first peak is at 4 mHz corresponding to
Ps6-band for pulses 1-3 and 4 at all stations. But for the second peak in the D spectrum,
RANK, TPAS and PINA have a spectral frequency of ~9-10 mHz for pulses 1-3 that is higher
than ~8-9 mHz for pulse 4. The difference of Pi2-band spectral frequency of consecutive
pulses 1-3 and 4 resembles the finding by Cheng et al. [2011] that two consecutive Pi2s have
the spectral characteristics of the dominant frequency band at the first onset becoming higher
than that at the second onset during a double-onset substorm associated with the IMF
variations. Unlike the Pi2-band spectral component having the feature of first higher and then
lower, the Ps6-band ones almost unchanged for pulses 1-3 and 4 except the H component at
GILL and TPAS appears to be first lower and then higher.
To check out if the above spectral feature using the Churchill-line stations is a global
phenomenon, we also have done the FFT analysis of consecutive pulses 1-3 and 4 near the
west coast in North America. In the same format of Figure 11, Figures 12a and 12b show the
spectrum of perturbed H and D components near the west coast for pulses 1-3 and 4. One can
find from Figure 12a that for pulses 1-3 at SNAP and FSIM, there are two dominant peaks in
the H component of which the first spectral frequency is ~2-3 mHz and the other ~9 mHz.
However, the pulses 1-3 at ATHA have one single spectral peak with frequency ~3 mHz. As
for the pulses 1-3 at lower latitudes, the H component at HOTS and UKIA seems to have one
©2014 American Geophysical Union. All rights reserved.
dominant peak with frequency ~9 mHz. As for pulse 4, the spectral feature of the H
component at SNAP, HOTS and UKIA has two dominant peaks of which the first spectral
frequency is ~2-3 mHz and the other ~9 mHz in contrast to that at FSIM and ATHA with a
single one with frequency ~3-4 mHz. One can clearly see from Figure 12b that the D
component becomes to have one single spectral peak with frequency ~3-4 mHz for pulses 1-3
and 4 at all stations as well. Moreover in Figure 12b, the dominant spectral frequency for
pulse 4 is higher than that for pulses 1-3. This feature is more obvious at FSIM, ATHA and
HOTS than two other stations. The comparison of Figures 12a and 12b to Figure 11 shows a
distinct spectral feature that two dominant peaks of H and D components are at ~2-4 mHz
corresponding to Ps6 band and at ~8-10 mHz corresponding to Pi2 band. For the Pi2-band
spectral peak of the H component, there is also a trend that pulses 1-3 seems to have a higher
frequency than pulse 4. Moreover, there are two other spectral characteristics at low-latitude
stations: the H component seems to have two harmonic peaks for pulse 4 instead of one peak
for pulses 1-3; the spectral peak of the D component of pulses 1-3 and 4 seems to be only one
and close to each other and hereby have likely the same dominant spectral frequency.
To find out if the above spectral characteristics at low-latitude stations are local features,
we proceed to make the FFT analysis of consecutive pulses 1-3 and 4 at low latitudes across
North America. In the same format of Figure 11, Figures 12c and 12d shows the spectrum of
perturbed H and D components at THEMIS/CARISMA low-latitude stations. One can see
from the H component shown in Figure 12c that except UKIA having one spectral peak for
pulses 1-3, most of low-latitude stations have two spectral peaks for pulses 1-3 and 4.
Moreover, the dominant spectral frequency of pulses 1-3 becomes higher than that of pulse 4.
The latter feature in the Pi2 band becomes clearer than the Ps6 band. But for the D component
in Figure 12d, the pulses 1-3 at SWNO, RMUS and LOYS seems to have two spectral peaks
in contrast to one at UKIA and FYTS. As for pulse 4 in Figure 12d, all low-latitude stations
appear to have one single spectral peak of which the amplitude is larger than that of pulses 1-3
©2014 American Geophysical Union. All rights reserved.
except UKIA. The spectral results at THEMIS/CARISMA low-latitude stations suggest that
Pi2-band pulsation seems to have more striking change in the dominant spectral frequency
than Ps6-band one. It is well accepted that nightside Pi2 waves excited by the impulsive
source in the magnetotail can propagate across the magnetospheric cavity in fast
compressional modes and along the geomagnetic field lines to the ground in shear Alfvén
modes [e.g., Cheng et al., 2004, 2009a, 2009b]. Moreover, fast compressional mode waves
can be trapped in the magnetospheric(plasmaspheric) cavity and result in a cavity resonance
with 180o
of phase change in the H component from high to low latitudes across the
plasmapause footprint (inside the plasmasphere) [see Lin et al., 1991; Cheng et al., 1998,
2000]. These features can be found from Pulses 2-3 in Figures 4c and 5a. Since the dominant
frequency of ground Pi2s depends on their source location and traveling path that is
determined by the cavity size, the length of the field lines and the plasma density in the
magnetosphere, their source location at the pulses 1-3 onset can be closer to the Earth than
that at the onset of pulse 4. This could be the reason why the Pi2-band spectral frequency
tends to change more strikingly than the Ps6-band one.
4. Waveform Comparison
In this section, we first examine if ground Pi2 and Ps6 onsets were directly driven by
earthward fast flows by comparing Vperp_xGSM variation to the pulsation waveforms at the
stations closer to the footprints of THEMIS probes during the time of interest. Figure 13a
shows Vperp_xGSM with 40 s running mean at four THEMIS probes from 0130 UT to 0208
UT. In the same interval as Figure 13a, Figure 13b shows the H component with 40 s running
mean at THEMIS/CARISMA stations near the east coast in North America. By comparing
Figure 13a to Figure 13b, one can see that the ground pulsations do not perturb with the same
periods and waveforms as Vperp_xGSM observed by THEMIS probes. Namely, consecutive
Pi2 and Ps6 pulsations cannot be directly controlled by earthward fast flows for this event.
©2014 American Geophysical Union. All rights reserved.
Based upon the same two harmonic spectral characteristics and 180o of phase change at
THEMIS/CARISMA stations along the same meridian, consecutive Pi2 and Ps6 pulsations
could be a fast magnetospheric/plasmaspheric cavity resonance mode. To justify this inference,
we have performed the waveform comparison at the stations along the Churchill line in
Canada by removing the ambient magnetic field. Likewise, the magnetic fluctuations sensed
by THEMIS-D, THEMIS-E, THEMIS-A, and GOES 12 satellites are included to compare to
the ground observations. The H component of the ground magnetometer can sense the
compressional component of fast mode waves propagating across the ambient magnetic field
to the Earth without any phase change [e.g., Olson, 1999 and references of therein]. The
compressional component of fast mode waves in space consists of the Bz components at
THEMIS probes and the Hp components at GOES 12. Figure 14a shows the waveforms of the
H component on the ground, the Hp component at GOES 12, and the Bz_GSM component at
three THEMIS probes. The blue and red vertical lines denote the most same peaks in the
waveforms for pulses 3 and 4, respectively. The green horizontal dashed lines denote the
nominal plasmapause for both pulses, respectively. The magnetic field data at THEMIS
probes are low-pass filtered with running mean in 40 s interval. One can see from Figure 14a
that for pulse 3 the waveform at RANK seems in phase with those at THEMIS probes and
GOES 12. But below the nominal plasmapause, the waveform at GILL seems out of phase
with GOES 12 and those at lower latitudes. As for pulse 4, the waveform at RANK seems out
of phase with those at THEMIS probes beyond the nominal plasmapause. But below the
nominal plasmapause, the waveform at GOES 12 seems out of phase with those at lower
latitudes. Next, we compared the above observational results with cavity modes calculated
with the box model by Lin et al. [1991]. With reference to a sharp jump in the plasma density
(a proxy for signature of the plasmapause) detected by THEMIS-A and –E probes in the
summary plot accessible at the THEMIS website (http://themis.ssl.berkeley.edu/index.shtml),
the nominal plasmapause was inferred to be located at ~XGSM -7.5 RE. By tracing the field
©2014 American Geophysical Union. All rights reserved.
line from RANK using Tsyganenko [1989] model, we found that the closed field line threads
in the plasma sheet less than 14 RE from the Earth. Hence, the boundary of nighttime
magnetospheric cavity could be around 14 RE from the Earth. Figure 14b shows the first and
second harmonics of magnetospheric cavity resonances in the box model by Lin et al. [1991]
for the plasma injection front at x/a=14, ka=0.2, p=7.5, q=7.6, and R=100. Note that the
letter a denotes the Earth’s radius, E1y the y component of perturbed electric field and B1z
On the other hand, the impulsive source like braking earthward fast flows may stimulate
the surface waves at the region with a steep gradient in Alfvén speed [e.g., Hasegawa and
Chen, 1974]. Unlike the cavity mode, surface waves are an evanescent fast mode, and their
amplitude decrease in isotropic propagation. To find out what is the exact source mechanism
for the amplitude enhancement at SNKQ, GILL and FSIM, we compare the H and D
components at THEMIS/CARISMA L~6 stations to the Hp and Hn components at GOES 12.
the z
component of perturbed magnetic field (corresponding to the fast compressional component).
In the same format as Figure 14b, Figure 14c shows first two harmonics of plasmaspheric
cavity resonances. By comparing Figures 14b and 14c to Figure 14a, one can find that
theoretical results are qualitatively consistent with observational ones in phase change from
space to the ground. Moreover based on a formula to estimate the period of cavity modes (see
Eq. 16 in Lin et al. [1991]) for the ratio of ion mass and proton mass to be 7.2 and the
plasmapause number density (per cubic centimeter) to be 16, the periods of first and second
magnetospheric (plasmaspheric) cavity modes respectively are 267.1 s (215.7 s) and 160.5 s
(134.8 s) as in the Pi2-Ps6 band as those observed by THEMIS/CARISMA stations. As a
result, both observational waveform comparison and theoretical results justifies that
consecutive Pi2 and Ps6 pulsations can be a fast magnetospheric/plasmaspheric cavity
resonance mode. Hence, it is suggested that Pi2 can result from a combination of fast
magnetospheric and plasmaspheric cavity resonance modes and Ps6 from a fast
magnetospheric cavity resonance mode.
©2014 American Geophysical Union. All rights reserved.
Figure 15 shows the H and D components at L~6 with a large longitudinal separation from
0120 UT to 0208 UT. One can see from Figure 15a that except at FYKN (L=6.71, CGM long.
266.4o) and TRO (L=6.71, CGM long. 102,9o), the H component began to fluctuate with a
slightly small but clear amplitude at 0134 UT. Note that the data resolution at TRO and NRSQ
(L=5.88, CGM long. 42.6o
) is respectively 1 min and 20 s unlike others with 1 s. For all
stations, the H component turned to have a wave-like oscillation with a period that was ~300 s
after 0139 UT and changed to ~240 s after ~0144 UT that persisted until 0208 UT. Moreover,
its amplitude first increased at SNKQ, subsequently at NRSQ and GOES 12, and finally at
FYKN and TRO. The arrowed solid lines denote the propagation direction of two adjacent
wave peaks of magnetic perturbations in the Ps6 band sensed by each magnetometer at L~6.
The same feature can be found in the D component shown in Figure 14b. Moreover, it is
noteworthy in Figure 15b that GILL and GOES 12 observe Ps6-band oscillation in the D and
Hn components right after 0134 UT the onset time of pulse 1 unlike others with a time delay.
Since Ps6-band perturbations at L~6 can occur with a delay time from the pulse 1 onset, their
amplitude enhancement does not just result from the coupling of a fast magnetospheric cavity
resonance mode to field line resonances but also from the surface waves in the near-Earth
magnetotail propagating both westward with a propagation speed of ~ 56 km/s and eastward ~
28 km/s from the meridian between SNKQ and NRSQ. The latter result is consistent with the
review by Saito [1978] that Ps6 onsets can propagate with a propagation speed of ~40 km/s
accompanied by two snake-like auroral activations meandering both westward and eastward
from the midnight site.
5. Hodogram Analysis
According to Hughes [1994], the polarization sense of magnetic pulsations caused by the
surface wave at the magnetopause due to KHI is respectively right-hand in the dawn flank of
the Earth’s magnetosphere and left-hand in the dusk flank. In this section, we attempt to
©2014 American Geophysical Union. All rights reserved.
perform the hodogram analysis of consecutive Pi2 and Ps6 pulsations at L~6 and at THEMIS
probes to study their link to earthward fast flows in the magnetotail. The ground hodogram
includes the perturbed H and D components. The hodogram at GOES 12 consists of the
perturbed Hn and He components. The hodogram at THEMIS probes is plotted with the
perturbed Bx_GSM and By_GSM components. The hodogram pattern is identified as
right-hand (RH) polarization and left-hand (LH) polarization along the direction of the
ambient magnetic field. Figure 16 shows the wave polarizations of pulse 4 on the ground and
in space. Note that the hodograms are arranged from top to down corresponding to from east
to west. One can see from Figure 16 that the wave polarization at L~6 changes from RH at
NRSQ to LH at SNKQ then to RH at GOES 12 and again to LH at GILL and FSIM. Moreover,
the wave polarization changes from LH at THEMIS-D and THEMIS-E to RH at THEMIS-A.
The wave polarization of pulse 4 (not shown in this study) resembles pulses 1-3 except
RH-LH at TRO, RH at FYKN, and RH for all THEMIS probes. The observational results at
L~6 are consistent with the polarization pattern caused by the surface waves stimulated by
braking earthward fast flows. As earthward fast flows brake and divert to dawn and dusk, flow
diversions could drive the similar polarization pattern caused by surface waves like those
around the Earth’s magnetopause [see Hughes,1994]. In Figure 7b, the Vy_GSM component at
THEMIS-E and THEMIS-A fluctuates around zero with a larger magnitude than that at
THEMIS-D. The fast flows with a positive (negative) Vy_GSM component correspond to
move earthward with a dawnward (duskward) component. Thus, fast flows could brake and
then move against the ambient convective flows likely to cause required velocity shear at their
interface and lead to so-called surface waves there. Consequently, earthward fast flows
braking in the magnetotail can play another dominant role for excitation of consecutive Pi2
and Ps6 pulsations for this event.
©2014 American Geophysical Union. All rights reserved.
6. Discussion
Previous studies by Saito [1978] and Connors et al. [2003] discovered that a Pi2 onset
can be accompanied by a Ps6. It is widely adopted that Pi2 can be regarded as an indicator of
substorm expansive phase onset. Ps6 pulsations, commonly seen accompanied by two
snake-like auroral activations meandering both eastward and westward from the midnight site,
can be magnetic perturbations induced by a current system passing over auroral zone during
substorms [Saito, 1978]. Some other studies [e.g., Opgenoorth et al., 1983, 1994] reported
that Ps6 can be associated with the substorm recovery phase. On the other hand, using ground
and space observations, Cheng et al. [2005] showed that Pi2s can have two and more onsets
under a distinct IMF variation cycle of north-to-south and north again during a substorm
sequence. More recently, Cheng et al. [2011] demonstrated the observational evidence that
two pairs of THEMIS ground Pi2s had the similar wave-like perturbations observed by
Cluster 4, probably driven by near-Earth reconnection during two double-onset substorms in
response to two distinct IMF variation cycles of north-to-south and north again. However,
Sutcliffe [2010] reported that Pi2 can occur at low latitudes during IMF-northward,
non-substorm intervals. Moreover, Keiling et al. [2006] argued that ground Pi2 can be
directly driven by pulsed reconnection in the magnetotail while the IMF in north. After
magnetotail reconnection occurs, fast flows can direct earthward and brake to lead to Pi2
onset [Shiokawa et al., 1998]. In addition, braking earthward fast flows can result in required
velocity shear in favor of the development of KHI-driven surface waves at the interface
[Connors and Rostoker, 1993]. Although past ground observations show that Pi2 and Ps6 can
occur in succession at substorm and non-substorm times, it is still unknown what causes
consecutive Pi2 and Ps6 onsets and their occurrence relationship with the IMF variations.
Thus by adopting well-coordinated observations on the ground and in space by the THEMIS
mission, the present study is the first one examining the relationship among consecutive Pi2
and Ps6 onsets, nightside hydrodynamic disturbances and the IMF variations. More
©2014 American Geophysical Union. All rights reserved.
importantly, the 11 March 2009 event demonstrates an unprecedented global picture of the
dynamic process of consecutive Pi2 and Ps6 onsets and earthward fast flows in response to
the IMF variations under a period time of very quiet geomagnetic condition.
In this study, the magnetometers in Greenland and Canada observed four consecutive
bay-like variations in the H component accompanied by positive and negative deflections in
the D component from west to east across the Atlantic like those affected by the SCW
formation during the time of interest (see Figure 3). Meanwhile, a train of consecutive Pi2-Ps6
band pulsations with a frequency range from 2 to 10 mHz appeared simultaneously at
THEMIS/CARISMA stations (see Figures 4-5). Especially at low latitudes, the pulsation train
can be visually identified as three consecutive Pi2s and one Ps6 (see Figures 5c-5d). Unlike
low-latitude one, the pulsation train at high (mid) latitudes occurred in a sequence of first
Pi2-band perturbations and then (large-amplitude) Ps6 (see Figures 4-5). Meanwhile at the
geostationary orbit, GOES 12 moving in the pre-midnight sector observed magnetic
perturbations similar to those at THEMIS/CARISMA ground stations at L~6 (see Figure 6).
The ground and geostationary observations suggest that the impulsive source sites for
consecutive Pi2 and Ps6 pulsations are close to one another around the midnight sector and
beyond geostationary orbit.
In the meantime, THEMIS-A, THEMIS-D and THEMIS-E probes were in the
pre-midnight sector and in the plasma sheet as well. Earthward fast flows, magnetic
dipolarizations, and modulated energetic ion and electron fluxes were first observed by
THEMIS-D at ~XGSM -9.2 RE prior to the pulse 1 onset time and then by THEMIS-E and
THEMIS-A at ~XGSM -7.6 RE after the pulse 1 onset. At the pulse 4 onset, these similar
disturbances were detected by THEMIS-C at ~XGSM -18.0 RE and not seen by THEMIS-A,
THEMIS-D and THEMIS-E probes at the radial distance less than 10 RE (see Figures 7-9).
Hence, magnetotail observations suggest that the impulsive source site for pulses 1-3 can be in
between the THEMIS-C and THEMIS-D locations and that for pulses 4 beyond the
©2014 American Geophysical Union. All rights reserved.
THEMIS-C site. By comparing Figure 6f to Figure 7a, however, one may argue that there are
no magnetic dipolarizations at GOES 12 as sensed by THEMIS-C and THEMIS-D. The
reason is that GOES 12 was close to the dusk sector not in the right position to detect small
dipolarizations and/or SCW formations occurring in the midnight sector. From Figures 3a and
3b, one can see that the H component had magnetic bay-like variations at STF, IQA and
NRSQ close to the footprints of THEMIS probes. And the D component had positive
deflections at OTT in Canada and negative ones in Europe. These observational results
support the inference that small SCW formations can be located across the Atlantic in the
midnight sector. For justification, we also compared Vperp_xGSM to VxGSM. Both
Vperp_xGSM and VxGSM variations look alike during the occurrence time of pulses 1-3 (see
Figure 7b). This suggests that the near-Earth magnetotail became dipolarized at each onset of
pulses 1-3. According to Takahashi et al. [1999], successive Pi2s can be regarded as recurring
in one succession with a time separation between two neighboring pulsations less than 3 min
equivalent to the traveling time between the Earth and the plasma sheet during substorm
onsets. Hence for this event, the first three Pi2s can be triple activations in a succession
resulting from the same impulsive source in the magnetotail. Moreover from Figures 13a and
13b, one can see that the ground pulsation waveforms near the footprints of THEMIS probes
are quite different from Vperp_xGSM variations at the near-Earth magnetotail. This
observational result does not support the view that earthward fast flows can directly drive Pi2
waves and control their frequency. Since earthward fast flows are the signature of momentum
and flux transport driven by magnetotail reconnection [Baumjohann et al., 1990], the
impulsive source for pulses 1-3 could be magnetic reconnection occurring at the near-Earth
neutral point in the magnetotail and the one for pulse 4 at the distant neutral point as in the
two-neutral-point model by Russell [2000].
In this study, the mapping of ground pulsation onset timing to the IMF observations just in
front of the Earth’s magnetopause shows that they appear during a northward IMF period with
©2014 American Geophysical Union. All rights reserved.
a clock angle variation of low-to-high and then low (see Figure 10). Moreover, the solar wind
dynamic pressure remained unchanged in the magnitude and Kyoto-AL and SYM-H indices
respectively remained low during the time of interest. These observational results suggest that
consecutive Pi2 and Ps6 pulsations occur during northward-IMF, non-substorm intervals as
Sutcliffe [2010] named.
The spectrum of the H component at THEMIS/CARISMA stations shows two harmonic
dominant frequencies of which the first is ~2-4 mHz and the second ~8-10 mHz (see Figures
11a,11c, 12a and 12c). As for the D component, the spectrum seems to have one dominant
frequency ~2-4 mHz (see Figures 11b, 11d, 12b and 12d). Notably for the Pi2-band frequency,
the spectrum of pulses 1-3 and 4 appears to have a feature of first higher frequency and then
lower one bearing the spectral characteristics of double-onset substorm triggered by the
northward turning of the IMF as Cheng et al. [2011] reported. Waveform comparisons of the
fast compressional component show that the waveform of the pulse 3 at RANK seems in
phase with those at THEMIS probes and GOES 12. But below the nominal plasmapause, the
waveform at GILL seems out of phase with those at lower latitudes. The waveform of the
pulse 4 at RANK seems out of phase with those at THEMIS probes beyond the nominal
plasmapause. But below the nominal plasmapause, the waveform at GOES 12 seems out of
phase with those at lower latitudes. As shown in Figures 14a, these observational results are
the same as the findings by Cheng et al. [2009b]. We note that Takahashi et al. [2003]
presented two harmonic frequencies of Pi2s during a period of auroral electrojet
intensification, ~7 mHz and ~12 mHz, with comparison of the ground data at Kakioka
(L=1.26) to the CRRES observations around the plasmapause. Their first harmonic frequency
~7 mHz is close to the second harmonic frequency in our finding. Takahashi et al. suggested
that they result from plasmaspheric cavity resonances. To verify the above inference, we have
performed calculation of first two harmonics of magnetospheric/plasma cavity resonance
modes in the box model by Lin et al. [1991] with normalized parameters based on
©2014 American Geophysical Union. All rights reserved.
observational results (see Figures 14b and 14c). Consequently, theoretical results are
qualitatively consistent with observational ones. Hence for this event, Pi2 can result from a
combination of fast magnetospheric and plasmaspheric cavity resonances and Ps6 from a fast
magnetospheric cavity resonance.
On the other hand, at the region with a steep gradient in Alfvén speed, surface waves can
be driven by the impulsive source due to braking earthward fast flows in the plasma sheet
[Hasegawa and Chen, 1974]. In this study, the waveforms of the H and D components at
THEMIS/CARISMA stations at L~6 and the HP and Hn components at GOES 12 look like
those caused by the surface waves propagating both westward with a propagation speed of ~
56 km/s and eastward ~ 28 km/s from the meridian between SNKQ and NRSQ (See Figure
15). From Figures 3a and 3b, one can also see that after 0148 UT there were the same Ps6
waveforms in the H and D components at mid latitudes from OTT in Canada to BFE and to
NUR the farther east in Europe. The same Ps6 waveforms can be found at ZYK (L=4.05,
CGM 218.3o
Since the KHI development on the boundary of earthward flow channel can drive
so-called surface waves there and thus lead to braking of fast flows in the near-Earth
magnetotail [Volwerk et al., 2007] and periodic aurora surge propagating eastward and
) one of 210 MM stations (http://stdb2.stelab.nagoya-u.ac.jp/mm210/) in the
morning sector as well (not shown in this study). The amplitude of Ps6 waves appeared to
decrease as they propagated eastward from BFE to NUR and to ZYK. Based on these
mid-latitude observations like those at L~6 and GOES 12, Ps6 can result from the surface
waves at the interface separating braking earthward fast flows from the ambient plasma
convection region closer to the Earth to be excited in the meridian between OTT and BFE as
in between SNKQ and NRSQ with a feature of both westward and eastward propagation.
These findings are consistent with the previous suggestion by Saito [1978] that Ps6 can be
accompanied by two snake-like auroral activations meandering both westward and eastward
from the midnight site with a propagation speed of ~40 km/s.
©2014 American Geophysical Union. All rights reserved.
westward at poleward boundary of auroral zone can be caused by the generation of periodic
burst of bi-directional flows beyond geostationary altitudes [Saka et al., 2012], hodogram
analyses are performed in this study to test their arguments. Consequently, the polarization
patterns of consecutive Pi2 and Ps6 pulsations beyond geostationary altitudes look similar to
those associated with the surface wave at the Earth’s magnetopause as Hughes [1994] showed
(see Figure 16).
Although no good auroral images in Canada were available for comparison, we found
from the website (http://www.geo.fmi.fi/MIRACLE/ASC/) that diffuse auroral activations did
occur over Finland observatories at LYR and KIL during the time of interest (not shown in
this study). Based on that the onset of both nightside Pi2 pulsations and magnetic bay
variations can be simultaneous with auroral brightening, Kepko et al. [2004] argued that they
are driven by the fast flows in the magnetotail. Since the duration of fast flows is a few
minutes, fast flows are regarded as driven by patchy-bursty 3-D spontaneous reconnection
instead of a single X line steady 2-D reconnection [Kan, 1998]. For explanation of the
double-onset observations, Russell [2000] modified the NENL model with emphasis on the
interplay of the near-Earth and the distant neutral points under an IMF variation cycle of
north-to-south and north again. In this study, consecutive Pi2-Ps6 band pulsations observed by
the THEMIS mission successively occur during a distinct clock angle variation cycle of
low-to-high and then low again while the IMF in north. By using SuperDARN observations,
Grocott et al. [2005] reported that the nightside ionospheric flows can result from the
reconnection in an asymmetric tail under influence of IMF By corresponding to low clock
angle condition. Russell et al. [2003] suggested that the maximum reconnection rate can occur
under a low clock angle that is away from due south. Thus, the 11 March 2009 event can be
explained with the Russell [2000] model. Namely, this event manifests the association of
consecutive Pi2-Ps6 band pulsations with earthward fast flows in the plasma sheet in response
to the IMF variations.
©2014 American Geophysical Union. All rights reserved.
Since our Ps6 periods just touch the conventional period range, one may argue that they
are atypical and not related to previously reported Ps6 events. One even argues that their
period and waveforms look like Pc5’s. By comparing Figure 3 to Figure 9 in Connors et al.
[2003], we find out that after magnetic bay activation and low-latitude Pi2 onset, both look
alike to have magnetic perturbations varying in two stages from short period to longer one
except for different time range and amplitude scale. The short-period perturbations in stage 1
occur with the same period and waveform as Pc5 and the longer-period ones in stage 2 seem
to have larger amplitude like Ps6. The short-period perturbations can be excited by braking
earthward fast flows and the longer-period ones with enhanced amplitude can be induced by
auroral zone currents due to relaxation of magnetic stress brought by earthward fast flows in
the later time [see Vaivads et al., 2001]. Hence, both can have the same origin and appear to
have different periods and waveforms in two stages. In this study, we have showed the
observational evidence of magnetic perturbation ~100 nT like those affected by auroral
poleward expansion during substorm onset (see Figure 3). To our knowledge, there is not any
literature reporting Pc5 preceded by Pi2 right after substorm onset. Hence in this event study,
the reported long-period pulsations can be referred to as Ps6.
7. Summary and Conclusion
On 11 March 2009, a train of Pi2-Ps6 band pulsations occurred at THEMIS/CARISMA
observatories in the pre-midnight sector. Unlike three consecutive Pi2s and one Ps6 clearly
identified at low latitudes, the pulsation train at high latitudes first perturbed in the Pi2-band
frequency and then in the Ps6 band, and at mid latitudes had the similar feature but followed
by large-amplitude Ps6. High-latitude magnetometers in Greenland and Canada observed four
consecutive bay-like magnetic variations like those affected by the SCW formation during the
occurrence time of consecutive Pi2 and Ps6 pulsations.
The geostationary orbit magnetometers sensed similar magnetic perturbations. Meanwhile,
©2014 American Geophysical Union. All rights reserved.
THEMIS probes in the plasma sheet first observed earthward fast flows, magnetic
dipolarizations and modulated energetic particle fluxes at ~XGSM -9.2 RE, then at ~XGSM
-7.5 RE for Pi2 and at ~XGSM -18.0 RE
The spectrum of the H component shows two harmonic frequencies of which the first is
~2-4 mHz and the second ~8-10 mHz. As for the D component, the spectrum seems to have
one dominant frequency ~2-4 mHz. For the Pi2 band, there is a more distinct spectrum of
higher frequency for pulses 1-3 and a lower one for pulse 4 in H than D. Waveform
comparisons show that Pi2 can result from a combination of fast magnetospheric and
plasmaspheric cavity resonances and Ps6 from a fast magnetospheric cavity resonance.
Hodogram analyses suggest that the surface waves at the interface between braking earthward
fast flows from the magnetotail and the ambient plasma convection region closer to the Earth
could lead to large-amplitude Ps6 at mid latitudes.
only for Ps6. The mapping of ground pulsations onset
timing to the solar wind observation just in front of Earth’s magnetopause shows that they
appear in a northward IMF period with a clock angle variation of low-to-high and then low.
Hence as in the two-neutral-point model by Russell [2000], consecutive Pi2 and Ps6
onsets can be associated with earthward fast flows in the plasma sheet, expectedly and
respectively driven by magnetic reconnection in the near-Earth region and the distant-Earth
one in response to the IMF variations during a very quiet geomagnetic time interval.
©2014 American Geophysical Union. All rights reserved.
Acknowledgments
We are indebted to M. Connors at Athabasca University for constructive comments on this work. The THEMIS data were obtained via CDAWeb. We acknowledge NASA contract NAS5-02099, V. Angelopoulos and C. T. Russell at UCLA for use of data from the THEMIS Mission. The CARISMA magnetometer array is operated by the University of Alberta, funded by the Canadian Space Agency. We thank the national institutes that support them and INTERMAGNET for promoting high standards of magnetic observatory practice. The GOES 11, GOES 12 magnetic field data were provided by H. Singer at NOAA via CDAWeb. The Kyoto AL index, the SYM-H index and the IMF data at 1 AU were provided by J.H. King and N. Papatashvilli at NASA GFSC via CDAWeb. The magnetic data at Cluster 4 were provided by A. Balogh at ICSTM via CDAWeb. This work was supported by National Science Council of R. O. C. on Taiwan under the grant NSC 100-2111-M-150-001.
©2014 American Geophysical Union. All rights reserved.
References Angelopoulos, V., C. F. Kennel, F. V. Coroniti, R. Pellat, M. G. Kivelson, R. J. Walker, C. T.
Russell, W. Baumjohann, W. C. Feldman, and J. T. Gosling (1994), Statistical characteristics of bursty bulk flow events, J. Geophys. Res., 99, 21,257-21,280.
Angelopoulos, V. (2008), The THEMIS Mission, Space Sci. Rev., 141, 5-34, doi: 10.1007/s11214-008-9336-1.
Baumjohann, W., and K. H. Glassmeier (1984), The transient response mechanism and Pi2 pulsations at substorm onset - Review and outlook, Planet. Space Sci., 32, 1361-1370.
Baumjohann, W., G.. Paschmann, and H. Luhr (1990), Characteristics of high-speed ion flows in the plasma sheet, J. Geophys. Res., 95, 3801-3809.
Cheng, C.-C., J.-K. Chao, and T.-S. Hsu (1998), Evidence of the coupling of a fast magnetospheric cavity mode to field line resonances, Earth Planet. Space, 50, 683-697.
Cheng, C.-C., J.-K. Chao, and K. Yumoto (2000), Spectral power of low-latitude Pi2 pulsations at 210o
Cheng, C.-C., C. T. Russell, Y. F. Gao, and P. J. Chi (2002a), On consecutive bursts of low-latitude Pi2 pulsations, J. Atoms. Sol. -Terr. Phys., 64, 1809-1821.
magnetic meridian stations and plasmaspheric cavity resonances, Earth Planet. Space, 52, 615-627.
Cheng, C.-C., C. T. Russell, M. Connors, and P. J. Chi (2002b), Relationship between multiple substorm onsets and the IMF: A case study, J. Geophys. Res., 107(A10), 1289, doi:10.1029/2001JA007553.
Cheng, C.-C., C. T. Russell, K. Yumoto, Y. F. Gao, and P. J. Chi (2004), Characteristics of consecutive bursts of Pi2 pulsations observed at the SMALL array: A new implication, Earth Planet. Space, 56, 531-545.
Cheng, C.-C., C. T. Russell, G. D. Reeves, M. Connors, and M. B. Moldwin (2005), On the relationship between double-onset substorm, pseudobreakup, and IMF variation: The 4 September 1999 event, J. Geophys. Res., 110, A07201, doi:10.1029/2004JA010778.
Cheng, C.-C., C. T. Russell, and J.-H. Shue (2009a), On the association of quiet-time Pi2 pulsations with IMF variations, Adv. Space Res., 43, 1118-1129, doi:10.1016/j.asr.2008.12.001.
Cheng, C.-C., C. T. Russell, V. Angelopoulos, I. Mann, K. H. Glassmeier, U. Auster, and W. Baumjohann (2009b), THEMIS observations of consecutive bursts of Pi2 pulsations: The 20 April 2007 event, J. Geophys. Res., 114, A00C19, doi:10.1029/2008JA013538.
Cheng, C.-C., C. T. Russell, V. Angelopoulos, I. R. Mann, K.-H. Glassmeier, and W. Baumjohann (2011),
Clauer, C. R., and R. L. McPherron (1974), Mapping the local time-universal time development of magnetospheric substorms using mid-latitude magnetic observations, J.
THEMIS observations of double-onset substorms and their association with IMF variations, Ann. Geophys., 29, 591-611, doi:10.5194/angeo-29-591-2011.
©2014 American Geophysical Union. All rights reserved.
Geophys. Res., 79, 2811-2820. Connors, M., and G. Rostoker (1993), Source mechanisms for morning auroral features,
Geophys. Res. Lett., 20, 1535–1538. Connors, M., G. Rostoker, G. Sofko, R. L. McPherron, and M. G.. Henderson (2003), Ps 6
disturbances: relation to substorms and the auroral oval, Ann. Geophys., 21, 493-508. Grocott, A., T. K. Yeoman, S. E. Milan, and S.W.H.Cowley (2005), Interhemispheric
observations of the ionospheric signature of tail reconnection during IMF-northward non-substorm intervals, Ann. Geophys., 23, 1763-1770.
Hasegawa, A., and L. Chen (1974), Theory of magnetic pulsations, Space Sci. Rev., 16, 347–359.
Hughes, W. J., and D. J. Southwood (1976), The screening of micropulsation signals by the atmosphere and ionosphere, J. Geophys. Res., 81, 3234-3240.
Hughes, W. J. (1994), Magnetospheric ULF waves: A tutorial with a historical perspective, ed. M. J. Engebretson et al., pp. 1-11, AGU monograph 81, Washington, DC.
Kan, J. R. (1998), A global integrated substorm model: Tail reconnection and magnetoshere-ionosphere coupling, J. Geophys. Res., 103, 11,787-11,795.
Keiling, A., et al. (2006), Association of Pi2 pulsations and pulsed reconnection: ground and Cluster observation in the tail lobe at 16 RE, Ann. Geophys., 24, 3433-3449
Kepko, L., M. G. Kivelson, R. L. McPherron, and H. E. Spence (2004), Relative timing of substorm onset phenomena, J. Geophys. Res., 109, A04203, doi:10.1029/2003JA010285.
.
Lin, C. A., L. C. Lee, and Y. J. Sun (1991), Observations of Pi2 pulsations at a very low latitude (L=1.06) station and magnetospheric cavity resonances, J. Geophys. Res., 96, 21,105-21,114.
Mann, I. R., D. K. Milling, I. J. Rae, L. G.. Ozeke, A. Kale, Z. C. Kale, K. R. Murphy, A. Parent, M. Usanova, D. M. Pahud, E.-A. Lee, V. Amalarj, D. D. Wallis, V. Angelopoulos, K. H. Glassmeier, C. T. Russell, H.-U. Auster, and H. J. Singer (2008), The upgraded CARISMA magnetometer array in the THEMIS era, Space Sci. Rev., 141, 413-451, doi: 10.1007/s11214-008-9457-6.
Mishin, V. M., T. Saifudinova, A. Bazarzhapov, C. T. Russell, W. Baumjohann, R. Nakamura, and M. Kubyshkina (2001), Two distinct substorm onsets, J. Geophys. Res., 106, 13,105-13,118.
Olson, J. V. (1999), Pi2 pulsations and substorm onsets: A review, J. Geophys. Res., 104, 17,499-17,520.
Opgenoorth, H. J., J. Oksman, K.U. Kaila, E. Nielsen, and W. Baumjohann (1983), Characteristics of eastward drifting omega bands in the morning sector of the auroral oval, J. Geophys. Res., 88, 9171–9185.
Opgenoorth, H. J., M. A. L. Persson, T. I. Pulkkinen, and R. J. Pellinen (1994), Recovery
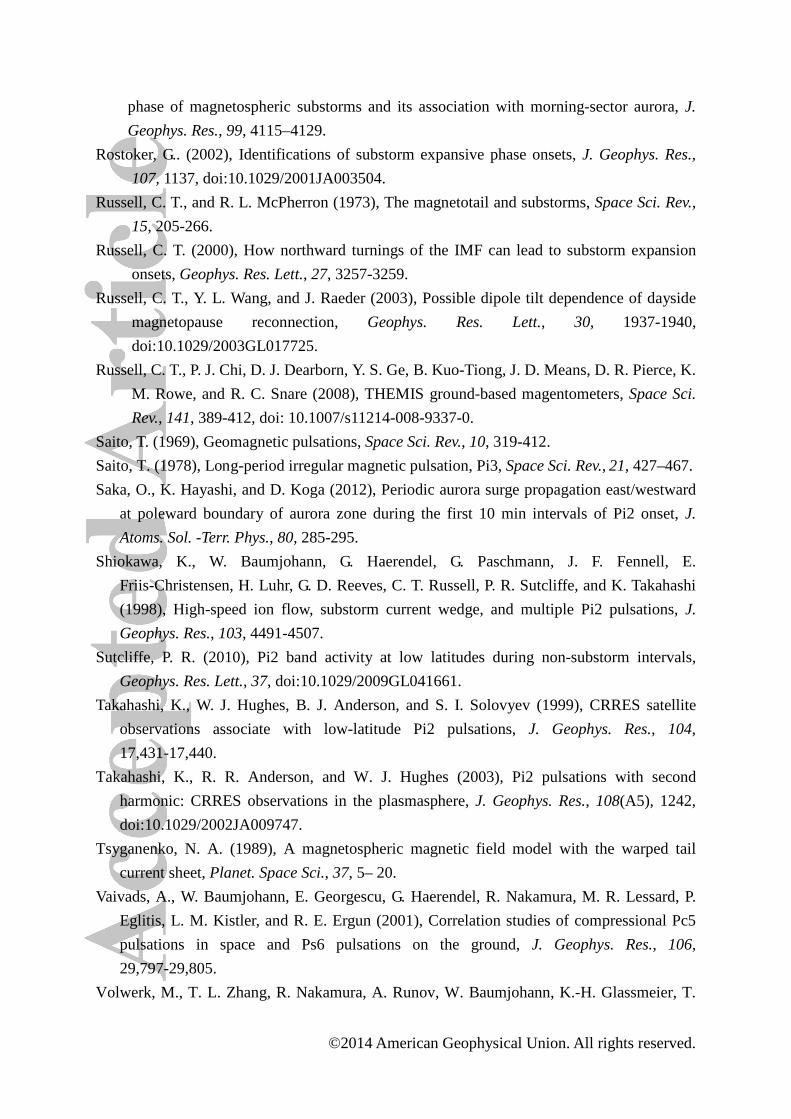
©2014 American Geophysical Union. All rights reserved.
phase of magnetospheric substorms and its association with morning-sector aurora, J. Geophys. Res., 99, 4115–4129.
Rostoker, G.. (2002), Identifications of substorm expansive phase onsets, J. Geophys. Res., 107, 1137, doi:10.1029/2001JA003504.
Russell, C. T., and R. L. McPherron (1973), The magnetotail and substorms, Space Sci. Rev., 15, 205-266.
Russell, C. T. (2000), How northward turnings of the IMF can lead to substorm expansion onsets, Geophys. Res. Lett., 27, 3257-3259.
Russell, C. T., Y. L. Wang, and J. Raeder (2003), Possible dipole tilt dependence of dayside magnetopause reconnection, Geophys. Res. Lett., 30, 1937-1940, doi:10.1029/2003GL017725.
Russell, C. T., P. J. Chi, D. J. Dearborn, Y. S. Ge, B. Kuo-Tiong, J. D. Means, D. R. Pierce, K. M. Rowe, and R. C. Snare (2008), THEMIS ground-based magentometers, Space Sci. Rev., 141, 389-412, doi: 10.1007/s11214-008-9337-0.
Saito, T. (1969), Geomagnetic pulsations, Space Sci. Rev., 10, 319-412. Saito, T. (1978), Long-period irregular magnetic pulsation, Pi3, Space Sci. Rev., 21, 427–467. Saka, O., K. Hayashi, and D. Koga (2012), Periodic aurora surge propagation east/westward
at poleward boundary of aurora zone during the first 10 min intervals of Pi2 onset, J. Atoms. Sol. -Terr. Phys., 80, 285-295.
Shiokawa, K., W. Baumjohann, G. Haerendel, G. Paschmann, J. F. Fennell, E. Friis-Christensen, H. Luhr, G. D. Reeves, C. T. Russell, P. R. Sutcliffe, and K. Takahashi (1998), High-speed ion flow, substorm current wedge, and multiple Pi2 pulsations, J. Geophys. Res., 103, 4491-4507.
Sutcliffe, P. R. (2010), Pi2 band activity at low latitudes during non-substorm intervals, Geophys. Res. Lett., 37, doi:10.1029/2009GL041661.
Takahashi, K., W. J. Hughes, B. J. Anderson, and S. I. Solovyev (1999), CRRES satellite observations associate with low-latitude Pi2 pulsations, J. Geophys. Res., 104, 17,431-17,440.
Takahashi, K., R. R. Anderson, and W. J. Hughes (2003), Pi2 pulsations with second harmonic: CRRES observations in the plasmasphere, J. Geophys. Res., 108(A5), 1242, doi:10.1029/2002JA009747.
Tsyganenko, N. A. (1989), A magnetospheric magnetic field model with the warped tail current sheet, Planet. Space Sci., 37, 5– 20.
Vaivads, A., W. Baumjohann, E. Georgescu, G. Haerendel, R. Nakamura, M. R. Lessard, P. Eglitis, L. M. Kistler, and R. E. Ergun (2001), Correlation studies of compressional Pc5 pulsations in space and Ps6 pulsations on the ground, J. Geophys. Res., 106, 29,797-29,805.
Volwerk, M., T. L. Zhang, R. Nakamura, A. Runov, W. Baumjohann, K.-H. Glassmeier, T.
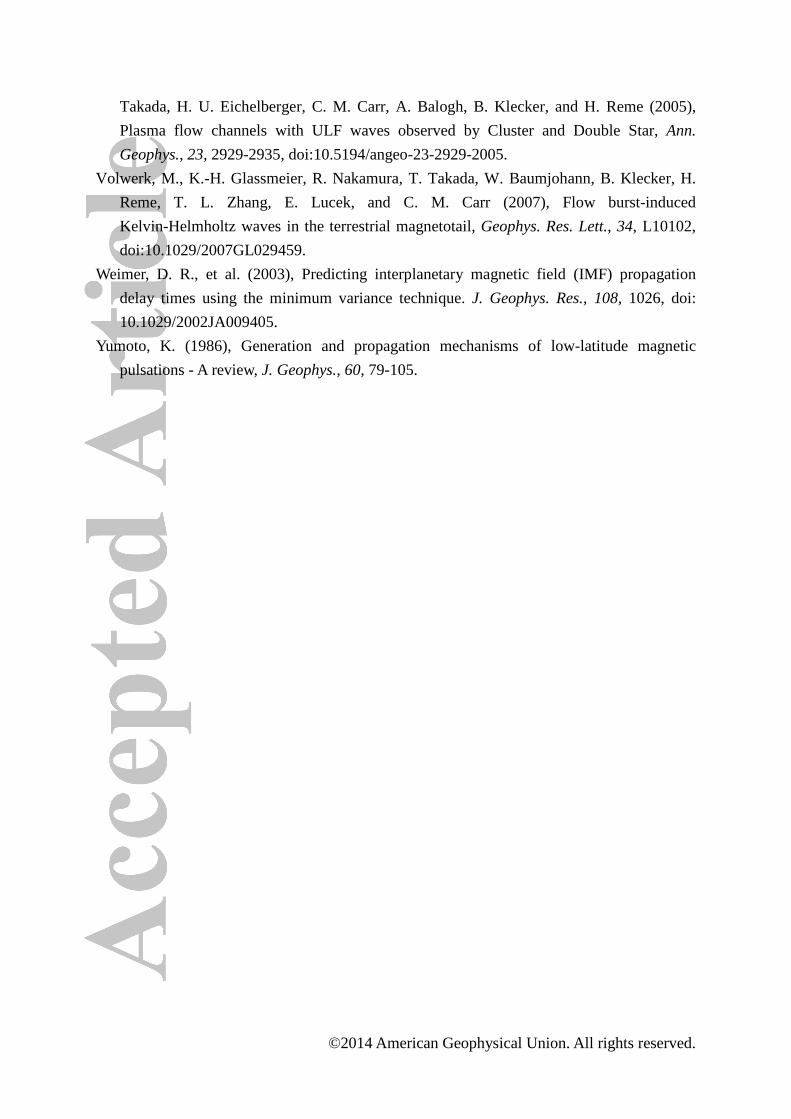
©2014 American Geophysical Union. All rights reserved.
Takada, H. U. Eichelberger, C. M. Carr, A. Balogh, B. Klecker, and H. Reme (2005), Plasma flow channels with ULF waves observed by Cluster and Double Star, Ann. Geophys., 23, 2929-2935, doi:10.5194/angeo-23-2929-2005
Volwerk, M., K.-H. Glassmeier, R. Nakamura, T. Takada, W. Baumjohann, B. Klecker, H. Reme, T. L. Zhang, E. Lucek, and C. M. Carr (2007), Flow burst-induced Kelvin-Helmholtz waves in the terrestrial magnetotail, Geophys. Res. Lett., 34, L10102, doi:10.1029/2007GL029459.
.
Weimer, D. R., et al. (2003), Predicting interplanetary magnetic field (IMF) propagation delay times using the minimum variance technique. J. Geophys. Res., 108, 1026, doi: 10.1029/2002JA009405.
Yumoto, K. (1986), Generation and propagation mechanisms of low-latitude magnetic pulsations - A review, J. Geophys., 60, 79-105.
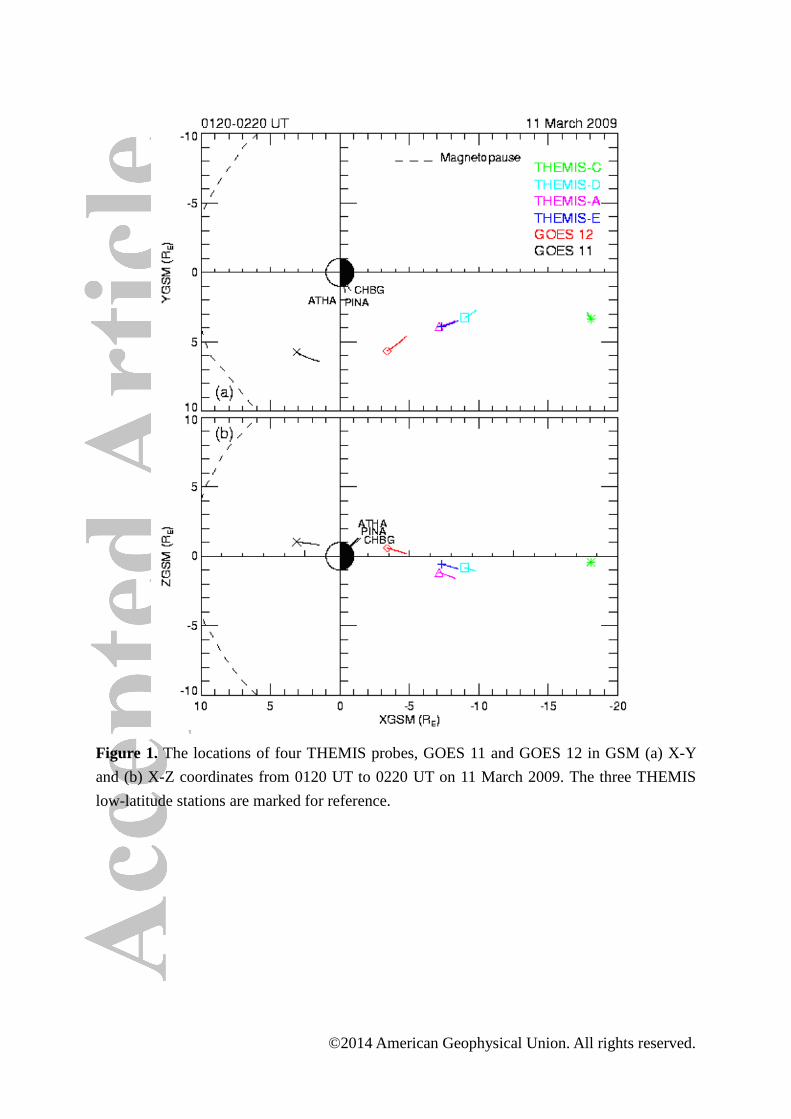
©2014 American Geophysical Union. All rights reserved.
Figure 1. The locations of four THEMIS probes, GOES 11 and GOES 12 in GSM (a) X-Y and (b) X-Z coordinates from 0120 UT to 0220 UT on 11 March 2009. The three THEMIS low-latitude stations are marked for reference.
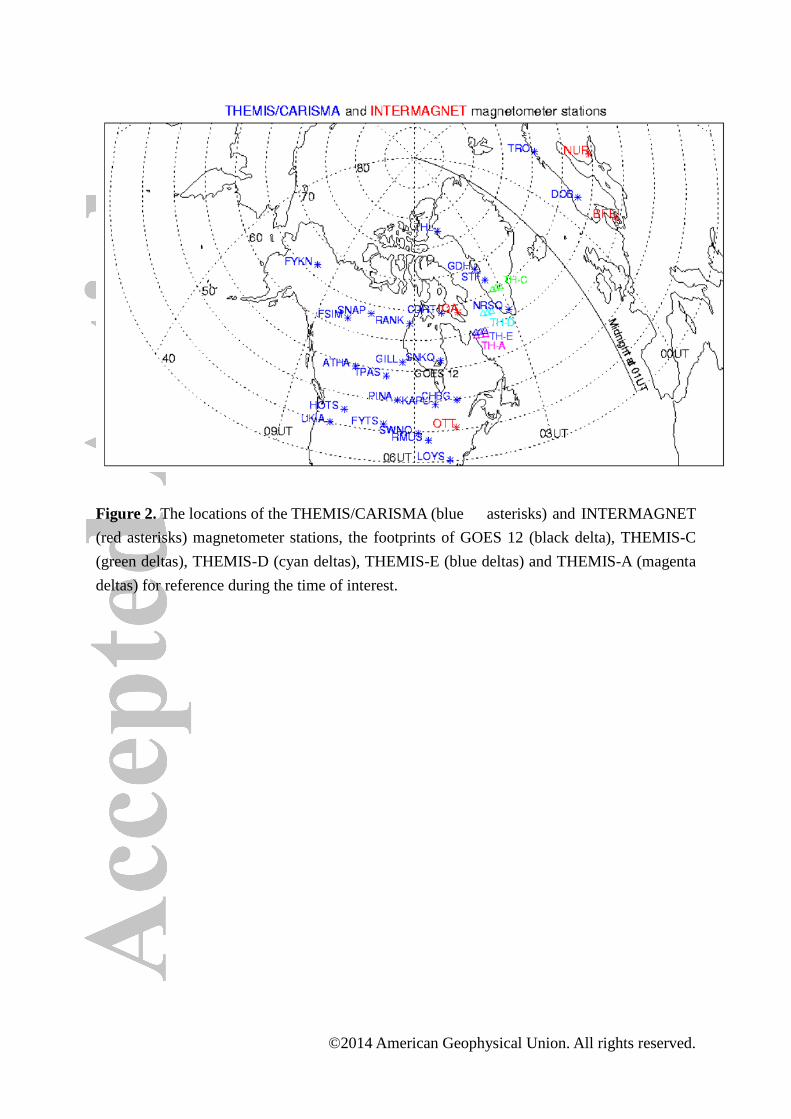
©2014 American Geophysical Union. All rights reserved.
Figure 2. The locations of the THEMIS/CARISMA (blue asterisks) and INTERMAGNET (red asterisks) magnetometer stations, the footprints of GOES 12 (black delta), THEMIS-C (green deltas), THEMIS-D (cyan deltas), THEMIS-E (blue deltas) and THEMIS-A (magenta deltas) for reference during the time of interest.
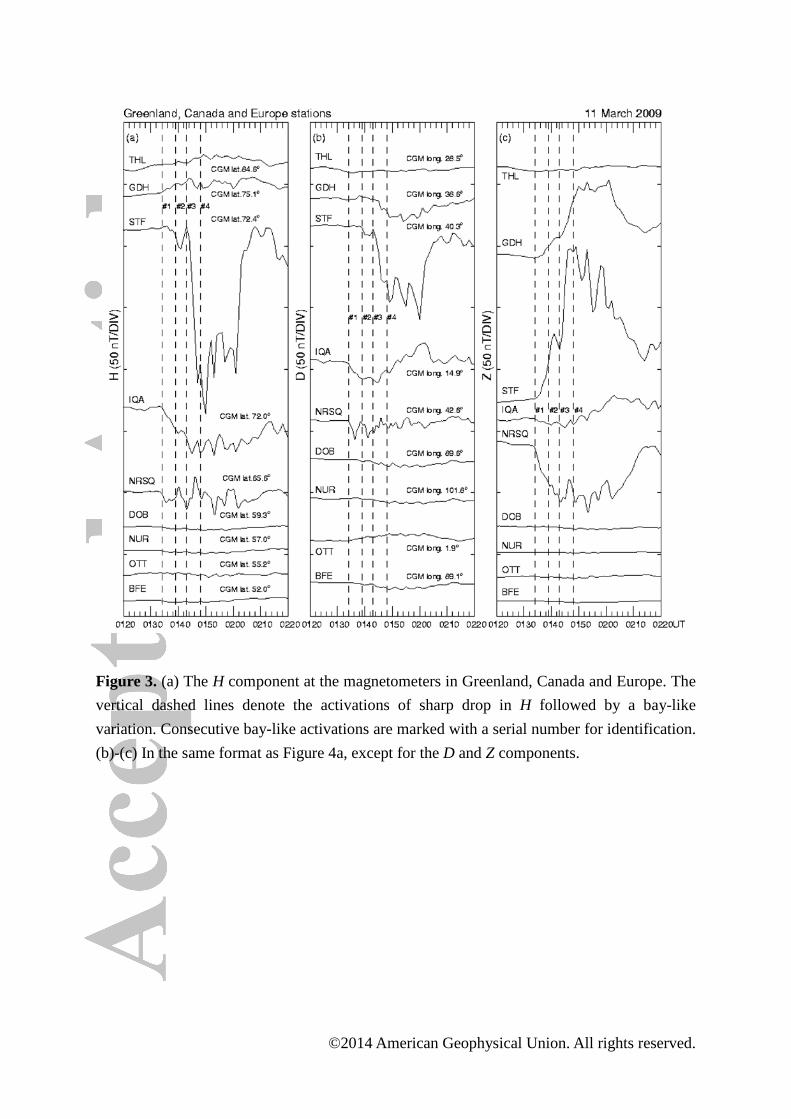
©2014 American Geophysical Union. All rights reserved.
Figure 3. (a) The H component at the magnetometers in Greenland, Canada and Europe. The vertical dashed lines denote the activations of sharp drop in H followed by a bay-like variation. Consecutive bay-like activations are marked with a serial number for identification. (b)-(c) In the same format as Figure 4a, except for the D and Z components.
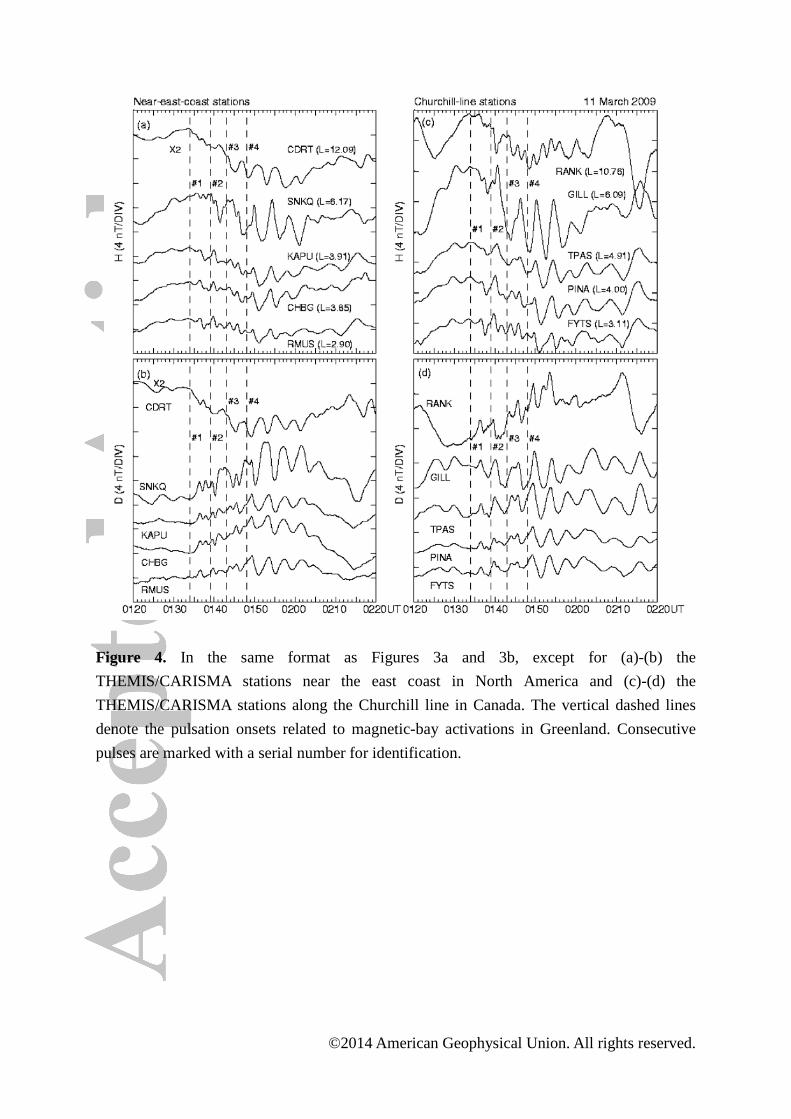
©2014 American Geophysical Union. All rights reserved.
Figure 4. In the same format as Figures 3a and 3b, except for (a)-(b) the THEMIS/CARISMA stations near the east coast in North America and (c)-(d) the THEMIS/CARISMA stations along the Churchill line in Canada. The vertical dashed lines denote the pulsation onsets related to magnetic-bay activations in Greenland. Consecutive pulses are marked with a serial number for identification.
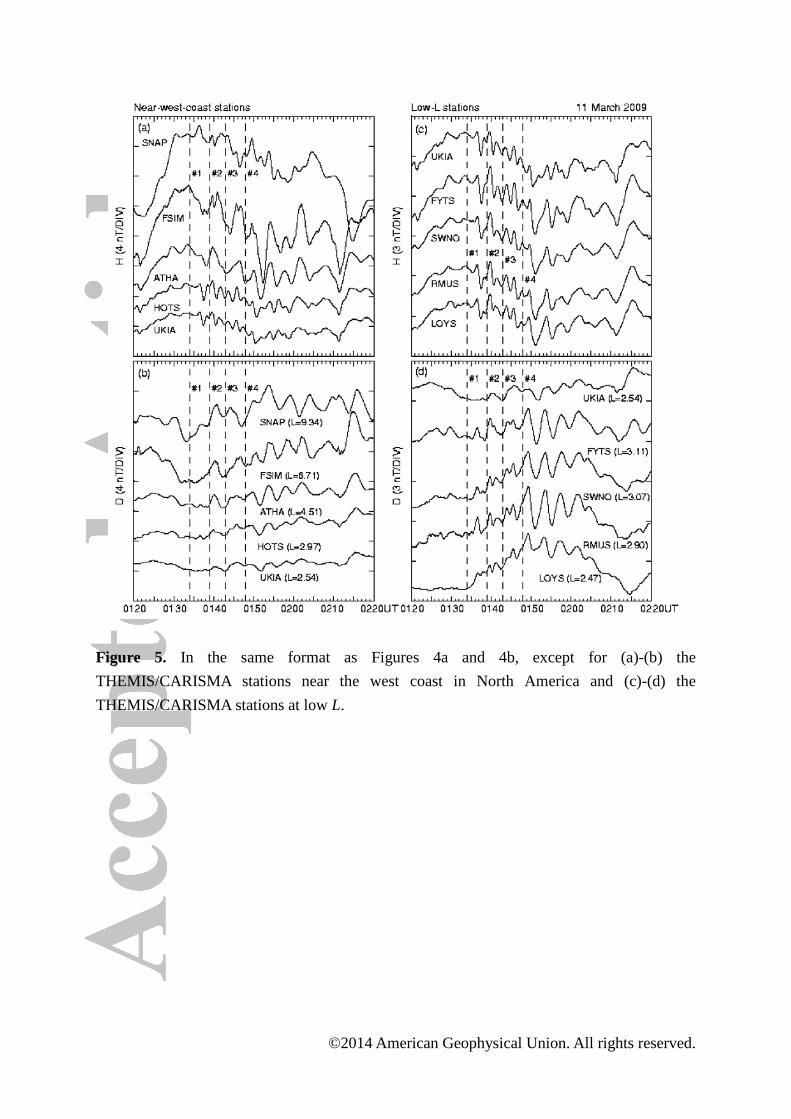
©2014 American Geophysical Union. All rights reserved.
Figure 5. In the same format as Figures 4a and 4b, except for (a)-(b) the THEMIS/CARISMA stations near the west coast in North America and (c)-(d) the THEMIS/CARISMA stations at low L.
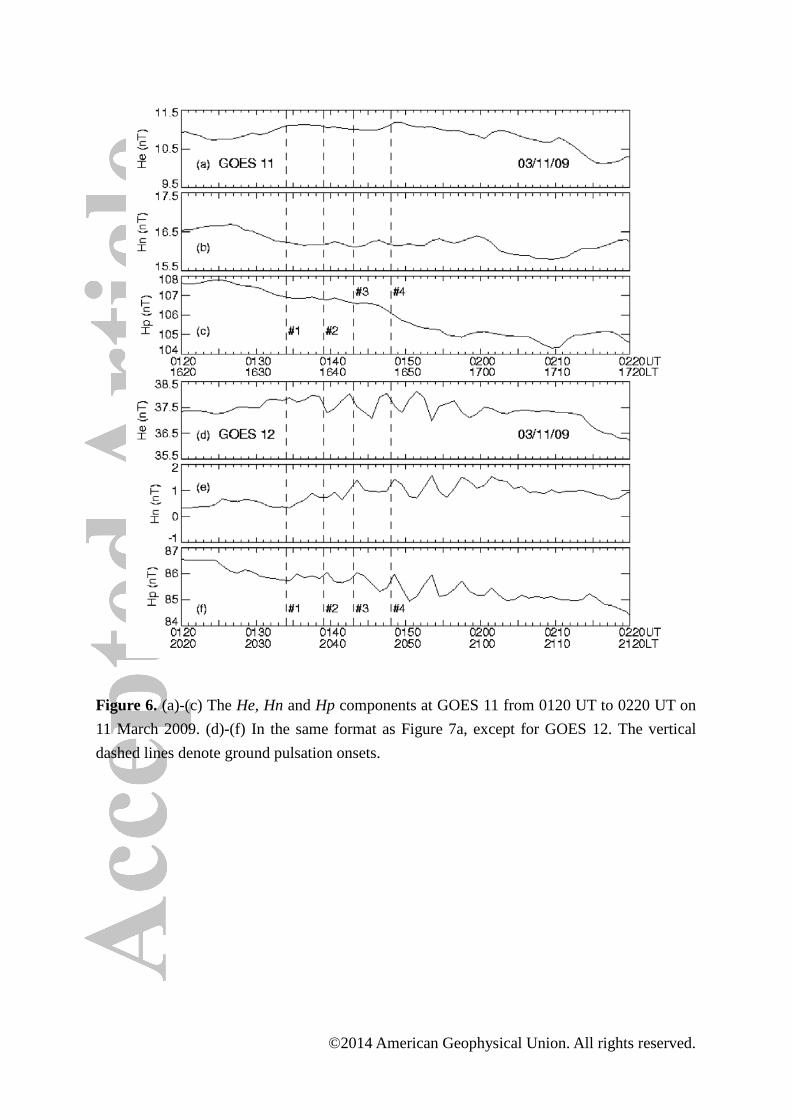
©2014 American Geophysical Union. All rights reserved.
Figure 6. (a)-(c) The He, Hn and Hp components at GOES 11 from 0120 UT to 0220 UT on 11 March 2009. (d)-(f) In the same format as Figure 7a, except for GOES 12. The vertical dashed lines denote ground pulsation onsets.
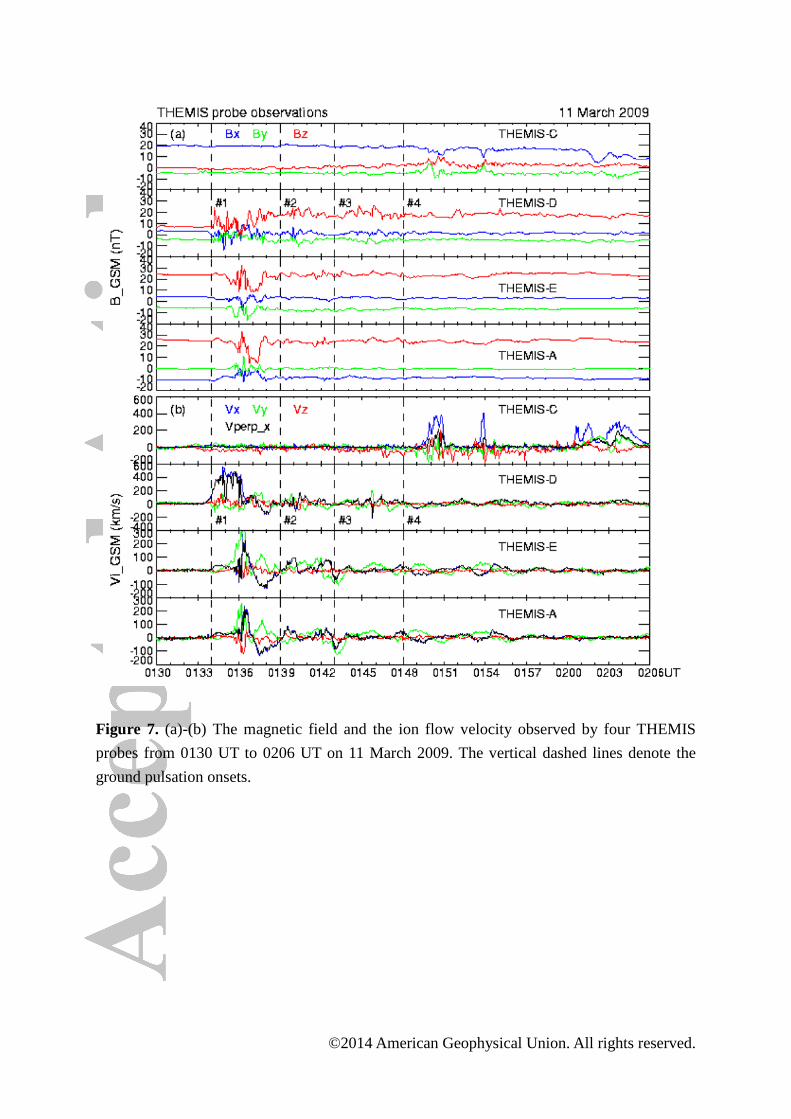
©2014 American Geophysical Union. All rights reserved.
Figure 7. (a)-(b) The magnetic field and the ion flow velocity observed by four THEMIS probes from 0130 UT to 0206 UT on 11 March 2009. The vertical dashed lines denote the ground pulsation onsets.
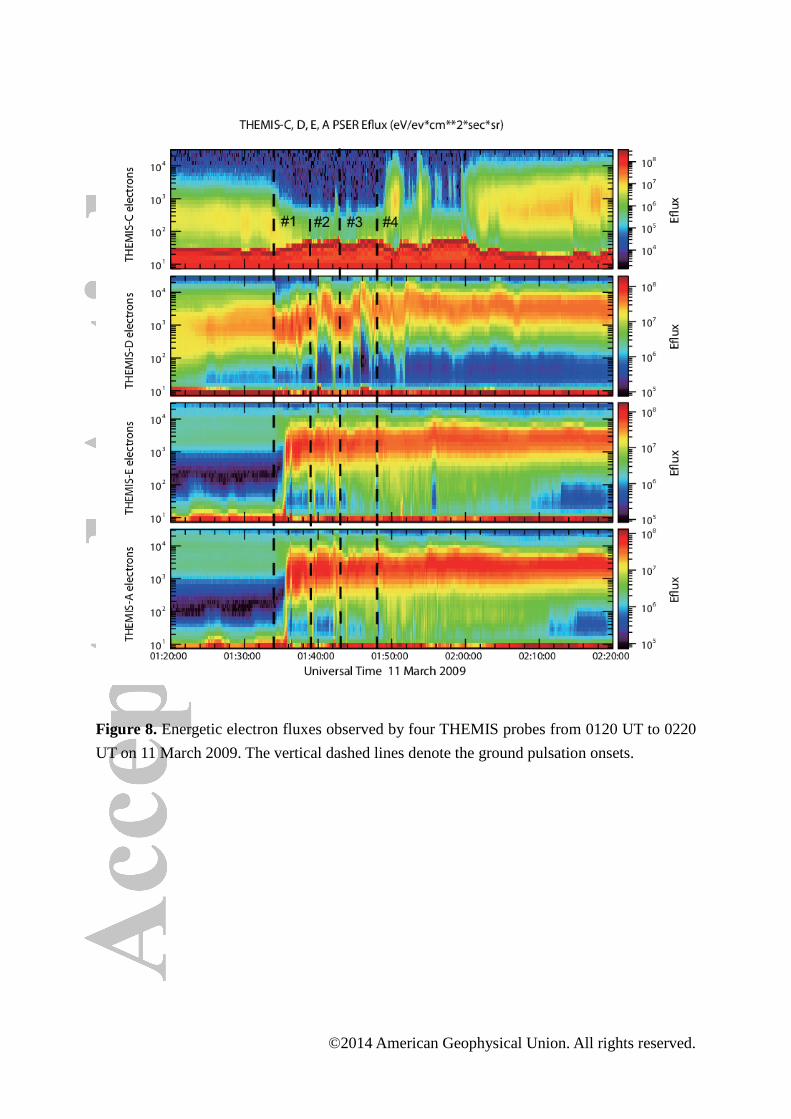
©2014 American Geophysical Union. All rights reserved.
Figure 8. Energetic electron fluxes observed by four THEMIS probes from 0120 UT to 0220 UT on 11 March 2009. The vertical dashed lines denote the ground pulsation onsets.
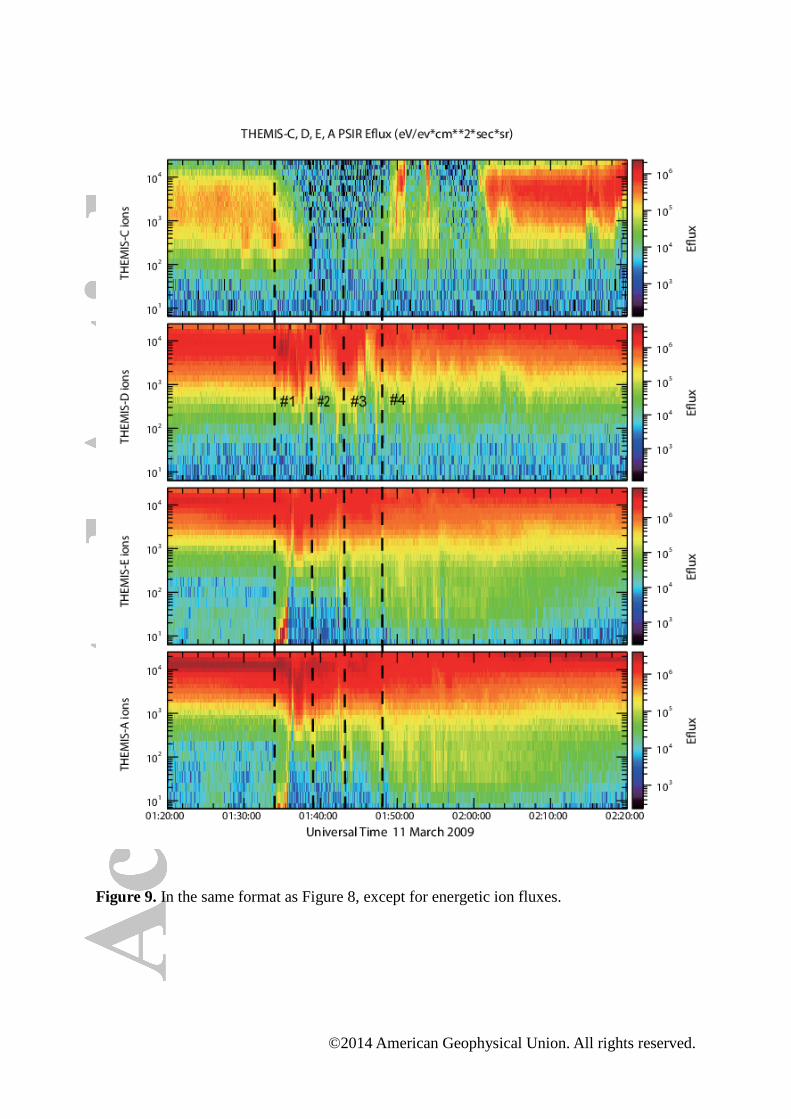
©2014 American Geophysical Union. All rights reserved.
Figure 9. In the same format as Figure 8, except for energetic ion fluxes.
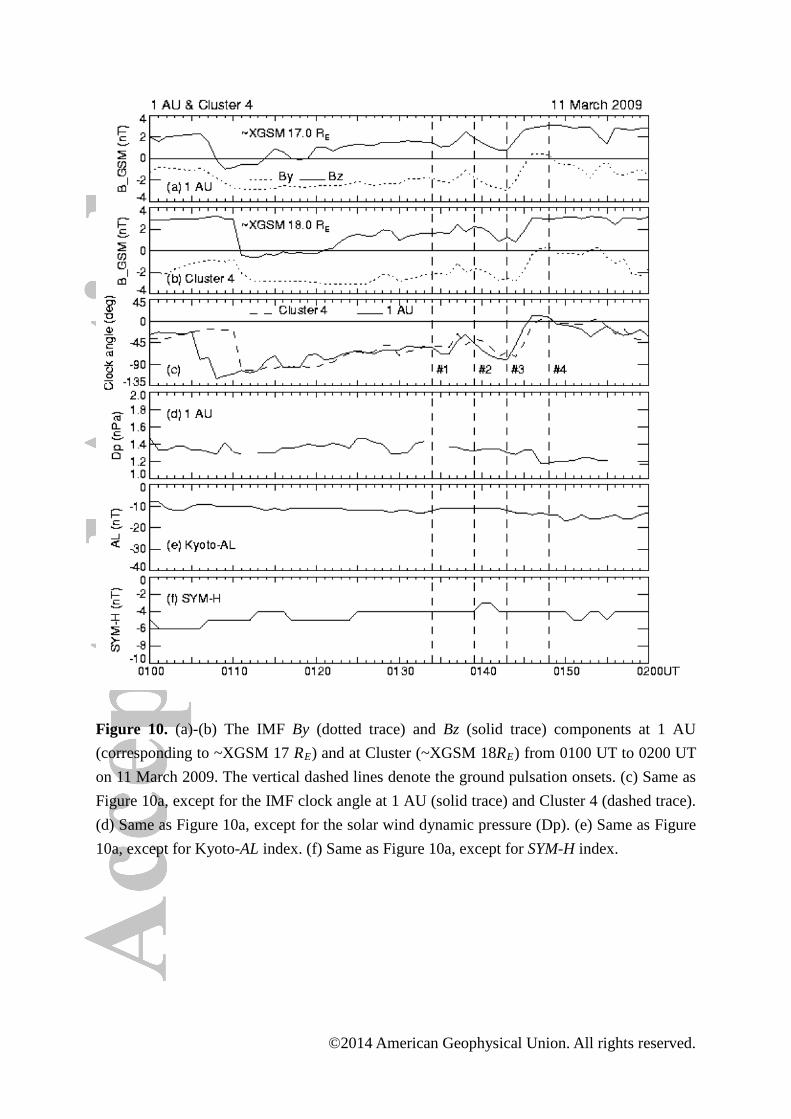
©2014 American Geophysical Union. All rights reserved.
Figure 10. (a)-(b) The IMF By (dotted trace) and Bz (solid trace) components at 1 AU (corresponding to ~XGSM 17 RE) and at Cluster (~XGSM 18RE) from 0100 UT to 0200 UT on 11 March 2009. The vertical dashed lines denote the ground pulsation onsets. (c) Same as Figure 10a, except for the IMF clock angle at 1 AU (solid trace) and Cluster 4 (dashed trace). (d) Same as Figure 10a, except for the solar wind dynamic pressure (Dp). (e) Same as Figure 10a, except for Kyoto-AL index. (f) Same as Figure 10a, except for SYM-H index.
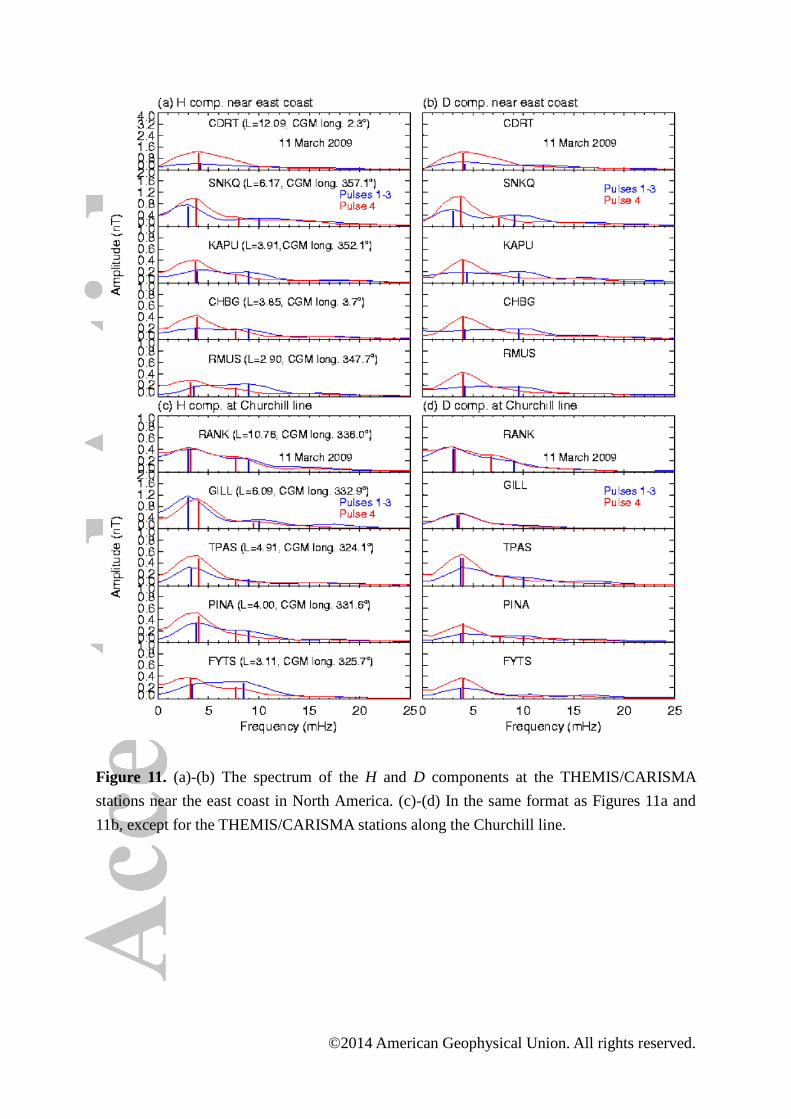
©2014 American Geophysical Union. All rights reserved.
Figure 11. (a)-(b) The spectrum of the H and D components at the THEMIS/CARISMA stations near the east coast in North America. (c)-(d) In the same format as Figures 11a and 11b, except for the THEMIS/CARISMA stations along the Churchill line.
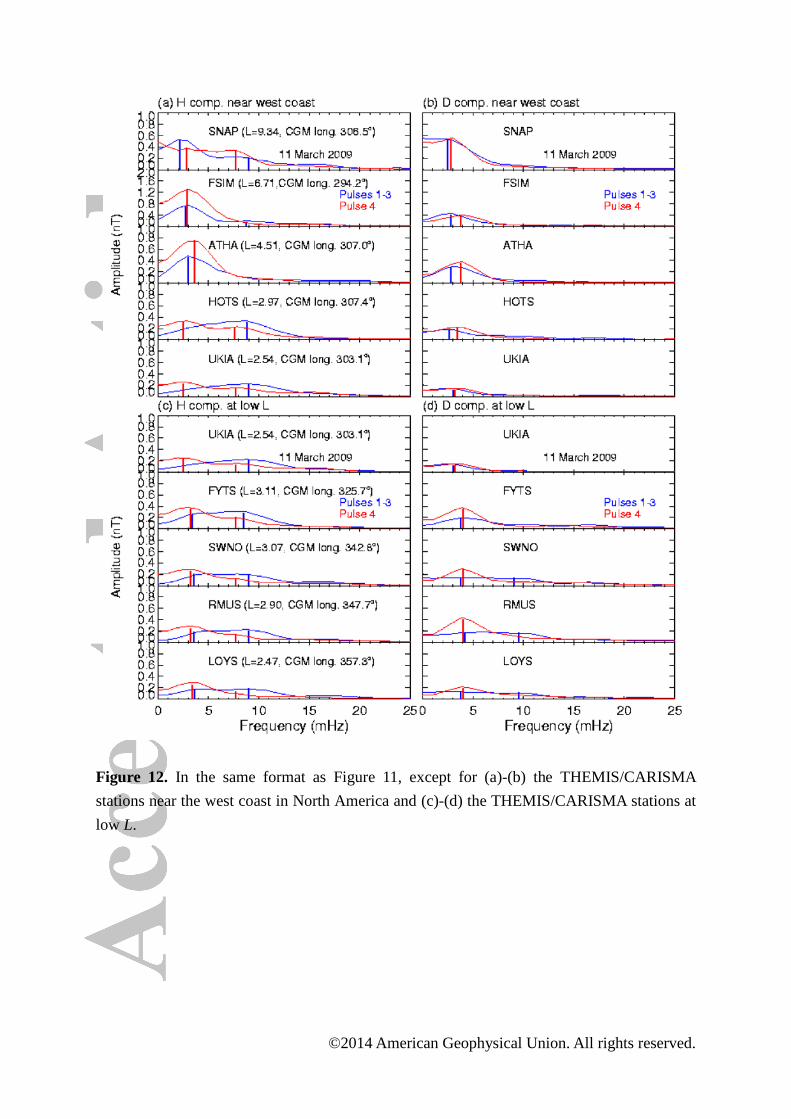
©2014 American Geophysical Union. All rights reserved.
Figure 12. In the same format as Figure 11, except for (a)-(b) the THEMIS/CARISMA stations near the west coast in North America and (c)-(d) the THEMIS/CARISMA stations at low L.
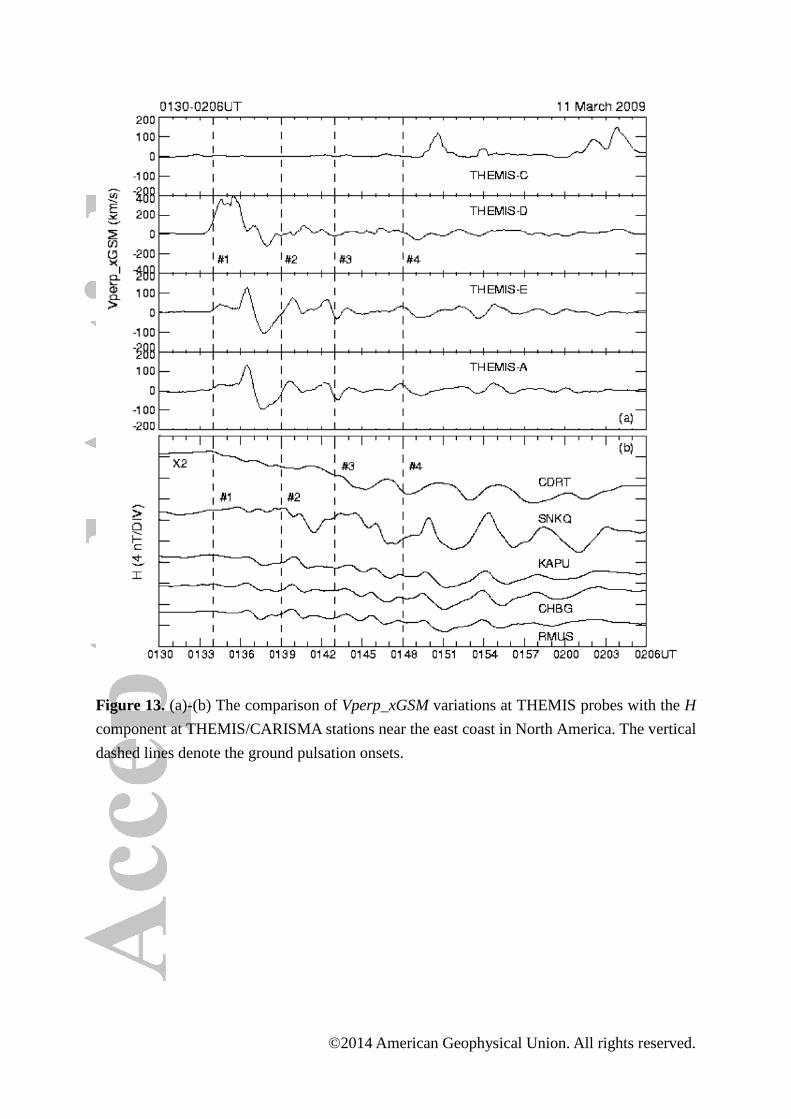
©2014 American Geophysical Union. All rights reserved.
Figure 13. (a)-(b) The comparison of Vperp_xGSM variations at THEMIS probes with the H component at THEMIS/CARISMA stations near the east coast in North America. The vertical dashed lines denote the ground pulsation onsets.
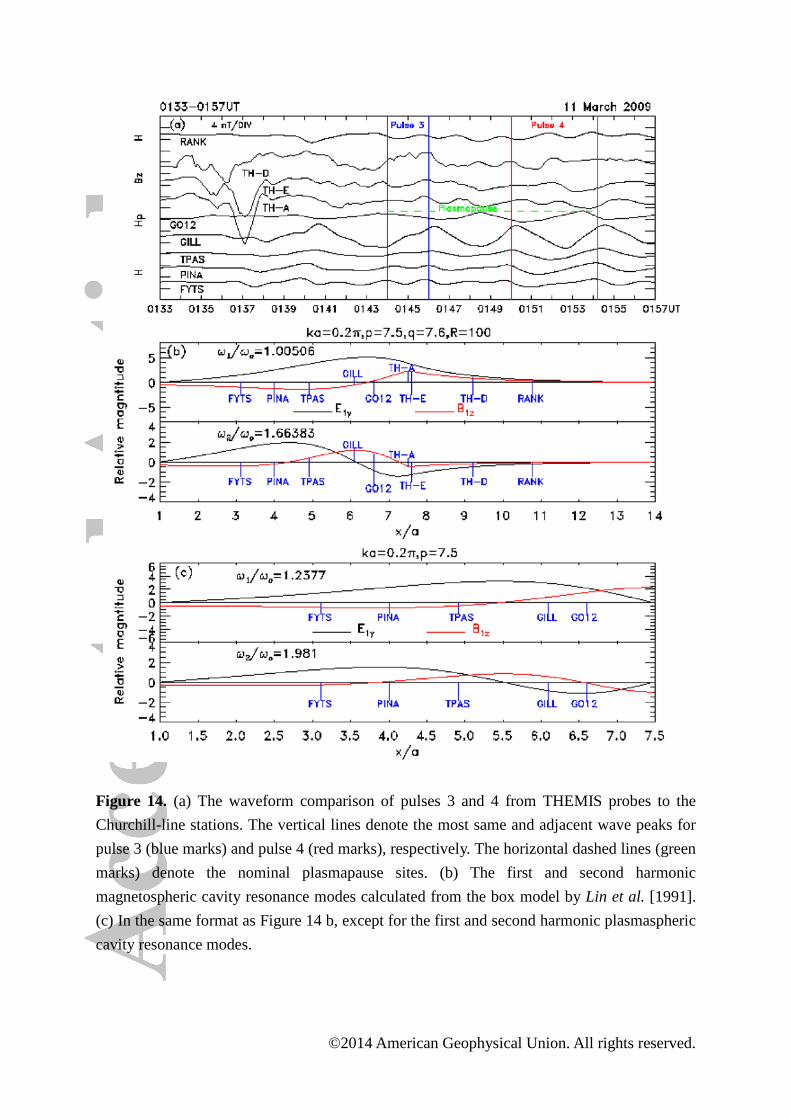
©2014 American Geophysical Union. All rights reserved.
Figure 14. (a) The waveform comparison of pulses 3 and 4 from THEMIS probes to the Churchill-line stations. The vertical lines denote the most same and adjacent wave peaks for pulse 3 (blue marks) and pulse 4 (red marks), respectively. The horizontal dashed lines (green marks) denote the nominal plasmapause sites. (b) The first and second harmonic magnetospheric cavity resonance modes calculated from the box model by Lin et al. [1991]. (c) In the same format as Figure 14 b, except for the first and second harmonic plasmaspheric cavity resonance modes.
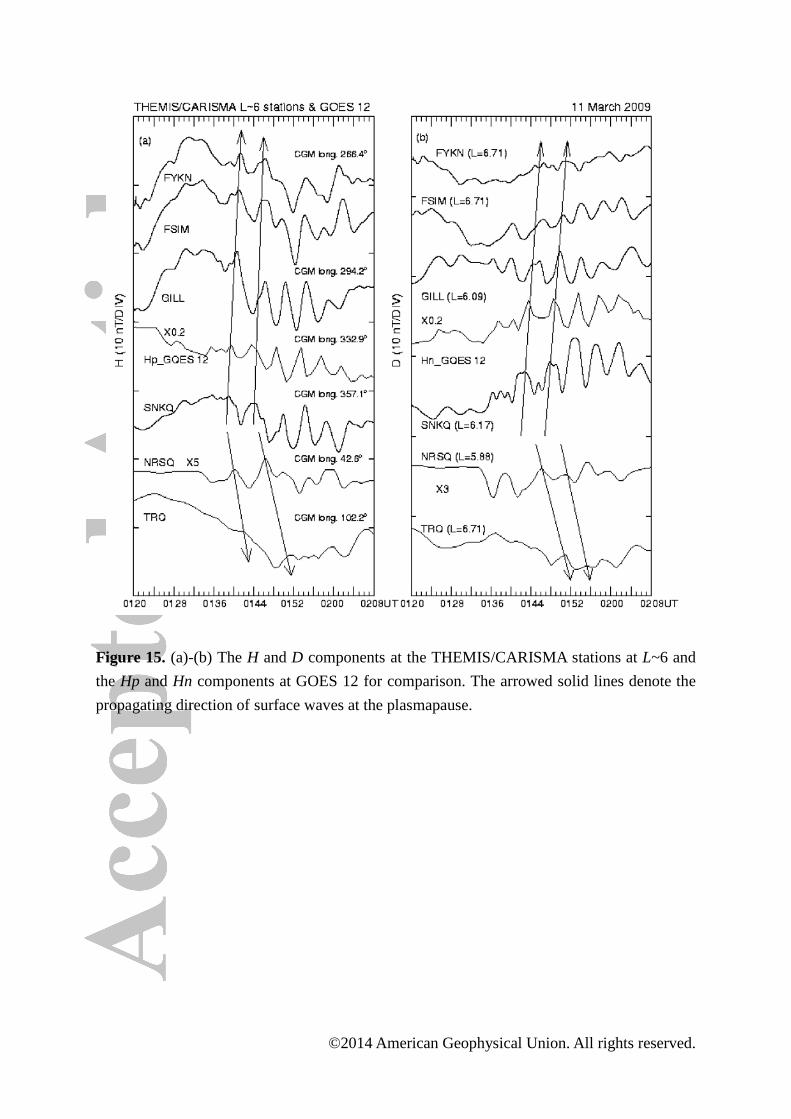
©2014 American Geophysical Union. All rights reserved.
Figure 15. (a)-(b) The H and D components at the THEMIS/CARISMA stations at L~6 and the Hp and Hn components at GOES 12 for comparison. The arrowed solid lines denote the propagating direction of surface waves at the plasmapause.
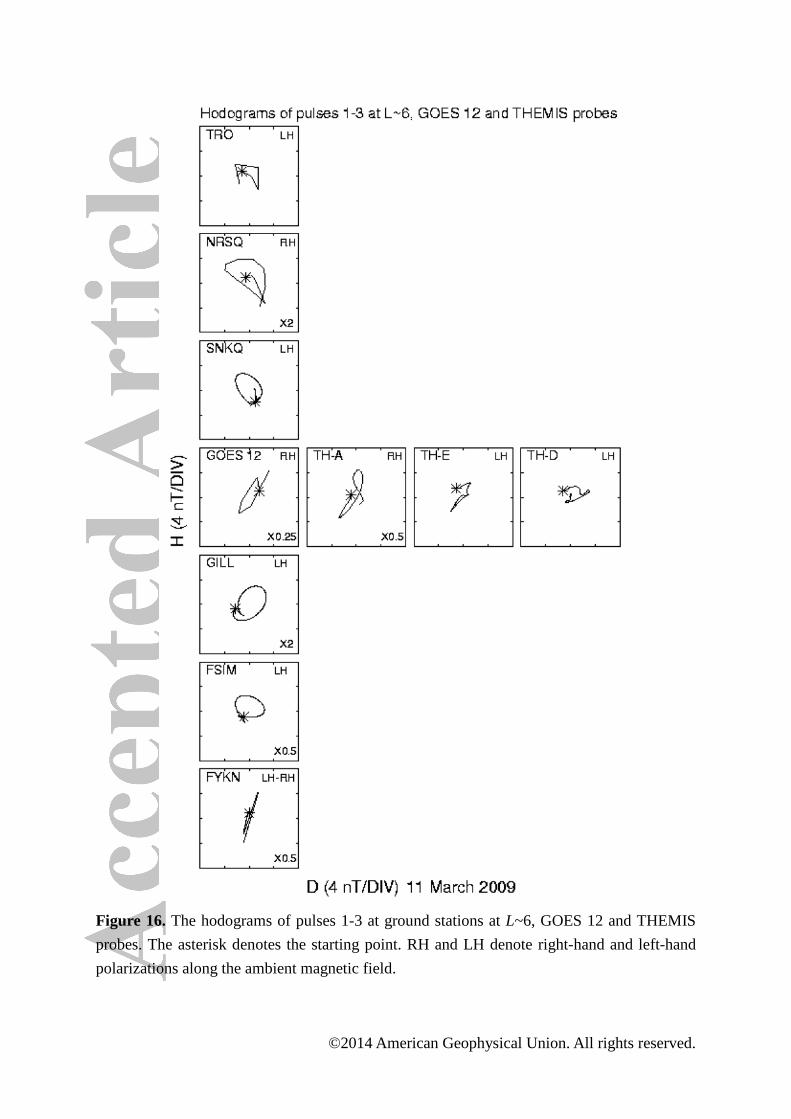
©2014 American Geophysical Union. All rights reserved.
Figure 16. The hodograms of pulses 1-3 at ground stations at L~6, GOES 12 and THEMIS probes. The asterisk denotes the starting point. RH and LH denote right-hand and left-hand polarizations along the ambient magnetic field.