Apparent environmental synergism drives the dynamics of Amazonian forest fragments
Upload
independentCategory
view
0download
0
Available online at www.sciencedirect.com
ng 27 (2009) 641–647
Magnetic Resonance ImagiAssociation between visual degeneration of intervertebral discs andthe apparent diffusion coefficient
Jaakko Niinimäkia,⁎, Arto Korkiakoskia,b, Outi Ojalab, Jaro Karppinenb,c,d, Jyrki Ruohonene,Marianne Haapeaa, Raija Korpelainenf,g, Antero Natrih, Osmo Tervonena
aDepartment of Diagnostic Radiology, Oulu University Hospital, 90029 Oulu, FinlandbPhysical Medicine and Rehabilitation, Oulu University Hospital, 90029 Oulu, Finland
cMusculoskeletal Centre, Finnish Institute of Occupational Health, 00250 Helsinki, FinlanddORTON Rehabilitation, ORTON Orthopedic Hospital, 00280 Helsinki, FinlandeDiagnostic Radiology, Seinäjoki Central Hospital, 60220 Seinäjoki, Finland
fDepartment of Sports Medicine, Oulu Deaconess Institute, 90100 Oulu, FinlandgDepartment of Medical Technology, University of Oulu, 90014 Oulu, Finland
hDepartment of Orthopaedics, Tampere University Hospital, 33521 Tampere, Finland
Received 19 August 2008; revised 13 October 2008; accepted 28 October 2008
Abstract
The value of apparent diffusion coefficient (ADC) measurements in intervertebral disc has been studied because ADC provides anestimate of free diffusion of unbound water and could be used as a quantitative tool to estimate degenerative changes. However, thechallenging nature of diffusion imaging of spine and limited numbers of subjects in earlier studies has produced contradictory findings. Weaimed to determine the relation between ADC and visual degenerative changes in lumbar intervertebral discs in a sufficiently largehomogeneous study group. Lumbar spines of 228 volunteer middle-aged men were MR imaged at 1.5 T including anatomic and diffusion-weighted imaging. ADC values, T2 signal intensity and height, and width of the three lowest lumbar intervertebral discs were measured anddisc degeneration visually graded. The calculated average ADC of 530 measured discs was 2.01×10⁻³ mm2/s±0.29 (±S.D.). The reduction inADC between visually normal and moderately degenerated discs was 4%. Severely degenerated discs showed 5% larger ADC values thannormal discs, presumably due to free water in cracks and fissures of those discs. T2 signal intensity of the disc was significantly correlatedwith the ADC values, whereas other measured parameters did not show correlation. There was no evident difference in ADC between thestudied anatomic lumbar levels. Because there is considerable overlap between ADC values of normal and degenerated discs, we concludethat ADC measurements of intervertebral discs, at least with current technology, have limited clinical value.© 2009 Elsevier Inc. All rights reserved.
Keywords: Diffusion weighted imaging; Intervertebral disc; Lumbar spine; Disc degeneration
1. Introduction
Diffusion-weighted (DW) magnetic resonance (MR)imaging is an established tool for early detection of ischemicbrain injury showing reduced diffusion of water presumablyassociated with cytotoxic edema [1]. DW imaging has alsobeen used as a method to discriminate between benign andmalignant vertebral body fractures [2]. DW MR imagingprovides indirect information about the microstructure ofthe examined tissue, namely, an estimate of diffusion of
⁎ Corresponding author. Tel.: +358 8 3152596; fax: +358 8 3152112.E-mail address: [email protected] (J. Niinimäki).
0730-725X/$ – see front matter © 2009 Elsevier Inc. All rights reserved.doi:10.1016/j.mri.2008.10.005
unbound water that is not available in conventional imagingand could therefore add valuable information to the imagingof the intervertebral disc. Although clinical MR imagingprovides detailed information about morphological changesin spine, it can seldom be used to distinguish incidental fromsymptomatic findings, or age-related degeneration fromdegenerative disc disease. If quantitative imaging methods,such as DW MR imaging, prove to be more sensitive todegenerative disc disease or more specific to symptomaticchanges than conventional imaging, they may come to playan important role in spine imaging [3,4].
Several researchers have recently published resultssuggesting association between disc degeneration and

642 J. Niinimäki et al. / Magnetic Resonance Imaging 27 (2009) 641–647
reduction in apparent diffusion coefficients (ADC). In astudy combining data from 39 patients and five volunteersat 1.5 T, a 9% reduction in ADC was observed [5], and inanother study of 30 volunteers at 3 T, a 19% reduction [6]was observed in degenerated discs compared to normalones. In addition, decreased ADC values have beenreported in discs adjacent to vertebral fractures 1 year orlater after trauma [7]. Efforts have also been made tocorrelate the change in ADC with biochemical alterationsin the intervertebral disc. In one study with human lumbarspecimens, decreases in glycosaminoglycan and watercontents in the nucleus pulposus correlated with a reductionin ADC [8]. However, also increased ADC values in thenucleus pulposus have been observed in experimentalanimal models in response to disc degradation induced bystab wound lesions [9] or by enzyme injections [10].Diffusion-weighted MR imaging of the disc is technicallychallenging and the previous results are inconsistent andare derived from limited numbers of study subjects. Forexample, ADC has been reported to be dependent onanatomic levels, showing the highest ADC values fornormal-appearing discs in one study [5] in cephalad discsand in other studies [11,12] in caudal discs. The role ofADC measurements in evaluating disc degeneration is thusstill unclear.
The purpose of this study was to determine the relation ofADC to degenerative changes in disc morphology and signalintensity in conventional MR imaging among a large andhomogenous group of adult volunteers.
2. Methods
2.1. Study population
The study population consisted of 228 male volunteerswith a mean age of 47 years (range, 36–56 years). They weretrain engineers and paper mill and chemical factory workers.The study was approved by the local hospital ethicscommittee and all participants gave written informed consentprior to enrollment and received no compensation.
2.2. Magnetic resonance imaging
Each participant underwent MR imaging on a clinical1.5-T unit (Signa Infinity Twinspeed, General ElectricMedical Systems, Milwaukee, WI, USA). A lumbar spineMRI examination was conducted with a Phased Array CTLSpine Coil (USA Instruments, Aurora, OH, USA).Examination included T2-weighted fast spin-echo sagittalimages with effective echo time and repetition times (TE/TR) of 116/3960 ms. A field of view (FOV) of 280 mm,matrix of 448×224 matrix and 4-mm sections with a 1-mmsection gap were used. Four averages were acquired andthe echo train length was 29. T2-weighted images wereused for visual grading of intervertebral disc degenerationand for measuring the signal intensity of the disc and itsheight and width.
A DW single-shot spin-echo echo-planar imagingsequence (DW-EPI) of the lumbar spine was performedwith a non-phased-array general-purpose flexible coil(GPFLEX, GE Medical Systems) in three orthogonaldirections with a b value of 500 s/mm2. Flexible coil canbe wrapped around the subject's back and it produces arelatively uniform signal throughout the region of interest(ROI). A TE/TR of 71/6000 ms, FOV of 250×125 mm,matrix of 256×128, one acquisition and scan time of 24 swere used for one mid-sagittal 10-mm-thick section. The b-scale was calibrated by measuring the known self-diffusioncoefficients of pure water and cyclohexane [13].
2.3. Image analysis
2.3.1. Visual degeneration gradingDegeneration of lumbar discs L3–L4, L4–L5 and L5–S1
was classified according to Pfirrmann's grading system [14]by a musculoskeletal radiologist and a fourth-year medicalstudent specifically trained for the task. The scans wereanalyzed in random order and in cases of disagreement aconsensus reading was performed. The Pfirrmann's degen-eration grading [14] takes disc signal, morphology andheight into account and is scaled as follows:
• Grade I — discs exhibiting homogenous signal that ishyperintense or isointense to cerebrospinal fluid(CSF); clear distinction between annulus and nucleus;normal height
• Grade II— discs exhibiting homogenous signal that ishyperintense or isointense to CSF with inhomogeneousstructure with or without horizontal bands and noblurriness between nucleus and annulus; normal height
• Grade III — discs with intermediate signal andinhomogeneous structure and blurriness betweennucleus and annulus; height may be slightly decreased
• Grade IV — discs with hypointense signal andinhomogeneous structure and distinction betweennucleus and annulus is lost; height may be moderatelydecreased
• Grade V — the same as Grade IV but with collapseddisc space.
2.3.2. Measurement of T2 signal intensity of the discsT2 signal intensities of the disc centers and CSF were
measured and the ratio between them (T2/CSF ratio) wascalculated. The plane with the brightest discs of the threemid-sagittal T2-weighted images was chosen and a ROI(50 mm2) was placed centrally in the high signal area of theL3–L4, L4–L5 and L5–S1 discs and in the free CSF behindthe L3 or L4 vertebral body (Fig. 1). The medical studentmeasured all the cases and the musculoskeletal radiologistmeasured 20 randomly selected cases for the interobserverreliability analysis.
2.3.3. Measurement of height and width of the discsHeight and width of the discs were measured from sagittal
T2-weighted images in random order by the musculoskeletal

Fig. 1. From left to right: T2-weighted fast spin-echo image, T2-weighted EPI image of the DW sequence (DW-EPI, b=0), and ADC map of the lumbar spine ofone study subject. Lines on the T2-weighted image indicate width (W) and height (H) measurements, and ROIs indicate measurements for T2/CSF ratio of L4–L5 disc. ROIs for ADCmeasurements were placed on lumbar discs and thereafter copied on the ADCmaps generated from the same sequence. In this individual,L3–L4 disc was classified in degeneration Group III, T2/CSF ratio was 0.22, W/H ratio was 3.76 and ADC was 0.22×10⁻³ mm2/s. Respective values for L4–L5disc were III, 0.20, 3.85 and 0.19×10⁻³ mm2/s and for L5–S1 disc III, 0.19, 3.39 and 0.20×10⁻³ mm2/s.
643J. Niinimäki et al. / Magnetic Resonance Imaging 27 (2009) 641–647
radiologist and a width-to-height ratio (W/H ratio) wascalculated (Fig. 1). The highest discs from the three mid-sagittal slices were chosen and if local endplate defects werepresent, the original contour of the endplate was estimated.The anterior–posterior width measurement included bothanterior and posterior longitudinal ligaments.
2.3.4. Measurement of disc ADCAn isotropic ADC map was calculated from three
directional DW images with FuncTool Performance software(GE Medical Systems). ADC measurements from lumbardiscs L3–L4, L4–L5 and L5–S1 were obtained by drawingan elliptical ROI on the ADC map and calculating the ADCfrom the measured signal intensity (I) attenuation accordingto the equation: ln[I(b1)/I(b0)]=−ADC×b. ROIs were placedcentrally in the high signal area of the disc in the DW-EPIimage (b=0 s/mm2) and then copied exactly to the sameposition on the ADC map (Fig. 1) by two research assistantstrained specifically for the task. If the disc could not beidentified by research assistants in the DW-EPI image due toadvanced degeneration, the measurement was not obtained.The size of the ROIs was initially set to 75 pixels (70 mm2);this was reduced if the ROI was too large to fit in the centerof the disc between endplates to avoid a partial volumeeffect. Both readers measured an equal number of cases, andfor inter-observer reliability analysis a set of 20 randomlyselected cases were mixed with both readers' cases.
2.4. Statistical methods
The parameters for sample size estimation [15] wereextracted from previous studies [5,7,11,12,16]. For0.10×10−3 mm2/s minimum expected difference betweennormal and degenerated discs with standard deviation of0.40×10−3 mm2/s and with 95% confidence interval, theneeded number of ADC measurements would be 245. Theinterobserver agreement of the visual degeneration gradingand T2 signal intensity and ADC measurements wasestimated by calculating the intra-class correlation coefficient(ICC, single measurements). Values in the range of 0–0.2indicate slight; 0.2–0.4, fair; 0.4–0.6, moderate; 0.6–0.8,substantial; and 0.8–1.0, almost perfect agreement [17].Pearson's correlation coefficient was used to correlate theADC, T2/CSF ratio and W/H ratio with each other. Analysisof variance (ANOVA) with post hoc Tukey's honestlysignificant difference (HSD) test was used to test thedifference of ADC values in different degeneration grades.P values less than .05 were considered statistically sig-nificant. Statistical analysis was performed using SPSS forWindows version 13.0.1 (SPSS, Inc, Chicago, IL, USA).
3. Results
The distribution of Pfirrmann's visual degenerationgrades between anatomic levels is shown in Table 1. In the

Table 1Prevalence of visual degeneration grades at different anatomic levels
Intervertebraldisc level
Visual degeneration grades
III IV V All
L3–L4 137 87 4 228L4–L5 69 138 21 228L5–S1 70 122 36 228All 276 347 61 684
Data are number of discs.
Fig. 2. Boxplot showing width/height (W/H) ratio and ratio of measuredaccording to lumbar levels.
644 J. Niinimäki et al. / Magnetic Resonance Imaging 27 (2009) 641–647
study population, Grade I discs were not observed and GradeII discs were in consensus reading reclassified as Grade IIIbecause the signal intensity of the discs was alwaysmeasured at less than 50% of CSF and therefore the criteriaof isointensity to CSF were not met. After the consensusreading, Grade III represents a combination of both normaland slightly degenerated discs, Grade IV moderatelydegenerated discs and Grade V severely degenerated discs.Degenerative changes were more pronounced at the lowerlumbar levels. At the L3–L4 level, 60% of the discs wereGrade III compared to 30% at the L5–S1 level. Fifty-ninepercent of the collapsed (Grade V) discs were at L5–S1. Thedistribution of T2/CSF ratio and W/H ratio according toanatomic levels and degeneration grades is shown in Fig. 2.Degeneration grades III and IV show statistically significantdifference (ANOVA, post hoc Tukey's HSD Pb.001) in T2/CSF ratio, whereas theW/H ratio differentiates grades IVandV (ANOVA, post hoc Tukey's HSD Pb.001). The age of thesubjects was negatively correlated with the T2/CSF ratio(Pearson correlation r=−0.21, Pb.01) and positively with theW/H ratio (Pearson correlation r=0.14, Pb.01).
In all, 530 ADC measurements of 684 discs wereobtained. The percentage of missing ADC measurementswas 12% at L3–L4, 23% at L4–L5 and 32% at L5–S1. Thenonmeasured discs had significantly lower T2/CSF ratios at
T2 sig
all levels (Pearson correlation r=−0.40, Pb.01). There wasno significant correlation between the age of the participantsand the measured ADC values.
The results of ADC measurements according to degen-eration grades and anatomic levels are shown in Table 2. Nosignificant association between ADC and anatomic levelswas observed except in Grade III degeneration, where themean ADC value at L4–L5 level was significantly higherthan at L3–L4 (Table 2). The measured ADC valuescompared to T2/CSF ratios of the discs across degenerationgrades are shown in Fig. 3. ADC values in Grade IV discdegeneration were significantly lower than in grades III andV, whereas the T2/CSF ratios of Grade IV were significantlylower than in Grade III but equal to Grade V. There was astatistically significant correlation between ADC and the T2/CSF ratio (Pearson correlation r=0.26, Pb.01), but notbetween ADC and the W/H ratio.
Interobserver agreement of visual degeneration gradingbetween the two readers was substantial (684 graded lumbarlevels; ICC single measures mean, 0.67; S.D., 0.05). Themean agreement of ADC measurements between the tworeaders was almost perfect (52 repeated ADC measurements;ICC single measures mean, 0.84; S.D., 0.07). For T2 signalintensity measurements of disc centers and CSF, the meanagreement between the two operators was almost perfect (80repeated signal intensity measurements; ICC single measuresmean, 0.86; S.D., 0.10).
4. Discussion
A significant difference in measured ADC valuesbetween visual lumbar disc degeneration grades wasobserved in the current study. In the study population, themean reduction of ADC between grades III and IV was 4%,whereas the mean ADC value in Grade V discs was 5%
nal intensity of disc to CSF (T2/CSF ratio) vs. visual degeneration grades

Table 2Mean ADC values according to Pfirrmann's visual degeneration grades at L3–L4 to L5–S1
Intervertebraldisc level
Visual degeneration grades All
III IV V
L3–L4 2.02±0.23 (128) ⁎ 1.91±0.27 (71) 1.94 (1) 1.98±0.25 (200L4–L5 2.13±0.26 (63) ⁎ 1.98±0.30 (107) 2.18±0.11 (5) 2.04±0.29 (175L5–S1 2.03±0.33 (64) 1.98±0.32 (81) 2.16±0.38 (10) 2.01±0.33 (155All 2.05±0.27 (255) 1.96±0.30 (259) 2.15±0.31 (16) 2.01±0.29 (530
Data are means (×10−3 mm2/s)±standard deviations, with number of measurements/all discs in parentheses.⁎ Significant difference between groups (ANOVA, post hoc Tukey's HSD Pb.05).
645J. Niinimäki et al. / Magnetic Resonance Imaging 27 (2009) 641–647
larger than in Grade III discs and 10% larger than in GradeIV discs.
Increased ADC values in severely degenerated discs(Grade V) have also been observed previously by otherresearchers [12,18] and have been explained by cracks andcavitations in the degenerated nucleus pulposus which arefilled with freely moving liquid. This explanation seemsplausible, since the discs with successful ADC measure-ments showed higher T2/CSF ratio than the nonmeasureddiscs, indicating overrepresentation of collapsed but high-signal discs among the ADC measurements. The divergentresults from severely degenerated discs in some previousreports [5,8] may be due to exclusion of collapsed discs,varying methodology of degeneration grading or differentstudy populations.
The Pfirrmann degeneration grading [14] applied in thecurrent study combines signal intensity, morphology andheight of the disc into a single estimate. Although it is basedon an earlier work in the literature, there is still a lack of
Fig. 3. Boxplot showing ADC values and ratio of measured T2 signal intensity of disc to CSF (T2/CSF ratio) in discs of different degeneration grades averagedover all three lumbar levels.
))))
correlation with histology or biochemistry. In the studied agegroup, the signal intensity of discs was always clearlyhypointense to CSF (Figs. 2 and 3) and, therefore, bothnormal and slightly degenerated discs were classified asGrade III. To study the possible correlations of separateparameters of visual grading with ADC, we measured andcalculated the T2/CSF and W/H ratios for the discs. Asignificant positive correlation between the ADC and T2/CSF ratios was found, but neither the W/H ratio nor theabsolute height (data not shown) of the disc correlated withthe measured ADC values. Despite the statistically sig-nificant correlation between the age of the study subjects andthe T2/CSF and W/H ratios of the discs, age was notsignificantly correlated with the ADC measurement results.
The mean ADC values of our study accord with previousfindings (Table 3). In three studies, however, the averageADC of normal discs was somewhat lower [11,12,16]. Thedifference may be explained by possible partial voluming inROI measurements due to use of the axial plane for diffusion
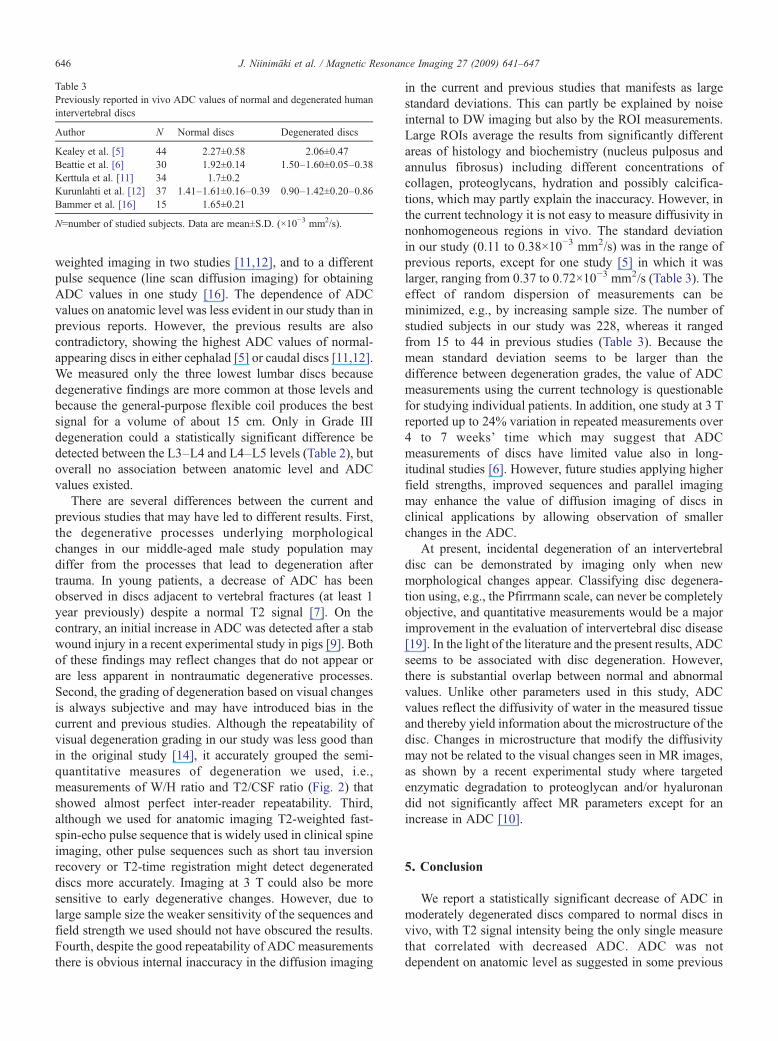
Table 3Previously reported in vivo ADC values of normal and degenerated humanintervertebral discs
Author N Normal discs Degenerated discs
Kealey et al. [5] 44 2.27±0.58 2.06±0.47Beattie et al. [6] 30 1.92±0.14 1.50–1.60±0.05–0.38Kerttula et al. [11] 34 1.7±0.2Kurunlahti et al. [12] 37 1.41–1.61±0.16–0.39 0.90–1.42±0.20–0.86Bammer et al. [16] 15 1.65±0.21
N=number of studied subjects. Data are mean±S.D. (×10−3 mm2/s).
646 J. Niinimäki et al. / Magnetic Resonance Imaging 27 (2009) 641–647
weighted imaging in two studies [11,12], and to a differentpulse sequence (line scan diffusion imaging) for obtainingADC values in one study [16]. The dependence of ADCvalues on anatomic level was less evident in our study than inprevious reports. However, the previous results are alsocontradictory, showing the highest ADC values of normal-appearing discs in either cephalad [5] or caudal discs [11,12].We measured only the three lowest lumbar discs becausedegenerative findings are more common at those levels andbecause the general-purpose flexible coil produces the bestsignal for a volume of about 15 cm. Only in Grade IIIdegeneration could a statistically significant difference bedetected between the L3–L4 and L4–L5 levels (Table 2), butoverall no association between anatomic level and ADCvalues existed.
There are several differences between the current andprevious studies that may have led to different results. First,the degenerative processes underlying morphologicalchanges in our middle-aged male study population maydiffer from the processes that lead to degeneration aftertrauma. In young patients, a decrease of ADC has beenobserved in discs adjacent to vertebral fractures (at least 1year previously) despite a normal T2 signal [7]. On thecontrary, an initial increase in ADC was detected after a stabwound injury in a recent experimental study in pigs [9]. Bothof these findings may reflect changes that do not appear orare less apparent in nontraumatic degenerative processes.Second, the grading of degeneration based on visual changesis always subjective and may have introduced bias in thecurrent and previous studies. Although the repeatability ofvisual degeneration grading in our study was less good thanin the original study [14], it accurately grouped the semi-quantitative measures of degeneration we used, i.e.,measurements of W/H ratio and T2/CSF ratio (Fig. 2) thatshowed almost perfect inter-reader repeatability. Third,although we used for anatomic imaging T2-weighted fast-spin-echo pulse sequence that is widely used in clinical spineimaging, other pulse sequences such as short tau inversionrecovery or T2-time registration might detect degenerateddiscs more accurately. Imaging at 3 T could also be moresensitive to early degenerative changes. However, due tolarge sample size the weaker sensitivity of the sequences andfield strength we used should not have obscured the results.Fourth, despite the good repeatability of ADC measurementsthere is obvious internal inaccuracy in the diffusion imaging
in the current and previous studies that manifests as largestandard deviations. This can partly be explained by noiseinternal to DW imaging but also by the ROI measurements.Large ROIs average the results from significantly differentareas of histology and biochemistry (nucleus pulposus andannulus fibrosus) including different concentrations ofcollagen, proteoglycans, hydration and possibly calcifica-tions, which may partly explain the inaccuracy. However, inthe current technology it is not easy to measure diffusivity innonhomogeneous regions in vivo. The standard deviationin our study (0.11 to 0.38×10⁻³ mm2/s) was in the range ofprevious reports, except for one study [5] in which it waslarger, ranging from 0.37 to 0.72×10⁻³ mm2/s (Table 3). Theeffect of random dispersion of measurements can beminimized, e.g., by increasing sample size. The number ofstudied subjects in our study was 228, whereas it rangedfrom 15 to 44 in previous studies (Table 3). Because themean standard deviation seems to be larger than thedifference between degeneration grades, the value of ADCmeasurements using the current technology is questionablefor studying individual patients. In addition, one study at 3 Treported up to 24% variation in repeated measurements over4 to 7 weeks' time which may suggest that ADCmeasurements of discs have limited value also in long-itudinal studies [6]. However, future studies applying higherfield strengths, improved sequences and parallel imagingmay enhance the value of diffusion imaging of discs inclinical applications by allowing observation of smallerchanges in the ADC.
At present, incidental degeneration of an intervertebraldisc can be demonstrated by imaging only when newmorphological changes appear. Classifying disc degenera-tion using, e.g., the Pfirrmann scale, can never be completelyobjective, and quantitative measurements would be a majorimprovement in the evaluation of intervertebral disc disease[19]. In the light of the literature and the present results, ADCseems to be associated with disc degeneration. However,there is substantial overlap between normal and abnormalvalues. Unlike other parameters used in this study, ADCvalues reflect the diffusivity of water in the measured tissueand thereby yield information about the microstructure of thedisc. Changes in microstructure that modify the diffusivitymay not be related to the visual changes seen in MR images,as shown by a recent experimental study where targetedenzymatic degradation to proteoglycan and/or hyaluronandid not significantly affect MR parameters except for anincrease in ADC [10].
5. Conclusion
We report a statistically significant decrease of ADC inmoderately degenerated discs compared to normal discs invivo, with T2 signal intensity being the only single measurethat correlated with decreased ADC. ADC was notdependent on anatomic level as suggested in some previous

647J. Niinimäki et al. / Magnetic Resonance Imaging 27 (2009) 641–647
studies. However, because there is considerable overlapbetween ADC values of normal and degenerated discs, ADCmeasurements of intervertebral discs are more suitable forepidemiological studies than for clinical use, at least with thecurrent MR technology.
References
[1] Beauchamp Jr NJ, Barker PB, Wang PY, vanZijl PC. Imaging of acutecerebral ischemia. Radiology 1999;212:307–24.
[2] Chan JH, Peh WC, Tsui EY, Chau LF, Cheung KK, Chan KB, et al.Acute vertebral body compression fractures: discrimination betweenbenign and malignant causes using apparent diffusion coefficients.Br J Radiol 2002;75:207–14.
[3] Haughton V. Medical imaging of intervertebral disc degeneration:current status of imaging. Spine 2004;29:2751–6.
[4] Majumdar S. Magnetic resonance imaging and spectroscopy of theintervertebral disc. NMR Biomed 2006;19:894–903.
[5] Kealey SM, Aho T, Delong D, Barboriak DP, Provenzale JM,Eastwood JD. Assessment of apparent diffusion coefficient in normaland degenerated intervertebral lumbar disks: initial experience.Radiology 2005;235:569–74.
[6] Beattie PF, Morgan PS, Peters D. Diffusion-weighted magneticresonance imaging of normal and degenerative lumbar intervertebraldiscs: a new method to potentially quantify the physiologic effect ofphysical therapy intervention. J Orthop Sports Phys Ther 2008;38:42–9.
[7] Kerttula L, Kurunlahti M, Jauhiainen J, Koivula A, Oikarinen J,Tervonen O. Apparent diffusion coefficients and T2 relaxation timemeasurements to evaluate disc degeneration. A quantitative MR studyof young patients with previous vertebral fracture. Acta Radiol 2001;42:585–91.
[8] Antoniou J, Demers CN, Beaudoin G, Goswami T, Mwale F, Aebi M,et al. Apparent diffusion coefficient of intervertebral discs related to
matrix composition and integrity. Magn Reson Imaging 2004;22:963–72.
[9] Niinimaki J, Ruohonen J, Silfverhuth M, Lappalainen A, Kaapa E,Tervonen O. Quantitative magnetic resonance imaging of experimen-tally injured porcine intervertebral disc. Acta Radiol 2007;48:643–9.
[10] Antoniou J, Mwale F, Demers CN, Beaudoin G, Goswami T, Aebi M,et al. Quantitative magnetic resonance imaging of enzymaticallyinduced degradation of the nucleus pulposus of intervertebral discs.Spine 2006;31:1547–54.
[11] Kerttula LI, Jauhiainen JP, Tervonen O, Suramo IJ, Koivula A,Oikarinen JT. Apparent diffusion coefficient in thoracolumbarintervertebral discs of healthy young volunteers. J Magn ResonImaging 2000;12:255–60.
[12] Kurunlahti M, Kerttula L, Jauhiainen J, Karppinen J, Tervonen O.Correlation of diffusion in lumbar intervertebral disks with occlusionof lumbar arteries: a study in adult volunteers. Radiology 2001;221:779–86.
[13] Tofts PS, Lloyd D, Clark CA, Barker GJ, Parker GJ, McConville P, etal. Test liquids for quantitative MRI measurements of self-diffusioncoefficient in vivo. Magn Reson Med 2000;43:368–74.
[14] Pfirrmann CW, Metzdorf A, Zanetti M, Hodler J, Boos N. Magneticresonance classification of lumbar intervertebral disc degeneration.Spine 2001;26:1873–8.
[15] Eng J. Sample size estimation: how many individuals should bestudied? Radiology 2003;227:309–13.
[16] Bammer R, Herneth AM, Maier SE, Butts K, Prokesch RW, Do HM,et al. Line scan diffusion imaging of the spine. Am J Neuroradiol2003;24:5–12.
[17] Landis JR, Koch GG. The measurement of observer agreement forcategorical data. Biometrics 1977;33:159–74.
[18] Chiu EJ, Newitt DC, Segal MR, Hu SS, Lotz JC, Majumdar S.Magnetic resonance imaging measurement of relaxation and waterdiffusion in the human lumbar intervertebral disc under compression invitro. Spine 2001;26:E437–44.
[19] Haughton V. Imaging intervertebral disc degeneration. J Bone JointSurg Am 2006;88(Suppl 2):15–20.
Copyright © 2022 FDOKUMEN