Rapid development of colitis in NSAID-treated IL10–deficient mice
Upload
independentCategory
view
2download
0
Accepted Manuscript
Association Between Serum Concentration of Infliximab and Efficacy in AdultPatients with Ulcerative Colitis
Omoniyi J. Adedokun, MS RPh William J. Sandborn, MD Brian G. Feagan, MDFRCPC Paul Rutgeerts, MD PhD FRCP Zhenhua Xu, PhD, FCP Colleen W.Marano, PhD Jewel Johanns, PhD Honghui Zhou, PhD, FCP Hugh M. Davis, PhDFreddy Cornillie, PhD Walter Reinisch, MD
PII: S0016-5085(14)01074-9DOI: 10.1053/j.gastro.2014.08.035Reference: YGAST 59318
To appear in: GastroenterologyAccepted Date: 26 August 2014
Please cite this article as: Adedokun OJ, Sandborn WJ, Feagan BG, Rutgeerts P, Xu Z, Marano CW,Johanns J, Zhou H, Davis HM, Cornillie F, Reinisch W, Association Between Serum Concentration ofInfliximab and Efficacy in Adult Patients with Ulcerative Colitis, Gastroenterology (2014), doi: 10.1053/j.gastro.2014.08.035.
This is a PDF file of an unedited manuscript that has been accepted for publication. As a service toour customers we are providing this early version of the manuscript. The manuscript will undergocopyediting, typesetting, and review of the resulting proof before it is published in its final form. Pleasenote that during the production process errors may be discovered which could affect the content, and alllegal disclaimers that apply to the journal pertain.
All studies published in Gastroenterology are embargoed until 3PM ET of the day they are published ascorrected proofs on-line. Studies cannot be publicized as accepted manuscripts or uncorrected proofs.

MANUSCRIP
T
ACCEPTED
ACCEPTED MANUSCRIPTGastroenterology resubmission #2
1
Short title: Infliximab concentration and clinical outcome in UC
Association Between Serum Concentration of Infliximab and Efficacy in Adult
Patients with Ulcerative Colitis
Omoniyi J Adedokun MS RPh 1, William J Sandborn MD2, Brian G Feagan MD
FRCPC3, Paul Rutgeerts MD PhD FRCP4, Zhenhua Xu PhD, FCP1, Colleen W Marano
PhD1, Jewel Johanns PhD1, Honghui Zhou PhD, FCP1, Hugh M Davis PhD1, Freddy
Cornillie PhD5, Walter Reinisch MD6
1Janssen Research & Development, LLC, Spring House, PA, USA; 2University of
California San Diego, La Jolla, California, USA; 3Robarts Clinical Trials, University of
Western Ontario, London, Ontario, Canada; 4University Hospital Leuven, Herestraat,
Belgium; 5Janssen Biologics BV, The Netherlands; 6Department of Internal Medicine III,
Medical University of Vienna, Vienna, Austria & McMaster University, Hamilton,
Ontario, Canada
Corresponding author and request for reprints: Omoniyi J. Adedokun; Janssen
Research & Development, LLC; 1400 McKean Road, Spring House, PA 19477; tel:
215.793.7220, fax: 215-986-1013, email: [email protected]
Grant support: The ACT-1 and ACT-2 trials were sponsored by Janssen Research &
Development, LLC (formerly Centocor Research & Development).

MANUSCRIP
T
ACCEPTED
ACCEPTED MANUSCRIPTGastroenterology resubmission #2
2
Disclosures: All authors must disclose any potential conflicts (financial, professional, or
personal) that are relevant to the manuscript. If the author(s) has nothing to disclose, this
must be stated.
OJ Adedokun is an employee of Janssen Research & Development, LLC.
WJ Sandborn has received consulting fees from Abbott, ActoGeniX NV, AGI
Therapeutics Inc, Alba Therapeutics Corp, Albireo, Alfa Wasserman, Amgen, AM-
Pharma BV, Anaphore, Astellas, Athersys Inc, Atlantic Healthcare Ltd, Aptalis,
BioBalance Corp, Boehringer-Ingelheim, Bristol-Myers Squibb, Celgene, Celek
Pharmaceuticals, Cellerix SL, Cerimon Pharmaceuticals, ChemoCentryx, CoMentis,
Cosmo Technologies, Coronado Biosciences, Cytokine Pharmasciences, Eagle
Pharmaceuticals, EnGene Inc, Eli Lilly, Enteromedics, Exagen Diagnostics Inc, Ferring
Pharmaceuticals, Flexio Therapeutics Inc, Funxional Therapeutics Ltd, Genzyme Corp,
Gilead Sciences, Given Imaging, GlaxoSmithKline, Human Genome Sciences, Ironwood
Pharmaceuticals, Janssen Pharmaceutical Research & Development, LLC; KaloBios
Pharmaceuticals, Lexicon Pharmaceuticals, Lycera Corp, Meda Pharmaceuticals, Merck
Research Laboratories, Merck/Serono, Millenium Pharmaceuticals, Nisshin Kyorin
Pharmaceuticals, Novo Nordisk, NPS Pharmaceuticals, Optimer Pharmaceuticals,
Orexigen Therapeutics Inc, PDL Biopharma, Pfizer, Procter and Gamble, Prometheus
Laboratories, ProtAb Ltd, Purgenesis Technologies Inc, Relypsa Inc, Roche, Salient
Pharmaceuticals, Salix Pharmaceuticals, Santarus, Schering Plough, Shire
Pharmaceuticals, Sigmoid Pharma Ltd, Sirtris Pharmaceuticals, SLA Pharma UK Ltd,
MANUSCRIP
T
ACCEPTED
ACCEPTED MANUSCRIPTGastroenterology resubmission #2
3
Targacept, Teva Pharmaceuticals, Therakos, Tilliotts Pharma AG, TxCell SA, UCB
Pharma, Viamet Pharmaceuticals, Vascular Biogenics Ltd, Warner Chilcott UK Ltd and
Wyeth; research grants from Abbott, Bristol-Myers Squibb, Genentech,
GlaxoSmithKline, Janssen Pharmaceutical Research & Development, LLC, Millennium
Pharmaceuticals, Novartis, Pfizer, Procter and Gamble, Shire Pharmaceuticals and UCB
Pharma; payments for lectures/speakers bureau from Abbott, Bristol-Myers Squibb and
Janssen Pharmaceutical Research & Development, LLC; and holds stock/stock options in
Enteromedics.
BG Feagan has received research/grant support from Abbott/AbbVie, Amgen, Astra
Zeneca, Bristol-Myers-Squibb, Janssen Biotech (Centocor), Johnson&Johnson/Janssen,
Millennium, Pfizer, Receptos, Roche/Genentech, Santarus, Sanofi, Tillotts, and UCB
Pharma; serves as a consultant to/speaker for Abbott/AbbVie, Actogenix, Albireo
Pharma, Amgen, Astra Zeneca, Avaxia Biologics Inc., Axcan, Baxter Healthcare Corp.,
Boehringer-Ingelheim, Bristol-Myers-Squibb, Calypso Biotech, Celgene, Elan/Biogen,
EnGene, Ferring Pharma, GiCare Pharma, Gilead, Given Imaging Inc., GlaxoSmithKline,
Ironwood Pharma, Janssen Biotech (Centocor), Johnson&Johnson/Janssen, Kyowa
Kakko Kirin Co Ltd., Lexicon, Lilly, Merck/Schering-Plough, Millennium, Nektar,
Novonordisk, Prometheus Therapeutics and Diagnostics, Pfizer, Receptos,
Roche/Genentech, Salix Pharma, Serono, Shire, Sigmoid Pharma, Synergy Pharma Inc.,
Takeda, Teva Pharma, Tillotts Pharma AG, UCB Pharma, Vertex Pharma, Warner-
Chilcott, Wyeth, Zealand, and Zyngenia; and is a Steering Committee member for
Abbott/AbbVie, Amgen, Astra Zeneca, Avaxia Biologics Inc., Bristol-Myers-Squibb,

MANUSCRIP
T
ACCEPTED
ACCEPTED MANUSCRIPTGastroenterology resubmission #2
4
Celgene, Elan/Biogen, Ferring, Janssen Biotech (Centocor), Johnson&Johnson/Janssen,
Merck/Schering-Plough, Novartis, Novonordisk, Pfizer, Prometheus Laboratories, Salix
Pharma, Takeda, Teva, Tillotts Pharma AG, and UCB Pharma.
P Rutgeerts has received research support from Abbott, Janssen, Merck/Schering Plough,
and UCB; consulting fees from Abbott, Bristol-Meyers-Squibb, Falk Pharma,
Genentech/Hoffman LaRoche, Janssen, Merck/Serono, Merck/Schering-Plough,
Millenium/Takeda, Neovacs, Pfizer, Robarts, Tillots, and UCB; and has served as a
speaker for Abbott, Janssen, and Merck/Schering-Plough.
Z Xu is an employee of Janssen Research & Development, LLC.
CW Marano is an employee of Janssen Research & Development, LLC.
J Johanns is an employee of Janssen Research & Development, LLC.
H Zhou is an employee of Janssen Research & Development, LLC.
HM Davis is an employee of Janssen Research & Development, LLC.
F Cornillie is an employee of Janssen Biologics BV.
W Reinisch has served as a speaker, a consultant and/or an advisory board member for
Abbott Laboratories, Abbvie, Aesca, Amgen, AM Pharma, Aptalis, Astellas, Astra
Zeneca, Biogen IDEC, Bristol-Myers Squibb, Cellerix, Chemocentryx, Celgene,
Centocor, Danone Austria, Elan, Falk Pharma GmbH, Ferring, Galapagos, Genentech,
Grünenthal, Janssen, Johnson & Johnson, Kyowa Hakko Kirin Pharma, Lipid
MANUSCRIP
T
ACCEPTED
ACCEPTED MANUSCRIPTGastroenterology resubmission #2
5
Therapeutics, Millenium, Mitsubishi Tanabe Pharma Corporation, MSD, Novartis, Ocera,
Otsuka, PDL, Pharmacosmos, Pfizer, Procter & Gamble, Prometheus, Robarts Clinical
Trial, Schering-Plough, Setpointmedical, Shire, Takeda, Therakos, Tigenix, UCB, Vifor,
Yakult, Zyngenia, and 4SC.
Writing assistance: Michelle Perate, MS and Mary Whitman, PhD (Janssen Scientific
Affairs, LLC) provided editorial and submission support.
Author contributions: All authors were involved in designing/conducting the clinical
study, contributing data for/interpreting data analyses, drafting/critically reviewing the
manuscript, and approving the final manuscript for submission.
Word count: 5,831/6,000
MANUSCRIP
T
ACCEPTED
ACCEPTED MANUSCRIPTGastroenterology resubmission #2
6
Abbreviations:
ACT-1/ACT-2 Active Ulcerative Colitis Trials
ATI antibodies to infliximab
AUC area under curve
CPW2/6/14/30/54 preinfusion concentration at week 2/6/14/30/54
CRP C-reactive protein
CW8 concentration at week 8
EIA enzyme immunoassay
IBD inflammatory bowel disease
LR+ positive likelihood ratio
NPV negative predictive value
PK pharmacokinetic
PPV positive predictive value
ROC receiver operator characteristics
SIC serum infliximab concentration
TNF tumor necrosis factor-α
UC ulcerative colitis
wk week

MANUSCRIP
T
ACCEPTED
ACCEPTED MANUSCRIPTGastroenterology resubmission #2
7
ABSTRACT
Background & Aims: We analyzed data collected during the Active Ulcerative Colitis
Trials (ACT-1 and ACT-2) to assess relationships between serum concentrations of
infliximab and outcomes of adults with moderate-to-severe ulcerative colitis.
Methods: We compared serum concentrations of infliximab with outcomes of 728
patients with moderately-to-severely active ulcerative colitis who participated in ACT 1
or ACT-2; efficacy data were collected at weeks 8, 30, and 54 (for ACT-1 only).
Relationships between serum concentration of infliximab and efficacy outcomes were
assessed using trend, logistic regression, and receiver operating characteristic curve
analyses. We also evaluated factors that affect the relationship between exposure and
response.
Results: Median serum concentrations of infliximab at weeks 8, 30, and/or 54 were
significantly higher in patients with clinical response, mucosal healing, and/or clinical
remission than in patients who did not meet these response criteria. There were
statistically significant relationships between quartile of infliximab serum concentration
and efficacy at these time points (P<.01). Infliximab therapy was effective for a smaller
proportion of patients in the lowest quartile, and these patients had lower serum levels of
albumin and a higher incidence of antibodies to infliximab than patients in other
quartiles. Although the relationship between exposure to infliximab and response varied
among patients, approximate serum concentrations of 41 µg/mL infliximab at week 8 of

MANUSCRIP
T
ACCEPTED
ACCEPTED MANUSCRIPTGastroenterology resubmission #2
8
induction therapy and 3.7 µg/mL at steady state during maintenance therapy produced
optimal outcomes in patients.
Conclusions: Serum concentrations of infliximab associate with efficacy in patients with
moderately to severe ulcerative colitis. However, complex factors determine the
relationship between exposure to this drug and response. A prospective evaluation of the
value of measuring serum concentrations of infliximab should be performed before these
data can be included in patient management strategies. Clinicaltrials.gov number,
NCT00036439 and NCT00096655
Key words: anti-tumor necrosis factor; monoclonal antibody; pharmacokinetics;
inflammatory bowel disease

MANUSCRIP
T
ACCEPTED
ACCEPTED MANUSCRIPTGastroenterology resubmission #2
9
INTRODUCTION
Infliximab is a recombinant chimeric immunoglobulin G-1κ monoclonal antibody that
neutralizes the biologic activity of tumor necrosis factor-α (TNF). Infliximab is approved
for treatment of patients with moderate-to-severe ulcerative colitis (UC) based on the
results of the Active Ulcerative Colitis Trials (ACT-1 and ACT-2) that evaluated 728
patients with moderate-to-severe disease. In these studies, patients treated with infliximab
at weeks 0, 2, 6, and every 8 weeks thereafter were more likely to demonstrate clinical
response, clinical remission, and mucosal healing at weeks 8, 30, and 54 than patients
assigned to placebo.1,2
Previous pharmacokinetic (PK) evaluations of infliximab use in UC have demonstrated a
linear relationship between dose and serum infliximab concentration3 and that the
systemic disposition of infliximab is influenced by body weight, serum albumin, and the
formation of antibodies to infliximab (ATI).4 In addition, serum infliximab
concentrations have been found to influence the response to treatment in Crohn’s
disease,5,6 rheumatoid arthritis,7 and psoriasis.8
Therapeutic drug monitoring can potentially improve outcomes in patients receiving
TNF-antagonists, particularly in those who have lost response to these agents due to
inadequate serum drug concentrations.9 As such, knowledge of the target serum
infliximab concentrations required for efficacy in both induction and maintenance may
improve clinical decision-making in UC.

MANUSCRIP
T
ACCEPTED
ACCEPTED MANUSCRIPTGastroenterology resubmission #2
10
Several studies have reported a positive association between infliximab concentration and
efficacy outcomes in patients with inflammatory bowel disease (IBD);10-14 however, there
are limited reports on specific concentration thresholds for optimal efficacy in UC. In one
study that identified specific infliximab cut-off levels, the analysis was based on
concentration data predominantly from patients with Crohn’s disease and included
relatively few patients with UC (n=13).14 Given the differences in pathophysiology and
response to treatment between Crohn’s disease and UC, it is reasonable to expect some
potential differences in the exposure-response relationship of anti-TNF therapies when
used to manage these conditions.9 Hence, evaluation of the relationship between serum
infliximab concentrations and efficacy based on data from well-controlled clinical trials
in UC patients may help identify target serum infliximab concentrations that can be used
to guide therapeutic decisions in an effort to optimize clinical outcomes in these patients.
We performed post-hoc analyses of data from the ACT-1 and ACT-2 trials to assess the
relationship between serum infliximab concentrations and clinical outcomes and to
identify clinically relevant drug concentrations to target in pursuit of better clinical
outcomes.

MANUSCRIP
T
ACCEPTED
ACCEPTED MANUSCRIPTGastroenterology resubmission #2
11
PATIENTS AND METHODS
Patients
ACT-1 and ACT-2 (NCT00036439 and NCT00096655) were randomized, double-blind,
placebo-controlled, Phase 3 clinical trials conducted globally. A total of 728 patients
were randomized at 62 sites in ACT-1 (N = 364) and 55 sites in ACT-2 (N = 364). The
institutional review board or ethics committee at each site approved the protocols, and all
patients provided informed consent. A patient disposition flow chart for the present
analyses is shown in Figure 1.
Study design
The ACT-1 and ACT-2 trials were conducted in compliance with the principles of the
Declaration of Helsinki and Good Clinical Practices. The design and conduct of these
trials were reported previously.2 Briefly, all patients had an established diagnosis of
moderately-to-severely active UC, with a Mayo score15 of 6 to 12 points (range: 0 to 12;
higher scores indicate more severe disease activity), despite concurrent treatment with
corticosteroids, azathioprine or 6-mercaptopurine (ACT-1 and ACT-2), or 5-
aminosalicylates (ACT-2 only). Patients diagnosed with indeterminate colitis, Crohn’s
disease, or clinical findings suggestive of Crohn’s disease (i.e., fistula or granuloma on
biopsy) were excluded. As previously described, concurrent therapy was not required at
enrollment for patients who could not tolerate or who previously failed to respond to
these medications.2 Doses of concomitant medications remained constant except for

MANUSCRIP
T
ACCEPTED
ACCEPTED MANUSCRIPTGastroenterology resubmission #2
12
corticosteroids, which were tapered to discontinuation following induction and during
maintenance therapy, i.e., from week 8 forward.2
Patients were randomized equally to receive intravenous infusions of infliximab 5 mg/kg,
infliximab 10 mg/kg, or placebo at weeks 0, 2, 6, and then every 8 weeks through week
22 (ACT-2) or week 46 (ACT-1) (Figure S1). Although infliximab is indicated for the
treatment of UC only as a 5 mg/kg dose regimen, for the purpose of these analyses, data
from patients who received the 10-mg/kg dose regimen in the ACT-1 and ACT-2 trials
were included for a more robust evaluation and interpretation of the concentration-
response relationship.
Study evaluations and analyses
Clinical outcomes were assessed using the Mayo score at week 8 (ACT-1 and ACT-2),
week 30 (ACT-1 and ACT-2), and week 54 (ACT-1 only). Clinical response, defined as a
decrease from baseline in the total Mayo score of at least 3 points and at least 30% and
with an accompanying decrease in the rectal bleeding subscore of at least1 point or an
absolute rectal bleeding subscore of 0 or 1, was the primary endpoint for both ACT-1 and
ACT-2. Clinical remission was defined as a total Mayo score of 2 points or lower, with
no individual subscore exceeding 1 point. Mucosal healing was defined by an endoscopy
subscore of 0 or 1.
For PK evaluations, patients were followed through week 54 in ACT-1 or week 42 in
ACT-2. In ACT-1, blood samples for determining serum infliximab concentrations were

MANUSCRIP
T
ACCEPTED
ACCEPTED MANUSCRIPTGastroenterology resubmission #2
13
drawn just before and 1 hour after the infusions at weeks 0, 2, 6, 14, and 46, and just
before the infusions at weeks 30 and 38. Additional blood samples for determination of
serum infliximab concentrations were drawn at the week-8 and week-54 non-dosing
visits (Figure S1). In ACT-2, blood samples were drawn just before and 1 hour after the
infusions at weeks 0 and 2, and just before the infusions at weeks 6 and 14. Additional
blood samples for serum infliximab concentration analysis were drawn at the week-8,
week-30, and week-42 non-dosing visits (Figure S1). Serum infliximab concentrations
were determined using a validated enzyme-linked immunosorbent assay,16 with a lower
limit of quantification of 0.1 µg/mL. Of the 484 patients randomized to infliximab (5 or
10 mg/kg) in the ACT-1 and ACT-2 trials, 482 received at least one infusion and had
appropriate serum infliximab concentration data. ATI were determined using an antigen-
bridging enzyme immunoassay (EIA).16 As with other EIAs, this assay was susceptible to
drug interference and was not able to accurately detect ATI in the presence of a
measurable infliximab concentration. For the purpose of this analysis, patients were
classified as positive if ATI were detected in their serum samples at any visit, while all
other patients were regarded as non-positive for ATI.
Statistical analysis
The patient population for these analyses included only those who received at least one
infusion of infliximab 5 or 10 mg/kg. Only patients with available infliximab
concentration data at the time point of interest were analyzed; missing serum infliximab
concentration data were not imputed. Serum infliximab concentrations and efficacy

MANUSCRIP
T
ACCEPTED
ACCEPTED MANUSCRIPTGastroenterology resubmission #2
14
outcomes at week 8 (time for induction efficacy endpoints for both ACT-1 and ACT-2),
week 30 (time for maintenance endpoints for both ACT-1 and ACT-2), and week 54
(additional time for maintenance endpoints for only ACT-1) were the primary focus of
these analyses. The prognostic value of earlier infliximab concentrations on subsequent
efficacy outcomes was also evaluated.
Patient characteristics and serum infliximab concentration data were summarized using
descriptive statistics. The correlation between serum infliximab concentrations at
different time points was assessed using the Pearson correlation coefficient. Serum
infliximab concentration data were compared between patients with and without the
specified efficacy outcomes using a 2-sided Wilcoxon-Mann-Whitney two-sample rank-
sum test. Serum infliximab concentrations were also categorized into quartiles, and the
trend of the proportion of patients with clinical outcomes across the quartiles was
evaluated using the 1-sided Cochrane-Armitage trend test. Comparison of the proportions
of patients with a given efficacy outcome across serum infliximab concentration quartiles
or across a given categorical variable was performed using Fisher’s exact test, while the
Kruskal-Wallis test was used to compare continuous variables across quartile groups. The
association between serum infliximab concentration (log-transformed) and clinical
outcomes was further evaluated by multivariable logistic regression modeling.
The effects of covariates (body weight, age, albumin, C-reactive protein [CRP], Mayo
score, sex, ATI status, and the use of immunosuppressive agents and corticosteroids)
were assessed by logistic regression analyses. A backward elimination approach using a

MANUSCRIP
T
ACCEPTED
ACCEPTED MANUSCRIPTGastroenterology resubmission #2
15
significance level of .05 for a covariate as a requirement for continued inclusion in the
model was adopted. Receiver-operating-characteristic (ROC) curve analysis was
employed to identify infliximab concentration thresholds associated with efficacy during
induction and maintenance. Optimal thresholds were chosen using the Youden Index,17
which maximizes the sum of the specificity and sensitivity of the ROC curve.
Access to study data
All authors had access to the study data and reviewed and approved the final manuscript.
MANUSCRIP
T
ACCEPTED
ACCEPTED MANUSCRIPTGastroenterology resubmission #2
16
RESULTS
Baseline characteristics in patients with PK data
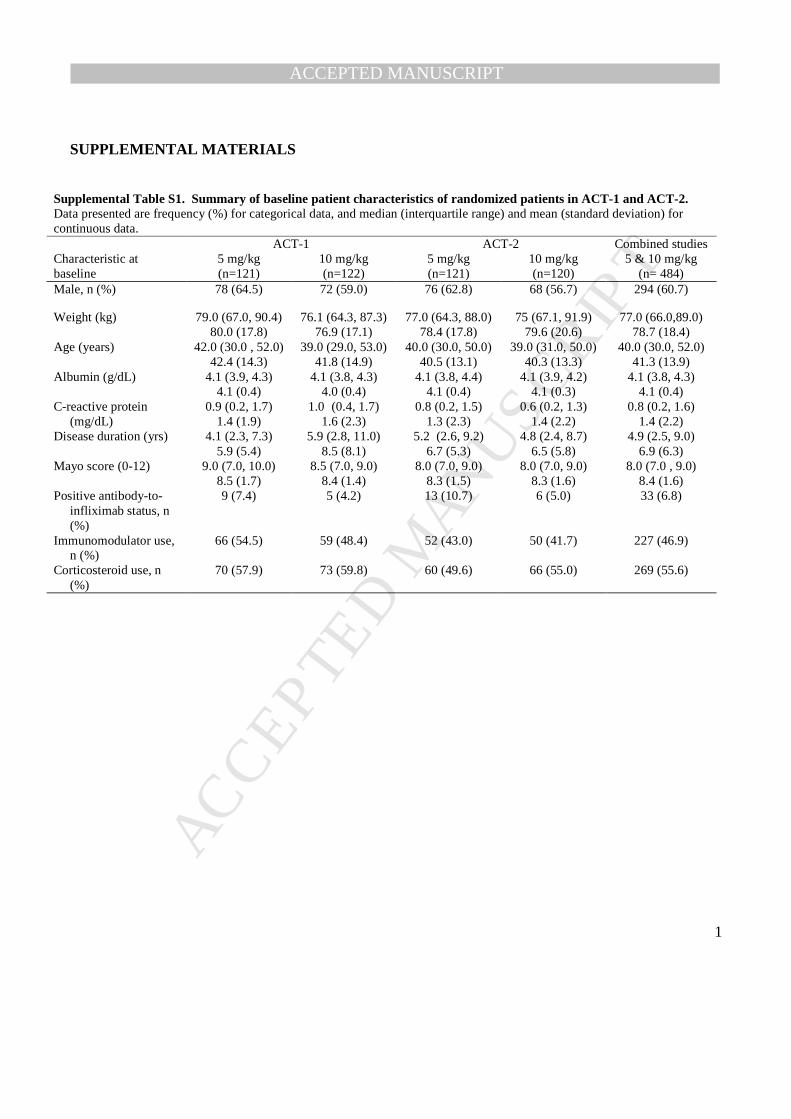
The baseline characteristics of patients who participated in ACT-1 and ACT-2 have been
detailed.2 A summary of characteristics for patients who were randomized to infliximab
treatment in both studies is provided in Table S1.
Serum infliximab concentrations by clinical response status
The distribution of serum infliximab concentrations observed at each visit through week
30 in patients receiving infliximab 5 or 10 mg/kg is depicted in Figure S2. When assessed
by clinical response status (using total Mayo score) at week 8, serum infliximab
concentrations over time were higher among patients with clinical response than among
patients without response, as illustrated for both dose regimens in Figure 2. For each dose
regimen, the median serum infliximab concentration was significantly higher at week 8 in
patients with clinical response or mucosal healing during induction than those not
achieving these endpoints (Table 1). For example, the median serum infliximab
concentration at week 8 in clinical responders was 35.0 µg/mL compared with
25.8 µg/mL in clinical nonresponders for the 5-mg/kg group at week 8. Similar results
were observed for clinical response and mucosal healing during maintenance at week 30
and week 54 (Table 1). For example, in patients who received the 5-mg/kg regimen, the
median trough serum infliximab concentration in clinical responders was several-fold that
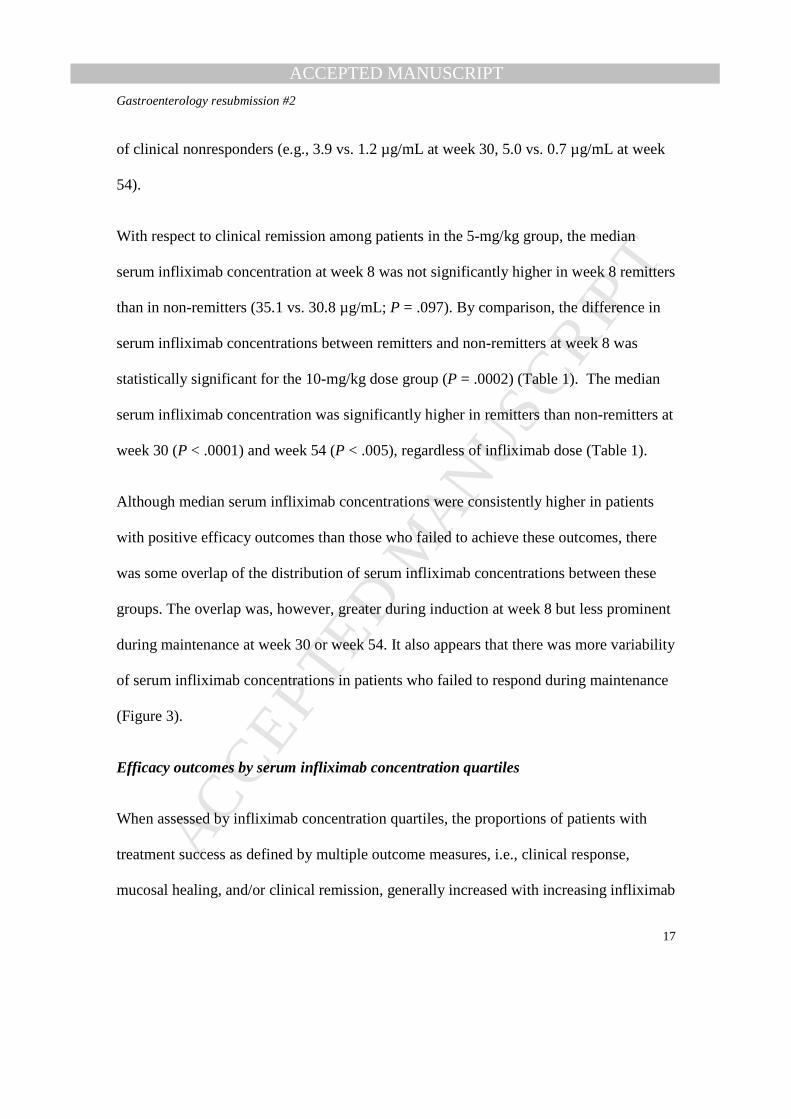
MANUSCRIP
T
ACCEPTED
ACCEPTED MANUSCRIPTGastroenterology resubmission #2
17
of clinical nonresponders (e.g., 3.9 vs. 1.2 µg/mL at week 30, 5.0 vs. 0.7 µg/mL at week
54).
With respect to clinical remission among patients in the 5-mg/kg group, the median
serum infliximab concentration at week 8 was not significantly higher in week 8 remitters
than in non-remitters (35.1 vs. 30.8 µg/mL; P = .097). By comparison, the difference in
serum infliximab concentrations between remitters and non-remitters at week 8 was
statistically significant for the 10-mg/kg dose group (P = .0002) (Table 1). The median
serum infliximab concentration was significantly higher in remitters than non-remitters at
week 30 (P < .0001) and week 54 (P < .005), regardless of infliximab dose (Table 1).
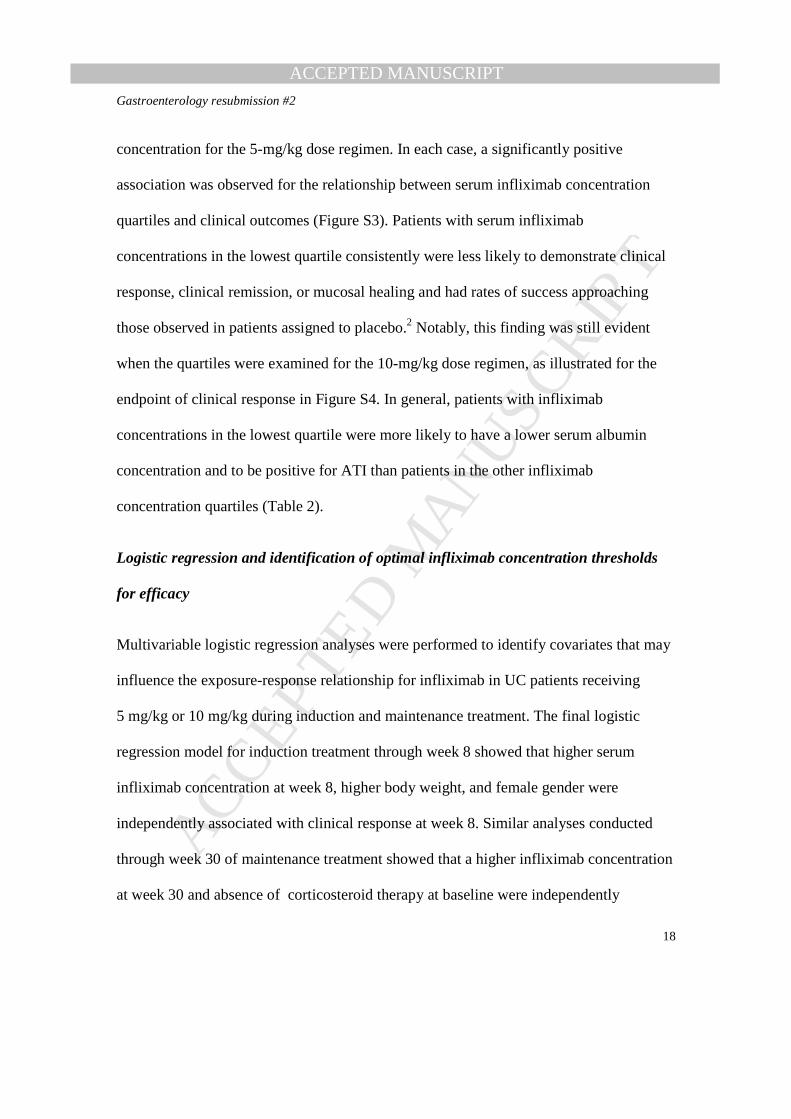
Although median serum infliximab concentrations were consistently higher in patients
with positive efficacy outcomes than those who failed to achieve these outcomes, there
was some overlap of the distribution of serum infliximab concentrations between these
groups. The overlap was, however, greater during induction at week 8 but less prominent
during maintenance at week 30 or week 54. It also appears that there was more variability
of serum infliximab concentrations in patients who failed to respond during maintenance
(Figure 3).
Efficacy outcomes by serum infliximab concentration quartiles
When assessed by infliximab concentration quartiles, the proportions of patients with
treatment success as defined by multiple outcome measures, i.e., clinical response,
mucosal healing, and/or clinical remission, generally increased with increasing infliximab
MANUSCRIP
T
ACCEPTED
ACCEPTED MANUSCRIPTGastroenterology resubmission #2
18
concentration for the 5-mg/kg dose regimen. In each case, a significantly positive
association was observed for the relationship between serum infliximab concentration
quartiles and clinical outcomes (Figure S3). Patients with serum infliximab
concentrations in the lowest quartile consistently were less likely to demonstrate clinical
response, clinical remission, or mucosal healing and had rates of success approaching
those observed in patients assigned to placebo.2 Notably, this finding was still evident
when the quartiles were examined for the 10-mg/kg dose regimen, as illustrated for the
endpoint of clinical response in Figure S4. In general, patients with infliximab
concentrations in the lowest quartile were more likely to have a lower serum albumin
concentration and to be positive for ATI than patients in the other infliximab
concentration quartiles (Table 2).
Logistic regression and identification of optimal infliximab concentration thresholds
for efficacy
Multivariable logistic regression analyses were performed to identify covariates that may
influence the exposure-response relationship for infliximab in UC patients receiving
5 mg/kg or 10 mg/kg during induction and maintenance treatment. The final logistic
regression model for induction treatment through week 8 showed that higher serum
infliximab concentration at week 8, higher body weight, and female gender were
independently associated with clinical response at week 8. Similar analyses conducted
through week 30 of maintenance treatment showed that a higher infliximab concentration
at week 30 and absence of corticosteroid therapy at baseline were independently
MANUSCRIP
T
ACCEPTED
ACCEPTED MANUSCRIPTGastroenterology resubmission #2
19
associated with a greater probability of maintaining clinical response at week 30 (Table
S2).
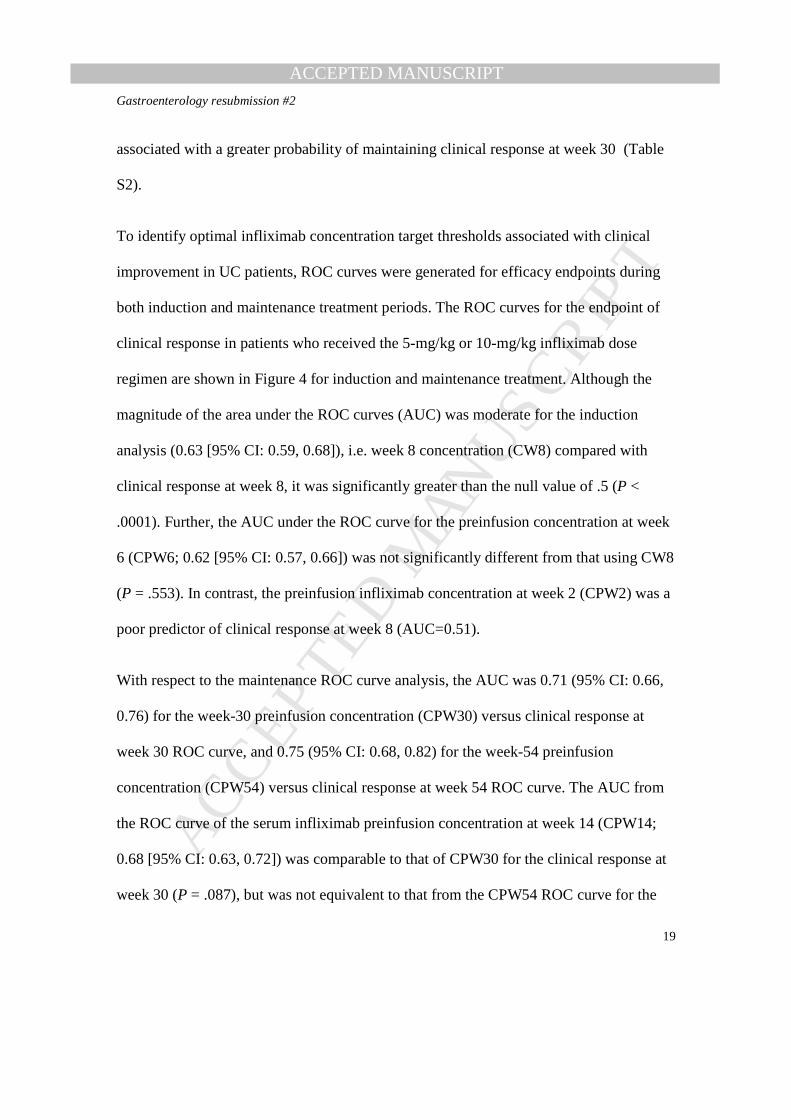
To identify optimal infliximab concentration target thresholds associated with clinical
improvement in UC patients, ROC curves were generated for efficacy endpoints during
both induction and maintenance treatment periods. The ROC curves for the endpoint of
clinical response in patients who received the 5-mg/kg or 10-mg/kg infliximab dose
regimen are shown in Figure 4 for induction and maintenance treatment. Although the
magnitude of the area under the ROC curves (AUC) was moderate for the induction
analysis (0.63 [95% CI: 0.59, 0.68]), i.e. week 8 concentration (CW8) compared with
clinical response at week 8, it was significantly greater than the null value of .5 (P <
.0001). Further, the AUC under the ROC curve for the preinfusion concentration at week
6 (CPW6; 0.62 [95% CI: 0.57, 0.66]) was not significantly different from that using CW8
(P = .553). In contrast, the preinfusion infliximab concentration at week 2 (CPW2) was a
poor predictor of clinical response at week 8 (AUC=0.51).
With respect to the maintenance ROC curve analysis, the AUC was 0.71 (95% CI: 0.66,
0.76) for the week-30 preinfusion concentration (CPW30) versus clinical response at
week 30 ROC curve, and 0.75 (95% CI: 0.68, 0.82) for the week-54 preinfusion
concentration (CPW54) versus clinical response at week 54 ROC curve. The AUC from
the ROC curve of the serum infliximab preinfusion concentration at week 14 (CPW14;
0.68 [95% CI: 0.63, 0.72]) was comparable to that of CPW30 for the clinical response at
week 30 (P = .087), but was not equivalent to that from the CPW54 ROC curve for the
MANUSCRIP
T
ACCEPTED
ACCEPTED MANUSCRIPTGastroenterology resubmission #2
20
week-54 clinical response endpoint (P = .041). In addition, the AUC from the CPW30
ROC curve was comparable to that from the CPW54 ROC curve (P = .746).
The ROC analysis identified different target thresholds depending on the time point of
the PK sampling or the efficacy assessment (Table 3). For clinical response at week 8, the
threshold infliximab concentration of 41 µg/mL at week 8 was associated with a
sensitivity, specificity, and positive predictive value (PPV) of 63%, 62%, and 80%,
respectively. Similarly, to maintain clinical response, an infliximab threshold
concentration of 3.7 µg/mL at week 30 was associated with sensitivity, specificity, and
PPV of 65%, 71%, and 82%, respectively. The data at week 54 suggest a range for serum
infliximab concentrations of similar sensitivity, specificity, and PPV, although the data
represent a subset of patients assessed, i.e., only those from ACT-1.
Serum infliximab concentration and subsequent efficacy outcomes
Serum infliximab concentrations at earlier time points were compared between patients
who maintained or who did not maintain an efficacy outcome. Serum concentrations at
week 8 and week 14 were examined for their impact on week 30 outcomes (ACT 1 and
ACT 2 combined), while concentrations at week 30 were examined for their impact on
week 54 outcomes (ACT 1 only). The results of these analyses demonstrate that patients
who previously achieved an efficacy outcome but who subsequently failed to maintain
that outcome exhibited lower serum infliximab concentrations earlier in their therapy
than did patients who maintained the efficacy outcome. This finding is illustrated for the
remission outcome in Figures S5A-C. In general, the lower the infliximab concentration

MANUSCRIP
T
ACCEPTED
ACCEPTED MANUSCRIPTGastroenterology resubmission #2
21
at a given time point, the more likely the patients were to fail to maintain remission
(Figures S5D-F). Similar findings were observed when individual infliximab doses were
analyzed, as illustrated in Figures S6A-D.

MANUSCRIP
T
ACCEPTED
ACCEPTED MANUSCRIPTGastroenterology resubmission #2
22
DISCUSSION
In these post-hoc analyses of the ACT-1 and ACT-2 data, we have shown a consistent
relationship between serum infliximab concentrations and clinical outcomes including
clinical response, clinical remission, and mucosal healing. These outcomes were
significantly more likely to occur in patients with higher infliximab concentrations than
those with lower drug concentrations. Although these findings are consistent with
previous reports of an association between serum levels of infliximab and efficacy in
patients with IBD, rheumatoid arthritis, and psoriasis,5-8,18-20 this is the largest evaluation
of this relationship that has been performed in patients with UC to date. A positive
exposure-response relationship has also been observed for golimumab (another anti-TNF
biologic) in patients with UC.21
Furthermore, our data originated from large-scale trials that prospectively evaluated a
large number of well-characterized patients. In particular, these analyses included data
for the approved 5-mg/kg dose as well as the highest studied dose in UC (i.e., 10 mg/kg)
and thus covered a wide range of serum infliximab concentrations. As a result, these
analyses provide more precise estimates of threshold concentrations associated with
efficacy and avoid confounding factors present in previous evaluations.
Although the consistency and statistical validity of the observed association indicates that
a positive correlation exists between infliximab concentrations and efficacy, it is
important to contextualize our findings. For induction, the presence of an infliximab
concentration of approximately 41 µg/mL at week 8 was associated with a PPV of 80%

MANUSCRIP
T
ACCEPTED
ACCEPTED MANUSCRIPTGastroenterology resubmission #2
23
and a negative predictive value (NPV) of 42% for the outcome of clinical response at
week 8. Based on the specificity and sensitivity values derived from the ROC analysis of
infliximab induction data, patients with serum infliximab concentrations >41 µg/mL have
almost twice the likelihood of achieving clinical response at week 8 compared with those
who do not achieve this target (positive likelihood ratio [LR+] = 1.7). However, for more
effective patient management, it would be preferable to predict the clinical outcome at
week 8 based on earlier measurements.
Accordingly, although our results showed that the preinfusion concentration at week 2
was not predictive of clinical response at week 8, the preinfusion concentration at week 6
may be a predictor of subsequent response. A likely explanation for this finding is that
the serum infliximab concentration at week 6 is more reflective of drug clearance than the
infliximab concentration at week 2, which reflects the initial phase of drug loading.
With respect to maintenance infliximab therapy, the largest amount of data (ACT-1 and
ACT-2 combined) was available at week 30, and the threshold at this time point was
defined by ROC analysis at 3.7 µg/mL, with a PPV of 82% and an NPV of 51% for the
maintenance of clinical response at week 30. These results show that patients with serum
infliximab concentration >3.7 µg/mL at steady state are more than twice as likely to be in
clinical response during maintenance compared with patients who do not achieve this
target (LR+ = 2.3).
Because preinfusion serum infliximab concentration at week 30 is most representative of
steady-state trough concentration for both ACT studies, more weight should be given to

MANUSCRIP
T
ACCEPTED
ACCEPTED MANUSCRIPTGastroenterology resubmission #2
24
the threshold estimate from the ROC analyses at this time point compared with the
week-54 maintenance time point in ACT-1. Nonetheless, our analysis showed that
preinfusion serum infliximab concentrations at week 14 may also be predictive of clinical
response during maintenance. Specifically, a serum infliximab concentration ≥ 5.1 µg/mL
at week 14 was also associated with clinical response at week 30. The serum infliximab
concentration threshold of 5.1 µg/mL at week 14 is consistent with that defined by ROC
analysis for week 30 (3.7 µg/mL) when consideration is given to the fact that the
concentration at week 14 is theoretically expected to be slightly higher than the
concentration at week 30 since only 8 weeks (one maintenance dose interval) have
elapsed before the week-14 sampling, following the three induction doses at week 0, 2,
and 6. Furthermore, the threshold serum infliximab concentration of 3.7 µg/mL is
consistent with that estimated for patients with Crohn’s disease in the infliximab
ACCENT 1 trial, in which a serum infliximab level of 3.5 µg/mL at week 14 was
associated with sustained durable response through week 54.22
In these analyses, patients in the lowest infliximab concentration quartile were found to
have a higher incidence of ATI and lower serum albumin concentrations. The effects of
albumin on serum infliximab concentrations and efficacy in UC were reported
previously.23 Although the occurrence of antibodies to TNF-inhibitors has been cited as a
possible cause for loss of therapeutic effect,10,13,24 the multivariable logistic regression
analysis showed that ATI status was not strongly associated with successful induction of
clinical response at week 8 or maintenance of response at week 30. Overall, the data
from the multivariable model suggest that low serum infliximab concentrations (which

MANUSCRIP
T
ACCEPTED
ACCEPTED MANUSCRIPTGastroenterology resubmission #2
25
could result from the presence of ATI) are more directly associated with decreased
response rather than just the occurrence of ATI. This finding is consistent with
conclusions from a systematic review of the impact of ATI in Crohn’s disease,25 as well
as previously published findings of the ACT trial, which showed that the clinical
response rate was numerically higher in patients who had inconclusive ATI status (with
higher serum infliximab concentrations) compared with those who tested positive or
negative for ATI (with lower serum infliximab concentrations).2 Furthermore, other
investigators have reported that some ATI may be transient and do not lead to worse
clinical outcomes unless these ATI levels are sustained.26 The persistence of ATI was not
assessed in the current analysis to make this determination.
Notwithstanding this apparent lack of effect of ATI status on efficacy, it should be noted
that since the assay used for these ATI assessments was only able to accurately detect
ATI in the absence of detectable circulating infliximab, and there is likely some bias from
missing data as patients who withdrew early from the study because of lack of efficacy
may not have had a comprehensive assessment of ATIs. It is possible that a higher
proportion of these patients may have developed ATIs than those who continued in the
trial.
Another important finding in the current study is that although patients with the poorest
outcomes generally display relatively lower serum infliximab concentrations, they do so
at both dose levels in the ACT studies. Although the reason for this phenomenon is
unknown, this counterintuitive finding is suggestive of an intricate relationship between

MANUSCRIP
T
ACCEPTED
ACCEPTED MANUSCRIPTGastroenterology resubmission #2
26
infliximab pharmacodynamics and its systemic clearance, such that patients who are
more likely to respond better to infliximab have intrinsically lower clearance of the drug.
Since the overall infliximab clearance is unchanged within the dose range evaluated in
the ACT trials,4 this hypothesis could explain why, despite higher infliximab dose and
higher infliximab concentrations, the proportion of patients achieving efficacy outcomes
remained largely unchanged when the respective dose-stratified concentration quartiles
are compared, most strikingly in the lowest infliximab concentration quartiles (Figure
S4). One possible inference from these data is the existence of a group of patients who
may not effectively be treated with infliximab due to high clearance rates, regardless of
the dose. It should be acknowledged, however, that the above hypothesis is not supported
by results of several studies that have shown the benefits of increasing the infliximab
dose in some patients with IBD or rheumatoid arthritis who lose response.27,28
Nonetheless, these findings suggest that clinicians should carefully weigh the need for a
dose adjustment when applicable, considering that not all patients may benefit from such
a dose increase.
The current results have some limitations. First, while the relationship between serum
infliximab concentrations and efficacy outcomes appears to be both consistent and robust,
these results are retrospective and may be confounded by other determinants of both drug
concentrations and outcomes. However, these data were generated from large randomized
trials in which known confounders were prospectively identified and in which
randomization would be expected to balance for the presence of confounding factors
between the experimental groups. Nevertheless, prospective studies designed to assess

MANUSCRIP
T
ACCEPTED
ACCEPTED MANUSCRIPTGastroenterology resubmission #2
27
the value of infliximab concentration-guided dose escalation in terms of efficacy and
potential impact on safety could provide valuable information pertaining to a more
optimized approach toward infliximab therapy of UC. One such study suggests that
therapeutic drug monitoring may predict the likelihood of achieving mucosal healing
following infliximab dose escalation in IBD.29 The positive findings of a small
randomized trial of therapeutic drug monitoring in patients with Crohn’s disease who
experienced a loss of response to infliximab are also encouraging.30 It is also generally
held that a therapeutic drug monitoring approach using treatment algorithms in the
management of secondary loss of response may be more rational than empiric dose
escalation.31
The results of these analyses may also be limited by the fact that the serum infliximab
concentrations were measured using a proprietary assay not presently available
commercially. As a result, research is needed to cross-validate the assay with those
available to physicians to help translate these identified infliximab concentrations into
practice settings. In addition, the low NPV and low positive likelihood ratio associated
with the identified threshold imply that false-negative results may be common and
additional clinical judgment will be needed to manage patients who demonstrate
concentrations below the target threshold. Conversely, the magnitude of the PPV at the
identified thresholds may reassure a clinician that a given patient is not under-treated if
serum drug concentrations are above these thresholds.

MANUSCRIP
T
ACCEPTED
ACCEPTED MANUSCRIPTGastroenterology resubmission #2
28
In summary, we have established that there is a strong association between serum
infliximab concentration and efficacy outcomes in patients with UC. The predictive value
of serum infliximab concentrations on subsequent efficacy outcomes in these patients
was also demonstrated. These results further highlight the possibility of infliximab dose
optimization, particularly in patients who are likely to fail to maintain efficacy benefit
while receiving the standard dose regimen. The target serum infliximab threshold
concentrations and corresponding time points for infliximab measurement suggested by
the analyses could assist the clinician in understanding the mechanism whereby an
individual patient is not achieving the expected efficacy. Whether these results can be
exploited to achieve better outcomes for patients with UC will need to be assessed in a
prospective study designed to confirm the growing evidence that concentrations of
infliximab may need to be optimized to maintain efficacy, and thus can provide guidance
to clinicians in the management of patients with UC.

MANUSCRIP
T
ACCEPTED
ACCEPTED MANUSCRIPTGastroenterology resubmission #2
29
TABLE AND FIGURE LEGENDS
Table 1. Summary of median (interquartile range) serum infliximab concentration
(SIC; µg/mL) by efficacy outcome status in ACT-1 and ACT-2.
Table 2. Summary of patient characteristics by serum infliximab concentration
quartiles (Q) at induction week 8 and maintenance week 30 among patients treated
with infliximab 5 or 10 mg/kg in ACT-1 and ACT-2.
Table 3. Target serum infliximab concentration thresholds for clinical response
based on the receiver- operating-characteristic (ROC) curve analyses among
patients treated with infliximab 5 or 10 mg/kg in ACT-1 and ACT-2
Figure 1. Patient disposition through the pharmacokinetic (PK) analytical time
points of interest in the ACT-1 and ACT-2 trials.
Figure 2. Serum infliximab concentrations over time by clinical response status at
week 8 in patients randomized to infliximab 5 mg/kg (Panel A) or 10 mg/kg (Panel
B) in ACT-1 and ACT-2. The pharmacokinetic profile shown is according to the
sampling times in ACT-1 and ACT-2.
Figure 3. Distribution of infliximab concentrations by efficacy outcome status at
induction week 8 (A), maintenance week 30 (B), and maintenance week 54 (C; ACT-
1 only) among patients treated with infliximab 5 or 10 mg/kg. Box plots below show

MANUSCRIP
T
ACCEPTED
ACCEPTED MANUSCRIPTGastroenterology resubmission #2
30
median (solid line in box), interquartile range (upper and lower boundaries of box) and
standard deviation (whiskers).
Figure 4. Receiver-operating-characteristic (ROC) curves for the relationship
between serum infliximab concentrations and clinical response in ACT-1 and ACT-
2 at induction week 8 (A), maintenance week 30 (B), and maintenance week 54 (C;
ACT-1 only) among patients treated with infliximab 5 or 10 mg/kg. CPW2, CPW6,
CW8 (Panel A), CPW14, CPW30 (Panels B and C), or CPW54 (Panel C, ACT-1 only)
represent ROC curves for clinical response and serum infliximab concentrations at weeks
2, 6, 8, 14, 30, or 54, respectively, all preinfusion except week 8 “A=” indicates the area
under the ROC curve.

MANUSCRIP
T
ACCEPTED
ACCEPTED MANUSCRIPTGastroenterology resubmission #2
31
REFERENCES
1. REMICADE (infliximab) prescribing information (revised March 2013). Available at:
http://www.remicade.com/shared/product/remicade/prescribing-information.pdf.
Accessed Jun 11, 2013.
2. Rutgeerts P, Sandborn WJ, Feagan BG, et al. Infliximab for induction and
maintenance therapy for ulcerative colitis. N Engl J Med 2005;353:2462–2476.
3. Siddiqui MA, Scott JL. Infliximab: A review of its use in Crohn’s disease and
rheumatoid arthritis. Drug 2006;66:2179–2208.
4. Fasanmade AA, Adedokun OJ, Ford J, et al. Population pharmacokinetic analysis of
infliximab in patients with ulcerative colitis. Eur J Clin Pharmacol 2009; 65:1211-1228.
5. Fasanmade A, Olson A, Bao W, et al. Relationship between infliximab
pharmacokinetics and improvement in Crohn’s disease. Gastroenterology 2002;122 (4
Suppl 1):A617–A618.
6. Fasanmade AA, Marsters P, Munsanje E, et al. Infliximab pharmacokinetics and
improvement in fistulizing Crohn’s disease. Gastroenterology 2003;124 (4 Suppl 1):A61.
7. St. Clair EW, Wagner CL, Fasanmade AA, et al. The relationship of serum infliximab
concentrations to clinical improvement in rheumatoid arthritis. Arthritis Rheum
2002;46:1451–1459.

MANUSCRIP
T
ACCEPTED
ACCEPTED MANUSCRIPTGastroenterology resubmission #2
32
8. Gottlieb AB, Masud S, Ramamurthi R, et al. Pharmacodynamic and pharmacokinetic
response to anti-tumor necrosis factor-α monoclonal antibody (infliximab) treatment of
moderate to severe psoriasis vulgaris. J Am Acad Dermatol 2003;48:68–75.
9. Ordas I, Mould DR, Feagan BG, et al. Anti-TNF monoclonal antibodies in
inflammatory bowel disease: pharmacokinetics-based dosing paradigms. Clin Pharmacol
Ther 2012;91:635–646.
10. Baert F, Noman M, Vermeire S, et al. Influence of immunogenicity on the long-term
efficacy of infliximab in Crohn's disease. N Engl J Med 2003;348:601–608.
11. Maser EA, Villela R, Silverberg MS, et al. Association of trough serum infliximab to
clinical outcome after scheduled maintenance treatment for Crohn's disease. Clin
Gastroenterol Hepatol 2006;4:1248–1254.
12. Bortlik M, Duricova D, Malickova K, et al. Infliximab trough levels may predict
sustained response to infliximab in patients with Crohn's disease. J Crohns Colitis
2013;7:736-743.
13. Seow CH, Newman A, Irwin SP, et al. Trough serum infliximab: a predictive factor
of clinical outcome for infliximab treatment in acute ulcerative colitis. Gut 2010;59:49–
54.

MANUSCRIP
T
ACCEPTED
ACCEPTED MANUSCRIPTGastroenterology resubmission #2
33
14. Steenholdt C, Bendtzen K, Brynskov J, et al. Cut-off levels and diagnostic accuracy
of infliximab trough levels and anti-infliximab antibodies in Crohn's disease. Scand J
Gastroenterol 2011;46:310–318.
15. Schroeder KW, Tremaine WJ, Ilstrup DM. Coated oral 5-aminosalicylic acid therapy
for mildly to moderately active ulcerative colitis: a randomized study. N Engl J Med
1987;317:1625–1629.
16. Hanauer SB, Wagner CL, Bala M, et al. Incidence and importance of antibody
responses to infliximab after maintenance or episodic treatment in Crohn’s disease. Clin
Gastroenterol Hepatol 2004;2:542–553.
17. Youden WJ. Index for rating diagnostic tests. Cancer 1950;3:32–35.
18. Mulleman D, Chu Miow Lin D, Ducourau E, et al. Trough infliximab concentrations
predict efficacy and sustained control of disease activity in rheumatoid arthritis. Ther
Drug Monitor 2010;32:232–236.
19. St Clair EW, Wagner CL, Fasanmade AA, et al. The relationship of serum infliximab
concentrations to clinical improvement in rheumatoid arthritis: results from ATTRACT, a
multicenter, randomized, double-blind, placebo-controlled trial. Arthritis Rheum
2002;46:1451–1459.

MANUSCRIP
T
ACCEPTED
ACCEPTED MANUSCRIPTGastroenterology resubmission #2
34
20. Pallagi-Kunstár E, Farkas K, Szepes Z, et al. Utility of serum TNF-α, infliximab
trough level, and antibody titers in inflammatory bowel disease. World J Gastroenterol
2014;20:5031-5.
21. Sandborn WJ, Feagan BG, Marano C, et al. Subcutaneous golimumab maintains
clinical response in patients with moderate-to-severe ulcerative colitis. Gastroenterology
2014;146:96-109.
22. Cornillie F, Hanauer SB, Diamond RH, et al. Postinduction serum infliximab trough
level and decrease of C-reactive protein level are associated with durable sustained
response to infliximab: a retrospective analysis of the ACCENT I trial. Gut 2014 Mar 4.
doi: 10.1136/gutjnl-2012-304094. [Epub ahead of print]
23. Fasanmade AA, Adedokun OJ, Olson A, et al. Serum albumin concentration: a
predictive factor of infliximab pharmacokinetics and clinical response in patients with
ulcerative colitis. Int J Clin Pharmacol Ther 2010;48:297-308.
24. Karmiris K, Paintaud G, Noman M, et al. Influence of trough serum levels and
immunogenicity on long-term outcome of adalimumab therapy in Crohn's disease.
Gastroenterology 2009;137:1628–1640.
25. Cassinotti A, Travis S. Incidence and clinical significance of immunogenicity to
infliximab in Crohn's disease: a critical systematic review. Inflamm Bowel Dis
2009;15:1264-1275.
MANUSCRIP
T
ACCEPTED
ACCEPTED MANUSCRIPTGastroenterology resubmission #2
35
26. Casteele V, Gils A, Singh S, et al. Antibody response to infliximab and its impact on
pharmacokinetics can be transient. Am J Gastroenterol 2013;108:962-971.
27. Afif W, Loftus EV Jr, Faubion WA, et al. Clinical utility of measuring infliximab and
human antichimeric antibody concentrations in patients with inflammatory bowel disease.
Am J Gastroenterol 2010;105:1133–1139.
28. Ariza-Ariza R, Navarro-Sarabia F, Hernández-Cruz B, et al. Dose escalation of the
anti-TNF-alpha agents in patients with rheumatoid arthritis. A systematic review.
Rheumatology (Oxford) 2007;46:529-532.
29. Paul S, Del Tedesco E, Marotte H, et al. Therapeutic drug monitoring of infliximab
and mucosal healing in inflammatory bowel disease: a prospective study. Inflamm Bowel
Dis 2013;19:2568-2576.
30. Steenholdt C, Brynskov J, Thomsen OO, et al. Individualised therapy is more cost-
effective than dose intensification in patients with Crohn's disease who lose response to
anti-TNF treatment: a randomised, controlled trial. Gut 2014;63:919-27.
31. Khanna R, Sattin BD, Afif W, et al. Review article: a clinician's guide for therapeutic
drug monitoring of infliximab in inflammatory bowel disease. Aliment Pharmacol Ther
2013;38:447-59.
[Author names in bold designate shared co-first authors.]

MANUSCRIP
T
ACCEPTED
ACCEPTED MANUSCRIPT
TABLES
Table 1. Summary of median (interquartile range) serum infliximab concentration (SIC; µg/mL) by efficacy outcome status in ACT-1 and ACT-2.
Week-8 efficacy outcome following infliximab induction treatment Efficacy outcome
Summary statistic
5 mg /kg (n=230)
10 mg/kg (n=216)
Combined 5 & 10 mg/kg (n=446)
Clinical response
Achieved Not achieved Achieved Not achieved Achieved Not achieved N (%) 160 (69.6) 70 (30.4) 153 (70.8) 63 (29.2) 313 (70.2) 133 (29.8) SIC 35.0
(25.0, 50.5) 25.8
(17.8, 39.5) 82.6
(56.7, 108.4) 52.4
(26.1, 91.0) 51.6
(31.7, 85.8) 33.5
(20.8, 64.4) P value1 .0012 < .0001 < .0001
Mucosal healing
N (%) 146 (63.5) 84 (36.5) 142 (65.7) 74 (34.3) 288 (64.6) 158 (35.4) SIC. 36.1
(25.8, 51.6) 26.0
(17.9, 38.8) 83.6
(57.2, 109.8) 52.5
(31.6, 90.5) 53.1
(33.2, 88.8) 33.5
(21.2, 63.1) P value1 < .0001 < .0001 < .0001
Clinical remission
N (%) 87 (37.8) 143 (62.2) 71 (32.9) 145 (67.1) 158 (35.4) 288 (64.6) SIC 35.1
(24.7, 49.0) 30.8
(20.4, 46.5) 89.6
(68.2, 117.3) 68.3
(39.5, 96.6) 49.0
(32.1, 89.6) 42.3
(24.5, 77.6) P value1 .0971 .0002 .0156
Week 30 efficacy outcome during maintenance treatment Efficacy outcome
Summary statistic
5 mg /kg (n=190)
10 mg/kg (n=184)
Combined 5 & 10 mg/kg (n=374)
Clinical response
Achieved Not achieved Achieved Not achieved Achieved Not achieved N (%) 119 (62.6) 71 (37.4) 130 (70.7) 54 (29.4) 249 (66.6) 125 (33.4) SIC 3.9
(0.7, 7.6) 1.2
(0.1, 3.6) 10.9
(3.9, 18.3) 2.2
(0.1, 4.8) 6.2
(2.0, 15.2) 1.2
(0.1, 4.4) P value1 .0006 < .0001 < .0001
Mucosal healing
N (%) 117 (61.6) 73 (38.4) 124 (67.4) 60 (32.6) 241 (64.4) 133 (35.6) SIC 4.1
(1.1, 8.4) 1.0
(0.1, 3.0) 11.5
(3.9, 18.5) 2.3
(0.1, 5.5) 6.5
(2.4, 15.3) 1.2
(0.1, 4.7) P value1 < .0001 < .0001 < .0001
Clinical remission
N (%) 72 (37.9) 118 (62.1) 85 (46.2) 99 (53.8) 157 (42.0) 217 (58.0) SIC 5.0
(2.3, 10.8) 1.2
(0.1, 4.6) 13.3
(6.3, 18.3) 3.7
(0.2, 7.8) 8.0
(3.5, 16.7) 2.0
(0.1, 6.5) P value1 < .0001 < .0001 < .0001
Week-54 efficacy outcome during maintenance treatment (ACT-1 only) Efficacy outcome
Summary statistic
5 mg /kg (n=78)
10 mg/kg (n=80)
Combined 5 & 10 mg/kg (n=158)
Clinical response
Achieved Not achieved Achieved Not achieved Achieved Not achieved N (%) 53 (68.0) 25 (32.1) 52 (65.0) 28 (35.0) 105 (66.5) 53 (33.5) SIC 5.0
(2.5, 9.3) 0.7
(0.1, 2.8) 10.5
(4.8, 19.1) 0.4
(0.1, 5.4) 6.1
(3.0,14.9) 0.7
(0.1,4.2) P value1 .0008 < .0001 < .0001
Mucosal healing
N (%) 54 (69.2) 24 (30.8) 55 (68.8) 25 (31.3) 109 (69.0) 49 (31.0) SIC 5.1
(2.5, 9.8) 1.1
(0.1, 2.7) 10.5
(4.6, 18.9) 0.1
(0.1, 3.1) 6.5
(3.0,14.9) 0.7
(0.1, 3.1) P value1 .0003 .0001 < .0001

MANUSCRIP
T
ACCEPTED
ACCEPTED MANUSCRIPT
Clinical remission
N (%) 42 (53.9) 36 (46.2) 41 (51.3) 39 (48.8) 83 (52.5) 75 (47.5) SIC 5.0
(2.6, 9.8) 1.9
(0.1, 6.5) 10.9
(5.9, 19.2) 2.2
(0.1, 11.1) 6.8
(3.2, 15.0) 2.1
(0.1,8.1) P value1 .0047 .0004 < .0001
1 P value derived from 2-sided Wilcoxon-Mann-Whitney two-sample rank-sum test comparing patients who achieved versus those who did not achieve the efficacy outcome.

MANUSCRIP
T
ACCEPTED
ACCEPTED MANUSCRIPT
Table 2. Summary of patient characteristics by serum infliximab concentration quartiles (Q) at induction week 8 and maintenance week 30 among patients treated with infliximab 5 or 10 mg/kg in ACT-1 and ACT-2. Characteristic1 Q1 Q2 Q3 Q4 P value2 Induction week 8, N 111 112 111 112 Continuous variables (median value)
Body weight (kg) 72.3 78.6 74.5 79.1 .035 Age (yr) 42.0 41.0 38.0 39.0 .140 Serum albumin (g/dL) 3.9 4.1 4.1 4.2 < .0001 C-reactive protein (mg/dL) 0.8 0.9 0.8 0.5 .005 Mayo score 9.0 8.0 8.0 8.0 .003
Categorical variables (%) Male 65.8 62.5 55.0 57.1 .338 Positive antibodies-to-infliximab status 14.4 10.7 2.7 1.8 .0002 Concomitant immunomodulator use3 45.1 42.9 47.8 47.3 .881 Corticosteroid use 62.2 57.1 52.3 53.6 .448
Maintenance week 30, N 93 94 93 94 Continuous variables (median)
Body weight (kg) 75.0 76.3 79.0 75.7 .426 Age (yr) 45.0 41.0 40.0 38.0 .104 Serum albumin (g/dL) 4.0 4.1 4.2 4.2 < .0001 C-reactive protein (mg/dL) 0.9 0.8 0.6 0.7 .142 Mayo score 9.0 8.0 8.0 8.0 .13
Categorical variables (%) Male 59.1 59.6 63.4 55.3 .736 Positive antibodies-to-infliximab status 25.8 3.2 3.2 0.0 < .0001 Concomitant immunomodulator use3 29.0 54.3 59.1 44.7 .0002 Corticosteroid use 57.0 54.3 60.2 46.8 .297
1All characteristics are at baseline with the exception of antibodies-to-infliximab status. 2 P value derived from the Fisher’s exact test for categorical variables and the Kruskal-Wallis test for continuous variables. 3Azathioprine, 6-mercaptopurine, or methotrexate

MANUSCRIP
T
ACCEPTED
ACCEPTED MANUSCRIPT
Table 3. Target serum infliximab concentration thresholds for clinical response based on the receiver- operating-characteristic (ROC) curve analyses among patients treated with infliximab 5 or 10 mg/kg in ACT-1 and ACT-2. Efficacy endpoint Infliximab pharmaco-
kinetic metric ROC analysis metric Estimate
Clinical response during induction at week 8
Concentration at week 8 Threshold (µg/mL) 41.2 Sensitivity 63% Specificity 62% NPV 42% PPV 80%
Concentration at week 6 Threshold (µg/mL) 22.0 Sensitivity 60% Specificity 62% NPV 41% PPV 78%
Clinical response during maintenance at week 30
Concentration at week 14 Threshold (µg/mL) 5.1 Sensitivity 66% Specificity 63% NPV 54% PPV 74%
Concentration at week 30 Threshold (µg/mL) 3.7 Sensitivity 65% Specificity 71% NPV 51% PPV 82%
Clinical response during maintenance at week 54 (ACT-1 only)
Concentration at week 14 Threshold (µg/mL) 3.5 Sensitivity 82% Specificity 50% NPV 72% PPV 63%
Concentration at week 30 Threshold (µg/mL) 2.4 Sensitivity 86% Specificity 62% NPV 77% PPV 76%
Concentration at week 54 Threshold (µg/mL) 1.7 Sensitivity 89% Specificity 64% NPV 74% PPV 83%
NPV = negative predictive value, PPV = positive predictive value

MANUSCRIP
T
ACCEPTED
ACCEPTED MANUSCRIPTPatients randomized in ACT-1(n = 364)
Patientsrandomizedto infliximab
5 mg/kg(n = 121)
Patientsrandomizedto infliximab
10 mg/kg(n = 122)
Patients withPK sampleincluded inthe analysis
(n = 113)
Patients withPK sampleincluded inthe analysis
(n = 108)
Patients withPK sampleincluded inthe analysis
(n = 96)
Patients withPK sampleincluded inthe analysis
(n = 91)
Patients withPK sampleincluded inthe analysis
(n = 78)
Patients withPK sampleincluded inthe analysis
(n = 80)
Patientsrandomizedto placebo(n = 121)
Week 8
Week 30
Week 54
Patients randomized in ACT-2(n = 364)
Patientsrandomizedto infliximab
5 mg/kg(n = 121)
Patientsrandomizedto infliximab
10 mg/kg(n = 120)
Patients withPK sampleincluded inthe analysis
(n = 117)
Patients withPK sampleincluded inthe analysis
(n = 108)
Patients withPK sampleincluded inthe analysis
(n = 94)
Patients withPK sampleincluded inthe analysis
(n = 93)
Patientsrandomizedto placebo(n = 123)
02
39

MANUSCRIP
T
ACCEPTED
ACCEPTED MANUSCRIPT
024
0_v2
0.1
n =
Responder 160 162 160 160 158 149 69 66 66
Nonresponder 79 78 73 70 50 41 14 14 12
0Week
*Concentrations not evaluated for patients in ACT-2.
2 6 8 14 22 30 38* 46* 54*
1
10
100
10005 mg/kg
AM
ed
ian s
eru
m in
flix
ima
b
co
nce
ntr
atio
n (
g/m
L)
Responders Nonresponders
0241_v2
0.1
n =
Responder 157 154 155 153 154 143 65 60 63
Nonresponder 85 85 71 65 48 42 13 14 17
0Week 2 6 8 14 22 30 38* 46* 54*
1
10
100
100010 mg/kg
B
Me
dia
n s
eru
m in
flix
ima
b
co
nce
ntr
atio
n (
g/m
L)

MANUSCRIP
T
ACCEPTED
ACCEPTED MANUSCRIPT
024
2_v2
AIn
flix
ima
b c
on
ce
ntr
atio
n a
t
we
ek 8
(µ
g/m
L)
No Yes
Clinical
response
No Yes
Mucosal
healing
Efficacy outcomes at week 8
No Yes
Clinical
remission
10
100
024
4_v2
C
Inflix
ima
b c
on
ce
ntr
atio
n a
t
we
ek 5
4 (
µg
/mL)
No Yes
Clinical
response
No Yes
Mucosal
healing
Efficacy outcomes at week 54
No Yes
Clinical
remission
0.1
0.0
10.0
1.0
024
3_v2
B
Inflix
ima
b c
on
ce
ntr
atio
n a
t
we
ek 3
0 (
µg
/mL)
No Yes
Clinical
response
No Yes
Mucosal
healing
Efficacy outcomes at week 30
No Yes
Clinical
remission
0.1
0.0
10.0
1.0
P = < .0001 < .0001 < .0001
n = 125 249 133 241 217 157
P = < .0001 < .0001 .0156
n = 133 313 158 288 288 158
P = < .0001 < .0001 < .0001
n = 53 105 49 109 75 83

MANUSCRIP
T
ACCEPTED
ACCEPTED MANUSCRIPT
0247_v3
C
0.0
0.2
0.4
0.6
0.8
1.0
Clinical response at week 54
0.0 0.2 0.4 0.6 0.8 1.0
Se
nsitiv
ity
Specificity0
24
6_v3
B
0.0
0.2
0.4
0.6
0.8
1.0
Clinical response at week 30
0.0 0.2 0.4 0.6 0.8 1.0
Se
nsitiv
ity
Specificity0
24
5_v3
A
0.0
0.2
0.4
0.6
0.8
1.0
Clinical response at week 8
0.0 0.2 0.4 0.6 0.8 1.0
Se
nsitiv
ity
Specificity
CW8, A = .63
CPW6, A = .62
CPW2, A = .51
CPW54, A = .75
CPW30, A = .74
CPW14, A = .67
CPW30, A = .71
CPW14, A = .68
MANUSCRIP
T
ACCEPTED
ACCEPTED MANUSCRIPT
1
SUPPLEMENTAL MATERIALS
Supplemental Table S1. Summary of baseline patient characteristics of randomized patients in ACT-1 and ACT-2. Data presented are frequency (%) for categorical data, and median (interquartile range) and mean (standard deviation) for continuous data. ACT-1 ACT-2 Combined studies Characteristic at baseline
5 mg/kg (n=121)
10 mg/kg (n=122)
5 mg/kg (n=121)
10 mg/kg (n=120)
5 & 10 mg/kg (n= 484)
Male, n (%) 78 (64.5) 72 (59.0) 76 (62.8) 68 (56.7) 294 (60.7)
Weight (kg) 79.0 (67.0, 90.4) 80.0 (17.8)
76.1 (64.3, 87.3) 76.9 (17.1)
77.0 (64.3, 88.0) 78.4 (17.8)
75 (67.1, 91.9) 79.6 (20.6)
77.0 (66.0,89.0) 78.7 (18.4)
Age (years) 42.0 (30.0 , 52.0) 42.4 (14.3)
39.0 (29.0, 53.0) 41.8 (14.9)
40.0 (30.0, 50.0) 40.5 (13.1)
39.0 (31.0, 50.0) 40.3 (13.3)
40.0 (30.0, 52.0) 41.3 (13.9)
Albumin (g/dL) 4.1 (3.9, 4.3) 4.1 (0.4)
4.1 (3.8, 4.3) 4.0 (0.4)
4.1 (3.8, 4.4) 4.1 (0.4)
4.1 (3.9, 4.2) 4.1 (0.3)
4.1 (3.8, 4.3) 4.1 (0.4)
C-reactive protein (mg/dL)
0.9 (0.2, 1.7) 1.4 (1.9)
1.0 (0.4, 1.7) 1.6 (2.3)
0.8 (0.2, 1.5) 1.3 (2.3)
0.6 (0.2, 1.3) 1.4 (2.2)
0.8 (0.2, 1.6) 1.4 (2.2)
Disease duration (yrs) 4.1 (2.3, 7.3) 5.9 (5.4)
5.9 (2.8, 11.0) 8.5 (8.1)
5.2 (2.6, 9.2) 6.7 (5.3)
4.8 (2.4, 8.7) 6.5 (5.8)
4.9 (2.5, 9.0) 6.9 (6.3)
Mayo score (0-12) 9.0 (7.0, 10.0) 8.5 (1.7)
8.5 (7.0, 9.0) 8.4 (1.4)
8.0 (7.0, 9.0) 8.3 (1.5)
8.0 (7.0, 9.0) 8.3 (1.6)
8.0 (7.0 , 9.0) 8.4 (1.6)
Positive antibody-to-infliximab status, n (%)
9 (7.4) 5 (4.2) 13 (10.7) 6 (5.0) 33 (6.8)
Immunomodulator use, n (%)
66 (54.5) 59 (48.4) 52 (43.0) 50 (41.7) 227 (46.9)
Corticosteroid use, n (%)
70 (57.9) 73 (59.8) 60 (49.6) 66 (55.0) 269 (55.6)

MANUSCRIP
T
ACCEPTED
ACCEPTED MANUSCRIPT
2
Supplemental Table S2. Multivariable logistic regression analysis results for induction and maintenance of clinical response in adult patients with ulcerative colitis treated with infliximab 5 or 10 mg/kg in ACT-1 and ACT-2.
Variable Odds ratio (95% confidence interval)
P value
Induction model (dependent variable: clinical response at week 8) Infliximab concentration at week 8* 1.24 (1.05, 1.46) .011 Body weight 1.02 (1.00, 1.03) .015 Sex (female vs. male) 2.55 (1.56, 4.20) .0002 Maintenance model (dependent variable: clinical response at week 30) Infliximab concentration at week 30* 1.38 (1.23,1.54) < .0001 Corticosteroid use at baseline 0.46 (0.29, 0.75) .0015 *Log-transformed concentration

MANUSCRIP
T
ACCEPTED
ACCEPTED MANUSCRIPT
3
Figure S1. Infliximab dosing and pharmacokinetic sampling scheme for ACT-1 and ACT-2. Open
circles and squares indicate treatment with infliximab 5 mg/kg or 10 mg/kg, respectively.
Figure S2. Distribution of infliximab concentrations among patients treated with infliximab 5 or
10 mg/kg in ACT-1 and ACT-2. CPW2, CPW6, CW8, CPW14, CPW30, and CPW54 (ACT 1 only)
represent serum infliximab concentrations at weeks 2, 6, 8, 14, 30, and 54, respectively; all preinfusion
with the exception of week 8. Box plots below show median (solid line in box), interquartile range
(upper and lower boundaries of box), mean (dotted line), and distribution of individual patient
concentrations (circles).
Figure S3. Proportion of patients achieving efficacy outcomes by serum infliximab concentration
quartiles in ACT-1 and ACT-2 for the 5-mg/kg treatment group at induction week 8 (A),
maintenance week 30 (B), and maintenance week 54 (C; ACT-1 only). The trend of the proportion of
patients achieving clinical outcomes across the quartiles was evaluated using the 1-sided Cochrane-
Armitage trend test.
Figure S4. Proportion of patients achieving clinical response by serum infliximab concentration
quartiles in ACT-1 and ACT-2 stratified by dose regimen at induction week 8 (A) and
maintenance week 30 (B). The trend of the proportion of patients achieving clinical outcomes across
the quartiles was evaluated using the 1-sided Cochrane-Armitage trend test.
Figure S5. The influence of serum infliximab concentration on subsequent efficacy outcome for
the combined 5- and 10-mg/kg infliximab doses. Median serum infliximab concentrations at weeks
30, 14, and 8 are shown for patients who did and did not achieve clinical remission at weeks 54 (ACT-1

MANUSCRIP
T
ACCEPTED
ACCEPTED MANUSCRIPT
4
only), 30 , and 30, respectively (A-C) and proportions of patients in clinical remission at weeks 54
(ACT-1 only), 30, and 30 by serum infliximab concentration quartiles at weeks 30, 14, and 8,
respectively, among patients in remission at weeks 30, 8, and 8, respectively (D-F). For all panels, the 5-
and 10-mg/kg doses of infliximab are combined.
Figure S6. The influence of serum infliximab concentration on subsequent efficacy outcome by
infliximab dose. Median serum infliximab concentrations at week 30 are shown for patients who did
and did not achieve clinical remission at week 54 (ACT-1 only) for patients receiving infliximab
5 mg/kg (A) and 10 mg/kg (B) and proportions of patients in clinical remission at week 54 (ACT-1 only)
by serum infliximab concentration quartiles at week 30 among patients in remission at week 30 for
patients receiving infliximab 5 mg/kg (C) and 10 mg/kg (D).

MANUSCRIP
T
ACCEPTED
ACCEPTED MANUSCRIPT
Week 0
Week 2
Week 6
Week 8
Week 14
Week 22
Week 30
Week 38
Week 42
Week 46
Week 54
Infliximab
5 mg/kg
(N = 121)
ACT-1
Infliximab
10 mg/kg
(N = 122)
Blood sampling (immediately before or 1 hour after infusion).
Infliximab
5 mg/kg
(N = 121)
ACT-2
Infliximab
10 mg/kg
(N = 120)
024
8_v2

MANUSCRIP
T
ACCEPTED
ACCEPTED MANUSCRIPT
Infliximab 5 mg/kg
*ACT-1 only
Infliximab 10 mg/kg
2CPW
Infusion
n = 240 233 230 208 190 78 238 225 216 201 184 80
6 8 14 30 54* 2 6 8 14 30 54*
Seru
m inflix
ima
b c
on
ce
ntr
atio
n µ
g/m
L)
< 0.1
1
10
100
1000
10000
024
9

MANUSCRIP
T
ACCEPTED
ACCEPTED MANUSCRIPT
Clinical
response
Mucosal
healing
Clinical
remission
0
20
40
60
80
100
Induction Week 8AP
rop
ort
ion
of
patie
nts
(%
)
02
50
_v2
Clinical
response
Mucosal
healing
Clinical
remission
0
20
40
60
80
100
Maintenance Week 30B
Pro
po
rtio
n o
f p
atie
nts
(%
)
02
51_v2
Clinical
response
Mucosal
healing
Clinical
remission
0
20
40
60
80
100
Maintenance Week 54C
Pro
po
rtio
n o
f p
atie
nts
(%
)
02
52
_v2
P < .001 P < .001
P < .05
P < .001 P < .0001
P < .0001
P < .001 P < .001
P < .01
< 21.3 µg/mL (n = 57)
21.3 to < 33.0 µg/mL (n = 58)
33.0 to < 47.9 µg/mL (n = 57)
≥ 47.9 µg/mL (n = 58)
0.1 µg/mL (n = 48)
> 0.1 to < 2.4 µg/mL (n = 47)
2.4 to < 6.8 µg/mL (n = 47)
≥ 6.8 µg/mL (n = 48)
< 1.4 µg/mL (n = 19)
> 1.4 to < 3.6 µg/mL (n = 20)
3.6 to < 8.1 µg/mL (n = 19)
≥ 8.1 µg/mL (n = 20)
52.6
69.0
75.481.0
45.6
56.9
71.9
79.3
26.3
37.943.9 43.1
47.953.2
76.672.9
43.844.7
83.0
75.0
14.6
25.5
59.6
52.1
31.6
70.0
94.7
75.0
36.8
65.0
94.7
80.0
21.1
55.0
79.0
60.0

MANUSCRIP
T
ACCEPTED
ACCEPTED MANUSCRIPT
5 mg/kg
n = 57 58 57 58 54 54 54 54
0
20
40
60
80
100
Clinical Response at Week 8AP
rop
ort
ion o
f p
atie
nts
(%
)
02
53
_v5
10 mg/kg
5 mg/kg 10 mg/kg
52.6
69.075.4
81.0
50.0
68.5
79.685.2
n = 48 47 47 48 46 45 47 46
0
20
40
60
80
100
Clinical Response at Week 30B
Pro
po
rtio
n o
f p
atie
nts
(%
)
02
54
_v5
47.953.2
76.672.9
41.3
60.0
89.4 91.3
P < .0001P < .0001
P < .0001
P < .0001
< 2.2 µg/mL
2.2 to < 6.5 µg/mL
6.5 to < 15.8 µg/mL
≥ 15.8 µg/mL
0.1 µg/mL
> 0.1 to < 2.4 µg/mL
2.4 to < 6.8 µg/mL
≥ 6.8 µg/mL
< 44.4 µg/mL
44.4 to < 75.3 µg/mL
75.3 to < 101.4 µg/mL
≥ 101.4 µg/mL
< 21.3 µg/mL
21.3 to < 33.0 µg/mL
33.0 to < 47.9 µg/mL
≥ 47.9 µg/mL

MANUSCRIP
T
ACCEPTED
ACCEPTED MANUSCRIPTInfliximab Concentration at Week 30A
Me
dia
n in
flix
ima
b
co
nce
ntr
atio
n (
µg
/mL)
03
52
_v2
Infliximab Concentration at Week 14B
Me
dia
n in
flix
ima
b
co
nce
ntr
atio
n (
µg
/mL)
03
53
_v2
Infliximab Concentration at Week 8C
Me
dia
n in
flix
ima
b
co
nce
ntr
atio
n (
µg
/mL)
03
54
_v2
Proportion of Patients in Remission at Week 54
by Infliximab Concentration Quartiles at Week 30;
Patients in Remission at Week 30
D
% in R
em
issio
n a
t W
ee
k 5
4
03
55
_v4
Proportion of Patients in Remission at Week 30
by Infliximab Concentration Quartiles at Week 14;
Patients in Remission at Week 8
E
% in R
em
issio
n a
t W
ee
k 3
0
03
56
_v4
Proportion of Patients in Remission at Week 30
by Infliximab Concentration Quartiles at Week 8;
Patients in Remission at Week 8
F
% in R
em
issio
n a
t W
ee
k 3
0
03
57_v4
0
2
4
6
8
10
12
8.4
3.2
10.9
N = 85 N = 17 N = 68
Patients in
remission at
Week 30
Patients not in
remission at
Week 54
Patients in
remission at
Week 54
N = 21
<3.5
N = 21
3.5 to
<8.4
Infliximab concentration at Week 30 (µg/mL)
N = 21
8.4 to
<16.7
N = 22
≥16.7
0
2
4
6
8
10
12
N = 154 N = 52 N = 102
Patients in
remission at
Week 8
Patients not in
remission at
Week 30
Patients in
remission at
Week 30
N = 158 N = 54 N = 104
Patients in
remission at
Week 8
Patients not in
remission at
Week 30
Patients in
remission at
Week 30
8.2
5.1
10.1
0
10
20
30
40
50
60
70
49.0
41.0
59.0
0
20
40
60
80
100
52.4
P = 0.0046P = 0.0041
P = 0.0012
P = 0.0041
90.5 90.586.4
N = 38
<3.3
N = 39
3.3 to
<8.2
Infliximab concentration at Week 14 (µg/mL)
N = 38
8.2 to
<16.2
N = 39
≥16.2
0
20
40
60
80
100
P = 0.0010
N = 39
<32.1
N = 40
32.1 to
<49.0
Infliximab concentration at Week 8 (µg/mL)
N = 39
49.0 to
<89.6
N = 40
≥89.6
0
20
40
60
80
100
P = 0.0011
47.4
69.263.2
84.6
51.3
60.0
69.2
82.5

MANUSCRIP
T
ACCEPTED
ACCEPTED MANUSCRIPTInfliximab Concentration at Week 30
5 mg/kg Treatment GroupA
Me
dia
n in
flix
ima
b
co
nce
ntr
atio
n (
µg
/mL)
04
25
Infliximab Concentration at Week 30
10 mg/kg Treatment GroupB
Me
dia
n in
flix
ima
b
co
nce
ntr
atio
n (
µg
/mL)
04
26
Proportion of Patients in Remission at Week 54 by
Infliximab Concentration Quartiles at Week 30; Patients
in Remission at Week 30 (5 mg/kg Treatment Group)
C
% in R
em
issio
n a
t W
ee
k 5
4
04
27
Proportion of Patients in Remission at Week 54 by
Infliximab Concentration Quartiles at Week 30; Patients
in Remission at Week 30 (10 mg/kg Treatment Group)
D
% in R
em
issio
n a
t W
ee
k 5
4
04
28
N = 41 N = 9 N = 32
Patients in
remission at
Week 30
Patients not in
remission at
Week 54
Patients in
remission at
Week 54
N = 10
<2.8
N = 10
2.8 to
<5.2
Infliximab concentration at Week 30 (µg/mL)
N = 10
5.2 to
<13.7
N = 11
≥13.7
N = 44 N = 8 N = 36
Patients in
remission at
Week 30
Patients not in
remission at
Week 54
Patients in
remission at
Week 54
0
20
40
60
80
100
N = 11
<7.2
N = 11
7.2 to
<12.1
Infliximab concentration at Week 30 (µg/mL)
N = 11
12.1 to
<18.1
N = 11
≥18.1
0
20
40
60
80
100
0
2
4
6
8
10
12
14
0
2
4
6
8
10
12
14
5.2
2.7
6.0
12.1
4.1
13.5
50.0
80.0
100.0
81.8
54.6
90.9
81.8
100.0
P = 0.0256
P = 0.0475
P = 0.0055
P = 0.0072
Copyright © 2022 FDOKUMEN