Assigning Dates to Thin Gneissic Veins in High-Grade Metamorphic Terranes: A Cautionary Tale from...
28
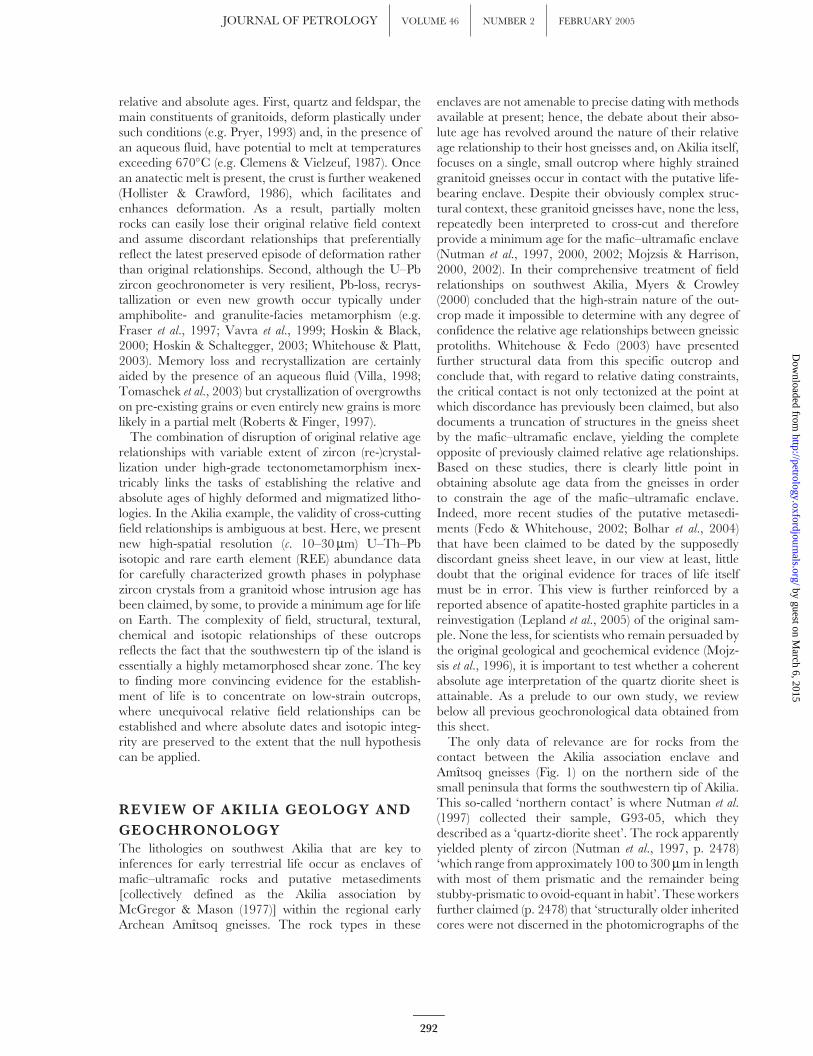
Assigning Dates to Thin Gneissic Veins in High-Grade Metamorphic Terranes: A Cautionary Tale from Akilia, Southwest Greenland MARTIN J. WHITEHOUSE 1 * AND BALZ S. KAMBER 2 1 SWEDISH MUSEUM OF NATURAL HISTORY, BOX 50007, SE-104 05 STOCKHOLM, SWEDEN 2 ADVANCED CENTRE FOR QUEENSLAND UNIVERSITY ISOTOPE RESEARCH EXCELLENCE (ACQUIRE), UNIVERSITY OF QUEENSLAND, ST LUCIA, QLD 4072, AUSTRALIA RECEIVED MAY 7, 2004; ACCEPTED SEPTEMBER 6, 2004 ADVANCE ACCESS PUBLICATION NOVEMBER 19, 2004 A granodiorite from Akilia, southwest Greenland, previously suggested to date putative life-bearing rocks to 384 Ga, is re- investigated using whole-rock major and trace-element geochemistry, and detailed cathodoluminescence image-guided secondary ion mass spectrometer analyses of zircon U–Th–Pb and rare earth elements. Complex zircon internal structure reveals three episodes of zircon growth and/or recrystallization dated to c.384 Ga, 362 Ga and 271 Ga. Rare earth element abundances imply a significant role for garnet in zircon generation at 362 Ga and 271 Ga. The 362 Ga event is interpreted as partial melting of a c.384 Ga grey gneiss precursor at granulite facies with residual garnet. Migration of this 362 Ga magma (or melt–crystal mush) away from the melt source places a maximum age limit on any intrusive relationship. These early Archaean relationships have been complicated further by iso- topic reworking in the 271 Ga event, which could have included a further episode of partial melting. This study highlights a general problem associated with dating thin gneissic veins in polyphase metamorphic terranes, where field relationships may be ambiguous and zircon inheritance can be expected. KEY WORDS: Archaean; geochronology; Greenland; secondary ion mass spectrometry; zircon INTRODUCTION A major source of controversy in the debate about the origin and evolution of life on Earth is the assignment of both relative and absolute ages to key lithologies. Indeed, the significance of actual evidence for biogenicity or for key steps of biological evolution is impossible to evaluate in cases where no consensus can be reached about relat- ive and absolute age. Nowhere is this problem more pronounced than on the island of Akilia, southwest Greenland, where evidence for Earth’s earliest life has been claimed on the basis of isotopically light carbon, occurring as graphite inclusions hosted by apatite, in a rock originally interpreted as a banded iron formation (Mojzsis et al., 1996). Since this claim was first published, several lines of evidence have emerged that question both the biogenicity and antiquity of the Akilia example, to the extent that most specialists now prefer to focus the dis- cussion about earliest life on the much better preserved and unambiguous volcano-sedimentary sequences in the (near-) contemporaneous Isua Greenstone Belt and the somewhat younger Warrawoona Group in the East Pilbara Craton. Despite this sobering outcome of the Akilia debate, many lessons can still be learnt, e.g. regarding establishment of relative and absolute age relationships of key lithologies. All lithologies on Akilia have experienced two major episodes of metamorphism at 360–365 and 271 Ga, reaching granulite and upper amphibolite facies respect- ively, as well as later thermal and minor structural over- prints. In cases where age relationships are determined with granitoid rocks, such high-T metamorphism and high-strain deformation conspire to inextricably link * Corresponding author. Telephone: þ46 8 519 551 69. Fax: þ46 8 519 540 31. E-mail: [email protected] Journal of Petrology vol. 46 issue 2 # Oxford University Press 2004; all rights reserved JOURNAL OF PETROLOGY VOLUME 46 NUMBER 2 PAGES 291–318 2005 doi:10.1093/petrology/egh075 by guest on March 6, 2015 http://petrology.oxfordjournals.org/ Downloaded from
-
Upload
independent -
Category
Documents
-
view
0 -
download
0
Transcript of Assigning Dates to Thin Gneissic Veins in High-Grade Metamorphic Terranes: A Cautionary Tale from...
Assigning Dates to Thin Gneissic Veins inHigh-Grade Metamorphic Terranes: ACautionary Tale from Akilia, SouthwestGreenland
MARTIN J. WHITEHOUSE1* AND BALZ S. KAMBER2
1SWEDISH MUSEUM OF NATURAL HISTORY, BOX 50007, SE-104 05 STOCKHOLM, SWEDEN
2ADVANCED CENTRE FOR QUEENSLAND UNIVERSITY ISOTOPE RESEARCH EXCELLENCE (ACQUIRE),
UNIVERSITY OF QUEENSLAND, ST LUCIA, QLD 4072, AUSTRALIA
RECEIVED MAY 7, 2004; ACCEPTED SEPTEMBER 6, 2004ADVANCE ACCESS PUBLICATION NOVEMBER 19, 2004
A granodiorite from Akilia, southwest Greenland, previously
suggested to date putative life-bearing rocks to �3�84 Ga, is re-investigated using whole-rock major and trace-element geochemistry,
and detailed cathodoluminescence image-guided secondary ion mass
spectrometer analyses of zircon U–Th–Pb and rare earth elements.
Complex zircon internal structure reveals three episodes of zircon
growth and/or recrystallization dated to c. 3�84 Ga, 3�62 Ga and2�71 Ga. Rare earth element abundances imply a significant role forgarnet in zircon generation at 3�62Ga and 2�71Ga. The 3�62Gaevent is interpreted as partial melting of a c. 3�84Ga grey gneiss
precursor at granulite facies with residual garnet. Migration of this
3�62 Ga magma (or melt–crystal mush) away from the melt source
places a maximum age limit on any intrusive relationship. These
early Archaean relationships have been complicated further by iso-
topic reworking in the 2�71Ga event, which could have included afurther episode of partial melting. This study highlights a general
problem associated with dating thin gneissic veins in polyphase
metamorphic terranes, where field relationships may be ambiguous
and zircon inheritance can be expected.
KEY WORDS: Archaean; geochronology; Greenland; secondary ion mass
spectrometry; zircon
INTRODUCTION
A major source of controversy in the debate about theorigin and evolution of life on Earth is the assignment of
both relative and absolute ages to key lithologies. Indeed,the significance of actual evidence for biogenicity or forkey steps of biological evolution is impossible to evaluatein cases where no consensus can be reached about relat-ive and absolute age. Nowhere is this problem morepronounced than on the island of Akilia, southwestGreenland, where evidence for Earth’s earliest life hasbeen claimed on the basis of isotopically light carbon,occurring as graphite inclusions hosted by apatite, in arock originally interpreted as a banded iron formation(Mojzsis et al., 1996). Since this claim was first published,several lines of evidence have emerged that question boththe biogenicity and antiquity of the Akilia example, to theextent that most specialists now prefer to focus the dis-cussion about earliest life on the much better preservedand unambiguous volcano-sedimentary sequences in the(near-) contemporaneous Isua Greenstone Belt and thesomewhat younger Warrawoona Group in the EastPilbara Craton. Despite this sobering outcome of theAkilia debate, many lessons can still be learnt, e.g.regarding establishment of relative and absolute agerelationships of key lithologies.
All lithologies on Akilia have experienced two majorepisodes of metamorphism at 3�60–3�65 and 2�71 Ga,reaching granulite and upper amphibolite facies respect-ively, as well as later thermal and minor structural over-prints. In cases where age relationships are determinedwith granitoid rocks, such high-T metamorphism andhigh-strain deformation conspire to inextricably link
*Corresponding author. Telephone: þ46 8 519 551 69. Fax: þ46 8
519 540 31. E-mail: [email protected]
Journal of Petrology vol. 46 issue 2 # Oxford University Press 2004;
all rights reserved
JOURNAL OF PETROLOGY VOLUME 46 NUMBER 2 PAGES 291–318 2005 doi:10.1093/petrology/egh075 by guest on M
arch 6, 2015http://petrology.oxfordjournals.org/
Dow
nloaded from
relative and absolute ages. First, quartz and feldspar, themain constituents of granitoids, deform plastically undersuch conditions (e.g. Pryer, 1993) and, in the presence ofan aqueous fluid, have potential to melt at temperaturesexceeding 670�C (e.g. Clemens & Vielzeuf, 1987). Oncean anatectic melt is present, the crust is further weakened(Hollister & Crawford, 1986), which facilitates andenhances deformation. As a result, partially moltenrocks can easily lose their original relative field contextand assume discordant relationships that preferentiallyreflect the latest preserved episode of deformation ratherthan original relationships. Second, although the U–Pbzircon geochronometer is very resilient, Pb-loss, recrys-tallization or even new growth occur typically underamphibolite- and granulite-facies metamorphism (e.g.Fraser et al., 1997; Vavra et al., 1999; Hoskin & Black,2000; Hoskin & Schaltegger, 2003; Whitehouse & Platt,2003). Memory loss and recrystallization are certainlyaided by the presence of an aqueous fluid (Villa, 1998;Tomaschek et al., 2003) but crystallization of overgrowthson pre-existing grains or even entirely new grains is morelikely in a partial melt (Roberts & Finger, 1997).
The combination of disruption of original relative agerelationships with variable extent of zircon (re-)crystal-lization under high-grade tectonometamorphism inex-tricably links the tasks of establishing the relative andabsolute ages of highly deformed and migmatized litho-logies. In the Akilia example, the validity of cross-cuttingfield relationships is ambiguous at best. Here, we presentnew high-spatial resolution (c. 10–30mm) U–Th–Pbisotopic and rare earth element (REE) abundance datafor carefully characterized growth phases in polyphasezircon crystals from a granitoid whose intrusion age hasbeen claimed, by some, to provide a minimum age for lifeon Earth. The complexity of field, structural, textural,chemical and isotopic relationships of these outcropsreflects the fact that the southwestern tip of the island isessentially a highly metamorphosed shear zone. The keyto finding more convincing evidence for the establish-ment of life is to concentrate on low-strain outcrops,where unequivocal relative field relationships can beestablished and where absolute dates and isotopic integ-rity are preserved to the extent that the null hypothesiscan be applied.
REVIEW OF AKILIA GEOLOGY AND
GEOCHRONOLOGY
The lithologies on southwest Akilia that are key toinferences for early terrestrial life occur as enclaves ofmafic–ultramafic rocks and putative metasediments[collectively defined as the Akilia association byMcGregor & Mason (1977)] within the regional earlyArchean Am��tsoq gneisses. The rock types in these
enclaves are not amenable to precise dating with methodsavailable at present; hence, the debate about their abso-lute age has revolved around the nature of their relativeage relationship to their host gneisses and, on Akilia itself,focuses on a single, small outcrop where highly strainedgranitoid gneisses occur in contact with the putative life-bearing enclave. Despite their obviously complex struc-tural context, these granitoid gneisses have, none the less,repeatedly been interpreted to cross-cut and thereforeprovide a minimum age for the mafic–ultramafic enclave(Nutman et al., 1997, 2000, 2002; Mojzsis & Harrison,2000, 2002). In their comprehensive treatment of fieldrelationships on southwest Akilia, Myers & Crowley(2000) concluded that the high-strain nature of the out-crop made it impossible to determine with any degree ofconfidence the relative age relationships between gneissicprotoliths. Whitehouse & Fedo (2003) have presentedfurther structural data from this specific outcrop andconclude that, with regard to relative dating constraints,the critical contact is not only tectonized at the point atwhich discordance has previously been claimed, but alsodocuments a truncation of structures in the gneiss sheetby the mafic–ultramafic enclave, yielding the completeopposite of previously claimed relative age relationships.Based on these studies, there is clearly little point inobtaining absolute age data from the gneisses in orderto constrain the age of the mafic–ultramafic enclave.Indeed, more recent studies of the putative metasedi-ments (Fedo & Whitehouse, 2002; Bolhar et al., 2004)that have been claimed to be dated by the supposedlydiscordant gneiss sheet leave, in our view at least, littledoubt that the original evidence for traces of life itselfmust be in error. This view is further reinforced by areported absence of apatite-hosted graphite particles in areinvestigation (Lepland et al., 2005) of the original sam-ple. None the less, for scientists who remain persuaded bythe original geological and geochemical evidence (Mojz-sis et al., 1996), it is important to test whether a coherentabsolute age interpretation of the quartz diorite sheet isattainable. As a prelude to our own study, we reviewbelow all previous geochronological data obtained fromthis sheet.
The only data of relevance are for rocks from thecontact between the Akilia association enclave andAm��tsoq gneisses (Fig. 1) on the northern side of thesmall peninsula that forms the southwestern tip of Akilia.This so-called ‘northern contact’ is where Nutman et al.(1997) collected their sample, G93-05, which theydescribed as a ‘quartz-diorite sheet’. The rock apparentlyyielded plenty of zircon (Nutman et al., 1997, p. 2478)‘which range from approximately 100 to 300 mm in lengthwith most of them prismatic and the remainder beingstubby-prismatic to ovoid-equant in habit’. These workersfurther claimed (p. 2478) that ‘structurally older inheritedcores were not discerned in the photomicrographs of the
292
JOURNAL OF PETROLOGY VOLUME 46 NUMBER 2 FEBRUARY 2005 by guest on M
arch 6, 2015http://petrology.oxfordjournals.org/
Dow
nloaded from
analysed zircons’. As will become apparent when discuss-ing our new data, it is important to recall Nutman et al.’s(1997) statement (p. 2478) that ‘in selecting grains of themain population for analysis, the clearest (generally low-est U) grains were predominantly selected’. The clear,low-U grains analysed by Nutman et al. (1997) define astatistically relevant population with an average age of3865 � 11 Ma (2s), whereas the deeper-coloured, mostlyovoid grains yielded ages between 3630 and 3530 Ma.On the basis of the their data and observations regardingzircon morphology, size and colour, Nutman et al. (1997)concluded that the igneous protolith of the quartz-dioritegneiss sheet intruded before 3850 Ma.
Whitehouse et al. (1999) also published ion-probe U–Pbzircon data for a so-called quartz-diorite gneiss from thesame general outcrop (their sample SM/GR/97/7).They presented cathodoluminescence (CL) images ofthe prismatic, elongate zircons selected for analysis,which showed oscillatory banding and a paucity of corestructures. Ion-probe data for SM/GR/97/7 zircons didnot directly correspond to Nutman et al.’s (1997) results,either in age distribution (younger) or U-content (higher).Whitehouse et al. (1999) concluded based on their own
data and CL imaging that the bulk of the zircon consistedof igneous growth at 3650 Ma, with minor inherited coresin excess of 3�8 Ga. Not surprisingly, Nutman et al. (2001)commented on the new results and inferred thatWhitehouse et al. (1999) had either mislabelled or other-wise confused a sample, as the differences between datafor G93-05 and SM/GR/97/7 appeared too substantialto permit a common origin of both samples. In theirresponse, Whitehouse et al. (2001) confirmed that theirsampling site of SM/GR/97/7 was no more than 25 cmfrom where Nutman et al. (1997) claimed to have takenG93-05. Whitehouse et al. (2001) acknowledged the sub-stantial difference in data for zircon extracted from sam-ples in such close proximity but reiterated their originalexplanation that this could have been because of a bias inselecting grains for mounting and/or that there could betrue sample heterogeneity on a dm scale—something thatis indeed evident from the now numerous detailed mapsand photographs of the outcrop (Myers & Crowley, 2000;Nutman et al., 2000, 2002; Whitehouse & Fedo, 2003).
Subsequently, Nutman et al. (2000) published retrospec-tive CL images for zircons of G93-05, which confirmedthe paucity of the 3�6–3�7 Ga CL-zoned thick rims that
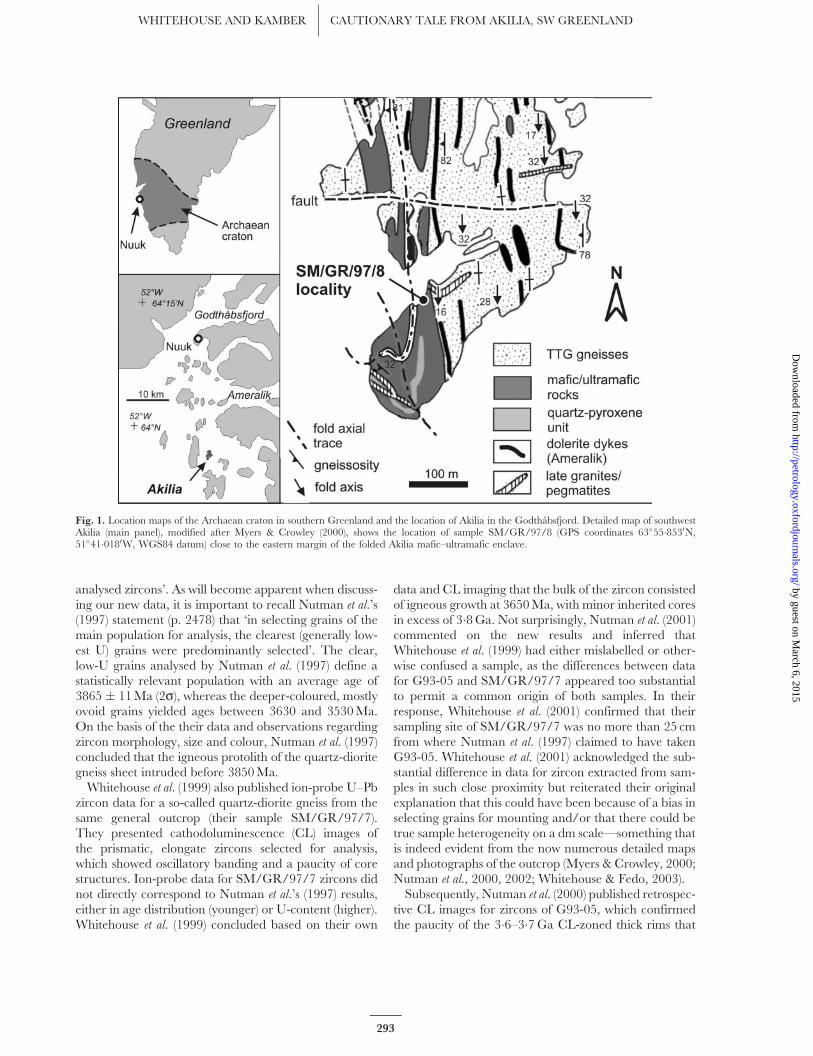
Fig. 1. Location maps of the Archaean craton in southern Greenland and the location of Akilia in the Godthabsfjord. Detailed map of southwestAkilia (main panel), modified after Myers & Crowley (2000), shows the location of sample SM/GR/97/8 (GPS coordinates 63�55�8530N,51�41�0180W, WGS84 datum) close to the eastern margin of the folded Akilia mafic–ultramafic enclave.
293
WHITEHOUSE AND KAMBER CAUTIONARY TALE FROM AKILIA, SW GREENLAND by guest on M
arch 6, 2015http://petrology.oxfordjournals.org/
Dow
nloaded from
Whitehouse et al. (1999) described from their sampleSM/GR/97/7. Nutman et al. (2000) also provided newU–Pb ion-probe dates for additional zircon grains fromG93-05. Their new data confirmed that among the grainsselected by Nutman et al. (1997), biased to large, low-U,clear, prismatic material, the pre-3�8 Ga oscillatory grainsclearly dominate. The only exception is their grain 16[shown in fig. 10 of Nutman et al. (2000)], which is astrongly zoned, but equant grain, that is clearly3�65 Ga old.
The most recently published dataset (Mojzsis &Harrison, 2002) for zircon from another sample(GR9716) from this locality, claimed to be equivalent toG93-05, has added considerably to the complexity.Unfortunately, Mojzsis & Harrison (2002) did not pro-vide CL images of their zircon. Instead, they obtainedtwo datasets using two different experimentalapproaches. One dataset was obtained by depth profilinginto the centre of a single, clear (presumably low-U)euhedral, prismatic zircon (grain GR9716_69) similar tothe majority of zircons analysed by Nutman et al. (1997,2000) from their sample G93-05. The profiling techniqueyielded clear evidence for this single grain of a 3828 �8 Ma core, mantled by a c. 3�6–3�65 Ga inner rim,which itself is mantled by a c. 2�7 Ga outer rim. Thisobservation is entirely consistent with the general picturecommonly obtained from tonalite–trondhjemite–grano-diorite (TTG) suite gneisses in the area (e.g. Whitehouseet al., 1999; Nutman et al., 2002) when dates are obtainedfrom suites of handpicked zircon grains selected for CL-image-guided U–Pb ion-probe dating. The second data-set presented by Mojzsis & Harrison (2002), however,is potentially more insightful than the depth profilingbecause it was obtained in situ in petrographic thin sec-tions. Of the 71 grains analysed, only a single grain,embedded in biotite, yielded an age in excess of 3�8 Ga.This grain (g1-1) yielded a near-concordant 207Pb/206Pbage of 4079 � 18 Ma and was interpreted by Mojzsis &Harrison (2002) as an inherited xenocryst at a relativelylate stage of protolith emplacement. This is by far theoldest zircon yet reported from the North Atlantic Cratonand has no correspondence to any other previouslystudied sample. However, the important observationfrom the in situ study is that almost all the grains analysedyielded ages between 3�5 and 3�7 Ga. This promptedMojzsis & Harrison (2002) to propose that in a �3�6 Gamigmatization event, a significant fraction ‘(�50%?)’ ofthe protolith zircon dissolved and re-precipitated via par-tial melting, dissolution–reprecipitation or Ostwaldripening. However, provided that the dated zircons inthis section are representative of the rock’s entire popula-tion (i.e. only one grain in 71 analysed is older than3�8 Ga), the estimate of the fraction of reworked zirconsought to be moved upward from ‘(�50%?)’ to �98%.Although the in situ method has obvious advantages for
preserving the petrographic enviroment of the analysedzircon, it should be realized that unlike separated zircongrain mounts, where polishing is optimized to reveal asmuch internal structure as possible, the zircon surfaceexposed in a thin section is essentially random. Withoutadditional control of CL (or BSE) imaging, application ofthis technique to potentially complex zircons will inevi-tably yield ambiguous results owing to mixing of differentgrowth phases. Indeed, a plot of Th/U against apparentage [fig. 7 of Mojzsis & Harrison (2002)] shows poorcorrespondence between in situ analyses and results of anearlier (Mojzsis & Harrison, 2000) grain mount study onthe very same sample. The apparent paucity of >3�8 Gazircon growth zones in the grains exposed in the thinsection studied by Mojzsis & Harrison (2002) could thuspartly stem from overlapping the primary ion beam ontoubiquitous younger mantles around old cores.
When the entire zircon evidence from this locality isconsidered, two obvious implications for further studies(such as ours) emerge. First, there appears to be verysignificant sample heterogeneity on the dm-scale as faras the distribution of zircon with different age, structureand chemistry is concerned. Only this can explain whyNutman et al. (1997) obtained a maximum age of 3865 �11 Ma [later revised to 3841 � 6 Ma by Nutman et al.(2000)], and Mojzsis & Harrison (2002) determined (froma single grain) a slightly younger age of 3828 � 8 Ma,whereas Whitehouse et al. (1999) found only a single> 3�8 Ga age from the core of a c. 3�65 Ga grain. As itis physically impossible to sample exactly the same mate-rial as previous workers (unless a concerted effort is madeto obtain a single large sample that is later split intoaliquots and distributed to different laboratories), we havereprocessed one of our samples (SM/GR/97/8, takenimmediately adjacent to SM/GR/97/7) which we nowbelieve corresponds to the original G93-05 [see discus-sion also by Whitehouse & Fedo (2003)] in an effort toobtain a higher yield of zircon for a new imaging anddating session. The second implication is that irrespectiveof the heterogeneity in zircon distribution, it is obviousthat the selection of rare, clear (low-U), prismatic grainsfor ion-probe analysis very strongly biases to the oldestgrains. The picture gained from such grains is not atall representative of the entire zircon population.Although this bias may be logical and intentional whendirected towards estimating the potential age of a pre-metamorphic protolith, it can be misleading with regardto the geological history experienced by a sample. In thecase of the much-discussed Akilia locality, the question isclearly that of how old the relative field relationships are(which some interpret as igneous cross-cutting), and it is,therefore, critically important to test whether these rocksunderwent significant, pervasive partial melting thatwould have obliterated older structural relationships per-taining to their original, magmatic emplacement. For this
294
JOURNAL OF PETROLOGY VOLUME 46 NUMBER 2 FEBRUARY 2005 by guest on M
arch 6, 2015http://petrology.oxfordjournals.org/
Dow
nloaded from
reason, we have tried to select the complete variety ofzircon present in these rocks, and to analyse the variousgrowth and recrystallization domains observed in the CLimages. Furthermore, building on our previous work(Whitehouse & Kamber, 2002, 2003), we have obtainedREE compositional data for the dated zircon spots.
SAMPLING
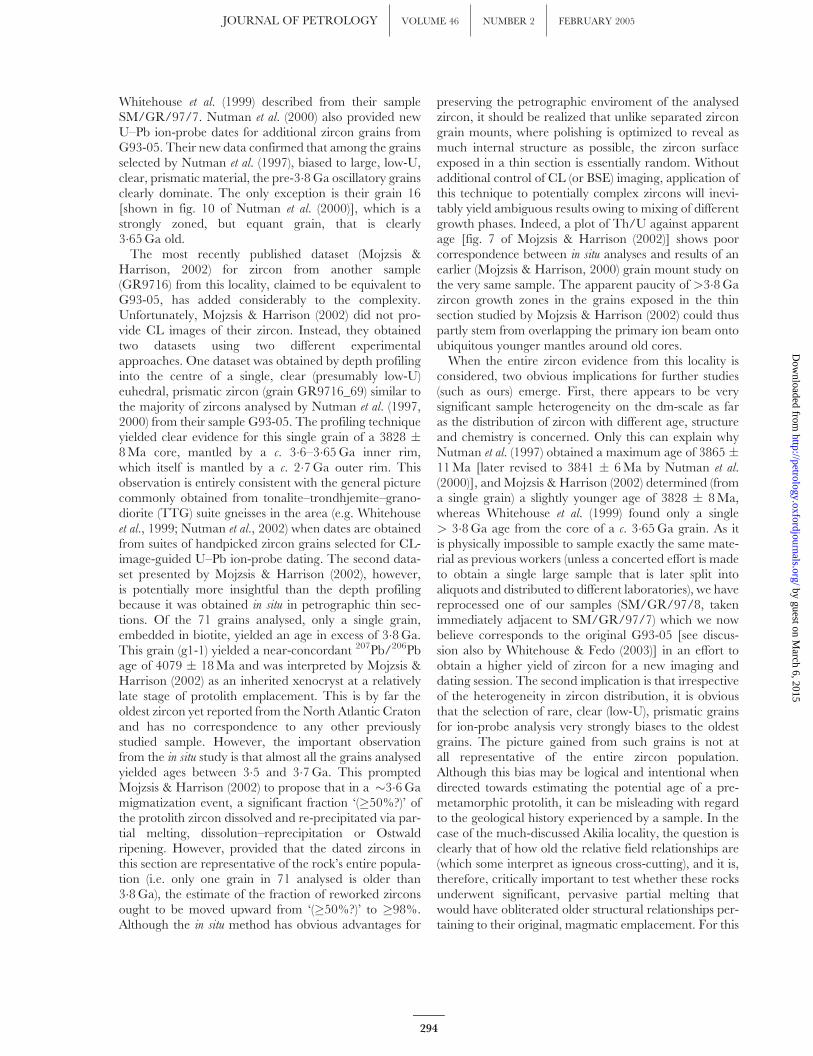
The sample studied here, SM/GR/97/8, was collectedfrom the northern contact locality (Fig. 1) by S. Moorbathin the company of the late V. R. McGregor and S. J.Mojzsis. It is closely related spatially to sample SM/GR/97/7 of Whitehouse et al. (1999), coming from <25 cmwest across regional strike of that sample. Whitehouse &Fedo (2003) noted that the latter sample preserves gneis-sic banding in thin section, whereas SM/GR/97/8 isessentially homogeneous (Fig. 2), with equigranularquartz and feldspar mosaic texture implying largely sta-tic, post-deformational recrystallization. This led them tosuggest that SM/GR/97/8 is the most likely equivalentof the so-called ‘homogeneous tonalite’ sheet worked onby Nutman et al. (1997, 2000) and Mojzsis & Harrison(2000, 2002), with SM/GR/97/7 representing thebanded gneiss immediately adjacent to the east, which,they noted, in places, appears to be cross-cut by the homo-geneous sheet [see fig. 4d of Whitehouse & Fedo (2003)].
ANALYTICAL METHODS
High spatial resolution U–Th–Pb and REE data weregenerated using a Cameca IMS1270 large-format ionmicroprobe at the Nordsim facility, Swedish Museum ofNatural History. Detailed analytical methods have beendescribed previously for U–Th–Pb (Whitehouse et al.,1997, 1999) and REE (Whitehouse & Kamber, 2003;Whitehouse & Platt, 2003). In all cases, a defocused O2-primary beam was used to project the image of either a100mm or a 50 mm aperture onto the sample, generatingelliptical, flat-bottomed craters of nominal c. 30mm andc. 15mm (long axis), respectively. For some analyses, thespatial resolution was further enhanced by use of the fieldaperture in the secondary ion optics, restricting the actualanalysed region admitted to the mass spectrometer to ac. 11mm square on the illuminated object, regardless ofthe size of primary probe. Complete U–Th–Pb analyses ata mass resolution (M/DM) of c. 5000 were performedusing a peak switching routine, with a single ion-countingelectron multiplier (EM) as the detection device. Anenergy window of 60 eV was used throughout, withenergy adjustments made using the 90Zr2
16O peak. Pre-cise mass calibration was maintained by using an auto-matic routine in the Cameca CIPS software to scan overlarge peaks and extrapolate the mass to B-field curve for
peaks between these reference points (e.g. Pb-isotopeswere calibrated by centring the 94Zr2
16O peak at nominalmass 204 and the 177Hf16O2 peak at nominal mass 209).Pb/U ratios, elemental concentrations and Th/U ratioswere calibrated relative to the Geostandards zircon91500 reference, which has an age of 1065 Ma(Wiedenbeck et al., 1995). In some cases, particularly thehighest spatial resolution analyses of very small zircondomains, only Pb-isotopic ratios were measured usingeither a short mono-collection peak-switching routine,or a multi-collection routine using four ion-countingEMs positioned at the appropriate mass spacing andoperating at a mass resolution of c. 8000 (determinedby the fixed exit slit width of the multicollector system).For the multicollector measurements, the relativeefficiencies of the EMs were first matched as closely as
(a)
hbl
hbl
bi
bi
qtz
qtz
pl
pl
(b)
(c)
Fig. 2. Thin section images comparing texture of (a) granodiorite,SM/GR/97/8 (scale bar represents 4 mm) and (b) adjacent gneiss,SM/GR/97/7 (scale bar represents 2 mm). Note strong millimetre-scale banding in (b) defined primarily by hornblende. (c) Photomicro-graph (plane-polarized light) of SM/GR/97/8 showing equigranular,mosaic recrytstallization texture of quartz (qtz) and feldspar (pl),together with hornblende (hbl) and biotite (bi) laths, the latter defininga slight foliation; field of view is c. 2 mm � 3 mm.
295
WHITEHOUSE AND KAMBER CAUTIONARY TALE FROM AKILIA, SW GREENLAND by guest on M
arch 6, 2015http://petrology.oxfordjournals.org/
Dow
nloaded from
possible using pulse height analysis to set appropriatehigh voltage and thresholds, and then calibrated by directmeasurement on the NIST SRM610 standard, assumingthe composition determined by TIMS (Belshaw et al.,1994). Decay constants follow the recommendations ofSteiger & J€aager (1977).
Simultaneous high mass resolution ion counting wasalso used for most of the analyses of Light REE (LREE)(La–Eu) coupled with low mass resolution, energy filteredmono-collection measurements of the middle to heavyREE (MREE to HREE) following the method detailed byWhitehouse & Kamber (2003) and Whitehouse (2004).For a few analyses, selected high-abundance HREE (i.e.Sm, Gd, Dy, Er, Yb) were also analysed at high massresolution using simultaneous ion counting, with a singlepeak switch to measure 92Zr28Si16O2 at nominal mass152 as a matrix reference peak. REE abundances werenormalized relative to NIST SRM610 [working values ofPearce et al. (1996)] with the exception of the multi-collector HREE measurements where the Geostandards91500 zircon was used, assuming the concentrationsdetermined by Whitehouse & Platt [2003; these werethemselves calibrated against NIST SRM610 in thisearlier study, ensuring compatibility of the datasetsgenerated by the different methods; furthermore, theseconcentrations are in good agreement with the ‘workingvalues’ of Wiedenbeck et al. (2004)]. Tables 2 and 3 pre-sent the U–Th–Pb and REE analytical data, respectively,and also document the spatial resolution and methodused for each analysis.
Cathodoluminescence images of zircon were obtainedusing a Hitachi S4300 scanning electron microscope atthe Swedish Museum of Natural History.
Whole-rock major and trace-element analyses of SM/GR/97/8 were obtained from an aliquot that was milledin tungsten carbide at Oxford University. No data for Wand Ta are reported because of contamination from themill. Major element compositions were determined at theDepartment of Earth Sciences (UQ) by ICP–OES from asolution obtained by dissolving a fused bead. Results arereported in Table 1. Trace-element analysis was per-formed at the ACQUIRE laboratory (UQ) by ICP–MSfrom a solution obtained by digesting the sample in asteel-jacketed PTFE (Teflon), vessel. Data are reported inTable 1. Analytical details were the same as thosereported by Kamber et al. (2003).
RESULTS
Whole-rock major and trace-elementgeochemistry
At least a part of the confusion regarding equivalence ofsamples from this outcrop stems from the disparatepetrographic names assigned by various workers. The
original sample, G93-05, was called a ‘quartz-diorite’by Nutman et al. (1997), a term also adopted byWhitehouse et al. (1999) for their sample, SM/GR/97/7,but was later referred to as a homogeneous ‘tonalite’ by
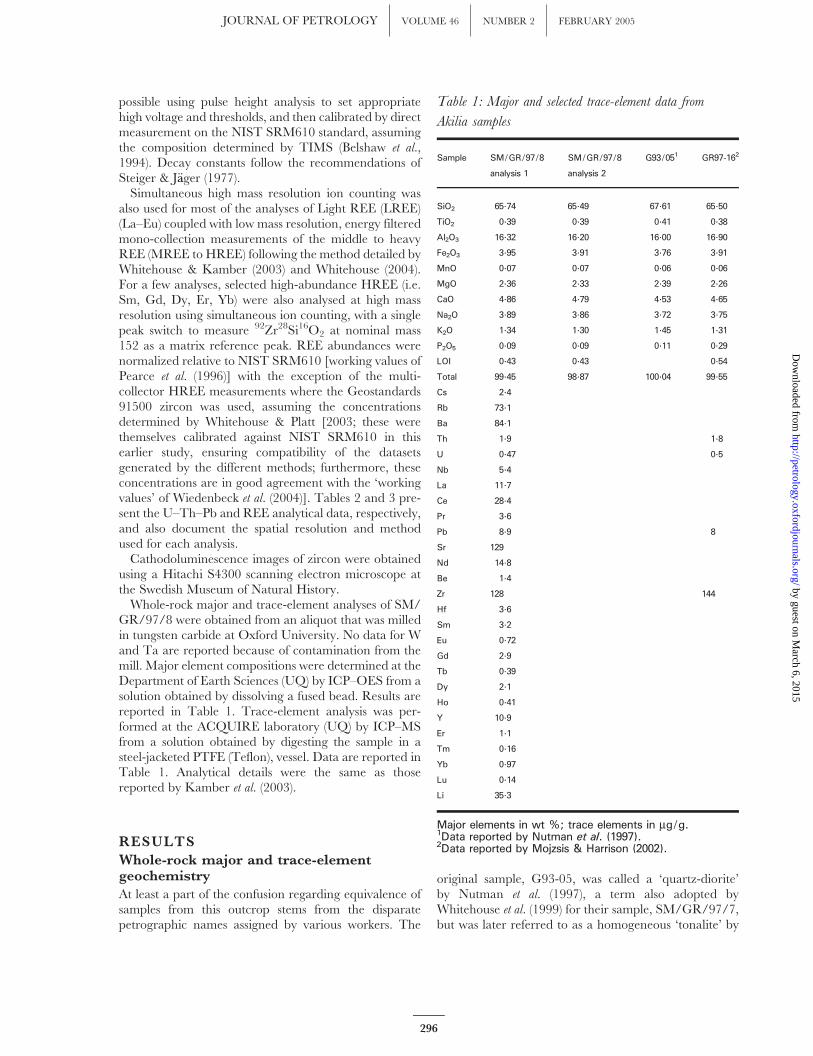
Table 1: Major and selected trace-element data from
Akilia samples
Sample SM/GR/97/8 SM/GR/97/8 G93/051 GR97-162
analysis 1 analysis 2
SiO2 65.74 65.49 67.61 65.50
TiO2 0.39 0.39 0.41 0.38
Al2O3 16.32 16.20 16.00 16.90
Fe2O3 3.95 3.91 3.76 3.91
MnO 0.07 0.07 0.06 0.06
MgO 2.36 2.33 2.39 2.26
CaO 4.86 4.79 4.53 4.65
Na2O 3.89 3.86 3.72 3.75
K2O 1.34 1.30 1.45 1.31
P2O5 0.09 0.09 0.11 0.29
LOI 0.43 0.43 0.54
Total 99.45 98.87 100.04 99.55
Cs 2.4
Rb 73.1
Ba 84.1
Th 1.9 1.8
U 0.47 0.5
Nb 5.4
La 11.7
Ce 28.4
Pr 3.6
Pb 8.9 8
Sr 129
Nd 14.8
Be 1.4
Zr 128 144
Hf 3.6
Sm 3.2
Eu 0.72
Gd 2.9
Tb 0.39
Dy 2.1
Ho 0.41
Y 10.9
Er 1.1
Tm 0.16
Yb 0.97
Lu 0.14
Li 35.3
Major elements in wt %; trace elements in mg/g.1Data reported by Nutman et al. (1997).2Data reported by Mojzsis & Harrison (2002).
296
JOURNAL OF PETROLOGY VOLUME 46 NUMBER 2 FEBRUARY 2005 by guest on M
arch 6, 2015http://petrology.oxfordjournals.org/
Dow
nloaded from
Nutman et al. (2000). Mojzsis & Harrison (2002) referredto their supposedly equivalent sample GR9716 also astonalite. Major and selected trace-element (Zr, Pb, U,Th) compositions of these samples are listed in Table 1alongside that of our sample, SM/GR/97/8.
We note the close correspondence of all analyses fromthese samples, in accord with our belief that they doindeed originate from the same, homogeneous part ofthe gneiss sheet. The normative mineralogy calculatedfrom bulk-rock composition also indicates that all threesamples are in fact granodiorites according to thewidely accepted IUGS classification of plutonic rocks(Streckeisen, 1976; le Maitre, 2002), richer in quartz(c. 27%) than quartz-diorite (5–20%) and lower inplagioclase as a proportion of total feldspar (c. 85%)than tonalite (90–100%). On this basis, we use grano-diorite throughout this paper. We note, however, thatalthough quartz-diorite is definitely an inappropriatename, use of other plutonic rock-classification schemesadds ambiguity to the distinction between granodioriteand tonalite. In an ab–an–or diagram (Barker, 1979), thepercentage of normative orthoclase (c. 14%) means thatall three analyses plot within the tonalite field. The use ofnormative mineralogy in classification schemes such asQAP or ab–an–or that are intended principally for modalmineralogy can introduce additional ambiguity whendealing with hydrated rocks (SM/GR/97/8 containsabundant modal biotite) because of the tendency ofnorms to assign K entirely to orthoclase and to consideronly orthoclase as an alkali feldspar. In the only com-monly used classification scheme that utilizes elementalabundances instead of normative or modal mineralogy,the R1–R2 cation proportion scheme of de la Roche et al.(1980), these analyses fall on the boundary between thegranodiorite and tonalite field.
This confusion over precise petrographic name is farfrom trivial when set against the backdrop of argumentsabout zircon saturation and the ability of melts to retaininherited zircon that has long been a feature of the Akiliageochronology debate. As noted recently by Hanchar &Watson (2003), the actual Zr-concentration and cationratio (Na þ K þ 2Ca)/(AlSi) value (M) have only a smallinfluence on zircon saturation temperature (� a few tensof �C), the most significance factor being the assumedtemperature of crystallization. The higher magmatictemperature expected for a tonalite implies a greaterability to dissolve xenocrystic zircon compared with alower-temperature granodiorite, although, as we shalldemonstrate below, several additional factors need to betaken into account in discussing zircon solubility, not theleast of which is the presence of water, which willsignificantly lower the solidus of any granitic composition.
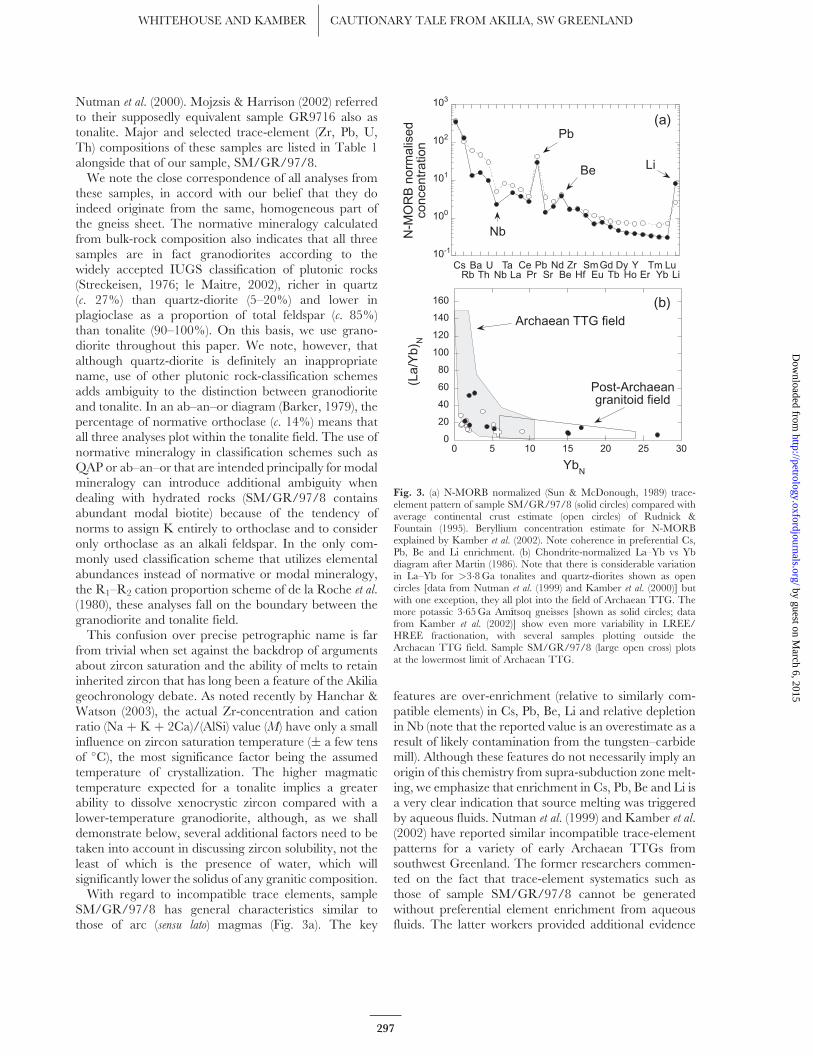
With regard to incompatible trace elements, sampleSM/GR/97/8 has general characteristics similar tothose of arc (sensu lato) magmas (Fig. 3a). The key
features are over-enrichment (relative to similarly com-patible elements) in Cs, Pb, Be, Li and relative depletionin Nb (note that the reported value is an overestimate as aresult of likely contamination from the tungsten–carbidemill). Although these features do not necessarily imply anorigin of this chemistry from supra-subduction zone melt-ing, we emphasize that enrichment in Cs, Pb, Be and Li isa very clear indication that source melting was triggeredby aqueous fluids. Nutman et al. (1999) and Kamber et al.(2002) have reported similar incompatible trace-elementpatterns for a variety of early Archaean TTGs fromsouthwest Greenland. The former researchers commen-ted on the fact that trace-element systematics such asthose of sample SM/GR/97/8 cannot be generatedwithout preferential element enrichment from aqueousfluids. The latter workers provided additional evidence
10-1
100
101
102
103
Cs
Rb
Ba
Th U Nb
Ta La Ce
Pr
Pb
Sr
Nd
Be Zr
Hf
Sm Eu
Gd
Tb
Dy
Ho Y Er
Tm Yb
Lu Li
N-M
OR
Bn
orm
alis
ed
con
cen
tra
tion
Pb
Nb
LiBe
B
0 5 10 15 20 25 300
20
40
60
80
100
120
140
160
Archaean TTG field
Post-Archaeangranitoid field
A
(a)
(b)
(La
/Yb
) N
101
100
10-1
102
103
Cs CeRb Pr
Ba PbTh Sr
U NdNb Be
Ta ZrLa Hf
SmEu
GdTb
Dy TmHo Yb
Y LuEr Li
YbN
Fig. 3. (a) N-MORB normalized (Sun & McDonough, 1989) trace-element pattern of sample SM/GR/97/8 (solid circles) compared withaverage continental crust estimate (open circles) of Rudnick &Fountain (1995). Beryllium concentration estimate for N-MORBexplained by Kamber et al. (2002). Note coherence in preferential Cs,Pb, Be and Li enrichment. (b) Chondrite-normalized La–Yb vs Ybdiagram after Martin (1986). Note that there is considerable variationin La–Yb for >3�8 Ga tonalites and quartz-diorites shown as opencircles [data from Nutman et al. (1999) and Kamber et al. (2000)] butwith one exception, they all plot into the field of Archaean TTG. Themore potassic 3�65 Ga Am��tsoq gneisses [shown as solid circles; datafrom Kamber et al. (2002)] show even more variability in LREE/HREE fractionation, with several samples plotting outside theArchaean TTG field. Sample SM/GR/97/8 (large open cross) plotsat the lowermost limit of Archaean TTG.
297
WHITEHOUSE AND KAMBER CAUTIONARY TALE FROM AKILIA, SW GREENLAND by guest on M
arch 6, 2015http://petrology.oxfordjournals.org/
Dow
nloaded from
for the role of aqueous fluids in generating the earliestpreserved continental crust. In the context of the Akiliadebate, it is very significant that trace-element distribu-tion strongly argues in favour of hydrous rather thananhydrous melting because previous consideration ofzircon solubility (Nutman et al., 1997; Mojzsis & Harrison,2002) has assumed that the igneous precursor of the stu-died rock crystallized from a ‘dry’ melt which, togetherwith inappropriate petrographic identification discussedabove, implies a much higher magmatic temperatureand, hence, ability to dissolve inherited zircon. Thispoint will be discussed in more detail after presentationof the zircon data.
A final aspect of the whole-rock geochemistry that is ofrelevance to the present study is the observation that thestudied granodiorite does not show the strong LREE overHREE enrichment that is so characteristic of typicalArchaean TTGs. In fact, the chondrite-normalized La/Yb of our sample is only 9�0, whereas the average ofreported >3�8 Ga tonalite and quartz-diorite datafrom south of the Isua Greenstone Belt is 18—almosttwice as fractionated as sample SM/GR/98/8. For thisreason, this sample only just plots into the ArchaeanTTG field (Fig 3b) defined by Martin (1986). The morepotassic 3�65 Ga Am��tsoq gneisses, reported by Kamberet al. (2002), show a bimodal distribution of chondrite-normalized La/Yb: one group with very high values ofc. 50, the other with much lower values of 6–17. Thisimplies that at least in terms of REE systematics, thestudied sample from Akilia is rather atypical for anArchaean TTG but akin to more potassic 3�65 Ga gran-itoids in the area. The origin of extreme HREE depletionin the more typical TTG may be a function of fractionalcrystallization processes rather than direct source pro-cesses as suggested by Kleinhanns et al. (2003), possiblydue in part to differing H2O-contents (Muentener et al.,2001).
Zircon populations in SM/GR/97/8
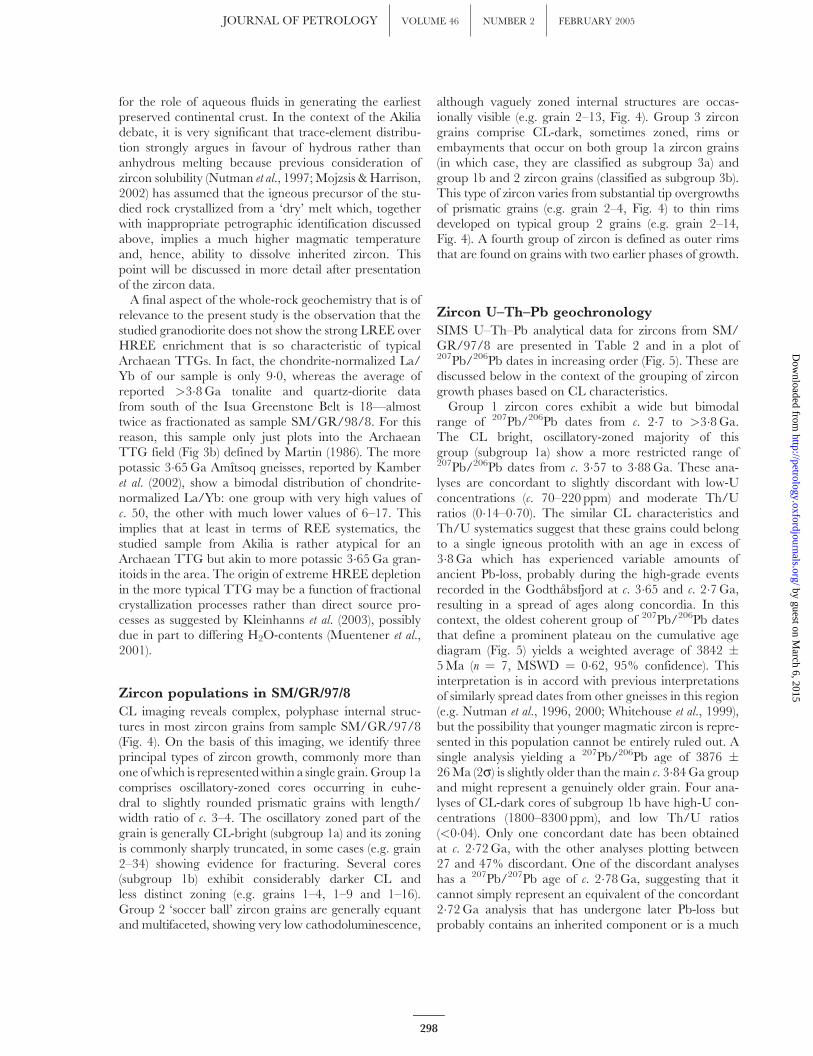
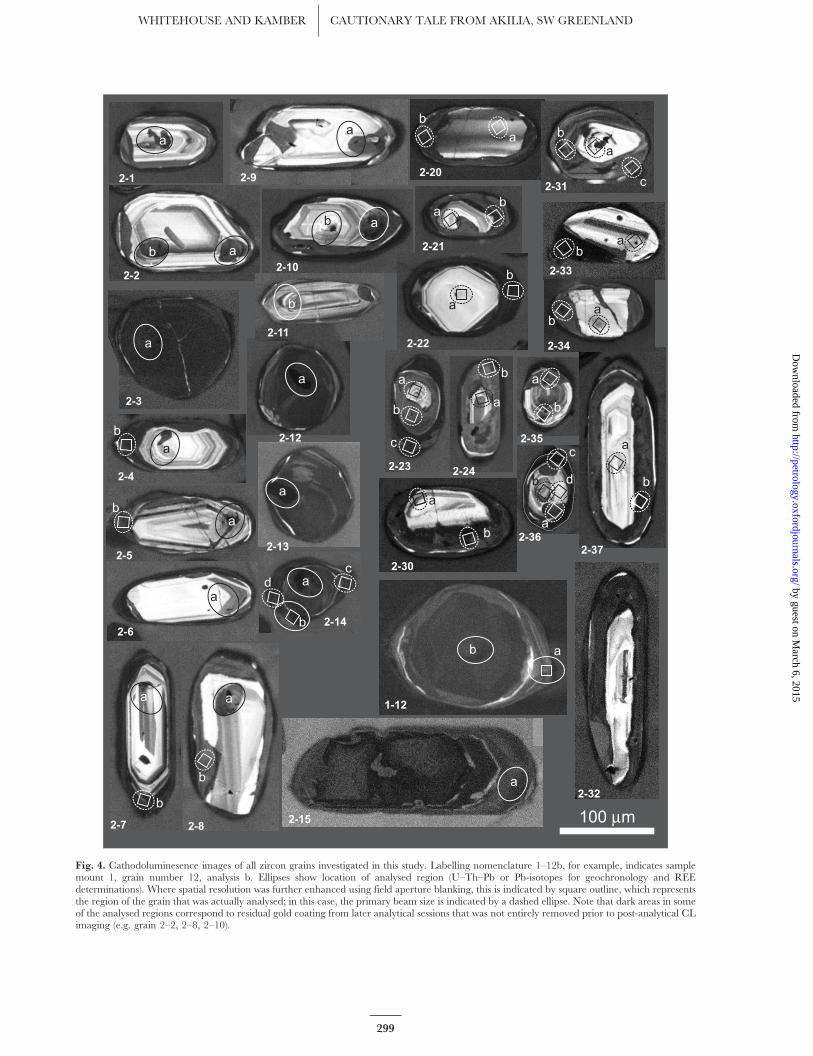
CL imaging reveals complex, polyphase internal struc-tures in most zircon grains from sample SM/GR/97/8(Fig. 4). On the basis of this imaging, we identify threeprincipal types of zircon growth, commonly more thanone of which is represented within a single grain. Group 1acomprises oscillatory-zoned cores occurring in euhe-dral to slightly rounded prismatic grains with length/width ratio of c. 3–4. The oscillatory zoned part of thegrain is generally CL-bright (subgroup 1a) and its zoningis commonly sharply truncated, in some cases (e.g. grain2–34) showing evidence for fracturing. Several cores(subgroup 1b) exhibit considerably darker CL andless distinct zoning (e.g. grains 1–4, 1–9 and 1–16).Group 2 ‘soccer ball’ zircon grains are generally equantand multifaceted, showing very low cathodoluminescence,
although vaguely zoned internal structures are occas-ionally visible (e.g. grain 2–13, Fig. 4). Group 3 zircongrains comprise CL-dark, sometimes zoned, rims orembayments that occur on both group 1a zircon grains(in which case, they are classified as subgroup 3a) andgroup 1b and 2 zircon grains (classified as subgroup 3b).This type of zircon varies from substantial tip overgrowthsof prismatic grains (e.g. grain 2–4, Fig. 4) to thin rimsdeveloped on typical group 2 grains (e.g. grain 2–14,Fig. 4). A fourth group of zircon is defined as outer rimsthat are found on grains with two earlier phases of growth.
Zircon U–Th–Pb geochronology
SIMS U–Th–Pb analytical data for zircons from SM/GR/97/8 are presented in Table 2 and in a plot of207Pb/206Pb dates in increasing order (Fig. 5). These arediscussed below in the context of the grouping of zircongrowth phases based on CL characteristics.
Group 1 zircon cores exhibit a wide but bimodalrange of 207Pb/206Pb dates from c. 2�7 to >3�8 Ga.The CL bright, oscillatory-zoned majority of thisgroup (subgroup 1a) show a more restricted range of207Pb/206Pb dates from c. 3�57 to 3�88 Ga. These ana-lyses are concordant to slightly discordant with low-Uconcentrations (c. 70–220 ppm) and moderate Th/Uratios (0�14–0�70). The similar CL characteristics andTh/U systematics suggest that these grains could belongto a single igneous protolith with an age in excess of3�8 Ga which has experienced variable amounts ofancient Pb-loss, probably during the high-grade eventsrecorded in the Godthabsfjord at c. 3�65 and c. 2�7 Ga,resulting in a spread of ages along concordia. In thiscontext, the oldest coherent group of 207Pb/206Pb datesthat define a prominent plateau on the cumulative agediagram (Fig. 5) yields a weighted average of 3842 �5 Ma (n ¼ 7, MSWD ¼ 0�62, 95% confidence). Thisinterpretation is in accord with previous interpretationsof similarly spread dates from other gneisses in this region(e.g. Nutman et al., 1996, 2000; Whitehouse et al., 1999),but the possibility that younger magmatic zircon is repre-sented in this population cannot be entirely ruled out. Asingle analysis yielding a 207Pb/206Pb age of 3876 �26 Ma (2s) is slightly older than the main c. 3�84 Ga groupand might represent a genuinely older grain. Four ana-lyses of CL-dark cores of subgroup 1b have high-U con-centrations (1800–8300 ppm), and low Th/U ratios(<0�04). Only one concordant date has been obtainedat c. 2�72 Ga, with the other analyses plotting between27 and 47% discordant. One of the discordant analyseshas a 207Pb/207Pb age of c. 2�78 Ga, suggesting that itcannot simply represent an equivalent of the concordant2�72 Ga analysis that has undergone later Pb-loss butprobably contains an inherited component or is a much
298
JOURNAL OF PETROLOGY VOLUME 46 NUMBER 2 FEBRUARY 2005 by guest on M
arch 6, 2015http://petrology.oxfordjournals.org/
Dow
nloaded from
2-1
2-3
2-2
2-6
2-9
2-10
2-12
2-23
2-21
2-20
2-24
2-22
2-31
2-7 2-8
2-5
2-4
2-13
2-30
2-15
2-33
2-32
2-36
2-35
2-37
1-12
2-34
2-14
2-11
a
a
a
a
a
a
a
a
a
b
a
a
a
b
c
b
b
b
b
b
b
b
b
dc
b
b
b
b
b
b
c
b
db
b
b
ba
a
b
a
a
a
a
a
a
a
c
aa
a
a
a
a
a
100 mµ
Fig. 4. Cathodoluminesence images of all zircon grains investigated in this study. Labelling nomenclature 1–12b, for example, indicates samplemount 1, grain number 12, analysis b. Ellipses show location of analysed region (U–Th–Pb or Pb-isotopes for geochronology and REEdeterminations). Where spatial resolution was further enhanced using field aperture blanking, this is indicated by square outline, which representsthe region of the grain that was actually analysed; in this case, the primary beam size is indicated by a dashed ellipse. Note that dark areas in someof the analysed regions correspond to residual gold coating from later analytical sessions that was not entirely removed prior to post-analytical CLimaging (e.g. grain 2–2, 2–8, 2–10).
299
WHITEHOUSE AND KAMBER CAUTIONARY TALE FROM AKILIA, SW GREENLAND by guest on M
arch 6, 2015http://petrology.oxfordjournals.org/
Dow
nloaded from
older grain (i.e. early-Archaean) that has experiencedextreme, possibly multiple, Pb-loss.
Group 2 ‘soccer ball’ zircon grains mostly yield a smallrange of 207Pb/206Pb dates from c. 3�57 to c. 3�62 Ga.Th/U ratios are very low (<0�03) and U-concentrationsfall in the range c. 500–800 ppm. The spread to youngerdates is attributed to minor Pb-loss from originally�3�62 Ga zircons, probably during the c. 2�71 Garegional high-grade event (although still concordant atthe 2s error level, the two analyses with youngest207Pb/206Pb dates are displaced to the right of the inverseconcordia). One zircon core (1–15a) that is provisionallyclassified into group 2 on the basis of its CL-dark,rounded appearance yields a concordant age ofc. 2�71 Ga, with low Th/U (0�025) and high U-concen-tration (1100 ppm).
Group 3a zircon phases comprise distinct, rather thinrim, overgrowths or embayments developed on oscilla-tory zoned CL-bright zircon cores of group 1a. Pb-isotope ratios only were obtained from this group usinga small primary beam spot (c. 15mm), together withfurther enhancement of spatial resolution of c. 11 mmusing a field aperture in the secondary ion beam (seeFig. 4). Despite the overall similarity of appearance inCL as well as consistently low Th/U ratios (<0�06), thisgroup yields a distinctly bimodal set of 207Pb/206Pb datesin the range c. 3�70–3�50 and 2�72–2�58 Ga. In line withour earlier interpretations, we attribute this limitedspread in zircon dates to Pb-loss affecting zircon grownoriginally at c. >3�60 and c. 2�71 Ga (Fig. 5). Group 3bzircon (rims on group 1b and group 2 zircon), togetherwith group 4 zircon (rims on polyphase grains) show
Fig. 4. Continued.
300
JOURNAL OF PETROLOGY VOLUME 46 NUMBER 2 FEBRUARY 2005 by guest on M
arch 6, 2015http://petrology.oxfordjournals.org/
Dow
nloaded from
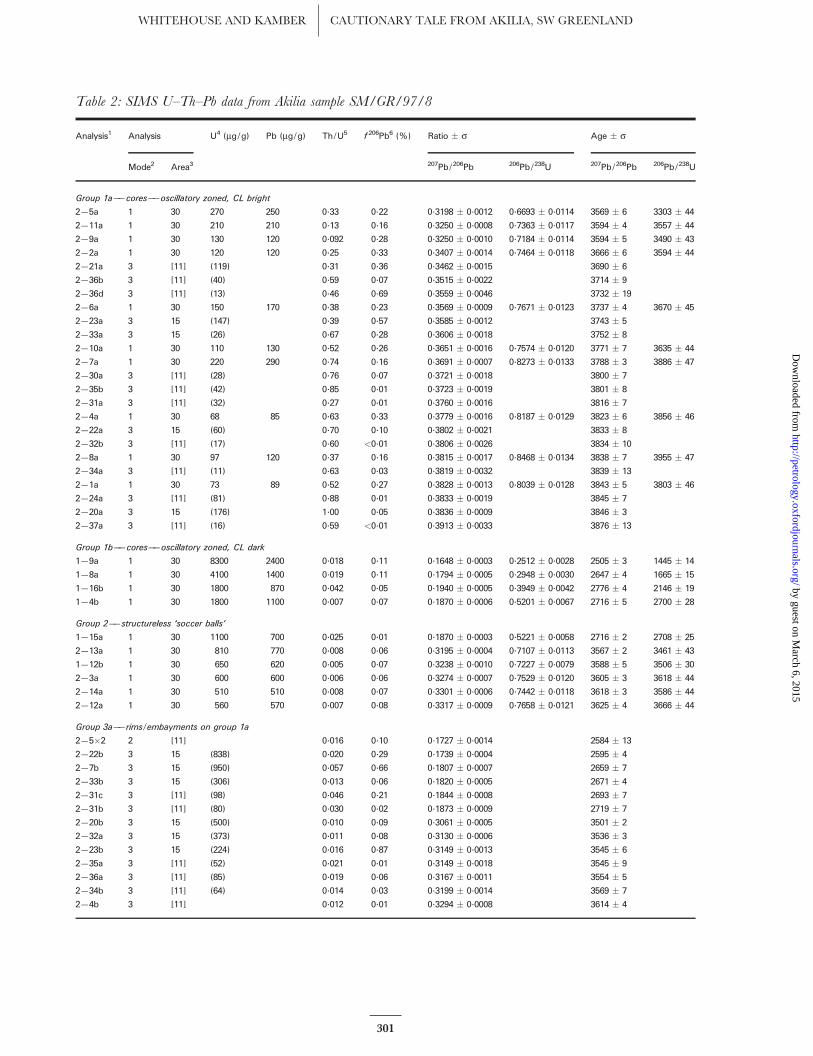
Table 2: SIMS U–Th–Pb data from Akilia sample SM/GR/97/8
Analysis1 Analysis U4 (mg/g) Pb (mg/g) Th/U5 f 206Pb6 (%) Ratio � s Age � s
Mode2 Area3 207Pb/206Pb 206Pb/238U 207Pb/206Pb 206Pb/238U
Group 1a——cores——oscillatory zoned, CL bright
2—5a 1 30 270 250 0.33 0.22 0.3198 � 0.0012 0.6693 � 0.0114 3569 � 6 3303 � 44
2—11a 1 30 210 210 0.13 0.16 0.3250 � 0.0008 0.7363 � 0.0117 3594 � 4 3557 � 44
2—9a 1 30 130 120 0.092 0.28 0.3250 � 0.0010 0.7184 � 0.0114 3594 � 5 3490 � 43
2—2a 1 30 120 120 0.25 0.33 0.3407 � 0.0014 0.7464 � 0.0118 3666 � 6 3594 � 44
2—21a 3 [11] (119) 0.31 0.36 0.3462 � 0.0015 3690 � 6
2—36b 3 [11] (40) 0.59 0.07 0.3515 � 0.0022 3714 � 9
2—36d 3 [11] (13) 0.46 0.69 0.3559 � 0.0046 3732 � 19
2—6a 1 30 150 170 0.38 0.23 0.3569 � 0.0009 0.7671 � 0.0123 3737 � 4 3670 � 45
2—23a 3 15 (147) 0.39 0.57 0.3585 � 0.0012 3743 � 5
2—33a 3 15 (26) 0.67 0.28 0.3606 � 0.0018 3752 � 8
2—10a 1 30 110 130 0.52 0.26 0.3651 � 0.0016 0.7574 � 0.0120 3771 � 7 3635 � 44
2—7a 1 30 220 290 0.74 0.16 0.3691 � 0.0007 0.8273 � 0.0133 3788 � 3 3886 � 47
2—30a 3 [11] (28) 0.76 0.07 0.3721 � 0.0018 3800 � 7
2—35b 3 [11] (42) 0.85 0.01 0.3723 � 0.0019 3801 � 8
2—31a 3 [11] (32) 0.27 0.01 0.3760 � 0.0016 3816 � 7
2—4a 1 30 68 85 0.63 0.33 0.3779 � 0.0016 0.8187 � 0.0129 3823 � 6 3856 � 46
2—22a 3 15 (60) 0.70 0.10 0.3802 � 0.0021 3833 � 8
2—32b 3 [11] (17) 0.60 <0.01 0.3806 � 0.0026 3834 � 10
2—8a 1 30 97 120 0.37 0.16 0.3815 � 0.0017 0.8468 � 0.0134 3838 � 7 3955 � 47
2—34a 3 [11] (11) 0.63 0.03 0.3819 � 0.0032 3839 � 13
2—1a 1 30 73 89 0.52 0.27 0.3828 � 0.0013 0.8039 � 0.0128 3843 � 5 3803 � 46
2—24a 3 [11] (81) 0.88 0.01 0.3833 � 0.0019 3845 � 7
2—20a 3 15 (176) 1.00 0.05 0.3836 � 0.0009 3846 � 3
2—37a 3 [11] (16) 0.59 <0.01 0.3913 � 0.0033 3876 � 13
Group 1b——cores——oscillatory zoned, CL dark
1—9a 1 30 8300 2400 0.018 0.11 0.1648 � 0.0003 0.2512 � 0.0028 2505 � 3 1445 � 14
1—8a 1 30 4100 1400 0.019 0.11 0.1794 � 0.0005 0.2948 � 0.0030 2647 � 4 1665 � 15
1—16b 1 30 1800 870 0.042 0.05 0.1940 � 0.0005 0.3949 � 0.0042 2776 � 4 2146 � 19
1—4b 1 30 1800 1100 0.007 0.07 0.1870 � 0.0006 0.5201 � 0.0067 2716 � 5 2700 � 28
Group 2——structureless ‘soccer balls’
1—15a 1 30 1100 700 0.025 0.01 0.1870 � 0.0003 0.5221 � 0.0058 2716 � 2 2708 � 25
2—13a 1 30 810 770 0.008 0.06 0.3195 � 0.0004 0.7107 � 0.0113 3567 � 2 3461 � 43
1—12b 1 30 650 620 0.005 0.07 0.3238 � 0.0010 0.7227 � 0.0079 3588 � 5 3506 � 30
2—3a 1 30 600 600 0.006 0.06 0.3274 � 0.0007 0.7529 � 0.0120 3605 � 3 3618 � 44
2—14a 1 30 510 510 0.008 0.07 0.3301 � 0.0006 0.7442 � 0.0118 3618 � 3 3586 � 44
2—12a 1 30 560 570 0.007 0.08 0.3317 � 0.0009 0.7658 � 0.0121 3625 � 4 3666 � 44
Group 3a——rims/embayments on group 1a
2—5�2 2 [11] 0.016 0.10 0.1727 � 0.0014 2584 � 13
2—22b 3 15 (838) 0.020 0.29 0.1739 � 0.0004 2595 � 4
2—7b 3 15 (950) 0.057 0.66 0.1807 � 0.0007 2659 � 7
2—33b 3 15 (306) 0.013 0.06 0.1820 � 0.0005 2671 � 4
2—31c 3 [11] (98) 0.046 0.21 0.1844 � 0.0008 2693 � 7
2—31b 3 [11] (80) 0.030 0.02 0.1873 � 0.0009 2719 � 7
2—20b 3 15 (500) 0.010 0.09 0.3061 � 0.0005 3501 � 2
2—32a 3 15 (373) 0.011 0.08 0.3130 � 0.0006 3536 � 3
2—23b 3 15 (224) 0.016 0.87 0.3149 � 0.0013 3545 � 6
2—35a 3 [11] (52) 0.021 0.01 0.3149 � 0.0018 3545 � 9
2—36a 3 [11] (85) 0.019 0.06 0.3167 � 0.0011 3554 � 5
2—34b 3 [11] (64) 0.014 0.03 0.3199 � 0.0014 3569 � 7
2—4b 3 [11] 0.012 0.01 0.3294 � 0.0008 3614 � 4
301
WHITEHOUSE AND KAMBER CAUTIONARY TALE FROM AKILIA, SW GREENLAND by guest on M
arch 6, 2015http://petrology.oxfordjournals.org/
Dow
nloaded from
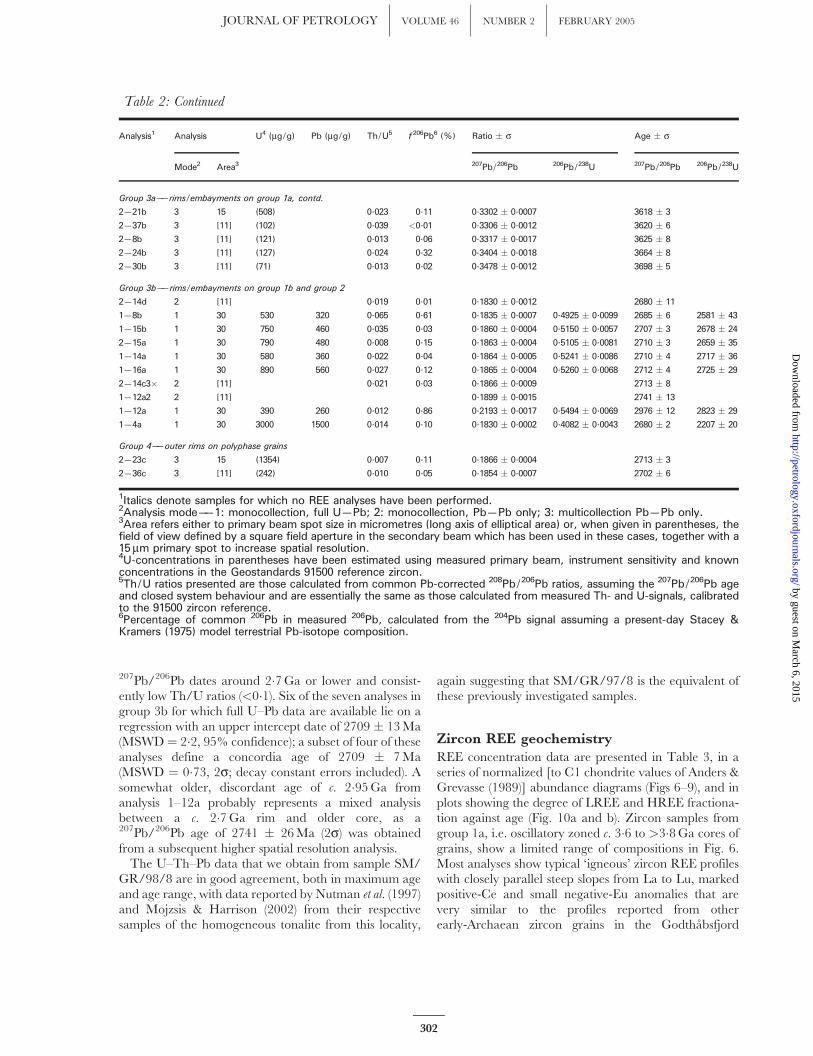
207Pb/206Pb dates around 2�7 Ga or lower and consist-ently low Th/U ratios (<0�1). Six of the seven analyses ingroup 3b for which full U–Pb data are available lie on aregression with an upper intercept date of 2709 � 13 Ma(MSWD ¼ 2�2, 95% confidence); a subset of four of theseanalyses define a concordia age of 2709 � 7 Ma(MSWD ¼ 0�73, 2s; decay constant errors included). Asomewhat older, discordant age of c. 2�95 Ga fromanalysis 1–12a probably represents a mixed analysisbetween a c. 2�7 Ga rim and older core, as a207Pb/206Pb age of 2741 � 26 Ma (2s) was obtainedfrom a subsequent higher spatial resolution analysis.
The U–Th–Pb data that we obtain from sample SM/GR/98/8 are in good agreement, both in maximum ageand age range, with data reported by Nutman et al. (1997)and Mojzsis & Harrison (2002) from their respectivesamples of the homogeneous tonalite from this locality,
again suggesting that SM/GR/97/8 is the equivalent ofthese previously investigated samples.
Zircon REE geochemistry
REE concentration data are presented in Table 3, in aseries of normalized [to C1 chondrite values of Anders &Grevasse (1989)] abundance diagrams (Figs 6–9), and inplots showing the degree of LREE and HREE fractiona-tion against age (Fig. 10a and b). Zircon samples fromgroup 1a, i.e. oscillatory zoned c. 3�6 to >3�8 Ga cores ofgrains, show a limited range of compositions in Fig. 6.Most analyses show typical ‘igneous’ zircon REE profileswith closely parallel steep slopes from La to Lu, markedpositive-Ce and small negative-Eu anomalies that arevery similar to the profiles reported from otherearly-Archaean zircon grains in the Godthabsfjord
Table 2: Continued
Analysis1 Analysis U4 (mg/g) Pb (mg/g) Th/U5 f 206Pb6 (%) Ratio � s Age � s
Mode2 Area3 207Pb/206Pb 206Pb/238U 207Pb/206Pb 206Pb/238U
Group 3a——rims/embayments on group 1a, contd.
2—21b 3 15 (508) 0.023 0.11 0.3302 � 0.0007 3618 � 3
2—37b 3 [11] (102) 0.039 <0.01 0.3306 � 0.0012 3620 � 6
2—8b 3 [11] (121) 0.013 0.06 0.3317 � 0.0017 3625 � 8
2—24b 3 [11] (127) 0.024 0.32 0.3404 � 0.0018 3664 � 8
2—30b 3 [11] (71) 0.013 0.02 0.3478 � 0.0012 3698 � 5
Group 3b——rims/embayments on group 1b and group 2
2—14d 2 [11] 0.019 0.01 0.1830 � 0.0012 2680 � 11
1—8b 1 30 530 320 0.065 0.61 0.1835 � 0.0007 0.4925 � 0.0099 2685 � 6 2581 � 43
1—15b 1 30 750 460 0.035 0.03 0.1860 � 0.0004 0.5150 � 0.0057 2707 � 3 2678 � 24
2—15a 1 30 790 480 0.008 0.15 0.1863 � 0.0004 0.5105 � 0.0081 2710 � 3 2659 � 35
1—14a 1 30 580 360 0.022 0.04 0.1864 � 0.0005 0.5241 � 0.0086 2710 � 4 2717 � 36
1—16a 1 30 890 560 0.027 0.12 0.1865 � 0.0004 0.5260 � 0.0068 2712 � 4 2725 � 29
2—14c3� 2 [11] 0.021 0.03 0.1866 � 0.0009 2713 � 8
1—12a2 2 [11] 0.1899 � 0.0015 2741 � 13
1—12a 1 30 390 260 0.012 0.86 0.2193 � 0.0017 0.5494 � 0.0069 2976 � 12 2823 � 29
1—4a 1 30 3000 1500 0.014 0.10 0.1830 � 0.0002 0.4082 � 0.0043 2680 � 2 2207 � 20
Group 4——outer rims on polyphase grains
2—23c 3 15 (1354) 0.007 0.11 0.1866 � 0.0004 2713 � 3
2—36c 3 [11] (242) 0.010 0.05 0.1854 � 0.0007 2702 � 6
1Italics denote samples for which no REE analyses have been performed.2Analysis mode——1: monocollection, full U—Pb; 2: monocollection, Pb—Pb only; 3: multicollection Pb—Pb only.3Area refers either to primary beam spot size in micrometres (long axis of elliptical area) or, when given in parentheses, thefield of view defined by a square field aperture in the secondary beam which has been used in these cases, together with a15mm primary spot to increase spatial resolution.4U-concentrations in parentheses have been estimated using measured primary beam, instrument sensitivity and knownconcentrations in the Geostandards 91500 reference zircon.5Th/U ratios presented are those calculated from common Pb-corrected 208Pb/206Pb ratios, assuming the 207Pb/206Pb ageand closed system behaviour and are essentially the same as those calculated from measured Th- and U-signals, calibratedto the 91500 zircon reference.6Percentage of common 206Pb in measured 206Pb, calculated from the 204Pb signal assuming a present-day Stacey &Kramers (1975) model terrestrial Pb-isotope composition.
302
JOURNAL OF PETROLOGY VOLUME 46 NUMBER 2 FEBRUARY 2005 by guest on M
arch 6, 2015http://petrology.oxfordjournals.org/
Dow
nloaded from
(e.g. Whitehouse & Kamber, 2002, 2003). Two of thesefive profiles (2a–x and 10a–x) represent analyses of thesame growth phase (based on CL imaging) that wasanalysed for U–Th–Pb but in a slightly different location.Analyses from the original dated location show markedlyincreased LREE concentrations (omitted from Fig. 6 butdata are retained in Table 3) that might be related to laterLREE mineralization along cracks, perturbing the origi-nal profile. The exact nature of this mineralization isunclear but, given the clearly LREE-depleted nature ofthe original zircon, only a very small amount of a stronglyLREE-enriched phase (e.g. monazite or allanite) wouldbe required to influence the REE profiles, whereas othercharacteristic enrichments (e.g. higher levels of Th inmonazite) remain undetected. Analysis 2–5a exhibits ahighly unusual REE profile that is enriched in bothLREE and MREE. Because it is unlikely that zirconcan incorporate REE in this pattern [by see discussionin Whitehouse & Kamber (2002)], we conclude that theREE profile of this particular grain must be controlled byinclusions (and/or microcrack fillings) of both LREE-and MREE-enriched minerals, such as monazite,allanite or apatite. This analysis is not considered furtherfor the purposes of protolith characterization. In general,the REE profiles from group 1a, together with Th/Uratios, are typical of zircon crystallized in equilibriumwith a primary melt.
Group 1b zircon samples also represent cores, but theseshow markedly different characteristics from those ofgroup 1a, particularly with regard to the LREE, whichare consistently flat at chondrite-normalized valuesbetween c. 40 and 1000, with absent to small positiveCe-anomalies (Fig. 6). The HREE profiles of this groupare either highly fractionated, similar to those of group 1a,or in one case (analysis 1–4b), flat at c. 100� chondritic.
Group 2 zircon grains exhibit an internally coherent setof REE profiles (Fig. 7) that are notably different fromthose of either group 1a or group 1b. The most promin-ent difference is the marked depletion of the HREE withflat or even concave-up profiles from Dy to Lu, irrespect-ive of whether the analysed grain is early or lateArchaean. These zircon grains show more variablefractionation of LREE relative to group 1a, with theearly Archaean grains showing the steepest profiles. Ingeneral, these analyses show smaller-magnitude Ce-anomalies and larger negative Eu-anomalies. Interest-ingly, the least suppressed positive Ce-anomaly (analysis14a2) is accompanied by the least enhanced negative Eu-anomaly—a feature that would be consistent with vari-able redox control of the behaviour of these two elementsduring the event generating the c. 3�6 Ga zircon. Thecharacteristic HREE depletion of this group (andpossibly in analysis 1–4b of group 1b) is the most impor-tant observation, as it suggests crystallization in an
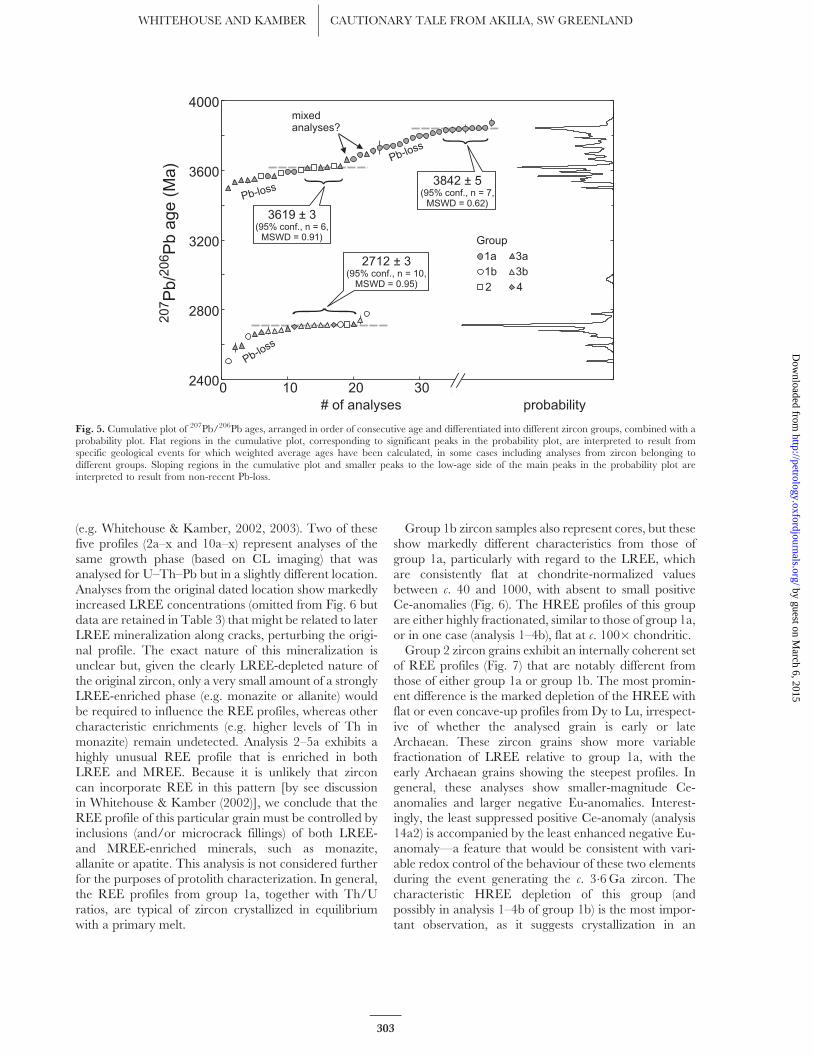
2400
2800
3200
3600
4000
0 10 20 30
207
206
Pb
/P
ba
ge
(Ma
)
# of analyses probability
{
{
{
Pb-loss
Pb-loss
Pb-loss
mixedanalyses?
3842 ± 5(95% conf., n = 7,
MSWD = 0.62)3619 ± 3
(95% conf., n = 6,MSWD = 0.91)
2712 ± 3(95% conf., n = 10,
MSWD = 0.95)
1a1b
2
3a3b
4
Group
Fig. 5. Cumulative plot of 207Pb/206Pb ages, arranged in order of consecutive age and differentiated into different zircon groups, combined with aprobability plot. Flat regions in the cumulative plot, corresponding to significant peaks in the probability plot, are interpreted to result fromspecific geological events for which weighted average ages have been calculated, in some cases including analyses from zircon belonging todifferent groups. Sloping regions in the cumulative plot and smaller peaks to the low-age side of the main peaks in the probability plot areinterpreted to result from non-recent Pb-loss.
303
WHITEHOUSE AND KAMBER CAUTIONARY TALE FROM AKILIA, SW GREENLAND by guest on M
arch 6, 2015http://petrology.oxfordjournals.org/
Dow
nloaded from
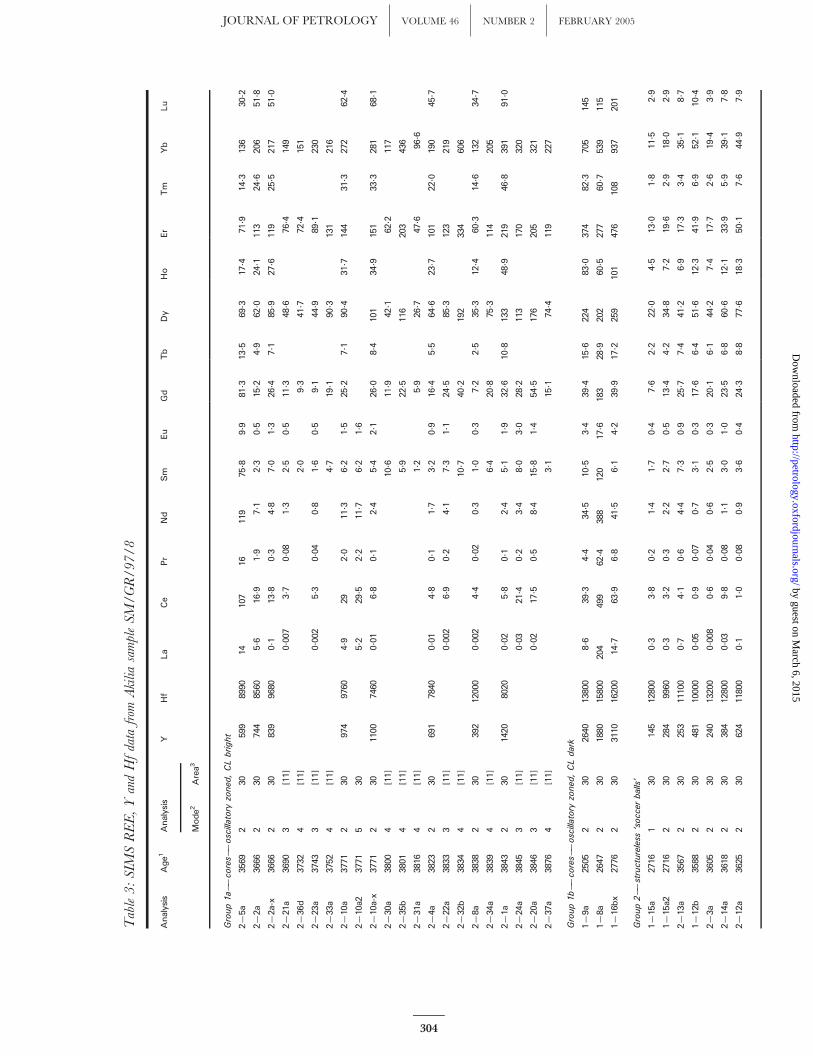
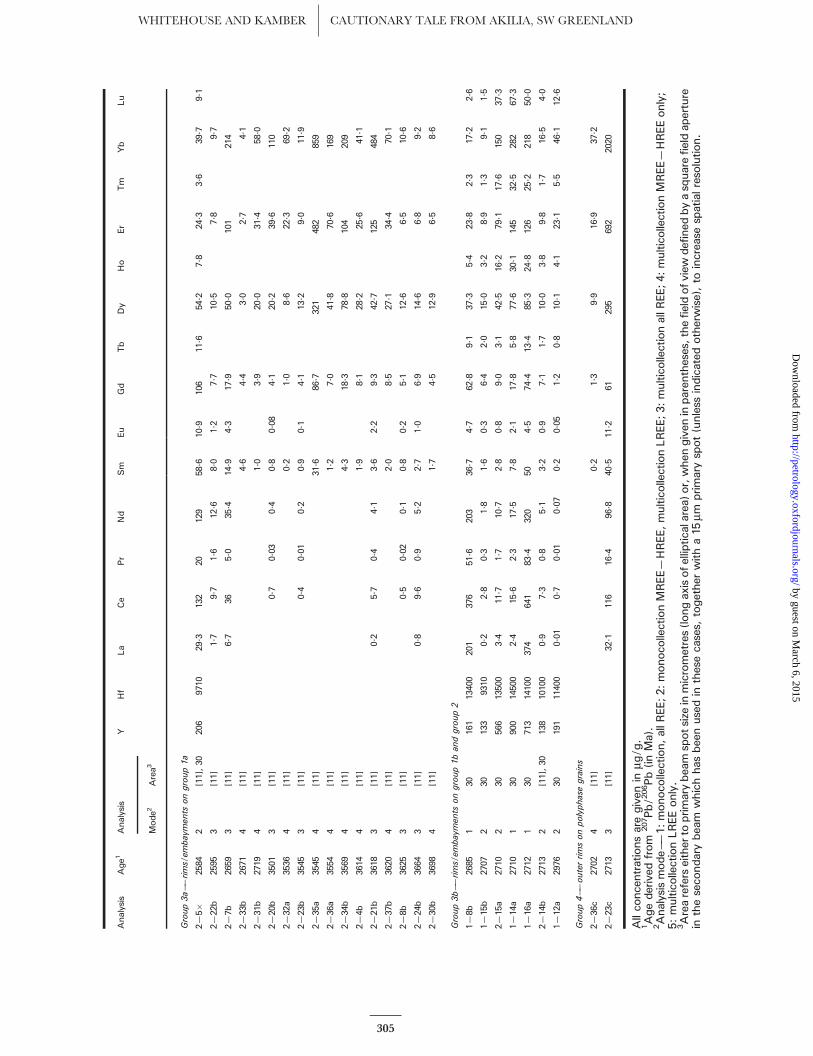
Table3:SIM
SREE,YandHfdatafrom
AkiliasampleSM/GR/97/8
Analysis
Age1
Analysis
YHf
La
Ce
Pr
Nd
Sm
Eu
Gd
Tb
Dy
Ho
Er
Tm
Yb
Lu
Mode2
Area3
Group1a——
cores——oscillatory
zoned
,CLbright
2—5a
3569
230
599
8990
14107
16119
75. 8
9.9
81. 3
13. 5
69. 3
17. 4
71. 9
14. 3
136
30. 2
2—2a
3666
230
744
8560
5.6
16. 9
1.9
7.1
2.3
0.5
15. 2
4.9
62. 0
24. 1
113
24. 6
206
51. 8
2—2a-x
3666
230
839
9680
0.1
13. 8
0.3
4.8
7.0
1.3
26. 4
7.1
85. 9
27. 6
119
25. 5
217
51. 0
2—21a
3690
3[11]
0.007
3.7
0.08
1.3
2.5
0.5
11. 3
48. 6
76. 4
149
2—36d
3732
4[11]
2.0
9.3
41. 7
72. 4
151
2—23a
3743
3[11]
0.002
5.3
0.04
0.8
1.6
0.5
9.1
44. 9
89. 1
230
2—33a
3752
4[11]
4.7
19. 1
90. 3
131
216
2—10a
3771
230
974
9760
4.9
292.0
11. 3
6.2
1.5
25. 2
7.1
90. 4
31. 7
144
31. 3
272
62. 4
2—10a2
3771
530
5.2
29. 5
2.2
11. 7
6.2
1.6
2—10a-x
3771
230
1100
7460
0.01
6.8
0.1
2.4
5.4
2.1
26. 0
8.4
101
34. 9
151
33. 3
281
68. 1
2—30a
3800
4[11]
10. 6
11. 9
42. 1
62. 2
117
2—35b
3801
4[11]
5.9
22. 5
116
203
436
2—31a
3816
4[11]
1.2
5.9
26. 7
47. 6
96. 6
2—4a
3823
230
691
7840
0.01
4.8
0.1
1.7
3.2
0.9
16. 4
5.5
64. 6
23. 7
101
22. 0
190
45. 7
2—22a
3833
3[11]
0.002
6.9
0.2
4.1
7.3
1.1
24. 5
85. 3
123
219
2—32b
3834
4[11]
10. 7
40. 2
192
334
606
2—8a
3838
230
392
12000
0.002
4.4
0.02
0.3
1.0
0.3
7.2
2.5
35. 3
12. 4
60. 3
14. 6
132
34. 7
2—34a
3839
4[11]
6.4
20. 8
75. 3
114
205
2—1a
3843
230
1420
8020
0.02
5.8
0.1
2.4
5.1
1.9
32. 6
10. 8
133
48. 9
219
46. 8
391
91. 0
2—24a
3845
3[11]
0.03
21. 4
0.2
3.4
8.0
3.0
28. 2
113
170
320
2—20a
3846
3[11]
0.02
17. 5
0.5
8.4
15. 8
1.4
54. 5
176
205
321
2—37a
3876
4[11]
3.1
15. 1
74. 4
119
227
Group1b
——co
res——oscillatory
zoned
,CLdark
1—9a
2505
230
2640
13800
8.6
39. 3
4.4
34. 5
10. 5
3.4
39. 4
15. 6
224
83. 0
374
82. 3
705
145
1—8a
2647
230
1880
15800
204
499
62. 4
388
120
17. 6
183
28. 9
202
60. 5
277
60. 7
539
115
1—16bx
2776
230
3110
16200
14. 7
63. 9
6.8
41. 5
6.1
4.2
39. 9
17. 2
259
101
476
108
937
201
Group2——structureless
‘soccer
balls’
1—15a
2716
130
145
12800
0.3
3.8
0.2
1.4
1.7
0.4
7.6
2.2
22. 0
4.5
13. 0
1.8
11. 5
2.9
1—15a2
2716
230
284
9960
0.3
3.2
0.3
2.2
2.7
0.5
13. 4
4.2
34. 8
7.2
19. 6
2.9
18. 0
2.9
2—13a
3567
230
253
11100
0.7
4.1
0.6
4.4
7.3
0.9
25. 7
7.4
41. 2
6.9
17. 3
3.4
35. 1
8.7
1—12b
3588
230
481
10000
0.05
0.9
0.07
0.7
3.1
0.3
17. 6
6.4
51. 6
12. 3
41. 9
6.9
52. 1
10. 4
2—3a
3605
230
240
13200
0.008
0.6
0.04
0.6
2.5
0.3
20. 1
6.1
44. 2
7.4
17. 7
2.6
19. 4
3.9
2—14a
3618
230
384
12800
0.03
9.8
0.08
1.1
3.0
1.0
23. 5
6.8
60. 6
12. 1
33. 9
5.9
39. 1
7.8
2—12a
3625
230
624
11800
0.1
1.0
0.08
0.9
3.6
0.4
24. 3
8.8
77. 6
18. 3
50. 1
7.6
44. 9
7.9
304
JOURNAL OF PETROLOGY VOLUME 46 NUMBER 2 FEBRUARY 2005 by guest on M
arch 6, 2015http://petrology.oxfordjournals.org/
Dow
nloaded from
Analysis
Age1
Analysis
YHf
La
Ce
Pr
Nd
Sm
Eu
Gd
Tb
Dy
Ho
Er
Tm
Yb
Lu
Mode2
Area3
Group3a——
rims/em
bayments
ongroup1a
2—5�
2584
2[11],30
206
9710
29. 3
132
20129
58. 6
10. 9
106
11. 6
54. 2
7.8
24. 3
3.6
39. 7
9.1
2—22b
2595
3[11]
1.7
9.7
1.6
12. 6
8.0
1.2
7.7
10. 5
7.8
9.7
2—7b
2659
3[11]
6.7
365.0
35. 4
14. 9
4.3
17. 9
50. 0
101
214
2—33b
2671
4[11]
4.6
4.4
3.0
2.7
4.1
2—31b
2719
4[11]
1.0
3.9
20. 0
31. 4
58. 0
2—20b
3501
3[11]
0.7
0.03
0.4
0.8
0.08
4.1
20. 2
39. 6
110
2—32a
3536
4[11]
0.2
1.0
8.6
22. 3
69. 2
2—23b
3545
3[11]
0.4
0.01
0.2
0.9
0.1
4.1
13. 2
9.0
11. 9
2—35a
3545
4[11]
31. 6
86. 7
321
482
859
2—36a
3554
4[11]
1.2
7.0
41. 8
70. 6
169
2—34b
3569
4[11]
4.3
18. 3
78. 8
104
209
2—4b
3614
4[11]
1.9
8.1
28. 2
25. 6
41. 1
2—21b
3618
3[11]
0.2
5.7
0.4
4.1
3.6
2.2
9.3
42. 7
125
484
2—37b
3620
4[11]
2.0
8.5
27. 1
34. 4
70. 1
2—8b
3625
3[11]
0.5
0.02
0.1
0.8
0.2
5.1
12. 6
6.5
10. 6
2—24b
3664
3[11]
0.8
9.6
0.9
5.2
2.7
1.0
6.9
14. 6
6.8
9.2
2—30b
3698
4[11]
1.7
4.5
12. 9
6.5
8.6
Group3b
——rims/em
baymen
tsongroup1b
andgroup2
1—8b
2685
130
161
13400
201
376
51. 6
203
36. 7
4.7
62. 8
9.1
37. 3
5.4
23. 8
2.3
17. 2
2.6
1—15b
2707
230
133
9310
0.2
2.8
0.3
1.8
1.6
0.3
6.4
2.0
15. 0
3.2
8.9
1.3
9.1
1.5
2—15a
2710
230
566
13500
3.4
11. 7
1.7
10. 7
2.8
0.8
9.0
3.1
42. 5
16. 2
79. 1
17. 6
150
37. 3
1—14a
2710
130
900
14500
2.4
15. 6
2.3
17. 5
7.8
2.1
17. 8
5.8
77. 6
30. 1
145
32. 5
282
67. 3
1—16a
2712
130
713
14100
374
641
83. 4
320
504.5
74. 4
13. 4
85. 3
24. 8
126
25. 2
218
50. 0
2—14b
2713
2[11],30
138
10100
0.9
7.3
0.8
5.1
3.2
0.9
7.1
1.7
10. 0
3.8
9.8
1.7
16. 5
4.0
1—12a
2976
230
191
11400
0.01
0.7
0.01
0.07
0.2
0.05
1.2
0.8
10. 1
4.1
23. 1
5.5
46. 1
12. 6
Group4——outerrimsonpolyphasegrains
2—36c
2702
4[11]
0.2
1.3
9.9
16. 9
37. 2
2—23c
2713
3[11]
32. 1
116
16. 4
96. 8
40. 5
11. 2
61295
692
2020
Allco
ncentrationsaregiven
inmg
/g.
1Agederived
from
207Pb/2
06Pb(inMa).
2Analysismode——1:
monoco
llection,allR
EE;2:
monoco
llectionMREE—HREE,multicollectionLREE;3:
multicollectionallR
EE;4:
multicollectionMREE—HREEonly;
5:multicollectionLREEonly.
3Areareferseither
toprimarybeam
spotsize
inmicrometres(longaxisofellipticalarea)
or,when
given
inparen
theses,thefieldofview
defined
byasquarefieldap
erture
intheseco
ndarybeam
whichhas
beenusedin
thesecases,
together
witha15
mmprimaryspot(unless
indicated
otherwise),to
increase
spatialresolution.
305
WHITEHOUSE AND KAMBER CAUTIONARY TALE FROM AKILIA, SW GREENLAND by guest on M
arch 6, 2015http://petrology.oxfordjournals.org/
Dow
nloaded from
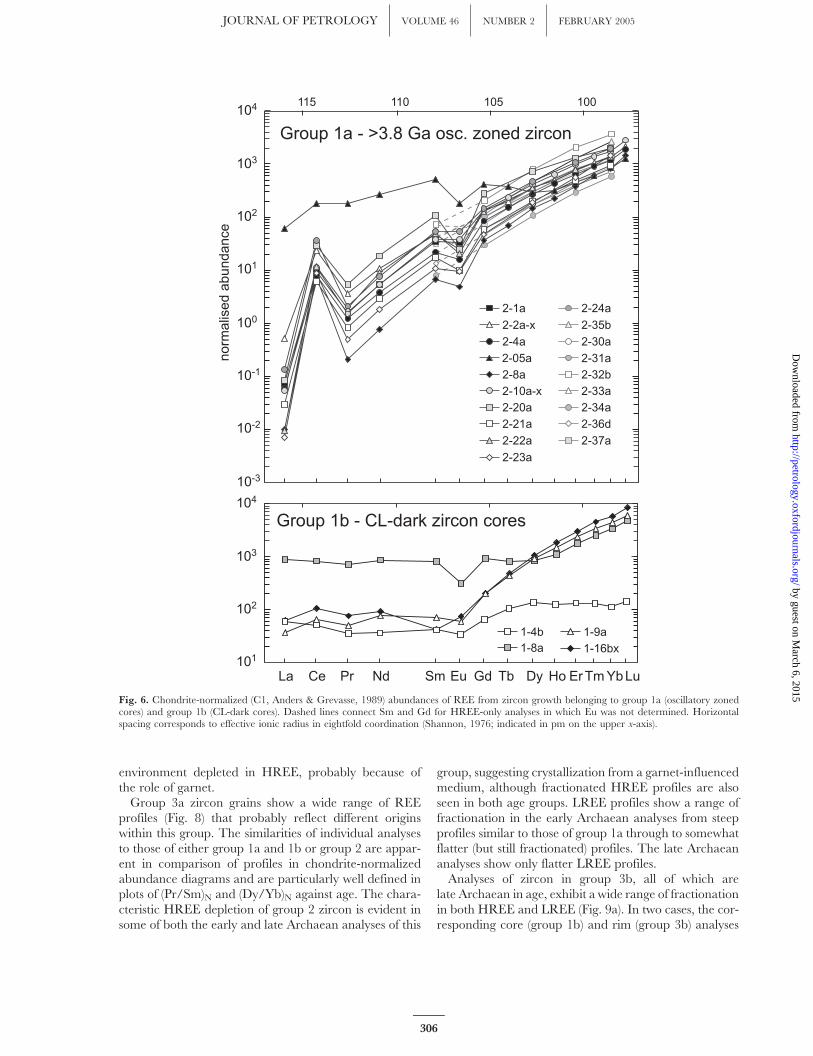
environment depleted in HREE, probably because ofthe role of garnet.
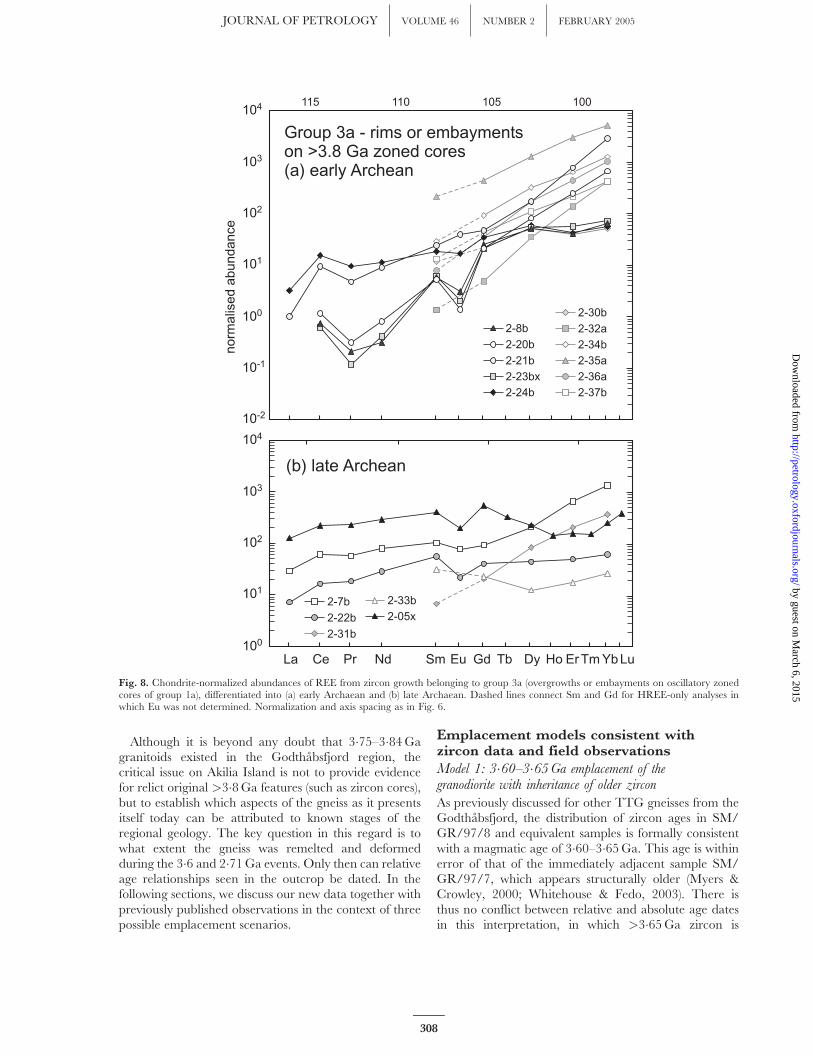
Group 3a zircon grains show a wide range of REEprofiles (Fig. 8) that probably reflect different originswithin this group. The similarities of individual analysesto those of either group 1a and 1b or group 2 are appar-ent in comparison of profiles in chondrite-normalizedabundance diagrams and are particularly well defined inplots of (Pr/Sm)N and (Dy/Yb)N against age. The chara-cteristic HREE depletion of group 2 zircon is evident insome of both the early and late Archaean analyses of this
group, suggesting crystallization from a garnet-influencedmedium, although fractionated HREE profiles are alsoseen in both age groups. LREE profiles show a range offractionation in the early Archaean analyses from steepprofiles similar to those of group 1a through to somewhatflatter (but still fractionated) profiles. The late Archaeananalyses show only flatter LREE profiles.
Analyses of zircon in group 3b, all of which arelate Archaean in age, exhibit a wide range of fractionationin both HREE and LREE (Fig. 9a). In two cases, the cor-responding core (group 1b) and rim (group 3b) analyses
115 110 105 100104
103
102
101
100
10-1
10-2
10-3
norm
alis
ed
abundance
Group 1a - >3.8 Ga osc. zoned zircon
2-1a
2-2a-x
2-4a
2-8a
2-10a-x
2-05a
2-20a
2-21a
2-22a
2-23a
2-24a
2-35b
2-30a
2-31a
2-32b
2-33a
2-34a
2-36d
2-37a
1-16bx1-8a1-4b 1-9a
104
103
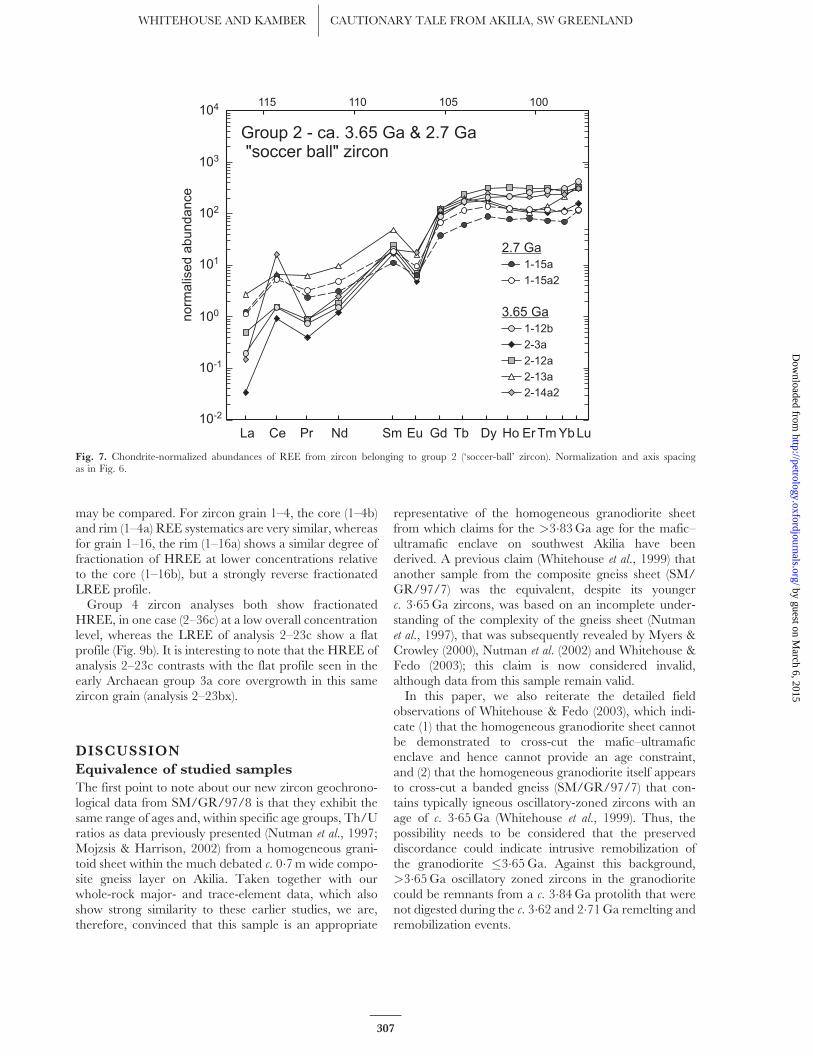
102
101
Group 1b - CL-dark zircon cores
La Ce Pr Nd Sm Eu Gd Tb Dy Ho Er Tm YbLu
Fig. 6. Chondrite-normalized (C1, Anders & Grevasse, 1989) abundances of REE from zircon growth belonging to group 1a (oscillatory zonedcores) and group 1b (CL-dark cores). Dashed lines connect Sm and Gd for HREE-only analyses in which Eu was not determined. Horizontalspacing corresponds to effective ionic radius in eightfold coordination (Shannon, 1976; indicated in pm on the upper x-axis).
306
JOURNAL OF PETROLOGY VOLUME 46 NUMBER 2 FEBRUARY 2005 by guest on M
arch 6, 2015http://petrology.oxfordjournals.org/
Dow
nloaded from
may be compared. For zircon grain 1–4, the core (1–4b)and rim (1–4a) REE systematics are very similar, whereasfor grain 1–16, the rim (1–16a) shows a similar degree offractionation of HREE at lower concentrations relativeto the core (1–16b), but a strongly reverse fractionatedLREE profile.
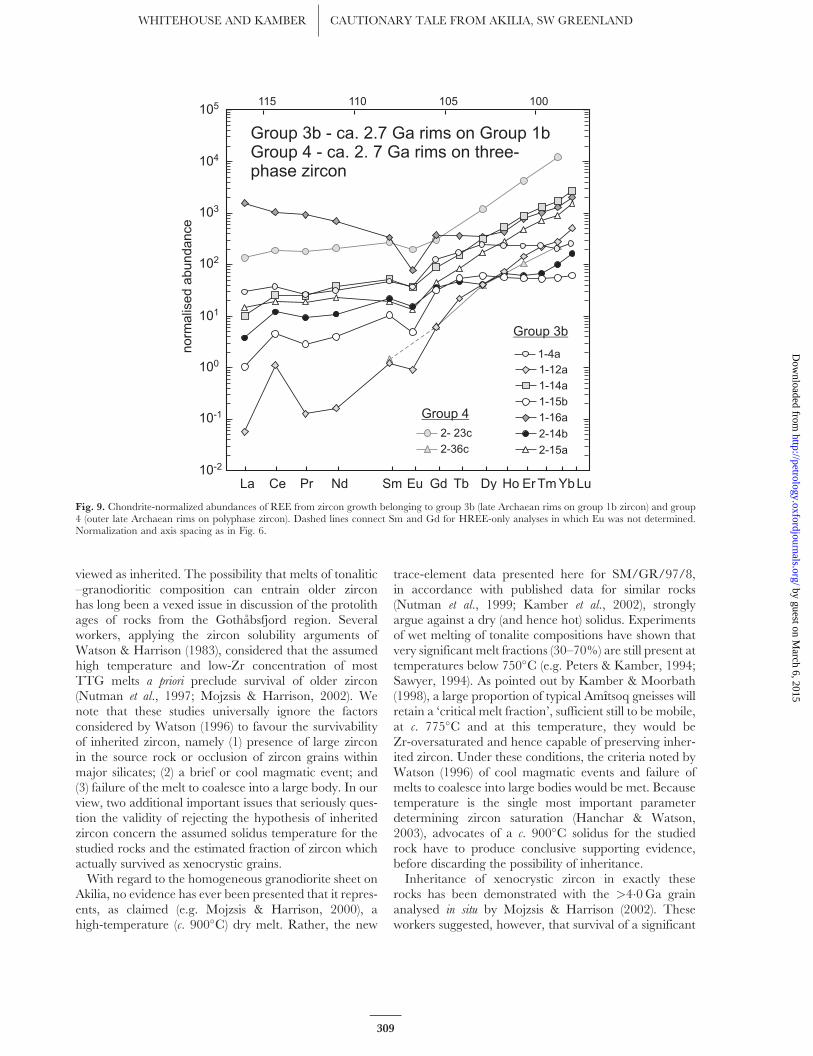
Group 4 zircon analyses both show fractionatedHREE, in one case (2–36c) at a low overall concentrationlevel, whereas the LREE of analysis 2–23c show a flatprofile (Fig. 9b). It is interesting to note that the HREE ofanalysis 2–23c contrasts with the flat profile seen in theearly Archaean group 3a core overgrowth in this samezircon grain (analysis 2–23bx).
DISCUSSION
Equivalence of studied samples
The first point to note about our new zircon geochrono-logical data from SM/GR/97/8 is that they exhibit thesame range of ages and, within specific age groups, Th/Uratios as data previously presented (Nutman et al., 1997;Mojzsis & Harrison, 2002) from a homogeneous grani-toid sheet within the much debated c. 0�7 m wide compo-site gneiss layer on Akilia. Taken together with ourwhole-rock major- and trace-element data, which alsoshow strong similarity to these earlier studies, we are,therefore, convinced that this sample is an appropriate
representative of the homogeneous granodiorite sheetfrom which claims for the >3�83 Ga age for the mafic–ultramafic enclave on southwest Akilia have beenderived. A previous claim (Whitehouse et al., 1999) thatanother sample from the composite gneiss sheet (SM/GR/97/7) was the equivalent, despite its youngerc. 3�65 Ga zircons, was based on an incomplete under-standing of the complexity of the gneiss sheet (Nutmanet al., 1997), that was subsequently revealed by Myers &Crowley (2000), Nutman et al. (2002) and Whitehouse &Fedo (2003); this claim is now considered invalid,although data from this sample remain valid.
In this paper, we also reiterate the detailed fieldobservations of Whitehouse & Fedo (2003), which indi-cate (1) that the homogeneous granodiorite sheet cannotbe demonstrated to cross-cut the mafic–ultramaficenclave and hence cannot provide an age constraint,and (2) that the homogeneous granodiorite itself appearsto cross-cut a banded gneiss (SM/GR/97/7) that con-tains typically igneous oscillatory-zoned zircons with anage of c. 3�65 Ga (Whitehouse et al., 1999). Thus, thepossibility needs to be considered that the preserveddiscordance could indicate intrusive remobilization ofthe granodiorite �3�65 Ga. Against this background,>3�65 Ga oscillatory zoned zircons in the granodioritecould be remnants from a c. 3�84 Ga protolith that werenot digested during the c. 3�62 and 2�71 Ga remelting andremobilization events.
Group 2 - ca. 3.65 Ga & 2.7 Ga"soccer ball" zircon
115 110 105 100104
103
10-2
102
101
100
10-1
no
rma
lise
da
bu
nd
an
ce
2-3a
2-12a
2-13a
2-14a2
1-12b
1-15a
1-15a2
2.7 Ga
3.65 Ga
La Ce Pr Nd Sm Eu Gd Tb Dy Ho Er Tm YbLu
Fig. 7. Chondrite-normalized abundances of REE from zircon belonging to group 2 (‘soccer-ball’ zircon). Normalization and axis spacingas in Fig. 6.
307
WHITEHOUSE AND KAMBER CAUTIONARY TALE FROM AKILIA, SW GREENLAND by guest on M
arch 6, 2015http://petrology.oxfordjournals.org/
Dow
nloaded from
Although it is beyond any doubt that 3�75–3�84 Gagranitoids existed in the Godthabsfjord region, thecritical issue on Akilia Island is not to provide evidencefor relict original >3�8 Ga features (such as zircon cores),but to establish which aspects of the gneiss as it presentsitself today can be attributed to known stages of theregional geology. The key question in this regard is towhat extent the gneiss was remelted and deformedduring the 3�6 and 2�71 Ga events. Only then can relativeage relationships seen in the outcrop be dated. In thefollowing sections, we discuss our new data together withpreviously published observations in the context of threepossible emplacement scenarios.
Emplacement models consistent withzircon data and field observations
Model 1: 3�60–3�65Ga emplacement of thegranodiorite with inheritance of older zircon
As previously discussed for other TTG gneisses from theGodthabsfjord, the distribution of zircon ages in SM/GR/97/8 and equivalent samples is formally consistentwith a magmatic age of 3�60–3�65 Ga. This age is withinerror of that of the immediately adjacent sample SM/GR/97/7, which appears structurally older (Myers &Crowley, 2000; Whitehouse & Fedo, 2003). There isthus no conflict between relative and absolute age datesin this interpretation, in which >3�65 Ga zircon is
115 110 105 100104
103
102
101
100
10-1
10-2
no
rma
lise
da
bu
nd
an
ce
Group 3a - rims or embaymentson >3.8 Ga zoned cores(a) early Archean
2-30b
2-32a
2-34b
2-35a
2-36a
2-37b2-24b
2-23bx
2-8b
2-20b
2-21b
104
103
102
101
100
(b) late Archean
2-7b
2-22b
2-31b
2-33b
2-05x
La Ce Pr Nd Sm Eu Gd Tb Dy Ho Er Tm YbLu
Fig. 8. Chondrite-normalized abundances of REE from zircon growth belonging to group 3a (overgrowths or embayments on oscillatory zonedcores of group 1a), differentiated into (a) early Archaean and (b) late Archaean. Dashed lines connect Sm and Gd for HREE-only analyses inwhich Eu was not determined. Normalization and axis spacing as in Fig. 6.
308
JOURNAL OF PETROLOGY VOLUME 46 NUMBER 2 FEBRUARY 2005 by guest on M
arch 6, 2015http://petrology.oxfordjournals.org/
Dow
nloaded from
viewed as inherited. The possibility that melts of tonalitic–granodioritic composition can entrain older zirconhas long been a vexed issue in discussion of the protolithages of rocks from the Gothabsfjord region. Severalworkers, applying the zircon solubility arguments ofWatson & Harrison (1983), considered that the assumedhigh temperature and low-Zr concentration of mostTTG melts a priori preclude survival of older zircon(Nutman et al., 1997; Mojzsis & Harrison, 2002). Wenote that these studies universally ignore the factorsconsidered by Watson (1996) to favour the survivabilityof inherited zircon, namely (1) presence of large zirconin the source rock or occlusion of zircon grains withinmajor silicates; (2) a brief or cool magmatic event; and(3) failure of the melt to coalesce into a large body. In ourview, two additional important issues that seriously ques-tion the validity of rejecting the hypothesis of inheritedzircon concern the assumed solidus temperature for thestudied rocks and the estimated fraction of zircon whichactually survived as xenocrystic grains.
With regard to the homogeneous granodiorite sheet onAkilia, no evidence has ever been presented that it repres-ents, as claimed (e.g. Mojzsis & Harrison, 2000), ahigh-temperature (c. 900�C) dry melt. Rather, the new
trace-element data presented here for SM/GR/97/8,in accordance with published data for similar rocks(Nutman et al., 1999; Kamber et al., 2002), stronglyargue against a dry (and hence hot) solidus. Experimentsof wet melting of tonalite compositions have shown thatvery significant melt fractions (30–70%) are still present attemperatures below 750�C (e.g. Peters & Kamber, 1994;Sawyer, 1994). As pointed out by Kamber & Moorbath(1998), a large proportion of typical Am��tsoq gneisses willretain a ‘critical melt fraction’, sufficient still to be mobile,at c. 775�C and at this temperature, they would beZr-oversaturated and hence capable of preserving inher-ited zircon. Under these conditions, the criteria noted byWatson (1996) of cool magmatic events and failure ofmelts to coalesce into large bodies would be met. Becausetemperature is the single most important parameterdetermining zircon saturation (Hanchar & Watson,2003), advocates of a c. 900�C solidus for the studiedrock have to produce conclusive supporting evidence,before discarding the possibility of inheritance.
Inheritance of xenocrystic zircon in exactly theserocks has been demonstrated with the >4�0 Ga grainanalysed in situ by Mojzsis & Harrison (2002). Theseworkers suggested, however, that survival of a significant
115 110 105 100105
104
103
102
101
100
10-1
10-2
no
rma
lise
da
bu
nd
an
ce
Group 3b - ca. 2.7 Ga rims on Group 1bGroup 4 - ca. 2. 7 Ga rims on three-phase zircon
2- 23c
2-36c 2-15a
2-14b
1-12a
1-4a
1-15b
1-16a
1-14a
La Ce Pr Nd Sm Eu Gd Tb Dy Ho Er Tm YbLu
Group 4
Group 3b
Fig. 9. Chondrite-normalized abundances of REE from zircon growth belonging to group 3b (late Archaean rims on group 1b zircon) and group4 (outer late Archaean rims on polyphase zircon). Dashed lines connect Sm and Gd for HREE-only analyses in which Eu was not determined.Normalization and axis spacing as in Fig. 6.
309
WHITEHOUSE AND KAMBER CAUTIONARY TALE FROM AKILIA, SW GREENLAND by guest on M
arch 6, 2015http://petrology.oxfordjournals.org/
Dow
nloaded from
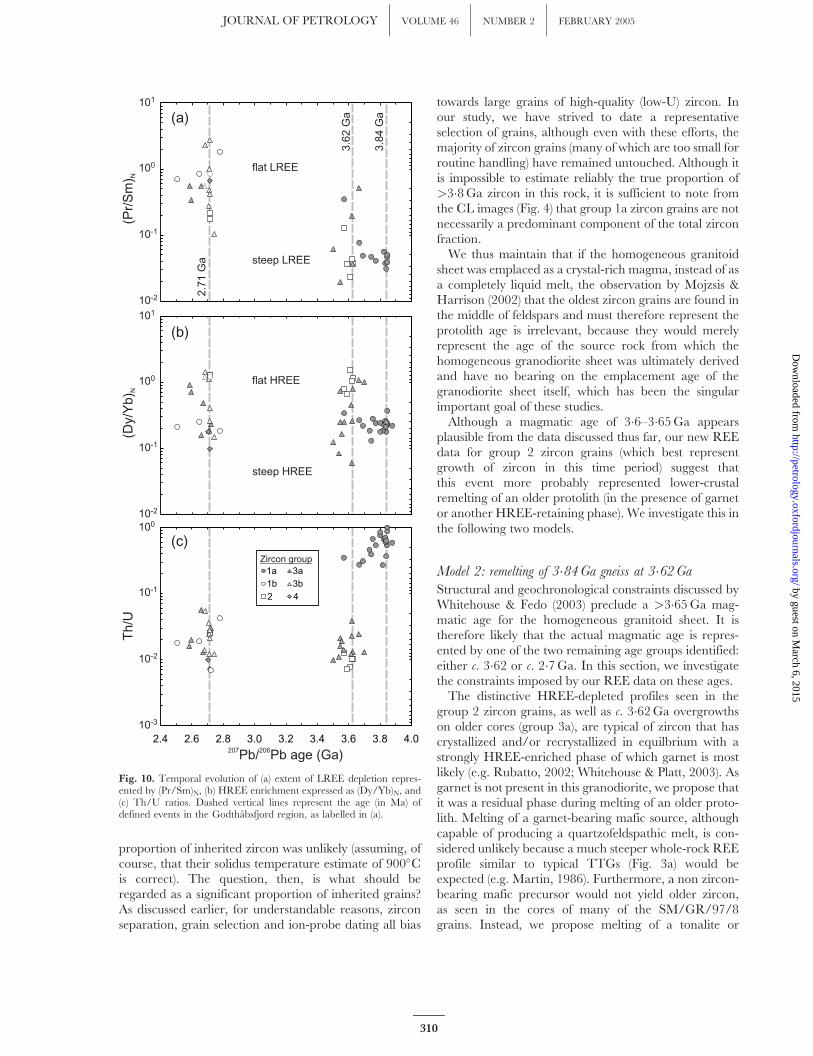
proportion of inherited zircon was unlikely (assuming, ofcourse, that their solidus temperature estimate of 900�Cis correct). The question, then, is what should beregarded as a significant proportion of inherited grains?As discussed earlier, for understandable reasons, zirconseparation, grain selection and ion-probe dating all bias
towards large grains of high-quality (low-U) zircon. Inour study, we have strived to date a representativeselection of grains, although even with these efforts, themajority of zircon grains (many of which are too small forroutine handling) have remained untouched. Although itis impossible to estimate reliably the true proportion of>3�8 Ga zircon in this rock, it is sufficient to note fromthe CL images (Fig. 4) that group 1a zircon grains are notnecessarily a predominant component of the total zirconfraction.
We thus maintain that if the homogeneous granitoidsheet was emplaced as a crystal-rich magma, instead of asa completely liquid melt, the observation by Mojzsis &Harrison (2002) that the oldest zircon grains are found inthe middle of feldspars and must therefore represent theprotolith age is irrelevant, because they would merelyrepresent the age of the source rock from which thehomogeneous granodiorite sheet was ultimately derivedand have no bearing on the emplacement age of thegranodiorite sheet itself, which has been the singularimportant goal of these studies.
Although a magmatic age of 3�6–3�65 Ga appearsplausible from the data discussed thus far, our new REEdata for group 2 zircon grains (which best representgrowth of zircon in this time period) suggest thatthis event more probably represented lower-crustalremelting of an older protolith (in the presence of garnetor another HREE-retaining phase). We investigate this inthe following two models.
Model 2: remelting of 3�84Ga gneiss at 3�62GaStructural and geochronological constraints discussed byWhitehouse & Fedo (2003) preclude a >3�65 Ga mag-matic age for the homogeneous granitoid sheet. It istherefore likely that the actual magmatic age is repres-ented by one of the two remaining age groups identified:either c. 3�62 or c. 2�7 Ga. In this section, we investigatethe constraints imposed by our REE data on these ages.
The distinctive HREE-depleted profiles seen in thegroup 2 zircon grains, as well as c. 3�62 Ga overgrowthson older cores (group 3a), are typical of zircon that hascrystallized and/or recrystallized in equilbrium with astrongly HREE-enriched phase of which garnet is mostlikely (e.g. Rubatto, 2002; Whitehouse & Platt, 2003). Asgarnet is not present in this granodiorite, we propose thatit was a residual phase during melting of an older proto-lith. Melting of a garnet-bearing mafic source, althoughcapable of producing a quartzofeldspathic melt, is con-sidered unlikely because a much steeper whole-rock REEprofile similar to typical TTGs (Fig. 3a) would beexpected (e.g. Martin, 1986). Furthermore, a non zircon-bearing mafic precursor would not yield older zircon,as seen in the cores of many of the SM/GR/97/8grains. Instead, we propose melting of a tonalite or
101
100
10-1
10-2
101
100
10-1
10-2
(Pr/
Sm
) N(D
y/Y
b) N
2.4 2.6 2.8 3.0 3.2 3.4 3.6 3.8 4.0207 206Pb/ Pb age (Ga)
1a1b
2
3a3b
4
Zircon group
100
10-1
10-2
10-3
Th/U
(a)
(b)
(c)
2.7
1G
a
3.6
2G
a
3.8
4G
a
flat LREE
steep LREE
steep HREE
flat HREE
Fig. 10. Temporal evolution of (a) extent of LREE depletion repres-ented by (Pr/Sm)N, (b) HREE enrichment expressed as (Dy/Yb)N, and(c) Th/U ratios. Dashed vertical lines represent the age (in Ma) ofdefined events in the Godthabsfjord region, as labelled in (a).
310
JOURNAL OF PETROLOGY VOLUME 46 NUMBER 2 FEBRUARY 2005 by guest on M
arch 6, 2015http://petrology.oxfordjournals.org/
Dow
nloaded from
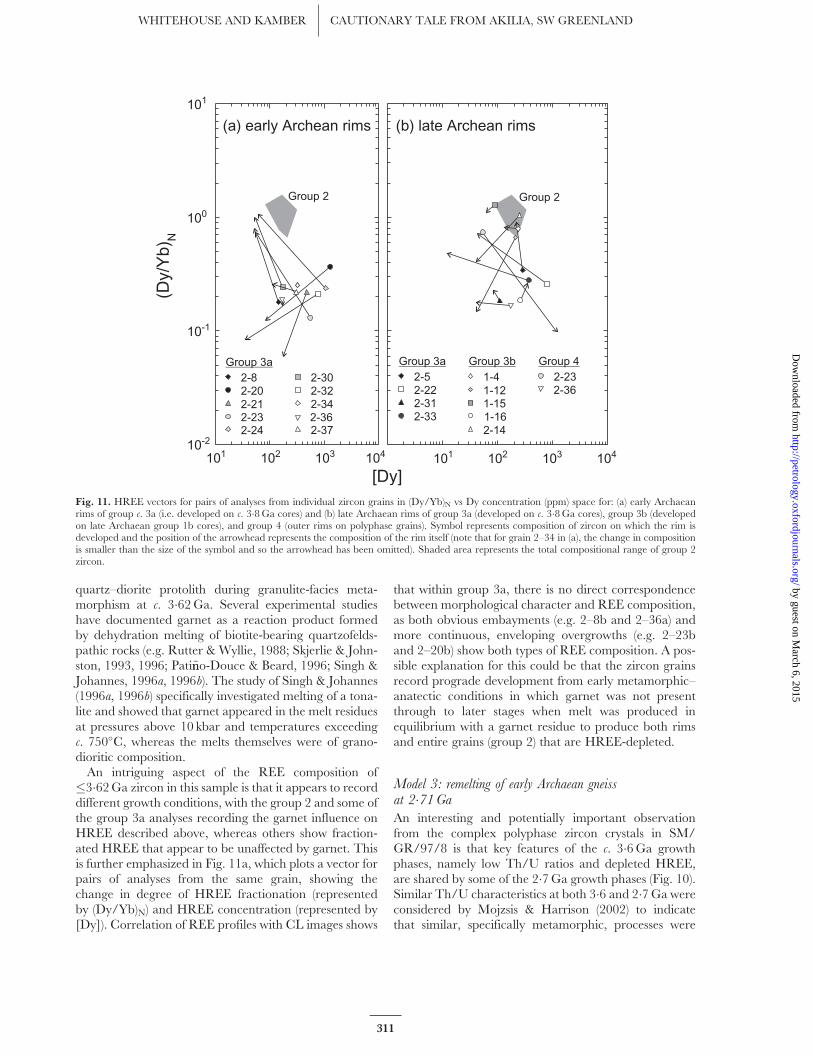
quartz–diorite protolith during granulite-facies meta-morphism at c. 3�62 Ga. Several experimental studieshave documented garnet as a reaction product formedby dehydration melting of biotite-bearing quartzofelds-pathic rocks (e.g. Rutter & Wyllie, 1988; Skjerlie & John-ston, 1993, 1996; Pati~nno-Douce & Beard, 1996; Singh &Johannes, 1996a, 1996b). The study of Singh & Johannes(1996a, 1996b) specifically investigated melting of a tona-lite and showed that garnet appeared in the melt residuesat pressures above 10 kbar and temperatures exceedingc. 750�C, whereas the melts themselves were of grano-dioritic composition.
An intriguing aspect of the REE composition of�3�62 Ga zircon in this sample is that it appears to recorddifferent growth conditions, with the group 2 and some ofthe group 3a analyses recording the garnet influence onHREE described above, whereas others show fraction-ated HREE that appear to be unaffected by garnet. Thisis further emphasized in Fig. 11a, which plots a vector forpairs of analyses from the same grain, showing thechange in degree of HREE fractionation (representedby (Dy/Yb)N) and HREE concentration (represented by[Dy]). Correlation of REE profiles with CL images shows
that within group 3a, there is no direct correspondencebetween morphological character and REE composition,as both obvious embayments (e.g. 2–8b and 2–36a) andmore continuous, enveloping overgrowths (e.g. 2–23band 2–20b) show both types of REE composition. A pos-sible explanation for this could be that the zircon grainsrecord prograde development from early metamorphic–anatectic conditions in which garnet was not presentthrough to later stages when melt was produced inequilibrium with a garnet residue to produce both rimsand entire grains (group 2) that are HREE-depleted.
Model 3: remelting of early Archaean gneissat 2�71GaAn interesting and potentially important observationfrom the complex polyphase zircon crystals in SM/GR/97/8 is that key features of the c. 3�6 Ga growthphases, namely low Th/U ratios and depleted HREE,are shared by some of the 2�7 Ga growth phases (Fig. 10).Similar Th/U characteristics at both 3�6 and 2�7 Ga wereconsidered by Mojzsis & Harrison (2002) to indicatethat similar, specifically metamorphic, processes were
101 102 103 104
101
100
10-1
10-2
[Dy]
(Dy/
Yb) N
2-82-202-212-232-24
2-302-322-34
2-372-36
Group 3a
Group 2
(a) early Archean rims
101 102 103 104
2-52-222-312-33
1-121-4
1-15
2-141-16
2-232-36
Group 2
Group 3a Group 3b Group 4
(b) late Archean rims
Fig. 11. HREE vectors for pairs of analyses from individual zircon grains in (Dy/Yb)N vs Dy concentration (ppm) space for: (a) early Archaeanrims of group c. 3a (i.e. developed on c. 3�8 Ga cores) and (b) late Archaean rims of group 3a (developed on c. 3�8 Ga cores), group 3b (developedon late Archaean group 1b cores), and group 4 (outer rims on polyphase grains). Symbol represents composition of zircon on which the rim isdeveloped and the position of the arrowhead represents the composition of the rim itself (note that for grain 2–34 in (a), the change in compositionis smaller than the size of the symbol and so the arrowhead has been omitted). Shaded area represents the total compositional range of group 2zircon.
311
WHITEHOUSE AND KAMBER CAUTIONARY TALE FROM AKILIA, SW GREENLAND by guest on M
arch 6, 2015http://petrology.oxfordjournals.org/
Dow
nloaded from
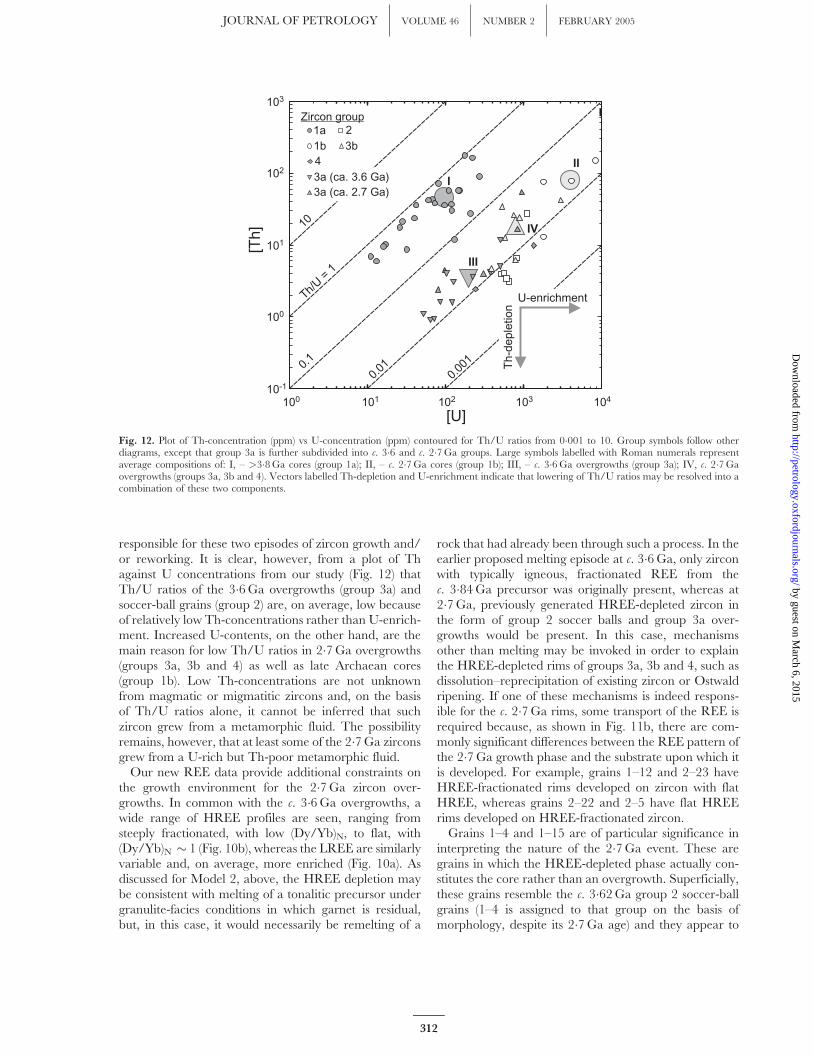
responsible for these two episodes of zircon growth and/or reworking. It is clear, however, from a plot of Thagainst U concentrations from our study (Fig. 12) thatTh/U ratios of the 3�6 Ga overgrowths (group 3a) andsoccer-ball grains (group 2) are, on average, low becauseof relatively low Th-concentrations rather than U-enrich-ment. Increased U-contents, on the other hand, are themain reason for low Th/U ratios in 2�7 Ga overgrowths(groups 3a, 3b and 4) as well as late Archaean cores(group 1b). Low Th-concentrations are not unknownfrom magmatic or migmatitic zircons and, on the basisof Th/U ratios alone, it cannot be inferred that suchzircon grew from a metamorphic fluid. The possibilityremains, however, that at least some of the 2�7 Ga zirconsgrew from a U-rich but Th-poor metamorphic fluid.
Our new REE data provide additional constraints onthe growth environment for the 2�7 Ga zircon over-growths. In common with the c. 3�6 Ga overgrowths, awide range of HREE profiles are seen, ranging fromsteeply fractionated, with low (Dy/Yb)N, to flat, with(Dy/Yb)N � 1 (Fig. 10b), whereas the LREE are similarlyvariable and, on average, more enriched (Fig. 10a). Asdiscussed for Model 2, above, the HREE depletion maybe consistent with melting of a tonalitic precursor undergranulite-facies conditions in which garnet is residual,but, in this case, it would necessarily be remelting of a
rock that had already been through such a process. In theearlier proposed melting episode at c. 3�6 Ga, only zirconwith typically igneous, fractionated REE from thec. 3�84 Ga precursor was originally present, whereas at2�7 Ga, previously generated HREE-depleted zircon inthe form of group 2 soccer balls and group 3a over-growths would be present. In this case, mechanismsother than melting may be invoked in order to explainthe HREE-depleted rims of groups 3a, 3b and 4, such asdissolution–reprecipitation of existing zircon or Ostwaldripening. If one of these mechanisms is indeed respons-ible for the c. 2�7 Ga rims, some transport of the REE isrequired because, as shown in Fig. 11b, there are com-monly significant differences between the REE pattern ofthe 2�7 Ga growth phase and the substrate upon which itis developed. For example, grains 1–12 and 2–23 haveHREE-fractionated rims developed on zircon with flatHREE, whereas grains 2–22 and 2–5 have flat HREErims developed on HREE-fractionated zircon.
Grains 1–4 and 1–15 are of particular significance ininterpreting the nature of the 2�7 Ga event. These aregrains in which the HREE-depleted phase actually con-stitutes the core rather than an overgrowth. Superficially,these grains resemble the c. 3�62 Ga group 2 soccer-ballgrains (1–4 is assigned to that group on the basis ofmorphology, despite its 2�7 Ga age) and they appear to
103
102
101
100
10-1
103102101100 104
[Th
]
[U]
U-enrichment
Th-d
eple
tion
1a1b
2
3a (ca. 3.6 Ga)3a (ca. 2.7 Ga)
3b4
Zircon group
Th/U
=1
0.1
10
0.01
0.00
1
I
II
III
IV
Fig. 12. Plot of Th-concentration (ppm) vs U-concentration (ppm) contoured for Th/U ratios from 0�001 to 10. Group symbols follow otherdiagrams, except that group 3a is further subdivided into c. 3�6 and c. 2�7 Ga groups. Large symbols labelled with Roman numerals representaverage compositions of: I, – >3�8 Ga cores (group 1a); II, – c. 2�7 Ga cores (group 1b); III, – c. 3�6 Ga overgrowths (group 3a); IV, c. 2�7 Gaovergrowths (groups 3a, 3b and 4). Vectors labelled Th-depletion and U-enrichment indicate that lowering of Th/U ratios may be resolved into acombination of these two components.
312
JOURNAL OF PETROLOGY VOLUME 46 NUMBER 2 FEBRUARY 2005 by guest on M
arch 6, 2015http://petrology.oxfordjournals.org/
Dow
nloaded from
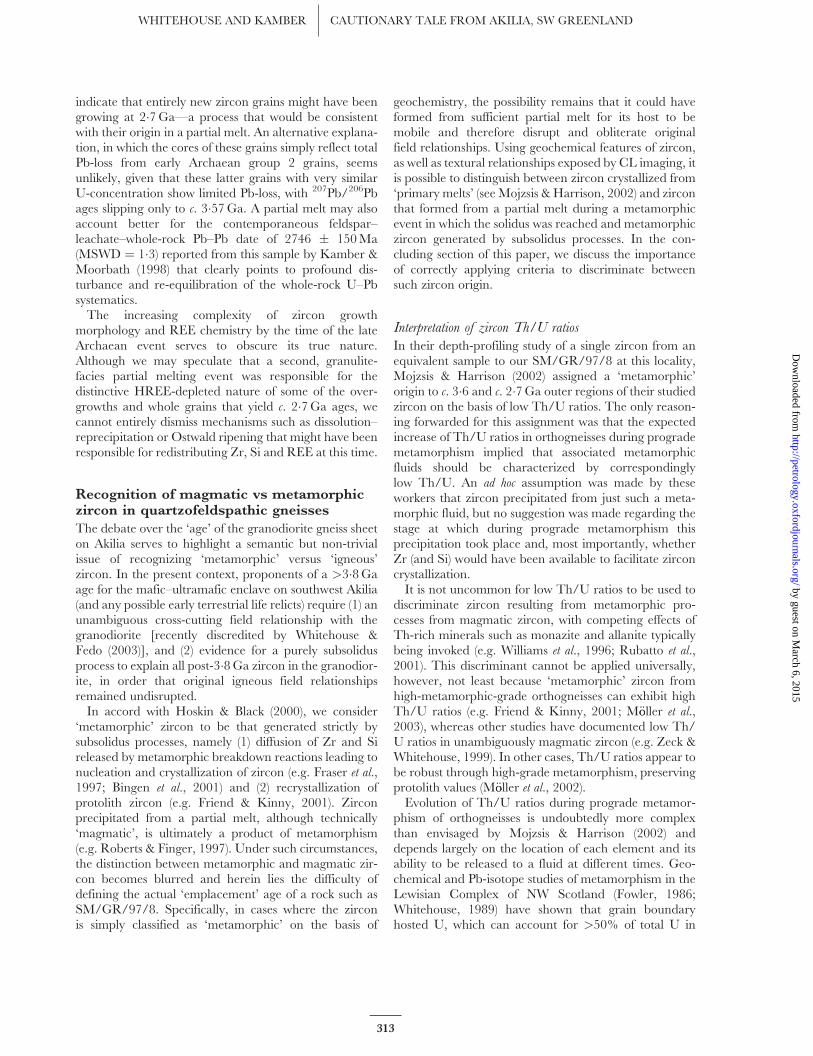
indicate that entirely new zircon grains might have beengrowing at 2�7 Ga—a process that would be consistentwith their origin in a partial melt. An alternative explana-tion, in which the cores of these grains simply reflect totalPb-loss from early Archaean group 2 grains, seemsunlikely, given that these latter grains with very similarU-concentration show limited Pb-loss, with 207Pb/206Pbages slipping only to c. 3�57 Ga. A partial melt may alsoaccount better for the contemporaneous feldspar–leachate–whole-rock Pb–Pb date of 2746 � 150 Ma(MSWD ¼ 1�3) reported from this sample by Kamber &Moorbath (1998) that clearly points to profound dis-turbance and re-equilibration of the whole-rock U–Pbsystematics.
The increasing complexity of zircon growthmorphology and REE chemistry by the time of the lateArchaean event serves to obscure its true nature.Although we may speculate that a second, granulite-facies partial melting event was responsible for thedistinctive HREE-depleted nature of some of the over-growths and whole grains that yield c. 2�7 Ga ages, wecannot entirely dismiss mechanisms such as dissolution–reprecipitation or Ostwald ripening that might have beenresponsible for redistributing Zr, Si and REE at this time.
Recognition of magmatic vs metamorphiczircon in quartzofeldspathic gneisses
The debate over the ‘age’ of the granodiorite gneiss sheeton Akilia serves to highlight a semantic but non-trivialissue of recognizing ‘metamorphic’ versus ‘igneous’zircon. In the present context, proponents of a >3�8 Gaage for the mafic–ultramafic enclave on southwest Akilia(and any possible early terrestrial life relicts) require (1) anunambiguous cross-cutting field relationship with thegranodiorite [recently discredited by Whitehouse &Fedo (2003)], and (2) evidence for a purely subsolidusprocess to explain all post-3�8 Ga zircon in the granodior-ite, in order that original igneous field relationshipsremained undisrupted.
In accord with Hoskin & Black (2000), we consider‘metamorphic’ zircon to be that generated strictly bysubsolidus processes, namely (1) diffusion of Zr and Sireleased by metamorphic breakdown reactions leading tonucleation and crystallization of zircon (e.g. Fraser et al.,1997; Bingen et al., 2001) and (2) recrystallization ofprotolith zircon (e.g. Friend & Kinny, 2001). Zirconprecipitated from a partial melt, although technically‘magmatic’, is ultimately a product of metamorphism(e.g. Roberts & Finger, 1997). Under such circumstances,the distinction between metamorphic and magmatic zir-con becomes blurred and herein lies the difficulty ofdefining the actual ‘emplacement’ age of a rock such asSM/GR/97/8. Specifically, in cases where the zirconis simply classified as ‘metamorphic’ on the basis of
geochemistry, the possibility remains that it could haveformed from sufficient partial melt for its host to bemobile and therefore disrupt and obliterate originalfield relationships. Using geochemical features of zircon,as well as textural relationships exposed by CL imaging, itis possible to distinguish between zircon crystallized from‘primary melts’ (see Mojzsis & Harrison, 2002) and zirconthat formed from a partial melt during a metamorphicevent in which the solidus was reached and metamorphiczircon generated by subsolidus processes. In the con-cluding section of this paper, we discuss the importanceof correctly applying criteria to discriminate betweensuch zircon origin.
Interpretation of zircon Th/U ratios
In their depth-profiling study of a single zircon from anequivalent sample to our SM/GR/97/8 at this locality,Mojzsis & Harrison (2002) assigned a ‘metamorphic’origin to c. 3�6 and c. 2�7 Ga outer regions of their studiedzircon on the basis of low Th/U ratios. The only reason-ing forwarded for this assignment was that the expectedincrease of Th/U ratios in orthogneisses during progrademetamorphism implied that associated metamorphicfluids should be characterized by correspondinglylow Th/U. An ad hoc assumption was made by theseworkers that zircon precipitated from just such a meta-morphic fluid, but no suggestion was made regarding thestage at which during prograde metamorphism thisprecipitation took place and, most importantly, whetherZr (and Si) would have been available to facilitate zirconcrystallization.
It is not uncommon for low Th/U ratios to be used todiscriminate zircon resulting from metamorphic pro-cesses from magmatic zircon, with competing effects ofTh-rich minerals such as monazite and allanite typicallybeing invoked (e.g. Williams et al., 1996; Rubatto et al.,2001). This discriminant cannot be applied universally,however, not least because ‘metamorphic’ zircon fromhigh-metamorphic-grade orthogneisses can exhibit highTh/U ratios (e.g. Friend & Kinny, 2001; M€ooller et al.,2003), whereas other studies have documented low Th/U ratios in unambiguously magmatic zircon (e.g. Zeck &Whitehouse, 1999). In other cases, Th/U ratios appear tobe robust through high-grade metamorphism, preservingprotolith values (M€ooller et al., 2002).
Evolution of Th/U ratios during prograde metamor-phism of orthogneisses is undoubtedly more complexthan envisaged by Mojzsis & Harrison (2002) anddepends largely on the location of each element and itsability to be released to a fluid at different times. Geo-chemical and Pb-isotope studies of metamorphism in theLewisian Complex of NW Scotland (Fowler, 1986;Whitehouse, 1989) have shown that grain boundaryhosted U, which can account for >50% of total U in
313
WHITEHOUSE AND KAMBER CAUTIONARY TALE FROM AKILIA, SW GREENLAND by guest on M
arch 6, 2015http://petrology.oxfordjournals.org/
Dow
nloaded from
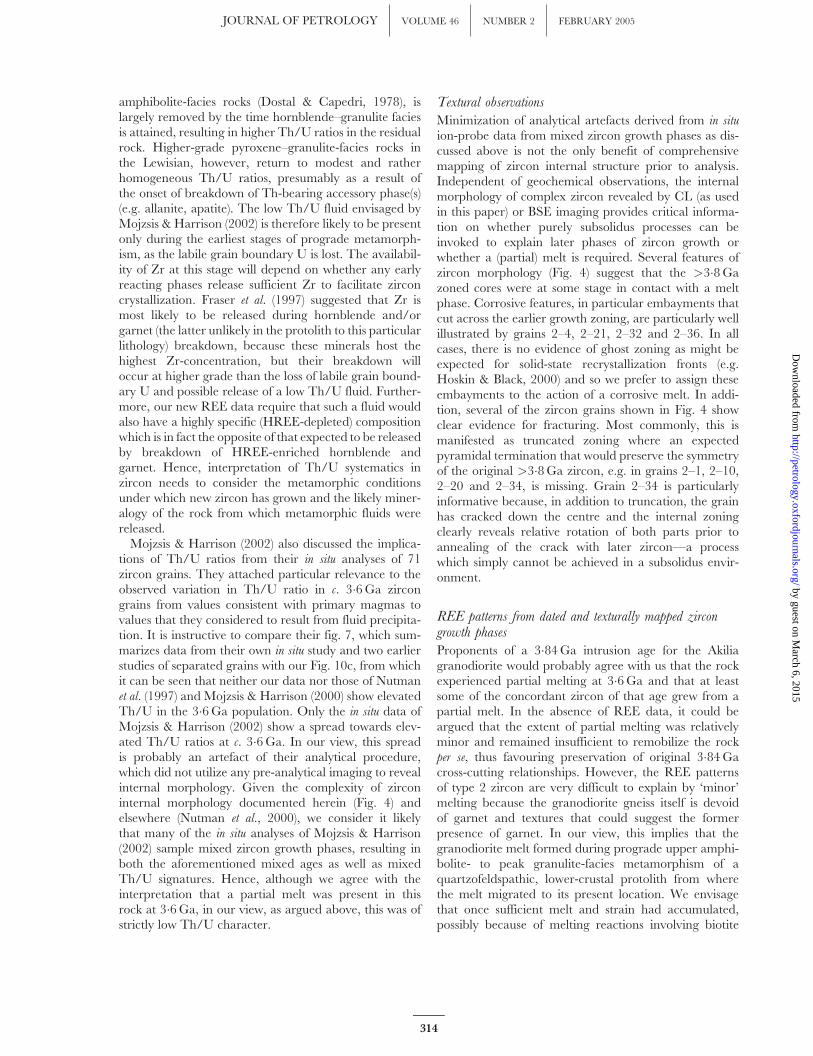
amphibolite-facies rocks (Dostal & Capedri, 1978), islargely removed by the time hornblende–granulite faciesis attained, resulting in higher Th/U ratios in the residualrock. Higher-grade pyroxene–granulite-facies rocks inthe Lewisian, however, return to modest and ratherhomogeneous Th/U ratios, presumably as a result ofthe onset of breakdown of Th-bearing accessory phase(s)(e.g. allanite, apatite). The low Th/U fluid envisaged byMojzsis & Harrison (2002) is therefore likely to be presentonly during the earliest stages of prograde metamorph-ism, as the labile grain boundary U is lost. The availabil-ity of Zr at this stage will depend on whether any earlyreacting phases release sufficient Zr to facilitate zirconcrystallization. Fraser et al. (1997) suggested that Zr ismost likely to be released during hornblende and/orgarnet (the latter unlikely in the protolith to this particularlithology) breakdown, because these minerals host thehighest Zr-concentration, but their breakdown willoccur at higher grade than the loss of labile grain bound-ary U and possible release of a low Th/U fluid. Further-more, our new REE data require that such a fluid wouldalso have a highly specific (HREE-depleted) compositionwhich is in fact the opposite of that expected to be releasedby breakdown of HREE-enriched hornblende andgarnet. Hence, interpretation of Th/U systematics inzircon needs to consider the metamorphic conditionsunder which new zircon has grown and the likely miner-alogy of the rock from which metamorphic fluids werereleased.
Mojzsis & Harrison (2002) also discussed the implica-tions of Th/U ratios from their in situ analyses of 71zircon grains. They attached particular relevance to theobserved variation in Th/U ratio in c. 3�6 Ga zircongrains from values consistent with primary magmas tovalues that they considered to result from fluid precipita-tion. It is instructive to compare their fig. 7, which sum-marizes data from their own in situ study and two earlierstudies of separated grains with our Fig. 10c, from whichit can be seen that neither our data nor those of Nutmanet al. (1997) and Mojzsis & Harrison (2000) show elevatedTh/U in the 3�6 Ga population. Only the in situ data ofMojzsis & Harrison (2002) show a spread towards elev-ated Th/U ratios at c. 3�6 Ga. In our view, this spreadis probably an artefact of their analytical procedure,which did not utilize any pre-analytical imaging to revealinternal morphology. Given the complexity of zirconinternal morphology documented herein (Fig. 4) andelsewhere (Nutman et al., 2000), we consider it likelythat many of the in situ analyses of Mojzsis & Harrison(2002) sample mixed zircon growth phases, resulting inboth the aforementioned mixed ages as well as mixedTh/U signatures. Hence, although we agree with theinterpretation that a partial melt was present in thisrock at 3�6 Ga, in our view, as argued above, this was ofstrictly low Th/U character.
Textural observations
Minimization of analytical artefacts derived from in situ
ion-probe data from mixed zircon growth phases as dis-cussed above is not the only benefit of comprehensivemapping of zircon internal structure prior to analysis.Independent of geochemical observations, the internalmorphology of complex zircon revealed by CL (as usedin this paper) or BSE imaging provides critical informa-tion on whether purely subsolidus processes can beinvoked to explain later phases of zircon growth orwhether a (partial) melt is required. Several features ofzircon morphology (Fig. 4) suggest that the >3�8 Gazoned cores were at some stage in contact with a meltphase. Corrosive features, in particular embayments thatcut across the earlier growth zoning, are particularly wellillustrated by grains 2–4, 2–21, 2–32 and 2–36. In allcases, there is no evidence of ghost zoning as might beexpected for solid-state recrystallization fronts (e.g.Hoskin & Black, 2000) and so we prefer to assign theseembayments to the action of a corrosive melt. In addi-tion, several of the zircon grains shown in Fig. 4 showclear evidence for fracturing. Most commonly, this ismanifested as truncated zoning where an expectedpyramidal termination that would preserve the symmetryof the original >3�8 Ga zircon, e.g. in grains 2–1, 2–10,2–20 and 2–34, is missing. Grain 2–34 is particularlyinformative because, in addition to truncation, the grainhas cracked down the centre and the internal zoningclearly reveals relative rotation of both parts prior toannealing of the crack with later zircon—a processwhich simply cannot be achieved in a subsolidus envir-onment.
REE patterns from dated and texturally mapped zircongrowth phases
Proponents of a 3�84 Ga intrusion age for the Akiliagranodiorite would probably agree with us that the rockexperienced partial melting at 3�6 Ga and that at leastsome of the concordant zircon of that age grew from apartial melt. In the absence of REE data, it could beargued that the extent of partial melting was relativelyminor and remained insufficient to remobilize the rockper se, thus favouring preservation of original 3�84 Gacross-cutting relationships. However, the REE patternsof type 2 zircon are very difficult to explain by ‘minor’melting because the granodiorite gneiss itself is devoidof garnet and textures that could suggest the formerpresence of garnet. In our view, this implies that thegranodiorite melt formed during prograde upper amphi-bolite- to peak granulite-facies metamorphism of aquartzofeldspathic, lower-crustal protolith from wherethe melt migrated to its present location. We envisagethat once sufficient melt and strain had accumulated,possibly because of melting reactions involving biotite
314
JOURNAL OF PETROLOGY VOLUME 46 NUMBER 2 FEBRUARY 2005 by guest on M
arch 6, 2015http://petrology.oxfordjournals.org/
Dow
nloaded from
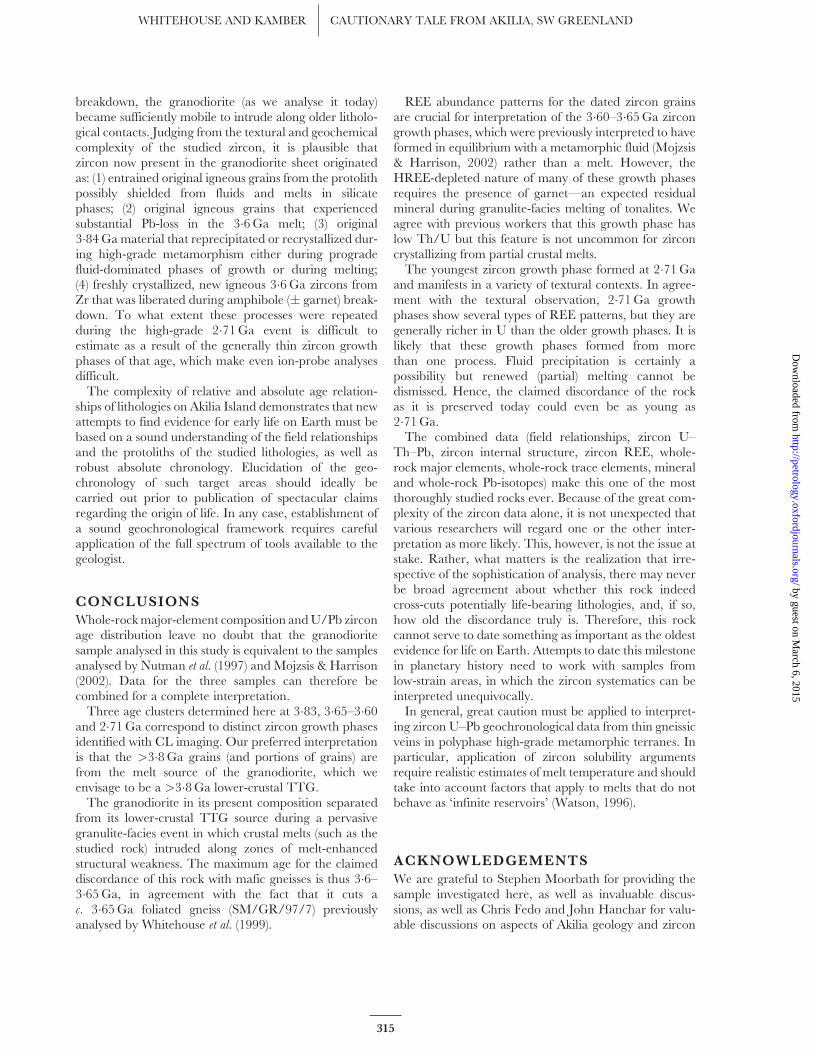
breakdown, the granodiorite (as we analyse it today)became sufficiently mobile to intrude along older litholo-gical contacts. Judging from the textural and geochemicalcomplexity of the studied zircon, it is plausible thatzircon now present in the granodiorite sheet originatedas: (1) entrained original igneous grains from the protolithpossibly shielded from fluids and melts in silicatephases; (2) original igneous grains that experiencedsubstantial Pb-loss in the 3�6 Ga melt; (3) original3�84 Ga material that reprecipitated or recrystallized dur-ing high-grade metamorphism either during progradefluid-dominated phases of growth or during melting;(4) freshly crystallized, new igneous 3�6 Ga zircons fromZr that was liberated during amphibole (� garnet) break-down. To what extent these processes were repeatedduring the high-grade 2�71 Ga event is difficult toestimate as a result of the generally thin zircon growthphases of that age, which make even ion-probe analysesdifficult.
The complexity of relative and absolute age relation-ships of lithologies on Akilia Island demonstrates that newattempts to find evidence for early life on Earth must bebased on a sound understanding of the field relationshipsand the protoliths of the studied lithologies, as well asrobust absolute chronology. Elucidation of the geo-chronology of such target areas should ideally becarried out prior to publication of spectacular claimsregarding the origin of life. In any case, establishment ofa sound geochronological framework requires carefulapplication of the full spectrum of tools available to thegeologist.
CONCLUSIONS
Whole-rock major-element composition and U/Pb zirconage distribution leave no doubt that the granodioritesample analysed in this study is equivalent to the samplesanalysed by Nutman et al. (1997) and Mojzsis & Harrison(2002). Data for the three samples can therefore becombined for a complete interpretation.
Three age clusters determined here at 3�83, 3�65–3�60and 2�71 Ga correspond to distinct zircon growth phasesidentified with CL imaging. Our preferred interpretationis that the >3�8 Ga grains (and portions of grains) arefrom the melt source of the granodiorite, which weenvisage to be a >3�8 Ga lower-crustal TTG.
The granodiorite in its present composition separatedfrom its lower-crustal TTG source during a pervasivegranulite-facies event in which crustal melts (such as thestudied rock) intruded along zones of melt-enhancedstructural weakness. The maximum age for the claimeddiscordance of this rock with mafic gneisses is thus 3�6–3�65 Ga, in agreement with the fact that it cuts ac. 3�65 Ga foliated gneiss (SM/GR/97/7) previouslyanalysed by Whitehouse et al. (1999).
REE abundance patterns for the dated zircon grainsare crucial for interpretation of the 3�60–3�65 Ga zircongrowth phases, which were previously interpreted to haveformed in equilibrium with a metamorphic fluid (Mojzsis& Harrison, 2002) rather than a melt. However, theHREE-depleted nature of many of these growth phasesrequires the presence of garnet—an expected residualmineral during granulite-facies melting of tonalites. Weagree with previous workers that this growth phase haslow Th/U but this feature is not uncommon for zirconcrystallizing from partial crustal melts.
The youngest zircon growth phase formed at 2�71 Gaand manifests in a variety of textural contexts. In agree-ment with the textural observation, 2�71 Ga growthphases show several types of REE patterns, but they aregenerally richer in U than the older growth phases. It islikely that these growth phases formed from morethan one process. Fluid precipitation is certainly apossibility but renewed (partial) melting cannot bedismissed. Hence, the claimed discordance of the rockas it is preserved today could even be as young as2�71 Ga.
The combined data (field relationships, zircon U–Th–Pb, zircon internal structure, zircon REE, whole-rock major elements, whole-rock trace elements, mineraland whole-rock Pb-isotopes) make this one of the mostthoroughly studied rocks ever. Because of the great com-plexity of the zircon data alone, it is not unexpected thatvarious researchers will regard one or the other inter-pretation as more likely. This, however, is not the issue atstake. Rather, what matters is the realization that irre-spective of the sophistication of analysis, there may neverbe broad agreement about whether this rock indeedcross-cuts potentially life-bearing lithologies, and, if so,how old the discordance truly is. Therefore, this rockcannot serve to date something as important as the oldestevidence for life on Earth. Attempts to date this milestonein planetary history need to work with samples fromlow-strain areas, in which the zircon systematics can beinterpreted unequivocally.
In general, great caution must be applied to interpret-ing zircon U–Pb geochronological data from thin gneissicveins in polyphase high-grade metamorphic terranes. Inparticular, application of zircon solubility argumentsrequire realistic estimates of melt temperature and shouldtake into account factors that apply to melts that do notbehave as ‘infinite reservoirs’ (Watson, 1996).
ACKNOWLEDGEMENTS
We are grateful to Stephen Moorbath for providing thesample investigated here, as well as invaluable discus-sions, as well as Chris Fedo and John Hanchar for valu-able discussions on aspects of Akilia geology and zircon
315
WHITEHOUSE AND KAMBER CAUTIONARY TALE FROM AKILIA, SW GREENLAND by guest on M
arch 6, 2015http://petrology.oxfordjournals.org/
Dow
nloaded from
geochemistry, respectively. We also thank Roland Maasand John Myers for their detailed and constructivereviews. The ion microprobe facility in Stockholm(Nordsims) is operated under an agreement between thejoint Nordic research councils (NOS-N), the GeologicalSurvey of Finland and the Swedish Museum of NaturalHistory. This paper is Nordsims publication 106.
REFERENCES
Anders, E. & Grevasse, N. (1989). Abundances of elements: meteoritic
and solar. Geochimica et Cosmochimica Acta 53, 197–214.
Barker, F. (1979). Trondhjemite: definition, environment and
hypotheses of origin. In: Barker, F. (ed.) Trondhjemites, Dacites and
Related Rocks. Amsterdam: Elsevier, pp. 1–12.
Belshaw, N. S., O’Nions, R. K., Martel, D. J. & Burton, K. W. (1994).
High-resolution SIMS analysis of common lead. Chemical Geology 112,
57–70.
Bingen J., Austrheim, H. & Whitehouse, M. (2001). Ilmenite as a
source for zirconium during high-grade metamorphism? Textural
evidence from the Caledonides of W. Norway and implications for
zircon geochronology. Journal of Petrology 42, 355–375.
Bolhar, R., Kamber, B. S., Moorbath, S., Fedo, C. M. & Whitehouse,
M. J. (2004). Characterisation of early Archaean chemical sediments
by trace element signatures. Earth and Planetary Science Letters 222,
43–60.
Clemens, J. D. & Vielzeuf, D. (1987). Constraints on melting and
magma production in the crust. Earth and Planetary Science Letters 86,
287–306.
De la Roche, H., Leterrier, J., Grandclaude, P. & Marchal, M. (1980).
A classification of volcanic and plutonic rocks using R1R2-diagram
and major-element analyses: its relationships with current
nomenclature. Chemical Geology 29, 183–210.
Dostal, J. & Capedri, S. (1978). Uranium in metamorphic rocks.
Contributions to Mineralogy and Petrology 66, 409–414.
Fedo, C. M. & Whitehouse, M. J. (2002). Metasomatic origin of
quartz–pyroxene rock, Akilia, Greenland, and implications for
Earth’s earliest life. Science 296, 1448–1452.
Fowler, M. B. (1986). Large-ion lithophile element characteristics of an
amphibolite facies to granulite facies transition at Gruinard Bay,
north-west Scotland. Journal of Metamorphic Geology 4, 345–359.
Fraser, G., Ellis, D. & Eggins, S. (1997). Zirconium abundance in
granulite-facies minerals, with implications for zircon geochronology
in high-grade rocks. Geology 25, 607–610.
Friend, C. R. L. & Kinny, P. D. (2001). A reappraisal of the Lewisian
gneiss complex; geochronological evidence for its tectonic assembly
from disparate terranes in the Proterozoic. Contributions to Mineralogy
and Petrology 142, 198–218.
Hanchar, J. M. & Watson, E. B. (2003). Zircon saturation thermo-
metry. In: Hanchar, J. M. & Hoskin, P. W. O. (eds) Zircon. Reviews in
Mineralogy and Geochemistry 53, 89–112.
Hollister, L. S. & Crawford, M. L. (1986). Melt-enhanced deformation:
a major tectonic process. Geology 14, 558–561.
Hoskin, P. W. O. & Black, L. P. (2000). Metamorphic zircon formation
by solid-state recrystallisation of protolith igneous zircon. Journal of
Metamorphic Geology 18, 423–439.
Hoskin, P. W. O. & Schaltegger, U. (2003). The composition of zircon
and igneous and metamorphic petrogenesis. In: Hanchar, J. M. &
Hoskin, P. W. O. (eds) Zircon. Reviews in Mineralogy and Geochemistry 53,
89–112.
Kamber, B. S. & Moorbath, S. (1998). Initial Pb of the Am��tsoq gneiss
revisited: implication for the timing of early Archaean crustal
evolution in West Greenland. Chemical Geology 150, 19–41.
Kamber, B. S., Ewart, A., Collerson, K. D., Bruce, M. C. &
McDonald, G. D. (2002). Fluid-mobile trace element constraints on
the role of slab melting and implications for Archaean crustal growth
models. Contributions to Mineralogy and Petrology 144, 38–56.
Kamber, B. S., Greig, A., Schoenberg, R. & Collerson, K. D. (2003). A
refined solution to Earth’s hidden niobium: implications for
evolution of continental crust and depth of core formation.
Precambrian Research 126, 289–308.
Kleinhanns, I. C., Kramers, J. D. & Kamber, B. S. (2003). Importance
of water for Archaean granitoid petrology: a comparative study of
TTG and potassic granitoids from Barberton Mountain
Land, South Africa. Contributions to Mineralogy and Petrology 145,
377–389.
Le Maitre, R. W. (2002). Igneous Rocks: A Classification and Glossary of
Terms, 2nd edn. Cambridge: Cambridge University Press.
Lepland, A., van Zuilen, M. A., Arrhenius, G. A., Whitehouse, M. J. &
Fedo, C. M. (2005). Questioning the evidence for Earth’s earliest life:
Akilia revisited. Geology (in press).
McGregor, V. R. & Mason, B. (1977). Petrogenesis and geochemistry
of metabasaltic and metasedimentary enclaves in the Am��tsoq
gneisses, West Greenland. American Mineralogist 62, 887–904.
Martin, H. (1986). Effect of steeper Archaean geothermal
gradient on geochemistry of subduction zone magmas. Geology 14,
753–756.
Mojzsis, S. J. & Harrison, T. M. (2000). Vestiges of a beginning: clues
to the emergent biosphere recorded in the oldest known sedimentary
rocks. GSA Today 10, 1–6.
Mojzsis, S. J. & Harrison, T. M. (2002). Establishment of a 3�83 Ga
magmatic age for the Akilia tonalite (southern West Greenland).
Earth and Planetary Science Letters 202, 563–576.
Mojzsis, S. J., Arrhenius, G., McKeegan, K. D., Harrison, T. M.,
Nutman, A. P. & Friend, C. R. L. (1996). Evidence for life on Earth
before 3,800 million years ago. Nature 384, 55–59.
M€ooller, A., O’Brien, P. J., Kennedy, A. & Kr€ooner, A. (2002). Polyphase
zircon in ultrahigh-temperature granulites (Rogaland, SW Norway):
constraints for Pb diffusion in zircon. Journal of Metamorphic Geology 20,
727–740.
M€ooller, A., O’Brien, P. J., Kennedy, A. & Kr€ooner, A. (2003). Linking
growth episodes of zircon and metamorphic textures to zircon
chemistry: an example from the ultrahigh-temperature granulites of
Rogaland (SW Norway). In: Vance, D., Muller, W. & Villa, I. (eds)
Geochronology: Linking the Isotopic Record with Petrology and Textures.
Geological Society, London, Special Publications 220, 65–81.
Muentener, O., Kelemen, P. B. & Grove, T. L. (2001). The role of
H2O during crystallization of primitive arc magmas under upper-
most mantle conditions and genesis of igneous pyroxenites: an
experimental study. Contributions to Mineralogy and Petrology 141,
643–658.
Myers, J. S. & Crowley, J. L. (2000). Vestiges of life in the oldest
Greenland rocks? A review of early Archaean geology of the
Godthabsfjord region, and reappraisal of field evidence for
>3850 Ma life on Akilia. Precambrian Research 103, 101–124.
Nutman, A. P., McGregor, V. R., Friend, C. R. L., Bennett, V. C. &
Kinny, P. D. (1996). The Itsaq Gneiss Complex of southern West
Greenland: the world’s most extensive record of early crustal
evolution (3900–3600 Ma). Precambrian Research 78, 1–39.
Nutman, A. P., Mojzsis, S. J. & Friend, C. R. L. (1997). Recognition of
�3850 Ma water-lain sediments in West Greenland and their
significance for the early Archaean Earth. Geochimica et Cosmochimica
Acta 61, 2475–2484.
316
JOURNAL OF PETROLOGY VOLUME 46 NUMBER 2 FEBRUARY 2005 by guest on M
arch 6, 2015http://petrology.oxfordjournals.org/
Dow
nloaded from
Nutman, A. P., Bennett, V. C., Friend, C. R. L. & Norman, M. D.
(1999). Meta-igneous (non-gneissic) tonalites and quartz-diorites
from an extensive c. 3800 Ma terrain south of the Isua supracrustal
belt, southern West Greenland: constraints on early crust formation.
Contributions to Mineralogy and Petrology 137, 364–388.
Nutman, A. P., Bennett, V. C., Friend, C. R. L. & McGregor, V. R.
(2000). The early Archaean Itsaq Gneiss Complex of southern West
Greenland: the importance of field observations in interpreting age
and isotopic constraints for early terrestrial evolution. Geochimica et
Cosmochimica Acta 64, 3035–3060.
Nutman, A. P., Friend, C. R. L. & Bennett, V. C. (2001). Age
significance of U–Th–Pb zircon data from early Archaean rocks of
west Greenland: a reassessment based on combined ion-microprobe
and imaging studies—comment. Chemical Geology 175, 191–199.
Nutman, A. P., McGregor, V. R., Shiraishi, K., Friend, C. R. L.,
Bennett, V. C. & Kinny, P. D. (2002). �3850 Ma BIF and mafic
inclusions in the early Archaean Itsaq Gneiss Complex around
Akilia, southern West Greenland? The difficulties of precise dating
of zircon-free protoliths in migmatites. Precambrian Research 117,
185–224.
Pearce, N. J. G., Perkins, W. T., Westgate, J. A., Gorton, M. P.,
Jackson, S. E., Neal, C. R., et al. (1996). A compilation of new and
published major and trace element data for NIST SRM 610 and
NIST SRM 612 glass reference materials. Geostandards Newsletter 21,
115–144.
Pati~nno-Douce, A. E. & Beard, J. S. (1996). Effects of P, fO2 and Mg/Fe
ratio on dehydration melting of model metagreywackes. Journal of
Petrology 37, 999–1024.
Peters, T. & Kamber, B. S. (1994). Peraluminous, potassium-rich
granitoids in the Semail Ophiolite. Contributions to Mineralogy and
Petrology 118, 229–238.
Pryer, L. L. (1993). Microstructures in feldspars from a major crustal
thrust zone: the Grenville Front, Ontario, Canada. Journal of
Structural Geology 15, 21–36.
Roberts, M. P. & Finger, F. (1997). Do U–Pb zircon ages from
granulites reflect peak metamorphic conditions? Geology 25, 319–322.
Rubatto, D. (2002). Zircon trace element geochemistry: partitioning
with garnet and the link between U–Pb ages and metamorphism.
Chemical Geology 184, 123–138.
Rubatto, D., Williams, I. S. & Buick, I. S. (2001). Zircon and monazite
response to prograde metamorphism in the Reynolds Range, central
Australia. Contributions to Mineralogy and Petrology 140, 458–468.
Rudnick, R. L. & Fountain, D. M. (1995). Nature and composition of
the continental crust: a lower crustal perspective. Reviews of Geophysics
33, 267–309.
Rutter, M. J. & Wyllie, P. J. (1988). Melting of vapour-absent tonalite at
10 kbar to simulate dehydration-melting in the deep crust. Nature
331, 159–160.
Sawyer, E. W. (1994). Melt segregation in the continental crust. Geology
22, 1019–1022.
Shannon, D. (1976). Revised effective ioni radii and systematic
studies of interatomic distances in halides and chalcogenides. Acta
Crystallographica A32, 751–767.
Singh, J. & Johannes, W. (1996a). Dehydration melting of tonalites:
Part I, Beginning of melting. Contributions to Mineralogy and Petrology
125, 16–25.
Singh, J. & Johannes, W. (1996b). Dehydration melting of tonalites:
Part II, Composition of melts and solids. Contributions to Mineralogy and
Petrology 125, 26–44.
Skjerlie, K. P. & Johnston, A. D. (1993). Fluid-absent melting behavior
of an F-rich tonalitic gneiss at mid-crustal pressures; implications
for the generation of anorogenic granites. Journal of Petrology 34,
785–815.
Skjerlie, K. P. & Johnston, A. D. (1996). Vapour-absent melting from
10 to 20 kbar of crustal rocks that contain multiple hydrous phases;
implications for anatexis in the deep to very deep continental crust
and active continental margins. Journal of Petrology 37, 661–691.
Steiger, R. H. & J€aager, E. (1977). Subcommission on geochronology:
convention on the use of decay constants in geo- and
cosmochronology. Earth and Planetary Science Letters 36, 359–362.
Streckeisen, A. (1976). To each plutonic rock its proper name. Earth-
Science Reviews 12, 1–33.
Sun, S. S. & McDonough, W. F. (1989). Chemical and isotopic
systematics of oceanic basalts: implications for mantle composition
and processes. In: Saunders, A. D. & Norry, M. J. (eds) Magmatism
in the Ocean Basins. Geological Society, London, Special Publications 42,
313–345.
Tomaschek, F., Kennedy, A. K., Villa, I. M., Lagos, M. & Ballhaus, C.
(2003). Zircons from Syros, Cyclades, Greece: recrystallization and
mobilization of zircon during high-pressure metamorphism. Journal
of Petrology 44, 1977–2002.
Vavra, G., Schmid, R. & Gebauer, D. (1999). Internal morphology,
habit and U–Th–Pb microanalysis of amphibolite-to-granulite
facies zircons: geochronology of the Ivrea Zone (southern Alps).
Contributions to Mineralogy and Petrology 134, 380–404.
Villa, I. M. (1998). Isotopic closure. Terra Nova 10, 42–47.
Watson, E. B. (1996). Dissolution, growth and survival of zircons
during crustal fusion: kinetic principles, geological models and
implications for isotopic inheritance. Transactions of the Royal Society of
Edinburgh: Earth Sciences 87, 43–56.
Watson, E. B. & Harrison, T. M. (1983). Zircon saturation revisited:
temperature and composition effects in a variety of crustal magma
types. Earth and Planetary Science Letters 64, 295–304.
Whitehouse, M. J. (1989). Pb-isotopic evidence for U–Th–Pb
behaviour in a prograde amphibolite to granulite facies transition
from the Lewisian Complex of Northwest Scotland. Geochimica et
Cosmochimica Acta 53, 717–724.
Whitehouse, M. J. (2004). Multi-collector SIMS analysis of trace
lanthanides in zircon (ZrSiO4). Geostandards and Geoanalytical Research
28, 105–201.
Whitehouse, M. J. & Kamber, B. S. (2002). On the overabundance of
light rare earth elements in terrestrial zircons and its implications for
Earth’s earliest magmatic differentiation. Earth and Planetary Science
Letters 204, 333–346.
Whitehouse, M. J. & Fedo, C. M. (2003). Deformation features and
critical field relationships of early Archaean rocks, Akilia, southwest
Greenland. Precambrian Research 126, 259–271.
Whitehouse, M. J. & Kamber, B. S. (2003). A rare earth element study
of complex zircons from early Archaean Am��tsoq gneisses,
Godthabsfjord, south-west Greenland. Precambrian Research 126,
363–377.
Whitehouse, M. J. & Platt, J. P. (2003). Dating high-grade
metamorphism: constraints from rare-earth elements in zircon and
garnet. Contributions to Mineralogy and Petrology 145, 61–74.
Whitehouse, M. J., Claesson, S., Sunde, T. & Vestin, J. (1997).
Ion-microprobe U–Pb zircon geochronology and correlation of
Archaean gneisses from the Lewisian Complex of Gruinard Bay,
north-west Scotland. Geochimica et Cosmochimica Acta 61, 4429–4438.
Whitehouse, M. J., Kamber, B. & Moorbath, S. (1999). Age
significance of U–Th–Pb zircon data from early Archaean rocks of
west Greenland: a reassessment based on combined ion-microprobe
and imaging studies. Chemical Geology 160, 201–224.
Whitehouse, M. J., Kamber, B. & Moorbath, S. (2001). Age
significance of U–Th–Pb zircon data from early Archaean rocks of
west Greenland: a reassessment based on combined ion-microprobe
and imaging studies. Chemical Geology 175, 201–208.
317
WHITEHOUSE AND KAMBER CAUTIONARY TALE FROM AKILIA, SW GREENLAND by guest on M
arch 6, 2015http://petrology.oxfordjournals.org/
Dow
nloaded from
Wiedenbeck, M., All�ee, P., Corfu, F., Griffin, W. L., Meier, M.,
Oberli, F., et al. (1995). Three natural zircon standards for U–Th–
Pb, Lu–Hf, trace element and REE analysis. Geostandards Newsletter
19, 1–23.
Wiedenbeck, M., Hanchar, J., Peck, W. H., Sylvester, P.,
Valley, J., Whitehouse, M., et al. (2004). Further characterization
of the 91500 zircon crystal. Geostandards and Geoanalytical Research 28,
9–39.
Williams, I. S., Buick, I. S. & Cartwright, I. (1996). An extended episode
of early Mesoproterozoic metamorphic fluid flow in the Reynolds
Range, central Australia. Journal of Metamorphic Geology 14, 29–47.
Zeck, H. P. & Whitehouse, M. J. (1999). Hercynian, Pan-African,
Proterozoic and Archean ion-microprobe zircon ages for a Betic–Rif
core complex, Alpine belt, W. Mediterranean: consequences
for its P–T–t path. Contributions to Mineralogy and Petrology 134,
134–149.
318
JOURNAL OF PETROLOGY VOLUME 46 NUMBER 2 FEBRUARY 2005 by guest on M
arch 6, 2015http://petrology.oxfordjournals.org/
Dow
nloaded from