Estimating a Marginal Causal Odds Ratio Subject to Confounding
Upload
independentCategory
view
5download
0
Hindawi Publishing CorporationJournal of ObesityVolume 2011, Article ID 561432, 5 pagesdoi:10.1155/2011/561432
Research Article
Population-Based Estimates of Physical Activity forAdults with Type 2 Diabetes: A Cautionary Tale of PotentialConfounding by Weight Status
Ronald C. Plotnikoff,1, 2, 3, 4 Steven T. Johnson,5 Constantinos A. Loucaides,3, 4, 6
Adrian E. Bauman,7 Nandini D. Karunamuni,3 and Michael A. Pickering3, 4
1 School of Education, University of Newcastle, University Drive, Callaghan, NSW 2308, Australia2 Centre for Health Promotion Studies, School of Public Health, University of Alberta, Edmonton, AB, Canada T6G 2R33 Physical Activity and Population Health Research Laboratory, Faculty of Physical Education and Recreation, University of Alberta,Edmonton, AB, Canada T6G 2R3
4 Alberta Centre for Active Living, Edmonton, AB, Canada T5M 3K65 Centre for Nursing and Health Studies, Faculty of Health Disciplines, Athabasca University, Athabasca, AB, Canada T95 3A36 The Open University of Cyprus, 1055 Nicosia, Cyprus7 Centre for Physical Activity and Health, School of Public Health, University of Sydney, Sydney, NSW 2006, Australia
Correspondence should be addressed to Ronald C. Plotnikoff, [email protected]
Received 26 May 2010; Revised 10 August 2010; Accepted 13 August 2010
Academic Editor: Robert J. Ross
Copyright © 2011 Ronald C. Plotnikoff et al. This is an open access article distributed under the Creative Commons AttributionLicense, which permits unrestricted use, distribution, and reproduction in any medium, provided the original work is properlycited.
At a population level, the method used to determine those meeting physical activity guidelines has important implications, asestimating “sufficient” physical activity might be confounded by weight status. The objective of this study was to test the differencebetween three methods in estimating the prevalence of “sufficient activity” among Canadian adults with type 2 diabetes in alarge population sample (N = 1614) while considering the role of weight status as a potential confounder. Our results revealedthat estimates of physical activity levels vary by BMI categories, depending on the methods examined. Although physical activitylevels were lower in the obese, their energy expenditure estimates were not different from those who were overweight or of ahealthy weight. The implications of these findings are that biased estimates of physical activity at a population level may result ininappropriate classification of adults with type 2 diabetes as “sufficiently active” and that the inclusion of body weight in estimatingphysical activity prevalence should be approached with caution.
1. Introduction
At a population level, the method used to determine thosemeeting physical activity guidelines has important impli-cations [1]. For example, estimating “sufficient” physicalactivity (PA) might be confounded by weight status. Thisis possible since an increase in mean weight status of apopulation may result in spurious estimates of increasingphysical activity-related energy expenditure over time [2].This hypothesis is particularly important for those who workwith type 2 diabetes populations because weight loss is asalient clinical target and can be achieved through energy
restriction alone or in combination with an increase inenergy expenditure. Consequently, as argued above, validchanges (i.e., increases or decreases) in PA patterns might notbe entirely and therefore correctly captured. If this were tooccur, assessing population-based strategies geared towardsincreasing physical activity and reducing body weight amongadults with type 2 diabetes might be limited by measurementerror.
Low physical activity levels in adults with type 2 diabeteshave been widely reported [3–9] yet there appear to besome irregularities among these data. For example, beingolder [3, 6] and being female [7, 9] were reported to

2 Journal of Obesity
Table 1: Methods of assessment.
Method Calculation “Sufficiently active” thresholds
Kcal Hours per week of moderate intense activities × (4 METS) + hours of vigorousintense activities × (7.5 METS) × body weight (kg)
≥800/week
Met·mins Minutes per week of moderate intense activities × (4 METS) + minutes of vigorousintense activities × (7.5 METS)
≥600/week
MVPA mins Minutes per week of moderate intense activity + minutes per week of vigorousintense activity (unweighted for intensity)
≥150
be negatively associated with physical activity yet in otherstudies, age [7, 9] and sex [6] had no significant relationshipwith physical activity. We contend that this discordancereflects methodological differences in data synthesis and thethresholds used to quantify physical activity levels sufficientfor health benefit, notably the use of weight dependentthresholds [9].
In response, we postulated that the methods for assessingself-reported physical activity might serve to explain some ofthe discordance. The objective of this study was to comparethree different methods to classify individuals with type 2diabetes as “sufficiently active” using a validated measureof physical activity instrument [10]. We hypothesized thatthe prevalence of those classified as “sufficiently” active (i.e.,proportional estimates) would be different according to themethod used to calculate weekly physical activity and thatthese differences would be confounded with the inclusion ofbody weight in indirectly estimating physical activity-relatedenergy expenditure.
2. Method
2.1. Subjects. The current study is a component ofthe Alberta Longitudinal Exercise and Diabetes ResearchAdvancement (ALEXANDRA) Study, a prospective assess-ment of physical activity determinants [8]. The participantsin this study were residents in the province of Alberta,Canada (N = 1614) with type 2 diabetes and were assessedat three time points: baseline, 6 months, and 18 months.Demographic characteristics, recruitment, and responserates have been previously described [8]. Briefly, participantswere 62.9±12.1 years of age, moderately overweight to obese(BMI = 29.6 ± 5.9 kg/m2), and represented equally by sex(51.4% male), and 72.0% of the sample indicated were Cana-dian while 28.0% were either Arab, Asian, African, European,Aboriginal, or Latin/South American. The demographiccharacteristics of this study population generally reflectCanada’s and Alberta’s adult type 2 diabetes populationin terms of age and sex distributions [8, 11]. Participantswere recruited by (1) mailing questionnaires and consentforms to individuals from the Canadian Diabetes Associationregistry, requesting completion from those with diabetesor (2) through a random digit dialing method to recruitindividuals living with diabetes in Alberta; households thatwere contacted could also nominate a family member orfriend with diabetes. This study received ethical approvalfrom the Health Research Ethics Board.
2.2. Physical Activity Assessment. Physical activity wasassessed with the Godin Leisure-Time Exercise Question-naire (GLTEQ) [10]. Participants were dichotomized as“sufficiently active” or “inactive” based on three differentclassifications as presented in Table 1: (1) the estimatedkilocalories method (Kcal)(hours per week of moderatelyintense activities [×4 METS] + hours per week of vigorouslyintense activities [×7.5 METS] × body weight (kg)); (2) theMet.mins method (minutes per week of moderately intenseactivities [×4 METS] + minutes per week of vigorouslyintense activities [×7.5 METS]); (3) the unweighted moderateand vigorous method (MVPA mins) (minutes per weekof moderately intense activities + minutes per week ofvigorously intense activities). Thresholds for categoriza-tion of “sufficiently active” for each method, respectively,were ≥800/week for the kilocalories which is based onprevious population surveys [2] and reflects achieving≥150 mins of moderate activity/week for an 80 kg person [2];≥600/week for Met·mins (reflecting ≥150 mins of moderateactivity/week); 150 minutes/week for MVPA mins. Thesethresholds were selected based on public health guidelines[12] and diabetes-specific [13, 14] guidelines for achievingmoderate activity of at least 150 mins per week.
Related to the first two methods, in calculating theindirect estimate of weekly energy expenditure, the numberof minutes was computed by multiplying the frequency andduration of (i) weekly minutes of moderate physical activity×4.0 METS and (ii) weekly minutes of vigorous physicalactivity ×7.5 METS. The weekly minutes for moderateand vigorous were then summed for a total Met score.One minute of vigorous physical activity is equivalent to1.875 minutes of moderate activity (7.5/4.0) based on theaverage Met levels for vigorous activity (Met level = 7.5)and moderate activity (Met level = 4.0) set by Brownand Bauman [2] and employed in the original paper ofthe ALEXANDRA study [8]. This weighting provides morecredit for participating in vigorous activity. Individuals whoaccumulated ≥600 Met-minutes per week (Method Two)were classified as “adequately active for health benefit” whilethose who did not were classified as “inadequately active”[2]. This criterion reflects achieving 150 minutes of moderateactivity [4.0 Mets] or 80 minutes of vigorous [7.5 Mets]activity per week, or any combination thereof [2].
2.3. Statistical Analysis. Using only baseline data, for eachphysical activity assessment method, one-way analysis ofvariance (ANOVA; with BMI as the independent variable)

Journal of Obesity 3
Table 2: Means and one-way ANOVA results for each of the three methods of assessment.
BMI N Kcal Met·mins MVPA mins
Mean SD (n) Mean SD (n) Mean SD (n)
<25 341 746.5 2051.4 (99) 853.6 1516.5 (135) 172.0 243.9 (115)
25–<30 570 798.2 1675.6 (170) 767.7 1221.4 (208) 158.3 231.7 (181)
≥30 704 650.4 1450.1 (175) 557.4 928.1 (182) 112.7 165.7 (156)
F = 1.3; P = .28 F = 9.0; P < .001 F = 12.2; P < .001
Table 3: Proportion of adults classified as “sufficiently” active based on the three methods stratified by BMI.
BMI NSufficiently active
based on Kcal n (%)Sufficiently active based
on Met·mins n (%)Sufficiently active basedon MVPA mins n (%)
<25 341 99 (29.0) 135 (39.6) 115 (33.7)
25–<30 570 170 (29.8) 208 (36.5) 181 (31.8)
≥30 704 175 (24.9) 182 (25.9) 156 (22.2)
χ2(2) = 4.4 χ2(2) = 26.1∗ χ2(2) = 21.4∗
∗Significantly different (P < .001)
was used to examine whether physical activity (as a con-tinuous variable) varied significantly across normal weight(BMI < 25.0), overweight (BMI 25.0–<30.0), or obese(BMI ≥ 30.0) categories. Chi-square tests were conductedto examine differences in the proportion of participantsclassified as “sufficiently” active across body weight statuscategories. The Kappa statistic was employed to examineagreement between the three methods, and effect sizes usingCohen’s h [15] were reported to assess the magnitude ofdifferences between the methods.
Considering that the mean age of the study sample was∼63 years, a sensitivity analysis was also conducted withMet·mins set at the lower cutoff (i.e., weekly minutes ofmoderate physical activity ×3.0 METS and weekly minutesof vigorous physical activity ×6.0 METS to calculate totalMet·mins). ANOVAS and chi-square analyses describedabove were repeated using this new Met·min variable.
3. Results
When examining physical activity levels for each method,ANOVA analyses revealed significant (P′s < .001) differencesfor Met·mins and MVPA mins but total physical activity didnot vary across BMI categories using the estimated kilocalo-ries method (see Table 2). Chi-square analyses also revealedsignificant (P′s < .001) differences in the proportion of thoseclassified as sufficiently active for Met·mins and MVPA minsmethods but not for the kilocalories method (see Table 3).Further, it is noteworthy that the obese group generally hadsimilar proportions that were sufficiently active, regardless ofthe physical activity measure (see Table 3).
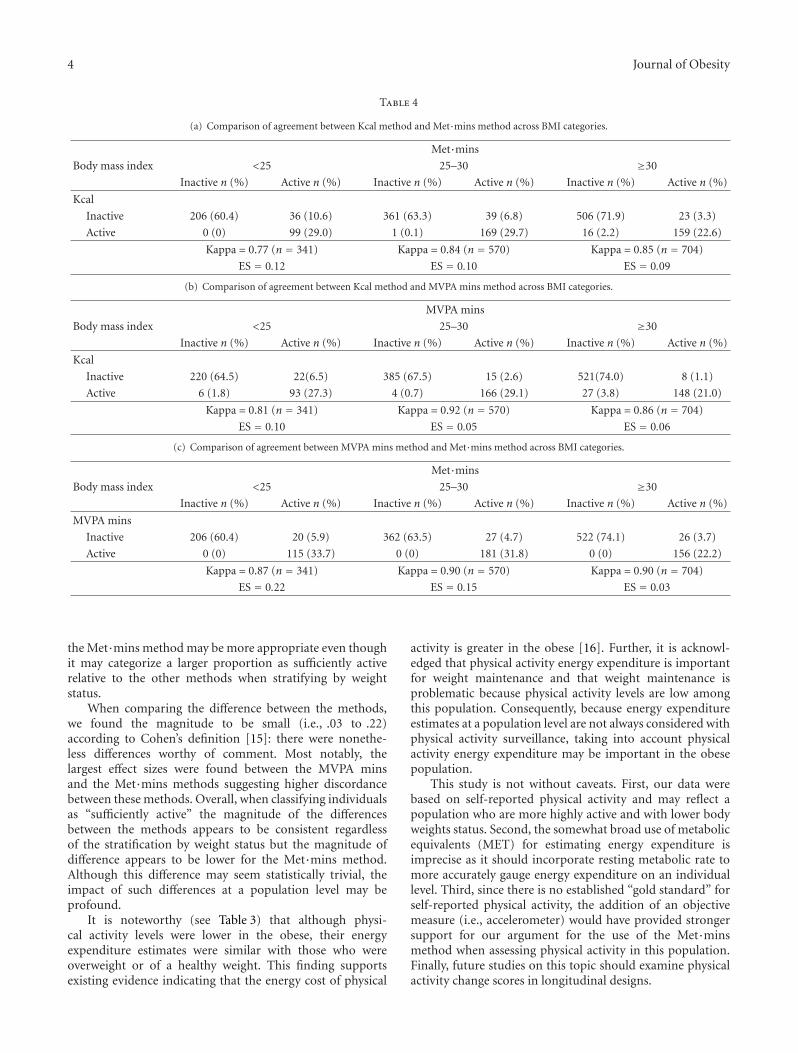
Estimates for those meeting “sufficient activity” guide-lines for each method across BMI categories are shown inTables 4(a), 4(b), and 4(c). In terms of relative comparisons,the Met·mins method was consistently higher for all weightcategories. The largest proportion was found for the normalweight category in the Met·mins methods (39.6%) and
the smallest for the obese category in the MVPA minsmethod (22.2%). The magnitudes of the differences werethe greatest when comparing the Met·mins and MVPAmins methods, with effect sizes ranging from .03 to .22. Thediscordance between the Kcal and the MVPA mins methodswas moderately lower than that between the Met·mins andKcal methods (effects sizes from .09 to .12) and the lowestfor the Kcal and the MVPA mins methods (.05 to .10).
The sensitivity tests (ANOVA’s and chi-square analyses)revealed significant differences for Met·mins (F = 8.6; P <.001; χ2 = 29.2) but not for estimated Kcals (F = 1.2;P = .31; χ2 = 4.4; P = .11). Kappa values across thethree respective BMI categories (<25, 25–30, and ≥30) forthe three methods were .90, .92, and .76 for the Kcal andMet·mins methods; 0.90, 0.89, and 0.85 for the MVPA minsand Met·mins methods; 0.81, 0.92, and 0.86 for the MVPAmins and Kcal methods.
4. Discussion
The objective of this study was to test the difference betweenthree methods in estimating the prevalence of “sufficientactivity” among Canadian adults with type 2 diabetes in alarge sample, while considering the role of weight status as apotential confounder. In addition to the unique population,our study expands on the Brown and Bauman [2] methodol-ogy by including a third measure of physical activity (MVPAmins) in addition to kilocalories and Met·minutes scores incomparing physical activity prevalence.
Overall, our results for all methods are generally inagreement with previous prevalence estimates of physicalactivity which show that approximately 60–70% of adultswith type 2 diabetes are not “sufficiently active” [3–7, 9].However, our results suggest that estimates of physical activ-ity levels vary by BMI categories, depending on the methodsexamined. Upon further comparison of methods consideredappropriate for estimating physical activity, we suggest that
4 Journal of Obesity
Table 4
(a) Comparison of agreement between Kcal method and Met·mins method across BMI categories.
Met·mins
Body mass index <25 25–30 ≥30
Inactive n (%) Active n (%) Inactive n (%) Active n (%) Inactive n (%) Active n (%)
Kcal
Inactive 206 (60.4) 36 (10.6) 361 (63.3) 39 (6.8) 506 (71.9) 23 (3.3)
Active 0 (0) 99 (29.0) 1 (0.1) 169 (29.7) 16 (2.2) 159 (22.6)
Kappa = 0.77 (n = 341) Kappa = 0.84 (n = 570) Kappa = 0.85 (n = 704)
ES = 0.12 ES = 0.10 ES = 0.09
(b) Comparison of agreement between Kcal method and MVPA mins method across BMI categories.
MVPA mins
Body mass index <25 25–30 ≥30
Inactive n (%) Active n (%) Inactive n (%) Active n (%) Inactive n (%) Active n (%)
Kcal
Inactive 220 (64.5) 22(6.5) 385 (67.5) 15 (2.6) 521(74.0) 8 (1.1)
Active 6 (1.8) 93 (27.3) 4 (0.7) 166 (29.1) 27 (3.8) 148 (21.0)
Kappa = 0.81 (n = 341) Kappa = 0.92 (n = 570) Kappa = 0.86 (n = 704)
ES = 0.10 ES = 0.05 ES = 0.06
(c) Comparison of agreement between MVPA mins method and Met·mins method across BMI categories.
Met·mins
Body mass index <25 25–30 ≥30
Inactive n (%) Active n (%) Inactive n (%) Active n (%) Inactive n (%) Active n (%)
MVPA mins
Inactive 206 (60.4) 20 (5.9) 362 (63.5) 27 (4.7) 522 (74.1) 26 (3.7)
Active 0 (0) 115 (33.7) 0 (0) 181 (31.8) 0 (0) 156 (22.2)
Kappa = 0.87 (n = 341) Kappa = 0.90 (n = 570) Kappa = 0.90 (n = 704)
ES = 0.22 ES = 0.15 ES = 0.03
the Met·mins method may be more appropriate even thoughit may categorize a larger proportion as sufficiently activerelative to the other methods when stratifying by weightstatus.
When comparing the difference between the methods,we found the magnitude to be small (i.e., .03 to .22)according to Cohen’s definition [15]: there were nonethe-less differences worthy of comment. Most notably, thelargest effect sizes were found between the MVPA minsand the Met·mins methods suggesting higher discordancebetween these methods. Overall, when classifying individualsas “sufficiently active” the magnitude of the differencesbetween the methods appears to be consistent regardlessof the stratification by weight status but the magnitude ofdifference appears to be lower for the Met·mins method.Although this difference may seem statistically trivial, theimpact of such differences at a population level may beprofound.
It is noteworthy (see Table 3) that although physi-cal activity levels were lower in the obese, their energyexpenditure estimates were similar with those who wereoverweight or of a healthy weight. This finding supportsexisting evidence indicating that the energy cost of physical
activity is greater in the obese [16]. Further, it is acknowl-edged that physical activity energy expenditure is importantfor weight maintenance and that weight maintenance isproblematic because physical activity levels are low amongthis population. Consequently, because energy expenditureestimates at a population level are not always considered withphysical activity surveillance, taking into account physicalactivity energy expenditure may be important in the obesepopulation.
This study is not without caveats. First, our data werebased on self-reported physical activity and may reflect apopulation who are more highly active and with lower bodyweights status. Second, the somewhat broad use of metabolicequivalents (MET) for estimating energy expenditure isimprecise as it should incorporate resting metabolic rate tomore accurately gauge energy expenditure on an individuallevel. Third, since there is no established “gold standard” forself-reported physical activity, the addition of an objectivemeasure (i.e., accelerometer) would have provided strongersupport for our argument for the use of the Met·minsmethod when assessing physical activity in this population.Finally, future studies on this topic should examine physicalactivity change scores in longitudinal designs.

Journal of Obesity 5
5. Conclusions
The implications of our study are that biased estimatesof physical activity at a population level may result ininappropriate classification of adults with type 2 diabetesas “sufficiently active” and that the inclusion of a weight-dependent estimate (i.e., Kcal method) of physical activityprevalence should be approached with caution as 80% ofindividuals with type 2 diabetes are overweight or obese [17].If a weight-dependent estimate of physical activity is usedhowever, an estimate of weight stability should be includedwithin the temporal reference with which physical activitybehaviors are collected.
Acknowledgments
This study was funded by the Alberta Heritage Foundationfor Medical Research and the Canadian Diabetes Association.Dr. R. C. Plotnikoff holds a salary award from the CanadianInstitutes of Health Research (Chair in Applied PublicHealth).
References
[1] P. T. Katzmarzyk and M. S. Tremblay, “Limitations of Canada’sphysical activity data: implications for monitoring trends,”Canadian Journal of Public Health, vol. 98, supplement 2, pp.S185–194, 2007.
[2] W. J. Brown and A. E. Bauman, “Comparison of estimatesof population levels of physical activity using two measures,”Australian and New Zealand Journal of Public Health, vol. 24,no. 5, pp. 520–525, 2000.
[3] L. M. Hays and D. O. Clark, “Correlates of physical activity ina sample of older adults with type 2 diabetes,” Diabetes Care,vol. 22, no. 5, pp. 706–712, 1999.
[4] E. H. B. Lin, W. Katon, M. Von Korff et al., “Relationship ofdepression and diabetes self-care, medication adherence, andpreventive care,” Diabetes Care, vol. 27, no. 9, pp. 2154–2160,2004.
[5] E. H. Morrato, J. O. Hill, H. R. Wyatt, V. Ghushchyan, and P.W. Sullivan, “Physical activity in U.S. adults with diabetes andat risk for developing diabetes, 2003,” Diabetes Care, vol. 30,no. 2, pp. 203–209, 2007.
[6] K. M. Nelson, G. Reiber, and E. J. Boyko, “Diet and exerciseamong adults with type 2 diabetes: findings from the thirdnational health and nutrition examination survey (NHANESIII),” Diabetes Care, vol. 25, no. 10, pp. 1722–1728, 2002.
[7] F. Nothwehr and T. Stump, “Health-promoting behaviorsamong adults with type 2 diabetes: findings from the healthand retirement study,” Preventive Medicine, vol. 30, no. 5, pp.407–414, 2000.
[8] R. C. Plotnikoff, L. M. Taylor, P. M. Wilson et al., “Factorsassociated with physical activity in Canadian adults withdiabetes,” Medicine and Science in Sports and Exercise, vol. 38,no. 8, pp. 1–9, 2006.
[9] J. G. Spangler and J. C. Konen, “Predicting exercise andsmoking behaviors in diabetic and hypertensive patients.Age, race, sex, and psychological factors,” Archives of FamilyMedicine, vol. 2, no. 2, pp. 149–155, 1993.
[10] G. Godin and R. J. Shephard, “A simple method to assessexercise behavior in the community,” Canadian Journal ofApplied Sport Sciences, vol. 10, no. 3, pp. 141–146, 1985.
[11] Health Canada, “ Responding to the challenge of diabetes inCanada,” First Report of the National Diabetes SurveillanceSystem (NDSS), Health Canada, Ottawa, Canada, 2003.
[12] R. R. Pate, M. Pratt, S. N. Blair et al., “Physical activityand public health. A recommendation from the Centres forDisease Control and Prevention and the American College ofSports Medicine,” Journal of American Medical Association, vol.273, no. 5, pp. 402–407, 1995.
[13] Canadian Diabetes Association, “Canadian Diabetes Associa-tion 2003 clinical practice guidelines for the prevention andmanagement of diabetes in Canada,” Canadian Journal ofDiabetes, vol. 27, supplement 2, pp. S1–S140, 2003.
[14] R. J. Sigal, G. P. Kenny, D. H. Wasserman, C. Castaneda-Sceppa, and R. D. White, “Physical activity/exercise and type 2diabetes: a consensus statement from the American DiabetesAssociation,” Diabetes Care, vol. 29, no. 6, pp. 1433–1438,2006.
[15] J. Cohen, Statistical Power Analysis for the Behavioral Sciences,Erlbaum, Hillsdale, NJ, USA, 1988.
[16] R. C. Browning and R. Kram, “Energetic cost and preferredspeed of walking in obese vs. normal weight women,” ObesityResearch, vol. 13, no. 5, pp. 891–899, 2005.
[17] National Institutes of Health, “U.S. Department of Health& Human Services. (n.d.). What are the health risks ofoverweight and obesity?” September 2008, http://www.nhlbi.nih.gov/health/dci/Diseases/obe/obe risks.html.

Submit your manuscripts athttp://www.hindawi.com
Stem CellsInternational
Hindawi Publishing Corporationhttp://www.hindawi.com Volume 2014
Hindawi Publishing Corporationhttp://www.hindawi.com Volume 2014
MEDIATORSINFLAMMATION
of
Hindawi Publishing Corporationhttp://www.hindawi.com Volume 2014
Behavioural Neurology
EndocrinologyInternational Journal of
Hindawi Publishing Corporationhttp://www.hindawi.com Volume 2014
Hindawi Publishing Corporationhttp://www.hindawi.com Volume 2014
Disease Markers
Hindawi Publishing Corporationhttp://www.hindawi.com Volume 2014
BioMed Research International
OncologyJournal of
Hindawi Publishing Corporationhttp://www.hindawi.com Volume 2014
Hindawi Publishing Corporationhttp://www.hindawi.com Volume 2014
Oxidative Medicine and Cellular Longevity
Hindawi Publishing Corporationhttp://www.hindawi.com Volume 2014
PPAR Research
The Scientific World JournalHindawi Publishing Corporation http://www.hindawi.com Volume 2014
Immunology ResearchHindawi Publishing Corporationhttp://www.hindawi.com Volume 2014
Journal of
ObesityJournal of
Hindawi Publishing Corporationhttp://www.hindawi.com Volume 2014
Hindawi Publishing Corporationhttp://www.hindawi.com Volume 2014
Computational and Mathematical Methods in Medicine
OphthalmologyJournal of
Hindawi Publishing Corporationhttp://www.hindawi.com Volume 2014
Diabetes ResearchJournal of
Hindawi Publishing Corporationhttp://www.hindawi.com Volume 2014
Hindawi Publishing Corporationhttp://www.hindawi.com Volume 2014
Research and TreatmentAIDS
Hindawi Publishing Corporationhttp://www.hindawi.com Volume 2014
Gastroenterology Research and Practice
Hindawi Publishing Corporationhttp://www.hindawi.com Volume 2014
Parkinson’s Disease
Evidence-Based Complementary and Alternative Medicine
Volume 2014Hindawi Publishing Corporationhttp://www.hindawi.com
Copyright © 2022 FDOKUMEN