Assessment of the value of woodland landscape function to ...
117
Tim Lynam, Rob Cunliffe, Isaac Mapaure and Isau Bwerinofa Assessment of the value of woodland landscape function to local communities in Gorongosa and Muanza Districts, Sofala Province, Mozambique
-
Upload
khangminh22 -
Category
Documents
-
view
1 -
download
0
Transcript of Assessment of the value of woodland landscape function to ...

ISBN 979-3361-11-5
Tim Lynam, Rob Cunliffe, Isaac Mapaure and Isau Bwerinofa
Tim Lynam
, Rob Cunliffe, Isaac Mapaure and Isau Bw
erinofa
Assessment of the valueof woodland landscape function tolocal communities in Gorongosa andMuanza Districts, Sofala Province,Mozambique
Assessm
ent of the value of woodland landscape function to local com
munities in
Gorongosa and M
uanza Districts, Sofala Province, M
ozambique

Tim LynamRob CunliffeIsaac MapaureIsau Bwerinofa
Assessment of the valueof woodland landscape function tolocal communities in Gorongosa andMuanza Districts, Sofala Province,Mozambique
ISBN 979-3361-11-5
© 2003 by CIFORAll rights reserved. Published in 2003Printed by SMK Grafika Desa Putera, Indonesia
Cover and inside photos by Tim Lynam
Published byCenter for International Forestry ResearchMailing address: P.O. Box 6596 JKPWB, Jakarta 10065, IndonesiaOffice address: Jl. CIFOR, Situ Gede, Sindang Barang,Bogor Barat 16680, IndonesiaTel.: +62 (251) 622622; Fax: +62 (251) 622100E-mail: [email protected] site: http://www.cifor.cgiar.org
Table of Contents
Executive summary 1Introduction 5
I. Site selection and description 9A. Background to Muaredzi 10B. Background to Nhanchururu 12
II. Community Landscape Valuations 15A. Methods 15
1. Initial conceptual model 152. Spatial data management 163. Community information collection 164. Refinement of the model 175. Field sampling for model confrontation 176 Updating the models 20
B. Results and discussion 201. Initial conceptual model 202. Muaredzi community assessments 213. Nhanchururu community assessments 364. Field Sampling for Model Confrontation 515. Confronting the models with reality 60
III. Vegetation inventory and assessments 65A. Approach and methods 65
1. Vegetation survey 652. Assessment of explanatory variables 663. Data analyses 66
B. Results 661. Muaredzi 662. Nhanchururu 71
C. Discussion 761. Muaredzi 762. Nhanchururu 77
D. Conservation values of vegetation in Muaredzi and Nhanchururu 78

iv
Looking east, from the miombo woodlands of Nhanchururu, down to the rift valley of Gorongosa National Park.
IV. Overlay of community valuations and conservation valuations 81A. Introduction 81B. Methods 81C. Results 82
1. Mauredzi 822. Nhanchururu 84
D. Discussion and conclusions 85V. Implications for land use planning 87
A. Community Evaluations 87B. Biodiversity Evaluations 88C. Modelling 89D. Overlay of Community and Biodiversity Evaluations 89E. Synthesis 89
VI. Acknowledgements 91VII. References 92VIII. Appendices 94
1. Data sheets used for field sampling for model confrontation 942. Land types identified by the Muaredzi CRUAT 963. Summary of 75 Muaredzi field samples for model confrontation 974. Summary of 82 Nhanchururu field samples for
model confrontation 1035. GPS point data for the vegetation inventory sites in Muredzi
and Nhanchururu 111

1
Assessment of the Value of LocalWoodland Landscape Functions toLocal Communities
During the process of developing a managementplan for Gorongosa National Park (GNP) in northernSofala Province, Mozambique the presence ofpeople within the park and in the areas immediatelysurrounding the park was identified as a majormanagement concern. The major objective of thepark was the conservation of ecosystems andbiodiversity. Local people were recognised as usersof natural resources but park management hadset itself the objective of ensuring that the use ofresources did not undermine the achievement ofconservation, recreation and knowledge generationobjectives. Little was know of the spatial patternsof use of resources by local communities nor whatareas were likely to be heavily impacted bycommunity use of resources.
The aim of the research was to develop andtest an approach to estimating local values forlandscape units and relate these to formalbiodiversity conservation values. The TropicalResource Ecology Program (TREP) team conductedparticipatory analyses in two village scale sites;Muaredzi that was entirely within the boundariesof GNP and the other, Nhanchururu that straddledthe boundary of GNP. The team used a combinationof participatory research methods, Bayesianprobability modelling and spatial data analyses of
baseline digital data sets and remotely sensedimages, to iteratively improve understanding ofthe factors determining the value that local peopleassign to specific landscape elements or locations.
In parallel to this participatory process, anassessment was made of the vegetation diversityof the same areas using standard scientificmethods of firstly interpreting satellite imageryand then field sampling to validate the resultantmaps and to fill in the details of speciescomposition in each vegetation type. Vegetationtypes were scored and ranked in order ofconservation importance. Conservationimportance values were derived as a function ofrelative area of each vegetation type, speciesdiversity of each vegetation type and the presenceof key species of conservation interest. The locallandscape values were then overlain with theconservation importance indices to identify areaswhere conflicts between village use andconservation were likely to be high, i.e. whereboth conservation and village valuations were bothhigh.
Community resource use assessment teams(CRUATs) were elected by the people of each villageto work with the scientific team. The analysisfollowed the same pattern in each site. Firstly,the scientific team developed a prior model orhypothesis of the value, to local villagers, of eachlandscape unit. In this model landscape unit valuewas defined as being a function of the ratio ofbenefits derived from the unit to the costs of
Executive summary
2 Tim Lynam, Rob Cunliffe, Isaac Mapaure and Isau Bwerinofa
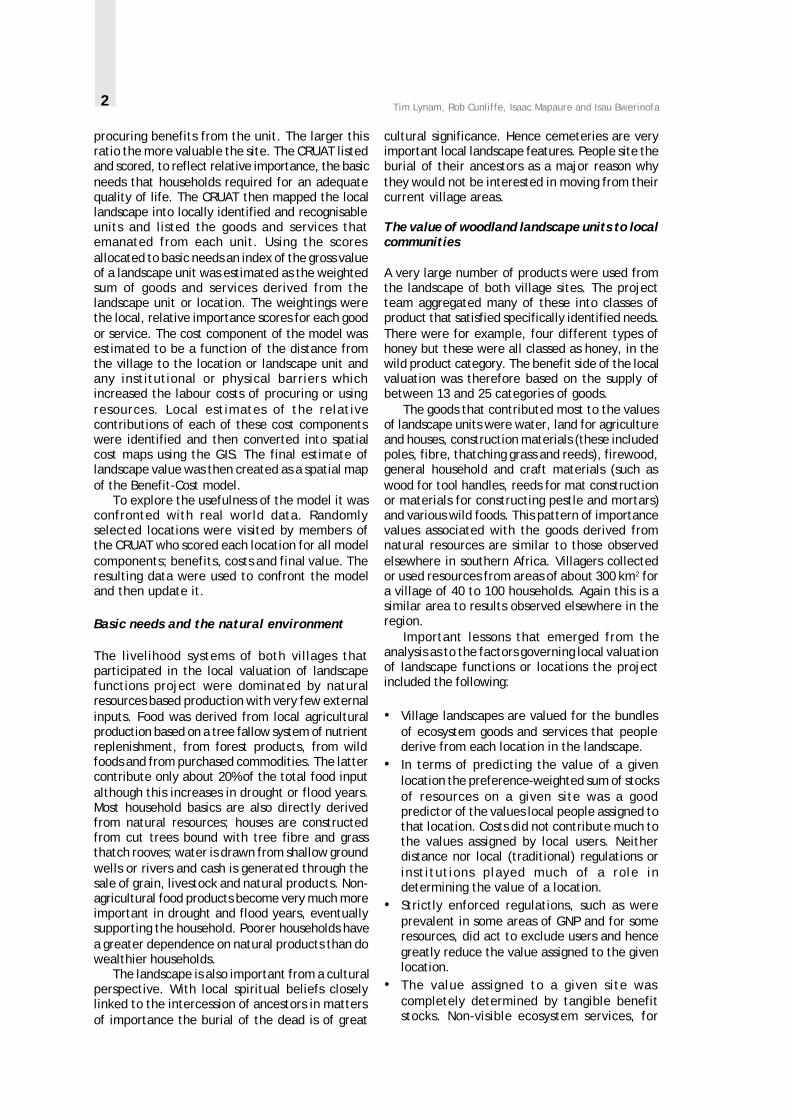
procuring benefits from the unit. The larger thisratio the more valuable the site. The CRUAT listedand scored, to reflect relative importance, the basicneeds that households required for an adequatequality of life. The CRUAT then mapped the locallandscape into locally identified and recognisableunits and listed the goods and services thatemanated from each unit. Using the scoresallocated to basic needs an index of the gross valueof a landscape unit was estimated as the weightedsum of goods and services derived from thelandscape unit or location. The weightings werethe local, relative importance scores for each goodor service. The cost component of the model wasestimated to be a function of the distance fromthe village to the location or landscape unit andany institutional or physical barriers whichincreased the labour costs of procuring or usingresources. Local estimates of the relativecontributions of each of these cost componentswere identified and then converted into spatialcost maps using the GIS. The final estimate oflandscape value was then created as a spatial mapof the Benefit-Cost model.
To explore the usefulness of the model it wasconfronted with real world data. Randomlyselected locations were visited by members ofthe CRUAT who scored each location for all modelcomponents; benefits, costs and final value. Theresulting data were used to confront the modeland then update it.
Basic needs and the natural environment
The livelihood systems of both villages thatparticipated in the local valuation of landscapefunctions project were dominated by naturalresources based production with very few externalinputs. Food was derived from local agriculturalproduction based on a tree fallow system of nutrientreplenishment, from forest products, from wildfoods and from purchased commodities. The lattercontribute only about 20% of the total food inputalthough this increases in drought or flood years.Most household basics are also directly derivedfrom natural resources; houses are constructedfrom cut trees bound with tree fibre and grassthatch rooves; water is drawn from shallow groundwells or rivers and cash is generated through thesale of grain, livestock and natural products. Non-agricultural food products become very much moreimportant in drought and flood years, eventuallysupporting the household. Poorer households havea greater dependence on natural products than dowealthier households.
The landscape is also important from a culturalperspective. With local spiritual beliefs closelylinked to the intercession of ancestors in mattersof importance the burial of the dead is of great
cultural significance. Hence cemeteries are veryimportant local landscape features. People site theburial of their ancestors as a major reason whythey would not be interested in moving from theircurrent village areas.
The value of woodland landscape units to localcommunities
A very large number of products were used fromthe landscape of both village sites. The projectteam aggregated many of these into classes ofproduct that satisfied specifically identified needs.There were for example, four different types ofhoney but these were all classed as honey, in thewild product category. The benefit side of the localvaluation was therefore based on the supply ofbetween 13 and 25 categories of goods.
The goods that contributed most to the valuesof landscape units were water, land for agricultureand houses, construction materials (these includedpoles, fibre, thatching grass and reeds), firewood,general household and craft materials (such aswood for tool handles, reeds for mat constructionor materials for constructing pestle and mortars)and various wild foods. This pattern of importancevalues associated with the goods derived fromnatural resources are similar to those observedelsewhere in southern Africa. Villagers collectedor used resources from areas of about 300 km2 fora village of 40 to 100 households. Again this is asimilar area to results observed elsewhere in theregion.
Important lessons that emerged from theanalysis as to the factors governing local valuationof landscape functions or locations the projectincluded the following:
• Village landscapes are valued for the bundlesof ecosystem goods and services that peoplederive from each location in the landscape.
• In terms of predicting the value of a givenlocation the preference-weighted sum of stocksof resources on a given site was a goodpredictor of the values local people assigned tothat location. Costs did not contribute much tothe values assigned by local users. Neitherdistance nor local (traditional) regulations orinstitutions played much of a role indetermining the value of a location.
• Strictly enforced regulations, such as wereprevalent in some areas of GNP and for someresources, did act to exclude users and hencegreatly reduce the value assigned to the givenlocation.
• The value assigned to a given site wascompletely determined by tangible benefitstocks. Non-visible ecosystem services, for
3Assessment of the value of woodland landscape function to local communitiesin Gorongosa and Muanza Districts, Sofala Province, Mozambique
example, were not identified as benefits andtherefore did not contribute to the valuesassigned in this analysis.
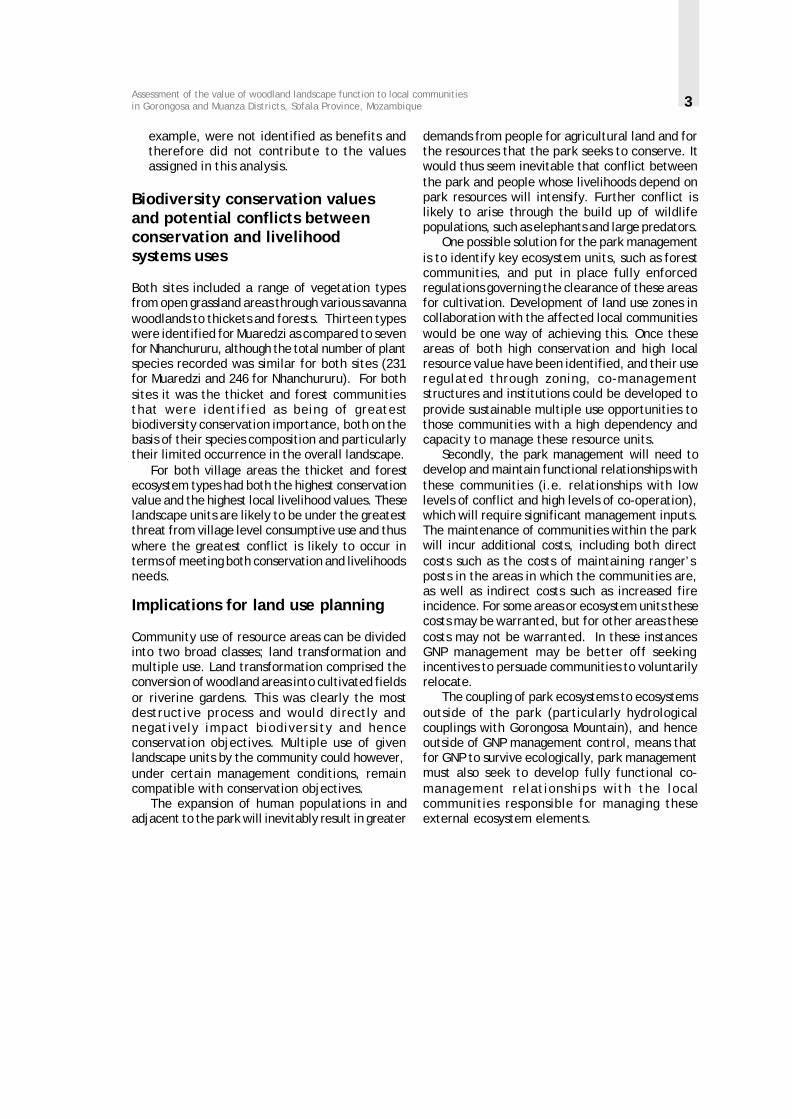
Biodiversity conservation valuesand potential conflicts betweenconservation and livelihoodsystems uses
Both sites included a range of vegetation typesfrom open grassland areas through various savannawoodlands to thickets and forests. Thirteen typeswere identified for Muaredzi as compared to sevenfor Nhanchururu, although the total number of plantspecies recorded was similar for both sites (231for Muaredzi and 246 for Nhanchururu). For bothsites it was the thicket and forest communitiesthat were identified as being of greatestbiodiversity conservation importance, both on thebasis of their species composition and particularlytheir limited occurrence in the overall landscape.
For both village areas the thicket and forestecosystem types had both the highest conservationvalue and the highest local livelihood values. Theselandscape units are likely to be under the greatestthreat from village level consumptive use and thuswhere the greatest conflict is likely to occur interms of meeting both conservation and livelihoodsneeds.
Implications for land use planning
Community use of resource areas can be dividedinto two broad classes; land transformation andmultiple use. Land transformation comprised theconversion of woodland areas into cultivated fieldsor riverine gardens. This was clearly the mostdestructive process and would directly andnegatively impact biodiversity and henceconservation objectives. Multiple use of givenlandscape units by the community could however,under certain management conditions, remaincompatible with conservation objectives.
The expansion of human populations in andadjacent to the park will inevitably result in greater
demands from people for agricultural land and forthe resources that the park seeks to conserve. Itwould thus seem inevitable that conflict betweenthe park and people whose livelihoods depend onpark resources will intensify. Further conflict islikely to arise through the build up of wildlifepopulations, such as elephants and large predators.
One possible solution for the park managementis to identify key ecosystem units, such as forestcommunities, and put in place fully enforcedregulations governing the clearance of these areasfor cultivation. Development of land use zones incollaboration with the affected local communitieswould be one way of achieving this. Once theseareas of both high conservation and high localresource value have been identified, and their useregulated through zoning, co-managementstructures and institutions could be developed toprovide sustainable multiple use opportunities tothose communities with a high dependency andcapacity to manage these resource units.
Secondly, the park management will need todevelop and maintain functional relationships withthese communities (i.e. relationships with lowlevels of conflict and high levels of co-operation),which will require significant management inputs.The maintenance of communities within the parkwill incur additional costs, including both directcosts such as the costs of maintaining ranger’sposts in the areas in which the communities are,as well as indirect costs such as increased fireincidence. For some areas or ecosystem units thesecosts may be warranted, but for other areas thesecosts may not be warranted. In these instancesGNP management may be better off seekingincentives to persuade communities to voluntarilyrelocate.
The coupling of park ecosystems to ecosystemsoutside of the park (particularly hydrologicalcouplings with Gorongosa Mountain), and henceoutside of GNP management control, means thatfor GNP to survive ecologically, park managementmust also seek to develop fully functional co-management relationships with the localcommunities responsible for managing theseexternal ecosystem elements.

4
Looking east, from the miombo woodlands of Nhanchururu, down to the rift valley of Gorongosa National Park.
5
As part of CIFOR’s project1 to identify the valueof landscapes to local users the Tropical ResourceEcology Program (TREP) at the University of Zim-babwe was contracted to undertake a short termresearch project to establish the value of land-scapes to local communities. A startup meetingwas held in Harare, Zimbabwe on 29th and 30th
of January, 2001, at which the TREP team2 pre-sented their suggested approach, and also sug-gested implementing the project in GorongosaNational Park (GNP) in Mozambique. The princi-pal reason for electing to implement the projectin the logistically more difficult Mozambicansite, was the opportunity for the project to di-rectly contribute to the GNP planning activity inwhich the team leader (Dr. T. Lynam) was al-ready involved.
Several communities live within theboundaries of GNP, whilst others straddle theboundaries, together amounting to an estimatedtotal population of some 10 to 15 thousandpeople living within the park (Figure 1). TheAdministrator of GNP and other senior NationalParks staff had clearly indicated the importanceof addressing the question of people living within
and adjacent to the park. A notable componentof the GNP planning activity was expected to bethe development, in consultation with allrelevant stakeholders, of a managementstrategy for the buffer zone or co-managementareas of the GNP. Thus, the CIFOR project wouldbe able to contribute directly to a real need,and hence had considerable support from theGNP Administration.
Conducting the assessment in and aroundGNP would serve three major purposes. The firstwas the provision of information to park plan-ners and managers, on what is of value to thelocal communities living within and around thepark, and some indication as to where thesevalues might be in conflict with GNP manage-ment objectives. The second, and equally im-portant objective, was to ensure that the viewsof local communities were clearly expressed inthe park planning exercise. In essence this wouldinvolve working with the local communities andtranslating their needs and views into informationthat would be useful to the Park Administration.The third purpose was to enhance the capacity ofMozambican partners in the project to conductsimilar assessments.
The approach adopted was to develop methodto estimating local values for landscape units, togenerate corresponding biodiversity conservationvalues, and then to compare these two sets of
Introduction
1Assessment of the Value of Woodland LandscapeFunctions for Local Communities
2Tim Lynam, Team Leader; Rob Cunliffe and IsaacMapaure.
6 Tim Lynam, Rob Cunliffe, Isaac Mapaure and Isau Bwerinofa
values. A combination of participatory researchmethods, Bayesian probability modelling andspatial data analyses of baseline digital data setsand remotely sensed images, were used togenerate and iteratively improve understandingof the factors determining the value that localpeople assign to specific landscape elements orlocations. Vegetation analyses of the same areaswere carried out using standard scientifictechniques of firstly interpreting satellite imageryand then carrying out ground sampling to validatethe resultant maps and to provide details ofspecies composition for each type. These dataprovided the basis for the subsequent generationof biodiversity conservation values. The locallandscape values were then overlain with theconservation importance indices to identify areaswhere conflicts between village use andconservation were likely to be high.
It is important to clarify what is meant by theterm value as used in this project. There is aconsiderable literature, both in the economic aswell as in the social fields, as to what value meansand how it is measured. It is not necessary for usto review that literature here. What is importantis that we have a clear definition of what is meantby value and what limitations there are on theuse of the term in the context of this project. Weuse the term value to reflect an index ofpreference ordering. The value of a good orservice is the relative degree to which that goodor service is preferred in comparison with othergoods and services available at that time andlocation. This last point is of fundamentalimportance. In our conception of the term thereis no such thing as “THE VALUE”. Value is adynamic and relative concept - value varies
across individuals, and varies through time asthe relative abundances and needs for variousgoods and services change. What we havestriven to obtain, in our implementation of thisproject, is a value estimate that is averagedacross a community and is expressed byindividuals selected by that community torepresent their views - it is thus a social value.We have also sought to average that estimateof value across a limited time domain - perhapsonly meaningful over at most a year or two. Theimportant point to reflect upon is that theestimates we have succeeded in making areappropriate at a given time and in a givenlocation - they are not necessarily generalisableacross a wider spatial or temporal domain.
Following this introduction, the remainder ofthe report is structured into a further five mainsections (Sections I-V). Section I describes theprocess of selecting research sites, and providesbrief descriptions of the two chosen areas:Muaredzi and Nhanchururu. The followingsection deals with the community landscapevaluations (Section II). This includes bothmethods and results concerning the developmentand confrontation of the models, the GIS datasets, and the participatory communityassessments. Details of the vegetationassessments and generation of biodiversityconservation values are then presented inSection III. Section IV concerns the overlay ofthe community and biodiversity conservationvaluations. The final section (Section V)comprises a synthesis which draws the variousthreads together and spells out the implicationsof the research findings in terms of the landuse planning process for GNP.

7Assessment of the value of woodland landscape function to local communitiesin Gorongosa and Muanza Districts, Sofala Province, Mozambique
Figure 1. Boundary of Gorongosa National Park with major tracks and roads as well as major areas of human settlement andpossible human incursion into the park.

8
9
I. Site selection and description
Discussions were held between the TREP teamand the Administrator of GNP to identifycommunities that would provide usefulinformation for the development of the Park plan.The importance of community perspectives on thebiophysical resources in the Park, and also theirperspectives on resources outside of the Park buton which GNP was critically dependent,3 werediscussed. Following these discussionsreconnaissance trips were made to four differentcommunities. The first of these potential sites wascalled Muaredzi and was entirely within the GNP(M - Figure 2). The second site (Nhanchururu) wason the western boundary of the GNP and hence inthe foothills of Gorongosa Mountain with thecommunity straddling the GNP boundary (N -Figure 2). The third and fourth sites (Vunduziand Canda) were located on the eastern andwestern sides of Gorongosa Mountain respectively(V and C - Figure 2). The Vunduzi community wasclose to the GNP boundary whilst the Candacommunity was several kilometres from the GNP
boundary. The Regulos4 governing these twocommunities were responsible for the traditionalcontrol of Gorongosa Mountain.
The traditional leaders from each of thesecommunities were approached and asked if theywould be willing to involve their communities inthe research project. In all cases this permissionwas granted, although in the Canda site thispermission was more guardedly given - apparentlybecause previous research initiatives had yieldedno tangible benefits for the community, and infact once the researchers had left nothing wasever heard from them again.
In general the selections were made using thefollowing criteria:
1. Willingness of community leaders toparticipate;
2. Degree of dependence of community onGNP resources;
3. Accessibility of the site.
Based on the reconnaissance visits it wasdecided that the project would start in Muaredziand then carry on in the Nhanchururu site. TheVunduzi site, whilst offering the opportunity towork on the biologically very interestingGorongosa Mountain, would be inaccessible aftersevere rains, whilst the Canda site was furthestfrom the park and hence reflected the leastdependence on Park resources. Although
3GNP is critically dependent on the water that drains offGorongosa Mountain and that which drains offCheringoma Plateau. Both of these areas are outside ofthe GNP and hence not under the control of the parkauthorities.4Regulo is the highest level of traditional leadership -roughly equivalent to Chiefs in other parts of southernAfrica.

10 Tim Lynam, Rob Cunliffe, Isaac Mapaure and Isau Bwerinofa
Gorongosa Mountain itself provides one of themost interesting biological sites in the region, dueto the difficulty of working there (access is limitedto a walk up lasting several hours and thencamping at the top) it was decided to not attemptto implement the project there.
Once the Muaredzi and Nhanchururu sites wereselected, the local leaders in each communitywere asked to assist in conducting the traditionalceremonies that were necessary for the ancestralspirits to accept the project.
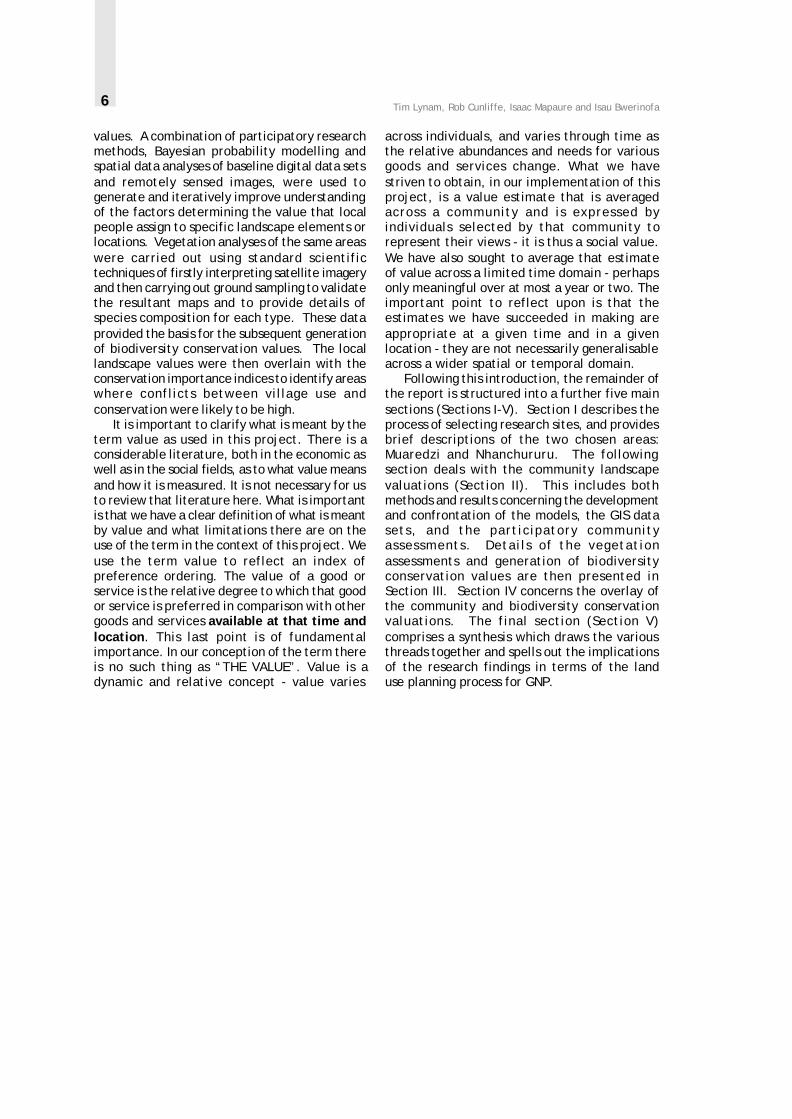
A. Background to MuaredziThe Muaredzi community is situated on the northand south sides of the Muaredzi River where itjoins the Urema River, downstream of Lake Urema(Figure 3). Maunza, the nearest town, isapproximately 35km to the northeast and Chitengothe GNP headquarters is about the same distanceto the west. There is no regular transport fromMuaredzi to Maunza and, and other than theoccasional visit by national parks staff, very fewvehicles come to the village.
The village area, comprising all householdsand fields, is relatively compact, being containedwithin an area of about 2km by 2km. In 1998 therewere estimated to be 172 members in thecommunity (Costa and Vogt, 1998). Although we
do not have a full count of people living inMuaredzi, 40 households were identified inNovember 2001. These were split roughly equallynorth and south of the Muaredzi River. Thecommunity falls under the jurisdiction of twodifferent Regulos. Regulo Nguinha controls thearea to the north of the Muaredzi River andRegulo Nhantaze controls the area to the south.Within Muaredzi there were four Fumos5.
Residents are forbidden by park regulationsto venture to the west of the Urema River. Thevillage area does not appear to have any clearboundaries to the east, south or north.
In addition to the road to Muanza, there aretwo other tracks leading away from Muaredzi. Oneleads north for some 18km along the edge of theUrema floodplain to Goinha (also known as MaunzaBaixo). The other comprises a path, which runsfor some 5 km to the south of the village, to acrossing point on the Urema river known asJangada. Across the river, this connects to theroad to GNP headquarters at Chitengo, some 35kmto the west. Before the civil war there was apontoon here (hence the name Jangada), but nowthe only means of crossing is by a dugout canoe.
5Fumos are the next level of traditional leadership downfrom the Regulo.
Figure 2. Map of central Mozambique showing Gorongosa Mountain, Gorongosa National Park (GNP) and the fourpreliminary sites considered for further investigation; C=Canda, V=Vunduzi, N=Nhanchururu, and M=Muaredzi.
11Assessment of the value of woodland landscape function to local communitiesin Gorongosa and Muanza Districts, Sofala Province, Mozambique
The nearest neighbours to Muaredzi live withina small village comprising a few householdssituated several km to the south of Jangada. Tothe north, the closest village is Goinha, whichappears to be slightly larger than Muaredzi. Bothof these are also within the National Park. Thereare no schools, clinics or shops within the village,such that people must travel to Muanza for thesefacilities. The lack of any buildings with tin roofsin Muaredzi, provides a further indicator of thelimited extent of development.
Tinley (1977, Figure 7.2) did not indicate anysettlement in the Muaredzi area at the time ofhis analyses (mid-1970’s), although there weresettlements north and south of Muaredzi alongthe Urema river basin. The 1:50,000 topographicmap of the Muaredzi area (based on airphotography of 1958/60) does however, indicatea small area of settlement a few km east of thepresent settlement. The inhabitants wereessentially subsistence producers of sorghum,cassava and maize (as a cash crop). These cropyields would be supplemented with fish and wildlife harvesting.
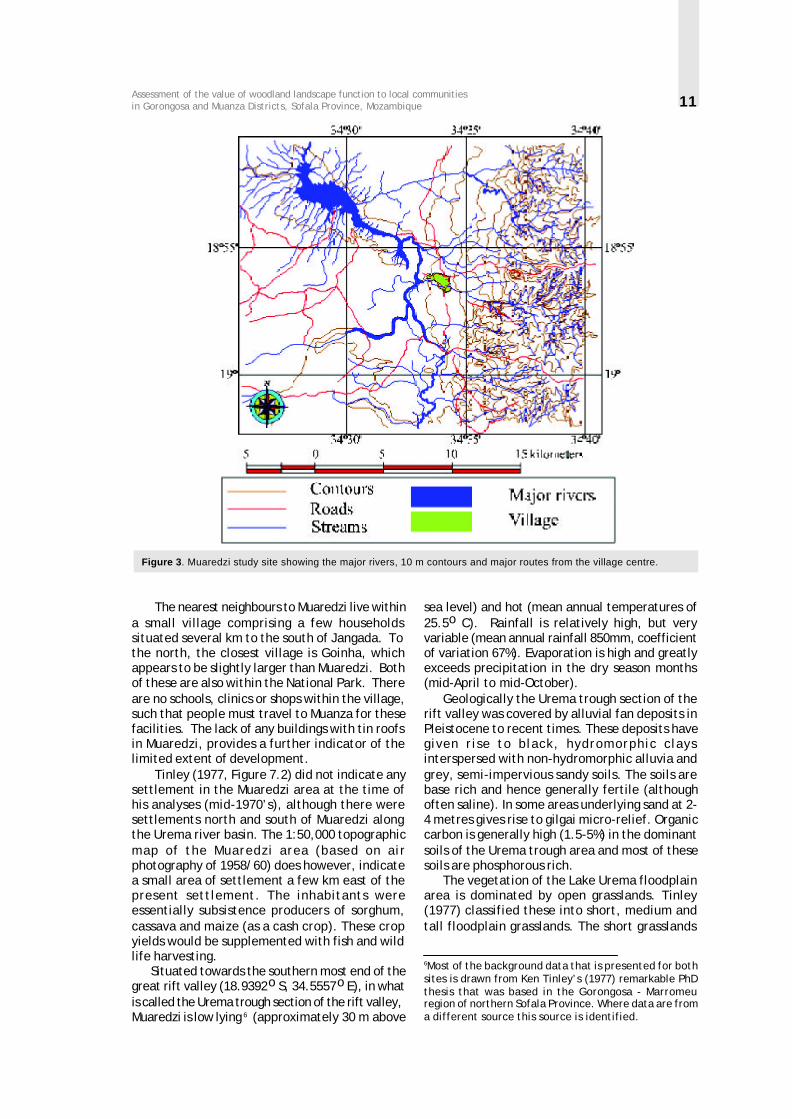
Situated towards the southern most end of thegreat rift valley (18.9392o S, 34.5557o E), in whatis called the Urema trough section of the rift valley,Muaredzi is low lying 6 (approximately 30 m above
sea level) and hot (mean annual temperatures of25.5o C). Rainfall is relatively high, but veryvariable (mean annual rainfall 850mm, coefficientof variation 67%). Evaporation is high and greatlyexceeds precipitation in the dry season months(mid-April to mid-October).
Geologically the Urema trough section of therift valley was covered by alluvial fan deposits inPleistocene to recent times. These deposits havegiven rise to black, hydromorphic claysinterspersed with non-hydromorphic alluvia andgrey, semi-impervious sandy soils. The soils arebase rich and hence generally fertile (althoughoften saline). In some areas underlying sand at 2-4 metres gives rise to gilgai micro-relief. Organiccarbon is generally high (1.5-5%) in the dominantsoils of the Urema trough area and most of thesesoils are phosphorous rich.
The vegetation of the Lake Urema floodplainarea is dominated by open grasslands. Tinley(1977) classified these into short, medium andtall floodplain grasslands. The short grasslands
6Most of the background data that is presented for bothsites is drawn from Ken Tinley’s (1977) remarkable PhDthesis that was based in the Gorongosa - Marromeuregion of northern Sofala Province. Where data are froma different source this source is identified.
Figure 3. Muaredzi study site showing the major rivers, 10 m contours and major routes from the village centre.

12 Tim Lynam, Rob Cunliffe, Isaac Mapaure and Isau Bwerinofa
comprise communities dominated by Sporobolusspp. (particularly S. kentrophyllus and S. ioclados )on saline soils, and others dominated by theCynodon dactylon and Digitaria swazilandensislawns. The latter form the bulk of the floodplainson the south and northwest sides of Lake Urema.The medium grassland largely comprises twocommunities - one dominated by Setaria eylesiiand the other by Echinachloa stagina. The tallgrasslands are characterised by a Vetiverianigritana community, which grows to 225cm inheight. These different grassland communitiesoccur as a mosaic that grades into the savannaareas above the floodplain. Historically therewould have been a large biomass and diversityof herbivores associated with these grasslands,but during and after the war of independencethese populations were completely decimated.Only small populations of mostly smallerherbivores such as impala now occur in theMuaredzi area. There are however, infrequentvisits to the area from hippopotami and elephants.Tinley also noted an aquatic community based onseasonally flooded pans in the flood plain.
Tinley identified six savanna woodland typesgrowing on the rift valley floor:
1. Mixed savanna (Acacia, Albizia, Lonchocarpus, Piliostigma, Sclerocarya);
2. Marginal floodplain woodland (Acacia albida, Acacia xanthophloea);
3. Knobthorn savanna (Acacia nigrescens);4. Sand savanna (Burkea africana, Terminalia
sericea);5. Mopane savanna (Colophospermum mopane);6. Palm savanna (Hyphaene benguellensis,
Borasus aethiopica).
Tinley also identified four thicket types andtwo forest types from the valley floor area. Allthicket types (riverine, alluvial fan, tree-base andtermitaria thickets) appear to occur in theMuaredzi area, but the forest types appear to beabsent.
Historically there would have been a greatnumber of large herbivores (elephant, buffalo,hippopotamus, zebra, waterbuck), withapproximately 50 hippo counted at theMuaredzi/ Urema confluence in the 1969 dryseason, about the same number of zebra, andwith well over 1000 buffalo and about 50elephant in the area during the following wetseason. These were virtually all eliminated, suchthat by 1994 there were hardly any largeherbivores in the GNP at all (Cumming et al.1994). Although the larger herbivores are slowlyreappearing, without introductions, rebuildingthe populations to their former levels willprobably take decades.
The GNP maintains a ranger’s post in thevillage, from where there is radio contact totheir headquarters at Chitengo (although thiswas not always functional). An overridingconcern of the Muaredzi community is that theGNP would like them to relocate to outside ofthe park area. The park has previouslyattempted to force them to move, and has madeit clear that they would still like to pursue this.Villagers are adamant that they want to remainwhere they are.
Being situated within the national park, thevillage is exposed to wildlife. Elephant movewithin the village area and surrounds, and clearlydo cause some destruction to crops. A number ofsmaller animals were also commonly seen withinclose proximity to the village, including nyala,impala, bushbuck, oribi, warthog and wildpig.Lake Urema is reported to harbour a healthypopulation of crocodiles, and hippos are alsopresent.
Community members are permitted to fish onparts of Lake Urema, although the GNP staffregulates such activities. Fishing is carried outwith gill nets placed within Lake Urema. Theseare serviced by means of dugout canoes. Canoesare launched from a designated point, situatedsome 6km to the north of the village. Fishextracted from the nets are brought back to thelaunch point, where they are gutted and laid outto dry in the sun. From here they are carried byfoot or bicycle, initially back to the village, andsubsequently out to Muanza, where they can besold. This appears to be one of the few ways thatpeople have of earning money.
During the period of the study, the only otherdirect involvement of any NGO’s within Muaredziwas that of a food for work programme, beingrun by the World Food Programme. The workinvolved clearing and repairing the western partof the track from Muaredzi towards Muanza.
We are aware of two previous studies that havebeen carried out within the village. Onecomprised a community study carried out by threepsychology students over four weeks during 1997(Costa and Vogt, 1998). The other comprised afishing project, implemented by the GNPauthorities, the aim of which was to establish afishing cooperative in Muaredzi and increasereturns from fishing activities (Zolho et al. 1998).This has subsequently collapsed, apparently dueto poor management.
B. Background to NhanchururuThe Nhanchururu site is situated astride thewestern boundary of GNP, some 15km to thesoutheast of Gorongosa Mountain, and some25km northeast of Villa Gorongosa. It comprises
13Assessment of the value of woodland landscape function to local communitiesin Gorongosa and Muanza Districts, Sofala Province, Mozambique
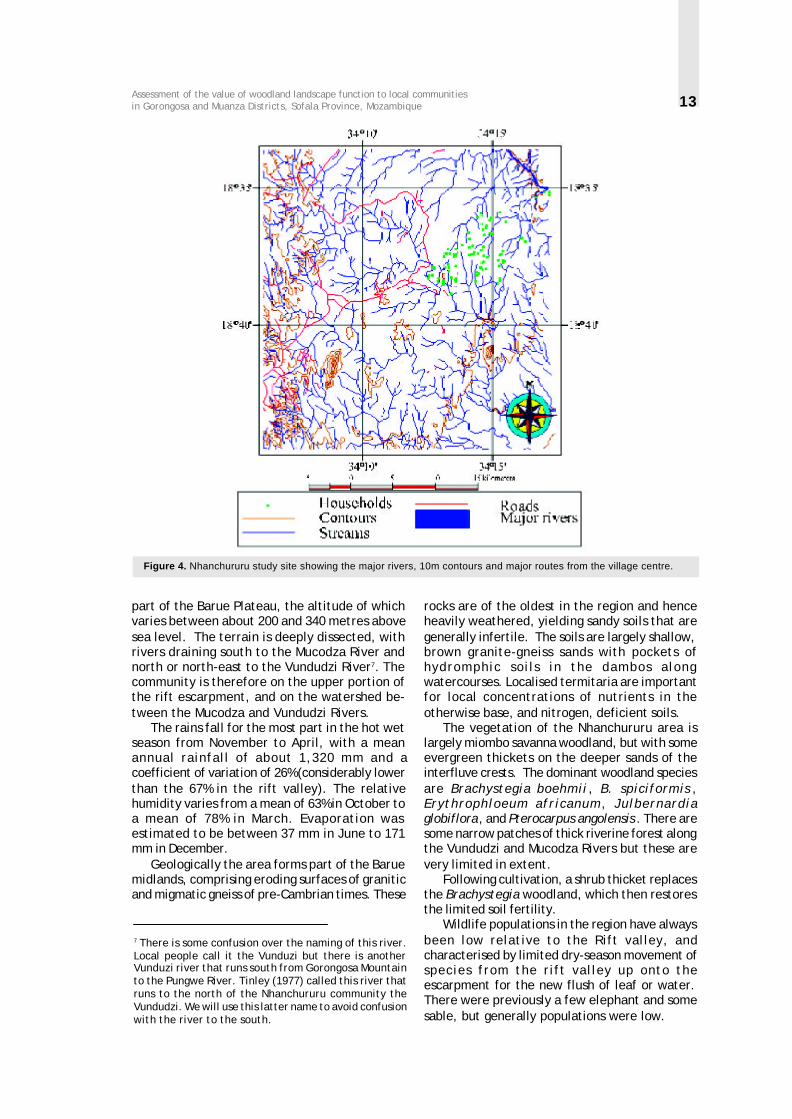
part of the Barue Plateau, the altitude of whichvaries between about 200 and 340 metres abovesea level. The terrain is deeply dissected, withrivers draining south to the Mucodza River andnorth or north-east to the Vundudzi River7. Thecommunity is therefore on the upper portion ofthe rift escarpment, and on the watershed be-tween the Mucodza and Vundudzi Rivers.
The rains fall for the most part in the hot wetseason from November to April, with a meanannual rainfall of about 1,320 mm and acoefficient of variation of 26% (considerably lowerthan the 67% in the rift valley). The relativehumidity varies from a mean of 63% in October toa mean of 78% in March. Evaporation wasestimated to be between 37 mm in June to 171mm in December.
Geologically the area forms part of the Baruemidlands, comprising eroding surfaces of graniticand migmatic gneiss of pre-Cambrian times. These
rocks are of the oldest in the region and henceheavily weathered, yielding sandy soils that aregenerally infertile. The soils are largely shallow,brown granite-gneiss sands with pockets ofhydromphic soils in the dambos alongwatercourses. Localised termitaria are importantfor local concentrations of nutrients in theotherwise base, and nitrogen, deficient soils.
The vegetation of the Nhanchururu area islargely miombo savanna woodland, but with someevergreen thickets on the deeper sands of theinterfluve crests. The dominant woodland speciesare Brachystegia boehmii , B. spiciformis ,Erythrophloeum africanum, Julbernardiaglobiflora, and Pterocarpus angolensis . There aresome narrow patches of thick riverine forest alongthe Vundudzi and Mucodza Rivers but these arevery limited in extent.
Following cultivation, a shrub thicket replacesthe Brachystegia woodland, which then restoresthe limited soil fertility.
Wildlife populations in the region have alwaysbeen low relative to the Rift valley, andcharacterised by limited dry-season movement ofspecies from the rift valley up onto theescarpment for the new flush of leaf or water.There were previously a few elephant and somesable, but generally populations were low.
7 There is some confusion over the naming of this river.Local people call it the Vunduzi but there is anotherVunduzi river that runs south from Gorongosa Mountainto the Pungwe River. Tinley (1977) called this river thatruns to the north of the Nhanchururu community theVundudzi. We will use this latter name to avoid confusionwith the river to the south.
Figure 4. Nhanchururu study site showing the major rivers, 10m contours and major routes from the village centre.
14
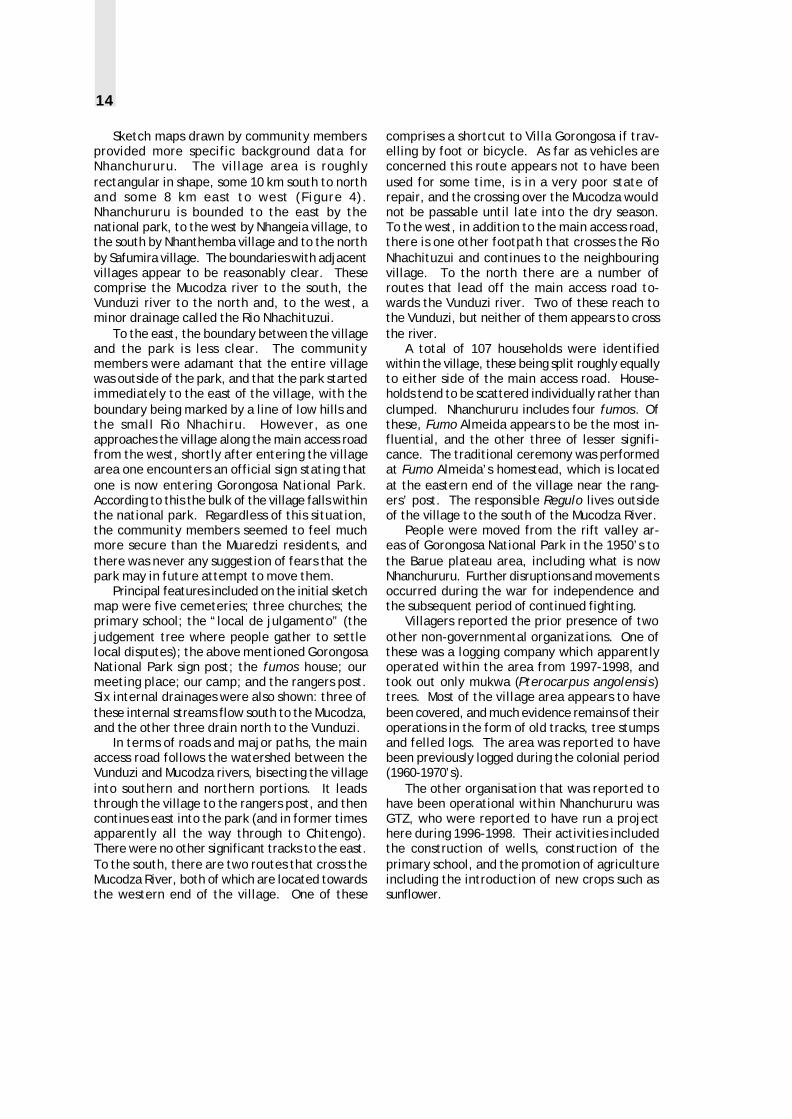
Sketch maps drawn by community membersprovided more specific background data forNhanchururu. The village area is roughlyrectangular in shape, some 10 km south to northand some 8 km east to west (Figure 4).Nhanchururu is bounded to the east by thenational park, to the west by Nhangeia village, tothe south by Nhanthemba village and to the northby Safumira village. The boundaries with adjacentvillages appear to be reasonably clear. Thesecomprise the Mucodza river to the south, theVunduzi river to the north and, to the west, aminor drainage called the Rio Nhachituzui.
To the east, the boundary between the villageand the park is less clear. The communitymembers were adamant that the entire villagewas outside of the park, and that the park startedimmediately to the east of the village, with theboundary being marked by a line of low hills andthe small Rio Nhachiru. However, as oneapproaches the village along the main access roadfrom the west, shortly after entering the villagearea one encounters an official sign stating thatone is now entering Gorongosa National Park.According to this the bulk of the village falls withinthe national park. Regardless of this situation,the community members seemed to feel muchmore secure than the Muaredzi residents, andthere was never any suggestion of fears that thepark may in future attempt to move them.
Principal features included on the initial sketchmap were five cemeteries; three churches; theprimary school; the “local de julgamento” (thejudgement tree where people gather to settlelocal disputes); the above mentioned GorongosaNational Park sign post; the fumos house; ourmeeting place; our camp; and the rangers post.Six internal drainages were also shown: three ofthese internal streams flow south to the Mucodza,and the other three drain north to the Vunduzi.
In terms of roads and major paths, the mainaccess road follows the watershed between theVunduzi and Mucodza rivers, bisecting the villageinto southern and northern portions. It leadsthrough the village to the rangers post, and thencontinues east into the park (and in former timesapparently all the way through to Chitengo).There were no other significant tracks to the east.To the south, there are two routes that cross theMucodza River, both of which are located towardsthe western end of the village. One of these
comprises a shortcut to Villa Gorongosa if trav-elling by foot or bicycle. As far as vehicles areconcerned this route appears not to have beenused for some time, is in a very poor state ofrepair, and the crossing over the Mucodza wouldnot be passable until late into the dry season.To the west, in addition to the main access road,there is one other footpath that crosses the RioNhachituzui and continues to the neighbouringvillage. To the north there are a number ofroutes that lead off the main access road to-wards the Vunduzi river. Two of these reach tothe Vunduzi, but neither of them appears to crossthe river.
A total of 107 households were identifiedwithin the village, these being split roughly equallyto either side of the main access road. House-holds tend to be scattered individually rather thanclumped. Nhanchururu includes four fumos. Ofthese, Fumo Almeida appears to be the most in-fluential, and the other three of lesser signifi-cance. The traditional ceremony was performedat Fumo Almeida’s homestead, which is locatedat the eastern end of the village near the rang-ers’ post. The responsible Regulo lives outsideof the village to the south of the Mucodza River.
People were moved from the rift valley ar-eas of Gorongosa National Park in the 1950’s tothe Barue plateau area, including what is nowNhanchururu. Further disruptions and movementsoccurred during the war for independence andthe subsequent period of continued fighting.
Villagers reported the prior presence of twoother non-governmental organizations. One ofthese was a logging company which apparentlyoperated within the area from 1997-1998, andtook out only mukwa (Pterocarpus angolensis)trees. Most of the village area appears to havebeen covered, and much evidence remains of theiroperations in the form of old tracks, tree stumpsand felled logs. The area was reported to havebeen previously logged during the colonial period(1960-1970’s).
The other organisation that was reported tohave been operational within Nhanchururu wasGTZ, who were reported to have run a projecthere during 1996-1998. Their activities includedthe construction of wells, construction of theprimary school, and the promotion of agricultureincluding the introduction of new crops such assunflower.

15
II. Community Landscape Valuation
The primary thrust of the project was to developa spatially explicit model of how community’svalue their local landscapes, and then to collectfield information from the two study sites in orderto refine, update and confront the model. Datacollection and model development were mutuallyinteractive and informing. The model was initiallycast as a general understanding of landscapevalues and then made increasingly specific as fielddata were collected.
The modelling and data confrontations werecarried out using Bayesian probabilities. Giventhis approach to probability, the mode of enquiryadopted was that of an iterative search for im-proved understanding. The process does not seeka true or false statement of the hypothesis as inthe classical statistical sense, but rather to es-tablish a degree of belief in the models. An addedadvantage of using the Bayesian approach toprobability is that local, subjective estimates ofprobability are acceptable, whereas in the clas-sical statistical paradigm subjective probabili-ties are not admissible evidence in any enquiry.
The general approach was to first developan hypothesis of what were believed to be thecrucial determinants of value of landscape unitsto community members. This formed the basisfor development of an initial conceptual model,which in turn was used to guide the initial datacollection. This data then informed changes inthe structure and data content of the revised
models, resulting in the development of “prior”models for each site. Additional field samplingwas then carried out in order to produce real datawith which to confront the models, and to furtherupdate them, thus resulting in the generation offinal “posterior” models.
A. Methods
In this section the methods used in the collectionand collation of information are described. Theobjective is to provide sufficient information thatthe reader can critically evaluate the results thatare presented. Where methods are described indetail elsewhere, these references are providedand the methods descriptions are correspondinglybrief.
1. Initial conceptual model
A preliminary conceptual model of the factorsgoverning local valuation of landscape elementsor units was presented to the CIFOR team inHarare in January 2001. Based on the resultingdiscussions the model was refined andreformulated. A computer implementation of theconceptual model was subsequently developedusing the software Netica (Norsys Software Corpwww.norsys.com). The implementation was inthe form of a Bayesian Belief Network (BBN).The model is seen as being a formalised state-

16 Tim Lynam, Rob Cunliffe, Isaac Mapaure and Isau Bwerinofa
ment of the TREP teams’ prior understandingof the processes governing local valuation oflandscapes.
2. Spatial data management
The model developed is spatially explicit, in thesense that it is designed to predict the value of agiven location within either site relative to allother locations within that area. It was therefore,necessary to develop extensive spatial data setsfor both sites, in order to provide the necessarydata for spatial and probability analyses. Theextent of the sample area for each site wasselected on the basis of initial discussions withthe Muaredzi community on how far they travelledto collect or use resources, together withsubsequent discussions among the TREP team.For both sites this comprised a square, centredon the respective community, and 20km on a side(giving a total sample area of 400km2 for eithersite). These areas dictated the extent of thevegetation assessments and the development ofspatial data sets for the two sites.
Topographic maps at 1:250,000 and 1:50,000were obtained from the Mozambique government,and data sets were digitised within the 400km2area around either community. The 1:50,000 mapswere based on rather old air photography of 1958to 1960. Additional data was obtained throughfield mapping using a number of handheld GarminGPSs (using the WGS 84 datum). For both sites,the positions of households, and of all majoroadsand paths, were recorded. The following datalayers were developed for both sites:
1. Rivers and wetlands2. Roads, paths and tracks3. Contours (at 10 m intervals, from the 1:50,000
maps) and point heights4. Settlements
The database was developed using theMicroImages Inc., TNT-MIPS software (Version 6.5)that provided complete topology for all data.
Landsat 7 imagery (Scene 167/73, 22 August1999) was procured for GNP, with the expectationthat it could be used for both vegetation mappingand for community based mapping. However, theimagery received was of poor quality, withconsiderable cloud cover over the Muaredzi area,and was found to be unsuitable for communitymapping of land types.
3. Community information collection
The same approach was followed for both sites,this being to first hold a traditional ceremony;then to hold an open community meeting; to
select a representative group of communityinformants (community resource use assessmentteam, or CRUAT); to establish a modus operandiwith the informant group and, thereafter, toproceed with the process of data collection. ForMuaredzi this was achieved over a series of threefield trips (September 2001, November 2001, andApril 2002). For Nhanchururu the traditionalceremony was held in April 2002, and theremainder of the activities and collection ofcommunity livelihood data were carried out duringa single field trip in May 2002.
The holding of a traditional ceremony prior tothe initiation of any new activity is customarywithin the rural areas of this part of Mozambique.The ceremony is performed by the local traditionalleadership. Our role was limited to the provisionof necessary items, as stipulated by the respectivecommunities.
The initial community meetings providedopportunity to explain the aims and needs of theproject to those present. The communitymembers were told that the project sought animproved understanding of household andcommunity livelihoods. It was also explained thatwe wished to work with a limited group ofinformants, and that these informants should berepresentative of the major socio-economicgroups within the community. Theserepresentatives would form the CRUAT.
At Muaredzi this initial meeting was attendedby some 38 villagers (28 men and 10 women),including the principal Fumos of the two villageswithin Muaredzi. For Nhanchururu the groupcomprised 42 community members, all of whomwere men, and again including two Fumos.
At either site the nature and conditions ofinvolvement with the project were explained, andthen the assembled group was asked to nominatepeople to form the CRUAT. The initial responsefor both sites was that the community traditionwas to ask for volunteers. For Muaredzi, this wasdone on the basis of a simple scoring activity that
Discussing a food spidergram, Mauredzi.

17Assessment of the value of woodland landscape function to local communitiesin Gorongosa and Muanza Districts, Sofala Province, Mozambique
The distribution of the above yielded only 27%women. As a general principle the approachdeveloped for working with local communities(Lynam, 2001) has been to seek an equalrepresentation of men and women in such CRUATgroups. The younger male group was thereforeasked if half of them would send their wives instead.This would have been problematic for somehouseholds, so it was agreed that the three youngermen that volunteered to send their wives could bothsend their wives and attend the workshopthemselves. This resulted in a final group of 22informants, comprising 14 men and 8 women.
A similar process was followed for Nhanchururu.The resulting group size there was 18 informants,comprising 10 men and 8 women, including 3 oldermen and one older women.
ing from 7:00 to 13:00. The Nhanchururu in-formants also chose to work from 7:00 to 13:00.
CRUAT members were paid a small daily al-lowance for their input into the project, amount-ing to about US$ 1.30 for Muaredzi and US$ 1.50for Nhanchururu. These amounts were arrivedat through discussion and agreement with theCRUAT members.
Group meetings were conducted in three dif-ferent languages: English, Portuguese and Sena.The translation back and forth between these lan-guages took time. For the first two trips toMuaredzi the process was crucially dependent onthe single Portuguese - Sena translator (Mr.Camissa) and the single Portuguese - English trans-lator (Mr. Jujuman). For the remaining trips Mr.Jujuman was replaced by three other translators/facilitators, two of whom could translate fromPortugese to English, and all three from Portugeseto Sena.
Three basic tools were used for the analysisthat was conducted - spidergrams, sketch mappingand open discussion. As each of these have beendescribed in detail elsewhere (Lynam, 2001) theywill not be described here.
4. Refinement of the model
Information obtained from the CRUATs wassubsequently used to shape and update the modelfor both study sites. In particular, this enabledthe detailing of both goods and services and alsocost functions for each site, and the assignmentof relative weights to each of these factors. Theresult was the development of specific priormodels for either site. These models were therebyat a stage whereby through inputting informationregarding the status of each of the peripheralnodes (goods and services and cost functions) fora particular point location, the model wouldprovide an estimate of the most probable valuefor that location.
5. Field sampling for modelconfrontation
The final step in terms of collection of field datawas to carry out a sampling process, in order togenerate field data with which to confront themodel, and to provide the basis for furtherrefinement and updating of the model. Thegeneral approach was to visit a number oflocations within each village, together withCRUAT members and, for each site, to recordtheir scores for each of the goods and servicespresent at the site, for all cost factors, and thenan overall landscape value. The scores for goodsand services and for cost factors weresubsequently fed into the model, based on which
It was emphasised to CRUAT members thatthey would have the dual responsibilities of bothproviding information on resource use andlivelihoods within the village, and also forreporting back to the community about theproject and the exercises that we were doing.
The CRUATs for both study sites agreed to workfor six hours per day. For Muaredzi, the groupinitially met each day from 8:00 until 12:00 andthen again from 14:00 to 16:00. On subsequenttrips the CRUAT insisted on a single session last-
identified the relative frequency of households ineach of three household categories (old people,younger people and widows - Table 1).
Table 1. Perceived proportions of households in threesocio-economic categories in Muaredzi as identified bycommunity members in a public meeting.
Socio-economic Community % ofcategory score households
Households headed 3 20by older menHouseholds headed 8 53by younger menHouseholds headed 4 27by widows
Muaredzi CRUAT members developing a village map.
18 Tim Lynam, Rob Cunliffe, Isaac Mapaure and Isau Bwerinofa
the model generated an estimated value for eachsample. These estimates were then comparedagainst the CRUAT values for each sample.
The sampling procedure was tested atMuaredzi during April 2002, after which it wasmodified and refined. Sampling for both siteswas carried out over a single field trip during July2002. In order to increase the number of samplespossible within the available time, the CRUATgroup at each site was split into three or foursubgroups. Each subgroup comprised severalcommunity members, plus a data recorder(facilitator). For Muaredzi, each subgroupcomprised two men and four women, whilst forNhanchururu the subgroup composition was twomen and two women.
Sampling was done along line transects. Eachsubgroup would cover a single transect per day.The placement of transects was selected on thebasis of providing overall coverage of each villagearea, coupled with logistical constraints, notablythe existence of potential access paths and roads,(the start and end points for each transect neededto be accessible by path or road). The length oftransects was decided according to the estimatedtime available for sampling i.e. total working timeof six hours per day, less time required to travelto the starting point and to return from the endpoint. Lengths varied from about 1.5km to
4.5km. The sampling interval and number ofsamples per transect were decided in the field,once at the starting point for the transect, andwere based on the estimated time available forsampling and the time it was likely to take totraverse the transect. Sampling intervalsranged from about 250 to 600m and the numberof samples per transect from 4 to 12.
The placement of transects was decided soas to cover the principal land types within eacharea, and all different combinations of distancesalong paths and off paths (since the priorversions of the model had shown a highsensitivity to these parameters). Actualpositions were first selected on satelliteimagery. Thereafter, the co-ordinates of thestart and end points were read off the GIS mapsand entered into GPS’s. Each day, the recorderfor each group would be given a GPS within whichthe start and end points for that day’s transecthad been entered. The group would then moveto the start point and do their first sample.Thereafter, they would use the GPS “Goto”function, to move directly towards thedesignated end point, recording additionalsamples at the agreed sample interval. Inpractice, recorders were required to use theirpersonal judgement, if necessary, to modify theirplanned sampling procedure according to their
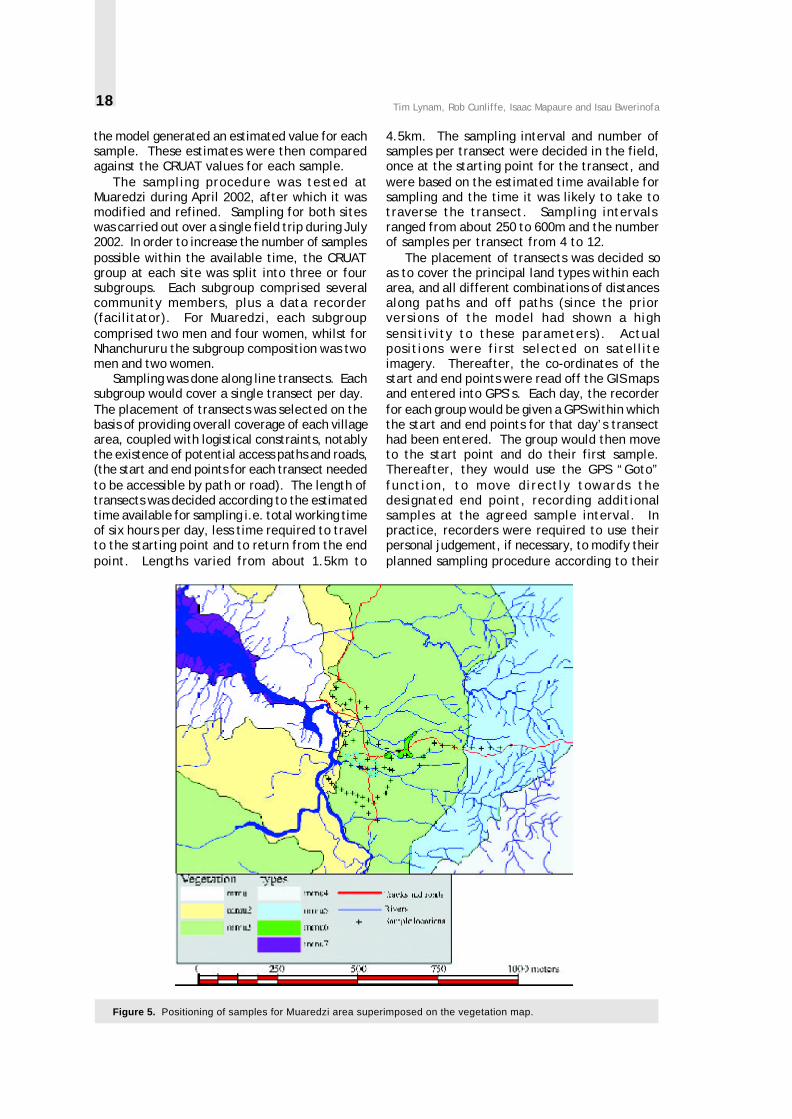
Figure 5. Positioning of samples for Muaredzi area superimposed on the vegetation map.
19Assessment of the value of woodland landscape function to local communitiesin Gorongosa and Muanza Districts, Sofala Province, Mozambique
rate of progress and distance to be covered forthat day.
Sample size was taken as being a circle,roughly 30m in radius (i.e. 0.28 ha in extent).The group would arrive at a sample point, andthen score the necessary factors based onconsideration of the resources and cost factorsapparent within a 30m radius. Sample areas werenot systematically searched either prior to, orduring, the scoring.
Individual data sheets were developed forMuaredzi and Nhanchururu to reflect the specificgoods and services and cost factors for either site.Copies of these are attached in Appendix 1. Thefirst section comprises basic information such asthe sample number, location, date, recorder, GPSco-ordinates, land type, soil type and vegetationtype (forest, woodland, grassland or field). Thisis followed by a listing of goods and services andcost factors, each of which was rated under fourpossible categories (for goods and services: good,moderate, poor or none; for cost factors: high,moderate, low or none; and for distances: veryfar, far, close or very close). Following this anoverall landscape value for the site was recorded,plus notes as to why this score was being given.The purpose of the notes was to provide a checkto make sure that informants were not beingunduly influenced by other factors not alreadycaptured on the data sheets.
Scoring of landscape values was open ended,and relative to the least important locality within
the village area, which was allocated a value ofone point. For either site, the reference point oflowest value was identified at the outset of thesampling process, and by the entire CRUAT grouptogether. For Muaredzi, the CRUAT identified acertain occurrence of chipale, known as Nteca,as being the site of lowest value. ForNhanchururu, the CRUAT identified a certainrange of hills within the national park area, asbeing the lowest value. CRUAT members reportedbeing familiar with these sites, and the types ofresources to be found there. However, in neithercase had all the informants, particularly thewomen, ever been to these places, and nor werethey visited as part of this exercise.
At the outset of the sampling process, for bothsites, the sampling procedure was first discussedwith the entire CRUAT group. Thereafter, severalsamples were completed either with the combinedgroup or several subgroups, following which theresults were presented to and discussed with thewhole group. For Muaredzi, at the start of eachday before setting off to sample, each subgroupfirst presented and discussed their results fromthe previous day to the combined CRUAT group.For Nhanchururu, there was no reporting back bysubgroups to the main CRUAT group.
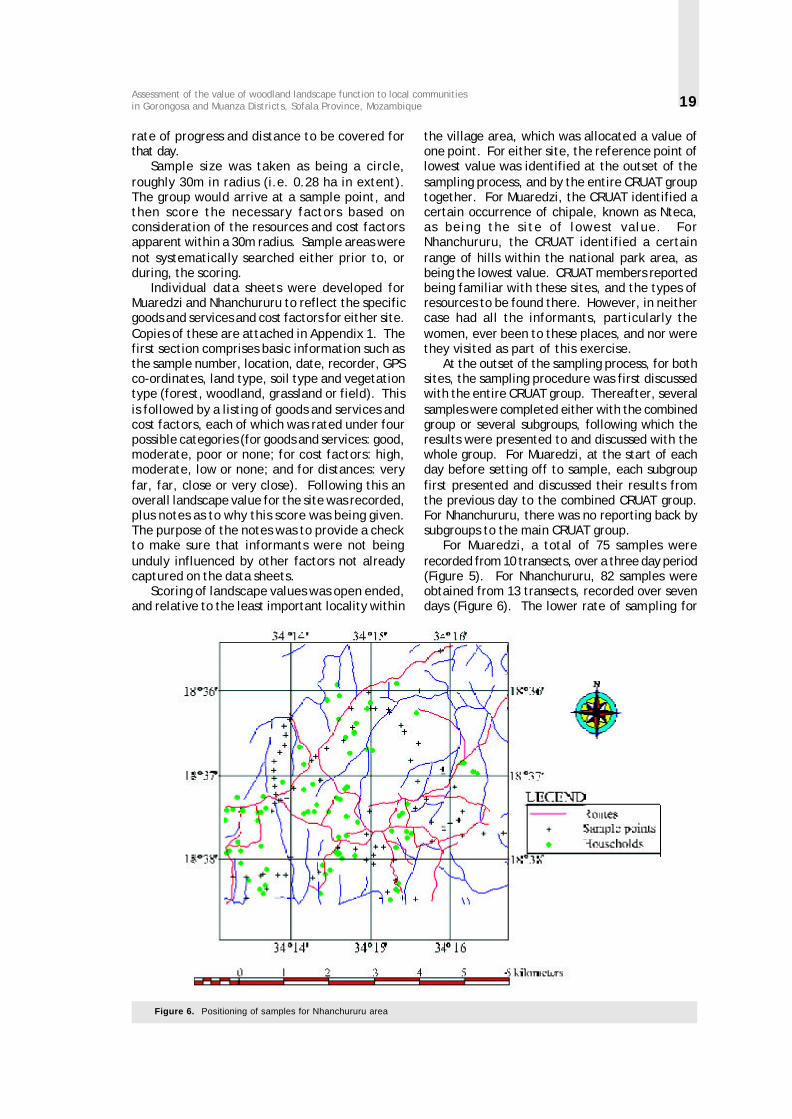
For Muaredzi, a total of 75 samples wererecorded from 10 transects, over a three day period(Figure 5). For Nhanchururu, 82 samples wereobtained from 13 transects, recorded over sevendays (Figure 6). The lower rate of sampling for
Figure 6. Positioning of samples for Nhanchururu area
20 Tim Lynam, Rob Cunliffe, Isaac Mapaure and Isau Bwerinofa
Nhanchururu as compared to Muaredzi was a resultof starting here and being less familiar with theprocedure; of the more difficult (broken and hilly)terrain; and of disruptions due to rain.
6. Updating the models
Field sample data was subsequently entered ontoa spreadsheet to form a case file for each site.Each case file consisted of the total number ofsamples (75 for Muaredzi and 82 for Nhanchururu),with each sample having scores for all goods andservices and for all cost factors. Based on thisdata, the model generated estimated landscapevalues for each sample location. These valueswere then compared against the values given foreach sample by the CRUAT members.
The case files were then used to confront themodels for each site. In each case the models werefirst confronted with the data in the case files,and the same case files were then used to updatethe probability structure of the model. Theresulting (posterior) models were subsequentlyused to explore the sensitivity of the models tothe collection of further information for eachnode, and also to explore the implications of theunderstanding gained for land use planning andpolicy decision making.
B. Results and discussionIn this section the field results obtained from theMuaredzi and Nhanchururu CRUATs are described,together with the various versions of the models.The presentation begins with a description of theinitial conceptual model and the first computerimplementations of the model (Section II.B.1).Presentations of the community assessment resultsthen follow (Sections II.B.2 and II.B.3). Based onthese results it was possible to update and refinethe models for both sites, resulting in theformulation of the prior models. Results of thesubsequent field sampling exercise, together withthe updated posterior models, are presented inSection II.B.4. The final section providescomparisons between the community landscapevaluations and the estimated values from themodel (Section II.B.5).
1. Initial conceptual model
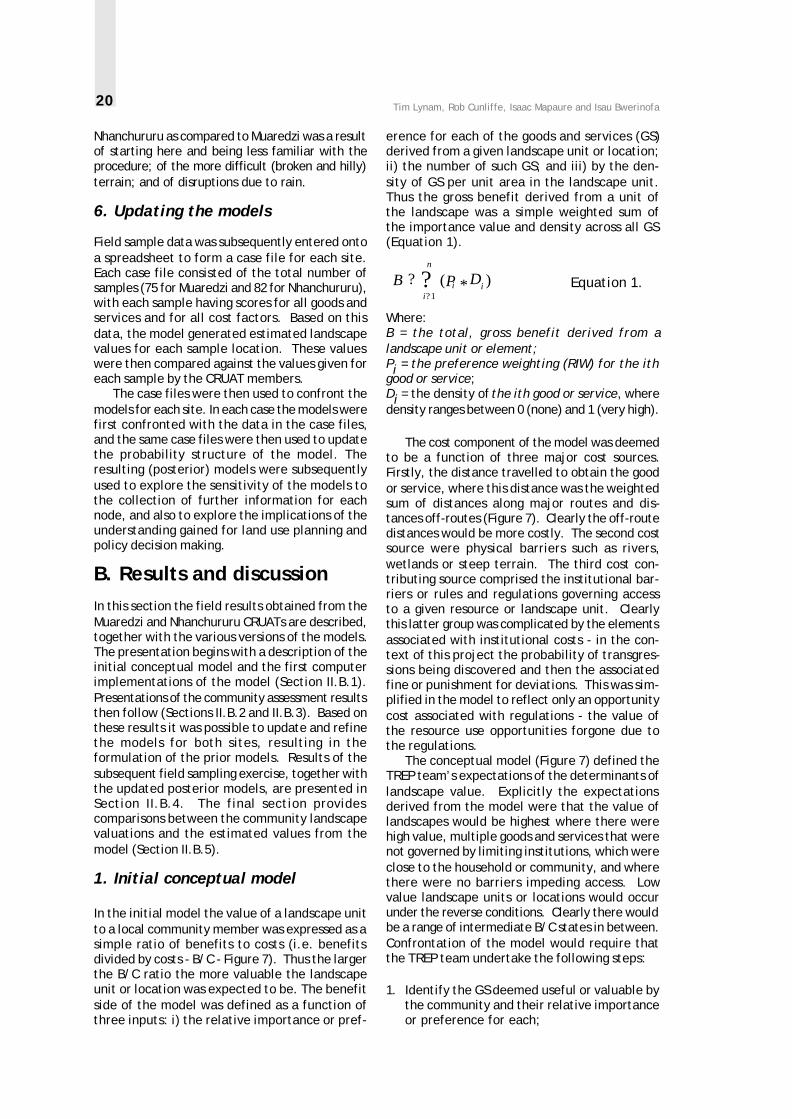
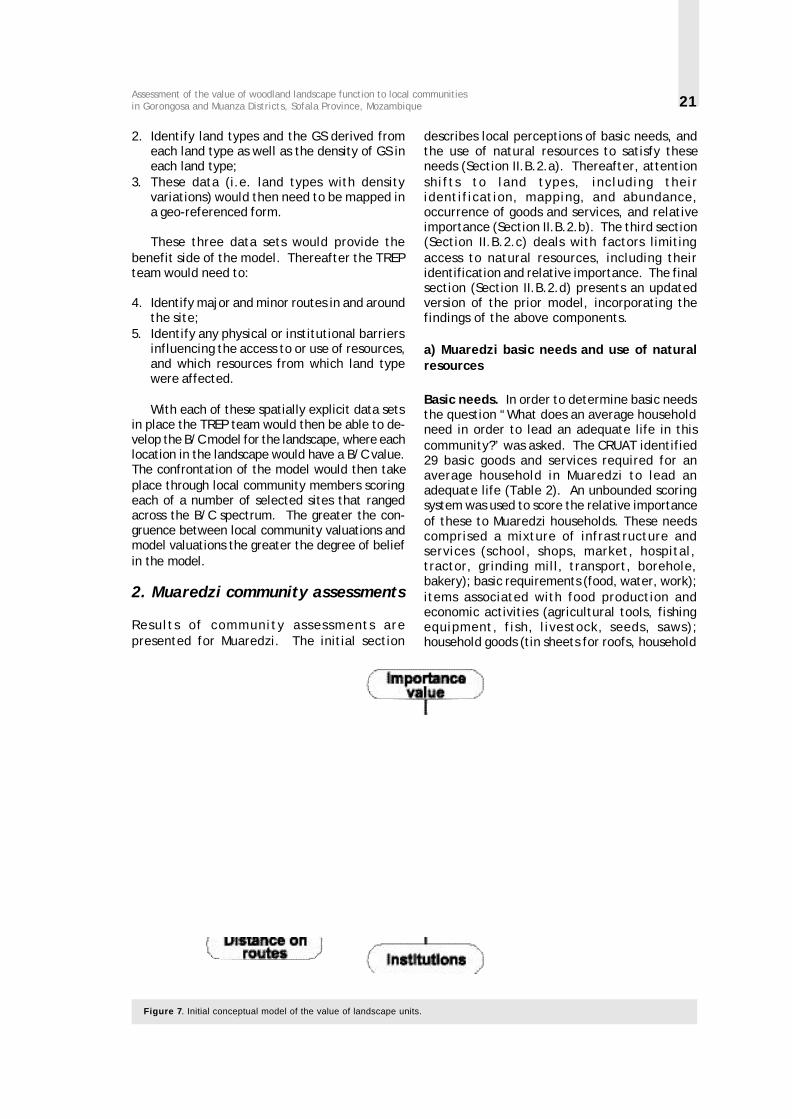
In the initial model the value of a landscape unitto a local community member was expressed as asimple ratio of benefits to costs (i.e. benefitsdivided by costs - B/C - Figure 7). Thus the largerthe B/C ratio the more valuable the landscapeunit or location was expected to be. The benefitside of the model was defined as a function ofthree inputs: i) the relative importance or pref-
erence for each of the goods and services (GS)derived from a given landscape unit or location;ii) the number of such GS; and iii) by the den-sity of GS per unit area in the landscape unit.Thus the gross benefit derived from a unit ofthe landscape was a simple weighted sum ofthe importance value and density across all GS(Equation 1). B P D i i
i
n ?
? ? ( * )
1 Equation 1.
Where:B = the total, gross benefit derived from alandscape unit or element;Pi = the preference weighting (RIW) for the ithgood or service;Di = the density of the ith good or service, wheredensity ranges between 0 (none) and 1 (very high).
The cost component of the model was deemedto be a function of three major cost sources.Firstly, the distance travelled to obtain the goodor service, where this distance was the weightedsum of distances along major routes and dis-tances off-routes (Figure 7). Clearly the off-routedistances would be more costly. The second costsource were physical barriers such as rivers,wetlands or steep terrain. The third cost con-tributing source comprised the institutional bar-riers or rules and regulations governing accessto a given resource or landscape unit. Clearlythis latter group was complicated by the elementsassociated with institutional costs - in the con-text of this project the probability of transgres-sions being discovered and then the associatedfine or punishment for deviations. This was sim-plified in the model to reflect only an opportunitycost associated with regulations - the value ofthe resource use opportunities forgone due tothe regulations.
The conceptual model (Figure 7) defined theTREP team’s expectations of the determinants oflandscape value. Explicitly the expectationsderived from the model were that the value oflandscapes would be highest where there werehigh value, multiple goods and services that werenot governed by limiting institutions, which wereclose to the household or community, and wherethere were no barriers impeding access. Lowvalue landscape units or locations would occurunder the reverse conditions. Clearly there wouldbe a range of intermediate B/C states in between.Confrontation of the model would require thatthe TREP team undertake the following steps:
1. Identify the GS deemed useful or valuable bythe community and their relative importanceor preference for each;
21Assessment of the value of woodland landscape function to local communitiesin Gorongosa and Muanza Districts, Sofala Province, Mozambique
2. Identify land types and the GS derived fromeach land type as well as the density of GS ineach land type;
3. These data (i.e. land types with densityvariations) would then need to be mapped ina geo-referenced form.
These three data sets would provide thebenefit side of the model. Thereafter the TREPteam would need to:
4. Identify major and minor routes in and aroundthe site;
5. Identify any physical or institutional barriersinfluencing the access to or use of resources,and which resources from which land typewere affected.
With each of these spatially explicit data setsin place the TREP team would then be able to de-velop the B/C model for the landscape, where eachlocation in the landscape would have a B/C value.The confrontation of the model would then takeplace through local community members scoringeach of a number of selected sites that rangedacross the B/C spectrum. The greater the con-gruence between local community valuations andmodel valuations the greater the degree of beliefin the model.
2. Muaredzi community assessments
Results of community assessments arepresented for Muaredzi. The initial section
describes local perceptions of basic needs, andthe use of natural resources to satisfy theseneeds (Section II.B.2.a). Thereafter, attentionshifts to land types, including theiridentification, mapping, and abundance,occurrence of goods and services, and relativeimportance (Section II.B.2.b). The third section(Section II.B.2.c) deals with factors limitingaccess to natural resources, including theiridentification and relative importance. The finalsection (Section II.B.2.d) presents an updatedversion of the prior model, incorporating thefindings of the above components.
a) Muaredzi basic needs and use of naturalresources
Basic needs. In order to determine basic needsthe question “What does an average householdneed in order to lead an adequate life in thiscommunity?” was asked. The CRUAT identified29 basic goods and services required for anaverage household in Muaredzi to lead anadequate life (Table 2). An unbounded scoringsystem was used to score the relative importanceof these to Muaredzi households. These needscomprised a mixture of infrastructure andservices (school, shops, market, hospital,tractor, grinding mill, transport, borehole,bakery); basic requirements (food, water, work);items associated with food production andeconomic activities (agricultural tools, fishingequipment, fish, livestock, seeds, saws);household goods (tin sheets for roofs, household
Figure 7. Initial conceptual model of the value of landscape units.

22 Tim Lynam, Rob Cunliffe, Isaac Mapaure and Isau Bwerinofa
Food sources. Food was rated as beingthe second most important need, after that ofa school (Table 2). The group was thereforeasked to identify “What are the main sourcesof food for households within Muaredzi?” Threemain sources were identified: cultivatedproducts, wild fruit, and other forest products.There appeared to be some initial confusion asto whether the question was to identify maintypes of food, or just those produced or collectedlocally from the environment, as opposed tothose brought in from outside. This was resolved
by adding a fourth group comprising importedfoods.
Each of the three local food sources was thenexplored individually. For each class of food thequestion was posed “What are the most importantsources of this type of food within Muaredzi?” Atotal of 39 food crops were identified. The fivemost important types were all starches (sorghum,maize, rice, millet, casava) and collectivelyaccounted for 37% of the total importance mass.Sweet potato, three types of beans, and a squashtogether made up a further 18% of the totalimportance mass, with the remaining 45% beingsplit among the other 29 products.
Excluding wild fruit, a total of 41 forestproducts were identified as food sources. Theprincipal products included grains, tubers, honey,salt, oil, vegetables (leaves) and insects. A totalof 25 wild fruits were identified. The top tenfruits collectively accounted for 67% of theoverall importance mass.
Following from these results, an attempt wasmade to establish the relative importance of thedifferent sources of food, and under differentcircumstances. Before doing this, a fourth foodcategory was added, comprising purchased fooditems. The initial question asked was “Howimportant are the different types of food to anaverage household within Muaredzi achieving anadequate supply of food?” A bounded scoringapproach was used, with five points beingallocated for each of the four types, giving a totalof 20 points. Crops were identified as being themost important food source (8 points) followedby forest products (6 points), while purchasedfoods (4 points) and wild fruit (2 points) wereconsidered less important.
The CRUAT was then asked whether thesescores always remained the same, or whether theycould identify any conditions under which thesescores were likely to change. Two possibilitieswere identified – conditions of drought andfloods. In order to get people thinking about
implements, clothes, sewing machines,blankets, furniture, mosquito nets, beds), anda football for recreation. The two institutionalcomponents (rules and traditions and localleaders) were only added after prompting. Thereis good general correspondence between theseneeds and those identified previously by Costaand Vogt (1998).
Recently harvested field in Mauredzi showing the bush clearancepractices of agricultural production. Sorghum residues and youngcassava plants in the foreground.
Table 2. Goods or services that make up the set of basicneeds required by an average household living anadequate quality of life in Muaredzi. Importance scoresreflect the relative importance of each good or serviceto achieving this standard of living. All scores are relativeto the least important factor (football).
Basic needs RIW RIWS RIWC
School 35 0.098 0.098Food 28 0.078 0.176Water 27 0.075 0.251Agricultural tools 20 0.056 0.307Work 20 0.056 0.363Traditions and rules 19 0.053 0.416Shops 18 0.050 0.466Equipment for fishing 18 0.050 0.517Tin sheets for roofs 16 0.045 0.561Market 16 0.045 0.606Fish 15 0.042 0.648Livestock 15 0.042 0.690Household implements 15 0.042 0.732Hospital 13 0.036 0.768Tractor for ploughing 12 0.034 0.802Grinding mill 11 0.031 0.832Seeds 10 0.028 0.860Clothes 10 0.028 0.888Local leaders 8 0.022 0.911Transport (to Mwanza) 7 0.020 0.930Sewing machines 5 0.014 0.944Household bedding 4 0.011 0.955Household furniture 4 0.011 0.966Borehole 3 0.008 0.975Mosquito nets 2 0.006 0.980Bed and mattress 2 0.006 0.986Bakery 2 0.006 0.992Saws 2 0.006 0.997Football 1 0.003 1.000Totals 358 1.000 1.000
RIW (Relative Importance Weight)RIW S (Standardised RIW)RIWC (Cumulative Standardised RIW)

23Assessment of the value of woodland landscape function to local communitiesin Gorongosa and Muanza Districts, Sofala Province, Mozambique
these conditions, they were first asked to listsuch years, working back from the present. Fivedrought years (1994, 1993, 1988, 1987 and1977) and four flood years (2001, 1996, 1992,1989) were identified during the previous 25years. These data should not be consideredparticularly reliable, as discussion was curtailedconcerning the relative intensities of such eventsand as to what should or should not be consid-ered a drought or flood year. The purpose ofthis exercise was merely to get people thinkingabout such conditions. During both drought andflood years it was reported that food crops be-come less important, and people rely more heav-ily on purchases and forest products (both wildfruits and other forest products, Table 3).
the overall importance mass. Constructionmaterials, firewood, fish, the selling of excessagricultural produce, and grinding sticks/stones,accounted for a further 46% of the importancemass. The remaining seven resources wereconsidered to be of lesser importance, collectivelyaccounting for the final 25% of the importancemass. Two other resources that could have beenadded to the listing, but were not considered,are artefacts and fishing materials. Theidentification of good and services and theirrelative scoring is largely consistent with resultsobtained previously concerning livelihoodactivities. The most dramatic change is forfirewood, but this results largely through a changein emphasis from the selling of firewood to homeconsumption.
Livelihood activities. CRUAT members wereasked to identify activities engaged in by house-holds in Muaredzi in order to satisfy their basicneeds. The group identified 16 such activities(Table 4). These equate to components of theirlivelihood systems. Over 70% of the identifiedimportance mass was associated with agricul-ture, grinding meal, house construction, welldigging and fishing. Surprisingly, fishing, whichappeared to be a major community activity, wasnot scored more highly. The dominant liveli-hood activities cast this community as largely asubsistence production community, with foodneeds largely being met from agriculturalproduction and to a lesser extent fishing.
Overall goods and services. At a later stage,after having thought in some detail as to the typesof goods and services associated with differenttypes of land, and also of the relative importanceof these different factors, the CRUAT group wasasked to draw up a composite list of all goods andservices. The relative importance of each of thesewas scored as regards its contribution towards anaverage family within Muaredzi living an adequatelife. These results are presented in Table 5. Themost important factors came out as water andagriculture, together accounting for one third of
Table 5. Final set of goods and services that were identifiedby Muaredzi CRUAT. Standardised RIW used in the BBN.
Final goods and services RIW RIWS RIWC
Water 20 0.163 0.163Agriculture 20 0.163 0.325Construction materials 16 0.130 0.455Firewood 15 0.122 0.577Fish 13 0.106 0.683Grinding sticks/stones 10 0.081 0.764Clay products 8 0.065 0.829Palm leaf products 6 0.049 0.878Palm wine 5 0.041 0.919Honey 4 0.033 0.951Medicine 3 0.024 0.976Wild foods 2 0.016 0.992Wild fruits 1 0.008 1.000Totals 123 1.000 1.000
Table 3. Perceived relative importance of differentsources of food within Muaredzi, to Muaredzi households,under normal conditions, drought and flood conditions. Abounded scoring approach was used, with an allocationof five points per factor, giving an overall total of 20points for each set of circumstances.
Source Normal Drought Floodof food conditions years1 years2
Fields 8 2 2Forest Products 6 7 4Purchased 4 8 8Wild Fruit 2 3 6Total 20 20 201 Drought years: 1994, 1993, 1988, 1987, 19772 Flood years: 2001, 1996, 1992, 1989
Table 4. Activities that households in Muaredziundertake as part of their livelihood systems. Scoresreflect the relative importance of each activity tohousehold well being. All scores are relative to the leastimportant activity (selling firewood).
Activity RIW RIWS RIWC
Agriculture 20 0.164 0.164Making grinding sticks 18 0.148 0.311House construction 16 0.131 0.443Digging wells 12 0.098 0.541Grinding meal with pestle 11 0.090 0.631and mortarFishing 10 0.082 0.713Sales of food surpluses 7 0.057 0.770Traditional medicines 6 0.049 0.820Grinding meal with stones 5 0.041 0.861Making clay pots 4 0.033 0.893Bee keeping 3 0.025 0.918Making palm leaf products 3 0.025 0.943Wild fruit collection 2 0.016 0.959Bartering 2 0.016 0.975Production of palm wine 2 0.016 0.992Selling firewood 1 0.008 1.000Total 122 1.000 1.000

24 Tim Lynam, Rob Cunliffe, Isaac Mapaure and Isau Bwerinofa
b) Muaredzi land types
During the first data collection field trip the CRUATwas asked “What types of land are found in thisarea?” After considerable discussion a total ofeight land types were identified (gombe,madimba, thando, planicie, chipale, nsitu,planalto and murmuchea - Appendix 2), andthese were subsequently scored in terms of rela-tive importance. During the second data collec-tion trip the discussion concerning land typeswas restarted by posing the following question:“Are you satisfied that these eight land typesare an accurate reflection for Muaredzi Village?”After lengthy debate, it was proposed that threecategories should be done away with. Chipale(bare ground) was lumped together with nsitu(forest), as these were considered to alwaysoccur in association with one another; thando(floodplain) was merged with planicie (plains)due to difficulties in separating these from oneanother; and madimba (dry season cropping ar-eas) was included with gombe (areas with wa-ter). Planalto (uplands) and murmuchea (ter-mite mounds) were retained unchanged. Someof the aspects that came up during the discus-sion were whether gombe should be split intolakes, rivers etc; the possibility of including spe-cific soil types as discrete land units; and wherethe different types are found.
The group was then asked to score the resultingfive types in terms of importance and abundance(Table 6). Importance ratings were similar to thoseobtained on the previous field trip, particularly forgombe/madimba (high), and murmuchea andplanalto (both low). Nsitu received a somewhathigher relative rating than before. The greatestdiscrepancy was the markedly lower rating forplanicie/thando. This score of 4 points seemsunrealistic given that it was later revealed that allhomesteads and machambas (fields) are locatedwithin planicie, and that more goods and servicesare derived from planicie than from any of theother land types.
Two scoring exercises were carried out to es-tablish local perceptions of the relative abundanceof land types within Muaredzi (Table 7). Initiallythe CRUAT members were asked to score the abun-dance of the five composite types as identifiedabove. Surprisingly, murmuchea was consideredto be the most abundant land type (9 points). Whenqueried, the CRUAT remained adamant about thisrating, on the basis that termite mounds werecommon in planicie, nsitu and planalto. Planicie/thando, gombe/madimba and nsitu/chipale wereconsidered to of similar abundance (6, 5 and 4points respectively). The low abundance of planalto(1 point) suggests that people were taking a rela-tively limited perspective of the village area, and
Table 6. Importance of principal land types found withinthe Muaredzi area, according to their contribution to-wards satisfying the basic needs for an average familywithin Muaredzi village. Two scoring exercises were car-ried out during separate field trips, but which were basedon different baskets of land types. For both exercises abounded scoring approach was used, with an allocationof five points per land type.
Local RIW
description Land type 1ft* 2ft
Gombe Wet areas 8 -Madimba Dry season crop areas 8 -Gombe Wet areas plus (16) 10(+Madimba) adjacent dry season
crop areasNsitu Forests 6 -Chipale Bare areas 1 -Nsitu (+Chipale) Forests plus (7) 7
accompanying bareareas
Planicie Lowlands 8 -Thando Seasonally flooded 3 -
areasPlanicie (+Thando) Lowlands including (11) 4
areas of seasonalflooding
Murmuchea Termite mounds 4 3Planalto Upland areas 2 1Total 40 25
* Scores in parentheses are the sums of the scores of the aggregatedland types.RIW (Relative Importance Weight)1ft (First field trip)2ft (Second field trip)
which is perhaps linked to the fact that relativelyfew goods and services appear to be derived fromthe planalto area.
The second scoring exercise was carried outthe following day, after completion of a sketchmap of land types (see below). This time thebasket of types comprised the six elements thatwere mapped as discrete units. Murmuchea wereexcluded on the basis that it was not possible tomap their occurrence. The major differences ascompared to the previous scoring were theconsiderably higher ratings for both planicie/thando (together 12 points) and the uplandplanalto areas (8 points). Ratings for gombe/madimba and nsitu/chipale remained much thesame. This second lot of abundance scores isprobably a more realistic reflection of the actualsituation, particularly in that it was carried outafter the land unit mapping exercise, which hadnecessitated considerable thought as to theoccurrence and distribution of the various types.
Mapping of land types. A subgroup was taskedwith drawing a sketch map to show the occurrenceof the various land types within Muaredzi. As afirst step the group sketched in a basic reference
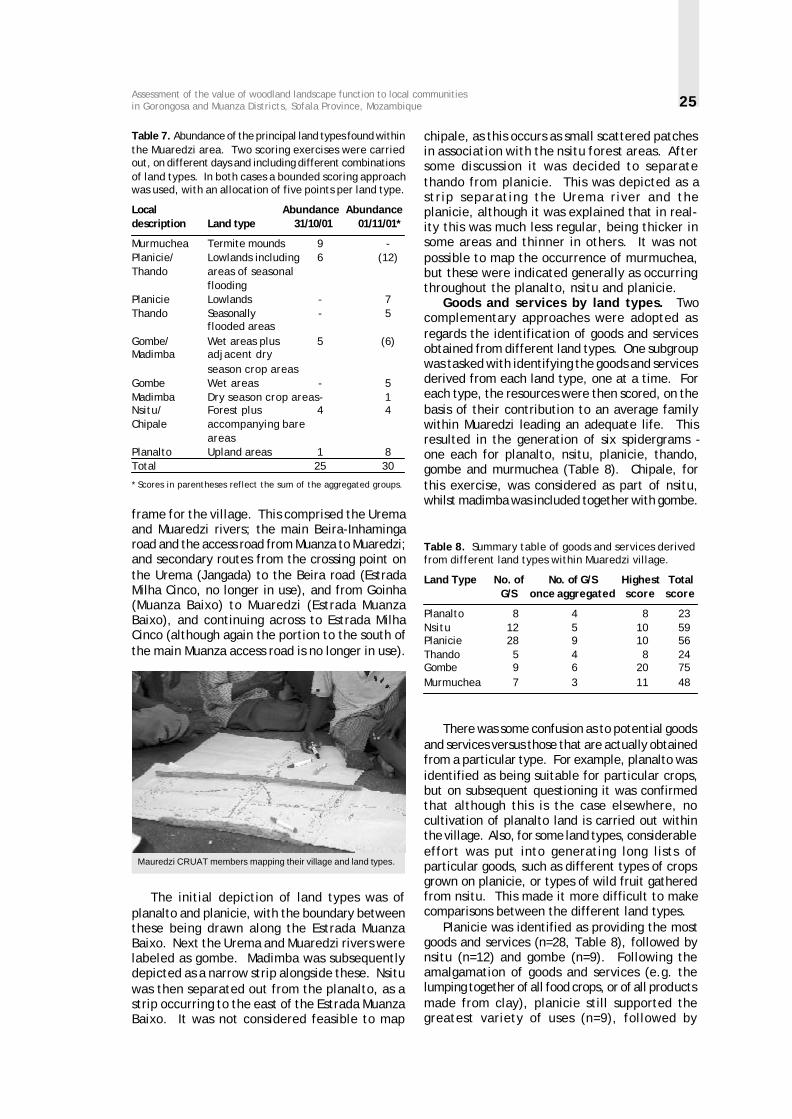
25Assessment of the value of woodland landscape function to local communitiesin Gorongosa and Muanza Districts, Sofala Province, Mozambique
frame for the village. This comprised the Uremaand Muaredzi rivers; the main Beira-Inhamingaroad and the access road from Muanza to Muaredzi;and secondary routes from the crossing point onthe Urema (Jangada) to the Beira road (EstradaMilha Cinco, no longer in use), and from Goinha(Muanza Baixo) to Muaredzi (Estrada MuanzaBaixo), and continuing across to Estrada MilhaCinco (although again the portion to the south ofthe main Muanza access road is no longer in use).
chipale, as this occurs as small scattered patchesin association with the nsitu forest areas. Aftersome discussion it was decided to separatethando from planicie. This was depicted as astrip separating the Urema river and theplanicie, although it was explained that in real-ity this was much less regular, being thicker insome areas and thinner in others. It was notpossible to map the occurrence of murmuchea,but these were indicated generally as occurringthroughout the planalto, nsitu and planicie.
Goods and services by land types. Twocomplementary approaches were adopted asregards the identification of goods and servicesobtained from different land types. One subgroupwas tasked with identifying the goods and servicesderived from each land type, one at a time. Foreach type, the resources were then scored, on thebasis of their contribution to an average familywithin Muaredzi leading an adequate life. Thisresulted in the generation of six spidergrams -one each for planalto, nsitu, planicie, thando,gombe and murmuchea (Table 8). Chipale, forthis exercise, was considered as part of nsitu,whilst madimba was included together with gombe.
The initial depiction of land types was ofplanalto and planicie, with the boundary betweenthese being drawn along the Estrada MuanzaBaixo. Next the Urema and Muaredzi rivers werelabeled as gombe. Madimba was subsequentlydepicted as a narrow strip alongside these. Nsituwas then separated out from the planalto, as astrip occurring to the east of the Estrada MuanzaBaixo. It was not considered feasible to map
There was some confusion as to potential goodsand services versus those that are actually obtainedfrom a particular type. For example, planalto wasidentified as being suitable for particular crops,but on subsequent questioning it was confirmedthat although this is the case elsewhere, nocultivation of planalto land is carried out withinthe village. Also, for some land types, considerableeffort was put into generating long lists ofparticular goods, such as different types of cropsgrown on planicie, or types of wild fruit gatheredfrom nsitu. This made it more difficult to makecomparisons between the different land types.
Planicie was identified as providing the mostgoods and services (n=28, Table 8), followed bynsitu (n=12) and gombe (n=9). Following theamalgamation of goods and services (e.g. thelumping together of all food crops, or of all productsmade from clay), planicie still supported thegreatest variety of uses (n=9), followed by
Mauredzi CRUAT members mapping their village and land types.
Table 7. Abundance of the principal land types found withinthe Muaredzi area. Two scoring exercises were carriedout, on different days and including different combinationsof land types. In both cases a bounded scoring approachwas used, with an allocation of five points per land type.
Local Abundance Abundancedescription Land type 31/10/01 01/11/01*
Murmuchea Termite mounds 9 -Planicie/ Lowlands including 6 (12)Thando areas of seasonal
floodingPlanicie Lowlands - 7Thando Seasonally - 5
flooded areasGombe/ Wet areas plus 5 (6)Madimba adjacent dry
season crop areasGombe Wet areas - 5Madimba Dry season crop areas- 1Nsitu/ Forest plus 4 4Chipale accompanying bare
areasPlanalto Upland areas 1 8Total 25 30
* Scores in parentheses reflect the sum of the aggregated groups.
Table 8. Summary table of goods and services derivedfrom different land types within Muaredzi village.
Land Type No. of No. of G/S Highest TotalG/S once aggregated score score
Planalto 8 4 8 23Nsitu 12 5 10 59Planicie 28 9 10 56Thando 5 4 8 24Gombe 9 6 20 75Murmuchea 7 3 11 48
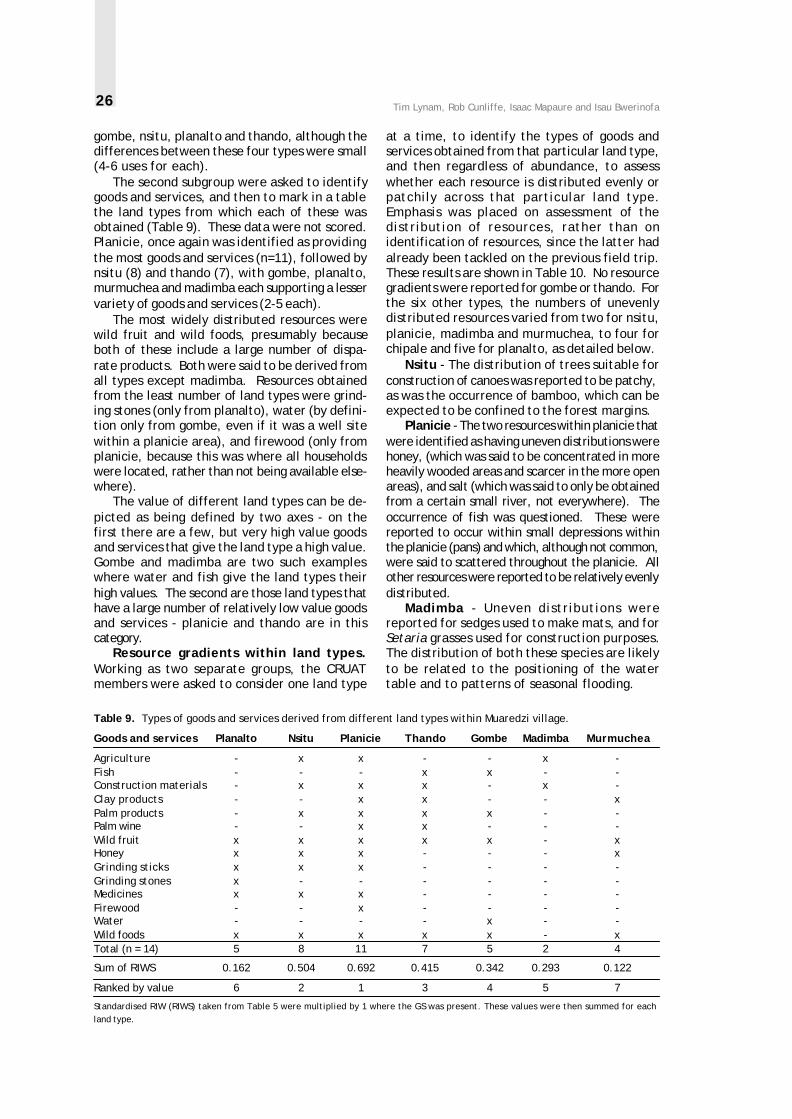
26 Tim Lynam, Rob Cunliffe, Isaac Mapaure and Isau Bwerinofa
gombe, nsitu, planalto and thando, although thedifferences between these four types were small(4-6 uses for each).
The second subgroup were asked to identifygoods and services, and then to mark in a tablethe land types from which each of these wasobtained (Table 9). These data were not scored.Planicie, once again was identified as providingthe most goods and services (n=11), followed bynsitu (8) and thando (7), with gombe, planalto,murmuchea and madimba each supporting a lesservariety of goods and services (2-5 each).
The most widely distributed resources werewild fruit and wild foods, presumably becauseboth of these include a large number of dispa-rate products. Both were said to be derived fromall types except madimba. Resources obtainedfrom the least number of land types were grind-ing stones (only from planalto), water (by defini-tion only from gombe, even if it was a well sitewithin a planicie area), and firewood (only fromplanicie, because this was where all householdswere located, rather than not being available else-where).
The value of different land types can be de-picted as being defined by two axes - on thefirst there are a few, but very high value goodsand services that give the land type a high value.Gombe and madimba are two such exampleswhere water and fish give the land types theirhigh values. The second are those land types thathave a large number of relatively low value goodsand services - planicie and thando are in thiscategory.
Resource gradients within land types.Working as two separate groups, the CRUATmembers were asked to consider one land type
at a time, to identify the types of goods andservices obtained from that particular land type,and then regardless of abundance, to assesswhether each resource is distributed evenly orpatchily across that particular land type.Emphasis was placed on assessment of thedistribution of resources, rather than onidentification of resources, since the latter hadalready been tackled on the previous field trip.These results are shown in Table 10. No resourcegradients were reported for gombe or thando. Forthe six other types, the numbers of unevenlydistributed resources varied from two for nsitu,planicie, madimba and murmuchea, to four forchipale and five for planalto, as detailed below.
Nsitu - The distribution of trees suitable forconstruction of canoes was reported to be patchy,as was the occurrence of bamboo, which can beexpected to be confined to the forest margins.
Planicie - The two resources within planicie thatwere identified as having uneven distributions werehoney, (which was said to be concentrated in moreheavily wooded areas and scarcer in the more openareas), and salt (which was said to only be obtainedfrom a certain small river, not everywhere). Theoccurrence of fish was questioned. These werereported to occur within small depressions withinthe planicie (pans) and which, although not common,were said to scattered throughout the planicie. Allother resources were reported to be relatively evenlydistributed.
Madimba - Uneven distributions werereported for sedges used to make mats, and forSetaria grasses used for construction purposes.The distribution of both these species are likelyto be related to the positioning of the watertable and to patterns of seasonal flooding.
Table 9. Types of goods and services derived from different land types within Muaredzi village.
Goods and services Planalto Nsitu Planicie Thando Gombe Madimba Murmuchea
Agriculture - x x - - x -Fish - - - x x - -Construction materials - x x x - x -Clay products - - x x - - xPalm products - x x x x - -Palm wine - - x x - - -Wild fruit x x x x x - xHoney x x x - - - xGrinding sticks x x x - - - -Grinding stones x - - - - - -Medicines x x x - - - -Firewood - - x - - - -Water - - - - x - -Wild foods x x x x x - xTotal (n = 14) 5 8 11 7 5 2 4
Sum of RIWS 0.162 0.504 0.692 0.415 0.342 0.293 0.122
Ranked by value 6 2 1 3 4 5 7
Standardised RIW (RIWS) taken from Table 5 were multiplied by 1 where the GS was present. These values were then summed for eachland type.

27Assessment of the value of woodland landscape function to local communitiesin Gorongosa and Muanza Districts, Sofala Province, Mozambique
Murmuchea - Most of the resources associ-ated with termite mounds were reported to oc-cur wherever such mounds are found. However,women reported that they use clay from somemounds but not others, and similarly that edibletermites (inswa) are obtained from some moundsbut not others.
Chipale - The distribution of resources withinchipale was perceived as being the most patchyof all the land types. The explanation given forthis was that chipale occurs between gombe (opengrassland) and thando (wooded areas). Thus,areas in proximity to gombe are devoid of treerelated resources, such as medicines and palms,whereas these do occur in portions that borderagainst thando. Similarly the distribution of water(pans) was said to be patchy, and it was suggestedthat this was the cause for the perceived irregularoccurrence of wildlife within this land type.
Planalto - Four resources were reported to beparticularly associated with the lower lying portionsof planalto, namely arable areas, thatching grass,well sites and bamboo. Grinding stones were saidto be found only on isolated rocky hills. There wassome discussion concerning firewood, which wassaid to only occur where there are trees but notwhere trees are absent. Although not absolutelycertain, it seems that people were thinking aboutsmall open areas within the planalto, rather than
significant portions of the landscape.It is possible that respondents may have ex-
perienced some confusion in trying to separateout the spatial occurrence of resources from theirabundance. The bulk of resources within eachland type were reported to be abundant. Almostinvariably those resources that were reported tobe abundant were said to be found everywherewithin a land type, whilst those that wereidentified as having patchy distributions tendedto be the less abundant items.
However, the main conclusion is that the bulkof resources within most land types are reportedto be relatively evenly distributed in space (52/69, or 75% of all resource/land type combinations).The implication is that resource gradients withinland types need not be of any great concern asregards development of the model.
Careful examination of Table 10 will reveal theinclusion of hunting as one of the resourcesobtained from various land units. The group wentto great lengths to explain that this informationwas based on hunting activities that they used tocarry out in the past, during the civil war, butthat they longer do so now. CRUAT membersseemed to be slightly more open to talking aboutsuch issues than on previous field trips, possiblydue to the absence of Mr. Jujuman or any otherpark personnel.
Table 10. Distribution patterns of resources within each of the 8 land types of Muaredzi village. The symbol xindicates an even distribution of a resource within a particular land type, uneven indicates an uneven distribution,and - indicates the absence of a resource from that land type.
Resources Planalto Nsitu Planicie Thando Gombe Madimba Murmuchea Chipale
Arable land uneven x x - - x x -Fish - - x x x - - -Construction materials x x x - x1 Uneven2 - -Grass for thatching uneven - x x - - - -Clay for making household items x - x x - - uneven xPalm leaves - x x x - x unevenPalm wine - - x - - - x -Wild fruit x x x - - - - -Honey x x uneven - - - x -Grinding sticks x x x - - - - -Grinding stones uneven - - - - - - -Medicines x x x - - - x unevenFirewood x x x - - - x -Water uneven - - - x - - unevenWild foods - x x x x - Uneven3 -Wild animals for hunting x x - x x - - unevenBamboo uneven uneven - - - - - -Rope from bark x - - - - - - -Trees for canoes x uneven - - - - - -Salt - - uneven - - - - -Grass for mats - - - - x uneven - -
Uneven/Total 5/15 2/12 2/14 0/6 0/6 2/3 2/8 4/51reeds; 2grasses; 3inswa
28 Tim Lynam, Rob Cunliffe, Isaac Mapaure and Isau Bwerinofa
c) Factors limiting access to resources withinMuaredzi
The approach adopted for investigating potentialcost factors was to start with a general discussionof factors limiting access to resources. Thereafter,particular resources were examined in more detail(agricultural production, canoes, plant productsand fish), in order to get a better understandingof the various cost factors, and to check whetherthere were any other important aspects that mightinitially have been over looked. Three factorswere then singled out for more in depth discussion:government regulations, traditional regulations,and distance. The final step was to generate anoverall listing of cost factors and to score therelative weights of these.
General discussion of limiting factors. TheCRUAT members were asked if there were anyfactors that limited access to natural resourceswithin Muaredzi, and if so what these were? Theimmediate response was yes, in the form of officialregulations, government controls and the rulesimposed by the GNP scouts living in the village.Some of the responses were that the GNP scoutsmake it difficult for us to hunt animals; we arenot allowed to burn the grass, or to cut trees, noteven for making chairs to sit on; we have beentold that we must move from this area; even thecollection of honey is prohibited, that is the reasonwhy we put bee hives in the village; we are notfree to kill even mosquitoes and moths in ourhouses; if one comes across a tortoise one cannotpick it up; and we are not allowed to harvest anybirds. It was further explained that previously,particularly during the civil war, it was very easyto access all these resources, to move aroundfreely, to hunt, and to cut trees, but that theproblems started once the government came backafter the war. Now they are given limits. Forexample, if anyone is caught on the other side ofthe Urema River they have to pay a fine.
Following some prompting, the discussionshifted to trying to identify other limiting factors.With further questioning, people agreed that someresources were simply too far away to utilise.Examples included that the best rope for use inbuilding houses (bwaze) is obtained from theplanalto, but because this is too far away palmsare instead used for this purpose. Grinding stonesare only found in the planalto but it is difficult toget them to the village; and the same applies tostones for the hearth. The difficulties posed bythe absence of any transport were pointed out.
Four additional factors were mentioned, thesebeing: lack of equipment for agriculture and forfishing, traditional regulations, and lack ofrainfall. Two other factors were discussed butomitted. These were the destruction of crops
by wildlife, particularly elephants, and theoccasional occurrence of too much water (flooding).The latter, although recognised as limiting accessto certain resources, was omitted on the basis ofnot comprising normal circumstances.
The issue of whether the community wouldbe allowed to remain where they were, or wouldbe forced to move to outside of GNP, resurfacedagain, but discussion on this was deliberatelycurtailed. People obviously view this as potentiallybeing an over riding limitation as regards accessto resources.
The Urema River would appear to comprise asignificant physical barrier as regards access toany resources on the opposite side from thevillage. This issue was raised indirectly severaltimes, but without any response, and then directly.People acknowledged that there may be usefulresources across the Urema (without identifyingthem), but explained that since they areprohibited under park regulations from ever goingthere, no-one ever did, and thus the barrier effectof the river was not of any significance to them.
Factors limiting access to particularresources. In order to try and gain further insightsinto potential limiting factors, the group was askedto consider specific resources in detail. The menand women were separated for this exercise. Eachsubgroup was asked to choose a resource, toidentify any barriers that serve to limit access toor reduce the availability of the particularresource within the Muaredzi area, and then toscore these factors in terms of relativeimportance. An open scoring technique was used,in which the group first identified the leastimportant factor, then scored each of theremaining factors relative to this one. The womeninitially chose agricultural production and the mencanoes. Once completed, the two groups wereasked to select a further resource and repeat theprocess. This time the women chose forestproducts and the men fish.
Agricultural production. Five factors wereidentified as limiting agricultural production:destruction by wild animals, droughts, floods,official regulations, and the lack of agriculturalequipment (Table 11).
Of these, official regulations were perceivedto be least important, and was allocated a singlepoint. The impact of official regulations wasreported to be felt only in that residents wereprevented from cultivating anywhere to the westof the Urema River. Portions of “madimba” areknown to occur there, but loss of access to theseareas was not seen as being particularlyimportant. It was claimed that there were nolaws regulating crop production on the villageside of the Urema (i.e. to the east of the Urema),and specifically that residents are free to clear
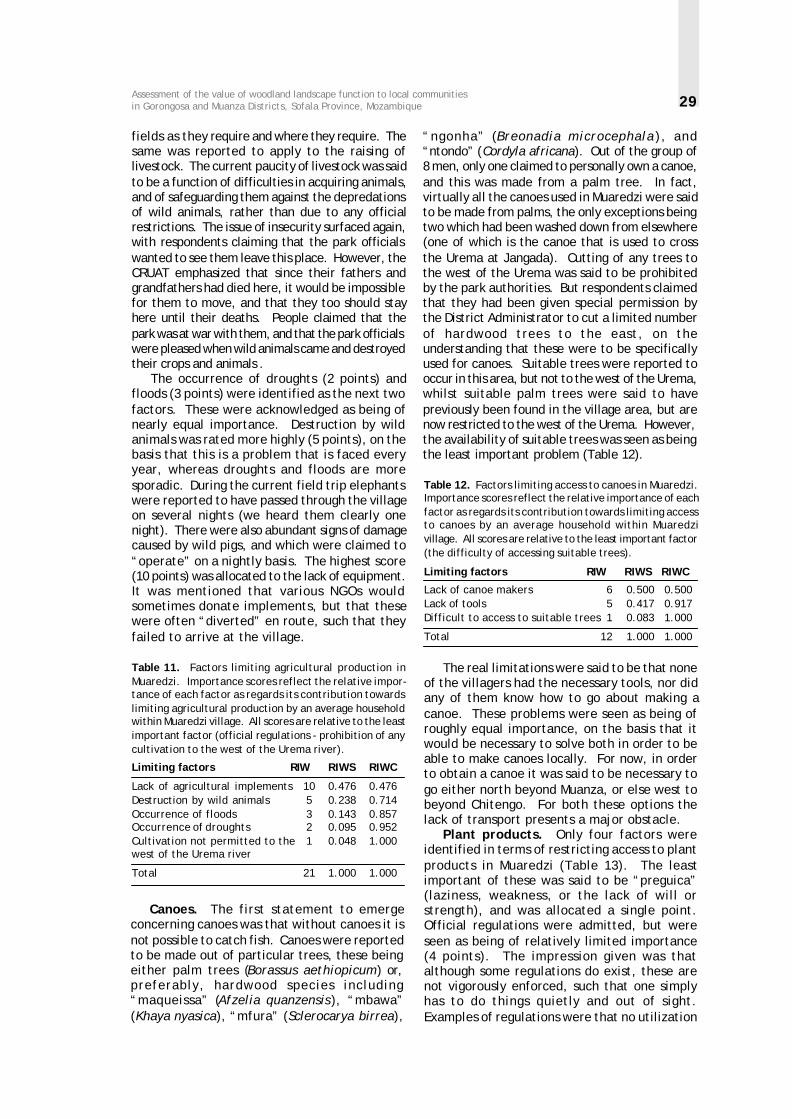
29Assessment of the value of woodland landscape function to local communitiesin Gorongosa and Muanza Districts, Sofala Province, Mozambique
fields as they require and where they require. Thesame was reported to apply to the raising oflivestock. The current paucity of livestock was saidto be a function of difficulties in acquiring animals,and of safeguarding them against the depredationsof wild animals, rather than due to any officialrestrictions. The issue of insecurity surfaced again,with respondents claiming that the park officialswanted to see them leave this place. However, theCRUAT emphasized that since their fathers andgrandfathers had died here, it would be impossiblefor them to move, and that they too should stayhere until their deaths. People claimed that thepark was at war with them, and that the park officialswere pleased when wild animals came and destroyedtheir crops and animals .
The occurrence of droughts (2 points) andfloods (3 points) were identified as the next twofactors. These were acknowledged as being ofnearly equal importance. Destruction by wildanimals was rated more highly (5 points), on thebasis that this is a problem that is faced everyyear, whereas droughts and floods are moresporadic. During the current field trip elephantswere reported to have passed through the villageon several nights (we heard them clearly onenight). There were also abundant signs of damagecaused by wild pigs, and which were claimed to“operate” on a nightly basis. The highest score(10 points) was allocated to the lack of equipment.It was mentioned that various NGOs wouldsometimes donate implements, but that thesewere often “diverted” en route, such that theyfailed to arrive at the village.
“ngonha” (Breonadia microcephala ), and“ntondo” (Cordyla africana). Out of the group of8 men, only one claimed to personally own a canoe,and this was made from a palm tree. In fact,virtually all the canoes used in Muaredzi were saidto be made from palms, the only exceptions beingtwo which had been washed down from elsewhere(one of which is the canoe that is used to crossthe Urema at Jangada). Cutting of any trees tothe west of the Urema was said to be prohibitedby the park authorities. But respondents claimedthat they had been given special permission bythe District Administrator to cut a limited numberof hardwood trees to the east, on theunderstanding that these were to be specificallyused for canoes. Suitable trees were reported tooccur in this area, but not to the west of the Urema,whilst suitable palm trees were said to havepreviously been found in the village area, but arenow restricted to the west of the Urema. However,the availability of suitable trees was seen as beingthe least important problem (Table 12).
Canoes. The first statement to emergeconcerning canoes was that without canoes it isnot possible to catch fish. Canoes were reportedto be made out of particular trees, these beingeither palm trees (Borassus aethiopicum) or,preferably, hardwood species including“maqueissa” (Afzelia quanzensis), “mbawa”(Khaya nyasica), “mfura” (Sclerocarya birrea),
The real limitations were said to be that noneof the villagers had the necessary tools, nor didany of them know how to go about making acanoe. These problems were seen as being ofroughly equal importance, on the basis that itwould be necessary to solve both in order to beable to make canoes locally. For now, in orderto obtain a canoe it was said to be necessary togo either north beyond Muanza, or else west tobeyond Chitengo. For both these options thelack of transport presents a major obstacle.
Plant products. Only four factors wereidentified in terms of restricting access to plantproducts in Muaredzi (Table 13). The leastimportant of these was said to be “preguica”(laziness, weakness, or the lack of will orstrength), and was allocated a single point.Official regulations were admitted, but wereseen as being of relatively limited importance(4 points). The impression given was thatalthough some regulations do exist, these arenot vigorously enforced, such that one simplyhas to do things quietly and out of sight.Examples of regulations were that no utilization
Table 11. Factors limiting agricultural production inMuaredzi. Importance scores reflect the relative impor-tance of each factor as regards its contribution towardslimiting agricultural production by an average householdwithin Muaredzi village. All scores are relative to the leastimportant factor (official regulations - prohibition of anycultivation to the west of the Urema river).
Limiting factors RIW RIWS RIWC
Lack of agricultural implements 10 0.476 0.476Destruction by wild animals 5 0.238 0.714Occurrence of floods 3 0.143 0.857Occurrence of droughts 2 0.095 0.952Cultivation not permitted to the 1 0.048 1.000west of the Urema river
Total 21 1.000 1.000
Table 12. Factors limiting access to canoes in Muaredzi.Importance scores reflect the relative importance of eachfactor as regards its contribution towards limiting accessto canoes by an average household within Muaredzivillage. All scores are relative to the least important factor(the difficulty of accessing suitable trees).
Limiting factors RIW RIWS RIWC
Lack of canoe makers 6 0.500 0.500Lack of tools 5 0.417 0.917Difficult to access to suitable trees 1 0.083 1.000
Total 12 1.000 1.000

30 Tim Lynam, Rob Cunliffe, Isaac Mapaure and Isau Bwerinofa
Fish from Lake Urema drying in Mauredzi
is permitted to the west of the Urema river; notimber trees are allowed to be cut (such as“mahogany” Afzelia quanzensis , “panga panga”Millettia stuhlmannii and “mukwa” Pterocarpusangolensis - “not important as we don’t makecanoes, nor tables, chairs or any other timberitems”); and that cutting of trees in madimba isprohibited (which appears to be due to a restrictionon streambank cultivation). It was also claimedthat the local rangers prohibit the collection of wildfruits and traditional medicines, but without muchconviction. Witchcraft was seen as being a moreimportant issue (6 points), together with a lack oftools for cutting trees (8 points). An example ofwitchcraft was that if one were bewitched, whenone cut a tree, instead of it falling to one side itwould come to fall on top of you. Costa and Vogt(1998) suggest that there is a high incidence ofwitchcraft within the village. This is supported bythe observation that almost all individuals, frombabies to adults, were seen to wear small bandsaround their legs, arms or necks. As regards thelack of tools, it was eloquently put that “even ifone is to run away from the “fiscais”, without toolsit is not possible to do anything”.
to come and fish here. In addition, it wasreported that people were not allowed to comeand buy fish from the village, but that insteadthe fish had to be carried out to Muanza for salethere. This was said to be a park regulationaimed at excluding traders, who the parkadministration claim were previously responsiblefor the poaching of animals.
Fish. The seven men present all claimed tobe fishermen. Fishing was reported to be carriedout throughout the year. Official controls wereseen as being the principal constraint to fishing(Table 14). These controls come in a number offorms, including restrictions imposed by the parkauthorities as to where people are allowed or notallowed to fish. In particular, people are restrictedfrom fishing the western portion of Lake Urema.It is necessary to obtain permission from the localGNP scouts, and who might also set limits on theamount of fish to be taken (although this wasnot entirely clear). It was further claimed, atleast to begin with, that Muaredzi residents wereonly allowed to catch fish for their ownconsumption and not for sale outside of thevillage. Later this was refuted, and it wasexplained that people from Muaredzi could catchas much fish as they wanted and sell it to theoutside, but that no other people were allowed
Other factors mentioned were the lack ofcanoes (5 points) and of poles for canoes (2points); the lack of nets (3 points); the pres-ence of crocodiles, which cause damage to nets(4 points); and the fact that without water therecannot be any fish (1 point). Other factors thatwere discussed, but dismissed as not being ofsignificance were the occurrence of droughts orfloods; the distance from the village to the fishinggrounds (1.5 hours walk either direction); andthe fact that the place where they had been shownto launch their canoes was now covered withgrass, making access difficult.
Table 14. Factors limiting catches of fish in Muaredzi.Importance scores reflect the relative importance ofeach factor as regards its contribution towards limit-ing catches of fish by an average household withinMuaredzi village. All scores are relative to the leastimportant factor (the need for water).
Limiting factors RIW RIW RIW
Restrictions on where to fish 6 0.240 0.240Lack of canoes 5 0.200 0.440Damage to nets by crocodiles 4 0.160 0.600Failure to secure permission 4 0.160 0.760 from park rangersLack of nets 3 0.120 0.880Lack of poles for canoes 2 0.080 0.960Lack of water 1 0.040 1.000
Total 25 1.000 1.000
Table 13. Factors limiting access to forest products inMuaredzi. Importance scores reflect the relative importanceof each factor as regards its contribution towards limitingaccess to forest (tree) resources by an average householdwithin Muaredzi village. All scores are relative to the leastimportant factor (weakness or laziness).
Limiting factors RIW RIWS RIWC
Lack of tools 8 0.421 0.421Witchcraft 6 0.316 0.737Official regulations 4 0.211 0.947Weakness (or laziness) 1 0.053 1.000
Total 19 1.000 1.000
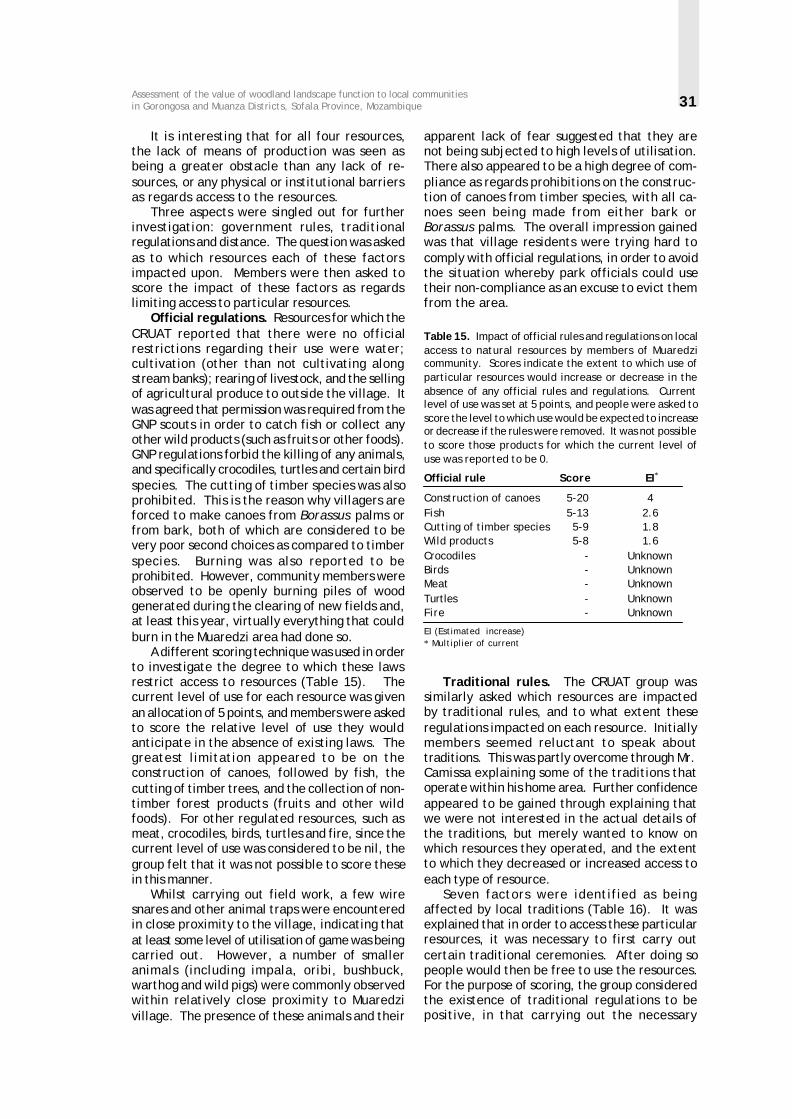
31Assessment of the value of woodland landscape function to local communitiesin Gorongosa and Muanza Districts, Sofala Province, Mozambique
It is interesting that for all four resources,the lack of means of production was seen asbeing a greater obstacle than any lack of re-sources, or any physical or institutional barriersas regards access to the resources.
Three aspects were singled out for furtherinvestigation: government rules, traditionalregulations and distance. The question was askedas to which resources each of these factorsimpacted upon. Members were then asked toscore the impact of these factors as regardslimiting access to particular resources.
Official regulations. Resources for which theCRUAT reported that there were no officialrestrictions regarding their use were water;cultivation (other than not cultivating alongstream banks); rearing of livestock, and the sellingof agricultural produce to outside the village. Itwas agreed that permission was required from theGNP scouts in order to catch fish or collect anyother wild products (such as fruits or other foods).GNP regulations forbid the killing of any animals,and specifically crocodiles, turtles and certain birdspecies. The cutting of timber species was alsoprohibited. This is the reason why villagers areforced to make canoes from Borassus palms orfrom bark, both of which are considered to bevery poor second choices as compared to timberspecies. Burning was also reported to beprohibited. However, community members wereobserved to be openly burning piles of woodgenerated during the clearing of new fields and,at least this year, virtually everything that couldburn in the Muaredzi area had done so.
A different scoring technique was used in orderto investigate the degree to which these lawsrestrict access to resources (Table 15). Thecurrent level of use for each resource was givenan allocation of 5 points, and members were askedto score the relative level of use they wouldanticipate in the absence of existing laws. Thegreatest limitation appeared to be on theconstruction of canoes, followed by fish, thecutting of timber trees, and the collection of non-timber forest products (fruits and other wildfoods). For other regulated resources, such asmeat, crocodiles, birds, turtles and fire, since thecurrent level of use was considered to be nil, thegroup felt that it was not possible to score thesein this manner.
Whilst carrying out field work, a few wiresnares and other animal traps were encounteredin close proximity to the village, indicating thatat least some level of utilisation of game was beingcarried out. However, a number of smalleranimals (including impala, oribi, bushbuck,warthog and wild pigs) were commonly observedwithin relatively close proximity to Muaredzivillage. The presence of these animals and their
Traditional rules. The CRUAT group wassimilarly asked which resources are impactedby traditional rules, and to what extent theseregulations impacted on each resource. Initiallymembers seemed reluctant to speak abouttraditions. This was partly overcome through Mr.Camissa explaining some of the traditions thatoperate within his home area. Further confidenceappeared to be gained through explaining thatwe were not interested in the actual details ofthe traditions, but merely wanted to know onwhich resources they operated, and the extentto which they decreased or increased access toeach type of resource.
Seven factors were identified as beingaffected by local traditions (Table 16). It wasexplained that in order to access these particularresources, it was necessary to first carry outcertain traditional ceremonies. After doing sopeople would then be free to use the resources.For the purpose of scoring, the group consideredthe existence of traditional regulations to bepositive, in that carrying out the necessary
Table 15. Impact of official rules and regulations on localaccess to natural resources by members of Muaredzicommunity. Scores indicate the extent to which use ofparticular resources would increase or decrease in theabsence of any official rules and regulations. Currentlevel of use was set at 5 points, and people were asked toscore the level to which use would be expected to increaseor decrease if the rules were removed. It was not possibleto score those products for which the current level ofuse was reported to be 0.
Official rule Score EI*
Construction of canoes 5-20 4Fish 5-13 2.6Cutting of timber species 5-9 1.8Wild products 5-8 1.6Crocodiles - UnknownBirds - UnknownMeat - UnknownTurtles - UnknownFire - Unknown
EI (Estimated increase)* Multiplier of current
apparent lack of fear suggested that they arenot being subjected to high levels of utilisation.There also appeared to be a high degree of com-pliance as regards prohibitions on the construc-tion of canoes from timber species, with all ca-noes seen being made from either bark orBorassus palms. The overall impression gainedwas that village residents were trying hard tocomply with official regulations, in order to avoidthe situation whereby park officials could usetheir non-compliance as an excuse to evict themfrom the area.
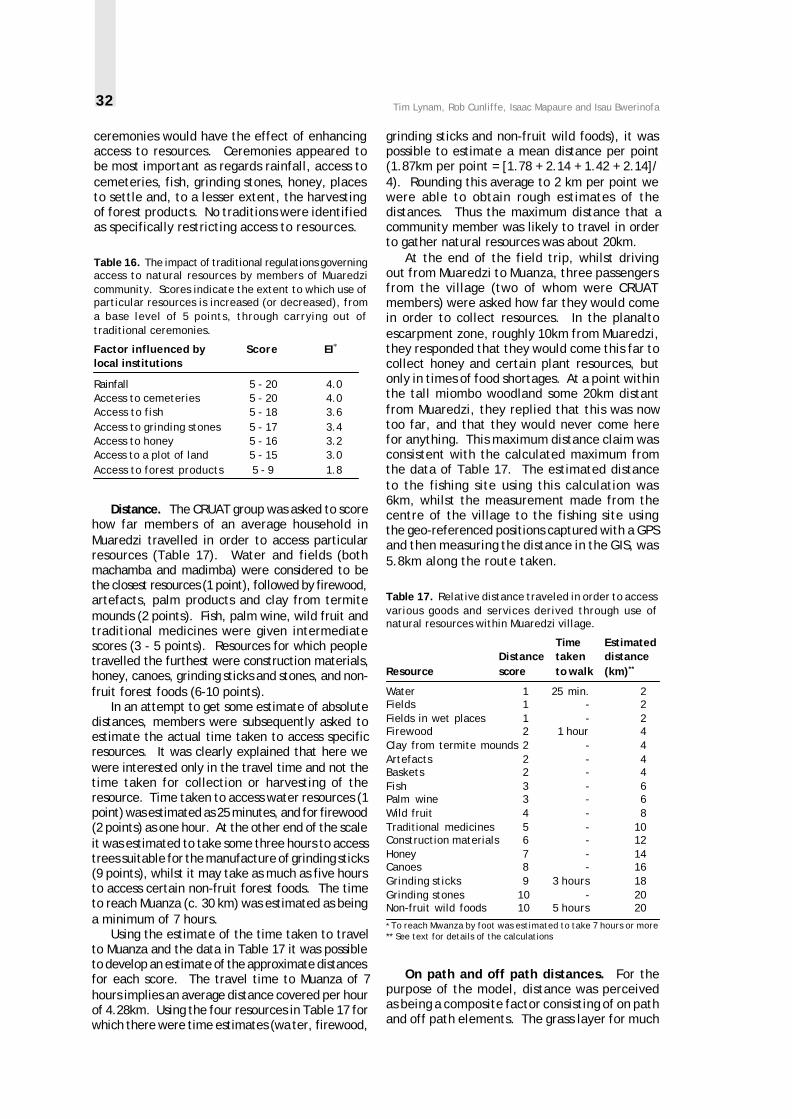
32 Tim Lynam, Rob Cunliffe, Isaac Mapaure and Isau Bwerinofa
Distance. The CRUAT group was asked to scorehow far members of an average household inMuaredzi travelled in order to access particularresources (Table 17). Water and fields (bothmachamba and madimba) were considered to bethe closest resources (1 point), followed by firewood,artefacts, palm products and clay from termitemounds (2 points). Fish, palm wine, wild fruit andtraditional medicines were given intermediatescores (3 - 5 points). Resources for which peopletravelled the furthest were construction materials,honey, canoes, grinding sticks and stones, and non-fruit forest foods (6-10 points).
In an attempt to get some estimate of absolutedistances, members were subsequently asked toestimate the actual time taken to access specificresources. It was clearly explained that here wewere interested only in the travel time and not thetime taken for collection or harvesting of theresource. Time taken to access water resources (1point) was estimated as 25 minutes, and for firewood(2 points) as one hour. At the other end of the scaleit was estimated to take some three hours to accesstrees suitable for the manufacture of grinding sticks(9 points), whilst it may take as much as five hoursto access certain non-fruit forest foods. The timeto reach Muanza (c. 30 km) was estimated as beinga minimum of 7 hours.
Using the estimate of the time taken to travelto Muanza and the data in Table 17 it was possibleto develop an estimate of the approximate distancesfor each score. The travel time to Muanza of 7hours implies an average distance covered per hourof 4.28km. Using the four resources in Table 17 forwhich there were time estimates (water, firewood,
grinding sticks and non-fruit wild foods), it waspossible to estimate a mean distance per point(1.87km per point = [1.78 + 2.14 + 1.42 + 2.14]/4). Rounding this average to 2 km per point wewere able to obtain rough estimates of thedistances. Thus the maximum distance that acommunity member was likely to travel in orderto gather natural resources was about 20km.
At the end of the field trip, whilst drivingout from Muaredzi to Muanza, three passengersfrom the village (two of whom were CRUATmembers) were asked how far they would comein order to collect resources. In the planaltoescarpment zone, roughly 10km from Muaredzi,they responded that they would come this far tocollect honey and certain plant resources, butonly in times of food shortages. At a point withinthe tall miombo woodland some 20km distantfrom Muaredzi, they replied that this was nowtoo far, and that they would never come herefor anything. This maximum distance claim wasconsistent with the calculated maximum fromthe data of Table 17. The estimated distanceto the fishing site using this calculation was6km, whilst the measurement made from thecentre of the village to the fishing site usingthe geo-referenced positions captured with a GPSand then measuring the distance in the GIS, was5.8km along the route taken.
On path and off path distances. For thepurpose of the model, distance was perceivedas being a composite factor consisting of on pathand off path elements. The grass layer for much
Table 17. Relative distance traveled in order to accessvarious goods and services derived through use ofnatural resources within Muaredzi village.
Time EstimatedDistance taken distance
Resource score to walk (km)**
Water 1 25 min. 2Fields 1 - 2Fields in wet places 1 - 2Firewood 2 1 hour 4Clay from termite mounds 2 - 4Artefacts 2 - 4Baskets 2 - 4Fish 3 - 6Palm wine 3 - 6Wild fruit 4 - 8Traditional medicines 5 - 10Construction materials 6 - 12Honey 7 - 14Canoes 8 - 16Grinding sticks 9 3 hours 18Grinding stones 10 - 20Non-fruit wild foods 10 5 hours 20
* To reach Mwanza by foot was estimated to take 7 hours or more** See text for details of the calculations
Table 16. The impact of traditional regulations governingaccess to natural resources by members of Muaredzicommunity. Scores indicate the extent to which use ofparticular resources is increased (or decreased), froma base level of 5 points, through carrying out oftraditional ceremonies.
Factor influenced by Score EI*
local institutions
Rainfall 5 - 20 4.0Access to cemeteries 5 - 20 4.0Access to fish 5 - 18 3.6Access to grinding stones 5 - 17 3.4Access to honey 5 - 16 3.2Access to a plot of land 5 - 15 3.0Access to forest products 5 - 9 1.8
ceremonies would have the effect of enhancingaccess to resources. Ceremonies appeared tobe most important as regards rainfall, access tocemeteries, fish, grinding stones, honey, placesto settle and, to a lesser extent, the harvestingof forest products. No traditions were identifiedas specifically restricting access to resources.

33Assessment of the value of woodland landscape function to local communitiesin Gorongosa and Muanza Districts, Sofala Province, Mozambique
of the year is extremely difficult to walkthrough, particularly when wet, and because ofits considerable height (2-4m) as soon as oneleaves the path it becomes extremely difficultto keep ones bearings and know where one is.The result is a marked reluctance to leave thepath, which reinforces the proposed breakdownof distance into on path and off path elements.
The first exercise was to investigate therelative distances travelled on path and off pathin order to access particular resources. Informantswere asked to classify the respective on path andoff path distances for each resource into one offour categories: very close, close, moderately far,and very far. The first step was to establish anunderstanding of these categories. This served adual purpose, in that it also comprised a trainingexercise for the subsequent scoring of the fieldsamples, for which each of the potential resourcesand costs were similarly classified according to afour class system.
A line was drawn on the ground and dividedinto four unequal categories, which were labelledas above. Thereafter, the CRUAT members wereasked to place known points in respect to thesecategories. In retrospect, it would have beenbetter to start the other way round, with theknown points and then to ask the CRUAT to definecategories. Nevertheless, clear markers wereestablished for two of the three boundaries.Distances up to the crossing point on the Uremariver, or to the fishing grounds, were consideredto be moderately far (coutali), whilst anythingbeyond these points was classified as being veryfar (coutali reto). Similarly the edge of the village,as defined by the locations of our camp and ofMr. Sixpence Fazenda’s homestead, wasconsidered to be the boundary between close(duzi) and moderately far (coutali). The third
boundary between close (duzi) and very close (duziduzi) was less well defined, but through usingexamples of particular homesteads it was agreedthat anything within reach of roughly threeminutes walking on the path should be consideredto be very close. These categories correspondapproximately to the following distances: veryclose is anything up to 250m; close=250m–2km;far=2–6km, whilst very far covers anything furtherthan 6km.
Having established these categories, the groupwas then asked to rate the distances travelled onpath and off path in order to access particularresources (Table 18). Most resources were rankedas being obtainable either very close or close onthe paths, and usually very close off the paths.The principal exceptions were trees suitable forcanoes and honey, both of which were reportedto be very far both for on path and off pathdistances. For grinding stones and wild foods, itwas considered necessary to travel very far fromthe village on the path, but then such resourceswould be easily obtainable in very close proximityto the path. Fishing grounds were ranked asmoderately far, but directly accessible by path.
Resource categories, which included groupingsof individual resources, such as wild fruits, wildfoods and traditional medicines, proved difficultto score. This is to be expected since, forexample, some kinds of wild fruits were readilyobtainable close by, whilst for others it wasnecessary to travel much further afield.
Results of this exercise are in broad agreementwith those obtained on the previous trip, whenthe group were asked to score how far membersof an average household in Muaredzi have to travelin order to access particular resources (Table 17).The two most obvious deviations are forconstruction materials and grinding sticks. These
Table 18. Relative distance travelled in order to access various goods and services derived through use of naturalresources within Muaredzi village. Distances on and off path were estimated according to four distance categories:very close, close, moderately far, or very far.
Distance Distance Distance scoreResource on path off path (previous trip)
Water close very close 1Fields (machamba) very close direct 1Fields in wet places - - 1Firewood close close 2Clay from termite mounds close very close 2Palm leaves very close very close 2Fish moderately far direct 3Palm wine close close 3Wild fruit close very close 4Traditional medicines close very close 5Construction materials very close very close 6Honey very far very far 7Canoes very far very far 8Grinding sticks close very close 9Grinding stones very far very close 10Non-fruit wild foods very far very close 10
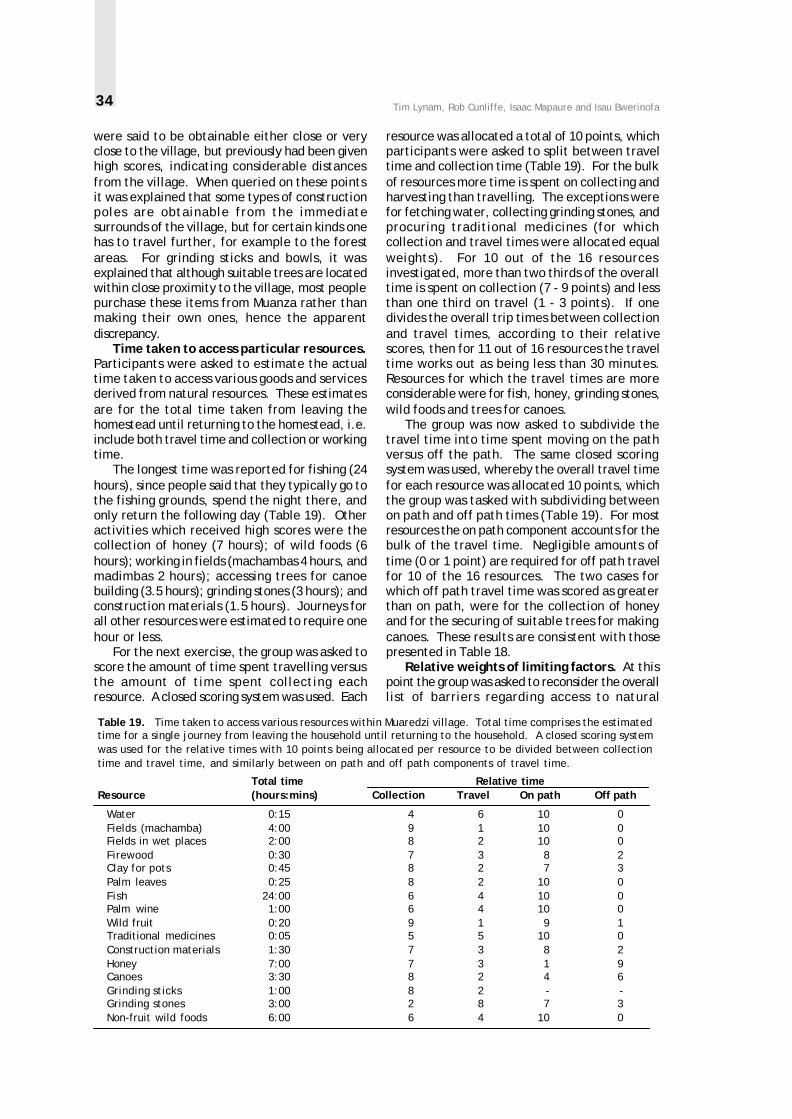
34 Tim Lynam, Rob Cunliffe, Isaac Mapaure and Isau Bwerinofa
were said to be obtainable either close or veryclose to the village, but previously had been givenhigh scores, indicating considerable distancesfrom the village. When queried on these pointsit was explained that some types of constructionpoles are obtainable from the immediatesurrounds of the village, but for certain kinds onehas to travel further, for example to the forestareas. For grinding sticks and bowls, it wasexplained that although suitable trees are locatedwithin close proximity to the village, most peoplepurchase these items from Muanza rather thanmaking their own ones, hence the apparentdiscrepancy.
Time taken to access particular resources.Participants were asked to estimate the actualtime taken to access various goods and servicesderived from natural resources. These estimatesare for the total time taken from leaving thehomestead until returning to the homestead, i.e.include both travel time and collection or workingtime.
The longest time was reported for fishing (24hours), since people said that they typically go tothe fishing grounds, spend the night there, andonly return the following day (Table 19). Otheractivities which received high scores were thecollection of honey (7 hours); of wild foods (6hours); working in fields (machambas 4 hours, andmadimbas 2 hours); accessing trees for canoebuilding (3.5 hours); grinding stones (3 hours); andconstruction materials (1.5 hours). Journeys forall other resources were estimated to require onehour or less.
For the next exercise, the group was asked toscore the amount of time spent travelling versusthe amount of time spent collecting eachresource. A closed scoring system was used. Each
resource was allocated a total of 10 points, whichparticipants were asked to split between traveltime and collection time (Table 19). For the bulkof resources more time is spent on collecting andharvesting than travelling. The exceptions werefor fetching water, collecting grinding stones, andprocuring traditional medicines (for whichcollection and travel times were allocated equalweights). For 10 out of the 16 resourcesinvestigated, more than two thirds of the overalltime is spent on collection (7 - 9 points) and lessthan one third on travel (1 - 3 points). If onedivides the overall trip times between collectionand travel times, according to their relativescores, then for 11 out of 16 resources the traveltime works out as being less than 30 minutes.Resources for which the travel times are moreconsiderable were for fish, honey, grinding stones,wild foods and trees for canoes.
The group was now asked to subdivide thetravel time into time spent moving on the pathversus off the path. The same closed scoringsystem was used, whereby the overall travel timefor each resource was allocated 10 points, whichthe group was tasked with subdividing betweenon path and off path times (Table 19). For mostresources the on path component accounts for thebulk of the travel time. Negligible amounts oftime (0 or 1 point) are required for off path travelfor 10 of the 16 resources. The two cases forwhich off path travel time was scored as greaterthan on path, were for the collection of honeyand for the securing of suitable trees for makingcanoes. These results are consistent with thosepresented in Table 18.
Relative weights of limiting factors. At thispoint the group was asked to reconsider the overalllist of barriers regarding access to natural
Table 19. Time taken to access various resources within Muaredzi village. Total time comprises the estimatedtime for a single journey from leaving the household until returning to the household. A closed scoring systemwas used for the relative times with 10 points being allocated per resource to be divided between collectiontime and travel time, and similarly between on path and off path components of travel time.
Total time Relative timeResource (hours:mins) Collection Travel On path Off path
Water 0:15 4 6 10 0Fields (machamba) 4:00 9 1 10 0Fields in wet places 2:00 8 2 10 0Firewood 0:30 7 3 8 2Clay for pots 0:45 8 2 7 3Palm leaves 0:25 8 2 10 0Fish 24:00 6 4 10 0Palm wine 1:00 6 4 10 0Wild fruit 0:20 9 1 9 1Traditional medicines 0:05 5 5 10 0Construction materials 1:30 7 3 8 2Honey 7:00 7 3 1 9Canoes 3:30 8 2 4 6Grinding sticks 1:00 8 2 - -Grinding stones 3:00 2 8 7 3Non-fruit wild foods 6:00 6 4 10 0

35Assessment of the value of woodland landscape function to local communitiesin Gorongosa and Muanza Districts, Sofala Province, Mozambique
resources, and if appropriate to add any factors,or perhaps to lump others together, and then toscore the relative importance of these. Simpleleading questions were asked in order to guidethis process. Problems relating to the lack ofequipment, tools or instruments were lumpedunder a single category, as were all stateregulations regardless of whether they were setby the local rangers, the park administration, orother government bodies (such as agriculturalofficials or the district administration).Difficulties posed by crocodiles to fishing, and thedestruction of crops by herbivores, were similarlylumped under a single category of wild animals.Other factors retained were those of drought andfloods, witchcraft and laziness, and the lack ofany canoe makers. I queried whether the lack ofcanoe makers could be cast in more general termsas a lack of knowledge. This was rejected, but Iwas not clear as to whether this was becausepeople felt that this only applied to canoes andnot to other resources, or because people werenot getting my point (i.e. translation difficulties).
The result was an overall list of nine barriers(Table 20). Of these, “weakness” was identifiedas being of least significance and thus allocated asingle point. All other factors were then scoredrelative to the effect of “weakness”. The twomost important aspects were seen as being thelack of tools or equipment (11 points), and therestrictions imposed through the various officialregulations (10 points). These were followed bya lack of canoe makers (8 points), witchcraft andwild animals (both with 6 points), and theoccurrence of droughts (5 points). The reasonfor ranking droughts above floods (3 points)instead of the other way round, as was presentedin discussion of agricultural production, was notfollowed up. Interestingly, the impact of dis-tance was considered to be of only relatively
minor importance (4 points), accounting for only7.4% of the overall importance mass.
d) Muaredzi prior model
Once the initial fieldwork had been completed inMuaredzi the data were used to update the priormodel for Muaredzi (Figure 8). Firstly, this entailedthe addition of nodes to reflect the specificbenefits that the CRUAT had identified. Secondly,the relative important weights that the CRUAThad used to indicate their preferences for thesegoods and services were used to weight each goodand service (see equation 1). Lastly, the weightsand additional nodes required to update the costside of the model were also added.
The initial model was then used to identifythe sensitivity of the Benefit/Cost node tofindings at each of the other nodes (Table 21).These results were used to inform subsequentfield data collection, on the basis that the mostcritical information to collect would be thatrelating to the factors to which the Benefit/Costnode showe greatest sensitivity. The BC nodewas most sensitive to additional information onthe costs, the benefits and then to most of thecost components of the model.
Table 20. Overall factors limiting access to naturalresources in Muaredzi. Importance scores reflect therelative importance of each factor as regards itscontribution towards limiting access to naturalresources by an average household within Muaredzivillage. All scores are relative to the least importantfactor (weakness).
Limiting factors RIW RIWS RIWC
Lack of tools or equipment 11 0.204 0.204Restrictions due to official 10 0.185 0.389regulationsLack of canoe makers 8 0.148 0.537Occurrence of witchcraft 6 0.111 0.648Destruction by wild animals 6 0.111 0.759Occurrence of droughts 5 0.093 0.852Distance to access resources 4 0.074 0.926Occurrence of floods 3 0.056 0.981Weakness or laziness 1 0.019 1.000Total 54 1.000 1.000
Table 21. Sensitivity of the node BCLandscape tofindings at each of the other nodes – Muaredzi priormodel.
VarianceNode ReductionBCLandscape 1.3960Costs 0.5354
Benefits 0.4696
Otherbenefits 0.2482
Distance 0.2363DistanceFromRoute 0.1638
OfficialRegulations 0.1498
PlantProducts 0.1049
AgriculturalLand 0.0835
WellSites 0.0835HouseholdConstructionMaterials 0.0566
DistanceAlongMajorRoutes 0.0562
Fishing 0.0372
GrindingStickMateria 0.0223
Barriers 0.0223Institutions 0.0208
Clay 0.0137
SesteriaProductMater 0.0082
PalmWinePalms 0.0056
Honey 0.0031TraditionalMedicines 0.0020
WildFood 0.0007
WildFruits 0.0002
Firewood 0.0000

36 Tim Lynam, Rob Cunliffe, Isaac Mapaure and Isau Bwerinofa
3. Nhanchururu community assessments
The presentation of community assessment resultsfor Nhanchururu is covered under four sections,following the same format as for Muaredzi.
a) Nhanchururu basic needs and use of natu-ral resources
As for Muaredzi, the initial exercise undertakenby the CRUAT was to identify the basic needsrequired for an average household withinNhanchururu to live an adequate life withintheir community. Additional information wasthen sought on five important groups of re-sources - these being sources of food, water,land and soil, forest products, and grasses.Each of these aspects was explored individu-ally. CRUAT members were asked to identifythe different uses made of each resource withinthe village area, and to score the relative im-portance of these. Following this, an overalllist of natural resources was prepared, and therelative importance of each item scored. Thefinal exercise within this section was to askthe CRUAT to identify any natural resources thatwere taken to be sold outside of the village,and to score the relative importance of theseitems in terms of overall sales.
Basic needs. The CRUAT identified a list of26 basic needs (Table 22). As for Muaredzi,these comprised a mix of basic requirements(such as shelter, food, water, firewood, employ-ment, sleeping mats, regulations); agriculturalrequirements (seeds, equipment, markets);infrastructure, most of which is currently lacking(school, hospital, grinding mill, access road,church, transport, shops), plus school materials,household utensils and furniture, clothes, tinsheets, alcohol, and fish, cattle and goats. Thereare virtually no cattle in the village at present.People say that this is due to difficulties inobtaining cattle (not available locally and highprices), rather than the area not being well suitedto the production of cattle (e.g. veterinaryproblems).
Sources of food. A number of differentsources of food were identified. These wereexplored individually through compiling lists ofeach type of product, and scoring the relativeimportance of these. Six spidergrams weredeveloped, these being for cultivated foods,including crops grown in fields, in wet areas,vegetables and fruits; foods collected from thewild that require cooking (mushrooms, tubers,leaves, seeds); foods from the wild that do notrequire cooking (honey and wild fruits); wildlife(comprising both animals and birds); domestic
Figure 8. Prior BBN for Muaredzi showing the nodes and their relationships. The uniform probability distributions in peripheral nodesindicates no prior knowledge as to the state of these variables.
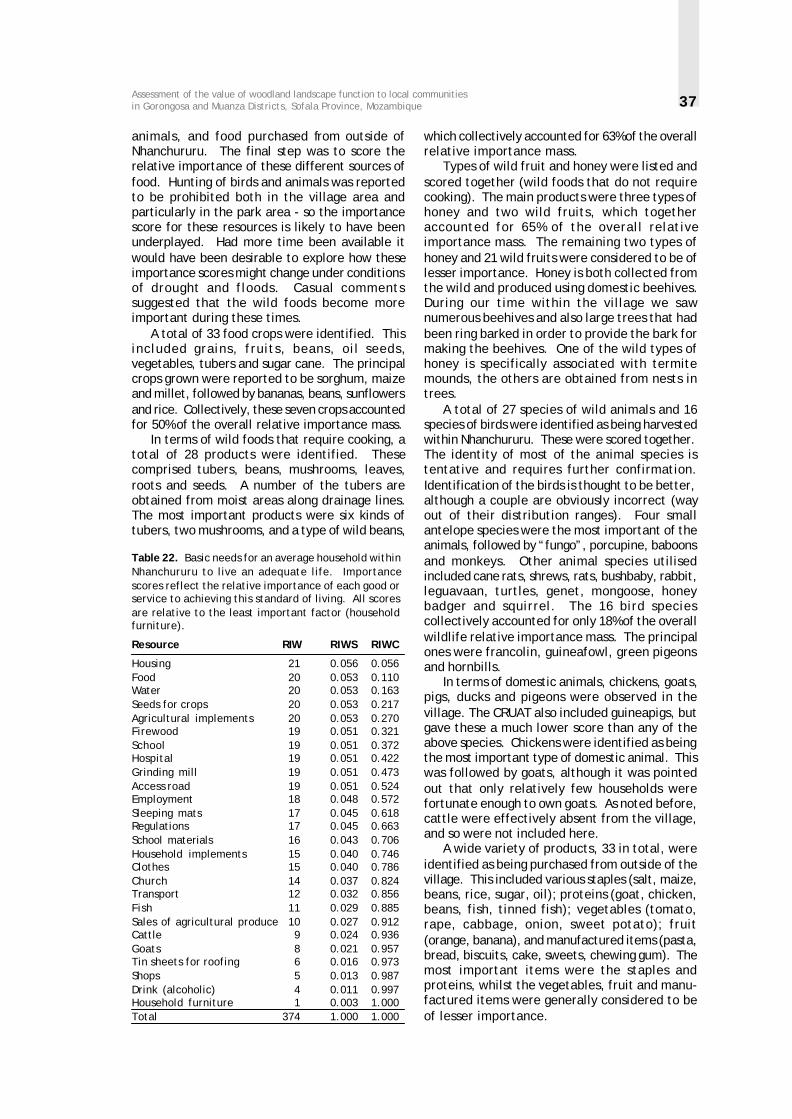
37Assessment of the value of woodland landscape function to local communitiesin Gorongosa and Muanza Districts, Sofala Province, Mozambique
animals, and food purchased from outside ofNhanchururu. The final step was to score therelative importance of these different sources offood. Hunting of birds and animals was reportedto be prohibited both in the village area andparticularly in the park area - so the importancescore for these resources is likely to have beenunderplayed. Had more time been available itwould have been desirable to explore how theseimportance scores might change under conditionsof drought and floods. Casual commentssuggested that the wild foods become moreimportant during these times.
A total of 33 food crops were identified. Thisincluded grains, fruits, beans, oil seeds,vegetables, tubers and sugar cane. The principalcrops grown were reported to be sorghum, maizeand millet, followed by bananas, beans, sunflowersand rice. Collectively, these seven crops accountedfor 50% of the overall relative importance mass.
In terms of wild foods that require cooking, atotal of 28 products were identified. Thesecomprised tubers, beans, mushrooms, leaves,roots and seeds. A number of the tubers areobtained from moist areas along drainage lines.The most important products were six kinds oftubers, two mushrooms, and a type of wild beans,
which collectively accounted for 63% of the overallrelative importance mass.
Types of wild fruit and honey were listed andscored together (wild foods that do not requirecooking). The main products were three types ofhoney and two wild fruits, which togetheraccounted for 65% of the overall relativeimportance mass. The remaining two types ofhoney and 21 wild fruits were considered to be oflesser importance. Honey is both collected fromthe wild and produced using domestic beehives.During our time within the village we sawnumerous beehives and also large trees that hadbeen ring barked in order to provide the bark formaking the beehives. One of the wild types ofhoney is specifically associated with termitemounds, the others are obtained from nests intrees.
A total of 27 species of wild animals and 16species of birds were identified as being harvestedwithin Nhanchururu. These were scored together.The identity of most of the animal species istentative and requires further confirmation.Identification of the birds is thought to be better,although a couple are obviously incorrect (wayout of their distribution ranges). Four smallantelope species were the most important of theanimals, followed by “fungo”, porcupine, baboonsand monkeys. Other animal species utilisedincluded cane rats, shrews, rats, bushbaby, rabbit,leguavaan, turtles, genet, mongoose, honeybadger and squirrel. The 16 bird speciescollectively accounted for only 18% of the overallwildlife relative importance mass. The principalones were francolin, guineafowl, green pigeonsand hornbills.
In terms of domestic animals, chickens, goats,pigs, ducks and pigeons were observed in thevillage. The CRUAT also included guineapigs, butgave these a much lower score than any of theabove species. Chickens were identified as beingthe most important type of domestic animal. Thiswas followed by goats, although it was pointedout that only relatively few households werefortunate enough to own goats. As noted before,cattle were effectively absent from the village,and so were not included here.
A wide variety of products, 33 in total, wereidentified as being purchased from outside of thevillage. This included various staples (salt, maize,beans, rice, sugar, oil); proteins (goat, chicken,beans, fish, tinned fish); vegetables (tomato,rape, cabbage, onion, sweet potato); fruit(orange, banana), and manufactured items (pasta,bread, biscuits, cake, sweets, chewing gum). Themost important items were the staples andproteins, whilst the vegetables, fruit and manu-factured items were generally considered to beof lesser importance.
Table 22. Basic needs for an average household withinNhanchururu to live an adequate life. Importancescores reflect the relative importance of each good orservice to achieving this standard of living. All scoresare relative to the least important factor (householdfurniture).
Resource RIW RIWS RIWC
Housing 21 0.056 0.056Food 20 0.053 0.110Water 20 0.053 0.163Seeds for crops 20 0.053 0.217Agricultural implements 20 0.053 0.270Firewood 19 0.051 0.321School 19 0.051 0.372Hospital 19 0.051 0.422Grinding mill 19 0.051 0.473Access road 19 0.051 0.524Employment 18 0.048 0.572Sleeping mats 17 0.045 0.618Regulations 17 0.045 0.663School materials 16 0.043 0.706Household implements 15 0.040 0.746Clothes 15 0.040 0.786Church 14 0.037 0.824Transport 12 0.032 0.856Fish 11 0.029 0.885Sales of agricultural produce 10 0.027 0.912Cattle 9 0.024 0.936Goats 8 0.021 0.957Tin sheets for roofing 6 0.016 0.973Shops 5 0.013 0.987Drink (alcoholic) 4 0.011 0.997Household furniture 1 0.003 1.000Total 374 1.000 1.000

38 Tim Lynam, Rob Cunliffe, Isaac Mapaure and Isau Bwerinofa
The perceived importance of these differentsources of food were then scored relative to oneanother (Table 23). Cultivated foods (crops andfruits) were identified as being the mostimportant food sources, together accounting for52% of the overall relative importance mass.Relatively high importance was also given tolivestock (19% of the overall importance mass).Foods harvested from the wild (wild animals,wild foods and fruits) collectively accounted foronly 22% of the importance mass, with purchasedfoods being confined to only 7%.
important uses of woodland areas were forcemeteries; for firewood; for grass; for timber(including the use of trees for making pestleand mortars for grinding grain); for traditionalmedicines, and for collecting wild foods andfruits. These were followed by constructionmaterials (poles, bamboo and bark for rope) andhoney. Hunting was stated as being the leastimportant use. The collection of palm wine wasgiven two points, although in later exercisespeople denied that any palms are to be foundwithin Nhanchururu. There may an element ofconfusion, in that some people go outside ofthe village area, for example into the adjacentpark area or to neighbouring villages, to obtaincertain products.
Grasses. The principal uses of grass were forthatching houses (apart from the school, the useof zinc roofing sheets within the village was ex-tremely limited), and for the construction of largeoval structures for storing sorghum grain(“chigua”), including protective mats that areplaced underneath these structures (“ncuputu”).Other important uses were for grazing by livestock,and for making protective rings to be placed onthe head when carrying heavy products, particu-larly water containers. Additional uses comprisedthe construction of bathrooms and toilets, andmaking nests for chickens. Roof decorations wereseen as being of least importance.
The principal grass species used wereHyparrhenia sp. (20 points), Themeda triandra(20 points), Digitaria sp. (16 points), Heteropogonsp. (10 points) and Panicum maximum (1 point).All of these were observed to grow commonlywithin the village area. In addition, Phragmitesreeds and Setaria incrassata were commonly usedfor construction of bathrooms and toilets.Bamboo, which is used for construction purposes,and Cyperus reeds (or “jungu”), which are usedfor making sleeping mats, were considered to beseparate resources from grasses.
Overall list of natural resources. A total of30 natural resources were identified as beingutilised within Nhanchururu (Table 24). Someof these could perhaps be combined together,for example the five types of honey, or “matope”and “nongo” which are two different types ofclay soils but which are both found in wet placesand used for cultivation. The most importantresources were seen as being land (9% of RIW),water (8% of RIW), firewood and wood forhandles (7% each of RIW). These were followedby 14 resources, each of which were given scoresranging from 19 to 10 points, and whichcollectively accounted for a further 56% of theoverall relative importance mass. Theseincluded food sources (livestock, cultivated fruitsand food from the wild); reeds for sleeping mats;
Water. Eleven uses of water were identified.The five most important functions were for drinking,cooking, medical treatments, bathing and washingclothes. Collectively, these uses accounted for 72%of the overall relative importance mass. Wateringvegetables and plastering houses were seen asbeing of lesser importance. Wild products derivedfrom aquatic systems, such as reeds, fish, otheraquatic animals, and aquatic food plants were seenas being of only minor importance in comparisonto other uses of water.
Land and soil. Seven uses of land and soilwere identified. The three most importantaspects were for cultivation, sites for living, andfor cemeteries. These uses were all given similarscores. These were followed, in terms of scores,by the use of clay for making pots, and of soil forplastering houses. The other two uses of sandand making bricks were seen as being of only minorsignificance. Very few brick structures wereobserved within the village.
Forest products. A total of 13 uses of naturalwoodland areas were identified. The use of treesfor making handles for implements such as hoesand axes was given the highest importancerating (14% of the overall RIW). This result wasconsistent with subsequent exercises, in whichhandles were consistently rated as being one ofthe most important natural products. Other
Table 23. Relative importance of different sources offood. Importance scores reflect the relative importanceof each source of food to an average household withinNhanchururu satisfying their food requirements. Allscores are relative to the least important source (helpfrom others).
Resources RIW RIWS RIWC
Food crops 70 0.302 0.302Cultivated fruits 50 0.216 0.517Livestock 45 0.194 0.711Foods from the wild 25 0.108 0.819Purchased foods 16 0.069 0.888Wild animals 15 0.065 0.953Wild fruits and honey 10 0.043 0.996Help from others 1 0.004 1.000
Total 232 1.000 1.000

39Assessment of the value of woodland landscape function to local communitiesin Gorongosa and Muanza Districts, Sofala Province, Mozambique
a variety of forest products (grinding sticks andbowls, timber, poles, bamboo, bark for rope, grassand traditional medicines); as well as clay for makingpots; grinding stones and reeds for constructionpurposes. The remaining 14% of the importancemass was split amongst a further 12 resources,comprising: aquatic related soils (matope andnongo), aquatic animals and plants, various typesof honey, wild fruits, wildlife, and sand.
The impression gained from variousdiscussions was that all of the resourcesmentioned on the overall list (Table 24), do occurand are harvested within Nhanchururu.However, some residents go outside of the villagearea to seek certain resources such as honey,reeds for mats, fish, wildlife and traditionalmedicines. Likewise neighbouring peoplesometimes come to collect certain resourcesfrom within Nhanchururu, such as bark for rope,bamboo, poles, timber (both for planks and formaking grinding sticks and bowls) and honey.
b) Nhanchururu Land Types
This section concerns the identification of landtypes and soil types within Nhanchururu; thespatial occurrence of these (sketch map and GPSmapping); the types of resources that are obtainedfrom the different land types; and their relativeabundance and importance. A final aspect wasto investigate the spatial distribution of resourceswithin land types - to the extent whether eachresource within a land type was relatively evenlydistributed, or whether it had an uneven, patchyor clumped distribution.
Identification of land and soil types. Thequestion was posed, “are there different typesof land within Nhanchururu or is it all the same?”Four types of land were identified: baixa (lowplaces), planicie (flat or sloping areas betweenbaixa and planalto), planalto (high areas, at thetop of slopes), and montanhas (mountains). Thebaixa and montanhas appear to be relatively welldefined, but whilst moving in the field no cleardistinction was discernible between planicie andplanalto. Planalto was described as being higherthan planicie (i.e. the tops of slopes wereconsidered to be planalto, regardless of theiractual elevation). Baixa comprises both lower
Sales of natural resources. Eleven resourceswere identified as being sold to outside ofNhanchururu (Table 25). The most important ofthese were livestock and crops, togetheraccounting for 42% of the overall importancemass. Of the various resources harvested fromthe wild, grinding sticks and bowls were seen asbeing the most important, followed by reeds formats and bamboo. These three items accountedfor a further 36% of the overall importance mass.Resources of lesser commercial value includedclay pots, fish, honey, traditional medicines,handles, and bark for rope.
Table 25. Natural resources sold to outside ofNhanchururu. Importance scores reflect the relativeimportance of sales of each resource to an averagehousehold within Nhanchururu achieving an adequatestandard of living. All scores are relative to the leastimportant resource (bark for rope).
Resources RIW RIWS RIWC
Livestock 22 0.220 0.220Crops 20 0.200 0.420Grinding sticks and bowls 18 0.180 0.600Reeds for mats 10 0.100 0.700Bamboo 8 0.080 0.780Clay pots 6 0.060 0.840Fish 5 0.050 0.890Honey 5 0.050 0.940Traditional medicines 3 0.030 0.970Wood for handles 2 0.020 0.990Bark for rope 1 0.010 1.000
Total 100 1.000 1.000
Table 24. Overall list of natural resources used withinNhanchururu. Importance scores reflect the relativeimportance of each resource to an average household withinNhanchururu achieving an adequate standard of living. Allscores are relative to the least important resources(wildlife, aquatic plants and two types of honey).
Resources RIW RIWS RIWC
Land for housing and fields 35 0.093 0.093Water 30 0.080 0.172Firewood 26 0.069 0.241Wood for handles 25 0.066 0.308Livestock 19 0.050 0.358Reeds for mats 18 0.048 0.406Grinding sticks and bowls 17 0.045 0.451Timber 17 0.045 0.496Poles for construction 16 0.042 0.538Bamboo for construction 16 0.042 0.581Rope for construction 16 0.042 0.623Grass for thatching 16 0.042 0.666Cultivated fruits 16 0.042 0.708Clay for pots 15 0.040 0.748Traditional medicines 14 0.037 0.785Grinding stones 12 0.032 0.817Reeds for construction 11 0.029 0.846Foods from the wild 10 0.027 0.873Mud for cultivation 9 0.024 0.897Honey 8 0.021 0.918Fish and other aquatic animals 7 0.019 0.936Wild fruits 6 0.016 0.952Sand 5 0.013 0.966Type of wild honey 4 0.011 0.976Slippery clay (for cultivation) 3 0.008 0.984Type of wild honey 2 0.005 0.989Type of wild honey 1 0.003 0.992Type of wild honey 1 0.003 0.995Wildlife 1 0.003 0.997Aquatic plants for food 1 0.003 1.000
Total 377 1.000 1.000

40 Tim Lynam, Rob Cunliffe, Isaac Mapaure and Isau Bwerinofa
slopes and valley bottoms. The location ofNhanchururu is such that it is an actively erodingarea and there is little build up of alluvium alongdrainage lines, with the result that adjacent soiltypes typically persist almost directly onto thedrainage lines. Regardless of the size of thedrainage, the extent of baixa was sometimesconsidered to be precisely confined to the ripariancommunity (often 10 m or less in width), but inother situations was considered to includesubstantial portions of the adjacent miombowoodland on the lower slopes.
The CRUAT members pointed out that withineach of these land types the soils were varied. Theythen proceeded to identify the different soils foundwithin each of the land types (Table 26). Three soiltypes were identified from baixa, and four fromeach of the other types. Baixa includes two typesof clay soils (“matope” or mud, and “nongo”described as slippery clay soil) and sand. Planiciewas identified as having black soil, red soil, termitemounds, and sand. Some days later, after we hadcovered substantial areas whilst mapping roads andpaths and not come across any sand areas (althoughthere were substantial portions of soil mixed withsand), the CRUAT members agreed that this wasan error and removed this category. For planalto,the four soil types were black soil, red soil, termitemounds, and soil mixed with small stones. Thelatter soil type was not considered to be suitablefor agriculture. Mountains were said to also haveboth black and red soils, and soils mixed with smallstones, as well as areas that were predominantlyrocky.
Soil types by land types. The CRUAT weresubsequently asked to consider one soil type at atime and, using a bounded scoring technique, toindicate the distribution of that particular soil typeamongst the four land types (Table 27). The firstfour types red soil, black soil, black soil with sandand black soil with small stones were all identifiedas occurring commonly in planicie, planalto andbaixa but not the mountains. Black soil with stonesoccurs in baixa, planalto and the mountains, butnot planicie. Dongo was only recorded from planicie,
despite the fact that termite mounds were alsoreported to occur in the planalto. Matope and nongowere confined to baixa. Stones were reported tooccur in baixa (along drainage lines), in planaltoand the mountains, but only to a limited extent inplanicie.
Sketch map of soil types. The CRUAT balkedat the idea of mapping land types, on the basisthat these typically occur as a mosaic in closeproximity to one another rather than covering largediscrete portions of landscape. However, they didproduce a credible map of soil types. Nine unitswere mapped. The largest of these was black soilwith sand (as belts to the west and east of thevillage); followed by red soil (the south centralportion onto the Mucodza river); then black soiland black soil mixed with stones (the north centralportion onto the Vunduzi river). Minor occurrencesof matope and nongo were mapped along some ofthe drainage lines. The occurrence of dongo
Table 27. Occurrence of soil types within the four principal land types of Nhanchururu. A bounded scoringapproach was used, with an allocation of five points per land type, to give a total of 20 points for each soiltype.
Soil Type Baixa Planicie Planalto Montanhas Total
Red soil 4 9 6 1 20Black soil 5 6 8 1 20Black soil with sand 7 8 4 1 20Black soil with small stones 4 6 9 1 20Black soil with stones 5 1 6 8 20Clay (dongo) - 20 - - 20Mud (matope) 20 - - - 20Slippery clay soil (nongo) 20 - - - 20Stones 5 1 6 8 20
Table 26. Initial identification of land and soil typesfound within Nhanchururu.
Local nomenclature Translation
BAIXA LOW AREASMatope MudNongo Slippery clay soilAreia Sand
PLANICIE FLAT AREASTerra preta Black soilTerra vermelha Red soilMurmuchea Termite moundsAreia Sand
PLANALTO HIGH AREASTerra preta Black soilTerra vermelha Red soilMestura com pedras Soil with stonesMurmuchea Termite mounds
MONTANHAS MOUNTAINSTerra preta Black soilTerra vermelha Red soilMestura com pedras Soil with stonesPedras Stones

41Assessment of the value of woodland landscape function to local communitiesin Gorongosa and Muanza Districts, Sofala Province, Mozambique
(termite mounds) was indicated in the zones ofblack soil with sand, red soil, and black soil withstones, but not for the portion of black soil.Stones were shown in association with the“mountain” areas to the extreme east of thevillage, and which were considered to mark theboundary between the village area and thenational park. A portion of sandy soil was initiallymapped to the south east of the village, buthaving done some GPS mapping in this area andnot found any sands, the CRUAT agreed that thiswas an error and that it should be changed toblack soil mixed with sand. The final map thusindicated only eight soil units.
GPS mapping of land and soil types. Whilstmapping roads and paths within the village,together with CRUAT members, for many of thepoints information was also recorded on land typesand soil types. Such data was recorded from atotal of 261 points, providing coverage of muchof the village (i.e. the bulk of the network of majorroutes). Points were recorded at about 200 paceintervals. Assuming this to be about 150m, thiswould give an overall distance of about 40km,which if done in straight lines would roughlyequate to five transects through the village area.Although this data obviously comprises a biasedsample, it does give some indication as to theoccurrence and patterning of the various landtypes and soil types.
According to these results (Table 28), planicieis the most common land type (49 % of the over-all points), followed by planalto (36 % of thepoints). Baixa accounted for some 13% of thepoints, with montanhas being represented by only4 points or 2 %.
In terms of soils, a total of 17 soil types weredescribed, the most common ones being black soilwith sand (33% of points), black soil (21%), andblack soil with stones or small stones (another21%). The most striking difference as comparedto the community map was the poorrepresentation of red soils. Only 5% of points wereclassed as red soil, although a further 16% werelabeled as various mixtures of red soil with blacksoil, sand, stones or small stones. The other typeswere all very rare, typically comprising only oneor two points. These were mainly associated withbaixa areas, and comprised various forms ofmatope and nongo, and sand.
Resources by land types. Two differentexercises were carried out in terms of identifyingthe use of natural resources from land types. Thefirst of these was to consider one land type at atime, to identify the resources obtained from thattype, and then to score the relative importanceof these (Table 29). A total of 27 resources wereidentified. Baixa and planicie provided 17 and16 resources respectively, whilst 13 were reported
to be obtained from planalto, but only four frommontanhas. Fourteen resources were obtainedfrom two or more land types, with the other 13being only obtained from one type. The bulk ofthe resources limited to a single type comprisedaquatic related resources, and were confined tobaixa (water, matope, reeds for mats, bananas,fish, aquatic plants, sand, reeds for constructionand nongo). Planicie was identified as being thesole area for football fields, clay for pots andtimber, although all of these could probably beobtained from planalto too (certainly timber). Theidentification of honey only from planalto is amisleading result, as for some of the other typesthis was included under wild foods and fruits.
In terms of relative importance, the keyresource from baixa was water (Table 29),followed to a lesser extent by matope (forcultivation), reeds for sleeping mats, andconstruction materials (poles, grass, rope andbamboo). The most important aspect of planiciewas use for fields, followed by wood for handles,livestock, firewood, pestle and mortars, sites forhouses, clay for pots, and then constructionmaterials. For planalto, the principal resourceswere use for fields, and pestle and mortars,whilst for the mountains it was the gathering ofwild foods and fruits and traditional medicines.
The second exercise was to consider oneresource at a time and, using a bounded scoring
Table 28. Frequency of land types and soil types from261 GPS points recorded within Nhanchururu whilstmapping roads and paths within the village.
Land types Frequency %
Baixa 34 13Planicie 128 49Planalto 94 36Montanhas 5 2Total 261 100
Soil Types Frequency %
Black soil 54 21Black soil with sand 85 33Black soil with stones 28 11Black soil with small stones 26 10Mixture of black and red soils 5 2Red soil 12 5Red soil with sand 7 3Red soil with stones 1 -Red soil with small stones 15 6Mixture black and red soils 12 5with small stonesBlack soil with sand and small stones 6 2Black soil with sand and nongo 2 1Sand 2 1Matope 2 1Black soil with stones and matope 2 1Black soil with sand and matope 1 -Sand and stones 1 -
Total 261 102

42 Tim Lynam, Rob Cunliffe, Isaac Mapaure and Isau Bwerinofa
technique, to indicate the importance of landtypes as a source for that particular resource(Table 30). Of the 25 resources examined,planicie was identified as being the principalsource for 12 of these, baixa for 10, planaltofor 3, and none from the mountains. Forplanalto, these were sites for houses, soil forplastering and grazing for livestock. For baixa,the bulk of the resources were aquatic relateditems, plus bamboo, grass for thatching,grinding stones (from river beds), honey andwild fruits. Planicie was identified as being themain source of land for fields, firewood, woodfor handles, wood for timber and grinding sticksand bowls, poles, bark for rope, clay for pots,traditional medicines, wild foods and wildlife.
Results of the two exercises were inconsistenton some aspects (Tables 29 and 30). For example,as regards whether houses were locatedpredominantly in planicie or planalto, or whetherplanicie or planalto were more important in termsof fields for cultivation. This may partly relateto the lack of clear separation between thesetwo types. Results of grazing for livestock alsovaried markedly.
Relative abundance and importance of soiltypes and land types. The CRUAT group wasasked to score the relative abundance and im-portance of soil and land types. A bounded scor-ing approach was used for both the abundancescores, and for the importance of soil types,but for the importance of land types an openscoring system was used.
In terms of abundance of soil types (Table31), red soil was perceived as being mostcommon (10 points), followed by black soil (9
Table 29. Natural resources obtained from each of the four land types within Nhanchururu. Each landtype was scored separately. Importance scores reflect the relative importance of each resource obtainedfrom that land type as regards an average household within Nhanchururu achieving an adequate standardof living. All scores are relative to the least important resource for each land type (traditional medicinesfor baixa and planalto, football field for planicie, and wildlife for montanhas).
Resource Relative Importance Weight (RIW)
Baixa Planicie Planalto Montanhas
Land for cultivation - 39 50 -Water 45 - - -Grinding sticks and bowls - 26 35 -Wood for handles - 30 15 -Grazing for livestock - 29 10 -Firewood 6 27 12 -Wet areas for crops (matope) 26 - - -Sites for houses - 25 9 -Reeds for mats 25 - - -Poles for construction 20 15 16 -Grass for thatching 20 15 - -Bark for rope 20 15 16 -Bamboo 20 15 - -Wild foods and fruits 3 13 17 20Clay for pots - 19 - -Bananas 18 - - -Traditional medicines 1 10 1 18Fish 16 - - -Grinding stones 12 - 5 15Wildlife for hunting - 12 8 1Aquatic plants for food 10 - - -Sand 9 - - -Timber - 9 - -Reeds for construction 7 - - -Honey - - 7 -Clay for cultivation (nongo) 2 - - -Football field - 1 - -
Total resources 17 16 13 4
Clearing new fields around a village at the base of GorongosaMountain.
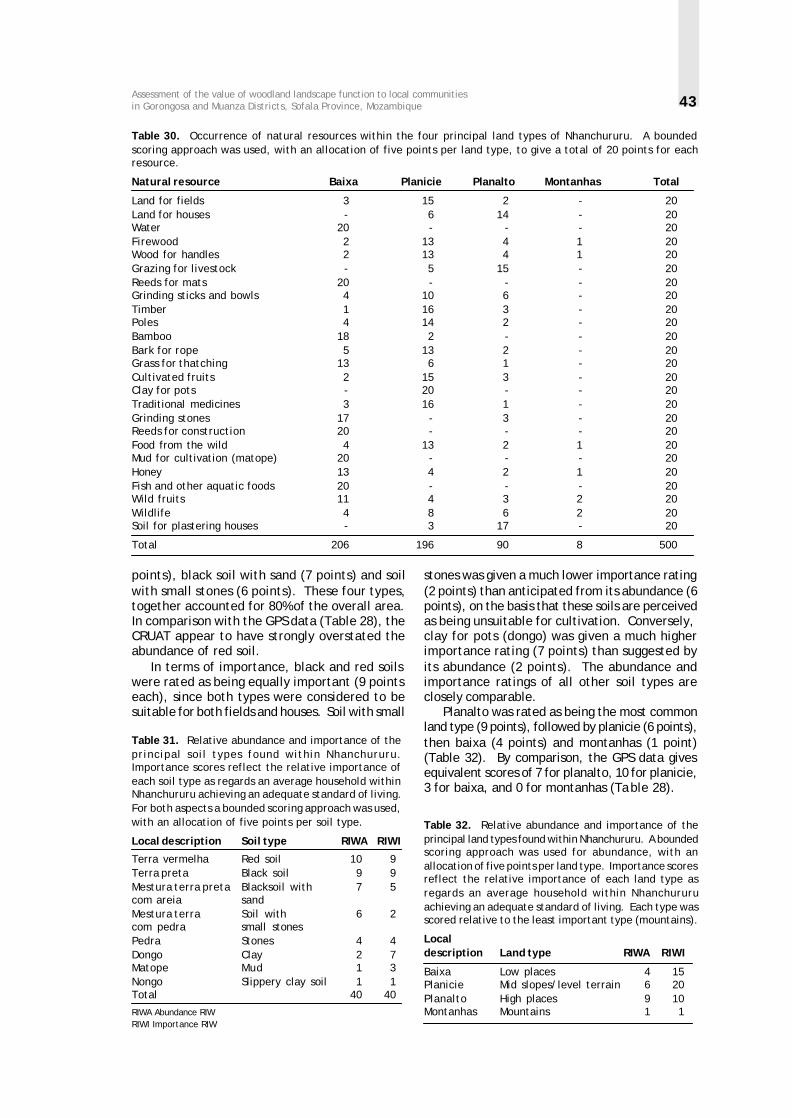
43Assessment of the value of woodland landscape function to local communitiesin Gorongosa and Muanza Districts, Sofala Province, Mozambique
Table 31. Relative abundance and importance of theprincipal soil types found within Nhanchururu.Importance scores reflect the relative importance ofeach soil type as regards an average household withinNhanchururu achieving an adequate standard of living.For both aspects a bounded scoring approach was used,with an allocation of five points per soil type.
Local description Soil type RIWA RIWI
Terra vermelha Red soil 10 9Terra preta Black soil 9 9Mestura terra preta Blacksoil with 7 5com areia sandMestura terra Soil with 6 2com pedra small stonesPedra Stones 4 4Dongo Clay 2 7Matope Mud 1 3Nongo Slippery clay soil 1 1Total 40 40
RIWA Abundance RIWRIWI Importance RIW
stones was given a much lower importance rating(2 points) than anticipated from its abundance (6points), on the basis that these soils are perceivedas being unsuitable for cultivation. Conversely,clay for pots (dongo) was given a much higherimportance rating (7 points) than suggested byits abundance (2 points). The abundance andimportance ratings of all other soil types areclosely comparable.
Planalto was rated as being the most commonland type (9 points), followed by planicie (6 points),then baixa (4 points) and montanhas (1 point)(Table 32). By comparison, the GPS data givesequivalent scores of 7 for planalto, 10 for planicie,3 for baixa, and 0 for montanhas (Table 28).
points), black soil with sand (7 points) and soilwith small stones (6 points). These four types,together accounted for 80% of the overall area.In comparison with the GPS data (Table 28), theCRUAT appear to have strongly overstated theabundance of red soil.
In terms of importance, black and red soilswere rated as being equally important (9 pointseach), since both types were considered to besuitable for both fields and houses. Soil with small
Table 30. Occurrence of natural resources within the four principal land types of Nhanchururu. A boundedscoring approach was used, with an allocation of five points per land type, to give a total of 20 points for eachresource.
Natural resource Baixa Planicie Planalto Montanhas Total
Land for fields 3 15 2 - 20Land for houses - 6 14 - 20Water 20 - - - 20Firewood 2 13 4 1 20Wood for handles 2 13 4 1 20Grazing for livestock - 5 15 - 20Reeds for mats 20 - - - 20Grinding sticks and bowls 4 10 6 - 20Timber 1 16 3 - 20Poles 4 14 2 - 20Bamboo 18 2 - - 20Bark for rope 5 13 2 - 20Grass for thatching 13 6 1 - 20Cultivated fruits 2 15 3 - 20Clay for pots - 20 - - 20Traditional medicines 3 16 1 - 20Grinding stones 17 - 3 - 20Reeds for construction 20 - - - 20Food from the wild 4 13 2 1 20Mud for cultivation (matope) 20 - - - 20Honey 13 4 2 1 20Fish and other aquatic foods 20 - - - 20Wild fruits 11 4 3 2 20Wildlife 4 8 6 2 20Soil for plastering houses - 3 17 - 20
Total 206 196 90 8 500
Table 32. Relative abundance and importance of theprincipal land types found within Nhanchururu. A boundedscoring approach was used for abundance, with anallocation of five points per land type. Importance scoresreflect the relative importance of each land type asregards an average household within Nhanchururuachieving an adequate standard of living. Each type wasscored relative to the least important type (mountains).
Localdescription Land type RIWA RIWI
Baixa Low places 4 15Planicie Mid slopes/level terrain 6 20Planalto High places 9 10Montanhas Mountains 1 1
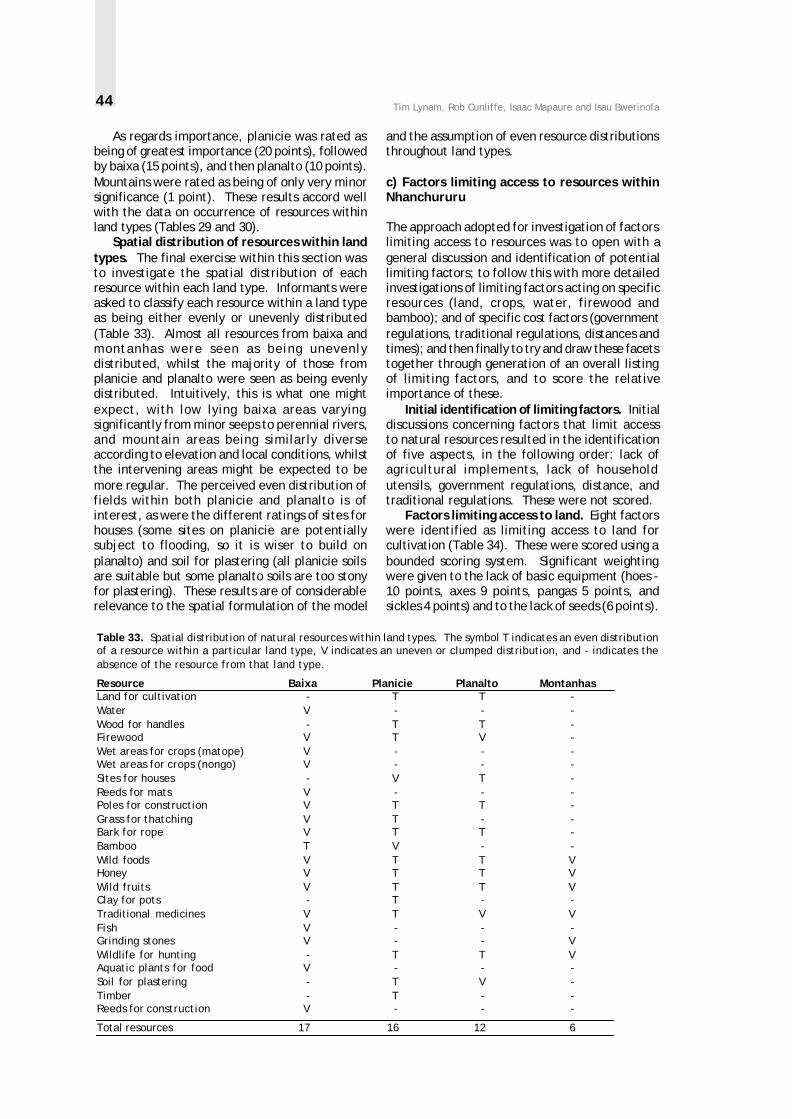
44 Tim Lynam, Rob Cunliffe, Isaac Mapaure and Isau Bwerinofa
As regards importance, planicie was rated asbeing of greatest importance (20 points), followedby baixa (15 points), and then planalto (10 points).Mountains were rated as being of only very minorsignificance (1 point). These results accord wellwith the data on occurrence of resources withinland types (Tables 29 and 30).
Spatial distribution of resources within landtypes. The final exercise within this section wasto investigate the spatial distribution of eachresource within each land type. Informants wereasked to classify each resource within a land typeas being either evenly or unevenly distributed(Table 33). Almost all resources from baixa andmontanhas were seen as being unevenlydistributed, whilst the majority of those fromplanicie and planalto were seen as being evenlydistributed. Intuitively, this is what one mightexpect, with low lying baixa areas varyingsignificantly from minor seeps to perennial rivers,and mountain areas being similarly diverseaccording to elevation and local conditions, whilstthe intervening areas might be expected to bemore regular. The perceived even distribution offields within both planicie and planalto is ofinterest, as were the different ratings of sites forhouses (some sites on planicie are potentiallysubject to flooding, so it is wiser to build onplanalto) and soil for plastering (all planicie soilsare suitable but some planalto soils are too stonyfor plastering). These results are of considerablerelevance to the spatial formulation of the model
and the assumption of even resource distributionsthroughout land types.
c) Factors limiting access to resources withinNhanchururu
The approach adopted for investigation of factorslimiting access to resources was to open with ageneral discussion and identification of potentiallimiting factors; to follow this with more detailedinvestigations of limiting factors acting on specificresources (land, crops, water, firewood andbamboo); and of specific cost factors (governmentregulations, traditional regulations, distances andtimes); and then finally to try and draw these facetstogether through generation of an overall listingof limiting factors, and to score the relativeimportance of these.
Initial identification of limiting factors. Initialdiscussions concerning factors that limit accessto natural resources resulted in the identificationof five aspects, in the following order: lack ofagricultural implements, lack of householdutensils, government regulations, distance, andtraditional regulations. These were not scored.
Factors limiting access to land. Eight factorswere identified as limiting access to land forcultivation (Table 34). These were scored using abounded scoring system. Significant weightingwere given to the lack of basic equipment (hoes -10 points, axes 9 points, pangas 5 points, andsickles 4 points) and to the lack of seeds (6 points).
Table 33. Spatial distribution of natural resources within land types. The symbol T indicates an even distributionof a resource within a particular land type, V indicates an uneven or clumped distribution, and - indicates theabsence of the resource from that land type.
Resource Baixa Planicie Planalto MontanhasLand for cultivation - T T -Water V - - -Wood for handles - T T -Firewood V T V -Wet areas for crops (matope) V - - -Wet areas for crops (nongo) V - - -Sites for houses - V T -Reeds for mats V - - -Poles for construction V T T -Grass for thatching V T - -Bark for rope V T T -Bamboo T V - -Wild foods V T T VHoney V T T VWild fruits V T T VClay for pots - T - -Traditional medicines V T V VFish V - - -Grinding stones V - - VWildlife for hunting - T T VAquatic plants for food V - - -Soil for plastering - T V -Timber - T - -Reeds for construction V - - -
Total resources 17 16 12 6
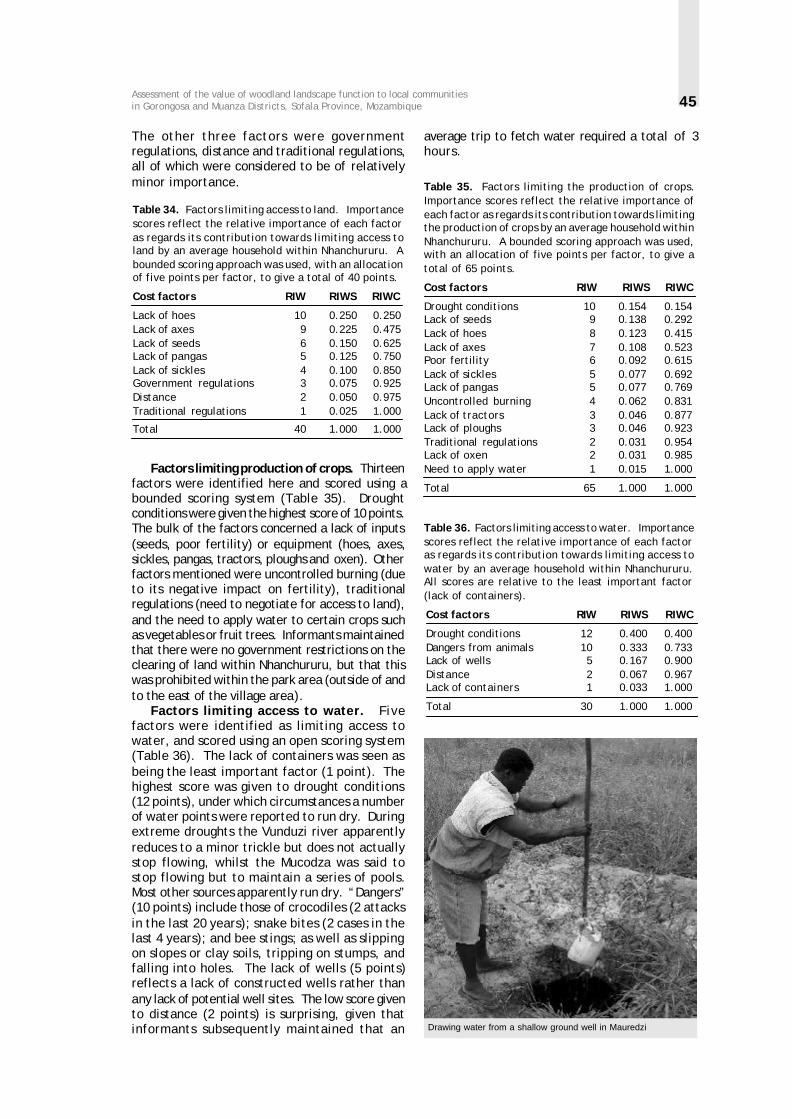
45Assessment of the value of woodland landscape function to local communitiesin Gorongosa and Muanza Districts, Sofala Province, Mozambique
Drawing water from a shallow ground well in Mauredzi
Factors limiting production of crops. Thirteenfactors were identified here and scored using abounded scoring system (Table 35). Droughtconditions were given the highest score of 10 points.The bulk of the factors concerned a lack of inputs(seeds, poor fertility) or equipment (hoes, axes,sickles, pangas, tractors, ploughs and oxen). Otherfactors mentioned were uncontrolled burning (dueto its negative impact on fertility), traditionalregulations (need to negotiate for access to land),and the need to apply water to certain crops suchas vegetables or fruit trees. Informants maintainedthat there were no government restrictions on theclearing of land within Nhanchururu, but that thiswas prohibited within the park area (outside of andto the east of the village area).
Factors limiting access to water. Fivefactors were identified as limiting access towater, and scored using an open scoring system(Table 36). The lack of containers was seen asbeing the least important factor (1 point). Thehighest score was given to drought conditions(12 points), under which circumstances a numberof water points were reported to run dry. Duringextreme droughts the Vunduzi river apparentlyreduces to a minor trickle but does not actuallystop flowing, whilst the Mucodza was said tostop flowing but to maintain a series of pools.Most other sources apparently run dry. “Dangers”(10 points) include those of crocodiles (2 attacksin the last 20 years); snake bites (2 cases in thelast 4 years); and bee stings; as well as slippingon slopes or clay soils, tripping on stumps, andfalling into holes. The lack of wells (5 points)reflects a lack of constructed wells rather thanany lack of potential well sites. The low score givento distance (2 points) is surprising, given thatinformants subsequently maintained that an
average trip to fetch water required a total of 3hours.
Table 34. Factors limiting access to land. Importancescores reflect the relative importance of each factoras regards its contribution towards limiting access toland by an average household within Nhanchururu. Abounded scoring approach was used, with an allocationof five points per factor, to give a total of 40 points.
Cost factors RIW RIWS RIWC
Lack of hoes 10 0.250 0.250Lack of axes 9 0.225 0.475Lack of seeds 6 0.150 0.625Lack of pangas 5 0.125 0.750Lack of sickles 4 0.100 0.850Government regulations 3 0.075 0.925Distance 2 0.050 0.975Traditional regulations 1 0.025 1.000
Total 40 1.000 1.000
Table 35. Factors limiting the production of crops.Importance scores reflect the relative importance ofeach factor as regards its contribution towards limitingthe production of crops by an average household withinNhanchururu. A bounded scoring approach was used,with an allocation of five points per factor, to give atotal of 65 points.
Cost factors RIW RIWS RIWC
Drought conditions 10 0.154 0.154Lack of seeds 9 0.138 0.292Lack of hoes 8 0.123 0.415Lack of axes 7 0.108 0.523Poor fertility 6 0.092 0.615Lack of sickles 5 0.077 0.692Lack of pangas 5 0.077 0.769Uncontrolled burning 4 0.062 0.831Lack of tractors 3 0.046 0.877Lack of ploughs 3 0.046 0.923Traditional regulations 2 0.031 0.954Lack of oxen 2 0.031 0.985Need to apply water 1 0.015 1.000
Total 65 1.000 1.000
Table 36. Factors limiting access to water. Importancescores reflect the relative importance of each factoras regards its contribution towards limiting access towater by an average household within Nhanchururu.All scores are relative to the least important factor(lack of containers).
Cost factors RIW RIWS RIWC
Drought conditions 12 0.400 0.400Dangers from animals 10 0.333 0.733Lack of wells 5 0.167 0.900Distance 2 0.067 0.967Lack of containers 1 0.033 1.000
Total 30 1.000 1.000
The other three factors were governmentregulations, distance and traditional regulations,all of which were considered to be of relativelyminor importance.
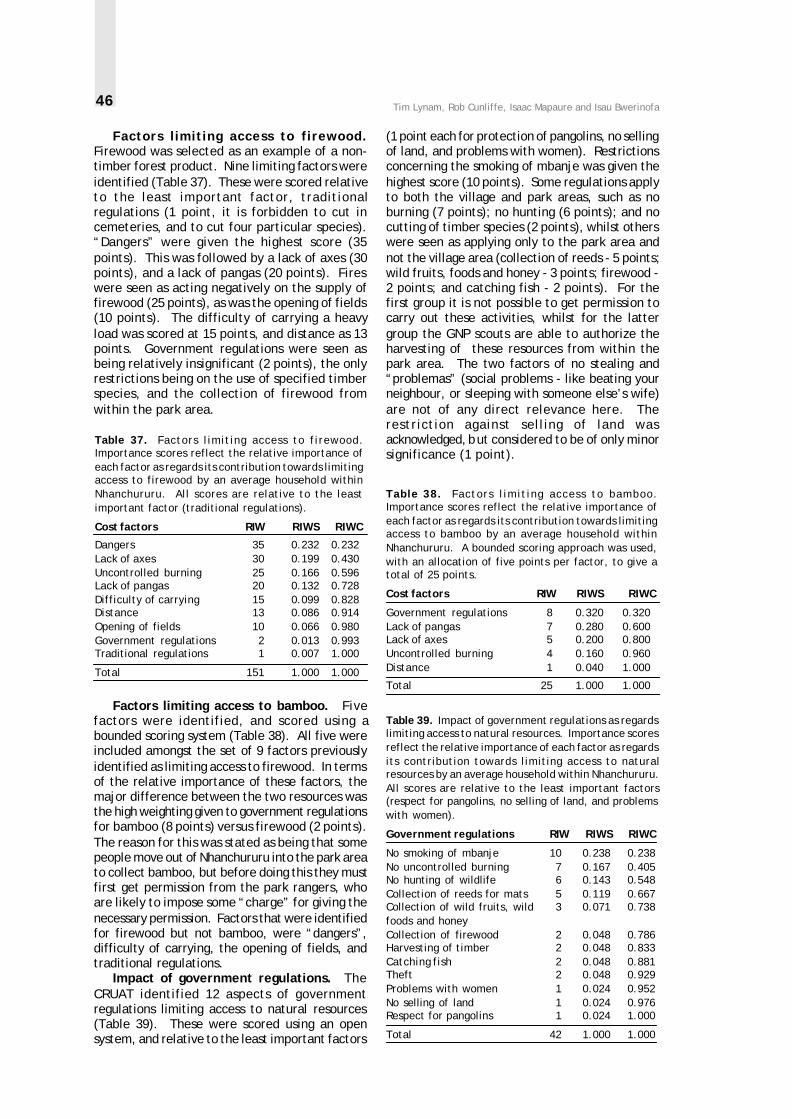
46 Tim Lynam, Rob Cunliffe, Isaac Mapaure and Isau Bwerinofa
Factors limiting access to firewood.Firewood was selected as an example of a non-timber forest product. Nine limiting factors wereidentified (Table 37). These were scored relativeto the least important factor, traditionalregulations (1 point, it is forbidden to cut incemeteries, and to cut four particular species).“Dangers” were given the highest score (35points). This was followed by a lack of axes (30points), and a lack of pangas (20 points). Fireswere seen as acting negatively on the supply offirewood (25 points), as was the opening of fields(10 points). The difficulty of carrying a heavyload was scored at 15 points, and distance as 13points. Government regulations were seen asbeing relatively insignificant (2 points), the onlyrestrictions being on the use of specified timberspecies, and the collection of firewood fromwithin the park area.
(1 point each for protection of pangolins, no sellingof land, and problems with women). Restrictionsconcerning the smoking of mbanje was given thehighest score (10 points). Some regulations applyto both the village and park areas, such as noburning (7 points); no hunting (6 points); and nocutting of timber species (2 points), whilst otherswere seen as applying only to the park area andnot the village area (collection of reeds - 5 points;wild fruits, foods and honey - 3 points; firewood -2 points; and catching fish - 2 points). For thefirst group it is not possible to get permission tocarry out these activities, whilst for the lattergroup the GNP scouts are able to authorize theharvesting of these resources from within thepark area. The two factors of no stealing and“problemas” (social problems - like beating yourneighbour, or sleeping with someone else’s wife)are not of any direct relevance here. Therestriction against selling of land wasacknowledged, but considered to be of only minorsignificance (1 point).
Factors limiting access to bamboo. Fivefactors were identified, and scored using abounded scoring system (Table 38). All five wereincluded amongst the set of 9 factors previouslyidentified as limiting access to firewood. In termsof the relative importance of these factors, themajor difference between the two resources wasthe high weighting given to government regulationsfor bamboo (8 points) versus firewood (2 points).The reason for this was stated as being that somepeople move out of Nhanchururu into the park areato collect bamboo, but before doing this they mustfirst get permission from the park rangers, whoare likely to impose some “charge” for giving thenecessary permission. Factors that were identifiedfor firewood but not bamboo, were “dangers”,difficulty of carrying, the opening of fields, andtraditional regulations.
Impact of government regulations. TheCRUAT identified 12 aspects of governmentregulations limiting access to natural resources(Table 39). These were scored using an opensystem, and relative to the least important factors
Table 37. Factors limiting access to firewood.Importance scores reflect the relative importance ofeach factor as regards its contribution towards limitingaccess to firewood by an average household withinNhanchururu. All scores are relative to the leastimportant factor (traditional regulations).
Cost factors RIW RIWS RIWC
Dangers 35 0.232 0.232Lack of axes 30 0.199 0.430Uncontrolled burning 25 0.166 0.596Lack of pangas 20 0.132 0.728Difficulty of carrying 15 0.099 0.828Distance 13 0.086 0.914Opening of fields 10 0.066 0.980Government regulations 2 0.013 0.993Traditional regulations 1 0.007 1.000
Total 151 1.000 1.000
Table 38. Factors limiting access to bamboo.Importance scores reflect the relative importance ofeach factor as regards its contribution towards limitingaccess to bamboo by an average household withinNhanchururu. A bounded scoring approach was used,with an allocation of five points per factor, to give atotal of 25 points.
Cost factors RIW RIWS RIWC
Government regulations 8 0.320 0.320Lack of pangas 7 0.280 0.600Lack of axes 5 0.200 0.800Uncontrolled burning 4 0.160 0.960Distance 1 0.040 1.000
Total 25 1.000 1.000
Table 39. Impact of government regulations as regardslimiting access to natural resources. Importance scoresreflect the relative importance of each factor as regardsits contribution towards limiting access to naturalresources by an average household within Nhanchururu.All scores are relative to the least important factors(respect for pangolins, no selling of land, and problemswith women).
Government regulations RIW RIWS RIWC
No smoking of mbanje 10 0.238 0.238No uncontrolled burning 7 0.167 0.405No hunting of wildlife 6 0.143 0.548Collection of reeds for mats 5 0.119 0.667Collection of wild fruits, wild 3 0.071 0.738foods and honeyCollection of firewood 2 0.048 0.786Harvesting of timber 2 0.048 0.833Catching fish 2 0.048 0.881Theft 2 0.048 0.929Problems with women 1 0.024 0.952No selling of land 1 0.024 0.976Respect for pangolins 1 0.024 1.000
Total 42 1.000 1.000

47Assessment of the value of woodland landscape function to local communitiesin Gorongosa and Muanza Districts, Sofala Province, Mozambique
Women from the Nhanchururu CRUAT during a discussion session
Impact of traditional regulations. Traditionalregulations were recognised as potentiallylimiting access to resources in nine different ways(Table 40). These were scored using a boundedscoring system. Five factors appear to be of onlymarginal interest as regards natural resources,these being: no smoking of mbanje (8 points),no sleeping with wives of others (7 points), nostealing (7 points), no drinking/brewing of “nipa”(4 points) and no premature marrying (1 point).Three of the other regulations are highly specific:no killing of crocodiles (8 points - as their partsare used for witchcraft), no killing of pangolins(3 points), and no cutting of four particular treespecies (2 points). The other factor, nouncontrolled burning (5 points), acts on a muchwider spectrum of resources. The level ofconcordance with the previous governmentregulations (five common factors) was surprising.
On and off path distances. The group wasasked to score the relative distances that had tobe covered on path and off path in order to accesseach type of resource. A bounded scoringapproach was used with an allocation of 10 pointsper resource (Table 41). A number of resourceswere reported to be directly accessible by path.These included key resources that are usedfrequently, such as water, fields and fields in wetareas (matope and nongo), as well as lesssignificant resources such as clay for pots, reedsfor construction, soil for plastering of houses,and aquatic food plants. For all other resourcesthe off path distance was consistently estimatedto be greater than the on path distance.
Time taken to access resources. Two exer-cises were carried out concerning the time re-quired to access each type of resource (Table42). Informants were initially asked to estimatethe actual time taken for a single trip to collecta particular resource, this being the time takenfrom leaving the house to returning to thehouse. For the second exercise, the CRUATwere asked to split 10 points for each resource,according to the relative time spent whilst trav-elling to the area to find the resource, to thatof the time spent harvesting or collecting theparticular resource.
Table 40. Impact of traditional regulations as regardslimiting access to resources by an average householdwithin Nhanchururu. A bounded scoring approach wasused, with an allocation of five points per factor, togive a total of 45 points.
Traditional regulations RIW RIWS RIWC
No smoking of mbanje 8 0.178 0.178No killing of crocodiles 8 0.178 0.356No sleeping with wives of others 7 0.156 0.511No stealing 7 0.156 0.667No burning 5 0.111 0.778No drinking of nipa 4 0.089 0.867No taking of pangolins 3 0.067 0.933No using of four types of trees 2 0.044 0.978No premature marrying 1 0.022 1.000
Total 45 1.000 1.000
Table 41. Relative distances travelled on path and offpath by an average household within Nhanchururu inorder to access natural resources. A bounded scoringapproach was used, with 10 points being allocated toeach resource to be divided between on path and offpath distances.
Relative distance
Natural resource On path Off Path
Wildlife 3 7Fish 1 9Wild foods 3 7Bamboo 4 6Water 10 -Wild fruits 3 7Honey 2 8Reeds for mats 3 7Grass for thatching 3 7Poles 4 6Firewood 2 8Timber including trees for 2 8grinding sticks and bowlsBark for rope 2 8Fields 10 -Wood for handles 4 6Fields in wet areas (matope) 10 -Fields in wet areas (nongo) 10 -Clay for pots 10 -Grinding stones 2 8Reeds for construction 10 -Soil for plastering 10 -Aquatic plants for food 10 -
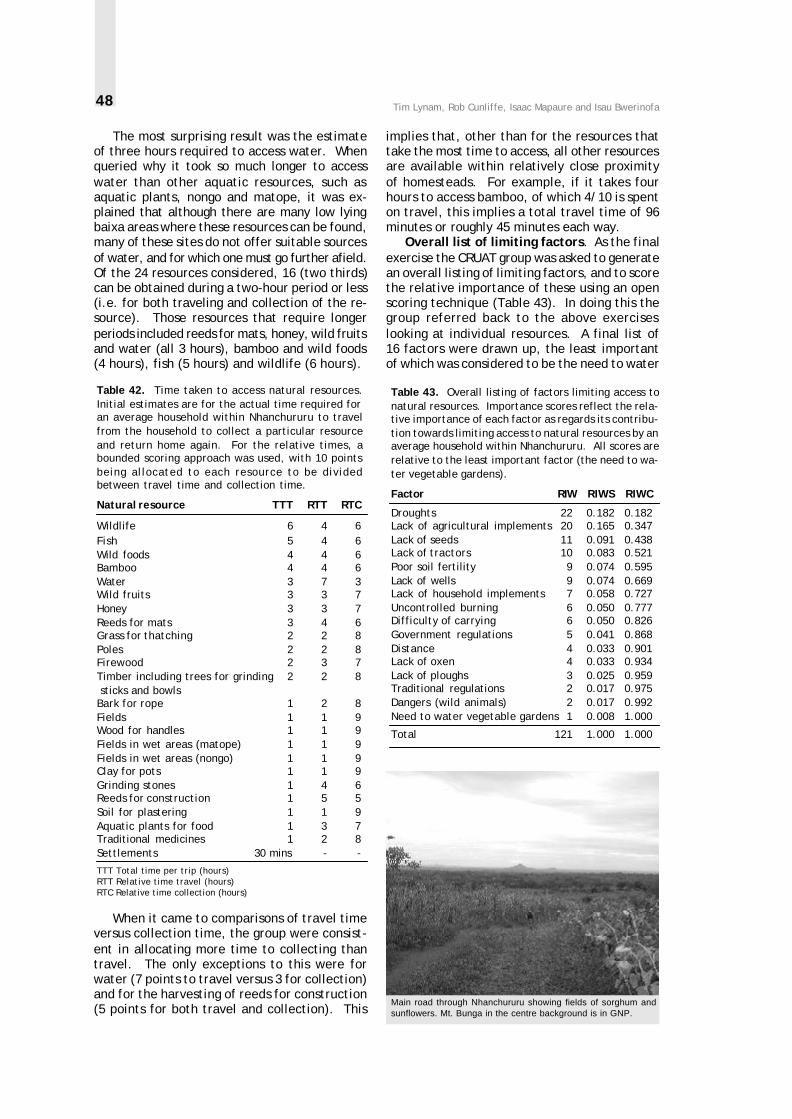
48 Tim Lynam, Rob Cunliffe, Isaac Mapaure and Isau Bwerinofa
The most surprising result was the estimateof three hours required to access water. Whenqueried why it took so much longer to accesswater than other aquatic resources, such asaquatic plants, nongo and matope, it was ex-plained that although there are many low lyingbaixa areas where these resources can be found,many of these sites do not offer suitable sourcesof water, and for which one must go further afield.Of the 24 resources considered, 16 (two thirds)can be obtained during a two-hour period or less(i.e. for both traveling and collection of the re-source). Those resources that require longerperiods included reeds for mats, honey, wild fruitsand water (all 3 hours), bamboo and wild foods(4 hours), fish (5 hours) and wildlife (6 hours).
When it came to comparisons of travel timeversus collection time, the group were consist-ent in allocating more time to collecting thantravel. The only exceptions to this were forwater (7 points to travel versus 3 for collection)and for the harvesting of reeds for construction(5 points for both travel and collection). This
implies that, other than for the resources thattake the most time to access, all other resourcesare available within relatively close proximityof homesteads. For example, if it takes fourhours to access bamboo, of which 4/10 is spenton travel, this implies a total travel time of 96minutes or roughly 45 minutes each way.
Overall list of limiting factors. As the finalexercise the CRUAT group was asked to generatean overall listing of limiting factors, and to scorethe relative importance of these using an openscoring technique (Table 43). In doing this thegroup referred back to the above exerciseslooking at individual resources. A final list of16 factors were drawn up, the least importantof which was considered to be the need to water
Main road through Nhanchururu showing fields of sorghum andsunflowers. Mt. Bunga in the centre background is in GNP.
Table 42. Time taken to access natural resources.Initial estimates are for the actual time required foran average household within Nhanchururu to travelfrom the household to collect a particular resourceand return home again. For the relative times, abounded scoring approach was used, with 10 pointsbeing allocated to each resource to be dividedbetween travel time and collection time.
Natural resource TTT RTT RTC
Wildlife 6 4 6Fish 5 4 6Wild foods 4 4 6Bamboo 4 4 6Water 3 7 3Wild fruits 3 3 7Honey 3 3 7Reeds for mats 3 4 6Grass for thatching 2 2 8Poles 2 2 8Firewood 2 3 7Timber including trees for grinding 2 2 8 sticks and bowlsBark for rope 1 2 8Fields 1 1 9Wood for handles 1 1 9Fields in wet areas (matope) 1 1 9Fields in wet areas (nongo) 1 1 9Clay for pots 1 1 9Grinding stones 1 4 6Reeds for construction 1 5 5Soil for plastering 1 1 9Aquatic plants for food 1 3 7Traditional medicines 1 2 8Settlements 30 mins - -
TTT Total time per trip (hours)RTT Relative time travel (hours)RTC Relative time collection (hours)
Table 43. Overall listing of factors limiting access tonatural resources. Importance scores reflect the rela-tive importance of each factor as regards its contribu-tion towards limiting access to natural resources by anaverage household within Nhanchururu. All scores arerelative to the least important factor (the need to wa-ter vegetable gardens).
Factor RIW RIWS RIWC
Droughts 22 0.182 0.182Lack of agricultural implements 20 0.165 0.347Lack of seeds 11 0.091 0.438Lack of tractors 10 0.083 0.521Poor soil fertility 9 0.074 0.595Lack of wells 9 0.074 0.669Lack of household implements 7 0.058 0.727Uncontrolled burning 6 0.050 0.777Difficulty of carrying 6 0.050 0.826Government regulations 5 0.041 0.868Distance 4 0.033 0.901Lack of oxen 4 0.033 0.934Lack of ploughs 3 0.025 0.959Traditional regulations 2 0.017 0.975Dangers (wild animals) 2 0.017 0.992Need to water vegetable gardens 1 0.008 1.000
Total 121 1.000 1.000

49Assessment of the value of woodland landscape function to local communitiesin Gorongosa and Muanza Districts, Sofala Province, Mozambique
vegetables and fruits (1 point). Drought wasidentified as being the most important factor (22points), followed closely by the lack of agriculturalimplements (hoes, axes, pangas, sickles - 20points). Another 6 factors relate specifically tocrop production, these being the lack of seeds(11 points); lack of tractors (10 points); poor soilfertility (9 points); lack of oxen (4 points); thelack of ploughs (3 points); and the need to applywater to certain crops (1 point). In terms of otherresources, the lack of wells was rated most highly(9 points); followed by the lack of householdutensils (7 points); uncontrolled burning (6 points),and the difficulty of carrying (6 points).Government regulations (5 points), distance (4points) and traditional regulations (2 points) wereall seen as being relatively minor importance,together with “dangers” (2 points).
In terms of physical barriers, no absolutebarriers were identified either by the CRUAT groupor whilst moving in the field. The dissected terrainis likely to make some areas more difficult toaccess than others, but not to provide any absolutebarriers. The so-called “mountains” are notmarked enough to provide any meaningfulobstacles. The two boundary rivers, particularlythe Vunduzi, are likely to be difficult to cross whenin flood.
d) Nhanchururu prior model
As was done with the Muaredzi assessment, theinitial field data were used to refine the priormodel developed for Nhanchururu (Figure 9). Theprocess was the same as that described forMuaredzi. In general, the goods and servicesidentified by the CRUAT from Nhanchururu weresimilar to those identified in Muaredzi. There wassome difference in the detail on components suchas household construction materials. There werealso a greater variety of types of honey identified(these were later amalgamated when field datawas collected for model confrontation).
The sensitivity analysis for the prior BBN fromNhanchururu yielded much the same results asobtained for Muaredzi. The cost and benefitnodes had the greatest impact as regards thebenefit/cost estimates, and these were againfollowed by the individual cost factors (Table 44).
Table 44. Results of the sensitivity analysis for theprior BBN from Nhanchururu.
VarianceNode reduction
BClandscape 0.223800Costs 0.077240Benefits 0.058560Distance 0.037560DistanceAlongMajorRoutes 0.021220Otherbenefits 0.017690PlantProducts 0.013920DistanceFromRoute 0.011750Institutions 0.011510Government 0.008050WoodProducts 0.005852Landandsoil 0.004151Water 0.004084Land 0.003362HouseholdConstructionMaterials 0.002751Dangers 0.002574ClayStones 0.002445TraditionalRegs 0.002317Firewood 0.001956AnimalsandFish 0.001910LandFields 0.001508LandHouses 0.001508Livestock 0.001419WoodforHandles 0.001229CultivatedFruits 0.001218ClayForPots 0.001172GrindingStones 0.000828Timber 0.000714GrindingStickMaterial 0.000714FoodItems 0.000512Poles 0.000510Bark 0.000510Bamboo 0.000510ConstructionReeds 0.000510Honey 0.000464WildFood 0.000322Fish 0.000301Honey_Mel 0.000278ThatchingGrass 0.000249MudForCultivation 0.000200HomeProducts 0.000173WildFruits 0.000137Sand 0.000129Honey_pasi 0.000076ClayForCultivation 0.000067ReedsForSleepingMats 0.000060TraditionalMedicines 0.000044Honey_cacecha 0.000016Honey_dowe 0.000006Honey_pumbuzi 0.000006Wildlife 0.000006AquaticPlantsforFood 0.000005
Gardens in the watercourses of Nhanchururu provide a diversityof fresh produce for local residents. Bananas, tobacco, beansand sugar-cane with sorghum fields around them.
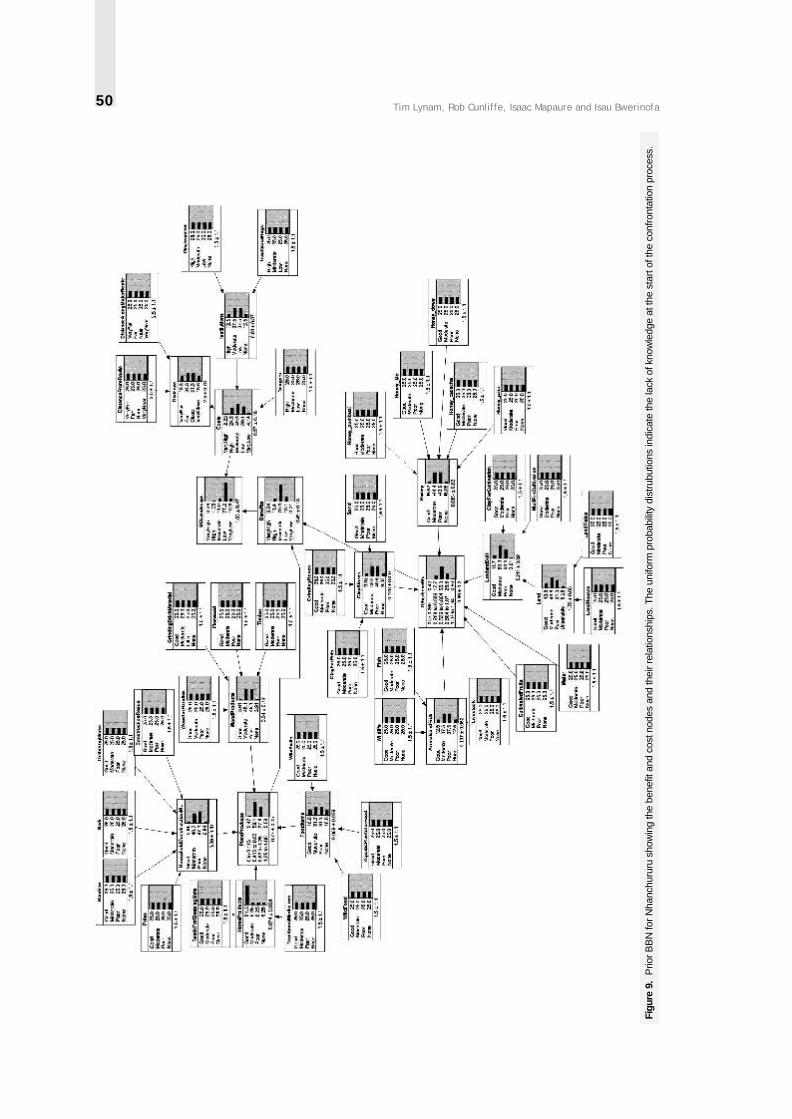
50 Tim Lynam, Rob Cunliffe, Isaac Mapaure and Isau Bwerinofa
Figu
re 9
. P
rior B
BN
for N
hanc
huru
ru s
how
ing
the
bene
fit a
nd c
ost n
odes
and
thei
r rel
atio
nshi
ps. T
he u
nifo
rm p
roba
bilit
y di
stru
butio
ns in
dica
te th
e la
ck o
f kno
wle
dge
at th
e st
art o
f the
con
front
atio
n pr
oces
s.

51Assessment of the value of woodland landscape function to local communitiesin Gorongosa and Muanza Districts, Sofala Province, Mozambique
The mean number of resources per samplewas 6.1, with the overall range being between 1and 12 resources per plot. These lowest andhighest numbers of resources were both recordedby Perreira. The case of a single resource wasgiven an overall landscape value of 3 points. Atthe other end of the scale, the sample with 12resources was given a landscape value of 22points. These data suggest that there is likelyto be a relationship between the number of re-sources per sample and the overall landscapevalue for that sample. This possibility is fur-ther supported in that all recorders commonlynoted that the landscape score for a particularsample was given “because of the number ofresources that occur there” (either few for lowscores, or many for high scores).
Factors limiting access to resources.Information was recorded for five potential costfactors: traditional regulations, governmentregulations, physical barriers, and both on pathand off path distances. A summary of theoccurrence of these factors is presented inTables 46 and 47.
4. Field Sampling for ModelConfrontation
Results of field sampling are presented forMuaredzi and Nhanchururu (Sections II.B.4.a andII.B.4.b). For each village the initial sectionprovides a brief analysis of the occurrence of goodsand services. This is followed by consideration offactors potentially limiting access to resources.Thereafter, attention is turned to the overalllandscape values and their breakdown byenumerators and land types. Brief considerationis also given as to the evidence for enumeratorbias within these results. These results are thendrawn together and summarised in the form of acomparison between sites (Section II.B.4.c).
a. Muaredzi
Sampling was carried out over a three-day period,during which the four recorders enumerated a totalof 75 samples from ten transects. Mr. Sizinhorecorded 6 samples from a single transect. Theother three recorders each covered three transects(one per day). Mr Camissa achieved 26 samples,Ms. Perreira 25, and Mr. Casse 18. The locations ofthese samples are shown in Figure 5. A summaryof the data obtained is presented in Appendix 3.
Goods and services. A total of 15 goods andservices were scored for each sample, these beingderived from the overall list of resources obtainedfor Muaredzi (Table 5). Land was separated intotwo categories, land for houses and land for fields,and these were scored separately. For each samplerecorders enquired as to the presence of anyadditional resources not included on the data sheet.Thatching grass was the only resource identifiedin this respect. Two groups (Camissa and Perreira)included thatching grass as part of constructionmaterials. The other two groups (Casse andSizinho) followed a narrower interpretation ofconstruction materials (as being confined to woodfor poles), such that thatching grass where presentwas noted separately.
Firewood was the most frequently occurringresource being recorded from 88% of samples(Table 45). Ten other resources were recordedfrom between 20% and 70% of samples. Theremaining four resources were each recorded fromless than 20% of samples, these being: fish (13%),wild foods (12%), clay for pots (7%) and grindingstones (1%). The single occurrence for grindingstones was recorded from a household within thevillage. The five occurrences of clay for pots allcame from samples in relatively close proximityto settlements. Scores for fish were not entirelyclear. Some records obviously relate to aquaticenvironments, but others appear not to be. It ispossible that these latter occurrences were from
areas where fish get left behind in pools afterfloods, and from where they are easily harvestedas the pools dry up. The low occurrence of wildfoods was surprising. Given their low relativeimportance, it is possible that their presence mayhave been overlooked for some plots.
Table 45. Frequency of occurrence of resources (good,moderate or poor) from 75 samples recorded from Muaredzi.
Resource Occ. f %RI
Firewood 66 88 0.122Land for cultivation 50 67 0.163Construction materials 50 67 0.130Traditional medicines 44 59 0.024Land for houses 44 59 not scoredWild fruit 37 49 0.008Palm leaf products 36 48 0.049Wood for grinding sticks 32 43 0.081Water/well sites 28 37 0.163Palm wine 26 35 0.041Honey 18 24 0.033Fish 10 13 0.106Wild foods 9 12 0.016Clay for pots 5 7 0.065Grinding stones 1 1 0.081
Occ. (Occurrences n=75)f (Frequency)%RI (% Relative Importance, from Table 5)
Table 46. Frequency of occurrences of factors limitingaccess to resources for 75 samples recorded fromMuaredzi.
Limiting Factors High Moderate Low None
Traditional regulations 0 0 0 75Government regulations 29 39 3 4Physical barriers 3 2 3 67

52 Tim Lynam, Rob Cunliffe, Isaac Mapaure and Isau Bwerinofa
Government regulations were recorded asbeing either high (Casse and Sizinho) or moderate(Camissa and Perreira) for 68 samples. Theremaining seven samples were rated as beingeither low (n=3) or none (n=4). Five of theseatypical scores come from Camissa’s initialtransect, and one from Perreira’s initial transect.
There is no apparent reason as to why governmentregulations should have been rated less highlyhere than for the other samples.
Physical barriers were recorded from 8 sam-ples. For two of these (Samples 36 and 44), therewas no obvious reason as to why the presence ofphysical barriers should have been recorded here.Five of the remaining samples came from thandoor madimba plots situated near the Urema river(Samples 05-06 and 51-53), and the final one wasfrom the Muaredzi river (Sample 75). These re-sults suggest that access is sometimes restrictedto low lying areas in proximity to the two mainrivers, presumably due to flooding.
Each sample was scored in terms of its dis-tance on path from the village and its distancefrom the nearest path (off path distance). Areasonably good spread of samples was obtainedin terms of distances off path, but less so fordistances along path (Table 47). Some 47 sam-ples were scored as being very far from the vil-lage on path, with the remaining 28 samplesbeing spread amongst the three closer catego-ries. Casual inspection of the raw data revealsat least seven samples for which the distancescores appear questionable. It would be usefulto compare the CRUAT distance ratings againstthe map of the village paths and roads.
Figure 10. Posterior BBN for Muaredzi showing the changes in the peripheral node probability structures due to the incorporation ofthe field case samples.
The category of traditional regulationsproved not to be very useful, as these were notrecorded for any samples. This is consistentwith information previously obtained from theCRUAT, who explained that traditions serve tosecure or increase access to resources ratherthan to limit availability in any manner.
Table 47. Distribution of 75 samples recorded fromMuaredzi according to on path and off distances foreach sample.
Distance on pathDistance Very Far Close Very Totaloff path far close
Very far 28 0 0 0 28Far 5 7 2 3 17Close 8 3 0 3 14Very close 6 2 3 5 16
Total 47 12 5 11 75
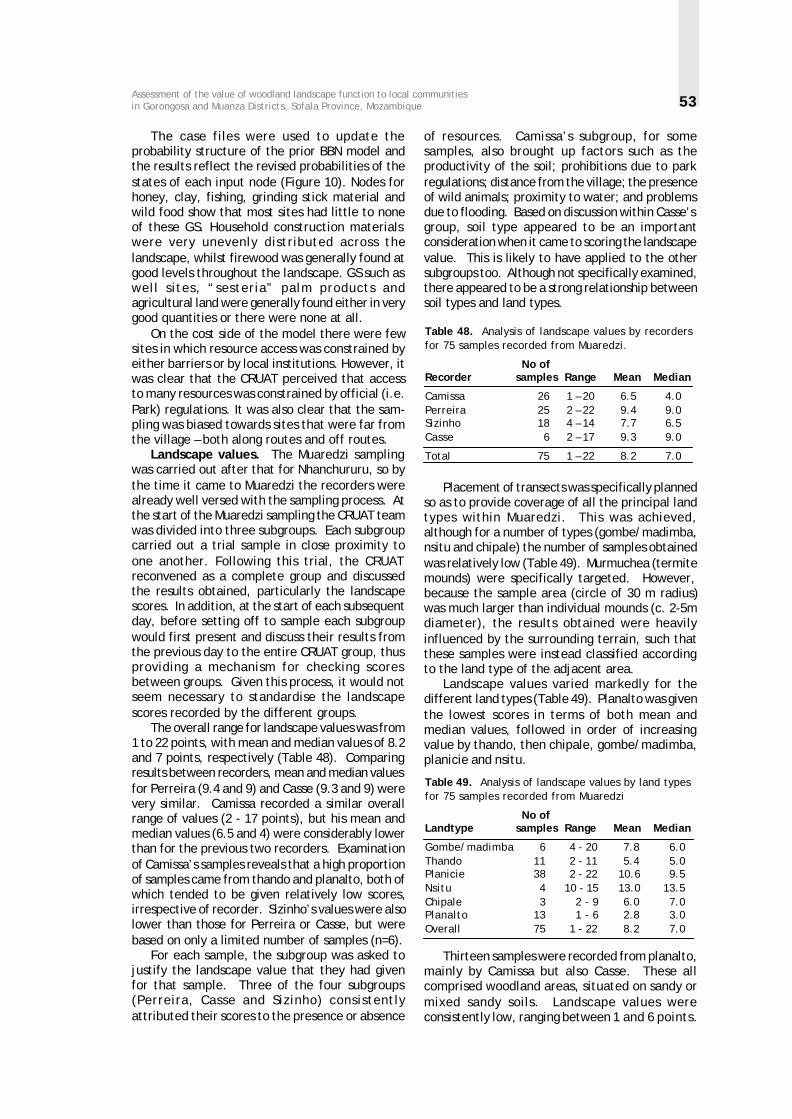
53Assessment of the value of woodland landscape function to local communitiesin Gorongosa and Muanza Districts, Sofala Province, Mozambique
Thirteen samples were recorded from planalto,mainly by Camissa but also Casse. These allcomprised woodland areas, situated on sandy ormixed sandy soils. Landscape values wereconsistently low, ranging between 1 and 6 points.
The case files were used to update theprobability structure of the prior BBN model andthe results reflect the revised probabilities of thestates of each input node (Figure 10). Nodes forhoney, clay, fishing, grinding stick material andwild food show that most sites had little to noneof these GS. Household construction materialswere very unevenly distributed across thelandscape, whilst firewood was generally found atgood levels throughout the landscape. GS such aswell sites, “sesteria” palm products andagricultural land were generally found either in verygood quantities or there were none at all.
On the cost side of the model there were fewsites in which resource access was constrained byeither barriers or by local institutions. However, itwas clear that the CRUAT perceived that accessto many resources was constrained by official (i.e.Park) regulations. It was also clear that the sam-pling was biased towards sites that were far fromthe village – both along routes and off routes.
Landscape values. The Muaredzi samplingwas carried out after that for Nhanchururu, so bythe time it came to Muaredzi the recorders werealready well versed with the sampling process. Atthe start of the Muaredzi sampling the CRUAT teamwas divided into three subgroups. Each subgroupcarried out a trial sample in close proximity toone another. Following this trial, the CRUATreconvened as a complete group and discussedthe results obtained, particularly the landscapescores. In addition, at the start of each subsequentday, before setting off to sample each subgroupwould first present and discuss their results fromthe previous day to the entire CRUAT group, thusproviding a mechanism for checking scoresbetween groups. Given this process, it would notseem necessary to standardise the landscapescores recorded by the different groups.
The overall range for landscape values was from1 to 22 points, with mean and median values of 8.2and 7 points, respectively (Table 48). Comparingresults between recorders, mean and median valuesfor Perreira (9.4 and 9) and Casse (9.3 and 9) werevery similar. Camissa recorded a similar overallrange of values (2 - 17 points), but his mean andmedian values (6.5 and 4) were considerably lowerthan for the previous two recorders. Examinationof Camissa’s samples reveals that a high proportionof samples came from thando and planalto, both ofwhich tended to be given relatively low scores,irrespective of recorder. Sizinho’s values were alsolower than those for Perreira or Casse, but werebased on only a limited number of samples (n=6).
For each sample, the subgroup was asked tojustify the landscape value that they had givenfor that sample. Three of the four subgroups(Perreira, Casse and Sizinho) consistentlyattributed their scores to the presence or absence
of resources. Camissa’s subgroup, for somesamples, also brought up factors such as theproductivity of the soil; prohibitions due to parkregulations; distance from the village; the presenceof wild animals; proximity to water; and problemsdue to flooding. Based on discussion within Casse’sgroup, soil type appeared to be an importantconsideration when it came to scoring the landscapevalue. This is likely to have applied to the othersubgroups too. Although not specifically examined,there appeared to be a strong relationship betweensoil types and land types.
Placement of transects was specifically plannedso as to provide coverage of all the principal landtypes within Muaredzi. This was achieved,although for a number of types (gombe/madimba,nsitu and chipale) the number of samples obtainedwas relatively low (Table 49). Murmuchea (termitemounds) were specifically targeted. However,because the sample area (circle of 30 m radius)was much larger than individual mounds (c. 2-5mdiameter), the results obtained were heavilyinfluenced by the surrounding terrain, such thatthese samples were instead classified accordingto the land type of the adjacent area.
Landscape values varied markedly for thedifferent land types (Table 49). Planalto was giventhe lowest scores in terms of both mean andmedian values, followed in order of increasingvalue by thando, then chipale, gombe/madimba,planicie and nsitu.
Table 48. Analysis of landscape values by recordersfor 75 samples recorded from Muaredzi.
No ofRecorder samples Range Mean Median
Camissa 26 1 – 20 6.5 4.0Perreira 25 2 – 22 9.4 9.0Sizinho 18 4 – 14 7.7 6.5Casse 6 2 – 17 9.3 9.0
Total 75 1 – 22 8.2 7.0
Table 49. Analysis of landscape values by land typesfor 75 samples recorded from Muaredzi
No ofLandtype samples Range Mean Median
Gombe/madimba 6 4 - 20 7.8 6.0Thando 11 2 - 11 5.4 5.0Planicie 38 2 - 22 10.6 9.5Nsitu 4 10 - 15 13.0 13.5Chipale 3 2 - 9 6.0 7.0Planalto 13 1 - 6 2.8 3.0Overall 75 1 - 22 8.2 7.0
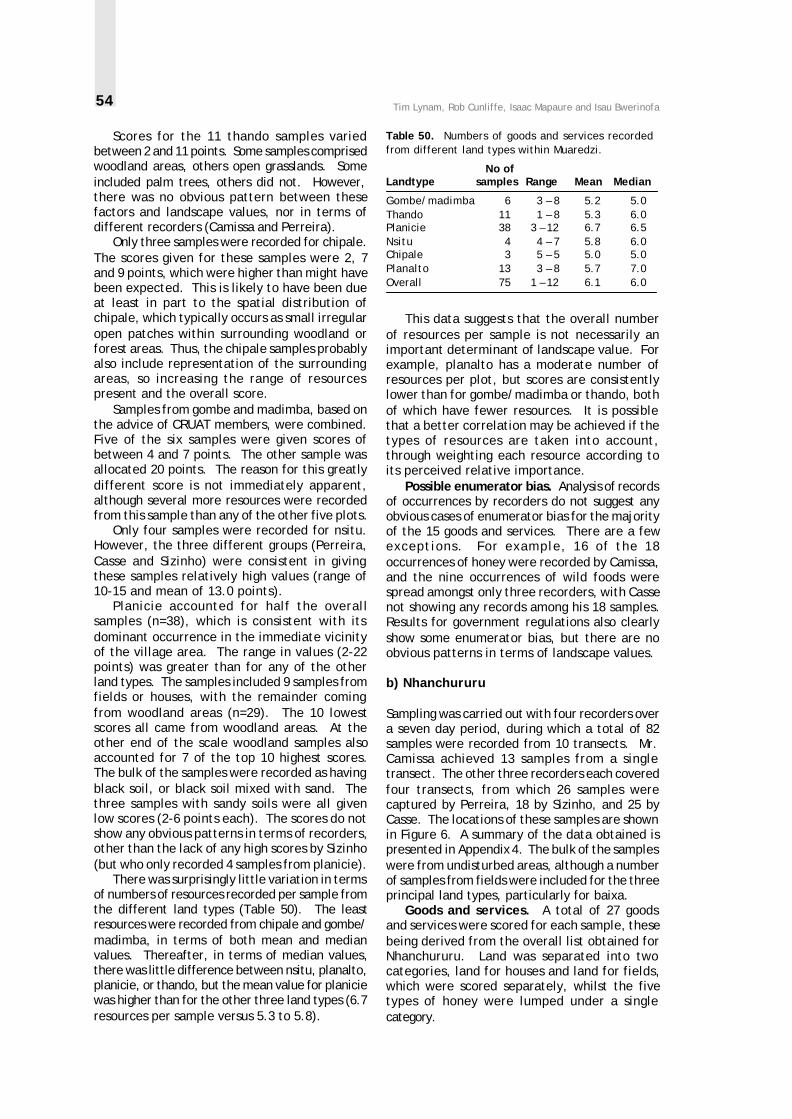
54 Tim Lynam, Rob Cunliffe, Isaac Mapaure and Isau Bwerinofa
Scores for the 11 thando samples variedbetween 2 and 11 points. Some samples comprisedwoodland areas, others open grasslands. Someincluded palm trees, others did not. However,there was no obvious pattern between thesefactors and landscape values, nor in terms ofdifferent recorders (Camissa and Perreira).
Only three samples were recorded for chipale.The scores given for these samples were 2, 7and 9 points, which were higher than might havebeen expected. This is likely to have been dueat least in part to the spatial distribution ofchipale, which typically occurs as small irregularopen patches within surrounding woodland orforest areas. Thus, the chipale samples probablyalso include representation of the surroundingareas, so increasing the range of resourcespresent and the overall score.
Samples from gombe and madimba, based onthe advice of CRUAT members, were combined.Five of the six samples were given scores ofbetween 4 and 7 points. The other sample wasallocated 20 points. The reason for this greatlydifferent score is not immediately apparent,although several more resources were recordedfrom this sample than any of the other five plots.
Only four samples were recorded for nsitu.However, the three different groups (Perreira,Casse and Sizinho) were consistent in givingthese samples relatively high values (range of10-15 and mean of 13.0 points).
Planicie accounted for half the overallsamples (n=38), which is consistent with itsdominant occurrence in the immediate vicinityof the village area. The range in values (2-22points) was greater than for any of the otherland types. The samples included 9 samples fromfields or houses, with the remainder comingfrom woodland areas (n=29). The 10 lowestscores all came from woodland areas. At theother end of the scale woodland samples alsoaccounted for 7 of the top 10 highest scores.The bulk of the samples were recorded as havingblack soil, or black soil mixed with sand. Thethree samples with sandy soils were all givenlow scores (2-6 points each). The scores do notshow any obvious patterns in terms of recorders,other than the lack of any high scores by Sizinho(but who only recorded 4 samples from planicie).
There was surprisingly little variation in termsof numbers of resources recorded per sample fromthe different land types (Table 50). The leastresources were recorded from chipale and gombe/madimba, in terms of both mean and medianvalues. Thereafter, in terms of median values,there was little difference between nsitu, planalto,planicie, or thando, but the mean value for planiciewas higher than for the other three land types (6.7resources per sample versus 5.3 to 5.8).
This data suggests that the overall numberof resources per sample is not necessarily animportant determinant of landscape value. Forexample, planalto has a moderate number ofresources per plot, but scores are consistentlylower than for gombe/madimba or thando, bothof which have fewer resources. It is possiblethat a better correlation may be achieved if thetypes of resources are taken into account,through weighting each resource according toits perceived relative importance.
Possible enumerator bias. Analysis of recordsof occurrences by recorders do not suggest anyobvious cases of enumerator bias for the majorityof the 15 goods and services. There are a fewexceptions. For example, 16 of the 18occurrences of honey were recorded by Camissa,and the nine occurrences of wild foods werespread amongst only three recorders, with Cassenot showing any records among his 18 samples.Results for government regulations also clearlyshow some enumerator bias, but there are noobvious patterns in terms of landscape values.
b) Nhanchururu
Sampling was carried out with four recorders overa seven day period, during which a total of 82samples were recorded from 10 transects. Mr.Camissa achieved 13 samples from a singletransect. The other three recorders each coveredfour transects, from which 26 samples werecaptured by Perreira, 18 by Sizinho, and 25 byCasse. The locations of these samples are shownin Figure 6. A summary of the data obtained ispresented in Appendix 4. The bulk of the sampleswere from undisturbed areas, although a numberof samples from fields were included for the threeprincipal land types, particularly for baixa.
Goods and services. A total of 27 goodsand services were scored for each sample, thesebeing derived from the overall list obtained forNhanchururu. Land was separated into twocategories, land for houses and land for fields,which were scored separately, whilst the fivetypes of honey were lumped under a singlecategory.
Table 50. Numbers of goods and services recordedfrom different land types within Muaredzi.
No ofLandtype samples Range Mean Median
Gombe/madimba 6 3 – 8 5.2 5.0Thando 11 1 – 8 5.3 6.0Planicie 38 3 – 12 6.7 6.5Nsitu 4 4 – 7 5.8 6.0Chipale 3 5 – 5 5.0 5.0Planalto 13 3 – 8 5.7 7.0Overall 75 1 – 12 6.1 6.0
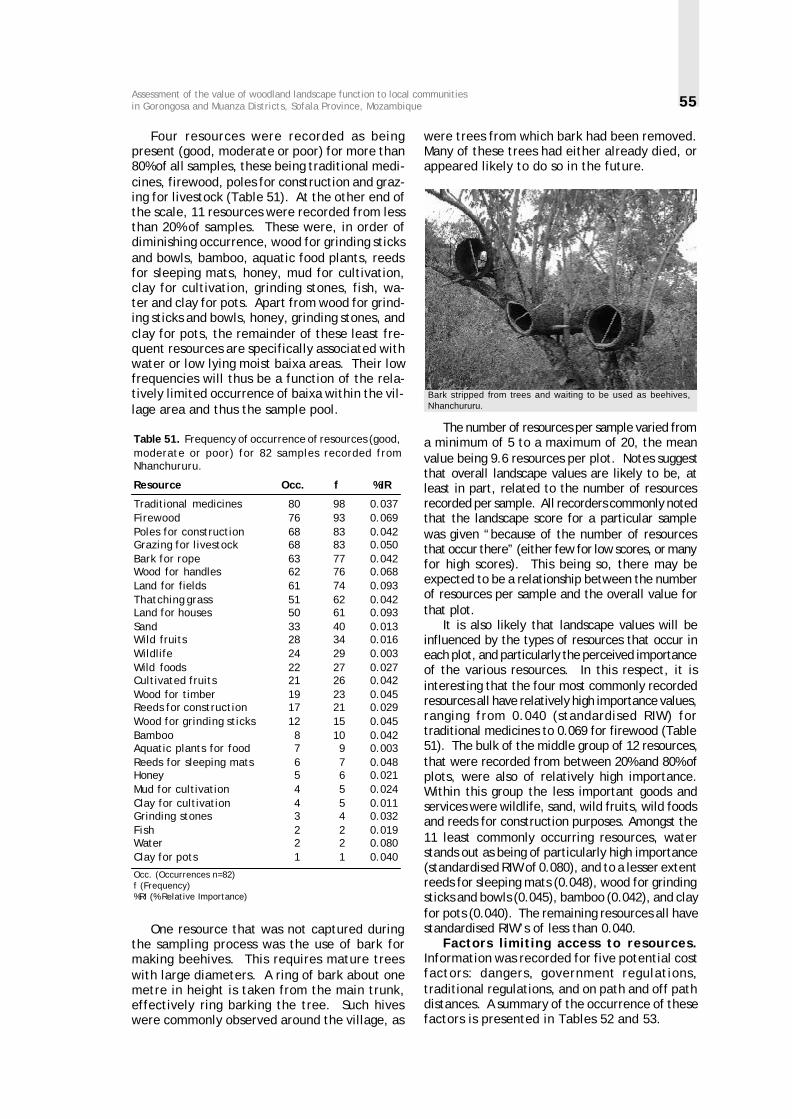
55Assessment of the value of woodland landscape function to local communitiesin Gorongosa and Muanza Districts, Sofala Province, Mozambique
One resource that was not captured duringthe sampling process was the use of bark formaking beehives. This requires mature treeswith large diameters. A ring of bark about onemetre in height is taken from the main trunk,effectively ring barking the tree. Such hiveswere commonly observed around the village, as
The number of resources per sample varied froma minimum of 5 to a maximum of 20, the meanvalue being 9.6 resources per plot. Notes suggestthat overall landscape values are likely to be, atleast in part, related to the number of resourcesrecorded per sample. All recorders commonly notedthat the landscape score for a particular samplewas given “because of the number of resourcesthat occur there” (either few for low scores, or manyfor high scores). This being so, there may beexpected to be a relationship between the numberof resources per sample and the overall value forthat plot.
It is also likely that landscape values will beinfluenced by the types of resources that occur ineach plot, and particularly the perceived importanceof the various resources. In this respect, it isinteresting that the four most commonly recordedresources all have relatively high importance values,ranging from 0.040 (standardised RIW) fortraditional medicines to 0.069 for firewood (Table51). The bulk of the middle group of 12 resources,that were recorded from between 20% and 80% ofplots, were also of relatively high importance.Within this group the less important goods andservices were wildlife, sand, wild fruits, wild foodsand reeds for construction purposes. Amongst the11 least commonly occurring resources, waterstands out as being of particularly high importance(standardised RIW of 0.080), and to a lesser extentreeds for sleeping mats (0.048), wood for grindingsticks and bowls (0.045), bamboo (0.042), and clayfor pots (0.040). The remaining resources all havestandardised RIW’s of less than 0.040.
Factors limiting access to resources.Information was recorded for five potential costfactors: dangers, government regulations,traditional regulations, and on path and off pathdistances. A summary of the occurrence of thesefactors is presented in Tables 52 and 53.
Four resources were recorded as beingpresent (good, moderate or poor) for more than80% of all samples, these being traditional medi-cines, firewood, poles for construction and graz-ing for livestock (Table 51). At the other end ofthe scale, 11 resources were recorded from lessthan 20% of samples. These were, in order ofdiminishing occurrence, wood for grinding sticksand bowls, bamboo, aquatic food plants, reedsfor sleeping mats, honey, mud for cultivation,clay for cultivation, grinding stones, fish, wa-ter and clay for pots. Apart from wood for grind-ing sticks and bowls, honey, grinding stones, andclay for pots, the remainder of these least fre-quent resources are specifically associated withwater or low lying moist baixa areas. Their lowfrequencies will thus be a function of the rela-tively limited occurrence of baixa within the vil-lage area and thus the sample pool.
were trees from which bark had been removed.Many of these trees had either already died, orappeared likely to do so in the future.
Table 51. Frequency of occurrence of resources (good,moderate or poor) for 82 samples recorded fromNhanchururu.
Resource Occ. f %IR
Traditional medicines 80 98 0.037Firewood 76 93 0.069Poles for construction 68 83 0.042Grazing for livestock 68 83 0.050Bark for rope 63 77 0.042Wood for handles 62 76 0.068Land for fields 61 74 0.093Thatching grass 51 62 0.042Land for houses 50 61 0.093Sand 33 40 0.013Wild fruits 28 34 0.016Wildlife 24 29 0.003Wild foods 22 27 0.027Cultivated fruits 21 26 0.042Wood for timber 19 23 0.045Reeds for construction 17 21 0.029Wood for grinding sticks 12 15 0.045Bamboo 8 10 0.042Aquatic plants for food 7 9 0.003Reeds for sleeping mats 6 7 0.048Honey 5 6 0.021Mud for cultivation 4 5 0.024Clay for cultivation 4 5 0.011Grinding stones 3 4 0.032Fish 2 2 0.019Water 2 2 0.080Clay for pots 1 1 0.040
Occ. (Occurrences n=82)f (Frequency)%RI (% Relative Importance)
Bark stripped from trees and waiting to be used as beehives,Nhanchururu.

56 Tim Lynam, Rob Cunliffe, Isaac Mapaure and Isau Bwerinofa
Government regulations were perceived asbeing high throughout the sample area (n=79).Three atypical cases were recorded, two being forthe first two “learning” samples (sample numbers01 and 02, both low), and the other for sample 23(moderate). There is no obvious explanation forthis latter case.
For traditional laws, a single sample wasrecorded as being low (sample number 02), whilstall others were either moderate (n=51) or high(n=30). The differences between moderate andhigh can be explained in terms of enumerators.Two recorders (Camissa and Casse) consistentlygave “moderate” ratings for traditionalregulations, whilst Sizinho consistently scored thisas “high”. The implication is that traditional lawswere considered to operate throughout the area,and with equal magnitude all over.
The factor “dangers” resulted in a wider spreadof values, with 40 samples being rated as high, 29as moderate and 12 as low. These results can alsobe partly explained in terms of enumerators.Camissa (except for his first training sample) andboth Sizinho and Casse, consistently rated dangersas moderate or high, whilst Perreira recordedroughly equal numbers of cases of high (n=6),moderate (n=6) and low (n=9). For her first andfourth transects Perreira mainly recorded dangersas being high (with two samples being moderate).These two transects passed through quite differentterrain, the one being relatively steep and wellwooded, the other passing through an area ofgentler terrain with many fields. For her middletwo transects, Perreira predominantly rateddangers as being either low or moderate, apartfrom one record of high. Visual examination ofthe data does not suggest any relationship betweenthe “danger” ratings of these 25 samples andeither of the two distance functions.
A good spread of samples was obtained for boththe “on path” and “off path” distance functions.When looking at the combination of these factors(Table 53), the spread of samples was againreasonable, albeit somewhat scanty for factors ofvery far along path by very close or close off path,and also very close along path by close, far or veryfar off path.
No obvious patterns emerge as regards therecording of distance scores by the differentrecorders. It would be interesting to check thedistance ratings against the map of routes for the
Landscape values. The overall range for land-scape values was from 1 to 25 (Table 54). Threesamples (numbers 55, 56 and 57, all recorded byCasse) were given scores of one point each, de-spite having similar levels of resources to theprevious three samples which were valued at 10,11 and 13 points. The CRUAT group explainedthat this was because these three samples weresituated within the national park area, and werethus subject to additional government regulationsas compared to all other samples from within thevillage area. These three samples were omittedfor the purpose of calculations of means andmedians, both for the subset of samples recordedby Casse and for the overall set of samples.
The overall mean landscape value was 9.9points, and the median value was 10 points (Table54). There was considerable variation betweenrecorders in terms of ranges of scores, means andmedians. Thus, for comparative purposes, it maybe necessary to first standardise the landscapescores for the different recorders. There aredifferent ways of doing this. One possibility is todivide the scores for each recorder by the highestscore obtained by that recorder, thus effectivelystandardising the scores for each recorder to arange of between 0 and 1. However, this placesstrong emphasis on the highest scores obtainedby each recorder, which can be expected togenuinely vary from one group to the next. Forexample, the highest score of 25 points, awardedby Perreira for sample number 69, appearsanomalous on the basis of the moderate numbersand levels of resources recorded from this plot,together with typical levels for cost factors.
village. Although distance received a relativelylow importance score in terms of the overall listingof potential limiting factors (Table 43), it ispossible that the two distance functions may havehad a relatively large influence on the overalllandscape values given during this samplingprocess. For example, samples 52, 53 and 54,despite all being from similar terrain, showdecreasing scores (13, 11 and 10, respectively)with increasing distance away from the settledportion of the village.
Table 52. Frequency of occurrences of factors limitingaccess to resources for 82 samples recorded fromNhanchururu.
Factor High Moderate Low None
Government regulations 79 1 2 0Traditional regulations 30 51 1 0Dangers 40 29 12 1
Table 53. Distribution of 82 samples recorded fromNhanchururu according to on path and off distancesfor each sample.
Distance on pathDistance Very Far Close Very Totaloff path far close
Very far 12 8 6 2 28Far 8 2 4 1 15Close 2 5 6 1 14Very close 2 5 12 6 25
Total 24 20 28 10 82

57Assessment of the value of woodland landscape function to local communitiesin Gorongosa and Muanza Districts, Sofala Province, Mozambique
Figu
re 1
1. P
oste
rior B
BN
for N
hanc
huru
ru s
how
ing
the
chan
ges
in th
e pe
riphe
ral n
ode
prob
abili
ty s
truc
ture
s du
es to
the
inco
rpor
atio
n of
the
field
cas
e s
ampl
es. N
ote
that
the
four
diff
eren
t typ
es o
f hon
eyw
ere
amal
gam
ated
in th
e fie
ld. T
he fi
eld
data
ther
efor
e co
ntrib
utes
dire
ctly
to th
e ho
ney
node
and
not
the
node
s fo
r di
ffere
nt ty
pes
of h
oney
. Thu
s th
e la
tter
have
uni
form
pro
babi
lity
dist
ribut
ions
.

58 Tim Lynam, Rob Cunliffe, Isaac Mapaure and Isau Bwerinofa
The mean value for planicie was the sameas that for planalto (10.4 points for each).However, planicie has a greater overall range ofvalues than planalto, and includes both the lowestsix scores and the highest five scores from theoverall data set. So it appears that planicie ismore variable than planalto, but much the samein terms of overall value. Intuitively this is whatone might expect, in that planalto is limited tohigher lying areas including the upper portionsof slopes, whereas planicie covers a wider rangeof situations, between the upper slopes andlower lying valley areas.
The overall range of values for baixa wassimilar to that of planalto, but its mean (8.8
points) and median values (9 points) were lowerthan for planalto and planicie. It should be notedthat baixa includes samples from both drainagelines at the bottoms of valleys, as well aswoodland areas on lower portions of slopes.
Similar numbers of resources were recordedfrom each land type (Table 56). The range ofvalues for baixa samples (5-20 resources persample) was greater than for planicie or planalto(ranges of 6-13 and 5-3 resources respectively),but there was little difference in terms of meanvalues: 10.1 resources per sample for baixa versusvalues of 9.3 and 9.4 for planicie and planalto.
Possible enumerator bias. Data obtained forfactors limiting access to resources show someclear examples of enumerator bias. It has alsobeen suggested that there may have beendifferences in the way that the four subgroups wereallocating landscape values, hence the suggestionto possibly standardise the scores. What is theevidence in terms of goods and services?
An alternative approach could be to increaseor decrease the scores of each recorder, so as tostandardise the median scores for each subset.This would require the addition of two points toeach of Camissa’s scores, and the subtraction ofthree points from each of Casse’s scores, suchthat the median value for each recorder would thenbe standardised at 9 points.
Analysis of the raw landscape values in termsof land types is presented in Table 55. Areasonable number of samples were obtainedfrom each of the three principal land types (baixa,planicie and planalto). Only two samples wereobtained from mountain areas, and given thelocation of one of these (sample number 59), itsclassification as montanhas seems questionable.
As a first attempt to examine this question,the responses for each resource were examinedin terms of the frequency of different levels ofoccurrence recorded by the four recorders (Table57). This reveals some clear examples of recorderbias. No clear patterns emerged for thoseresources that were recorded least frequently (11resources with 15 or less occurrences). However,for the remaining 16 more frequent resources,13 of these show possible suggestions of recorderbias in terms of unlikely distributions of numbersand nature of records amongst the four recorders.For example, 15 of the 22 occurrences of wildfoods were recorded by Casse, as were 21 of the24 records of wildlife, whilst Sizinho recorded 13out of 17 occurrences of reeds for construction.
c) Comparison between Muaredzi andNhanchururu
Similar numbers of samples were achieved for bothsites. The Nhanchururu sampling tookconsiderably longer, principally because this iswhere we started and the recorders were not yetfamiliar with the sampling process and, particularly,with using GPS’s. Difficult terrain and poor accessto certain areas were encountered at both sites.
Table 54. Analysis of landscape values by recordersfor 82 samples recorded from Nhanchururu.
Recorder No of Range Mean MedianSamples
Camissa 13 2 - 14 6.8 7 Perreira 26 5 - 25 10.2 9 Sizinho 18 3 - 18 9.3 9 Casse * 22 8 - 20 11.8 12
Total * 79 2 - 25 9.9 10
* Three samples by Casse were given scores of 1 on the basis ofbeing within the park area. These samples were excluded for thepurpose of calculating mean and median values for Casse and forthe overall group.
Table 55. Analysis of landscape values by land typesfor 82 samples recorded from Nhanchururu.
No ofLandtype Samples Range Mean Median
Baixa * 22 5 - 15 8.8 9Planicie * 38 2 - 25 10.4 10Planalto * 17 6 - 14 10.4 11Montanhas 2 5 - 12 na naOverall * 79 2 - 25 9.9 10
* Three samples were given scores of 1 on the basis of being withinthe park area, one each for baixa, panicie and planalto. Thesesamples were excluded for the purpose of calculating mean andmedian values for these three land types and for the overall group.
Table 56. Numbers of goods and services recordedfrom different land types within Nhanchururu.
No ofLandtype Samples Range Mean Median
Baixa 23 5 - 20 10.1 10.0Planicie 39 5 - 13 9.3 10.0Planalto 18 6 - 13 9.4 9.0Montanhas 2 8 - 14 11.0 0.0Overall 82 5 - 20 9.6 9.5
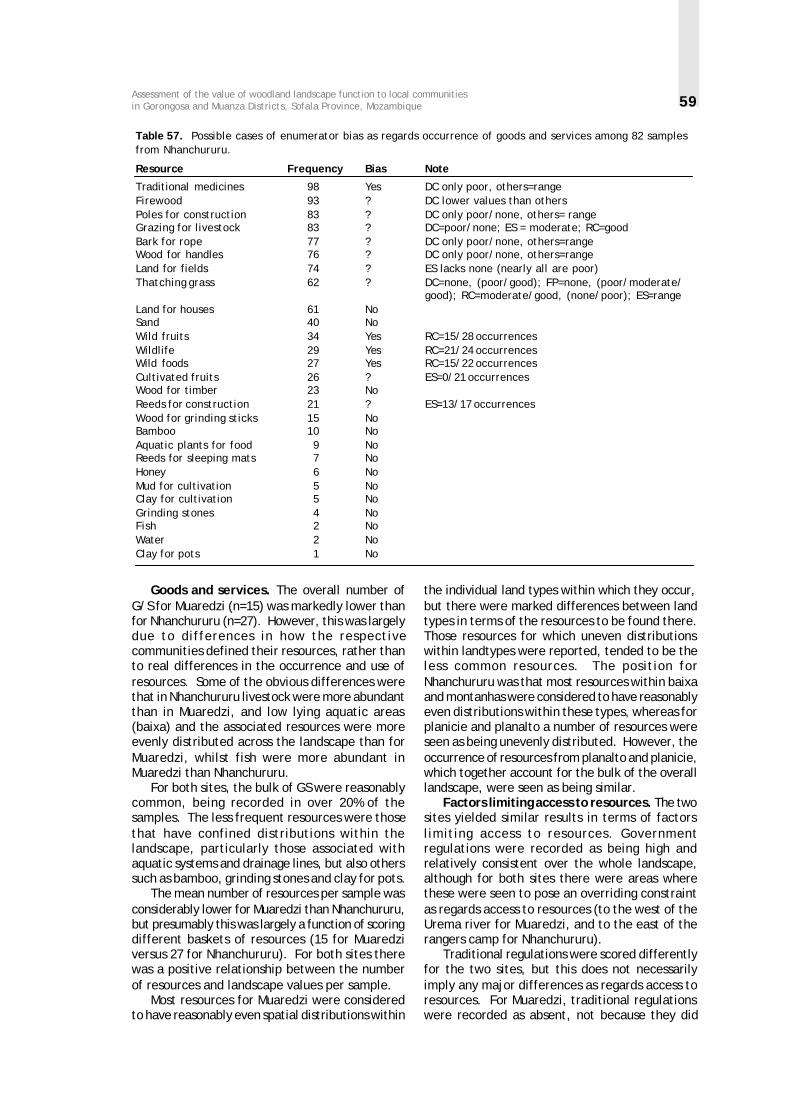
59Assessment of the value of woodland landscape function to local communitiesin Gorongosa and Muanza Districts, Sofala Province, Mozambique
Goods and services. The overall number ofG/S for Muaredzi (n=15) was markedly lower thanfor Nhanchururu (n=27). However, this was largelydue to differences in how the respectivecommunities defined their resources, rather thanto real differences in the occurrence and use ofresources. Some of the obvious differences werethat in Nhanchururu livestock were more abundantthan in Muaredzi, and low lying aquatic areas(baixa) and the associated resources were moreevenly distributed across the landscape than forMuaredzi, whilst fish were more abundant inMuaredzi than Nhanchururu.
For both sites, the bulk of GS were reasonablycommon, being recorded in over 20% of thesamples. The less frequent resources were thosethat have confined distributions within thelandscape, particularly those associated withaquatic systems and drainage lines, but also otherssuch as bamboo, grinding stones and clay for pots.
The mean number of resources per sample wasconsiderably lower for Muaredzi than Nhanchururu,but presumably this was largely a function of scoringdifferent baskets of resources (15 for Muaredziversus 27 for Nhanchururu). For both sites therewas a positive relationship between the numberof resources and landscape values per sample.
Most resources for Muaredzi were consideredto have reasonably even spatial distributions within
the individual land types within which they occur,but there were marked differences between landtypes in terms of the resources to be found there.Those resources for which uneven distributionswithin landtypes were reported, tended to be theless common resources. The position forNhanchururu was that most resources within baixaand montanhas were considered to have reasonablyeven distributions within these types, whereas forplanicie and planalto a number of resources wereseen as being unevenly distributed. However, theoccurrence of resources from planalto and planicie,which together account for the bulk of the overalllandscape, were seen as being similar.
Factors limiting access to resources. The twosites yielded similar results in terms of factorslimiting access to resources. Governmentregulations were recorded as being high andrelatively consistent over the whole landscape,although for both sites there were areas wherethese were seen to pose an overriding constraintas regards access to resources (to the west of theUrema river for Muaredzi, and to the east of therangers camp for Nhanchururu).
Traditional regulations were scored differentlyfor the two sites, but this does not necessarilyimply any major differences as regards access toresources. For Muaredzi, traditional regulationswere recorded as absent, not because they did
Table 57. Possible cases of enumerator bias as regards occurrence of goods and services among 82 samplesfrom Nhanchururu.
Resource Frequency Bias Note
Traditional medicines 98 Yes DC only poor, others=rangeFirewood 93 ? DC lower values than othersPoles for construction 83 ? DC only poor/none, others= rangeGrazing for livestock 83 ? DC=poor/none; ES = moderate; RC=goodBark for rope 77 ? DC only poor/none, others=rangeWood for handles 76 ? DC only poor/none, others=rangeLand for fields 74 ? ES lacks none (nearly all are poor)Thatching grass 62 ? DC=none, (poor/good); FP=none, (poor/moderate/
good); RC=moderate/good, (none/poor); ES=rangeLand for houses 61 NoSand 40 NoWild fruits 34 Yes RC=15/28 occurrencesWildlife 29 Yes RC=21/24 occurrencesWild foods 27 Yes RC=15/22 occurrencesCultivated fruits 26 ? ES=0/21 occurrencesWood for timber 23 NoReeds for construction 21 ? ES=13/17 occurrencesWood for grinding sticks 15 NoBamboo 10 NoAquatic plants for food 9 NoReeds for sleeping mats 7 NoHoney 6 NoMud for cultivation 5 NoClay for cultivation 5 NoGrinding stones 4 NoFish 2 NoWater 2 NoClay for pots 1 No

60 Tim Lynam, Rob Cunliffe, Isaac Mapaure and Isau Bwerinofa
not exist but rather because they were notconsidered to imply any restrictions on access toresources (on the contrary traditions weredescribed as enhancing access to resources). ForNhanchururu, traditional regulations were seen asbeing moderate to high throughout the area, buton the basis that traditional authority extendsover the entire village landscape, rather thanresulting in any marked restrictions on access toresources.
Physical barriers were of little consequencefor either site, the most notable occurrence beingseasonal flooding of low-lying areas withinMuaredzi. Dangers were identified as anadditional cost factor for Nhanchururu, and thesewere considered to show greater variation acrossthe landscape.
The impacts of the on path and off path distancefunctions, as regards limiting access to resourcesis less clear. Sampling for Muaredzi was biasedtowards sites that were far from the village andwell off routes. Both sites are considered to berelatively well endowed with resources, and thebulk of the principal resources appear to beavailable within reasonable proximity ofsettlements, such that the distance functions maynot be that important here.
Landscape values. In terms of overall range,mean and median values, were marginally higherfor Nhanchururu than Muaredzi. The process ofcoming together to report and discuss landscapevalues was carried out for Muaredzi but notNhanchururu. Also, by the time it came toMuaredzi, the recorders were more familiar andexperienced with the sampling process. This mayaccount for the greater variation in landscapevalues among subgroups for Nhanchururu, asopposed to the more uniform results obtainedfor Muaredzi.
Landscape vlaues varied markedly with landtypes for Muaredzi (nsitu and planice were highestin value, gombe and madimba intermediate, andthando and planalto of lowest value). Differencesfor Nhanchururu were less marked, with planaltoand planicie receiving very similar scores, andbaixa only a little lower. For both sites, therewas surprisingly little variation from one land typeto the next in terms of mean numbers of resourcesper sample (range=5.0 for chipale to 6.7 forplanicie for Muaredzi, and for Nhanchururu 9.3in planicie to 11.0 in montanhas).
Differences in resource scores and landscapevalues between recorders are to be expected, inthat different recorders were sampling in differentlocalities. Nevertheless, there is some evidenceof enumerator bias, but more in terms of scoresgiven to resources rather than the presence orabsence of resources. The variations betweenrecorders are greater for Nhanchururu, where therecorders were less experienced
5) Confronting the models with reality
Both models were confronted with theinformation that was collected by the fieldteams. The data sheets were used to generatecase files that were then used to explore thedegree to which the models accurately predictedwhat was found in the real world. Thereafterthe case files were used to update the models.In this section the results of confronting theBBN’s with field data are presented. We startwith presentations of the confrontations for eachsite and then explore the implications of mergingthe two data sets to generate a broader andmore general understanding.
a) Mauredzi
The score that local people assigned to eachsampling location in the Mauredzi site waspositively correlated with the number ofresources found in that site (Figure 12). Althoughnot a strong relationship (Pearson correlationcoefficient r=0.495, n=75) the positiverelationship was consistent with expectations.
A similar positive relationship was observedbetween the local valuation score and the totalbenefits score that was estimated using a sim-ple summation of the scores that were allocatedto each resource at a site (Figure 13; Pearson’scorrelation coefficient r=0.628, n=75).
Figure 12. Correlation between the total number of goods at a samplelocation (NUMGOODS) and the valuation score (SCORE) given to thatlocation for Muaredzi (Pearson correlation coefficient r=0.495, n=75).
Figure 13. Correlation between the natural log of the total benefitscore at a sample location (LNGOODTOT) and the natural logarithmof the local valuation score (LNSCORE) given to that location forMuaredzi (Pearson correlation coefficient r=0.628, n=75).
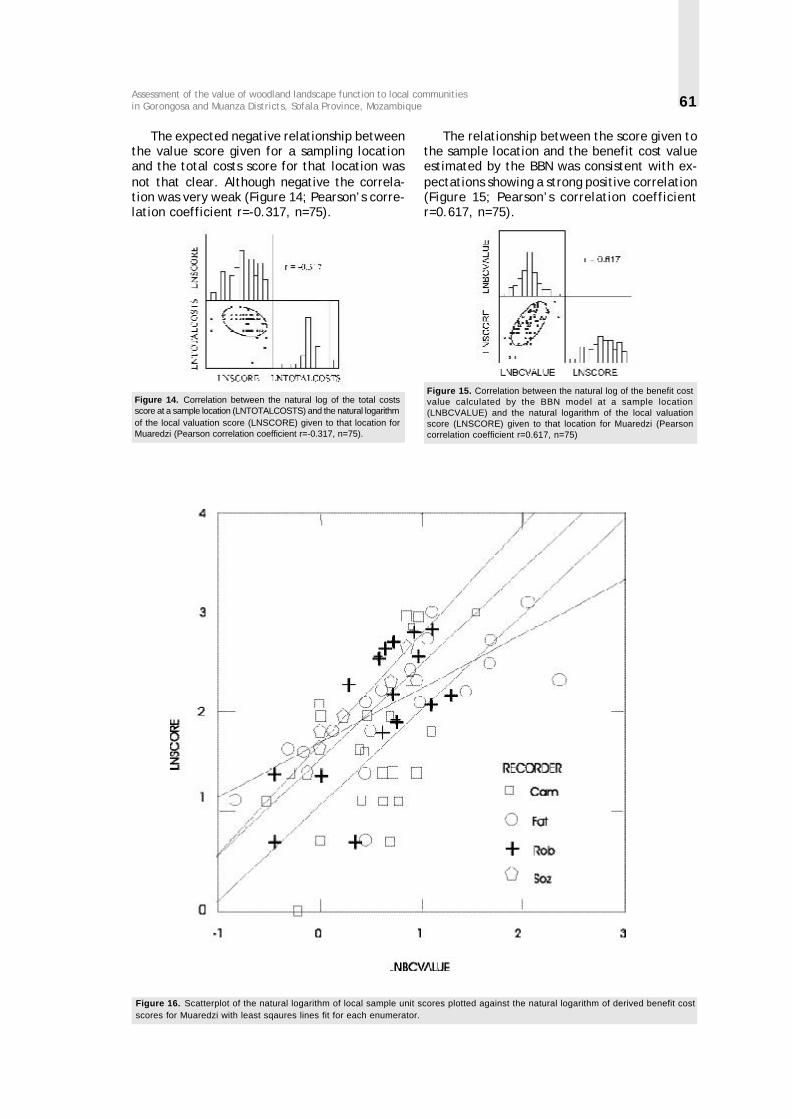
61Assessment of the value of woodland landscape function to local communitiesin Gorongosa and Muanza Districts, Sofala Province, Mozambique
Figure 16. Scatterplot of the natural logarithm of local sample unit scores plotted against the natural logarithm of derived benefit costscores for Muaredzi with least sqaures lines fit for each enumerator.
The expected negative relationship betweenthe value score given for a sampling locationand the total costs score for that location wasnot that clear. Although negative the correla-tion was very weak (Figure 14; Pearson’s corre-lation coefficient r=-0.317, n=75).
The relationship between the score given tothe sample location and the benefit cost valueestimated by the BBN was consistent with ex-pectations showing a strong positive correlation(Figure 15; Pearson’s correlation coefficientr=0.617, n=75).
Figure 14. Correlation between the natural log of the total costsscore at a sample location (LNTOTALCOSTS) and the natural logarithmof the local valuation score (LNSCORE) given to that location forMuaredzi (Pearson correlation coefficient r=-0.317, n=75).
Figure 15. Correlation between the natural log of the benefit costvalue calculated by the BBN model at a sample location(LNBCVALUE) and the natural logarithm of the local valuationscore (LNSCORE) given to that location for Muaredzi (Pearsoncorrelation coefficient r=0.617, n=75)

62 Tim Lynam, Rob Cunliffe, Isaac Mapaure and Isau Bwerinofa
It would appear that a good deal of the noisein the relationship between local scores and othervariables is attributable to differences in thescores for locations that were generated by groupsworking with specific enumerators. In figure 16the correlation between the scores and benefitvalues generated by each enumerator are shown.
When the Muaredzi prior model was testedusing the Muaredzi field data the error rate whenthe predicted benefit cost value was comparedwith the actual benefit cost value was 46.67%(Table 58). One would expect the predicted andactual values to lie along the diagonal from topleft to bottom right of the table. Overall the modelappears to be predicting slightly lower values thanwere found in the field.
The relationship between the score given tothe sample location and the benefit cost valueestimated by the BBN was consistent withexpectations but the relationship was muchweaker than expected (Pearson’s correlationcoefficient r=0.416, n=82). However when thethree outlier samples that were placed within theboundary of Gorongosa National Park were removedthe correlation was greatly improved and strongerthan the Muaredzi relationship (Figure 20;Pearson’s correlation coefficient r=0.727, n=79).
The performances of individual CRUATsubgroups were quite varied. In general, thecorrelation’s between local valuations and themodel estimates of value were reasonable butvaried greatly across groups (Pearson correlationco-efficient varied from 0.5 to 0.9).
More worrying for the method and approachwas the variation in the relationships for eachsubgroup (Figure 21). Different subgroupsappeared to be using different baselines (a in
b) Nhanchururu
The score that local people assigned to eachsampling location in the Nhanchururu site waspositively correlated with the number of resourcesfound in that site (Figure 17) but the relationshipwas weak (Pearson correlation coefficientr=0.362, n=82) the positive relationship washowever, consistent with expectations.
The expected negative relationship betweenthe value score given for a sampling location andthe total costs score for that location was evidentbut very weak (Figure 19; Pearson’s correlationcoefficient r=-0.252, n=82).
Figure 19. Correlation between the natural log of the total costsscore at a sample location (LNTOTALCOSTS) and the natural logarithmof the local valuation score (LNSCORE) given to that location forNhanchururu (Pearson correlation coefficient r=-0.252, n=82).
Figure 17. Correlation between the total number of goods at asample location (NUMGOODS) and the valuation score (SCORE)given to that location for Nhanchururu (Pearson correlationcoefficient r=0.362, n=82).
A weak positive relationship was observedbetween the local valuation score and the totalbenefits score that was estimated using a simplesummation of the scores that were allocated toeach resource at a site (Figure 18; Pearson’scorrelation coefficient r=0.355, n=82). Thisrelationship was weaker than expected and muchweaker than the relationship found in Muaredzi.
Figure 18. Correlation between the natural log of the total benefitscore at a sample location (LNTOTALBENEF) and the natural logarithmof the local valuation score (LNSCORE) given to that location forNhanchururu (Pearson correlation coefficient r=0.355, n=82).
Table 58. Confusion matrix for the Muaredzi modelwhen confronted with field data.
Predicted BC state Actual BC state
0 1.67 3.33 56 3.00 0.00 0 0.00
13 32.00 0.00 3 1.671 11.00 2.00 4 3.330 0.00 0.00 0 5.00
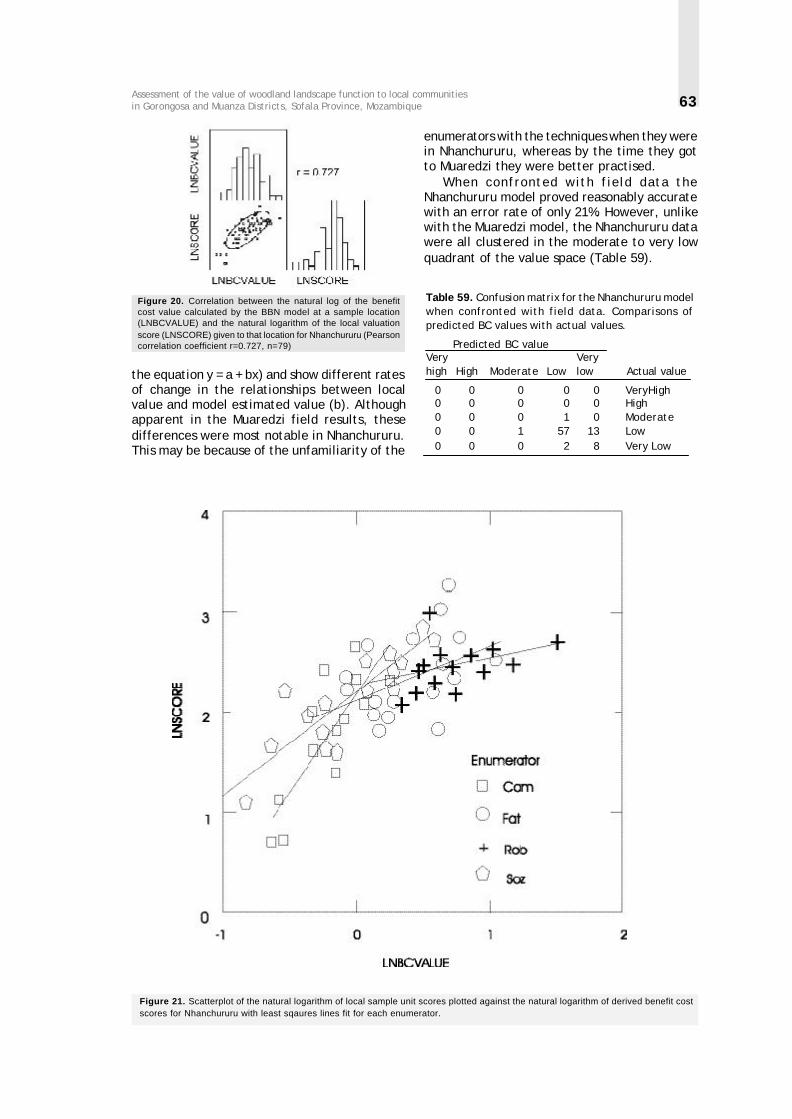
63Assessment of the value of woodland landscape function to local communitiesin Gorongosa and Muanza Districts, Sofala Province, Mozambique
Figure 21. Scatterplot of the natural logarithm of local sample unit scores plotted against the natural logarithm of derived benefit costscores for Nhanchururu with least sqaures lines fit for each enumerator.
the equation y = a + bx) and show different ratesof change in the relationships between localvalue and model estimated value (b). Althoughapparent in the Muaredzi field results, thesedifferences were most notable in Nhanchururu.This may be because of the unfamiliarity of the
enumerators with the techniques when they werein Nhanchururu, whereas by the time they gotto Muaredzi they were better practised.
When confronted with field data theNhanchururu model proved reasonably accuratewith an error rate of only 21%. However, unlikewith the Muaredzi model, the Nhanchururu datawere all clustered in the moderate to very lowquadrant of the value space (Table 59).
Figure 20. Correlation between the natural log of the benefitcost value calculated by the BBN model at a sample location(LNBCVALUE) and the natural logarithm of the local valuationscore (LNSCORE) given to that location for Nhanchururu (Pearsoncorrelation coefficient r=0.727, n=79)
Table 59. Confusion matrix for the Nhanchururu modelwhen confronted with field data. Comparisons ofpredicted BC values with actual values.
Predicted BC valueVery Veryhigh High Moderate Low low Actual value
0 0 0 0 0 VeryHigh0 0 0 0 0 High0 0 0 1 0 Moderate0 0 1 57 13 Low0 0 0 2 8 Very Low

64 Tim Lynam, Rob Cunliffe, Isaac Mapaure and Isau Bwerinofa
Thus despite the inadequacies of the modelsand the methods used for collecting the local valuedata the models and field data collectionprocedures produced encouraging results.
It is clear that the local valuation results arestrongly, positively related to the benefit streamsthat local people derive from a given location andless strongly related to the costs of procuring thesebenefits. Although the latter are of the expectednegative relationship they were weak and notuseful in predicting ultimate value of a given
location. It is likely that we could improve ourmethods of estimating costs, perhaps throughallocating separate cost relationships to eachbenefit rather than to a location as a whole.However, the strong relationships between thevalue given and the benefit streams suggest thatin many cases the local value of a landscapelocation could be usefully predicted through simplesummations of the benefit streams likely to bederived from that location.
65
III. Vegetation inventoryand assessments
A. Approach and methodsInterpretation of Landsat images (Scene 167/73;22 August 1999) and aerial photographs was doneby carefully examining paper copies of the Landsatimage and aerial photographs, as well as on-screeninterpretation of the image. The study areas wereinitially demarcated on the image to form a 10x10km square but were revised according toboundaries indicated by communities in therespective areas. Image and aerial photographinterpretation resulted in the production ofpreliminary vegetation associations evident fromdifferences in colour and texture on the aerialphotographs and images. This formed the basisupon which the vegetation was stratified andenabled sampling within each vegetation stratum.Fieldwork was carried out in the Muaredzi areabetween 3 and 14 September 2001, and between6 and 18 May 2002 in Nhanchururu area. Ground-truthing of vegetation boundaries and furtherassessments were done between 8 and 19 April2002 in Muaredzi area. The ground-truthingexercise was deemed unnecessary for Nhanchururubecause of the simplicity of the mapping units.
1. Vegetation survey
a) Muaredzi
Four main transects covering the area wereidentified according to the directions of the main
access roads. Taking the Rangers’ Post as areference point, these were: the track towardsthe confluence of the Urema and Muaredzi rivers(western direction); the road towards Goinhavillage (northern direction); the road towardsMuanza town (eastern direction); and the roadtowards the Urema crossing to Chitengo(southern direction). In addition, a number ofsmaller access tracks were followed but muchof the inventory was done along the main roads.The positioning of the roads seemed toadequately cover much of the variation in thevegetation evident on the Landsat image.
b) Nhanchururu
In Nhanchururu, there was better access toplaces compared to Muredzi. The former site,due to the widely scattered homesteads, hadmore tracks and paths ramifying the area,allowing better access to sample areas. A numberof these paths were followed and assessmentsof vegetation done.
c) Inventory procedure
For both sites, a plot-less sampling proceduresimilar to that of Timberlake et al. (1993) wasfollowed when inventorying the vegetation. Siteswere selected within the stratified zonesaccording to how representative they were ofthe vegetation type under consideration. At each

66 Tim Lynam, Rob Cunliffe, Isaac Mapaure and Isau Bwerinofa
site, a starting point was randomly selected anda circular area covered around this central point,recording all plant species until no new specieswere encountered within the defined area, whichwas usually between 0.25 and 0.5 ha., dependingon species richness. This approach follows theconcept of the species-area curve (Connor andMcCoy, 1979), which ensures that an adequatearea to record all species is sampled. Care wastaken to avoid roadside margins and to ensurethat no obvious environmental boundaries weretraversed to avoid straying into differentvegetation units. A cover abundance value foreach species was estimated according to theBraun-Blanquet scale (Mueller-Dombois andEllenberg, 1974). Average heights of the canopy,sub-canopy, shrub and grass layers wereestimated and the dominant species noted.Forty-seven sample points (including 9 ontermite mounds) were inventoried in Muaredziwhile 50 sample points (including 5 on termitemounds) were inventoried in Nhanchururu. Inaddition, notes were taken at various otherpoints in the two sites. The location of eachsample point was entered onto a globalpositioning system (Appendix 5).
2. Assessment of explanatoryvariables
A number of explanatory variables were assessedas follows: Assessments of soil colour, texture,surface capping, land-use, grazing intensity(none, light, heavy, overgrazed), and vegetationcondition (undisturbed, disturbed or degraded)were done. Any evidence of previous fires wasalso recorded. Evidence of fire occurrence wastaken from the presence of charred stems andburnt stumps of trees.
3. Data analyses
Hierarchical Cluster Analysis (HCA) usingaverage linkage method (van Tongeren, 1995)was performed on a matrix of 47 plots by 228species for Muredzi, and a matrix of 50 plots by246 species for Nhanchururu, using speciescover-abundance data. This was done to producea classification of the vegetation based onfloristic and structural similarities/dissimilarities among them. HCA was performedusing MINITAB version 13.1 statistical software(Minitab Inc., 2000). Detrended CorrespondenceAnalysis (DCA) (ter Braak, 1986; 1995, Gauch,1982), an indirect gradient analysis technique,was performed on species cover abundance datato elucidate relationships amongst the variousplant associations and underlying environmentalgradients. CANOCO Version 4 for Windows
package (ter Braak, 1988; ter Braak, 1991; terBraak and Smilauer, 1997) was used for thisanalysis. CANODRAW package, available inCANOCO, was used to calculate the Shannondiversity and richness indices (Ludwig andReynolds, 1988; Magurran, 1988) for eachinventoried site. The absolute richness valuesfor each site were calculated as the total numberof species recorded at the site.
The conservation importance value (CIV) foreach map unit was calculated by multiplying therelative abundance value of the unit (RAV) byits mean diversity index (MDI), and then weight-ing the value obtained through multiplying bythe relative proportion of unique/importantplant species found within the unit (RPspp).Thus CIV=RAV*MDI*RPspp. The relative abun-dance value for each map unit was calculatedusing the formula RAV = 1-(map unit area/to-tal area). The total area excluded water bod-ies. This approach is justified since the smallerthe area, the higher the priority for conserva-tion (Timberlake et al. 1991). The MDI com-prises the mean diversity value for all the sitesthat make up each unit. Use of the MDI alonein the calculation of the conservation impor-tance values is justified, on the basis that thediversity index takes into account both speciesrichness and evenness (Magurran, 1988). Thenumber of important species was expressed ona scale of 1-5, where no important species=1;1-2 species=2; 3-4 species=3; 5-6 species=4;and >6 species=5. RPspp scores for each unitwere derived through dividing the scale value(1-5) by the highest scale value (5). Finally,standardized conservation values were calcu-lated for each unit by dividing the CIV by thehighest CIV, thus giving values between zeroand one. Water or river systems were arbitrar-ily assigned conservation values of 0.0001.
B. Results
1. Muaredzi
a) Vegetation types
Much of the vegetation falls within two of the fivebroad physiographic units categorised by Tinley(1977) along his idealised Gorongosa-Cheringomatransect. The physiographic units found within thestudy area are the Midlands and Rift Valley withinwhich Tinley (1977) identified various types offorest, thicket and scrub-thicket, savanna,rockfaces, grassland and freshwater systems.Similarities to some of Tinley’s (1977) vegetationtypes are noted in the descriptions below.Physiognomic classes used in this report followPratt et al. (1966).

67Assessment of the value of woodland landscape function to local communitiesin Gorongosa and Muanza Districts, Sofala Province, Mozambique
b) Vegetation classification
Four broad categories of vegetation communi-ties were identified, each of which comprisesone or more vegetation types. The HierarchicalCluster Analysis separated the vegetation into13 vegetation types (Figure 22) based onfloristic composition and cover abundance.These are described below.
A: FORESTS AND THICKETSA1: Millettia stuhlmannii mixed dry forest,
Two patches of dry forest dominated by Millettiastuhlmannii were identified at the base of theescarpment along the road to Muanza. These arewhat local communities refer to as Nsitu. It ispossible that more patches could occur on similarsites within the area. They are structurally similarto the dry forests often referred to as ‘jessethickets’ or dry layered forests in Zimbabwe(Timberlake et al. 1993). The dry forests describedby Tinley (1977) are different from the onesoccurring in the area. The dry forests occur onsandy soils and depict distinctive verticalstratification of the canopy, sub-canopy and shrublayers. There are very few grasses in the forest.
Total woody cover is 90-100%. The uppercanopy trees reach up to 20m, the sub-canopy isabout 10m and shrubs are more than 3m in height.Other common trees in the canopy layer areAfzelia quanzensis, Guibourtia conjugata andDiospyros mespiliformis. The sub-canopy layer isdominated by Cleistoclamys kirkii,Tabernaemontana elegans and Strychnoshenningsii . Common shrubs are Dovyalismacrocalyx, Alchornea laxiflora, Tricalysiajasminiflora, Diospyros senensis and Grewiasulcata. Occasional thickets of Combretumpisoniiflorum, Artabotrys brachypetalus ,Hippocratea africana and Acacia schweinfurthianaare scattered within the forest. Large termitariaare common in the dry forests, supportingvegetation described below as type A3.
A2: Spirostachys africana mixed dry forest,A number of small patches of dry forestsdominated by Spirostachys africana are foundalong the roads to the Urema crossing and toGoinha village. They occur on grey sandy clayloams on raised ground. Total woody cover isbetween 80 and 90%. The vegetation is very thickin places with virtually no grass layer and exhibitsclear vertical stratification of the tree and shrublayers. Emergent trees reach up to 15 m but thegeneral canopy height is about 8 m while shrubsare generally 2-3m in height. Other common treesinclude Afzelia quanzensis , Xeroderrisstuhlmannii, Dalbergia melanoxylon and Diospyrosmespiliformis. The shrub layer is dominated byRhus dentata, Dichrostachys cinerea, Diospyros
senensis and Deinbolia xanthocarpa. A number ofclimbers or scandent plants occur, includingCombretum pisoniiflorum, Cissus quadrangularis ,Combretum mossambicense, Capparis tomentosaand Artabotrys brachypetalus. Termitaria arecommon in this vegetation type, supporting avegetation type described in A3 below.
A3: Mixed Cleistoclamys kirkii woodland-thickets , Tinley (1977) emphasised theimportance of termitaria in most vegetation typeswithin the Rift valley. Local communities alsorecognise their importance and specifically singleout murmuchea (termite mounds) as an importantland unit. Termitaria are a common feature withinvegetation types A1 and A2, but are also scatteredin the type B woodlands. They support woodland-thickets of slightly different species compositionand structure from the rest of the dry forestproper. There are also slight differences in thecomposition of the woodland-thickets between thetwo dry forest types, A1 and A2. The vegetationis of mixed dominance but Cleistoclamys kirkii isa common dominant on almost all inventoriedtermitaria. Tamarindus indica is also common ontermitaria in vegetation type A2. Other commontrees include Trichilia capitata , Diospyrosmespiliformis, Xeroderris stuhlmanii, Berchemiadiscolor, Ziziphus mucronata , and Lanneaschweinfurthiana, among others. The sub-canopylayer is usually dominated by Deinboliaxanthocarpa, Tricalysia jasminiflora, Markhamiazanzibarica, Rhus gueinzii and Diospyros senensis .Caparris tomentosa, Combretum mossambicense,Tiliacora funifera, Jasminum fluminense andCissus quadrangularis sometimes form moreclosed associations on the termite mounds. Thereare virtually no grasses in the woodland-thickets.
B: WOODLANDSB1: Julbernardia globiflora-Brachystegia
spiciformis (miombo) woodland , Miombowoodland dominated by Julbernardia globifloraand Brachystegia spiciformis is found on theescarpment in the eastern part of the study area.This land type was identified as planalto by localcommunities, and is a distinct landscape markedlydifferent from the Rift Valley. This vegetation typeis more extensive outside the study site, especiallyalong the road to Muanza. It comprises tall treesof up to 14m in height and occurs on brown sandyclay loams. Total woody cover is between 70-80%.It is a well-structured woodland with clearstratification of the tree, shrub and grass layers.The sub-canopy layer is composed of a wide rangeof tree species including Diplorhynchuscondylocarpon, Stereospermum kunthianum,Pterocarpus rotundifolius and Combretumzeyheri. Dichrostachys cinerea, Ximenia caffra,Pterocarpus brenanii, Dalbergia melanoxylon and

68 Tim Lynam, Rob Cunliffe, Isaac Mapaure and Isau Bwerinofa
Figure 22. Hierarchical Cluster Analysis dendrogram showing a classification of the vegetation of Muaredzi area, based on 47 (1-47)sample points inventoried.
Lippia javanica are common in the shrub layer.Grass cover is sparse, due to the dense woodland,where Hypathelia sp. and Heteropogonmelanocarpus are prominent.
B2: Combretum adenogonium-Sclerocaryabirrea mixed woodland, The most extensive veg-etation type found in the study area is dominatedby Combretum adenogonium and Sclerocaryabirrea. The latter species occurs mainly asemergents while the former species are the maincanopy trees. Although Combretum adenogoniumis the dominant species in most places, local vari-ations in the co-dominant tree species are evi-dent. Total woody cover varies considerably fromone locality to another, ranging between 50% and70%. Emergent trees are generally between 15 and18m in height, while the main canopy is generallyaround 8m high. Average height of the shrub layeris between 2 and 3m. The vegetation type occurson dark brown sandy clay loams and sandy clayson undulating terrain but sometimes on flat landin the planicie land type. Common trees includeZiziphus abyssinica, Combretum zeyheri, Acaciasp., Pteleopsis myrtifolia and Acacia nigrescens.The shrub layer is usually thick, dominated byTricalysia jasminiflora , Rhus gueinzii and Grewiasulcata, and is complemented by dense grass coverdominated by Heteropogon melanocarpus andHypathelia species. This vegetation type has highspecies richness, with some sites registering upto 50 species.
B3: Acacia polyacantha -Piliostigmathonningii mixed woodland, This woodlandoccurs in a number of limited areas. Exemplarypatches are found around Muaredzi village. It isdominated by Acacia polyacantha and Piliostigmathonningii and occurs on heavy clay soils in theplanicie. It grades into Setaria incrassata woodedgrassland. There are local variations in species
composition but the dominants remain relativelyunchanged. Total woody cover is around 60%. Thecanopy is generally low (about 8m tall) butemergent trees (especially Acacia polyacantha)may reach up to 12m. Other tree species oftenencountered include Combretum adenogonium,Sclerocarya birrea, Combretum imberbe andHyphaene petersiana. Shrubs are generally 2-3min height and comprise mainly young Sclerocaryabirrea, Hyphaene petersiana , Piliostigmathonningii and Combretum imberbe. The grasslayer is dominated by Setaria incrassata. Much ofthis vegetation type around Muaredzi village iscurrently being cleared for cultivation.
B4: Hyphaene petersiana -Salvadora persicaopen woodland, Along the fringes of somegrassland areas in the thando land type, occurs awoodland dominated by Hyphaene petersiana andSalvadora persica. Soils, which are grey sandy clayloams, are apparently salty as evidenced by thedominance of Salvadora persica (Aronson, 1989).It is an open woodland with a total woody coverof between 20 and 30%. The woody vegetationlargely occurs in localised clumps, withwidespread open areas supporting a short grasssward. The open areas are heavily utilised bywarthog. Tree canopy height is less than 6m butoccasional Acacia trees are taller than this. Othercommon species are Acacia xanthophloea,Lonchocarpus capassa, Flueggia virosa and Eucleanatalensis . Capparis tomentosa forms a layer overmost of the clumps of trees and shrubs. The maingrass, which is heavily grazed by warthog, isEriochloa stapfiana, while Panicum maximum isfound under the clumps of vegetation.
B5: Combretum zeyheri-Acacia karroomixed woodland, This vegetation type isdominated by Combretum zeyheri and Acaciakarroo, and exhibits a wide mixture of species.
69Assessment of the value of woodland landscape function to local communitiesin Gorongosa and Muanza Districts, Sofala Province, Mozambique
It comprises species found in Combretum-domi-nated woodlands of the rift valley and those foundin the miombo woodlands on the escarpment. Itoccurs on light-textured loamy soils in bothplanalto and planicie. It is an open woodland withtotal woody cover of up to 60%. Scatteredtermitaria, supporting clumps of evergreen andsemi-evergreen species, are found in places. Talltrees reach up to 14m in height but the canopylayer is generally between 8 and 10m. Other com-mon trees include Combretum adenogonium,Piliostigma thonningii, Commiphora africana,Diplorhynchus condylocarpon, Pericopsisangolensis , Pterocarpus rotundifolius andErythroxylum zambesiacum. The shrub layer issparse and dominated by Tricalysia jasminiflora,Bauhinia galpinii, Maytenus senegalensis andAcacia karroo. Aristida junciformis andHeteropogon contortus are the dominant grasses.
B6: Mixed riverine woodland, Riverine wood-land, of mixed dominance, extends from theMillettia stuhlmannii dry forests to higher alti-tudes into the miombo woodlands. It occurs alongone or two major seasonal rivers, and covers asizeable belt of up to 40m on either side of theriver channels. Woody cover is about 70-80%. Theupper canopy layer rises to about 14m, while thesub-canopy is up to 10m. Shrubs are up to 3mtall, while the grass layer is poorly developed andsometimes non-existent. Dominant tree speciesare Manilkara mochisia, Strychnos henningsii,Diospyros mespiliformis and Strychnosmadagascariensis. Other common trees includeTeclea nobilis, Spirostachys africana, Dovyalis lu-cida and Millettia stuhlmannii. Common shrubsare Grewia sulcata, Ehretia obtusifolia, Eucleadivinorum, Dalbergia melanoxylon and Tricalysiajasminiflora
C: FLOODPLAIN VEGETATIONThe C-vegetation types, described below, occur inthe thando, planicie, madimba and gombe landtypes.
C1: Phragmites mauritianus reed commu-nities, This vegetation type is dominated byPhragmites mauritianus reeds. It forms a narrowfringe (usually <10m wide) along the banks of theUrema and Muaredzi rivers. It occurs on a vari-ety of soil types, ranging from coarse sandy soilsin parts of Muaredzi riverbed to black heavy claysin some sections of the Urema. Few scatteredtrees also grow within and close to the reed com-munities. These include Acacia sieberiana,Antidesma venosum, Acacia xanthophloea andCombretum imberbe. Total woody cover is lessthan 1%. Eichorrnia crassipes is found floating onthe water in some sections of Urema River. Themain grasses associated with this vegetation typeare Setaria incrassata and Echinochloa haploclada.
C2: Echinochloa haploclada grassland, Thisgrassland is dominated by Echinochloa hapocladaand is mainly found in the flood zone of lakeUrema. It is an extensive grassland forming thick,deep mats getting to almost knee-height. Soilsare black alluvial clays. Few scattered shrubs ofSesbania sesban and Mimosa pigra occur in someplaces, attaining a total woody cover of less than1%. Occasional Faidherbia albida trees andHyphaene petersiana shrubs occur at the fringesof the grassland where it grades into the Setariaincrassata wooded grassland (C3).
C3: Setaria incrassata wooded grassland,An extensive wooded grassland dominated bySetaria incrassata occurs in low-lying areas. Theseareas become waterlogged during the rainyseason, resulting in the death of some grasstussocks as evidenced in the area close to theMuaredzi-Urema confluence. Soils are heavy, blackloamy clays of alluvial origin and crack during thedry season. Grass height is >2m. This vegetationtype forms almost pure grassland in wetter areasbut the woody component becomes significant onbetter-drained soils. Total woody cover is less than5%. Common trees, some of which reach up to20m in height, include Combretum imberbe,Faidherbia albida, Acacia sieberiana, Acaciaxanthophloea and Kigelia africana. Common,scattered shrubs (up to 3m in height) areAntidesma venosum, Hyphaene petersiana andMimosa pigra.
D: FALLOW LAND VEGETATIOND1: Lippia javanica -Piliostigma thonningii
mixed shrubland, This vegetation type is foundon fallow lands of various ages. It is largely ashrubland dominated by Lippia javanica andPiliostigma thonningii. Species composition variesconsiderably due to both the age of fallow and theinitial composition before the land was cleared.The structure tends towards a woodland on olderfallows, which are characterised by even-aged treesof Piliostigma thonningii and Acacia polyacantha.Tall trees (about 12m in height) are scatteredthroughout the shrubland. These trees arepresumably remnants of the original woodlandbefore clearing. Shrubs are generally 2-3m inheight on young fallows but the canopy reaches upto 8m on older fallows. Other common trees areSclerocarya birrea, Kigelia africana and Acaciaxanthophloea. The shrub layer is usually thick withoccasional thickets of Combretum microphyllum.Other common shrubs include Solanum incanum,Cajanus cajan (cultivated), Hyphaene petersiana,Ocimum canum, Senna singueana, Cassia sp. andOzoroa obovata. The grass layer is somewhatsparse but tall, with Panicum maximum and Setariaincrassata dominant. Roettboelia cochinchinensisis widespread in the younger fallows.

70 Tim Lynam, Rob Cunliffe, Isaac Mapaure and Isau Bwerinofa
c) Mapping units
The vegetation map (Figure 23) presents sixmapping units (MMU1-MMU6), and a seventh oneindicating fresh water (MMU7). It was not possibleto map each vegetation type due to the scale ofpresentation, given that some of the types onlycover very limited areas. Each mapping unit,therefore, consists of a number of vegetationtypes as indicated in Table 60 below.
d) Main gradients in vegetation composition andstructure
Detrended Correspondence Analysis shows moreseparation of the plots along axis 1 than alongaxis 2 (Figure 24). These two axes accounted for92.2% and 56.9%, respectively, of the variation in
species data. Separation of the plots is such thatthe floodplain vegetation (C1, C2, C3) is found tothe left of the diagram and the forests (A1, A2,A3) to the extreme right. Separation along axis 2distinguishes Phragmites mauritianus reedcommunities (C1) and Echinocloa haplocladagrassland (C2) from each other and from the othervegetation types.
e) Species richness, diversity and conservationimportance ranks of vegetation mapping units
The total number of species recorded in the areawas 228. The Shannon diversity indices indicatevery low mean diversity in the grassland andPhragmites mauritianus reed communities andhigher diversity in Combretum adenogoniun-Sclerocarya birrea-Acacia types and the dry
Figure 23. Vegetation map of Muaredzi. See text and Table 60 for descriptions of mapping units, mmu1 to mmu7.

71Assessment of the value of woodland landscape function to local communitiesin Gorongosa and Muanza Districts, Sofala Province, Mozambique
Figure 24. DCA ordination diagram indicating a scatter of inventoried sites in Muaredzi, conforming to a perceived soil moisture gradient.
forests. Richness indices follow a similar pattern(Table 61). Generally, richness was significantlyhigher in woodlands and dry forests than in woodedgrasslands, grasslands and reed communities(F=5.67, p<0.001). Diversity was also significantlylower in type C vegetation than in the othervegetation types (F=16.17, p<0.001).
Based on the diversity indices above (Table 61)and the relative abundance of the vegetation types,the standardized conservation importance indicesof the mapping units are shown in Table 62 below.Important species (cited in the Mozambique RedData List (SABONET, 2001)) identified in the areaare Afzelia qaunzensis (low risk), Colamossambicensis (near endemic, vulnerable),Dalbergia melanoxylon (threatened), Diospyrosmespiliformis (threatened), Guibourtia conjugata(threatened), Spirostachys africana (threatened),and Sterculia quinqueloba (vulnerable). The Mixeddry forests and thickets (MMU6) have the highestcalculated conservation value, mainly due to theirlimited extent and the existence of a highernumber of important species, while the Echinocloahaploclada-Phragmites mauritianus communites
(MMU1) have the lowest calculated conservationvalue because they have low diversity and noimportant species.
2. Nhanchururu
a) Vegetation types
Much of the vegetation falls within Tinley’s (1977)moist Brachystegia savanna woodlands within theMidlands physiognomic unit. Physiognomic classesused in the following descriptions follow Pratt etal. (1966).
b) Vegetation classification
The Hierarchical Cluster Analysis separated thevegetation into five vegetation types (A1, A2, B1,B2 and C1) (Figure 25) based on floristiccomposition and cover abundance. One of thetypes (A1) comprises three sub-types (A1a, A1band A1c). The vegetation types, though mainlywoodlands and woodland-thickets, includecultivated land.
Table 60. Descriptions of the mapping units used in the vegetation map of Muaredzi (MMU=Muaredzi Mapping Unit).
Mapping unit Description Vegetation types
MMU1 Echinochloa haploclada-Phragmites mauritianus communities C1, C2MMU2 Setaria incrassata-Hyphaene patersiana communities B4, C3MMU3 Combretum adenogonium-Sclerocarya birrea-Acacia complexes B2, B3, D1MMU4 Julbernardia globiflora-Brachystegia spiciformis woodlands B1MMU5 Combretum zeyheri-Acacia complexes B5, B6MMU6 Mixed dry forests and thickets A1, A2, A3MMU7 Fresh water Urema river
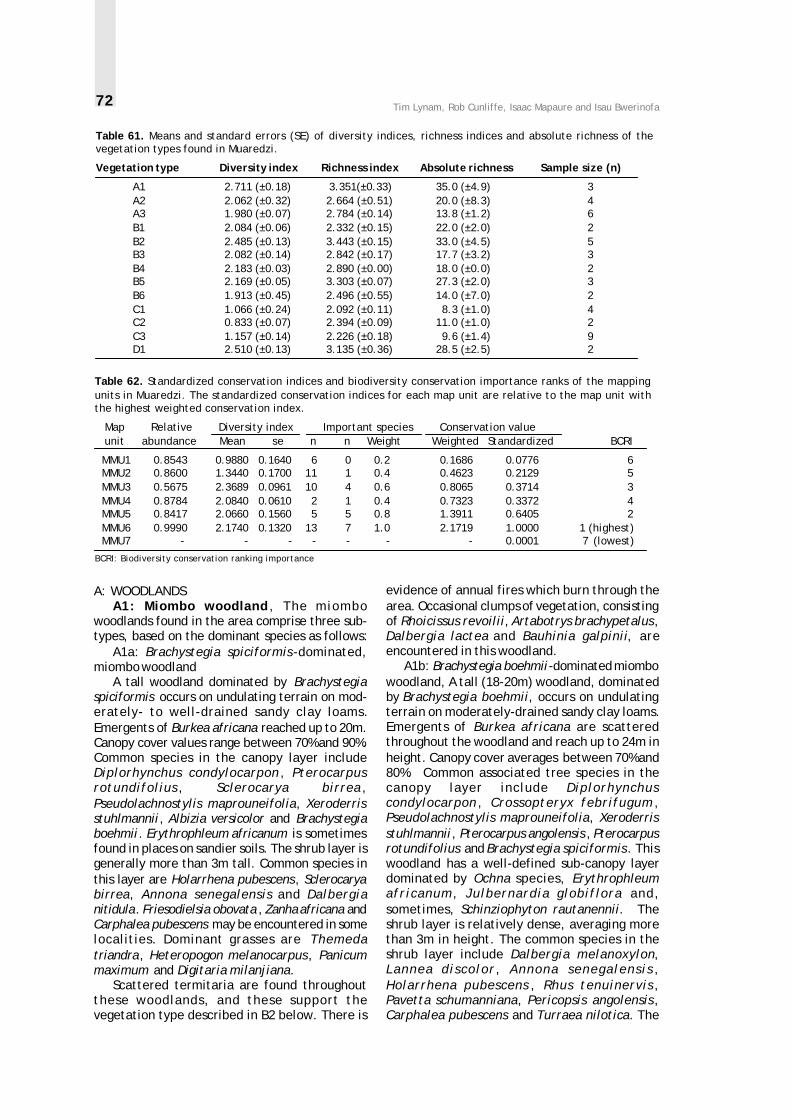
72 Tim Lynam, Rob Cunliffe, Isaac Mapaure and Isau Bwerinofa
Table 61. Means and standard errors (SE) of diversity indices, richness indices and absolute richness of thevegetation types found in Muaredzi.
Vegetation type Diversity index Richness index Absolute richness Sample size (n)
A1 2.711 (±0.18) 3.351(±0.33) 35.0 (±4.9) 3A2 2.062 (±0.32) 2.664 (±0.51) 20.0 (±8.3) 4A3 1.980 (±0.07) 2.784 (±0.14) 13.8 (±1.2) 6B1 2.084 (±0.06) 2.332 (±0.15) 22.0 (±2.0) 2B2 2.485 (±0.13) 3.443 (±0.15) 33.0 (±4.5) 5B3 2.082 (±0.14) 2.842 (±0.17) 17.7 (±3.2) 3B4 2.183 (±0.03) 2.890 (±0.00) 18.0 (±0.0) 2B5 2.169 (±0.05) 3.303 (±0.07) 27.3 (±2.0) 3B6 1.913 (±0.45) 2.496 (±0.55) 14.0 (±7.0) 2C1 1.066 (±0.24) 2.092 (±0.11) 8.3 (±1.0) 4C2 0.833 (±0.07) 2.394 (±0.09) 11.0 (±1.0) 2C3 1.157 (±0.14) 2.226 (±0.18) 9.6 (±1.4) 9D1 2.510 (±0.13) 3.135 (±0.36) 28.5 (±2.5) 2
A: WOODLANDSA1: Miombo woodland , The miombo
woodlands found in the area comprise three sub-types, based on the dominant species as follows:
A1a: Brachystegia spiciformis-dominated,miombo woodland
A tall woodland dominated by Brachystegiaspiciformis occurs on undulating terrain on mod-erately- to well-drained sandy clay loams.Emergents of Burkea africana reached up to 20m.Canopy cover values range between 70% and 90%.Common species in the canopy layer includeDiplorhynchus condylocarpon , Pterocarpusrotundifolius , Sclerocarya birrea ,Pseudolachnostylis maprouneifolia, Xeroderrisstuhlmannii, Albizia versicolor and Brachystegiaboehmii. Erythrophleum africanum is sometimesfound in places on sandier soils. The shrub layer isgenerally more than 3m tall. Common species inthis layer are Holarrhena pubescens, Sclerocaryabirrea, Annona senegalensis and Dalbergianitidula. Friesodielsia obovata , Zanha africana andCarphalea pubescens may be encountered in somelocalities. Dominant grasses are Themedatriandra, Heteropogon melanocarpus, Panicummaximum and Digitaria milanjiana.
Scattered termitaria are found throughoutthese woodlands, and these support thevegetation type described in B2 below. There is
evidence of annual fires which burn through thearea. Occasional clumps of vegetation, consistingof Rhoicissus revoilii, Artabotrys brachypetalus,Dalbergia lactea and Bauhinia galpinii, areencountered in this woodland.
A1b: Brachystegia boehmii-dominated miombowoodland, A tall (18-20m) woodland, dominatedby Brachystegia boehmii, occurs on undulatingterrain on moderately-drained sandy clay loams.Emergents of Burkea africana are scatteredthroughout the woodland and reach up to 24m inheight. Canopy cover averages between 70% and80%. Common associated tree species in thecanopy layer include Diplorhynchuscondylocarpon , Crossopteryx febrifugum ,Pseudolachnostylis maprouneifolia, Xeroderrisstuhlmannii, Pterocarpus angolensis , Pterocarpusrotundifolius and Brachystegia spiciformis. Thiswoodland has a well-defined sub-canopy layerdominated by Ochna species, Erythrophleumafricanum, Julbernardia globiflora and,sometimes, Schinziophyton rautanennii. Theshrub layer is relatively dense, averaging morethan 3m in height. The common species in theshrub layer include Dalbergia melanoxylon,Lannea discolor, Annona senegalensis ,Holarrhena pubescens , Rhus tenuinervis ,Pavetta schumanniana, Pericopsis angolensis,Carphalea pubescens and Turraea nilotica. The
Table 62. Standardized conservation indices and biodiversity conservation importance ranks of the mappingunits in Muaredzi. The standardized conservation indices for each map unit are relative to the map unit withthe highest weighted conservation index.
Map Relative Diversity index Important species Conservation value unit abundance Mean se n n Weight Weighted Standardized BCRI
MMU1 0.8543 0.9880 0.1640 6 0 0.2 0.1686 0.0776 6 MMU2 0.8600 1.3440 0.1700 11 1 0.4 0.4623 0.2129 5 MMU3 0.5675 2.3689 0.0961 10 4 0.6 0.8065 0.3714 3 MMU4 0.8784 2.0840 0.0610 2 1 0.4 0.7323 0.3372 4 MMU5 0.8417 2.0660 0.1560 5 5 0.8 1.3911 0.6405 2 MMU6 0.9990 2.1740 0.1320 13 7 1.0 2.1719 1.0000 1 (highest) MMU7 - - - - - - - 0.0001 7 (lowest)
BCRI: Biodiversity conservation ranking importance
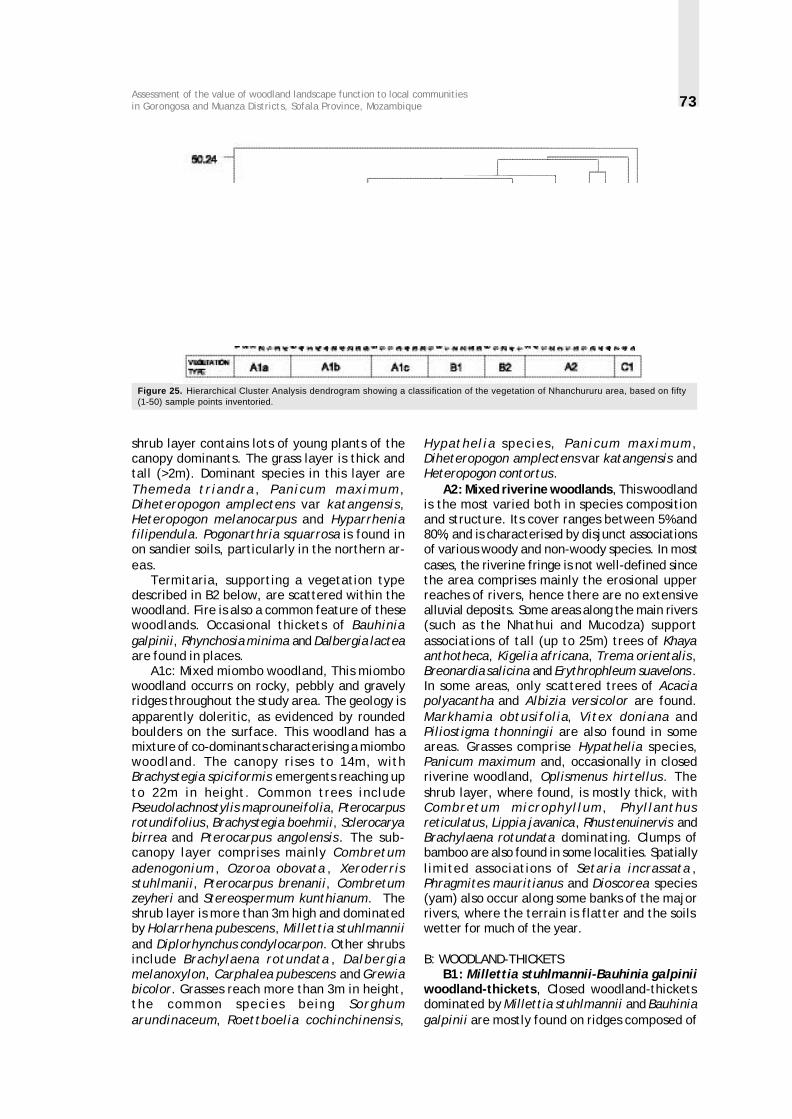
73Assessment of the value of woodland landscape function to local communitiesin Gorongosa and Muanza Districts, Sofala Province, Mozambique
shrub layer contains lots of young plants of thecanopy dominants. The grass layer is thick andtall (>2m). Dominant species in this layer areThemeda triandra , Panicum maximum,Diheteropogon amplectens var katangensis,Heteropogon melanocarpus and Hyparrheniafilipendula. Pogonarthria squarrosa is found inon sandier soils, particularly in the northern ar-eas.
Termitaria, supporting a vegetation typedescribed in B2 below, are scattered within thewoodland. Fire is also a common feature of thesewoodlands. Occasional thickets of Bauhiniagalpinii, Rhynchosia minima and Dalbergia lacteaare found in places.
A1c: Mixed miombo woodland, This miombowoodland occurrs on rocky, pebbly and gravelyridges throughout the study area. The geology isapparently doleritic, as evidenced by roundedboulders on the surface. This woodland has amixture of co-dominants characterising a miombowoodland. The canopy rises to 14m, withBrachystegia spiciformis emergents reaching upto 22m in height. Common trees includePseudolachnostylis maprouneifolia, Pterocarpusrotundifolius, Brachystegia boehmii, Sclerocaryabirrea and Pterocarpus angolensis. The sub-canopy layer comprises mainly Combretumadenogonium , Ozoroa obovata , Xeroderrisstuhlmanii, Pterocarpus brenanii, Combretumzeyheri and Stereospermum kunthianum. Theshrub layer is more than 3m high and dominatedby Holarrhena pubescens, Millettia stuhlmanniiand Diplorhynchus condylocarpon. Other shrubsinclude Brachylaena rotundata , Dalbergiamelanoxylon, Carphalea pubescens and Grewiabicolor. Grasses reach more than 3m in height,the common species being Sorghumarundinaceum, Roettboelia cochinchinensis,
Hypathelia species, Panicum maximum,Diheteropogon amplectens var katangensis andHeteropogon contortus.
A2: Mixed riverine woodlands, This woodlandis the most varied both in species compositionand structure. Its cover ranges between 5% and80%, and is characterised by disjunct associationsof various woody and non-woody species. In mostcases, the riverine fringe is not well-defined sincethe area comprises mainly the erosional upperreaches of rivers, hence there are no extensivealluvial deposits. Some areas along the main rivers(such as the Nhathui and Mucodza) supportassociations of tall (up to 25m) trees of Khayaanthotheca, Kigelia africana, Trema orientalis,Breonardia salicina and Erythrophleum suavelons .In some areas, only scattered trees of Acaciapolyacantha and Albizia versicolor are found.Markhamia obtusifolia, Vitex doniana andPiliostigma thonningii are also found in someareas. Grasses comprise Hypathelia species,Panicum maximum and, occasionally in closedriverine woodland, Oplismenus hirtellus. Theshrub layer, where found, is mostly thick, withCombretum microphyllum, Phyllanthusreticulatus, Lippia javanica, Rhus tenuinervis andBrachylaena rotundata dominating. Clumps ofbamboo are also found in some localities. Spatiallylimited associations of Setaria incrassata ,Phragmites mauritianus and Dioscorea species(yam) also occur along some banks of the majorrivers, where the terrain is flatter and the soilswetter for much of the year.
B: WOODLAND-THICKETSB1: Millettia stuhlmannii-Bauhinia galpinii
woodland-thickets, Closed woodland-thicketsdominated by Millettia stuhlmannii and Bauhiniagalpinii are mostly found on ridges composed of
Figure 25. Hierarchical Cluster Analysis dendrogram showing a classification of the vegetation of Nhanchururu area, based on fifty(1-50) sample points inventoried.

74 Tim Lynam, Rob Cunliffe, Isaac Mapaure and Isau Bwerinofa
reddish-brown clayey soils. Quartz pebbles aresometimes found on the surface. Woody cover isup to 100%, and the height is up to 10m, withemergents of Xeroderris stuhlmannii andSclerocarya birrea occasionally reaching up to14m. Other common tree species includeMarkhamia obtusifolia, Pterocarpus rotundifolius ,Schrebera trichoclada, Cleistoclamys kirkii, Vitexpayos, Brachystegia boehmii and Brachystegiaspiciformis. The shrub layer is usually thick andconsists mainly of shrubs >3m in height. Dominantshrub species are Friesodielsia obovata ,Holarrhena pubescens, Xanthoxylum capense,Annona senegalensis, Markhamia obtusifolia andTricalysia jasminiflora. Thicker associations ofArtabotrys brachypetalus, Rhoicissus revoilii andBauhinia galpinii are also common. The grass layeris sparse, except in the few openings found insome of the woodland-thickets where Setariahomonyma, Panicum maximum, Heteropogoncontortus and Oplismenus hirtellus may be found.Fire is of common occurrence in some of the moreopen woodland-thickets.
B2: Friesodielsia obovata mixed woodland-thickets, Scattered termitaria are found in mostof the vegetation types described above. Thetermitaria range in height from 1.5m to 3m andthe diameter is usually >5m. Most termitariasupport both woody and non-woody plants, the
composition of which varies considerably withsoil type and surrounding vegetation type. Thephysiognomy of the vegetation tends to be wood-land-thickets, mostly dominated by Friesodielsiaobovata and/or Combretum mossambicense.Other common species include Bauhinia galpinii,Sclerocarya birrea, Azanza garckeana, Albiziaharveyi, Deinbolia xanthocarpa , Maytenusheterophylla and Carissa edulis. Commonly en-countered grasses are Panicum maximum,Digitaria milanjiana and Setaria homonyma.
C: CULTIVATED LANDSC1: Mixed vegetation in cultivated lands,
Much of the plateau area is cultivated, particularlythe reddish-brown soils which seem to be morefertile than the rest. Sorgum bicolor (sorghum)and Zea mays (maize) are the main crops. Theseare usually intercropped with perennial fruit,legume or other crops such Cajanus cajan (pigeonpea), Carica papaya (paw paw) and Manihotesculenta (cassava). Bananas (Musa paradisiaca),yams (Dioscorea spp.) and other crops arecultivated along drainage lines. In addition toweedy plants, a number of indigenous woody andnon-woody plants persist in the cultivated lands,mainly as coppice shrubs. These includeSclerocarya birrea, Markhamia obtusifolia,Diplorhynchus condylocarpon, Rhynchosia minima,
Figure 26. Vegetation map Nhanchururu
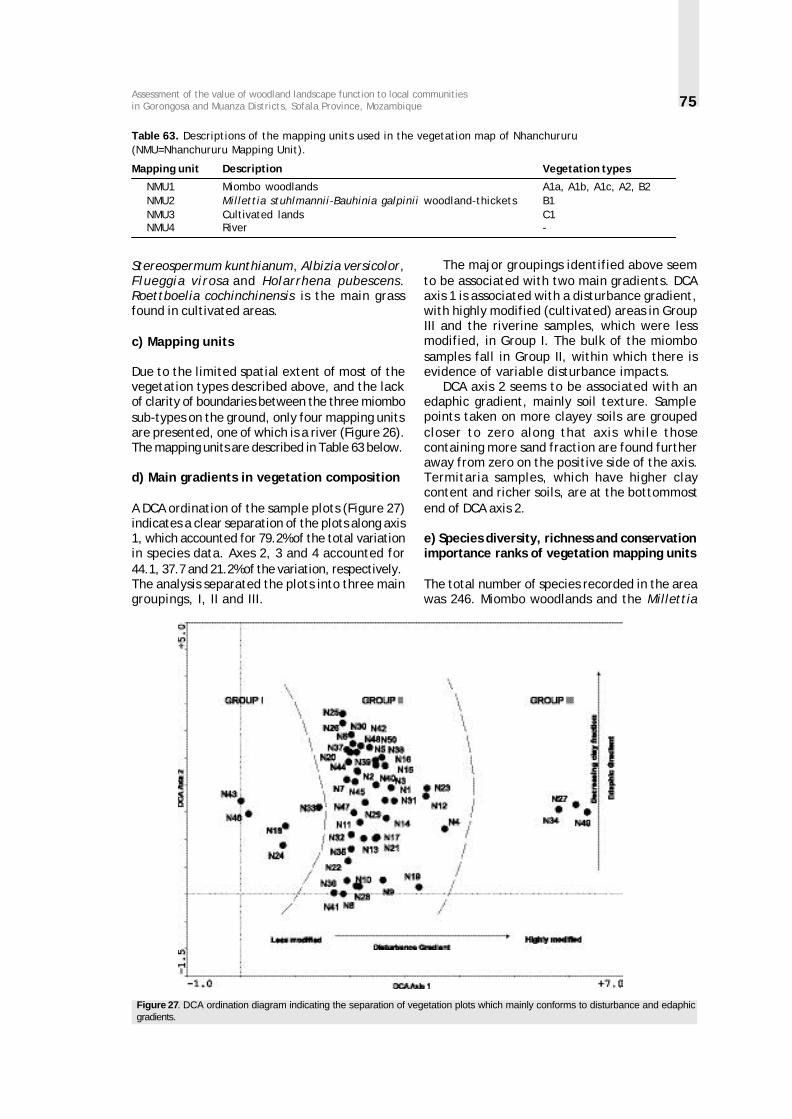
75Assessment of the value of woodland landscape function to local communitiesin Gorongosa and Muanza Districts, Sofala Province, Mozambique
Figure 27. DCA ordination diagram indicating the separation of vegetation plots which mainly conforms to disturbance and edaphicgradients.
Stereospermum kunthianum, Albizia versicolor,Flueggia virosa and Holarrhena pubescens.Roettboelia cochinchinensis is the main grassfound in cultivated areas.
c) Mapping units
Due to the limited spatial extent of most of thevegetation types described above, and the lackof clarity of boundaries between the three miombosub-types on the ground, only four mapping unitsare presented, one of which is a river (Figure 26).The mapping units are described in Table 63 below.
d) Main gradients in vegetation composition
A DCA ordination of the sample plots (Figure 27)indicates a clear separation of the plots along axis1, which accounted for 79.2% of the total variationin species data. Axes 2, 3 and 4 accounted for44.1, 37.7 and 21.2% of the variation, respectively.The analysis separated the plots into three maingroupings, I, II and III.
The major groupings identified above seemto be associated with two main gradients. DCAaxis 1 is associated with a disturbance gradient,with highly modified (cultivated) areas in GroupIII and the riverine samples, which were lessmodified, in Group I. The bulk of the miombosamples fall in Group II, within which there isevidence of variable disturbance impacts.
DCA axis 2 seems to be associated with anedaphic gradient, mainly soil texture. Samplepoints taken on more clayey soils are groupedcloser to zero along that axis while thosecontaining more sand fraction are found furtheraway from zero on the positive side of the axis.Termitaria samples, which have higher claycontent and richer soils, are at the bottommostend of DCA axis 2.
e) Species diversity, richness and conservationimportance ranks of vegetation mapping units
The total number of species recorded in the areawas 246. Miombo woodlands and the Millettia
Table 63. Descriptions of the mapping units used in the vegetation map of Nhanchururu(NMU=Nhanchururu Mapping Unit).
Mapping unit Description Vegetation types
NMU1 Miombo woodlands A1a, A1b, A1c, A2, B2NMU2 Millettia stuhlmannii-Bauhinia galpinii woodland-thickets B1NMU3 Cultivated lands C1NMU4 River -

76 Tim Lynam, Rob Cunliffe, Isaac Mapaure and Isau Bwerinofa
stuhlmannii-Bauhinia galpinii woodland-thickethad higher species richness and diversity thanthe rest of the vegetation types (Table 64).Cultivated lands had the least number of speciesand species diversity. Vegetation types A1a, A1b,A1c, A2 and B1 were significantly richer inspecies than B2 and C1 (F=14.5, p<0.001).Differences in richness and diversity are shownin Table 64 below. Important species (cited inthe Mozambique Red Data List (SABONET, 2001))identified in the area are Afzelia quanzensis (lowrisk), Dalbergia melanoxylon (threatened),Diospyros mespiliformis (threatened), Khayaanthotheca (low risk) and Sterculia quinqueloba(vulnerable). The Miombo woodlands (NMU1)have the highest calculated conservation value,mainly due to their high diversity and theexistence of a higher number of importantspecies, while the Cultivated lands (NMU2) havethe lowest calculated conservation value becausethey have low diversity and no important species.
Based on the diversity indices above (Table 64),the relative abundance of the mapping units andthe number of important species, the standardizedconservation indices of the mapping units areshown in Table 65 below.
C. Discussion
1. Muaredzi
a) Factors influencing vegetation structure andcomposition
Soil moisture and flooding.From the DCAordination diagram (Figure 24) it is clear that
the plots are separated along a soil moisturegradient. Drier plots are found on the right ofthe diagram while wetter plots are placed onthe opposite end. Apart from showing the relativeproximity of the respective plot groupings to majorrivers, the results show increasing sand fraction inthe soil, which confirms the importance of soilmoisture in influencing vegetation composition.Soils in the valley floor, which usually get flooded,are heavier in texture (more clay) than the onesfound towards the escarpment, which are sandier.The length of flooding of any particular areadetermines the balance between the woody andgrass components of the vegetation. Where an areais flooded for a longer period, the vegetationbecomes predominantly grassland while the woodycomponent becomes dominant where there is noflooding, or where flooding period is shorter.Availability of water along river courses results inthe dominance of Phragmites mauritianuscommunities which form a fringe along most of theperennial rivers and streams. There is clear zonationof vegetation with increasing distance from the mainrivers such as the Urema. Echinochloa haploclada-dominated grasslands are found in the flood zonewhile Setaria incrassata , and Hyphaene-Acacia-Combretum and miombo complexes (in that order)dominate vegetation communities as one movesaway from the floodplain to the escarpment.
Soil texture and geology. There is anapparent association between soil texture andvegetation composition. Areas with heavy blackclay soils of alluvial origin tend to supportcomplexes of Acacia-Piliostigma woodlands,sometimes with Hyphaene petersiana and Setariaincrassata. Common Acacia species were A.sieberiana, A. karroo, A. nigrescens and A.
Table 65. Standardized conservation indices and biodiversity conservation importance ranks of the mappingunits in Nhanchururu. The standardized conservation importance indices for each map unit are relative to themap unit with the highest relative conservation index.
Map Relative Diversity index Important species Conservation valueunit abundance Mean se n n Weight Weighted Standardized BCRI
NMU1 0.8421 2.5564 0.0545 40 5 0.8 1.7222 1.0000 1 (highest)NMU2 0.9876 2.6590 0.1010 7 3 0.6 1.5757 0.9149 2NMU3 0.1702 1.3300 0.2500 3 0 0.2 0.0453 0.0263 3NMU4 - - - - - - - 0.0001 4 (lowest)
BCRI: Biodiversity conservation ranking importance
Table 64. Means and standard errors (SE) of diversity indices, richness indices and absolute richness of thevegetation types found in Nhanchururu.
Vegetation type Diversity index Richness index Absolute richness Sample size (n)
A1a 2.850 (±0.05) 3.760 (±0.05) 42.4 (±2.1) 7A1b 2.672 (±0.05) 3.620 (±0.05) 38.4 (±2.2) 10A1c 2.685 (±0.06) 3.521 (±0.09) 34.6(±2.9) 7A2 2.407 (±0.10) 3.313 (±0.09) 28.5 (±2.3) 11B1 2.659 (±0.10) 3.584 (±0.09) 36.7 (±2.6) 7B2 2.062 (±0.18) 2.890 (±0.13) 18.6 (±2.6) 5C1 1.330 (±0.25) 2.225 (±0.22) 9.7 (±1.9) 3
77Assessment of the value of woodland landscape function to local communitiesin Gorongosa and Muanza Districts, Sofala Province, Mozambique
polyacantha. Other species indicative of heavysoils include Combretum imberbe, Piliostigmathonningii and Lonchocarpus capassa. Sandiersoils are mainly found along low ridges and thesetend to support thicker woodlands with tallemergents. Common indicative speciesencountered were Sclerocarya birrea, Terminaliasericea, Spirostachys africana and mixed dryforests. On soils of medium texture (presumablycolluvial), occur complexes of a wide range ofvegetation types but these are largely dominatedby Combretum species, particularly Combretumadenogonium. The vegetation complexes showmarked local variations in species dominanceas stated in the descriptions of the vegetationtypes.
Altitude and rainfall. There is a majordifference between vegetation types within theRift valley and those occurring on the escarpment.The latter areas support tall Julbernardia-Brachystegia miombo woodlands while the rest ofthe vegetation types described above occur in theRift valley. Altitude has an influence on the rainfallpattern, thereby indirectly influencing vegetationcomposition. Tinley (1977) noted differences inrainfall along the Gorongosa-Cheringoma transectindicating lower rainfall in the Rift valley. Rainfallis therefore an important factor and appears toincrease with altitude, particularly when onecompares the Midlands and the Rift valley. Thereare differences in geology, from the flood plain tothe escarpment, which interacts with altitude andrainfall to influence vegetation composition asoutlined in V.A.1.b and V.A.1.c above.
Fire. Is a common occurrence in the areaand may play an important role in the dynamicsof the woodlands. It was evident that a largepercentage of the area burns annually. There werehuge fires in the area during the time ofconducting fieldwork. Fire may cause changes inthe size class structure and species compositionof the woodlands. A large body of literature hasdiscussed how fire influences the structure andcomposition of woodlands (e.g. Frost andRobertson, 1987; Trollope, 1982; 1984).
b) Concluding remarks
From the preceding account, it can therefore beconcluded that soil moisture, soil texture andgeology, altitude and fire have a major influenceon the floristic composition and structure of thevegetation in the area. These factors may act ininteraction with each other. Therefore, thedominant gradient influencing vegetation in thearea may be labelled as a ‘complex gradient’, sinceit may consist of a combination of a number offactors.
2) Nhanchururu
a) Factors influencing vegetation structureand composition
From observations in the field, together withpatterns emerging from the DCA ordination (Fig-ure 24), a number of factors which influencethe structure, species composition and dynam-ics of the woodlands in the area can be identi-fied. These can be divided into anthropogenicdisturbances and edaphic (including geology)factors.
Timber extraction. There is overwhelmingevidence of timber extraction in the area. Loggedstumps of Pterocarpus angolensis and Millettiastuhlmannii were seen scattered throughout themiombo woodlands. In fact, the mixed-dominancemiombo woodlands could have resulted from theremoval of the previous dominants. The localpeople indicated that the area was logged duringthe war (1970s) and again after the war in 1997-1998. A pile of six Pterocarpus angolensis logs (stillin good condition), averaging 6m long, and ofaverage diameter 50cm, was encountered atS18o39’32.0”, E34o15’40.8”. A quick estimate ofstocking density of this species in the area wasabout 7 trees per hectare, meaning that theloggers extracted about 8.2m3ha-1. This hasresulted in changes in the species dominancestructure and composition in the affected areas.There is also small-scale extraction of constructiontimber by the locals, as indicated in the list ofresources they obtain from the landscape.
Fire. Almost every vegetation type describedabove is affected by fire. The intensity of firedepends on the season of burning, the prevailingambient conditions and the type and amount offuel available to carry a fire (Frost, 1996).Woodlands opened up through timber extractionshow increased grass growth, and this will resultin hotter, more intense fires. The variousecological impacts of fire on savanna woodlandsare discussed at length by Frost (1996) and Frostand Robertson (1987) and interactive effects ofwoodland thinning and fire on miombo woodlandstructure and dynamics were discussed byMapaure (2001). Most fires are apparently causedby honey gatherers and burning of areas forcultivation.
Bark removal. There is evidence of a numberof trees dying due to bark removal by localpeople. This is mainly for making beehives, andthe affected species are mainly Brachystegiaspiciformis and Brachystegia boehmii. Most ofthe affected trees are large, usually more than30cm in basal diameter. Up to 8 beehives,awaiting to be mounted up on trees, were heapedat one old homestead (at S18o37’25.5”,

78 Tim Lynam, Rob Cunliffe, Isaac Mapaure and Isau Bwerinofa
E34o16’25.9”). If the practice continues, it willhave a significant effect on the structure andfunctioning of the woodlands. The death ofdebarked trees may be accelerated by fire, andthis has been demonstrated in a Burkea africanasavanna (Yeaton, 1988). From interviews withthe local communities it emerged that honey wasone of the important wild products obtained fromthe landscape by the local community. Bark hasalso been stripped for ropes but this seems tohave a lesser ecological impact than that ofbeehive-making.
Land clearing. Much of the area on reddish-brown soils is cultivated. There is evidence of newclearing in some areas, while places of oldhabitation are re-vegetating, largely to grass-dominated woodlands. Land-clearing results inhabitat loss, habitat fragmentation and,sometimes, loss of biodiversity (McNeely et al.1995). This activity is more prevalent in themiombo woodlands and thickets on more fertilesoils than elsewhere.
Soils and geology. It appears that soils andgeology are important determinants of vegetationstructure and composition in the area. This isevidenced by the grouping of the sample pointson ordination diagram (Figure 27), where thesecond axis appears to be associated with anedaphic gradient. The Millettia stuhlmanniiwoodland-thickets are confined to reddish-brown,clayey soils which appear to be doleriticintrusions, while all the miombo woodlands occuron what appear to be gneissic soils of sandiertexture. Due to the lack of a detailed geologicalmap of the area, these observations remainunconfirmed. Tinley (1977) broadly described thegeology in the area as preCambrian metamorphicrocks of magmatites, paragneiss, amphibolites andschists of the Zambezian system.
D) Conservation values ofvegetation in Muaredzi andNhanchururu
Scientific valuation of the conservationimportance of vegetation in Muredzi andNhanchururu is based on the diversity of plants.This is because the variety of living organismsin any area is so great that it is impracticable toinventory and identify all of them, hence the useof ‘indicator groups‘ (UNEP, 1996) as surrogatesfor the whole biological diversity. We havetherefore taken one group of living organisms asa surrogate for the overall biodiversity in theseareas. Whilst this approach slightly differs fromtaxon-based biodiversity surrogates (Williams,2001), it is a valid scheme since it focuses on a
biological entity, the plant community (Burgmanand Lindenmayer, 1998: in Williams, 2001). Thisis an acceptable approach given that thevegetation of an area represents an integrationof environmental features such as climate, soils,topography, previous land-use and site potential(Timberlake and Mapaure, 1992).
Determination of the conservation values ofthe vegetation mapping units has been based ontheir individual merits, which considered overalldiversity, spatial extent and numbers of unique/important species in each unit. The principle ofcomplementarity (Vane-Wright et al. 1991) wasthought to be not appropriate since selection ofsubsequent units after the first is based on thefact that one does not wish to replicate taxa whichoccur in the first choice. It also presupposes alevel of the knowledge of species presence/absence and distribution (Beentje, 1996), whichwas not the case with our data. Complementarityincreases the efficiency of selection of sites orunits only when data are more complete (Presseyet al. 1993). Even though the list of importantspecies (endemic, threatened, vulnerable, etc.)given by SABONET (2001) is somewhat preliminary,it gives us a sound basis upon which conservationvalues can confidently be weighted. Before thepreliminary list, there was no Red Data List forplants of Mozambique (see Bandeira et al. 1994).If the whole of Gorongosa National Park were tobe included in the analysis, a different picturecould emerge since the species diversity andspatial extents of other vegetation types in thepark are not known.
Approaches of selection of areas forconservation have often been based on countsof endemic species, especially for faunal species(Pearson and Cassola, 1992). This method canalso be applicable to conservation of vegetation(Beentje, 1996). Thus the determination of theconservation importance values of the mappingunits presented in this report has been centredon above criteria. Because of the non-availabilityof a comprehensive list of endemic species, itwas only possible to base our evaluations on theidentified important species (SABONET, 2001).It has been recommended, however, that inaddition to numbers of endemics, scoringsystems for sites should include evaluation ofthreats, appropriate measures of site viabilityand species richness (Hawksworth and Kalin-Arroyo, 1995). Timberlake et al. (1991) notedthat rarity of a vegetation type, high plantspecies diversity, wide variety of habitats in alimited area and relatively undisturbed conditionof a vegetation type were some of the criteriaused for selection of areas for conservation. Itis also important to consider the vulnerabilityof sites to ecological perturbations,

79Assessment of the value of woodland landscape function to local communitiesin Gorongosa and Muanza Districts, Sofala Province, Mozambique
anthropogenic and natural threats as well as thefunctional significance of each site and theecological processes involved. For instance, thefunctional importance of the wetland areas ingeneral, as discussed by Whitlow (1985), Matiza(1992) and Breen et al. (1997) may far outweighthe biodiversity values. Whilst such considerationsare desirable, it was beyond our ability to evaluate(and perhaps, quantify) ecological processes.
The major threats to biodiversityconservation in both Muredzi and Nhanchurururelate mainly to agricultural activities. We foreseean extensification of cropping and expansion ofhouseholds in Muredzi while intensification ofagricultural production is predicted inNhanchururu in the long-term. Signs of theexpansion of agricultural fields are alreadyevident in Muredzi, and this may significantlyreduce the spatial extents of the Combretumadenogonium-Sclerocarya birrea, and Acaciapolyacantha -Piliostigma thonningii mixedwoodlands, in particular. Though quite variablein species richness and dominance, theCombretum adenogonium-Sclerocarya birreawoodland contains sites, such as termitaria, withhigh species diversity, and are of highconservation importance. The dry forests inMuredzi, due to the relatively poor agricultural
potential of the sandy soils on which they occur,may not be at an immediate risk of clearance forfields but extraction of targeted species maynegatively impact on the biodiversity withinthem. In addition to their high species diversity,their limited spatial extent and the occurrenceof important species make them somewhatecologically special.
In addition to agricultural intensification inNhanchururu, the other major threats tovegetation are commercial timber exploitation,wide-spread fires and uncontrolled small-scaletimber extraction. No evidence has, however,been gathered on how much change has occurredin species diversity and structure of thewoodlands resulting from the disturbance factorsdiscussed above. Compared to miombo woodlandsin Muredzi, in Nhanchururu, miombo woodlandsare richer and more diverse in species. It ispossible, therefore, that previous logging and fireregimes in Nhanchururu have been ofintermediate nature (compared to Muredzi) suchthat diversity was higher than expected. We,however, also note that apart from differencesin disturbance regimes other factors such asrainfall patterns, geological and altitudinaldifferences may play (interactively or individually)important roles in the dynamics of the woodlands.

80
81
IV. Overlay of community valuationsand conservation valuations
A. IntroductionAn important output of this project’s activitieswas the production of maps in which the estimatedlocal community valuation of landscape elementswas overlain with the estimated conservationvalue of each landscape unit. This would enableboth GNP management and the local communitiesto identify locations that were of high value toboth groups and hence required specialmanagement attention and possibly thedevelopment of co-management arrangements.The greatest difficulty in achieving this objectivewas the production of maps by the localcommunity. In Mauredzi this was feasible becausethe structure of the vegetation communities andhence the landscapes was such that they couldbe easily mapped in a geo-referenced format fromthe sketch maps of the CRUAT. Basically there wasvery good correspondence between the vegetationmaps developed from the Landsat 7 imagery andthe Mauredzi CRUAT sketch maps such that theTREP team’s map (from Landsat 7 imagery) couldbe used as the CRUAT map. This was not the casein Nhanchururu. The vegetation types describedby the CRUAT in Nhanchururu as well as by theTREP team formed a mosaic of types that theCRUAT claimed they could not map and the TREPteam also could not differentiate adequately(even using Landsat 7 imagery) except at a very
coarse resolution. The maps for Nhanchururu aretherefore, less than satisfactory.
Despite this difficulty we present both sets ofmaps and use them to identify locations that arelikely to be in high demand for both sites. However,although we believe the resulting product forMauredzi is of high quality and hence very usefulwe would rather use the models of section 3 forNhanchururu than these maps.
B. MethodsAs far as was possible the BBN models developedfor each site were used to guide the generationof final landscape valuation maps for each site.Although the calculations for generating the finalmaps were simplifications of the calculations usedin the models the general approach and principleswere the same; the final valuation map wasdeveloped as a ratio of the benefits to costs.Benefits were calculated as the weighted sum ofscores of the benefits that the CRUAT identifiedas being derived from each vegetation type. Theweightings were the CRUAT relative importanceweights (RIW) as used in the BBN. For each sitethe developed vegetation maps were convertedinto raster maps with square cells. Thesedimensions were selected because they were thesame size as the sample plots for fieldconfrontation.
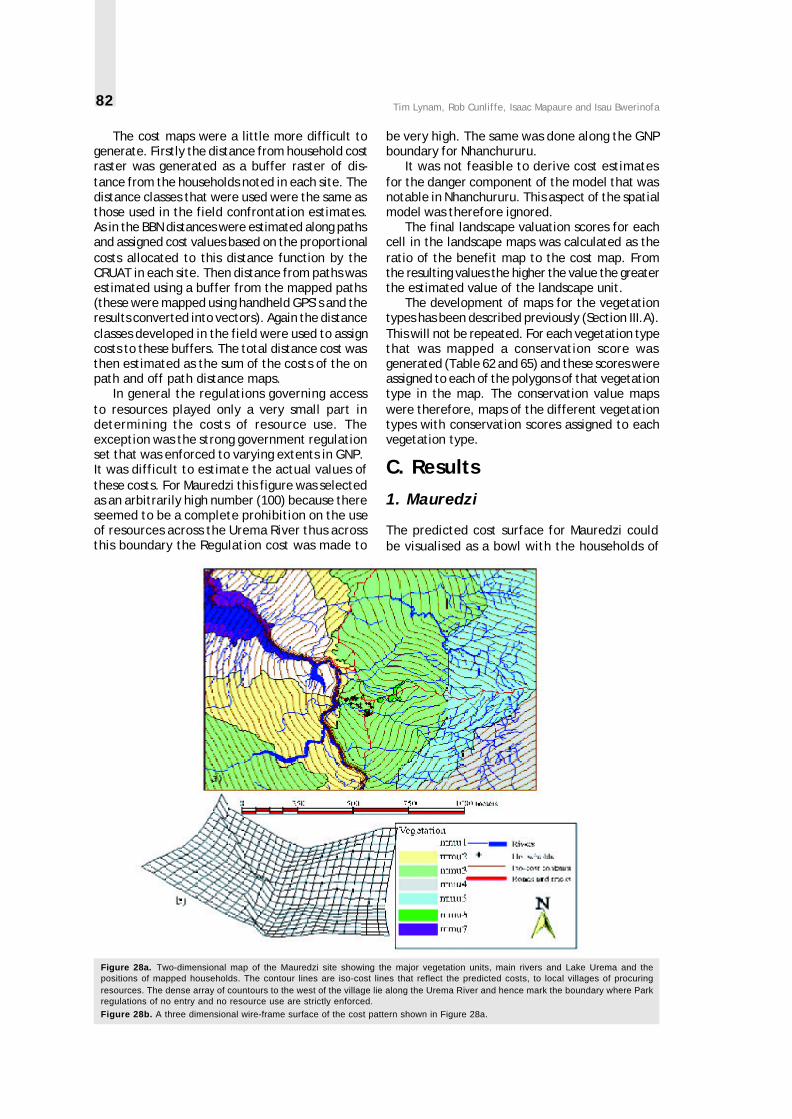
82 Tim Lynam, Rob Cunliffe, Isaac Mapaure and Isau Bwerinofa
The cost maps were a little more difficult togenerate. Firstly the distance from household costraster was generated as a buffer raster of dis-tance from the households noted in each site. Thedistance classes that were used were the same asthose used in the field confrontation estimates.As in the BBN distances were estimated along pathsand assigned cost values based on the proportionalcosts allocated to this distance function by theCRUAT in each site. Then distance from paths wasestimated using a buffer from the mapped paths(these were mapped using handheld GPS’s and theresults converted into vectors). Again the distanceclasses developed in the field were used to assigncosts to these buffers. The total distance cost wasthen estimated as the sum of the costs of the onpath and off path distance maps.
In general the regulations governing accessto resources played only a very small part indetermining the costs of resource use. Theexception was the strong government regulationset that was enforced to varying extents in GNP.It was difficult to estimate the actual values ofthese costs. For Mauredzi this figure was selectedas an arbitrarily high number (100) because thereseemed to be a complete prohibition on the useof resources across the Urema River thus acrossthis boundary the Regulation cost was made to
be very high. The same was done along the GNPboundary for Nhanchururu.
It was not feasible to derive cost estimatesfor the danger component of the model that wasnotable in Nhanchururu. This aspect of the spatialmodel was therefore ignored.
The final landscape valuation scores for eachcell in the landscape maps was calculated as theratio of the benefit map to the cost map. Fromthe resulting values the higher the value the greaterthe estimated value of the landscape unit.
The development of maps for the vegetationtypes has been described previously (Section III.A).This will not be repeated. For each vegetation typethat was mapped a conservation score wasgenerated (Table 62 and 65) and these scores wereassigned to each of the polygons of that vegetationtype in the map. The conservation value mapswere therefore, maps of the different vegetationtypes with conservation scores assigned to eachvegetation type.
C. Results
1. Mauredzi
The predicted cost surface for Mauredzi couldbe visualised as a bowl with the households of
Figure 28a. Two-dimensional map of the Mauredzi site showing the major vegetation units, main rivers and Lake Urema and thepositions of mapped households. The contour lines are iso-cost lines that reflect the predicted costs, to local villages of procuringresources. The dense array of countours to the west of the village lie along the Urema River and hence mark the boundary where Parkregulations of no entry and no resource use are strictly enforced.Figure 28b. A three dimensional wire-frame surface of the cost pattern shown in Figure 28a.
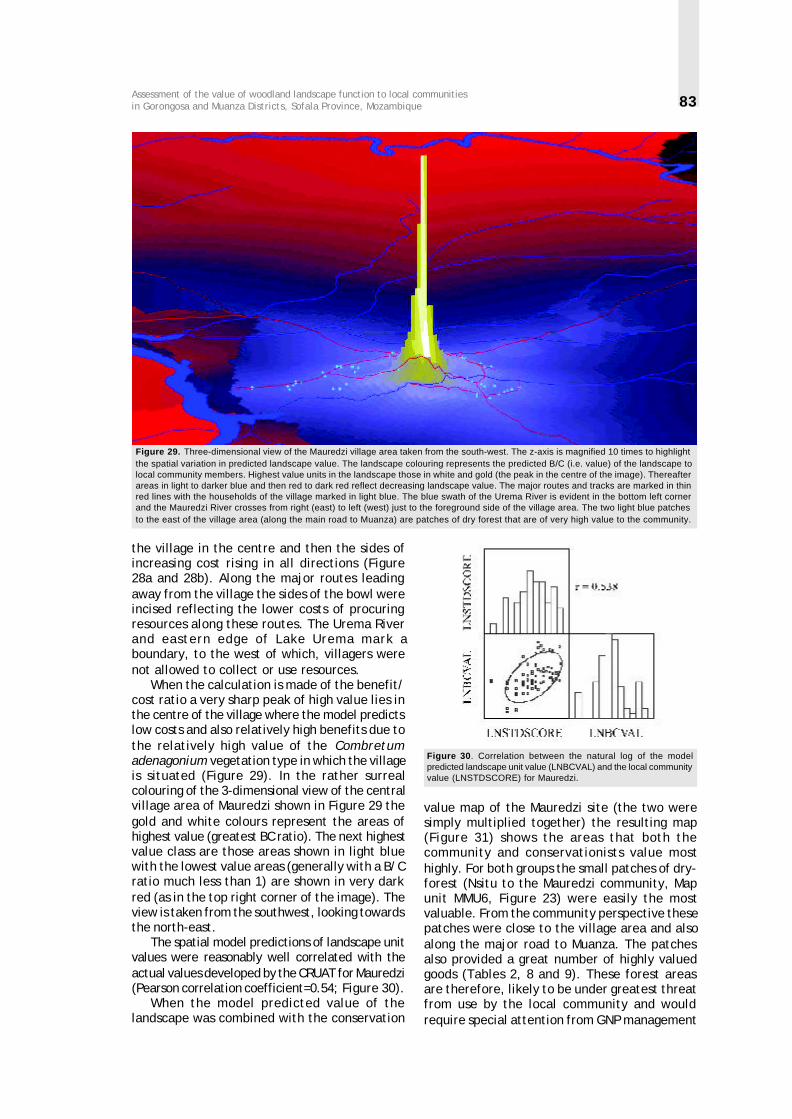
83Assessment of the value of woodland landscape function to local communitiesin Gorongosa and Muanza Districts, Sofala Province, Mozambique
the village in the centre and then the sides ofincreasing cost rising in all directions (Figure28a and 28b). Along the major routes leadingaway from the village the sides of the bowl wereincised reflecting the lower costs of procuringresources along these routes. The Urema Riverand eastern edge of Lake Urema mark aboundary, to the west of which, villagers werenot allowed to collect or use resources.
When the calculation is made of the benefit/cost ratio a very sharp peak of high value lies inthe centre of the village where the model predictslow costs and also relatively high benefits due tothe relatively high value of the Combretumadenagonium vegetation type in which the villageis situated (Figure 29). In the rather surrealcolouring of the 3-dimensional view of the centralvillage area of Mauredzi shown in Figure 29 thegold and white colours represent the areas ofhighest value (greatest BC ratio). The next highestvalue class are those areas shown in light bluewith the lowest value areas (generally with a B/Cratio much less than 1) are shown in very darkred (as in the top right corner of the image). Theview is taken from the southwest, looking towardsthe north-east.
The spatial model predictions of landscape unitvalues were reasonably well correlated with theactual values developed by the CRUAT for Mauredzi(Pearson correlation coefficient=0.54; Figure 30).
When the model predicted value of thelandscape was combined with the conservation
value map of the Mauredzi site (the two weresimply multiplied together) the resulting map(Figure 31) shows the areas that both thecommunity and conservationists value mosthighly. For both groups the small patches of dry-forest (Nsitu to the Mauredzi community, Mapunit MMU6, Figure 23) were easily the mostvaluable. From the community perspective thesepatches were close to the village area and alsoalong the major road to Muanza. The patchesalso provided a great number of highly valuedgoods (Tables 2, 8 and 9). These forest areasare therefore, likely to be under greatest threatfrom use by the local community and wouldrequire special attention from GNP management
Figure 29. Three-dimensional view of the Mauredzi village area taken from the south-west. The z-axis is magnified 10 times to highlightthe spatial variation in predicted landscape value. The landscape colouring represents the predicted B/C (i.e. value) of the landscape tolocal community members. Highest value units in the landscape those in white and gold (the peak in the centre of the image). Thereafterareas in light to darker blue and then red to dark red reflect decreasing landscape value. The major routes and tracks are marked in thinred lines with the households of the village marked in light blue. The blue swath of the Urema River is evident in the bottom left cornerand the Mauredzi River crosses from right (east) to left (west) just to the foreground side of the village area. The two light blue patchesto the east of the village area (along the main road to Muanza) are patches of dry forest that are of very high value to the community.
Figure 30. Correlation between the natural log of the modelpredicted landscape unit value (LNBCVAL) and the local communityvalue (LNSTDSCORE) for Mauredzi.
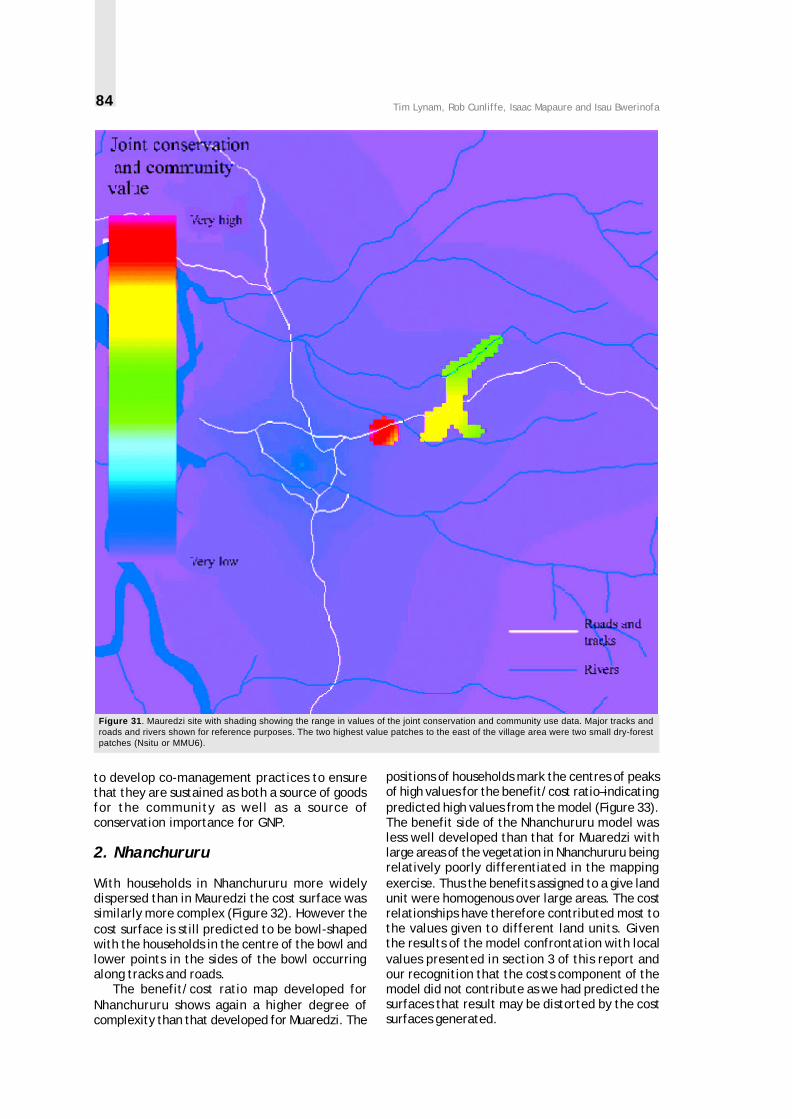
84 Tim Lynam, Rob Cunliffe, Isaac Mapaure and Isau Bwerinofa
to develop co-management practices to ensurethat they are sustained as both a source of goodsfor the community as well as a source ofconservation importance for GNP.
2. Nhanchururu
With households in Nhanchururu more widelydispersed than in Mauredzi the cost surface wassimilarly more complex (Figure 32). However thecost surface is still predicted to be bowl-shapedwith the households in the centre of the bowl andlower points in the sides of the bowl occurringalong tracks and roads.
The benefit/cost ratio map developed forNhanchururu shows again a higher degree ofcomplexity than that developed for Muaredzi. The
positions of households mark the centres of peaksof high values for the benefit/cost ratio–indicatingpredicted high values from the model (Figure 33).The benefit side of the Nhanchururu model wasless well developed than that for Muaredzi withlarge areas of the vegetation in Nhanchururu beingrelatively poorly differentiated in the mappingexercise. Thus the benefits assigned to a give landunit were homogenous over large areas. The costrelationships have therefore contributed most tothe values given to different land units. Giventhe results of the model confrontation with localvalues presented in section 3 of this report andour recognition that the costs component of themodel did not contribute as we had predicted thesurfaces that result may be distorted by the costsurfaces generated.
Figure 31. Mauredzi site with shading showing the range in values of the joint conservation and community use data. Major tracks androads and rivers shown for reference purposes. The two highest value patches to the east of the village area were two small dry-forestpatches (Nsitu or MMU6).

85Assessment of the value of woodland landscape function to local communitiesin Gorongosa and Muanza Districts, Sofala Province, Mozambique
Figure 34. Correlation between the natural logarithm of model predictedlandscape unit value (LNBCVALUE) and the natural logarithm of thestandardised scores allocated to each location by Nhanchururu CRUAT.
The spatial model and local valuations forNhanchururu were not as well correlated as theywere for Mauredzi. Given the weakness of thescoring data for Nhanchururu this is notunexpected. The correlation coefficient of 0.3indicates that there was considerable noise in therelationship between model predicted values andthose allocated to the same locations by CRUATmembers (Figure 34). We recognise that much ofthis variance is attributable to the differences inscoring among enumerators.
extended itself to well within the boundary of GNP.There are areas within the park that are of higherconservation importance and it is likely to be theseareas that would be of greatest concern to themanagement of GNP.
D. Discussion and conclusionsThe overlay of community values with conservationvalues identifies sites of both Muaredzi andNhanchururu that are most likely to be the sourceof conflict between GNP management and the twocommunities. Both communities valued sites fortheir use value, thus it is the stream of directbenefits that household use from each site that isof value to them. This is in direct contrast to theGNP objectives of conservation, which is more ofan option value.
We feel more comfortable with the results ofthe analysis from Muaredzi. The units identifiedas being of greatest concern to GNP managementand the Muaredzi community were reliablyidentified from analyses that were robust andyielded results in which we had a high degree ofbelief.
We feel less comfortable with the results fromNhanchururu. In part this is attributable to thepoorer community valuation results fromNhanchururu and in part it is attributable to thedifficulty of developing a reasonable map of thevegetation types for Nhanchururu that reflectedthe units that people valued. Despite this theresults are likely to be useful in identifying wherethere are likely to be problems as well ashighlighting the need for reasonably fine resolution
The overlain maps of local values andconservation values show a more broadlydistributed set of areas that might be of concernto the Park and to the local community (Figure35). This is clearly related to the more distributedpattern of household settlement in Nhanchururuwhen compared to Muaredzi. It is clear from thisanalysis that the Nhanchururu community has
Figure 32. Three-dimensional representation of the predicted cost surface for the Nhanchururu community. Lowest cost areas for theprocurement of resources are those represented by red areas around the household positions. Costs increase with dark to light blue andthen gold to white with white representing the highest cost areas. Z-scale magnified 10 fold to highlight the differences. The black linerunning over the surface is the GNP boundary with the Park on the right of the image.

86 Tim Lynam, Rob Cunliffe, Isaac Mapaure and Isau Bwerinofa
maps of vegetation types to enable thedevelopment of benefit stream data sets.
In both cases we believe the cost estimatesfrom the model have had a greater impact onthe spatial representations than the BBN modelanalysis suggested was reasonable. This effect wasexacerbated by the lack of resolution in thebenefit side of the maps–we had no data on thedensity of resources in each site (except from the
field confrontation data). Thus the cost side ofthe spatial models was resolved to 60m cells butthe benefit side of the spatial models was onlyresolved to the level of the vegetation map unit.We suspect that it would be possible to use NDVImeasured to provide the much-needed spatialdifferentiation of resource availability.Unfortunately this was not possible in the scopeof this project.
Figure 33. Benefit/cost ratio map for Nhanchururu. Highest BC values are shown in white and gold with decreasing values shown bylight to dark blue and then light to dark red. Black line running over the surface is the GNP boundary.
Figure 35. Nhanchururu site with shading showing the range in values of the joint conservation and community use data. Major tracksand roads shown for reference purposes. Areas with the highest joint value (shown in light green to yellow) are generally those in closeproximity to the households within the miombo vegetation type. The larger patches of mauve to dark blue are generally cultivated areasand hence have low conservation value.

87
V. Implications for land use planning
The purpose of this section is to draw attentionto the implications of our research findings asregards land use planning for the GNP region. Theproject included limited provision for feedingresults into the ongoing planning process, in theform of reporting to relevant Mozambicanauthorities, as well as a small workshop. Rathermore effective has been the direct involvementof one project member (Dr. T. Lynam) in the GNPplanning process, through other projects. Thishas provided opportunity to interpret and makeresults directly available to planners.
The remainder of this section examinesindividually the four principal elements of theresearch work (community evaluations,biodiversity evaluations, modelling and overlayof community and biodiversity results), and thenattempts to draw these together into a concludingsynthesis, as regards issues raised of relevance toland use planning.
A. Community EvaluationsMuaredzi. The key perspective to emerge fromthe Muaredzi community evaluations was that thecommunity members want to be able to staywhere they are, and not be forced to move.Attempts have been made to relocate thiscommunity in the past, and members are nervousthat the GNP authorities may attempt to do soagain in the future. Lack of security of tenure
obviously weighs heavily on these people andconversely the GNP feels apprehensive for thesepeople to remain in the park.
The area is relatively rich in terms of theprincipal resources sought by the community(water, land for housing and cultivation, fish,construction materials, firewood). This providesa strong incentive for the community to seek toremain where they are. The community appearsto show a high degree of willingness to complywith existing restrictions on resource use, imposedby the GNP, as long as they can remain wherethey are. Greater flexibility by the GNPauthorities on certain issues would, however, beappreciated.
It is interesting to note that Costa & Vogt (1998)report that a considerable proportion of theyounger community members does not see afuture for themselves in Muaredzi. This was notexplored under the current study.
Muaredzi has previously been described asbeing a fishing community. Our results showthat although fishing is an important livelihoodcomponent, agricultural production isconsistently given a higher rating. Thecommunity appears to be in a state of transitionfrom a fishing village to a more conventionalagro-based community. One possible cause forthis may be the restrictions imposed by GNP onfishing activities (e.g. types of canoes, wherefishing can take place, fish to be taken out the
88 Tim Lynam, Rob Cunliffe, Isaac Mapaure and Isau Bwerinofa
park for marketing). Another possibility is theapparent lack of any restrictions concerningcultivation, whereas in the past the GNP mayhave maintained tighter control over the openingof new fields. At the time of the study numerousnew fields were observed being opened up.
Continuation of this trend will result in theclearing of ever-greater areas around the village,presumably within the surrounding planicie area,and consequent destruction of the naturalresources of these areas.
Wildlife populations during the prolongedcivil war were reduced to very low levels, butnow appear to be building up again. Assumingthat wildlife populations do gradually increase,there is likely to be growing conflict betweenwildlife and the Muaredzi community, particularlyin the form of elephant damage to crops.
A principal constraint, in terms of meetingthe basic needs of the community, is the lack offacilities and infrastructure (shops, school,clinic). Whilst this is partly a result of restrictionsimposed by the GNP (particularly restrictions ontraders coming in from the outside), it is equallydifficult to see how the desired infrastructuraldevelopments (e.g. school and clinic) could bejustified for such a small and isolated community.
Overall, the outlook for the Muaredzicommunity is one of increasing conflict,characterised by continued tenurial uncertainty,continued absence of key infrastructure, andincreasing conflict with wildlife. GNPmanagement, on the other hand, are likely tobecome increasingly disaffected with the furtherexpansion of agricultural activities, andattendant destruction of resources, within theheart of their conservation area.
Nhanchururu. The Nhanchururu communityis far more secure and confident about theirtenure, despite an apparent discrepancy betweenthe official GNP boundary and their perceptionof the boundary. The villagers have a definiteconcept of where the boundary is on the ground,and appear willing to respect GNP’s authority tothe east of this line. They also appear confidentthat the GNP will not interfere with theiractivities to the west of this line, and particularlythat there will not be any suggestion or attemptfor any community members to move.
Nhanchururu village is also relatively wellendowed with natural resources. The communityis relatively sparsely settled over a considerablearea. The future is likely to see further openingof new fields within the existing village area,thus leading to a situation of more intensivecultivation, as already exists in neighbouringvillages closer to Villa Gorongosa.
Compared to Muaredzi, the Nhanchururu areais situated at higher altitude and thus
experiences higher and, importantly, morereliable, rainfall such that the community appearsmore secure in terms of crop and foodproduction. A key constraint to futuredevelopment is the poor access and lack oftransport to Villa Gorongosa. Thus, while thevillage appears capable of producing considerableagricultural surpluses, there is little opportunityfor transporting crops to markets outside of thevillage area. Assuming that this situation wasto be addressed, this would act as a significantincentive to increase crop production within thiscommunity.
The community does already use someresources from within the park area. As thevillage population increases, and the croppingsituation intensifies, this demand can beexpected to increase, in terms of both thequantities of resources harvested and the typesof resources sought.
A key threat to future wellbeing is landdegradation. With relatively steep slopes andrelatively high rainfall, the risk of erosion is high,and signs of erosion are already evident. Currentcultivation occurs predominantly on the morelevel ground found on the tops of slopes and onthe lower lying baixa areas. Future expansionwill necessitate expanding onto steeper, lessfavourable localities, which will carry a higherrisk of erosion. Increased erosion will alsoimpact on the hydrological regime downstreamwithin the park.
Coupled with agricultural growth and wealthcreation, there is likely to be a build up oflivestock, particularly the introduction of cattle,which at present are virtually absent. Theintroduction of livestock might lead to conflictswith the park such as losses of animals topredators, spread of diseases, and competitionfor grazing resources. As compared to Muaredzi,wildlife populations within the vicinity ofNhanchururu are relatively low, and are not likelyto pose any significant conflicts with theNhanchururu community.
B. Biodiversity Evaluations
Biodiversity evaluations were limited tovegetation analyses, and to a large extent towoody species. One of the interesting resultswas the recording of more species fromNhanchururu (246 species) than Muaredzi (231species), these coming from similar numbers ofplots (50 for Nhanchururu versus 47 forMuaredzi). This is surprising given the limiteddifferentiation of types within Nhanchururu (7vegetation types) as compared to the 13 typesidentified for Muaredzi. One explanation forthis, is that the range of structural types was

89Assessment of the value of woodland landscape function to local communitiesin Gorongosa and Muanza Districts, Sofala Province, Mozambique
similar for both sites, varying from grasslands(relatively extensive floodplain and palmsavannas for Muaredzi, versus much narrowerstrips along watercourses in Nhanchururu);through various woodlands (occupying the bulkof both sites), to thickets and forests (verylimited in extent for both sites). Other causativefactors could be differences in rainfall and fireregimes. Both sites contained comparablenumbers of species of interest.
Evaluation of the conservation significanceof the various types was hampered by the lack ofa wider perspective, for example of the GNP as awhole. This was recognised as a constraint fromthe outset, but there were insufficient resourcesto address it. However, the results do suggestthat the key vegetation types for both sites arethe thicket and forest communities. These standout in terms of the relatively high speciesdiversity, high occurrence of species of interestand, particularly, their highly restrictedoccurrence. This result would probably be upheldwithin context of the park as a whole.
The other limitation acknowledged withrespect to the conservation valuations is that,apart from being based only on a single group oforganisms (woody plants), it omits considerationof other perspectives such as the delivery ofecological services. For example, the floodplaincommunities are of little biodiversity interest interms of woody plants, but in terms of other taxasuch as herbivores, or birds, and from a functionalperspective, will be of much greater importance.This restriction is recognised, but again therewere insufficient resources to address it underthis study.
C. Modelling
The modelling component proved extremely usefulin conceptualising the study, and structuring andinforming the data gathering activities. It hasalso provided a useful tool for assessing thevalidity of community landscape values.
Similar results were obtained for bothMuaredzi and Nhanchururu. A key finding wasthat landscape values are primarily a function ofpotential benefits, with the cost factors being ofrelatively little importance. Confrontation of therespective models with field data, suggest areasonable degree of belief in the models, andthat the adopted approach is reasonably robust.
It is important to realise that the resultsobtained relate to this particular point in time,and can be expected to vary with time. Both sitesare relatively resource rich. As resources becomeless readily abundant, it is possible that costfactors, such as the distance functions, maybecome more significant.
D. Overlay of Communityand Biodiversity EvaluationsThe process of overlaying community andbiodiversity evaluations produced more mixedresults. This worked reasonably well for Muaredzi,where there was good correspondence betweenvegetation map units and the landscape unitsidentified and mapped by the CRUAT. ForNhanchururu, the overlay results are presentedwith a lower degree of belief. The baixa, planicieand planalto types identified by the CRUAT occuras a matrix of small interspersed portions, whichwould be extremely difficult to map at this scale.Furthermore, the satellite imagery was too poorto enable the effective identification andseparation of woodland types (although this initself is an interesting result).
The biodiversity conservation valuations didnot include any consideration of threat. Theoverlays make this possible, at least for Muaredzi.Here the forest types (MMU6) were allocated thehighest conservation value, and were also rankedby the CRUAT as being of high value during boththe initial scoring exercises and subsequent fieldevaluations. This is where the greatest conflictcan be anticipated between competing uses forconservation purposes and for multiple use by theMuaredzi community, and thus should be a logicalfocus for any local conservation efforts.
Planalto vegetation, comprising Combretumzeyheri-Acacia complexes (MMU5) and miombowoodlands (MMU4), were identified as being ofnext highest conservation value. The CRUAT,however, consistently rated planalto as being ofleast value, such that little conflict can beanticipated here.
The Setaria-Hyphaene open community(MMU2), which corresponds to thando, was ratedas being of intermediary value in terms of boththe biodiversity conservation and CRUAT ratings.
The final two map units, planicie (MMU3) andfloodplain or gombe/madimba communities(MMU1) were considered to be of lowestconservation value, but were both identified bythe CRUAT as being of relatively high value. Thus,although significant impacts to natural resourcescan be anticipated for these areas, it appearsthat these should not be of major significance asregards conservation concerns.
E. SynthesisEach aspect of the study has yielded usefulinsights as regards potential future scenariosfor Muaredzi and Nhanchururu. Key aspects forland use planning are summarised below.Hopefully these can inform and steer the
90 Tim Lynam, Rob Cunliffe, Isaac Mapaure and Isau Bwerinofa
development paths for these sites to the mutualadvantage of both the communities and thepark.
Muaredzi. Settlement of the issue of tenureand whether the community are to stay in placeor move to elsewhere. The resolution of thisissue is critical to both the community beingable to develop their lives, and for the parkmanagement. Non-resolution will be destructiveto both parties. Assuming that the communityremains in place, the park will need to engagemore actively with the community to develop amore functional relationship, possibly resultingin some form of co-management.
Expansion of agricultural activities.Assuming that the community remains in place,the park will need to devise a strategy formanaging future expansion of cropping areas.
Provision of infrastructure. Assuming that thecommunity remains in place, the park will need toconsider how the community’s requirements forinfrastructure and facilities can or can not be met.
Fishing activities. Fishing is an importantlivelihood activity, and which seems possible toregulate and continue on a sustainable basis.Guaranteeing continued access to fishing rightscould provide a valuable incentive were thecommunity to relocate to elsewhere.
Protection of forest communities. The smallforest patches harbour valuable resources interms of both biodiversity conservation and alsoof use to the community. It is here that thegreatest conflict can be expected in terms ofuse by the community and conservation values.
Human wildlife conflicts. Continued build upof wildlife populations, coupled with expansionof cultivation, can be anticipated to result inincreasing levels of conflict between thecommunity and park.
Nhanchururu. Land use planning for thisarea should take place within the context of thecommunity remaining in place where they are,
although there may be need to clarify theirposition relative to the park boundary. Theobvious implication is that the park needs toengage with this community and ensure thedevelopment of a sound functional relationship.
Intensification of cultivation. It is likely thatcultivation will continue to expand, such thatthere is likely to be gradual development of amuch harder edge between the village area andadjacent park area.
Improved access to Vila Gorongosa.Enhancing access to markets is seen as beingcrucial to the future development and prosperityfor this village.
Introduction of cattle. Assuming that thecommunity does prosper and become wealthier,it can be anticipated that livestock populationswill increase, and that cattle are likely to beintroduced. The park needs to consider thevarious potential implications of this.
Use of resources within the park. There isalready some use of resources by communitymembers within the park. Assuming a gradualhardening of the boundary between the villageand park areas, the demand on resources withinthe park is likely to grow.
Management of Gorongosa mountain. Thepark has long been aware of the importance ofGorongosa Mountain and the adjacent foothillsto the hydrological cycle within the park. Thiswas one of the motivations for Tinley’s “mountainto mangrove” vision. Assuming that the situationwithin Nhanchururu is typical of neighbouringvillages, it seems that the opportunity forincluding Gorongosa Mountain and the interveningarea within the park is no longer attainable.However, the substance of the vision still remainsvalid, but will need to be pursued under the guiseof community rather than park management.This is a key area for the development of co-management arrangements between GNP and thecommunities living around the mountain.
91
VI. Acknowledgements
The TREP team gratefully acknowledge the keycontributions made to the project by a widevariety of people, without whose inputs it wouldnot have been possible to carry out the work. TheCRUAT members played an essential role asregards the collection of field data within the twocommunities. For Muaredzi, we gratefullyacknowledge the willing input of the following 26informants:
António Armindo, Fieda Betchane, João Botão,Inês Chuva, Rosário Diogo, Chanaze Fazenda,Mateus Fazenda, Rosa Fazenda, Nina Fernando,Florindo Jambo, Maria Jambo, Pascua Jambo,Anita João, Augusto João, Costamina João, DiogoJoão, Pedro João, Tima João, Zelinha Luis, VirgíniaMacamero, José Mairosse, Celina Manuel, MariaManuel, Inês Melo, Salita Pita and FazendaSixpence,
and for Nhanchururu village the following 20members:
Cassenguere Almeida, Janita Almeida, RicardoAlmeida, Lúcia António, Anita Baptista, EusébioFernando, Henriques Fernando, Pureja Fombe,Victória Francisco, José Carlos Fredi, SargaJoalinho, Laurita João, Melita José, PurejaMatequesse, José Moises, Joalinho Murungo,Rodito Pureja, Fairita Saimone, Manuel VernizSandramo, and Melisa Zeca.
Accessing the community data requiredcontinual translations from Sena to Portugese andEnglish and facilitation. We thank Mr. Pedro DiqueCamissa, Mr. Euzebio Simao Sizinho, Mr. ReginaldoAlberto Casse and Ms. Fatima de Jesus Pereira,
and Mr. Atanasio Jujuman for capably providingthese inputs.
The project would not have been possiblewithout the logistical, technical and moral supportof Roberto Zolho, Administrator of GorongosaNational Park. We are extremely grateful to him.Brit Reichelt has consistently provided us with themost remarkable administrative support inMozambique. We are equally grateful for the veryable field assistance provided by numerous fieldstaff of the park, particularly those of Muaredziand Nhanchururu Posts, who facilitated our staysin the field, and played an important role inpassing important communications to and fromthe park headquarters and in passing messagesto community members.
We thank the District Administrators of Muanzaand Gorongosa Districts for giving their permissionto implement the project within their respectivedistricts.
In Zimbabwe, we thank the administrativestaff of TREP for their ongoing support to theproject; Ms. Astrid Huelin for assistance withprocuring and processing the satellite imagery,and Mr. Isau Bwerinofa for extensive assistancewith digital mapping.
The TREP team gratefully acknowledges thefinancial support of CIFOR. We are most gratefulto Wil de Jong for his continued encouragementand support, and to Doug Sheil and Miriam VanHeist for sharing their experiences from Indonesiaand for contributing towards the initial shapingof the study.
92
VII. References
Aronson, J.A. 1989. Haloph, a data base of salttolerant plants of the world. Office of Arid LandStudies, University of Arizona, Tucson.www.ussl.ars.usda.gov/pls/caliche/halophyte
Bandeira, S.O., Hatton, J.C., Munisse, P. andIzidine, S. 1994. The ecology and conservationstatus of plant resources in Mozambique.Strelitzia 1: 105-115.
Beentje, H.J. 1996. Centres of plant diversity inAfrica. In: van der Maesern, L.J.G., van derBurgt, X.M. and van Medenbach de Rooy, J.M.The biodiversity of African plants. Proceedingsof the XIVth AETFAT Congress; 22-27 August1994 Wageningen. Kluwer AcademicPublishers, Dordrecht, London.
Breen, C.M., Quinn, N.W. and Mander, J.J. (eds)1997. Wetlands conservation and managementin southern Africa: Challenges andopportunities. IUCN-ROSA, Harare.
Burgman, M.A. and Lindenmayer, D.B. 1998.Conservation biology for the Australianenvironment. Surrey Beatty and Sons, Sydney.
Conor, E.F. and McCoy, E.D. 1979. The statisticsand biology of the species-area relationship.American Naturalist 113, 791-833.
Costa, P and Vogt, F. 1998. Gorongosa NationalPark and Muaredzi CommunityInterrelationship. Unpublished report, BrunelUniversity, England.
Cumming, D.H.M., Mackie, C., Magane, S. andTaylor, R.D. 1994. Aerial census of largeherbivores in the Gorongosa National Park andMarromeu area of the Zambezi Delta in
Mozambique: June 1994. Consultants reportto IUCN-ROSA and DNFFB, Maputo.
Frost, P. 1996. The ecology of miombo woodlands.In: Campbell, B. (ed.). The miombo intransition: Woodlands and welfare in Africa.pp. 11-57. Centre for International ForestryResearch (CIFOR), Bogor.
Frost, P.G.H. and Robertson, F. 1987. Theecological effects of fire in savannas. In:Walker, B.H. (ed.). Determinants of TropicalSavannas, pp. 93-141. IUBS Monograph SeriesNo. 3. IRL Press, Oxford.
Gauch, H.G.Jr. 1982. Multivariate analysis incommunity ecology. Cambridge Press,Cambridge.
Hawksworth, D.L. and Kalin-Arroyo, M.T. 1995.Magnitude and distribution of biodiversity. In:Heywood, V.H. (ed.). Global Biodiversityassessment, pp 107-191. UNEP, CambridgeUniversity Press, Cambridge.
Ludwig, J.A. and Reynolds, J.F. 1988. Statisticalecology: A primer on methods and computing.John Wiley & Sons, New York.
Lynam, T.J.P. 2001. Participatory systems analysis– an introductory guide. IES Special ReportNo. 22. Institute of Environmental Sciences(IES), University of Zimbabwe, Harare,Zimbabwe and Centre for InternationalForestry Research (CIFOR), Bogor, Indonesia.
Magurran, A. 1988. Ecological diversity and itsmeasurement. Croom Helm, London.
Mapaure, I. 2001. The influence of elephants andfire on the structure and dynamics of miombo
93Assessment of the value of woodland landscape function to local communitiesin Gorongosa and Muanza Districts, Sofala Province, Mozambique
woodland in Sengwa Wildlife Research Area,Zimbabwe. Doctor of Philosophy Thesis,University of Zimbabwe, Harare.
Matiza, T. (ed.) 1992. Wetlands of Zimbabwe:Report of the Zimbabwe WetlandsConservation Seminar. IUCN-ROSA, Harare.
McNeely, J.A., Gadgil, M., Leveque, C., Padoch,C. and Redford, K. 1995. Human influences onbiodiversity. In: Heywood, V.H. (ed.). GlobalBiodiversity assessment, pp 711-821. UNEP,Cambridge University Press, Cambridge.
Minitab Inc. 2000. MINITAB Statistical Software.State College, PA. USA.
Mueller-Dombois, D. and Ellenberg, H. 1974. Aimsand Methods of Vegetation Ecology. JohnWiley & Sons, New York.
Pearson, D.L. and Cassola, F. 1992. World-widespecies richness patterns of tiger beetles(Coleoptera: Cicinidelidae): indicator taxon forbiodiversity and conservation studies.Conservation Biology 6: 376-391.
Pratt, D.J., Greenway, P.J. and Gwynne, M.D.1966. A classification of East African rangeland.Journal of Applied Ecology 3, 369-382.
Pressey, R.L., Humphries, C.R. and Margules, R.I.1993. Beyond opportunism: key principles forsystematic reserve selection. Trends in Ecologyand Evolution 8: 124-128.
SABONET southern Mozambique wxpedition 2001.SABONET News (March) 7(1):6-18.
ter Braak, C.J.F. 1986. Canonical correspondenceanalysis: A new eigenvector technique formultivariate direct gradient analysis. Ecology67, 1167-1179.
ter Braak, C.J.F. 1988. CANOCO - an extension ofDECORANA to analyse species-environmentrelationships. Vegetatio 75,159-160.
ter Braak, C.J.F. 1991. CANOCO - a Fortranprogram for canonical community ordinationby [partial] [detrended] [canonical]correspondence analysis, principal componentsanalysis and redundancy analysis (Version3.12). Agricultural Mathematics Group,Technical Report, Wagenigen.
ter Braak, C.J.F. 1995. Ordination. In: Jongman,R.H.G., ter Braak, C.J.F. and van Tongeren,O.F.R. (eds). Data analysis in community andlandscape ecology, pp. 91-173. CambridgeUniversity Press, Cambridge.
Ter Braak, C.J.F. and Smilauer, P. 1997. CANOCOReference Manual and User’s Guide to Canocofor Windows: Software for CanonicalCommunity Ordinations Version 4. Centre forBiometry Wageningen (Wageningen NL) andMicrocomputer Power, Ithaca, New York.
Timberlake, J. and Mapaure, I. 1992. Vegeta-tion and its conservation in the eastern mid-Zambezi Valley, Zimbabwe. Transactions of theZimbabwe Scientific Association 66: 1-14.
Timberlake, J.R., Nobanda, N., Mapaure, I. andMhlanga L. 1991. Sites of interest forconservation in Zimbabwe’s communal lands.Vegetation Survey of the Communal LandsReport No. 1. Ecology unit, National Herbarium& Botanic Garden, Harare.
Timberlake, J.R., Nobanda, N. and Mapaure, I.1993. Vegetation Survey of the CommunalLands - North and West Zimbabwe. Kirkia 14,171-270.
Tinley, K.L. 1977. Framework of the Gorongosaecosystem. D.Sc. Thesis, University of Pretoria,South Africa.
Trollope, W.S.W. 1982. Ecological effects of firein South African savannas. In: Huntley, B.J. andWalker, B.H. (eds). Ecology of tropicalsavannas. Ecological Studies 42, pp. 292-306.Springer-Verlag, Berlin, New York.
Trollope, W.S.W. 1984. Fire in savanna. In:Booysen, P. de V. and Tainton, N.M. (eds).Ecological effects of fire in South Africanecosystems. Ecological Studies 48, pp. 149-176.Springer-Verlag, Berlin, New York.
UNEP 1996. Assessment of biological diversity andmethodologies for future assessments.Convention of Biodiversity Report UNEP/CBD/SBSTTA/2/2.UNEP
Vane-Wright, R.I., Humphries, C.J. and Williams,P.H. (1991). What to protect? – systematics andthe agony of choice. Biological Conservation55: 235-254.
Van Tongeren, O,F.R. 1995. Cluster Analysis. In:Jongman, R.H.G., ter Braak, C.J.F. and vanTongeren, O.F.R. (eds). Data analysis incommunity and landscape ecology, pp. 174-212. Cambridge University Press, Cambridge.
Whitlow, J.R. 1985. Dambos in Zimbabwe: areview. Zeitschrift fur GeomorphologieSupplementband 52: 115-146.
Williams, J. 2001. State of the environmentAustralia 2001. Biodiversity theme report.Commonwealth of Australia, Canbera.
Yeaton, R.I. 1988. Porcupines, fire and thedynamics of the tree layer of Burkea africanasavanna. Journal of Ecology 76: 1017-1029.
Zolho, R., Nyaunga, F.C., Fonseca, A.M.L. andChicote, E.A.J. 1998. Projecto CommunitarioPesqueiro de Muaredzi e Dingue Dingue. 1aConferencia Nacional sobre ManeioCommunitario dos Recursos Naturias, Maputo.

94
VIII. Appendices
Appendix 1. Data sheets used for field sampling for modelconfrontation
CIFOR/TREP GORONGOSA RESEARCH PROJECT 2001/2002CONFRONTATION OF BENEFIT-COST MODEL
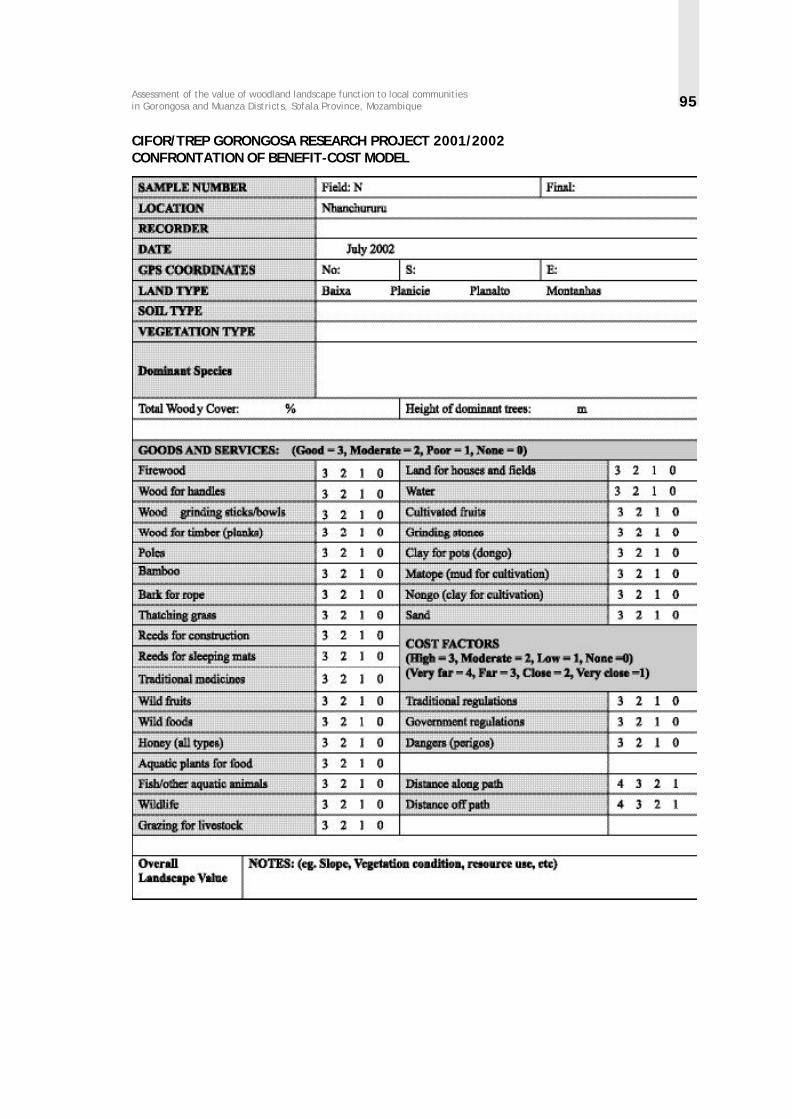
95Assessment of the value of woodland landscape function to local communitiesin Gorongosa and Muanza Districts, Sofala Province, Mozambique
CIFOR/TREP GORONGOSA RESEARCH PROJECT 2001/2002CONFRONTATION OF BENEFIT-COST MODEL
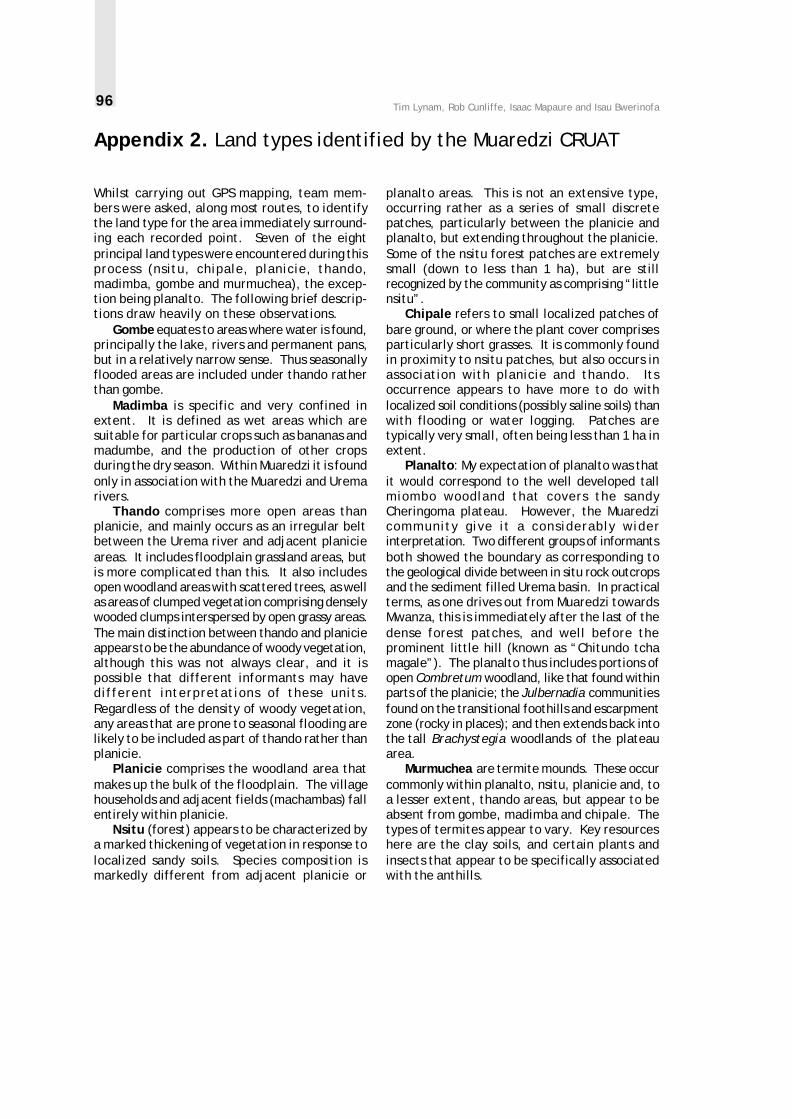
96 Tim Lynam, Rob Cunliffe, Isaac Mapaure and Isau Bwerinofa
Whilst carrying out GPS mapping, team mem-bers were asked, along most routes, to identifythe land type for the area immediately surround-ing each recorded point. Seven of the eightprincipal land types were encountered during thisprocess (nsitu, chipale, planicie, thando,madimba, gombe and murmuchea), the excep-tion being planalto. The following brief descrip-tions draw heavily on these observations.
Gombe equates to areas where water is found,principally the lake, rivers and permanent pans,but in a relatively narrow sense. Thus seasonallyflooded areas are included under thando ratherthan gombe.
Madimba is specific and very confined inextent. It is defined as wet areas which aresuitable for particular crops such as bananas andmadumbe, and the production of other cropsduring the dry season. Within Muaredzi it is foundonly in association with the Muaredzi and Uremarivers.
Thando comprises more open areas thanplanicie, and mainly occurs as an irregular beltbetween the Urema river and adjacent planicieareas. It includes floodplain grassland areas, butis more complicated than this. It also includesopen woodland areas with scattered trees, as wellas areas of clumped vegetation comprising denselywooded clumps interspersed by open grassy areas.The main distinction between thando and planicieappears to be the abundance of woody vegetation,although this was not always clear, and it ispossible that different informants may havedifferent interpretations of these units.Regardless of the density of woody vegetation,any areas that are prone to seasonal flooding arelikely to be included as part of thando rather thanplanicie.
Planicie comprises the woodland area thatmakes up the bulk of the floodplain. The villagehouseholds and adjacent fields (machambas) fallentirely within planicie.
Nsitu (forest) appears to be characterized bya marked thickening of vegetation in response tolocalized sandy soils. Species composition ismarkedly different from adjacent planicie or
planalto areas. This is not an extensive type,occurring rather as a series of small discretepatches, particularly between the planicie andplanalto, but extending throughout the planicie.Some of the nsitu forest patches are extremelysmall (down to less than 1 ha), but are stillrecognized by the community as comprising “littlensitu”.
Chipale refers to small localized patches ofbare ground, or where the plant cover comprisesparticularly short grasses. It is commonly foundin proximity to nsitu patches, but also occurs inassociation with planicie and thando. Itsoccurrence appears to have more to do withlocalized soil conditions (possibly saline soils) thanwith flooding or water logging. Patches aretypically very small, often being less than 1 ha inextent.
Planalto: My expectation of planalto was thatit would correspond to the well developed tallmiombo woodland that covers the sandyCheringoma plateau. However, the Muaredzicommunity give it a considerably widerinterpretation. Two different groups of informantsboth showed the boundary as corresponding tothe geological divide between in situ rock outcropsand the sediment filled Urema basin. In practicalterms, as one drives out from Muaredzi towardsMwanza, this is immediately after the last of thedense forest patches, and well before theprominent little hill (known as “Chitundo tchamagale”). The planalto thus includes portions ofopen Combretum woodland, like that found withinparts of the planicie; the Julbernadia communitiesfound on the transitional foothills and escarpmentzone (rocky in places); and then extends back intothe tall Brachystegia woodlands of the plateauarea.
Murmuchea are termite mounds. These occurcommonly within planalto, nsitu, planicie and, toa lesser extent, thando areas, but appear to beabsent from gombe, madimba and chipale. Thetypes of termites appear to vary. Key resourceshere are the clay soils, and certain plants andinsects that appear to be specifically associatedwith the anthills.
Appendix 2. Land types identified by the Muaredzi CRUAT
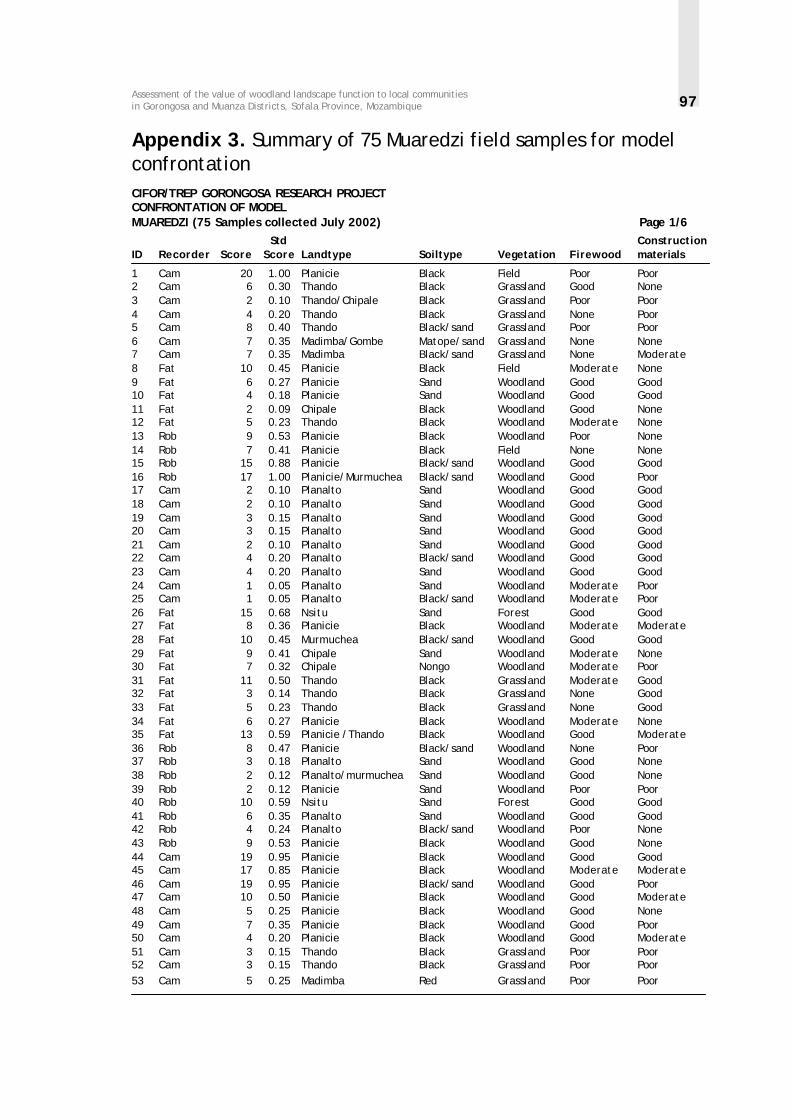
97Assessment of the value of woodland landscape function to local communitiesin Gorongosa and Muanza Districts, Sofala Province, Mozambique
Appendix 3. Summary of 75 Muaredzi field samples for modelconfrontationCIFOR/TREP GORONGOSA RESEARCH PROJECTCONFRONTATION OF MODELMUAREDZI (75 Samples collected July 2002) Page 1/6
Std ConstructionID Recorder Score Score Landtype Soiltype Vegetation Firewood materials
1 Cam 20 1.00 Planicie Black Field Poor Poor2 Cam 6 0.30 Thando Black Grassland Good None3 Cam 2 0.10 Thando/Chipale Black Grassland Poor Poor4 Cam 4 0.20 Thando Black Grassland None Poor5 Cam 8 0.40 Thando Black/sand Grassland Poor Poor6 Cam 7 0.35 Madimba/Gombe Matope/sand Grassland None None7 Cam 7 0.35 Madimba Black/sand Grassland None Moderate8 Fat 10 0.45 Planicie Black Field Moderate None9 Fat 6 0.27 Planicie Sand Woodland Good Good10 Fat 4 0.18 Planicie Sand Woodland Good Good11 Fat 2 0.09 Chipale Black Woodland Good None12 Fat 5 0.23 Thando Black Woodland Moderate None13 Rob 9 0.53 Planicie Black Woodland Poor None14 Rob 7 0.41 Planicie Black Field None None15 Rob 15 0.88 Planicie Black/sand Woodland Good Good16 Rob 17 1.00 Planicie/Murmuchea Black/sand Woodland Good Poor17 Cam 2 0.10 Planalto Sand Woodland Good Good18 Cam 2 0.10 Planalto Sand Woodland Good Good19 Cam 3 0.15 Planalto Sand Woodland Good Good20 Cam 3 0.15 Planalto Sand Woodland Good Good21 Cam 2 0.10 Planalto Sand Woodland Good Good22 Cam 4 0.20 Planalto Black/sand Woodland Good Good23 Cam 4 0.20 Planalto Sand Woodland Good Good24 Cam 1 0.05 Planalto Sand Woodland Moderate Poor25 Cam 1 0.05 Planalto Black/sand Woodland Moderate Poor26 Fat 15 0.68 Nsitu Sand Forest Good Good27 Fat 8 0.36 Planicie Black Woodland Moderate Moderate28 Fat 10 0.45 Murmuchea Black/sand Woodland Good Good29 Fat 9 0.41 Chipale Sand Woodland Moderate None30 Fat 7 0.32 Chipale Nongo Woodland Moderate Poor31 Fat 11 0.50 Thando Black Grassland Moderate Good32 Fat 3 0.14 Thando Black Grassland None Good33 Fat 5 0.23 Thando Black Grassland None Good34 Fat 6 0.27 Planicie Black Woodland Moderate None35 Fat 13 0.59 Planicie /Thando Black Woodland Good Moderate36 Rob 8 0.47 Planicie Black/sand Woodland None Poor37 Rob 3 0.18 Planalto Sand Woodland Good None38 Rob 2 0.12 Planalto/murmuchea Sand Woodland Good None39 Rob 2 0.12 Planicie Sand Woodland Poor Poor40 Rob 10 0.59 Nsitu Sand Forest Good Good41 Rob 6 0.35 Planalto Sand Woodland Good Good42 Rob 4 0.24 Planalto Black/sand Woodland Poor None43 Rob 9 0.53 Planicie Black Woodland Good None44 Cam 19 0.95 Planicie Black Woodland Good Good45 Cam 17 0.85 Planicie Black Woodland Moderate Moderate46 Cam 19 0.95 Planicie Black/sand Woodland Good Poor47 Cam 10 0.50 Planicie Black Woodland Good Moderate48 Cam 5 0.25 Planicie Black Woodland Good None49 Cam 7 0.35 Planicie Black Woodland Good Poor50 Cam 4 0.20 Planicie Black Woodland Good Moderate51 Cam 3 0.15 Thando Black Grassland Poor Poor52 Cam 3 0.15 Thando Black Grassland Poor Poor53 Cam 5 0.25 Madimba Red Grassland Poor Poor
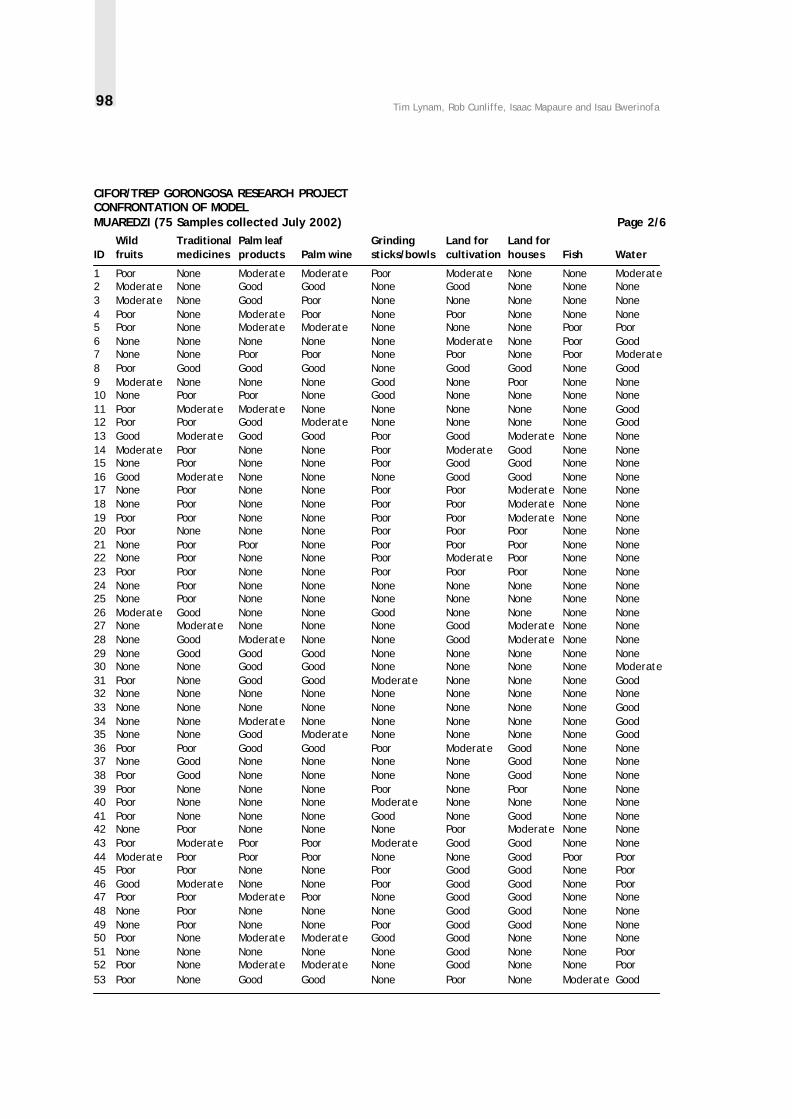
98 Tim Lynam, Rob Cunliffe, Isaac Mapaure and Isau Bwerinofa
CIFOR/TREP GORONGOSA RESEARCH PROJECTCONFRONTATION OF MODELMUAREDZI (75 Samples collected July 2002) Page 2/6
Wild Traditional Palm leaf Grinding Land for Land forID fruits medicines products Palm wine sticks/bowls cultivation houses Fish Water
1 Poor None Moderate Moderate Poor Moderate None None Moderate2 Moderate None Good Good None Good None None None3 Moderate None Good Poor None None None None None4 Poor None Moderate Poor None Poor None None None5 Poor None Moderate Moderate None None None Poor Poor6 None None None None None Moderate None Poor Good7 None None Poor Poor None Poor None Poor Moderate8 Poor Good Good Good None Good Good None Good9 Moderate None None None Good None Poor None None10 None Poor Poor None Good None None None None11 Poor Moderate Moderate None None None None None Good12 Poor Poor Good Moderate None None None None Good13 Good Moderate Good Good Poor Good Moderate None None14 Moderate Poor None None Poor Moderate Good None None15 None Poor None None Poor Good Good None None16 Good Moderate None None None Good Good None None17 None Poor None None Poor Poor Moderate None None18 None Poor None None Poor Poor Moderate None None19 Poor Poor None None Poor Poor Moderate None None20 Poor None None None Poor Poor Poor None None21 None Poor Poor None Poor Poor Poor None None22 None Poor None None Poor Moderate Poor None None23 Poor Poor None None Poor Poor Poor None None24 None Poor None None None None None None None25 None Poor None None None None None None None26 Moderate Good None None Good None None None None27 None Moderate None None None Good Moderate None None28 None Good Moderate None None Good Moderate None None29 None Good Good Good None None None None None30 None None Good Good None None None None Moderate31 Poor None Good Good Moderate None None None Good32 None None None None None None None None None33 None None None None None None None None Good34 None None Moderate None None None None None Good35 None None Good Moderate None None None None Good36 Poor Poor Good Good Poor Moderate Good None None37 None Good None None None None Good None None38 Poor Good None None None None Good None None39 Poor None None None Poor None Poor None None40 Poor None None None Moderate None None None None41 Poor None None None Good None Good None None42 None Poor None None None Poor Moderate None None43 Poor Moderate Poor Poor Moderate Good Good None None44 Moderate Poor Poor Poor None None Good Poor Poor45 Poor Poor None None Poor Good Good None Poor46 Good Moderate None None Poor Good Good None Poor47 Poor Poor Moderate Poor None Good Good None None48 None Poor None None None Good Good None None49 None Poor None None Poor Good Good None None50 Poor None Moderate Moderate Good Good None None None51 None None None None None Good None None Poor52 Poor None Moderate Moderate None Good None None Poor53 Poor None Good Good None Poor None Moderate Good
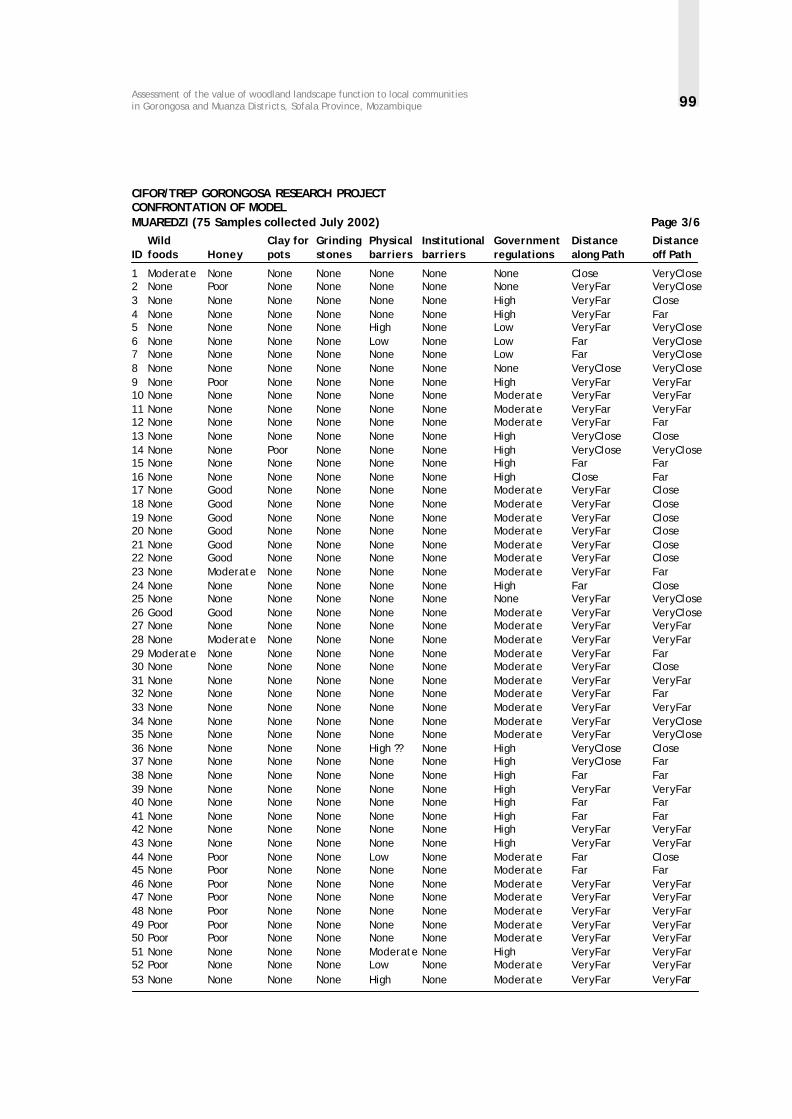
99Assessment of the value of woodland landscape function to local communitiesin Gorongosa and Muanza Districts, Sofala Province, Mozambique
CIFOR/TREP GORONGOSA RESEARCH PROJECTCONFRONTATION OF MODELMUAREDZI (75 Samples collected July 2002) Page 3/6
Wild Clay for Grinding Physical Institutional Government Distance DistanceID foods Honey pots stones barriers barriers regulations along Path off Path
1 Moderate None None None None None None Close VeryClose2 None Poor None None None None None VeryFar VeryClose3 None None None None None None High VeryFar Close4 None None None None None None High VeryFar Far5 None None None None High None Low VeryFar VeryClose6 None None None None Low None Low Far VeryClose7 None None None None None None Low Far VeryClose8 None None None None None None None VeryClose VeryClose9 None Poor None None None None High VeryFar VeryFar10 None None None None None None Moderate VeryFar VeryFar11 None None None None None None Moderate VeryFar VeryFar12 None None None None None None Moderate VeryFar Far13 None None None None None None High VeryClose Close14 None None Poor None None None High VeryClose VeryClose15 None None None None None None High Far Far16 None None None None None None High Close Far17 None Good None None None None Moderate VeryFar Close18 None Good None None None None Moderate VeryFar Close19 None Good None None None None Moderate VeryFar Close20 None Good None None None None Moderate VeryFar Close21 None Good None None None None Moderate VeryFar Close22 None Good None None None None Moderate VeryFar Close23 None Moderate None None None None Moderate VeryFar Far24 None None None None None None High Far Close25 None None None None None None None VeryFar VeryClose26 Good Good None None None None Moderate VeryFar VeryClose27 None None None None None None Moderate VeryFar VeryFar28 None Moderate None None None None Moderate VeryFar VeryFar29 Moderate None None None None None Moderate VeryFar Far30 None None None None None None Moderate VeryFar Close31 None None None None None None Moderate VeryFar VeryFar32 None None None None None None Moderate VeryFar Far33 None None None None None None Moderate VeryFar VeryFar34 None None None None None None Moderate VeryFar VeryClose35 None None None None None None Moderate VeryFar VeryClose36 None None None None High ?? None High VeryClose Close37 None None None None None None High VeryClose Far38 None None None None None None High Far Far39 None None None None None None High VeryFar VeryFar40 None None None None None None High Far Far41 None None None None None None High Far Far42 None None None None None None High VeryFar VeryFar43 None None None None None None High VeryFar VeryFar44 None Poor None None Low None Moderate Far Close45 None Poor None None None None Moderate Far Far46 None Poor None None None None Moderate VeryFar VeryFar47 None Poor None None None None Moderate VeryFar VeryFar48 None Poor None None None None Moderate VeryFar VeryFar49 Poor Poor None None None None Moderate VeryFar VeryFar50 Poor Poor None None None None Moderate VeryFar VeryFar51 None None None None Moderate None High VeryFar VeryFar52 Poor None None None Low None Moderate VeryFar VeryFar53 None None None None High None Moderate VeryFar VeryFar

100 Tim Lynam, Rob Cunliffe, Isaac Mapaure and Isau Bwerinofa
CIFOR/TREP GORONGOSA RESEARCH PROJECTCONFRONTATION OF MODELMUAREDZI (75 Samples collected July 2002) Page 4/6
Std ConstructionID Recorder Score Score Landtype Soiltype Vegetation Firewood materials
54 Soz 10 0.71 Planicie Black Woodland Good Good55 Soz 5 0.36 Planicie Black Woodland Good None56 Soz 7 0.50 Planicie/Murmuchea Black Woodland Good None57 Soz 4 0.29 Gombe Sand Woodland Poor None58 Soz 6 0.43 Planicie Black Woodland Good None59 Soz 14 1.00 Nsitu Sand Forest Good Good60 Fat 15 0.68 Planicie Black/sand Field Good Moderate61 Fat 22 1.00 Planicie Black Household Good Poor62 Fat 12 0.55 Planicie Black Field Moderate Moderate63 Fat 10 0.45 Thando Sand Woodland Good Moderate64 Fat 20 0.91 Madimba Black Woodland Moderate Moderate65 Fat 13 0.59 Planicie Black/sand Field Good None66 Fat 8 0.36 Planicie Black Field Moderate Moderate67 Fat 9 0.41 Planicie Black Field Good None68 Fat 5 0.23 Planicie Black Woodland None None69 Fat 6 0.27 Planicie Black Woodland Good Moderate70 Rob 17 1.00 Planicie Black Woodland Good None71 Rob 13 0.76 Nsitu/Murmuchea Sand Forest Good Good72 Rob 14 0.82 Planicie Black Woodland Good None73 Rob 13 0.76 Planicie Black Woodland Good None74 Rob 14 0.82 Planicie Black Woodland Good Good75 Rob 4 0.24 Gombe/Madimba Sand Reeds None None
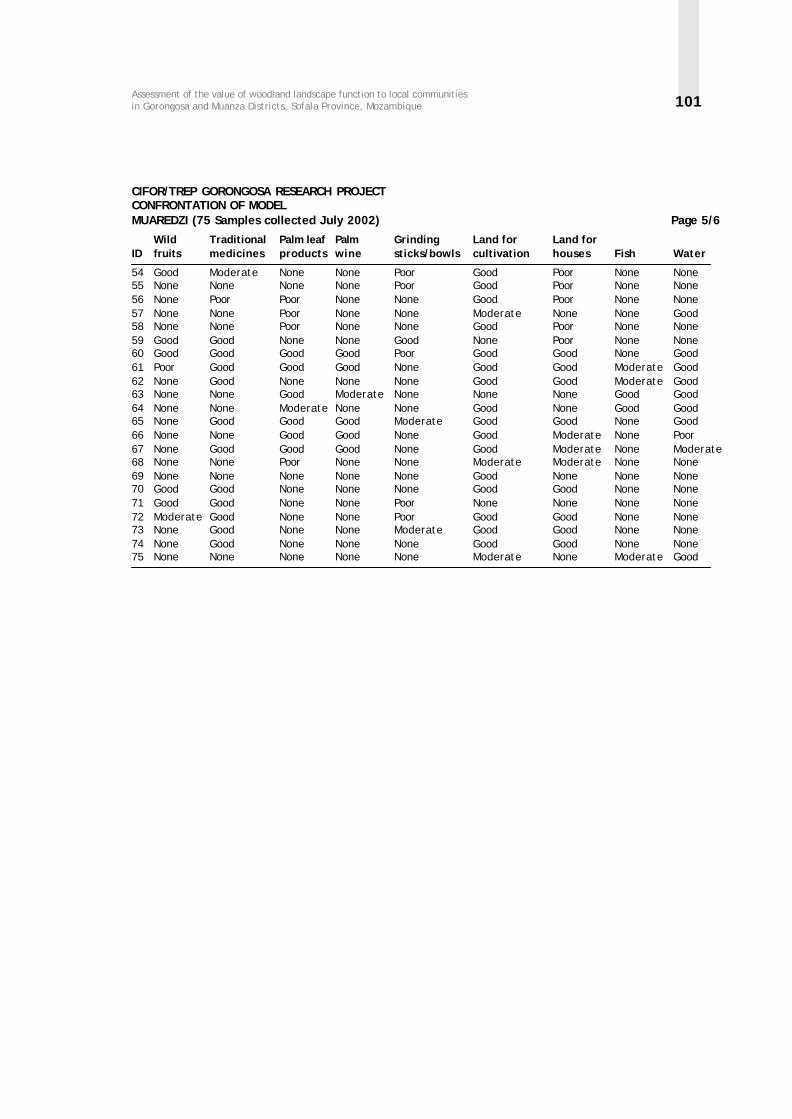
101Assessment of the value of woodland landscape function to local communitiesin Gorongosa and Muanza Districts, Sofala Province, Mozambique
CIFOR/TREP GORONGOSA RESEARCH PROJECTCONFRONTATION OF MODELMUAREDZI (75 Samples collected July 2002) Page 5/6
Wild Traditional Palm leaf Palm Grinding Land for Land forID fruits medicines products wine sticks/bowls cultivation houses Fish Water
54 Good Moderate None None Poor Good Poor None None55 None None None None Poor Good Poor None None56 None Poor Poor None None Good Poor None None57 None None Poor None None Moderate None None Good58 None None Poor None None Good Poor None None59 Good Good None None Good None Poor None None60 Good Good Good Good Poor Good Good None Good61 Poor Good Good Good None Good Good Moderate Good62 None Good None None None Good Good Moderate Good63 None None Good Moderate None None None Good Good64 None None Moderate None None Good None Good Good65 None Good Good Good Moderate Good Good None Good66 None None Good Good None Good Moderate None Poor67 None Good Good Good None Good Moderate None Moderate68 None None Poor None None Moderate Moderate None None69 None None None None None Good None None None70 Good Good None None None Good Good None None71 Good Good None None Poor None None None None72 Moderate Good None None Poor Good Good None None73 None Good None None Moderate Good Good None None74 None Good None None None Good Good None None75 None None None None None Moderate None Moderate Good

102 Tim Lynam, Rob Cunliffe, Isaac Mapaure and Isau Bwerinofa
CIFOR/TREP GORONGOSA RESEARCH PROJECTCONFRONTATION OF MODELMUAREDZI (75 Samples collected July 2002) Page 6/6
Wild Clay for Grinding Physical Institutional Government Distance DistanceID foods Honey pots stones barriers barriers regulations along Path off Path
54 None None None None None None High VeryFar VeryFar55 None None None None None None High VeryFar VeryFar56 Poor None None None None None High VeryFar VeryFar57 None None None None None None High VeryFar VeryFar58 None None None None None None High VeryFar VeryFar59 Good None None None None None High VeryFar VeryFar60 None None None None None None Moderate Close VeryClose61 None None Good Good None None Moderate VeryClose VeryClose62 None None Good None None None Moderate VeryClose VeryClose63 None None Good None None None Moderate Close VeryClose64 None None Good None None None Moderate Far Far65 None None None None None None Moderate VeryClose VeryClose66 None None None None None None Moderate Far Close67 Moderate None None None None None Moderate Close VeryFar68 None None None None None None Moderate VeryFar VeryFar69 None None None None None None Moderate VeryFar VeryFar70 None None None None None None High VeryClose Far71 None None None None None None High VeryClose Far72 None None None None None None High Far Far73 None None None None None None High VeryFar VeryFar74 None None None None None None High VeryFar VeryFar75 None None None None Moderate None High VeryClose Close
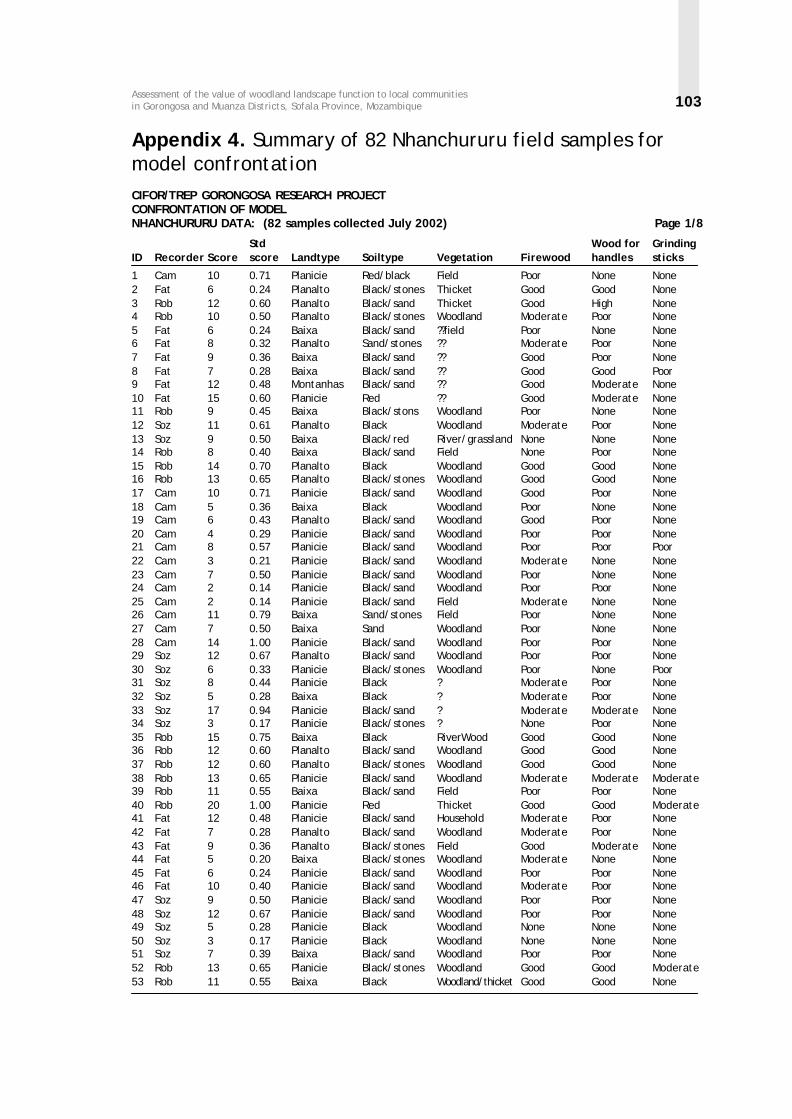
103Assessment of the value of woodland landscape function to local communitiesin Gorongosa and Muanza Districts, Sofala Province, Mozambique
Appendix 4. Summary of 82 Nhanchururu field samples formodel confrontationCIFOR/TREP GORONGOSA RESEARCH PROJECTCONFRONTATION OF MODELNHANCHURURU DATA: (82 samples collected July 2002) Page 1/8
Std Wood for GrindingID Recorder Score score Landtype Soiltype Vegetation Firewood handles sticks
1 Cam 10 0.71 Planicie Red/black Field Poor None None2 Fat 6 0.24 Planalto Black/stones Thicket Good Good None3 Rob 12 0.60 Planalto Black/sand Thicket Good High None4 Rob 10 0.50 Planalto Black/stones Woodland Moderate Poor None5 Fat 6 0.24 Baixa Black/sand ??field Poor None None6 Fat 8 0.32 Planalto Sand/stones ?? Moderate Poor None7 Fat 9 0.36 Baixa Black/sand ?? Good Poor None8 Fat 7 0.28 Baixa Black/sand ?? Good Good Poor9 Fat 12 0.48 Montanhas Black/sand ?? Good Moderate None10 Fat 15 0.60 Planicie Red ?? Good Moderate None11 Rob 9 0.45 Baixa Black/stons Woodland Poor None None12 Soz 11 0.61 Planalto Black Woodland Moderate Poor None13 Soz 9 0.50 Baixa Black/red River/grassland None None None14 Rob 8 0.40 Baixa Black/sand Field None Poor None15 Rob 14 0.70 Planalto Black Woodland Good Good None16 Rob 13 0.65 Planalto Black/stones Woodland Good Good None17 Cam 10 0.71 Planicie Black/sand Woodland Good Poor None18 Cam 5 0.36 Baixa Black Woodland Poor None None19 Cam 6 0.43 Planalto Black/sand Woodland Good Poor None20 Cam 4 0.29 Planicie Black/sand Woodland Poor Poor None21 Cam 8 0.57 Planicie Black/sand Woodland Poor Poor Poor22 Cam 3 0.21 Planicie Black/sand Woodland Moderate None None23 Cam 7 0.50 Planicie Black/sand Woodland Poor None None24 Cam 2 0.14 Planicie Black/sand Woodland Poor Poor None25 Cam 2 0.14 Planicie Black/sand Field Moderate None None26 Cam 11 0.79 Baixa Sand/stones Field Poor None None27 Cam 7 0.50 Baixa Sand Woodland Poor None None28 Cam 14 1.00 Planicie Black/sand Woodland Poor Poor None29 Soz 12 0.67 Planalto Black/sand Woodland Poor Poor None30 Soz 6 0.33 Planicie Black/stones Woodland Poor None Poor31 Soz 8 0.44 Planicie Black ? Moderate Poor None32 Soz 5 0.28 Baixa Black ? Moderate Poor None33 Soz 17 0.94 Planicie Black/sand ? Moderate Moderate None34 Soz 3 0.17 Planicie Black/stones ? None Poor None35 Rob 15 0.75 Baixa Black RiverWood Good Good None36 Rob 12 0.60 Planalto Black/sand Woodland Good Good None37 Rob 12 0.60 Planalto Black/stones Woodland Good Good None38 Rob 13 0.65 Planicie Black/sand Woodland Moderate Moderate Moderate39 Rob 11 0.55 Baixa Black/sand Field Poor Poor None40 Rob 20 1.00 Planicie Red Thicket Good Good Moderate41 Fat 12 0.48 Planicie Black/sand Household Moderate Poor None42 Fat 7 0.28 Planalto Black/sand Woodland Moderate Poor None43 Fat 9 0.36 Planalto Black/stones Field Good Moderate None44 Fat 5 0.20 Baixa Black/stones Woodland Moderate None None45 Fat 6 0.24 Planicie Black/sand Woodland Poor Poor None46 Fat 10 0.40 Planicie Black/sand Woodland Moderate Poor None47 Soz 9 0.50 Planicie Black/sand Woodland Poor Poor None48 Soz 12 0.67 Planicie Black/sand Woodland Poor Poor None49 Soz 5 0.28 Planicie Black Woodland None None None50 Soz 3 0.17 Planicie Black Woodland None None None51 Soz 7 0.39 Baixa Black/sand Woodland Poor Poor None52 Rob 13 0.65 Planicie Black/stones Woodland Good Good Moderate53 Rob 11 0.55 Baixa Black Woodland/thicket Good Good None
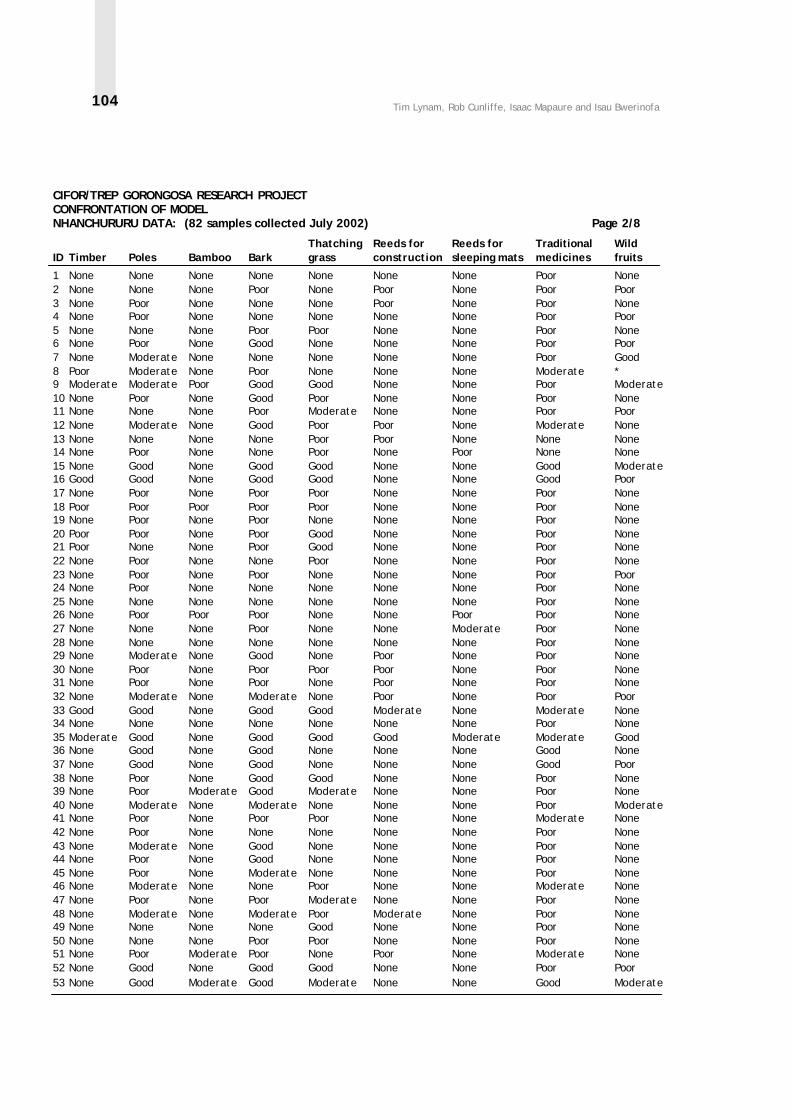
104 Tim Lynam, Rob Cunliffe, Isaac Mapaure and Isau Bwerinofa
CIFOR/TREP GORONGOSA RESEARCH PROJECTCONFRONTATION OF MODELNHANCHURURU DATA: (82 samples collected July 2002) Page 2/8
Thatching Reeds for Reeds for Traditional WildID Timber Poles Bamboo Bark grass construction sleeping mats medicines fruits
1 None None None None None None None Poor None2 None None None Poor None Poor None Poor Poor3 None Poor None None None Poor None Poor None4 None Poor None None None None None Poor Poor5 None None None Poor Poor None None Poor None6 None Poor None Good None None None Poor Poor7 None Moderate None None None None None Poor Good8 Poor Moderate None Poor None None None Moderate *9 Moderate Moderate Poor Good Good None None Poor Moderate10 None Poor None Good Poor None None Poor None11 None None None Poor Moderate None None Poor Poor12 None Moderate None Good Poor Poor None Moderate None13 None None None None Poor Poor None None None14 None Poor None None Poor None Poor None None15 None Good None Good Good None None Good Moderate16 Good Good None Good Good None None Good Poor17 None Poor None Poor Poor None None Poor None18 Poor Poor Poor Poor Poor None None Poor None19 None Poor None Poor None None None Poor None20 Poor Poor None Poor Good None None Poor None21 Poor None None Poor Good None None Poor None22 None Poor None None Poor None None Poor None23 None Poor None Poor None None None Poor Poor24 None Poor None None None None None Poor None25 None None None None None None None Poor None26 None Poor Poor Poor None None Poor Poor None27 None None None Poor None None Moderate Poor None28 None None None None None None None Poor None29 None Moderate None Good None Poor None Poor None30 None Poor None Poor Poor Poor None Poor None31 None Poor None Poor None Poor None Poor None32 None Moderate None Moderate None Poor None Poor Poor33 Good Good None Good Good Moderate None Moderate None34 None None None None None None None Poor None35 Moderate Good None Good Good Good Moderate Moderate Good36 None Good None Good None None None Good None37 None Good None Good None None None Good Poor38 None Poor None Good Good None None Poor None39 None Poor Moderate Good Moderate None None Poor None40 None Moderate None Moderate None None None Poor Moderate41 None Poor None Poor Poor None None Moderate None42 None Poor None None None None None Poor None43 None Moderate None Good None None None Poor None44 None Poor None Good None None None Poor None45 None Poor None Moderate None None None Poor None46 None Moderate None None Poor None None Moderate None47 None Poor None Poor Moderate None None Poor None48 None Moderate None Moderate Poor Moderate None Poor None49 None None None None Good None None Poor None50 None None None Poor Poor None None Poor None51 None Poor Moderate Poor None Poor None Moderate None52 None Good None Good Good None None Poor Poor53 None Good Moderate Good Moderate None None Good Moderate

105Assessment of the value of woodland landscape function to local communitiesin Gorongosa and Muanza Districts, Sofala Province, Mozambique
CIFOR/TREP GORONGOSA RESEARCH PROJECTCONFRONTATION OF MODELNHANCHURURU DATA: (82 samples collected July 2002) Page 3/8
Wild Aquatic Land for Land for CultivatedID foods Honey food plants Fish Wildlife Livestock houses fields Water fruits
1 None None None None None Poor Good Poor None Poor2 None None None None None None Poor Poor None Poor3 None None None None Poor None Good Good None None4 Poor None None None None Poor Poor Poor None None5 None None None None None Good None Good None Good6 None None None None Poor Poor None Moderate None Good7 None None None None Poor Poor None Poor None Good8 Poor None None None None Good None Good None None9 Poor None None None Poor Good None Good None Good10 None None None None None Poor Good Good None Moderate11 None None None None None Good Poor Poor None Poor12 None None None None None Poor Poor Moderate None None13 None None None None None Moderate None Moderate None None14 None None Poor None None Poor None Moderate None Good15 None Poor None None Good Good Good Good None None16 Poor Poor None None Good Good None Moderate None None17 None None None None None Good Good Good None None18 None None None None * Moderate None Poor None None19 None None None None None None Good Poor None Poor20 None None None None None Poor Moderate None None None21 None None None None None Poor Good None None None22 None None None None None * Moderate None None None23 Poor None None None None None Moderate Poor None None24 None None None None None None Moderate None None None25 None None None None None * Moderate Poor None None26 None None Poor None None Poor None Poor None None27 None None Moderate None None * None Poor None Poor28 None None None None None Poor Good Moderate None Moderate29 None None None None None Poor Good Good None None30 None None None None None Moderate Poor Poor None None31 None None None None None Moderate None Good None None32 None None None None * Poor None Moderate None None33 None None None None None Good Poor Poor None None34 Poor None None None * Poor Poor Poor None None35 None Poor Good Good Poor Good None None Good None36 Moderate None None None Good None Poor None None None37 Poor None None None Poor None None None None None38 Poor None None None Good Good Good Poor None None39 Moderate None None None Moderate Good None Good None Good40 Good None None None Good None Good Good None None41 None None None None None Moderate Moderate None None Good42 Moderate None None None None Poor None Good None Moderate43 None None None None None None None Poor None None44 None None None None None Poor None Moderate None Poor45 None None None None None Good None Moderate None None46 None None None None None Moderate Moderate None None None47 None None None None None Moderate Moderate Poor None None48 None None None None None Moderate Poor Poor None None49 None None None None None Moderate Poor Poor None None50 None None None None None Moderate Poor Poor None None51 None None None None None Moderate None Poor None None52 None None None None Good Good Moderate Moderate None None53 Moderate None None None Good Good None Moderate None None
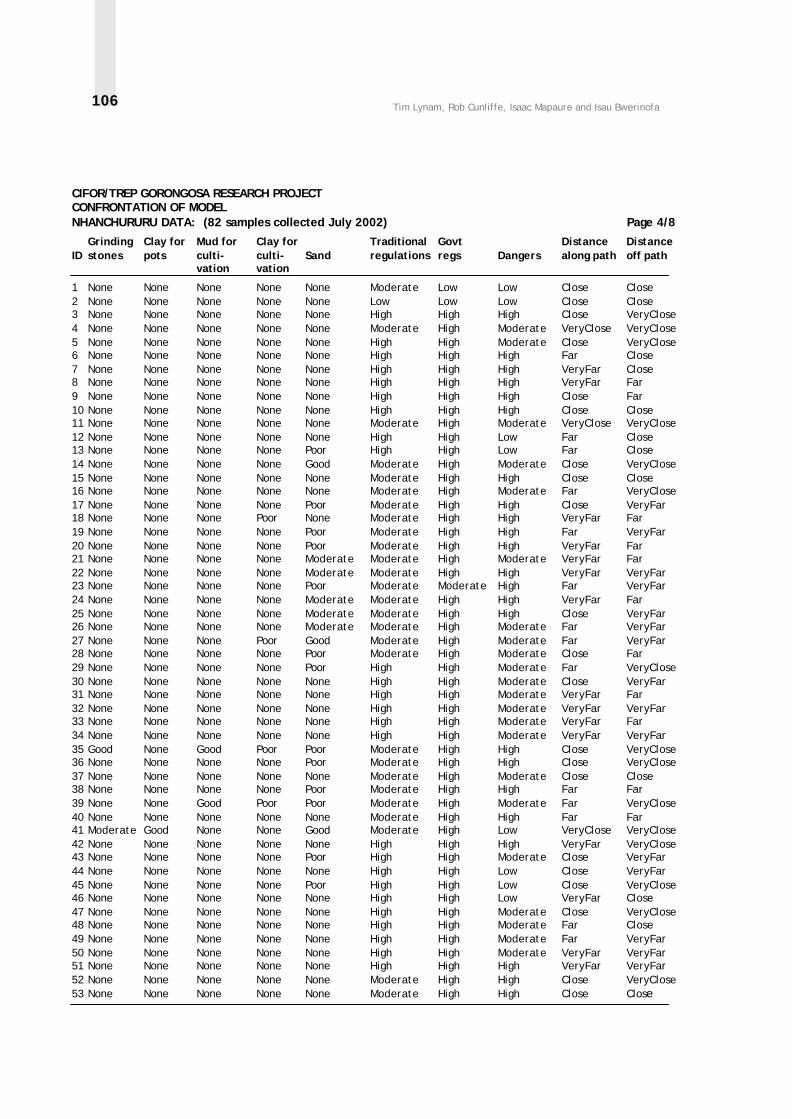
106 Tim Lynam, Rob Cunliffe, Isaac Mapaure and Isau Bwerinofa
CIFOR/TREP GORONGOSA RESEARCH PROJECTCONFRONTATION OF MODELNHANCHURURU DATA: (82 samples collected July 2002) Page 4/8
Grinding Clay for Mud for Clay for Traditional Govt Distance DistanceID stones pots culti- culti- Sand regulations regs Dangers along path off path
vation vation
1 None None None None None Moderate Low Low Close Close2 None None None None None Low Low Low Close Close3 None None None None None High High High Close VeryClose4 None None None None None Moderate High Moderate VeryClose VeryClose5 None None None None None High High Moderate Close VeryClose6 None None None None None High High High Far Close7 None None None None None High High High VeryFar Close8 None None None None None High High High VeryFar Far9 None None None None None High High High Close Far10 None None None None None High High High Close Close11 None None None None None Moderate High Moderate VeryClose VeryClose12 None None None None None High High Low Far Close13 None None None None Poor High High Low Far Close14 None None None None Good Moderate High Moderate Close VeryClose15 None None None None None Moderate High High Close Close16 None None None None None Moderate High Moderate Far VeryClose17 None None None None Poor Moderate High High Close VeryFar18 None None None Poor None Moderate High High VeryFar Far19 None None None None Poor Moderate High High Far VeryFar20 None None None None Poor Moderate High High VeryFar Far21 None None None None Moderate Moderate High Moderate VeryFar Far22 None None None None Moderate Moderate High High VeryFar VeryFar23 None None None None Poor Moderate Moderate High Far VeryFar24 None None None None Moderate Moderate High High VeryFar Far25 None None None None Moderate Moderate High High Close VeryFar26 None None None None Moderate Moderate High Moderate Far VeryFar27 None None None Poor Good Moderate High Moderate Far VeryFar28 None None None None Poor Moderate High Moderate Close Far29 None None None None Poor High High Moderate Far VeryClose30 None None None None None High High Moderate Close VeryFar31 None None None None None High High Moderate VeryFar Far32 None None None None None High High Moderate VeryFar VeryFar33 None None None None None High High Moderate VeryFar Far34 None None None None None High High Moderate VeryFar VeryFar35 Good None Good Poor Poor Moderate High High Close VeryClose36 None None None None Poor Moderate High High Close VeryClose37 None None None None None Moderate High Moderate Close Close38 None None None None Poor Moderate High High Far Far39 None None Good Poor Poor Moderate High Moderate Far VeryClose40 None None None None None Moderate High High Far Far41 Moderate Good None None Good Moderate High Low VeryClose VeryClose42 None None None None None High High High VeryFar VeryClose43 None None None None Poor High High Moderate Close VeryFar44 None None None None None High High Low Close VeryFar45 None None None None Poor High High Low Close VeryClose46 None None None None None High High Low VeryFar Close47 None None None None None High High Moderate Close VeryClose48 None None None None None High High Moderate Far Close49 None None None None None High High Moderate Far VeryFar50 None None None None None High High Moderate VeryFar VeryFar51 None None None None None High High High VeryFar VeryFar52 None None None None None Moderate High High Close VeryClose53 None None None None None Moderate High High Close Close

107Assessment of the value of woodland landscape function to local communitiesin Gorongosa and Muanza Districts, Sofala Province, Mozambique
CIFOR/TREP GORONGOSA RESEARCH PROJECTCONFRONTATION OF MODELNHANCHURURU DATA: (82 samples collected July 2002) Page 5/8
Std Wood for GrindingID Recorder Score Score Landtype Soiltype Vegetation Firewood handles sticks
54 Rob 10 0.50 Planicie Black/sand Woodland Moderate Poor None55 Rob 1 0.05 Planalto Black/stones Woodland Good Poor None56 Rob 1 0.05 Baixa Black/stones Thicket-riverine Good Good None57 Rob 1 0.05 Planicie Black/sand Woodland Good Moderate None58 Soz 13 0.72 Planalto Black/sand Woodland Good Moderate Moderate59 Soz 5 0.28 Montanhas Black/stones Woodland Moderate None None60 Soz 9 0.50 Planicie Black/stones Woodland Good Moderate Moderate61 Soz 18 1.00 Planicie Black/sand Woodland Good Good None62 Soz 15 0.83 Baixa Black/stones Woodland Good Moderate Good63 Fat 9 0.36 Planicie Sand Woodland Moderate Moderate None64 Fat 10 0.40 Planicie Black/sand Woodland Good None None65 Fat 8 0.32 Planalto ?? Woodland Moderate Moderate None66 Fat 14 0.56 Planalto Black/sand Woodland Good Good None67 Fat 6 0.24 Baixa Black Field Poor None None68 Fat 20 0.80 Planicie Black/sand Woodland Poor Moderate Poor69 Fat 25 1.00 Planicie Sand/stones Woodland Good Moderate None70 Rob 13 0.65 Planicie Black Woodland Good Good None71 Rob 13 0.65 Planicie Black/sand Woodland Good Good None72 Rob 12 0.60 Baixa Black Woodland Good Good None73 Rob 9 0.45 Baixa Black Woodland Good None None74 Rob 9 0.45 Planalto Black Woodland Good Good None75 Rob 10 0.50 Baixa Black Field None None None76 Rob 11 0.55 Planicie Black/stones Field Poor None None77 Fat 10 0.40 Planicie Sand Field Good Poor Poor78 Fat 12 0.48 Planicie Black Woodland Good Good None79 Fat 15 0.60 Planicie Sand Field Good Moderate m80 Fat 9 0.36 Baixa Black/stones Woodland Moderate Poor None81 Fat 8 0.32 Baixa Black/stones Woodland Moderate Moderate None82 Fat 7 0.28 Planicie Sand/stones Woodland Moderate Moderate None

108 Tim Lynam, Rob Cunliffe, Isaac Mapaure and Isau Bwerinofa
CIFOR/TREP GORONGOSA RESEARCH PROJECTCONFRONTATION OF MODELNHANCHURURU DATA: (82 samples collected July 2002) Page 6/8
Thatching Reeds for Reeds for Traditional WildID Timber Poles Bamboo Bark grass construction sleeping mats medicines fruits
54 None Poor None Good Moderate None None Moderate Moderate55 Good Moderate None Moderate Good None None Poor Poor56 Good Moderate None None Moderate None None Good Good57 Good Good None Moderate Moderate None None Moderate None58 Good Moderate None Good Poor Poor None Poor None59 None Poor None Moderate Good None None Poor Moderate60 None Good None Good Moderate Poor None Good None61 None Good None Good Good Moderate None Good Moderate62 Moderate Good None Good Good Moderate None Moderate Moderate63 Poor Moderate None Good None None None Poor None64 Moderate Moderate None Good Moderate None None Poor None65 None Good None None None None None Moderate None66 None Good None Good Poor None None Moderate None67 Poor Poor None Poor Moderate Moderate None Poor None68 None Moderate None Good Good None None Poor None69 None Moderate None Good Moderate None None Moderate Moderate70 None Good None Good Good None None Moderate Good71 Poor Good None None Good None None Poor Moderate72 None Poor Good Poor Good None Good Good Good73 None Moderate Good Good Good None None Good None74 Poor Good None Good Poor None None Moderate None75 None None None None Good None Moderate Poor None76 None None None None None None None Poor None77 None Moderate None Moderate None None None Poor None78 None Good None Good Moderate None None Poor None79 Moderate Moderate None Moderate Poor None None Poor Moderate80 None Moderate None Good None None None Moderate None81 None Moderate None Good Moderate None None Poor Moderate82 None Poor None Good Poor None None Moderate Poor

109Assessment of the value of woodland landscape function to local communitiesin Gorongosa and Muanza Districts, Sofala Province, Mozambique
CIFOR/TREP GORONGOSA RESEARCH PROJECTCONFRONTATION OF MODELNHANCHURURU DATA: (82 samples collected July 2002) Page 7/8
Wild Aquatic Land for Land for CultivatedID foods Honey food plants Fish Wildlife Livestock houses fields Water fruits
54 Moderate None None None Moderate Moderate Poor None None None55 Poor None None None Good Good Good Moderate None None56 g g None None Good Good None Good None None57 None g None None Good Good Good None None None58 None None None None None Poor Poor Poor None None59 None None None None None Good None Poor None None60 None None None None None Moderate Poor Poor None None61 Moderate None None None None Moderate Poor Poor None None62 None None None None None Moderate Poor Poor None None63 None None None None None Poor Poor None None None64 None None None None None Poor Poor None None None65 None None None None None Poor Poor None None None66 None None None None None None None None None None67 None None None None None Poor None Poor None None68 None None None None None Poor Good Good None Moderate69 None None None None None Moderate Moderate None None None70 None None None None Poor Good Poor Poor None Poor71 Poor None None None Moderate Good Poor Moderate None None72 Good None Poor None Moderate Good None Good None None73 g None None None Moderate Good None Moderate None None74 g None None None Poor Poor Good None None None75 None None Poor p Poor Good None Moderate Moderate Moderate76 None None Poor None None None Good Good None Poor77 None None None None None Moderate Moderate Moderate None Moderate78 None None None None None Moderate None Moderate None None79 Moderate None None None None Good Good None None None80 None None None None None Poor None None None None81 None None None None None Moderate None None None None82 None None None None None Moderate Poor None None None
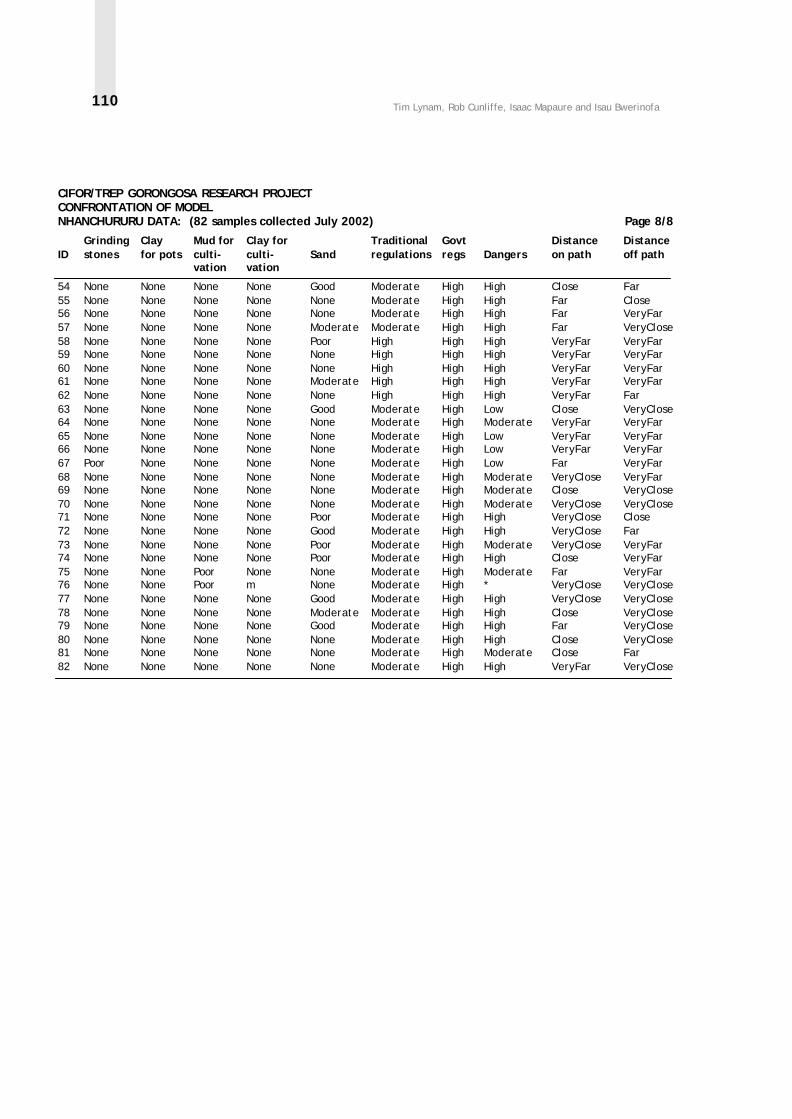
110 Tim Lynam, Rob Cunliffe, Isaac Mapaure and Isau Bwerinofa
CIFOR/TREP GORONGOSA RESEARCH PROJECTCONFRONTATION OF MODELNHANCHURURU DATA: (82 samples collected July 2002) Page 8/8
Grinding Clay Mud for Clay for Traditional Govt Distance DistanceID stones for pots culti- culti- Sand regulations regs Dangers on path off path
vation vation
54 None None None None Good Moderate High High Close Far55 None None None None None Moderate High High Far Close56 None None None None None Moderate High High Far VeryFar57 None None None None Moderate Moderate High High Far VeryClose58 None None None None Poor High High High VeryFar VeryFar59 None None None None None High High High VeryFar VeryFar60 None None None None None High High High VeryFar VeryFar61 None None None None Moderate High High High VeryFar VeryFar62 None None None None None High High High VeryFar Far63 None None None None Good Moderate High Low Close VeryClose64 None None None None None Moderate High Moderate VeryFar VeryFar65 None None None None None Moderate High Low VeryFar VeryFar66 None None None None None Moderate High Low VeryFar VeryFar67 Poor None None None None Moderate High Low Far VeryFar68 None None None None None Moderate High Moderate VeryClose VeryFar69 None None None None None Moderate High Moderate Close VeryClose70 None None None None None Moderate High Moderate VeryClose VeryClose71 None None None None Poor Moderate High High VeryClose Close72 None None None None Good Moderate High High VeryClose Far73 None None None None Poor Moderate High Moderate VeryClose VeryFar74 None None None None Poor Moderate High High Close VeryFar75 None None Poor None None Moderate High Moderate Far VeryFar76 None None Poor m None Moderate High * VeryClose VeryClose77 None None None None Good Moderate High High VeryClose VeryClose78 None None None None Moderate Moderate High High Close VeryClose79 None None None None Good Moderate High High Far VeryClose80 None None None None None Moderate High High Close VeryClose81 None None None None None Moderate High Moderate Close Far82 None None None None None Moderate High High VeryFar VeryClose

111Assessment of the value of woodland landscape function to local communitiesin Gorongosa and Muanza Districts, Sofala Province, Mozambique
Appendix 5. GPS point data for the vegetation inventorysites in Muredzi and Nhanchururu
ISBN 979-3361-11-5
Tim Lynam, Rob Cunliffe, Isaac Mapaure and Isau Bwerinofa
Tim Lynam
, Rob Cunliffe, Isaac Mapaure and Isau Bw
erinofa
Assessment of the valueof woodland landscape function tolocal communities in Gorongosa andMuanza Districts, Sofala Province,Mozambique
Assessm
ent of the value of woodland landscape function to local com
munities in
Gorongosa and M
uanza Districts, Sofala Province, M
ozambique