Generic Strategies, Leader Attributes, Environmental ... - CORE
Upload
khangminh22Category
view
0download
0
ASSESSMENT OF SELECTED MATERNAL ATTRIBUTES AND FOOD PRACTICES
IN HOUSEHOLDS WITH M A LNOURISHED AND H O U S E H O L D S WITH WELL
NOURISHED CHILDREN BELOW FIVE YEARS IN
PER 1-URBAN N A I R O B I .
BY
FANITA WUKA5A-HWANTHI
THIS THESIS IS SUBMITTED IN PARTIAL F U LFILLMENT OF THE REQUIREMENT OF THE M A S T E R ’S DEGREE IN APPLIED HUMAN NUTRITION IN THE D E P A R T M E N T OF
FOOD TECHNOLOGY AND NUTRITION, C O L L E G E OF AGRICULTURE VETERINARY SCIENCES.
UNIVERSITY OF NAIROBI.KABETE CAMPUS.
1990. ,

<11)
DECLARATION
THIS IS MY ORIGINAL WORK AND IT HAS NOT RFFN PRESENTED TO ANY OTHER UNIVERSITY.
ITA T. MUKASA—MWANTHI
THIS THESIS HAS BEEN SUBMITTED FOR EXAMINATION AFTER THE SUPERVISION AND APPROVAL OF
DR. G. K. MARITIM PhD.
Lee turerDepartment of Food Technology,
and NutritionUniversity of Nairobi. Kabete Campus.
n.t. I v / W / f t /
DR. N. M. MUROKI PhD.
Senior i.ecturer Department of Food Tecnnoloqy
ana imu x r i c i on.University of Nairooi. K a b e t e Campus.
■>.*■ wh, In

VII 1 /
DEDICATION
TO MY G R A N D M O T H E R A7T7A MUKIBX,
MY PARENTS,
AND MUTUKU,
WHO HAVE DEARLY WORKED FOR MY SUCCESS.

< i V >
Page
T 1 11 .............................................................1
D e c l a r a t i o n ................................................1 1
D e d i c a t i o n ................................................. 11 1
A c k n o w l e d g e m e n t ............................................ I*
A b s t r a c t ............................................... xll-xlv
Definition of T e r m s ....................................... xv
C H A P T E R ONE
INTRODUCTION
1.1. Introduction to the S t u d y .....................1
1.2. Statement of the P r o b l e m ......................3
1.3. Aim of the S t u d y ............................... 6
1.4 Objectives of the S t u d y ........................7
1.5. Research H y p o t h e s e s ........................... 8
1.6. Benefits Expected from the s t u d y ........... 9
1.7. L i mitations of the S t u d y .....................10
CHAPTER TWO.
LITERATURE REVIEW
2.1. M a l n u t r i t i o n .................................... 11
2.2. Factors that InfluenceFood Practices .................................12
2.2.1. Biological F a c t o r s .............................12
2.2.2. Physiological F a c t o r * .........................13
2.2.3. Economical F a c t o r s ............................ 14
TABLE OF CONTENTS.

2.2.4. Soclai F a c t o r s .................................. 16
2.3. Food P r a c t i c e s .................... 17
2.3.1. Food rrocurement-Purchas l n g .................17
2.3.2. Child F e e d i n g ...................................20
2.3.2. 1. Child Feeding P r a c t i c e s ...................... 20
2.3.2.2. Factors Governing F e e d i n g ................ 22
CHAPTER THREE
3.0. Background of the Study A r e a ..................24
CHAPTER FOUR.
RECFARCH METHODOLOGY.
4.1. Study D e s i g n .......................................29
4.1.1. Type of S t u d y ..................................... 29
4.1.2. Sample F r a m e . . . . . ................................ 29
4.1.3. Study C r i t e r i a .................................... 30
4.1.4. Sample S i z e ........................................ 31
4.2. Research P r e p a r a t i o n ................ 32
4.2.1. Happing the Study A r e a ......................... 32
4.2.2. Development and Testing of Research1 n s t r u m e n t ......................................... 32
4.3. Household Selection P r o c e d u r e ................ 34
4.4. Methods of Data Collection-Q u e s tionnaire A d m i n i s t r a t i on ..................30
(i) Demographic D a t a ..............................39
(11) Weight M e a s u r e m e n t ........................... 39
<111> Height M e a s u r e m e n t ........................... 40

<iv) Age D e t e r m i n a t i o n .............................41
(v) Morbidity of indexC h i l d r e n ........................................ 41
<vi) Household Food S u r v e y ........................42
(vil) 24 Hour Dietary R e c a l l ...................... 43
4.5. Data M a n a g e m e n t .................................. 44
4.5.1. Data C i o a n l n g . . ...................................44
4.5.2. Data A n a l y s i s ..................................... 45
CHAPTER FIVE.
RESULTS
5.1. I n troduction..................................... 46
5.2. General DemographicCharacter istics................................. 47
5.2.1. C o m p o s i t i o n and Ageof P o u p u l a t l o n ...................................47
5.2.2. Income S t a t u s .................................... 40
5.3. C l a s s ification of theHouseho ids........................................ 48
5.4. Morbidity Among the indexC h i l d r e n ...........................................50
5.5. Distribution of Householdsin Kariooangi N o r t h ...........................52
5.6. Characteristics of Personsin Different H o u s e h o l d s ....................... 55
5.6.1. Distribution of Personsby A g e ............................................. 55
5.6.2. Gender and Marital S t a t u s .................... 56
5.6.3. Occupation of Household Headsand Household Incomes......................... 58
< V 1 >

(vl i >
5.6.4. Maternal A t t r i b u t e s ............................ 62
5.6.5. Maternal Period ofStay in A r e a ..................................... 65
5.7. Food A c q u i s i t i o n - Pu r c h a s i n g ..................66
5.8. Quantity of Food P u r c h a s e s ................... 69
5.9. 24 Hour Dietary Recall ....................... 71
CHAPTER SIX
DISCUSSION
6.1. I n troduction..................................... 79
6.2. Selection and Classification ofHouaeho Ids........................................ 79
6.3. Selected HouseholdCharacteristics on Nutritoinal S t a t u s . ...81
6.4. Maternal A t t r i b u t e s ............................ 85
6.5. Food P r a c t i c o s ................................... 86
6.6. Child Feeding P r a c t i c e s ....................... 88
CHAPTER SEVEN
CONCLUSIONS AND RECOMMENDATIONS
7.1. C o n c l u s i o n . . ..................................... 51
7.2. Recomoendat Ion.................................. 92
CHAPTER EIGHT
REFERENCES 93-104

< v i i i )
1. Distribution of children Below Five Yearsby Sex and Weight for Age......................50
2. Distribution of tta1nourtshodand Well Nourished Household* by He*1thStatus............................................. 50
Z. Health Status of Malnourishedand Well Nourished Children................... 52
4. Distribution of HouseholdsIn tho Five Village*............................57
5. Distribution of Persons in theDifferent Age Groups............................56
6. Distribution of Houaenold Heads bvGender and Marital Status......................57
7. Occupation o t Household Heads.................58
8. Distribution of Householdsby Income..........................................62
9. M«9n norted Income .......................... 62
10. Distribution of Mother’s byHousehold Type and Income......................64
11. Maternal Period of Stayin Stuoy Area.....................................65
12. Food Purchases by Different Households.....67
13. Number of Well Nourished and Malnourished
Household* Purchasing Different Food
Stuffs..............................................69
14. Average Purchases OfDifferent Foods.................................. 71
15. Distribution of Children bvAmounts of Mai70 Porridge Fed..........................
LIST OF TABLES
75

(lx)
1. Map of Kariobangl N o r t h .......................... 26
2. Selection of H o u s e h o l d s ..........................36
3. Distribution of Households byFan l I y S i z e ..........................................54
4. Dustrlbutlon of Income Earners by Income Category andHousehold T y p e ......................................60
5. Number of Households FeedingDifferent Foods at B r e a k f a s t ................... 73
6. Number of Househo ids Feeding Different Foods at Lunch andS u p p e r ................................................ 74
LIST OF FIGURES

LIST OF APPENDICES
1. Q u e s t i o n n a i r e ................................. 105-112
2. Persons Related to
Household H e a d .....................................113
3. Food Acquisition -Purchasing 1 IA

< xi >
ACKNOWLEDGMENT
The funding from my benevolent «ponsor* through the
University of Nairobi, for the completion of my
degree requirement is gratefully acknowledged.
1 wish to thank the numerous i nd i v i dua Is at t.he
College of Agriculture and Veterinary Sciences
(CAVS) wno have participated In my academic llfo.
Particular a p p r e c i a t i o n goes to Dr. A.A. Kielmann,
who was then the Applied Nutrition Program (ANP)
officer for 'nis enriiess guidance and steering of
the course.
I sincorely wish to thank my ANP advisers for their
continuous encouragement as we trudged in the study
area. 1 thank my field assistants who tirelessly
combed the area tracing the respondents for the
second interview. Lastly, sincere thanks go to Mr.
M. A. Mwanthl for his encouragement and patience
during my study time.

< X i i >
ABSTRACT
This cross sectional d e scriptive study was
conducted from February to July 1989 in North
Kariobangi following the prevalence and the ecology
of aalnutrltionai studies that were undertaken by
University of Nairobi researchers In 1986.
The overall objective was to assess selected
household and maternal characteristics. and food
practices which may determine the difference In
nutritional status of the children in the area.
First, a cross sectional study was undertaken,
and thereafter households were classified as
" m a l n o u r i s h e d ” or weii nourished according to tho
nutritional status of the children, using the 70*
weight for age and/or the 90* weight for height of
the National Council of Health Statistics (NCHS)
median as cut off points. Seventy six households
were classified as m a l nourished and eighty two
households as weii nourished.
A questionnaire was a d m inistered to collect
data on demographic characteristics , maternal
attributes, the major food a c q u i s i t i o n methods and

c X 1 1 i >
on the subsequent quantity of the purchased diet.
The food Intake was done on a subsample of index
chi Idren.
During the interview households reported all
the foods they had procured and where they had
acquiree them (source) ouring the last seven days
(ono week), inquiries were made of the amount of
time the mother remained with the child and also of
the total duration the mother had lived in p e r i
urban settings. Cn a subsample of index children
(30 in each type of household) a more detailed 24
hour dietary recall was done.
The study revealed that the duration tho
mother haa stayed in the peri-urban area was
associated with the nutritional status of the young
children. A higher proportion (35*) of mothers with
malnourished children had ilved for a longer period
in the peri-urban area than the mothers with well
nourished children (27*). It was apparent that
staying ionger in peri-urban areas was associated
with low nutritional status. Over 70* of mothers
from well nourished households stayed with their
children most Of the time (approximately 24 hours)
while only 3 6 . 2 * of malnourished mothers did so.
This could mean that the length of stay with the

\ X 1 V ')
children contributed to good nutrition status.
The survey on food practices showed that in
both households, purchasing was the major food
procurement mothod. Well nourished households had
higher mean househo id food purchases of b e a n s ,
milk, and bread per week. These also provided
greater diet diversity In terms of vegetables and
fruits.
The 2A hour dietary recall showed that a
higher proportion of children In well nourished
household were fed maize meal porridge in greater
amounts and more frequently than were the children
in malnourlshod households. Twelve (40%) well
nourished children consumod over 3/4 of a cup of
maize porridge daily compared to only 6 (20%)
malnourished children. M a l nourished households
served more tea with mlik, pastry (chapati) and
doughtnuts (mandazi/ while no well nourished child
was roportea to have fed on the above foods.
Other factors namely family size, marital
status, employment patterns and income status were
similar In both types of households, and could
not explain the difference in the
nutritional status.

Definition of Terms,
1. Food P r a c t i c e : oenotes any a c t i v i t y or means
which the Individual employs to procure food for
the family and the subsequent feeding of the food
to the young children.
2. htefti thy .jar_-legj<Ll3K-Wai.l.t i« taken as a state
of well-being, as exhibited by the child physical
ly as well as showing good mental alertness.
3. Househo i d : denotes a group of individuals who
may be related, living together in one housing or
shelter and sharing meal3. sleeping arrangements
and other household amenities, for example latrines,
and water. The Individuals may be related by blood
or any other affinity.
4. iig.riQgsL <.flgmh.nu.fcg> and-sto.peU <p»?try): are
wheat based prooucts prepared by pan frying.
Mandasi is sweet and golden brown, while chapeti Is
a salty thin pastry.
5. Traditional (Informal) s e c t o r : refers to
owner-occupier small scale business enterprises
usually without accounts or record books.
6. Uga 1 1 ; is a ’’stiff" meal of ground maize which
is made by mixing the ground maize in boiling water.

-1-
CHAPTER 1
iNTRijDUCTIGN
1.1. introduction to the Study-
Nutritional studies of underflve year old
children have an Important place In public health
because of the nutritional vulnerability of this
group. Malnutrition among children below five years
does not affect the c h i l d r e n ’s well-being alone,
but It affects the entire community by limiting the
c h i l d r e n ’s potential growth and development. It
drains the family resources, thus reducing
productive returns of the human resources which are
essential for social and economic growth (Winslow,
1984, Forde, 1575). rla i nutr 111 onn 1 problems occur
frequently In the children under five years of age
because of their higher nutritional needs, and
their susceptibility to many types of Infections.
This is exacerbated oy the fact that adults d e t e r
mine what they should eat CMartorell, 1984).
In uncontrolled peri-urban settings. the
households have no space for cultivation (U.0.N\ADD,
-2-
1971), The food must be acquired by other means
Food practices become Important. These denote any
activities or means which the households use in
availing or procuring food and the subsequent
feeding of its vulnerable members, in particular
the young chiIdren.
Primary attention of this work has been given
to studying the food practices and selected factors
In households with undernourished and well n o u r
ished children. These factors ares the household
characteristics, maternal period of stay In the
peri-urban areas, the time devoted to child care,
and child feeding practices. It Is hoped that these
should partiaiiy explain why the majority of young
children thrive and their peri-urban peers fail.
The main purpose of assessing these food practices
and their relationship on the nutritional status of
young children is to provide data that may be
useful In nutrition education.

-3-
1 .2 . S.Ulftrcg.n.l 9.S- £.o 9.l s£Lu
A number of researchers have carried out
studies on the nutritional status of young
children. The studies have been mainly in the rural
areas (van Steenoergen et a l ., 1984, Oomen, 1981,
Muonann, et ai., 1970). A few studies carried out
in the peri-urban areas have also shown that
malnutrition problems exist.
Recently University of Nairobi researchers
disclosed a variety of m a 1nutritionaI problems
Including Protein Energy M a l nutrition (PEM>, and
nutritional anemia among young children living in
the peri-urban environment CNJama, 1988, Malna,
1988). in 1957 the prevalence of PEM among the
underfive oid children In the peri-urban Nairobi
areas (based on less than 70* weight for age of the
National Council of Health Statistics (NCHS>) was
30* (Njaaa, 1988). The studies showed that over 60*
of the underfive children were between 80* to 110*
of the NCHS and were on the Road to Health.
The University of Na i robi researchers

identified a number of factors associated with
undernutrltion of the young children in peri-urban
settings. These factors were interrelated and were
basically social and economic In nature. However,
the low proportion (3GK> of undcrnutrition
observed in this uncontrolled peri-urban settlement
implied that there were factors other than those
reported by the University of Nairobi researchers.
In i96i rer-rlnstrup Andersen of the World
Bank outlineo a nuooor of factors other than the
eaonomio ones which were closely related to the
nutritional status of any individual. These factors
Included the ability and the desire of the head of
the household to obtain the food to which he has
access to, and the utilization of the obtained food
by the household to meet each i n d i v i d u a l ’s n u t r i
tional neods. To reduce the prevalence of
malnutrition among the young children, efforts
should Include Investigations to determine which of
these factors Is the immediate cause of that
problem as improvement in social and economic
factors alone is not enough.
Since malnutrition nas been cited as a problem

-5-
of ecology (Merrill, ec al . , 1981.
1988), situational v e n v 1r o n m e n t a I )
also be taken into account. In
observations made, it is clear that
studies need to be undertaken.
Addo, et a I..
factors should
view of the
more nutritional
In nutritional epidemiology, general agreement
holds that nutrient Intakes have a direct
fundamental relationship to good nutritional status
(Dennis, et al., 1985). Therefore the concern for
the inability to acquire good nutritional status
must focus on the adequacy of the food that the
household brings to the home. In view of the above
children below five years are among the most
vulnerable groups, nutritional studies must be
carried out (Nnharro, 1981)

6-
1.3. Aim of the Study.
Pathlson (1963) stressed that nutrition
affects how one grows and develops through its in
terplay with hereditary influences and the
situational or environmental conditions. As Is
evident for any improvement in growth and overall
health, understanding of the food or nutritional
practices and conditions in the particular c o m
munity is required. The overall aim of this study
is to provide data on family food practices in
order to facilitate Improvement In the nutrition of
young chiIdren.

-7-
1 . a . Objectives of the Study,
The following objectives were formulated for
this study:
1. To oetermlne nousehoid characteristics that
contribute to the occurence of poor nutritional
status.
2. To determine possible relationship between the
nutritional status and selected maternal
attributes, namely the mothers period of stay In
the peri-urban area and the amount of time the
mother devotes to child care.
3. To determine household food procurement
methods and the quantities of the procured foods In
a week In weil nourished and malnourished
househoIds.
u , To determine the food items fed to a
subsampie of the target children (30 m a l
nourished and 30 well nourished children).

- 6 -
1.5. Research Hypotheses.
1. Thor© is no difference in food procurement
practice between households with malnourished
children below five years of age and those with
well nourished ones.
2. Undernutrition in the underflve year old
children is significantly related to the quantity
of food access lb i e to the household.

-9-
1-6- 1 tS---_____________Lf.gPI___the Study.
assessing the food practices and the subse
quent diet provided to the child under five years
of age in pori-urban areas should point out good
endeavors that contribute to the elimination of
undernutrition <?EM). These endeavors can be
adopted by household* afflicted with malnutrition.
The study will fill In a vital gap in
knowledge on the 1ntra-househoId data of who are
affocted as thoir circumstances changed from the
rural to the pert-urban living. This will render
the existing nutritional programs more effective.
Hence the findings will be useful In the allocation
of the scarce resources.

-10-
1.7. i.lmltatlon of thg StV^y-
Due to the limited funds and time, the reteach
was limited to households with children under
five years living In peri-urban Karlobangl North.
This setting is very similar to that In many high
density areas.

-il-
CHAPTER 2
LITERATURE REVIEW
2.1. Up I P M U it io.ru.
M a l n u t r i t i o n has been cited as both a cause and
effect of underdevelopment. Bsrg (1987) defined It as
the pathological condition brought about
by Inadequacy of one or more of the
essential nutrients that the body cannot
make which are necessary for survival,
growth and reproduction and for the
capacity to work, learn and function in
society (Berg, 1987).
The most common form of malnutrition among
young children is Protein Energy Malnutrition (PEM)
(Facts of Life, 1980). PEM predisposes children
to many incidences of preventable morbidity with
possible subsequent mortality (Berg. 1987).
In addition to the heightened morbidity,
undornutrition may adversely affect the central
nervous system 3nd may Impair intellectual,
psychological and neuromuscular capacity (Cousin,
1965). Impairment of the above may lead to

-12-
inadequate realization of the individual’s inherent
potential (Dobbing, 1985). This may result in slow
development of the community.
2.2. Factors___that Influence Food__ P i a c U c t i t
Graham (1972) has noted that malnutrition is a
complex product of biological, physiological,
economical, and social factors, all of which are
Interrelated. These factors cause malnutrition
directly and/or indirectly by influencing food
practices and diets.
2.2.1. aJLaiSHjc?) Factor? i
Biological factors Include agents that cause
disease. These agents arc abundant due to the fact
that in tropical regions the temperatures and
humidity are relatively stable. These factors favor
the propagation and transmission of parasites and
infectious agents vLeonardo. 1977 > which cause
u n d e r n u t r 1tlon directly or Indirectly by
Influencing food practices particularly regarding
the feeding of the young child.
The biological agents causing disease precipitate
malnutrition in many ways, which includo increased

-13-
nutrient requirements of the b o d y ’s needs for
energy and nutrient, or Increased nutrient loss
and underutilization of the nutrients. The
illnesses decrease the ability of the body to re
cover from the malnutrition (Berg, 1987). According
to Scrimshaw (1965) a mutually aggravating rela
tionship results between malnutrition and the
illness. Consequently the child gets debilitated.
2.2.2 Physiological FactoX-J^
The physiological factors Include the
state of health of the child and his or her
vulnerability to malnutrition. Graves citing
Srikantla <1S72) stressed that the mother should
act as a source of the infant’s physical and
emotional satisfaction. She should be a mediator
and a source of stimulation for the young child
during feeding.
In peri-urban areas, owing to the e n
croachment of an exchange system of monetarlzed
activities, many mothers have to engage In o u t - o f
home activities to earn money for the household
upkeep. In most coses the children ore not provided
with adequate food when the mother Is away. This
practice predisposes the child to malnutrition.
14-
2.2.3. Economic Factors
The economic factors denote any commodity or
•ervicec which yield satisfaction and must be
obtained for a fee in cash or "in kind" (Tadaro,
1982). A number of studies on the effects of
economic status and u n d e r nutrition have been
conducted. Schnetz et al., (1984) observed that
though u n d e r nutrition is closely related to
poverty, it is not bound by the family income.
Qualitative diet improvements have been noticed in
some households but these have not essentially
reflected increased incomes. Pellet (1977) also
cited marasmus in the children below five years
who were not necessarily from low Income families.
He observed that the low nutritional status was
related to other factors.
In Thailand, for oxample, middle Income
families had the least shopping and consumption
frequencies. For these families, a direct relation
between the shopping and c onsumption was observed,
excluding the Income factor. Indeed existing
infrastructure was found to be the major factor
influencing nutrition (Schnetz, et al., 1984). In
all cases the further the shops were, the less was
the food consumption.

- 15-
Cons 1 de r i ng all the afore-mentioned, it Is
clear that high income does not always imply
optimum nutrition. Low income households in peri
urban areas can have good nutritional health among
the young children If they have proper food
p r a c t i c e s .
Ritchie i 1967). citing Food and Agriculture
O r ganization (FAO) studlee done by P e r l s s e ’ in
Ivory Coast and In Haii in 1965. noted that in spite
of great differences in cash Income the diets of
all groups investigated, Including farmers and the
progressive persons, were Identical. Other factors
besides the income therefore influenced the
food patterns.
A study carried out in Kenyan peri-urban areas
by Otundo <1982>, showed that the marginal propensity
to consume food 1 ten>9 decreases progressively in all
households. The food practices remained similar. In
other cases, evidence showed that the diets of the
lowly paid were remarkably well balanced, In spite
of their low monetary expenditure (Berg, 1981).
From the observations given here it is evldont that
other factors are also Involved and that Income la
not the most detrimental factor affecting the
f a m l 1y diet.

- i d -
2.2.4. Social Factors
The social factors embrace the situational
organizations of the peri-urban households. These
Influence food practices In the causation of under-
nutrition as well, it has been known that p e o p l e ’s
food practices are deeply rooted in their culture
a9 well being Influenced by social changes
of * m o d e r n l z a t i o n ' t'fiitchie, 1967, Nakatsuka, <*t
a l . , 1586) and exposure to mass media. Food p r a c
tices therefore tend to change and/or get modified
f r e q u e n t 1y .
Imitation, prestige or misinformation from
peers have resulted in greater changes in feeding
practices. Breast feeding is one of the practices
which has been influenced. Infants have been
abruptly weaned or Introduced to solids early. This
has caused early infant feeding problems. The
problems include diarrhea and/or gastroenteritis
which precipitate malnutrition (Jelliffe, 1963).
According to Kahn <iS6i) the shortening period of
breastfeeding was observed more than among their
rural peers.

• i 7
2.3. Food Practices.
It has been mentioned that food practices are
other factor that causes malnutrition as they are
influenced by the factors above.
2.3.1. F.o.gd, f_rg.C.y,C,3Jn,ftlU .JP.Vr.9ha g inft),
Food can be obtained by purchasing, received
as gifts, or from o n e ’s own production. The method
of a c quisition depends o n o n e ’s resources,
availability In the markets, and advertisement.
One's own production refers to availability of
gardens and means of production. In peri-urban
settings, where households have no space for
cultivation (U.o.N ADD, 1971) the major procurement
method is purchasing. The market becomes the major
source of food supply (Oftedal, at al., 1974).
Purchasing behavior therefore greatly Influences
the food consumed. Some factors influence the food
purchasing benavior. These are foods available in
the markets, the advertisement of all the c o m m o d
ities on saie, and income (which Is already
d l s c u s s e d >.
Food Avallabli ity.
The a v ailability of food has been found to be

- 1 8
food in the household (Addo et al., 1988). Den
Hartog (1985) noted that urban people have greater
variety of vegetables and fruits, more types of
meats and do experience less seasonal influences on
diet due to the presence of the markets. The
greater variety of food may cause difficulties in
the selection of food for the child. This is even
aggravated by the wide variety of other
consumables and luxuries for the adults'
satisfaction.
A number of researchers have observed that
these households which always purchase their food,
constantly modify the quality ar.d quantity of their
diet depending on the agricultural seasons (Mwangi,
1982). Conditions in peri-urban areas facilitate
the feasibility of a diverse diet for the your.g child.
However a diverse diet is not always consumed because
when people who have beer, accustomed to a subsistence
economy need to purchase their food for cash they
take the choices of food basically on prestige
grounds.
Faced with the above situations, p e n - u r b a n
populations are highly prone to changing the
traditional diets which are more complimentary ir.

- 1 9 -
tradttional diets which are more complimentary in
nature and more nutritious for the maintenance of
the body. As a result there ha« been increased
prevalence of PEM due to urbanization (Kahn, 1961,
Jelllffe. 1963).
Advert, i sement.
Marketing practices have been cited as
important Influences in Nairobi (CBS, 1984). PEM
may persist because of the purchasing option wven
though all households have access to vendors of
food. This is due to aggressive advertisements as
Oftedal (1976) observed. He noted that migration to
urban areas and exposure to mass media did not lead
to nutritionally improved food patterns.
In Libyan households with adequate purchasing
power, the influence of advertisement on food
purchasing caused PEM among the children under five
years of ago (Kamel, et al., 1984). The households
have been found to purchase inappropriate foods for
the children because these foods were highly
promoted by the food vendors.

- 2 0 -
2.3.2. Chi id Fading.
2.3.2.1. Chjjd
The actual feeding of the young child is an
Important practice that determines the outcome of
his nutritional condition. Many nutritional
advisers have recommended exclusive breast feeding
'on the c h i l d ’s d e m a n d ’ for the first four months
of life (Williams, 1981). Thereafter solids are
suggested to be included into the c h i l d ’s diet,
one food at a time depending on the manner the
child tolerates them.
Nutritional educators have discouraged the
over use of processed foods in the c h i l d ’s diet and
suggested the inclusion of more natural foods
(Werner, 1981). Frequent giving of fluids and
feeding using cup and spoon have been recommended
as the best mothod (King. et al., 1981, King,
et. a l ., 1972).
On the average, the young child in peri-urban
areas is fed at the home three times a day. This
Includes the morning meal, an afternoon lunch and
the evening meal. in many instances the food is

- 2 1 -
the evening mcai. In many instances the food is
cooked and served at the times and venues when
the adults are eating. Casual snacking provided by
the children's peers may occur as they aongregate
throughout the day.
During early chiidnooa the child lacks
certain enzymes {Krause, et a!., 1979), The
teeth are not r'uiiy developed. The food fed to the
child must be properly handled to facilitate
digestion in the gastrointestinal tract. The manner
in which the food is prepared determines the u l t i m
ate utilization in the body tissues.
Softening and/or smoothenlng food items for
the child under five years of age are feasible
approaches in alleviating malnutrition. Mashing,
mincing and grinding should be possible using the
locally available toois. Enriching foods by a d d i
tion of fats or milk improves the energy and
protein qualities that have been suggested in the
alleviation of u n d e r n u t r 111 on (Cameron, et al.,
1983).

- 2 2 -
2. 3.2. 2. ras.^LLS_AQyaE q |L HA. the Feeding ?f g.h 1 I T^n.
Food and faadlni; Is Influenced by a number of
factors in the communities. Uorsley it al.(1982>
named some of these Influences as being situational
(environmental; and others indigenous or intra-
individual. In other cases many prescriptions and
restrictions, iikes and riisiikes coupled with food
significances, also Influence feeding of the
younger ohildren.
A social obligation to feed the younger
members predominates. To most families. familiar
foods they learned to eat in childhood may continue
to De their preferences in adult life. In p e r i
urban areas people change and they learn what they
can eat or feed the child rather than eat what they
like, owing to the d etachment from the rural homes.
Loyalty to food and diets that people grew up with
are no ionger feasible in these areas. The children
seldom feed on these diets.
Economical Influences affecting child n u t r i
tion in perl-ur'oan settings vary from family to
family and time to time. As mentioned above in
section 2 . 2 . 2 . . the mothers can provide many foods
to the young children under peri-urban conditions.
The mother should be able to nurse or feed her

- 2 3 -
adversely affect the nutritional health of the
child under five years of age.
In peri-urban areas several ethnic groups
live together 'in harmony* and develop new coping
skills. Cultural prescriptions on child feeding do
not appear to adversely prevent optimum nutrition
to be provided to the young children. Though r e
strictions may exist, these are frequently o v e r
looked due to the necessity to survive in the new
env i r o n m e n t .
Tho young children have the least p s y c h o
logical associations with food, l.iking for certain
foods is usually the result of satisfying hunger
and occasionally the emotional relationship b e
tween the child and the mother/caretaker feeding
him. The mother's devotion towards the child. her
display of affection and encouragemont determine
the way in which the child will consume his or her
meal. Thus the above do influence child nutrition.

-24-
CHAPTER 3
3 .0. B » c Hn r q,v»nd 9f stydy
Kariobangl North is a squatter settlement on
the outskirts of the Nairobi city. This area lies
on the eastern side of the city center. It w a s
first occupied in 1964 under the resettlement
scheme for squatters from Purawanl and Gikomba
who had to be moved far from the city center
(Shihembetsa, 1989). More details o n the origins
of settlement of the area are discussed by U n i v e r
sity of Nairobi researchers (Maina, 1988, Uelsner,
1975).
The first settlement covered an area of 0.445
square kilometers. Presently it Is a sprawling
residential area with a population density of 700
persons per hectare (Shihembetsa, 1989). The area
is fairly heterogeneous: depicting a great variety
of sheltering structures, several religious
groupings, and many commercial /educational
enterprises. Indigenous hoalth healers and
entertainment facilities exist throughout the area.
The majority of the enterprises are owned by the
area residents. From observation, all the services

-25-
and goods supplied within these enterprises require
a fee.
Kariobangi North is a conglomerate of smaller
villages (clusters) which bear the names of the
areas from where the p e o p l e ’s former shelters were
in the early and late 1 9 7 0 ’s (Weisner, 1975). The
five villages, namely Gitathuru, Grogan,
Highrldge, Korogocho and Ngomongo are demarcated
arbitrarily by the roads within (Figure 1).
In every village, about 80% of the houses are
used for commercla 1/business undertakings while
the families sleep in the back rooms. Piped water
is available within, and each household owns a pit
latrine. For easy collection of garbago by the City
Commission authorities, wastes are dumped in heaps
by the roadside at strategic places.
Within the village development of the houses
is random (U.o.N ADD, 1971). Many houses are made
up of mud and wattle (Chana, 1971), and are
modifications of the traditional African hut whilo
some others are made up of brick and corrugated
iron sheets.

F i g u r e 1

-27-
Th* Inhabitants come from several regions,
particularly Central. Rift Valley and Western
Provinces. The distance from the city center to the
rural home or place of origin of the head of the
household determine* the number of family members
present within the household at a particular time.
In 1905 the average occupancy rate was one room per
household of 2.2 persons (U.o.N.ADD, 1971).
The African extended family system, including
relatives and acquaintances of the spouses,
prevails in the area. This living arrangement Is
traditional and socially desirable because the
young child may be cared for by others when the
biological parents are absent or missing.
In the majority of cases male household heads
come first to this peri-urban setting. They are
then followed by the wives and children later. In
some Instances wives and other relatives visit
their households according to the agricultural
seasons in their rural home areas. During the
planting up to the harvest seasons, the wives and
underflve children are at the rural homes (U.o.N.
ADD, 1971). This means the number of the persons
living in the area changes frequently.

- 25-
The s* i 1 -*mpi oyment enterprises include full
meal restaurants referred to as kiosks, Mandazi or
doughnuts Kitchen type enterprises, butcheries and
groceries, numerous raw vegetable and fruit
vending. Hardware, manufacturing and repair shops,
clothing, tailoring and hair saloon businesses are
abundant. Several bars and Inns are available
throughout the five viiiages.
A variety of food Items are available e v e r y
where at most of the time within the area. The
numerous kiosks offer many types of food including
indigenous or traditional dishes. Popular meat
dishes lnciutm beef, tripe (matumbo) stews, roasts;
chicken, many types of fish, pork and veal. Each is
available at a wide range of prices. There are
numerous types of green leafy vegetables, cereals
and citrus fruits. A large scale raw foods market
is situated in the Aorogocho village. There
thereforo exists an excellent opportunity for
availing suitable and adequate food to the p r e s c h o
ol chi 1dren.
/

-29-
CHAPTER A
RESEARCH METHODOLOGY
A. i . Study Design.
A . 1.1. TyP« tfl’ SWOlt.
This Is a croas-sectionai descriptive study
that was undertaken In Kariobangl North from F e b r u
ary t.o Juiy 1955. It Is an in-depth study a s s e s s
ing food practices in an effort to explain why
some young children thrive while tholr peer* fail
in the same ecosystem.
A . 1.2. S a m p i 1ng Frame.
All the households with young children up to
the age of sixty months who had been introduced to
food and were living In Karlobangi North comprised
the sample frame. This was in conformity with the
Central Bureau of Statistics (CBS) Kenya (198A)
finding that children as young as one month of age
belonglmg to mothers from low and middle incomes in
Nairobi were being given breastmilk and food
supplements.
/

-30-
4.1.3. Study Criteria.
The households were classified according to
the nutritional status of the children. To achieve
this, the following criteria were strictly followed.
For a household to be qualified as " a a 1n o u r 1 s h e d " .
one of the children unaer rive years of age had to
be less than 70* weight for age AND/OR less than 90%
weight for height of the NCHS median (Jelllffe,
1966).
For a household to be qualified as " well
nourished": None of the children within were
undernourished; l.e. all the children under five
years of ago were on the " ROAD TO HEALTH"
according to their growth monitoring charts, (i.e.
above 30* welgnt for age of the NCHS median). To
reduce bias with regards to child feeding
practices, the mother must not have attended
the nutritional rehabilitation center within the
preceding twelve months.
/

31
4.1.A. Saropi e Size.
Previous studios in this area had disclosed
undernutrition at a cut off point of less than 70*
weight for age to be 3G». Based on this, the sample
size was calculated according to the following
formula for the sample:
w h e r e :
z represents the standard normal deviate.
This was taken at l.56;
r is the degree of accuracy desired.
This was set at 0.05;
p la the established malnutrition rate
that Is 0.30.
The ideal household sample size was found to
bo 323. According to the objectives and study
criteria used to qualify the households, the team
commenced to enroll as many households as could
n
21.56 x <0.30 x 0.70>
2
1. e. n * = 323.0.05
/

- 3 2 -
quallfy within the set study period. In total. 170
were investigated. Each household was visited twice.
First households were reached and the first
interviews wore done. After a minimum of two weeks,
these same households were revtsted for the second
Inlervlew.
*.2. 5flngax.^-r.£ap.*j.gj;1.9.n
4.2.1. Mapping the study area.
The researcher met the Assistant Chief
and the other community lenders. She then toured
the study area extensively. Three field assistants,
two of whom were Conmunity Health workers living
within the area, were recruited, and involved In
mopping the area. Ail three had participated earli
er In community studies in peri-urban and rural
areas, ana were familiar with research methods.
^•2.2. Development jand _T_es_t.l_njL_Qi___the fle.g.earchI ns t rumen t .
Thu resoaron Instrument- questionnaire, was
developed. It covered household characteristics.
/

-33-
a child Identification, weekly household food
budget survey and the hour dietary recall
sections. The researcher taught the three field
assistants how to lake weight and height
measurements using the Salter Scales and the
Infatometer respectively.
For the questionnaire emphasis was directed to
ascertaining that the field assistants ask the
respondents the questions In a manner that the
latter would be sole to recall the amount® of
food which they had procured during the past week.
The respondents were asked about the foods they had
eaten the day before.
To ascertain its reliability, the questionnaire was
pilot tested in Klnyango - Mathare Valley.
This area has similar characteristics as Karlo-
bangl North. The pliot study revealed that 17% of
households had malnourished children while 23% had
well nourished children.
Later a room was hired within the study area.
This was used as a field office. The research team
kept the survey tools in there. A month after the
start of the actual survey, owing to the high a t
t

-0*4-
trition ran? and/or internal migration within the
study area, two more field assistants were recruit
ed to enable the investigating team reach the
respondents for the second interview as soon as
possible.
a.3. Selection Procedure of the H o u s ehold_S ample,.
Selection of the households was modified after
piloting in Kinyango - Mathare Valley. Kinyango
Mathare Valley is an adjacent peri-urban area with
practically similar living conditions with North
Kariobangi. During piloting tn Kinyango, random
seloctlon of numoered households yielded a lot of
unneeded data. From this pilot survey the fifty
households that were reached and their residents
interviewed, only thirty households qualified to be
included In the analysis. Using the net criteria,
out of the thirty, only five households (17%) were
classified as malnourished ones. F r o m the remaining
83% of households, oniy 23% wero classified as well
nourished households. About fifty percent were
excluded In the analysis.
/

-35-
In this area new shelters are constructed
dally (Shihembatsa, iSSd, Welsner, 1975) due to
Internal migration within the area. In order to
avoid missing the households for the Interview,
every shelter was visited (Figure 2).
/

36-
k'ar iobangi NorthI»
»A1 i households visited
i
tidentifying ail householdwith below 5 years of age
•
lI
Anthropometry of the children below five years at home
IEnrolling households
Fi rst intervi ew at home
l
Second interview at home
Figure 2. , -r SEurVT i «•« ijr H!U SKh ;

-37-
At the onset of the study period, from the
first village, Grogan, the team worked from
shelter to shelter starting from the oast of the
nutrition rehabilitation center In the area. The
team asked the residents and their neighbors
whether they had underflve year old children.
Asking neignoors and/or making appointments to
visit households through thorn has been found to be
effective and hence been adapted in uncontrolled
squatter settlements iU.u.N., 1971).
Reaching the households for direct observation
was also necessary to enable the investigators to
determine whether the households had children under
five years of age. This was made possible by
the facts that two of the field assistants
had lived in this area for a minimum of five years,
and both worked as community health workers.
Hence the households were reached in that manner.
The investigators worked in groups. At the
shelter, the questionnaire (Appendix l) was
administered to the child's mother or the adult
/

-36-
child caretaker. They frequently worked inside
the sneiters. They introduced themselves and
thoroughly explained the purpose of their visit.
The investigators asked the mother or c a r e
taker of all the children below five years about
the ages of the children. For each child below five
years, the team inquirea whether the child had
been Introduced to food. If the child had been,
they then requested tho mother to show them the
growth monitoring charts to verify the ago and to
ascertain the growth trajectory of the child.
The mother was asked if she had attended the
nutritional rehabilitation center in the preceding
twelve months. For the mothers who had not, the
weight and helgnt of their child were taken. Only
one child was picked in accordance with the set
anthropometric criteria. Based on the nutritional
status of this index child, the household was
qualified as either well nourished or malnourished.
The household was enrolled In the study. If any of
the conditions were not satisfied, the household
was excluded from the sample.
/

-3a-
4 . 4 . H e t n o o O f M a t a C p j j g g . . t i o n . _ r -t tu g .K A iP H M L i.L aAomin i?t,ra,yi.«?n.
Four hundred packs of the pilot tested
questionnaire were made. These packs contained
a first page of Identification of the child, his
weight and height, the name of the mother or c a r e
taker, village name and the household number. This
was meant to assist later in locating the h o u s e
hold for the second Interview.
( i > Pern ojt.ra.p.n.lc,...pjLtjLu
The mother of the selected child reported the
needed demographic data pertaining to the household
on the first visit, information was collected on
persons who regularly slept at the shelter. During
the second visit, data on any visitor who had come
after the first visit was excluded as these were
not regular residents.
( l l > W e i g h t Mea s ur eme nt .
For the weight measurements, each toam of
investigators used 5aiter scales calibrated to
0.1 of a kilogram suppileo by UNICEF. For each
measurement, the ooaie wan first adjusted to zero.
/

-UO-
There was the suspension plastic pants which came
with the scale, and were worn by the child
being weighed. Each child under five years of
age was undressed and pi aced into the plastio
weighing pants. The child was hung on the Salter
scale. One field assistant took the first scale
reading which was noted on the questionnaire.
A different fleid assistant read the scale as
well for the second time in order to check on
interobserver variation.
(ill) Height M e a s u r e m e n t .
The infantometer was used for t.he children's
length measurement, particularly those who were not
walking then. For toddlers the metallic tape was
used for their heights while standing by a firm
wall.
The infantometer was placed on tho floor.
Children who were stiil undressed, were laid flat
on it. Care was taken to ascertain that the scalp
was on the upper board, and the feet were
perpendicular to the board with the spinal
vertebrae straight, and hips and knee joints well
/

- e l -
extended vUnlted Nation*, 1S38). Two field a s s i s t
ants rpad the scaies consecutively,
A lot of crying ana kicking were encountered
when the toddler* were laid down. The standing
posture was adapted. For the children who walked
well, ^children aoout twenty four months and over)
the Investigators requested the mother to stand the
child straight ag&insr. the wail. The metallic tape
was stretched at the same spot (on the wall). Two
field assistants took two readings of the
measurement of each child's height. In other
Instances, the iniantomecer was used In the
vertical position.
Civ) A ge— wetearning t i o n ,
The reported age of each child was
verified with the recording on the provided
growtn monitoring charts.
< V ) tlar.O.ltil *.y____flf_ the index Children
On the first visit. through observation
facilitated by the field assistant* who were
community health workers and the medical students.

- h I-
the investigators scrutinized the general a p p e a r
ance of each selected child; his eyes, skin and any
other evidence that would conform to signs of
undernutrition. The investigators assessed whether
the child looked healthy or unhealthy. They checked
whether the child had visual problems. skin
lesions, any injuries, burns or scabies that would
Imply inaoequate care which culminates in
undernut r i t i o n .
(v i > Household Food Survey.
According to the method proponed by Kain
<1985) the respondents were asked about each meal,
namely breakfast, lunch, supper and snacks that
they provided for their family the previous day.
For every ingredient, the investigators inquired
about Its source with regard to purchasing, garden
ing, or if it was given free by relatives or
friends. The teams asked about all the food items
that respondents had purchased within the last one
week. Then using the 'leading' approach they
Inquired how much of the following items had the
household provided for the members. (Appendix 1
page ~ of 3). The budget survey was undertaken
twice for every housohoid during the study time.
/

-43-
The foods were reported in the amounts in
which they were sola. These included reports of
heaps or bundles. To ascertain the actual
quantities \ln kilograms) and the form of the food,
market visits to the Korogocho fresh food depot
were carried out dally during the study period.
Milk was reported on the basis of the half litre
and bread oy the i/2 kilogram loaf.
( v i i ) Tv.pnty, .rjL’Lf— Hg.^ I'.lgtftjy Rg.Cftll.i
On the second visit the twenty four hour
dietary recoil of thirty malnourished and thirty
well nourished children was carried out. These
children were pictceo randomly. From previous
reporting. It had been disclosed that the children
fed at the same meal times and e ssentially from the
same crockery with the adult3. To facilitate the
reporting of the measurements of the foods actually
consumed by this subset, one 250 millimeter plastic
cup ano one 2 G 0 millimeter plastic bowl were given
to every other household on the first interview
visit.
/

<4*4-
7he cup and bowl were products of Kenpoly,
Kenya Plastics Limited. Both were easily calibrated
In halves and quarters to ascertain quantities that
the children Ingested. These as well served as
tokens to the families who accepted to Weep them.
During the second visit, the investigators asked
the mothers to report all the food and the q u a n
tities that the chi id had eaten in the previous
twenty four hours.
The Investigators noted the source of the food
with respect to whether the food was prepared at
home or bought (already cooked) from the kiosk. The
method by which the food was prepared at home with
respect to mashing it, mincing it, grinding and
enriching It with other nutrients were also noted.
The quantities were reported in terms of the amount
finished from the cup or bowl.
4.5. gata Management.
4.S .1. Data C l e a n i n g .
Every day, each completed
first visit was checked to
had been answer
questionnaire on the
ascertai n that a I I
ed. The principalquost i on* The

- 4 5 -
lnvestlgator noted the household numbers so that
the households could be traced for the second
household budget survey. Reported quantities of
food were compared frequently with the market
quantities on sale in order to be certain of actual
m e a s u r e m e n t s .
4.5.2. Data Analysis.
In the analysis, information on the child
given by any adult other than the mother or its
adult caretaker has been excluded. Out of the 170
households, 155 have been included in the final
analysis. Seven of the households were excluded
because the respondents could not be traced for the
second household food budget survey. One household
was excluded because the responding mother got
admitted to the mental hospital. Another four
households have been excluded because the children
had been to hospital seven days before the visit
d a y .
The selected demographic c h a r a c teristics of
all households analyzed included total population
and period of stay within the urban areas. D e t e r
mination of frequencies and possible relationships
were done using statistical tools.

-46
CHAPTER 5
RESULTS
5.1. i n u o . g ^ U o j b -
Thle study In R'arlobangl North
assessed maternal characteristics, and food
practices and their relationsnip to the nutritional
status of young children in the peri-urban area
where a good number of children thrive while some
of their peers fail. in order to achieve the
objectives given in section 1.2, determination of
household demographic characteristics was done.
Weight and height measurements of all children
were taken. Households were classified as either
poorly nourished - " m a l n o u r i s h e d ” , or well nourished
according to the nutritional status of their young
chi 1dren.
Selected maternai attributes that Influence
the nutritional health of the children within the
household were investigated. The study looked at
food acquisition methods. In particular the
purchasing method. Establishment of the quality and
quantity of the purchased foods and the 24 hour
dietary recall were undertaken.I

-47-
5.2. Generai Demographic Characteristics of the Study Population.
5.2.1. C o mposition and Age of the Study Population.
The Inhabitants of this area were from all the
provinces of the country. There was a total of 767
persons In the study households of whom 384 uero
males and 383 were females. This gave a 1:1 ratio
of males to females. About half of this population
<51.0%) had lived In the area for less than 2
years while 39.0% had stayed In the area between 2
and 10 years. The rest <10%) had been In the area
between 10 and 35 years. The ages of this
population ranged from less than one year to 69
years.
Fifty two percent of this population was under
10 years, while 10.5% was between 10 and 20 years.
Thirty seven percent was over 20 years. The mean
age for the entire population was 14.5 years with a
median of 9 years hence implying a relatively young
popuiat ion.
There were many couples living with their
Children, grand children and relatives. Twenty one
percent of the population were household heads who

-46-
lived with their spouses. About 3 1 % of all persons
within were sons while 25% were daughters staying
with the parents. One percent were grand children
while 2% were relatives of the household head. A
very small proportion <G.7S) were acquaitances to
one of the household members (Appendix 2).
5.2.2. income Status.
Many people depenoea on other h o u s e h o 1d
members for their welfare as 71.5% (including
chiIdren) reported no i ncome generating
occupations. Only 5% of the adult population had
regural salaried employment, while 23% were working
in the informal (traditional) sector. The majority
of the working people earned between 300 and 1500
shillings a month. This gave a mean monthly income
of 212.0 s h i 1 Iings.
5.3. ClftM.in.ci&ign__ 21___ riougghgiflg____hx___ i M-ritionai Status of the Index Children^
Seventy six households were outrlghtly
classified as poorly nourished -i.e. malnourished.
In these households there were 42 male and 34
female children whoso weight for age indices were
below the 30th centiie of the of the NCHS median.

-*♦9-
Seventy one households were also outrlgntly
classified as well nourished. The children in
these households had choir weight for age indices
between 60 and 120% of the NCHS median. This group
had 36 males and 35 females.
For the thirteen children whose weight for
age feii between tne 71-75 * range and could not
bo outrlghtly classified as malnourished or wall
nourished, eleven of them were considered well
nourished because their weight for height was over
90% of the NCHS median, uf these children, 9 were
males and 2, females.
Two households were excluded because the
children were above 120% weight for ago. Residents
of two other households could not be traced during
the second visit thus necessitating the omission of
those households. In total, therefore, there wore
82 households with weii nourished children (Table
1 ).
1

-50-
Table i : Distribution of Children Below Five Years
by Sex and their Weight for Age.
••:U p 1ghtSage••i
l••
Na i e n = 9G
•! Female. n = 72
Tota 1 162
i < 70 i 42 1 34 76! 71-79 i• 1 i i 2 131 80-120 i 36 1 35 71: < izo••
«•1 i 1 2
5 . a . Morbidity of the index Children,
About seventy percent of m a l nourished children
were found "unhealthy", comparod to only about
19.0% of children from well nourished households
(Table 2>.
Table 2: Percent D i stribution of Malnourishedand Weil Nourished Households by Health Status as Judged by General Appearance.
:! Appearance Percent Percent
Hai nourlsheo Wel 1n o u r 1 shed
1 Not well 69.7 19.0S Healthy 27.6 69.0! Excluded 2. 7 12.00
1100.0 100.0

-5 i -
About three percent of children from malnourished
households were excluded because they had boen to
hospital seven days before the visit day.
More malnourished children <44X> presented
signs of pale conjuctiva than the well nourished
for whom the condition was seen in only 13% of the
children (Table 3>.
About 3 5 . 5 a of malnourished children presented
open lesions^scratches on their skin, while only
9.7% of the well nourished children presented this
condition (Table 3>.
On checking on edema and the condition of the
hair which frequently accompany prolonged
undernutrition, it was observed that two of the 76
nalnourlsned children had edema while twenty six
had straight discolored hair. This suggested a
deficiency of protein in the diet. None of the well
nourished children presented these signs.
s

-52-
Table 3: Health Status of Ha 1n o u r 1 shed andWe i i Nourished Children as Jugded by Different Criteria.
«Household. Scable like iStralght L Type i Scratching iDiscolored
Edema11
I n % in % : n % !Mai- 11 • •• !
n o u r 1 shed :27 <35.5i .26 i 34 > 12 <2.6 > :n»7o I •• 1 !
Uel 1 I •• 1 1n o u r 1 shed 3 0 •1 0 3 0
n = 82 f• i •• ••1 • ! •
5.5. Dlst r fput 1 0n _ o f__t_h6 Househo.l.ds_1_n_the— Stud* A r e a .
The distribution of the househo Ids Is g 1ven
Table A . A total of 158 households were
Investigated. The Korogoeho village has the highest
number of households that were studied. This
village was the first to be settled. Grogan has a
lower number of studied households possibly due to
Its vicinity to the nutritional rehabilitation
c e n t e r .
\

-53-
Table A: Distribution of Households In theFive VIIi age9.
Village 1 Number ofI Households
i ria i - SWell ! Tot a Ii n o u r 1 shed Inourished :
n * i n % : :
1 1 iG l ta thuru 8 25 •• 24 1 75 32 iGrogan 6 6A f• 5 ! 36 14 •
Hi ghridge 20 AA •• 25 ! 56 45 iKorogocho 3A 67 17 1 33 51 iNgomongo 5 31 1 11 i 69 16
Total 76 1 82 158 1i
From the total population of 767, there were
on average more persons in m a •nourlshed households
than in well nourished households (4.91 persons per
malnourished household compared with 4.67 persons
In well nourished households).
From Figure 3, It is apparent that a great
number of households had A to 5 residents. On close
examination, 27* of well nourished households had 5
or less residents compared with the 15% of
malnourisheo households who had that same number.
Malnourlshod households had as well more households
with 7 and 6 persons (i.e. 6 and 6 respectively
compared to 3 and i respectively in well nourished
househoIds)

C/> Q
. —
O J
tD
WC
Ol
Figure 3: Distribution of Malnourished and Well Nourished Households by
Family Size.
Number of Persons
Bar
Malnourished HHs Well nourished HHs
P e o o \ « a\ h o m o .

-55-
5.6. Shyrggstrlgilfij; °f -r.ai.jg.nf in__ Malnourished^ n g _ w e t t .Hoprighea Households.
5.6.1. Distribution of Persona by Different Age yatigqr
Table 5 shows the distribution of the people
by age In malnourished and well nourished
households. Differences wero seen for all age
groups in both types of households. The differences
were found not to be significant.
The proportion of the population between 0-5
years (preschool children) was practically the same
(i.e. 3 9 . OX in malnourished households and 40.9% in
well nourished households). The proportion of the
population oeiow 15 years is also practically the
same (57.-% in malnourished households and 55.8% in
well nourished households). The similarity was
also observea for the age groups of 16-25 and 26-64
years (17.7% and 25.0% in malnourished households
and 17.6% and 26.1% in well nourished households
respectively). There was no person over 64
years in malnourished households while one person
was 69 years old in well nourished household
group.
The dependence ratio in these two types of
\ h o u s e h o 1ds therefore was 1.33 in maInour i shed

-56
households and 1.26 in well nourished households.
Table 5: Distribution of Persons in the Different Age Groups.
S I• AgeI category : years
Persons in the householdsIIil•______________________________________ •
: ; i : ! I Halnourlshed ! Well nourished ! I I Househo i d : HousehoId !
•• 0 - 5 154 (39.0) 5 153 (40.9) 1•• 6 - 10 53 (14.7) : 38 (10.1) •1•• 11 - 15 12 ( 3 . i > : 18 ( 4.8) ••: 16 - 20 23 ( 5.6) : 27 ( 7.2) i1i 21 - 25 47 (ii.9> ; 39 (10.4) :
26 - 30 49 (12.5) 5 58 (15.5) !: 31 - 35 34 ( Q.6> : 24 ( 6.4) •••• 36 - 40 5 ( 2.2) : 9 ( 2.4) 1si•
41 • 57 7 ( 1.7) 1••
7 ( 1.8) ••t
•• Total 352 f1 373 1I
5-6.2. Gender and Hor 1 ta.l.. Status of___Househojd.Head
Table 6 shows that in both malnourished and
well nourished households, about 90% of the heads
of the households wore males. From Table 6 it i«
also clear that the pattern of marital status is
practically similar. In both cases about 84% were
married while 16% were single.

I db I e D i s t r i b u t i o n o f llun*it*hol J b y(ienclpf a n d Mar i t a l S t a t u s .
W1i
6:
!H o u a e h o l d 1 y p p
• ___________■
! G e n d e r o f M e n d
t
r
r
r
•
::
5 1 1 * 1! M a i e9
F e m a l e J M a r r i e d•
Si riql e•S n •
V. n V. ! n 7. n 7.9
M a i n o u r i s h e d !•J
n « 7 6 S 6 8 •
8 9 . 5 8 i o . 5 : 6 « •
8 4 . 2 12 1 5 . 8•
W e l l n o u r i sited t•••
n = 8 2 ! 7 3 8 9 9 11 1 6 9 8 4 . 7 13 1 5 . 9 ir • i
Household heads who were widowed: separated or divorced from their spour.es.

- 5 6 -
5 . 6 . 3 . O ccupation of Household H e «b «rs and Hpus_eno_i_p— i.ncjuaes..
The majority of household heads 72.4X In
m a 1nour i shed and 76. a% 1 n we 1 1 nourI shed
h o u s e h o 1ds > reported no ful 1 time occupations
(Table 7>. These were either casual workers or
occas i ona i i y seif emp i o y e d . About f 1 ve percent and
one percent of the h o u s e h o 1d heads from
m a 1n o u r 1 shed and we 1 I n o u r 1 shed h o u s e h o 1 da
respect i v o 1y had no work. These had only recently
arrived In the area.
Table 7: Occupation of Household Heads in both Types of Households.
; Occupation1 1 i :
H a l n o u r 1 shed n*7o
! U e 11 n o u r - !1 1 shed n = 02 1• • • 1
i ; ;Employed (regular) 5• •
17 <22.A)1t! 18•
11(22) !
•I •ICasual Employmentt i! (out of h o m e )• •
1l1•
39 (51.3)1! 42 •
(51.2> : 1• *
! Inf ormal sector1 • f •iTotal Casual Employ!t •
16 (21.1) : 211
(25.6) : • 1!ii •
laent ! > : !No work (1ooklng) !: : i t
55 (72.a) : 63 «
•(76.6) !
1
a (5.3)•: l4•!
((1.2) !
I11•
• Includes casual work In and out of homo.

55
Figure 4 shows the number of persons who were
earning income (in shillings) in both malnourished
and well nourished households. The Income groups
were coded as follows:A ----0 - 250a --- 25i - 500C ----501 - 750D --- 751 - 1000E ----iOOi - 1250F ----1251 - 1500G ----1501 - 1750H --- 1751 - 20001 ---- > 2000
Practically similar proportions of persons
76.8* in malnourished households and 78.9* in well
nourished households (78.9*) had no Income. In
malnourished households there were more persons -76
(19.3*) earning incomes between 250 to 1250
Shillings compared to the persons in well nourished
households who were oniy 43 (11.4*).

I
I
Figure 4: Distribution of Income Earners by Income Category and Household Type
ot o
A ---- 0B ---- 251C ---- soiD ---- 751E --------------1001 -
F -----1251 •-G ---- 1501 -H ---- 1751 -I ---- >
L
250 500 750 1000 1250 1500 1750 2000 -
2000M alnourished S 3 Well Nourished
I n c o m e R e p o r t e d In Shilling*.

income oiatrlbutI on is presented in Table 8.
More weil nourished households (24.4%) had no
Income compared to the malnourished households for
which 13.2% had no income. In both cases a high
proportion of households (55.2% in malnourished and
42.7% in well nourished households) had average
Incomes of 1000 shillings or less.
About one third of each type of households
(malnourished and well nourished household) earned
between 1001 to 2000 shillings. Only two well
nourished households earned over 2000 shillings
while no malnourished household earned above 2000
shillings. For three income categories (i.e.
shillings 0, < 1000 and 1001-2000), there was
statistical significance between the two household
type*.
In addition, weii nourished households had
higher mean monthly Income per person and per
household (Table & i . These were 229.6 and 1047.0
shillings respectively compared to malnourished
households who had 1S5.6 and 1010 shillings
respectively. The difference, however, was not
s i gni fleant.

-62-
Table 8: Distribution of Households by Income Category.
I I I :Month i y 1 1i ncone ! Ha i nourlshed Ue 1 1 nourished
(s h l 1 1 lngs > •• n-7o % n«82 * :••
01»: 10
%9
! 13.2 14: : : 24.4 :
<1000 •• 42 : 55.2 54 5 42.7 S1001-2000 • 24 1 31.6 24 1 29.2 :2 0 0 1 -Max. J 0 i 0 2 : 3.6 :
J
Chi square vaiue 7.642, df 2, p< 0.05.
Tablo 9r M e a n Reported Income Per Person InMalnourished and Well Nourished Households.
I Income Hainourished U e 11 n o u r 1 shed1 (Kahililngs)
! Per capita i35.6 229.6
1 Per Household 1010.0 1047.0
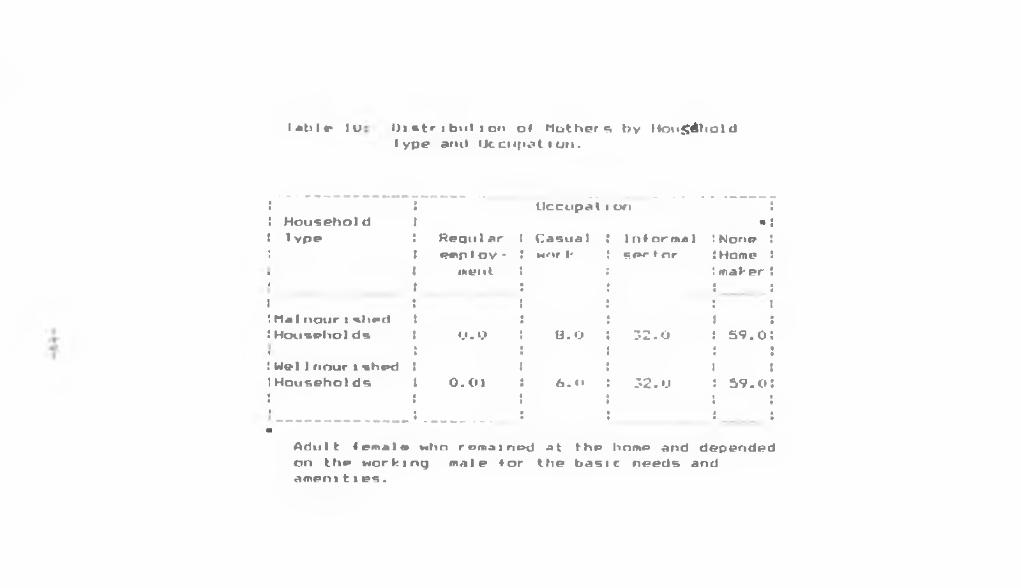
5.6.4. M aternal Attributes.
Mothers who were household heads were
few; only 4* In malnourished households and 11%
In well nourished housenoids.

-63
In both cases about 59* of the mothers of
the index children were home makers and 32* worked
in the informal sector. More mothers from
malnourished households (8%> had casual work
conpartd to the mothers from well nourished
households who were 6*. In malnourished households
none of the mothers had regular salaried employment
while in well nourished households there was one
mother with regular salaried employment (Table 10).
Mothers from well nourished households spent
more time with their children than those from
malnourished households. In well nourished
households. 70.2* of the mothers spent all the time
(24 hours) with the children and only 13.2* spent
less than 12 hours with their children.
in malnourished households on the other hand,
38.2*-- remained with the children over the 24 hour
period while a much higher proportion (44.7%) of
mothers from mainourished households remained with
the children for 12 hours or less.
I « b I «* lu l>» r.tr i bu t i o n o * M o t h e r 5 b y H o n S t l i o l d I ype am) IJcciipation.
»• U c c u p a t i o n ■•! H o u s e h o l d t 1 y p e R e g u l a r ! C a s u a l 1 n ♦ o r nta 1
* :: N o n e ;
•• e m p 1 o v - ! wn r 1' e e r *• n r : H o m e J••
m e n l !••
! m a k e r !• • • •
: 11 : i5 M a i n o i i r i s i t e d «• : :J H o u « t h o l d s o . o : o . o
■3 2 . 0 : 5 9 . o :
• ••I W e l 1 n o u r I s h e d
■i
• •i t
! H o u s e h o l d s••
o . o i : 6 . u••
3 2 . 0 : 5 9 . o :• • • •
1 •• i a • •m
A d t i l t f emfl 1 <t w h o r e m a i n e d a t t h e h o m e a n d d e p e n d e don the working male tor the basic needs and a m e m ties.

-65-
5.6.5. Hothtri*___PtrlQd flX.-St*y___Lo__ P?r<-urbanAreas,
Table 11 shows that about seventy four
percent of mothers of well nourished children had
lived in the area for 5 years or less while 65.8%
of mothers from malnourished households had lived
for the same period. In both cases a similar
proportion (about 16%) had lived in the area for 6-
11 years. Twice (15.6%) as many mothers of
malnourished children had lived in the area for
over 12 years as had the 7.3% of mothers in
we I 1nourished children.
Although there were differences between the
two types of households, no statistical difference
was observed (Table ii>.
Table ii: Maternal Period of Stay in the Study Area.
1 «! Number i Proportion of mothersl of i in : i n: Years ! ria 1 nourished :
; :Wei 1 Nourished
3 1 l n % i ; i 50 5 5 . 8 !
n %
: 0-5 61 74. 4! 6-11 3 ii 16.i : 15 18. 35 >12 ; 12 15.8 i
1 36 7. 3
Chi square 2.726, df 2, p > 0.05.

- 6 6 -
5.7. Food Acquisition Hetnods and Purc_h_a_sJ_n^_
P u r c h a s i n g was t h e m o s t popular m e t h o d of food
procurement f o r most of t h e h o u s e h o l d s as i s
evident i n A p p e n d i x 4. Gardening w a s reported by
only 3.6S of t h e w e l l n o u r i s h e d h o u s e h o l d s w h o
g r e w c a b b a g e and k a l e . No gardening w a s r e p o r t e d
by t h e p o o r l y nourished h o u s e h o l d s . No f a m i l y
reported g i f t s of food from relatives or friends.
Both types of households purchased the foods
within the area. The money spent was directly
related to the amounts that each households bought
for the home. This implied that well nourished
households spent more money for each food item.
Table 12 shows the purchasing behavior of high
calorie and protein foods by the different
households. Purchases of other food items that aro
served with the staples are reported in Table 13.
These were purchased in smaller amounts.
Far the foods considered in Table 12. more
well nourished households purchased more food
Items than the malnourished ones. Twelve food items
were bought by more well nourished households

-67
Table 12: Number of Households Purchasing SelectedFoods as Recordea from t.he Household Food Budget Survey.
Food Item . nail nourlsnea*
•1 Wei i . nourished•
P
1Value ■'
Maize meal
•1! 72 (54.7)
1l1 77 (93.9) p >0.05 :
Potatoes I 34 \ 5.2)•1» 34 (41.4) p< o.os »:
Rice•1 4 ( 5.2)
l1l
M (17.0) p< o.os :
Millet ; 2 «' 2.6/•• 9 (10.9) p> O.OS 1
Sorghum•: 2 i 2.6/ •• 3 < 3.6) —— :
Wheat basea prod . 2** < 5.2)•1• 13 (15.8) p> o.os :
Sugarl; 67 (65.1) • 82 (100 ) p< 0.05 »:
Bread _2
•i 17 (22.3) 66 (80.4) p< 0.05 »:
Legumes 1 10 tl3.i) «1 (50.0) p< 0.05 3•
Beef\tripe\iIvert; i7 (22.3i
•lt 45 (54.8) p<
40.05 •:
i
Fish•i ia (23.6)
lV 3 1 (37.8) p>
i
0.05 3«Milk . 45 (64.a/
11• 62 (75.6) p>
•0.05 I
4
Eggs•: 3 ( 3.5)
•• 2 ( 2.4)
4___ 3
i i 3C o o k i n g Fat i 70 (52.1> ••
t•62 (100 > p< 0.05 »:
* Significance difference observed between the malnourished and well nourished households purchasings.
Includes pastry (chapatl) and doughnuts Includes cow peas, green grams, and kidney beans

- 6 8 -
compared to only 2 food 1 teens (millet and wheat
based products) bought by more malnourished
households than tne well nourished ones. Therefore
It is apparent that the well nourished households
endeavored to provide greater diet diversity.
For the foods that are served with the
staples, or eaten as snacks and the beverages
(carrots, sweet bananas, cabbage and cow pea
leaves, herbs and spices, cocoa and arrowroots)
only an appreciable number of households from the
manourished and weli nourished groups purchased
those. These food items were purchased by the
respective number of households in the proportions
given In Table 13.
In all cases well nourished households
purchased foods than the malnourished households.
The proportions of well nourished households
purchasing respective items were 8.5% for carrots,
13.4% for sweet bananas, 30.4% for cabbage and cow
p e a s , 16.3% for herba i spices. 14.6% for cocoa and
4.8% for arrow roots. The proportions of mal
nourished households purchasing similar items
wore as follows: 3.5% for carrots, 9 . 2 % for sweet
bananas, S.2% for cabbage and cow pea leaves, 6.5%
for herbs and spioes and no cocoa or arrowroot
(Table 13),

Table 13: Number of Well Nourished and Malnourished Householoa Purchasing Different Food 5tuf f s .
S
Food 1 ten Percentage of households \ reporting the purchase. !
:Ha i
nourisned
Carrots 3. 9Bananas 9.2Cabbage'x 5. 2Herbs & Spices 6.5Cocoa 0Arrowroot uSour milk 0Mutton 0PumpkIns 0Orange 0Ovacado 0Chicken 0Duck 0
i Weil 1 nourished1
! Total••
•!s
l 8.5 1 12. A !1 13. A ! 22.6 •••• 30. A : 39.6 1i 18.3 5 2A.8 l•• 1A. 6 : i a . 6 iz• A. 8 : a . e ••# A. 8 : a . e :1 3.6 : 3.6 •••• 3.6 : 3.6 :: 1.2 : 1 . 2 •t; 1.2 : 1 . 2 •• 1.2 ! 1.2 ••t• 1.2 : 1 . 2 ••« •• f•
5.8. ftMflPAUy Pi Fp.Qd rurcoagesj.
Results of this survey on different food Items
purchased Is given In Taoip 1A. In order to account
for the persons In the different types of
households. a correction factor of 0.95 (i.e.
37A/392, that le 37A persons In malnourished
households and 392 persons In well nourished
households) was used for the well nourished group.
The bulk of the diet comprised of maize meal
and potatoes in both types of households. Mai-

- 7 0 -
nourlshea and wei I nourished households purchased
practically the same amounts of these foods. In
malnourished households mean quantities of maize
meal and potatoes were 7.67 Kg and 2.44 Kg per week
respectively. The corresponding values In the well
nourished households were 6.92 Kg of maize meal and
2.25 Kg of potatoes. Rice was purchased in much
smaller amounts which were practically the same in
both typos of households (i.e, 0.45 Kg in
malnourished households and 0.41 Kg In well
nourished households).
Higher amounts of beans (1.43 Kg) were
purchased by weii nourished households than by the
malnourished ones nought only 0.43 Kg. Higher mean
values were observed for sugar (1.60 Kg>, milk
(3.00 Kg) and bread <3.52 Kg) in well nourished
households than in malnourished ones whose
corresponding mean values were for sugar 1.52 Kg,
milk 1.67 Kg ana bread 2.19 Kg.
For beef and fish, the malnourished
households and well nourished households had
vltually similar means. Well nourished households
hAd 0.77 Kg and 1.06 Kg respectively while the
malnourished households had 0.71 Kg and 1.02 Kg
respectively.

-71-
The mean value of cooking fat was more <0.91
Kg> in well nourished households than In
malnourished ones where the mean purchase was 0.69
Kg. There was also a statistical significance at
p<0.05 with respect to this food Item. No other
statistical significance was obsorved with the
other food items.
Table 14: Average Purchases of Different Foods asReported by the M a l n o u r i s h e d and Well Nourished Households.
Food 1 tem Halnouri shed ! Well n o u r 1 shed<I
! Mean Sta. Mean Sta.•1 - Error Error:• __ 3D K « ( k ) SD
IMalrc mea i 7. 67 0.58 6.29 0.53:Potatoes 2. 44 0 . 5a 2.25 0.33: R i ce 0. «5 0. 10 0.41 0.07:Beans 0.45 0. 10 1.43 0.06! Beef 0.77 0.11 0. 71 0.07!Sugar 1.52 0. 12 1.60 0. 1 1I C o o k l n g fat . 65 0.05 : 0.91 0.20:Bread 2. 15 0.24 3.32 0 . 2BIFish 1.02 0. 7. i 1.06 0. 19;Mi 1k ( liter)!.67 0.50 3.00 0.25:____________________________________ _____________* Statistical significance at P <0.0S.
5.9. Twenty. Jigjj.r___riaUL...fr.i.g..taf Y__ Sg-CaJJ___of___UieS u o s a m p j e_of Index C h i l dren.
Three dally meals were recorded in all the
househo ids. There was no separate preparation of

- 7 2 -
mea I b for the children. Thus no supplementary food
preparation methods were reported with respect to
mincing meat, mashing grains or enriching foods by
the addition of fats'xolls or proteins In both
types of households.
In both types of households, numbers of
children consuming different typos of foods is
given in Figures 5 and 6.
M a l2e meal was tho most widely consumed food.
This was consumed as posho (ugall) or porridge. The
porridge was consumed mainly in the morning and the
ugall at lunch and supper times. The consumption of
porridge varied in the two types of households.
More well nourished children <14)were fed the
porridge than were the malnourished children <11).
Twice os many (12) well nourished children were fed
higher amounts (over 3/4 of a cup- 107.5 mis)
compared to the ma 1 nour i shed children who were 6.
Five malnourished children were fed 1/4 of a cup
or less of maize porridge compared to the well
nourished ohildron of whom only two consumed
that amount (Tabie 15).

<D (fi C
Figure 5: Number of Households Feeding Specific Foods (Early Morning Meal)
TeaXmilk M ille t Sorghum Bread Eggs
Malnourished Well nourished

Figure 6: Number of Households Feeding Specific Foods at Lunch and Supper
Rice Beans Kale C arro ts Beef Stew Fish Tomatoes Ugali
Malnourished W ellnourlshed

- 7 5 -
Table i S : Distribution of Children by Amounts of Porridge Fed in the Different Households During the Early Morning rieai .
1Status i
%•Amounts in
•1ml 11 1 1 1ters
1•• 62.5 :167.51250
•>250 !
•M a l n o u r 1 s h e d .
(n « 3 0 ) !
• •5 i 1 1 A
i 11 |
: i 1 ! »I1 (36%)1
• i 4 •1 1•
U e 11 nour i s h .<n«30> !
1
i 42 1 A l a
• •1 1
l 1 a : * i a <A6%>:
i :
Similar amounts (200-300 grams) of maize meal
(ugaI 1> were reported for lunch and supper by both
types of households. Approximately 16.6% of
malnourished children were reported to have
consumed rice at supper time. No well nourished
child was reported to have consumed rice at any one
time.
Beans were fed to more (6 <20%)) of the well
nourished children than to the malnourished
children. Only one (3%) consumed this food. Two of
the well nourished children were given a dish with
beans at breakfast, and the other A fed on beans at
supper time. This implied the move from the
traditional diets of whole grain consumption..

-76-
Thc children from the well nourished
households fed on a combination of many other food
Items which Included millet and sorghum. Two well
nourished children were fed millet porridge at
breakfast in quantities of 150 milliliters while
another two were fed on sorghum porridge in
quantities of 200 milliliters. Children In the
malnourished households wero not fed any of these.
Bread was served with margarine to more (46%>
of well nourished children while only 16.6* of m a 1
nourished children were fed this food at breakfast.
Bread alone was fed to 39* of the malnourished
children between meals In unspecified quantities
between meals.
Milk was fed In a brew of tea and sugar,
mostly at breakfast, to 16 malnourished children
compared to only 2 of the well nourished children.
Eight well nourished children drunk milk after
supper. No malnourished child drank milk after
meaIs.
Two well nourished children ate eggs at
breakfast while 3 others ate eggs at supper giving
a total of 5 children. In malnourished households,
only two children were given eggs at breakfast.

- 7 7 -
Beof stew w.m served to the children by both
types of households in unspecified amounts. More
well nouflsnea households (18 (60%)) fed beef
stew than the malnourished households where thl3
was reported by i2 (40%) of the households.
Tomatoes were used in the beef stew* in over
66% in both m a lnourished and well nourished
chi Idren.
A oiear soup of dry fish was given to more
malnourished children <15 (50%)) than to the well
nourished children (12 (40%)). In both types of
households, this soup was sorved with the staple In
unspecified amounts. No fish fillet consumption was
reported by any of the households.
Kale was the most popular vegetable fed. It
was fed to all of children at lunch and supper
times In 50% of all the households. In most cases
the well nourished households mixed the kale with
the staple (maize meal). In three of the well
nourished households, the kale was mixed with the
beef stew. In malnourished households kale was
S i m p l y cooked without being mixed with a n y food,
and then consumed with ugali.

- 76-
C a r r o n s were eaten by oniy one well nourished
child and no malnourished child red on carrots
although this rood item Is abundant in the area.
All the children in both types of households
consumed cooking far. because It was used In the
preparation of of many dishes.
Occasional snacking was repoted in more well
nourished households ilA (46.6%)> than in
m a lnourished ones where only 5 < 16.6%) of children
were reported to have snacked. Snacking consisted
mainly of sweetenea tea ana milk.
Seven <23.3%) malnourished households reported
feeding pastry ichapati) and doughnuts (raandazt)
to the mainourisned children In unspecified
quantities. These products were bought from the
kiosks (grocery/ stores. No well nourished
household reported feeding pastry (chapatl) or
doughnuts imandasti) to the children.
Three mothers of malnourished children and one
mother of a well nourished child reported w i t h
holding eggs. Four mothers of well nourished
children considered beans harmful to children under
13 months.

-75-
CHAPTER 6
DISCUSSION
6.1 1ntroductIon,
In considering the results of this study It
must oe emphasized that the cause of malnutrition
is multi factorial (Taylor, e t at., 1976). HousehoId
practices have been known to be culturally
determined while culture is defined as the
peoples' way of life (Fieldhouse, 1986). In p e r i
urban areas there is a great deal of intra-cuItural
diversity as the individual household members are
exposed to new ideas coupled with generational and
educational differences (Pelto, 1987).
With regards to children's nutritional health,
maternal attributes and food practices were
important factors as shown by this study.
6.2 Selection and C l a s s ification of_____ thjLH o u s e h o 1d s .
During tho study it was observed that many
households in the peri-urban area are occupied by
adults with no children. This is contrary to the
o b servation made during a tour of this area which
revealed that there were many young children at the
road side.
-60
Many study findings have shown that the basic
causes of most of the malnutrition in the world
today are social (Ritchie, 1967). Peri-urban aroas
present a population of diverse ethnic origins
which has migrated from the rural homes and has
formed large oonglomerates of shelters within the
city limits <uy wer, 1975).
Of the 158 households, 76 of these were
outrightly classified as having malnourished
children. The children in these households had
measurements that conformed to the International
norms whereby children's weight for age of 60-65%
(or below 70%) of tho National Council of Health
Statistics (NCH5) are undernourished according to
tho Gomez classification. According to Jolliffe
(1966) aiso these children were in the lower range
of the second degree malnutrition (60%-75%).
The nutritional status of these children
showed patterns similar with the patterns
identified by Stephenson (1979) In rural Konya.
According to this categorization, the children in
rural Kenya presented past chronic malnutrition
(low weight for age, low height for age and normal

- a i -
weight for height) and current long duration (low
weight for age. low height for age and low weight
for height) malnutrition. The results of this study
confirm that it is some of these similar families
that have moved to the peri-urban areas. and the
children still maintain the same nutritional
status. This same pattern of deprived growth was
also found by West (1966) in Bangladesh. Hence
rural to urban migration has not solved nutritional
prob I e m s .
Kigondu (1966) stated that children grow both
In weight and height with age. Weight for age index
was used in qualifying the children as it combines
both acute and chronic malnutrition. In addition It
is recommended by World Health Organization (WHO)
in describing the nutritional status of children.
6.3. Effect of 5eIected H o usehold Character 1sticson the Nutritional Status of Young Children.
T-ami-ly-SUe.,.
The number and the ages of persons In the
household are Important determinants in the
prevalence of optimum nutritional health. These two
demographic characteristics influence the amounts

-82-
of food avallaoie to the household (Helto, 1987)
and the tubsoquont distribution of that food In the
home. High numbers of aauit persons require high
amounts of food to be provided. High numbers of
young children necessitate the provision of high
energy density and high protein foods to meet the
increased nutritional needs of the growing
children. In cases where eating utensils (plates
and bowls) are shared, children may not consume
adequate amounts if tne number of persons in the
household is large.
This difference (0.24) in the family size
between malnourished and well nourished households
both of which were observed to have similar age
distribution of the residents, similar occupations
and marital status. Is too small to account for
the difference In the nutritional status of the
chi 1dren.
Marltai Status.
Marital status has been cited as a factor
in the well being of all household members
including the nutritional nealth of the children!
as observation reveals many problems associated
with single parenthood. in this study the

-63-
diffprence in ine nuzritionai status between the
children In the two households can not be explained
by the marital status as this was practically
similar (section 5.6.2.).
Dependence Ratio. Employment Pattern and Income S t a t u s .
The economic status of any household depends
on the earning capabilities of its members.
Children below 15 years and adults over 65 years
are usually regarded as Incapable of bringing In
any income for the household upkeep. High numbers
of these two groups imply high dependence ratios
for the particular household.
The dependence ratio of malnourished
households <1.33) though somohow higher than that
of well nourished households <1.29) does not
account for the difference in the nutritional
status of the children as it is too small.
The employment pattern which was also found to
be similar in the two types of households does not
also help to explain the the differing nutritional
status. Similarly the income does not explain the
d 1 f f erence in the nutritional status of the

-3«-
c M I d r e n as tho proportion of thou® getting
bp tween 250-1250 shillings was higher (19.3%) in
malnourisnea housenoids compared to the one (11.4%)
in we 1 i nourished households.
There were three persons earning over 2000
shillings in well nourished households. These
higher earnings possibly account for the slightly
higher per person and per household income (229.6
arid 1047.0 shillings per person and per household
respectively in well nourished households compared
with 195.3 and iOiO.O shillings per person per
household respectively in malnourished households).
The result# arc consistent with other previous
studies which have incorporated the analyses of
Income and poor nutritional status. These studios
have disclosed that with urbanization and
development (change) new nutritional hazards have
come up. and in some cases income alone ceases to
be the most detrimental factor to the household
diet. Several illustrations) studies and
observations show that diet have failed to Improve
In some households in spite of rising incomes in
the peri-urban areas.

-35-
6.4. E.ffecr? g f, Ha_t_erna A t t r i b u t e s .
The raothir'i period of *tay In peri-urban
areas (section 5.6.5) was found to have
Influences on the practices due to the exposure to
new Ideas from peers and the mass media. With long
residence, household members may learn or adapt new
coping skills (Dennis, 1965) in order to survive
batter in the new environment. It was found that
that a higher proportion of mother* 0 4 . 2 % ) from
maInourishea children had lived longer - over 6
years in the peri-urban area compared to the
proportion of mother* (25.6%) In well nourished
households who had stayed in the area for that same
period. with the long stay, it appears these
mothers encounter more hardship in terms of
Increased family size with respect to dependants.
Honce the nutritional status of the vulnerable
members deteriorates.
The better nutritional status observed in the
children w h o m mothers remained with them for longer
periods implies that intontionai child neglect can
lead to malnutrition of the child. There has been
evidence in support of closer child mother contact.

- 8 6 -
In this study, mothers In well nourished
household*? spent more time with the children
although these same mothers had similar demographic
characteristics, marital status and employment
patterns as the mothers in malnourished households.
Cultural characteristics or education of the
mothers may account for the difference. This has.
however, to be established.
6 • 5. Ef f.ects___of Food__ practices and F oodl_n taxes.
The observation with respect to food
a cquisition methods showed that purchasing was the
most common method as households In peri-urban
areas have no space for cultivation. Well nourished
households had higher purchasing frequencies for
most of the food Items (Appendix 2). Thl3 should
explain why the children in thl3 households had
good nutritional health compared to their peers in
the malnourished households.
Although there is considerable casual eating
outside of the home in the urban areas (Dennis, et
al., 1566, Ueob, 1988), it has been possible to
estimate correctly the nutrient defici ency for
vulnerable groups from the relationship between the

-67-
food accessibility at the household level without
actually knowing now actuai Intakes have varied in
the groups (Woria Bank. 1986). Household food budget
surveys were used therefore as they are aost
appropriate methods of determining food
accessibility at the housenoid level.
Though this is basically a rocall method. the
results obtained show a striking difference with
respect to the provision of diet diversity by the
well nourished households. The results obtained
show not oniy a greater diversity in well nourished
households. but these households bought higher
quantities of the major foods such as beans. milk
and sugar which are good contributors of protein
and energy; and relatively more varieties and
higher quantities of vegetables. They also hud more
casual snacking which could have contributed to the
improved nutritional status.
The
studies,
most of
Dav i dson,
nutrlent
observations are in agreement with other
r or example, Latham (1979) stated that
the food consumption Is done at home,
et ali, (1986) reported also that
content Intake has a fundamental
relationship to good nutritional health.

-66-
With great*r diet diversity, there is better
provision of quaiity and quantity of nutrients. The
better nutritional status of these households
purchasing more variety of foods is even explained
better by the fact that the children in these
households are likely to consume a greater variety
of micronutrients. it has been well established
that in order for the body to metabolize the major
nutrients, certain key vitamins and minerals are
requlred.
It is important to note that malnourished
households reported purchasing more nandazl and
chapotl from the kiosks. This could have
c o n siderably reduced their purchases of the more
nourishing foods for the child. Hence this
partially accounts for the low nutritional status.
6.6. C_h_l_l.d_F.eeq 1 ng Practices..
It is evident that ohild feeding practices
were better in well nourished households. The
feeding of maizemeal porridge In higher amounts
(over 3/4 cup) to 12 children (40%) in wo I I
nourished households is a far much better practice
than feeding tea with milk and sugar which was
practiced oy the malnourished households In feeding

- 6 9 -
18 (80K> of raainour1 shod children. This high
frequencies of feeding this low energy drink
explains the prevalence of undernutrition among
thoso children. C o n siderable snacking was obaurved
as well in w e i 1 nourished households.
From the results, it is reported that more
malnourished children were fed on rice than the
well nourished children. Only one malnourished
child <3*> ate beans compared to the 6 (20%) of
well nourished children. This finding conformed to
Witcher's observation in Ecuador where the women
and children who migrated to urban areas changed
their dietary patterns. These woman and children
reported low c onsumption of whole grains owing to
the availability of refined grain products. This
move from the traditional diets which have been
cited long ago as appropriate for the maintenance
of the body accounts for the low nutritional health
among these children in the malnourished households.
Summary.
Tho over all o b servation is that even if
household age distribution and income factors
which influence the food practices are similar,
differences in nutritional status can be observed.

-90-
Tho hypothesis that no difference exists In
food procurement between the households was not
true. while the second hypothesis stating that
undernutrltlon is significantly related to the
quantity of food accessible to the household was
true.
It Is obvious maternal and food practices are also
determined by other factors. Such factors may he
cultural practices and nutritional knowledge which
this study did not address.
- 5 1 -
CHAPTER 7
CONCLUSION AND RECOMMENDATIONS
7.1. Cone t us Ion.
Family food practices are major determinants
In the prevalence of undernutrltion among children
in households with relatively similar
characteristics living in the same ecosystem.
Exposure to new ideas is not always the most
important determinant of good nutritional status
among young children because long residence in
peri-urban areas nurtures more concerns as
household members adjust to the new settlement.
The household characteristics considered here
namely family size, employment patterns and marital
status did not explain the poor nutritional status
In the households.
The mothers' period Of stay in the
area was an important determinant as
expected due to the detarenment from
h o m e s .
peri-urban
would be
the rural
In urban areas, purchasing is the most
important method of food acquisition and it is an
indicator of fooo consumption.

7 . 2 . R g g g ja a g n d f t U Q n j .
Families newly migrated from the rural homes
should be counseled on living In peri-urban areas
In order to reduce recurrence of poor nutritional
health status among their vulnerable members. These
families should make use of the available
government nutrition rehabilitation facilities and
the non-governmental ones for the example the
churches'and the World Vision, Danish
International Deveolpment Agency In the urban s e t t
ings in order to improve their welbelng In the new
sett 1eaent.
Cultural practices pertaining to feeding of
the young children should be studied in urban
areas to determine their Influence on food practices.
Programs promoting better nutrition must a s c e r
tain that diets that are recommended are feasible
and suitable with respect to the new culture that
the peri-urban residents adapted.

- 9 3 -
REFERENCES
Addo, A. A. Kareem, F.M., Sampson, T.I., Jibrin, C.L. (1988).
Anthropometry and Nutrient Intake of
Nlgorlan School Children fro* Different
Ecological Zone*. Ecology of Food L
Nutrition Volume 21: No A p271-272.
Berg. A. (1981).Malnourished Peopi*, a Policy.
View. Poverty Basic Needs Series p26.
Berge, A. (1987).Malnutrition. What can be done?
Lessons fro* World Bank Experience p2,A. 86.
Cameron, M . , Hofvander, Y. (1983).
Manual on Feeding Infants and Young
Children. Oxford University Publication
Third Edition. p23.
Central Bureau of Statistic*. Social Perspectives (1984).
Ministry of r 1a n n l n g - K e n y a .
Chana, A. S. (1971).
Uncontrolled Urban Settlements Case Study for
Kenya. Policy Indicators. Tutein & Koch
Capenhagen 3.03.

-94-
Cours in, (1965).
Effect of Undernutrition on Central Nervous
System Function. Nutrition Reviews 23: 6S
1965.
Davidson F . R . , Hayek, A. L . , Altschul A. M. (1986).
Towards Accurate Assessment of C h i l d r e n ’s
Food Consumption. Ecology of Food & N u t r i
tion 10: p309-317.
Den Hartog. A. P. and van Stavornn, A.U. (1985).
Manual for Social Survey on Food Habits
and C onsumption In Development Countries.
Pudoc Wageningen pl6.
Dennis, B . , Shufflett, P. A. (1985).
A Conceptual & Methodological Model for
Studying Dietary Habits In the Community.
Ecology of Food U Nutrition. 17 p253-262.
Dwyer, (1979).
People and Housing in Third World Cities.
Longmans London.
Dobblng, J. (1985).
Infant Nutrition and Later Achievement. The
American Journal of Clinical Nutrition 41
Febraury p477 -464.

Facts of Life A Communication Challenge (1980s).
Published by UNICEF L WHO and UNESCO
3 UN Plaza New York p41
Fleldhouse, P. (1986).Food £t Nutrition Customs and Culture.
Croom Helm Publishers. New York.
pl-2.
Folds, R. (1987).
The Use of Traditional Ingredients in the
Development of Weaning Foods in the Expert
Consultation on Upgrading of Traditional Food
Techniques Volume 2 p9l.
Graham, (1972).
Environmental Factors Affecting the Growth
of Children. The American Journal of Clinical
Nutrition 25 pil64-ll88
Graves, P.L. (1972).
Nutrition, infant Behaviour and Maternal
Characteristics, a Pilot Study in Uest Bengal
India. The John Hopkins University D e p a r t
ment of rathoblology.

56
Huenemann
J a I ] lfe,
Jel 1 iffe.
Kahn. E.
Kaln. J..
* R. . Schrimshaw. H. (1570).
Dietary Practices and
Ecological Assessment
Status of a Guatamala
Volumei. INCAP Summer
Pub I i c i-iea 1th.
B e !ief s 1n the
of the Nutritional
Flnca Population
Course in Clinical And
D.B. <1963 >.
Urbanization and Child Nutrition in Africa.
International Child Uelfare Reviews. 16
(2): p 6 7 .
D. B. (1966).
The Assessment of Nutrition Status of the
Community. (With Special Reference to
Field Surveys in Developing Regions) WHO M o n o
gram Serial No 53.
(1961).
Peadiatrics in an Industrialized Part of
Africa. Journal of Pediatrics, 58: p277.
Oscar, R . (1985 >.
A D e scription of the Use of Household
Budget Surveys to Estimate the Dietary Intake
of Low Income Urban Families. Ecology of Food
& Nutrition Volume 18; pl9-27.

- 9 7 -
Karat'1. B. S. and Martinez, 0. B. (1984).
Food Availability in Kuwaiti and Non-Kuwaiti
Households. Ecology of Food and Nutrition
Volume i5: pi9i-20i.
Kigondu J.. D. (1986).
A Guide for Health Workers in Kenya M.O.H.
) Kenya. March. plO.
King, M., King.F., Mar todipoero, S. (1961).
In Primary Child Care. Manual for Health
Workers Book 1 Oxford Medical Pulications
p90.
King, M.. King, F . , Morley, D . , Burgess, L. Burgess, A. (1972).
Nutrition and D eveloping Countries Oxford
University Press Chapter 8.6.
Krause M. V . , Mahan L.K. <1979).
In Food, Nutrition and Diet Therapy. W.B.
Saunders Company Sixth Edition p312.
Latham M. C. (1979).
Human Nutrition in Tropical Africa. FAO Roma
p225
L e o n a r d o , M. J. (1977).
EnvIronmentai Determinants and Signs of
Malnutrition in Edit R.M Suskind Raven
Prov. New York. pi**.

- 9 8 -
Malna G. U. (1988).
Ecology of Preschool Malnutrition In
P e r i - u r b a n Nairobi (CAVS> University of
Nairobi. Kenya.
JH e r r l 11,S . , Read U.S.A. (1961).
Ecological Assesement of the Nutrition Status
of a G u a t e m a l a n Finca Population Vo I i 1981.
Mar tore 11, R. (198A).
Nutrition and Health Status Indicators.
Living Standard Measurement Study. Working
Paper No 130 LSH5 p 7.
Mvangi, W. N. (1982).
Low Income Food Systems and Food Safety in
Kenya. A Case Study of Kangemi Peri-urban
Area. IDS DP 278.
Nabarro, D. (1981).
Social, Economic, Health and Environmental
Determinants of Nutritional Status. UH0-SEAR0
Workshop on Nutrition Monitoring and E v a l u a t
ion. New Dehli, India. pl8.
Nakatsuka H. , Kasahara, M . , Uatanabe, T . . Hlsamichi, S. ,
Shimizu, H. Fujisaku, S . , Ichinowatari, Y. ,
Ida. Y., Suda. M. , Kato. K. , Ikeda, M . U 9 8 8 ) .
Urban-Rural Difference* In Food Habits in

-SB-
North -Eastern Japan. Ecology of Food &
Nutrition Volume 21s p77.
N j a m a , D. (1988).
Pre-school and Maternal Malnutrition in P e r i
urban. (CAVS) University of Nairobi. Kenya.
Oftedal, T . , Levinson, F.J. (1974).
Health, Nutrltionand Income Distribution in
International Nutrition Planning Program.
Massachusetts Institute of Technology.
Cambridge Massachussetts. p9-ll.
Oomen, J. M. V. (1981).
Monitoring Health in African Dams. The
Kamburu Dam Kenya as a Test Case.
Chapter 9 p99.
Otundo, S. B. (1982).
Rural-Urban Dualism and the Consumption
Behaviour of Kenyan Households. M.A. Thesis
in Economics U.O.N.
Pa t h 1 son, M. (1963).
Teaching Nutrition. The Ioua State
University Press. Ames Iowa U.S.A. pl30.
Pellet, P.L. (1977).
Marasmas in the Newly Rich Urbanised
Society. Ecology of Food & Nutrition. Volume
6 1 p53-56.

PeI t o , G.H.
Per Pinstrlp
Ritchie, J.,
Sal. F. T.
Schnetz, M . ,
Schr i mshaw.
J
- 1 0 0 -
( 1987).
Determinants of Childhood Feeding Practices,
University of Connecticut. USA.
Anderson, (1981).
Nutritional Consequences of Agricultural
Projects! C o n o e p t u a 1 R e lationship and
Assessment Approaches World Bank Staff:
Working Paper No. A56 May. p47, 89.
163.
AS. (1967).
Learning Bettor Nutrition. A second Study of
Approaches and Techinlque* by Department of
Human Nutrition. London School of Hygiene
and Tropical Medicine. p21.
(1963).
The Impact of Uroan Life on the Diets of
Rural immigrants and R e p e r c u e e 1ons on the
Nutritional Status of the Community Working
Paper No. 4 WHO Working Paper.
E g o r a m a i p h o l , S., Leitzmann, C. (1984).
Migration and Nutrition In Thailand. Ecology
of Food fc Nutrition. Volume 15: p89-l07.
N.S. (1965).
M a lnutrition and Infection Bolden's Rev.

-iOi
Nutritional n e s . , 26 pl5
Shihembetsa. L.U. (1989).
Brief Notes on Kariobangl. University of
Nairobi. Intornat1o n a 1 Workshop On Housing
( U N C H S -PGCHS HRDU > pi
Stepheson. L.S., Latham, L.C., Crompton, D.W.T., Schulpen,
T.W.J., Jansen, A.A. (1979).
Nutritional Status and Stool Examinations for
Intestinal Parasites in Kenyan Preschool
Children in Machakos District. East African
Medical Journal. Volume 56: NO. 1.
Tadaro, M. P. (1982).
Economics for a Developing World Second
Edition Longman's Group Ltd. p426.
Taylor C.E., Taylor E.M. (1976).
Multi-factorial Causation of M a lnutrition in
Nutrition in the Community. A Text for
Public Health Workers. Edit. D.S. McLaren
England: John Wiiey and Sons Ltd. (chap 7)
p75-85.
Tlmmor, C. P., Falcon, W. p., Pearson, S. R. (1983).
Food Policy Analysis A World Bank

Publication. The Jonh Hopkins University
Press. p3S.
United Nations (1986).
How To Weigh and Measure Children. Assessing
the Nutritional Status of Young Children In
Housenola Surveys. New York. p2l-4i.
University of Nairobi Department nf Architecture and Design (I97l>
Hathare Valley Housing and Research Dev.
Unit A case Study of Uncontrolled Settlement.
p4.
Van Steenbergen, U.M., Kusin, J.A., Gnchere S.R. (1984)
Food Consumption of Preschool Children In
Maternal and Child Health in Rural
Kenya. Edited by J.K. van Ginneken and A.S.
Muller Croon Heim Limited. Kent pl67 196.
Uebb, R. E . , Hyatt S. A. (1966).
Hatian Street Foods and their Nutritional
Contribution to Dietary Intakes. Ecology of
Food £■ Nutrition Volume 21 pl99-200.
Uelsner, T.S. (1975).
Kariobangit The Case Study History of a
Squatter Resettlement Scheme In Kenya.

- 1 0 3 -
Werner, D.
West, K.P.
V! I I lams,
Winslow, C.
Wi tcher B .,
Wo 1s I e y , A.
World Bank
(1981).Where There Is No Doctor. The Hesperian
Foundation. Chapter 11. plt5-117.
Jr. (1986).
P e r i - u r b a n Malnutrition In Bengladesh.
Differential Energy, Protein and Growth
Status of Children. Ecology of Food and
Nutrition. Volume iS: p99-112.
. R. (1981).
N u t r i t i o n and Diet Therapy. The C. V. Mosby
C o m p a n y .
C.A. (1984).
The Cost of Sickness and the Price of
Health. Geneva WHO Monogram. Series No.7.
Kolasa, K . , Bond, J.T. (1988).
Influence of Rural-Urban Migration on Adult
W o m e n ’s Food Patterns and Adequacy of their
Children's Dint, in Ecuador. Ecology of Food
& Nutrition Volume 2i pl95.
, Baghurot, P . , Worsloy, A.J., Coonan, W . , Peters, M.
(1985).
A ustralian Ten Year o l d ’s Perceptions of
food: i Sex Difference Ecology of Food &
Nutrition Vol. 15 pp231-2A6.
Policy Study <1S66>.
Poverty and Hunger.

-104-
APPENDICES

-105-
APPENDIX !
HOUSEHOLDS C H A R A C T E R ? STLCS QUESTIONNAIRE
FIRST STAGE
Circle - 1 Clinic Case - 2 Hoee Visit Case3 Control j ;
d a t e i ____ : ______ : : ____: _____ : : 8 9 _ :dd no
CHILD'SN A M E ______________________________________________________ _____
Child's Date of Birth I____!____:____:_________;_____ ;D D M H Y y
Age in Months ! _____!
'Jas the date of birth verified by a document?
« I* _________ •
i». Child Health Card, Registration Card etc.
1 » yes 2 * no
SEX Male / FemaIe
MOTHER'S / CARETATER'SN A M E ________________________________________
PLACE OF RESIDENCE: HOUSEHOLDN O . ______________________
C L U S T E R ________________________ :1 * Gitathuru2 = Grogan3 * Highridge4 * Korogocho5 ■ Ngomo’go

FOOD PRAC nut UUfcSIJHNNAJRfc.C i r c l e (Healthy or Halnourished>
I'agr* S of 8U%«* pencil for filling: Initials of interviewer 5Cluster H.H. Number |___ : : Date : : i____;____ :/09
* Name of the head of the househol d Sex H/F ! J
0 Name of respondent
h e r .
No.! Name0•
J A g e
f•
•■
••
S e x
M \ F
••
••
o r n i p . 1
••
R e l a t .
t o H . H
S P e r i o d o l S M a r i t a l
R e s i d e n c e . ! s t a t u s
I
t•
M i
! n c c
O l »• 1
• •t
••
1•
•• !
0 2•• 1 1 •• a
••a •
• i
0 3•• 1 \ •
• i•a
t•
a• •
n O•t 1
1•
• ••
•i : •
•la :
• • 3•• ■
•••
••
•• i •
•aa :
• • / . ••
••
■•
00
«a s
••
•a i
•0 1 •
• 9•
a• i
••
00 :
« * nt
• 0 a a a a 0a • 4 a « a a •
R e l a t i o n I n t h e 11.11
1 H e a d2 W i f eT. S o n4 D a u g h te r5 G r a n d d a u g h t e r h G r a n d s o n7 br other
( i r c u p a t i o n1 R e q u l a r e n p l a y m e n !
2 C a s u a l3 B u s i n e s s 0 N o n e
Mar i » a I S t a t u s1 s i n g l e
2 m a r r i e d3 d i v o r c e d4 s e p a r a t e d 3 w i d o w e d6 o t h o r

- 1 0 7 -
CHILD INFORMATION
Household No. :_____!_____ :
1 Name of Index c h i l d ____________________________________
2 Sex___________ 1 = Hale 2 - Female :__ !
3 Date of Birth !___ !____/:___ !____ :___ !____; .
DD MM YY
Was the date of birth verified by a document? :__te. Child Health Card, Registration Card etc.
1 • yes 2 ■ no
ANTHROPOMETRIC D A T A .
Enua. 1
Weight (Kg .1) I__l _
Height (Cm)
I t • I • I I I I I •
Page 3 of 0
Enum. 2 Average
CLINICAL SIGNS OF MALNUTRITION:
(Fill In number of each observed sign)
General Appearence
1 ■ looks healthy2 « looks unwell : !
EYES1 * pale conjuctive2 3 Conjuctlvltls3 ■ visual loss In any of the eyes :

-loe-
CWILD INFORMATION
Page A of 9
Household No.
SKIN1 • burns \ lesions due o fnjury2 ■ scabies3 » others s p e c i fy---------- --------;____ ;____•
Other signs:1 ■ any evidence of edema2 • muscle wasting ;___ •____•3 ■ hair discolored •A • other signs spec 1 f y - - - - - - - - - - - -
What Is the occupation of the mother \caretaker of the Index child?
1 Regular employment2 Casual work outside the home3 Business at homeA None . .
If the mother Is employed o u t s i d e the home, how many hours Is she away from the home during the day?
hours
How many hours during the day does the mother care for the child?
I h o u r s

-109-
HQUSEMi) BUDGET SURVEY
Household Ho. :___! :Dai* 5 of 8
I ihat foods .*■ •« rates by the faally yesterday ?
Circle the day of th* M«k to which you are rwfvrrIng:
Tuesday/ fednesday/Thursday/Friday.
For each teal, list the food 1 tea and fan b«!ow th dish * the ijredtents used in the preparation. Beside each food .tea listed -rite doun the source of the ingredient.
Codes for sources: I > purchased locally 2 > garden 3 • gift » < other UEUFAST :sou; LUNCH .’sou: SUFPBt I sou! SHACKS Isou:
I
:

- I 10-
Within the last week, what foods did you buy?
P a g e 6 of 0 Household No. :_____:_____:
Food Item 1 Form of1 Foodft
Anount bought
••
•i
aft•«%•• j••••i<»•••i•••i••i•
fft
e•ft«e••

111-
Page 7 of 8 Household No.Within the last week, did you buy any of the following foods?Food Item ! Form Amount P r l ce
Maize meal
P o t a t o e s__
Whole maize _
Rice __________
Ml I let________
Sor gum
M a n d a z 1_______
S u g a r __________
Bread
F 1 o u r __________
Chapa 1 1s______
Beans/Iegumes
B e e f ___________
F i s h __________
Egg* ________
Ml Ik _________
T o m a t o e s____
Ka I e ______
On 1ons
C a r r o t s ______
Blue Band __
K 1abo _______
Salt _________
S o d a s _________
O t h e r s ______
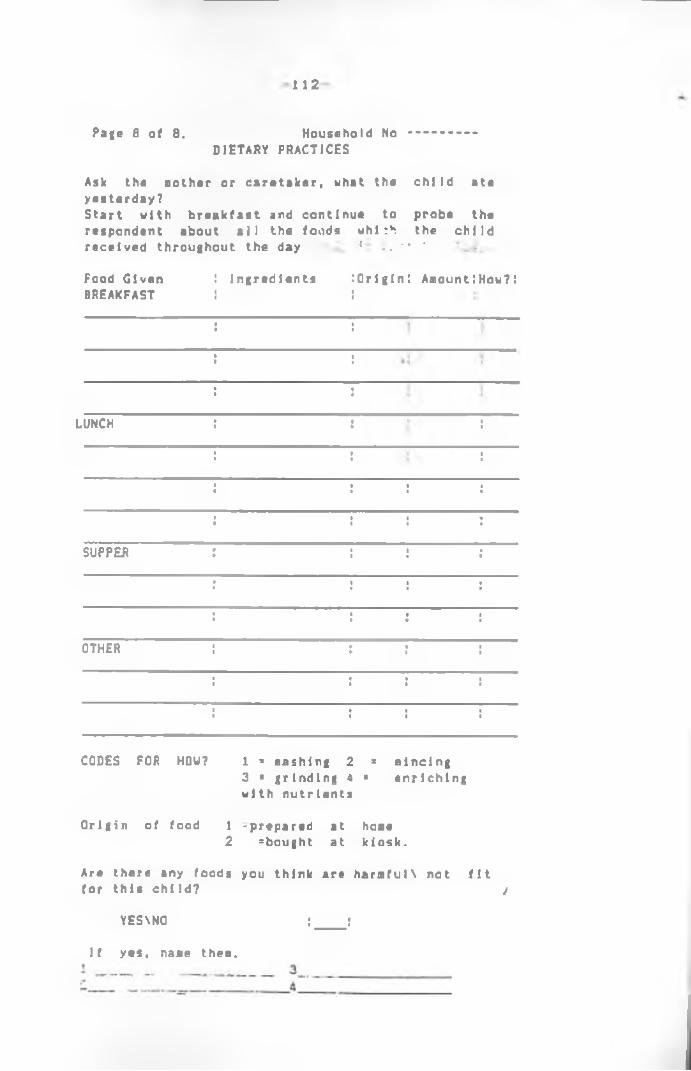
1 1 2
Page a of 8. Household No DIETARY PRACTICES
Ask the Bother or caretaker, what the child ate yesterday?Start with breakfast and continue to probe the respondent about all the foods whi :h the child received throughout the day { .. '* *.
Food Given BREAKFAST
LUNCH
SUPPER
OTHER
I ingredientsI
Origin! AaountIHow?:
CODES FOR HOW? 1 * nashing 2 = nincing3 ■ grinding 4 * enriching with nutrients
Origin of food 1 -prepared at hoae2 ^bought at kiosk.
Are there any foods you think are haraful\ not fit for this child? /
YES\N0 ;____ r
If yes, nane then.

APPENDIX 2
Number of Person* Related to the Head of theH o u s e h o I d .
:Relation 1 to h o u s e h o 1d I head
iHa 1n o u r 1 shed U e l 1 n o u r 1 shed
I 5 in 12A 111
!Daughter 95 99
IGrand Daughte r 1 3 2
IGrand Son 2 1
:Brother 6 1
:Sister 5 3• *!Others 4 4
i Total 237 221
Includes In laws and acquaintances.

HA-
APPENDIX 3
FOOD ACQUISITION M E T H O D ; PURCHASING
Food M a l n o u r 1 shed n« 76
We 1 l n o u r 1s h ! ed n*82 j
•n 1 %
•* 5
Maize meal Potatoes
i72 : 94.7 7 : 9.2
7134
!93.9 :
•0
Whole maize 2 : 2.6 23 28.0 5Rice 4 1 5.2 14 17.0 5Ml 1 let 2 1 2.6 9 10.9 :Sorghum 0 1 0 3 3.6 5M a n d a z l 3 1 3.9 0 0 5Sugar 67 ! 88.1 13 15.8 5Bread 17 1 22.3 82 100 ;Whea t flour 2 5 2.6 66 00.4 :Chapatls • 2 1 2.6 0 o :B e a n s / 1egumes 10 1 13.1 41 50.0 53eef 17 1 22.3 45 54.8 5Fish 16 1 2 3 . 6 31 37.8 :Eggs 3 5 3.9 2 2.4 :Milk 49 5 64.4 62 75.6 5Tomatoes 45 5 59.2 64 78.0 :Ka 1 e 50 5 65.7 67 81.7 5Onions 45 5 59.2 78 95. 1 5Carrot 3 5 3. 9 7 8.5 5Blue Band 7 5 9.5 40 4Q.7 5Cooking fat 70 5 92.1 82 100 5SaltBananas
69 5 90.7 7 5 9.2
76 95.1 5 13.4 5
Cabbage 7 5 9.2 25 30.4 5Coffee 5 5 6.5 16 19.5 5Spices 5 5 6.5 15 18. 3 5PumpkIns 0 5 0 3 3.6 :Cocoa 0 5 0 12 14.6 5C h 1cken 0 5 0 1 1.2 5Sour milk 0 5 0 4 4.8 5Orange 0 5 0 1 1.2 5Duck 0 5 0 1 1.2 :Mutton 0 5 0 3 3.6 5Ar rowroot 0 5 0 4 4.8 5Ovacado 0 5 0
51 1.2 5
01
• Pan fried pastry.
Copyright © 2022 FDOKUMEN