The Effect of Maternal Education and Maternal Mental Health ...
76
YOUNG LIVES STUDENT PAPER The Effect of Maternal Education and Maternal Mental Health on Child’s Growth Anupama Hazarika August 2010 Paper submitted in part fulfilment of the requirements for the degree of MSc in Global Health Science, Department of Public Health and Primary Health Care, University of Oxford. The data used in this paper comes from Young Lives, a longitudinal study investigating the changing nature of childhood poverty in Ethiopia, India (Andhra Pradesh), Peru and Vietnam over 15 years. For further details, visit: www.younglives.org.uk. Young Lives is core-funded by the Department for International Development (DFID), with sub- studies funded by IDRC (in Ethiopia), UNICEF (India), the Bernard van Leer Foundation (in India and Peru), and Irish Aid (in Vietnam). The views expressed here are those of the author. They are not necessarily those of the Young Lives project, the University of Oxford, DFID or other funders.
-
Upload
khangminh22 -
Category
Documents
-
view
3 -
download
0
Transcript of The Effect of Maternal Education and Maternal Mental Health ...
1
YOUNG LIVES STUDENT PAPER
The Effect of Maternal Educationand Maternal Mental Health onChild’s Growth
Anupama Hazarika
August 2010
Paper submitted in part fulfilment of the requirements for the degree of MSc in Global Health
Science, Department of Public Health and Primary Health Care, University of Oxford.
The data used in this paper comes from Young Lives, a longitudinal study investigating the
changing nature of childhood poverty in Ethiopia, India (Andhra Pradesh), Peru and Vietnam over
15 years. For further details, visit: www.younglives.org.uk.
Young Lives is core-funded by the Department for International Development (DFID), with sub-studies funded by IDRC (in Ethiopia), UNICEF (India), the Bernard van Leer Foundation (in Indiaand Peru), and Irish Aid (in Vietnam).
The views expressed here are those of the author. They are not necessarily those of the Young
Lives project, the University of Oxford, DFID or other funders.

2
The Effect of Maternal
Education and Maternal Mental
Health on Child’s Growth
Dissertation submitted in partial fulfilment of the requirements
for
Candidate number: 736693
August 2010
MSc in Global Health Science
Department of Public Health and Primary Health Care
University of Oxford

Being a part of the Department of Public Health, University of Oxford has been an incredible
experience. It was surreal to have met and be mentored by such brilliant minds.
At the very outset, I owe my deepest gratitude to Dr Lucy Carpenter, my placement
supervisor, who gently guided me in each step of this research, responded to my infinite
queries, and resolved my problems. I admire her patience and fortitude in guiding me
the entire process of developing, structuring and writing this dissertation.
It is an honour to thank Dr Premila Webster, my academic supervisor, who has been a
constant source of support not only during this dissertation but throughout the year. I
me great pleasure to thank our course director Dr Proochista Ariana and Dr Jacqueline Papo
for their valuable inputs.
I would like to thank Dr Harold Jaffe, former Head of the Department and Dr Emma Plugge,
former course director for having me as
Doll for giving me the insights into statistics. I
responded to my every need and successfully managed a wonderful year.
i
Acknowledgement
Being a part of the Department of Public Health, University of Oxford has been an incredible
experience. It was surreal to have met and be mentored by such brilliant minds.
At the very outset, I owe my deepest gratitude to Dr Lucy Carpenter, my placement
supervisor, who gently guided me in each step of this research, responded to my infinite
queries, and resolved my problems. I admire her patience and fortitude in guiding me
the entire process of developing, structuring and writing this dissertation.
It is an honour to thank Dr Premila Webster, my academic supervisor, who has been a
constant source of support not only during this dissertation but throughout the year. I
me great pleasure to thank our course director Dr Proochista Ariana and Dr Jacqueline Papo
I would like to thank Dr Harold Jaffe, former Head of the Department and Dr Emma Plugge,
former course director for having me as a part of this wonderful course. I thank Dr Helen
Doll for giving me the insights into statistics. I also thank Ms Christelle Kervella who
responded to my every need and successfully managed a wonderful year.
“Asato ma sad gamaya
Tamaso ma jyotir gamaya
Mrityor ma amritam gamaya”
Lead me from untruth to truth;Lead me from darkness to the light;
Lead me from mortality to immortality
- An Ancient Sanskrit Verse
Being a part of the Department of Public Health, University of Oxford has been an incredible
experience. It was surreal to have met and be mentored by such brilliant minds.
At the very outset, I owe my deepest gratitude to Dr Lucy Carpenter, my placement
supervisor, who gently guided me in each step of this research, responded to my infinite
queries, and resolved my problems. I admire her patience and fortitude in guiding me during
the entire process of developing, structuring and writing this dissertation.
It is an honour to thank Dr Premila Webster, my academic supervisor, who has been a
constant source of support not only during this dissertation but throughout the year. It gives
me great pleasure to thank our course director Dr Proochista Ariana and Dr Jacqueline Papo
I would like to thank Dr Harold Jaffe, former Head of the Department and Dr Emma Plugge,
a part of this wonderful course. I thank Dr Helen
thank Ms Christelle Kervella who
Sanskrit Verse
I am grateful to the Public Health Foundation o
University of Oxford possible and Young Lives
documentation for this dissertation.
I would like to extend my gratitude to my friends at Wolfson College and my flatmates in
Q-Block for making me feel at home, so far away from home. Interacting with my classmates
from all over the world was amazing and a memory that I will cherish.
Last but not the least, I would like to thank my mother, Mrs Manashree Hazarika, who has
stood beside me like a rock and supported every decision
ii
I am grateful to the Public Health Foundation of India who made my studies in the
University of Oxford possible and Young Lives – UK for sharing their data and photographic
documentation for this dissertation.
I would like to extend my gratitude to my friends at Wolfson College and my flatmates in
Block for making me feel at home, so far away from home. Interacting with my classmates
from all over the world was amazing and a memory that I will cherish.
Last but not the least, I would like to thank my mother, Mrs Manashree Hazarika, who has
nd supported every decision I made, no matter how difficult.
f India who made my studies in the
UK for sharing their data and photographic
I would like to extend my gratitude to my friends at Wolfson College and my flatmates in
Block for making me feel at home, so far away from home. Interacting with my classmates
Last but not the least, I would like to thank my mother, Mrs Manashree Hazarika, who has
I made, no matter how difficult.

iii
Abstract
Background: child growth is recognised internationally as the best global indicator of
physical well-being in children. This study identifies the main factors associated with
trajectory of child’s growth among poor children in the state of Andhra Pradesh, India, with
specific focus on the effects of maternal education and maternal mental health.
Materials and method: data from two consecutive rounds of the Young Lives cohort study
were individually linked to obtain continuous measures of child growth between the ages of
1 and 5: a) increase in child’s height (in centimetres) and b) increase in child’s weight (in
kilograms). Each measure was analysed using linear regression to estimate the effects of
maternal education, maternal mental health and other factors on child’s growth.
Results: simple regression found increases in height and weight to be positively associated
with maternal education and maternal mental health. Associations were also observed with
child’s gender, maternal height, weight and caste, paternal education, household wealth
index and debt, type of setting (urban versus rural) and region (agro-climatic). Multiple
regressions revealed increases in child’s height and weight to be independently associated
with child’s gender, maternal height and weight, household wealth index and region but not
with maternal education and maternal mental health.
Conclusion: this study illustrates the pivotal role of a prospective design in identifying key
factors affecting increases in child’s height and weight. Neither key factors of prior interest
examined - maternal education or maternal mental health - was found to be associated with
child growth independent of other factors identified.
iv
Contents
Page No
Chapter 1 : Review of Literature 1
1.1 Introduction 1
1.2 Perspectives of Child growth 1
1.3 Conceptual Framework for Causes of Malnutrition 6
1.4 Factors associated with Child Growth in Developing Countries 9
1.5 Aims and Objectives 16
1.6 Organisation of Dissertation 16
Chapter 2: Materials and Method 17
2.1 Introduction 17
2.2 Background of the Young Lives Project 17
2.3 Study Sample for the Present Research 18
2.4 Description of Variables 20
2.5 Analytical Methods 28
Chapter 3: Results 30
3.1 Introduction 30
3.2 Descriptive Statistics 30
3.3 Associations with continuous explanatory factors 34
3.4 Simple Regression 36
3.5 Multiple Regressions 39
Chapter 4. Discussion and Conclusions 42
4.1 Findings from the Present Research 42
4.2 Comparison of Findings with Previous Research 43
4.3 Strength of this Research 45
4.4 Limitations of this Research 46
4.5 Conclusions 46
v
Tables
Page No
Table 1.1 Worldwide Prevalence of Growth Measures in 0-5 yearchildren
5
Table 2.1 Coding of Level of Maternal Education 23
Table 2.2 Birth Order of the Young Lives Index Child 24
Table 2.3 Paternal Education 27
Table 2.4 Distribution of children in the regions and urban and ruralsettings
28
Table 3.1 Key Explanatory Variables 32
Table 3.2 Child Factors 32
Table 3.3 Other Maternal Factors and Paternal Education 33
Table 3.4 Household Factors 33
Table 3.5 Simple regression: Maternal Education and Maternal MentalHealth
36
Table 3.6 Simple regression: Child Factors 37
Table 3.7 Simple regression: Other Maternal Factors and PaternalEducation
37
Table 3.8 Simple regression: Household Factors 38
Table 3.9 Multiple regressions: Maternal Education and Increases inChild’s Height and Weight
40
Table 3.10 Multiple regressions: Maternal Mental Health and Increases inChild’s Height and Weight
41
vi
Figures
Page No
Fig 1.1 UNICEF’s Conceptual Framework of Causes of Malnutrition 7
Fig 1.2 Proposed Revision of UNICEF Conceptual Framework ofCauses of Malnutrition
8
Fig 2.1 Map of India and Andhra Pradesh 19
Fig 2.2 Histogram: Distribution of Child’s Length in Round 1 21
Fig 2.3 Histogram: Distribution of Child’s Height in Round 2 21
Fig 2.4 Histogram: Distribution of Child’s Weight in Round 1 21
Fig 2.5 Histogram: Distribution of Child’s Weight in Round 2 21
Fig 2.6 Box Plot: Distribution of Child’s Height at age 5 22
Fig 2.7 Box Plot: Distribution of Child’s Weight at age 5 22
Fig 2.8 Histogram: Estimated Age of Child at Round 2 23
Fig 2.9 Histogram: Time Interval between 2 survey rounds 23
Fig 2.10 Histogram: Distribution of Maternal Height 26
Fig 2.11 Description of Levels of Variables 29
Fig 3.1 Histogram: Distribution of Increase in Child’s Height 31
Fig 3.2 Histogram: Distribution of Increase in Child’s Weight 31
Fig 3.3 Scatter Plot: Increase in Child’s Height and Increase in Child’sWeight
34
Fig 3.4 Scatter Plot: Increase in Child’s Height and Time Intervalbetween Rounds
35
Fig 3.5 Scatter Plot: Increase in Child’s Weight and Time Intervalbetween Rounds
35
Fig 3.6 Scatter Plot: Increase in Child’s Height and Maternal Height 35
Fig 3.7 Scatter Plot: Increase in Child’s Weight and Maternal Weight 35
Fig 3.8 Scatter Plot: Increase in Child’s Height and Wealth Index 35
Fig 3.9 Scatter Plot: Increase in Child’s Weight and Wealth Index 35

vii
Abbreviations
Cm centimetre
DALY Disability Adjusted Life Year
Kg kilogram
NFHS National Family Health Survey
r Correlation Coefficient
SD Standard Deviation
UNICEF United Nation’s Children Emergency Fund
WHO World Health Organisation
WHO MRGS WHO Multicenter Reference Growth Study
YL Young Lives
Chapter 1: Literature Review
1
Chapter 1: Literature Review
1.1 Introduction
Child growth has been internationally recognised as the best global indicator of physical
well-being in children.1,2 The WHO Multicenter Growth Reference Study (1997-2003)
conducted in Brazil, Ghana, Norway, India, Oman and USA suggests that given the optimum
start in life, children born anywhere in the world have the potential to develop to within the
same range of height and weight. Estimates in the past suggested that height is to a large
extent a result of the phenotypic variation in a given population and determined by genetic
factors.3 Notwithstanding individual differences, across large populations, regionally and
globally, the WHO MGRS suggests that the average growth of the child should be
remarkably similar when provided healthy growth conditions in early life.4,5 While highest
growth rates are attained during the human foetal period and early life, differences in
children's growth to age five are more influenced by nutrition, feeding practices,
environment, and healthcare than genetics or ethnicity.4,6
1.2 Perspectives of child growth
Child growth is a measure of a physiological process that depends on the child’s nutrition
both in utero and post-natally. This is modulated by many factors which include genetics,
child illness, the care the child receives, maternal behaviour, and economic, health or
emotional shocks suffered during pregnancy and during the lifetime of the child.7
Development of physical capacity in the early years is the foundation of health, across the
life course of an individual and is now recognized as a social determinant of health.8,9 The
human foetus initially differentiates and thereafter attains its highest growth rates during
the early embryonic period. Growth slows during the late gestation period and continues to
2
slow in childhood. The supply of nutrients to the foetus has a major influence on growth and
under-nutrition in early intra-uterine life and leads to permanent changes in body structure,
physiology, and metabolism that are forerunner to diseases of the later life.6
Extensive work has been done linking childhood health to adult health using height and
weight as proxy for early life health and nutrition. Height-for-age (stunting), weight-for-
height (wasting) and weight-for-age (underweight) have been comprehensively used in
anthropometry. The height-for-age is an indicator of linear growth retardation and
cumulative growth deficits. It reflects long term failure to receive adequate nutrition and is
also affected by recurrent and chronic illness. It does not vary according to the recent
dietary intake. Weight-for-height is an indicator of current nutritional status of the child and
represents failure to receive adequate nutrition or an episode of illness in the recent past.
Weight-for-age is a composite index of height-for-age and weight-for-height. It takes into
account both acute and chronic malnutrition.5,10 In the assessment of growth, it is important
to determine the overall trajectory of growth by observing whether the child is tracking
along the growth curve or crossing over centiles towards a lower centile, and not merely a
single measurement point.11
Poor child growth is of public health importance not only because it signifies infections, lack
of adequate nutrition and poor psychological state of the mother or child, but can translate
into infant and child death, developmental delays and diseases in adulthood.12 Child growth
is viewed with increased interest as the world grapples with child death due to malnutrition
in the developing world and a growing burden of chronic disease of adulthood in the
developed countries.

3
This chapter provides a review of the literatures on the factors that influence child growth in
developing countries.
1.2.1 Historical Perspective
The long-term biological, psycho-social and behavioural processes in adult life that link adult
life and disease processes can be attributed to physical and social exposures during
gestation, childhood, adolescence and early adult life or across generations.13Initial research
Anthropometric Measures
Height-for-age (stunting): The height-for-age is an indicator of linear growthretardation and cumulative growth deficits. The median height of the referencepopulation is the point of reference. Children with height-for-age z score of minustwo standard deviations from the median reference value are considered to bestunted while those which are minus three standard deviations away from themedian reference value are severely stunted. Thus, stunting reflects long termfailure to receive adequate nutrition and also affected by recurrent and chronicillness. It represents long term effects of malnutrition and does not vary accordingto the recent dietary intake.
Weight-for-height (wasting): weight-for-height is an indicator of current nutritionalstatus of the child. Wasting represents failure to receive adequate nutrition or anepisode of illness in the recent past. The median weight of the reference populationis considered the point of reference. Children whose weight-for-height z scores arebelow two standard deviations of the median reference value of the referencepopulation are considered thin or wasted and those whose weight are below threestandard deviations from the median reference value are considered severelywasted.
Weight-for-age (under-nutrition): is a composite index of height-for-age andweight-for-height. It takes into account both acute and chronic malnutrition.Children whose weight-for-age is below minus two standard deviations from themedian of the reference population are classified as underweight. Children whoseweight-for-age is below minus three standard deviations (-3 SD) from the median ofthe reference population are considered to be severely underweight.
Source: 2,10

4
done 1970s and 1980s especially in developed countries, revealed the importance of
prenatal and infant exposures for adult chronic disease which were augmented by life
factors such as poor growth, development and adverse environment during childhood.6,13-15
1.2.2 World Perspective
In 2005, child growth was studied in 139 countries and 388 national surveys produced
estimates of prevalence of under-nutrition, wasting, and stunting.16 These estimates
revealed that 20% of children below 5 years in low-income and middle-income countries
had under-nutrition. The highest rates of prevalence of under-nutrition were in South-
Central Asia and Eastern Africa with 33% and 28% affected children, respectively.16 Current
WHO estimates indicate that approximately 16% of children from developing countries are
severely malnourished.17 With 2·2 million deaths and 21% of DALYs for children below 5
years,16 the number of global deaths and disability-adjusted life-years (DALYs) attributed to
stunting, severe wasting and under-nutrition, constitutes the largest percentage of risk
factor in this age group.16
Country Year of datacollection
Samplesize
Under-nutrition
Stunting Wasting
Afghanistan 2004 946 32.9 59.3 8.6Brazil 2007 4415 2.2 7.1 1.6Ethiopia 2005 4968 34.6 50.7 12.3India 2006 49233 43.5 47.9 20Iraq 2006 16309 7.1 27.5 5.8Kenya 2003 5536 16.5 35.8 5.8Kuwait 2005 5601 2.7 4.5 7.5Mexico 2006 7707 3.4 15.5 7.6Peru 2005 1893 5.4 29.8 1.0Vietnam 2000 3041 26.7 43.4 6.1Zimbabwe 2006 5254 14 35.8 9.1UK 1973 13380 1.0 2.4 2.1Japan 1981 7308 0.8 5.6 3.7Netherlands 1980 18930 1.6 1.8 2.3USA 1999 3920 1.3 3.9 0.6
Table 1.1: Worldwide prevalence of Growth Measures in 0-5 year old children18
5
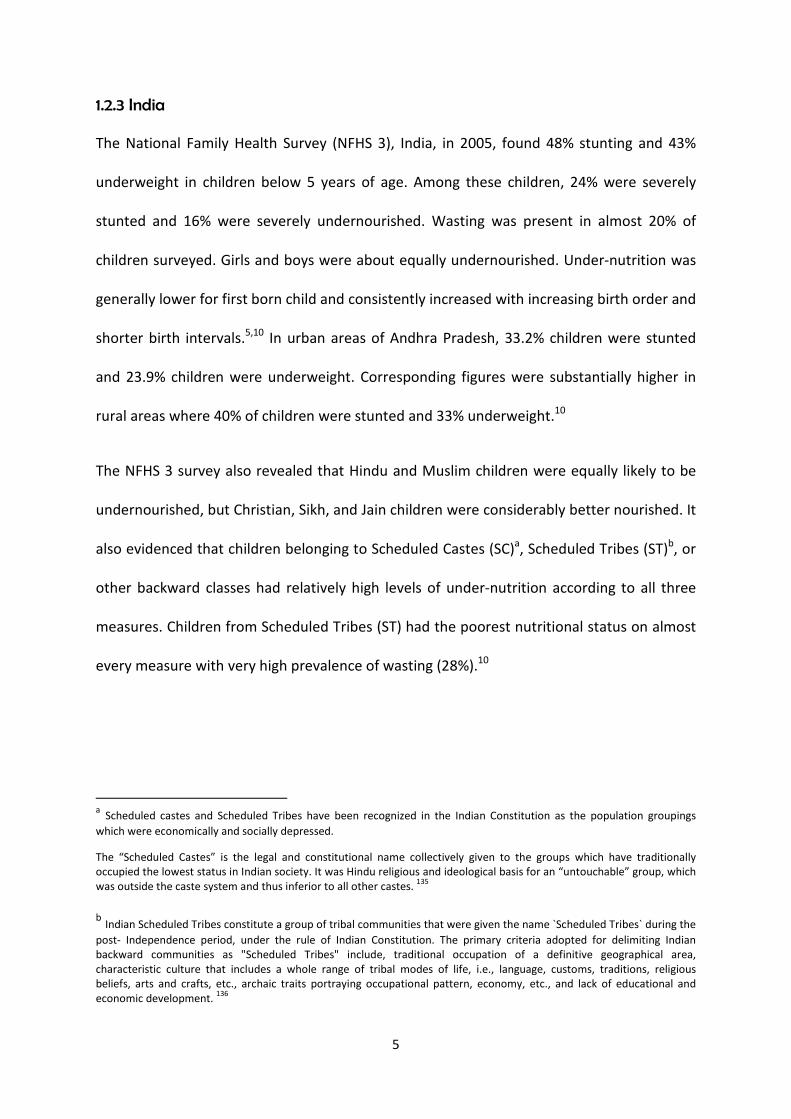
1.2.3 India
The National Family Health Survey (NFHS 3), India, in 2005, found 48% stunting and 43%
underweight in children below 5 years of age. Among these children, 24% were severely
stunted and 16% were severely undernourished. Wasting was present in almost 20% of
children surveyed. Girls and boys were about equally undernourished. Under-nutrition was
generally lower for first born child and consistently increased with increasing birth order and
shorter birth intervals.5,10 In urban areas of Andhra Pradesh, 33.2% children were stunted
and 23.9% children were underweight. Corresponding figures were substantially higher in
rural areas where 40% of children were stunted and 33% underweight.10
The NFHS 3 survey also revealed that Hindu and Muslim children were equally likely to be
undernourished, but Christian, Sikh, and Jain children were considerably better nourished. It
also evidenced that children belonging to Scheduled Castes (SC)a, Scheduled Tribes (ST)b, or
other backward classes had relatively high levels of under-nutrition according to all three
measures. Children from Scheduled Tribes (ST) had the poorest nutritional status on almost
every measure with very high prevalence of wasting (28%).10
aScheduled castes and Scheduled Tribes have been recognized in the Indian Constitution as the population groupings
which were economically and socially depressed.
The “Scheduled Castes” is the legal and constitutional name collectively given to the groups which have traditionallyoccupied the lowest status in Indian society. It was Hindu religious and ideological basis for an “untouchable” group, whichwas outside the caste system and thus inferior to all other castes.
135
bIndian Scheduled Tribes constitute a group of tribal communities that were given the name `Scheduled Tribes` during the
post- Independence period, under the rule of Indian Constitution. The primary criteria adopted for delimiting Indianbackward communities as "Scheduled Tribes" include, traditional occupation of a definitive geographical area,characteristic culture that includes a whole range of tribal modes of life, i.e., language, customs, traditions, religiousbeliefs, arts and crafts, etc., archaic traits portraying occupational pattern, economy, etc., and lack of educational andeconomic development.
136

6
1.3 Conceptual Framework for Causes of Malnutrition
The UNICEF original conceptual framework for causes of malnutrition model (1990) suggests
that child survival, growth and development were influenced by three underlying factors
namely a) household food security, b) care for women and c) health services and healthy
environment. Child survival, growth and development are effected by caregiver behaviours
like feeding, hygiene, health practices, psychosocial stimulation and not food intake
alone.19,20 (refer Fig: 1.1)
Potential Resources
Political, Cultural, Economic Structure and Social and Context Structure
Family and Community Resources and Control:
Human, Economic, Organisational
Care for WomenBreastfeeding/ Feeding
Psychosocial careFood Processing
Hygiene PracticesHome Health Practices
Household
Food Security
Health Services
and Healthy
Environment
Information, Education and Communication
Adequate Dietary Intake Health
Child survival growth and development
Basic Determinants
Immediate Determinants
Underlying Determinants
Outcome
Source: Engle, Lhotska and Armstrong (1997)
Fig 1.1: UNICEF Conceptual Framework of Causes of Malnutrition (1990)
7
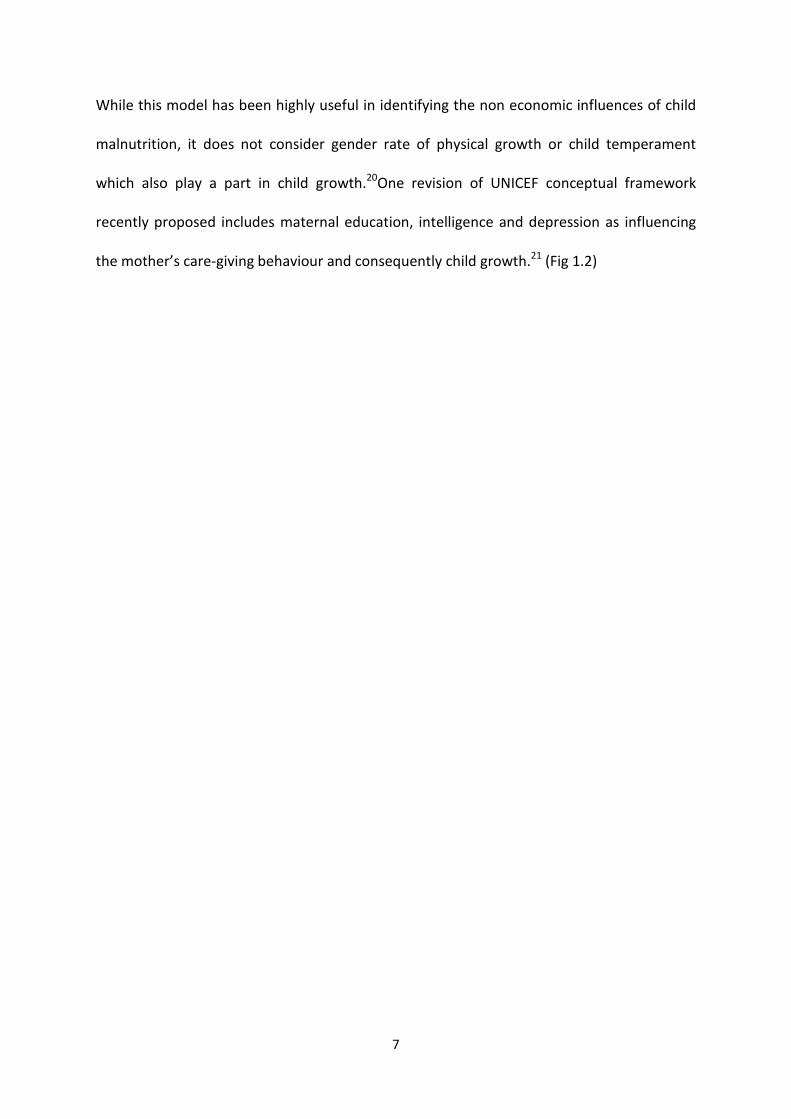
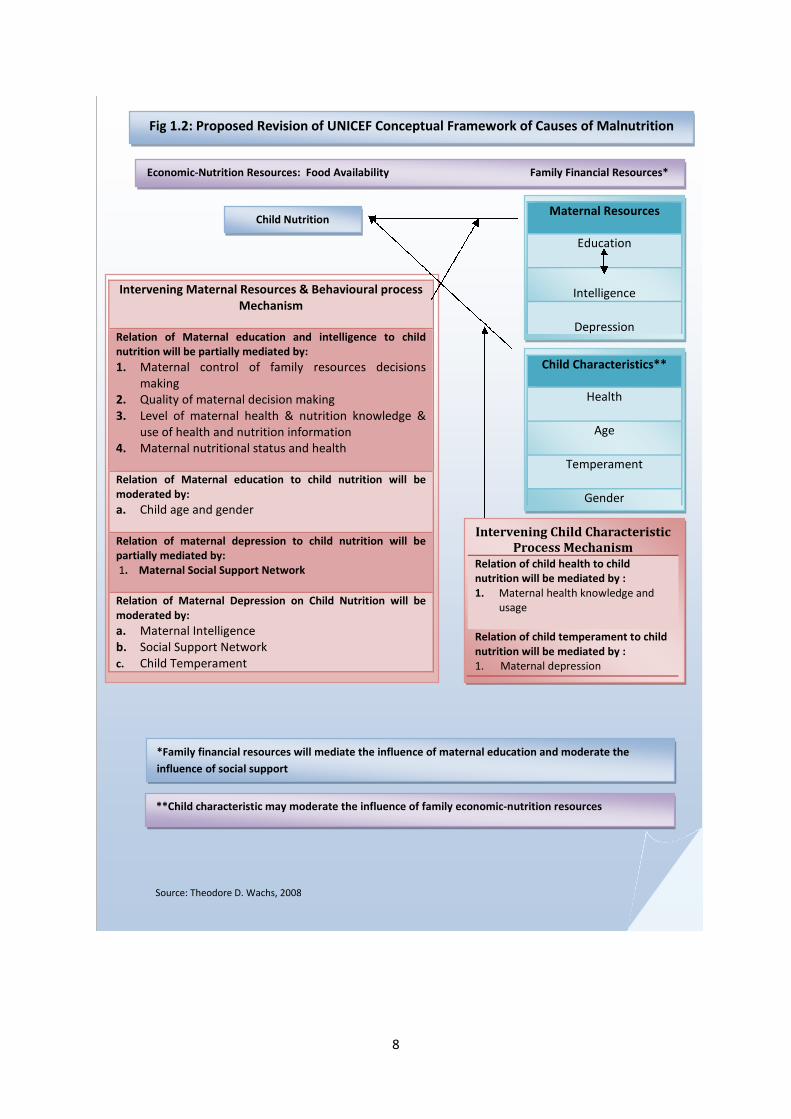
While this model has been highly useful in identifying the non economic influences of child
malnutrition, it does not consider gender rate of physical growth or child temperament
which also play a part in child growth.20One revision of UNICEF conceptual framework
recently proposed includes maternal education, intelligence and depression as influencing
the mother’s care-giving behaviour and consequently child growth.21 (Fig 1.2)
8
Intervening Maternal Resources & Behavioural processMechanism
Relation of Maternal education and intelligence to childnutrition will be partially mediated by:
1. Maternal control of family resources decisionsmaking
2. Quality of maternal decision making3. Level of maternal health & nutrition knowledge &
use of health and nutrition information4. Maternal nutritional status and health
Relation of Maternal education to child nutrition will bemoderated by:
a. Child age and gender
Relation of maternal depression to child nutrition will bepartially mediated by:1. Maternal Social Support Network
Relation of Maternal Depression on Child Nutrition will bemoderated by:
a. Maternal Intelligenceb. Social Support Networkc. Child Temperament
Economic-Nutrition Resources: Food Availability Family Financial Resources*
Child NutritionMaternal Resources
Education
Intelligence
Depression
Fig 1.2: Proposed Revision of UNICEF Conceptual Framework of Causes of Malnutrition
Intervening Child CharacteristicProcess Mechanism
Relation of child health to childnutrition will be mediated by :1. Maternal health knowledge and
usage
Relation of child temperament to childnutrition will be mediated by :1. Maternal depression
Child Characteristics**
Health
Age
Temperament
Gender
**Child characteristic may moderate the influence of family economic-nutrition resources
*Family financial resources will mediate the influence of maternal education and moderate the
influence of social support
Source: Theodore D. Wachs, 2008

9
1.4 Factors associated with child growth in developing countries
Plausible non-genetic determinants of height as noted in secular rises in childhood and adult
stature across successive birth cohorts include socioeconomic status, nutrition,
environmental factors, parental and caregiver factors, illness, injuries and psychosocial
stress.3,22 The reduction in child growth in any society can be thus viewed as an operation of
social, economic, biological and environmental influence which operates through these
determinants.22Young children in developing countries are exposed to multiple risks,
including poverty, gender biases, incorrect feeding practices, infections, maternal care-
giving behaviour, paternal education and urban and rural setting which detrimentally affect
their physical, emotional and psycho-social development. Each of these factors has been
considered below:
1.4.1 Poverty, household wealth and family income: family economic resources and
food availability are important for reduction of malnutrition and improved child growth.21 At
the low end of the wealth spectrum, poverty is a key determinant of mortality and poor
health in all countries.23,24 Due to its numerous dimensions, it has a profound effect on child
growth as it deprives children of the capabilities needed to survive, develop and thrive and
also entrenches on social and economic aspects needed for child growth.25 More than 200
million children under the age of 5 years fail to reach their growth and cognitive potential
due to poverty, poor health, lack of adequate nutrition and deficient care.26 A longitudinal
study conducted in Uganda noted that the majority of the growth faltering occurred in the
first 12 months of life.27 Poverty leads to poor growth outcomes in children hence long term
reduction in poverty is considered to be far more effective than short term management of
issues.28

10
In contrast, household wealth offers leverage for improving child growth by providing an
opportunity to improve material circumstances of the family to purchase goods and services
that are health enhancing.23,24
Environmental factors such as overcrowding, unsafe water, lack of sanitation and sewerage
and poor garbage disposal facilities have a deterministic role in child’s growth.3,7 Family
income also allows the family to spend more on food, clean water, hygiene and sanitation,
and preventive and curative health care.29,30
1.4.2 Gender: associations between nutritional status and thereby child growth with
reference to the gender of a child are highly variable. Some studies reported no relation
between gender of the child and the indices of nutritional status10,31while others found that
the female child either received better nutrition or was nutritionally disadvantaged27,32-34
Evidence from a study in Andhra Pradesh, India suggests that gender discrimination is
notable among girl children.35 Several studies in Rural Nepal36, Peru37, India31,38and
Indonesia39have suggested that malnutrition can result from inequities in food distribution
and preferential child care practices that favour certain age and sex groups within societies
even when food supplies are sufficient.37,40-42The relationship between child gender and
nutrition maybe moderated by a variety of factors including cultural values,43,44 birth order
or sex ratio of children in the family 38,45and household decisions on allocation of
supplementary food resources.20,36,46-53
1.4.3 Feeding Practices: longitudinal studies revealed that under-nutrition has a profound
influence on the child’s physical growth as well as their cognitive development.16

11
Poor feeding continues to affect a high proportion of children in developing countries.
Improved breast feeding practices is estimated to save up to 1 million lives. Complementary
feeding while breast feeding for up to two years or beyond could save up to half million lives
by reducing the risk of infection leading to improved physical growth and motor
development.54,55 This is debatable in highly endemic HIV settings of resource poor
developing countries, where an estimated 15% of children born to HIV-infected mothers are
infected with HIV through breastfeeding. The longer a child is breastfed by an HIV-positive
mother the higher the risk of HIV infection. The child’s risk of acquiring HIV is reduced to
one third when breastfed for 6 months as compared to breastfeeding for 2 years while
exclusive breast feeding for shorter durations are protective.56 On the other hand, early
introduction of supplementary feeds is suggested to encourage excessive weight gain,
increased risk of infections and allergies, and reduce the amount of breast milk ingested by
the infant. In developing countries the protective effects of breastfeeding are compromised
by malnutrition, poor environmental conditions, over-dilution of formula milk, and
infectious diseases.57
1.4.4 Infections: there is considerable evidence mostly from resource poor countries that
infections including diarrhoea, acute respiratory tract infection, and intestinal parasites such
as hookworm, trichuris and ascaris each retard physical development.3,35,58,59 A third of the
world’s children suffer from intestinal helminthiasis. Diarrhoea, dysentery, HIV/AIDS and
malaria are some of the infections that compound the problem of malnutrition and thereby
seriously hamper child growth.25
12
1.4.5 Maternal Factors
Since the early 1980’s there has been a resurgence of interest in the role of the mother or
caregiver on child’s growth. Relevant maternal characteristics include her education, mental
health and self confidence, intelligence, knowledge and beliefs, autonomy and control of
resources, reasonable workload and availability of time, and family and community social
support. Relying on the strong correlation between maternal education and child health,
public policy discourse has increasingly assumed that investment in womens’ education is
important for lowering infant mortality and improving child growth.3,16,24,41,51-53,60-94
Maternal Education: it has often been argued that children of educated mothers experience
lower co-morbidities such as gastro-intestinal disorders, inadequate nutritional status and
lower mortality and achieve better health outcomes and higher growth than children of
uneducated mothers.21,72,95-101 While mother’s education was found to have a positive effect
on long-term nutritional status, as measured by stunting, evidence also suggests this is more
important in the earlier years of child growth.7
Studies in developing countries indicate that higher levels of maternal education are related
to increased knowledge and understanding of health information and use of health
services.19,24,27,79,102,103 Utilization of health-promoting activities such as vaccination and
vitamin A supplementation of the off-spring, by educated mothers is one such mechanism
through which maternal education influences their child’s physical growth.104
A longitudinal study in Bangladesh suggests that there was improved feeding practices and
cleanliness due to maternal education. Mothers were likely to feed the child more
frequently, with fresh food and in cleaner, more protected environment.105 Education may
13
also affect health through a reduction in the number of pregnancies and the number of
children, which allows more resources to be devoted to the surviving children.7,106
Evidence suggests that associations between mothers’ level of education and the physical
growth of their children involves her greater participation in important family decisions, as
mothers are more likely than fathers to allocate family resources in ways that promote their
child’s nutrition.20,21,51,52,78,107,108 Increased levels of schooling are linked to higher levels of
maternal intelligence.74 A study shows that intelligent mothers make appropriate decisions
on resource allocation when the family economic resources are limited leading to better
physical growth of the child.20,109 Knowledge and verbal skill enhance mothers’ ability to be
successful in decision making situations110, and empower them through access to outside
resources like job opportunities.21
Maternal education may thus transmit information about health and nutrition directly, by
enabling mothers to acquire information, and exposing them to new environments thus
making them receptive to modern medical treatments. It imparts self confidence which
enhances the woman’s role in intra-household decision making and interaction with health
care professionals.27,102,111
Currently, Public Health Policies have been increasingly focused towards improving maternal
education as an important discourse towards achieving lower infant and child mortality and
improving child health. Education is linked to socioeconomic status of the family, which
itself is one of the major determinants of child health.60
Maternal Mental Health: that poor mental health of mothers might adversely affect their
child's health and development is evidenced by a study from South Asia which demonstrates

14
an association between postnatal maternal depression and impaired child growth.112Case-
control and cohort studies in Pakistan and Tamil Nadu state of India revealed that,
compared to controls, infants of depressed mothers were likely to be more than twice
underweight at 6 months of age (30% versus 12%) and three times more likely to be stunted
(25% versus 8%).113,114 Studies in South Asia, indicated that the odds of a malnourished child
having a depressed mother were 3.9 to 7.4 times higher.94,112,114
A study in Goa, India found that the more educated women are at lower risk for depression
than are less educated women.115 A cohort study in Rawalpindi, Pakistan noted that infants
of mothers with depression are at greater risk of growth failure than are infants whose
mothers are not depressed.114 The mechanism through which depression in the mother
influences the physical growth of their child probably entails reduced involvement in
parental care by depressed women.114,115
1.4.5. Maternal Age and Height: there is a strong association between infant mortality, low
birth weight and poor child growth in mothers younger than 20 years of age.35,116-118Studies
have suggested that prominent risk factor for decreased childhood growth is maternal short
stature.3,7,119
1.4.6 Paternal Education
In recent years researchers have begun to acknowledge the influence of fathers on the
development of their young children.120 Fathers assume multiple roles in families which
influence children in numerous ways, directly and indirectly (via mothers).120 The education
of parents often is used as an indicator of the quality of time children spend with their
parents.121 It has been hypothesized that better educated parents are more concerned and

15
involved with their children's development as they are aware of children's developmental
needs.121-123 Paternal education along with maternal education is a strong predictor of child
growth as evidenced by these studies.104
It is also hypothesised that more educated fathers usually earn more money and marry
women of a comparable level of education.104,124 A study in Bangladesh showed that lack of
paternal education led to diminished child growth.104
1.4.7 Setting: Urban versus Rural
Evidence suggests that urban children generally have a better nutritional status than their
rural counterparts.125-128 This is of particular relevance for stunting and underweight.128
Using data from FAO for 11 countries, most of which were from Africa, Stunting rates in
urban areas were found to be 55–78% of those found in rural areas.127 More recently
UNICEF data from 33 countries in Africa, Asia, and the Americas showed that, on average,
stunting was 1.6 times greater in rural compared to urban areas.126Demographic and Health
Surveys from 28 countries have also documented consistently lower prevalence of stunting
in urban areas, with wider urban/rural differences in Latin America compared to Africa and
Asia.125 Although typically prevalence of wasting is also higher in rural areas, most studies
have found very small urban/rural differences and even slightly higher wasting in urban
areas has been reported.125-128
1.5 Aims and Objectives
This study aims to identify main factors associated with the trajectory of child’s growth
among poor children in the state of Andhra Pradesh, India, with specific attention on the
effects of maternal education and maternal mental health.

16
1.5.1 Research Question
To what extent does maternal education and maternal mental health influence early
childhood growth in poor populations of Andhra Pradesh, India?
1.5.2 Objectives
Using data from two surveys of children conducted by the Young Lives project:
1. to individually link data to identify a cohort of children surveyed at ages 1 and 5
years;
2. to use increases in height and weight to describe their observed trajectories of child
growth;
3. to examine associations between child growth and two key risk factors (maternal
education and maternal mental health) and other potential risk factors at the child,
maternal, paternal and community level;
4. to identify the independent effects on child’s growth of each of risk factor
considered.
1.6 Organisation of Dissertation
This introductory chapter has reviewed the literature regarding potential factors affecting
the trajectories of child growth, particularly in developing countries. The next chapter
describes the Young Lives data collected in Andhra Pradesh and explains the materials and
methods used in the analyses. Chapter 3 describes the results of these analyses and Chapter
4 discuses these with reference to previous literature. Following consideration of strengths
and limitations of this research, conclusions are drawn.

Chapter 2: Materials and Methods

17
Chapter 2: Materials and Methods
2.1 Introduction
Young Lives is an international project investigating the changing nature of childhood
poverty across four developing countries namely India, Peru, Vietnam and Ethiopia. It
follows a total of 12,000 children of two birth cohorts, the first born in 1994-95 and the
second in 2001-02.129There have been two survey rounds of data collection completed
to date. The first was in the year 2002 and second in 2006-07. A third round is currently
underway.
This chapter provides a background to Young Lives Project relevant to the current
research. It uses quantitative data, for the second birth cohort of 2000 children born in
2001 – 02 in Andhra Pradesh, India collected at the first and second rounds. It describes
the particular characteristics for which data were abstracted, the methods applied in the
quantitative analysis of the trajectory of growth in this younger cohort of children
followed to the age of five.
2.2 Background of the Young Lives Project
The state of Andhra Pradesh is divided into 23 districts spread over three distinct agro-
climatic regions of Coastal Andhra Pradesh, Rayalseema and Telangana. For the first
survey round in 2002, the Young Lives Project selected 2011 children born in the year
2001 - 02, from twenty sentinel sites, from 6 districts, 2 in each region. Together the
districts selected comprise of 28% of the total population of Andhra Pradesh. (Fig 2.1)
They used a sampling methodology known as ‘sentinel site surveillance system’ through a
pro-poor approach, which consisted of a multi-stage semi-purposive method. 5 urban
and 15 rural sites were selected in the districts of West Godavari, Srikakulam,
18
Anantapur, Cudapah, Mahbubnagar, Karimnagar and Hyderabad city, using a set of
developmental criteria. Seven of these sites were located in coastal regions, 6 in
Rayalaseema and 7 in Telangana. A hundred households in four villages were then
randomly selected from each sentinel site using a list drawn from the 1991 census in
such a way that they were uniformly spread. Three areas across Hyderabad city were
also included in the survey to study the urban slum.129
2.3 Study Sample for the Present Research
The present study uses data obtained following individual linkage of the cohort of
children surveyed at Round 1 to those surveyed subsequently in 2006-07 (from now on
referred to as Round 2). Of the 2011 children initially surveyed in Round 1, 32 had died,
22 were lost to follow up and 7 refused to participate in Round 2, resulting in a total
attrition of 61 children (3%). Thus, a total of 1950 children, whose data have been
included in both rounds, will be the cohort for this analysis. The study uses these
individually linked data to examine how factors measured in Round 1 influence the early
period of a child’s growth, specifically during the first five years of life. Special emphasis
is given to the importance of maternal education and maternal mental health on early
childhood growth.

19
Fig 2.1: Map of India and Andhra Pradesh130
Young Lives Project
districts

20
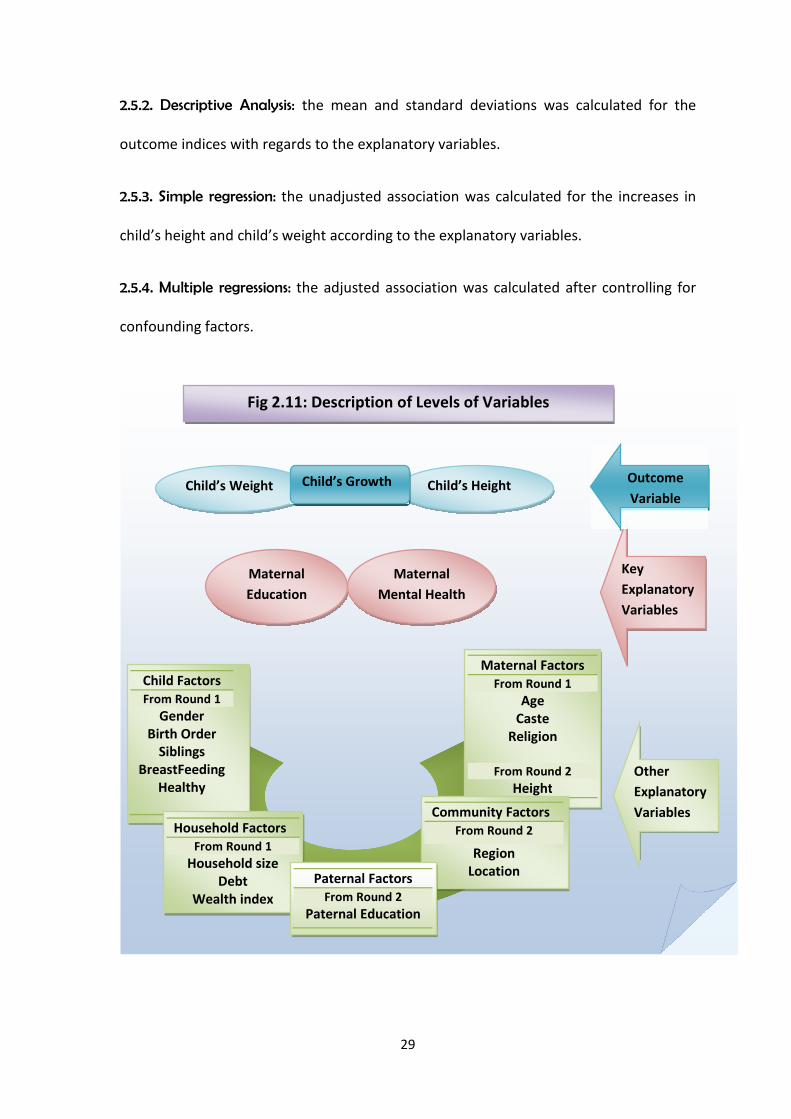
2.4 Description of Variables
Two indices for child growth, ‘increase in child’s height’ and ‘increase in child’s weight’
between Round 1 and Round 2 were derived from the existing data on child’s height and
weight. The key explanatory variables chosen were maternal education and maternal
mental health. There were fifteen other potential explanatory variables which were
grouped under five categories: child factors, maternal factors, paternal factors,
household factors and community factors. (refer Fig 2.11). These are described below:
2.4.1. Outcome Variables
Child Height: was measured at both rounds (1 and 2) in centimetres (cm) to the nearest
agreed 0.1 cm. A length board was used to measure children below two years. Two
persons measured the child; one held the child’s head and the other measured the child.
A height stick was used to measure the older children which was stabilised against a wall
or a door. Two independent readings were taken before finalising the height. 131,132
Out of 1950 observations, 0.87% (17) from the Round 1 and 0.35% (7) from Round 2
were missing. One observation was dropped from Round 2 because of suspected data
entry errorc.The mean height at round 1 was 71.6 cm (SD 5.06) and at round 2 was
104.02 cm (SD 5.3). The mean height for girls and boys in Round 1 was 70.92 cm (SD
4.97) and 72.28 cm (SD: 5.05) respectively. The mean height for same cohort of girls and
boys in Round 2 was 103.77 (SD: 5.30) cm and 104.23 cm (SD: 5.40). (Figs: 2.2, 2.3, 2.6)
cThe child height was recorded as 173.5 cm
21
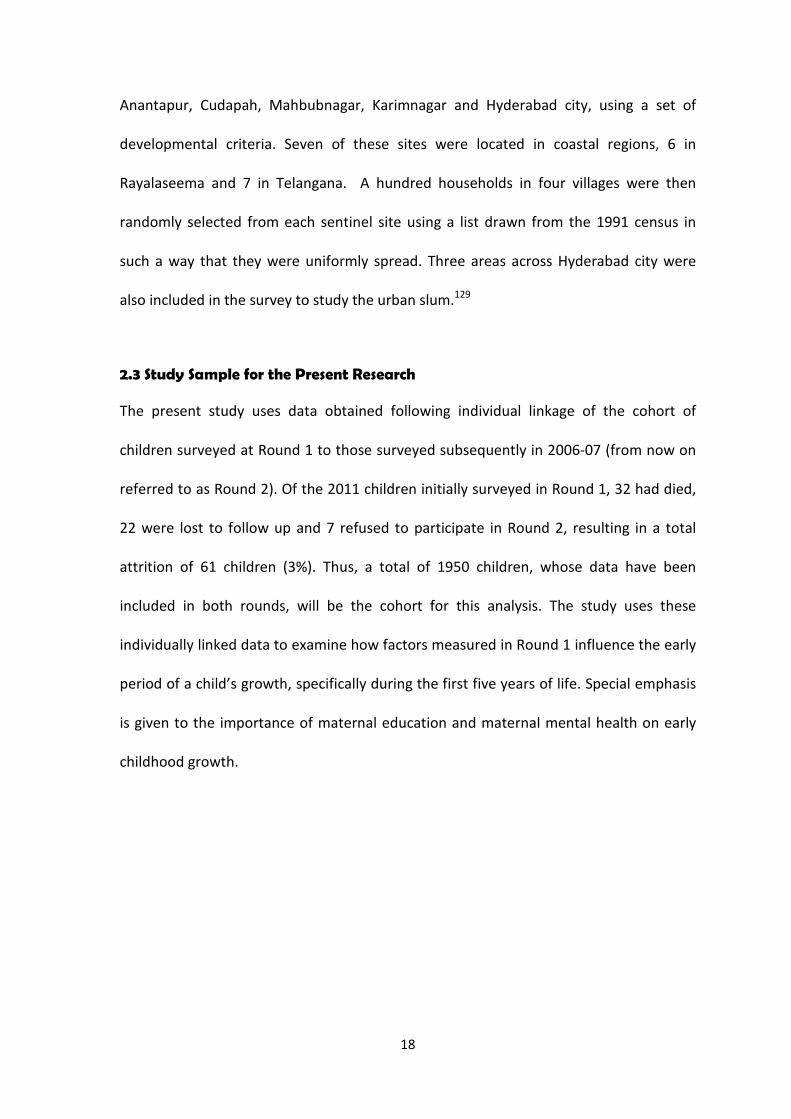
Fig 2.2: Distribution of Child Length in Round 1 Fig 2.3: Distribution of Child Height in Round 2
Fig.2.4: Distribution of Child Weight in Round1
Fig 2.5: Distribution of Child Weight in Round2
Child’s Weight: was measured in both rounds to the nearest agreed 0.1 kg using a clock
(spring) balance by two persons. Two readings were taken before finalising the
measured weight. Out of 1950 observations, there were 0.82% (16) and 0.35% (7)
missing observations, for Round 1 and Round 2 respectively. The mean weight of
children was 7.84 kgs (SD 1.17) in Round 1 and 15.01 kgs in Round 2(SD 1.93).(Figs 2.4,
2.5). The mean weight of girls was 7.59 kgs (SD: 1.1) and 14.84 kgs (SD: 1.9) while the
mean weight of boys, was 8.09 kgs (SD: 1.2) and 15.16 kgs (SD: 1.8), in Round 1 and 2
respectively.(Fig 2.7)
0.0
2.0
4.0
6.0
8D
en
sity
50 60 70 80 90 100Child's Lenght in Round 1 (cm)
0.0
2.0
4.0
6.0
8D
en
sity
80 100 120 140 160Child's Height at Round 2
0.1
.2.3
.4D
ensity
4 6 8 10 12 14Child's Weight in Round 1 (kg)
0.0
5.1
.15
.2.2
5D
ensity
10 15 20 25 30Child's Weight in Round 2 (Kgs)
n = 1933n = 1942
n = 1934 n = 1943
22
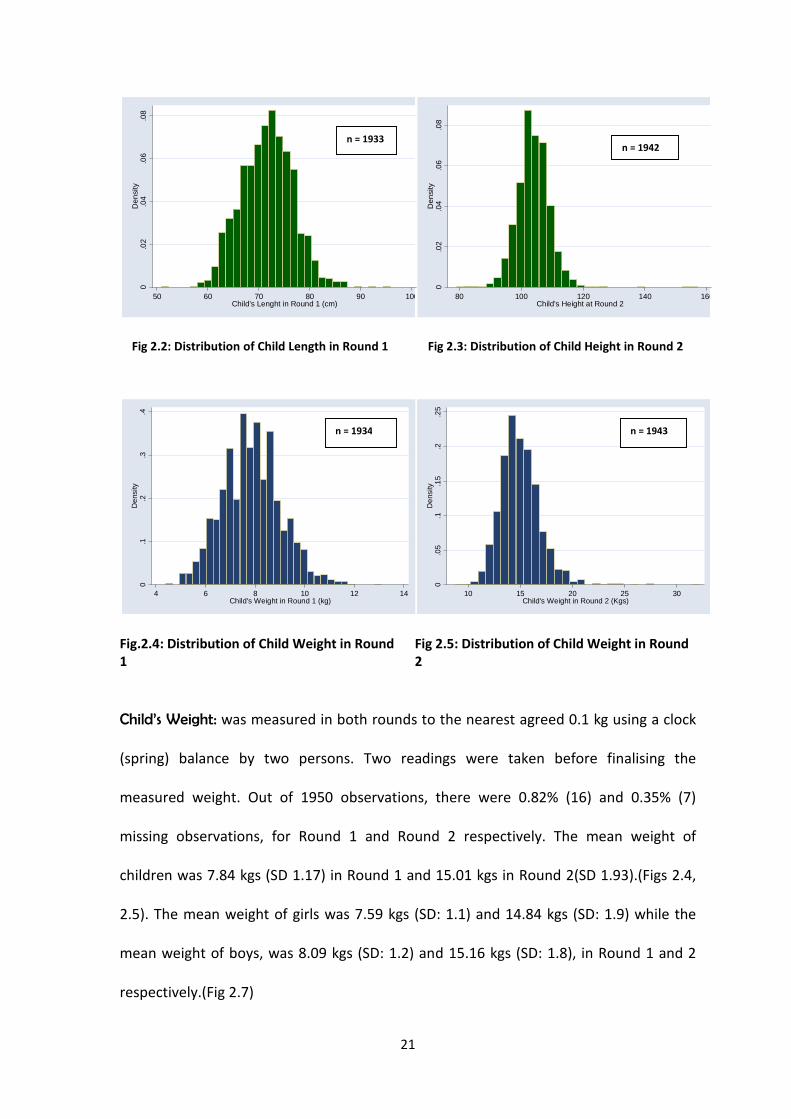
Fig 2.6: Distribution of Child’s Height at age 5 Fig 2.7: Distribution of Child’s Weight at age 5
2.4.2. Calculation of Outcome Variables
Increase in Height of the Child: was calculated by subtracting child’s height at Round 1
from child’s height at Round 2. 1925 observations were generated. 44 observations
were missing.
Increase in Weight of the Child: was calculated by subtracting Child’s weight at Round 1
from Child’s weight at Round 2. 1927 observations were generated and 42 observations
were missing.
Time Interval of Growth: the time interval of growth between rounds was calculated by
subtracting the date of interview in Round 1 from the date of Interview in Round 2. 1950
observations were generated. The minimum time interval for growth of the children
between the two rounds was 49.22 months and the maximum was 57.78 months. The
mean time interval between the 2 rounds was 52.48 (SD 1.19). (Fig: 2.9)
80
10
01
20
14
01
60
18
0C
hild
He
igh
ta
ta
ge
5(c
m)
male female
10
15
20
25
30
child
'sw
eig
ht
male female
23
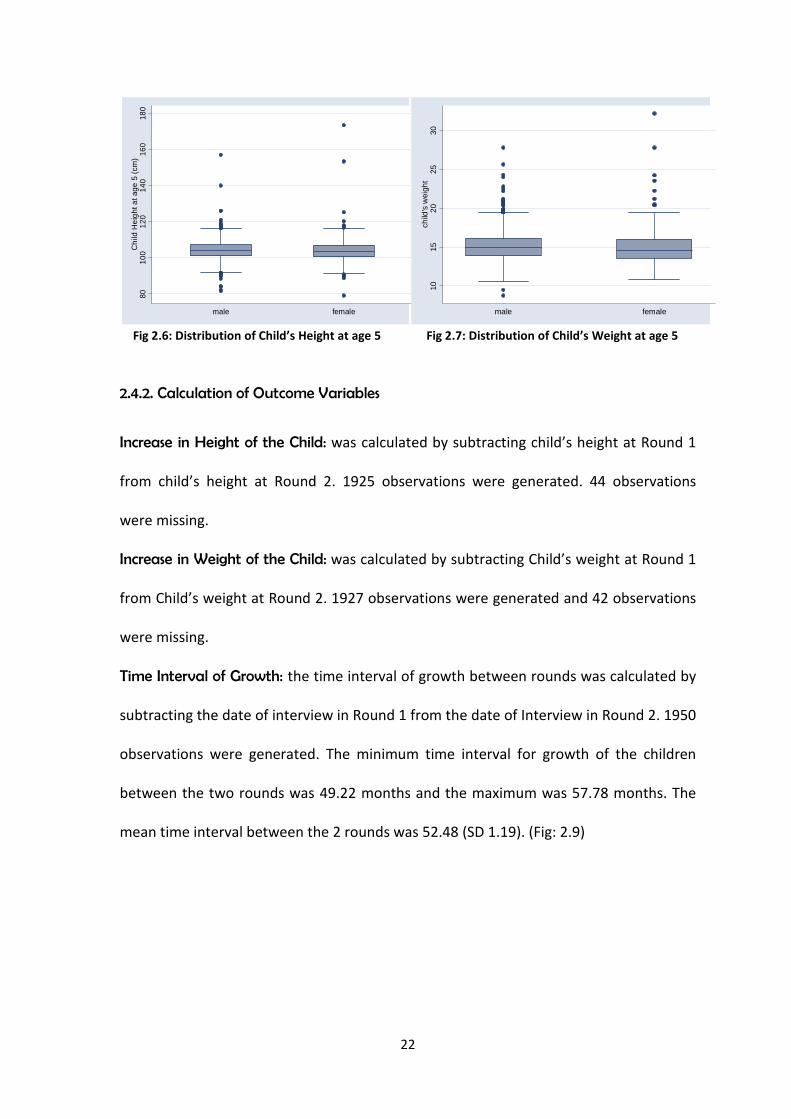
Fig 2.8: Estimated Age of Child in Round 2 Fig 2.9: Time Interval between two survey rounds
Age of Child: the age of the child in Round 1 was added to the derived time interval of
growth to estimate the age at Round 2. The minimum age recorded in Round 1 was 5
months and maximum was 21 months. The mean age at Round 1 was 11.82 months (SD:
3.5). The minimum age recorded at Round 2 was 55.11 months and the maximum was
74.52 months. The mean age of the child at Round 2 was 64.30 months (SD: 3.72). (Fig:
2.8)
2.4.3. Key Variables
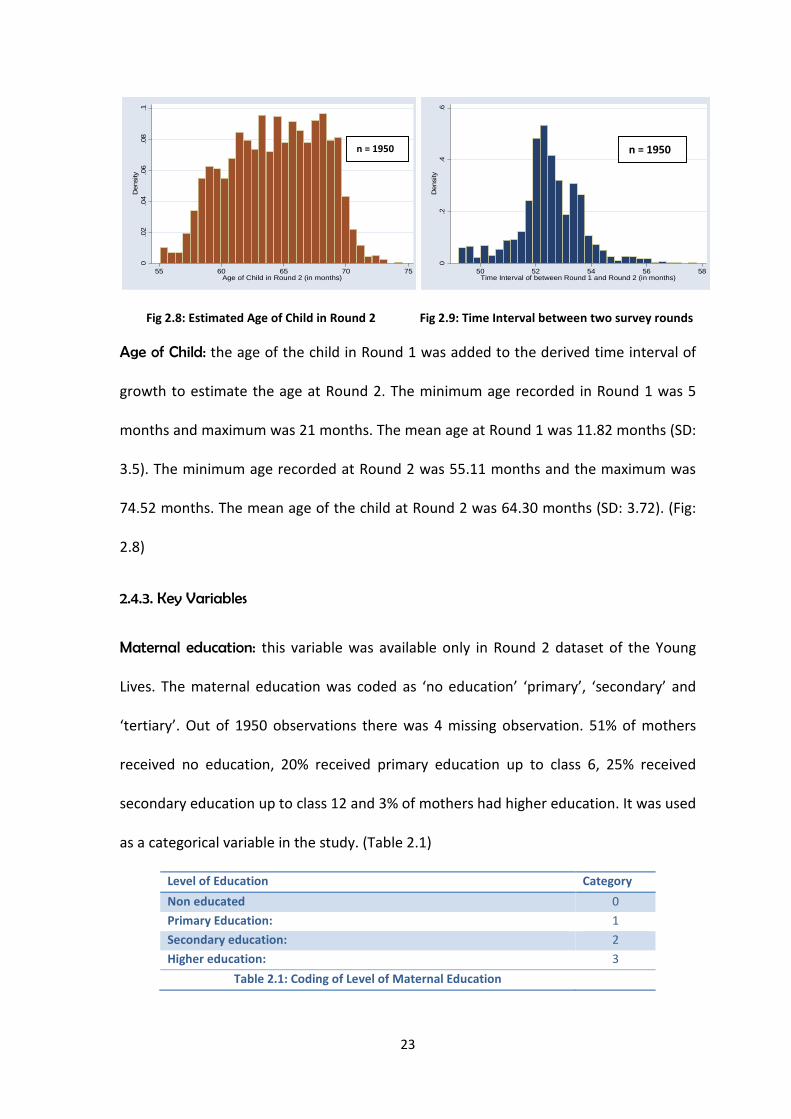
Maternal education: this variable was available only in Round 2 dataset of the Young
Lives. The maternal education was coded as ‘no education’ ‘primary’, ‘secondary’ and
‘tertiary’. Out of 1950 observations there was 4 missing observation. 51% of mothers
received no education, 20% received primary education up to class 6, 25% received
secondary education up to class 12 and 3% of mothers had higher education. It was used
as a categorical variable in the study. (Table 2.1)
Level of Education Category
Non educated 0
Primary Education: 1
Secondary education: 2
Higher education: 3
Table 2.1: Coding of Level of Maternal Education
0.0
2.0
4.0
6.0
8.1
Densi
ty
55 60 65 70 75Age of Child in Round 2 (in months)
0.2
.4.6
Densi
ty
50 52 54 56 58Time Interval of between Round 1 and Round 2 (in months)
n = 1950 n = 1950
24
Maternal mental health: this variable was available in Round 1 dataset only. Young Lives
used WHO Self Reported Questionnaire 20 to assess the presence of maternal
depression using 8 as cut-off to separate the probable case from non-case. Of the 1950
observations listed under caregiver depression, 93.4% (1827) was listed as mothers
while 0.66% was listed as other relatives. 5.6% (110) observations were missing. 30.05 %
(549) mothers were considered as a case of depression while 69.95% (1278) mothers
were considered as non-case.
2.4.4. Other potential explanatory variables:
Child Factors: Measures from Round 1
Gender: gender was included in this research, coded as male and female, as gender
disparities regarding food and resource allocation have been evidenced in previous
studies. 53.36% children were males and 46.6% children were females in this study.
Siblings: studies have shown that allocation of food is reduced or biased with increase in
the number of children in the household. Thus presence or absence of siblings was
included.
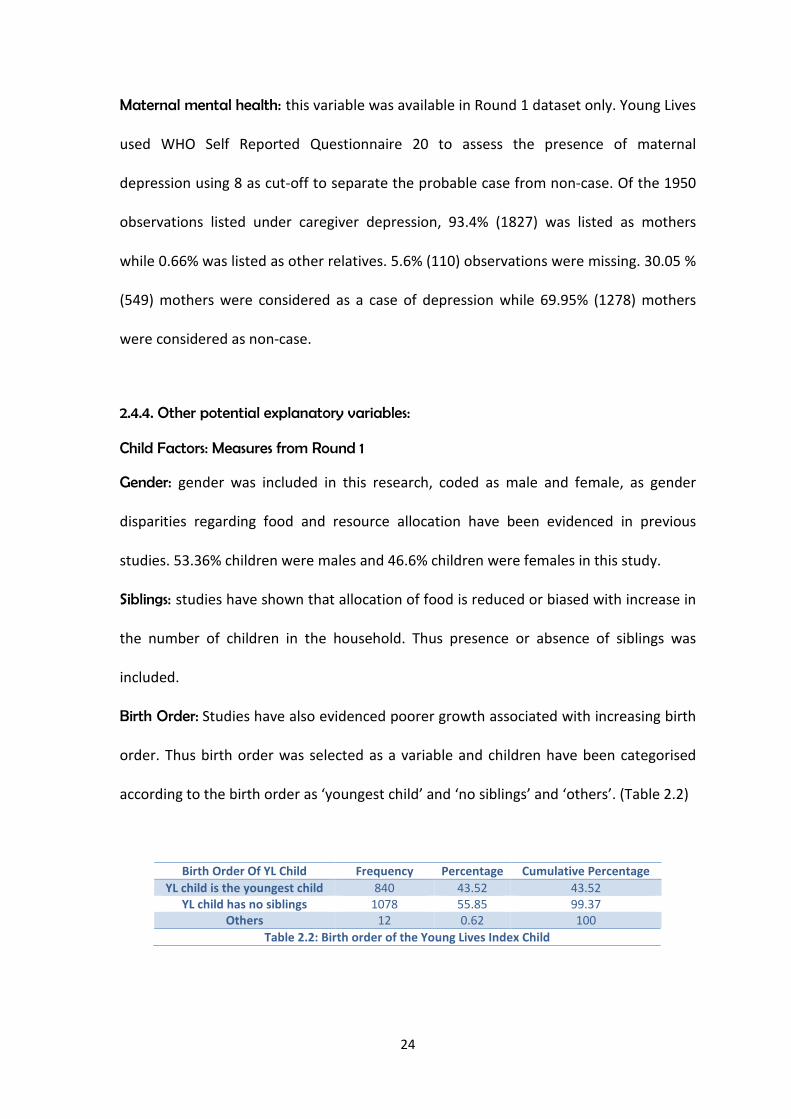
Birth Order: Studies have also evidenced poorer growth associated with increasing birth
order. Thus birth order was selected as a variable and children have been categorised
according to the birth order as ‘youngest child’ and ‘no siblings’ and ‘others’. (Table 2.2)
Birth Order Of YL Child Frequency Percentage Cumulative Percentage
YL child is the youngest child 840 43.52 43.52YL child has no siblings 1078 55.85 99.37
Others 12 0.62 100
Table 2.2: Birth order of the Young Lives Index Child
25
Breast feeding: as the length of breast feeding has an impact on the child’s growth in the
early period of life this variable was included from Round 1. It was coded as breast
feeding ‘up to 6 months’ ‘greater than 6 months’ and ‘still breast feeding’. There were
1874 observations. 5.23 % children have breast fed up to 6 months of age, 4.43%
children have breast fed over 6 months and 90.34% children were still breast feeding.
Child Health: the variable labelled healthy was chosen to assess the perception of
relative health of the child by the mother. The child has been categorised as ‘same as
the other children of his age’, ‘better than children of the same age’ and ‘worse than
children of the same age’. There are 48.8% children who are considered same while
37.34% are considered better and 13.77% children considered worst than children of the
same age.
Maternal Factors: Measures from Round 1
Maternal age: the age of the biological mother has been included and coded as ‘below
19’, ‘19 – 25’ and ‘25 – 30’ and ‘above 30’. The median age of the mother is 23 years
while the mean is 23.7 years (SD: 4.32 years). There are 11 missing variables in the
dataset.
Caste of the mother: studies show that caste is an important factor in child’s growth in
India as children of higher castes fare better than those of scheduled castes. In this study
18.4% mothers belonged to scheduled castes, 14.57% mothers belonged to Scheduled
Tribes, 46% mothers belonged to backward castes and 21.08% belonged to other castes.
Religion of the mother: previous studies revealed that Hindu and Muslim children have
poor growth compared to Christian and Sikh children. In this dataset 3.93% mothers
were Christians, 7.61% Muslims, 87.47% Hindus and 0.94% Buddhist.

26
Maternal Factors: Measures from Round 2
Maternal height: maternal height is an important genetic factor in the child’s growth
and hence included in the analysis. 1914 observations for maternal height were
recorded in Round 2 and there were 36 missing observations. One observation was
droppedd. The minimum height recorded was 104.1 cm and the maximum height was
175.5 cm. The mean height recorded was 151.48 cm (SD 6.08). (Fig: 2.10)
Fig 2.10: Distribution of Maternal Height
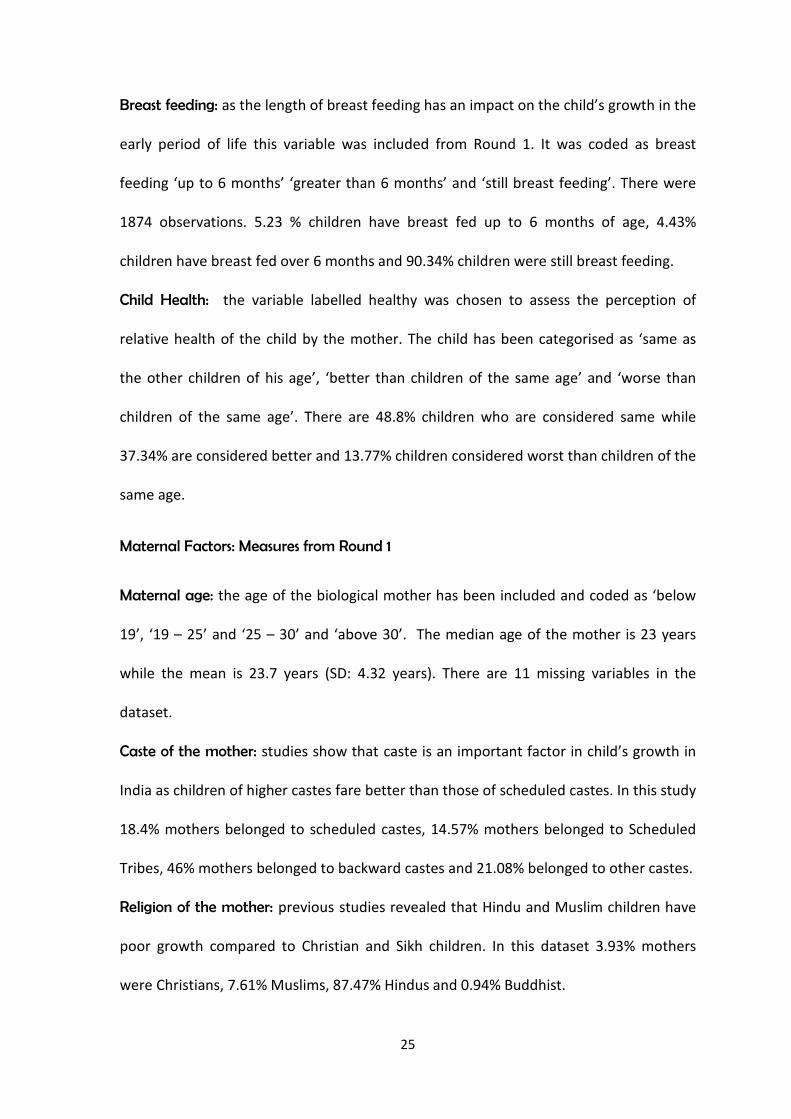
Paternal Education: paternal education has a role in deciding the resource allocation in
the household which in turn affects child growth.120 There are 1947 observations and 3
missing values. 33% fathers had no education, 21% had primary education, 33%
secondary education and 9% higher education in the dataset of round 2 of the Young
Lives. (Table 2.3)
dThe minimum recorded value of 47.3 cm was dropped due to suspected entry error.
0.0
2.0
4.0
6.0
8D
ensity
100 120 140 160 180mother's height
n = 1913
27
Fathers Education Frequency Percentage Cumulative
None 645 33.13 33.1Primary 471 24.19 57.32
Secondary 517 26.55 83.87
Higher Education 314 16.13 100
Total 1947 100
Table 2.3: Paternal Education
Household Factors
Previous studies have revealed the importance of household size and household wealth
in influencing a child’s growth. Based on those findings the following variables were
selected:
Household size: the household size was coded as ‘less than 5 members’ ‘5-7’ members’
and ‘greater than 7 members’. The mean household size in the study population was 5.5
members (SD: 2.2 members).
Debt: 50.7% households are in debt while 49.4% households are not in debt.
Wealth Index: wealth index was a simple average of three components: housing quality,
consumer durables and access to public services. Housing quality was a simple average
of rooms per person and quality of floor, roof and wall. Consumer durables were proxied
by the number of durables available in the household. Public services were a simple
average of dummy variables reflecting access to drinking water, electricity, a toilet and
fuel. This variable was available from the dataset.
28
Community Factors
Region: Young Lives Project sites are present in three agro-climatically distinct regions of
Andhra Pradesh; Coastal Andhra Pradesh, Rayalseema and Telangana and these were
coded as such for the purpose of this study.
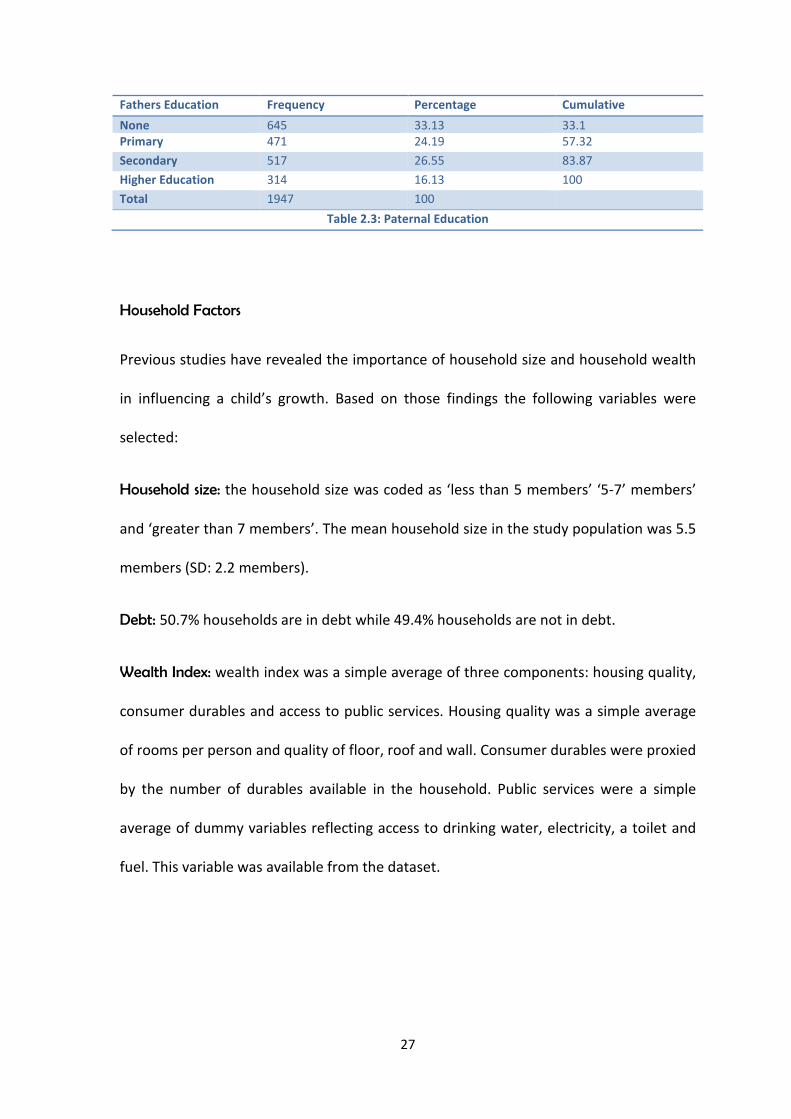
Setting: five urban areas and 15 rural areas were included in the datasets and these
were coded as Urban and Rural setting for the purpose of this study. (Table: 2.4)
Setting Gender Coastal Rayalseema Telangana NotKnown
Total Percentage
Urban Male 102 57 112 1 272 14%
Female 91 51 85 1 228 12%
Rural Male 252 242 273 0 767 39%
Female 243 229 210 1 683 35%
Total 688 579 680 3 1950
Percentage 35.3% 29.7% 34.9% 0.2% 100%
Table 2.4: Distribution of children in the regions and urban and rural setting
2.5 Analytical Methods
Data from both the rounds were merged and individually matched. 61 children with
missing data were dropped from the analysis as was individual observations with
suspected data entry error. The mean and standard deviation were calculated for
continuous variables and frequency distribution for categorical variables. The two
outcome measures were derived from existing data. These were ‘increase in child’s
height’ and ‘increase in child’s weight’.
STATA 11.0 was used for the analysis of this dissertation.
2.5.1. Correlations: the outcome variables were correlated with continuous explanatory
factors variables and the correlation coefficient “r” was calculated.
29
2.5.2. Descriptive Analysis: the mean and standard deviations was calculated for the
outcome indices with regards to the explanatory variables.
2.5.3. Simple regression: the unadjusted association was calculated for the increases in
child’s height and child’s weight according to the explanatory variables.
2.5.4. Multiple regressions: the adjusted association was calculated after controlling for
confounding factors.
Fig 2.11: Description of Levels of Variables
Child FactorsFrom Round 1
GenderBirth Order
SiblingsBreastFeeding
Healthy
Household FactorsFrom Round 1
Household sizeDebt
Wealth index
Maternal FactorsFrom Round 1
AgeCaste
Religion
From Round 2
Height
Community FactorsFrom Round 2
RegionLocation
Paternal FactorsFrom Round 2
Paternal Education
Child’s HeightChild’s Weight Child’s Growth
Maternal
Education
Maternal
Mental Health
Other
Explanatory
Variables
Key
Explanatory
Variables
Outcome
Variable

30
Chapter 3: Results
30
CHAPTER 3: RESULTS
3.1 Introduction
The previous chapter describes data collected by the Young Lives project from two survey
rounds of children residing in Andhra Pradesh. In this chapter, data from these rounds is
directly compared to obtain two indices of child growth between the age of 1 and 5 years:
a) increase in height and b) increase in weight. Section 3.2 reports descriptive statistics
obtained for each of these indices. In Section 3.3, increases in child growth are examined
according to each of the two key factors of interest - maternal education and maternal
mental health - and also other factors introduced in Chapter 2 (child, other maternal factors,
paternal education, household, community). For each index of child growth, associations
with each factor obtained using simple linear regression are reported in Section 3.4. Finally,
independent associations between each index and each factor are assessed using multiple
linear regression are reported in Section 3.5.
3.2 Descriptive Statistics
3.2.1 Outcome Variables
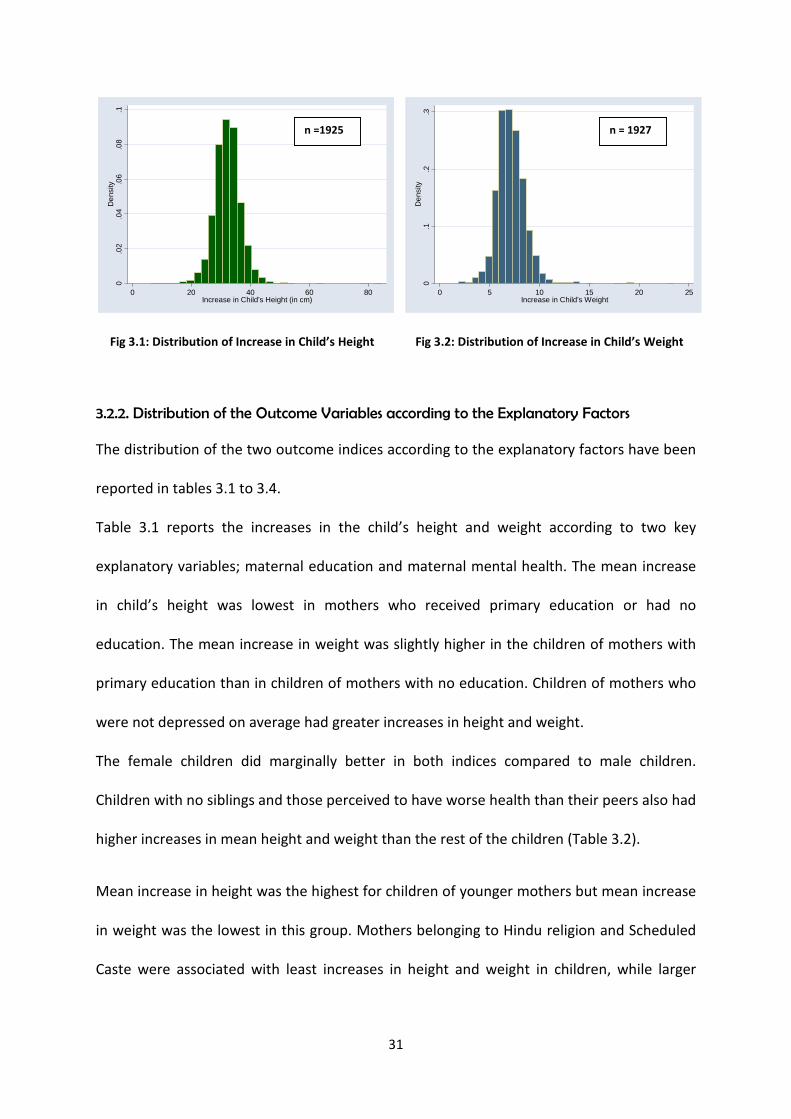
Increase in Height of the Child: the recorded minimum increase in height was 6.25 cm,
maximum was 84.5cm and the calculated mean was 32.37 cm (SD: 4.75). The mean increase
in boys height was 31.9 cm (SD: 4.7) and in girls was 32.8 cm (SD: 4.7). (Fig: 3.1)
Increase in Weight of the Child: the recorded minimum increase in weight recorded was 1.9
kgs, maximum was 23.5 kgs and calculated mean was 7.15 kgs (SD: 1.50). The mean increase
in weight of the boys was 7.08 kgs (SD: 1.4) and in girls was 7.24 kgs (SD: 1.5). (Fig: 3.2)
31
Fig 3.1: Distribution of Increase in Child’s Height Fig 3.2: Distribution of Increase in Child’s Weight
3.2.2. Distribution of the Outcome Variables according to the Explanatory Factors
The distribution of the two outcome indices according to the explanatory factors have been
reported in tables 3.1 to 3.4.
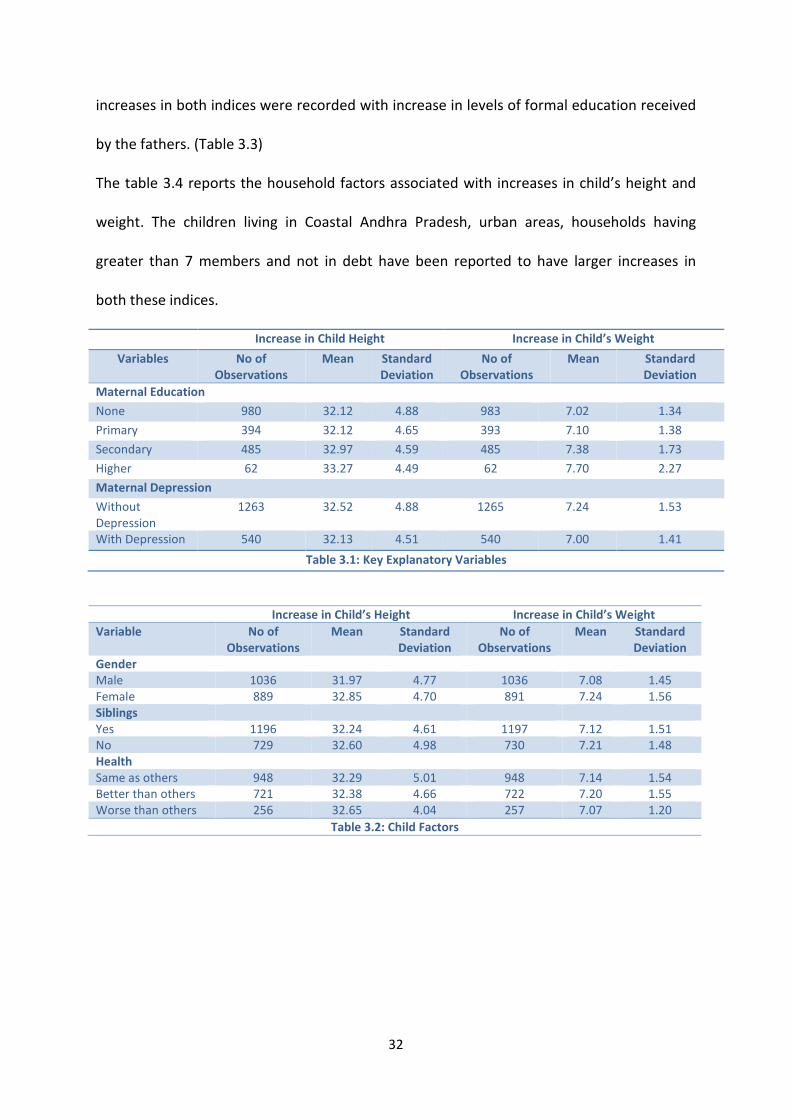
Table 3.1 reports the increases in the child’s height and weight according to two key
explanatory variables; maternal education and maternal mental health. The mean increase
in child’s height was lowest in mothers who received primary education or had no
education. The mean increase in weight was slightly higher in the children of mothers with
primary education than in children of mothers with no education. Children of mothers who
were not depressed on average had greater increases in height and weight.
The female children did marginally better in both indices compared to male children.
Children with no siblings and those perceived to have worse health than their peers also had
higher increases in mean height and weight than the rest of the children (Table 3.2).
Mean increase in height was the highest for children of younger mothers but mean increase
in weight was the lowest in this group. Mothers belonging to Hindu religion and Scheduled
Caste were associated with least increases in height and weight in children, while larger
0.0
2.0
4.0
6.0
8.1
De
nsity
0 20 40 60 80Increase in Child's Height (in cm)
0.1
.2.3
De
nsity
0 5 10 15 20 25Increase in Child's Weight
n =1925 n = 1927
32
increases in both indices were recorded with increase in levels of formal education received
by the fathers. (Table 3.3)
The table 3.4 reports the household factors associated with increases in child’s height and
weight. The children living in Coastal Andhra Pradesh, urban areas, households having
greater than 7 members and not in debt have been reported to have larger increases in
both these indices.
Increase in Child Height Increase in Child’s Weight
Variables No ofObservations
Mean StandardDeviation
No ofObservations
Mean StandardDeviation
Maternal Education
None 980 32.12 4.88 983 7.02 1.34
Primary 394 32.12 4.65 393 7.10 1.38
Secondary 485 32.97 4.59 485 7.38 1.73
Higher 62 33.27 4.49 62 7.70 2.27
Maternal Depression
WithoutDepression
1263 32.52 4.88 1265 7.24 1.53
With Depression 540 32.13 4.51 540 7.00 1.41
Table 3.1: Key Explanatory Variables
Increase in Child’s Height Increase in Child’s Weight
Variable No ofObservations
Mean StandardDeviation
No ofObservations
Mean StandardDeviation
GenderMale 1036 31.97 4.77 1036 7.08 1.45Female 889 32.85 4.70 891 7.24 1.56SiblingsYes 1196 32.24 4.61 1197 7.12 1.51No 729 32.60 4.98 730 7.21 1.48HealthSame as others 948 32.29 5.01 948 7.14 1.54Better than others 721 32.38 4.66 722 7.20 1.55Worse than others 256 32.65 4.04 257 7.07 1.20
Table 3.2: Child Factors
33
Increase in Child’s Height Increase in Child’s Weight
Variables No ofObservations
Mean StandardDeviation
No ofObservations
Mean StandardDeviation
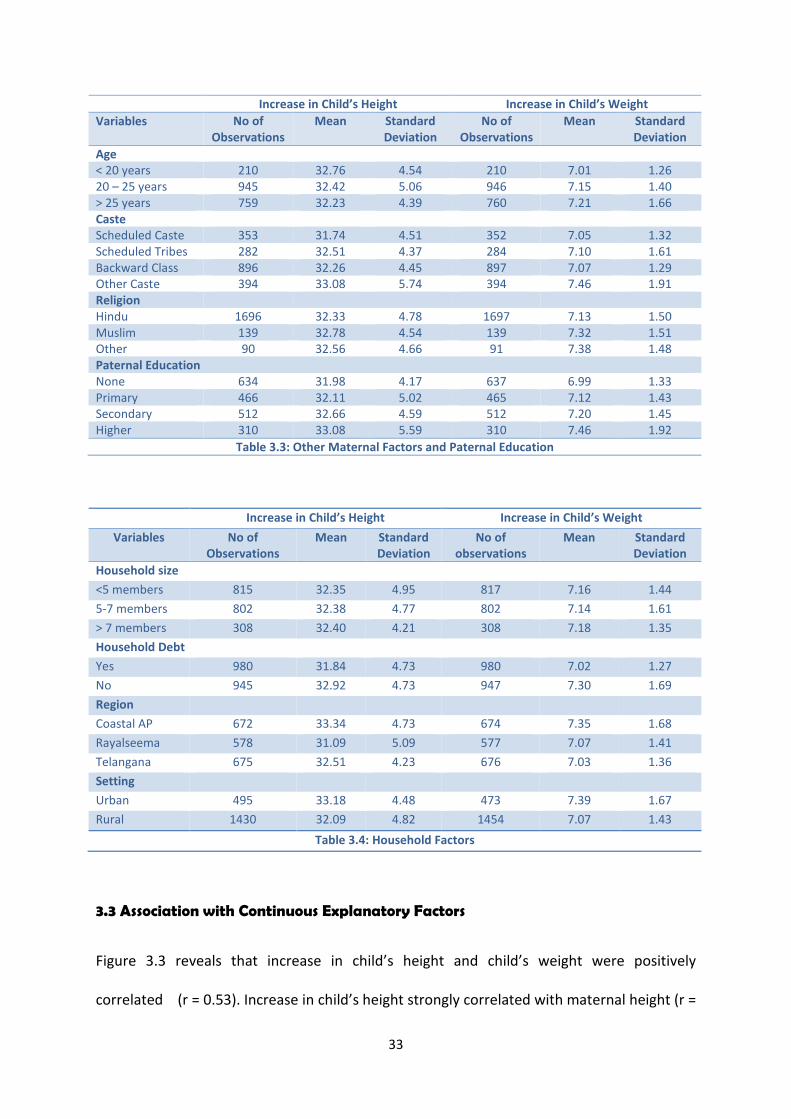
Age< 20 years 210 32.76 4.54 210 7.01 1.2620 – 25 years 945 32.42 5.06 946 7.15 1.40> 25 years 759 32.23 4.39 760 7.21 1.66CasteScheduled Caste 353 31.74 4.51 352 7.05 1.32Scheduled Tribes 282 32.51 4.37 284 7.10 1.61Backward Class 896 32.26 4.45 897 7.07 1.29Other Caste 394 33.08 5.74 394 7.46 1.91ReligionHindu 1696 32.33 4.78 1697 7.13 1.50Muslim 139 32.78 4.54 139 7.32 1.51Other 90 32.56 4.66 91 7.38 1.48Paternal EducationNone 634 31.98 4.17 637 6.99 1.33Primary 466 32.11 5.02 465 7.12 1.43Secondary 512 32.66 4.59 512 7.20 1.45Higher 310 33.08 5.59 310 7.46 1.92
Table 3.3: Other Maternal Factors and Paternal Education
Increase in Child’s Height Increase in Child’s Weight
Variables No ofObservations
Mean StandardDeviation
No ofobservations
Mean StandardDeviation
Household size
<5 members 815 32.35 4.95 817 7.16 1.44
5-7 members 802 32.38 4.77 802 7.14 1.61
> 7 members 308 32.40 4.21 308 7.18 1.35
Household Debt
Yes 980 31.84 4.73 980 7.02 1.27
No 945 32.92 4.73 947 7.30 1.69
Region
Coastal AP 672 33.34 4.73 674 7.35 1.68
Rayalseema 578 31.09 5.09 577 7.07 1.41
Telangana 675 32.51 4.23 676 7.03 1.36
Setting
Urban 495 33.18 4.48 473 7.39 1.67
Rural 1430 32.09 4.82 1454 7.07 1.43
Table 3.4: Household Factors
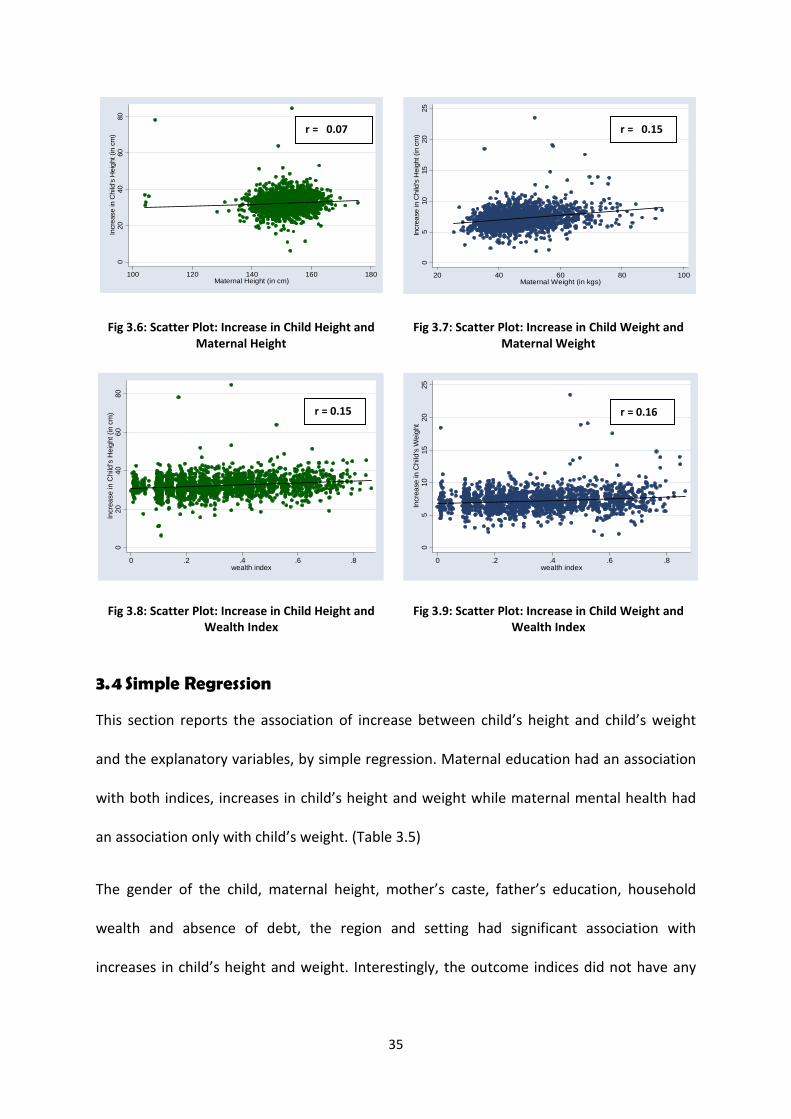
3.3 Association with Continuous Explanatory Factors
Figure 3.3 reveals that increase in child’s height and child’s weight were positively
correlated (r = 0.53). Increase in child’s height strongly correlated with maternal height (r =

34
0.07), time interval of growth (r = 0.10) and wealth index (r = 0.15). Increase in child’s
weight was also found to strongly positively correlate with maternal weight (r = 0.15), time
interval of growth (r = 0) and wealth index (r = 0.16). (Fig: 3.4 to 3.9)
Fig 3.3: Scatter Plot: Increase in Child Height and Increasein Child Weight
Fig 3.4: Scatter Plot: Increase in Child’s Height andTime Interval between Rounds
Fig 3.5: Scatter Plot: Increase in Child’s Weight andTime Interval between Rounds
020
40
60
80
Incr
ea
sein
Child
'sH
eig
ht(i
ncm
)
0 5 10 15 20 25Increase in Child's Weight (in Kgs)
02
04
06
08
0In
cre
ase
inC
hild
'sH
eig
ht
(in
cm)
50 52 54 56 58Time Interval between Round 1 and Round 2 ( in months)
05
10
15
20
25
Incr
ea
sein
Ch
il's
We
igh
t(i
nkg
s)
50 52 54 56 58Time Interval between Round 1 and Round 2 (in months)
r = 0.10 r = 0.00
r = 0.53
35
Fig 3.6: Scatter Plot: Increase in Child Height andMaternal Height
Fig 3.7: Scatter Plot: Increase in Child Weight andMaternal Weight
Fig 3.8: Scatter Plot: Increase in Child Height andWealth Index
Fig 3.9: Scatter Plot: Increase in Child Weight andWealth Index
3.4 Simple Regression
This section reports the association of increase between child’s height and child’s weight
and the explanatory variables, by simple regression. Maternal education had an association
with both indices, increases in child’s height and weight while maternal mental health had
an association only with child’s weight. (Table 3.5)
The gender of the child, maternal height, mother’s caste, father’s education, household
wealth and absence of debt, the region and setting had significant association with
increases in child’s height and weight. Interestingly, the outcome indices did not have any
020
40
60
80
Incr
ease
inC
hild
'sH
eig
ht(in
cm)
100 120 140 160 180Maternal Height (in cm)
05
10
15
20
25
Incre
ase
inC
hild
'sH
eig
ht(in
cm
)
20 40 60 80 100Maternal Weight (in kgs)
020
40
60
80
Incr
ea
se
inC
hild
'sH
eig
ht(i
ncm
)
0 .2 .4 .6 .8wealth index
05
10
15
20
25
Incre
ase
inC
hild
'sW
eig
ht
0 .2 .4 .6 .8wealth index
r = 0.07 r = 0.15
r = 0.15 r = 0.16
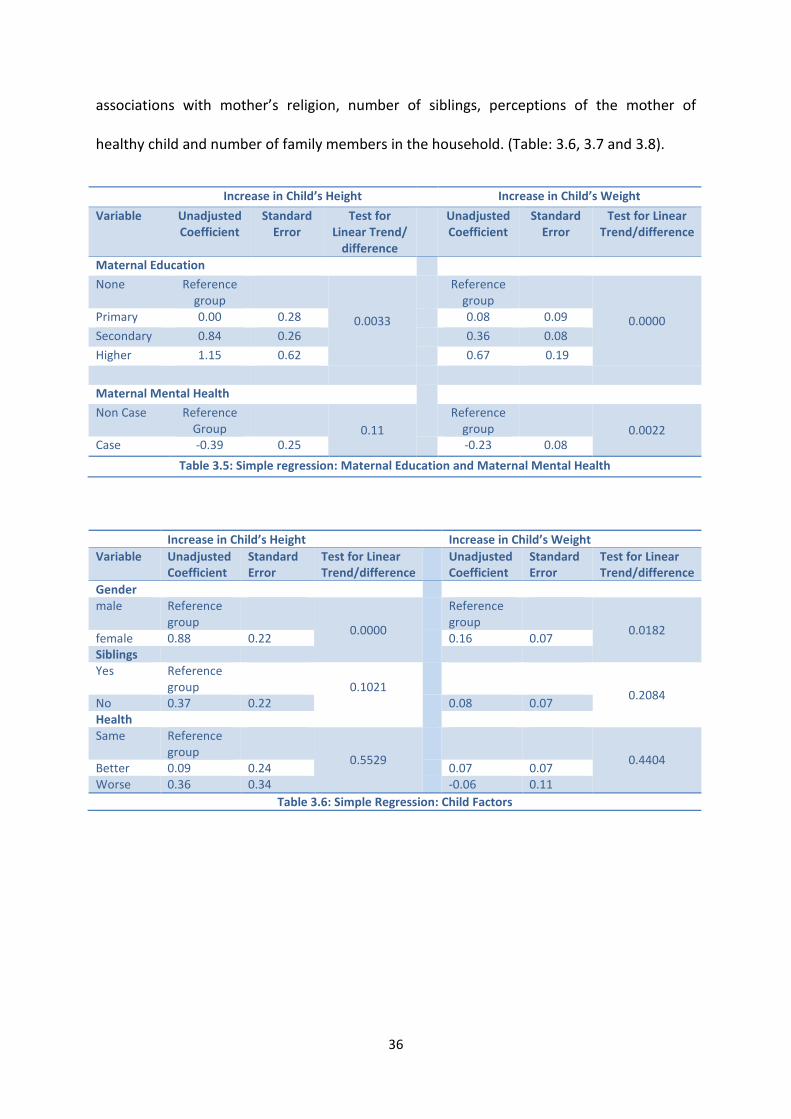
36
associations with mother’s religion, number of siblings, perceptions of the mother of
healthy child and number of family members in the household. (Table: 3.6, 3.7 and 3.8).
Increase in Child’s Height Increase in Child’s Weight
Variable UnadjustedCoefficient
StandardError
Test forLinear Trend/
difference
UnadjustedCoefficient
StandardError
Test for LinearTrend/difference
Maternal Education
None Referencegroup
0.0033
Referencegroup
0.0000Primary 0.00 0.28 0.08 0.09
Secondary 0.84 0.26 0.36 0.08
Higher 1.15 0.62 0.67 0.19
Maternal Mental Health
Non Case ReferenceGroup 0.11
Referencegroup 0.0022
Case -0.39 0.25 -0.23 0.08
Table 3.5: Simple regression: Maternal Education and Maternal Mental Health
Increase in Child’s Height Increase in Child’s Weight
Variable UnadjustedCoefficient
StandardError
Test for LinearTrend/difference
UnadjustedCoefficient
StandardError
Test for LinearTrend/difference
Gendermale Reference
group0.0000
Referencegroup
0.0182female 0.88 0.22 0.16 0.07SiblingsYes Reference
group 0.10210.2084
No 0.37 0.22 0.08 0.07HealthSame Reference
group0.5529 0.4404
Better 0.09 0.24 0.07 0.07Worse 0.36 0.34 -0.06 0.11
Table 3.6: Simple Regression: Child Factors

37
Increase in Child’s Height Increase in Child’s Weight
Variable UnadjustedCoefficient
StandardError
Test for LinearTrend/
difference
UnadjustedCoefficient
StandardError
Test for LinearTrend/
difference
Age< 20 years Reference group Reference group20 – 24 years -0.34 0.36 0.3430 0.13 0.11 0.2366> 24 years -0.53 0.37 0.20 0.11CasteScheduledCaste
Reference group Reference group
ScheduledTribe
0.77 0.38
0.0013
0.05 0.12
0.0001Backwardclass
0.52 0.30 0.02 0.09
Other castes 1.34 0.35 0.41 0.11ReligionOthers Reference group Reference groupHindu 0.21 0.64 0.5172 -0.05 0.20 0.1318Muslim -0.23 0.51 -0.24 0.16MaternalHeight orWeight
0.05 0.02 0.0042 0.01 0.001 0.0000
Paternal Educationnone Reference group
0.0023
Reference group
0.0001Primary 0.13 0.29 0.12 0.09Secondary 0.68 0.28 0.20 0.09Higher 1.10 0.32 0.46 0.10
Table 3.7: Simple Regression: Other Maternal Factors and Paternal Education
38
Increase in Child’s Height Increase in Child’s Weight
Variable UnadjustedCoefficient
StandardError
Test for LinearTrend/difference
UnadjustedCoefficient
StandardError
Test for LinearTrend/difference
Household size< 5members
Referencegroup
0.9836 Referencegroup
0.9159
5-7members
0.03 0.24 -0.02 0.08
>7 members 0.05 0.32 0.03 0.10
DebtNo debt Reference
group0.0000 Reference
group0.0000
Has debt 1.08 0.22 0.28 0.07
WealthIndex
3.42 0.51 0.000 1.13 0.16 0.000
RegionCoastal AP Reference
groupRayalseema -2.25 0.27 0.0000 -0.27 0.08 0.0002Telangana -0.824 0.25 -0.32 0.08
SettingUrban Reference
GroupRural -1.29 0.25 0.0000 -0.31 0.08 0.0001
Table 3.8: Simple Regression: House hold Factors
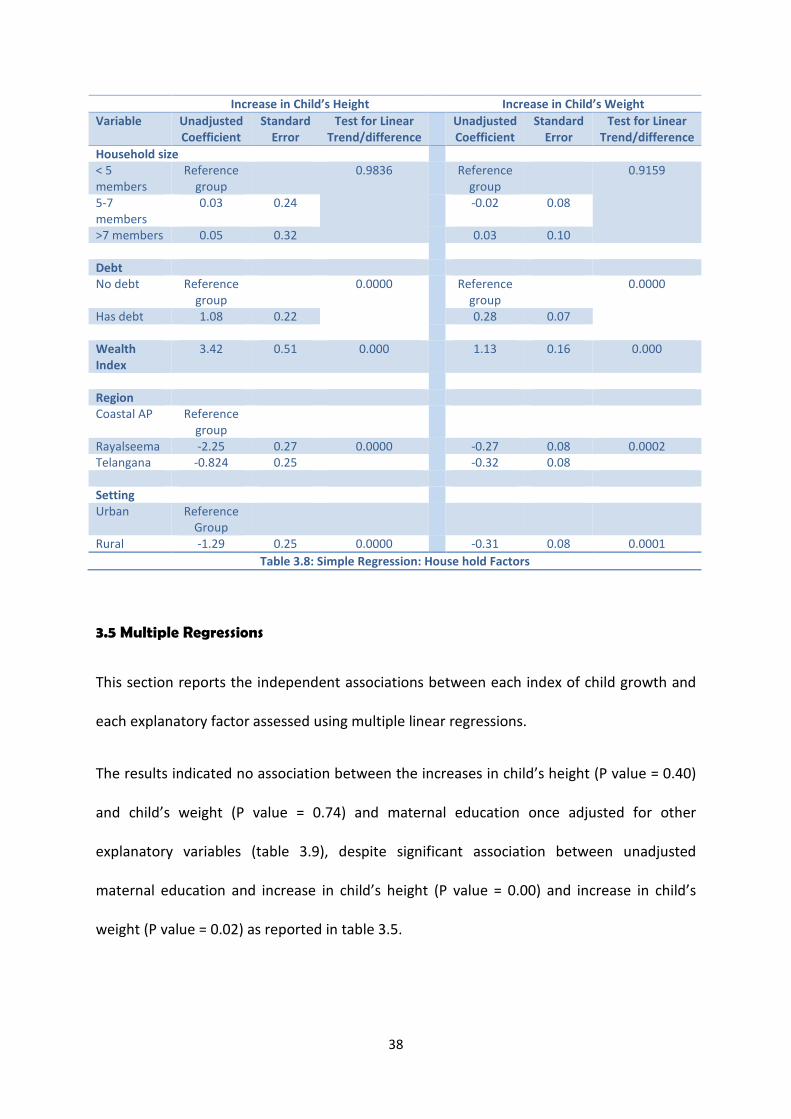
3.5 Multiple Regressions
This section reports the independent associations between each index of child growth and
each explanatory factor assessed using multiple linear regressions.
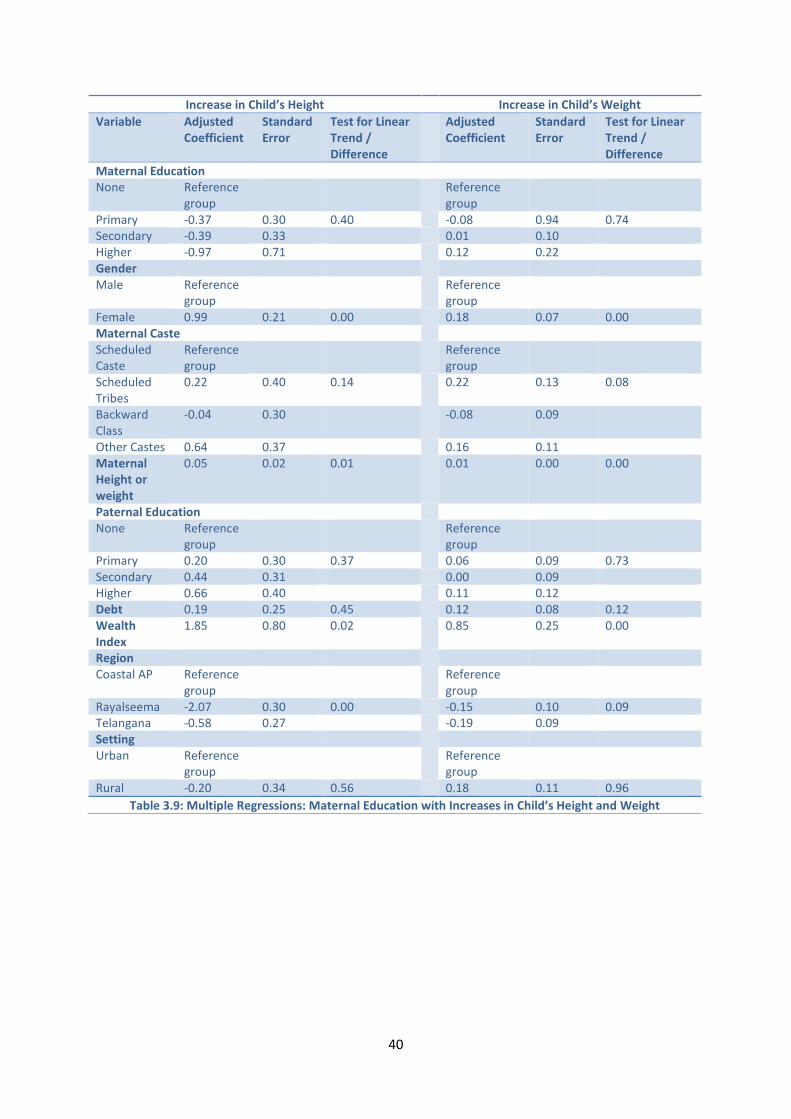
The results indicated no association between the increases in child’s height (P value = 0.40)
and child’s weight (P value = 0.74) and maternal education once adjusted for other
explanatory variables (table 3.9), despite significant association between unadjusted
maternal education and increase in child’s height (P value = 0.00) and increase in child’s
weight (P value = 0.02) as reported in table 3.5.

39
The adjusted maternal mental health also indicated no association with the increase in
child’s height (p value = 0.80) and increase in child’s weight (p value = 0.43). This is reported
in table 3.10.
Similarly, there was no association between increase in child’s height and the adjusted
factors of maternal caste, paternal education, household debt or setting (table 3.9). But
there was a significant association between increase in child’s height and gender of the
child, maternal height, the wealth index and the region to which the child belongs (table
3.9).
The increase in child’s weight was significantly associated with the adjusted factors of
gender of the child, maternal weight, maternal caste, wealth index and region while there
was no association with paternal education, debt or setting (table 3.9).
40
Increase in Child’s Height Increase in Child’s Weight
Variable AdjustedCoefficient
StandardError
Test for LinearTrend /Difference
AdjustedCoefficient
StandardError
Test for LinearTrend /Difference
Maternal EducationNone Reference
groupReferencegroup
Primary -0.37 0.30 0.40 -0.08 0.94 0.74Secondary -0.39 0.33 0.01 0.10Higher -0.97 0.71 0.12 0.22GenderMale Reference
groupReferencegroup
Female 0.99 0.21 0.00 0.18 0.07 0.00Maternal CasteScheduledCaste
Referencegroup
Referencegroup
ScheduledTribes
0.22 0.40 0.14 0.22 0.13 0.08
BackwardClass
-0.04 0.30 -0.08 0.09
Other Castes 0.64 0.37 0.16 0.11MaternalHeight orweight
0.05 0.02 0.01 0.01 0.00 0.00
Paternal EducationNone Reference
groupReferencegroup
Primary 0.20 0.30 0.37 0.06 0.09 0.73Secondary 0.44 0.31 0.00 0.09Higher 0.66 0.40 0.11 0.12Debt 0.19 0.25 0.45 0.12 0.08 0.12WealthIndex
1.85 0.80 0.02 0.85 0.25 0.00
RegionCoastal AP Reference
groupReferencegroup
Rayalseema -2.07 0.30 0.00 -0.15 0.10 0.09Telangana -0.58 0.27 -0.19 0.09SettingUrban Reference
groupReferencegroup
Rural -0.20 0.34 0.56 0.18 0.11 0.96
Table 3.9: Multiple Regressions: Maternal Education with Increases in Child’s Height and Weight

41
Increase in Child’s Height Increase in Child’s Weight
Variable AdjustedCoefficient
StandardError
Test for LinearTrend /Difference
AdjustedCoefficient
StandardError
Test for LinearTrend /Difference
Maternal Mental HealthNon Case Reference
groupReferencegroup
Case 0.08 0.26 0.80 -0.64 0.08 0.43GenderMale Reference
groupReferencegroup
Female 0.90 0.22 0.00 0.15 0.07 0.03
Maternal CasteScheduledCaste
Referencegroup
Referencegroup
ScheduledTribes
0.29 0.41 0.30 0.061 0.13
BackwardClass
0.06 0.32 -0.04 0.10
Other Castes 0.60 0.38 0.16 0.12 0.19MaternalHeight orweight
0.04 0.02 0.02 0.01 0.00 0.00
Paternal EducationNone Reference
groupReferencegroup
Primary 0.10 0.30 0.69 0.05 0.09 0.70Secondary 0.22 0.31 -0.01 0.10Higher 0.45 0.38 0.11 0.11
Debt 0.13 0.26 0.61 0.14 0.08 0.08WealthIndex
1.82 0.82 0.03 0.85 0.26 0.00
RegionCoastal AP Reference
groupReferencegroup
Rayalseema -2.09 0.31 0.00 -0.16 0.10 0.14Telangana -0.43 0.29 -0.17 0.09
SettingUrban Reference
groupReferencegroup
Rural 0.07 0.35 0.84 0.21 0.11 0.06
Table 3.10: Multiple Regressions: Maternal Mental Health with Increases in Child’s Height and Weight
Chapter 4: Discussion & Conclusions
42
Chapter 4: Discussion and Conclusions
4.1 Findings from the present research
This research reports trajectories of child growth for a cohort of children living in Andhra
Pradesh using data from the Young Lives project. Children were followed up from an
average age of 11.8 months to 5.5 years during which they grew, on average, 32.7 cm taller
and 7.15 kgs heavier.
Increases in child height and weight both showed strong positive associations with maternal
education in unadjusted analyses, these being least in children of mothers with either no
formal education or only primary education. While increases in child’s height and weight
were both lower in mothers reporting mental health problems, this difference was only
statistically significant for child’s weight. Unadjusted analyses also revealed strong positive
associations between increases in child’s height and weight and eight other factors: gender
of the child, caste of the mother, maternal height and weight, paternal education, wealth
index, debt, the agro-climatic region and setting (urban versus rural). No associations were
found, however, with presence of siblings, relative health of the child, age and religion of
the mother. Associations between child growth and maternal education and maternal
mental health did not persist after adjustment was made for the eight other factors.
Increases in child’s height and weight were, however, independently associated with gender
of the child, maternal height and weight, wealth index and the agro-climatic region.
Interestingly, associations with paternal education or household debt did not persist when
adjusted for other factors.
43
4.2 Comparison of findings with previous research
Maternal Education: lack of independent associations between maternal education and the
increases in child’s height and weight contrast with previous studies which found mother’s
education to be a strong predictor of better physical growth of the child.102,104,133 The
findings of the current research were, however, similar to that of a prospective cohort study
in Brazil.71 There it was noted that, on controlling for other factors, the effect of maternal
education on child’s growth which was assessed by prevalence of stunting and under-
nutrition was reduced by between 50 to 75%. It is noteworthy that several previous studies
which found associations between child growth and maternal education had compared data
from very different countries or regions. The Young Lives data used here, by contrast, were
collected using a pro poor sampling method within one single state of India. The absence of
an association persisting after adjustment for other factors may partly reflect smaller
variation in population sampled in terms of level of maternal education, socioeconomic
status or region in which these communities were located. In particular, the influence of
household wealth appeared more important than maternal education. It is known from
previous studies and reviews that better educated women contribute to household
income.71,104 The findings from the present study are similar to those of one which
concluded that maternal education is a proxy for socioeconomic status and geographical
area of residence and thus the effects of maternal education disappeared or greatly reduced
once these factors were controlled.61,134
The lack of association found between maternal education and child’s growth also raises
questions regarding the quality of the primary educational system present in the
community. This was also noted in previous literature which emphasised the need for

44
women’s education beyond primary level and imparting better quality education to produce
adequate health knowledge in mothers.71,102
Maternal Mental Health: a prospective cohort study in Pakistan documented maternal
mental health as a strong predictor of child growth and viewed that prevalence of maternal
depression could reduce the growth of the child by nearly 30 %.114 Other case-control and
cross sectional studies in India, Pakistan and other regions of world also indicated that
depressed mothers demonstrated impaired child growth.94,112,113 In contrast, the results of
this study indicated no association between maternal mental health and decrease in child
growth indices.
Paternal Education: while paternal education initially appeared to have an important role
to play in child growth these influences disappeared once controlled for potential
confounders. With a growing interest in paternal contribution to a child’s growth studies the
recent past have reported some associations with paternal education. 104,121-123
Poverty and Household Wealth: the study found a strong positive independent association
with wealth index but not household debt. Previous studies have documented that
household wealth provides leverage for improving child growth by providing the
opportunity to purchase goods and services which were health enhancing.21,23,24,29,30
Gender: unlike most previous studies, child growth was measured using two continuous
measures: increase in height and increase in weight. While mean height of the boys and
girls at age 5 years was similar, the increase in the female child’s height and weight was
slightly higher. This finding contrasts with previous studies which had not found any
difference between the growth of male and female.10,31
45
Maternal Height and Weight: there was strong association between maternal height and
weight and increases in child’s height and weight. Previous studies have also documented
similar findings.3,7,119
Setting and Region: evidence suggested that urban children generally have a better
nutritional status than their rural counterparts.125-128 Unadjusted analysis in this study
revealed that urban children had greater increase in height but these differences ceased
once adjusted for the other explanatory factors. Increases in height and weight were highest
in children living in Coastal Andhra Pradesh and lowest among those living in Rayalseema.
This is the first time such regional comparisons in child growth have been made within
Andhra Pradesh.
4.3 Strengths of this research
This research observed increases in child’s growth between the ages of 1 and 5 years, in
resource poor settings of Andhra Pradesh using individually linked data. The Young Lives
Project provided complete datasets for two consecutive survey rounds, with a follow-up of
97%.Two sensitive continuous measures of child’s growth were used: a) increase in height in
centimetres and b) increase in weight in kilograms. Most previous studies of child growth in
developing countries have been predominantly case-control or cross sectional in their
design and using prevalence stunting and wasting as their indices.
4.4 Limitations of this research
The Young Lives has used a pro poor sampling technique within a single state in India. The
resultant smaller variation in maternal education may explain the lack of association with
46
child growth after adjusting for the confounding effects of other important factors at the
community level such as the wealth index.
The first survey took place when children were aged on average 11.8 months and second
survey when aged 5.5 years. The time between the two survey rounds ranged from 49 to 58
months, which may have introduced variability into the period of child’s growth. While data
could have been restricted to a narrower age range, analyses would have lost precision.
Maternal depression was only recorded at Round 1 while maternal education was only
recorded at Round 2. In addition the information on breastfeeding was incomplete. It would
have been preferable to have had information regarding all these three variables at both
survey rounds. Lack of information on the 32 children who died was not provided at Round
2.
4.5 Conclusions
This was the first study to assess child’s growth using continuous measures derived from
data from an international cohort study (Young Lives). It followed the children in their early
period of their growth, from the ages of 1 to 5 years. Independent associations were found
between child growth and child’s gender, maternal height and weight, household wealth
index and the agro-climatic region. While both key factors of prior interest, maternal
education and maternal mental health, were initially associated with child growth, these did
not persist after adjustment for other factors. Other factors, including paternal education
were also not found to be associated. This study draws attention to the need for improved
quality of the educational system in poorer areas of Andhra Pradesh. It also illustrates the
pivotal role of the prospective study design in identifying key factors affecting child’s
growth.
Bibliography

47
Bibliography
1. De Onis M. Chapter 5: Child Growth and Development. In: Semba R, Bloem MW, editors.
Nutrition and health in developing countries. 2nd Edition. Humana Press; 2001 :113 -134
2. De Onis M, Blossner M. The World Health Organization; Global Database on Child
Growth and Malnutrition: Methodology and applications. Int .J. Epidemiol. 2003; 32(4):
518.
3. Batty GD, Shipley MJ, Gunnell D, Huxley R, Kivimaki M, Woodward M, et al. Height,
Wealth, and Health: An Overview with New Data from Three Longitudinal Studies.
Economics & Human Biology 2009 7; 7(2):137-152.
4. World Health Organization. World Health Organization Releases New Child Growth
Standards. 2006. Available at http: //www.who.int /mediacentre /news /releases /2006
/pr21/en/index.html (accessed on 28.6.2010).
5. World Health Organization. WHO Child Growth Standards: Length/height-for-age,
weight-for-age, weight-for-length, weight-for-height and body mass index-for-age:
methods and development. 2006; 1-307
6. Barker DJP. Mothers, babies, and health in later life. Elsevier Health Sciences; 1998.
7. Escobal J, Saavedra J, Suárez P, Huttly S, Penny M, Lanata C, et al. The Interaction of
Public Assets, Private Assets and Community Characteristics and its Effect on Early
Childhood Height-for-Age in Peru. Young Lives Working Paper; 2005: 14.
8. Lloyd JEV, Hertzman C. From Kindergarten readiness to fourth-grade assessment:
Longitudinal analysis with linked population data. Soc.Sci.Med. 2009 1; 68(1):111-123.
9. World Health Organisation. World Health Report (2007) - A safer future: Global public
Health Security in the 21st century. Geneva. Switzerland. 2007.
48
10. International Institute of Population Sciences (IIPS) and Macro International. National
Family Health Survey (NFHS 3), 2005-06: India; Volume 1 Mumbai: IIPS; 2007.
11. De Onis M, Onyango AW. WHO Child Growth Standards. The Lancet 2008 1/19;
371(9608):204-204.
12. Kalanda BF, van Buuren S, Verhoeff FH, Brabin BJ. Catch-up growth in Malawian babies,
a longitudinal study of normal and low birthweight babies born in a malarious endemic
area. Early Hum.Dev. 2005 ; 81(10):841-850.
13. Kuh D, Ben-Shlomo Y. A life course approach to chronic disease epidemiology: Oxford
University Press, USA; 2004. 1-477
14. Hertzman C. The biological embedding of early experience and its effects on health in
adulthood; Ann.N.Y.Acad.Sci. 1999; 896: 85-95.
15. Woolf B. Studies on Infant Mortality: Part II. Social Aetiology of Stillbirths and Infant
Deaths in County Boroughs of England and Wales. Br.Med.J. 1947; 1(2):73.
16. Black RE, Allen LH, Bhutta ZA, Caulfield LE, de Onis M, Ezzati M, et al. Maternal and Child
Under-nutrition: global and regional exposures and health consequences. The Lancet
2008. 1/19; 371(9608):243-260.
17. World Health Organisation. Millennium Development Goals: Progress towards the
Health-Related Millennium Development Goal: Key facts May, 2010; available at:
http://www .who .int/mediacentre/factsheets/fs290/en/index.html (accessed on
12.7.2010).
18. World Health Organisation. Global Database on Child Growth and Malnutrition. 2010;
available at http://www.who.int/nutgrowthdb/en/ (accessed on 14.6.2010).
49
19. Engle PL, Menon P, Haddad LJ. Care and Nutrition: Concepts and Measurement: Intl
Food Policy Research Inst; 1997. 1-39
20. Wachs TD. Mechanisms linking parental education and stunting. The Lancet 2008 1/26;
371(9609):280-281.
21. Wachs TD. Multiple influences on children's nutritional deficiencies: A systems
perspective. Physiol.Behav. 2008 4/22; 94(1):48-60.
22. Mosley WH, Chen LC. An analytical framework for the study of child survival in
developing countries. Bull.World Health Organ. 2003; 81:140-145.
23. World Health Organisation. The World Health Report 1999: Making a difference. 1999.
24. Boyle MH, Racine Y, Georgiades K, Snelling D, Hong S, Omariba W, et al. The influence of
economic development level, household wealth and maternal education on child health
in the developing world. Soc.Sci.Med. 2006; 63(8):2242-2254.
25. Walker SP, Wachs TD, Meeks Gardner J, Lozoff B, Wasserman GA, Pollitt E, et al. Child
development: risk factors for adverse outcomes in developing countries. The Lancet
2007 1/13; 369(9556):145-157.
26. Grantham-McGregor S, Cheung YB, Cueto S, Glewwe P, Richter L, Strupp B.
Developmental potential in the first 5 years for children in developing countries. The
Lancet 2007 1/6; 369(9555):60-70.
27. Alderman H. Improving Nutrition through Community Growth Promotion: Longitudinal
Study of the Nutrition and Early Child Development Program in Uganda. World Dev.
2007 8; 35(8):1376-1389.
28. Fernald LC, Gertler PJ, Neufeld LM. 10-year effect of Oportunidades, Mexico's
conditional cash transfer programme, on child growth, cognition, language, and
behaviour: a longitudinal follow-up study. The Lancet 2009 12/12; 374(9706):1997-2005.
50
29. Alderman H, Hoogeveen H, Rossi M. Reducing child malnutrition in Tanzania: Combined
effects of income growth and program interventions. Economics & Human Biology 2006
1; 4(1):1-23.
30. Ranis G, Stewart F, Ramirez A. Economic growth and human development. World Dev.
2000; 28(2):197-220.
31. Griffiths P, Matthews Z, Hinde A. Gender, family, and the nutritional status of children in
three culturally contrasting states of India. Soc.Sci.Med. 2002; 55(5):775-790.
32. Venancio SI, Monteiro CA. Individual and contextual determinants of exclusive breast-
feeding in São Paulo, Brazil: a multilevel analysis. Public Health Nutr. 2007; 9(01):40-46.
33. Sakisaka K, Wakai S, Kuroiwa C, Flores LC, Kai I. Nutritional status and associated factors
in children aged 0-23 months in Granada, Nicaragua Public Health 2006;120(5):400-411.
34. Choudhury KK, Hanifi MA, Rasheed S, Bhuiya A. Gender inequality and severe
malnutrition among children in a remote rural area of Bangladesh Journal of Health
Population and Nutrition 2000;18(3):123-130.
35. Masset E, White H. Infant and Child Mortality in Andhra Pradesh: Analysing changes over
time and between states. 2003. MPRA (2008); 11206: 12-33. Available at
http://mpra.ub.uni-muenchen.de/11206/ (accessed on 2.8.2010).
36. Gittelsohn J, Thapa M, Landman LT. Cultural factors, caloric intake and micronutrient
sufficiency in rural Nepali households. Soc.Sci.Med. 1997 6; 44(11):1739-1749.
37. Graham MA. Food allocation in rural Peruvian households: concepts and behaviour
regarding children. Soc.Sci.Med. 1997; 44(11):1697-1709.
38. Pande RP. Selective Gender Differences in Childhood Nutrition and Immunization in
Rural India: The Role of Siblings. Demography 2003 Aug.; 40(3):395-418.
51
39. Ralston K. Children's health as an input to labor: Intrahousehold food distribution in
Rural Indonesia. Journal of Policy Modeling 1997 10; 19(5):567-586.
40. Van Esterik P. Intra-family food distribution: its relevance for maternal and child
nutrition. Determinants of Young Child Feeding and Their Implications for Nutritional
Surveillance. Cornell Nutritional Surveillance Program Working Paper 1985; 31.
41. Pelto GH. Cultural issues in maternal and child health and nutrition. Soc.Sci.Med. 1987;
25(6):553-559.
42. Graham MA. Food allocation in rural Peruvian households: Concepts and behavior
regarding children. Soc.Sci.Med. 1997 6; 44(11):1697-1709.
43. Thomas D. Like father, like son; like mother, like daughter: Parental resources and child
height. J.Hum.Resour. 1994; 29(4):950-988.
44. Darnton-Hill I, Webb P, Harvey PWJ, Hunt JM, Dalmiya N, Chopra M, et al. Micronutrient
deficiencies and gender: social and economic costs. Am.J.Clin.Nutr. 2005; 81(5):1198S.
45. Shell-Duncan B, Obiero WO. Child nutrition in the transition from nomadic pastoralism
to settled lifestyles: individual, household, and community-level factors.
Am.J.Phys.Anthropol. 2000; 113(2):183-200.
46. Quisumbing AR. Food aid and child nutrition in rural Ethiopia. World Dev. 2003;
31(7):1309-1324.
47. Colecraft E, Marquis GS, Aryeetey R, Sakyi-Dawson O, Lartey A, Ahunu B, et al.
Constraints on the use of animal source foods for young children in Ghana: A
participatory rapid appraisal approach. Ecol.Food Nutr. 2006; 45(5):351-377.
48. Mwadime RK, Baldwin SL. Relationship between household access to food and
malnutrition in eastern and southern Africa. East Afr.Med.J. 1994 Sep; 71(9):571-579.
52
49. Rosegrant MW, Meijer S. Appropriate food policies and investments could reduce child
malnutrition by 43% in 2020. J.Nutr. 2002; 132(11):3437S.
50. Simon D, Adams AM, Madhavan S. Women’s social power, child nutrition and poverty in
Mali. J.Biosoc.Sci. 2002; 34(02):193-213.
51. Thomas D, Strauss J, Henriques MH. How does mother's education affect child height?
J.Hum.Resour. 1991; 26(2):183-211.
52. Thomas D. Intra-Household Resource Allocation: An Inferential Approach. J.Hum.Resour.
1990 Autumn; 25(4):635-664.
53. Tucker K, Young FW. Household structure and child nutrition: A reinterpretation of
income and mother's education. Soc.Indicators Res. 1989; 21(6):629-649.
54. UNICEF. The State of the World’s Children 2008. New York: United Nations Children’s
Fund (UNICEF); 2008. 1-154
55. UNICEF. State of World's Children 2005. New York: United Nations Children’s Fund
(UNICEF); 2005. 1-151
56. UNICEF. HIV and Infant Feeding: The Facts 2010. Available at: http:// www.unicef.org/
programme/breastfeeding/hiv.htm (accessed on 29.7.2010).
57. Mamabolo RL, Alberts M, Steyn NP, Delemarre-Van De Waal HA, Levitt NS. Prevalence
and determinants of stunting and overweight in 3-year-old black South African children
residing in the Central Region of Limpopo Province, South Africa. Public Health Nutr.
2007; 8(05):501-508.
58. Casapía M, Joseph SA, Núnez C, Rahme E, Gyorkos TW. Parasite risk factors for stunting
in grade 5 students in a community of extreme poverty in Peru. Int.J.Parasitol. 2006;
36(7):741-747.

53
59. Komlos J. Anthropometric evidence on economic growth, biological well-being and
regional convergence in the Habsburg Monarchy c.1850–1910. Cliometrica 2007;
1(3):211-237.
60. Schultz TP. Returns to women’s education. In: King EM, Hill MA, editors. Women’s
education in developing countries: Barriers, benefits, and policies. The John Hopkins
University Press. 1993 June:51–99.
61. Desai S, Alva S. Maternal education and child health: Is there a strong causal
relationship? Demography 1998; 35(1):71-81.
62. Behrman JR, Wolfe BL. How does mother's schooling affect family health, nutrition,
medical care usage, and household sanitation? J.Econ. 1987; 36(1-2):185-204.
63. Bhuiya A, Zimicki S, D'Souza S. Socioeconomic differentials in child nutrition and
morbidity in a rural area of Bangladesh. J.Trop.Pediatr. 1986; 32(1):17.
64. Christian P, Abbi R, Gujral S, Gopaldas T. The role of maternal literacy and nutrition
knowledge in determining children's nutritional status. Food Nutr. Bull. (USA) 1988; 10:
35-40.
65. Christian PS, Gujral S, Abbi RD, Gopaldas T. Relationship between maternal and infant
nutritional status. J.Trop.Pediatr. 1989; 35(2):71.
66. Handa S. Maternal education and child height. Economic Development and Cultural
Change 1999; 47(2):421-439.
67. Hexel PC, Wintersberger H. Inequalities in health: Strategies. Soc.Sci.Med. 1986; 22(2):
151-160.
68. Hill MS, Duncan GJ. Parental family income and the socioeconomic attainment of
children. Soc.Sci.Res. 1987 3; 16(1):39-73.

54
69. Reed BA, Habicht JP, Niameogo C. The effects of maternal education on child nutritional
status depend on socio-environmental conditions. Int.J.Epidemiol. 1996; 25(3):585.
70. Thomas D, Strauss J, Henriques M. Child survival, height for age and household
characteristics in Brazil. J.Dev.Econ. 1990 10; 33(2):197-234.
71. Victoria CG, Huttly SRA, Barros FC, Lombardi C, Vaughan JP. Maternal education in
relation to early and late child health outcomes: findings from a Brazilian cohort study
Soc.Sci.Med. 1992; 34(8):899-905.
72. Desai S. Maternal Education and Child Health: A Feminist Dilemma. Feminist Studies.
2000; 26(2):425-446.
73. Block SA. Maternal Nutrition Knowledge versus Schooling as Determinants of Child
Micronutrient Status. Oxford Economic Papers. 2007 Apr; 59(2):330-353.
74. Anoop S, Saravanan B, Joseph A, Cherian A, Jacob K. Maternal depression and low
maternal intelligence as risk factors for malnutrition in children: a community based
case-control study from South India. Arch.Dis.Child. 2004; 89(4):325.
75. Aromolaran AB. Household income, women's income share and food calorie intake in
South Western Nigeria. Food Policy. 2004; 29(5):507-530.
76. Babones SJ. Income inequality and population health: Correlation and causality.
Soc.Sci.Med. 2008 4; 66(7):1614-1626.
77. Baldacci E, Clements B, Gupta S, Cui Q. Social Spending, Human Capital, and Growth in
Developing Countries. World Dev. 2008 8; 36(8):1317-1341.
78. Becker S, Fonseca-Becker F, Schenck-Yglesias C. Husbands' and wives' reports of
women's decision-making power in Western Guatemala and their effects on preventive
health behaviours. Soc.Sci.Med. 2006; 62(9):2313-2326.
55
79. Begin F, Frongillo Jr EA, Delisle H. Caregiver behaviors and resources influence child
height-for-age in rural Chad. J.Nutr. 1999; 129(3):680.
80. Bhutta ZA, Ahmed T, Black RE, Cousens S, Dewey K, Giugliani E, et al. What works?
Interventions for maternal and child undernutrition and survival. The Lancet 2008 2/2;
371(9610):417-440.
81. Biggs B, King L, Basu S, Stuckler D. Is wealthier always healthier? The impact of national
income level, inequality, and poverty on public health in Latin America. Soc.Sci.Med.
2010 7; 71 (2): 266-273.
82. Black MM, Walker SP, Wachs TD, Ulkuer N, Gardner JM, Grantham-McGregor S, et al.
Policies to reduce undernutrition include child development. The Lancet 2008 2/9;
371(9611):454-455.
83. Blumberg RL. Income under female versus male control: Hypotheses from a Theory of
Gender Stratification and Data from the Third World. J Fam. Issue. 1988 3; 9: 51-84
84. Caballero B, Popkin BM. Policy implications. In: Benjamin Caballero, Barry M. Popkin,
editors. The Nutrition Transition London: Academic Press; 2002: 241-250.
85. Carter MR, Maluccio JA. Social Capital and Coping with Economic Shocks: An Analysis of
Stunting of South African Children. World Dev. 2003 7; 31(7):1147-1163.
86. Coburn D. Beyond the income inequality hypothesis: class, neo-liberalism, and health
inequalities. Soc.Sci.Med. 2004 1; 58(1):41-56.
87. De Miranda CT, Turecki G, Mari Jdej, Andreoli SB, Marcolim MA, Goihman S, et al.
Mental health of the mothers of malnourished children Int.J.Epidemiol. 1996; 25(1):
128.
88. De Silva MJ, Harpham T. Maternal social capital and child nutritional status in four
developing countries. Health Place. 2007 6; 13(2):341-355.

56
89. De Silva MJ, Huttly SR, Harpham T, Kenward MG. Social capital and mental health: A
comparative analysis of four low income countries. Soc.Sci.Med. 2007 1; 64(1):5-20.
90. DeRose LF, Das M, Millman SR. Does Female Disadvantage Mean Lower Access to Food?
Population and Development Review 2000 Sep.; 26(3):517-547.
91. Doan RM, Bisharat L. Female autonomy and child nutritional status: The extended-family
residential unit in Amman, Jordan. Soc.Sci.Med. 1990; 31(7):783-789.
92. Dowd JB. Early childhood origins of the income/health gradient: The role of maternal
health behaviors. Soc.Sci.Med. 2007 9; 65(6):1202-1213.
93. Durlauf SN, Fafchamps M. Chapter 26 Social Capital. In: Philippe Aghion and Steven N.
Durlauf, editors. Handbook of Economic Growth: Elsevier; 2005; 1639-1699.
94. Harpham T, Sharon Huttly, Silva MJD, Abramsky T. Maternal Mental Health and Child
Nutritional Status in Four Developing Countries. Journal of Epidemiology and Community
Health (1979); 2005 Dec.; 59(12):1060-1064.
95. Cadwell JC. Education as a Factor in Mortality Decline An Examination of Nigerian Data.
Population Studies 1979 Nov. 33 (3): 395-413
96. Rodrigues M, Patel V, Jaswal S, de Souza N. Listening to mothers: qualitative studies on
motherhood and depression from Goa, India. Soc.Sci.Med. 2003; 57(10):1797-1806.
97. Adair L, Popkin B, VanDerslice J, Akin J, Guilkey D, Black R, et al. Growth dynamics during
the first two years of life: a prospective study in the Philippines. European Journal of
Clinical Nutrition. 1993; 47:42-51.
98. Berkman DS, Lescano AG, Gilman RH, Lopez SL, Black MM. Effects of stunting, diarrhoeal
disease, and parasitic infection during infancy on cognition in late childhood: a follow-up
study The Lancet 2002;359(9306):564-571.
57
99. Rahman A, Bunn J, Lovel H, Creed F. Maternal depression increases infant risk of
diarrhoeal illness: a cohort study. Br.Med.J. 2007; 92(1):24.
100. Hatt LE, Waters HR. Determinants of child morbidity in Latin America: a pooled
analysis of interactions between parental education and economic status. Soc.Sci.Med.
2006; 62(2):375-386.
101. Kandala NB, Magadi MA, Madise NJ. An investigation of district spatial variations of
childhood diarrhoea and fever morbidity in Malawi. Soc.Sci.Med. 2006; 62(5):1138-
1152.
102. Glewwe P. Why does mother's schooling raise child health in developing countries?
Evidence from Morocco. J.Hum.Resour. 1999; 34 (1):124-159.
103. Pongou R, Ezzati M, Salomon JA. Household and community socioeconomic and
environmental determinants of child nutritional status in Cameroon. BMC Public Health
2006 Apr 17;6:98.
104. Semba RD, de Pee S, Sun K, Sari M, Akhter N, Bloem MW. Effect of parental formal
education on risk of child stunting in Indonesia and Bangladesh: a cross-sectional study.
The Lancet 2008 1/26; 371(9609):322-328.
105. Guldan GS, Zeitlin MF, Beiser AS, Super CM, Gershoff SN, Datta S. Maternal
education and child feeding practices in rural Bangladesh. Soc.Sci.Med. 1993 4;
36(7):925-935.
106. Kravdal Ø. Child mortality in India: the community-level effect of education.
Population Studies. 2004; 58(2): 177- 192
107. Cleland J, Kaufmann G. Education, fertility and child survival: Unraveling the links. In:
Basu AM, Aaby P, eds. The methods and uses of anthropological demography. Oxford:
Clarendon. Press, 1998:128-152.

58
108. Pfeiffer J, Gloyd S, Li LR. Intrahousehold resource allocation and child growth in
Mozambique: an ethnographic case–control study. Soc.Sci.Med. 2001 7; 53(1):83-97.
109. Gottfredson LS. Why g matters: The complexity of everyday life. Intelligence. 1997 2;
24(1):79-132.
110. Durand J, Kandel W, Parrado EA, Massey DS. International migration and
development in Mexican communities. Demography. 1996; 33(2):249-264.
111. Smith LC, Ramakrishnan U, Ndiaye A, Haddad L, Martorell R. The importance of
women's status for child nutrition in developing countries: Intl Food Policy Research Inst;
2003; 1-155
112. Patel V, Rahman A, Jacob K, Hughes M. Effect of maternal mental health on infant
growth in low income countries: new evidence from South Asia. Br.Med.J. 2004;
328(7443):820.
113. Fisher J, de Mello MC, Izutsu T. Mental health aspects of pregnancy, childbirth and
the postpartum period. Contemporary Topics in Women's Mental Health: Global
Perspectives in a Changing Society. Wiley. 2009: 1-579.
114. Rahman A, Lovel H, Bunn J, Iqbal Z, Harrington R. Mothers' mental health and infant
growth: a case–control study from Rawalpindi, Pakistan. Child: Care, Health and
Development 2003; 30(1):21-27.
115. Patel V, Rodrigues M, DeSouza N. Gender, poverty, and postnatal depression: a study
of mothers in Goa, India. Am.J.Psychiatry 2002; 159(1):43.
116. Friede A, Baldwin W, Rhodes PH, Buehler JW, Strauss LT, Smith JC, et al. Young
maternal age and infant mortality: the role of low birth weight. Public Health Rep. 1987;
102(2):192.
59
117. Baldwin W, Cain VS. The Children of Teenage Parents. Fam.Plann.Perspect. 1980 Jan.
- Feb.; 12(1):34-43.
118. Scholl TO, Hediger ML, Belsky DH. Prenatal care and maternal health during
adolescent pregnancy: A review and meta-analysis. Journal of Adolescent Health 1994 9;
15(6):444-456.
119. Haidar J, Abate G, Kogi-Makau W, Sorensen P. Risk factors for child under-nutrition
with a human rights edge in rural villages of North Wollo, Ethiopia. East Afr.Med.J.
2005; 82(12):625-630.
120. McBride BA, Mills G. A comparison of mother and father involvement with their
preschool age children. Early Childhood Research Quarterly 1993; 8(4):457-477.
121. Yeung WJ, Sandberg JF, Davis-Kean PE, Hofferth SL. Children's Time with Fathers in
Intact Families. Journal of Marriage and Family 2001 Feb.; 63(1):136-154.
122. Bailey W. Fathers' knowledge of development and involvement with preschool
children. Percept.Mot.Skills 1993; 77(3):1032-1034.
123. Blair SL, Wenk DA, Hardesty C. Marital quality and paternal involvement:
Interconnections of men's spousal and parental roles. The Journal of Men's Studies
1994; 2(3):221-237.
124. Horton S. Child nutrition and family size in the Philippines. J.Dev.Econ. 1986 9;
23(1):161-176.
125. Ruel M. The natural history of growth failure: Importance of intrauterine and
postnatal periods. Nestle Nutrition Workshop Series:Philadelphia; Lippincott-Raven;
1999; 2001.
126. Von Braun J. Urban food insecurity and malnutrition in developing countries: Trends,
policies, and research implications. Intl Food Policy Research Inst. 1993;1-47
60
127. Hussain AM, Lunven P. Urbanization and hunger in the cities. Food and Nutrition
Bulletin 1987; 9(4):50-61.
128. Smith LC, Ruel MT, Ndiaye A. Why is child malnutrition lower in urban than in rural
areas? Evidence from 36 developing countries. World Dev. 2005; 33(8):1285-1305.
129. Young Lives: An International Study of Childhood Poverty. Sampling Methods: Young
Lives Sampling Approach: Selection of Sentinel Sites and Communities in Andhra
Pradesh. 2010. Available at: http://www.younglives.org.uk /countries /india /folder
.2006 -01-24. 1901922959 /index_html/ (accessed on 25.7.2010).
130. MapsofIndia. Map of India and Andhra Pradesh. 2010; Available at: http://
www.mapsofindia.com/ (accessed on 15.6.2010).
131. Young Lives: An International Study of Childhood Poverty. Fieldworker Instruction
Handbook 2002; Available at: http: //www.younglives.org.uk /pdf/research /index-child
/fieldworker-manual.pdf (accessed on 25.7.2010).
132. Young Lives: An International Study of Childhood Poverty. Fieldworker Instruction
Handbook 2006; Available at: http: //www.younglives.org.uk/pdf/ research/
Manual%20HH%20and%20Child%20Core_Rnd2.pdf (accessed on 25.7.2010).
133. Barrera A. The role of maternal schooling and its interaction with public health
programs in child health production. J Dev Econ 1990; 32: 69-91.
134. Frost MB, Forste R, Haas DW. Maternal education and child nutritional status in
Bolivia: finding the links. Soc Sci Med 2005; 60: 395-407.
135. Internet FAQ Archives. World Directory of Minorities: Scheduled Castes of India
2010; Available at: http://www.faqs.org/minorities/South-Asia/Scheduled-Castes-of-
India.html (accessed on 20.7.2010).

61
136. Indianetzone. Indian Scheduled Tribes 2010; Available at: http:
//www.indianetzone.com /37/indian_scheduled_tribes.htm (accessed on 20.7.2010).

62