Assessment of Phosphorus-microbe Interactions in Lake Ontario by Multiple Techniques
16
J. Great Lakes Res. 32:455–470 Internat. Assoc. Great Lakes Res., 2006 Assessment of Phosphorus-microbe Interactions in Lake Ontario by Multiple Techniques Sandra P. Gouvêa 1,†, § , Christyanne Melendez 2,¶,§ , Matthew J. Carberry 3 , George S. Bullerjahn 4 , Steven W. Wilhelm 3 , Tom A. Langen 1 , and Michael R. Twiss 1,* 1 Department of Biology/Clarkson Center for the Environment Clarkson University Potsdam, New York 13699 2 Internship Program U.S. EPA Great Lakes National Program Office Chicago, Illinois 60604 3 Department of Microbiology The University of Tennessee Knoxville, Tennessee 37996 4 Department of Biological Sciences Bowling Green State University Bowling Green, Ohio 43403 ABSTRACT. Conventional and newly-developed techniques to determine the phosphorus (P) status of Lake Ontario phytoplankton were employed in September 2003, immediately after the passage of the storm system associated with Hurricane Isabel. Surface water (1–5 m) was collected at 29 stations, with selected stations sampled throughout the water column. Chemical estimates of total P concentrations were compared with proxies of P bioavailability: P enrichment bioassays of lake water, alkaline phos- phatase activity (APA), and P-dependent bioreporter assays. Average total P (314 nM) and total chloro- phyll-a (2.12 μg/L) concentrations measured in pelagic surface waters from throughout Lake Ontario suggest an oligotrophic status prevailed across much of this lake during the sample period. Autotrophic picoplankton (0.2–2 μm) displayed the highest growth rates and were grazed at the highest rate, whereas P-enrichment bioassays favored the production of autotrophic nanoplankton (2–20 μm) and autotrophic microplankton (> 20 μm) biomass. Average concentrations of bacteria (2.61 × 10 10 cells/L) were higher than those measured during summer in a similar lake (Erie), whereas the average viral density (1.38 × 10 10 virus particles/L) was similar. Pelagic stations exhibited higher APA than coastal stations; cyanobacterial bioreporter responses did not show high correlation with APA suggesting that proxies of P-demand based on residual effects (e.g., enzyme production) were not indicative of shorter-term biologi- cal responses related to planktonic growth (bioreporter genetic response). The combination of traditional chemical, biochemical (APA), and cutting-edge biological methods (bioreporter) provided information on nutrient concentrations and primary productivity throughout Lake Ontario, while concurrently allowing real-time assessment of P bioavailability. INDEX WORDS: Bacteria, bioreporter, Lake Ontario, LOLA, phosphorus, phytoplankton, viruses. * Corresponding author. E-mail: [email protected] †Current address: Laboratório de Ficologia—Departamento de Botânica, Universidade Federal de São Carlos, SP-310, Rodovia Washington Luís, São Carlos, São Paulo, 13565-905, Brazil 455 §Both authors contributed equally ¶ Current address: Department of Geology, Northern Arizona University, Flagstaff, Arizona 86011, USA
-
Upload
independent -
Category
Documents
-
view
0 -
download
0
Transcript of Assessment of Phosphorus-microbe Interactions in Lake Ontario by Multiple Techniques
J. Great Lakes Res. 32:455–470Internat. Assoc. Great Lakes Res., 2006
Assessment of Phosphorus-microbe Interactions in Lake Ontarioby Multiple Techniques
Sandra P. Gouvêa1,†, §, Christyanne Melendez2,¶,§, Matthew J. Carberry3, George S. Bullerjahn4, Steven W. Wilhelm3, Tom A. Langen1, and Michael R. Twiss1,*
1Department of Biology/Clarkson Center for the EnvironmentClarkson University
Potsdam, New York 13699
2Internship ProgramU.S. EPA Great Lakes National Program Office
Chicago, Illinois 60604
3Department of MicrobiologyThe University of TennesseeKnoxville, Tennessee 37996
4Department of Biological SciencesBowling Green State University
Bowling Green, Ohio 43403
ABSTRACT. Conventional and newly-developed techniques to determine the phosphorus (P) status ofLake Ontario phytoplankton were employed in September 2003, immediately after the passage of thestorm system associated with Hurricane Isabel. Surface water (1–5 m) was collected at 29 stations, withselected stations sampled throughout the water column. Chemical estimates of total P concentrationswere compared with proxies of P bioavailability: P enrichment bioassays of lake water, alkaline phos-phatase activity (APA), and P-dependent bioreporter assays. Average total P (314 nM) and total chloro-phyll-a (2.12 µg/L) concentrations measured in pelagic surface waters from throughout Lake Ontariosuggest an oligotrophic status prevailed across much of this lake during the sample period. Autotrophicpicoplankton (0.2–2 µm) displayed the highest growth rates and were grazed at the highest rate, whereasP-enrichment bioassays favored the production of autotrophic nanoplankton (2–20 µm) and autotrophicmicroplankton (> 20 µm) biomass. Average concentrations of bacteria (2.61 × 10¹⁰ cells/L) were higherthan those measured during summer in a similar lake (Erie), whereas the average viral density (1.38 ×10¹⁰ virus particles/L) was similar. Pelagic stations exhibited higher APA than coastal stations;cyanobacterial bioreporter responses did not show high correlation with APA suggesting that proxies ofP-demand based on residual effects (e.g., enzyme production) were not indicative of shorter-term biologi-cal responses related to planktonic growth (bioreporter genetic response). The combination of traditionalchemical, biochemical (APA), and cutting-edge biological methods (bioreporter) provided information onnutrient concentrations and primary productivity throughout Lake Ontario, while concurrently allowingreal-time assessment of P bioavailability.
INDEX WORDS: Bacteria, bioreporter, Lake Ontario, LOLA, phosphorus, phytoplankton, viruses.
*Corresponding author. E-mail: [email protected]†Current address: Laboratório de Ficologia—Departamento de Botânica,Universidade Federal de São Carlos, SP-310, Rodovia Washington Luís,São Carlos, São Paulo, 13565-905, Brazil
455
§Both authors contributed equally¶Current address: Department of Geology, Northern Arizona University,Flagstaff, Arizona 86011, USA
456 Gouvêa et al.
INTRODUCTION
While there remains some debate surrounding theissue, the availability of P is generally believed tobe a limiting nutrient in most freshwater environ-ments (Schindler 1977). Fluctuations in P concen-trations are capable of significantly altering primaryproductivity levels in lakes, while excessive con-centrations of P can lead to accelerated growth ofprimary producers in freshwater ecosystems result-ing in eutrophication (Lean and Charlton 1975).
Concentrations of phosphorus are intensivelymonitored in the Great Lakes due to their implica-tions for lake-wide productivity. In some freshwaterecosystems, eutrophication has been accelerated byexcess P loading from anthropogenic activity, pri-marily sewage treatment plant effluent and agricul-tural runoff, e.g., Lake Erie (Dolan 1993), Bay ofQuinte, Lake Ontario (Millard and Sager 1994). Re-medial action plans enacted in the U.S. and Canadaprohibit the use of P in detergents, lessening theamount of surplus P reaching the Great Lakes. Inaddition, the treatment of sewage discharge hashelped decrease further P-loading to the GreatLakes basin. Ironically, declines in P concentrationsin the Great Lakes have resulted in concerns aboutnegative impacts on fisheries due to reduced pri-mary production (Ludsin et al. 2001).
Chemical and biochemical techniques allow forthe rapid and sensitive determination of manychemicals, such as ambient P concentrations. Sev-eral classical techniques have been employed to de-tect P availability in lakes. Traditionally, the mostcommon analytical techniques have consisted ofcolorimetric reactions combined with absorbancemeasurements, a method widely used to provide in-formation on the physical fractionation of P (e.g.,total particulate and total dissolved) as well as or-thophosphate concentrations (Strickland and Par-sons 1968). A complementary biochemicaltechnique involves the use of the alkaline phos-phatase (APase; EC 3.1.3.1) enzyme assay, whichprovides insight on the P-status of the biologicalcommunity. Radiometric techniques using 33P and32P labeled orthophosphate have also been devel-oped to quantifying planktonic demand for phos-phorus (Rigler 1956) and the cycling of thisnutrient between particulate, colloidal, and dis-solved phases within the water column (Lean1973).
In response to P limiting conditions, some mi-croorganisms, including some phytoplankton, syn-thesize alkaline phosphatase (APase), an enzyme
released to hydrolyze organic P-containing mole-cules and release bioavailable P for uptake by thecell. APase is inducible under P stress. As such,APase can be assayed to assess the time-integratedoverall level of P deficiency in the environment(Smith and Kalff 1981). In this assay, the activity ofAPase depends on the hydrolysis of phosphate frommethylumbelliferyl phosphate, yielding the produc-tion of highly fluorescent methylumbelliferone,which can be monitored fluorometrically. In fact,APase activity (APA) is considered to be a good in-dicator of P deficiency in lakes (Healey andHendzel 1980, Istvanovics et al. 1992). Neverthe-less, the aforementioned techniques do not providereal-time information on P bioavailability. Conse-quently, biomolecular tools (bioreporters) havebeen developed to enable the detection of chemicalsthrough their interactions with the biologicalmaterial.
Bioreporters are genetically modified organisms(e.g., microbial cells) that function as biologicalsensors. The introduction of a “reporter gene”linked to a biological response for the chemical ofconcern, results in a quantifiable output signal suchas luminescence (Bachmann 2003). These biore-porters depend on the induction of bioluminescenceas a consequence of bacterial luciferase synthesistriggered by P-limited gene transcription (Gillor etal. 2002, Bachmann 2003). Bioreporters for P havealready been used to assess P bioavailability inmonitoring applications in Lake Kinneret (Gillor etal. 2002) and P amendment investigations in LakeErie (Wilhelm et al. 2003).
We focus here on a comparison between the clas-sical and advanced techniques used to quantify P infreshwater environments. The comparison is basedon research conducted during a limnologypracticum (19–26 September 2003) onboard theR/V Lake Guardian (cf. Twiss et al. 2005). LakeOntario was subjected to a period of high windsfrom 18–20 September 2003, as an intense stormsystem originating from Hurricane Isabel swept in-land over the lower Great Lakes region. The stormsubjected Lake Ontario to sustained winds of 65km/h and gusts to 80 km/h during 19 September (C. Fogarty, Canadian Hurricane Centre, Environ-ment Canada, unpublished data). We hypothesizedthat wind-induced phenomena may have affectedthe distribution of phytoplankton and hence P dy-namics in Lake Ontario. As we were unable to testthis possibility with a single cruise, the primary ob-jective of this research was to compare severalproxies of phytoplankton and P dynamics and relate
Phosphorus Bioavailability to Lake Ontario Phytoplankton 457
them to conditions in Lake Ontario observed duringprevious studies (Dobson et al. 1974, Mills et al.2003).
Assessment of the P concentrations in Lake On-tario was conducted using an assay to measure APAin order to examine the enzyme activity of the en-dogenous plankton community in nearshore andoffshore waters, as well as in depth profiles. Total Pand total dissolved P were measured using the tra-ditional colorimetric method. In addition, the real-time demand for P from the plankton communitywas assayed with a genetically modified cyanobac-terial “bioreporter.” Combined with a survey of bio-logical parameters (chlorophyll-a , virus andbacterial abundance) we present these results as aunique data set of lake conditions immediately aftera large-scale, basin-wide disturbance.
METHODS AND MATERIALS
Station Sampling andPhysical/Chemical Parameters
This research was conducted during a limnologypracticum (Twiss et al. 2005), which in turn washeld in conjunction with a cruise for the EPA’sLOLA project (Lake Ontario Lower Aquatic Food-web Assessment). Hence, we used the same sam-pling stations and schedule as that set by the LOLAproject.
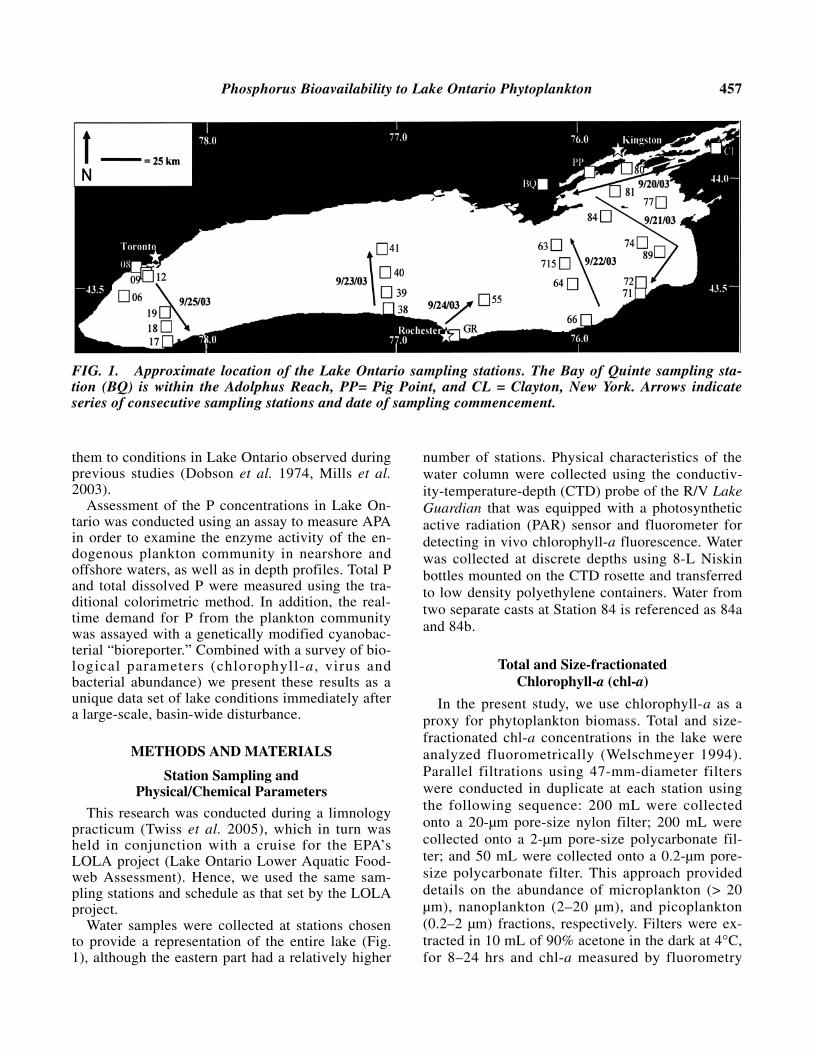
Water samples were collected at stations chosento provide a representation of the entire lake (Fig.1), although the eastern part had a relatively higher
number of stations. Physical characteristics of thewater column were collected using the conductiv-ity-temperature-depth (CTD) probe of the R/V LakeGuardian that was equipped with a photosyntheticactive radiation (PAR) sensor and fluorometer fordetecting in vivo chlorophyll-a fluorescence. Waterwas collected at discrete depths using 8-L Niskinbottles mounted on the CTD rosette and transferredto low density polyethylene containers. Water fromtwo separate casts at Station 84 is referenced as 84aand 84b.
Total and Size-fractionatedChlorophyll-a (chl-a)
In the present study, we use chlorophyll-a as aproxy for phytoplankton biomass. Total and size-fractionated chl-a concentrations in the lake wereanalyzed fluorometrically (Welschmeyer 1994).Parallel filtrations using 47-mm-diameter filterswere conducted in duplicate at each station usingthe following sequence: 200 mL were collectedonto a 20-µm pore-size nylon filter; 200 mL werecollected onto a 2-µm pore-size polycarbonate fil-ter; and 50 mL were collected onto a 0.2-µm pore-size polycarbonate filter. This approach provideddetails on the abundance of microplankton (> 20µm), nanoplankton (2–20 µm), and picoplankton(0.2–2 µm) fractions, respectively. Filters were ex-tracted in 10 mL of 90% acetone in the dark at 4°C,for 8–24 hrs and chl-a measured by fluorometry
FIG. 1. Approximate location of the Lake Ontario sampling stations. The Bay of Quinte sampling sta-tion (BQ) is within the Adolphus Reach, PP= Pig Point, and CL = Clayton, New York. Arrows indicateseries of consecutive sampling stations and date of sampling commencement.
458 Gouvêa et al.
(Welschemeyer 1994) using a calibrated fluorome-ter (Turner Designs, model TD-700).
Dilution Assays
Size-specific growth and grazing rates of phyto-plankton were estimated by diluting screened (<210 µm) lake water with lake water filtered througha 0.45-µm pore size cartridge filter (AquaPrep 600;Gelman Sciences, Ann Arbor, MI) to achieve a se-ries of six dilutions (100%, 82%, 65.6%, 52.3%,41%, and 24.6 % screened lake water) in 1.2 Lpolycarbonate bottles. Each bottle was amendedwith 10 nM potassium phosphate to account for po-tential differences in dissolved nutrients resultingfrom grazing and viral activity in the bottles. Size-fractionated chl-a concentrations (< 210 µm) weredetermined in each dilution at the beginning andafter a 24 hour period. Bottles were incubated in atemperature and light-controlled incubator set tomimic temperature at the depth of sampling. Lightlevels were 120 and 10 µmol photons/m2/s for as-says conducted on epilimnetic water and metalim-netic water, respectively. Incubator temperatureswere set to match (±1°C) that observed at the sam-pling depth at that specific station. Chl-a-specificgrowth rates (µ) were calculated in each dilution asfollows:
µ = (log [chl-a]end – log [chl-a]start)/t (1)
where [chl-a] is the estimated chl-a concentrationin a given size fraction at the beginning or end ofthe incubation period, and t the duration of the in-cubation. The intrinsic growth rate was determinedas the intercept with the ordinate of a linear leastsquares regression of specific growth rate in eachdilution versus the respective dilution factor; graz-ing rate was determined as the slope of this regres-sion (Landry and Hassett 1982).
Phosphate Enrichment Assay
Water collected at 5 m from Station 84 (Fig. 1)was divided into 1.2 L polycarbonate bottles andamended with a premixed phosphate solution (1:4,KH2PO4:K2HPO4) to generate the following treat-ments (in triplicate): 0 (Control), 50, 250, 500 nM,and an additional treatment containing 500 nMPO4-P was incubated in the dark. The bottles wereincubated onboard for 3 days in a 12:12 h daylightcycle with illumination at 650 µmol photons/m2/sand a constant temperature (19°C) (similar to con-
ditions at the depth of sampling). APA and size-fractionated chl-a were analyzed in each bottle 3days following the completion of the incubation pe-riod.
The main objective of the P enrichment assaywas to verify the effects of the increase in P con-centrations in the lake. Station 84 was selected be-cause it is located offshore, with less influence ofvariations in the P concentrations due to inland in-puts, and thus it would represent the response of theplankton community at a more representative over-all concentration of P in the lake. In addition, Sta-tion 84 was selected for the P-enrichmentexperiments based on the logistic constraints, viz.time (3 d) required for grow out of the experimentsand the coordination with a concurrent dilutionassay that was also being conducted at this station.
Phosphorus Analysis
Total phosphorus (TP) and total dissolved (< 0.2µm) phosphorus (TDP) concentrations were deter-mined using the molybdate-ascorbate-antimonyltartrate methodology (Wetzel and Likens 2000).Freshly prepared persulfate was added to wholelake water samples (for TP) or water filteredthrough a 0.2-µm pore-size filter (for TDP) to givea concentration of 0.8% ammonium persulfate, fol-lowed by a 15 minute digestion in an autoclave at121°C. Sample absorbance was measured at 885nm using 10 cm light path length cuvettes in a spec-trophotometer (Cecil Instruments Model CE 3021).The concentrations of each sample were calculatedagainst a calibration curve with a range of 0–1,000nM P.
Alkaline Phosphatase (APase)Activity (APA)
Water samples for the measurement of APA werecollected along transects including both nearshoreand offshore stations, and from depth profiles atsome stations (Table 1). At each of the stations ordiscrete depths within in a depth profile, a 4-Lwater sample was collected. When necessary, sam-ples were refrigerated (< 6 h) until ready for the en-zyme assay. The assay was conducted on cuvettesfilled with 3.125 mL solutions consisting of threereference standards (0.625 mL of 5 µM methylum-belliferone and 2.5 mL of 5 mM sodium bicarbon-ate), two negative controls (2.5 mL of 5 mMbicarbonate and 0.625 mL of 50 µM substrate), sixquench standards (2.5 mL unfiltered lake water and
Phosphorus Bioavailability to Lake Ontario Phytoplankton 459
0.625 mL of 5 µM methylumbelliferone), and threesamples (2.5 mL unfiltered lake water and 0.625mL of 50 µM substrate) in separate cuvettes. Thecuvettes were incubated at ambient lab temperaturein the dark and fluorescence was read over hourlyintervals in a fluorimeter (Turner Designs ModelTD-700) calibrated with 1, 0.5, 0.1 µM solutions ofmethylumbelliferone. Readings were carried out athourly intervals for up to 2 h after starting the assayto make sure the fluorescence readings were stabi-lized. For the last reading was that reported, APAwas normalized to the chl-a concentration to pro-vide activity as nmol/µg chl-a/h.
P-Dependent Bioreporter Assay
This assay is based on methodology of Gillor etal. (2002). The freshwater cyanobacterium, Syne-chococcus sp. PCC 7942, was previously geneti-cally modified to yield a luminescent signal whengenes specific to adaptation to P-deficiency wereactivated. This strain was engineered to contain thephoA promoter (PphoA), controlling transcription ofthe phoA gene encoding APase, fused to the genes(luxAB) encoding bacterial luciferase from Vibriofischeri. Relative measurement of P-limitation waspossible through the induction of PphoA-dependenttranscription, yielding luciferase synthesis, which inturn catalyzes the following light emitting reaction:
Acyl-CHO + O2 + FMNH2 →Acyl-COOH + H2O + FMN + hν (2)
where, Acyl-CHO = n-decyl aldehyde, FMN =flavin mononucleotide, hν = blue-green photon.
Bioreporter cells, maintained in P-replete BG-11medium (Rippka et al. 1979) identified to contain20% of its total P concentration (referenced as P-re-plete BG-11), were collected by centrifugation andwashed with P-free BG-11 medium, centrifugedonce more, and transferred to station water samples.Samples consisting of filtered Lake Ontario waterand P-replete BG-11 (negative) and P-free BG-11(positive) controls were incubated for 30–48 h atlaboratory temperature (20–23°C), while continu-ously shaken and provided with constant light(30–50 µmol photons/m2/s) provided by fluorescenttubes. Following incubation, 2 mL aliquots of thesamples and controls were exposed to the substrateAcyl-CHO in the vapor phase for 30 min. Biolumi-nescence in each treatment was detected using a lu-minometer (Zylux Model FB14). The negative andpositive controls of P status were a means to obtain
a comparison of the bioreporter response to thesesituations, and are in accordance to the method de-scribed by Gillor et al. (2002).
Bacterial and Virus Abundance
To estimate the abundance of viruses and bacte-ria, water samples (15 mL) were collected at sta-tions and preserved with 2.5% (final concentration)glutaraldehyde and stored (4ºC) until processing.Virus and bacterial particle abundance were deter-mined in samples stained with SYBR Green I(Noble and Fuhrman 1998) or Acridine Orange(Hobbie et al. 1977), respectively, prior to directenumeration by epifluorescence microscopy. Foreach sample a minimum of 200 particles or 20fields of view were observed.
RESULTS AND DISCUSSION
Total and Size-fractionated Chlorophyll-a
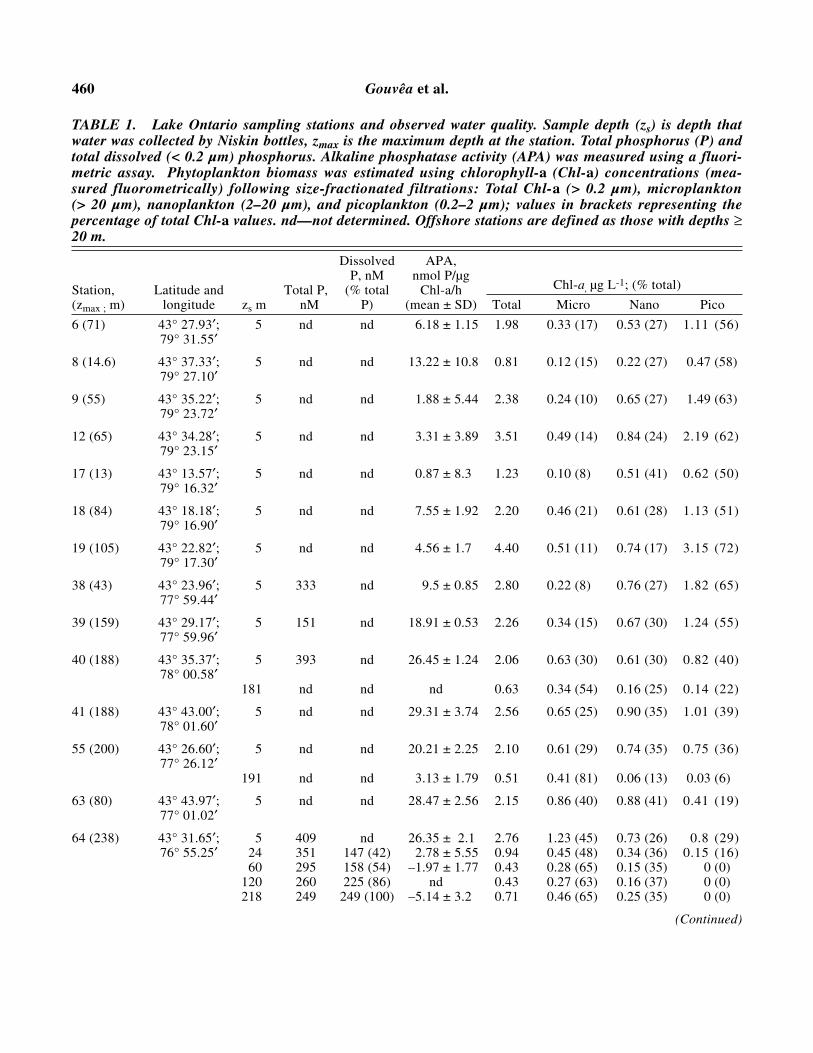
Total chl-a concentrations varied between0.81–4.40 µg/L, except the Bay of Quinte stationwhere the chl-a concentration was 11.5 µg/L (Table1). The relatively high concentration in Bay ofQuinte was probably due to the localized shallow,isolated nature of this area as well as the influenceof the Trent River discharge and local agriculturalimpacts (Millard and Sager 1994). The range ofchl-a concentrations in the remainder of the lake re-flected an oligotrophic level, which is supported bythe findings measured over 30 years ago in this lake(Dobson et al. 1974). Dobson et al. (1974) sug-gested oligotrophic-mesotrophic and mesotrophic-eutrophic limits of 4.4 and 8.8 µg/L chlorophyll-a,respectively. Lake Ontario basin-wide chl-a con-centrations during the ice-free period in 1970 hadmean values of 4.8 µg/L, although the maximumvalue reported (9.3 µg/L) reached eutrophic levels.A recent survey of Lake Ontario (Mills et al. 2003)reports the summer mean chl-a concentrations from1973 to 1994 to range from 2.8–5.3 µg/L, with anoverall declining trend. Hence, the results found forchl-a concentrations during our September 2003cruise are in accordance with the works citedabove, suggesting a shift toward oligotrophy (Millset al. 2003), except for isolated points, e.g., at Bayof Quinte. Depth profiles for Stations 64 and 89show mean total chl-a concentrations peaking at 5 m, after which concentrations decrease with in-creasing depth (Table 1).
460 Gouvêa et al.
TABLE 1. Lake Ontario sampling stations and observed water quality. Sample depth (zs) is depth thatwater was collected by Niskin bottles, zmax is the maximum depth at the station. Total phosphorus (P) andtotal dissolved (< 0.2 µm) phosphorus. Alkaline phosphatase activity (APA) was measured using a fluori-metric assay. Phytoplankton biomass was estimated using chlorophyll-a (Chl-a) concentrations (mea-sured fluorometrically) following size-fractionated filtrations: Total Chl-a (> 0.2 µm), microplankton (> 20 µm), nanoplankton (2–20 µm), and picoplankton (0.2–2 µm); values in brackets representing thepercentage of total Chl-a values. nd—not determined. Offshore stations are defined as those with depths ≥20 m.
Dissolved APA,P, nM nmol P/µg
Station, Latitude and Total P, (% total Chl-a/h Chl-a, µg L-1; (% total)
(zmax ; m) longitude zs m nM P) (mean ± SD) Total Micro Nano Pico
6 (71) 43° 27.93′; 5 nd nd 6.18 ± 1.15 1.98 0.33 (17) 0.53 (27) 1.11 (56)79° 31.55′
8 (14.6) 43° 37.33′; 5 nd nd 13.22 ± 10.8 0.81 0.12 (15) 0.22 (27) 0.47 (58)79° 27.10′
9 (55) 43° 35.22′; 5 nd nd 1.88 ± 5.44 2.38 0.24 (10) 0.65 (27) 1.49 (63)79° 23.72′
12 (65) 43° 34.28′; 5 nd nd 3.31 ± 3.89 3.51 0.49 (14) 0.84 (24) 2.19 (62)79° 23.15′
17 (13) 43° 13.57′; 5 nd nd 0.87 ± 8.3 1.23 0.10 (8) 0.51 (41) 0.62 (50)79° 16.32′
18 (84) 43° 18.18′; 5 nd nd 7.55 ± 1.92 2.20 0.46 (21) 0.61 (28) 1.13 (51)79° 16.90′
19 (105) 43° 22.82′; 5 nd nd 4.56 ± 1.7 4.40 0.51 (11) 0.74 (17) 3.15 (72)79° 17.30′
38 (43) 43° 23.96′; 5 333 nd 9.5 ± 0.85 2.80 0.22 (8) 0.76 (27) 1.82 (65)77° 59.44′
39 (159) 43° 29.17′; 5 151 nd 18.91 ± 0.53 2.26 0.34 (15) 0.67 (30) 1.24 (55)77° 59.96′
40 (188) 43° 35.37′; 5 393 nd 26.45 ± 1.24 2.06 0.63 (30) 0.61 (30) 0.82 (40)78° 00.58′
181 nd nd nd 0.63 0.34 (54) 0.16 (25) 0.14 (22)
41 (188) 43° 43.00′; 5 nd nd 29.31 ± 3.74 2.56 0.65 (25) 0.90 (35) 1.01 (39)78° 01.60′
55 (200) 43° 26.60′; 5 nd nd 20.21 ± 2.25 2.10 0.61 (29) 0.74 (35) 0.75 (36)77° 26.12′
191 nd nd 3.13 ± 1.79 0.51 0.41 (81) 0.06 (13) 0.03 (6)
63 (80) 43° 43.97′; 5 nd nd 28.47 ± 2.56 2.15 0.86 (40) 0.88 (41) 0.41 (19)77° 01.02′
64 (238) 43° 31.65′; 5 409 nd 26.35 ± 2.1 2.76 1.23 (45) 0.73 (26) 0.8 (29)76° 55.25′ 24 351 147 (42) 2.78 ± 5.55 0.94 0.45 (48) 0.34 (36) 0.15 (16)
60 295 158 (54) –1.97 ± 1.77 0.43 0.28 (65) 0.15 (35) 0 (0)120 260 225 (86) nd 0.43 0.27 (63) 0.16 (37) 0 (0)218 249 249 (100) –5.14 ± 3.2 0.71 0.46 (65) 0.25 (35) 0 (0)
(Continued)
Phosphorus Bioavailability to Lake Ontario Phytoplankton 461
TABLE 1. (Continued).
Dissolved APA,P, nM nmol P/µg
Station, Latitude and Total P, (% total Chl-a/h Chl-a, µg L-1; (% total)
(zmax ; m) longitude zs m nM P) (mean ± SD) Total Micro Nano Pico
66 (18) 43° 20.02′; 5 418 nd 9.18 ± 3.75 1.44 0.3 (21) 0.43 (30) 0.71 (49)76° 50.45′
71 (5) 43°28.68′; 5 nd nd 32.84 ± 3.4 1.73 0.38 (22) 0.54 (31) 0.81 (47)76° 31.66′
72 (94) 43° 32.05′; 5 nd nd 25.73 ± 3.7 2.03 0.73 (36) 0.57 (28) 0.73 (36)76° 31.58′
74 (68) 43° 44.85′; 5 337 70 (21) 37.58 ± 3.6 2.44 0.83 (34) 1 (41) 0.62 (25)76° 31.10′
77 (28) 43° 57.41′; 5 467 172 (37) 28.52 ± 2 1.83 0.73 (40) 0.55 (30) 0.55 (30)76° 24.49′
80 (20) 44° 08.28′; 5 182 45.3 (25) 20.83 ± 2.7 1.78 0.66 (37) 0.36 (20) 0.77 (43)76° 36.48′
81 (35) 76° 40.49′; 5 168 24.2 (14) 32.70 ± 2.5 1.52 0.57 (38) 0.51 (34) 0.44 (29)44° 01.01′
84a (36) 43° 53.15′; 5 281 27.8 (10) nd 1.95 0.56 (29) 0.67 (35) 0.71 (37)76° 43.81′
84b (second 43° 53.15′; 5 nd 38.81 ± 3.6 1.06 0.36 (34) 0.5 (47) 0.2 (19)cast; 36) 76° 43.81′
89 (82) 43° 41.90′; 1 nd nd nd 2.03 1.06 (52) 0.65 (32) 0.32 (16)76° 24.95′ 5 nd nd 19.39 ± 0.75 3.43 0.47 (14) 0.79 (23) 2.17 (63)
9 nd nd nd 2.68 1.07 (40) 0.72 (27) 0.88 (33)26 nd nd nd 1.25 0.60 (48) 0.38 (30) 0.27 (22)
715 (150) 43° 38.13′; 5 nd nd 17.05 ± 1.51 1.91 0.6 (31) 0.6 (31) 0.72 (38)76° 58.03′
Bay of 44° 03.39′;Quinte 77° 05.71′ 3 nd nd 8.64 ± 0.27 11.591 n/a n/a n/a(BQ; 10)
Clayton, 44° 14.61′; 4 nd nd 46.23 ± 2.27 1.34 0.36 (27) 0.50 (37) 0.48 (36)NY (CY; 8) 76° 05.20′
Genesee 43° 15.36′;River 77° 36.40′ 1 nd nd nd 0.99 0.15 (15) 0.71 (71) 0.14 (14)(GR; 3) 44° 07.26′;
Pig Point 76° 49.36′ 10 nd nd 20.72 ± 1.1 1.20 0.55 (46) 0.47 (39) 0.18 (15)(PP; 18) 1No size fractionation was possible due to apparent plugging of the 2-µm pore-size filter.
462 Gouvêa et al.
Phytoplankton Population Dynamics
Size-fractionated chl-a data can be used to char-acterize the primary producer community. Au-totrophic (i.e., containing chl-a) microplankton,nanoplankton, and picoplankton biomass (Table 1)varied among the stations. Picoplankton proportionswere higher in most of the stations in the westernand central region of the lake. The concentrationsof the three size classes were not constant through-out the lake. Near to shore, the majority of phyto-plankton chl-a was picoplanktonic at stationslocated at Oswego, Toronto, and Kingston; mi-croplanktonic chl-a was the majority at stations po-sitioned at Pig Point; and nanoplanktonic chl-a wasdominant at Clayton and Genesee River stations.The depth profiles for Station 64 revealed an in-crease in the percentage of microplanktonic chl-awith increasing depth, despite the overall decreasein total chl-a concentrations (perhaps due to thepresence of zooplankton fecal matter [> 20 µm]containing chl-a). In general, these results correlatewith size-fractionated phytoplankton studies ofLake Ontario conducted during 1990 to 1997 thatassociate primary production with smaller-sizednanoplankton and picoplankton, as hypothesized byMills et al. (2003). Picoplankton comprised24–58% of the total chl-a (average 41 ± 15%) at a10 m depth in Lake Ontario in late summer 2001(Twiss et al. 2003).
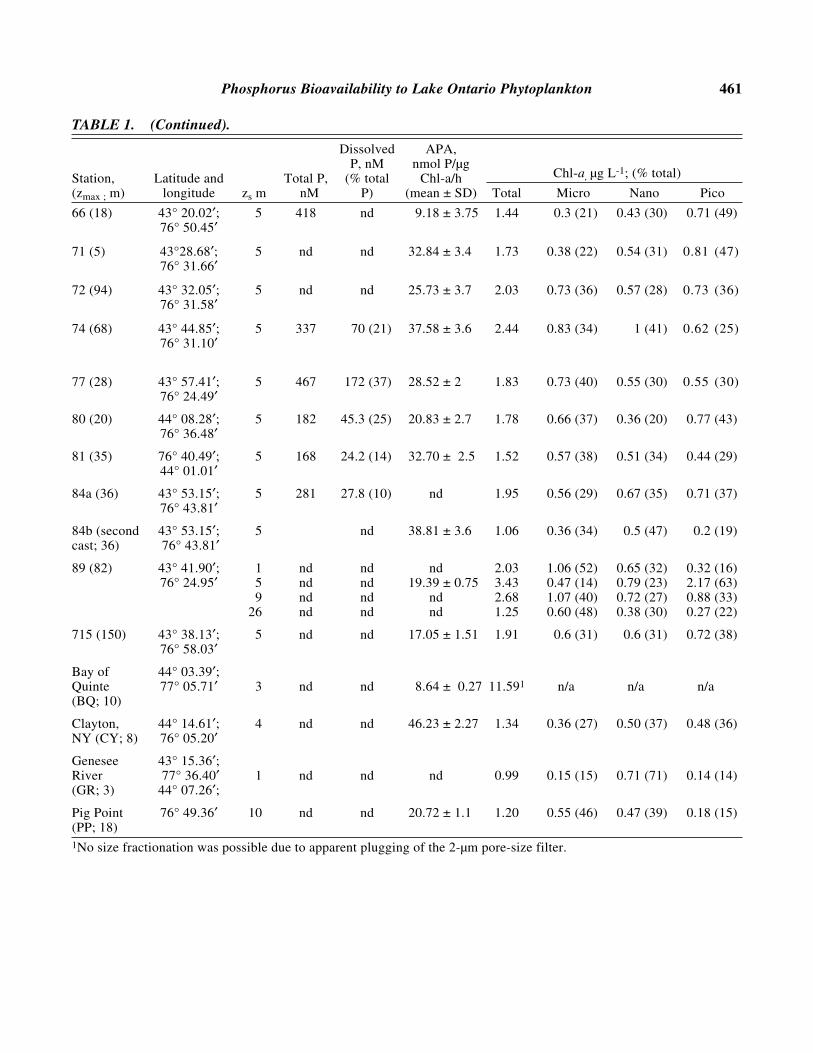
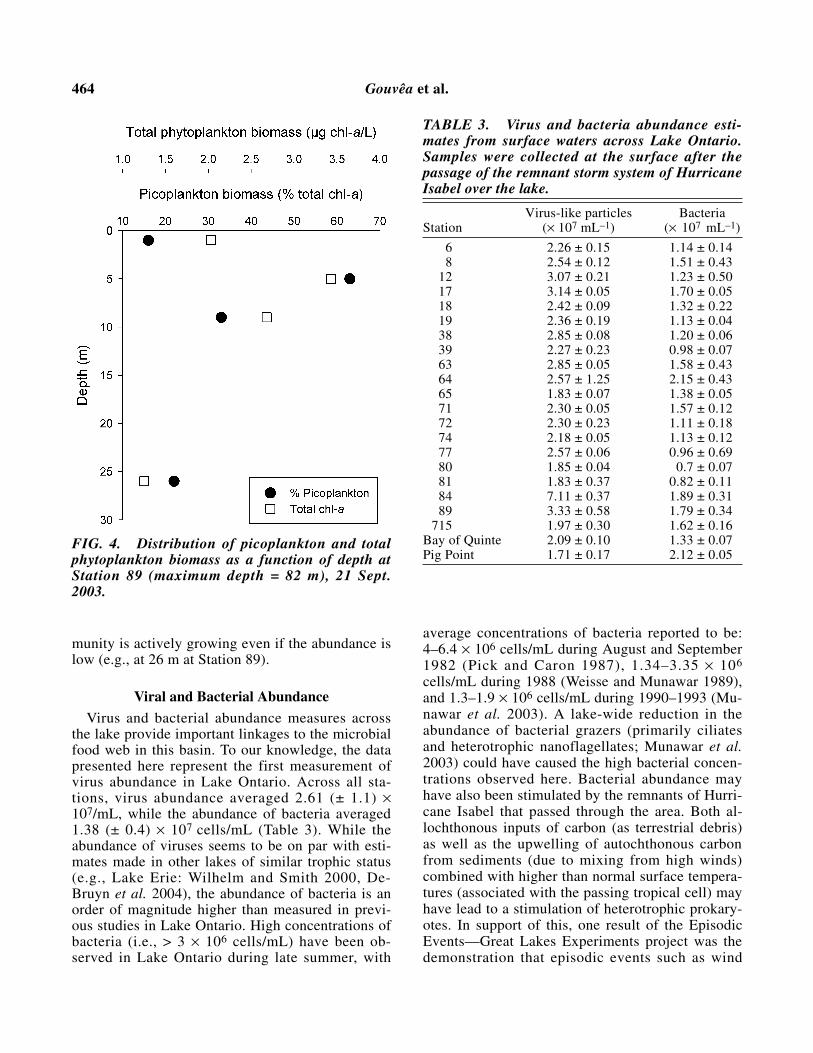
Our survey showed the synoptic phytoplanktonsize class distribution at stations across Lake On-tario over a brief time period (20–25 September,2003; Table 1). Information on the dynamics of thispopulation was determined by experiment. Themeasurement of a chl-a concentration provides in-formation on the state of the phytoplankton com-munity only in terms of the phytoplankton biomasspresent in the water. Measurements of rates ofchange in the biomass of phytoplankton communityrequire other techniques. At each of the three sta-tions examined using dilution assays (Fig. 2), thetotal phytoplankton community was subjected toboth growth and grazing influences over the oneday assay period. Picoplankton displayed the high-est rates of growth and grazing, followed by thenanoplankton, and the microplankton (Table 2). Thephytoplankton community sampled from the metal-imnion (26 m) at Station 89 had a higher biomass(as indicated by chl-a) and higher chl-a-specificgrowth rates of all plankton size classes, comparedto the phytoplankton community sampled from theepilimnion (9 m). Although the environmental
growth conditions would be considered less favor-able (colder temperature [19.6°C at 9 m vs. 6.7°C at26 m]), higher growth rates are likely due to greaterabundance of nutrients due to entrainment of nutri-ent (P) rich hypolimnetic waters (see profile of TPand TDP at Station 64; Fig. 3) that may have re-sulted from increased epilimnetic mixing followingthe 2 days of high sustained winds on Sept. 19–20.Maximum picoplankton abundance at Station 89was observed at a depth of 5 m (Fig. 4). This obser-vation is in accordance with picoplankton abun-dances made on this lake during 1982 whenpicoplankton abundance was primarily in the epil-imnion (above the 8°C) isotherm with a maximumabundance at 5 m (abundances upwards of 4.5 ×10⁸ cells/L occurring in August [Pick and Caron1987]). The dilution assays conducted here suggestthat even in late September the picoplankton com-
FIG. 2. Growth and grazing rates of phytoplank-ton from Lake Ontario stations as determined by adilution assay. Intrinsic growth rates are values atinfinite dilution (ordinate intercept) and grazingrates are the slopes of linear least squares regres-sions (see Table 2 for size-fractionated phyto-plankton population dynamics derived from theseassays). Symbols: ●● (Station 89, 9 m), ●● (Station89, 26 m), ▼▼ (Station 84, 5 m), ▼▼ (Station 55, 10 m).
Phosphorus Bioavailability to Lake Ontario Phytoplankton 463
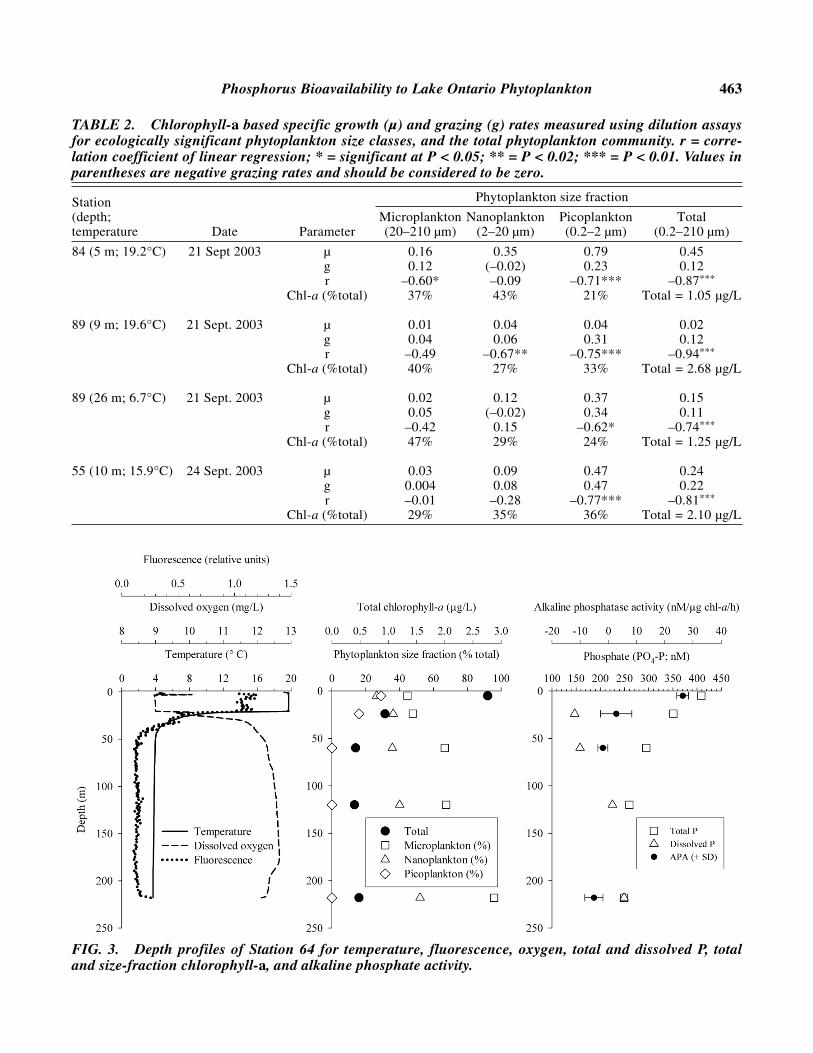
TABLE 2. Chlorophyll-a based specific growth (µ) and grazing (g) rates measured using dilution assaysfor ecologically significant phytoplankton size classes, and the total phytoplankton community. r = corre-lation coefficient of linear regression; * = significant at P < 0.05; ** = P < 0.02; *** = P < 0.01. Values inparentheses are negative grazing rates and should be considered to be zero.
Station Phytoplankton size fraction
(depth; Microplankton Nanoplankton Picoplankton Totaltemperature Date Parameter (20–210 µm) (2–20 µm) (0.2–2 µm) (0.2–210 µm)
84 (5 m; 19.2°C) 21 Sept 2003 µ 0.16 0.35 0.79 0.45g 0.12 (–0.02) 0.23 0.12r –0.60* –0.09 –0.71*** –0.87***
Chl-a (%total) 37% 43% 21% Total = 1.05 µg/L
89 (9 m; 19.6°C) 21 Sept. 2003 µ 0.01 0.04 0.04 0.02g 0.04 0.06 0.31 0.12r –0.49 –0.67** –0.75*** –0.94***
Chl-a (%total) 40% 27% 33% Total = 2.68 µg/L
89 (26 m; 6.7°C) 21 Sept. 2003 µ 0.02 0.12 0.37 0.15g 0.05 (–0.02) 0.34 0.11r –0.42 0.15 –0.62* –0.74***
Chl-a (%total) 47% 29% 24% Total = 1.25 µg/L
55 (10 m; 15.9°C) 24 Sept. 2003 µ 0.03 0.09 0.47 0.24g 0.004 0.08 0.47 0.22r –0.01 –0.28 –0.77*** –0.81***
Chl-a (%total) 29% 35% 36% Total = 2.10 µg/L
FIG. 3. Depth profiles of Station 64 for temperature, fluorescence, oxygen, total and dissolved P, totaland size-fraction chlorophyll-a, and alkaline phosphate activity.
464 Gouvêa et al.
munity is actively growing even if the abundance islow (e.g., at 26 m at Station 89).
Viral and Bacterial Abundance
Virus and bacterial abundance measures acrossthe lake provide important linkages to the microbialfood web in this basin. To our knowledge, the datapresented here represent the first measurement ofvirus abundance in Lake Ontario. Across all sta-tions, virus abundance averaged 2.61 (± 1.1) ×107/mL, while the abundance of bacteria averaged1.38 (± 0.4) × 107 cells/mL (Table 3). While theabundance of viruses seems to be on par with esti-mates made in other lakes of similar trophic status(e.g., Lake Erie: Wilhelm and Smith 2000, De-Bruyn et al. 2004), the abundance of bacteria is anorder of magnitude higher than measured in previ-ous studies in Lake Ontario. High concentrations ofbacteria (i.e., > 3 × 10⁶ cells/mL) have been ob-served in Lake Ontario during late summer, with
average concentrations of bacteria reported to be:4–6.4 × 10⁶ cells/mL during August and September1982 (Pick and Caron 1987), 1.34–3.35 × 10⁶
cells/mL during 1988 (Weisse and Munawar 1989),and 1.3–1.9 × 10⁶ cells/mL during 1990–1993 (Mu-nawar et al. 2003). A lake-wide reduction in theabundance of bacterial grazers (primarily ciliatesand heterotrophic nanoflagellates; Munawar et al.2003) could have caused the high bacterial concen-trations observed here. Bacterial abundance mayhave also been stimulated by the remnants of Hurri-cane Isabel that passed through the area. Both al-lochthonous inputs of carbon (as terrestrial debris)as well as the upwelling of autochthonous carbonfrom sediments (due to mixing from high winds)combined with higher than normal surface tempera-tures (associated with the passing tropical cell) mayhave lead to a stimulation of heterotrophic prokary-otes. In support of this, one result of the EpisodicEvents—Great Lakes Experiments project was thedemonstration that episodic events such as wind
TABLE 3. Virus and bacteria abundance esti-mates from surface waters across Lake Ontario.Samples were collected at the surface after thepassage of the remnant storm system of HurricaneIsabel over the lake.
Virus-like particles BacteriaStation (× 107 mL–1) (× 107 mL–1)
6 2.26 ± 0.15 1.14 ± 0.148 2.54 ± 0.12 1.51 ± 0.43
12 3.07 ± 0.21 1.23 ± 0.5017 3.14 ± 0.05 1.70 ± 0.0518 2.42 ± 0.09 1.32 ± 0.2219 2.36 ± 0.19 1.13 ± 0.0438 2.85 ± 0.08 1.20 ± 0.0639 2.27 ± 0.23 0.98 ± 0.0763 2.85 ± 0.05 1.58 ± 0.4364 2.57 ± 1.25 2.15 ± 0.4365 1.83 ± 0.07 1.38 ± 0.0571 2.30 ± 0.05 1.57 ± 0.1272 2.30 ± 0.23 1.11 ± 0.1874 2.18 ± 0.05 1.13 ± 0.1277 2.57 ± 0.06 0.96 ± 0.6980 1.85 ± 0.04 0.7 ± 0.0781 1.83 ± 0.37 0.82 ± 0.1184 7.11 ± 0.37 1.89 ± 0.3189 3.33 ± 0.58 1.79 ± 0.34
715 1.97 ± 0.30 1.62 ± 0.16Bay of Quinte 2.09 ± 0.10 1.33 ± 0.07Pig Point 1.71 ± 0.17 2.12 ± 0.05
FIG. 4. Distribution of picoplankton and totalphytoplankton biomass as a function of depth atStation 89 (maximum depth = 82 m), 21 Sept.2003.
Phosphorus Bioavailability to Lake Ontario Phytoplankton 465
driven sediment suspension plumes are able tostrongly support secondary heterotrophic produc-tion in Lake Michigan (Chen et al. 2004).
Like earlier studies in Lake Ontario (Munawar etal. 2003), we observed no off-shore near-shoretrend in bacterial abundance. Although speculative,it is highly likely that an increased load of materialsfrom the littoral zone sediment (suspended due tothe high winds experienced during the passage ofthe intense storm system combined with inflows ofsurface runoff due to precipitation) resulted in astrong pulse of dissolved organic matter (DOM)into the water of Lake Ontario. Given that plank-tonic heterotrophic bacteria are typically limited byDOM in large lake systems (DeBruyn et al. 2004),one can hypothesize that bacterial abundance mayhave increased significantly due to a relaxation ofthis growth constraint. If this was indeed what hap-pened then enhanced DOM loading/resuspensionwould also provide increased P-loads, thereby stim-ulating primary production that in itself is tightlycoupled to bacterial activity (Hwang and Heath1997). The results suggest that disturbances in asystem like Lake Ontario may lead directly toshort-term burst in the productivity of heterotrophicprokaryotes.
Phosphate Enrichment Assay
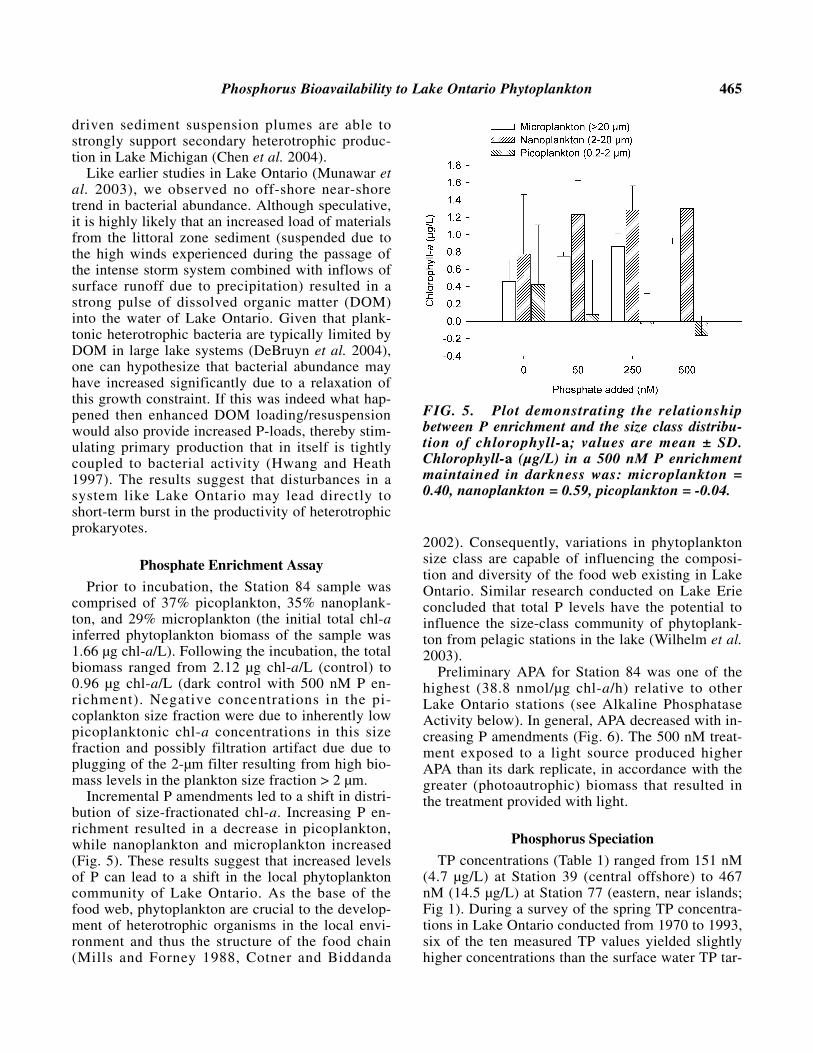
Prior to incubation, the Station 84 sample wascomprised of 37% picoplankton, 35% nanoplank-ton, and 29% microplankton (the initial total chl-ainferred phytoplankton biomass of the sample was1.66 µg chl-a/L). Following the incubation, the totalbiomass ranged from 2.12 µg chl-a/L (control) to0.96 µg chl-a/L (dark control with 500 nM P en-richment). Negative concentrations in the pi-coplankton size fraction were due to inherently lowpicoplanktonic chl-a concentrations in this sizefraction and possibly filtration artifact due due toplugging of the 2-µm filter resulting from high bio-mass levels in the plankton size fraction > 2 µm.
Incremental P amendments led to a shift in distri-bution of size-fractionated chl-a. Increasing P en-richment resulted in a decrease in picoplankton,while nanoplankton and microplankton increased(Fig. 5). These results suggest that increased levelsof P can lead to a shift in the local phytoplanktoncommunity of Lake Ontario. As the base of thefood web, phytoplankton are crucial to the develop-ment of heterotrophic organisms in the local envi-ronment and thus the structure of the food chain(Mills and Forney 1988, Cotner and Biddanda
2002). Consequently, variations in phytoplanktonsize class are capable of influencing the composi-tion and diversity of the food web existing in LakeOntario. Similar research conducted on Lake Erieconcluded that total P levels have the potential toinfluence the size-class community of phytoplank-ton from pelagic stations in the lake (Wilhelm et al.2003).
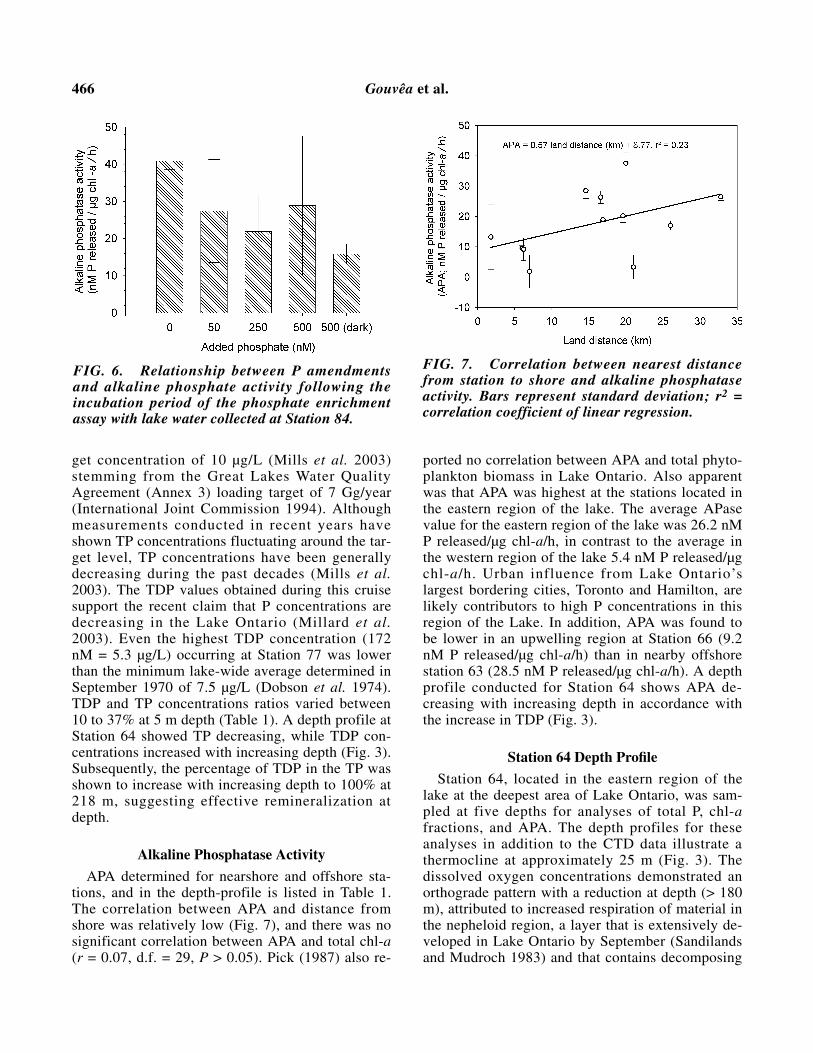
Preliminary APA for Station 84 was one of thehighest (38.8 nmol/µg chl-a/h) relative to otherLake Ontario stations (see Alkaline PhosphataseActivity below). In general, APA decreased with in-creasing P amendments (Fig. 6). The 500 nM treat-ment exposed to a light source produced higherAPA than its dark replicate, in accordance with thegreater (photoautrophic) biomass that resulted inthe treatment provided with light.
Phosphorus Speciation
TP concentrations (Table 1) ranged from 151 nM(4.7 µg/L) at Station 39 (central offshore) to 467nM (14.5 µg/L) at Station 77 (eastern, near islands;Fig 1). During a survey of the spring TP concentra-tions in Lake Ontario conducted from 1970 to 1993,six of the ten measured TP values yielded slightlyhigher concentrations than the surface water TP tar-
FIG. 5. Plot demonstrating the relationshipbetween P enrichment and the size class distribu-tion of chlorophyll-a; values are mean ± SD.Chlorophyll-a (µg/L) in a 500 nM P enrichmentmaintained in darkness was: microplankton =0.40, nanoplankton = 0.59, picoplankton = -0.04.
466 Gouvêa et al.
get concentration of 10 µg/L (Mills et al. 2003)stemming from the Great Lakes Water QualityAgreement (Annex 3) loading target of 7 Gg/year(International Joint Commission 1994). Althoughmeasurements conducted in recent years haveshown TP concentrations fluctuating around the tar-get level, TP concentrations have been generallydecreasing during the past decades (Mills et al.2003). The TDP values obtained during this cruisesupport the recent claim that P concentrations aredecreasing in the Lake Ontario (Millard et al.2003). Even the highest TDP concentration (172nM = 5.3 µg/L) occurring at Station 77 was lowerthan the minimum lake-wide average determined inSeptember 1970 of 7.5 µg/L (Dobson et al. 1974).TDP and TP concentrations ratios varied between10 to 37% at 5 m depth (Table 1). A depth profile atStation 64 showed TP decreasing, while TDP con-centrations increased with increasing depth (Fig. 3).Subsequently, the percentage of TDP in the TP wasshown to increase with increasing depth to 100% at218 m, suggesting effective remineralization atdepth.
Alkaline Phosphatase Activity
APA determined for nearshore and offshore sta-tions, and in the depth-profile is listed in Table 1.The correlation between APA and distance fromshore was relatively low (Fig. 7), and there was nosignificant correlation between APA and total chl-a(r = 0.07, d.f. = 29, P > 0.05). Pick (1987) also re-
ported no correlation between APA and total phyto-plankton biomass in Lake Ontario. Also apparentwas that APA was highest at the stations located inthe eastern region of the lake. The average APasevalue for the eastern region of the lake was 26.2 nMP released/µg chl-a/h, in contrast to the average inthe western region of the lake 5.4 nM P released/µgchl-a/h. Urban influence from Lake Ontario’slargest bordering cities, Toronto and Hamilton, arelikely contributors to high P concentrations in thisregion of the Lake. In addition, APA was found tobe lower in an upwelling region at Station 66 (9.2nM P released/µg chl-a/h) than in nearby offshorestation 63 (28.5 nM P released/µg chl-a/h). A depthprofile conducted for Station 64 shows APA de-creasing with increasing depth in accordance withthe increase in TDP (Fig. 3).
Station 64 Depth Profile
Station 64, located in the eastern region of thelake at the deepest area of Lake Ontario, was sam-pled at five depths for analyses of total P, chl-afractions, and APA. The depth profiles for theseanalyses in addition to the CTD data illustrate athermocline at approximately 25 m (Fig. 3). Thedissolved oxygen concentrations demonstrated anorthograde pattern with a reduction at depth (> 180m), attributed to increased respiration of material inthe nepheloid region, a layer that is extensively de-veloped in Lake Ontario by September (Sandilandsand Mudroch 1983) and that contains decomposing
FIG. 7. Correlation between nearest distancefrom station to shore and alkaline phosphataseactivity. Bars represent standard deviation; r2 =correlation coefficient of linear regression.
FIG. 6. Relationship between P amendmentsand alkaline phosphate activity following theincubation period of the phosphate enrichmentassay with lake water collected at Station 84.
Phosphorus Bioavailability to Lake Ontario Phytoplankton 467
organic matter primarily derived from the epil-imnion (Mudroch and Mudroch 1992). A metalim-netic fluorescence peak was observed above thethermocline (Fig. 3). Total chl-a, TP, and APA de-creased while TDP increased with increasing depth.As noted above, microplankton represented thehighest percentage of chl-a, which increased withincreasing depth, with picoplankton and nanoplank-ton concentrations declining with depth. Thus, Sta-tion 64 exemplifies a typical stratified oligotrophicwater column found during summer and early fall,with greater primary productivity and higher tem-peratures in the epilimnion, contrasting with thehigher concentration of dissolved nutrients, andoxygen, in the hypolimnion. TP is shown to de-crease with increasing depth since much of its bulkmass is believed to be comprised of living biomassor particulate matter derived from the epilimnion(Mudroch and Mudroch 1992), while the increasein TDP is attributed to the decreasing plankton de-mand with increasing depth. Sandilands andMudroch (1983) report increasing soluble reactivephosphorus with depth in Lake Ontario, an observa-tion consistent with the reduced APA activity ob-served here and in similar observations made in1982 (Pick 1987).
Bioreporter Assays
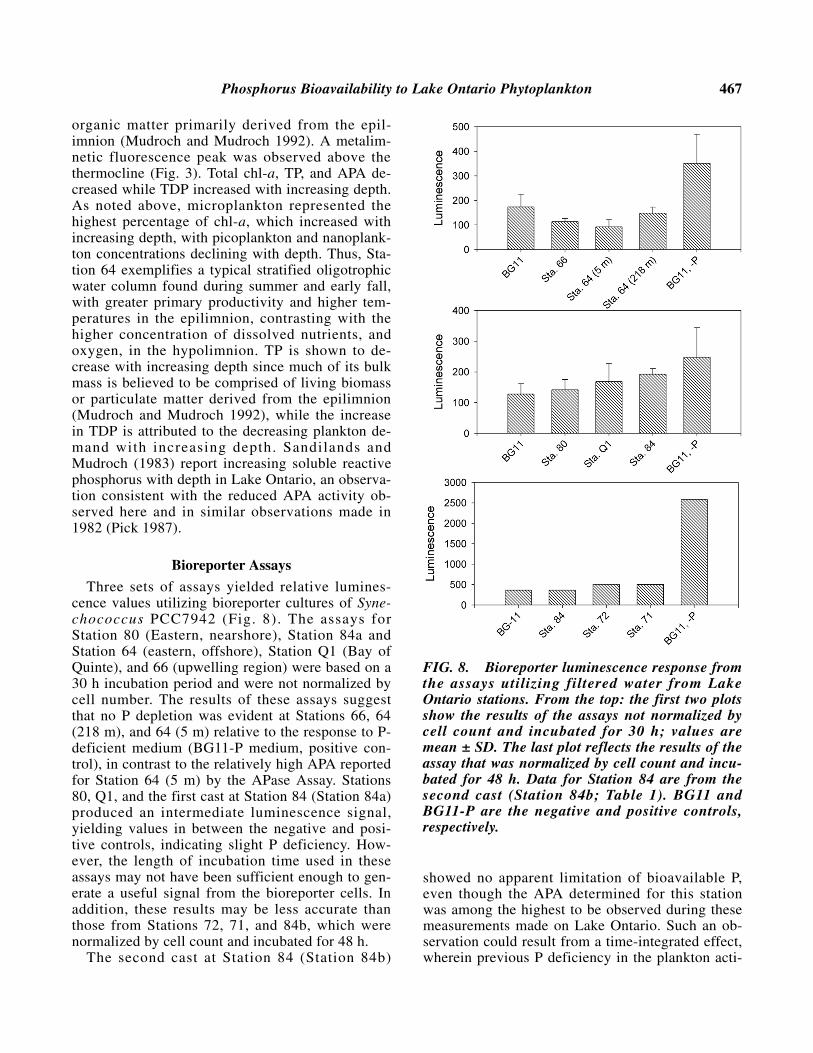
Three sets of assays yielded relative lumines-cence values utilizing bioreporter cultures of Syne-chococcus PCC7942 (Fig. 8). The assays forStation 80 (Eastern, nearshore), Station 84a andStation 64 (eastern, offshore), Station Q1 (Bay ofQuinte), and 66 (upwelling region) were based on a30 h incubation period and were not normalized bycell number. The results of these assays suggest that no P depletion was evident at Stations 66, 64(218 m), and 64 (5 m) relative to the response to P-deficient medium (BG11-P medium, positive con-trol), in contrast to the relatively high APA reportedfor Station 64 (5 m) by the APase Assay. Stations80, Q1, and the first cast at Station 84 (Station 84a)produced an intermediate luminescence signal,yielding values in between the negative and posi-tive controls, indicating slight P deficiency. How-ever, the length of incubation time used in theseassays may not have been sufficient enough to gen-erate a useful signal from the bioreporter cells. Inaddition, these results may be less accurate thanthose from Stations 72, 71, and 84b, which werenormalized by cell count and incubated for 48 h.
The second cast at Station 84 (Station 84b)
showed no apparent limitation of bioavailable P,even though the APA determined for this stationwas among the highest to be observed during thesemeasurements made on Lake Ontario. Such an ob-servation could result from a time-integrated effect,wherein previous P deficiency in the plankton acti-
FIG. 8. Bioreporter luminescence response fromthe assays utilizing filtered water from LakeOntario stations. From the top: the first two plotsshow the results of the assays not normalized bycell count and incubated for 30 h; values aremean ± SD. The last plot reflects the results of theassay that was normalized by cell count and incu-bated for 48 h. Data for Station 84 are from thesecond cast (Station 84b; Table 1). BG11 andBG11-P are the negative and positive controls,respectively.
468 Gouvêa et al.
vated APase and further extracellular release of thisenzyme. Thus, APA could be detecting persistentAPase, while the bioreporter is responding to thelevel of bioavailable P at the moment of the assay.Stations 71 and 72 reflected some P limitation,which correlates with the higher APase valuesfound in the eastern region using the APA assay,despite their proximity to shore and an expectedsurplus of available phosphorus.
CONCLUSIONS
The Comparison of Chemical, Community,Biochemical, and Bioreporter Measures
Chemical measures yielded specific values of Pconcentrations, while P bioavailability was deter-mined at by biological response levels. Total P andchl-a concentrations can be used to infer trophicstatus, yet these metrics do not provide informationon the amount of bioavailable P or the level of P-deficiency existing in the microbial community.Size-fractionated chl-a standing crop and bacterialand virus densities indicated that the majority ofstations sampled had high proportions of picoplank-ton, an indicator of oligotrophic systems where themicrobial food web is a major component of theplanktonic food web (Cotner and Biddanda 2002).Dilution assays demonstrated that high rates ofgrazing and growth rates occur in the smaller au-totrophic size fractions (picoplankton, nanoplank-ton). The P enrichment assays demonstrated acommunity response to increased P levels, suggest-ing that increased P loading to Lake Ontario wouldresult in a shift from the microbial food web tomore mesozooplankton-based grazers as larger phy-toplankton arose from the P enrichments.
There was not a strong correlation observed be-tween the APA assay and bioreporter assays; thisdifference is attributed to the detection capabilitiesof the two assays. APA can be detected after P-deficiency has been resolved, since the residual en-zyme can remain in solution and contribute to thesignal of P demand. In addition, although both theAPA and bioreporter assays are indicators of P sta-tus, they are distinctly different measures. Thebioreporter assays the response of a singlecyanobacteria species that serves as a proxy,whereas measurement of APA involves the entireautotrophic and heterotrophic microbial planktoncommunity. While traditional chemical (TP, chl-a),bioassays (P enrichment), and biochemical (APA)methods provide information on the status of P inthe lake and a predicted response of microorgan-
isms, use of the bioreporter assay provides a real-time output of P bioavailability, albeit that ex-pressed by a single species, the picoplanktoniccyanobacterium Synechococcus.
In summary, phytoplankton biomass (chl-a) wasprimarily found in the picoplankton (0.2–2 µm) andnanoplankton (2–20 µm) size-fractions. The chloro-phyll-a concentrations presented in this work are inaccordance to the oligotrophic status accorded toLake Ontario. Viral abundance compares well withestimates presented for Lake Erie, although bacter-ial abundance was 10 times higher than in similarsystems. Phosphorus enrichments can lead to a po-tential shift in the local phytoplankton community.Combining chemical, biochemical, and biologicaltechniques provided improved information on P sta-tus and bioavailability.
ACKNOWLEDGMENTS
This study was supported by a ship time grantfrom the United States Environmental ProtectionAgency Great Lakes National Program Office (U.S. EPA GLNPO) to M.R.T., T.A.L., R.M.L.McKay (Bowling Green State University), S.W.W.,and T.C. Young (Clarkson University). S.P.G. waspartially supported by Fundação de Amparo àPesquisa do Estado de São Paulo, Brazil, contract00/03122-0. C.M. was supported in part by an in-ternship program at the U.S. EPA GLNPO adminis-tered by the Environmental Careers Organizationand the Oak Ridge Institute for Science and Educa-tion. We acknowledge B. Hess, D.A. Rockwell, andother members of LOLIPOP (Lake Ontario Limnol-ogy Practicum Opportunity: Sonia Johns, CatherineMasson, Tina Parshley, and Edward Stachowiak V)for their attention to contributions made in the col-lection of this data set. This is Contribution No. 271of the Clarkson Center for the Environment.
REFERENCESBachmann, T. 2003. Transforming cyanobacteria into
bioreporters of biological relevance. Trends Biotech-nol. 21:247–249.
Chen, C., Wang, L., Ji, R., Budd, J.W., Schwab, D.J.,Beletsky, D., Fahnenstiel, G.L., Vanderploeg, H.,Eadie, B., and Cotner, J. 2004. Impacts of suspendedsediment on the ecosystem in Lake Michigan: A comparison between the 1998 and 1999 plume events.J. Geophys. Res. 109: C10S05, doi:10.1029/2002JC001687.
Cotner, J.B., and Biddanda, B.A. 2002. Small players,large role: microbial influence on biogeochemical
Phosphorus Bioavailability to Lake Ontario Phytoplankton 469
processes in pelagic aquatic ecosystems. Ecosystems5:105–121.
DeBruyn, J.M., Leigh-Bell, J.A., McKay, R.M.L., Bour-bonniere, R.A., and Wilhelm, S.W. 2004. Microbialdistributions and the impact of phosphorus on bacter-ial activity in Lake Erie. J. Great Lake Res.30:166–183.
Dobson, H.F.H., Gilbertson, M., and Sly, P.G. 1974. Asummary and comparison of nutrients and relatedwater quality in Lakes Erie, Ontario, Huron and Supe-rior. J. Fish. Res. Board Can. 31:731–738.
Dolan, D.M. 1993. Point source loading of phosphorusto Lake Erie: 1986–1990. J. Great Lake Res .19:212–223.
Gillor, O., Hudas, O., Post, A.F., and Belkin, S. 2002.Phosphorus bioavailability monitoring by a biolumi-nescent cyanobacterial sensor strain. J. Phycol.38:107–115.
Healey, F.P., and Hendzel L.L. 1980. Physiological indi-cators of nutrient deficiency in lake phytoplankton.Can J. Fish. Aquat. Sci. 37:442–453.
Hobbie, J.E., Daley, R.J., and Jasper, S. 1977. Use ofNuclepore filters for counting bacteria by fluores-cence microscopy. Appl. Environ. Microbiol.33:1225–1228.
Hwang, S.-J., and Heath, R. 1997. Bacterial productivityand protistan bacterivory in coastal and offshore com-munities of Lake Erie. Can. J. Fish. Aquat. Sci.54:788–799.
International Joint Commission. 1994. Great LakesWater Quality Agreement of 1978 (revised, reprinted1994). International Joint Commission, Ottawa,Ontario, and Washington, D. C.
Istvanovics, V., Pettersson, K., Pierson, D., and Bell, R.1992. Evaluation of phosphorus deficiency indicatorsfor summer phytoplankton in Lake Erken. Limnol.Oceanogr. 37:890–900.
Landry, M.R., and Hassett, R.P. 1982. Estimating thegrazing impact of micro-zooplankton. Mar. Biol.67:283–288.
Lean, D.R.S. 1973. Phosphorus dynamics in lake waters.Science 179:678–680.
———, and Charlton, M.N. 1975. A study of phosphoruskinetics in a lake ecosystem. Environ. Biogeochem.1:283–293.
Ludsin, S.A., Kershner, M.W., Blockson, K.A., Knight,R.L., and Stein, R.A. 2001. Life after death in LakeErie: nutrient controls drive fish species richness,rehabilitation. Ecol. Applic. 11:731–746.
Millard, E.S., and Sager, P.E. 1994.Comparison of phos-phorus, light climate, and photosynthesis between 2culturally eutrophied bays—Green Bay, Lake-Michi-gan, and the Bay of Quinte, Lake-Ontario. Can. J.Fish. Aquat. Sci. 51:2579–2590.
———, Johannsson, O.E., Neilson, M.A., and El-Shaarawi, A.H. 2003. Long-term, seasonal and spatialtrends in nutrients, chlorophyll a and light attenuation
in Lake Ontario. In State of Lake Ontario: Past, Pre-sent and Future, ed. M. Munawar, pp. 97–132. Ecovi-sion World Monograph Series. The Netherlands:Backhuys Publishers.
Mills, E.L., and Forney, J.L. 1988. Trophic dynamicsand development of freshwater pelagic food webs. InComplex interactions in lake communities, ed. S.R.Carpenter, pp. 11–30. New York: Springer-Verlag.
———, Casselman, J.M., Dermott, R., Fitzsimons, J.D.,Gal, G., Holeck, K.T.,Hoyle, J.A., Johannsson, O.E.,Lantry, B.F., Makarewicz, J.C., Millard, E.S.,Munawar, I.F., Munawar, M., O’Gorman, R., Owens,R.W., Rudstam, L.G., Schaner, T., and Stewart, T.J.2003. Lake Ontario: food web dynamics in a changingecosystem (1970–2000). Can. J. Fish. Aquat. Sci.60:471–490.
Mudroch, A., and Mudroch, P. 1992. Geochemical com-position of the nepheloid layer in Lake Ontario. J.Great Lakes Res. 18:132–153.
Munawar, M., Legner, M., and Munawar, I.F. 2003.Assessing the microbial food web of Lake Ontario. InState of Lake Ontario: Past, Present and Future, ed.M. Munawar, pp. 135–170. Ecovision World Mono-graph Series. The Netherlands: Backhuys Publishers.
Noble, R.T., and Fuhrman, J.A. 1998. Use of SYBRGreen I for rapid epifluorescence counts of marineviruses and bacteria. Aquat. Microb. Ecol.14:113–118.
Pick, F.R. 1987. Interpretation of alkaline phosphataseactivity in Lake Ontario. Can J. Fish. Aquat. Sci.44:2087–2094.
———, and Caron, D.A. 1987. Picoplankton andnanoplankton biomass in Lake Ontario: Relative con-tribution to phototrophic and heterotrophic communi-ties. Can. J. Fish. Aquat. Sci. 44:2164–2172.
Rigler, F.H. 1956. A tracer study of the phosphorus cyclein lake water. Ecology 37:550–562.
Rippka, R., Deruelles, J., Waterbury, J.B., Herdman, M.,and Stanier, R.Y. 1979. Genetic assignments, strainhistories, and properties of pure cultures of cyanobac-teria. J. Gen. Microbiol. 111:1–61.
Sandilands, R.G., and Mudroch, A. 1983. Nepheloidlayer in Lake Ontario. J. Great Lakes Res. 9:190–200.
Schindler, D.W. 1977. Evaluation of phosphorus limita-tion in lakes. Science 195:260–262.
Smith, R.E.H., and J. Kalff. 1981. The effect of phospho-rus limitation on algal growth rates: evidence fromalkaline phosphatase. Can. J. Fish. Aquat. Sci.38:1421–1427.
Strickland, J.D.H., and Parsons, T.R. 1968. A practicalhandbook of seawater analysis. Bull. Fish. Res. Bd.Can. 167:1–311.
Twiss, M.R., Twining, B.S., and Fisher, N.F. 2003. Par-titioning of dissolved thallium in seston in lakes Erieand Ontario. Can. J. Fish. Aquat. Sci. 60:1369–1375.
———, Langen, T.A., Bullerjahn, G.S., Wilhelm, S.W.,
470 Gouvêa et al.
and Rockwell, D.C. 2005. The Lake Ontario GreatLakes Science Practicum: A model for training lim-nology students on how to conduct shipboard researchin the Great Lakes. J. Great Lakes Res. 31:236–242.
Weisse, T., and Munawar, M. 1989. Evaluation of themicrobial loop in North American Great Lakes. Can.Tech. Rep. Fish. Aquat. Sci. 1709. pp. i–v, 1–30.
Welschemeyer, N.A. 1994. Fluorometric analysis ofchlorophyll a in the presence of chlorophyll b andphaeopigments. Limnol. Oceanogr. 39:1985–1992.
Wetzel, R.G., and Likens, G.E. 2000. LimnologicalAnalyses. Third Edition. New York: Springer-Verlag.
Wilhelm, S.W., and Smith, R.E.H. 2000. Bacterial car-
bon production in Lake Erie is influenced by virusesand solar radiation. Can. J. Fish. Aquat. Sci .57:317–326.
———, DeBruyn, J.M., Gillor, O., Twiss, M.R., Liv-ingston, K., Bourbonniere, R.A., Pickell, L.D., Trick,C.G., Dean, A.L., and McKay, R.M.L. 2003. Theeffect of phosphorus amendments on present dayplankton communities in pelagic Lake Erie. Aquat.Microb. Ecol. 32:275–285.
Submitted: 19 October 2004Accepted: 11 April 2006Editorial handling: Joseph C. Makarewicz