Application of composite textile at Fakhruddin Textile Mills ...
Upload
independentCategory
view
3download
0
Available online at www.sciencedirect.com
Journal of Cleaner Production 16 (2008) 1081e1089www.elsevier.com/locate/jclepro
Assessment of fieldscale zero liquid discharge treatment systems forrecovery of water and salt from textile effluents
G. Vishnu a,*, S. Palanisamy b, Kurian Joseph a
a Centre for Environmental Studies, College of Engineering, Anna University, Guindy, Chennai 600 025, Tamil Nadu, Indiab Tamil Nadu Pollution Control Board, Chennai, India
Received 16 September 2006; received in revised form 3 March 2007; accepted 1 June 2007
Available online 5 September 2007
Abstract
Treatment systems consisting of physico-chemical treatment, biological treatment, ozonation, reverse osmosis system, nanofiltration system,multiple effect evaporator, crystalliser and solar evaporation pans set up by three dyeing units in Tirupur, India, were assessed in the presentstudy. The composite samples were analysed for colour, pH, TSS, TDS, chlorides, sulphates, COD, total iron, silica, SDI, LSI and total hardness.The results indicated that the physico-chemical treatment alone is inadequate to achieve the feed water quality norms for spiral wound RO mem-branes. It is recommended that the primary treatment may incorporate biological treatment and ultrafiltration to reduce COD and SDI in the feedwater. Water recovery by reverse osmosis and salt recovery using nanofilter were 87% and 71%, respectively.
It was also found that there is substantial direct profit in recovering water using reverse osmosis and sodium chloride in solution using nano-filtration as compared to the recovery of Na2SO4. The study also revealed that high quality water could be produced by treatment systemincorporating membrane technology at affordable costs and recycled back into the process in the textile dyeing industry.� 2007 Elsevier Ltd. All rights reserved.
Keywords: Textile wastewater; Total dissolved solids; Membrane technology; Multiple effect evaporator; Zero discharge
1. Introduction in Tirupur requiring 400e500 t of salt. The salt used is either
The textile dyeing industry demands large quantities of wa-ter and produces wastewater having high load of contaminants.In the textile processing industry many processing steps arecarried out discontinuously, resulting in different processstreams from the same processing steps. More than 80% ofthe salt and 90% of the colour is discharged with the dyebathand first rinsing bath [1,2]. It is logical that by segregatingthe exhaust dyebath and the first rinse the major part of the pol-lution load is isolated and would also enhance the treatability ofthe effluent [3,4].
The trade effluent from dyeing and bleaching units at Tiru-pur, India, has caused severe environmental problems [5].Every day about 600e700 t of hosiery fabrics are processed
* Corresponding author.
E-mail address: [email protected] (G. Vishnu).
0959-6526/$ - see front matter � 2007 Elsevier Ltd. All rights reserved.
doi:10.1016/j.jclepro.2007.06.005
sodium chloride (NaCl) or sodium sulphate (Na2SO4). Thisgenerates large quantity of effluent, and the total dissolvedsolids (TDS) in the treated effluent is in the range of 5000e7000 mg/l with chloride in the range of 2000e3500 mg/l ascompared to the tolerance limits of 2100 mg/l for TDS and1000 mg/l for chlorides. The high level of TDS and chloridesis due to the salt addition in the dyeing process for the fixationof dyes into the fabric.
The two main pollutants, namely colour and total dissolvedsolids, make the textile effluent quite resistant to biodegrada-tion. Though the colour removal can be effectively achievedby physico-chemical methods, a large volume of sludge is pro-duced as by-product. The salt is largely unaffected by biologicaltreatment methods [6,7]. Apart from their non-biodegradability,the dyeing effluent is intensely coloured and imparts the same tothe receiving water bodies into which it is discharged.
Having understood the seriousness of the water pollution, theregulatory agencies are insisting on treating the wastewaters
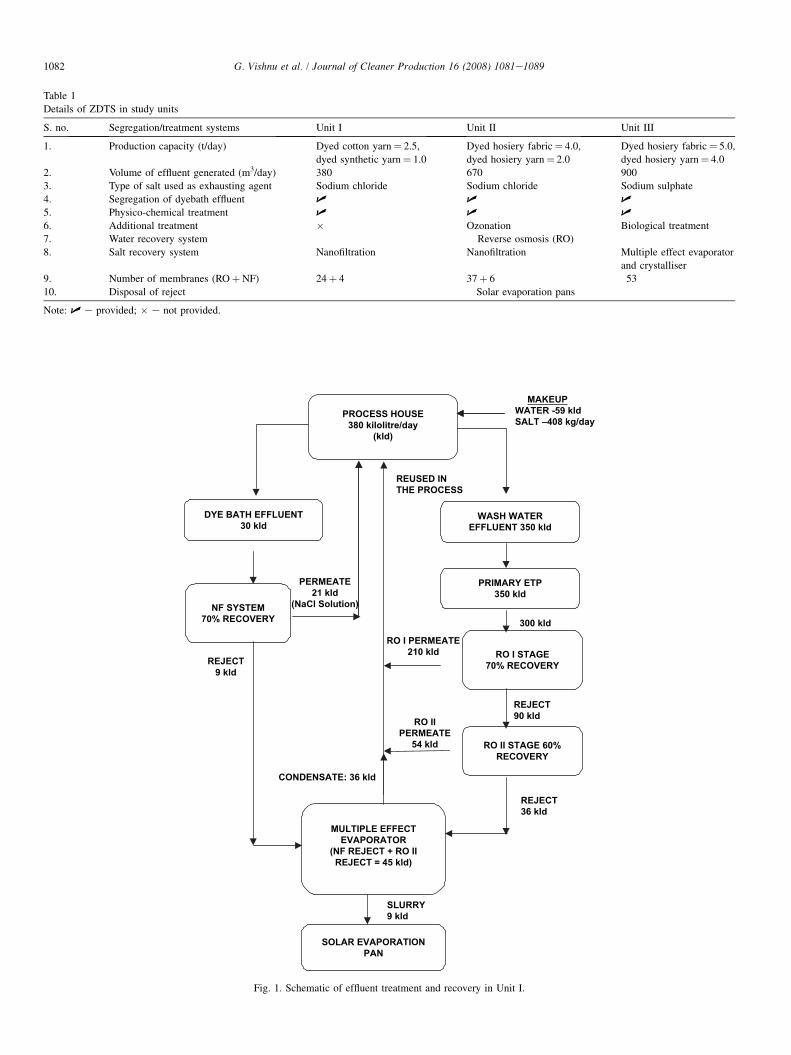
Table 1
Details of ZDTS in study units
S. no. Segregation/treatment systems Unit I Unit II Unit III
1. Production capacity (t/day) Dyed cotton yarn¼ 2.5,
dyed synthetic yarn¼ 1.0
Dyed hosiery fabric¼ 4.0,
dyed hosiery yarn¼ 2.0
Dyed hosiery fabric¼ 5.0,
dyed hosiery yarn¼ 4.0
2. Volume of effluent generated (m3/day) 380 670 900
3. Type of salt used as exhausting agent Sodium chloride Sodium chloride Sodium sulphate
4. Segregation of dyebath effluent U U U
5. Physico-chemical treatment U U U
6. Additional treatment � Ozonation Biological treatment
7. Water recovery system Reverse osmosis (RO)
8. Salt recovery system Nanofiltration Nanofiltration Multiple effect evaporator
and crystalliser
9. Number of membranes (ROþNF) 24þ 4 37þ 6 53
10. Disposal of reject Solar evaporation pans
Note: U e provided; � e not provided.
PROCESS HOUSE
380 kilolitre/day
(kld)
MULTIPLE EFFECT
EVAPORATOR
(NF REJECT + RO II
REJECT = 45 kld)
SOLAR EVAPORATION
PAN
NF SYSTEM
70% RECOVERY
RO I STAGE
70% RECOVERY
PERMEATE
21 kld
(NaCl Solution)
RO I PERMEATE
210 kld
REJECT
9 kld
REJECT
90 kld
CONDENSATE: 36 kld
PRIMARY ETP
350 kld
RO II STAGE 60%
RECOVERY
RO II
PERMEATE
54 kld
REJECT
36 kld
REUSED IN
THE PROCESS
SLURRY
9 kld
WASH WATER
EFFLUENT 350 kld
300 kld
MAKEUP
WATER -59 kld
SALT –408 kg/day
DYE BATH EFFLUENT
30 kld
Fig. 1. Schematic of effluent treatment and recovery in Unit I.
1082 G. Vishnu et al. / Journal of Cleaner Production 16 (2008) 1081e1089
PROCESS HOUSE
637 kilolitre /day
(kld)
MULTIPLE EFFECT
EVAPORATOR
(NF REJECT + RO-III
REJECT = 55 kld)
SOLAR EVAPORATION
NF SYSTEM
73% RECOVERY
RO I STAGE
65% RECOVERY
PERMEATE
27 kld
(NaCl Solution)
RO I
PERMEATE
340 kld
REJECT
10 kldREJECT
180 kld
CONDENSATE
38.5 kld
PRIMARY ETP
600 kld
RO II STAGE 50%
RECOVERY
RO II
PERMEATE
90 kld
REJECT
45 kld
REUSED IN
THE PROCESS
SLURRY
3 kld
520 kld
MAKEUP
WATER - 96.5 kld
SALT – 201 kg/day
REJECT
90 kld
RO III STAGE 50%
RECOVERY
RO III
PERMEATE
45 kld
DY
E B
AT
H E
FF
LU
EN
T
37
k
ld
WA
SH
W
AT
ER
EF
FL
UE
NT
60
0 k
ld
SLUDGE80 kld
Fig. 2. Schematic of effluent treatment and recovery in Unit II.
1083G. Vishnu et al. / Journal of Cleaner Production 16 (2008) 1081e1089
to reuse it in the process itself and achieve ‘zero discharge’.Twenty-nine large- and medium-scale dyeing units in Tirupurhave installed zero discharge treatment systems (ZDTS) con-sisting of different combinations of treatment technologies.The technical and economic feasibility of these technologiesneeds to be studied to arrive at the optimum combination ofthe treatment techniques. Thus this paper focuses on three unitswhich are using a combination of treatment techniques for therecovery and reuse of water and salt with an in-depth technicaland economic analysis.
2. Methodology
In this study, three textile dyeing units were selected basedon factors such as production capacity of the units, salt used,physico-chemical treatment system adopted, membrane pro-cesses incorporated, etc. The details of the units are providedin Table 1.
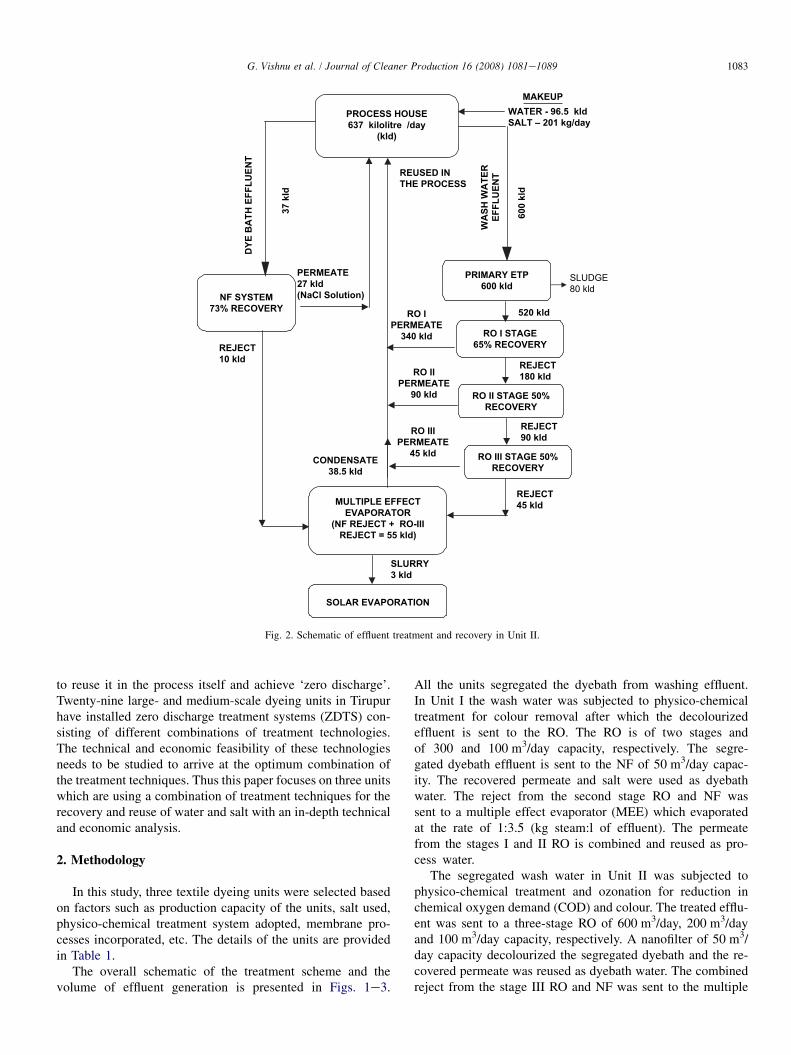
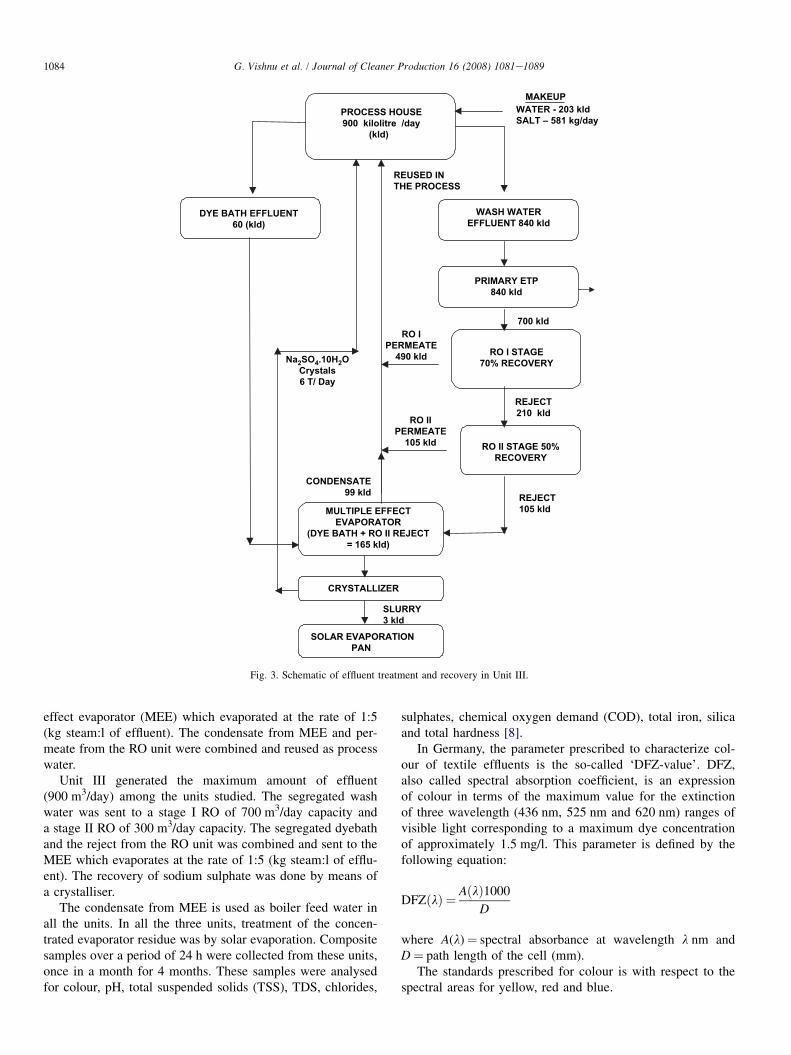
The overall schematic of the treatment scheme and thevolume of effluent generation is presented in Figs. 1e3.
All the units segregated the dyebath from washing effluent.In Unit I the wash water was subjected to physico-chemicaltreatment for colour removal after which the decolourizedeffluent is sent to the RO. The RO is of two stages andof 300 and 100 m3/day capacity, respectively. The segre-gated dyebath effluent is sent to the NF of 50 m3/day capac-ity. The recovered permeate and salt were used as dyebathwater. The reject from the second stage RO and NF wassent to a multiple effect evaporator (MEE) which evaporatedat the rate of 1:3.5 (kg steam:l of effluent). The permeatefrom the stages I and II RO is combined and reused as pro-cess water.
The segregated wash water in Unit II was subjected tophysico-chemical treatment and ozonation for reduction inchemical oxygen demand (COD) and colour. The treated efflu-ent was sent to a three-stage RO of 600 m3/day, 200 m3/dayand 100 m3/day capacity, respectively. A nanofilter of 50 m3/day capacity decolourized the segregated dyebath and the re-covered permeate was reused as dyebath water. The combinedreject from the stage III RO and NF was sent to the multiple
PROCESS HOUSE
900 kilolitre /day
(kld)
MULTIPLE EFFECT
EVAPORATOR
(DYE BATH + RO II REJECT
= 165 kld)
SOLAR EVAPORATION
PAN
RO I STAGE
70% RECOVERY
RO I
PERMEATE
490 kld
REJECT
210 kld
CONDENSATE
99 kld
PRIMARY ETP
840 kld
RO II STAGE 50%
RECOVERY
RO II
PERMEATE
105 kld
REJECT
105 kld
REUSED IN
THE PROCESS
SLURRY
3 kld
WASH WATER
EFFLUENT 840 kld
700 kld
MAKEUP
WATER - 203 kld
SALT – 581 kg/day
DYE BATH EFFLUENT
60 (kld)
CRYSTALLIZER
Na2SO
4.10H
2O
Crystals
6 T/ Day
Fig. 3. Schematic of effluent treatment and recovery in Unit III.
1084 G. Vishnu et al. / Journal of Cleaner Production 16 (2008) 1081e1089
effect evaporator (MEE) which evaporated at the rate of 1:5(kg steam:l of effluent). The condensate from MEE and per-meate from the RO unit were combined and reused as processwater.
Unit III generated the maximum amount of effluent(900 m3/day) among the units studied. The segregated washwater was sent to a stage I RO of 700 m3/day capacity anda stage II RO of 300 m3/day capacity. The segregated dyebathand the reject from the RO unit was combined and sent to theMEE which evaporates at the rate of 1:5 (kg steam:l of efflu-ent). The recovery of sodium sulphate was done by means ofa crystalliser.
The condensate from MEE is used as boiler feed water inall the units. In all the three units, treatment of the concen-trated evaporator residue was by solar evaporation. Compositesamples over a period of 24 h were collected from these units,once in a month for 4 months. These samples were analysedfor colour, pH, total suspended solids (TSS), TDS, chlorides,
sulphates, chemical oxygen demand (COD), total iron, silicaand total hardness [8].
In Germany, the parameter prescribed to characterize col-our of textile effluents is the so-called ‘DFZ-value’. DFZ,also called spectral absorption coefficient, is an expressionof colour in terms of the maximum value for the extinctionof three wavelength (436 nm, 525 nm and 620 nm) ranges ofvisible light corresponding to a maximum dye concentrationof approximately 1.5 mg/l. This parameter is defined by thefollowing equation:
DFZðlÞ ¼ AðlÞ1000
D
where A(l)¼ spectral absorbance at wavelength l nm andD¼ path length of the cell (mm).
The standards prescribed for colour is with respect to thespectral areas for yellow, red and blue.
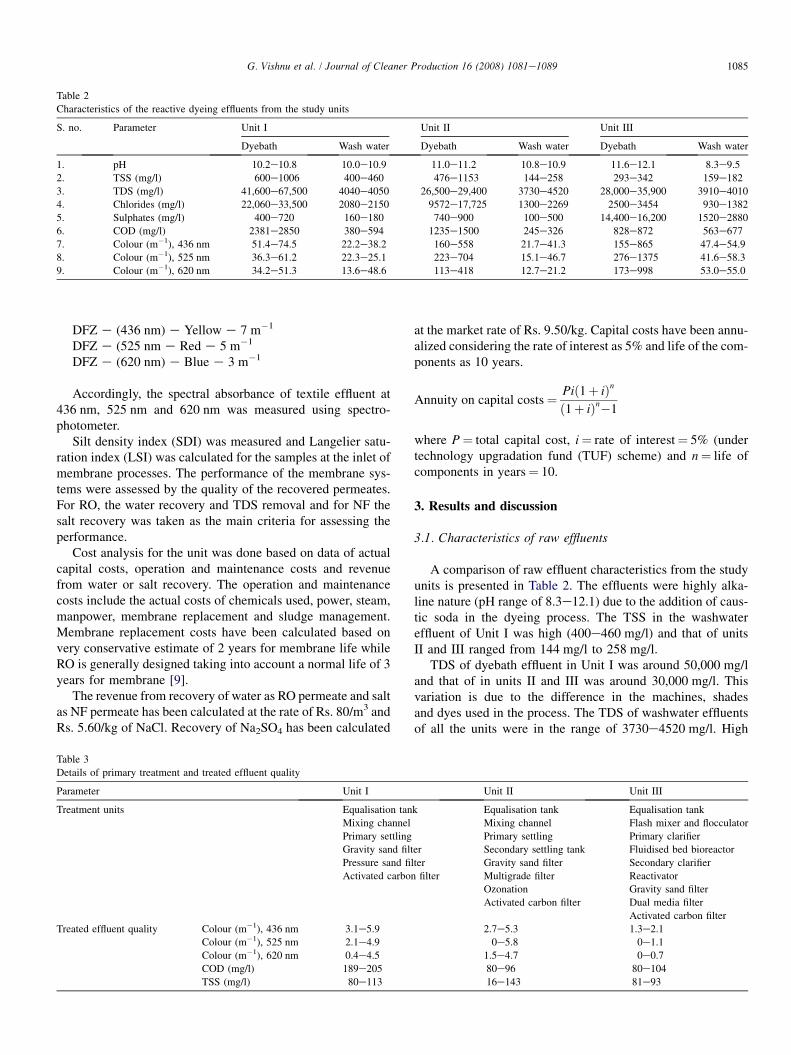
Table 2
Characteristics of the reactive dyeing effluents from the study units
S. no. Parameter Unit I Unit II Unit III
Dyebath Wash water Dyebath Wash water Dyebath Wash water
1. pH 10.2e10.8 10.0e10.9 11.0e11.2 10.8e10.9 11.6e12.1 8.3e9.5
2. TSS (mg/l) 600e1006 400e460 476e1153 144e258 293e342 159e182
3. TDS (mg/l) 41,600e67,500 4040e4050 26,500e29,400 3730e4520 28,000e35,900 3910e4010
4. Chlorides (mg/l) 22,060e33,500 2080e2150 9572e17,725 1300e2269 2500e3454 930e1382
5. Sulphates (mg/l) 400e720 160e180 740e900 100e500 14,400e16,200 1520e2880
6. COD (mg/l) 2381e2850 380e594 1235e1500 245e326 828e872 563e677
7. Colour (m�1), 436 nm 51.4e74.5 22.2e38.2 160e558 21.7e41.3 155e865 47.4e54.9
8. Colour (m�1), 525 nm 36.3e61.2 22.3e25.1 223e704 15.1e46.7 276e1375 41.6e58.3
9. Colour (m�1), 620 nm 34.2e51.3 13.6e48.6 113e418 12.7e21.2 173e998 53.0e55.0
1085G. Vishnu et al. / Journal of Cleaner Production 16 (2008) 1081e1089
DFZ e (436 nm) e Yellow e 7 m�1
DFZ e (525 nm e Red e 5 m�1
DFZ e (620 nm) e Blue e 3 m�1
Accordingly, the spectral absorbance of textile effluent at436 nm, 525 nm and 620 nm was measured using spectro-photometer.
Silt density index (SDI) was measured and Langelier satu-ration index (LSI) was calculated for the samples at the inlet ofmembrane processes. The performance of the membrane sys-tems were assessed by the quality of the recovered permeates.For RO, the water recovery and TDS removal and for NF thesalt recovery was taken as the main criteria for assessing theperformance.
Cost analysis for the unit was done based on data of actualcapital costs, operation and maintenance costs and revenuefrom water or salt recovery. The operation and maintenancecosts include the actual costs of chemicals used, power, steam,manpower, membrane replacement and sludge management.Membrane replacement costs have been calculated based onvery conservative estimate of 2 years for membrane life whileRO is generally designed taking into account a normal life of 3years for membrane [9].
The revenue from recovery of water as RO permeate and saltas NF permeate has been calculated at the rate of Rs. 80/m3 andRs. 5.60/kg of NaCl. Recovery of Na2SO4 has been calculated
Table 3
Details of primary treatment and treated effluent quality
Parameter Unit I
Treatment units Equalisation tan
Mixing channel
Primary settling
Gravity sand filt
Pressure sand fil
Activated carbon
Treated effluent quality Colour (m�1), 436 nm 3.1e5.9
Colour (m�1), 525 nm 2.1e4.9
Colour (m�1), 620 nm 0.4e4.5
COD (mg/l) 189e205
TSS (mg/l) 80e113
at the market rate of Rs. 9.50/kg. Capital costs have been annu-alized considering the rate of interest as 5% and life of the com-ponents as 10 years.
Annuity on capital costs¼ Pið1þ iÞn
ð1þ iÞn�1
where P¼ total capital cost, i¼ rate of interest¼ 5% (undertechnology upgradation fund (TUF) scheme) and n¼ life ofcomponents in years¼ 10.
3. Results and discussion
3.1. Characteristics of raw effluents
A comparison of raw effluent characteristics from the studyunits is presented in Table 2. The effluents were highly alka-line nature (pH range of 8.3e12.1) due to the addition of caus-tic soda in the dyeing process. The TSS in the washwatereffluent of Unit I was high (400e460 mg/l) and that of unitsII and III ranged from 144 mg/l to 258 mg/l.
TDS of dyebath effluent in Unit I was around 50,000 mg/land that of in units II and III was around 30,000 mg/l. Thisvariation is due to the difference in the machines, shadesand dyes used in the process. The TDS of washwater effluentsof all the units were in the range of 3730e4520 mg/l. High
Unit II Unit III
k Equalisation tank Equalisation tank
Mixing channel Flash mixer and flocculator
Primary settling Primary clarifier
er Secondary settling tank Fluidised bed bioreactor
ter Gravity sand filter Secondary clarifier
filter Multigrade filter Reactivator
Ozonation Gravity sand filter
Activated carbon filter Dual media filter
Activated carbon filter
2.7e5.3 1.3e2.1
0e5.8 0e1.1
1.5e4.7 0e0.7
80e96 80e104
16e143 81e93
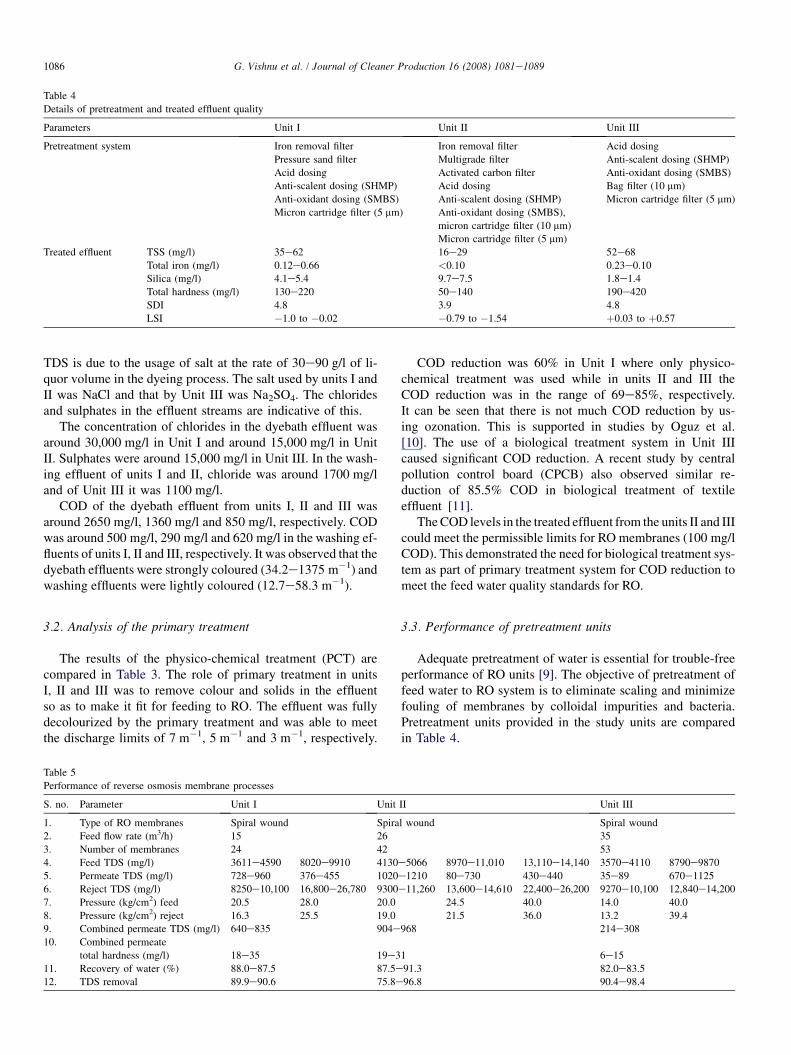
Table 4
Details of pretreatment and treated effluent quality
Parameters Unit I Unit II Unit III
Pretreatment system Iron removal filter Iron removal filter Acid dosing
Pressure sand filter Multigrade filter Anti-scalent dosing (SHMP)
Acid dosing Activated carbon filter Anti-oxidant dosing (SMBS)
Anti-scalent dosing (SHMP) Acid dosing Bag filter (10 mm)
Anti-oxidant dosing (SMBS) Anti-scalent dosing (SHMP) Micron cartridge filter (5 mm)
Micron cartridge filter (5 mm) Anti-oxidant dosing (SMBS),
micron cartridge filter (10 mm)
Micron cartridge filter (5 mm)
Treated effluent TSS (mg/l) 35e62 16e29 52e68
Total iron (mg/l) 0.12e0.66 <0.10 0.23e0.10
Silica (mg/l) 4.1e5.4 9.7e7.5 1.8e1.4
Total hardness (mg/l) 130e220 50e140 190e420
SDI 4.8 3.9 4.8
LSI �1.0 to �0.02 �0.79 to �1.54 þ0.03 to þ0.57
1086 G. Vishnu et al. / Journal of Cleaner Production 16 (2008) 1081e1089
TDS is due to the usage of salt at the rate of 30e90 g/l of li-quor volume in the dyeing process. The salt used by units I andII was NaCl and that by Unit III was Na2SO4. The chloridesand sulphates in the effluent streams are indicative of this.
The concentration of chlorides in the dyebath effluent wasaround 30,000 mg/l in Unit I and around 15,000 mg/l in UnitII. Sulphates were around 15,000 mg/l in Unit III. In the wash-ing effluent of units I and II, chloride was around 1700 mg/land of Unit III it was 1100 mg/l.
COD of the dyebath effluent from units I, II and III wasaround 2650 mg/l, 1360 mg/l and 850 mg/l, respectively. CODwas around 500 mg/l, 290 mg/l and 620 mg/l in the washing ef-fluents of units I, II and III, respectively. It was observed that thedyebath effluents were strongly coloured (34.2e1375 m�1) andwashing effluents were lightly coloured (12.7e58.3 m�1).
3.2. Analysis of the primary treatment
The results of the physico-chemical treatment (PCT) arecompared in Table 3. The role of primary treatment in unitsI, II and III was to remove colour and solids in the effluentso as to make it fit for feeding to RO. The effluent was fullydecolourized by the primary treatment and was able to meetthe discharge limits of 7 m�1, 5 m�1 and 3 m�1, respectively.
Table 5
Performance of reverse osmosis membrane processes
S. no. Parameter Unit I Unit
1. Type of RO membranes Spiral wound Spira
2. Feed flow rate (m3/h) 15 26
3. Number of membranes 24 42
4. Feed TDS (mg/l) 3611e4590 8020e9910 4130
5. Permeate TDS (mg/l) 728e960 376e455 1020
6. Reject TDS (mg/l) 8250e10,100 16,800e26,780 9300
7. Pressure (kg/cm2) feed 20.5 28.0 20.0
8. Pressure (kg/cm2) reject 16.3 25.5 19.0
9. Combined permeate TDS (mg/l) 640e835 904e
10. Combined permeate
total hardness (mg/l) 18e35 19e3
11. Recovery of water (%) 88.0e87.5 87.5e12. TDS removal 89.9e90.6 75.8e
COD reduction was 60% in Unit I where only physico-chemical treatment was used while in units II and III theCOD reduction was in the range of 69e85%, respectively.It can be seen that there is not much COD reduction by us-ing ozonation. This is supported in studies by Oguz et al.[10]. The use of a biological treatment system in Unit IIIcaused significant COD reduction. A recent study by centralpollution control board (CPCB) also observed similar re-duction of 85.5% COD in biological treatment of textileeffluent [11].
The COD levels in the treated effluent from the units II and IIIcould meet the permissible limits for RO membranes (100 mg/lCOD). This demonstrated the need for biological treatment sys-tem as part of primary treatment system for COD reduction tomeet the feed water quality standards for RO.
3.3. Performance of pretreatment units
Adequate pretreatment of water is essential for trouble-freeperformance of RO units [9]. The objective of pretreatment offeed water to RO system is to eliminate scaling and minimizefouling of membranes by colloidal impurities and bacteria.Pretreatment units provided in the study units are comparedin Table 4.
II Unit III
l wound Spiral wound
35
53
e5066 8970e11,010 13,110e14,140 3570e4110 8790e9870
e1210 80e730 430e440 35e89 670e1125
e11,260 13,600e14,610 22,400e26,200 9270e10,100 12,840e14,200
24.5 40.0 14.0 40.0
21.5 36.0 13.2 39.4
968 214e308
1 6e15
91.3 82.0e83.5
96.8 90.4e98.4
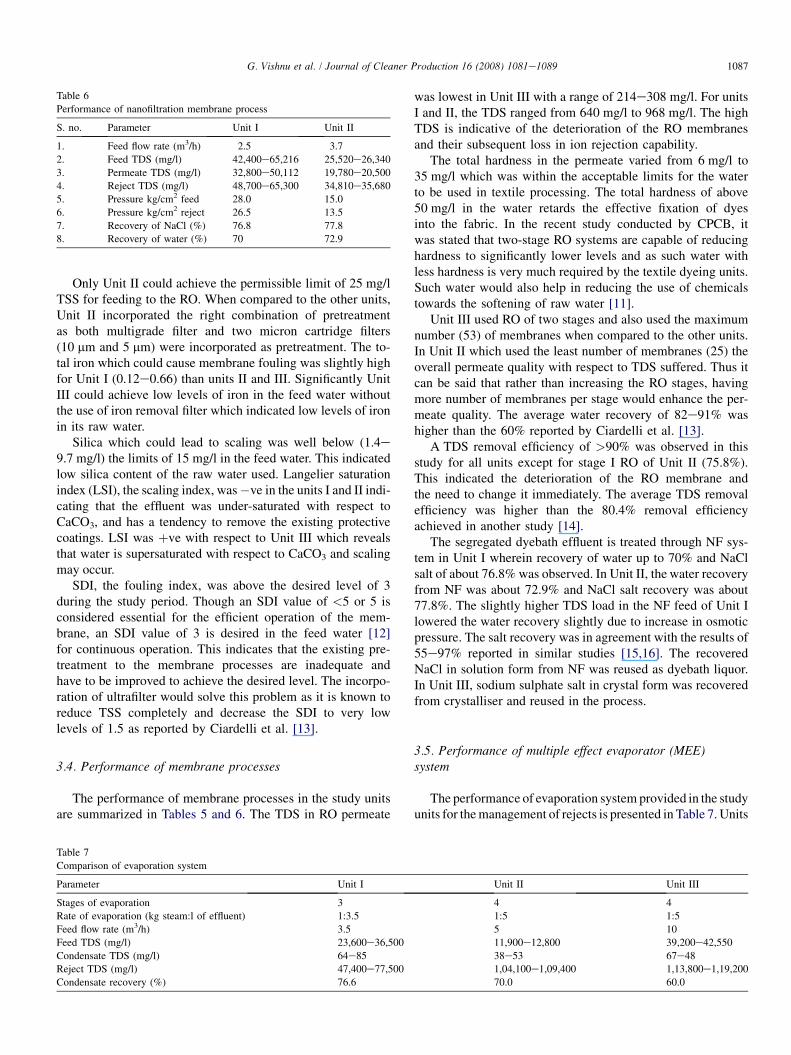
Table 6
Performance of nanofiltration membrane process
S. no. Parameter Unit I Unit II
1. Feed flow rate (m3/h) 2.5 3.7
2. Feed TDS (mg/l) 42,400e65,216 25,520e26,340
3. Permeate TDS (mg/l) 32,800e50,112 19,780e20,500
4. Reject TDS (mg/l) 48,700e65,300 34,810e35,680
5. Pressure kg/cm2 feed 28.0 15.0
6. Pressure kg/cm2 reject 26.5 13.5
7. Recovery of NaCl (%) 76.8 77.8
8. Recovery of water (%) 70 72.9
1087G. Vishnu et al. / Journal of Cleaner Production 16 (2008) 1081e1089
Only Unit II could achieve the permissible limit of 25 mg/lTSS for feeding to the RO. When compared to the other units,Unit II incorporated the right combination of pretreatmentas both multigrade filter and two micron cartridge filters(10 mm and 5 mm) were incorporated as pretreatment. The to-tal iron which could cause membrane fouling was slightly highfor Unit I (0.12e0.66) than units II and III. Significantly UnitIII could achieve low levels of iron in the feed water withoutthe use of iron removal filter which indicated low levels of ironin its raw water.
Silica which could lead to scaling was well below (1.4e9.7 mg/l) the limits of 15 mg/l in the feed water. This indicatedlow silica content of the raw water used. Langelier saturationindex (LSI), the scaling index, was�ve in the units I and II indi-cating that the effluent was under-saturated with respect toCaCO3, and has a tendency to remove the existing protectivecoatings. LSI was þve with respect to Unit III which revealsthat water is supersaturated with respect to CaCO3 and scalingmay occur.
SDI, the fouling index, was above the desired level of 3during the study period. Though an SDI value of <5 or 5 isconsidered essential for the efficient operation of the mem-brane, an SDI value of 3 is desired in the feed water [12]for continuous operation. This indicates that the existing pre-treatment to the membrane processes are inadequate andhave to be improved to achieve the desired level. The incorpo-ration of ultrafilter would solve this problem as it is known toreduce TSS completely and decrease the SDI to very lowlevels of 1.5 as reported by Ciardelli et al. [13].
3.4. Performance of membrane processes
The performance of membrane processes in the study unitsare summarized in Tables 5 and 6. The TDS in RO permeate
Table 7
Comparison of evaporation system
Parameter Unit I
Stages of evaporation 3
Rate of evaporation (kg steam:l of effluent) 1:3.5
Feed flow rate (m3/h) 3.5
Feed TDS (mg/l) 23,600e36,500
Condensate TDS (mg/l) 64e85
Reject TDS (mg/l) 47,400e77,500
Condensate recovery (%) 76.6
was lowest in Unit III with a range of 214e308 mg/l. For unitsI and II, the TDS ranged from 640 mg/l to 968 mg/l. The highTDS is indicative of the deterioration of the RO membranesand their subsequent loss in ion rejection capability.
The total hardness in the permeate varied from 6 mg/l to35 mg/l which was within the acceptable limits for the waterto be used in textile processing. The total hardness of above50 mg/l in the water retards the effective fixation of dyesinto the fabric. In the recent study conducted by CPCB, itwas stated that two-stage RO systems are capable of reducinghardness to significantly lower levels and as such water withless hardness is very much required by the textile dyeing units.Such water would also help in reducing the use of chemicalstowards the softening of raw water [11].
Unit III used RO of two stages and also used the maximumnumber (53) of membranes when compared to the other units.In Unit II which used the least number of membranes (25) theoverall permeate quality with respect to TDS suffered. Thus itcan be said that rather than increasing the RO stages, havingmore number of membranes per stage would enhance the per-meate quality. The average water recovery of 82e91% washigher than the 60% reported by Ciardelli et al. [13].
A TDS removal efficiency of >90% was observed in thisstudy for all units except for stage I RO of Unit II (75.8%).This indicated the deterioration of the RO membrane andthe need to change it immediately. The average TDS removalefficiency was higher than the 80.4% removal efficiencyachieved in another study [14].
The segregated dyebath effluent is treated through NF sys-tem in Unit I wherein recovery of water up to 70% and NaClsalt of about 76.8% was observed. In Unit II, the water recoveryfrom NF was about 72.9% and NaCl salt recovery was about77.8%. The slightly higher TDS load in the NF feed of Unit Ilowered the water recovery slightly due to increase in osmoticpressure. The salt recovery was in agreement with the results of55e97% reported in similar studies [15,16]. The recoveredNaCl in solution form from NF was reused as dyebath liquor.In Unit III, sodium sulphate salt in crystal form was recoveredfrom crystalliser and reused in the process.
3.5. Performance of multiple effect evaporator (MEE)system
The performance of evaporation system provided in the studyunits for the management of rejects is presented in Table 7. Units
Unit II Unit III
4 4
1:5 1:5
5 10
11,900e12,800 39,200e42,550
38e53 67e48
1,04,100e1,09,400 1,13,800e1,19,200
70.0 60.0
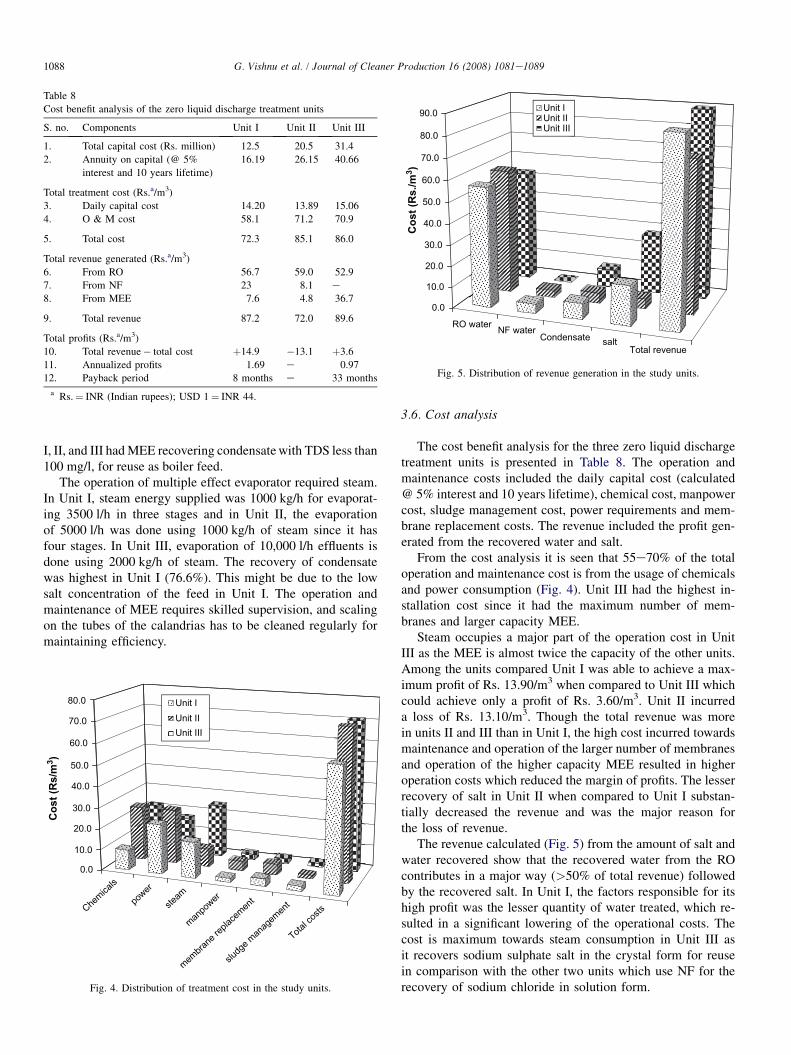
Table 8
Cost benefit analysis of the zero liquid discharge treatment units
S. no. Components Unit I Unit II Unit III
1. Total capital cost (Rs. million) 12.5 20.5 31.4
2. Annuity on capital (@ 5%
interest and 10 years lifetime)
16.19 26.15 40.66
Total treatment cost (Rs.a/m3)
3. Daily capital cost 14.20 13.89 15.06
4. O & M cost 58.1 71.2 70.9
5. Total cost 72.3 85.1 86.0
Total revenue generated (Rs.a/m3)
6. From RO 56.7 59.0 52.9
7. From NF 23 8.1 e
8. From MEE 7.6 4.8 36.7
9. Total revenue 87.2 72.0 89.6
Total profits (Rs.a/m3)
10. Total revenue� total cost þ14.9 �13.1 þ3.6
11. Annualized profits 1.69 e 0.97
12. Payback period 8 months e 33 months
a Rs.¼ INR (Indian rupees); USD 1¼ INR 44.
RO water NF waterCondensate salt
Total revenue
0.0
10.0
20.0
30.0
40.0
50.0
60.0
70.0
80.0
90.0
Co
st (R
s./m
3)
Unit IUnit IIUnit III
Fig. 5. Distribution of revenue generation in the study units.
1088 G. Vishnu et al. / Journal of Cleaner Production 16 (2008) 1081e1089
I, II, and III had MEE recovering condensate with TDS less than100 mg/l, for reuse as boiler feed.
The operation of multiple effect evaporator required steam.In Unit I, steam energy supplied was 1000 kg/h for evaporat-ing 3500 l/h in three stages and in Unit II, the evaporationof 5000 l/h was done using 1000 kg/h of steam since it hasfour stages. In Unit III, evaporation of 10,000 l/h effluents isdone using 2000 kg/h of steam. The recovery of condensatewas highest in Unit I (76.6%). This might be due to the lowsalt concentration of the feed in Unit I. The operation andmaintenance of MEE requires skilled supervision, and scalingon the tubes of the calandrias has to be cleaned regularly formaintaining efficiency.
Chemica
ls
power
steam
manpo
wer
membra
ne re
place
ment
sludg
e man
agem
ent
Total c
osts
0.0
10.0
20.0
30.0
40.0
50.0
60.0
70.0
80.0
Co
st (R
s/m
3)
Unit IUnit IIUnit III
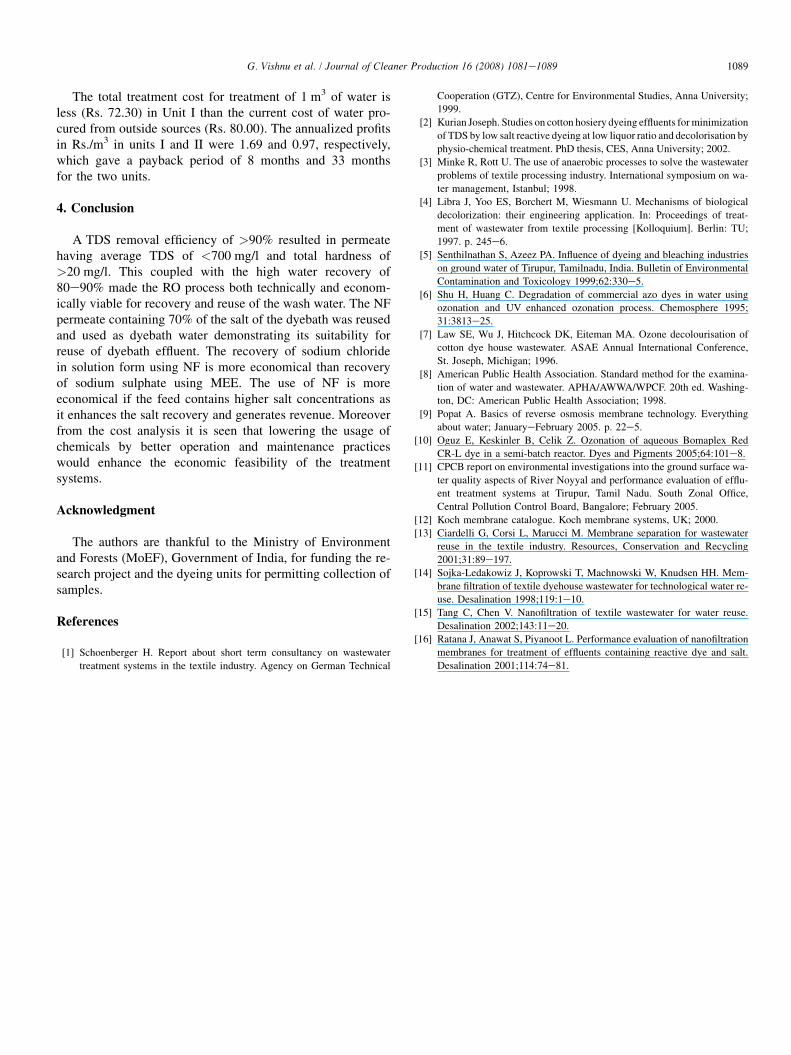
Fig. 4. Distribution of treatment cost in the study units.
3.6. Cost analysis
The cost benefit analysis for the three zero liquid dischargetreatment units is presented in Table 8. The operation andmaintenance costs included the daily capital cost (calculated@ 5% interest and 10 years lifetime), chemical cost, manpowercost, sludge management cost, power requirements and mem-brane replacement costs. The revenue included the profit gen-erated from the recovered water and salt.
From the cost analysis it is seen that 55e70% of the totaloperation and maintenance cost is from the usage of chemicalsand power consumption (Fig. 4). Unit III had the highest in-stallation cost since it had the maximum number of mem-branes and larger capacity MEE.
Steam occupies a major part of the operation cost in UnitIII as the MEE is almost twice the capacity of the other units.Among the units compared Unit I was able to achieve a max-imum profit of Rs. 13.90/m3 when compared to Unit III whichcould achieve only a profit of Rs. 3.60/m3. Unit II incurreda loss of Rs. 13.10/m3. Though the total revenue was morein units II and III than in Unit I, the high cost incurred towardsmaintenance and operation of the larger number of membranesand operation of the higher capacity MEE resulted in higheroperation costs which reduced the margin of profits. The lesserrecovery of salt in Unit II when compared to Unit I substan-tially decreased the revenue and was the major reason forthe loss of revenue.
The revenue calculated (Fig. 5) from the amount of salt andwater recovered show that the recovered water from the ROcontributes in a major way (>50% of total revenue) followedby the recovered salt. In Unit I, the factors responsible for itshigh profit was the lesser quantity of water treated, which re-sulted in a significant lowering of the operational costs. Thecost is maximum towards steam consumption in Unit III asit recovers sodium sulphate salt in the crystal form for reusein comparison with the other two units which use NF for therecovery of sodium chloride in solution form.
1089G. Vishnu et al. / Journal of Cleaner Production 16 (2008) 1081e1089
The total treatment cost for treatment of 1 m3 of water isless (Rs. 72.30) in Unit I than the current cost of water pro-cured from outside sources (Rs. 80.00). The annualized profitsin Rs./m3 in units I and II were 1.69 and 0.97, respectively,which gave a payback period of 8 months and 33 monthsfor the two units.
4. Conclusion
A TDS removal efficiency of >90% resulted in permeatehaving average TDS of <700 mg/l and total hardness of>20 mg/l. This coupled with the high water recovery of80e90% made the RO process both technically and econom-ically viable for recovery and reuse of the wash water. The NFpermeate containing 70% of the salt of the dyebath was reusedand used as dyebath water demonstrating its suitability forreuse of dyebath effluent. The recovery of sodium chloridein solution form using NF is more economical than recoveryof sodium sulphate using MEE. The use of NF is moreeconomical if the feed contains higher salt concentrations asit enhances the salt recovery and generates revenue. Moreoverfrom the cost analysis it is seen that lowering the usage ofchemicals by better operation and maintenance practiceswould enhance the economic feasibility of the treatmentsystems.
Acknowledgment
The authors are thankful to the Ministry of Environmentand Forests (MoEF), Government of India, for funding the re-search project and the dyeing units for permitting collection ofsamples.
References
[1] Schoenberger H. Report about short term consultancy on wastewater
treatment systems in the textile industry. Agency on German Technical
Cooperation (GTZ), Centre for Environmental Studies, Anna University;
1999.
[2] Kurian Joseph. Studies on cotton hosiery dyeing effluents for minimization
of TDS by low salt reactive dyeing at low liquor ratio and decolorisation by
physio-chemical treatment. PhD thesis, CES, Anna University; 2002.
[3] Minke R, Rott U. The use of anaerobic processes to solve the wastewater
problems of textile processing industry. International symposium on wa-
ter management, Istanbul; 1998.
[4] Libra J, Yoo ES, Borchert M, Wiesmann U. Mechanisms of biological
decolorization: their engineering application. In: Proceedings of treat-
ment of wastewater from textile processing [Kolloquium]. Berlin: TU;
1997. p. 245e6.
[5] Senthilnathan S, Azeez PA. Influence of dyeing and bleaching industries
on ground water of Tirupur, Tamilnadu, India. Bulletin of Environmental
Contamination and Toxicology 1999;62:330e5.
[6] Shu H, Huang C. Degradation of commercial azo dyes in water using
ozonation and UV enhanced ozonation process. Chemosphere 1995;
31:3813e25.
[7] Law SE, Wu J, Hitchcock DK, Eiteman MA. Ozone decolourisation of
cotton dye house wastewater. ASAE Annual International Conference,
St. Joseph, Michigan; 1996.
[8] American Public Health Association. Standard method for the examina-
tion of water and wastewater. APHA/AWWA/WPCF. 20th ed. Washing-
ton, DC: American Public Health Association; 1998.
[9] Popat A. Basics of reverse osmosis membrane technology. Everything
about water; JanuaryeFebruary 2005. p. 22e5.
[10] Oguz E, Keskinler B, Celik Z. Ozonation of aqueous Bomaplex Red
CR-L dye in a semi-batch reactor. Dyes and Pigments 2005;64:101e8.
[11] CPCB report on environmental investigations into the ground surface wa-
ter quality aspects of River Noyyal and performance evaluation of efflu-
ent treatment systems at Tirupur, Tamil Nadu. South Zonal Office,
Central Pollution Control Board, Bangalore; February 2005.
[12] Koch membrane catalogue. Koch membrane systems, UK; 2000.
[13] Ciardelli G, Corsi L, Marucci M. Membrane separation for wastewater
reuse in the textile industry. Resources, Conservation and Recycling
2001;31:89e197.
[14] Sojka-Ledakowiz J, Koprowski T, Machnowski W, Knudsen HH. Mem-
brane filtration of textile dyehouse wastewater for technological water re-
use. Desalination 1998;119:1e10.
[15] Tang C, Chen V. Nanofiltration of textile wastewater for water reuse.
Desalination 2002;143:11e20.
[16] Ratana J, Anawat S, Piyanoot L. Performance evaluation of nanofiltration
membranes for treatment of effluents containing reactive dye and salt.
Desalination 2001;114:74e81.
Copyright © 2022 FDOKUMEN