Assessment of Facilities Available for Primary & Upper ...
355
ASSESSMENT OF FACILITIES AVAILABLE FOR PRIMARY & UPPER PRIMARY EDUCATION IN MUSLIM PRE-DOMINANT AREAS Conducted for the Ministry of Human Resource Development with the support of Educational Consultants India Ltd Department of Social Work, Jamia Millia Islamia, New Delhi 2013
-
Upload
khangminh22 -
Category
Documents
-
view
0 -
download
0
Transcript of Assessment of Facilities Available for Primary & Upper ...

ASSESSMENT OF FACILITIES AVAILABLE FOR PRIMARY & UPPER PRIMARY
EDUCATION IN MUSLIM PRE-DOMINANTAREAS
Conducted for the Ministry of Human Resource Development w ith the support of Educational Consultants India Ltd
Department of Social Work, Jamia Millia Islamia, New Delhi
2013

A CK N O W LEDG EM EN T
The Department of School Education and Literacy, Ministry of Human Resource Development had
commissioned the national study on “Assessment o f Facil i t ies avai lable f o r Pr imary a nd Upper
Primary Educat ion in Mus l im Predominant A r e a s ” to be conducted in 28 districts of 13 States. The
terms of reference including the objectives of the study were framed by the Department of School
Education and Literacy and Department of Social Work, Jamia Millia Islamia was asked to
coordinate the above study.
An Advisory Committee consisting of Profs (Ms) Snehlata Shukla, Prof M Z Khan, Prof S M I A
Zaidi and Prof A B L Srivastava was constituted to advise on various aspects of the study. In
addition, Prof R R Saxena, Prof Satveer Singh, Prof J K Gupta and others have helped in the various
stages of the study. I sincerely thank them for their constant support and encouragement. The
Advisory Committee along with partners helped in the development of the sampling plan, the various
tools, template for the data entry, analysis plan and report template. Agencies were hired for the
translation of the tools, collection of data, data entry and analysis and submission of state reports.
This report presents the situation in respect of 25 districts of 12 states as data from West Bengal could
not be received in the proper format. The report is presented in eight chapters alongwith an executive
summary. Tables etc have been appended in the end to facilitate reading.
I am thankful to the Department of School Education and Literacy, Ministry of Human Resource
Development for providing me an opportunity to coordinate this critical study. I would especially like
to thank the Secretary, Ms Anita Kaul, the Director, Mr Ariz Ahmed and Mr A K Tiwari, Under
Secretary for facilitating the study. The Study was coordinated by the TSG, Ed CIL. I am indebted to
Prof A B L Srivastava , Chief Consultant for his constant guidance and support and to Shri M L Goel,
Project Manager , Ed CIL for his facilitation of the various aspects of the study. I am also thankful to
the various agencies that have facilitated the study. Doubtless, without their hard work, this study
would not have been possible.
Prof Zubair Meenai National Coordinator
zubairmeenai @ gmail.com

ContentsChapter Particulars Page
Acknowledgements ii
List of Tables vi
List of Figures x
List of Tables in Annexures xi
1 Introduction 11.1 Context and background of the study; States and districts selected for the study;
Role of Jamia Millia Islamia1.2 Objectives of the study1.3 Demographic features; literacy rate with focus on Muslim population;
Out-of-school children (total & Muslim)1.4 Educational Scenario in the sampled districts particularly with reference to Muslims;
State level and district-wise information on total enrolment and Percentageof Muslims in the enrolment by gender for all districts of the state
1.5 Review of earlier studies/ reports1.6 Facilities and Incentive schemes (SSA and of state govt, if any);
beneficiaries of these schemes (total and Muslims); mention of SPQEM and IDMI schemes of GOI for Madrasahs and coverage of Madrasahsif the state has these schemes; Teaching of Urdu
1.7 Structure of the Report
2 Methodology 222.1 Sampling Procedure2.2 Schedules for Data Collection2.3 Data Collection2.4 Data Analysis Plan
3 Schooling Facilities in Muslim concentrated Areas in the Selected Districts 293.1 Schooling facilities in sampled villages; Sampled villages, their population,
BPL households; Availability of schools having primary classes in (or within 1 km of) the habitations of sampled villages; Availability of schools having upper primary classes in (or within 3 km of) the habitations of sampled villages;Primary and upper primary Schools existing in sampled villages; Enrolment in Primary and Upper Primary classes; Recognized Madrasahs and Enrolment;KGBV in the blocks and girls of selected villages enrolled in KGBVs
3.2 Facilities in Sampled Schools; Classrooms and space for children in classrooms;Drinking Water; Toilets - total and for girls; Electricity; Library Books;Sports Material
3.3 Incentive Schemes; Free Uniform; Free Textbooks; Scholarship;Providing cycles (in upper primary classes)
3.4 Other Issues; Attached Pre-primary classes; Multi-grade teaching; Problems

being faced by schools
4 Teachers 554.1 Regular and contract teachers - total & Muslims by gender in primary
and upper primary schools4.2 Educational & Professional Qualification of Teachers; Primary Schools; Upper Primary Schools4.3 Schools according to Number of Teachers in them4.4 Absence of teachers (on day of visit); Comparison of Present Survey Data with
Data of recently conducted study by EdCIL on Attendance of Teachers inPrimary and Upper Primary Schools
4.5 Relaxation in time, if any, given to Muslim teachers and students during Ramzan and on Fridays
5 Enrolment and Retention 735.1 Enrolment (Total & Muslims) in Rural and Urban Primary Schools;
trend over last 3 years; PTR5.2 Enrolment (Total & Muslims) in Upper Primary Classes;
trend over last 3 years; PTR5.3 School Leavers and Dropouts (Muslims, non-Muslims) at Primary Stage
5.4 School Leavers and Dropouts (Muslims, non-Muslims) at Upper Primary Stage5.5 Reasons for dropping out5.6 Absence rate; reasons for long absence5.7 Support from Community; SMC5.8 Comparison of Muslim and Non-Muslim students in respect of certain
educational parameters
6 Recognised Madrasahs 936.1 Facilities in sampled Madrasahs; Sampled Madrasahs; Classrooms; space for
children in classrooms; Availability of Drinking water and Toilet facilities;Electricity, Library books and Sports material facilities; Pre-primary classes;Multi-grade teaching
6.2 Incentive schemes6.3 Teachers; Regular and Contract Teachers - total & Muslims in Primary and
Upper primary Madrasahs; Qualifications - Educational & Professional;Absence of teachers (on day of visit); Relaxation; if any, given to Muslim Teachers and Students
6.4 Enrolment and Retention; Enrolment in Primary Classes; Enrolment in Upper primary Classes; Madrasah leavers and dropouts (Muslims, non-Muslims) at primary and upper primary stages; Reasons for dropping out;Absence rate; reasons for long absence; School Management Committee;Support from Community
7 Parents’ opinion 1247.1 Selection of parents for interviewing7.2 Parents’ Occupation7.3 Educational level of parents
iv

7.4 Children in the age-group 6 to below 14 years in homes of sampled parents7.5 Children who were out of school7.6 Children attending school/ recognized Madrasahs7.7 Incentives provided to children7.8 Children provided escort for going to School/ Madrasah7.9 Children’s long absence from school and reasons thereof7.10 Perception of parents about school and teachers7.11 Vision for future relating to education and employment of Muslim children
and suggestions for changes in the system
8 Summary and Main Findings 1458.1 B ackground of the study8.2 Methodology8.3 Villages and Habitations covered in Study8.4 Enrolment in Schools, Madrasahs and KGBVs of Sampled Villages8.5 Facilities in Sampled Schools8.6 Drinking water, Toilets and Electricity in Schools8.7 Incentive Schemes8.8 Other Issues8.9 Teachers8.10 Enrolment8.11 Madrasahs8.12 Parents’ Opinion about Schools and Madrasahs
Annexures:
Supplem entary Tables 169
Profile of P a rtn e r Agencies 303
Tools of D ata Collection 307
1. State Schedule2. Questionnaire for District Project Coordinator3. Village/ Town Fact Sheet4. School Schedule5. Recognised Madrasah and Maktab Schedule6. Parents Schedule7. Focused Group Discussions with Community Members8. Investigator’s Observation Schedule
v

LIST OF TABLES Page
Table 1.1: Number of Selected Districts in different States 2
Table 1.2: Population, Sex Ratio and Literacy Rate in Sampled Districts 4Table 1.3: Number of out of school children identified through the latest household survey 6Table 1.4: Number of Schools according to School Category and Management as on 30th September 2011
8
Table 1.5: Enrolment at Primary Stage by Management and type of Schools as on 30th September 2011 in Sampled Districts
9
Table 1.6: Enrolment at Upper Primary Stage by Management and type of Schools as on 30th September 2011 in Sampled Districts
11
Table 1.7: Beneficiaries of different incentives/facilities at primary stage in sampled districts in 2010-11
15
Table 1.8: Beneficiaries of different incentives/facilities at upper primary stage in sampled districts in 2010-11
17
Table 1.9: Number and Percentage of Madrasahs benefitted from scheme for providing Quality Education in Madrasahs (SPQEM), Infrastructure Development for Minority Institutions (IDMI) and SarvaShiksha Abhiyan (SSA)
19
Table 1.10: Information about demand for teaching of Urdu as second language, number of schools actually teaching Urdu and number of teachers trained for teaching Urdu
20
Table 2.1: List of Selected Districts 23Table 2.2: Distribution of Sampled Schools/Madrasahs according to Area and Management 24Table 2.3: Primary and Upper primary schools according to Management in sampled districts in the year 2011
26
Table 3.1: Number of Sampled Villages, their population, Number of BPL (BelowPoverty Line) households, BPL Households per village and percentage of Muslim Population in different population slabs
30
3.1.2 Availability of schools having primary classes in (or within 1 km of) the habitations of sampled villages
31
Table 3.3: Neighbourhood Norms for opening a new Primary School 32Table 3.4: Availability of Schools/Madrasahs having Upper Primary Classes in the Habitation of Sampled Villages
33
Table 3.5: Neighbourhood Norms for opening a new Upper Primary School 33Table 3.6: Number of Schools/Madrasahs in the Village according to Level, Type and Management
35
Table 3.7: Number of Children and Schools/Madrasahs in the habitations of Sampled Villages
36
Table 3.8: Enrolment in Primary and Upper Primary Classes in Schools of Sampled Villages 37Table 3.9: Percentage of Girls in Primary and Upper primary Classes in Recognised Madrasahs in sampled Villages
3 8
Table 3.10: Number of Villages having KGBV in the Block 39Table 3.11: Number of Classrooms in Primary Schools 40Table 3.12: Number of Classrooms in Upper Primary Schools 41Table 3.13: Primary Schools with Number of Classrooms having adverse SCR 42
vi

Table 3.14: Upper Primary Schools with Number of Classrooms having adverse SCR
43
Table 3.15: Availability of Drinking Water and Toilet Facilities in Schools 44Table 3.16: Availability of Drinking Water and Toilet Facilities in Schools 45Table 3.17: Number of Primary Schools having Electricity, Library Books and Sports material Facilities
47
Table 3.18: Number of Upper Primary Schools having Electricity, Library Books and Sports material Facilities
48
Table 3.19: Special Incentives being provided to students in all sampled schools 49Table 3.20: Number of Schools having Nursery/Pre-Primary Classes 51Table 3.21: Number of Schools with Multi-grade Teaching 52Table 3.22: Number of Schools which faced Problems in respect of different activities 54Table 4.1: Number of Teachers in the Sampled Schools in Rural and Urban Areas 56Table 4.2: Number of Teachers in Government and Private Schools in the total Sample of Schools of the 12 selected States
58
Table 4.3: Educational Qualification of Primary School Teachers working in Rural and Urban Areas
60
Table 4.4: Professional Qualification of Primary School Teachers working in Rural and Urban Areas
61
Table 4.5: Educational Qualification of Teachers working in Government and Private Primary Schools
62
Table 4.6: Professional Qualification of Teachers working in Government and Private Primary Schools
63
Table 4.7: Educational Qualification of Teachers working in Schools having Upper Primary classes in Rural and Urban Areas
65
Table 4.8: Professional Qualification of Teachers working in Schools having Upper Primary classes in Rural and Urban Areas
66
Table 4.9: Educational Qualification of Teachers working in Government and Private School having Upper Primary classes
67
Table 4.10: Professional Qualification of Teachers working in Government and Private Schools having Upper Primary classes
67
Table 4.11: Distribution of Sampled Schools according to Number of Teachers in them 68Table 4.12: Percentage of Teachers present in School on the day of visit 69able 4.13: Percentage of Teachers present in the School on the day of visit 70Table 4.14: Type of relaxation given to Muslim teachers and students in School Hours during Ramzan Month
7 1
Table 4.15: Type of relaxation given to Muslim teachers and students in School Hours for the Friday Prayer
72
Table 5.1: Enrolment as on 30th September in Primary Classes of Sampled Schools in Rural and Urban Areas in 2009, 2010 and 2011
74
Table 5.2: Percentage Increase in Enrolment at Primary Level between 2009 & 2010 and between 2010 & 2011
76
Table 5.3: Pupil-Teacher Ratio in Primary Schools in the year 2011 77Table 5.4: Distribution of Sampled Primary Schools according to Pupil-Teacher Ratio 78Table 5.5: Enrolment as on 30th September in Upper Primary Classes in 79
vii

Rural and Urban Areas in 2009, 2010 and 2011Table 5.6: Pupil-Teacher Ratio in Sampled Upper primary Schools in the year 2011 80Table 5.7: Distribution of Upper Primary Schools according to Pupil-Teacher Ratio 81Table 5.8: Percentage of School leavers and dropouts at Primary Stage in the years 2009-10 and 2010-11
83
Table 5.9: Percentage of School leavers and dropout at Upper Primary Stage in 2009-10 and 2010-11
84
Table 5.10: Main Reasons of Students dropping out from schools during 2010-11 86Table 5.11: Enrolment and Number of Students found present on the day of visit 87Table 5.12: Percentage of Students found present on the day of visit 88Table 5.13 Main reasons for long or frequent absence of children from school based on the data of all sampled schools
89
Table 5.14: Number of Members in School Management Committee (SMC) and Number of those who had attended the last meeting
90
Table 5.15: Support received by schools from the community in facilitating Education of all children and Muslim students in particular in Rural Areas
91
Table 6.1: Distribution of Madrasahs according to Area and Management 94Table 6.2: Management-wise distribution of Madrasahas according to the agency which provided recognition to them
95
Table 6.3: Distribution of Madrasahs according to Type and Residential status 96Table 6.4: Number of Classrooms in Madrasahs 96Table 6.5: Classrooms having Insufficient Seating Space in Madrasahs 97Table 6.6: Availability of Drinking water and Toilet facilities in Sampled Madrasahs 98Table 6.7: Number of Madrasahs having Electricity, Library books and Sports material Facilities
100
Table 6.8: Number of Sampled Madrasahs having Nursery/Pre-Primary Classes 101Table 6.9: Madrasahs in the sample with Multi-grade Teaching 101Table 6.10: Special Incentives being provided to students in Sampled Madrasahs 102Table 6.11: Agencies providing Special Incentives to students in Sampled Madrasahs 103Table 6.12: Number of Teachers in Sampled Madrasahs 104Table 6.13: State-wise Number of Teachers in Sampled Madrasahs 105Table 6.14: Educational Qualification of Teachers 106Table 6.15: Professional Qualification of Teachers in Madrasahs 108Table 6.16: Number and Percentage of Teachers present in Madrasah on day of visiable 6.15: Professional Qualification of Teachers
110
Table 6.17: Type of relaxation given to Muslim teachers and students in School Hours during Ramzan Month
111
Table 6.18: Type of relaxation given to Muslim teachers and students inSchool Hours for the Friday Prayer
112
Table 6.19: Enrolment as on 30th September in Sampled Madrasahs in Primary Classesin the years 2009, 2010 and 2011
113
Table 6.20: Percentage increase in Enrolment at Primary level between 2009 & 2010 and between 2010 & 2011
114
Table 6.21: Enrolment as on 30th September in Upper Primary Classes in the years 2009, 2010 and 2011
115
vill

Table 6.22: Percentage increase in Enrolment at Upper Primary level between 2009 & 2010 and between 2010 & 2011
117
Table 6.23: Percentage of Madrasah leavers and dropout at Primary Stage in 2009-10 and 201
119
Table 6.24: Main Reasons of Students dropping out from Madrasahs according to head teachers during 2010-11
120
Table 6.25: Enrolment and percentage of students found present on the day of visit 121Table 6.26: Main reasons for long or frequent absence of children from Madrasahs 122Table 6.27: Number of Members in School Management Committee (SMC) and Number of those who attended the latest meeting
122
Table 6.28: Support received by Madrasah from the community in facilitating Education of all children and Muslim students in particular
123
Table 7.1: Distribution of Parents according to Area, Gender and Age 125Table 7.2: Percentage of Parents by their Families’ primary source of income, Families belonging to BPL category and Mothers engaged in Economic activity
126
Table 7.3: Educational level of Parents 128Table 7.4: Distribution of Children in the age-group 6 to below 14 years in homes of Parents according to their educational status
129
Table 7.5: Number of out-of-school children in homes of parents 130Table 7.6: Number of Children of the sampled Parents in the age group 6 to below 14 years who were attending School/Recognized Madrasahs in Rural and Urban areas
131
Table 7.7: Number of Children of sampled parents studying at Primary level (Classes IV) getting different incentives in Rural and Urban areas
133
Table 7.8: Number of Children of sampled parents studying at Upper Primary level getting different incentives in Rural and Urban areas
135
Table 7.9: Number of Children of sampled parents who were provided escort for going to School/ Madrasah
136
Table 7.10: Number of children of sampled parents in Primary classes with long absence (over 15 days) and reasons thereof
138
Table 7.11: Number of children of sampled parents in Upper Primary classes with long absence (over 15 days) and reasons thereof
139
Table 7.12: Perception of parents about schooling facilities for their children studying in Primary classes
140
Table 7.13: Perception of parents about schooling facilities for their children studying in Upper Primary Classes
141
ix

List of Figures
Figure 3.1: Percentage of Muslim Population served by Schools/Madrasahs having Primary Classes 34Figure 3.2: Percentage of Muslim Population served by Schools/Madrasahs having U.Primary Classes 34Figure 4.1: Number of Teachers in the Sampled Primary Schools 57Figure 4.2: Number of Teachers in the Sampled Upper Primary Schools 57Figure 4.3: Educational Qualification of Primary School Teachers 60Figure 4.4: Professional Qualification of Primary School Teachers 61Figure 4.5: Educational Qualification of Upper Primary School Teachers 64Figure 4.6: Professional Qualification of Upper Primary School Teachers 64Figure 5.1: Comparison of Enrolment of Muslim Children of 2009, 2010 and 2011 in
Primary Classes of Sampled Schools 75Figure 5.2: Pupil-Teacher Ratio in Primary Schools in the year 2011 78Figure 5.3: Pupil-Teacher Ratio in Upper Primary Schools in the year 2011 81Figure 5.4: Percentage of School leavers and dropouts at Primary Stage in the years
2009-10 and 2010-11 83
Figure 5.5: Percentage of School leavers and dropouts at Upper Primary Stage in the years2009-10 and 2010-11 85
Figure 6.1: Availability of Drinking water and Toilet facilities in Sampled Madrasahs 98Figure 6.2: Educational Qualification of Teachers 107Figure 6.3: Professional Qualification of Teachers 109Figure 6.4: Type of relaxation given to Muslim teachers and students in School Hours
during Ramzan Month 111
x

List of Tables in A ppendix
Table A3.1: Availability of Schools/Madrasahs having Primary Classes in the Habitation Table A3.2: Availability of Schools/Madrasahs having Upper Primary Classes in the Habitation Table A3.3: Number of Schools/Madrasahs in the Village according to Level,Type and Management Table A3.4: Enrolment in Primary and Upper Primary Classes in Schools of Sampled Villages Table A3.5: Percentage of Girls in Primary and Upper primary Classes in Recognised Madrasahs
in sampled Villages Table A3.6: Number of Classrooms in Primary Schools Table A3.7: Number of Classrooms in Upper Primary SchoolsTable A3.8: Primary Schools with Number of Classrooms having insufficient seating space Table A3.9: Upper Primary Schools with Number of Classrooms having insufficient seating space Table A3.10: Availability of Drinking Water and Toilet Facilities in Schools Table A3.11: Number of Primary Schools having Electricity, Library Books and Sports material
FacilitiesTable A3.12: Number of Upper Primary Schools having Electricity, Library Books and Sports
material Facilities
Table A4.1: Number of Teachers in Sampled Schools (Rural)Table A4.2: Number of Teachers in Sampled Schools (Urban)Table A4.3: Number of Teachers in Sampled Schools (Government)Table A4.4: Number of Teachers in Sampled Schools (Private)Table A4.5: Number of Teachers in all Sampled Schools Table A4.6: Educational Qualification of Teachers (Rural)Table A4.7: Educational Qualification of Teachers (Urban)Table A4.8: Educational Qualification of Teachers (Government)Table A4.9: Educational Qualification of Teachers (Private)Table A4.10: Educational Qualification of Teachers in all Sampled Schools Table A4.11: Professional Qualification of Teachers (Rural)Table A4.12: Professional Qualification of Teachers (Urban)Table A4.13: Professional Qualification of Teachers (Government)Table A4.14: Professional Qualification of Teachers (Private)Table A4.15: Professional Qualification of Teachers in all Sampled Schools Table A4.16: Percentage of Teachers present in School on the day of visit Table A4.17: Type of relaxation given to Muslim teachers and students in
School Hours during Ramzan month Table A4.18: Type of relaxation given to Muslim teachers and students in
School Hours for the Friday Prayer
Table A5.1: Enrolment as on 30th September in Primary Classes in 2009, 2010 and 2011 (Rural)Table A5.2: Enrolment as on 30th September in Primary Classes in 2009, 2010 and 2011 (Urban)Table A5.3: Enrolment as on 30th September in Primary Classes in 2009, 2010 and 2011(Total)Table A5.4: Enrolment as on 30th September in Upper Primary Classes in 2009, 2010 and 2011
(Rural)
xl

Table A5.5: Enrolment as on 30th September in Upper Primary Classes in 2009, 2010 and 2011 (Urban)
Table A5.6: Enrolment as on 30th September in Upper Primary Classes in 2009, 2010 and 2011(Total)
Table A5.7: Percentage of School leavers and dropout at Primary Stage in 2009-10 and 2010-11 Table A5.8: Percentage of School leavers and dropout at Upper Primary Stage in 2009-10 and 2010
11Table A5.9: Enrolment and Number of students found present on the day of visit Table A5.10: Number of Members in School Management Committee (SMC) and Number of those
who attended the last meeting Table A5.11: Support received by schools from the community in facilitating Education of all
children and Muslim students in particular in Rural Areas Table A5.12: Mean Values, Mean difference scores and t-values for different parameters
(separately for all the 12 selected states)
Table A7.1: Educational level of ParentsTable A7.2: Distribution of Children in the age-group 6 to below 14 years in homes of
Parents according to their Educational status Table A7.3: Number of out-of-school children in homes of parentsTable A7.4: Number of Children of the sampled Parents in the age group 6 to below 14 years
who were attending School/Recognized Madrasahs (Rural)Table A7.5: Number of Children of the sampled Parents in the age group 6 to below 14 years
who were attending School/Recognized Madrasahs (Urban)Table A7.6: Number of Children of the sampled Parents in the age group 6 to below 14 years
who were attending School/Recognized Madrasahs (Total)Table A7.7: Number of Children of sampled parents studying at Primary level (Classes I-V)
Getting different incentives in Rural areas Table A7.8: Number of Children of sampled parents studying at Primary level (Classes I-V)
Getting different incentives in Urban areas Table A7.9: Number of Children of sampled parents studying at Primary level (Classes I-V)
Getting different incentives in Rural and Urban areas Table A7.10: Number of Children of sampled parents studying at Upper Primary level
(Classes VI-VIII) getting different incentives in Rural areas Table A7.11: Number of Children of sampled parents studying at Upper Primary level
(Classes VI-VIII) getting different incentives in Urban areas Table A7.12: Number of Children of sampled parents studying at Upper Primary level
(Classes VI-VIII) getting different incentives in Rural and Urban areas Table A7.13: Number of children who were provided escorts for going to School/Madrasah Table A7.14: Perception of parents about schooling facilities for their children
studying in Primary classes Table A7.15: Perception of parents about schooling facilities for their children
studying in Upper Primary classes
xii

Chapter 1
Introduction
1.1 Context and background of the study; States selected for the study; Role of Jamia Millia Islamia; Selection of district(s) for the study
1.1.1 Context and background of the study
To achieve the goal of universalisation of elementary education (UEE), the Government of India
launched from time to time several programmes such as Operation Blackboard, District Primary
Education Programme (DPEP) and Sarva Shiksha Abhiyan (SSA). Sarva Shiksha Abhiyan,
launched in 2001, covered the entire country and extended its scope from primary to upper
primary level, that is, up to class 8. It aimed at providing educational facilities to all children of
the age group 6 to below 14, with removal of all kinds of disparities and impediments to
education. It also targeted for retention of all children in school up to class 8 and provided
various inputs for improving the quality of education. SSA and subsequently implementation of
the Right to Education (RTE) Act in 2009, made provision for giving priority to incentives for
education of girls and socially deprived groups. One such group is that of Muslims who have, for
various reasons, remained largely educationally backward. The districts with high concentration
of Muslim population were identified and labeled as Special Focus Districts (SFD) for providing
additional incentives for Muslim children. It was felt that a separate study in Muslim
concentration Special Focus districts should be conducted to find out the present status of
primary and upper primary education for Muslims in these districts. The proposed study has been
conducted on a sample basis. The task of planning and coordinating this study at national level,
was entrusted to Jamia Millia Islamia, a renowned University in Delhi by the Ministry of Human
Resource Development (MHRD), which had to get this study conducted in 13 states having large
percentage of Muslims in some of the districts. The Technical Support Group for SSA set up
under EdCIL by MHRD collaborated with Jamia Millia Islamia (JMI) in developing the research
design and tools for this study. Some agencies were identified by JMI for conducting this study
at state level in each state. The Department of Social Work at the University with the help of an Jc

Advisory Committee provided necessary guidance to the agencies selected for conducting the
study in different states.
1.1.2 States and districts selected for the study
In the country, 88 minority concentration districts in 19 states were identified under SSA as
Special Focus Districts having 20% or more Muslim population. Of these, four districts (two
districts of Delhi, Hyderabad and Kolkata) are completely urban districts and known to have
good access to elementary education. Therefore, these districts were excluded from the purview
of the study. In addition smaller states/ UTs, namely Lakshadweep, Manipur and Pudducherry,
each having one Muslim SFD were also excluded. Thus, from the remaining 81 districts
belonging to 13 states, a sample of 28 districts (listed in Table 1.1) was drawn for conducting the
study. The districts were selected from SFDs in different parts of each state. For selecting the
sample of villages and towns, the sampling frame consisted of all the Muslim concentration
villages and towns/cities of these districts.
The number of districts selected from different states varied between 1 and 3, except in Uttar
Pradesh where 5 districts were selected. Table 1.1 gives the total number of special focus
districts (Muslim concentration) along with number of districts selected in the sample in different
states.
Table 1.1: Number of Selected Districts in different States
Sl.No.
State/UT Total No. of special focus
districts
No. of selected districts
Sl.No.
State/UT Total No. of special focus
districts
No. of selected districts
(1) (2) (3) (4) (5) (6) (7) (8)1 Assam 13 3 8 Kerala 6 32 Bihar 7 3 9 Madhya Pradesh 1 13 Gujarat 2 1 10 Rajasthan 1 14 Haryana 1 1 11 Uttarakhand 2 15 Jammu & Kashmir 11 3 12 Uttar Pradesh 20 56 Jharkhand 5 2 13 West Bengal 11 37 Karnataka 1 1 Total 81 28 CN
OJgOh

1.1.3 Role of Jamia Millia Islamia
Jamia Millia Islamia provided necessary help to the state agencies in the following ways:
(i) Developed schedules for data collection in collaboration with Research Evaluation
and Studies Unit (RESU) of the Technical Support Group for SSA and in consultation
with the participating agencies and made the same available to them.
(ii) Provided an official letter to help the agencies in getting access to schools
(iii) Provided guidelines for data collection and data analysis plan to the agencies.
(iv) Sampling of the villages, towns, schools and Madrasahs within each selected district
was done centrally and the list of selected units was provided to the agencies.
(v) Provided data entry template to the agencies.
(vi) Provided structure of the report to each agency.
1.2 Objectives of the study
The objectives of the study were as follows:
(i) To assess availability of schooling facility including Maktabs, Madrasas, EGS (special
training centres) & AIE centres in Muslim concentration areas for primary and upper
stages within the rural habitations and wards of selected towns/cities in different
population slabs.
(ii) To find out whether there has been significant improvement in enrolment and retention of
Muslim girls at primary and upper primary level during the last 3 years.
(iii) To assess whether and to what extent SSA inputs have been made available to Madrasas
and Maktabs
(iv) To find out perception of parents about schooling facilities for Muslim children,
especially girls.
(v) To assess whether and to what extent SSA inputs provided specially for Muslim
community are utilized at the village level and in schools.
OJegOh

1.3 Demographic features; literacy rate with focus on Muslim population; Out-of-school children (total & Muslim)
1.3.1 Demographic features
Table 1.2 gives population, sex ratio and literacy rate in the sampled districts of selected states. It
may be observed from the table that as per 2011 Census, India had a population of 1,210,193,422
with 623,724,248 males and 586,469,174 (48.5%) females. The corresponding population figures for
the sampled districts together were 56,872,283 (total population), 29,332,034 (males) and
27,540,249 (females) respectively. The sex ratio for these districts was 939 as against 940 for the
country. Further, sampled districts of Kerala had the highest sex-ratio of 1099 while it was the
lowest in Rajasthan (852).
Table 1.2: Population, Sex Ratio and Literacy Rate in Sampled Districts
State Persons Males Females % of females
SexRatio
LiteracyRate
(1) (2) (3) (4) (5) (6) (7)India 1,210,193,422 623,724,248 586,469,174 48.5 940 74.0
Assam 5,991,640 3,059,375 2,932,265 48.9 958 70.3
Bihar 9,817,640 5,124,873 4,692,767 47.8 916 54.0
Gujarat 1,551,019 805,707 745,312 48.1 925 81.5
Haryana 1,089,406 571,480 517,926 47.5 906 56.1
Jammu & Kashmir 1,367,018 725,453 641,565 46.9 884 64.8
Jharkhand 1,612,357 822,020 790,337 49.0 961 56.5
Karnataka 2,089,649 1,034,714 1,054,935 50.5 1020 88.6
Kerala 8,419,230 4,011,601 4,407,629 52.4 1099 93.2
Madhya Pradesh 2,371,061 1,236,130 1,134,931 47.9 918 80.4
Rajasthan 669,919 361,708 308,211 46.0 852 57.2
Uttar Pradesh 20,002,922 10,573,678 9,429,244 47.1 892 71.6
Uttarakhand 1,890,422 1,005,295 885,127 46.8 880 73.4
Total 56,872,283 29,332,034 27,540,249 48.4 939 71.9
OJegOh

1.3.2 Literacy rate with focus on Muslim population
Literacy rate is an important indicator which is worked out in every census. According to
population census, a person is considered literate if she or he can read and write with
understanding in any language. It is seen from Table 1.2 that the literacy rate in the country was
74.0. The corresponding figure for the total of sampled districts was only 71.9. Among the
sampled districts, the highest literacy rate was recorded for the districts of Kerala (93.2) and the
lowest for the districts of Bihar (54.0).
1.3.3 Out-of-school children (total & Muslim)
Distribution of out-of-school children by gender and social group in different age-groups for
sampled districts (combined) according to the latest household survey conducted by the
respective states is presented in Table 1.3. Every state conducts such survey every year usually
with the help of teachers to find out the children for whom schooling facility is required. It may
be mentioned that the data in respect of Jammu & Kashmir, Kerala and Uttarakhand was found
either incomplete or inconsistent and therefore, not included in this table. It is seen from the table
that the total number of out-of-school children in the age-group 6 to below 14 years for the
sampled districts together was 107078 of which 53.4% were girls. The corresponding percentage
for Muslim girls was 53.2% which was almost the same as that for non-Muslim girls (53.5%).
Further, the percentage of girls among the out-of-school children belonging to Muslim
community in the age-group 6 to below 11 years (47.4%) was lower compared to that among
non-Muslim children (52.9%). But the position is reversed in the case of out-of school children
in the age-group 11 to below 14 years where the percentage of girls among the out-of-school
Muslim children (57.3%) was higher than that among non-Muslim children (54.2%).
The table further reveals that the percentage of girls among the out-of-school Muslim children was higher
than the corresponding percentage among the non-Muslim out-of-school children in the age-group 6 to
below 14 years in Assam, Haryana, Karnataka and Madhya Pradesh but the position is reversed in the
case of remaining states where the percentage of girls among the out-of-school Muslim children was
lower than the corresponding percentage among the non-Muslim out-of-school children.
LOOJgOh

Table 1.3: Number of out of school children identified through the latest household survey
State Category6 to below 11 years 11 to below 14 years 6 to below 14 years
Total Girls % of Girls
Total Girls % of Girls
Total Girls % of Girls
(1) (2) (3) (4) (5) (6) (7) (8) (9) (10) (11)
AssamTotal 8169 3756 46.0 6389 2876 45.0 14558 6632 45.6Muslims 5152 2494 48.4 4123 1803 43.7 9275 4297 46.3Non-Muslims 3017 1262 41.8 2266 1073 47.4 5283 2335 44.2
BiharTotal 16957 8332 49.1 14467 6821 47.1 31424 15153 48.2Muslims 10508 4902 46.7 9398 3995 42.5 19906 8897 44.7Non-Muslims 6449 3430 53.2 5069 2826 55.8 11518 6256 54.3
GujaratTotal 407 198 48.6 957 513 53.6 1364 711 52.1Muslims 45 17 37.8 122 63 51.6 167 80 47.9Non-Muslims 362 181 50.0 835 450 53.9 1197 631 52.7
HaryanaTotal 771 462 59.9 19496 13567 69.6 20267 14029 69.2Muslims 650 371 57.1 16420 11561 70.4 17070 11932 69.9Non-Muslims 121 91 75.2 3076 2006 65.2 3197 2097 65.6
JharkhandTotal 2499 1242 49.7 1624 784 48.3 4123 2026 49.1Muslims 669 323 48.3 500 223 44.6 1169 546 46.7Non-Muslims 1830 919 50.2 1124 561 49.9 2954 1480 50.1
KarnatakaTotal 68 29 42.6 69 19 27.5 137 48 35.0Muslims 9 4 44.4 7 2 28.6 16 6 37.5Non-Muslims 59 25 42.4 62 17 27.4 121 42 34.7
MadhyaPradesh
Total 908 434 47.8 656 443 67.5 1564 877 56.1Muslims 219 135 61.6 184 102 55.4 403 237 58.8Non-Muslims 689 299 43.4 472 341 72.2 1161 640 55.1
RajasthanTotal 12137 6764 55.7 4450 2051 46.1 16587 8815 53.1Muslims 3776 1802 47.7 569 220 38.7 4345 2022 46.5Non-Muslims 8361 4962 59.3 3881 1831 47.2 12242 6793 55.5
UttarPradesh
Total 8631 4253 49.3 8423 4590 54.5 17054 8843 51.9Muslims 2081 909 43.7 1767 997 56.4 3848 1906 49.5Non-Muslims 6550 3344 51.1 6656 3593 54.0 13206 6937 52.5
TotalTotal 50547 25470 50.4 56531 31664 56.0 107078 57134 53.4Muslims 23109 10957 47.4 33090 18966 57.3 56199 29923 53.2Non- 27438 14513 52.9 23441 12698 54.2 50879 27211 53.5
Note: Data about out-of-school Muslim and non-Muslim children in Ghaziabad district and out-of- school Muslim children in Bareilly district was not available and therefore, not included. The source of data is the Annual Work Plan and Budget submitted by the states every year.
Data in respect of Jammu & Kashmir, Kerala and Uttarakhand was found either incomplete or inconsistent and therefore, not included in this table. V.DOJeg
Oh

1.4 Educational Scenario in the sampled districts particularly with reference to Muslims; State level and district-wise information on total enrolment and percentage of Muslims in the enrolment by gender for all districts of the state.
This section deals with the existing position of primary and upper schools, teachers posted in
these schools and enrolment at primary and upper primary levels in the year 2010-11 in the entire
sampled districts. This information has been provided by the concerned states.
1.4.1 Primary and Upper primary schools and teachers in schools
Table 1.4 shows that the total number of primary and upper primary schools in the 25 sampled
districts together was 29396, and 14723 respectively. Of the total primary schools, 71.7% were
government schools. The corresponding percentage for upper primary schools was 67.1%.
Table 1.4 also gives management-wise distribution of teachers in position, along with percentage
of Muslim teachers, in entire primary and upper primary schools of sampled districts. It is
observed from the table that the teachers working in government primary schools constituted
71.3% of the total number of teachers in primary schools of the sampled districts whereas in
upper primary schools the corresponding percentage was only 63.9%. The table further reveals
that the percentage of Muslim teachers in government primary schools of the sampled districts
was 19% as against only 16.4% in private primary schools. The corresponding percentages of
Muslim teachers in government and private upper primary schools were 19.3% and 9%
respectively. In Gujarat, Kerala and Rajasthan not a single Muslim teacher was reported to be
working in any sampled primary or upper primary school while there was no Muslim teacher in
sampled upper primary schools in Uttarakhand.
1.4.2 Enrolment of Muslim and Non-Muslim children by gender in sampled districts
Enrolment at primary stage in the year 2011-12 for the sampled districts of every selected state is
presented in Table 1.5. The table shows that the total enrolment in primary classes in government
schools of the 25 sampled districts put together was 4,109,764 of which 38% were Muslims.
The corresponding figures for private schools were 2,313,926 and 14.7% respectively.
OJegOh

Table 1.4: Number of Schools according to School Category and Managementas on 30th September 2011
State Item Primary schools Upper Primary schoolsGovt. Private Govt. Private
(1) (2) (3) (4) (5) (6)
Assam No. of schools 5412 198 1023 112Total No. of teachers 10408 1081 6344 701% of Muslim teachers 35.9 51.9 39.6 50.2
Bihar No. of schools 3677 4 2412 266Total No. of teachers 20081 12 12851 1999% of Muslim teachers 34.8 25.0 51.3 33.6
Gujarat No. of schools 241 29 708 204Total No. of teachers 688 151 4890 2050% of Muslim teachers 0.0 0.0 0.0 0.0
Haryana No. of schools 548 10 346 120Total No. of teachers 2072 66 1106 1293% of Muslim teachers 34.7 22.7 20.9 27.5
Jammu & Kashmir
No. of schools N.A N.A N.A N.ATotal No. of teachers N.A N.A N.A N.A% of Muslim teachers N.A N.A N.A N.A
Jharkhand No. of schools 1365 55 695 36Total No. of teachers 2530 224 2859 369% of Muslim teachers 20.2 16.5 17.8 18.4
Karnataka No. of schools 280 17 653 212Total No. of teachers 550 53 3952 1254% of Muslim teachers 2.7 5.7 2.4 1.7
Kerala No. of schools 199 347 134 238Total No. of teachers 9309 8426 10128 8593% of Muslim teachers 0.0 0.0 0.0 0.0
MadhyaPradesh
No. of schools 839 269 372 923Total No. of teachers 3497 2158 1444 7653% of Muslim teachers 8.0 8.2 9.5 7.7
Rajasthan No. of schools 911 77 467 137Total No. of teachers 1274 291 2057 985% of Muslim teachers 0.0 0.0 0.0 0.0
Uttar Pradesh No. of schools 6938 6681 2887 2240Total No. of teachers 15249 12744 6655 2561% of Muslim teachers 2.3 29.0 0.7 24.2
Uttarakhand No. of schools 676 623 180 358Total No. of teachers 2187 2139 618 2373% of Muslim teachers 11.8 0.0 9.4 0.0
TotalNo. of schools 21086 8310 9877 4846Total No. of teachers 67845 27345 52904 29831% of Muslim teachers 19.0 16.4 19.3 9.0
Source: Information provided by the state against Item 5 of Sch. 2.
0 0OJgOh

Table 1.5: Enrolment at Primary Stage by Management and type of Schoolsas on 30th September 2011 in Sampled Districts
State School/Madrasah
Totalenrolment
% of Muslims % of girls
% of girls among Muslim
students(1) (2) (3) (4) (5) (6)
Assam(3)
Govt. school 783710 73.1 50.1 50.1Private school 50138 53.8 44.3 43.5Madrasah 7689 99.5 44.7 44.7
Bihar(3)
Govt. school 1505364 27.8 49.2 48.3Private school 4168 6.8 54.0 31.2Madrasah 59408 86.6 52.2 51.4
Gujarat(1)
Govt. school 97408 18.5 49.5 51.1Private school 52152 29.5 43.9 46.1Madrasah - - - -
Haryana(1)
Govt. school 156761 76.2 46.7 46.1Private school 24198 55.8 30.7 26.4Madrasah N.A. N.A. N.A. N.A.
Jammu & Kashmir
(3)
Govt. school N.A. N.A. N.A. N.A.Private school N.A. N.A. N.A. N.A.Madrasah N.A. N.A. N.A. N.A.
Jharkhand(2)
Govt. school 210976 33.7 48.9 49.4Private school 21392 12.7 41.6 45.0Madrasah 9877 100.0 53.5 53.5
Karnataka(1)
Govt. school 72681 35.7 49.3 49.8Private school 35793 26.7 48.3 49.2Madrasah - - - -
Kerala(3)
Govt. school 121612 36.0 50.2 49.3Private school 319486 31.2 49.6 49.5Madrasah - - - -
Madhya Pradesh (1)
Govt. school 91709 13.3 52.4 50.6Private school 124439 14.6 44.6 48.0Madrasah 36607 100.0 51.7 51.7
Rajasthan(1)
Govt. school 83386 37.6 48.3 57.5Private school 23934 8.4 32.5 22.6Madrasah 4442 92.3 44.9 46.3
Uttar Pradesh (5)
Govt. school 893918 22.6 51.2 51.1Private school 1551912 7.8 46.0 41.7Madrasah 20035 94.4 43.3 43.5
Uttarakhand(1)
Govt. school 92239 47.9 51.2 51.2Private school 106314 29.0 40.9 38.6Madrasah 18936 93.4 44.7 45.5
Total(25)
Govt. school 4109764 38.0 49.8 49.6Private school 2313926 14.7 45.8 43.9Madrasah 156994 93.2 49.5 49.4
Source: Information provided by the state on Item 4 of Sch. 2.
OJgOh

Girls constituted 49.8% of the total enrolment in primary classes in government schools as
against 45.8% in private schools. Further, the percentage of girls among the total Muslim
students in primary classes studying in government schools was 49.6% while the corresponding
percentage in the case of Muslim students studying in private schools was only 43.9%. This
indicates that the majority of parents of Muslim as well as non-Muslim children prefer to send
their male child to a private school and the female child to a government school.
Table 1.5 further reveals that the total number of children studying in primary classes in
recognized Madrasahs in 2011-12 was 156,994 of which 93.2% were Muslims. The percentage
of girls among the Muslim students was 49.4%.
Table 1.6 gives enrolment at upper primary stage in the year 2011-12 for the sampled districts of
the selected states. It is observed from the table that the total enrolment in upper primary classes
in government schools of the sampled districts was 1,418,320 of which 36.3% were Muslims.
The corresponding figures in private schools were 959,784 and 22.5% respectively. Girls
constituted 51% of the total enrolment in upper primary classes in government schools as against
45.3% in private schools. Further, the percentage of girls among the total Muslim students in
upper primary classes studying in government schools was 51.6% as against the corresponding
percentage of only 45.5% in the case of private schools.
From the above discussion it can be concluded that the majority of parents of Muslim as well as
non-Muslim children prefer to send their male child to a private school and the female child to a
government school.
Table 1.6 further reveals that the total enrolment in upper primary classes in recognized
Madrasahs in 2011-12 was 91,622 of which 92.7% were Muslims. The percentage of girls
among the Muslim students was 52.9%.
OJegOh

Table 1.6: Enrolment at Upper Primary Stage by Management and type of Schoolsas on 30th September 2011 in Sampled Districts
State School/ Madrasah Totalenrolment
% of Muslims % of girls
% of girls among Muslim
stufents(1) (2) (3) (4) (5)
Assam(3)
Govt. school 404411 64.8 54.3 55.7Private school 19516 51.9 44.7 44.4Madrasah 42888 93.0 56.6 57.0
Bihar(3)
Govt. school 355703 24.9 47.8 46.2Private school 4164 23.1 50.6 52.5Madrasah 25579 86.4 51.7 51.1
Gujarat(1)
Govt. school 44989 19.8 49.9 53.5Private school 24309 28.9 43.6 45.7Madrasah - - - -
Haryana(1)
Govt. school 39129 66.9 38.5 33.1Private school 10662 62.3 23.8 22.8Madrasah N.A. N.A. N.A. N.A.
Jammu & Kashmir
(3)
Govt. school N.A. N.A. N.A. N.A.Private school N.A. N.A. N.A. N.A.Madrasah N.A. N.A. N.A. N.A.
Jharkhand(2)
Govt. school 72262 29.6 50.1 53.3Private school 6727 12.9 44.2 64.8Madrasah 3977 100.0 55.5 55.5
Karnataka(1)
Govt. school 48248 38.3 48.4 48.5Private school 31982 24.6 47.7 47.1Madrasah - - - -
Kerala(3)
Govt. school 109361 32.7 48.6 48.5Private school 245293 23.5 47.4 49.4Madrasah - - - -
Madhya Pradesh (1)
Govt. school 46741 10.4 56.2 55.9Private school 107790 7.9 45.7 44.9Madrasah 11715 100.0 48.3 48.3
Rajasthan(1)
Govt. school 23054 15.4 41.0 30.4Private school 7596 7.2 28.8 19.1Madrasah 185 100.0 17.3 17.3
Uttar Pradesh (5)
Govt. school 248251 14.2 54.1 51.9Private school 467694 23.3 45.2 45.3Madrasah 6064 98.2 41.3 41.3
Uttarakhand(1)
Govt. school 26171 37.1 54.3 53.1Private school 34051 20.6 39.7 36.6Madrasah 1214 91.0 46.7 45.8
Total(25)
Govt. school 1418320 36.3 51.0 51.6Private school 959784 22.5 45.3 45.5Madrasah 91622 92.7 52.9 52.9
Source: Information provided by the state on Item 4 of Sch. 2.OJgOh

1.5 Review of earlier Studies/ Reports
(a) Baseline Survey of Minority Concentration Districts: An Overview of the Findings by
Shri D. Narasimha Reddy for Indian Council for Social Science Research, New Delhi.
The Ministry of Minority Affairs, Government of India (GOI) had identified 90 Minority
concentrated districts (MCDs) using eight indicators of socio-economic development and
amenities based on 2001 census data. A baseline survey of all the MCDs in the country had been
conducted in 2008 to explore development deficits in the availability of basic amenities and
infrastructural facilities. The survey was sponsored by the Ministry of Minority Affairs,
Government of India. Indian Council of Social Science Research (ICSSR) had been assigned the
task of coordinating the entire project. On the basis of the findings of these surveys an overview
paper was written by Shri D. Narasimha Reddy for ICSSR. In fact, this overview paper does not
summarize the findings of the MCD survey reports. Its main objective was “to examine whether
these district level assessments help in discerning any pattern across the districts in terms of the
indicators analyzed in the individual MCDs”. Some important observations in respect of MCDs
of individual states put together are given below.
1. The survey results confirm that in MCDs as a whole, the sex ratio of the Muslim community
was higher than that of the Hindu in all the selected states except in Jammu & Kashmir where it
was compared with Buddhists and was reported to be lower among the Muslims.
2. For the six and above age group, the average literacy levels for all the MCDs of individual
states put together shows that it was higher for the Hindus than the Muslim community in all the
selected states except Jammu & Kashmir, Kerala and Uttar Pradesh.
3. According to the survey, dropout rate in the age-group 5-15 years was marginally higher for
Muslims than for the Hindus in most of the states.
4. The percentage of 'never enrolled' children in the age-group 5-15 years was higher among
Muslims compared to among Hindus.
5. The MCDs in most of the states show that average size of the family of the minority ^
community is larger compared to that of Hindus. ^

(b) The Government of India constituted a High Level Committee under the Chairmanship of
Justice Sachar in 2005 for preparation of a Report on the Social, Economic and Educational
Status of Muslim Community of India and to suggest various welfare measures for Minorities.
The Committee submitted its report in November 2006. Mohamed Shafi Qureshi compiled
various observations and recommendations made in this report in 2010. The major points
covered in the report are:
1. The literacy rate among Muslims (59.1%) in 2001 was far below the National average (65.1%)
and other SRCs (70.8%).
2. State level estimates suggest that the literacy gap between Muslims and the general average is
greater in urban areas and for women.
3. As many as 25% of Muslim children in the 6-14 year age group have either never attended
school or have dropped out. Muslims have the highest dropout rate in the country.
4. Since artisanship is a dominant activity among Muslims, therefore technical training needs to
be imparted to even those who may not have completed schooling.
5. While some progress has been made over a period of time, disparities exist and the current
generation of Muslims is lagging behind in the field of education.
6. The gap between Muslims and other Socio-Religion Categories (SRCs) increases as the level
of education increases.
7. Muslims are at a greater disadvantage at the higher secondary level education in both rural and
urban areas and for both males and females.
8. Only 3% of Muslim children among the school going age go to Madrasahs.
9. The State must fulfill its obligation to provide affordable high quality school education
through the formal education system.
10. Despite the positive recommendations of various Committees, in many States, there is dearth
of facilities for teaching Urdu.OJgOh

11. In view of a large number of children with Urdu as their mother tongue Urdu should be
taught, as an elective subject, up-till graduation.
12. The gaps across all levels of education between Muslims and other Socio-Religion
Categories (SRCs) are higher in urban areas and for women. Muslim parents are not averse to
modern or mainstream education and sending their children to the affordable Government
schools. Therefore, the notion that Muslims prefer only Madrasah education is wrong.
1.6 Facilities and Incentive schemes (SSA and of state govt, if any); beneficiaries of these schemes (total and Muslims); mention of SPQEM and IDMI schemes of GOI for Madrasahs and coverage of Madrasahs if the state has these schemes; Teaching of Urdu.
1.6.1 Facilities and Incentive schemes
Table 1.7 gives the number of beneficiaries of different incentives/ facilities provided to children
in primary classes of sampled districts in the selected states. The table shows that free textbooks
in primary classes were given to 2,416,734 boys and 2,003,469 girls. Amongst boys 28.2% were
Muslims while the corresponding figure amongst girls was 32.4%. Among the states, the
percentage of Muslim children among those who received free textbooks was highest in Assam
(65.3% among boys and 68.2% among girls) and Haryana (67.3% among boys and 61.4% among
girls).
Free uniforms were supplied to 843,178 boys and 1,107,061 girls. The percentage of Muslim
beneficiaries amongst boys was 35.4% as against only 29.4% amongst girls. In the states of
Jharkhand and Kerala, scholarship was not given to any student in the sampled districts.
Scholarships were provided to 401,179 boys and 309,197 girls of whom 12.6% amongst boys
and 17.2% amongst girls belonged to Muslim community. Among the states, the scholarship was
given to the students in the sampled districts of only 5 states, namely, Gujarat, Karnataka,
Rajasthan, Uttar Pradesh and Uttarakhand.
The facilities of free transport was given to 1115 boys (1.3% Muslim) and 1058 girls (0.6%
Muslim); escorting children to school to 1148 boys (1.1% Muslim) and 1112 girls (0.4% ^
Muslim) and hostels to 426 boys (0.9% Muslim) and 563 girls (0.5% Muslim).

Table 1.7: Beneficiaries of different incentives/facilities at primary stage insampled districts in 2010-11
State BeneficiariesFree Textbooks Free Uniform Scholarship
Boys Girls Boys Girls Boys Girls(1) (2) (3) (4) (5) (6) (7) (8)
AssamTotal 365243 366413 156265 177527 0 0
% of Muslims 65.3 68.2 78.7 74.6 - -
BiharTotal 732667 713422 420596 412601 0 0
% of Muslims 29.2 28.9 32.5 32.8 - -
GujaratTotal 49164 48244 38853 38319 38853 38319
% of Muslims 17.9 19.1 9.1 14.4 9.1 14.4
HaryanaTotal 73435 58998 70681 52731 0 0
% of Muslims 67.3 61.4 - - - -
Jammu & Kashmir
Total - - - - - -
% of Muslims - - - - - -
JharkhandTotal 84173 77821 0 0 0 0
% of Muslims 29.6 30.8 - - - -
KarnatakaTotal 5963 5735 5084 4853 420 442
% of Muslims 24.9 21.6 22.9 19.6 1.2 3.6
KeralaTotal 372570 184125 0 0 0 0
% of Muslims 16.3 16.5 - - - -
MadhyaPradesh
Total 43697 48012 43697 48012 0 0
% of Muslims 13.8 12.9 13.8 12.9 - -
RajasthanTotal 43101 40285 13 255 241 193
% of Muslims 30.9 44.8 100 76.5 99.6 98.4
Uttar PradeshTotal 587319 398549 82530 323306 326464 233027
% of Muslims 7.5 11.5 5.9 6.6 9.7 13.6
UttarakhandTotal 59402 61865 25459 49457 35201 37216
% of Muslims 35.6 35.3 90.7 48.4 42.3 41.9
TotalTotal 2416734 2003469 843178 1107061 401179 309197
% of Muslims 28.2 32.4 35.4 29.4 12.6 17.2
Source: Information given by the state against Item 7 of Sch. 2. LO
OJgOh

Table 1.7 (Contd.): Beneficiaries of different incentives/facilities at primary stagein sampled districts in 2010-11
State BeneficiariesFree Transport Escorts Hostels
Boys Girls Boys Girls Boys Girls(1) (2) (9) (10) (11) (12) (13) (14)
AssamTotal 1071 1029 1115 1085 0 0% of Muslims 0.0 0.0 0.0 0.0 - -
BiharTotal 0 0 0 0 0 0% of Muslims - - - - - -
GujaratTotal 35 24 22 25 0 0% of Muslims 28.6 16.7 27.3 16.0 - -
HaryanaTotal 0 0 0 0 0 0% of Muslims - - - - - -
Jammu & Kashmir
Total - - - - - -% of Muslims - - - - - -
JharkhandTotal 0 0 0 0 166 0% of Muslims - - - - 0.0 -
KarnatakaTotal 0 0 0 0 231 392% of Muslims - - - - - -
KeralaTotal 0 0 0 0 0 0% of Muslims - - - - - -
MadhyaPradesh
Total 0 0 0 0 0 144% of Muslims - - - - - 0.7
RajasthanTotal 0 0 0 0 29 27% of Muslims - - - - 13.8 7.4
Uttar PradeshTotal 0 0 0 0 0 0% of Muslims - - - - - -
UttarakhandTotal 9 5 11 2 0 0% of Muslims 44.4 40.0 63.6 50.0 - -
TotalTotal 1115 1058 1148 1112 426 563% of Muslims 1.3 0.6 1.1 0.4 0.9 0.5
Source: Information given by the state against Item 7 of Sch. 2.
It is seen from Table 1.8 that out of 946,434 boys getting free textbooks at upper primary stage
20.9% were Muslims while 24.9% of the total 728,390 girls belonged to Muslim community.
The total number of boys and girls who got free uniform was 288,996 and 320,293 respectively
of whom about one-third boys as well as girls were Muslim. Out of 130,918 boys who received
scholarship, 9.2% were Muslim. The corresponding percentage for Muslim girls was 11.2%.
V.D
OJgOh

Free transport facility to children was not available in any sampled district. Escort facility also
was not available in the sampled districts except in Haridwar of Uttarakhand state where this
facility was provided to only two Muslim girls. Hostel facility to students was available only in 5
states, namely, Jharkhand, Karnataka, Madhya Pradesh, Rajasthan and Uttarakhand.
Table 1.8: Beneficiaries of different incentives/facilities at upper primary stagein sampled districts in 2010-11
State BeneficiariesFree Textbooks Free Uniform Scholarship
Boys Girls Boys Girls Boys Girls(1) (2) (3) (4) (5) (6) (7) (8)
AssamTotal 84118 103909 69425 72286 0 0% of Muslims 56.7 61.9 60.1 67.3 - -
BiharTotal 194883 177428 110357 105313 0 0% of Muslims 26.9 26.2 28.8 29.9 - -
GujaratTotal 22526 22463 10526 10463 10526 10463% of Muslims 18.4 21.2 23.6 27.4 23.6 27.4
HaryanaTotal 16861 8194 15307 6400 0 0% of Muslims 51.8 33.9 - - - -
Jammu & Kashmir
Total - - - - - -% of Muslims - - - - - -
JharkhandTotal 25282 22974 0 0 0 0% of Muslims 24.3 25.2 - - - -
KarnatakaTotal 52287 50316 33944 32854 2439 2675% of Muslims 33.1 34.2 36.8 38.3 10.2 12.2
KeralaTotal 312171 151087 0 0 0 0% of Muslims 13.4 14.2 - - - -
MadhyaPradesh
Total 20460 26281 20460 26281 1569 2107% of Muslims 10.5 10.3 10.5 10.3 18.4 21.2
RajasthanTotal 13612 9442 94 425 736 503% of Muslims 18.1 11.4 16 23.1 25.4 13.9
Uttar PradeshTotal 192481 143290 17306 52640 109817 89913% of Muslims 5.9 7.5 4.8 2.4 6.4 7.4
UttarakhandTotal 11753 13006 11577 13631 5831 7039% of Muslims 30.2 30.1 42.3 36 31 31.4
TotalTotal 946434 728390 288996 320293 130918 112700% of Muslims 20.9 24.9 33.4 32.6 9.2 11.2
Source: Information given by the state against Item 7 of Sch. 2.OJgOh

Table 1.8 (Contd.): Beneficiaries of different incentives/facilities at upper primary stagein sampled districts in 2010-11
State
(1)
Assam
Bihar
Gujarat
Haryana
Jammu & Kashmir
Jharkhand
Karnataka
Kerala
MadhyaPradesh
Rajasthan
Uttar Pradesh
Uttarakhand
Total
Beneficiaries
(2)Total% of MuslimsTotal% of MuslimsTotal% of MuslimsTotal% of MuslimsTotal% of MuslimsTotal% of MuslimsTotal% of MuslimsTotal% of MuslimsTotal% of MuslimsTotal% of MuslimsTotal% of MuslimsTotal% of MuslimsTotal% of Muslims
Free Transport
Boys(9)
0
Girls(10)
0
Source: Information given by the state against Item 7 of Sc
1.6.2 SPQEM and IDMI Schemes for Madrasahs
Escorts
Boys(11)
Girls(12)
100
100
Hostels
Boys(13)
h. 2.
122
1031.9
3361.8
5611.4
Girls(14)
13315.0
81
45510.52482.8
340
12577.3
Scheme for providing quality education in Madrasahs (SPQEM), Infrastructure development for
minority institutions (IDMI) and Sarva Shiksha Abhiyan are centrally sponsored schemes which
seek to bring about qualitative improvement in Madrasahs and schools to enable Muslim
children attain standards of the national education system in formal education subjects. Table 1.9
gives the number of Madrasahs, in the sampled districts of selected states, which benefitted
under these schemes. As mentioned earlier, there was no recognized Madrasah in Gujarat.
0 0
OJgOh
0 0 0 0 0 0
0 00 0 0 0
0 0 0 0 0
0 0 0 0 0
0 0 0 0
00 0 00
0 0 0 0 0 0
0 0 0 0 0
00 0 0
0 0 0 0 0 0
2 00 0 05
0 2

Information on this item was not given by the district level officers in Haryana, Jammu &
Kashmir, Karnataka and Kerala. The table shows that the percentage of Madrasahs benefitted
under SPQEM scheme was highest in Uttarakhand (65.2%) followed by Uttar Pradesh (14.5%)
and Assam (9%). Under the scheme of Infrastructure development for minority institutions
(IDMI), only 52 (2.4%) Madrasahs in the sampled districts were reported to be benefitted. Of
these, 40 Madrasahs (9%) existed in Assam, 9 Madrasahs in Rajasthan, 2 Madrasahs in Bihar
and only one Madrasah in Jharkhand. Further, the percentage of Madrasahs which benefitted
under SSA was highest in Jharkhand (93.2%) followed by Bihar (74.8%), Uttar Pradesh (74.4%)
and Assam (61.8%).
Table 1.9: Number and Percentage of Madrasahs benefitted from scheme for providing Quality Education in Madrasahs (SPQEM), Infrastructure Development for
Minority Institutions (IDMI) and SarvaShiksha Abhiyan (SSA)
StateTotal No. ofrecognizedMadrasahs
SPQEM IDMI SSA
No % No. % No. %
(1) (2) (3) (4) (5) (6) (7) (8)Assam 445 40 9.0 40 9.0 275 61.8Bihar 404 0 0.0 2 0.5 302 74.8Gujarat 0 0 0 0 0 0 0Haryana N.A. N.A. N.A. N.A. N.A. N.A. N.A.Jammu & Kashmir N.A. N.A. N.A. N.A. N.A. N.A. N.A.Jharkhand 44 1 2.3 1 2.3 41 93.2
Karnataka N.A. N.A. N.A. N.A. N.A. N.A. N.A.Kerala N.A. N.A. N.A. N.A. N.A. N.A. N.A.Madhya Pradesh 852 - - - - 335 39.3Rajasthan 134 8 6.0 9 6.7 74 55.2Uttar Pradesh 227 33 14.5 - - 169 74.4Uttarakhand 66 43 65.2 - - - -
Total 2172 125 5.8 52 2.4 1196 55.1Source: Item 6 of District Schedule 2.
1.6.3 Teaching of Urdu
Table 1.10 shows that there was a demand from Muslim parents for teaching of Urdu as a second
language in 10 of the 22 sampled districts which had supplied information on this item by theOJgOh

District Project Coordinators. These districts existed in Assam (1), Bihar (3), Haryana (1),
Karnataka (1), Madhya Pradesh (1), Rajasthan (1) and Uttar Pradesh (2). Urdu was being taught
in 1947 schools at primary level and 1366 schools at upper primary level. The total number of
teachers trained for teaching Urdu was 5822. Of these, 4655 (80%) teachers were teaching in
Bihar.
Table 1.10: Information about demand for teaching of Urdu as second language, number of schools actually teaching Urdu and number of teachers trained for teaching Urdu
State
No. of sampled districts
Muslim parents demanded for teaching Urdu
as 2nd language
Schools actually teaching Urdu
Primary level Upper Primary level
No. of teachers
trained for teaching
Urdu(1) (2) (3) (4) (5) (6)
Assam 359 102Bihar 971 562 4655GujaratHaryanaJammu & Kashmir N. A. N. A. N. A. N. A.Jharkhand 20 45 16Karnataka 18 38Kerala 488 488Madhya Pradesh 56 16Rajasthan 128 120Uttar Pradesh 378 77 395Uttarakhand 89 12 94Total 25 10 1947 1366 5822
Source: item 12 of Sch. 2
1.7 Structure of the report
The report comprises 8 chapters. The first chapter contains background information about the
study, objectives of the study, review of earlier studies, availability of facilities and incentive
schemes including beneficiaries of these schemes and structure of the report. The second chapter
deals with the methodology including sampling design used for selection of villages, towns and
schools, tools used for data collection, procedure of data collection and data analysis plan. The
third Chapter covers such aspects as availability of schooling facilities in Muslim concentratedOCN
OJgOh
3 1 03 31 0 0 0 01 0 0 0132 01 1 23 0 01 1 01 1 65 21 0

areas, availability of ancillary facilities and incentives offered to students under SSA. The fourth
chapter is devoted to teachers, their educational and professional qualifications, their attitude and
behavior, absence of teachers, relaxation (if any) given to Muslim teachers. The fifth chapter
focuses on such issues as enrolment in primary and upper primary schools, school leavers,
dropouts, absenteeism, support provided to school by the community, parity of Muslim and non-
Muslim students in respect of certain educational parameters. The sixth chapter presents detailed
information about sampled Madrasahs in the selected districts on such aspects as number of
classrooms, enrolment, teachers posted, availability of facilities/ incentives, etc. The seventh
chapter discusses parents’ opinion about school and teachers in relation to education of their
wards, availability of facilities in the schools and incentives provided to their children. The last
chapter (eighth) summarizes the findings.
CNOJgOh

Chapter 2
Methodology
This chapter deals with the sampling procedure followed for selection of schools, villages and
towns; tools used for data collection; organization of data collection and analysis of data.
2.1 Sampling Procedure
This study has been conducted in a few selected districts of 13 states having more than 20%
Muslim population. In every state, first of all a list of minority concentration districts (MCDs),
which have over 20% Muslim population, was prepared. From this list, requisite number of
districts (1 to 5) was selected randomly. In all 28 districts were selected from these states. List of
selected districts is given in Table 2.1. Since the data from West Bengal could not be available at
the time of writing this report, the findings for West Bengal are not being reported. All the
findings are based only on the data of 25 districts of 12 states.
Two stage sampling design has been used for the selection of villages/ towns and schools. At the
first stage, 2 to 4 blocks and 1 to 3 towns from each selected district were chosen.
In all, 30 villages have been selected from the sampled blocks in each district to represent rural
areas. For selection of villages, 30 schools were sampled from the list of schools of the selected
blocks. The villages in which these schools existed were automatically selected for collecting
village level data through Village questionnaire. While selecting the schools it was ensured that
they were located in different villages and about two-thirds were primary and one-third upper
primary schools. Selection of schools was done by following circular systematic sampling
procedure from the list of schools in each block, ensuring that there was only one school sampled
from a village. CNCNOJg
Oh

Table 2.1: List of Selected Districts
Sl. No. State Selected districts
1 Assam Dhubri, Karimganj, Nagaon (3)
Bihar Araria, Katihar, Pashchim Champaran (3)
Gujarat Bharuch (1)
Haryana Mewat (1)
Jammu & Kashmir Doda, Rajauri, Reasi (3)
Jharkhand Lohardaga, Sahibganj (2)
Karnataka Dakshina Kannada (1)
Kerala Kannur, Kozhikode, Palakkad (3)
Madhya Pradesh Bhopal (1)
10 Rajasthan Jaisalmer (1)
11 Uttar Pradesh Balrampur, Bareilly, Ghaziabad, Lucknow, Muzaffar Nagar (5)
12 Uttarakhand Hardwar (1)
13 West Bengal Birbhum, Koch Bihar, North 24 Pargana (3)
For selection of schools in urban areas, it was proposed to select 2 primary and 2 upper primary
schools from the list of schools of each selected town, ensuring that the two primary schools
were from different wards. The two wards then were automatically selected for collecting ward
level data.
As regards selection of recognised Madrasahs imparting general education to children, it was
decided to select 3 Madrasahs from the selected blocks and 2 Madrasahs from the selected towns
of the district.
Distribution of selected schools is given in Table 2.2. The total number of schools chosen from
25 selected districts was 1054 of which 783 (74.3%) schools were located in rural areas. Of the
783 schools in rural areas, 631 schools (405 primary and 226 with upper primary classes) were
run by the government and 152 schools (83 primary and 69 with upper primary classes) were
managed by private agencies. Out of 271 schools in urban areas, 175 (95 primary and 80 with
upper primary classes) were government schools while the remaining 96 schools (45 primary and
51 upper primary) were private schools.
0 0CNOJg
Oh
2
3
4
5
6
7
8
9

Table 2.2: Distribution of Sampled Schools/Madrasahs according to Area and Management
State SchoolCategory
Rural Urban Total
Govt. Private Total Govt. Private Total Govt. Private Total % of Govt
schools(1) (2) (3) (4) (5) (6) (7) (8) (9) (10) (11) (12)
Assam
Primary 58 2 60 15 1 16 73 3 76 96.1U. Primary 26 4 30 12 1 13 38 5 43 88.4Sec./Hr. Sec. 0 0 0 3 0 3 3 0 3 100.0Total 84 6 90 30 2 32 114 8 122 93.4
Bihar
Primary 57 3 60 13 1 14 70 4 74 94.6U. Primary 30 0 30 13 1 14 43 1 44 97.7Sec./Hr. Sec. 0 0 0 0 0 0 0 0 0 0Total 87 3 90 26 2 28 113 5 118 95.8
Gujarat
Primary 20 0 20 6 0 6 26 0 26 100.0U. Primary 10 0 10 5 1 6 15 1 16 93.8Sec./Hr. Sec. 0 0 0 0 0 0 0 0 0 0Total 30 0 30 11 1 12 41 1 42 97.6
Haryana
Primary 19 0 19 5 1 6 24 1 25 96.0U. Primary 10 1 11 1 3 4 11 4 15 73.3Sec./Hr. Sec. 0 0 0 2 0 2 2 0 2 100.0Total 29 1 30 8 4 12 37 5 42 88.1
Jammu & Kashmir
Primary 43 3 46 9 2 11 52 5 57 91.2U. Primary 38 3 41 6 4 10 44 7 51 86.3Sec./Hr. Sec. 1 0 1 0 3 3 1 3 4 25.0Total 82 6 88 15 9 24 97 15 112 86.6
Jharkhand
Primary 40 0 40 2 4 6 42 4 46 91.3U. Primary 20 0 20 2 2 4 22 2 24 91.7Sec./Hr. Sec. 0 0 0 0 2 2 0 2 2 0.0Total 60 0 60 4 8 12 64 8 72 88.9
Karnataka
Primary 8 2 10 5 3 8 13 5 18 72.2U. Primary 18 6 24 3 8 11 21 14 35 60.0Sec./Hr. Sec. 0 2 2 0 0 0 0 2 2 0.0Total 26 10 36 8 11 19 34 21 55 61.8
Kerala
Primary 25 51 76 9 16 25 34 67 101 33.7U. Primary 11 33 44 6 11 17 17 44 61 27.9Sec./Hr. Sec. 0 0 0 4 2 6 4 2 6 66.7Total 36 84 120 19 29 48 55 113 168 32.7
OJgOh

Table 2.2 (Contd.): Distribution of Sampled Schools/Madrasahs according toArea and Management
State SchoolCategory
Rural Urban Total
Govt. Private Total Govt. Private Total Govt Private Total % of Govt
schools(1) (2) (3) (4) (5) (6) (7) (8) (9) (10) (11) (12)
MadhyaPradesh
Primary 20 0 20 4 0 4 24 0 24 100.0U. Primary 9 1 10 2 2 4 11 3 14 78.6Sec./Hr. 0 0 0 0 0 0 0 0 0 0.0Total 29 1 30 6 2 8 35 3 38 92.1
Rajasthan
Primary 19 1 20 3 1 4 22 2 24 91.7U. Primary 10 0 10 3 1 4 13 1 14 92.9Sec./Hr. 0 0 0 0 0 0 0 0 0 0.0Total 29 1 30 6 2 8 35 3 38 92.1
UttarPradesh
Primary 84 14 98 18 14 32 102 28 130 78.5U. Primary 39 12 51 14 8 22 53 20 73 72.6Sec./Hr. 1 0 1 2 0 2 3 0 3 100.0Total 124 26 150 34 22 56 158 48 206 76.7
Uttarakhand
Primary 12 7 19 6 2 8 18 9 27 66.7U. Primary 3 5 8 2 2 4 5 7 12 41.7Sec./Hr. 0 2 2 0 0 0 0 2 2 0.0Total 15 14 29 8 4 12 23 18 41 56.1
Total
Primary 405 83 488 95 45 140 500 128 628 79.6U. Primary 224 65 289 69 44 113 293 109 402 72.9Sec./Hr. 2 4 6 11 7 18 13 11 24 54.2Total 631 152 783 175 96 271 806 248 1054 76.5
Source: Items 2, 8, 9 & 10 of Sch. 4; Items 9 & 10 of Sch. 5.
Table 2.2 further reveals that 79.6% of the total sampled primary schools were run by the
government or local body. This figure is very close to the percentage of government schools
(79.9%) covered under DISE for the entire district (see Table 2.3). Further, the percentage
of sampled government upper primaryschools was 72.9% as against 60.9% such schools
covered under DISE.LOCNOJeg
Oh

Table 2.3: Primary and Upper primary schools according to Management in sampled districts in the year 2011
StateNumber of schools in 2011
Primary Upper primaryTotal Govt % Total Govt %
Assam 5644 5446 96.5 2516 1224 48.6Bihar 3789 3789 100.0 2220 2210 99.5Gujarat 269 240 89.2 913 709 77.7Haryana 556 548 98.6 463 352 76.0Jammu & Kashmir 2524 2327 92.2 1910 1608 84.2Jharkhand 1393 1373 98.6 837 765 91.4Karnataka 354 290 81.9 1586 841 53.0Kerala 1341 408 30.4 1053 318 30.2Madhya Pradesh 932 822 88.2 1500 370 24.7Rajasthan 1002 919 91.7 608 470 77.3Uttar Pradesh 11295 7260 64.3 5805 3083 53.1Uttarakhand 1198 774 64.6 608 240 39.5
Total 30297 24196 79.9 20019 12190 60.9Source: DISE
2.2 Schedules for data collection
The following schedules were used for collection of data. These schedules were prepared at
Jamia Millia Islamia in collaboration with RESU and in consultation with the participating Agencies and
made available to the State agency conducting the study. Guidelines for data collection and data
analysis plan were also provided to the agencies.
(i) State schedule: Information on policy for education of Muslim children and facilities
provided for them; status of special interventions and incentives for such children.
(ii) District Schedule: Education facilities including Madarsas & Maktabs in the district;
gender-wise and total Muslim population (6 to 10 years and 11 to 13 years) according
to 2001 census, and information about SSA interventions and facilities provided to
Muslim children. V.DCN
OJgOh

(iii) Village/Town Fact Sheet: Habitation-wise/Ward-wise information was to be
collected on the following aspects.
• Estimated population (Total & Muslims) - Total and gender-wise in the age group
6 to 10 years and 11 to 13 years.
• Access and its quality so far as Muslim Children are concerned in recognized
primary and upper primary schools, Maktabs, Madarsahs, EGS and AIE centers
and unrecognized primary and upper primary schools.
• Enrolment - gender-wise, total and Muslims, in recognized and unrecognized
schools, AIE centers, EGS, Maktabs and Madarsahs and other educational
facilities.
• Status of special SSA interventions for Muslim children in the village/ward.
(iv) School Schedule: Status of special SSA interventions at school level; class-wise
enrolment during last 3 years; number of repeaters during last 2 years; teachers
engaged; availability of incentive schemes; support from community.
(v) Recognised Madrasah and Maktab schedule: Status of special SSA interventions
at Madrasah level; class-wise enrolment during last 3 years; number of repeaters
during last 2 years; teachers engaged; availability of incentive schemes; relaxation to
teachers and students during Ramzan month and for Friday prayer; support from
community.
(vi) Parents Schedule: Information about age, gender, education, etc. for the children in
the age-group 6 to below 14 years.
(vii) Investigator’s Observation Schedule: Investigator’s own observations on certain
points such as maintenance of school building, cleanliness in the school and its
surroundings, activities during morning assembly, behavior of teachers and students
during school hours.
CNOJegOh

2.3 Data Collection
The schedules provided by Jamia Millia Islamia were translated in regional language by the
agencies and got printed at their level in required quantity. Sufficient number of investigators
and supervisors were employed for data collection. They were provided two days training and
field experience before sending them for field work. The training of the field staff was arranged
in each district separately. Manual scrutiny checks for ensuring the completeness and
consistency of data were also explained during the training programme. The FGDs were
conducted by the senior staff following the guidelines provided by the coordinating institution,
Jamia Millia Islamia. Suitable arrangements were made for checking of data to ensure that all the
schedules were filled properly without any omissions.
2.4 Data Analysis Plan
After completion of scrutiny of data, the questionnaires were handed over for transcription on
magnetic media. Validation checks were also applied to check internal consistency of data. Data
analysis plan was developed centrally and made available to the state agencies. Analysis of data
was done on computers by the agencies themselves according to the guidance provided from the
central institution. Certain indicators such as Pupil-teacher ratio, percentage of school leavers and
percentage of school dropouts, etc. were developed. Some charts and diagrams were also prepared.
0 0CN
OJgOh

Chapter 3
Schooling Facilities in Muslim concentrated Areas in the
Selected Districts
3.1 Schooling facilities in Sampled Villages
This chapter deals with availability of schooling facilities at primary and upper primary stages in
the sampled villages of Muslim predominant districts in terms of percentage of population served
by (a) schools with primary section within the habitation or within a convenient walking distance
of 1 km and (b) schools with upper primary section within the habitation or within a convenient
walking distance of 3 km.
3.1.1 Sampled Villages, their Population, BPL households
Table 3.1 gives the distribution of sampled villages along with the population data; number of
BPL households and percentage of Muslim population in the villages. The table shows that a
sample of 735 villages with a total population of 4209647 was drawn from the 25 selected
districts of 12 selected states for collection of data on availability of educational facilities in rural
areas. Of the 735 villages, 349 (47.5%) villages were in the population slab ‘3000 and above’
while each one of the remaining 386 (52.5%) villages had a population of less than 3000. The
number of households in the 735 villages was 339711. The average number of BPL households
per village was 462.2; ranging from 54.9 BPL households in Rajasthan to 2393 BPL households
in Kerala. Muslims constituted 60.3% of the total population in these villages.
CNOJegOh

Table 3.1: Number of Sampled Villages, their population, Number of BPL (Below Poverty Line) households, BPL Households per village and
percentage of Muslim Population in different population slabs
State Population slab No. of villages
TotalPopulation
% of Muslim
Population
No. of BPL households
BPLhouseholds per village
(1) (2) (3) (4) (5) (6) (7)
AssamBelow 3000 41 69502 65.0 12631 308.1
3000 & above 49 347376 81.2 25284 516.0Total 90 416878 73.8 37915 421.3
BiharBelow 3000 56 82627 56.8 12352 220.6
3000 & above 34 288021 45.6 27805 817.8Total 90 370648 52.6 40157 446.2
GujaratBelow 3000 17 22878 49.2 1337 78.6
3000 & above 13 70824 68.3 3024 232.6Total 30 93702 57.5 4361 145.4
HaryanaBelow 3000 17 31014 94.4 1585 93.2
3000 & above 13 100500 89.6 3560 273.8Total 30 131514 92.3 5145 171.5
Jammu & Kashmir
Below 3000 67 62302 79.5 7581 113.13000 & above 16 112185 83.5 35665 2229.1
Total 83 174487 80.2 43246 521.0
JharkhandBelow 3000 51 58678 66.1 6710 131.6
3000 & above 9 76048 32.2 9655 1072.8Total 60 134726 61.0 16365 272.7
KarnatakaBelow 3000 23 6272 35.3 581 193.7
3000 & above 9 79567 30.6 17260 595.2Total 32 85839 31.0 17841 557.5
KeralaBelow 3000 0 0 0 0 0
3000 & above 58 1585237 30.6 138811 2393.3Total 58 1585237 30.6 138811 2393.3
MadhyaPradesh
Below 3000 31 31347 51.7 2686 86.63000 & above 2 11700 69.3 645 322.5
Total 33 49047 52.8 3331 100.9
RajasthanBelow 3000 28 24151 77.6 1333 47.6
3000 & above 5 27450 38.9 479 95.8Total 33 51601 71.7 1812 54.9
UttarPradesh
Below 3000 70 113602 51.7 4335 61.93000 & above 95 812357 59.6 20492 215.7
Total 165 925959 56.2 24827 150.5
UttarakhandBelow 3000 5 10904 55.8 660 132.0
3000 & above 26 179105 65.7 5240 201.5Total 31 190009 64.1 5900 190.3
TotalBelow 3000 386 513277 64.1 51791 134.2
3000 & above 349 3696370 56.1 287920 825.0Total 735 4209647 60.3 339711 462.2
OJgOh

3.1.2 Availability of schools having primary classes in (or within 1 km of) the habitations of sampled villages
Table 3.2 gives the number of habitations and their population served by primary sections. The
table shows that the total number of habitations in the sampled villages of the selected districts of
the 12 states was 15321497. Their total population was 32,28,07131,57,942 of which 58.459.5%
were Muslims. Of the 1532 1497 habitations, 1079 1054 (70.4%) habitations covering about
84.185.7% of the total Muslim population had primary schooling facility within the habitation;
3^ 251 (16.8%) habitations constituting about 10% Muslim population had these facilities in the
neighbouring habitation up to 1 km. There were 196-192 (12.8%) habitations, accounting for
64.4% of the total Muslim population, which did not have access to primary education within a
walking distance of 1 km. It can be seen from Table A3.2 in Appendix that about one-half of
these habitations had a population of below 300 each. Another 9.4% habitations fall under
population slab ‘301 to 500’; 21.9% such habitations belong to population slab ‘501 to 1000’
while the remaining 18.3% habitations had a population of above 1000 each. Provision of
schooling facility within 1 km for the children in these habitations needs special attention.
Criteria laid down by respective states for opening a new primary school is given in Table 3.3.
Table 3.2: Availability of Schools/Madrasahs having Primary Classes in the Habitation of Sampled Villages
Item Habitations having primary classes
All Habitations Within the habitation
Up to 1 km from the
habitation
Beyond 1 km from the
habitation(21 (31 (41 (5)
No. of Habitations 1497 1054 251 192Their total population 3157942 2701031 346175 110736Muslim Population 1878628 1609745 186617 82266% of Muslim Population served 100.0 85.7 9.9 4.4
OJgOh

Table 3.3: Neighbourhood Norms for opening a new Primary School
State Distance (in km)
Children Population Remark
Assam 1
Bihar 1 40 Minimum of 40 children in age- group 6-14
Guiarat 1Haryana 1 3Jammu & Kashmir 1Jharkhand 1Karnataka 1Kerala 1Madhya Pradesh 1 40Rajasthan 1Uttar Pradesh 1 300 Population of at least 300
Uttarakhand 1 25/40 200 25 children in rural areas and 40 children in urban areas.
Table A3.1 (in the Appendix) reveals that all the habitations of the selected villages in the states
of Gujarat, Haryana, Karnataka, Madhya Pradesh and Uttarakhand had access to primary school
education within 1 km. Bihar, Kerala and Uttar Pradesh are other twe-three states in which
almost all the habitations had these facilities within 1 km. On the other hand, Jharkhand (19.7%),
Kerala (15.3%), Jammu & Kashmir (12.3%) and Rajasthan (11.6%) are the states where primary
schooling facilities were not available within 1 km for more than 10% of the Muslim population
of the selected villages. (See also Figure 3.1).
3,1,3 Availability of schools/ Madrasahs having upper primary classes in (or within3 km of) the habitations of sampled villages
The number of habitations and their population served by schools having upper primary classes
is presented in Table 3.4. It is observed from the table that out of a total of 1532 1497 habitations
in the sampled villages, ^ j 6-687 (46.145.9%) habitations catering to 66.10% of the total Muslim
population had access to upper primary schooling facility within the habitation; 6^ 621 (41.5%)
habitations covering 2 9 .^ % of the total Muslim population had upper primary schooling facility
within a walking distance of 3 km while 190-189 (12.46%) habitations accounting for 4.56% of
the total Muslim population had schools with upper primary sections beyond 3 km. In such
habitations the needed facilities for upper primary education will have to be provided to meet theCNc nOJeg
Oh

requirements of RTE- 2009. . Criteria laid down by respective states for opening a new upper
primary school is given in Table 3.5.
Table 3.4: Availability of Schools/Madrasahs having Upper Primary Classes in the Habitation of Sampled Villages
ItemHabitations having upper primary classes
AllHabitations
Within the habitation
Up to 3 km from the
habitation
Beyond 3 km from the
habitation
(1) 21 (3) (H [5)No. of Habitations 1497 687 621 189
Their total population 3157942 2131316 917781 108845
Muslim Population 1878628 1239675 553238 85715
% of Muslim Population served 100.0 66.0 29.4 4.6
Table 3.5: Neighbourhood Norms for opening a new Upper Primary School
State Distance (in km)
Children Population
Remark
Assam 3
Bihar 3
Gujarat 3
Haryana1 At least 150 children in primary school
and minimum 30 children in class 5.
Jammu & Kashmir
3 Having two feeding primary schools.
Jharkhand 2
Karnataka 3 Class VIII - 5 km.
Kerala 3
Madhya Pradesh 3
Rajasthan 2
Uttar Pradesh 3 800 Population of at least 800.
Uttarakhand3 25/40 400 25 children in rural areas and 40 children
in urban areas.
0 0c n
OJgOh

Figure 3.1: Percentage of Muslim Population served by Schools/Madrasahs
having Primary Classes
Figure 3.2: Percentage of Muslim Population served by Schools/Madrasahs
having Upper Primary Classes
120
100
80
60
40
20
11 1
I L JJ ■ 1 . r LyiP ^ cj ■xv %. ef?I? c!^ oi> ci> ^
vV
I within the habitation
I up to 3 km
I Beyond 3 km
It is further observed from Table A3.3 (in Appendix) and Figure 3.2 that almost the entire
Muslim population of the selected villages in the states of Bihar (99.5%), Gujarat (99.5%),
Karnataka (100.0%), Kerala (99.6%) and Uttar Pradesh (97.7%) had access to upper primary
schooling facility within a walking distance of 3 km. Rajasthan is the only state where 44.2% ofc nOJegH3Dh

the total 52 habitations constituting 22.9% of the Muslim population of these villages did not
have this facility even up to 3 km. This is so mainly because of low population density in certain
parts of Rajasthan. Further, out of 189 habitations where upper primary schooling facilities were
not available within a walking distance of 3 km 45.5% habitations fall in population slab ‘up to
300’; another 17.5% in population slab ‘301 to 500’. It means majority of such habitations had
population up to 500 only (see Table A3.4 in Appendix).
3.1.4 Primary and Upper Primary schools existing in sampled villages
Table 3.6 gives the number of schools and recognized Madrasahs existing in the sampled
villages of the 12 states. It is observed from the table that there were 1593 primary, 729 upper
primary and 74 secondary/ higher secondary schools having upper primary classes in these
villages. In addition to these schools, 36 Madrasahs at primary level and 23 Madrasahs at upper
primary level also existed in these villages. However, there were no EGS centers as they all have
been upgraded to regular schools.
Table 3.6: Number of Schools/Madrasahs in the Village according to Level,Type and Management
Management
Level of school Recognized Madrasahs
Primary UpperPrimary
Sec./Hr. Sec having UP
Classes
with Primary Classes
with Upper Primary Classes
N % N % N % N % N %Govt/ Local Body 1097 68.9 473 64.9 34 45.9 7 19.4 14 60.9Private Aided 348 21.8 196 26.9 13 17.6 11 30.6 8 34.8Private Unaided 124 7.8 56 7.7 21 28.4 18 50.0 1 4.3Unrecognized 24 1.5 4 0.5 6 8.1 - - - -
Total 1593 100.0 729 100.0 74 100.0 36 100.0 23 100.0
Management-wise, 68.9% primary schools were run by government or Local Body, 29.6% were
managed by private agencies including 7.8% private schools not receiving any aid from the
government. In addition to these, 24 (1.5%) unrecognized primary schools were also functioning
in these villages. Among the states, most of the primary schools in Gujarat (92.9%), Haryana
(100.0%), Jammu & Kashmir (96.1%) and Jharkhand (95.8%) were government schools. On
comparing these percentages with DISE data of 2011 no discernible difference was found in the
LOc nOJeg
Oh

percentages in these states. On the other hand, Kerala (31.5%) and Uttarakhand (47.1%) are the
states where the percentage of government primary schools was less than 50% (See Table A3.5
and A3.6 in Appendix).
As regards upper primary schools, the percentage of government run schools was 64.9% which
was lower than that among primary schools. On the other hand, the percentage of private upper
primary schools was higher compared to that of private primary schools. Among the states, in
Gujarat (92.5%), Jammu & Kashmir (97.7%) and Jharkhand (95.5%) most of the upper primary
schools were run by government while the percentage of government schools was below 50% in
Kerala (35.1%) and Madhya Pradesh (48.0%).
Among the secondary/ higher secondary schools having upper primary classes, 34 (45.9%) of
them were government, 13 (17.6%) were private aided, 21 (28.4%) private unaided and 6 (8.1%)
were unrecognised schools.
As regards Madrasahs, out of 36 Madrasahs at primary level, 7 were government, 11 private
aided and 18 private unaided. At upper primary level, majority (60.9%) of the 23 Madrasahs
were run by the government.
Table 3.7: Number of Children and Schools/Madrasahs in the habitations of Sampled Villages
State
No. of children (in years)
No. of schools/ Madrasahs No. of children per school/ Madrasah
6 to below 11
11 to below 14
Primary Upper Primary/ Hr. Sec. with UP
classes
Primary Upper Primary/ Hr. Sec. with UP
classesAssam 55507 29941 289 101 192 296Bihar 61113 28117 189 55 323 511Gujarat 9018 5810 14 47 644 124Haryana 21770 11205 33 23 660 487Jammu & Kashmir 21517 13391 152 93 142 144Jharkhand 20106 10243 72 30 279 341Karnataka 6770 4421 13 19 521 233Kerala 128056 82586 306 174 418 475Madhya Pradesh 6443 3647 46 27 140 135Rajasthan 7845 3998 73 23 107 174Uttar Pradesh 127403 70424 357 204 357 345Uttarakhand 24752 13864 85 30 291 462
Total 490301 277646 1629 826 301 336V.Dc n
Source: Census 2011 for child population. OJegOh

It is observed from Table 3.7 that the total number of children in age-group 6 to below 11
years in the sampled villages as per Census 2011 was 490301 and the total number of
primary schools/ Madrasahs in these villages was 1629 in the year 2011 which gives on an
average one primary school per 301 children. Further, the total number of children in age-
group 11 to below 14 years in these villages was 277 646 and number of upper primary
schools/ Madrasahs or secondary schools with upper primary sections was 826 providing
an average of 336 children per school having upper primary classes. It may be mentioned
that some upper primary schools had primary classes also.
3,1,5 Enrolment in Primary and Upper Primary classes
Table 3.8 shows that a total of 287,583 children were enrolled in primary classes in all the
existing schools of selected villages. Of these, 173,768 (60.4%) were Muslim. Muslim girls
constituted half of the Muslim children while the percentage of girls among non-Muslim children
was 48.0%. Further, the total enrolment in upper primary classes was 111,610 of which 55.3%
were Muslims. The percentage of girls among the Muslim students was 50.1% which was
slightly higher than the percentage of girls among the non- Muslim children (48.7%).
Among the states, a discernible difference in percentage of girls among Muslim and non-Muslim
students in primary classes was noticed in Haryana and Madhya Pradesh. In both the states, the
percentage of girls among Muslim students at primary level was much higher than that among
non-Muslim children. In upper primary classes, a discernible difference in these percentages was
found in Jharkhand and Rajasthan where the percentage of girls among non-Muslim students was
higher than that among Muslim students (See Table A3.7 in the Appendix).
Table 3.8: Enrolment in Primary and Upper Primary Classes in Schools of Sampled Villages
ClassesTotal Muslim % of
Muslim students
% of girls among
Total Girls Total Girls Muslim Non-Muslim
I - IV/V 287583 141484 173768 86852 60.4 50.0 48.0
V/VI - VII/VIII 111610 55247 61765 30960 55.3 50.1 48.7
1 - VII/VIII 399193 196731 235533 117812 59.0 50.0 48.2
c nOJgOh

3.1.6 Recognized Madrasahs and Enrolment
It is observed from Table 3.9 that a total of 6030 children were enrolled in primary classes in all
the existing recognized Madrasahs of selected villages. Almost all children (96.1%) in these
classes belonged to Muslim community. Muslim girls constituted about half of the Muslim
children while the percentage of girls among non-Muslim children was 63.2%. Further, the total
enrolment in upper primary classes was 2239 of which 95.8% were Muslims. The percentage of
girls among the Muslim students was 57.0% which was much lower than the percentage of girls
among the non- Muslim children (73.7%). No recognized Madrasahs were reported to in
existence in the villages selected for this study in Gujarat, Jammu & Kashmir and Karnataka.
Table 3.9: Percentage of Girls in Primary and Upper primary Classes in Recognised Madrasahs in sampled Villages
ClassesTotal Muslim % of
Muslim students
% of girls among
Total Girls Total Girls Muslim Non-Muslim
I - IV/V 6030 3080 5796 2932 96.1 50.6 63.2V/VI - VI^VIII 2239 1293 2144 1223 95.8 57.0 73.71 - VII/VIII 8269 4373 7940 4155 77.3 52.3 67.8
3,1,7 KGBV in the Blocks and girls of selected villages enrolled in KGBVs
Table 3.10 presents the number of villages having KGBVs in the block to which the selected
village belonged and the number of girls from those villages enrolled in them. The table shows
that out of a total of 735 sampled villages of the 12 selected states, 477 (64.9%) villages had the
facility of KGBV within the block in which the selected village was. Among the states while all
the sampled villages of Haryana and Uttar Pradesh had this facility within the block, there was
no KGBV within the block of any selected village in Gujarat, Karnataka and Kerala. In Madhya
Pradesh, although 14 villages had the facility of KGBV within the block but no girl from these
villages was studying in them. In all 1800 girls from these villages were enrolled in KGBVs. Of
these, 919 (51.1%) were Muslim girls. On comparing the values of percentage of Muslim girls
among the total girls enrolled in KGBVs obtained from this survey with the corresponding state
level DISE data (2011-12), a discernible difference between the two was noticed in all the states.0 0c n
OJgOh

Table 3.10: Number of Villages having KGBV in the Block
StateNo. of villages
having KGBV in the Block
No. of Girls from these villages enrolled in KGBVs
Total Muslim% of Muslim
girls among the total girls
% Muslim girls enrolled in
KGBVs (State level DISE data of
2011-12)
Assam 39 _27- 24 .9 34.35
Bihar J 2 - 1401 729 52.0 12.93Gujarat 1.91Haryana J 0 - .46- 73.9 52.49Jammu & Kashmir J7_ J 7 . _26- 29.9 68.19Jharkhand 95 .46. 48.4 5.49
Karnataka 8.11Kerala N.A.
Madhya Pradesh 1 4 _ 2.94Rajasthan .23. 0.0 7.02Uttar Pradesh _1TL .58. 45.7 9.58
Uttarakhand 29 15 13.3 3.57
Total 477 1800 919 51.1 N.A.
3.2 Facilities in Sampled Schools
3.2.1 Classrooms and space for children in classrooms
Table 3.11 gives the number of classrooms and average enrolmm t perstudent classroom ratio (SCR) in
selected primary schools. The table also gives the distribution of these schools according to number
of classrooms in them. Similar table A3.9 (state-wise) is given in the Appendix. The table shows
that the total number of classrooms in the 487 primary schools in the sampled villages was 1968
which means, on an average, there were 4 classrooms per school. Among the states, the average
number of classrooms per school was highest in Kerala (6.2) followed by Uttarakhand (5.4),
Haryana (5.3) and Uttar Pradesh (5.0) while it was less than 3 in Assam (2.2), Bihar (2.9) and
Jammu & Kashmir (2.3). Now looking at the distribution of schools according to number of
classrooms in them, it was found that more than one-half of schools had 3 to 5 classrooms in
them. Another 17.7% schools had more than 5 classrooms while 29% schools had only 1 or 2
classrooms. In urban areas, there were 709 classrooms in 140 primary schools with an average of c nOJgOh
2 0
2

5.1 classrooms per school. State-wise analysis shows that the average number of classrooms per
school was highest in Jammu & Kashmir (9.1) followed by Kerala (6.8), Gujarat (6.2) and
Jharkhand (6.0); it was less than 4 in Assam (3.0), Bihar (3.4), Rajasthan (2.3) and Uttarakhand
(2.8). Further, majority of schools (54.3%) had 3 to 5 classrooms in them.
It is observed from the table that 80% of 627 primary schools were run by the government with
an average of 3.7 classrooms per school. The remaining 20% primary schools were managed by
private agencies. These schools, on an average, had 6.6 classrooms per school. Further, more
than 50% of government as well as private schools had 3 to 5 classrooms in them. The
percentage of government schools having only 1 or 2 classrooms was 32.7% as against 7.8% in
private schools.
Table 3.11 further reveals that the average enrolment perstudent classroom ratio (SCR) was 34.
The corresponding figure in rural and urban primary schools was 34 and 35 respectively.
Management-wise, the average enrolment per classroomSCR in government schools was 39 as
against only 24 in private schools. Among the states, the average enrolment per classroomSCR
was highest in Bihar (75) followed by Haryana (59) and Assam (58). On the other hand, in the
states of Jammu & Kashmir (14), Karnataka (10), Kerala (19) and Rajasthan (18), on average,
less than 20 students sit in a classroom.
Table 3.11: Number of Classrooms in Primary Schools
Area Total No. of schools
% of schools with classrooms
No. of classrooms Total enrolment
in allschools
AverageSCRenrol
1 - 2 3 - 5 > 5 Total Average class room(1) (2) (3) (4) (5) (6) (7) (8) (9)
Total 627 27.6 53.6 18.8 2677 4.3 90451 34
Rural 487 29.0 53.4 17.7 1968 4.0 65916 34
Urban 140 22.9 54.3 22.9 709 5.1 24535 35
Govt. 499 32.7 54.1 13.2 1837 3.7 71041 39
Private 128 7.8 51.6 40.6 840 6.6 19410 24
Table A3.10 in Appendix shows that a large percentage of primary schools (46.9%) had an
average SCR of more than 30 including 26.7% schools with an average SCR of more than 50.
O
OJgOh

The states which had over 50% of the selected primary schools with SCR of more than 30 are
Bihar (95.9%), Assam (81.6%), Haryana (75%), Uttarakhand (74.1%), Gujarat (61.5%) and
Jharkhand (56.5%). It is alarming to note that in a large percentage of primary schools in Bihar
(70.3%), Assam (57.9%) and Haryana (50%) average SCR was more than 50.
Distribution of upper primary schools according to number of classrooms in the school is
presented in Table 3.12. Similar table (state-wise) A 3.10-8 is given in the Appendix. It is
observed from the table that the total number of classrooms in 426 sampled upper primary
schools was 3203 averaging 7.5 classrooms per school. The average number of classrooms per
school in urban areas (8.9) was two percentage points higher than that in rural areas (6.9).
Among the states, the average number of classrooms per school was highest in Kerala (14.9)
followed by Haryana (10.4) and Karnataka (9.1) while it was the lowest in Assam (3.8). Further,
majority of schools, both in rural and urban areas, had more than 5 classrooms in them. The
average enrolment perstudent classroom ratio (SCR) was 33 in rural upper primary schools as
against 26 in urban schools. The corresponding figures for government and private schools were
33 and 26 respectively. Further, average enrolment perSCR in upper primary schools in rural
areas was 222 as against 228 in urban areas. The corresponding figures for government and
private schools were 197 and 292 respectively.
Table 3.12: Number of Classrooms in Upper Primary Schools
Area Total No. of schools
% of schools with classrooms
No. of classrooms Total enrolment
in allschools
Average enrolmm t per class roomSCR1 - 2 3 - 5 > 5 Total Average
(1) (2) (3) (4) (5) (6) (7) (8) (9)Total 426 8.2 37.8 54.0 3203 7.5 95298 30Rural 295 9.2 40.0 50.8 2033 6.9 65458 33
Urban 131 6.1 32.8 61.1 1170 8.9 29840 26
Govt. 306 9.8 46.1 44.1 1835 6.0 60277 33
Private 120 4.2 16.7 79.2 1368 11.4 35021 26
Table A3.12 in Appendix shows that 36.6% of the selected upper primary schools had an
average SCR of more than 35 including 19.8% schools with an average SCR of more than 50.OJgOh

The table further reveals that 50% or more.upper primary schools in Bihar (86.4%), Jharkhand
(65.4%), Assam (54.3%), Gujarat (50%) and Madhya Pradesh (50%) had average SCR of more
than 35.
Table 3.13 gives information about number of primary schools and number of classrooms having
insufficient seating space for childrenadverse SCR. It is seen from the table that 35.7% schools
in rural areas and 40.7% in urban areas did not have sufficient seating space to accommodate all
children in their respective classrooms. The corresponding figures for schools managed by
government and private agencies were 40.8% and 21.1% respectively. Further, looking at this
problem from another angle, i.e., lack of seating space for the students in classroom, it is
observed that the percentage of classrooms which had insufficient seating spaceadverse SCR in
rural schools was 18.0% as against 16.9% in urban schools. The corresponding figures for
government and private schools were 21.9% and 8.6% respectively. The above results indicate
that the problem of accommodating students either in schools or classrooms was more acute in
government schools than in private schools.
Table 3.13: Primary Schools with Number of Classrooms having adverse SCR
Area Total No. of schools
No. and % of Schools
seating spaceadverse SCR Total No. of
classrooms
No. of classrooms having
seatingspaceadverse
SCR
% of Col. 6 to Col. 5
Insufficient % of Col 3 to Col 2
(1) (2) (3) (4) (5) (6) (7)Total 628 231 36.8 2677 474 17.7Rural 488 174 35.7 1968 354 18.0Urban 140 57 40.7 709 120 16.9Govt. 500 204 40.8 1837 402 21.9Private 128 27 21.1 840 72 8.6
Table 3.14 shows that the percentage of upper primary schools having insufficient seating space
for the students in classroomsadverse SCR was 31.9% in rural areas against 33.6% such schools
in urban areas. The corresponding figures for government and private schools were 35.9% and
23.3% respectively. As regards availability of seating space in classrooms, 14.0% in rural areas
and 12.6% classrooms in urban areas lacked sufficient seating space. The percentage of such
classrooms was 16.5% in government schools and 9.5% in private schools. The above results
CN
OJgOh

clearly show that, like in primary schools, the problem of accommodating students in schools
and their classrooms is more acute in government schools than in private schools.
Table 3.14: Upper Primary Schools with Number of Classrooms having insufficient seating spaceadverse SCR
Area Total No. of schools
No. and % of Schools having insufficim t
seating spaceadverse SCR
Insufficient % of Col 3 to Col 2
Total No. of
classrooms
No. of classrooms having insufficient
seatingspaceadverse
SCR
% of Col. 6 to Col. 5
(1) (2) (3) (4) (5) (6) (7)Total 426 138 32.4 3203 432 13.5Rural 295 94 31.9 2033 284 14.0Urban 131 44 33.6 1170 148 12.6Govt. 306 110 35.9 1835 302 16.5Private 120 28 23.3 1368 130 9.5
3.2.2 Drinking Water
Availability of facilities like drinking water, functional toilets particularly for girls are presented
in Table 3.15. Similar table (state-wise) A3.15 is given in the Appendix. It is seen from the table
that the drinking water facility in rural areas was available in 79.5% primary schools and 82.7%
upper primary schools. The corresponding percentages for urban schools were 88.6% and 96.2%
respectively. In government schools, drinking water facility was available in 78.6% primary and
83.3% upper primary schools while much higher percentage of private schools, 93% primary and
95.8% upper primary schools, had drinking water facility. Among the states, drinking water
facility was not available in quite a large proportion of sampled rural primary schools of Assam
(36.7%), Jammu & Kashmir (58.7%), Haryana (36.8%) and Rajasthan (35.0%) while no such
situation was observed in urban primary schools. According to DISE data (2011-12), except
Assam (76.26%), Bihar (88.73%), Jammu & Kashmir (76.76%) and Jharkhand (87.03%)
all other selected states had drinking water facility in almost all primary schools. As
regards upper primary schools, over 90% of them had drinking water facility in Gujarat,
Karnataka, Kerala and Uttarakhand while Assam (63.0) and Jammu & Kashmir (61.8%)
are two states where this facility was available in less than 70% schools. OJgOh

3.2.3 Toilets - total and for girls
Table 3.15 shows that in rural areas, 71.9% primary schools and 78.6% upper primary schools
had functional toilets in them. The corresponding percentages for urban schools were 83.6% and
89.3% respectively. Management-wise analysis shows that in government schools, this facility
was available in 70.8% primary schools and 77.5% upper primary schools. The corresponding
percentages for private schools were 89.1% and 93.3% respectively. Among the states, it was
noticed that while more than 90% of the sampled primary schools in Gujarat, Kerala, Uttar
Pradesh and Uttarakhand had toilets, this facility was not available in a large proportion of
primary schools in Assam (46.1%), Bihar (47.3%) and Jammu & Kashmir (71.2%). The
percentage of upper primary schools having this facility was higher than that in primary schools
in almost all states (also see Table A3.15 in Appendix). According to DISE data (state average
for 2011-12) the states in which more than 90% primary schools had toilets for boys were
Haryana (92.04), Karnataka (97.86), Madhya Pradesh (90.59) and Uttarakhand (93.46%)
(see Table 3.16).
It is further seen from the table that 58.0% primary and 65.4% upper primary schools in rural
areas had separate functional toilets for girls while in urban areas such toilet facility was
available in 57.1% primary and 77.9% upper primary schools. Management-wise, 56.8% primary
and 62.7% government upper primary schools had separate functional toilets for girls while the
corresponding percentages for private schools were 61.7% and 85.8% respectively. Across
states, over 70% primary as well as upper primary schools in Karnataka, Uttar Pradesh and
Uttarakhand had separate functional toilets in them while in Assam and Jammu & Kashmir this
facility was not satisfactory in both category of schools. As per DISE data (2011-12), over
90% primary schools in Gujarat, Haryana, Karnataka and Rajasthan had separate toilet
for girls while the position was miserable in Jammu & Kashmir where only 15.02% primary
schools had this facility.
Table 3.15: Availability of Drinking Water and Toilet Facilities in Schools
AreaTotal No.
ofprimaryschools
% of primary schools having Total No. of upper primary schools
% of upper primary schools having
DrinkingWater
Functional
Toilets
Separate functional
toilet for girlsDrinking
WaterFunctionalToilets
Separate functional
toilet for girls(1) (2) (3) (4) (5) (6) (7) (8) (9)
OJgOh

Total 628 81.5 74.5 57.8 426 86.9 81.9 69.2Rural 488 79.5 71.9 58.0 295 82.7 78.6 65.4Urban 140 88.6 83.6 57.1 131 96.2 89.3 77.9Govt. 500 78.6 70.8 56.8 306 83.3 77.5 62.7Private 128 93.0 89.1 61.7 120 95.8 93.3 85.8
Table 3.16: Availability of Drinking Water and Toilet Facilities in Schools
State % of primary schools havingDrinking water Boys’ toilet Girls’ toilet
Assam 76.26 56.17 49.02Bihar .73 59.05 41.31Gujarat 99.97 54.27 99.55Haryana 99.34 92.04 91.78Jammu & Kashmir 76.76 32.50 15.02Jharkhand 87.03 71.38 63.64Karnataka 99.29 97.86 96.56Kerala 96.89 87.83 72.14Madhya Pradesh 97.89 90.59 75.60Rajasthan 92.38 67.72 93.18Uttar Pradesh 99.34 87.85 80.63Uttarakhand 95.70 93.46 75.03Source: DISE, 2011-12.
3.2.4 Electricity
Table 3.17 gives the number of primary schools having facilities of electricity, library books
and sports material. Similar table (state-wise) A3.16 is given in the Appendix. It is observed from the
table that out of 488 primary schools in rural areas electricity was available in 56.3% of them
including 21.5% schools where supply of electricity was there but it was not regular. In urban
areas, this facility was available in 75.1% schools including 9.4% schools having irregular
supply of electricity. It is unfortunate that a large number of primary schools both in rural
(43.6%) and urban areas (25.7%) had no electricity connection in them. Management-wise, while
electricity was mostly available in 75.8% private schools, only one-third of government schools
had this facility. Among the states, a large percentage of primary schools did not have an
electricity connection in Assam (55.3%), Bihar (60.8%), Jammu & Kashmir (52.6%), Jharkhand
(67.4%), Madhya Pradesh (62.5%) and Rajasthan (83.3%). On the other hand, electricity was
available and its supply was also regular in more than 90% primary schools in Gujarat,
Karnataka and Kerala. According to DISE data (2011-12) electricity connection was available
LO
OJgOh

in more than 90% primary schools in Gujarat, Haryana and Karnataka while this facility
was available only in less than 10% schools in Assam, Bihar, Jammu & Kashmir and
Jharkhand.
As regards availability of electricity in upper primary schools, it is observed from Table 3.17 that
63.8% schools in rural areas had electricity connection in them but its supply was not regular in
19.7% schools. There were 36.3% upper primary schools in rural areas which did not have
electricity connection. In urban areas, situation regarding availability of electricity was
somewhat better than that in rural areas as this facility was available in 80% of sampled urban
upper primary schools and irregularity in its supply was reported in only fewer than 10%
schools. However, one-fifth of the sampled schools were without electricity facility.
Management-wise, electricity was available only in 39.9% upper primary schools run by
government while another 19.3% had irregular supply of electricity. A large proportion of
schools (40.8%) did not have electricity connection in them. Among the private upper primary
schools, 93.4% had electricity connection in them but there was no regular supply in 9.2%
schools. Further, there were four states, namely, Bihar, Jammu & Kashmir, Jharkhand and
Madhya Pradesh where more than one-half of sampled upper primary schools did not have
electricity connection. Since computer education is being introduced at the upper primary stage
in a large number of schools, it is unfortunate that a large number of schools still do not have
electricity connection and even if they have, the supply is irregular (see Table A3.17 in
Appendix).
3.2.5 Library Books
Out of 488 sampled primary schools in rural areas, 56.1% schools had library books which were
also used by the students; 17.8% schools had library books but mostly these were not used. The
remaining 26% rural schools did not have any library books. In urban areas, library books were
available and also used by the students in 62.9% schools. Another 12.1% schools had library
books but mostly not used by the students. The remaining 25% urban schools did not have
library books. Management-wise, library books were available in 53% government schools as
against 75.8 % private schools.V.D
OJgOh

As regards availability of library books in rural upper primary schools it is seen that 64.1% of
them had library books which were also used by students. In 20.7% schools, library books were
not available. On the other hand, in urban areas, library books were available and mostly used by
the students in 75.6% of the sampled schools. There were only 13.7% urban upper primary
schools in which library books were not available. Management-wise, 81.7% upper primary
schools managed by private agencies had library books while library books were available only
in 62.1% government schools. Apparently private primary schools were better equipped with
library books than private upper primary schools whereas in the case of government schools the
opposite was true (See Table 3.18).
3.2.6 Sports Material
It is observed from Table 3.17 that sports material was available in 61.1% primary schools in
rural areas but was used only in 44.9% schools. There were 38.9% schools which did not have
any sports material or equipment. As regards availability of sports material in urban primary
schools 51.4% of them had sports equipment/ material, which was also used by the students.
Another 14.3% schools had sports material but mostly not used. About one-third schools were
without any sports material or equipment. Management-wise, sports material was available in
59.4% private primary schools as against only 43% government schools.
Table 3.18 also reveals that in 62.4% rural upper primary schools, sports material was available
and used while 13.2 % schools had sports material but it was not used. In urban areas, sports
material was available in 78.6% upper primary schools but it was used only in 67.9% schools.
Management-wise, sports material or equipment was available and used in only 57.2%
government upper primary schools whereas it was available in 81.7% private schools.
Table 3.17: Number of Primary Schools having Electricity, Library Books and Sports material Facilities
Area/Management
Total No. of
primary schools
Electricity Library Books Sports Material
Available
Irregular
Notavailable
Available
Available but mostly not used
Notavailable
Available
Available but mostly not used
Notavailable OJg
Oh

(1) (2) (3) (4) (5) (6) (7) (8) (9) (10) (11)
Total 628 41.7 18.6 39.6 57.6 16.6 25.8 46.3 15.8 37.9
Rural 488 34.8 21.5 43.6 56.1 17.8 26.0 44.9 16.2 38.9
Urban 140 65.7 8.6 25.7 62.9 12.1 25.0 51.4 14.3 34.3
Govt. 500 33.0 20.8 46.2 53.0 19.2 27.8 43.0 17.6 39.4
Private 128 75.8 10.2 14.1 75.8 6.3 18.0 59.4 8.6 32.0
Table 3.18: Number of Upper Primary Schools having Electricity, Library Booksand Sports material Facilities
Area/Management
Total No. of upper
primary schools
Electricity
Available
Irregular
Notavailable
Library Books
Available
Available but mostly not used
Notavailable
Sports Material
Available
Available but mostly not used
Notavailable
(1) (2) (3) (4) (5) (6) (7) (8) (9) (10) (11)
Total 426 52.3 16.4 31.2 67.6 13.8 18.5 64.1 12.4 23.5
Rural 295 44.1 19.7 36.3 64.1 15.3 20.7 62.4 13.2 24.4
Urban 131 71.0 9.2 19.8 75.6 10.7 13.7 67.9 10.7 21.4
Govt. 306 39.9 19.3 40.8 62.1 17.0 20.9 57.2 16.0 26.8
Private 120 84.2 9.2 6.7 81.7 5.8 12.5 81.7 3.3 15.0
3.3 Incentive Schemes
3.3.1. Free Uniform
After implementation of RTE Act, all SC, ST and BPL category children have to be provided not
one but two sets of free school uniform every year. But it is found that out of a total of 806
sampled government schools in the selected states, free uniform was given to all students only in
45.3% schools. Another 8.9% schools gave this incentive only to girls while 3.6% schools
provided it only to ‘SC/ST/BPL category students’ and 2.9% schools to only ‘girls of
SC/ST/BPL category’. There were two schools in the sample which gave this incentive to
0 0
OJgO h

Muslim students; in all other schools religion was not the basis for decision about giving free
uniforms to children. Free uniform was not distributed to any student in 39.1% schools which is
quite a large percentage, considering that it was obligatory for the government to provide it to all
students. In most of the 248 (88.7%) private schools free uniform was not given to any student.
Free uniform were supplied to all students in 6.5% private schools; to only girls in 2.8% schools;
to other category of students in very few schools (See Table 3.19).
3,3,2 Free Textbooks
Table 3.19 shows that out of 806 sampled government schools in the selected states, 95.5%
schools had given free textbooks to all students. Another 4 schools (0.5%) provided free
textbooks to only girls while this incentive was given to Muslim students in two schools and to
all SC/ST/BPL category students in one school. There were 3.6% schools in which no student
got free textbooks. Further, of the 248 sampled private schools free textbooks were given to all
students only in 55.2% schools. The percentage of private schools which did not give free
textbooks to any student was 41.9%.
Table 3.19: Special Incentives being provided to students in all sampled schools
Management Incentive
% of Schools provided incentives
Not provided
to any student
Provided to all
students
Provided to only girls
Provided to all
Muslim Students
Provided to only Muslim
Girls
Provided to all SC/ST/
BPL category students
Provided to only girls of SC/ST/
BPL category
(1) (2) (3) (4) (5) (6) (7) (8) (9)
Govt.
Free Text books 3.6 95.5 0.5 0.2 0.0 0.1 0.0Free School Uniform 39.1 45.3 8.9 0.1 0.1 3.6 2.9
Scholarship 29.9 29.2 2.4 3.0 2.7 26.1 6.8Cycles (in upper primary classes) 92.6 2.6 3.1 0.4 0.2 0.5 0.6
Some other 64.9 26.3 6.7 0.6 0.4 0.9 0.2
Private
Free Text books 41.9 55.2 1.6 0.4 0.4 0.4 0.0Free School Uniform 88.7 6.5 2.8 0.4 0.4 1.2 0.0
Scholarship 30.2 21.0 6.0 14.1 7.7 19.0 2.0Cycles (in upper primary classes) 95.2 0.0 2.8 0.0 0.8 1.2 0.0
Some other 87.1 8.5 0.4 1.2 0.4 1.2 1.2 OJgO h

Free Text books 12.6 86.1 0.8 0.3 0.1 0.2 0.0
TotalFree School Uniform 50.8 36.1 7.5 0.2 0.2 3.0 2.2
Scholarship 30.0 27.2 3.2 5.6 3.9 24.4 5.7Cycles (in upper primary classes) 93.2 2.0 3.0 0.3 0.4 0.7 0.5
Some other 70.1 22.1 5.2 0.8 0.4 0.9 0.5
3.3.3 Scholarship
It is observed from Table 3.19 that in 29.2% sampled government schools, scholarship was
provided to all students while this incentive was given only to all students belonging to ‘SC or
ST or BPL category’ in 26.1% schools; to only girls of ‘SC or ST or BPL category’ in 6.8%
schools; to ‘all Muslim students’ in 3% schools; to only ‘Muslim girls’ in 2.7% schools and to
‘only girls’ in 2.4% schools. However, this incentive was not given to any student in 30% of
schools. Among the private sampled schools, only 21% schools had given scholarship to all
students. Another 19% schools gave this incentive to all students belonging to ‘SC or ST or BPL
category’; 14.1% schools to ‘all Muslim students’; 7.7% schools to only ‘Muslim girls’; 6% to
only girls and 2% schools to only girls of ‘SC or ST or BPL category’.
3.3.4 Providing cycles (in upper primary classes)
Table 3.19 shows that in 92.6% of the sampled government upper primary schools no cycle was
given to any student. The corresponding percentage for sampled private schools was 95.2%.
Cycles were given to girls at upper primary stage, who resided beyond 2 to 3 km from the
school, in few schools in the selected states except Gujarat, Haryana, Rajasthan and Uttarakhand
in 2011. Preference was given to those girls who belonged to SC or ST or BPL category.
Generally, cycles were supplied to only girls but in a few government schools cycles were also
given to all students, to ‘all Muslim students’ and to all students belonging to ‘SC or ST or BPL
category’.
3.4 Other Issues
3.4.1 Attached Pre-primary classesOLO
OJgO h

Out of a total of 488 sampled primary schools in rural areas 32.4% had attached pre-primary
classes while this facility was available in 34.3% of 140 primary schools in urban areas.
Management-wise, 53.9% private primary schools had attached pre-primary classes as against
only 27.5% government schools. As regards upper primary schools 22.4% of the 295 schools in
rural areas and 30.5% of the 131 schools in urban areas had attached pre-primary classes.
Management-wise, this facility was available in 48.3% private schools as against only 15.7%
government schools.
Table 3.20: Number of Schools having Nursery/Pre-Primary Classes
State School Category Schools having nursery/pre-primary classesTotal Rural Urban Govt. Private
N % N % N % N % N %(1) (2) (3) (4) (5) (6) (7) (8) (9) (10) (11) (12)
AssamPrimary Schools 58 76.3 46 76.7 12 75.0 55 75.3 3 100.0Schools with Upper Primary Classes 2 4.3 2 6.7 0 0.0 1 2.4 1 20.0
BiharPrimary Schools 17 23.0 15 25.0 2 14.3 14 20.0 3 75.0Schools with Upper Primary Classes 14 31.8 10 33.3 4 28.6 14 32.6 0 0.0
GujaratPrimary Schools 0 0.0 0 0.0 0 0.0 0 0.0 0 0.0Schools with Upper Primary Classes 0 0.0 0 0.0 0 0.0 0 0.0 0 0.0
HaryanaPrimary Schools 6 24.0 3 15.8 3 50.0 6 25.0 0 0.0Schools with Upper Primary Classes 3 17.6 0 0.0 3 50.0 2 15.4 1 25.0
Jammu & Kashmir
Primary Schools 23 41.1 19 42.2 4 36.4 18 35.3 5 100.0Schools with Upper Primary Classes 25 45.5 18 42.9 7 53.8 15 33.3 10 100.0
JharkhandPrimary Schools 5 10.9 2 5.0 3 50.0 2 4.8 3 75.0Schools with Upper Primary Classes 5 19.2 1 5.0 4 66.7 1 4.5 4 100.0
KarnatakaPrimary Schools 7 38.9 2 20.0 5 62.5 2 15.4 5 100.0Schools with Upper Primary Classes 12 32.4 8 30.8 4 36.4 3 14.3 9 56.3
KeralaPrimary Schools 44 43.6 34 44.7 10 40.0 14 41.2 30 44.8Schools with Upper Primary Classes 22 32.8 12 27.3 10 43.5 6 28.6 16 34.8
MadhyaPradesh
Primary Schools 1 4.2 1 5.0 0 0.0 1 4.2 0 0.0Schools with Upper Primary Classes 2 14.3 0 0.0 2 50.0 0 0.0 2 66.7
Rajasthan Primary Schools 0 0.0 0 0.0 0 0.0 0 0.0 0 0.0 LOOJgO h

Schools with Upper Primary Classes 7.1 0.0 25.0 0.0 100.0
UttarPradesh
Primary Schools 37 28.5 30 30.6 21.9 24 23.5 13 46.4Schools with Upper Primary Classes 14 18.4 17.3 20.8 10.7 40.0
Uttra-khand
Primary Schools 29.6 31.6 25.0 5.6 77.8Schools with Upper Primary Classes 42.9 60.0 0.0 0.0 66.7
Primary Schools 206 32.8 158 32.4 48 34.3 137 27.5 69 53.9Total Schools with Upper
Primary Classes 106 24.9 66 22.4 40 30.5 48 15.7 58 48.3
3.4.2 Multi-grade teaching
Table 3.21 gives the number of primary schools and schools with upper primary classes having
multi-grade teaching in them. It is observed from the table that 68.6% rural primary schools and
59.3% urban primary schools had multi-grade teaching. Management-wise, about two-thirds of
both government and private primary schools had classes in which multi-grade teaching was
done. Amongst upper primary schools, 56.9% in rural areas and 45.8% in urban areas were
practicing multi-grade teaching. Management-wise, the percentage of such upper primary private
schools was slightly higher (55.8%) than the percentage of such government schools (52.6%).
Table 3.21: Number of Schools with Multi-grade Teaching
State School Category Schools having multi-grade teachingTotal Rural Urban Govt. Private
N % N % N % N % N %(1) (2) (3) (4) (5) (6) (7) (8) (9) (10) (11) (12)
AssamPrimary Schools 64 84.2 55 91.7 9 56.3 61 83.6 3 100.0Schools with Upper Primary Classes 7 15.2 6 20.0 1 6.3 7 17.1 0 0.0
BiharPrimary Schools 31 41.9 26 43.3 5 35.7 30 42.9 1 25.0Schools with Upper Primary Classes 17 38.6 13 43.3 4 28.6 17 39.5 0 0.0
GujaratPrimary Schools 10 38.5 9 45.0 1 16.7 10 38.5 0 0.0Schools with Upper Primary Classes 5 31.3 3 30.0 2 33.3 5 33.3 0 0.0
HaryanaPrimary Schools 9 36.0 6 31.6 3 50.0 9 37.5 0 0.0Schools with Upper Primary Classes 2 11.8 2 18.2 0 0.0 2 15.4 0 0.0
Jammu & Kashmir
Primary Schools 57 101.8 46 102.2 11 100.0 52 102.0 5 100.0Schools with Upper Primary Classes 55 100.0 42 100.0 13 100.0 45 100.0 10 100.0
CNLO
CJgroCX
1 0 1 0 1
7
9 85 6
8 26 1 7
6 6 0 0 6

JharkhandPrimary Schools 28 60.9 27 67.5 1 16.7 28 66.7 0 0.0Schools with Upper Primary Classes 15 57.7 12 60.0 3 50.0 14 63.6 1 25.0
KarnatakaPrimary Schools 11 61.1 7 70.0 4 50.0 10 76.9 1 20.0Schools with Upper Primary Classes 24 64.9 21 80.8 3 27.3 20 95.2 4 25.0
KeralaPrimary Schools 101 100.0 76 100.0 25 100.0 34 100.0 67 100.0Schools with Upper Primary Classes 67 100.0 44 100.0 23 100.0 21 100.0 46 100.0
Table 3.21 (Contd.): Number of Schools with Multi-grade Teaching
State School CategoryTotal
N %
Schools having multi-grade teachingRural
N %Urban
N %Govt.
N %Private
N %(1) (2) (3) (4) (5) (6) (7) (8) (9) (10) (11) (12)
MadhyaPradesh
Primary Schools 18 75.0 17 85.0 25.0 18 75.0Schools with Upper Primary Classes 28.6 20.0 50.0 9.1
0.0
100.0
RajasthanPrimary Schools 22 91.7 20 100.0 50.0 21 95.5Schools with Upper Primary Classes 13 92.9 10 100.0 75.0 13 100.0
50.0
0.0
UttarPradesh
Primary Schools 55 42.3 39 39.8 16 50.0 51 50.0Schools with Upper Primary Classes 17 22.4 11 21.2 25.0 15 26.8
14.3
10.0
Uttra-khand
Primary Schools 11 40.7 31.6 62.5 50.0Schools with Upper Primary Classes 14.3 20.0 0.0 20.0
22.2
11.1
TotalPrimary Schools 417 66.5 334 68.6 83 59.3 333 66.7Schools with Upper Primary Classes 228 53.5 168 56.9 60 45.8 161 52.6
84
67
65.6
55.8
3.4.3 Problems being faced by schools
The head teachers of the sampled schools were asked whether the school had faced any problem
in respect of certain educational activities such as new admission of students, dropping out of
students from school, irregularity in students’ attendance and poor achievement level of students
and whether the school had faced the problem in the case of all children or only Muslim
children? Table 3.22 shows that about 54% sampled government schools and about 27% private
schools in the selected states had faced problems in respect of irregularity in students’ attendance
for both Muslim and non-Muslim boys and girls. The problem of poor achievement level of
students was reported by about 51% government schools and about 31% private schools. The
0 0LO
CJgroCX
1 0
2 2 34 1
2 1
3 0
4
6 2
6 5 9 2
2 2 0 1 1

problem related to ‘dropping out of students from school’ was faced by about 38% government
and 22% private schools. The percentage of government schools which had faced problem
related to ‘new admission of students’ was between 18% for all boys and 20% for Muslim girls.
The proportion of private schools facing this problem was higher (27% for all children and 25%
for Muslim children) compared to government schools.
Table 3.22: Number of Schools which faced Problems in respect of different activities
Management ProblemNo. of
sampled schools
% of schools which faced problemFor all boys
For all girls
ForMuslim
boys
ForMuslim
girls(1) (2) (3) (4) (5) (6) (7)
Government
Getting New Students Admitted 806 17.9 19.4 18.2 20.1
Dropping out of students from school 806 38.2 38.5 38.5 38.7
Irregularity in students attendance 806 53.6 54.3 54.7 54.6
Poor achievement level of students 806 50.4 50.6 51.5 50.7
Private
Getting New Students Admitted 248 27.4 27.4 25.0 25.4
Dropping out of students from school 248 22.2 22.2 21.4 22.2
Irregularity in students attendance 248 26.6 28.2 27.4 27.4
Poor achievement level of students 248 30.6 30.2 31.9 30.2
Total
Getting New Students Admitted 1054 20.1 21.3 19.8 21.3Dropping out of students from school 1054 34.4 34.6 34.4 34.8Irregularity in students attendance 1054 47.2 48.2 48.3 48.2Poor achievement level of students 1054 45.7 45.8 46.9 45.9
LOOJegO h

Chapter 4
Teachers
4.1 Regular and contract teachers - total & Muslims by gender in primary and upper primary schools
Here we are going to present the information about the teachers working in primary schools and
schools having upper primary classes selected for this study in both rural and urban areas.
Table 4.1 presents the distribution of teachers according to school category in rural and urban
areas. The table shows that the total number of teachers in the sampled primary schools was
2788 of whom 1997 (71.6%) were posted in rural areas. Out of total teachers working in primary
schools, 1090 (39.1%) were Muslim. The corresponding figures in rural and urban areas were
42.0% and 31.9% respectively. Among the states, as per Table A4.5 in Appendix, the percentage
of Muslim teachers was more than 50% in Assam (56.0%), Gujarat (57.3%), Jammu & Kashmir
(56.8%) and Jharkhand (54.6%) while this percentage was less than 25 % in Haryana (24.1%),
Karnataka (17.7%) and Madhya Pradesh (14.8%). Further, 1482 (53.2%) of the total teachers
were female. It is seen from the table that the proportion of female teachers was much higher in
urban areas (69.8%) than in rural areas (46.6%). Among the total female teachers 469 (31.6%)
were Muslim. The percentage of females among the Muslim teachers was 43.0%. The
corresponding figures in rural and urban areas were 37.0% and 63.1% respectively. Further,
29.0% teachers were contract teachers or community paid teachers in primary schools while the
percentage of such teachers among the Muslim teachers was 34.2%. The percentage of
contract/community paid teachers in rural areas was 32.4% as against 20.5% in urban areas.
Among the states, the highest percentage of contract or community paid teachers was in
Jharkhand (74.1%) followed by Bihar (63.8%), Uttar Pradesh (44.7%) and Rajasthan (33.3%).
On the other hand, there were some states in which such teachers constituted less than 10% of
the total teachers. These states are Gujarat, Karnataka, Kerala and Madhya Pradesh (also see
Figure 4.1 and Table A4.5 in Appendix). '"QdCOh

Table 4.1: Number of Teachers in the Sampled Schools in Rural and Urban Areas
Area Category of teachers
No. of teachers in Primary schools
TotalTotal Female
Muslim
Total Female
No. of teachers in schools with upper primary classes
TotalTotal Female
Muslim
Total Female(1) (2) (3) (4) (5) (6) (7) (8) (9) (10)
RuralTotal
1997 930 838(42.0)
310(33.3)
2272 1127 765(33.7)
Regular1350 675 519
(38.4)199
(29.5)1871 946 568
(30.4)Contract & Community
647 255Paid
319(49.3)
111(43.5)
401 181 197(49.1)
240(21.3)
155(16.4)
85(47.0)
UrbanTotal
791 552 252(31.9)
159(28.8)
1478 960 442
Regular629 437 198
(31.5)128
(29.3)1240 809 353
(28.5)Contract & Community
162 115Paid
54(33.3)
31(27.0)
238 151 89(37.4)
262(27.3)
215(27.3)
47(31.1)
TotalTotal 2788 1482 1090
(39.1)469
(31.6)3750 2087 1207
(32.2)
Regular 1979 1112 717(36.2)
327(29.4)
3111 1755 921(29.6)
Contract & Community
809 370Paid
373(46.1)
142(38.4)
639 332 286(44.8)
502(24.1)
370(21.1)
132(39.8)
Note: Figures within parentheses indicate percentages of Muslim teachers among total teachers.
Management-wise distribution of teachers posted in primary schools and schools with upper
primary classes is given in Tables 4.2. The table shows that out of a total of 2788 teachers
teaching in primary schools 1941 (69.6%) were in government schools and the remaining 847
(30.4%) in private schools. The percentage of Muslim teachers in government schools was
41.7% as against 33.1% in private schools. Female teachers constituted 46.9% of the total
teachers posted in government primary schools while their proportion was much higher in
private schools (67.4%). Among the Muslim teachers also the proportion of females in
government schools was 39.9% as against 52.1% in privately managed schools. As regards the
proportion of contractual teachers, it was much higher in government schools (33.1%) than in
private schools (19.7%). The corresponding percentages of such teachers among Muslim
teachers were 32.8% and 24.7% respectively.V.DLO
OJgO h

Figure 4.1: Number of Teachers in the Sampled Primary Schools
800
700
600
500
400
300
200
100
ITotal teachers
I Contract teachers
Figure 4.2: Number of Teachers in the Sampled Upper Primary Schools
1400
12001200
1 nnn 1000
Qnn800
Ann600
yinn■ Total teachers
400
200
0
V
lLitlfci/ /
■ Contract teachers
^ ^ ^ >
LOOJegH3D h
0

Table 4.1 further reveals that half of the total 3750 teachers teaching in upper primary schools
were posted in rural areas. Female teachers constituted 55.7% of the total teachers in these
schools. Of the total teachers, 32.2% belonged to Muslim community. The corresponding figures
in rural and urban areas were 33.7% and 30.0% respectively. It may be seen from Table A4.5
that the highest percentage of Muslim teachers existed in Jammu & Kashmir (62.1%) followed
by Assam (47.9%), Gujarat (47.9%), Haryana (46.6%) and Bihar (44.9%). However in one state
namely Karnataka, the percentage of Muslim teachers was less than 10%. Further, the percentage
of contract or community paid teachers in upper primary schools was 17.0% which was much
lower than that in the case of primary schools. Among the states, Jharkhand had the highest
percentage of contract or community paid teachers (54.1%) followed by Uttarakhand (50.9%),
Bihar (43.2%), Jammu & Kashmir (34.0%) and Haryana (33.1%). The percentage of such
teachers was less than 10% in Assam, Gujarat, Karnataka, Kerala and Rajasthan. (Also see
Figure 4.2).
Table 4.2: Number of Teachers in Government and Private Schools in the total Sample of Schools of the 12 selected States
Manage-ment
Category of teachers
No. of teachers in Primary schools No. of teachers in schools with upper primary classes
Total Muslim Total MuslimTotal Female Total Female Total Female Total Female
(1) (2) (3) (4) (5) (6) (7) (8) (9) (10)
Govt.Total
1941 911 810(41.7)
323(35.5)
2065 976 774(37.5)
288(29.5)
Regular1299 642 509
(39.2)217
(33.8)1665 800 586
(35.2)208
(26.0)Contract & Community Paid
642 269 301(46.9)
106(39.4)
400 176 188(47.0)
80(45.5)
PrivateTotal
847 571 280(33.1)
146(25.6)
1685 1111 433(25.7)
214(19.3)
Regular680 470 208
(30.6)110
(23.4)1446 955 335
(23.2)162
(17.0)Contract & Community Paid 167 101 72
(43.1)36
(35.6) 239 156 98(41.0)
52(33.3)
Note: Figures within parentheses indicate percentages of Muslim teachers among total teachers. 0 0LOOJeg
O h

Out of a total of 3750 teachers in sampled schools with upper primary classes, 2065 (55.1%)
were posted in government schools and the remaining 1690 (44.9%) were in private schools. The
proportion of females among the total teachers in government schools was 47.3% as against
37.2% among the Muslim teachers. The corresponding figures in private schools were 65.9% and
49.4% respectively. It shows that the representation of females among the total as well as
Muslim teachers was much higher in private schools than in government schools. The proportion
of contractual teachers in sampled government schools was 19.4% as against 14.2% in private
schools. The corresponding figures of contractual teachers among Muslim teachers were 24.3%
and 22.6% respectively.
4.2 Educational and Professional Qualification of Teachers
4.2.1 Primary Schools
Distribution of teachers teaching in rural and urban primary schools as per their educational and
professional qualifications is presented in Tables 4.3 and 4.4 respectively while similar tables
giving state-wise figures are given in the Appendix (Tables A4.6 to A4.15). Out of a total of
2788 teachers teaching in the sampled schools, 47.2% were either graduates or post graduates.
The percentage of teachers having minimum graduate degree was much higher among non-
Muslim teachers (53.8%) compared to Muslim teachers (37.0%). In rural areas, the percentage of
graduate teachers was 46.6% as against 48.8% teachers in schools located in urban areas. About
one-third of the total teachers had higher secondary certificate while 19.2% teachers had passed
secondary examination only. The percentage of teachers who had passed only secondary
examination was comparatively higher among Muslim teachers (23.3%) than among non-
Muslim teachers (16.6%). The percentage of such teachers in rural and urban schools was 18.0%
and 22.3% respectively (Also see Figure 4.3). State-wise analysis of data reveals a large
variation among states with regard to proportion of teachers teaching in primary schools with
only a secondary pass qualification. The highest percentage of teachers with such qualification
were found in Gujarat (73.4%) followed by Assam (40.9%), Karnataka (35.5%) and KeralaLO
(28.3%).O h

Table 4.3: Educational Qualification of Primary School Teachers working inRural and Urban Areas
EducationalQualification
No. of teachers working in rural areas
No. of teachers working in urban areas
Total (Rural + Urban)
Muslim Non-Muslim Total Muslim Non-
Muslim Total Muslim Non-Muslim Total
(1) (2) (3) (4) (5) (6) (7) (8) (9) (10)
Secondary 192(22.9)
168(14.5)
360(18.0)
62(24.6)
114(21.2)
176(22.3)
254(23.3)
282(16.6)
536(19.2)
Hr. Secondary 340(40.6)
360(31.1)
700(35.1)
82(32.5)
141(26.2)
223(28.2)
422(38.7)
501(29.5)
923(33.1)
Graduate & above
300(35.8)
631(54.4)
931(46.6)
103(40.9)
283(52.5)
386(48.8)
403(37.0)
914(53.8)
1317(47.2)
Others 6(0.7)
0(0.0)
6(0.3)
5(2.0)
1(0.2)
6(0.8)
11(1.0)
1(0.1)
12(0.4)
Total 838(100.0)
1159(100.0)
1997(100.0
252(100.0)
539(100.0)
791(100.0
1090(100.0)
1698(100.0)
2788(100.0
Note: Figures within parentheses indicate per)centages.
Figure 4.3: Educational Qualification of Primary School Teachers
Muslim1.0
I Secondary
I Hr. Secondary
I Graduate & above
I Others
Regarding professional qualification of teachers working in primary schools, majority of teachers
(45.2%) had a certificate in primary education. Another 17.2% of teachers had a B.Ed. degree.
The percentage of Muslim teachers with B.Ed. degree was 12.7% as against 20.1% non-Muslim
OV.D
OJgD h

teachers. Untrained teachers accounted for 27.4% of the total teachers. The percentage of
untrained teachers was comparatively higher among Muslim teachers (35.0%) than among non-
Muslim teachers (22.6%) (Also see Figure 4.4). Among the states, the highest percentage of
untrained teachers was in Jharkhand (52.3%) followed by Bihar (46.1%), Jammu & Kashmir
(45.8%), Assam (44.0%) and Uttar Pradesh (41.4%).
Table 4.4: Professional Qualification of Primary School Teachers working inRural and Urban Areas
ProfessionalQualification
No. of teachers working in rural areas
No. of teachers working in urban areas
Total (Rural + Urban)
Muslim Non-Muslim Total Muslim Non-
Muslim Total Muslim Non-Muslim Total
(1) (2) (3) (4) (5) (6) (7) (8) (9) (10)Untrained 301
(35.9)266
(23.0)567
(28.4)81
(32.1)117
(21.7)198
(25.0)382
(35.0)383
(22.6)765
(27.4)Diploma/BTC/JBT
373(44.5)
541(46.7)
914(45.8)
96(38.1)
251(46.6)
347(43.9)
469(43.0)
792(46.6)
1261(45.2)
B.Ed. 104(12.4)
206(17.8)
310(15.5)
34(13.5)
135(25.0)
169(21.4)
138(12.7)
341(20.1)
479(17.2)
Others 60(7.2)
146(12.6)
206(10.3)
41(16.3)
36(6.7)
77(9.7)
101(9.3)
182(10.7)
283(10.2)
Total 838(100.0)
1159(100.0)
1997(100.0)
252(100.0)
539(100.0)
791(100.0)
1090(100.0)
1698(100.0)
2788(100.0)
Note: Figures within parentheses indicate percentages.
Figure 4.4: Professional Qualification of Primary School Teachers
V.DOJegD h

Distribution of government and private school teachers as per their educational and professional
qualifications is given in Tables 4.5 and 4.6. It is observed from Table 4.5 that majority of
teachers in government (46.6%) as well as in private schools (48.6%) had a B.Ed. degree. The
percentage of teachers with B.Ed. degree was lower among the Muslim teachers than among the
non-Muslim teachers working either in government or private schools. Further, of the total
teachers working in primary schools managed by either government or private agencies about
one-third had higher secondary certificate while about one-fifth teachers had passed secondary
examination only.
Table 4.5: Educational Qualification of Teachers working in Government and Private Primary Schools
EducationalQualification
No. of teachers working in government schools
No. of teachers working in private schools
Total
Muslim Non-Muslim Total Muslim Non-
Muslim Total Muslim Non-Muslim Total
(1) (2) (3) (4) (5) (6) (7) (8) (9) (10)
Secondary 183(22.6)
196(17.3)
379(19.5)
71(25.4)
86(15.2)
157(18.5
254(23.3)
282(16.6)
536(19.2)
Hr. Secondary 327(40.4)
324(28.6)
651(33.5)
95(33.9)
177(31.2)
27^(32.1
422(38.7)
501(29.5)
923(33.1)
Graduate & above
295(36.4)
610(53.9)
905(46.6)
108(38.6)
304(53.6)
41^(48.6
403(37.0)
914(53.8)
1317(47.2)
Others 5(0.6)
1(0.1)
6(0.3)
6(2.1)
0(0.0)
6(0.7)
11(1.0)
1(0.1)
12(0.4)
Total 810(100.0)
1131(100.0)
1941(100.0
280(100.0)
567(100.0)
847(100.
1090(100.0)
1698(100.0)
2788(100.0
Note: Figures within parentheses indicate per)c entages.
Table 4.6 reveals that 15.5% teachers in government schools and 21.1% teachers in private
schools had B.Ed. degree. The corresponding figures for Muslim teachers were 13.2% and
11.1% respectively. The percentages of teachers who had either a diploma or undergone
BTC/JBT training was 47.0% in government schools and 41.1% in private schools; the
percentage of such teachers was the highest among the non-Muslim teachers in government
CNV.DOJeg
O h

schools (49.5%). The percentage of untrained teachers was more or less same in both
government (27.8%) and private schools (26.6%).
Table 4.6: Professional Qualification of Teachers working in Government and Private Primary Schools
ProfessionalQualification
No. of teachers working in Govt. schools
Muslim Non-Muslim Total
No. of teachers working in Private schools
Muslim Non-Muslim Total
Total
Muslim Non-Muslim Total
(1) (2) (3) (4) (5) (6) (7) (8) (9) (10)Untrained 292
(36.0)
248
(21.9)
540
(27.8)
90
(32.1)
135
(23.8)
225
(26.6)
382
(35.0)
383
(22.6)
765
(27.4)Diploma/BTC/JBT
353
(43.6)
560
(49.5)
913
(47.0)
116
(41.4)
232
(40.9)
348
(41.1)
469
(43.0)
792
(46.6)
1261
(45.2)B.Ed. 107
(13.2)
193
(17.1)
300
(15.5)
31
(11.1)
148
(26.1)
179
(21.1)
138
(12.7)
341
(20.1)
479
(17.2)Any Other 58
(7.2)
130
(11.5)
188
(9.7)
43
(15.4)
52
(9.2)
95
(11.2)
101
(9.3)
182
(10.7)
283
(10.2)Total 810
(100.0)
1131
(100.0)
1941
(100.0)
280
(100.0)
567
(100.0)
847
(100.
1090
(100.0
1698
(100.0)
2788
(100.0)Note: Figures within parentheses indicate percentages.
4.2.2 Upper Primary Schools
Table 4.7 gives the distribution of teachers posted in schools with upper primary classes
according to area and their educational qualification. It is seen from the table that out of a total of
3750 teachers, 2043 (54.5%) teachers possessed a minimum graduate degree. The corresponding
percentages for Muslim and non-Muslim teachers were 49.0% and 57.1% respectively. Also see
Figure 4.5). Among the states, more than 70% teachers were either graduates or post-graduates
in Haryana (97.5%), Madhya Pradesh (93.4%), Rajasthan (73.8%), Uttar Pradesh (89.8%) and
Uttarakhand (73.3%). Another 28.2% teachers had higher secondary certificate while16.1%
teachers had passed only secondary school examination (Also see Figure 4.5). It was
disappointing to note that 57.7% teachers in upper primary schools in Gujarat state possessed
only secondary school qualification. The other states where more than 15% teachers had such
qualification are Bihar (16.8%), Jharkhand (16.8%), Karnataka (20.1%) and Kerala (23.8%).
0 0V.DOJg
O h

Figure 4.5: Educational Qualification of Upper Primary School Teachers
Muslim
2.1%
I Secondary
I Hr. Secondary
I Graduate & above
I Others
Figure 4.6: Professional Qualification of Upper Primary School Teachers
V.DOJegD h

Table 4.7: Educational Qualification of Teachers working in Schools having
Upper Primary classes in Rural and Urban Areas
EducationalQualification
No. of teachers working in rural areas
Muslim Non-Muslim Total
No. of teachers working in urban areas
Muslim Non-Muslim Total
Total (Rural + Urban)
Muslim Non-Muslim Total
(1) (2) (3) (4) (5) (6) (7) (8) (9) (10)
Secondary146
(19.1)
227
(15.1)
373
(16.4)
68
(15.4)
163
(15.7)
231
(15.6)
214
(17.7)
390
(15.3)
604
(16.1)
Hr. Secondary259
(33.9)
411
(27.3)
670
(29.5)
117
(26.5)
271
(26.2)
388
(26.3)
376
(31.2)
682
(26.8)
1058
(28.2)
Graduate & above
339
(44.3)
851
(56.5)
1190
(52.4)
253
(57.2)
600
(57.9)
853
(57.7)
592
(49.0)
1451
(57.1)
2043
(54.5)
Others21
(2.7)
18
(1.2)
39
(1.7)
4
(0.9)
2
(0.2)
6
(0.4)
25
(2.1)
20
(0.8)
45
(1.2)
Total765
(100.0)
1507
(100.0)
2272
(100.0
442
(100.0)
1036
(100.0)
1478
(100.0
1207
(100.0)
2543
(100.0)
3750
(100.0)Note: Figures within parentheses indicate percentages.
Table 4.8 gives information about professional qualification of teachers working in rural and
urban areas. The table shows that the proportion of teachers having different level of teaching
training was more or less same in both rural and urban schools. The percentage of total upper
primary school teachers possessing a B.Ed. degree was 31.1%. The corresponding figures for
Muslim and non-Muslim teachers were 23.9% and 34.5% respectively. Further, 37.3% of
teachers had undergone JBT/BTC training. Untrained teachers accounted for 23.3% of the total
teachers teaching in these schools. The percentage of untrained Muslim teachers was 35% which
was twice the percentage of the untrained among the non-Muslim teachers (Also see Figure 4.6).
Among the states, the percentage of untrained teachers was the highest in Assam (60.6%)
followed by Uttarakhand (50.9%), Jammu & Kashmir, Jharkhand (35.7%) and Bihar (31.1%).
LOV.D
OJgO h

Table 4.8: Professional Qualification of Teachers working in Schools havingUpper Primary classes in Rural and Urban Areas
ProfessionalQualification
No. of teachers working in rural areas
Muslim Non-Muslim Total
No. of teachers working in urban areas
Muslim Non-Muslim Total
Total (Rural + Urban)
Muslim Non-Muslim Total
(1) (2) (3) (4) (5) (6) (7) (8) (9) (10)Untrained 284
(37.1)
254
(16.9)
538
(23.7)
138
(31.2)
197
(19.0)
335
(22.7)
422
(35.0)
451
(17.7)
873
(23.3)Diploma/BTC/JBT
248
(32.4)
584
(38.8)
832
(36.6)
137
(31.0)
429
(41.4)
566
(38.3)
385
(31.9)
1013
(39.8)
1398
(37.3)B.Ed. 157
(20.5)
525
(34.8)
682 131
(29.6)
353
(34.1)
484
(32.7)
288
(23.9)
878
(34.5)
1166
(31.1)Any Other 76
(9.9)
144
(9.6)
220
(9.7)
36
(8.1)
57
(5.5)
93
(6.3)
112
(9.3)
201
(7.9)
313
(8.3)Total 765
(100.0)
1507
(100.0)
2272
(100.0)
442
(100.0)
1036
(100.0)
1478
(100.
1207
(100.0
2543
(100.0)
3750
(100.0)Note: Figures wit hin parentheses indicate percentages.
Tables 4.9 and 4.10 give distribution of upper primary school teachers teaching in government
and private schools according to their educational and professional qualification. It is seen from
Table 4.9 that the percentage of graduate teachers in government schools was 50.8% as against
59.1% in private schools. About one-third of government school teachers had higher secondary
pass certificate while the corresponding percentage in private schools was 22.6%. There were
15.4% teachers in government schools who had passed only secondary school examination as
against 17% such teachers in private schools.
In government schools 22.8% of teachers had a B.Ed. degree as against 38.8% teachers in private
schools. The percentage of teachers who possessed a diploma or BTC/JBT certificate in
government and private schools were 45.2% and 27.5% respectively. The proportion of
untrained teachers was more or less same in government schools (22.8%) and private schools
(23.9%) (see Table 4.10). V.DV.D
OJgO h

Table 4.9: Educational Qualification of Teachers working in Government and Private Schools having Upper Primary classes
EducationalQualification
No. of teachers working in government schools
No. of teachers working in private schools
Total
Muslim Non-Muslim Total Muslim Non-
Muslim Total Muslim Non-Muslim Total
(1) (2) (3) (4) (5) (6) (7) (8) (9) (10)
Secondary133
(17.2)
185
(14.3)
318
(15.4)
81
(18.7)
205
(16.4)
286
(17.0)
214
(17.7)
390
(15.3)
604
(16.1)
Hr. Secondary286
(37.0)
391
(30.3)
677
(32.8)
90
(20.8)
291
(23.2)
381
(22.6)
376
(31.2)
682
(26.8)
1058
(28.2)
Graduate & above
337
(43.5)
711
(55.1)
1048
(50.8)
255
(58.9)
740
(59.1)
995
(59.1)
592
(49.0)
1451
(57.1)
2043
(54.5)
Others18
(2.3)
4
(0.3)
22
(1.1)
7
(1.6)
16
(1.3)
23
(1.4)
25
(2.1)
20
(0.8)
45
(1.2)
Total774
(100.0)
1291
(100.0)
2065
(100.0
433
(100.0)
1252
(100.0)
1685
(100.0
1207
(100.0)
2543
(100.0)
3750
(100.0)Note: Figures within parentheses indicate percentages.
Table 4.10: Professional Qualification of Teachers working in Government and Private Schools having Upper Primary classes
ProfessionalQualification
No. of teachers working in Govt. schools
No. of teachers working in Private schools
Total
Muslim Non-Muslim Total Muslim Non-
Muslim Total Muslim Non-Muslim Total
(1) (2) (3) (4) (5) (6) (7) (8) (9) (10)Untrained 248
(32.0)
223
(17.3)
471
(22.8)
174
(40.2)
228
(18.2)
402
(23.9)
422
(35.0)
451
(17.7)
873
(23.3)Diploma/BTC/JBT
290
(37.5)
644
(49.9)
934
(45.2)
95
(21.9)
369
(29.5)
464
(27.5)
385
(31.9)
1013
(39.8)
1398
(37.3)B.Ed. 173
(22.4)
340
(26.3)
513
(24.8)
115
(26.6)
538
(43.0)
653
(38.8)
288
(23.9)
878
(34.5)
1166
(31.1)Any Other 63
(8.1)
84
(6.5)
147
(7.1)
49
(11.3)
117
(9.3)
166
(9.9)
112
(9.3)
201
(7.9)
313
(8.3)Total 774
(100.0)
1291
(100.0)
2065
(100.0)
433
(100.0)
1252
(100.0)
1685
(100.
1207
(100.0
2543
(100.0)
3750
(100.0)Note: Figures wit lin parent heses indicate percentages. V.D
OJgO h

In government schools 24.8% of teachers had a B.Ed. degree as against 38.8% teachers in private
schools. The percentage of teachers who possessed a diploma or BTC/JBT certificate in
government and private schools were 45.2% and 27.5% respectively. The proportion of
untrained teachers was more or less same in government (22.8%) and private schools (23.9%)
(see Table 4.10).
4.3 Schools according to Number of Teachers in them
Table 4.11 presents the distribution of teachers according to number of teachers posted in them.
The table shows that out of a total of 628 sampled primary schools 34 (5.4%) were single teacher
schools. Among the states, Rajasthan had more than 50% schools with only one teacher each.
Next was Uttarakhand state which had 14.8% such schools followed by Assam (10.5%) and
Jammu & Kashmir (10.5%). Table 4.11 further reveals that out of 426 upper primary schools, 22
(5.2%) were single teacher schools. Of these 22 schools, 21 existed in Uttar Pradesh.
Table 4.11: Distribution of Sampled Schools according to Number of Teachers in them
State School category Total No. of schools
Schools with no. of teachers1 2 More than 2
N % N % N %
AssamPrimary 76 8 10.5 29 38.2 39 51.3Upper Primary 46 1 2.2 0 0.0 45 97.8
BiharPrimary 74 0 0.0 8 10.8 66 89.2Upper Primary 44 0 0.0 0 0.0 44 100.0
GujaratPrimary 26 0 0.0 5 19.2 21 80.8Upper Primary 16 0 0.0 0 0.0 16 100.0
HaryanaPrimary 25 1 4.0 4 16.0 20 80.0Upper Primary 17 0 0.0 0 0.0 17 100.0
Jammu & Kashmir
Primary 57 6 10.5 31 54.4 20 35.1Upper Primary 55 0 0.0 3 5.5 52 94.5
JharkhandPrimary 46 0 0.0 18 39.1 28 60.9Upper Primary 26 0 0.0 1 3.8 25 96.2
KarnatakaPrimary 18 1 5.6 6 33.3 11 61.1Upper Primary 37 0 0.0 1 2.7 36 97.3
KeralaPrimary 101 0 0.0 0 0.0 101 100.0Upper Primary 67 0 0.0 0 0.0 67 100.0
MadhyaPradesh
Primary 24 0 0.0 9 37.5 15 62.5Upper Primary 14 0 0.0 1 7.1 13 92.9
RajasthanPrimary 24 14 58.3 6 25.0 4 16.7Upper Primary 14 0 0.0 1 7.1 13 92.9
0 0V.DOJg
O h

Table 4.11 (Contd.): Distribution of Sampled Schools according to Number of Teachers in them
State School category Total No. of schools
Schools with no. of teachers
N %2
N %More than 2N %
UttarPradesh
PrimaryUpper Primary
130 0.0 14 10.876 21 27.6 10.5
11647
89.261.8
UttarakhandPrimaryUpper Primary
27 14.8 11.114 0.0 0.0
2014
74.1100.0
TotalPrimaryUpper Primary
628 34 5.4 133 21.2426 22 5.2 15 3.5
461389
73.491.3
4.4 Absence of teachers (on day of visit)
Percentage of teachers who were present on the date of investigator’s visit to school is presented
in Table 4.12. The table giving state-wise figures is Table A4.16 in the Appendix. Table 4.12
shows that the percentage of teachers who were found present in rural primary schools (78.3%)
was slightly higher than that in urban schools (74.6%). Management-wise, percentage of teachers
who were found present in private schools (77.1%) was a little higher than that in government
schools (75.2%).
In upper primary schools, the percentage of teachers who were present in school was higher in
urban areas (77.1%) than in rural areas (73.2%). Management-wise, such percentage was much
higher in private schools (82.1%) than in government schools (71.5%).
Table 4.12: Percentage of Teachers present in School on the day of visit
Area/Management
No. of Teachers in Primary Schools
No . of Teachers in Schools with Upper Primary Classes
Total Present on day of visit
% of teachers present Total Present on
day of visit% of teachers
present(1) (2) (3) (4) (5) (6) (7)
Total 2788 2018 77.1 3755 2359 75.2
Rural 1997 1479 78.3 2276 1436 73.2
Urban 791 539 74.6 1479 923 77.1
Govt. 1941 1479 75.2 2065 1425 71.5
Private 847 539 77.1 1690 934 82.1 V.DOJg
O h
1
08
4 30 0

Comparison of Present Survey Data with Data of recently conducted study by EdCIL on Attendance of Teachers in Primary and Upper Primary Schools
It is seen from Table 4.13 that in the difference in attendance rate of primary school
teachers between the two surveys was found to be less than 5 percentage points in the states
of Bihar, Gujarat, Jammu & Kashmir, Madhya Pradesh, Uttar Pradesh and Uttarakhand.
Further, there were only four states namely Bihar, Haryana, Jammu & Kashmir and Uttar
Pradesh in which such difference between the two surveys was noticed as less than 5
percentage points.
Table 4.13: Percentage of Teachers present in the School on the day of visit
State School category% of teachers found present on day of visit
Present survey Earlier surveyRural Urban Total Rural Urban Total
Assam Primary 74.2 67.0 71.4 77.3 74.0 77.0Upper primary 57.4 69.4 62.7 71.1 88.6 72.7
Bihar Primary 78.0 77.2 77.8 81.4 81.6 81.4Upper primary 76.2 75.8 76.0 78.0 80.5 78.1
Gujarat Primary 92.1 97.1 93.5 94.0 94.4 94.1Upper primary 88.0 89.8 88.7 94.5 93.8 94.4
Haryana Primary 100.0 77.1 94.3 87.0 89.0 87.3Upper primary 80.5 95.3 88.3 85.5 77.7 85.0
Jammu & Kashmir
Primary 87.9 81.6 85.4 85.1 89.9 85.4Upper primary 79.2 90.9 84.1 82.4 92.0 83.6
Jharkhand Primary 78.9 82.9 79.9 91.0 94.8 91.1Upper primary 81.9 86.3 83.7 91.6 81.9 90.8
Karnataka Primary 40.0 37.0 38.7 80.4 80.8 80.4Upper primary 29.1 45.5 35.1 77.5 86.5 79.4
Kerala Primary 50.3 30.9 45.1 83.5 83.5 83.5Upper primary 48.1 18.3 37.7 79.8 80.3 79.9
MadhyaPradesh
Primary 87.9 86.7 87.5 84.0 84.7 84.1Upper primary 77.5 94.4 85.5 79.5 84.0 80.0
Rajasthan Primary 94.1 87.5 92.9 86.4 69.7 85.3Upper primary 91.7 84.0 88.5 77.1 72.8 76.7
UttarPradesh
Primary 83.5 85.5 84.0 83.3 90.1 83.8Upper primary 83.6 94.2 88.0 85.1 86.2 85.2
Uttarakhand
Primary 73.0 85.0 74.8 78.7 69.5 78.1Upper primary 85.3 81.0 84.5 76.7 83.7 77.5
Total Primary 78.3 74.6 77.1 N.A N.A N.AUpper primary 73.2 77.1 75.2 N.A N.A N.A
Source: Study on Students and Teachers Attenc ance in Primary and Upper Primary Sc hools,O
EdCIL, New Delhi, 2013. OJgO h

4.5 Relaxation in time, if any, given to Muslim Teachers and Students during Ramzan andon Fridays
4.5.1 Relaxation during Ramzan month
Table 4.14 gives information about type of relaxation, if any, given to Muslim teachers and
students in the month of Ramzan in rural and urban schools. The state-wise figures are given in
Tables A4.17 and A4.18 in the Appendix. It is seen from Table 4.14 that in rural areas, no
relaxation was allowed to teachers in 65.8% schools and to students in 76% schools. Permission
to leave the school early was given to teachers and students in 12.4% and 20.3% schools
respectively. There were only about 4% schools in which both teachers and students were
allowed to come to school late. School hours were changed in 10.6% schools during Ramzan
period.
In urban areas, 64.2% schools did not provide any relaxation to teachers while such percentage
in the case of students was 77.1%. The percentage of schools in which teachers and students
were permitted to leave the school early was 14% and 21% respectively. There were 11.8%
schools which changed school hours during Ramzan month.
Table 4.14: Type of relaxation given to Muslim teachers and students in School Hours during Ramzan Month
Area Relaxation to teachers/ Students
Total No. of schools
% of schools providing Relaxation to teachers/ students in school hours during Ramazan
NoRelaxa
tion
Leavingschoolearly
Coming late to school
Changingschoolhours
Someother
(1) (2) (3) (4) (5) (6) (7) (8)
RuralTeachers 783 65.8 12.4 3.8 10.6 7.4
Students 783 76.0 20.3 3.7 0.0 0.0
UrbanTeachers 271 64.2 14.0 1.1 11.8 8.9
Students 271 77.1 21.0 1.8 0.0 0.0
TotalTeachers 1054 65.4 12.8 3.1 10.9 7.8
Students 1054 76.3 20.5 3.2 0.0 0.0OJg
O h

Information regarding type of relaxation given to Muslim teachers and students to attend Friday
prayers during school hours is presented in Table 4.15. The table shows that in majority of
schools in rural areas, one hour break was provided for teachers (45.3%) and students (52.9%).
The practice of closing the school early on Friday was followed in about 12% of schools.
However, no relaxation was given to Muslim teachers and students in 43.2% and 34.6% of
schools respectively. In urban areas, one hour break was allowed in 43.2% and 50.2% schools
for teachers and students respectively. A little over 10% schools were closed early for Friday
prayers. However, no relaxation was provided to teachers and students in 46.5% and 38.7%
schools respectively.
4.5.2 Relaxation for the Friday Prayers
Table 4.15: Type of relaxation given to Muslim teachers and students in School Hours for the Friday Prayer
AreaRelaxation to teachers/ Students
Relaxation given to teachers in school hours for Friday Prayer
No relaxation Break for about 1 hour
School closed early
Total
N % N % N % N %
(1) (2) (3) (4) (5) (6) (7) (8) (9) (10)
RuralTeachers 338 43.2 355 45.3 90 11.5 783 100.0
Students 271 34.6 414 52.9 98 12.5 783 100.0
Urban Teachers 126 46.5 117 43.2 28 10.3 271 100.0
Students 105 38.7 136 50.2 30 11.1 271 100.0
TotalTeachers 464 44.0 472 44.8 118 11.2 1054 100.0
Students 376 35.7 550 52.2 128 12.1 1054 100.0
CN
OJgO h

Chapter 5
Enrolment and Retention
5.1 Enrolment (Total & Muslims) in Rural and Urban Primary Schools; trend over last 3 years; PTR
This chapter discusses such issues as enrolment in sampled primary and upper primary schools,
school leavers, retention, dropout, absenteeism, support provided to school by the community,
parity of Muslim and non-Muslim students in respect of certain educational parameters.
5,1,1 Enrolment in Primary Classes (I-V)
Enrolment of all children as well as of Muslim children (as on 30th September) in primary classes
in rural and urban areas in the years 2009, 2010 and 2011 is given in Table 5.1. State-wise data is
given in Tables A5.1, A5.2 and A5.3 of the Appendix. It is seen from Table 5.1 that the total
enrolment in primary classes in the year 2009 was 148,169 which had decreased to 147,266 in
2010 and further decreased to 144,144 in 2011. There is an overall decrease of 2.7% between
2009 and 2011. Further, the percentage of Muslim children among the total children enrolled in
primary classes was more or less same during the last three years. It varied from 62.4% in 2009
to 62.8% in 2010. In rural and urban areas also, it was more or less same during the last three
years. However, the percentage of Muslim children was much lower in urban areas than in rural
areas; it was 66.4% in rural areas as against 53.9% in urban areas in the year 2011. Among the
states, the percentage of Muslim children in the year 2011 was the highest in Assam (79.9%)
closely followed by Haryana (76.2%), Jammu & Kashmir (73.4%) and Uttarakhand (71.3%). On
the other hand, this percentage was less than 60% in Bihar (54.9%), Gujarat (57.5%), Karnataka
(58.0%) and Madhya Pradesh (38.8%) (see Table A5.3 in Appendix).
As regards enrolment of girls, it may be noticed that the proportion of girls among the total
enrolment in the last three years was more or less same in both rural and urban areas. It varied
from 48.0% in rural schools in 2009 to 49.3% in urban schools in the years 2010 and 2011.
Further, no discernible variation was noticed in the proportion of girls among total MuslimOJg

children during these three years. It varied from 48.0% in rural schools in 2009 to 50.3% in
urban schools in 2011. Further, girls constituted less than 50% of the total as well as Muslim
children enrolled in primary classes in the year 2011 in all the selected states except Haryana and
Madhya Pradesh. But the proportion of Muslim girls in the total girls’ enrolment was found more
than 50% in all the states except Madhya Pradesh (41.3%). Among the remaining states, this
proportion was the highest in Haryana (81.8%). The next was Assam (80.5%) followed by
Jammu & Kashmir (73.1%) and Uttarakhand (71.2%) (see Table A5.3 in Appendix).
Table 5.1: Enrolment as on 30th September in Primary Classes of Sampled Schools in Rural andUrban Areas in 2009, 2010 and 2011
Area YearEnrolment in primary classes
Total Muslim % of Muslims
Total Girls % of girls
Total Girls % of girls
Total Girls
(1) (2) (3) (4) (5) (6) (7) (8) (9) (10)
Rural2009 103749 49772 48.0 68674 32930 48.0 66.2 66.2
2010 104090 51136 49.1 68914 33586 48.7 66.2 65.7
2011 101651 49098 48.3 67546 32520 48.1 66.4 66.2
Urban2009 44420 21558 48.5 23759 11546 48.6 53.5 53.6
2010 43176 21285 49.3 23583 11675 49.5 54.6 54.9
2011 42493 20944 49.3 22892 11509 50.3 53.9 55.0
Total2009 148169 71330 48.1 92433 44476 48.1 62.4 62.4
2010 147266 72421 49.2 92497 45261 48.9 62.8 62.5
2011 144144 70042 48.6 90438 44029 48.7 62.7 62.9
5.1.2 Comparison of Enrolment figures of 2009, 2010 and 2011
Table 5.2 gives percentage increase in enrolment at primary level between 2009 & 2010 and
between 2010 & 2011. It is observed from the table that in the aggregate of all the selected states
the enrolment of Muslim children had shown an increase of only 0.07% between 2009 and 2010OJg
O h

while the enrolment of non-Muslim children witnessed a decrease of 1.73% during this period.
Further, a decrease of 2.23% was observed in the enrolment of Muslim children from 2010 to
2011 as against a decrease of 1.94% in the enrolment of non-Muslim children (Also see Figure
5.1). But the trend was not the same in all the states, in some the enrolment had increased while
in others it had decreased. Among the states, the highest increase in total enrolment from 2009 to
2010 was noticed in Haryana (6.03%). The other states which showed an increase were Uttar
Pradesh (2.74%) and Uttarakhand (0.64%). In the remaining states there was a decrease in
enrolment during the period 2009 - 2011, ranging between 0.29% in Assam to 8.51% in
Rajasthan. Further, Bihar (4.16%), Haryana (8.10%), Rajasthan (14.0%) and Uttarakhand
(1.38%) were the only states which showed an increase in total enrolment between 2010 and
2011 while the remaining states witnessed a decrease ranging between 0.14% in Gujarat and
20.47% in Assam.
Figure 5.1: Comparison of Enrolment of Muslim Children of 2009, 2010 and 2011 inPrimary Classes of Sampled Schools
100000900008000070000600005000040000300002000010000
0 L L LTotal
I Girls
2010 2011 2009 2010 2011 2009 2010 2011
Rural Urban Total
LO
OJgD h

Table 5.2: Percentage Increase in Enrolment at Primary Levelbetween 2009 & 2010 and between 2010 & 2011
State Category Between 2009 & 2010 Between 2010 & 2011Rural Urban Total Rural Urban Total
AssamTotal - 0.12 - 0.71 - 0.29 - 20.21 - 21.06 - 20.47Muslim 0.21 2.41 0.74 - 19.01 - 20.05 - 19.27Non-Muslim - 1.86 - 6.09 - 3.94 - 26.65 - 22.97 - 24.88
BiharTotal 2.33 - 7.35 - 0.71 2.20 8.88 4.16Muslim 2.44 - 1.16 1.53 - 2.06 4.92 - 0.34Non-Muslim 2.16 - 12.43 - 3.57 8.93 12.55 10.22
GujaratTotal - 1.98 - 5.62 - 3.22 - 2.25 4.12 - 0.14Muslim - 3.62 - 6.41 - 4.56 - 4.41 2.69 - 2.06Non-Muslim 0.46 - 4.49 - 1.24 0.82 6.13 2.59
HaryanaTotal 8.93 0.24 6.03 15.97 -8.96 8.10Muslim 0.19 0.00 0.14 16.96 -13.30 9.52Non-Muslim 88.62 0.58 29.11 11.15 -2.79 3.81
Jammu & Kashmir
Total -3.42 1.24 -1.81 - 0.71 -2.55 -1.37Muslim -4.10 6.90 -1.08 - 0.52 -3.23 -1.32Non-Muslim - 0.59 -6.51 -3.77 -1.49 -1.50 -1.50
JharkhandTotal -2.50 11.89 - 0.37 -8.12 -2.90 -7.25Muslim 0.00 14.68 1.44 -8.51 10.08 -6.45Non-Muslim -7.45 9.90 -3.42 -7.29 -12.54 -8.68
KarnatakaTotal -2.42 -2.62 -2.50 -2.60 3.02 - 0.31Muslim 0.52 -1.74 - 0.41 - 0.69 3.16 0.87Non-Muslim -6.15 -3.75 -5.17 -5.21 2.82 -1.89
KeralaTotal -3.70 -5.38 -4.25 -4.46 -2.00 -3.67Muslim -3.53 -4.54 -3.84 2.15 -6.48 - 0.49Non-Muslim -3.97 -6.48 -4.86 -15.15 4.06 -8.51
MadhyaPradesh
Total - 0.66 -1.86 -1.17 -9.55 -7.84 -8.83Muslim - 0.66 -1.24 - 0.80 -5.14 -10.66 -6.43Non-Muslim - 0.67 -2.02 -1.40 -13.98 -7.10 -10.28
RajasthanTotal -3.16 -20.18 -8.51 13.74 14.70 14.00Muslim -2.65 -13.06 -4.88 15.07 -1.91 11.75Non-Muslim -4.94 -26.27 -16.13 8.98 31.49 19.36
UttarPradesh
Total 2.93 2.28 2.74 -4.18 -5.86 -4.66Muslim 2.03 -2.02 0.88 -3.88 3.21 -1.93Non-Muslim 4.41 8.81 5.72 -4.66 -18.24 -8.83
Uttarakhand
Total 0.57 0.64 0.58 2.60 -5.94 1.38Muslim 6.82 16.01 8.19 4.30 -25.00 - 0.40Non-Muslim -12.08 -36.36 -15.21 -1.59 77.71 6.07
TotalTotal 0.33 -2.80 - 0.61 -2.34 -1.58 -2.12Muslim 0.35 - 0.74 . 007 -1.99 -2.93 -2.23Non-Muslim 0.29 -5.17 -1.73 -3.04 0.04 -1.94
V.D
OJgO h

5.1.3 Pupil-Teacher Ratio
It is seen from Table 5.3 that the pupil-teacher ratio in all sampled primary schools, on average,
was 33.3. The corresponding figures for rural and urban primary schools were 34.2 and 31.0
respectively. Among the states it was the highest in Bihar (57.4) closely followed by Haryana
(55.9). Pupil-teacher ratio was found to be less than 20 in Jammu & Kashmir (13.2), Karnataka
(13.0) and Kerala (17.9). On comparing PTR of sampled schools with that of state level DISE
figures it is noticed that there was no discernible difference between the survey figures and the
state level DISE data in the states of Assam, Bihar, Gujarat, Jammu & Kashmir, Jharkhand,
Kerala and Madhya Pradesh.
Table 5.3: Pupil-Teacher Ratio in Sampled Primary Schools in the year 2011
State Rural Urban Total State level DISE data
Assam 40.5 28.1 35.7Bihar 57.4 57.2 57.4Gujarat 35.2 34.5 35.0 31Haryana 58.9 46.7 55.9 29Jammu & Kashmir 12.3 14.5 13.2Jharkhand 39.1 19.9 34.5 41Karnataka 11.0 15.7 13.0 26Kerala 17.1 19.9 17.9 21Madhya Pradesh 30.9 45.3 35.8 33Rajasthan 39.8 41.4 40.1 27Uttar Pradesh 36.7 36.4 36.6 46Uttarakhand 36.8 44.4 38.0 25Total 34.2 31.0 33.3 N.A.
Table 5.4 presents the distribution of primary schools according to pupil-teacher ratio (PTR) in
them. The table shows that 60.2% of the sampled primary schools had PTR up to 35 (as per RTE
norms); varying from only 16% such schools in Haryana to 100% schools in Karnataka. Another
9.1% schools had PTR between 36 and 40. Thus the percentage of schools having PTR up to 40
was 69.3%. There were 19.1% primary schools which had PTR of more than 50. The percentage
of such schools was highest in Haryana (68%) followed by Bihar (39.2%) and Assam (38.2%).
OJgO h

Table 5.4: Distribution of Sampled Primary Schools according to Pupil-Teacher Ratio
Total No. of schools
Schools with pupil-teacher ratioState Up.to 35 36 o 40 41 to 50 More than 50
N % N % N % N %Assam 76 26 34.2 5 6.6 21.1 29 38.2Bihar 74 26 35.1 10 13.5 9 12.2 29 39.2Gujarat 26 14 53.8 9 34.6 1 3.8 2 7.7Haryana 25 4 16.0 0 0.0 16.0 68.0Jammu & Kashmir 96.5 0 0.0 1 1.8 1 1.8Jharkhand 46 24 52.2 9 19.6 9 19.6 4 8.7Karnataka 18 18 100.0 0 0.0 0 0.0 0 0.0Kerala 101 100 99.0 1 1.0 0 0.0 0 0.0Madhya Pradesh 24 62.5 3 12.5 4 16.7 2 8.3Rajasthan 24 54.2 2 8.3 3 12.5 6 25.0Uttar Pradesh 130 73 56.2 14 10.8 14.6 24 18.5Uttarakhand 27 37.0 4 14.8 7 25.9 6 22.2
Total 628 378 60.2 57 9.1 73 11.6 120 19.1
Figure 5.2: Pupil-Teacher Ratio in Sampled Primary Schools in the year 2011
0 0OJg
D h

5.2 Enrolment (Total & Muslims) in Upper Primary Classes; trend over last 3 years; PTR
5.2.1 Enrolment (Total & Muslims) in Upper Primary Classes
Table 5.5 presents total enrolment as well as of Muslim children (as on 30th September) in upper
primary classes in rural and urban areas in the years 2009, 2010 and 2011. State-wise
information about enrolment is given in Tables A5.4, A5.5 and A5.6 in Appendix. Table 5.5
shows that there was an increase in enrolment during successive years. The total enrolment in
upper primary classes was 53489 in 2009 which became 58803 in 2011, registering an increase
of 9.9%. Further, the percentage of Muslims among the total enrolment was 52.5% in 2009
which increased to 53.9% next year but again decreased to 53.1% in 2011. While this percentage
was more or less same in rural areas during these three years, there was a variation among them
in urban areas. However, the percentage of Muslim children was lower in urban areas than in
rural areas; it was 56.1% in rural areas as against 48.2% in urban areas in the year 2011. Table
A5.6 of the Appendix shows a large variation among states in the proportion of Muslim children
in the total enrolment. It ranged from 74.2% in Assam to 45.8% in Bihar in the year 2011;
Jammu & Kashmir was another state where such proportion was more than 70%.
Table 5.5: Enrolment as on 30th September in Upper Primary Classes in Rural and Urban Areas in 2009, 2010 and 2011
Area Year
Enrolment in upper primary classes
Total Muslim % of Muslims
Total Girls % of girls Total Girls % of
girls Total Girls
(1) (2) (3) (4) (5) (6) (7) (8) (9) (10)
Rural
2009 32054 15281 47.7 18039 8603 47.7 56.3 56.3
2010 33507 16242 48.5 18830 9173 48.7 56.2 56.5
2011 36901 17742 48.1 20699 10180 49.2 56.1 57.4
Urban
2009 21435 10267 47.9 10022 4913 49.0 46.8 47.9
2010 21539 10543 48.9 10830 5307 49.0 50.3 50.3
2011 21902 10495 47.9 10546 5142 48.8 48.2 49.0
Total
2009 53489 25548 47.8 28061 13516 48.2 52.5 52.9
2010 55046 26785 48.7 29660 14480 48.8 53.9 54.1
2011 58803 28237 48.0 31245 15322 49.0 53.1 54.3OJg
O h

Table 5.5 further reveals that the proportion of girls among the total enrolment in the years 2009,
2010 and 2011 was more or less same in both rural and urban areas. It varied from 47.7% in rural
areas in 2009 to 48.9% in urban areas in 2010. Further, almost no variation was found in the
proportion of girls among total Muslim students during these three years; it varied between
48.2% in 2009 and 49.0% in 2011. Among the states, such proportion was more than 50% in 4
states, namely, Assam (55.9%), Gujarat (52.2%), Madhya Pradesh (57.8%) and Uttarakhand
(58.6%) in 2011. On the other hand, the corresponding proportion was found to be less than 40%
in Haryana (39.7%) and Rajasthan (33.5%).
5.2.2 Pupil-Teacher Ratio
Pupil-teacher ratio in sampled upper primary schools in the year 2011, on average, was 29.4. The
corresponding figure for rural areas was 30.9 as against 27.0 in urban areas. Among the states,
Bihar had the highest pupil-teacher ratio of 63.9. Next was Jharkhand (41.7) followed by Uttar
Pradesh (33.9), Rajasthan (33.0) and Gujarat (29.9). Pupil-teacher ratio was less than 20 in the
states of Assam (16.0) and Jammu & Kashmir (13.9). Further, no discernible difference is found
between PTR based on survey data and state level PTR of DISE in almost all the selected states.
Table 5.6: Pupil-Teacher Ratio in Sampled Upper primary Schools in the year 2011
State Rural Urban Total State level DISE data
Assam 19.1 12.1 16.0 HBihar 59.3 69.8 63.9 63Gujarat 27.7 32.9 29.9 31Haryana 34.6 23.3 28.6 22Jammu & Kashmir 16.3 10.7 13.9Jharkhand 56.1 20.8 41.7 42Karnataka 27.8 31.4 29.1 23Kerala 24.9 20.8 23.5 22Madhya Pradesh 41.9 14.7 29.0 34Rajasthan 35.4 29.6 33.0 26Uttar Pradesh 36.9 29.6 33.9 44Uttarakhand 27.6 20.3 26.3 22
Total 30.9 27.0 29.4 N.A. o0 0
OJgO h

Figure 5.3: Pupil-Teacher Ratio in Sampled Upper Primary Schools in the year 2011
It is seen from Table 5.7 that out of 426 upper primary schools 295 (69.2%) had PTR up to
35 (as per RTE norms). States which had percentage of such schools more than 80% were
Gujarat (87.5%), Jammu & Kashmir (96.4%), Kerala (95.5%) and Uttarakhand (92.9%).
There were 15.3% upper primary schools with above 50 PTR. Bihar had highest
percentage (56.8%) of such schools. Next was Jharkhand with 26.9% schools had PTR of
more than 50.
Table 5.7: Distribution of Upper Primary Schools according to Pupil-Teacher Ratio
State Total No. of schools
Schools with pupil-teacher ratioUp to 35 36 to 40 41 to 50 More than 50
N % N % N % N %Assam 46 35 76.1 2 4.3 4 8.7 5 10.9Bihar 44 6 13.6 5 11.4 8 18.2 25 56.8Gujarat 16 14 87.5 1 6.3 0 0.0 1 6.3Haryana 17 11 64.7 1 5.9 1 5.9 4 23.5Jammu & Kashmir 55 53 96.4 1 1.8 0 0.0 1 1.8Jharkhand 26 7 26.9 4 15.4 8 30.8 7 26.9Karnataka 37 28 75.7 6 16.2 2 5.4 1 2.7Kerala 67 64 95.5 2 3.0 0 0.0 1 1.5Madhya Pradesh 14 9 64.3 0 0.0 3 21.4 2 14.3Rajasthan 14 8 57.1 2 14.3 3 21.4 1 7.1Uttar Pradesh 76 47 61.8 4 5.3 8 10.5 17 22.4Uttarakhand 14 13 92.9 1 7.1 0 0.0 0 0.0
Total 426 295 69.2 29 6.8 37 8.7 65 15.3 0 0OJegD h

5.3 Schools leavers and drop outs (Muslims, non Muslims) at primary stage
5.3.1 School Leavers at Primary Stage
Table 5.8 gives percentage of school leavers and dropouts at primary stage in rural and urban
areas for the years 2009-10 and 2010-11. Some of the school leavers join other schools but some
become dropouts. It is seen from the table that the percentage of school leavers in the case of
Muslim and non-Muslim children during the year 2009-10 was 4.6% and 3.8% respectively. The
corresponding figures for girl students were 4.5% and 3.4% respectively. The table further
reveals that there was a small increase in the percentage of school leavers from 2009-10 to 2010
11. The percentage of school leavers among the Muslim students was 4.8% as against 3.9%
among non-Muslim students in the year 2010-11. The corresponding figures for girls were 4.8%
and 3.6% respectively. The above discussion shows that the incidence of school leaving was
more common among Muslim students compared to non-Muslim students. On comparing the
data pertaining to school leavers in rural and urban areas it is found that the proportion of school
leavers was slightly higher among the Muslim students than the non-Muslim students in rural
areas but there was no such trend in urban areas. An exception was the year 2009-10 in which it
seems that more non-Muslim boys left school compared to Muslim boys.
It is seen from Table A5.7 of the Appendix that the percentage of school leavers at the primary
stage was about 10% or more in the states of Assam, Madhya Pradesh, Rajasthan and
Uttarakhand. On the other hand, such percentage was less than 3% in Bihar, Jharkhand,
Karnataka and Kerala.
5.3.2 Dropouts at Primary Stage
It is observed from Table 5.8 and Figure 5.4 that the dropout rate among Muslim and non-
Muslim children was less than 3% in both rural and urban areas during the years 2009-10 and
2010-11. However, it was comparatively higher among Muslim children than among non-
Muslim children. Among the states, this was the situation in Assam, Bihar, Madhya Pradesh,
Rajasthan and Uttar Pradesh in both the years while opposite was the case in the states of Gujarat
and Haryana. Rajasthan state had witnessed the highest dropout rate of 17.4% among Muslim CN0 0
girls in the year 2009-10 while there was no dropout in the state of Karnataka in both the years.D h

Table 5.8: Percentage of School leavers and dropouts at Primary Stagein the years 2009-10 and 2010-11
Area Year% of School leavers % of School dropouts
Muslim Non-Muslim Muslim Non-Muslim
Total Girls Total Girls Total Girls Total Girls
(1) (2) (3) (4) (5) (6) (7) (8) (9) (10)
Rural2009-10 4.9 4.7 3.5 3.3 2.3 2.2 1.1 1.12010-11 5.1 4.9 4.0 3.5 2.6 2.7 2.0 1.5
Urban2009-10 3.7 3.9 4.3 3.6 1.4 1.4 1.8 1.12010-11 3.9 4.5 3.9 3.8 1.7 1.9 1.6 1.4
Total2009-10 4.6 4.5 3.8 3.4 2.1 2.0 1.3 1.1
2010-11 4.8 4.8 3.9 3.6 2.4 2.5 1.9 1.5
Figure 5.4: Percentage of School leavers and dropouts at Primary Stage in the years 2009-10 and 2010-11
4 -
3 -
2
n I
0 -
n n in r i ■ ■ ' ■ m i l l '■ I ' i ' i 1
I I I I I
I
2009-10 2010-11 2009-10 2010-11 2009-10 2010-11
Rural Urban Total
I Muslim School leavers
I Muslim School dropouts
I Non-Muslim School leavers
Non-Muslim School dropouts
c n0 0
OJegD h
6
5
1

5.4 Schools leavers and drop outs (Muslims, non Muslims) at upper primary stage
5.4.1 School Leavers at Upper Primary Stage
Percentage of school leavers and dropouts at upper primary stage in sampled schools during the
years 2009-10 and 2010-11 is presented in Table 5.9 and Figure 5.5. State-wise analysis of data
is presented in Table A5.8 in Appendix. It is seen from Table 5.9 that the percentage of Muslim
and non-Muslim children who left school during the year 2009-10 was 4.6% and 3.3%
respectively. The corresponding percentages for girls were slightly lower than that of total
children. In the year 2010-11 about 4% Muslim as well as non-Muslim children had left school
while the percentage of school leavers among Muslim and non-Muslim girls were 3.8% and
2.7% respectively. Further, the percentage of school leavers among Muslim and non-Muslim
children was comparatively higher in rural areas than in urban areas.
It is observed from Table A5.8 of the Appendix that the percentage of children who had left
school at upper primary stage in 2010-11 was 10% or more in Assam, Haryana, Jammu &
Kashmir, Rajasthan and Uttarakhand while this percentage was less than 3% in Bihar, Karnataka
and Kerala.
Table 5.9: Percentage of School leavers and dropout at Upper Primary Stagein 2009-10 and 2010-11
Area Year% of School leavers % of School dropouts
Muslim Non-Muslim Muslim Non-Muslim
Total Girls Total Girls Total Girls Total Girls
(1) (2) (3) (4) (5) (6) (7) (8) (9) (10)
Rural2009-10 5.1 4.6 3.7 3.1 2.5 2.8 1.5 1.02010-11 4.5 3.8 4.1 2.8 1.9 1.8 1.6 1.0
Urban2009-10 3.7 4.1 2.8 2.7 1.8 1.8 1.4 1.22010-11 3.8 3.9 3.5 2.6 2.3 2.4 2.2 1.2
Total2009-10 4.6 4.4 3.3 2.9 2.3 2.4 1.5 1.1
2010-11 4.2 3.8 3.9 2.7 2.0 2.0 1.8 1.1
0 0OJeg
O h

Figure 5.5: Percentage of School leavers and dropouts at Upper Primary Stagein the years 2009-10 and 2010-11
4
3 -
2 -
1 -
0 -
tr i w n n■■iiraiiiii1 1 1 I 1
I I I I I
I Muslim School leavers
I Muslim School dropouts
I Non-Muslim School leavers
Non-Muslim School dropouts
2009-10 2010-11
Rural
2009-10 2010-11
Urban
2009-10 2010-11
Total
5.4.2 Dropouts at Upper Primary Stage
Table 5.9 shows that the percentage of dropouts among Muslim and non-Muslim students was
less than 3% in both rural and urban areas in the years 2009-10 and 2010-11. It varied from 1.0%
among non-Muslim girls in rural areas in both the years to 2.8% among Muslim girls in rural
areas in 2009-10. However, the dropout rate was comparatively higher among Muslim children
than among non-Muslim children.
Among the states, the dropout rate at upper primary stage was the highest in Rajasthan (16.9%)
among non-Muslim girls in 2009-10. There was no dropout in sampled schools in Karnataka
during these two years.
5.5 Reasons for dropping out
The head teacher of every school was asked to give two main reasons of dropping out along with
the number of students who had discontinued their studies during 2010-11. The responses of
head teachers are given in Table 5.10. The table shows that both in primary and upper primary
schools, ‘engaging children for domestic help or taking care of siblings’, ‘child needed to help
parents in their occupation or income generating activity’ and ‘lack of parental interest in
LO0 0
OJegD h
6
5

studies’ emerged as the main reasons for both Muslim and non-Muslim children dropping out
from school. ‘Early marriage’ was another reason for dropping out in the case of both Muslim
and non-Muslim girls given by a large proportion of head teachers. The table further reveals that
‘engaging children for domestic help or taking care of siblings’ emerged as the main reason for
both Muslim and non-Muslim girls for dropping out from primary school as well as upper
primary school.
Table 5.10: Main Reasons of Students dropping out from schools during 2010-11
Schoolcategory
Gender No. of dropouts
% of children dropping out due toR1 R2 R3 R4 R5 R6 R7
(1) (2) (3) (4) (5) (6) (7) (8) (9) (10) (11)
All Boys 1871 65.7 42.9 61.1 2.1 0.9 5.5
Primary Girls 1483 20.1 55.1 44.8 18.3 1.2 5.114.510.6
Muslim Boys 1368 62.5 46.2 66.3 2.2 2.9 2.2Girls 1109 18.3 71.9 54.5 28.2 3.7 2.2
13.713.6
SchoolshavingUpper
primaryclasses
All Boys 1118 76.0 39.4 48.1 3.7 0.2 3.8Girls 745 28.3 64.0 51.9 28.6 0.0 2.7
17.914.0
Muslim Boys 651 70.5 38.4 59.0 6.3 2.6 1.2Girls 475 26.3 68.4 39.8 45.7 1.7 1.3
8.18.8
R1: Child needed to help parents in their occupation or income generating activityR2: Child needed to help in domestic work and care of siblingsR3: Lack of parental interest in studiesR4: Early MarriageR5: No facility for teaching UrduR6: School being far from HomeR7: Some Other
5.6 Absence rate; reasons for long absence
5.6.1 Absence rate
Enrolment and percentage of students who were present on the day of visit to school by the
investigator in primary and upper primary schools are given in Table 5.11. The table shows that
about 68% of Muslim and non-Muslim students were present on the day of visit in primary
schools. The attendance percentage of all students as well as of Muslim students was
comparatively higher in urban schools than in rural schools. Table A5.9 of the Appendix reveals
that more than 80% Muslim and non-Muslim students were present on the day of visit in Gujarat,
Jammu & Kashmir, Karnataka and Kerala while presence percentage of students was found to be
V.D0 0
OJgO h

less than 60% in Madhya Pradesh and Rajasthan. It may be mentioned here that all the data was
collected during holidays in most of the schools in Karnataka and Kerala and hence it was not
considered proper to collect data related to the attendance of children in such schools.
In the total sample of upper primary schools about 70% of the total students were present on the
day of visit. The presence percentage was slightly higher for total students compared to girl
students. Presence percentage of students in upper primary schools was more than 80% in
Gujarat, Jammu & Kashmir, Karnataka and Uttarakhand while less than 60% students in the
schools of Bihar and Madhya Pradesh.
Table 5.11: Enrolment and Number of Students found present on the day of visit
Area Category
Primary schools Schools having upper primary classesAll students Muslim students All students Muslim students
Enrolment
%present
Enrolment
%present
Enrolment
%present
Enrolment
%present
(1) (2) (3) (4) (5) (6) (7) (8) (9) (10)
Rural Total 59501 67.4 41996 68.4 49200 68.6 29688 70.5Girls 29376 67.5 20530 68.8 24051 64.9 15163 67.5
Urban Total 20160 69.0 11233 69.0 24203 72.3 12373 74.4
Girls 9825 69.2 5749 66.5 13285 71.5 6906 73.4
Total Total 79661 67.8 53229 68.5 73403 69.8 42061 71.6Girls 39201 67.9 26279 68.3 37336 67.2 22069 69.4
5.6.2 Comparison of Present Survey Data with Data of a Study conducted by EdCIL on
Attendance of Students in Primary and Upper Primary Schools
It is seen from Table 5.12 that in primary schools, the attendance data of present survey was
close to that of recently conducted survey by EdCIL in 7 of the 12 states namely Bihar, Gujarat,
Jammu & Kashmir, Jharkhand, Kerala, Uttar Pradesh and Uttarakhand while a difference of
more than 10 percentage points was noticed in the remaining 5 states. In upper primary schools,
no discernible difference was noticed in the attendance data of the two surveys in Bihar, Gujarat,
Jammu & Kashmir, Jharkhand and Uttarakhand.
0 0OJeg
O h

Table 5 .12 : Percentage of Students found present on the day of visit
StatePrimary
Present SurveyTotal Girls
Earlier surveyTotal Girls
Upper primaryPresent SurveyTotal Girls
Earlier surveyTotal Girls
Assam 64.3 64.7 84.6 87.7 62.9 64.1 85.4 86.9Bihar 58.3 54.6 63.6 65.2 58.0 58.7 59.7 62.1Gujarat 8.4 89.4 87.0 86.7 83.6 86.8 86.1Haryana 77.8 82.0 89.8 90.2 79.2 81.2 89.6 88.6Jammu & Kashmir 83.3 82.8 84.8 84.6 81.2 .7 855 86.9Jharkhand 62.8 63.1 66.7 67.1 61.3 58.9 65.1 68.1Karnataka 100.0 100.0 89.1 89.4 99.1 98.7 8.9Kerala 91.2 94.2 96.2 96.4 81.8 75.2 96.6 97.4Madhya Pradesh 55.1 52.2 76.1 74.7 46.7 42.6 73.2 74.9Rajasthan 51.7 50.3 713 697 60.6 57.0 737Uttar Pradesh 64.6 65.2 65.4 63.9 80.1 76.7 63.4 59.4Uttarakhand 70.2 71.9 76.5 76.6 83.1 82.6 81.3 83.6Total 67.8 67.9 N.A. N.A. 69.8 67.2 N.A. N.A.Source: Study on Students an
New Delhi, 2013.
Teachers Attendance in Primary and Upper Primary Schools, EdCIL,
5,6,2 3 Reasons for long absence
The head teachers of sampled schools were asked to indicate two main reasons which in their
opinion were responsible for long or frequent absence of children from school. They had to show
long absence cases separately for all students, Muslim boys and Muslim girls. Their consolidated
responses are given in Table 5.1013. The table shows that ‘lack of interest of parents in
children’s school attendance’ was the main reason given by 55.9% of head teachers for the
absence of children from school. This was also the main reason for absence of Muslim boys
(48.4%). ‘Helping parents in their occupation’ was the next important reason given for all
students (42.5%) as well as Muslim boys (48.1%). In the case of Muslim girls ‘involvement in
household work or looking after younger brothers and sisters’ and ‘lack of parents’ interest in
children’s school attendance’ were considered as the two main reason by 48.1% and 43.1% of
head teachers respectively. Some other reasons for absence of children such as ‘participation in
religious and social activities’ and ‘migration of family to other place’ were not considered as
main reasons and so were given low rating by the head teachers. It will be worthwhile to mention
that the percentages given for different reasons don’t add to 100 as most of the respondents had
mentioned two reasons for long or frequent absence of children from school.
0 00 0
OJgO h
.1
.1

Table 5.1013: Main reasons for long or frequent absence of children from school based on the data of all sampled schools
Main reasons for long absence
For all Students
N %
Particularly for Muslim boysN %
Particularly for Muslim GirlsN %
(1) (2) (3) (4) (5) (6) (7)Parents lack of interest in the children school attendance 589 55.9 510 48.4 454 43.1
Students engagement in wage earning activities or helping parents in their occupation________ 451 42.8 507 48.1 288 27.3
Students involvement in household work/taking care of younger brother/sister_______________ 269 25.5 238 22.6 507 48.1
Participation in religious and social functions 36 3.4 68 6.5 71 6.7Family migrating to other place in search of work 67 6.4 55 5.2 47 4.5Some Other 379 36.0 388 36.8 395 37.5
5.7 Support from community; SMC
5.7.1 School Management Committee
Table 5 .H -14_gives the total number of School Management Committee (SMC) members and
the number of those who attended the last meeting in the sampled schools while similar table
giving state-wise figures are given in the Appendix (A5.10). It is seen from Table 5.14 that the
total number of members in SMCs of all sampled schools was 12309. Of these, 6448 (52.4%)
were from Muslim community. Among the states, Haryana had the highest percentage (71.1%)
of Muslim members followed by Jammu & Kashmir (68.2%), Assam (67.9%) and Rajasthan
(65.4%) while the percentage of Muslim members was found to be less than 40% in Madhya
Pradesh (33.8%) and Uttar Pradesh (38.8%). Females constituted 45.4% of the total SMC
members and 44.2% of the Muslim members. Further, 74.2% of the total members were reported
to have attended the last SMC meeting as against 76.1% Muslim members. The corresponding
figures for female members were 74.0% and 74.6% respectively. The table further reveals that
the percentage of members who attended the last meeting was comparatively higher in urban
schools than in rural schools. Among the states, the percentage of Muslim as well as non-Muslim
members who attended the last meeting was found to be more than 90% in Bihar and Haryana
whereas in Madhya Pradesh the percentage of such members was less than 50%. 0 0OJg
O h

Table 5.4414: Number of Members in School Management Committee (SMC) and Number of those who had attended the last meeting
Area Item Total members
Male Female Total
Muslim members
Male Female Total
(1) (2) (3) (4) (5) (6) (7) (8)
RuralTotal number of members 5163 4191 9354 2880 2226 5106
% of those who attended the last meeting
73.5 72.5 73.1 76.6 73.1 75.1
Total number of members 1561 1394 2955 721Urban
621 1342
% of those who attended the last meeting
77.5 78.5 77.9 80.0 79.7 79.9
TotalTotal number of members 6724 5585 12309 3601 2847 6448
% of those who attended the last meeting
74.4 74.0 74.2 77.3 74.6 76.1
5.7.2 Support from Community
Community support is essential for the success of educational programmes in schools particularly
in rural areas. The support can be given by way of donations or providing any other help needed
by the school. Information on community support for facilitating education of children
particularly of Muslim children is given in Table 5.4215. State-wise figures are presented in Table
A5.11 in the Appendix. Table 5.15 shows that the majority of sampled schools (53.9%) had
received support from the community in admission process and ensuring children’s retention and
attendance. The percentage of schools receiving such support from the community was found to
be more than 70% in the states of Gujarat (80%), Jharkhand (71.7%), Karnataka (72.2%) and
Kerala (85%) and less than 40% in Assam (34.4%), Jammu & Kashmir (36.4%) and Uttar
Pradesh (34%). Again as reported, about one-third of schools were provided academic help in
studies by the community. Among the states, the percentage of such schools was more than 50%
in Karnataka (58.3%) and Kerala (70.8%) and less than 20% in Jammu & Kashmir, Madhya
Pradesh, Uttar Pradesh and Uttarakhand. The community also supported schools in teaching some
skills to children (29.9%), organizing religious or moral education programmes (29.5%) and
getting donations for improvement of facilities in school (25.5). However, any contribution or
support from the community was meant for all children and not specifically for Muslim children.
O
OJgO h

Table 5.1215: Support received by schools from the community in facilitating Education of all children and Muslim students in particular in Rural Areas
Item
% of schools received supportFor all children
No Partial Adequate
Particularly for Muslim children
No Partial Adequate
(1) (2) (3) (4) (5) (6) (7)(i) Enrolling children and ensuring their retention and attendance 46.1 35.8 18.1 47.0 34.9 18.1
(ii) Getting donations in cash or kind for improvement of facilities in school 74.5 18.6 6.9 75.0 18.3 6.8
(iii) Providing help in studies66.9 24.5 8.6 67.0 24.6 8.3
(iv) Organising religious or moral education programmes 70.5 23.0 6.5 67.8 24.6 7.5
(v) Teaching some skills to children. 70.1 21.6 8.3 70.0 21.6 8.4
5.8 Comparison of Muslim and Non-Muslim students in respect to certain educational
indicators
Head teacher of every selected school was asked to rate Muslim and non-Muslim students
studying in the school separately in respect of certain educational parameters on a 5-point scale.
The head teacher was required to write a code number in the blank columns against each
parameter. These code numbers were converted into numerical values by assigning 5 for very
good, 4 for good, 3 for average, 2 for poor and 1 for very poor. It may be mentioned here that
those schools in which the percentage of non-Muslim students was less than 10% were not
considered for comparison purposes. The mean value for each cell, based on the ratings in the
remaining schools, was computed. Thereafter, paired t-test was applied to test whether there was
any significant difference between the average ratings of students belonging to two different
communities. For every selected state, mean values of the head teachers’ rating, mean difference
scores and t-values for all the 13 parameters are given in Table A5.12 in Appendix.
Table A5.13-12 reveals that the t-values are significant at 1% level of significance, along with
higher mean values in the case of Muslim students compared to non-Muslim students, in respectOJg
O h

of all the 13 parameters in the states of Assam and Jharkhand. On the other hand, mean
difference scores were not found to be significant even at 5% level of significance on any
parameter in Jammu & Kashmir and Uttarakhand. In the remaining states, the mean difference
scores were found to be significant on certain parameters only.
On the basis of t-values which were significant in respect of certain parameters in some states,
the following conclusions are drawn. According to the head teachers of schools
1. Muslim students were more regular than non-Muslim students in attending the school in Assam,
Bihar, Gujarat, Jharkhand, Kerala and Rajasthan whereas non-Muslim students were reported to
be more regular than Muslim students in Karnataka and Madhya Pradesh.
2. Muslim students were more punctual than non-Muslim students in coming to school, in
Assam, Bihar, Jharkhand and Rajasthan whereas reverse is the case in the states of Haryana,
Madhya Pradesh and Uttar Pradesh.
3. Muslim students were participating more in classroom activities and doing slightly better in
EVS/ Science in Assam, Bihar, Gujarat, Jharkhand and Kerala.
4. Muslim students were doing slightly better on ‘achievement in language’ in Assam, Bihar,
Gujarat, Jharkhand and Rajasthan while on ‘achievement in Mathematics’ their performance
was slightly better in Assam, Bihar, Gujarat, Jharkhand, Kerala and Rajasthan. On the other
hand, the performance of non-muslim students was better than Muslim students on ‘achievement
of language’ in Haryana and Madhya Pradesh while they were doing better in ‘achievement in
Mathematics’ in Uttar Pradesh.
5. Muslim students had interacted slightly more with teachers than non-Muslim students in Assam,
Bihar, Jharkhand, Kerala and Rajasthan.
6. Muslim students had shown a little higher level of self confidence than their counterparts
(non-Muslim students) in Assam, Bihar, Gujarat, Jharkhand, Rajasthan and Uttar Pradesh.
7. Parents of Muslim students showed more interest in their studies than the parents of non-
Muslim students in Assam, Bihar, Gujarat and Jharkhand whereas the situation is reversed in
Haryana, Karnataka, Madhya Pradesh and Uttar Pradesh.
CN
OJgO h

Chapter 6
Recognised Madrasahs
This chapter contains detailed information about sampled Madrasahs in the selected districts and
discusses on such aspects as number of classrooms, enrolment, teachers posted, availability of
facilities/ incentives, etc. in the Madrasahs.
6.1 Facilities in sampled Madrasahs
6.1.1 Sampled Madrasahs
State-wise distribution of sampled Madrasahs according to area and management is presented in
Table 6.1. It may be observed that total 97 Madrasahs were selected from the sampled districts of
12 states covered in the study. Of these, 34 Madrasahs were imparting education to children at
primary level while 63 Madrasahs had classes up to upper primary stage. Out of a total of 34
primary Madrasahs, 24 (70.6%) were located in rural areas and 10 (29.4%) in urban areas; 9
(26.5%) were run by the government while 25 (73.5%) were managed by private agencies.
Further, out of 63 upper primary Madrasahs, 46 (73%) were located in rural areas and 17 (27%)
in urban areas; 17 (27%) were government/ Local Body Madrasahs and 46 (73%) private
Madrasahs.
It is seen from Table 6.2 that 49 (50.5%) of the 97 Madrasahs were recognized by the respective
State Governments; 10 (10.3%) Madrasahs by W aqf Board while 38 (39.2%) Madrasahs had
received recognition from other agencies. For example, National Institute of Open Schooling
(NIOS) had provided recognition to 4 of the 5 sampled Madrasahs in Haryana state. The table
further reveals that the percentage of State Madrasahs was higher in the case of Government
Madrasahs (57.7%) as compared to private Madrasahs (47.9%). On the other hand, the
percentage of private Madrasahs which had been recognized by ‘Other agencies’ was higher
(42.3%) as compared to Government Madrasahs (30.8%).OJg
O h

Table 6.1: Distribution of Madrasahs according to Area and Management
State MadrasahCategory
Total No. of Madrasahs
Area ManagementRural Urban Government Private
(1) (2) (3) (4) (5) (6) (7)
AssamPrimary 6 5 1 4 2Upper Primary 6 4 2 4 2
Total 12 9 3 8 4
BiharPrimary 3 1 2 1 2Upper Primary 10 8 2 8 2
Total 13 9 4 9 4
GujaratPrimary 0 0 0 0 0Upper Primary 0 0 0 0 0
Total 0 0 0 0 0
HaryanaPrimary 1 1 0 0 1Upper Primary 4 4 0 0 4
Total 5 5 0 0 5Jammu & Kashmir
Primary 1 1 0 0 1Upper Primary 4 4 0 0 4
Total 5 5 0 0 5
JharkhandPrimary 0 0 0 0 0Upper Primary 3 3 0 3 0
Total 3 3 0 3 0
KarnatakaPrimary 0 0 0 0 0Upper Primary 5 3 2 0 5
Total 5 3 2 0 5
KeralaPrimary 0 0 0 0 0Upper Primary 14 10 4 0 14
Total 14 10 4 0 14MadhayaPradesh
Primary 0 0 0 0 0Upper Primary 5 3 2 0 5
Total 5 3 2 0 5
RajasthanPrimary 2 2 0 1 1Upper Primary 3 1 2 1 2
Total 5 3 2 2 3
Uttar PradeshPrimary 16 9 7 3 13Upper Primary 9 6 3 1 8
Total 25 15 10 4 21
UttarakhandPrimary 5 5 0 0 5Upper Primary 0 0 0 0 0
Total 5 5 0 0 5
TotalPrimary 34 24 10 9 25Upper Primary 63 46 17 17 46
Total 97 70 27 26 71

Table 6.2: Management-wise distribution of Madrasahas according to the agency which provided recognition to them
Category Management No. of Madrasahs
Board which provided the recognitionWaqf BoardN %
State MadarsahaN %
Some OtherN %
PrimaryGovt/ Local BodyPrivateTotal
9 22.2 22.225 4.0 12 48.034 8.8 14 41.2
1217
55.648.050.0
UpperPrimary
Govt/ Local BodyPrivateTotal
17 5.9 13 76.546 13.0 22 47.863 11.1 35 55.6
1821
17.639.133.3
TotalGovt/ Local BodyPrivateTotal
26 11.5 15 57.771 9.9 34 47.997 10 10.3 49 50.5
3038
30.842.339.2
Table 6.3 gives the distribution of sampled Madrasahs according to type and residential status.
The table shows that 41.2% of the total Madrasahs at primary level were non-residential, another
38.2% Madrasahs were both residential and non-residential while the remaining 20.6%
Madrasahs were only residential. The corresponding percentages for upper primary Madrasahs
were 60.3%, 27.0% and 12.7% respectively. Further, out of a total of 97 Madrasahs, 63 (64.9%)
were co-educational while 15 (15.5%) were co-educational up to primary level only. Besides,
there were 12 Madrasahs for boys only and 7 Madrasahs for girls only.
6.1.2 Classrooms; space for children in classrooms
Table 6.4 shows that there were 190 classrooms in 34 primary Madrasahs with an average of 5.6
classrooms per Madrasah. While 14 (41.2%) of them had more than 5 classrooms, 12 (35.3%)
had 3 to 5 classrooms and the remaining 8 (23.5%) Madrasahs had only one or two classrooms.
The average student classroom ratio (SCR) in primary Madrasahs was 33. The corresponding
figure for government and private Madrasahs was 35 and 32 respectively.
Further, the total number of classrooms in 63 upper primary Madrasahs was 469 averaging 7.4
classrooms per Madrasah. The average student classroom ratio was 24 in upper primary
Madrasahs. The corresponding figure for government and private Madrasahs was 25 and 24
respectively.
LO
OJgO h
2 2 513
31673 87

Table 6.3: Distribution of Madrasahs according to Type and Residential status
Residential Status of Madarsahas Type of Madarsahas
CategoryManagement Total
Residential
Non-resi
dentialBoth
ForBoysonly
ForGirlsonly
Co-educational
Co-ed. up to
primary only
Govt 9 2 4 3 1 1 4 3Primary Private 25 5 10 10 4 2 12 7
Total 34 7 14 13 5 3 16 10(100.0) (20.6) (41.2) (38.2) (14.7) (8.8) (47.1) (29.4)
UpperPrimary
Govt 17 2 13 2 2 3 11 1Private 46 6 25 15 5 1 36 4Total 63 8 38 17 7 4 47 5
(100.0) (12.7) (60.3) (27.0) (11.1) (6.3) (74.6) (7.9)Govt 26 4 17 5 3 4 15 4
Total Private 71 11 35 25 9 3 48 11Total 97 15 52 30 12 7 63 15
(100.0) (15.5) (53.6) (30.9) (12.4) (7.2) (64.9) (15.5)
Table 6.4: Number of Classrooms in Madrasahs
CategoryManage
ment
No. of Madrasahs with Classrooms
No. of classrooms Total Enrolment
in all Madrasahas
AverageSCR1-2 3-5 > 5 Total Total Average
PrimaryGovt 2 5 2 9 34 3.8 1177 35
Private 6 7 12 25 156 6.2 5001 32Total 8 12 14 34 190 5.6 6178 33
UpperPrimary
Govt 2 6 9 17 113 6.6 2848 25Private 5 11 30 46 356 7.7 8568 24
Total 7 17 39 63 469 7.4 11416 24
It is seen from Table 6.5 that 20 (58.8%) of 34 primary Madrasahs had adverse classroom
student ratio (CSR). The percentage of classrooms having adverse CSR was 33.2%. The
corresponding percentage in government Madrasahs was 26.5% as against 34.6% in private
Madrasahs. Further, 26 (41.3%) of 63 upper primary Madrasahs did not have sufficient seating
space to accommodate all children in classrooms. As regards seating space in classrooms, 19.4%
classrooms in sampled upper primary Madrasahs lacked sufficient seating space. The percentageV.D
OJegO h

of such government Madrasahs was 29.2% as against only 16.3% Madrasahs managed by private
agencies.
Table 6.5: Number of Classrooms having adverse Classroom Student Ratio (CSR) in Madrasahs
MadrasahCategory
Management Total No. of
Madrasahs
Madrasahs havingadverse CSR
Number %
Total No. of Classrooms
Classrooms having adverse CSR
Number %
PrimaryGovtPrivate
Total
9 55.6 3425 15 60.0 15634 20 58.8 190
5463
26.534.633.2
UpperPrimary
GovtPrivate
Total
17 12 70.6 11346 14 30.4 35663 26 41.3 469
335891
29.216.319.4
6.1.3 Availability of Drinking water and Toilet facilities
6,1,3,1 Drinking Water
Table 6.6 gives information about availability of drinking water and toilet facilities in sampled
primary and upper primary Madrasahs. It is observed from the table that the drinking water
facility was available in 82.4% primary and 88.9% upper primary Madrasahs. In government
Madrasahs, drinking water facility was available in 88.9% primary and 70.6% upper primary
Madrasahs. The corresponding percentages for private Madrasahs were 80% and 95.7%
respectively.
6,1,3,2 Toilets - total and for girls
It is further observed from Table 6.6 that 85.3% of primary Madrasahs and 76.2% of upper
primary Madrasahs had functional toilets in them. Management-wise analysis shows that in
government Madrasahs, this facility was available in 88.9% primary Madrasahs and 35.3% upper
primary Madrasahs. The corresponding percentages for private Madrasahs were 84% and 91.3%
respectively.OJg
O h
5 9

Separate functional toilets for girls were available in only 47.1% of primary and 60.3% of upper
primary Madrasahs. Management-wise, 55.6% primary and 35.3% government upper primary
Madrasahs had separate functional toilets for girls while the corresponding percentages for
private Madrasahs were 44% and 69.6% respectively.
Table 6.6: Availability of Drinking water and Toilet facilities in Sampled Madrasahs
Category Management
Total No. of
Madrasahs
Madarsahas having facilityDrinking
WaterFunct
Toiionalets
Separate Functional Toilet for Girls
N % N % N %
PrimaryGovernment 9 8 88.9 8 88.9 5 55.6Private 25 20 80.0 21 84.0 11 44.0
Total 34 28 82.4 29 85.3 16 47.1
UpperPrimary
Government 17 12 70.6 6 35.3 6 35.3
Private 46 44 95.7 42 91.3 32 69.6Total 63 56 88.9 48 76.2 38 60.3
Figure 6.1: Availability of Drinking water and Toilet facilities in Sampled Madrasahs
100.0%90.0%80.0%70.0%60.0%50.0%40.0%30.0%20.0%10.0%0.0%
I Primary
I Upper Primary
T------^ ------1------^ ------1Drinking water Functional toilet Separate toilet for girls
0 0
OJegD h

6.1.4 Electricity, Library books and Sports material facilities
6,1,4,1 Electricity
It is seen from Table 6.7 that the electricity was available in 26 (76.5%) of the 34 primary
Madrasahs but in 7 (20.6%) Madrasahs, the supply of electricity was irregular. There were 8
(23.5%) primary Madrasahs which did not have electricity connection in them. Management-
wise, electricity was available in 80% of the 25 private Madrasahs, only two-thirds of
government Madrasahs had this facility.
Further, out of 63 upper primary Madrasahs, 53 (84.1%) had electricity but in 11 (17.5%)
Madrasah its supply was not regular. Management-wise, electricity was available only in 4 upper
primary Madrasahs run by government while another 5 had irregular supply of electricity. A
large proportion of Madrasahs (47.1%) did not have electricity connection in them. Among the
private upper primary Madrasahs, 95.7% had electricity connection in them but there was no
regular supply in 13% Madrasahs.
6,1,4,2 Library Books
Table 6.7 reveals that library books were available and used by the students in only 13 (38.2%)
primary level Madrasahs; 7 (20.6%) Madrasahs had library books but mostly these were not
used. In the remaining 14 (41.2%) Madrasahs library books were not available. Management-
wise, library books were available in 44.4% government Madrasahs as against 64 % private
Madrasahs.
As regards availability of library books in upper primary level Madrasahs, it is observed that 31
(49.2%) of them had library books which were also used by the students; 10 (15.9%) Madrasahs
had library books but mostly not used. In the remaining 22 (34.9%) Madrasahs, library books
were not available. Management-wise, 14 (82.3%) government upper primary Madrasahs had
library books while library books were available only in 27 (58.7%) private upper primary
Madrasahs.OJeg
O h

Table 6.7: Number of Madrasahs having Electricity, Library books and Sports material Facilities
Category Management
Availability of Electricity in
Available
Irregular
Notavailable
Availability of Library books
Avail-able
Available but mostly
not used
Notavailable
Availability of Sports Material
Available
Available but mostly
not used
Notavailable
(1) (2) (3) (4) (5) (6) (7) (8) (9) (10) (11)
PrimaryGovtPrivate
Total14 1119 13 14 10
1319
UpperPrimary
GovtPrivate
Total38 23 19 1442 11 10 31 10 22 19 10
2934
6.1.4.3 Sports Material
It is observed from Table 6.7 that sports material was available in 15 of the 34 primary
Madrasahs including 10 Madrasahs where it was mostly used. There were 19 Madrasahs which
did not have this facility. Management-wise, sports material was available in 48% private
primary Madrasahs as against only 33% government Madrasahs.
In upper primary Madrasahs, sports material was available and used in 19 (30.2%) Madrasahs
whereas this facility was also available in 10 (15.9%) Madrasahs but mostly not utilised by the
students. In the remaining 34(54%) Madrasahs sports material was not available. Management-
wise, sports material or equipment was available and used in 70.6% government upper primary
Madrasahs whereas it was available in only 37% private Madrasahs.
6.1.5 Pre-primary classes
Table 6.8 gives the number of sampled Madrasahs having nursery/pre-primary classes. The table shows
that 18 (52.9%) primary Madrasahs had attached pre-primary classes. The percentage for such
Madrasahs was slightly higher in the case of government Madrasahs compared to private
Madrasahs.. At upper primary level, this facility was available in only 15 (23.8%) upper primary
Madrasahs. The corresponding percentage for government and private Madrasahs was 11.8%
and 28.3% respectively.
OO
OJgO h
5 1 3 2 2 5 2 1 66 5 5 9 8 47 8 7 5
4 8 35 8 6 5 7 52 4 36

Table 6.8: Number of Sampled Madrasahs having Nursery/Pre-Primary Classes
CategoryMadrasahs having Nursery/Pre-Primary Classes
Government
No. %
Private
No. %
Total
No. %Primary 55.6 13 52.0 18 52.9
Upper Primary 11.8 13 28.3 15 23.8
Total 26.9 26 36.6 33 34.0
6.1.6 Multi-grade teaching
The number of Madrasahs in which multi-grade teaching takes place are shown in Table 6.9. It is
seen from the table that 41.2% of the 34 primary Madrasahs had multi-grade teaching in them.
At upper primary level, there were 24 (38.1%) out of 63 Madrasahs which had multi-grade
teaching. Management-wise, the percentage of Madrasahs having Multi-grade teaching was
much higher in government Madrasahs than in private Madrasahs for both at primary and upper
primary level.
Table 6.9: Madrasahs in the sample with Multi-grade Teaching
CategoryMadrasahs having Multi-grade Teaching
Government Private TotalNo. % No. % No. %
Primary 5 55.6 9 36.0 14 41.2Upper Primary 9 52.9 15 32.6 24 38.1
Total 14 53.8 24 33.8 38 39.2
6.2 Incentive schemes
6.2.1 Free School Uniform
Table 6.10 shows that in 92.8% of the 97 sampled Madrasahs, free uniform was not provided to
any student. Apparently Madrasahs are not covered in the scheme of providing free uniform to
children.
OJgO h
52
7

6.2.2 Free Textbooks
It is observed from Table 6.10 that only 17.5% of the 97 sampled Madrasahs had provided free
textbooks to all students while in 76.3% of Madrasahs, no student got free textbooks. Again it
appears that very few Madrasahs are covered in distribution of free textbooks.
6.2.3 Scholarship
It is seen from Table 6.10 that no scholarship was given to any student in 84.5% of the 97
sampled Madrasahs. In only 12.4% of Madrasahs, scholarship was provided to all students,
perhaps from other than government funds.
Table 6.10: Special Incentives being provided to students in Sampled Madrasahs
Incentives
% of Madrasahs which provide incentives
Not provided
to any student
To all students
Toonlygirls
To all Muslim students
To only Muslim
girls
To all SC or ST or
BPL category students
To only girls of SC/
ST/ BPL category
(1) (2) (3) (4) (5) (6) (7) (8)
Free text books 76.3 17.5 1.0 1.0 0.0 2.1 2.1
Free school uniform 92.8 2.1 1.0 0.0 0.0 2.1 2.1
Scholarship 84.5 12.4 0.0 0.0 0.0 2.1 1.0
Cycles (in upper primary classes)
96.8 3.2 0.0 0.0 0.0 0.0 0.0
Science kit 59.8 17.5 8.2 13.4 0.0 1.0 0.0
Books for school/ class library
73.2 20.6 4.1 1.0 0.0 1.0 0.0
Computers for upper primary sections
84.5 13.4 2.1 0.0 0.0 0.0 0.0
Vocational training 92.8 4.1 0.0 2.1 1.0 0.0 0.0
Others 86.6 11.3 0.0 0.0 0.0 2.1 0.0CNO
OJgO h

6.2.4 Providing Cycles (in upper primary classes)
Table 6.10 shows that in 96.8% of 63 upper primary Madrasahs, no cycle was given to any
student in the current session. This incentive is not available for girls in many states.
6.2.5 Agencies providing incentives to Students
Table 6.11 gives information about various agencies which provided special incentives to
students in Madrasahs. It is seen from the table that most of the sampled Madrasahs had not
received any incentive from any non-government agency. However, Education Department had
given some incentives to more than 10% Madrasahs. These incentives are free textbooks
(18.6%), Science kit (23.7%), books for library (17.5%), computers for upper primary classes
(17.5%) and facility for vocational training (12.4%). Ministry of Minority Affairs had provided
free textbooks, free school uniform, scholarship, Science kit, books for library and computers for
upper primary classes in a few (2 to 12) Madrasahs. Besides, NGOs and local community had
also given some incentives, such as free textbboks, free school uniform, scholarship, Science kit
and books for library, to a few Madrasahs.
Table 6.11: Agencies providing Special Incentives to students in Sampled Madrasahs
Incentives
Total No. of
Madrasahs
% of agencies providing special incentives to students
Not getting incentives from any agency
Education
Dept.
Ministryof
MinorityAffairs
NGOsLocal
Community
Otheragency
(1) (2) (3) (4) (5) (6) (7) (8)Free text books 97 68.0 18.6 3.1 3.1 4.1 3.1Free school uniform 97 89.7 2.1 2.1 2.1 1.0 3.1Scholarship 97 83.5 5.2 8.2 1.0 1.0 1.0Cycles 63 96.8 3.2 0.0 0.0 0.0 0.0Science kit and other pedagogical equipment
97 58.8 23.7 12.4 5.2 0.0 0.0
Books for school/class library 97 73.2 17.5 5.2 1.0 2.1 1.0Computers for upper primary sections 63 69.8 17.5 9.5 0.0 1.6 1.6Facility for Vocational training 97 81.4 12.4 1.0 2.1 1.0 2.1Other facility 97 82.5 13.4 2.1 0.0 1.0 1.0
c no
OJegO h

6.3 Teachers
6.3.1 Regular and Contract Teachers - total & Muslim Teachers in Primary and Upper primary Madrasahs
Table 6.12 gives the distribution of teachers working in sampled primary and upper primary
Madrasahs according to category of teachers. State-wise number of teachers is also given in
Table 6.13. It is seen from Table 6.12 that the total number of teachers in primary Madrasahs
was 228; except 6 teachers all were Muslim. Assam and Haryana are the only states where
Table 6.12: Number of Teachers in Sampled Madrasahs
Madrasah Manage Category of Total MuslimCategory ment teachers Total Female Total Female
No. % No. % No. % No. %Regular 81 35.5 12 54.5 76 34.2 9 50.0
Total Contract & Community Paid
147 64.5 10 45.5 146 65.8 9 50.0
Total 228 100.0 22 100.0 222 100.0 18 100.0
Government
Regular 37 80.4 8 80.0 33 78.6 5 71.4Primary Contract &
Community Paid9 19.6 2 20.0 9 21.4 2 28.6
Total 46 100.0 10 100.0 42 100.0 7 100.0Regular 44 24.2 4 33.3 43 23.9 4 36.4
Private Contract & Community Paid
138 75.8 8 66.7 137 76.1 7 63.6
Total 182 100.0 12 100.0 180 100.0 11 100.0Regular 393 75.6 48 60.8 377 77.1 43 62.3
Total Contract & Community Paid
127 24.4 31 39.2 112 22.9 26 37.7
Total 520 100.0 79 100.0 489 100.0 69 100.0
Government
Regular 111 76.0 14 70.0 104 78.2 10 62.5Upper
PrimaryContract & Community Paid
35 24.0 6 30.0 29 21.8 6 37.5
Total 146 100.0 20 100.0 133 100.0 16 100.0Regular 282 75.4 34 57.6 273 76.7 33 62.3
Private Contract & Community Paid
92 24.6 25 42.4 83 23.3 20 37.7
Total 374 100.0 59 100.0 356 100.0 53 100.0 o
OJgO h

non-Muslim teachers were working in primary Madrasahs. There were only 22 female teachers
posted in these Madrasahs. Further, 35.5% of the total teachers in primary Madrasahs were
recruited on regular basis while the remaining 64.5% teachers were contractual. Management-
wise, the percentage of regular teachers in government primary Madrasahs was 80.4% as against
only 24.2% in private primary Madrasahs. As regards 520 teachers working in upper primary
Madrasahs, 94% of them were Muslim and only 15% were females. About three-fourths of the
total teachers in these Madrasahs were regular and the rest were contractual. Management-wise,
no difference was observed in the percentages of regular or contractual teachers between
government and private Madrasahs, Among the states, in Jammu & Kashmir, Jharkhand,
Karnataka, Kerala and Madhya Pradesh all the teachers in upper primary Madrasahs were
Muslim.
Table 6.13: State-wise Number of Teachers in Sampled Madrasahs
State
Primary Upper Primary
Total Muslim Total Muslim
Total Female Total Female Total Female Total Female(1) (2) (3) (4) (5) (6) (7) (8) (9)
Assam 19 7 15 4 80 13 68 9Bihar 17 1 17 1 56 4 55 2
Gujarat
Haryana 8 2 6 1 47 17 42 16
Jammu & Kashmir 1 0 1 0 53 12 53 12
Jharkhand 17 1 17 1Karnataka 32 0 32 0
Kerala 69 0 69 0Madhya Pradesh 20 16 20 16Rajasthan 3 0 3 0 16 3 10 2
Uttar Pradesh 128 12 128 12 130 13 123 11
Uttarakhand 52 0 52 0
Total 228 22 222 18 520 79 489 69LOo
OJgO h

6.3.2 Qualifications - Educational & Professional
6.3.2.1 Educational Qualification
Distribution of teachers according to their educational qualification is given in Tables 6.14 and
Figure 6.2. It may be seen that most of the teachers working in primary level Madrasahs had
either Hafiz (29.8%) or Aalim (21.5%) qualification. Another 21.5% teachers had a minimum
graduation degree while the percentage of those who had passed only higher secondary was
14.5%. There were 9.2% teachers who had qualification up to secondary level only. The
percentage of graduate or post-graduate teachers was higher in private Madrasahs (23.6%)
compared to government Madrasahs (13%).
About one-third of the 520 teachers working in upper primary Madrasahs were either graduate or
post-graduate while 30.8% teachers had passed either higher secondary or secondary
examination. Besides, nearly one-third of teachers had either Aalim (19.4%) or Hafiz (13.5%)
qualification. The percentage of graduate or post-graduate teachers in government Madrasahs
was 49.3% as against only 27.8% in private Madrasahs.
Table 6.14: Educational Qualification of Teachers in Primary Madrasahs
Category EducationalQualification
Teachers in primary MadrasahsTotal Government Private
No. % No. % No. %
Total
Secondary 21 9.2 5 10.9 16 8.8Hr. Secondary 33 14.5 13 28.3 20 11.0Graduate & above 49 21.5 6 13.0 43 23.6Others 8 3.5 0 0.0 8 4.4Hafiz 68 29.8 16 34.8 52 28.6Aalim 49 21.5 6 13.0 43 23.6Total 228 100.0 46 100.0 182 100.0
Muslim
Secondary 19 8.6 3 7.1 16 8.9Hr. Secondary 31 14.0 12 28.6 19 10.6Graduate & above 47 21.2 5 11.9 42 23.3Others 8 3.6 0 0.0 8 4.4Hafiz 68 30.6 16 38.1 52 28.9Aalim 49 22.1 6 14.3 43 23.9Total 222 100.0 42 100.0 180 100.0 V.D
O
OJegO h

Table 6.14 (Contd.): Educational Qualification of Teachers in Upper Primary Madrasahs
Category EducationalQualification
Teachers in upper primary MadrasahsTotal Government Private
No. % No. % No. %
Total
Secondary 82 15.8 8 5.5 74 19.8Hr. Secondary 78 15.0 22 15.1 56 15.0Graduate & above 176 33.8 72 49.3 104 27.8Others 13 2.5 2 1.4 11 2.9Hafiz 70 13.5 16 11.0 54 14.4
Aalim 101 19.4 26 17.8 75 20.1Total 520 100.0 146 100.0 374 100.0
Muslim
Secondary 77 15.7 8 6.0 69 19.4Hr. Secondary 69 14.1 19 14.3 50 14.0Graduate & above 161 32.9 63 47.4 98 27.5
Others 13 2.7 2 1.5 11 3.1
Hafiz 69 14.1 16 12.0 53 14.9Aalim 100 20.4 25 18.8 75 21.1
Total 489 100.0 133 100.0 356 100.0
Figure 6.2: Educational Qualification of Teachers
Primary
I Secondary
I Hr. Secondary
I Graduate & above
I Others
I Hafiz
I Alim
Upper Primary
o
OJgD h

6,3,2,2 Professional Qualification
It is seen from Tables 6.15 and Figure 6.3 that about one-half the teachers working in primary
Madrasahs were untrained and another 19.3% had ‘other’ qualification; 8.3% teachers had
diploma/ certificate in primary education and 7.9% teachers had B.Ed. degree. ‘Other
qualification' includes UTC, Aalim, Faazil, Kaari etc. The remaining teachers had either Mufti
(11%) or Maullim (1.8%) qualification. The percentage of untrained teachers was much higher in
private primary Madrasahs (55.5%) than in government primary Madrasahs (37%).
In upper primary Madrasahs also, majority of teachers were either untrained (59.4%) or had
‘other’ (12.3%) qualification; 6.9 % teachers were either Mufti or Maullim. ‘Other qualification'
includes Ph.D., UTC, Aalim, Faazil, Kaari etc. Another 11.3% teachers had B.Ed. degree while
10% teachers had undergone BTC/JBT training. The percentage of untrained teachers in
government upper primary Madrasahs was 56.8% as against 60.4% in private upper primary
Madrasahs.
Table 6.15: Professional Qualification of Teachers in Madrasahs
MadrasahProfessionalQualification
Teachers in MadrasahsCategory Category Total Government Private
No. % No. % No. %Untrained 118 51.8 17 37.0 101 55.5Diploma/ BTC/ JBT 19 8.3 2 4.3 17 9.3
TotalB.Ed. 18 7.9 0 0.0 18 9.9Others 44 19.3 15 32.6 29 15.9
Primary Mufti 25 11.0 12 26.1 13 7.1Maullim 4 1.8 0 0.0 4 2.2Total 228 100.0 46 100.0 182 100.0Untrained 114 51.4 14 33.3 100 55.6Diploma/ BTC/ JBT 18 8.1 1 2.4 17 9.4
MuslimB.Ed. 17 7.7 0 0.0 17 9.4Others 44 19.8 15 35.7 29 16.1Mufti 25 11.3 12 28.6 13 7.2Maullim 4 1.8 0 0.0 4 2.2Total 222 100.0 42 100.0 180 100.0 0 0
o
OJgO h

Table 6.15 (Contd.): Professional Qualification of Teachers in Madrasahs
MadrasahProfessionalQualification
Teachers in MadrasahsCategory Category Total Government Private
No. % No. % No. %Untrained 309 59.4 83 56.8 226 60.4Diploma/ BTC/ JBT 52 10.0 24 16.4 28 7.5
TotalB.Ed. 59 11.3 24 16.4 35 9.4Others 64 12.3 0 0.0 64 17.1
UpperPrimary
Mufti 27 5.2 15 10.3 12 3.2Maullim 9 1.7 0 0.0 9 2.4Total 520 100.0 146 100.0 374 100.0Untrained 297 60.7 79 59.4 218 61.2Diploma/ BTC/ JBT 46 9.4 22 16.5 24 6.7
MuslimB.Ed. 47 9.6 17 12.8 30 8.4Others 63 12.9 0 0.0 63 17.7Mufti 27 5.5 15 11.3 12 3.4Maullim 9 1.8 0 0.0 9 2.5Total 489 100.0 133 100.0 356 100.0
Figure 6.3: Professional Qualification of Teachers
Primary
1.8
I Untrained
I Diploma/BTC/ JBT
IB.Ed.
I Others
I Mufti
I Maullim
OJegD h

Table 6.16 gives the percentage of teachers who were present in Madrasah on the day of visit of the
investigator. It is seen from the table that 89% of teachers in primary level Madrasahs were found present
on the day of visit. The corresponding percentage in government primary Madrasahs was 93,5% which
was higher than that in private primary Madrasahs (87.9%). On the other hand, the percentage of teachers
who were reported to be present in upper primary level Madrasahs was 94.4% which was comparatively
higher than that in primary Madrasahs. Further, the percentage of teachers who were present in
government upper primary Madrasah was 89.7% as against 96.3% teachers present in private upper
primary Madrasahs.
6.3.3 Absence of teachers (on day of visit)
Table 6.16: Number and Percentage of Teachers present in Madrasah on day of visit
ManagementNo. of teachers in Primary Madrasahs No. of teachers in Upper Primary
Madrasahs
Total Present on day of visit
% teachers present on day of visit
Total Present on day of visit
% teachers present on day of visit
Total 228 203 89.0 520 491 94.4Govt. 46 43 93.5 146 131 89.7Private 182 160 87.9 374 360 96.3
6.3.4 Relaxation; if any, given to Muslim Teachers and Students
6.3.4.1 Relaxation during Ramzan month
Table 6.17 gives the distribution of Madrasahs according to type of relaxation provided to
Muslim teachers and students in school hours during Ramzan month. The table shows that out of
97 sampled Madrasahs, in 56.7% of them one month vacation was declared for the month of Ramzan
while no relaxation was given to teachers in 8.2% Madrasahs. There were 22.7% Madrasahs in
which teachers were permitted to leave the Madrasah early while working hours were changed in
11.3% Madrasahs. Further, more or less same rules as mentioned above for teachers were
followed for students also.OJg
O h

Table 6.17: Type of relaxation given to Muslim teachers and students in School Hours during Ramzan Month
Mange-ment
Relaxationto
teachers/Students
Relaxation given to teachers/students in school hours during RamazanNo
relaxationgiven
LeavingMaktab/
Madrasahearly
Coming late to Maktab/ Madrasah
ChangingMaktab/
Madrasahhours
Any Other (One Month Vacation)
Total
N % N % N % N % N % N
Total Teachers 8 8.2 22 22.7 1 1.0 11 11.3 55 56.7 97Students 6 6.2 23 23.7 1 1.0 12 12.4 55 56.7 97
Govt Teachers 0 0.0 3 11.5 1 3.8 2 7.7 20 76.9 26Students 0 0.0 3 11.5 1 3.8 2 7.7 20 76.9 26
Private Teachers 8 11.3 19 26.8 0 0.0 9 12.7 35 49.3 71Students 6 8.5 20 28.2 0 0.0 10 14.1 35 49.3 71
Figure 6.4: Type of relaxation given to Muslim teachers and students in School Hours during Ramzan Month
Teachers
I No relaxation given
I Leaving Madrasah early
I Coming late to MadrasahChanging Madrasah hours
Students6.2%
6,3,4,2 Relaxation for the Friday prayers
Table 6.18 gives the distribution of Madrasahs according to type of relaxation provided to
Muslim teachers and students during working hours for the Friday prayers. It is seen from the
table that no relaxation was given to teachers in 28.9% of Madrasahs. Break for one hour was
given in 11.3% Madrasahs for teachers while the practice of closing the Madrasah early onOJeg
D h

Friday was followed in 39.2% Madrasahs. There were 20.6% Madrasahs in which weekly off
was kept for offering prayers on Friday. As regards relaxation given to students for offering
Friday Prayer in these Madrasahs, it is observed that more or less same rules as mentioned above
for teachers were followed for students also.
Table 6.18: Type of relaxation given to Muslim teachers and students in School Hours for the Friday Prayer
Mange-ment
Relaxation to teachers/ Students
Relaxation given to teachers in school hours for Friday PrayerNo relaxation
N %
Break for about 1 hourN %
Maktab/Madrasah closed earlyN %
Any Other (Weekly Off)
N %
Total
NTotal Teachers
Students28 28.9 11 11.3 38 39.2 20 20.627 27.8 12 12.4 39 40.2 19 19.6
9797
Govt TeachersStudents
18 69.2 7.7 19.218 69.2 7.7 23.1
3.80.0
2626
Private TeachersStudents
10 14.1 12.7 33 46.512.7 10 14.1 33 46.5
19 26.819 26.8
7171
6.4 Enrolment and Retention
6.4.1 Enrolment in Primary Classes
Table 6.19 gives enrolment (as on 30th September) in primary classes of sampled Madrasahs in
the years 2009, 2010 and 2011. The table shows that in each year more than 99% children
enrolled in Madrasahs were Muslim. The total enrolment of Muslim children in primary classes
in the year 2009 was 14354 which had increased in successive years 2010 and 2011 by 1.2%;
showing an increase of 2.4% between 2009 and 2011. In the case of girls’ enrolment, however, it
had decreased between 2009 and 2010 by 3.5% and then increased between 2010 and 2011 by
4.1% which means that there was a nominal increase of 0.5% between 2009 and 2011 (also see
Table 6.20). As regards enrolment of non-Muslim children in Madrasahs, it is observed that there
were 114 children (including 55 girls) enrolled in 2009 but their number had decreased to only
68 (including 33 girls) in 2011. CN
OJgO h
2 5 12 069
9

Table 6.19: Enrolment as on 30th September in Sampled Madrasahs in Primary Classesin the years 2009, 2010 and 2011
State Category2009 2010 2011
Total Girls % of girls Total Girls % of
girls Total Girls % of girls
AssamTotal 1124 490 43.6 1227 487 39.7 1099 479 43.6Muslim 1113 487 43.8 1217 486 39.9 1091 477 43.7Non-Muslim 11 3 27.3 10 1 10.0 8 2 25.0
BiharTotal 2095 1199 57.2 2091 1115 53.3 1940 963 49.6Muslim 2088 1195 57.2 2083 1110 53.3 1933 959 49.6Non-Muslim 7 4 57.1 8 5 62.5 7 4 57.1
GujaratTotal - - - - - - - - -Muslim - - - - - - - - -Non-Muslim
HaryanaTotal 1184 399 33.7 1277 426 33.4 1366 492 36.0Muslim 1146 378 33.0 1246 407 32.7 1337 477 35.7Non-Muslim 38 21 55.3 31 19 61.3 29 15 51.7
Jammu & Kashmir
Total 337 155 46.0 392 176 44.9 403 198 49.1Muslim 337 155 46.0 392 176 44.9 403 198 49.1Non-Muslim 0 0 - 0 0 - 0 0 -
JharkhandTotal 581 346 59.6 606 367 60.6 560 323 57.7Muslim 576 342 59.4 601 363 60.4 560 323 57.7Non-Muslim 5 4 80.0 5 4 80.0 - - -
KarnatakaTotal 713 372 52.2 776 406 52.3 800 386 48.3Muslim 713 372 52.2 776 406 52.3 800 386 48.3Non-Muslim 0 0 - 0 0 - 0 0 -
KeralaTotal 1038 508 48.9 1041 504 48.4 1065 531 49.9Muslim 1038 508 48.9 1041 504 48.4 1065 531 49.9Non-Muslim 0 0 - 0 0 - 0 0 -
MadhyaPradesh
Total 333 169 50.8 315 169 53.7 315 177 56.2Muslim 333 169 50.8 315 169 53.7 315 177 56.2Non-Muslim 0 0 - 0 0 - 0 0 -
RajasthanTotal 449 79 17.6 480 102 21.3 452 89 19.7Muslim 449 79 17.6 480 102 21.3 452 89 19.7Non-Muslim 0 0 - 0 0 - 0 0 -
UttarPradesh
Total 5229 2327 44.5 5060 2154 42.6 5144 2386 46.4Muslim 5176 2304 44.5 5023 2137 42.5 5120 2374 46.4Non-Muslim 53 23 43.4 37 27 73.0 24 12 50.0
Uttarakhand
Total 1385 641 46.3 1356 541 39.9 1628 672 41.3Muslim 1385 641 46.3 1356 541 39.9 1628 672 41.3Non-Muslim 0 0 - 0 0 - 0 0 -
Total
Total 14468 6685 46.2 14621 6447 44.1 14772 6696 45.3Muslim 14354 6630 46.2 14530 6401 44.1 14704 6663 45.3Non-Muslim 114 55 48.2 91 46 50.5 68 33 48.5% Muslims 99.2 99.2 - 99.4 99.3 - 99.5 99.5 -
OJgO h

Among the states, an increase of more than 10% in the enrolment of Muslim girls between 2009
and 2011 was witnessed in Haryana (26.2%), Jammu & Kashmir (27.7) and Rajasthan (12.7%)
while in Karnataka, Kerala, Madhya Pradesh, Uttar Pradesh and Uttarakhand the increase was
less than 5%. On the other hand the enrolment of Muslim girls had declined in Assam (2.1%),
Bihar (19.7%) and Jharkhand (5.6%) during that period (see Table 6.20).
Table 6.20: Percentage increase in Enrolment at Primary level between 2009 & 2010 and between 2010 & 2011
% increase in enrolment
State Category Between 2009 & Between 2010 & Between 2009 &2010 2011 2011
Total Girls Total Girls Total Girls
Assam Total 9.2 -0.6 -10.4 -1.6 -2.2 -2.2Muslim 9.3 -0.2 -10.4 -1.9 -2.0 -2.1
Bihar Total -0.2 -7.0 -7.2 -13.6 -7.4 -19.7Muslim -0.2 -7.1 -7.2 -13.6 -7.4 -19.7
Gujarat Total - - - - - -Muslim - - - - - -
Haryana Total 7.9 6.8 7.0 15.5 15.4 23.3Muslim 8.7 7.7 7.3 17.2 16.7 26.2
Jammu & Total 16.3 13.5 2.8 12.5 19.6 27.7Kashmir Muslim 16.3 13.5 2.8 12.5 19.6 27.7Jharkhand Total 4.3 6.1 -7.6 -12.0 -3.6 -6.6
Muslim 4.3 6.1 -6.8 -11.0 -2.8 -5.6Karnataka Total 8.8 9.1 3.1 -4.9 12.2 3.8
Muslim 8.8 9.1 3.1 -4.9 12.2 3.8Kerala Total 0.3 -0.8 2.3 5.4 2.6 4.5
Muslim 0.3 -0.8 2.3 5.4 2.6 4.5Madhya Total -5.4 0.0 0.0 4.7 -5.4 4.7Pradesh Muslim -5.4 0.0 0.0 4.7 -5.4 4.7Rajasthan Total 6.9 29.1 -5.8 -12.7 0.7 12.7
Muslim 6.9 29.1 -5.8 -12.7 0.7 12.7Uttar Pradesh Total -3.2 -7.4 1.7 10.8 -1.6 2.5
Muslim -3.0 -7.2 1.9 11.1 -1.1 3.0Uttarakhand Total -2.1 -15.6 20.1 24.2 17.5 4.8
Muslim -2.1 -15.6 20.1 24.2 17.5 4.8Total Total 1.1 -3.6 1.0 3.9 2.1 0.2
Muslim 1.2 -3.5 1.2 4.1 2.4 0.5OJg
O h

Table 6.21 gives enrolment (as on 30th September) in upper primary classes of sampled
Madrasahs in the years 2009, 2010 and 2011. It is seen from the table that the percentage of
Muslim children in the total enrolment was more than 99%. The total enrolment of Muslim
children in upper primary classes was 3835 in 2009 which became 4092 in 2010, showing an
increase of 6.7%. It rose to 5948 the next year registering a sharp increase of 45.4%. Thus, there
was an increase of 55.1% in the total Muslim enrolment between 2009 and 2011. As regards the
enrolment of Muslim girls, an increase of only 5.7% was noticed between 2009 and 2011.
Among the states, a sharp increase was seen in the enrolment of Muslim girls in Assam (48.9%),
Haryana (132.3%), Jharkhand (78.3%) and Rajasthan (115.4%) between 2009 and 2011. On the
other hand, there was a decline in such enrolment in the states of Bihar (7.5%), Jammu &
Kashmir (21.3%) and Kerala (7.2%) during this period. The number of non-Muslim children in
upper primary classes was 23 (including 11 girls) in 2009 which became 64 (including 25 girls)
in 2011.
Table 6.21: Enrolment as on 30th September in Upper Primary Classes
in the years 2009, 2010 and 2011
6.4.2 Enrolment in Upper primary Classes
State Category2009 2010 2011
Total Girls % of Total Girls % of Total Girls % of
AssamTotal 428 92 21.5 439 114 (5.0 614 139 2^.6Muslim 425 92 21.6 433 112 25.9 608 137 22.5Non-Muslim 3 0 0.0 6 2 33.3 6 2 33.3
BiharTotal 769 511 66.4 769 478 62.2 1212 474 39.1Muslim 766 510 66.6 767 476 62.1 1208 472 39.1Non-Muslim 3 1 33.3 2 2 100.0 4 2 50.0
GujaratTotal - - - - - - - -Muslim - - - - - - - -Non-Muslim - - - - - - - -
HaryanaTotal 160 36 22.5 195 66 33.8 331 87 26.3Muslim 150 31 20.7 170 50 29.4 291 72 24.7Non-Muslim 10 5 50.0 25 16 64.0 40 15 37.5 LO
OJgO h

Table 6.21 (Contd.): Enrolment as on 30th September in Upper Primary Classes
in the years 2009, 2010 and 2011
State Category2009 2010 2011
Total Girls % of girls Total Girls % of
girls Total Girls % of girls
Jammu & Kashmir
Total 300 164 54.7 315 155 49.2 414 129 31.2Muslim 300 164 54.7 315 155 49.2 414 129 31.2Non-Muslim 0 0 - 0 0 - 0 0 -
JharkhandTotal 189 84 44.4 230 137 59.6 382 150 39.3Muslim 186 83 44.6 228 135 59.2 377 148 39.3Non-Muslim 3 1 33.3 2 2 100.0 5 2 40.0
KarnatakaTotal 349 179 51.3 362 188 51.9 578 198 34.3Muslim 349 179 51.3 362 188 51.9 578 198 34.3Non-Muslim 0 0 - 0 0 - 0 0 -
KeralaTotal 657 321 48.9 652 305 46.8 903 298 33.0Muslim 657 321 48.9 652 305 46.8 903 298 33.0Non-Muslim 0 0 - 0 0 - 0 0 -
MadhyaPradesh
Total 179 96 53.6 183 103 56.3 286 102 35.7Muslim 179 96 53.6 183 103 56.3 286 102 35.7Non-Muslim 0 0 - 0 0 - 0 0 -
RajasthanTotal 164 13 7.9 174 15 8.6 212 28 13.2Muslim 164 13 7.9 174 15 8.6 212 28 13.2Non-Muslim 0 0 - 0 0 - 0 0 -
UttarPradesh
Total 663 263 39.7 813 284 34.9 1080 267 24.7Muslim 659 259 39.3 808 280 34.7 1071 263 24.6Non-Muslim 4 4 100.0 5 4 80.0 9 4 44.4
Uttarakhand
Total 0 0 - 0 0 - 0 0 -Muslim 0 0 - 0 0 - 0 0 -Non-Muslim 0 0 - 0 0 - 0 0 -
Total
Total 3858 1759 45.6 4132 1845 44.7 6012 1872 31.1Muslim 3835 1748 45.6 4092 1819 44.5 5948 1847 31.1Non-Muslim 23 11 47.8 40 26 65.0 64 25 39.1% Muslims 99.4 99.4 - 99.0 98.6 - 98.9 98.7 -
V.D
OJgO h

Table 6.22: Percentage increase in Enrolment at Upper Primarybetween 2009 & 2010 and between 2010 & 2011
level
State Category
% increase in enrolment
Between 2009 & 2010
Between 2010 & 2011
Between 2009 & 2011
Total Girls Total Girls Total Girls
Assam Total 2.6 23.9 39.9 21.9 43.5 51.1Muslim 1.9 21.7 40.4 22.3 43.1 48.9
Bihar Total 0.0 -6.5 57.6 -0.8 57.6 -7.2Muslim 0.1 -6.7 57.5 -0.8 57.7 -7.5
Gujarat Total - - - - - -Muslim - - - - - -
Haryana Total 21.9 83.3 69.7 31.8 106.9 141.7Muslim 13.3 61.3 71.2 44.0 94.0 132.3
Jammu & Kashmir
Total 5.0 -5.5 31.4 -16.8 38.0 -21.3Muslim 5.0 -5.5 31.4 -16.8 38.0 -21.3
Jharkhand Total 21.7 63.1 66.1 9.5 102.1 78.6Muslim 22.6 62.7 65.4 9.6 102.7 78.3
Karnataka Total 3.7 5.0 59.7 5.3 65.6 10.6Muslim 3.7 5.0 59.7 5.3 65.6 10.6
Kerala Total -0.8 -5.0 38.5 -2.3 37.4 -7.2Muslim -0.8 -5.0 38.5 -2.3 37.4 -7.2
MadhyaPradesh
Total 2.2 7.3 56.3 -1.0 59.8 6.3Muslim 2.2 7.3 56.3 -1.0 59.8 6.3
Rajasthan Total 6.1 15.4 21.8 86.7 29.3 115.4Muslim 6.1 15.4 21.8 86.7 29.3 115.4
Uttar Pradesh Total 22.6 8.0 32.8 -6.0 62.9 1.5Muslim 22.6 8.1 32.5 -6.1 62.5 1.5
Uttarakhand Total - - - - - -Muslim - - - - - -
Total Total 7.1 4.9 45.5 1.5 55.8 6.4Muslim 6.7 4.1 45.4 1.5 55.1 5.7
OJgO h

6.4.3 Madrasah leavers and dropouts (Muslims, non-Muslims) at primary and upper primary stages
6,4,3,1 Madrasah Leavers at Primary Stage
Table 6.23 gives the percentage of Madrasah leavers and dropouts at primary stage during the
years 2009-10 and 2010-11. Madrasah leavers were those who were in school in a given year but
no longer in the same school in the following year. Some of the Madrasah leavers joined other
schools/ Madrasahs but some became dropouts. The table shows that the percentage of children
who had left Madrasah during 2009-10 was 3.9% in the case of Muslim children as against 3.5%
for non-Muslim children. The corresponding percentages for girls were 3.6% and 1.8%
respectively. During the year 2010-11, there was a slight decrease in the percentage of Madrasah
leavers for total Muslim children while an increase was noticed for non-Muslim children; the
percentage of Madrasah leavers among total Muslim children was 3.6% as against 9.9% among
non-Muslim children. The corresponding figures for girls were 3.8% and 8.7% respectively.
6.4.3.2 Dropouts at Primary Stage
It is seen from Table 6.23 that the percentage of dropouts among Muslim and non-Muslim
children during the year 2009-10 was 2.1% and 3.5% respectively. The corresponding
percentages for girls were 2.1% and 1.8% respectively. It is interesting to note that all Madrasah
leavers among the non-Muslim children became dropouts. In the year 2010-11, the percentage
of dropouts among Muslim children was more or less same as was in the previous year but an
increase was noticed in these percentages among non-Muslim children.
6.4.3.3 Madrasah Leavers at Upper Primary Stage
It is observed from Table 6.23 that the percentage of Madrasah leavers at upper primary stage
during 2009-10 was 5.3% among Muslim children as against 8.7% among non-Muslim children.
The corresponding percentages for girls were 4.4% and 9.1% respectively. A mixed trend was 0 0t-H
observed in the year 2010-11, a decrease among total Muslim children and an increase among ^OJ
total non-Muslim children, in the percentage of Madrasah leavers. Jg

Table 6.23: Percentage of Madrasah leavers and dropout at Primary Stagein 2009-10 and 2010-11
Stage Year% of Madrasah leavers
Muslim
Total Girls
Non-Muslim
Total Girls
% of dropoutsMuslim
Total Girls
Non-Muslim
Total Girls
(1) (2) (3) (4) (5) (6) (7) (8) (9) (10)
Primary2009-10 3.9 3.6 3.5 1.8 2.1 2.1
2010-11 3.6 3.8 9.9 8.7 2.1 2.3
3.5
8.8
1.8
8.7
Upper Primary2009-10 5.3 4.4 8.7 9.1 2.1 1.7
2010-11 4.5 3.6 20.0 3.8 2.6 2.6
8.7
17.5
9.1
0.0
Total2009-10 4.2 3.8 4.4 3.0 2.1 2.0
2010-11 3.8 3.7 13.0 6.9 2.2 2.3
4.4
11.5
3.0
5.6
6,4,3,4 Dropouts at Upper Primary Stage
It is further observed from Table 6.23 that the percentage of dropouts at upper primary stage
among Muslim and non-Muslim children in 2009-10 was 2.1% and 8.7% respectively. It means
all Madrasah leavers among non-Muslim children became dropouts. In the year 2010-11, an
increase was noticed in the percentage of dropouts from the previous year among Muslim as well
as non-Muslim children.
6.4.4 Reasons for dropping out
The head teacher of every Madrasah was asked to give the number of students who had
discontinued their studies during the year 2010-11. He was also asked to mention two main
reasons of their leaving the Madrasah separately for ‘all boys’, ‘all girls’, ‘Muslim boys’ and
‘Muslim girls’ from the list of 7 possible reasons. It is evident from Table 6.24 that three main
reasons of dropping out that emerged for ‘all’ as well as ‘Muslim children’ in primary Madrasahs
were ‘child needed to help parents in their occupation or income generating activity’, ‘childOJg
O h

needed to help in domestic work or taking care of siblings’ and ‘lack of parental interest in
studies’. Besides, the reasons like ‘Early marriage’, ‘no facility of teaching Urdu’ and ‘Madrasah
being far from Home’ were also mentioned but only by a relatively small number of head
teachers.
Table 6.24: Main Reasons of Students dropping out from Madrasahs according to head teachers during 2010-11
Reason of dropping outChildren in Primary Madrasahs
All
Boys Girls
Muslim
Boys Girls
Children in Upper Primary MadrasahsAll
Boys Girls
Muslim
Boys Girls1
Child needed to help parents in their occupation or income generating activity
82 66 78 60 81 53 73 52
Child needed to help in domestic work and care of siblings
67 68 60 60 79 57 71 56
Lack of parental interest in studies 59 36 57 34 74 63 66 60Early Marriage 15 29 11 23 11 11
No facility for teaching Urdu 14 19 10 13 25 32 20 32Madrasah being far from Home 11 13 11 13 24 31 19 31Any Other 12 16 12 14
Further, in the case of children studying in upper primary classes the three main reasons for
children dropping out from Madrasah were the same as mentioned above for primary school
children. ‘No facility of teaching Urdu’ and ‘Madrasah being far from Home’ were two other
reasons that were mentioned by quite a relatively small number of head teachers. Surprisingly,
‘Early marriage’ as a reason of students dropping out from was given by a lesser proportion of
head teachers of upper primary level than by the head teachers of primary level Madrasahs.
6.4.5 Absence rate; reasons for long absence
6.4.5.1 Absence rate
Table 6.25 gives the enrolment and percentage of students found present on the day of visit in
primary and upper primary Madrasahs. The table shows that almost all students enrolled in
OCN
CJgroCX
2 4 5 6 7 8 9
6 6
01 1 0

Madrasahs belonged to Muslim community. Therefore, discussion will be only about Muslim
students. Out of a total of 5375 Muslim students in primary Madrasahs, 76.9% were present on
the day of visit. The corresponding percentage for girls was 73.3%.
In upper primary Madrasahs, the percentage of total Muslim students present in Madrasah was
86.8%. The corresponding percentage for Muslim girls was 83.0%.
Table 6.25: Enrolment and percentage of students found present on the day of visit
Madrasahcategory
All Students
Enrolment No.Present
% of Col. 4 to Col.3
Muslim Students
Enrolment No.Present
% of Col. 7 to Col.6
(1) (2) (3) (4) (5) (6) (7) (8)Primary Total
Girls
5391 4168 77.3 5375 4133
2309 1691 73.2 2296 1683
76.9
73.3Upper
PrimaryTotal
Girls
7724 6716 86.9 7689 6671
3203 2661 83.1 3181 2639
86.8
83.0
6.4.5.2 Reasons for long absence
The head teachers of sampled Madrasahs were asked to mention two main reasons for long or
frequent absence of children from Madrasah separately for (a) all students; (b) particularly
Muslim boys and (c) particularly Muslim girls. It is seen from Table 6.26 that 36.1% of head
teachers had given ‘Lack of interest of parents in their children’s school attendance’ as the main
reason for children’s long absence from Madrasah. Next was the reason ‘helping parents in their
occupation’ mentioned by 34.0% head teachers followed by the reason ‘involvement of students
in household work’ (28.9%). In the case of Muslim girls the latter reason was given by over 50%
head teachers. Some other reasons were also given by head teachers of fairly large percentage
of Madrasahs.
CN
OJgO h

Table 6.26: Main reasons for long or frequent absence of children from Madrasahs
Category of Students
Parents lack of
interest in the
children’s school
attendance
N %
helping parents in
their occupation
N %
Students’ involvement in household work/taking
care of younger
brother/sister
N %
Participation in religious and social functions
N %
Family migrating to other place in
search of work
N %
Others
N %
Total
(1) (2) (3) (4) (5) (6) (7) (8) (9) (10) (11) (12) (13) (14)For all Students 35 36.1 33 34.0 28 28.9 1.0 6.2 50 51.5 97
Particularly for Muslim boys
35 36.1 32 33.0 19 19.6 3.1 28 28.9 27 27.8 97
Particularly for Muslim Girls
28 28.9 23 23.7 57 58.8 5.2 4.1 28 28.9 97
6.4.6.1 School Management Committee
Table 6.27 gives the number of School Management Committee (SMC) members and the
percentage of those members who attended the latest meeting of SMC. The table shows that the
total number of members in SMCs in 97 sampled Madrasahs was 1052. Of these, 796 (75.7%)
members belonged to Muslim community. Females constituted 29.8% of the total members as
against only 14.7% among Muslim members in SMCs. About 80% of Muslim members as well
as non-Muslim members had attended the latest meeting
Table 6.27: Number of Members in School Management Committee (SMC) and Number of those who attended the latest meeting
CategoryTotal Members Muslim Members
Male Female Total Male Female Total
(1) (2) (3) (4) (5) (6) (7)Total Number of Members 739 313 1052 679 117 796
Number of those who attended the latest meeting
591 245 836 546 89 635
% of Members who attended the latest meeting
80.0 78.3 79.5 80.4 76.1 79.8CNCN
OJgO h
1 6
45

Table 6.28 gives information about the kind of support (partial or adequate) the community
provided to Madrasahs in facilitating education of all children and particularly of Muslim
children. As mentioned earlier, almost all students (99.5%) enrolled in primary and upper
primary Madrasahs belonged to Muslim community, hence the support received by Madrasahs
will be discussed only about Muslim students. The table shows that for Muslim children,
majority of Madrasahs had received support from the community in admission process and
ensuring children’s retention and attendance (66%) and in organization of religious or moral
education programmes (60%). In more than one-half of the Madrasahs some support was
received in the form of donations in cash or kind for improvement of facilities in school (56.7%)
and providing help in studies (53.6%). Nearly one-third of Madrasahs were supported by the
community in the form of teaching some skills to children.
6.4.6.2 Support from Community
Table 6.28: Support received by Madrasah from the community in facilitating Education of all children and Muslim students in particular
Item Total No. of
Madrasahs
% of Madrasahs received support from communityFor all children For Muslim children
Nosupport
somesupport
adequatesupport
Nosupport
somesupport
adequatesupport
(1) (2) (3) (4) (5) (6) (7) (8)(i) Enrolling children and
ensuring their retention and attendance
97 48.5 25.8 25.8 34.0 36.1 29.9
(ii) Getting donations in cash or kind for improvement of facilities in school.
97 56.7 22.7 20.6 43.3 27.8 28.9
(iii) Providing help in studies 97 57.7 25.8 16.5 46.4 35.1 18.6
(iv) Organising religious or moral education programmes
97 57.7 28.9 13.4 40.2 30.9 28.9
(v) Teaching some skills to children.
97 66.0 24.7 9.3 68.0 20.6 11.3
c nCN
OJgO h

Chapter 7
Parents’ opinion
This chapter discusses such aspects as (i) information from Muslim parents about educational
status of their children of school going age (ii) their views regarding functioning of school and
(iii) incentives given to Muslim children in school/ Madrasah.
7.1 Selection of parents for interviewing
From every sampled school/ Madrasah 4 Muslim children were selected in order to interview
their parents. Table 7.1 presents the distribution of these parents according to area, their gender
and age. The table shows that the total number of parents selected from the sampled districts of
the 12 selected states was 4583. Of these, 3383 (73.8%) were from rural area and 1200 (26.2%)
from urban area. Females constitute 30.6% of the total respondents. The corresponding
percentage of females in the sample in rural and urban areas was 27.1% and 40.5% respectively.
The percentage of female respondents was highest in Kerala (54.5%) followed by Gujarat
(48.2%) and Karnataka (44.7%). On the other hand, Jharkhand had the lowest percentage (6.3%)
of female respondents. The other states which had low percentage of female respondents were
Jammu & Kashmir (12%) and Rajasthan (13.4%). Majority of parents (46%) belonged to age-
group 36 to 45 years. A little over one-third of parents were below 36 years of age; the
percentage of such parents in rural areas was 34.5% as against 38.9% in urban areas.
7.2 Parents’ occupation
Table 7.2 gives the distribution of parents according to their families’ primary source of income;
percentage of families below poverty line (BPL) and percentage of mothers engaged in economic
activity. It is seen from the table that in rural areas, the majority of parents were agriculturist
(26.9%). Next were those parents who were casual labourer (25.3%). About 15% parents were
agriculture labourer and another 14.4% parents were engaged in trading.CN
OJgO h

Table 7.1: Distribution of Parents according to Area, Gender and Age
State Area No. of respondent parents % of parents in Age -group
Total Female % of female respondents
Up to 35 years
36 to 45 years
> 45 years
(1) (2) (3) (4) (5) (6) (7) (8)
AssamRural 397 110 27.7 32.0 36.0 32.0Urban 134 63 47.0 39.6 38.8 21.6Total 531 173 32.6 33.9 36.7 29.4
BiharRural 396 112 28.3 40.4 42.2 17.4Urban 128 52 40.6 39.1 46.1 14.8Total 524 164 31.3 40.1 43.1 16.8
GujaratRural 120 51 42.5 35.8 50.0 14.2Urban 48 30 62.5 52.1 37.5 10.4Total 168 81 48.2 40.5 46.4 13.1
HaryanaRural 120 36 30.0 26.7 55.8 17.5Urban 48 11 22.9 52.1 39.6 8.3Total 168 47 28.0 33.9 51.2 14.9
Jammu & Kashmir
Rural 304 25 8.2 33.2 44.1 22.7Urban 80 21 26.3 28.8 52.5 18.8Total 384 46 12.0 32.3 45.8 21.9
JharkhandRural 246 15 6.1 30.1 50.4 19.5Urban 54 4 7.4 18.5 66.7 14.8Total 300 19 6.3 28.0 53.3 18.7
KarnatakaRural 194 88 45.4 39.2 50.5 10.3Urban 90 39 43.3 35.6 53.3 11.1Total 284 127 44.7 38.0 51.4 10.6
KeralaRural 552 294 53.3 49.1 43.5 7.5Urban 234 134 57.3 49.6 42.7 7.7Total 786 428 54.5 49.2 43.2 7.5
MadhyaPradesh
Rural 132 40 30.3 47.0 39.4 13.6Urban 40 17 42.5 50.0 35.0 15.0Total 172 57 33.1 47.7 38.4 14.0
RajasthanRural 131 10 7.6 18.3 55.7 26.0Urban 41 13 31.7 41.5 41.5 17.1Total 172 23 13.4 23.8 52.3 23.8
Uttar PradeshRural 662 107 16.2 24.2 49.5 26.3Urban 256 84 32.8 30.5 50.4 19.1Total 918 191 20.8 25.9 49.8 24.3
UttarakhandRural 129 30 23.3 27.9 50.4 21.7Urban 47 18 38.3 38.3 46.8 14.9Total 176 48 27.3 30.7 49.4 19.9
TotalRural 3383 918 27.1 34.5 45.8 19.7Urban 1200 486 40.5 38.9 46.3 14.8Total 4583 1404 30.6 35.6 46.0 18.4
OJgO h

Table 7.2: Percentage of Parents by their Families’ primary source of income, Families belonging to BPL category and Mothers engaged in Economic activity
State Area Total no. of parents
(N)
% of familirs having primary source of income as % of families belong to BPL category
% of mothers engaged ineconomicactivity
Agricultureonownland
Agricultureonrentedland
Agriculturelabour
Casuallabour
Selfemploy-ment/trading
Traditionalhandi-craft/craft -- ..1.
Service
(1) (2) (3) (4) (5) (6) (7) (8) (9) (10) (11) (12)
AssamRural 397 22.2 21.4 17.6 17.4 10.8 1.8 8.8 50.4 14.1Urban 134 6.0 9.0 21.6 11.2 38.8 3.0 10.4 41.0 16.4Total 531 18.1 18.3 18.6 15.8 17.9 2.1 9.2 48.0 14.7
BiharRural 396 38.9 14.6 18.2 17.9 6.6 1.5 2.3 54.8 47.5Urban 128 14.1 7.8 16.4 18.8 26.6 10.9 5.5 47.7 14.8Total 524 32.8 13.0 17.7 18.1 11.5 3.8 3.1 53.1 39.5
GujaratRural 120 12.5 5.0 15.0 11.7 28.3 5.8 21.7 25.0 23.3Urban 48 4.2 0.0 4.2 27.1 50.0 2.1 12.5 37.5 14.6Total 168 10.1 3.6 11.9 16.1 34.5 4.8 19.0 28.6 20.8
HaryanaRural 120 40.0 8.3 18.3 18.3 6.7 3.3 5.0 50.8 15.8Urban 48 18.8 6.3 14.6 6.3 14.6 4.2 35.4 29.2 14.6Total 168 33.9 7.7 17.2 14.9 9.0 3.6 13.7 44.6 15.5
Jammu & Kashmir
Rural 304 65.8 1.3 2.3 18.8 3.0 0.7 8.2 66.1 12.8Urban 80 13.8 5.0 1.3 27.5 18.8 1.3 32.5 33.8 16.3Total 384 54.9 2.1 2.1 20.6 6.3 0.8 13.3 59.4 13.5
JharkhandRural 246 36.2 10.6 35.8 8.1 2.0 2.0 5.3 78.0 20.7Urban 54 7.4 0.0 13.0 35.2 33.3 3.7 7.4 40.7 0.0Total 300 31.0 8.7 31.7 13.0 7.7 2.3 5.7 71.3 17.0
KarnatakaRural 194 8.2 1.0 17.0 28.4 22.2 10.8 12.4 44.3 46.4Urban 90 1.1 1.1 11.1 34.4 30.0 2.2 20.0 37.8 30.0Total 284 6.0 1.1 15.1 30.3 24.6 8.1 14.8 42.3 41.2
KeralaRural 552 8.0 5.8 6.0 37.7 31.7 1.4 9.4 39.7 14.7Urban 234 2.1 0.4 4.3 44.0 31.2 5.1 12.8 29.5 12.0Total 786 6.2 4.2 5.5 39.6 31.6 2.5 10.4 36.6 13.9
MadhyaPradesh
Rural 132 27.3 0.0 17.4 41.7 6.1 0.0 7.6 48.5 65.2Urban 40 0.0 0.0 0.0 52.5 20.0 7.5 20.0 65.0 30.0Total 172 20.9 0.0 13.4 44.2 9.3 1.7 10.5 52.3 57.0
RajasthanRural 131 29.0 3.1 25.2 23.7 6.1 .8 12.2 48.9 39.7Urban 41 9.8 2.4 9.8 29.3 26.8 4.9 17.1 36.6 19.5Total 172 24.4 2.9 21.5 25.0 11.0 1.7 13.4 45.9 34.9
UttarPradesh
Rural 662 24.9 2.6 16.8 31.3 14.0 6.2 4.2 37.8 15.0Urban 256 2.7 0.8 2.3 37.1 38.3 12.5 6.3 27.7 8.6Total 918 18.7 2.1 12.7 32.9 20.8 8.0 4.8 35.0 13.2
Uttarakhand
Rural 129 12.4 0.8 8.5 37.2 26.4 9.3 5.4 26.4 17.1Urban 47 2.1 2.1 2.1 46.8 31.9 12.8 2.1 17.0 14.9Total 176 9.7 1.1 6.8 39.8 27.8 10.2 4.5 23.9 16.5
TotalRural 3383 26.9 7.2 15.4 25.3 14.4 3.4 7.4 47.8 24.0Urban 1200 5.8 2.9 8.2 31.7 31.8 6.8 12.8 35.0 14.3Total 4583 21.4 6.1 13.5 27.0 18.9 4.3 8.8 44.5 21.4

In urban areas, 31.8% of parents were engaged in trading; 31.7% were casual labourer; and
another 12.8% of parents were in service. In six of the 12 states, majority of parents were casual
labourer. These states are Karnataka, Kerala, Madhya Pradesh, Rajasthan, Uttar Pradesh and
Uttarakhand. In three states namely Bihar, Jammu & Kashmir and Haryana, majority of parents
were agriculturist. Further, majority of parents were agriculture labourers in Assam and Jharkand
while in Gujarat the majority of parents were either self-employed or engaged in trade.
The table further reveals that 44.5% families of total selected children belonged to BPL category.
The corresponding percentages in rural and urban areas were 47.8% and 35.0% respectively.
Among the states, Jharkhand (71.3%) had the highest percentage of BPL families in the sample
followed by Jammu & Kashmir (59.4%), Bihar (53.1%) and Madhya Pradesh (52.3%). The
percentage of such families was the lowest in Uttarakhand (23.9%). As regards involvement of
mothers in economic activity, the percentage of such mothers in rural areas was 24.0% as against
14.3% in urban areas.
7.3 Educational level of parents
Distribution of parents as per their educational level is presented in Table 7.3. It is seen from the
table that out of a total of 3383 respondent parents, the majority of them (fathers - 24.4%;
mothers - 43.5%) were illiterate in rural areas. The percentage of fathers who had passed either
secondary or higher education qualification was only 23.6% but the situation in the case of
female parents was even worse as only 16.9% of them had such qualification. Of the 1200
respondent parents in urban areas, 14.0% fathers and 26.5% mothers were illiterate. The percentage of
fathers who had completed a minimum secondary education was 37% while the percentage of
mothers having such qualification was only 26.8%. State-wise analysis shows a large variation in
the educational qualification of parents. In some states, majority of parents were illiterate while
in some other states the percentage of illiterate parents was small and majority of them had a
minimum secondary pass certificate. The states where majority of parents (both male and
female) were illiterate are Bihar, Haryana, Jammu & Kashmir, Rajasthan and Uttar Pradesh, On
the other hand, Gujarat, Karnataka and Kerala are the states where majority of parents had either CN
a secondary or higher qualification. (See Table A3.1 in Appendix). ce

Table 7.3: Educational level of Parents
Area Parents Total(N)
% of parents having educational level asIlliterate
Literate with no/
little schooling
completedprimary
completedupper
primary
completed Secondary (class x)
completed Sr. Secon
dary
Graduate & above
(1) (2) (3) (4) (5) (6) (7) (8) (9) (10)Rural Father 3383 24.4 16.8 19.0 16.2 13.0 6.1 4.5
Mother 3383 43.5 18.1 11.6 9.8 10.4 4.0 2.5
Urban Father 1200 14.0 14.3 17.0 17.7 17.5 9.9 9.6
Mother 1200 26.5 18.3 13.2 15.2 15.6 6.8 4.4
Total Father 4583 21.7 16.1 18.5 16.6 14.2 7.1 5.8
Mother 4583 39.1 18.2 12.0 11.2 11.7 4.8 3.0
7.4 Children in the age-group 6 to below 14 years in homes of sampled parents
Table 7.4 gives the total number of children in the age-group 6 to below 14 years in homes of
sampled parents as per their educational status. It is observed from the table that the total number
of children in the age groups 6 to below 11 years and 11 to below 14 years was 5353 (2818 boys
and 2535 girls) and 3829 (1952 boys and 1877 girls) respectively. Of the total number of
children in the age-group 6 to below 11 years, 95.5% were attending school or recognized
Madrasah while the remaining 4.5% were out-of-school. The corresponding figures for age-
group 11 to below 14 years were 93.3% and 6.7% respectively. Among the states, in the age-
group 6 to below 11 years, Jharkhand had the highest percentage (14.8%) of out-of-school
children in homes of sampled parents followed by Karnataka (6.2%) while the percentage of
such children was found below 1% in the states of Karnataka and Uttarakhand. In the age-group
11 to below 14 years, the percentage of out-of-school children was between 9% and 10% in
Jammu & Kashmir, Jharkhand, Rajasthan and Uttar Pradesh and below 2% in Gujarat, Kerala
and Uttarakhand. (See Table A3.2 in Appendix). Detailed information about out-of-school
children and those who were studying in school or recognized Madrasah is given in subsequent
sections.
0 0CN
OJgO h

Table 7.4: Distribution of Children in the age-group 6 to below 14 years in homes of Parentsaccording to their educational status
Area GenderAge-group 6 to below 11 years
Total no. of
children
% of childrenout-ofschool
attendingschool
Age-group 11 to below 14 years
Total no. of
children
% of childrenout-ofschool
attendingschool
Age-group 6 to below 14 years
Total no. of
children
% of childrenout-ofschool
attendingschool
J1L J2L J3L J4L J5L J6L JZL J8L I9L (11)Boys 2156 4.4 95.6 1415 7.3 92.7 3571 5.5 94.5
Rural Girls 1887 3.3 96.7 1325 5.7 94.3 3212 4.3 95.7Total 4043 3.9 96.1 2740 6.5 93.5 6783 4.9 95.1Boys 662 6.2 93.8 537 7.3 92.7 1199 6.7 93.3
Urban Girls 648 6.9 93.1 552 7.4 92.6 1200 7.2 92.8
Total 1310 6.6 93.4 1089 7.3 92.7 2399 6.9 93.1Boys 2818 4.8 95.2 1952 7.3 92.7 4770 5.8 94.2
Total Girls 2535 4.2 95.8 1877 6.2 93.8 4412 5.1 94.9
Total 5353 4.5 95.5 3829 6.7 93.3 9182 5.5 94.5
7.5 Children who were out of school
The parents were asked to give information about all their children in the age-group 6-14 years
who were not studying in any recognized school or Madrasah. The distribution of such children
according to area, gender and educational status is given in Table 7.4. The table shows that out of
a total 243 (136 boys and 107 girls) out-of-school children (OOSC) in the age-group 6 to below
11 years, 35.0% had dropped out from school while 29.6% of them were attending Madrasah/
maktab which provides only religious education. The percentage of girls among OOSC was less,
44% against 56% boys. There were 35.4% out-of-school children who had never gone to any
school. Further, the total number of out-of-school children in the age-group 11 to below 14 years
was 258 (142 boys and 116 girls). It may be noted that the percentage of girls among out-of
school children in 6 to below 11 years age group was less, 45% against 55% boys. About 63% of
these children were dropouts from school. The corresponding figure for boys was 65.5% as
against 59.5% for girls. The percentage of those children in this age group who had never gone
a ^CN
OJegO h

to school was 18.6% (12.7% boys and 25.9% girls). State-wise analysis of out-of-school children
in homes of parents indicates that more than 50% of these children in the age-group 6 to below
11 years had dropped out in Gujarat (2 out of 2), Kerala (4 out of 5) and Rajasthan (5 out of 7).
The percentage of such children in the age-group 11 to below 14 years was about 75% in the states of
Jammu & Kashmir, Rajasthan and Uttar Pradesh.
Table 7.5: Number of out-of-school children in homes of parents
Area GenderAge-group 6 to below 11 years
Total no. of
children
% of childrennever went to school
had dropped -
out
attendingMadrasah/Maktab*
Age-group 11 to below 14 yearsTotal no. of
children
% of childrennever went to school
had dropped -
out
attendingMadrasah/Maktab*
(1) (2) (3) (4) (5) (6) (7) (8) (9) (10)
RuralBoys 95 42.1 36.8 21.1 103 15.5 66.0 18.4
Girls 62 45.2 25.8 29.0 75 25.3 62.7 12.0
Total 157 43.3 32.5 24.2 178 19.7 64.6 15.7
UrbanBoys 41 24.4 36.6 39.0 39 5.1 64.1 30.8
Girls 45 17.8 42.2 40.0 41 26.8 53.7 19.5
Total 86 20.9 39.5 39.5 80 16.3 58.8 25.0
Boys 136 36.8 36.8 26.5 142 12.7 65.5 21.8
Total Girls 107 33.6 32.7 33.6 116 25.9 59.5 14.7
Total 243 35.4 35.0 29.6 258 18.6 62.8 18.6
' providing only religious education.
7.6 Children attending School/ recognized Madrasahs
The distribution of children of the sampled parents in the age-group 6 to below 14 years who
were studying in school or recognized Madrasahs is presented in Table 7.6. The total number of
such children in the age-group 6 to below 11 years was 5110 of whom 47.5% were girls. About
69% of the boys were enrolled in government schools as against 70% girls while the
corresponding percentages in private schools were 22.6% and 22.0% respectively. Besides, 8.4%
children were enrolled in recognized Madrasahs. The table further reveals that out of a total ofOJeg
O h

3571 children in the age-group 11 to below 14 years, 2580 (72.2%) were enrolled in government
schools. The percentage of girls in this age-group studying in government schools was 73%
while the corresponding percentage of boys was 71.5%. On the other hand, the percentage of
girls enrolled in private schools was 17.9% which was a little lower than the corresponding
percentage of boys (20.9%). Another 8.3% children of this age-group had joined Madrasahs. The
above discussion indicates that some parents give preference to their sons over their daughters in
sending them to a private school.
Table 7.6: Number of Children of the sampled Parents in the age group 6 to below 14 years who were attending School/Recognized Madrasahs in Rural and Urban areas
Area Type of School
No. of children attending school/Madrasah6 to below 11 years 11 to below 14 years 6 to below 14 years
Boys Girls Total Boys Girls Total Boys Girls Total(1) (2) (3) (4) (5) (6) (7) (8) (9) (10) (11)
Rural
Govt.School
1502(72.9)
1347(73.8)
2849(73.3)
976(74.4)
935(74.8)
1911(74.6)
2478(73.5)
2282(74.2)
4760(73.8)
PrivateSchool
382(18.5)
335(18.4)
717(18.5)
238(18.1)
190(15.2)
428(16.7)
620(18.4)
525(17.1)
1145(17.8)
Madrasah 177(8.6)
143(7.8)
320(8.2)
98(7.5)
125(10.0)
223(8.7)
275(8.2)
268(8.7)
543(8.4)
Total 2061(100.0)
1825(100.0)
3886(100.0)
1312(100.0)
1250(100.0)
2562(100.0)
3373(100.0)
3075(100.0)
6448(100.0)
Urban
Govt.School
342(55.1)
352(58.4)
694(56.7)
319(64.1)
350(68.5)
669(66.3)
661(59.1)
702(63.0)
1363(61.0)
PrivateSchool
224(36.1)
198(32.8)
422(34.5)
141(28.3)
125(24.5)
266(26.4)
365(32.6)
323(29.0)
688(30.8)
Madrasah 55(8.9)
53(8.8)
108(8.8)
38(7.6)
36(7.0)
74(7.3)
93(8.3)
89(8.0)
182(8.2)
Total 621(100.0)
603(100.0)
1224(100.0)
498(100.0)
511(100.0)
1009(100.0)
1119(100.0)
1114(100.0)
2233(100.0)
Total
Govt.School
1844(68.8)
1699(70.0)
3543(69.3)
1295(71.5)
1285(73.0)
2580(72.2)
3139(69.9)
2984(71.2)
6123(70.5)
PrivateSchool
606(22.6)
533(22.0)
1139(22.3)
379(20.9)
315(17.9)
694(19.4)
985(21.9)
848(20.2)
1833(21.1)
Madrasah 232(8.7)
196(8.1)
428(8.4)
136(7.5)
161(9.1)
297(8.3)
368(8.2)
357(8.5)
725(8.4)
Total 2682(100.0)
2428(100.0)
5110(100.0)
1810(100.0)
1761(100.0)
3571(100.0)
4492(100.0)
4189(100.0)
8681(100.0)
Note: Figures within the parentheses indicate percentages. OJegO h

We shall discuss the incentives separately for the children studying at primary and upper primary
levels in rural and urban areas. While the incentives are the same, the percentage of children
benefitting differs from one type of school to another.
7.7.1 Children studying at Primary level in rural areas
Table 7.7 gives information about children studying at primary level getting different incentives
in school. The table shows that, according to the parents, most of their children (both boys and
girls) studying at primary level in rural government schools were getting free textbooks and M id
day meal. Free uniforms were given to 51.5% boys and 62.6% girls while scholarships were
given to 45.4% boys and 47.2% girls. Free school bag was given to only 20% children (13.5%
boys and 27.1% girls). Among the children going to private schools, free textbooks, Mid-day
meal and scholarship were received by 41.0%, 46.1% and 44.7% boys respectively. The
corresponding figures for girls were 52.7%, 57.4% and 45.9% respectively. While free textbooks
and mid-day meals are for every child, it is surprising that a large percentage of children in
government schools remained deprived of these incentives according to their parents. Other
incentives such as free school bag were given only to very few children. In Madrasahs, free
textbooks, Mid-day meal and scholarship were given respectively to 51%, 41% and 18.4%
children; other incentives were given to few children.
7.7.2 Children studying at Primary level in urban areas
It is seen from Table 7.7 that in urban areas, 898 children (442 boys and 456 girls) were studying
at primary level in government schools. While most of the children received free textbooks and
Mid-day meal, the percentage of girls getting free uniform, free school bag and scholarship was
much higher than that of boys. Among the children who were enrolled in private schools, the
percentage of boys receiving free textbooks, Mid-day meal and scholarship was 27.1%, 33.9%
and 30.3% respectively. The corresponding percentages for girls were 29.6%, 37.3% and 35.2%
respectively. Free uniform and free school bag were received by only very few students. In CN
Madrasahs, free textbooks were given to 52.1% boys and 60.8% girls, Mid-day meal to 29.6% ^
boys and 39.2% girls and scholarship to 22.5% boys and 21.6% girls.
7.7 Incentives provided to children

Table 7.7: Number of Children of sampled parents studying at Primary level (Classes I-V)getting different incentives in Rural and Urban areas
Area Type of school
Gender Total No. of children attending primary classes
% of children getting
freetextbooks
freeuniform
freeschoolbag
Middaymeal
Scholarship
(1) (2) (3) (4) (5) (6) (7) (8) (9)
Govt.school
Boys 1890 91.6 51.5 13.5 89.7 45.4
Girls 1702 94.4 62.6 27.1 90.8 47.2Total 3592 92.9 56.8 20.0 90.2 46.2
Rural Privateschool
Boys 434 41.0 6.2 4.6 46.1 44.7Girls 364 52.7 13.7 4.7 57.4 45.9Total 798 46.4 9.6 4.6 51.3 45.2
Madrasah/Maktab
Boys 230 53.0 13.9 6.5 44.8 18.7Girls 182 48.4 9.9 5.5 36.3 18.1Total 412 51.0 12.1 6.1 41.0 18.4
Govt.school
Boys 442 90.5 52.7 12.0 91.9 49.3Girls 456 92.5 69.3 24.1 92.3 58.1Total 898 91.5 61.1 18.2 92.1 53.8
Urban Privateschool
Boys 251 27.1 7.6 1.6 33.9 30.3Girls 233 29.6 8.6 1.7 37.3 35.2Total 484 28.3 8.1 1.7 35.5 32.6
Madrasah/Maktab
Boys 71 52.1 15.5 7.0 29.6 22.5Girls 74 60.8 10.8 1.4 39.2 21.6Total 145 56.6 13.1 4.1 34.5 22.1
Govt. Boys 2332 91.4 51.7 13.2 90.1 46.1
school Girls 2158 94.0 64.0 26.5 91.1 49.5
TotalTotal 4490 92.6 57.7 19.6 90.6 47.7
Private Boys 685 35.9 6.7 3.5 41.6 39.4
school Girls 597 43.7 11.7 3.5 49.6 41.7
Total 1282 39.6 9.0 3.5 45.3 40.4
Madrasah/ Boys 301 52.8 14.3 6.6 41.2 19.6
Maktab Girls 256 52.0 10.2 4.3 37.1 19.1
Total 557 52.5 12.4 5.6 39.3 19.4
OJegO h

State-wise analysis of data regarding the children of sampled parents who were studying at
primary level and getting different incentives in school is given in Table A7.9 in Appendix. It
may be seen that more than 90% boys and girls enrolled in government primary schools had
received free textbooks in all the 12 states except Bihar (89.2%), Karnataka (74.4%) and Kerala
(77.3%). Mid-day meals were also provided to more than 90% children of government schools in
all selected states except Assam (82.6%), Bihar (76.7%) and Jharkhand (86.8%). The percentage
of children in government schools who were given free uniform was more than 90% in Gujarat,
Haryana and Madhya Pradesh while this percentage was between 70% and 80% in Assam, Uttar
Pradesh and Uttarakhand. Scholarships were given to most of the students studying in
government schools at primary level in Uttar Pradesh (94.2%) and Uttarakhand (88.2%).
7.7.3 Children studying at Upper Primary level in rural areas
It is observed from Table 7.8 that a total of 1182 children (596 boys and 586) girls were studying
at upper primary level in rural government schools. About 90% of boys and girls in these schools
had received free textbooks and Mid-day meal but free uniform was given to only 49.3% boys
and 63.1% girls and scholarship to about 55% boys and girls; free school bag was provided to
only 15.8% boys and 28% girls. In private schools, free textbooks, Mid-day meal and scholarship
were given to between 39.5% and 45% of the children but free uniform and free school bag were
given to only few of them. In Madrasahs, textbooks and Mid-day meal were provided to more
than half of the children but the percentage of girls getting these incentives was less than that of
boys. Some other incentives were also given to some children studying in Madrasahs.
7.7.4 Children studying at Upper Primary level in urban areas
In urban areas, 451 children (211 boys and 240 girls) were enrolled in government schools. Most
of them had received free textbooks and mid-day meal. Besides, free uniform and scholarship
were given to 41.2% and 41.7% boys respectively. The corresponding percentages for girls were
61.3% and 54.6% respectively. In private schools, about one-third of total 202 students were
provided free textbooks, mid-day meal and scholarship. Other two incentives were given to a few
students. Out of 22 boys and 15 girls going to Madrasah, 16 boys and 9 girls got free textbooks
while 16 boys and 10 girls were served mid-day meal. The remaining three incentives were given ^
to less than 30% children (see Table 7.8). t-HOJgOh

Table 7.8: Number of Children of sampled parents studying at Upper Primarygetting different incentives in Rural and Urban areas
level
Area Type of school
Gender Total No. of children attending
upper primary classes
% of children gettingfreetextbooks
freeuniform
freeschoolbag
Middaymeal
Scholarship
(1) (2) (3) (4) (5) (6) (7) (8) (9)
Rural
Govt.school
Boys 596 90.6 49.3 15.8 90.3 54.4Girls 586 93.3 63.1 28.0 89.2 55.5Total 1182 92.0 56.2 21.8 89.8 54.9
Privateschool
Boys 188 34.6 3.7 1.6 42.6 41.0Girls 161 45.3 5.6 4.3 47.8 39.8Total 349 39.5 4.6 2.9 45.0 40.4
Madrasah/Maktab
Boys 45 60.0 17.8 13.3 62.2 26.7Girls 86 47.7 11.6 30.2 51.2 10.5Total 131 51.9 13.7 24.4 55.0 16.0
Urban
Govt.school
Boys 211 86.7 41.2 7.1 84.8 41.7Girls 240 86.3 61.3 17.1 89.6 54.6Total 451 86.5 51.9 12.4 87.4 48.6
Privateschool
Boys 112 30.4 7.1 2.7 33.9 40.2Girls 90 34.4 12.2 2.2 38.9 23.3Total 202 32.2 9.4 2.5 36.1 32.7
Madrasah/Maktab
Boys 22 72.7 27.3 13.6 72.7 27.3Girls 15 60.0 33.3 33.3 66.7 26.7Total 37 67.6 29.7 21.6 70.3 27.0
Total
Govt.school
Boys 808 89.6 47.2 13.5 88.9 51.0Girls 826 91.3 62.6 24.8 89.3 55.2Total 1634 90.5 55.0 19.2 89.1 53.1
Privateschool
Boys 303 33.0 5.0 2.0 39.6 40.6Girls 251 41.4 8.0 3.6 44.6 33.9Total 554 36.8 6.3 2.7 41.9 37.5
Madrasah/Maktab
Boys 67 64.2 20.9 13.4 65.7 26.9Girls 101 49.5 14.9 30.7 53.5 12.9Total 168 55.4 17.3 23.8 58.3 18.5
LOc n
OJgO h

Table A7.12 of the Appendix provides state-wise information about children of sampled parents
studying at upper primary level and getting different incentives in school. It is observed that free
textbooks were given to more than 90% students of government schools in Assam, Gujarat,
Jammu & Kashmir, Madhya Pradesh, Rajasthan and Uttar Pradesh. Free uniform were provided
to most of the children going to government schools in Gujarat, Haryana, Karnataka, Madhya
Pradesh and Uttarakhand. The percentage of students studying in government schools at upper
primary stage getting Mid-day meal was 90% or more in the states of Gujarat, Jammu &
Kashmir, Karnataka, Madhya Pradesh, Rajasthan and Uttar Pradesh. Scholarship was received
by most of the students of government schools in Gujarat, Madhya Pradesh, Uttar Pradesh and
Uttarakhand.
7.8 Children provided escort for going to School/ Madrasah
It is seen from Table 7.9 that out of 8697 children of sampled parents going to school or
Madrasah, only 667 (7.7%) of them were provided escort for going to school in both rural and
urban areas. The percentage of boys getting escort for going to government schools was 6.6% as
against 7.4% girls. The corresponding figures for boys and girls in private schools were 8.8%
and 11.4% respectively. Further, 6.8% boys were escorted for going to Madrasahs as against
8.4% girls.
Table 7.9: Number of Children of sampled parents who were provided escortfor going to School/ Madrasah
Type of school Gender No. of children going to school/ Madrasah
children who were provided escort
children who were not provided escort
No. % No. %(1) (2) (3) (4) (5) (6) (7)
Govt. schoolBoys 3145 207 6.6 2938 93.4Girls 2991 221 7.4 2770 92.6Total 6136 428 7.0 5708 93.0
Private schoolBoys 988 87 8.8 901 91.2Girls 848 97 11.4 751 88.6Total 1836 184 10.0 1652 90.0
Madrasah/ MaktabBoys 368 25 6.8 343 93.2Girls 357 30 8.4 327 91.6Total 725 55 7.6 670 92.4
TotalBoys 4501 319 7.1 4182 92.9Girls 4196 348 8.3 3848 91.7Total 8697 667 7.7 8030 92.3
V.Dc n
OJgO h

7.9 Children’s long absence from School and Reasons thereof
7.9.1 Children studying in Primary Classes
The parents were asked to give the main reason for their children’s long absence from school.
Their responses about children studying in primary classes are summarized in Table 7.10. The
table shows that out of 6341 children (3323 boys and 3018 girls) enrolled in schools or
Madrasahs at primary level, 92.4% did not remain absent for over 15 days. The parents of about
4% boys and girls said that they remained absent because they helped in household work while
2.6% boys and 2.8% girls were absent because of sickness. Another 23 boys (0.7%) and 30 girls
(1.1%) remained absent due to their providing help in economic activity. Among the states, more
than 95% children attending primary classes did not remain absent for a long time in Gujarat
(99.2%), Karnataka (95.1%), Madhya Pradesh (97.4%), Rajasthan (97.0%), Uttar Pradesh
(96.8%) and Uttarakhand (95.9%).
7.9.2 Children studying in Upper Primary Classes
It is seen from Table 7.11 that there were 2356 children (1178 boys and 1178 girls) of sampled
parents studying in schools or Madrasahs at upper primary classes. Of these, 4.6% boys and
4.6% girls were reported to have remained absent for a long time due to providing help in
household work. Another 3.6% boys and 3.1% girls were absent due to sickness and 1.4% boys
and 1.6% girls remained absent because they helped parents in income generating activities. The
parents of over 90% children said that they did not remain absent for a long time. Among the
states, more than 95% children attending upper primary classes were not absent from school for
over 15 days in Assam (96%), Gujarat (100%), Madhya Pradesh (98.7%), Rajasthan (98.7%),
Uttar Pradesh (95.2%) and Uttarakhand (95.2%).
c n
OJgO h

Table 7.10: Number of children of sampled parents in Primary classeswith long absence (over 15 days) and reasons thereof
State GenderNo. of
children going to school/
Madrasah
% of children who were absent because ofbeingsick
helping in household
work
helping in income
generating activity
Child was not absent for
over 15 days
(1) (2) (3) (4) (5) (6) (7)
Assam Boys 272 5.5 1.5 0.0 93.0Girls 262 4.2 1.5 0.0 94.3Total 534 4.9 1.5 0.0 93.6
Bihar Boys 428 4.7 6.5 0.5 88.3Girls 402 5.7 4.7 1.0 88.6Total 830 5.2 5.7 0.7 88.4
Gujarat Boys 134 0.7 0.0 0.0 99.3Girls 124 0.8 0.0 0.0 99.2Total 258 0.8 0.0 0.0 99.2
Haryana Boys 165 13.3 3.0 0.6 83.0Girls 121 9.9 6.6 0.0 83.5Total 286 11.9 4.5 0.3 83.2
Jammu & Kashmir
Boys 283 1.1 12.0 3.9 83.0Girls 212 3.3 9.0 3.8 84.0Total 495 2.0 10.7 3.8 83.4
Jharkhand Boys 211 3.3 2.8 2.4 91.5Girls 190 4.2 4.7 3.2 87.9Total 401 3.7 3.7 2.7 89.8
Karnataka Boys 156 0.0 3.8 0.0 96.2Girls 132 0.0 6.1 0.0 93.9Total 288 0.0 4.9 0.0 95.1
KeralaBoys 407 1.7 6.9 0.0 91.4Girls 409 4.6 8.6 0.0 86.8Total 816 3.2 7.7 0.0 89.1
MadhyaPradesh
Boys 129 0.0 1.6 0.0 98.4Girls 142 1.4 2.1 0.0 96.5Total 271 0.7 1.8 0.0 97.4
Rajasthan Boys 179 1.7 2.2 0.0 96.1Girls 119 0.0 1.7 0.0 98.3Total 298 1.0 2.0 0.0 97.0
Uttar Pradesh Boys 778 0.8 1.7 0.3 97.3Girls 766 0.1 2.0 1.6 96.3Total 1544 0.5 1.8 0.9 96.8
Uttarakhand Boys 181 1.7 3.3 1.1 93.9Girls 139 0.0 0.7 0.7 98.6Total 320 0.9 2.2 0.9 95.9
TotalBoys 3323 2.6 4.1 0.7 92.6Girls 3018 2.8 4.0 1.0 92.2Total 6341 2.7 4.1 0.9 92.4

Table 7.11: Number of children of sampled parents in Upper Primary classes withlong absence (over 15 days) and reasons thereof
State GenderNo. of
children going to school/
Madrasah
% of children who were absent because ofbeingsick
helping in household
work
helping in income
generating activity
Child was not absent for
over 15 days
(1) (2) (3) (4) (5) (6) (7)
Assam Boys 116 1.7 0.9 0.0 97.4Girls 133 2.3 2.3 0.8 94.7Total 249 2.0 1.6 0.4 96.0
Bihar Boys 98 10.2 4.1 0.0 85.7Girls 147 8.8 4.8 5.4 81.0Total 245 9.4 4.5 3.3 82.9
Gujarat Boys 48 0.0 0.0 0.0 100.0Girls 46 0.0 0.0 0.0 100.0Total 94 0.0 0.0 0.0 100.0
Haryana Boys 43 14.0 4.7 4.7 76.7Girls 28 7.1 7.1 0.0 85.7Total 71 11.3 5.6 2.8 80.3
Jammu & Kashmir
Boys 113 0.9 8.0 4.4 86.7Girls 97 3.1 12.4 7.2 77.3Total 210 1.9 10.0 5.7 82.4
Jharkhand Boys 77 13.0 6.5 3.9 76.6Girls 65 4.6 9.2 1.5 84.6Total 142 9.2 7.7 2.8 80.3
Karnataka Boys 110 0.9 9.1 0.9 89.1Girls 96 0.0 4.2 0.0 95.8Total 206 0.5 6.8 0.5 92.2
KeralaBoys 176 3.4 9.7 0.0 86.9Girls 170 4.1 10.0 0.0 85.9Total 346 3.8 9.8 0.0 86.4
MadhyaPradesh
Boys 57 0.0 1.8 1.8 96.5Girls 92 0.0 0.0 0.0 100.0Total 149 0.0 0.7 0.7 98.7
Rajasthan Boys 53 0.0 1.9 0.0 98.1Girls 26 0.0 0.0 0.0 100.0Total 79 0.0 1.3 0.0 98.7
Uttar Pradesh Boys 248 2.0 1.6 1.6 94.8Girls 233 2.1 1.3 0.9 95.7Total 481 2.1 1.5 1.2 95.2
Uttarakhand Boys 39 2.6 0.0 0.0 97.4Girls 45 2.2 4.4 0.0 93.3Total 84 2.4 2.4 0.0 95.2
TotalBoys 1178 3.6 4.6 1.4 90.5Girls 1178 3.1 4.6 1.6 90.7Total 2356 3.4 4.6 1.5 90.6

Table 7.12 gives information about perception of parents on such aspects as teaching at school,
child’s interest in going to school, discrimination faced by the child at school and punishment
given to child by the teacher is given in. It may be mentioned here that the table gives the
number of children, not the parents. It is seen from the table that the parents of almost all
children studying at primary level either in a government school or a private school or a
Madrasah said that they were satisfied with the teaching at school and their children enjoyed
going to school. The percentage of children who had faced discrimination problem in
government schools was 3.8% as against 2.3% in private schools. Punishment by teachers was
given to 7.7% children in government schools as against 4.0% children in private schools. As
regards children studying in Madrasahs, only 1.8% of them had faced discrimination problem
while 5.4% children were reported to be given punishment.
Table A7.14 of the Appendix reveals that in all the selected states, the parents of almost all
children enrolled either in government or private schools were of the view that the teaching at
school was satisfactory and their wards enjoyed going to school. These views were also
expressed by the parents of children studying in Madrasahs. As regards discrimination at school,
about 10% children were reported to have faced discrimination in Bihar and Jharkhand. The
percentage of students who were given punishment by teachers was substantial in Bihar (21.8%),
Haryana (13.6%) and Jharkhand (26.9%).
7.10 Perception of parents about school and teachers
Table 7.12: Perception of parents about schooling facilities for their childrenstudying in Primary classes
Type of school attended
Total No. of parents
Perception of Parents
No. of Parents satisfied with teaching at
school
No. of Parents saying child
enjoys going to school
No. of Parents saying Child
faced discrimination
at school
No. of Parents saying Child gets
punnished by teachers
N % N % N % N %
Government School 4502 4282 95.1 4191 93.1 173 3.8 347 7.7
Private School 1282 1233 96.2 1235 96.3 29 2.3 51 4.0
Madrasah/Maktab 557 529 95.0 518 93.0 10 1.8 30 5.4
Total 6341 6044 95.3 5944 93.7 212 3.3 428 6.7
o
OJegO h

Table 7.13 shows that the parents of almost all children studying in upper primary classes in
government and private schools were satisfied with the teaching at school and their wards were
enjoying going to school. According to parents, 34 (2.1%) children in government schools and
13 (2.3%) children in private schools had faced discrimination at school while 71 (4.3%)
children in government schools and 29 (5.2%) children in private schools were punished.
Further, the parents of 81% children enrolled in Madrasahs were of the view that the teaching at
Madrasah was satisfactory while the parents of 74.4% children said that their wards were
enjoying going to Madrasah. The parents further said that 3% of their wards had faced
discrimination while 6% of them were punished in Madrasah.
Regarding discrimination at school, according to the parents, 11% children had faced
discrimination problem in Bihar. The percentage of students who were given punishment by
teachers was substantial in Bihar (15.5%) and Jharkhand (28.9%) (see Table A7.15 in
Appendix).
Table 7.13: Perception of parents about schooling facilities for their children studying in Upper Primary Classes
Type of school attended
Total No. of parents
Perception of Parents
No. of Parents satisfied with teaching at
school
No. of Parents saying child
enjoys going to school
No. of Parents saying Child
faced discrimination at
school
No. of Parents saying Child gets
punnished by teachers
N % N % N % N %
Government School 1634 1569 96.0 1537 94.1 34 2.1 71 4.3
Private School 554 530 95.7 530 95.7 13 2.3 29 5.2
Madrasah/Maktab 168 136 81.0 125 74.4 5 3.0 10 6.0
Total 2356 2235 94.9 2192 93.0 52 2.2 110 4.7
OJgO h

In this section an attempt has been made to ascertain the views of community members (all
Muslims), who participated in FGDs, regarding their vision for the future of their children in
terms of minimum educational level to be achieved and type of employment. They were also
required to suggest changes in the present education system. Five FGDs in each sampled district
of the selected states were conducted. The vision for the future reported by the parents is as
follows:
7.11.1 Minimum Educational Level
During different Focus group discussions in the sampled districts the members in different states
gave variant views. For example, in Gujarat, Haryana, Karnataka, Kerala, Madhya Pradesh and
Uttar Pradesh most of the participants were of the view that boys should get a minimum
graduation degree; some of them said that there was no binding on boys - they can study up to
the level as they wish. Few members in Gujarat and Uttar Pradesh felt that the boys should go for
technical education. In Rajasthan, the parents wanted their sons to get education at least up to
higher secondary level.
As regards girls’ education, parents had different views. In Haryana, Rajasthan and Uttar Pradesh
majority of participants felt that the girls can study only up to the level for which educational
facilities are available in the village as they were reluctant to send their daughters outside the
village for education. Some of them fixed class X as the upper limit for girls. A few of them said
that there was no need of educating girls as they have to do household work and not any job. In
Karnataka, Kerala and Madhya Pradesh, most of the parents wanted education for girls at least
up to class 12. In Gujarat, however, some parents said that the girls can study up to the level as
they wish.
7.11.2 Type of Employment
CNAs regards employment of boys the participants in almost all states said that they should either get a good ^
job or establish their own business. Some of them felt that their wards should become either doctors or ^
engineers or teachers. In the case of girls most of the participants did not like girls doing any job and
7.11 Vision for future relating to education and employment of Muslim children and
suggestions for change in the system

said the girls after marriage should take the responsibility of their families in Haryana and Uttar Pradesh.
In Gujarat and Rajasthan, some of them felt that teaching and nursing were the most suited jobs for girls.
In Karnataka and Kerala, few Muslim parents had a preference that both boys and girls should get a
good position through self-employment but some opted for any type of work for boys. Majority
of the participants preferred basic education for girls as according to them it would help in
preparing them for better family life. Automobile engineering, entrepreneurship development
programme and computer training were some of the livelihood options for both boys and girls,
suggested by the FGD respondents.
7.11.3 Suggested Changes
The FGD members gave the following suggestions for the improvement in the present education
system.
1. Teachers should not be engaged in non-teaching activity.
2. The number of teachers in school should be increased.
3. As far as possible, teachers should be posted within the same district to which they
belong.
4. Transport facility should be provided to female teachers to reach school on time.
5. Teachers should pay more attention on weak students in the class.
6. Both teachers and students should reach the school in time.
7. Urdu should be taught in school.
8. Incentives to children should also be provided in private schools.
9. Some participants were of the view that MDM programme should be stopped as it has
become hindrance in teaching while, on the other hand, some participants said that MDM
should also be served in private unaided schools.c n
OJgH3O h

10. Religious education should also be given along with general education to students so that
they would not go to Madrasahs for this purpose.
11. There should be separate schools for boys and girls and female teachers should be posted
in primary schools.
12. An open shop should be started in each school in order to develop honesty and
discipline.
13. Regular medical check-up, free school dress for children and scholarships for
meritorious girl-students were also suggested.
14. Interference by Madrasah Board in Madrasah’s educational activities was resented by
some participants.
15. The curriculum committee should ensure that the textbook not contains matters
antagonistic to minority values.
16. There should be separate functional toilets for Girls in school.
OJgO h

Chapter 8
Summary and Main Findings
8.1 Background of the study
This study has been conducted on sample basis in a few selected districts of 13 states having
more than 20% Muslim population. The responsibility of conducting the study was entrusted to
Jamia Millia Islamia by the Ministry of Human Resource Development. The main objective of
the study was to find out to what extent the facilities and incentives for elementary education of
Muslim children are available and being utilized in the states and districts that have large regions
with concentration of Muslim population. Actually 88 districts in 19 states of the country were
identified as Special Focus districts by the Government of India because Muslim population in
these districts was 20% or more of the total population. Since Muslims have been educationally
backward in general, some incentives are provided and priority is given to these districts in
opening of new schools. Initially, 28 districts of the 13 selected states were covered. Since the
data from West Bengal could not be available at the time of writing this report, the findings for
West Bengal are not being reported. All the findings are based only on the data of 25 districts of
12 states, namely, Assam, Bihar, Gujarat, Haryana, Jammu & Kashmir, Jharkhand, Karnataka,
Kerala, Madhya Pradesh, Rajasthan, Uttarakhand and Uttar Pradesh. The Department of Social
Work of Jamia Millia Islamia, which was responsible for the study. While the objectives of the
study were decided by the Ministry of HRD, the tools for data collection were developed at JMI
with the help of an Advisory Committee set up for the study. These tools were used to collect
data on existing facilities and incentives for Muslim children from the State headquarters,
District Project Offices, Village heads, school Head teachers, Heads of recognized Madrasahs,
teachers and parents of Muslim students. The tools were translated in the main language of each
state before collection of data. In each state the selected agency was responsible for translationLO
of tools, selection and training of field investigators, collection and checking of data, analysis of ^
data according to a predetermined plan prepared at JMI and finally writing of the state report. H3Oh

The main objectives of the study were to assess availability of educational facilities for children
in Muslim predominant areas and to find out whether improvement had taken place in enrolment
and retention of Muslim children in schools in the recent years. Attempt was also made to get the
views of Muslim parents about education being provided to their children specially girls and
whether the inputs being given under SSA were benefiting them. Another objective was to find
out whether SSA inputs specially meant for Madrasahs providing general education and not just
religious education, were reaching them or not.
The data, the tables derived from the data and the state reports were eventually used for
preparation of this national level synthesis report.
8.2 Methodology
Two-stage sampling design has been used for the selection of villages/ towns and schools from
the selected districts. At the first stage, 2 to 4 blocks and 1 to 3 towns from each district were
chosen. In each district, 30 villages were selected from the sampled blocks to represent rural
areas. For selection of villages, 30 schools were sampled from the schools of the selected
blocks; the villages in which these schools functioned were automatically selected for collecting
village level data. Selection of schools was done by following circular systematic sampling
procedure from the list of schools in each block, ensuring that there was only one school sampled
from a village; about two-thirds were primary schools and one-third upper primary schools. To
cover urban areas, 2 primary and 2 upper primary schools were selected in each selected town,
ensuring that the two primary schools were from different wards.
8.3 Villages and Habitations covered in Study
In all, 735 villages with a total population of 42,09,647 were covered in the 25 selected districts.
Of these, 349 (47.5%) and 386 (52.5%) villages were in the population slabs ‘3000 and above’ V.Dand ‘below 3000’ respectively. The average number of BPL households per village was 462.2.
Muslims constituted 60.3% of the total population in the selected villages. ^

The total number of habitations in the sampled villages of the 25 districts was 1497. Of these,
1054 (70.4%) habitations catering to about 86% of the total Muslim population had access to
primary education within the habitation. There were 192 habitations, accounting for 4.4% of the
total Muslim population which did not have primary schooling facility within 1 km. Further, 687
habitations, covering 66.0% of the total Muslim population, had upper primary schooling facility
within the habitation; 621 habitations, catering to 29.4% of the Muslim population, had upper
primary education facility within 3 km; and only 189 habitations with 4.6% of the Muslim
population had such facility beyond 3 km. About 50% of the habitations which did not have
primary classes within 1 km had a population of below 300 each. Similarly, 63% of the
habitations which did not have upper primary classes within 3 km had a population not more
than 500 each.
8.4 Enrolment in Schools, Madrasahs and KGBVs of Sampled Villages
The total number of children enrolled in primary classes in all the existing schools of selected
villages was 287,583. Of these, 173,768 (60.4%) students belonged to Muslim community and
the percentage of girls among them was 50%. Further, the total enrolment in upper primary
classes was 111,610 of which 55.3% were Muslims and about 50% of them were girls.
The total enrolment in primary classes in all the existing Madrasahs of selected villages was
6030. Of these, 96.1% students were Muslims. Muslim girls constituted about half of the
Muslim children. Further, the total enrolment in upper primary classes was 2239 and 95.8% of
them were Muslims. The percentage of girls among the Muslim students was 57%.
As regards enrolment in KGBVs in the blocks from which the villages were selected, it was
found that 1800 girls from these villages were enrolled in KGBVs; among them, 919 (51.1%)
were Muslim girls.
8.5 Facilities in Sampled Schools
8.5.1 Classrooms and space for Children in Classrooms
The total number of classrooms in the 487 primary schools in the sampled villages was 1968
which means, on an average, there were 4 classrooms per school. Among the states, the average ^
number of classrooms per school was highest in Kerala (6.2) followed by Uttarakhand (5.4),

Haryana (5.3) and Uttar Pradesh (5.0) while it was less than 3 in Assam (2.2), Bihar (2.9) and
Jammu & Kashmir (2.3). More than 50% schools had 3 to 5 classrooms in them. There were
29% schools which had only 1 or 2 classrooms. In urban areas, there were 709 classrooms in 140
primary schools with an average of 5.1 classrooms per school. Among the states, the average
number of classrooms per school was highest in Jammu & Kashmir (9.1) followed by Kerala
(6.8), Gujarat (6.2) and Jharkhand (6.0); it was less than 4 in Assam (3.0), Bihar (3.4), Rajasthan
(2.3) and Uttarakhand (2.8). Majority of schools (54.3%) had 3 to 5 classrooms in them.
Management-wise, 80% of 627 primary schools were run by the government with an average of
3.7 classrooms per school. The remaining 20% primary schools were managed by private
agencies with an average of 6.6 classrooms per school. Further, more than 50% government as
well as private schools had 3 to 5 classrooms in them. The percentage of government schools
having only 1 or 2 classrooms was 32.7% as against 7.8% in private schools.
The average student classroom ratio (SCR) in government schools was 39 as against only 24 in
private schools. Among the states, the average SCR was highest in Bihar (75) followed by
Haryana (59) and Assam (58). In the states of Jammu & Kashmir (14), Karnataka (10), Kerala
(19) and Rajasthan (18), on average, less than 20 students sit in a classroom.
The total number of classrooms in 426 sampled upper primary schools was 3203 averaging 7.5
classrooms per school. The average number of classrooms per school in urban areas (8.9) was
higher than that in rural areas (6.9). Among the states, the average number of classrooms per
school was highest in Kerala (14.9) followed by Haryana (10.4) and Karnataka (9.1) while it was
the lowest in Assam (3.8). Majority of schools, both in rural and urban areas, had more than 5
classrooms in them. The average SCR was 33 in rural upper primary schools as against 26 in
urban schools. The corresponding figures for government and private schools were 33 and 26
respectively. Further, average enrolment per upper primary school in rural areas was 222 as
against 228 in urban areas. The corresponding figures for government and private schools were
197 and 292 respectively. The states which had over 50% of the selected primary schools with
SCR of more than 30 are Bihar (95.9%), Assam (81.6%), Haryana (75%), Uttarakhand (74.1%),
Gujarat (61.5%) and Jharkhand (56.5%). It is alarming to note that in a large percentage of 0 0
primary schools in Bihar (70.3%), Assam (57.9%) and Haryana (50%) average SCR was moreOJg
than 50.

As regards classrooms having adverse SCR for children in primary schools, it was found that
35.7% schools in rural areas and 40.7% in urban areas did not have sufficient seating space to
accommodate all children in their respective classrooms. The corresponding figures for
government and private schools were 40.8% and 21.1% respectively. Further, the percentage of
classrooms having adverse SCR in rural schools was 18.0% as against 16.9% in urban schools.
The corresponding figures for government and private schools were 21.9% and 8.6%
respectively. The above results indicate that the problem of accommodating students either in
schools or classrooms was more acute in government schools than in private schools.
The percentage of upper primary schools having adverse SCR for the students in classrooms was
31.9% in rural areas as against 33.6% such schools in urban areas. The corresponding figures for
government and private schools were 35.9% and 23.3% respectively. As regards availability of
seating space in classrooms, 14.0% in rural areas and 12.6% classrooms in urban areas lacked
sufficient seating space. The percentage of such classrooms was 16.5% in government schools
and 9.5% in private schools. The above results clearly show that, like in primary schools, the
problem of accommodating students in schools and their classrooms is more acute in government
schools than in private schools.
8.6 Drinking water, Toilets and Electricity in Schools
8,6,1 Drinking Water
Drinking water facility in rural areas was available in 79.5% primary schools and 82.7% upper
primary schools. The corresponding percentages for urban schools were 88.6% and 96.2%
respectively. In government schools, drinking water facility was available in 78.6% primary and
83.3% upper primary schools while much higher percentage of private schools, 93% primary and
95.8% upper primary schools, had drinking water facility. Among the states, drinking water
facility was not available in quite a large proportion of sampled rural primary schools of Assam
(36.7%), Jammu & Kashmir (58.7%), Haryana (36.8%) and Rajasthan (35.0%) while no such
situation was observed in urban primary schools.t-HOJeg
Oh

8.6.2 Toilets - total and for girls
In rural areas, 71.9% primary schools and 78.6% upper primary schools had functional toilets in
them. The corresponding percentages for urban schools were 83.6% and 89.3% respectively.
Management-wise, in government schools, this facility was available in 70.8% primary schools
and 77.5% upper primary schools. The corresponding percentages for private schools were
89.1% and 93.3% respectively. Among the states, more than 90% of the sampled primary
schools in Gujarat, Kerala, Uttar Pradesh and Uttarakhand had toilets while this facility was not
available in a large proportion of primary schools in Assam (46.1%), Bihar (47.3%) and Jammu
& Kashmir (71.2%).
Separate functional toilets for girls were available in 58.0% primary and 65.4% upper primary
schools in rural areas while in urban areas such toilet facility was available in 57.1% primary and
77.9% upper primary schools. Management-wise, 56.8% primary and 62.7% government upper
primary schools had separate functional toilets for girls while the corresponding percentages for
private schools were 61.7% and 85.8% respectively. The percentage of upper primary schools
having this facility was higher than that in primary schools in almost all states.
8.6.3 Electricity
Out of 488 primary schools in rural areas electricity was available in 56.3% of them including
21.5% schools where supply of electricity was there but it was not regular. In urban areas, this
facility was available in 75.1% schools including 9.4% schools having irregular supply of
electricity. However, a large number of primary schools both in rural (43.6%) and urban areas
(25.7%) had no electricity connection in them. Management-wise, while electricity was mostly
available in 75.8% private schools, only one-third of government schools had this facility.
Among the states, a large percentage of primary schools did not have an electricity connection in
Assam (55.3%), Bihar (60.8%), Jammu & Kashmir (52.6%), Jharkhand (67.4%), Madhya
Pradesh (62.5%) and Rajasthan (83.3%). Electricity was available and its supply was also
regular in more than 90% primary schools in Gujarat, Karnataka and Kerala
In rural upper primary schools, 63.8% had electricity connection in them but its supply was not OLO
regular in 19.7% schools; about 36% did not have electricity connection. In urban areas, this ^OJ
facility was available in 80% of sampled urban upper primary schools and irregularity in its

supply was reported in only fewer than 10% schools. However, one-fifth of the sampled schools
were without electricity facility. Management-wise, electricity was available only in 39.9%
government upper primary schools while another 19.3% had irregular supply of electricity. A
large proportion of schools (40.8%) did not have electricity connection in them. Among the
private upper primary schools, 93.4% had electricity connection in them but there was no regular
supply in 9.2% schools. Among the states, more than 50% sampled upper primary schools did
not have electricity connection in Bihar, Jammu & Kashmir, Jharkhand and Madhya Pradesh.
Since computer education is being introduced at the upper primary stage in a large number of
schools, it is unfortunate that a large number of schools still do not have electricity connection
and even if they have, the supply is irregular.
8.6.4 Library Books
Out of 488 sampled primary schools in rural areas, 56.1% schools had library books which were
also used by the students; 17.8% schools had library books but mostly these were not used. The
remaining 26% rural schools did not have any library books. In urban areas, library books were
available and also used by the students in 62.9% schools. Another 12.1% schools had library
books but mostly not used by the students. The remaining 25% urban schools did not have
library books. Management-wise, library books were available in 53% government schools as
against 75.8 % private schools.
In rural areas, 64.1% upper primary schools had library books which were also used by students
while in 20.7% schools, library books were not available. In urban areas, library books were
available and mostly used by the students in 75.6% of the sampled upper primary schools. There
were only 13.7% urban upper primary schools in which library books were not available.
Management-wise, 81.7% private upper primary schools had library books as against only 62.1%
government schools. Apparently private primary schools were better equipped with library books
than private upper primary schools whereas in the case of government schools the opposite was
true.
8.6.5 Sports Materialt-H
Sports material was available and used only in 44.9% schools. There were 38.9% schools which LOt-H
did not have any sports material or equipment. In urban primary schools, 51.4% of them had ^USOh

sports equipment/ material which were also used by the students. About one-third schools were
without any sports material or equipment. Management-wise, sports material was available in
59.4% private primary schools as against only 43% government schools.
In 62.4% rural upper primary schools, sports material was available and used; 13.2 % schools
had sports material but it was not used. In urban areas, sports material was available in 78.6%
upper primary schools but it was used only in 67.9% schools. Management-wise, sports material
or equipment was available and used in only 57.2% government upper primary schools whereas
it was available in 81.7% private schools.
8.7 Incentive Schemes
8.7.1 Free Uniform
After implementation of RTE Act, all SC, ST and BPL category children have to be provided not
one but two sets of free school uniform. But it is found that out of a total of 1054 sampled
schools in the selected states, free uniform was given to all students only in 36.1% schools.
Another 7.5% schools gave this incentive to ‘only girls’ while 3% schools provided it only to ‘all
SC/ST/BPL category students’ and 2.2% schools to ‘only girls of SC/ST/BPL category’. There
were four schools in which this incentive was given to Muslim students. Free uniform was not
distributed to any student in 50.8% schools.
8.7.2 Free Textbooks
Most of the sampled primary and upper primary schools in the selected states (86.1%) had given
free textbooks to all students. Another 8 schools (0.8%) provided free textbooks to only girls
while this incentive was given to Muslim students in four schools and to all SC/ST/BPL category
students in two schools. There were 12.6% schools in which none of the students got free
textbooks.
8.7.3 Scholarship
In 27.2% of the schools, scholarship was provided to all students while this incentive was given
to all students belonging to ‘SC or ST or BPL category’ in 24.4% schools; to ‘all Muslim
students’ in 5.6% schools and to ‘only girls’ in 5.7% schools. However, this incentive was not ^
given to any student in 30% of schools.
CNLO

In 93.2% of the 426 sampled upper primary schools no cycle was given to any student.
8.8 Other Issues
8.8.1 Attached Pre-primary classes
Out of a total of 488 sampled primary schools in rural areas 32.4% had attached pre-primary
classes while this facility was available in 34.3% of 140 primary schools in urban areas.
Management-wise, 53.9% private primary schools had attached pre-primary classes as against
only 27.5% government schools. As regards upper primary schools 22.4% of the 295 schools in
rural areas and 30.5% of the 131 schools in urban areas had attached pre-primary classes.
Management-wise, this facility was available in 48.3% private schools as against only 15.7%
government schools.
8.8.2 Multi-grade teaching
About 69% rural primary schools and 59% urban primary schools had multi-grade teaching..
Management-wise, about two-thirds of both government and private primary schools had classes
in which multi-grade teaching was done. Amongst upper primary schools, 56.9% in rural areas
and 45.8% in urban areas were practicing multi-grade teaching. Management-wise, the
percentage of such upper primary private schools was slightly higher (55.8%) than the
percentage of such government schools (52.6%).
8.8.3 Problems being faced by schools
The headmasters of the sampled schools were asked whether the school had faced any problem
in respect of certain educational activities such as new admission of students, dropping out of
students from school, irregularity in students’ attendance and poor achievement level of students
and whether the school had faced the problem in the case of all children or only Muslim
children? It is found that the majority of sampled schools in the selected states had faced
problems in respect of the last two issues mentioned above. The problems related to ‘droppingc n
out of students from school’ and ‘new admission of students’ were faced by about one-third and
one-fifth of schools respectively. ^ gOh
8.7.4 Providing cycles (in upper primary classes)

8.9.1 Teachers in primary schools
There were 2788 teachers in primary schools (average 4.4 per school) and 3750 in upper primary
schools (average 8.8 per school) included in our sample of schools. Of the total teachers in the
sample of primary schools, 69.6% were working in government schools and the rest in private
schools. Among the total teachers, 39.1% were Muslim and 60.9% non-Muslim. The percentage
of Muslim teachers was less in private schools than government schools. The percentage of
female teachers was 53.2% among the total teachers, while among Muslim teachers the
percentage of females was less, only 43%. Of the total teachers 29% were contract teachers and
the rest were regular teachers.
8.9.2 Teachers in schools with upper primary classes
In schools with upper primary classes, 55.1% were in government schools and the rest in private
schools. Further, among the total teachers, 32.2% teachers were Muslim and 55.7% teachers
were female teachers, the percentage of female teachers among Muslim teachers being much
less, only 41.6%. The percentage of Muslims among the teachers was more in government
schools (37.5%) than in private schools (25.7%). The percentage of contract teachers was less at
upper primary level, only 17%.
8.9.3 Educational and Professional Qualifications of teachers
Among the 2788 teachers in primary schools 27.4% were untrained; the percentage of such
teachers was higher (35%) among Muslim teachers. About one-third of the total teachers had
higher secondary certificate while 19.2% teachers had passed secondary examination only.
However, 47.2% teachers were either graduates or post graduates. The percentage of teachers
having minimum graduate degree was much higher among non-Muslim teachers (53.8%)
compared to Muslim teachers (37.0%). There was a large variation among states in teacher
qualifications The proportion of teachers with only a secondary pass qualification was highest in
Gujarat (73.4%) followed by Assam (40.9%), Karnataka (35.5%) and Kerala (28.3%). As
regards their professional qualification, 45.2% teachers had a certificate (JBT or equivalent) for LO
teaching in primary schools. Another 17.2% of teachers had a B.Ed. degree. The percentage of geOh
8.9 Teachers

Muslim teachers with B.Ed. qualification was only 12.7% as against 20.1% non-Muslim
teachers. Untrained teachers accounted for 27.4% of the total teachers. The percentage of
untrained teachers was comparatively higher among Muslim teachers (35.0%) than among non-
Muslim teachers (22.6%). Among states, the highest percentage of untrained teachers was in
Jharkhand (52.3%) next in order was Bihar (46.1%) followed by Jammu & Kashmir (45.8%),
Assam (44.0%) and Uttar Pradesh (41.4%).
Out of total 3750 teachers teaching at upper primary level 54.5% had at least graduate degree.
The corresponding percentages for Muslim and non-Muslim teachers were 49.0% and 57.1%
respectively. Among states, 90% or more teachers were either graduates or post-graduates in
Haryana, Madhya Pradesh and Uttar Pradesh and about 74% in Rajasthan and Uttarakhand.
Another 28.2% teachers had higher secondary certificate while 16.1% teachers had passed only
secondary school examination. Surprisingly there were 57.7% teachers in upper primary schools
in Gujarat state who possessed only secondary school qualification. As regards teacher training,
31.1% teachers had B.Ed. degree; the percentage of such teachers was much higher in private
schools (38.8%) than in government schools (24.8%). Also the percentage of such teachers was
more among non-Muslim teachers (34.5%) compared to Muslim teachers (23.9%).
Out of a total of 628 sampled primary schools 34 (5.4%) were single teacher schools. Among the
states, Rajasthan had more than 50% such schools. Of the 426 upper primary schools, 22 (5.2%)
were single teacher schools; 21 existed in Uttar Pradesh.
8.9.4 Absence rate of teachers
The investigators who visited schools to collect data noted the percentage of teachers who were
present. Out of the total teachers posted in the schools, the percentage of those who were present
in primary schools was 77.1%; this percentage was higher in rural primary schools (78.3%) than
that in urban schools (74.6%). Management-wise, percentage of teachers who were found
present in private schools (77.1%) was two percentage points higher than that in government
schools (75.2%).
In upper primary schools, the percentage of teachers who were present in school was 75.2%; it 1-0LO
was higher in urban areas (77.1%) than in rural areas (73.2%). Management-wise, the percentage ^
of teachers who were present was much higher in private schools (82.1%) than in government

schools (71.5%). Obviously private schools are more concerned about teachers being present in
school when the school is open. Some absence could be due to teachers being on duty elsewhere
or on leave; absence need not be considered as irregular absence from duty
8.9.5 Relaxation in school hours during Ramzan
As the schools were located in Muslim predominant areas, information was collected on whether
any relaxation in school hours was given during the holy month of Ramzan when Muslims fast.
It was found that in 65.4% schools no relaxation was given to teachers. This percentage was
more or less same in both rural and urban areas. Teachers were allowed to leave school early in
12.8% schools and in 3.1% schools they were permitted to come late to school. About 11%
schools changed their school timings during Ramzan. However, the percentage of schools not
giving any relaxation to students was higher, 76.3%, perhaps due to children not being required
to fast. But the percentage of schools in which children were allowed to leave early was 20.8%
which is higher than the percentage of schools in which teachers were allowed to leave early.
8.9.6 Relaxation in school hours on Fridays
Schools generally provide some relaxation for enabling Muslim teachers and students to offer
their afternoon Friday prayers. It was found that 44% schools did not have any such provision for
teachers while 36% schools did not have such provision for students. However, 45% schools had
one-hour break for teachers and 52% schools had such break for students to enable them to offer
prayers. But about 12% schools closed early on Fridays instead of continuing teaching after the
prayer time.
8.10 Enrolment
8.10.1 Enrolment at Primary level
So far as enrolment is concerned, it was found that in the schools of sampled villages and towns
of the 12 states, there was overall 2.1% decrease in enrolment in primary classes between 2010
and 2011. The decrease was slightly more in the case of Muslims (2.23%) than non-MuslimsV.D
(1.94%).The decrease rate in the case of Muslim children was more than that of non-Muslim
children in rural areas (3%) than in urban areas (2%). In urban areas, the decrease was about 3% ^Oh

for Muslim children while there was hardly any increase or decrease in the case of non-Muslim
children. The difference across states, however, were very sharp - in some states like Assam,
Jharkhand, Madhya Pradesh and Uttar Pradesh, there was significant decrease in enrolment
between 2010 and 2011 while there was conspicuous increase in enrolment during this period in
Haryana and Rajasthan. The percentage of girls was same (about 49%) among Muslim and non-
Muslim students, and this percentage had not changed much between 2009 and 2011. The
percentage of Muslims in the total enrolment was 62.9% in 2011; this percentage was higher in
rural schools (66.2%) than in urban schools where it was only 55%. The high percentage of
Muslims in enrolment is of course due to sampling of schools in Muslim predominant areas.
8.10.2 Enrolment at Upper primary level
The percentage of Muslims among students at upper primary level was higher in rural schools
(53.1%) than in urban schools (48.8), the overall percentage being 53.1%. there was no variation
over the last 3 years in this percentage. The overall percentage of girls was 48%; it was a little
higher in the case of Muslim students (49%). There was no difference between rural and urban
schools in respect of percentage of girls among students at the upper primary level.
8.10.3 Pupil Teacher ratio
The PTR was rather low in the sampled schools, 33.3 in primary schools and 29.4 in upper
primary schools. In rural schools it was higher (34.2 in primary schools and 30.9 in upper
primary schools compared to urban schools where these percentages were 31.0 and 27.0
respectively. The variation in PTR across states was very large; in primary schools it was as low
as 13 in Karnataka and Jammu & Kashmir and as high as 57 in Bihar and 56 in Haryana. About
60% primary schools had PTR 35 or below; varying from only 16% such schools in Haryana to
100% schools in Karnataka. There were 19.1% primary schools which had PTR of more than 50.
The percentage of such schools was highest in Haryana (68%) followed by Bihar (39.2%) and
Assam (38.2%). In upper primary schools PTR was highest (64) in Bihar and lowest in Assam
and Jammu & Kashmir (14). About 69% upper primary schools had PTR up to 35. The states
which had percentage of such schools more than 80% were Gujarat (87.5%), Jammu &
Kashmir (96.4%), Kerala (95.5%) and Uttarakhand (92.9%). There were 15.3% upperLO
primary schools with above 50 PTR. Bihar had highest percentage (56.8%) of such schools. t-HOJeg
Next was Jharkhand with 26.9% schools had PTR of more than 50.

8.10.4 Dropout rate
The dropout rate was quite low for both Muslim and non-Muslim students. At the primary level,
it was 2.4% for Muslim students and 1.9% for non-Muslim students; at the upper primary level,
these dropout rates were 2.0% and 1.9% respectively. In the case of girls these rates were almost
the same as for boys. The problem of dropping out from school does not appear to be serious.
The main reason for dropping out was ‘child needed to help parents in their occupational work or
household work at home’. Another significant reason was parent’s lack of interest in child’s
education. Surprisingly this was given as a more common reason in the case of boys than girls.
Other reasons such as ‘early marriage’, ‘school being far from home’ and ‘lack of facility for
teaching of Urdu’ were given by very few heads of schools.
8.10.5 Attendance rate
Average attendance of students reported in this study is based on actual observation of students
found present out of those enrolled in school on the day of investigator’s visit to school. The
average attendance was 67.8% in primary schools and 69.8% in upper primary schools. There
was not much difference between the average attendance of Muslim and non-Muslim students;
actually the attendance rate of Muslim children was 1 to 2 percentage points higher. Also there
was hardly any difference between attendance rate of boys and girls.
The incidence of long absence of students from school was very low. However, in the case of
long absence, the reasons given by the head of school were: lack of interest of parents in sending
the child to school and the child being needed to help parents in their occupational or household
work. But very few boys were required to help parents in household work and very few girls
were required to help parents in occupational work. Their absence because of participation in
religious or social functions was rare.
8.10.6 Participation in SMC meetings
School Management Committees help in participation of the community in school affairs and
improving the school with community efforts. In the schools selected for this study, the
attendance of the members of SMC in its meetings was quite good; 74% members had 0 0LO
participated in the meetings of SMC held just before the investigator’s visit to school. The
attendance of Muslim members was slightly better as 76.1% had attended these meetings. ThereOJg

8.10.7 Community support to school
The community support to betterment of school is rather limited. About 54% schools claimed to
have received some support from the community in getting children enrolled or sent to school
while 46% did not get any such help. Only 25 to 30 percent schools heads said that they received
support from the community in such matters as getting donation for the school, organizing
religious or other functions in school, helping children in their studies and teaching them some
skills. Such help from the community was in equal measure for Muslim and non-Muslim
children.
8.10.8 Head teachers’ opinion about children
In this study an attempt was also made to assess what the heads of schools felt about the
performance of Muslim and non-Muslim children. They evaluated them on a 5- point scale (1 for
very poor or low and 5 for very good or high). They gave their views on children’s regularity and
punctuality, their achievement in academic subjects, participation in games/ sports and co-
curricular activities, their self- confidence level and extent of interaction with teachers. The code
numbers were converted into numerical values by assigning 5 for very good, 4 for good, 3 for
average, 2 for poor and 1 for very poor. Thereafter, paired t-test was applied to test whether there
was any significant difference between the average ratings of students belonging to two different
communities.
It was found that the t-values are significant at 1% level of significance, along with higher mean
values in the case of Muslim students compared to non-Muslim students, in respect of all the 13
parameters in the states of Assam and Jharkhand. On the other hand, mean difference scores
were not found to be significant even at 5% level of significance on any parameter in Jammu &
Kashmir and Uttarakhand. In the remaining states, the mean difference scores were found to be
significant on certain parameters only. According to the head teachers of schools
1. Muslim students were more regular than non-Muslim students in attending the school in Assam, ^
Bihar, Gujarat, Jharkhand, Kerala and Rajasthan whereas non-Muslim students were reported to l_0
was hardly any difference between participation rate of Muslim and non-Muslim members in
these meetings.
be more regular than Muslim students in Karnataka and Madhya Pradesh.. OJegO h

2. Muslim students were more punctual than non-Muslim students in coming to school, in
Assam, Bihar, Jharkhand and Rajasthan whereas reverse is the case in the states of Haryana,
Madhya Pradesh and Uttar Pradesh.
3. Muslim students were participating more in classroom activities and doing slightly better in
EVS/ Science in Assam, Bihar, Gujarat, Jharkhand and Kerala.
4. Muslim students were doing slightly better on ‘achievement in language’ in Assam, Bihar,
Gujarat, Jharkhand and Rajasthan while on ‘achievement in Mathematics’ their performance
was slightly better in Assam, Bihar, Gujarat, Jharkhand, Kerala and Rajasthan. The
performance of non-muslim students was better than Muslim students on ‘achievement of
language’ in Haryana and Madhya Pradesh while they were doing better in ‘achievement in
Mathematics’ in Uttar Pradesh.
5. Muslim students had interacted slightly more with teachers than non-Muslim students in Assam,
Bihar, Jharkhand, Kerala and Rajasthan.
6. Muslim students had shown a little higher level of self confidence than their counterparts
(non-Muslim students) in Assam, Bihar, Gujarat, Jharkhand, Rajasthan and Uttar Pradesh.
7. Parents of Muslim students showed more interest in their studies than the parents of non-
Muslim students in Assam, Bihar, Gujarat and Jharkhand; the situation is reversed in Haryana,
Karnataka, Madhya Pradesh and Uttar Pradesh.
8.11 Madrasahs
8.11.1 Types of Madrasahs in the sample
Total 97 Madrasahs were selected from the sampled districts of 12 states covered in the study in
order to study their status and how they are functioning. Of these, 34 Madrasahs had only
primary level classes while 63 Madrasahs had classes up to upper primary level. There is wide
variation across states - there was no Madrasah from Gujarat in the sample and no primary level
Madrasah in the sample from Jharkhand, Madhya Pradesh and Kerala. Out of a total of 34
primary Madrasahs, 24 were located in rural areas and 10 in urban areas; 9 were government
Madrasahs and 25 were operated by private agencies. About 50% of the 97 Madrasahs were
recognized by the respective State Governments; 10 (10.3%) Madrasahs by Waqf Board while
38 (39.2%) Madrasahs had received recognition from other agencies like National Institute of
Open Schooling (NIOS). Further, out of 63 upper primary Madrasahs, 46 were located in rural
OV.D
OJegO h

areas and 17 in urban areas; 17 were government Madrasahs and 46 private Madrasahs. At the
primary level, out of the 34 Madrasahs14 did not have hostels for children, 7 had residential
facility for all children and 13 admitted both day scholars and others who needed residential
facility. In the case of 63 Madrasahs having upper primary classes, the number of those in these
3 categories was 38, 8 and 17 respectively. Further, some Madrasahs were coeducational and
some not. Out of the 97 Madrasahs, 63 were coeducational, 15 were coeducational only up to
primary level, 12 were only for boys and 7 were for only girls.
8.11.2 Facilities in Madrashas
The average enrolment per primary level Madrasah was 182 and in Madrashas with upper
primary classes, it was 181. The average student classroom ratio (SCR) was 33 in primary level
Madrasahs and 24 in upper primary Madrasahs. In 33% classrooms of primary Madrasahs and
19% classrooms of upper primary Madrasahs, sitting space for children was inadequate. The
drinking water facility was available in 82% primary and 89% upper primary Madrasahs.
Further, 85% of primary Madrasahs and 76% of upper primary Madrasahs had functional toilets
in them. Separate functional toilets for girls were available in only 47% of primary and 60% of
upper primary Madrasahs.
Of the total 97 Madrasahs, electric connection was available in 79 Madrasahs but the supply was
irregular in 18 of them. Further, 63% Madrasahs had library books and 30% had sports / games
material but in about one-third of them these were not being used by the children.
A few Madrasahs (34%) had attached pre-primary classes, the percentage of primary Madrasahs
with pre-primary classes was higher (53%) than the percentage (24%) of such Upper primary
Madrasahs. Quite a few Madrasahs like other primary schools had multi-grade teaching, the
percentage of such Madrasahs being 39%.
8.11.3 Incentives to children in Madrasahs
The children in Madrasahs were not getting the incentives that the children in government
schools get. The percentage of Madrasahs in which no free textbook was given, was 76%, where
no free uniform was given, was 93% and where no scholarship was given, was 85%. Cycles to V.Ot-HOJg
Oh

8.11.4 Teachers in Madrasahs
The average number of teachers per primary Madrasah was 6.7 and per upper primary Madrasah,
8.3. Among 228 teachers of primary Madrasah, 97% were Muslims and 91% were male; among
520 teachers of upper primary, 94% were Muslims and 85% were male. As regards their
educational qualification, 30% of primary teachers were Hafiz and 22% were Aalim and the rest
had other regular academic qualifications. In upper primary Madrasahs, about 14% were Hafiz,
19% were Aalim, 34% were graduates and the rest had other secondary education qualifications.
But many of the teachers were untrained (52% in primary and 59% in upper primary Madrasahs).
Some teachers had professional qualifications of Muft i or Maul l im (13% in primary and 7% in
upper primary Madrasahs). About 16% primary and 21% upper primary teachers had teacher
training at JBT or B,Ed. level. Teachers’ absence rate appears to be very low. On the day of visit
of the investigator, 89% primary Madrasah teachers and 94% of upper primary Madrasah
teachers were present.
8.11.5 Relaxation during Ramazan and on Fridays
During the holy month of Ramazan, Muslim teachers and some students also fast. So some
Madrasahs close early, some close down for the whole month. It was found that 57% Madrasahs
had declared vacation during Ramazan, 23% allowed teachers and students to leave early, 12%
changed their working hours while 8% did not make any change in their routine. On Fridays
when they have to offer their noon prayer, 12% Madrasahs allowed one hour break for that, 40%
closed down early and 20% observed weekly off on Fridays instead of Sundays whereas 29% did
not make any change in their daily routine.
8.11.6 Enrolment and Retention
The total enrolment in 2011 at primary level in 97 Madrasahs was 14,772 and at upper primary
level, 6,012.The percentage of Muslims was 99.5% and 98.9% respectively at these levels. TheCN
percentage of girls was 45.3% at primary level and 31.1% at upper primary level. The total v,0
enrolment had increased by 1.1% between 2009 and 2010, and by 1.0% between 2010 and 2011; ^Oh
girls were given in only 3% Madrasahs. Most of the incetives were provided by Education
Department but some were given by the Department of Minority Affairs or NGOs too.

the enrolment of girls had decreased by 3.6% between 2009 and 2010 but increased by 3.9%
between 2010 and 2011. There was wide difference in the pattern of increase or decrease across
states. In Haryana, Jammu & Kashmir, Uttarakhand, Karnataka and Kerala, increase had taken
place while in Assam, Bihar, Jharkhand and Madhya Pradesh enrolment had gradually
decreased.
At upper primary level, the total enrolment had increased by 7.1% between 2009 and 2010 and
by 45.5% between 2010 and 2011; the corresponding increase in enrolment of girls was 4.9%
and 1.5% respectively. The large increase between 2010 and 2011 was mainly in Bihar, Assam
and Uttar Pradesh.
The percentage of Muslim children who left Madrasah either to join another school or Madrasah
was between 3.5% and 4.5% in any year. The percentage of those who became dropouts was
2.1% at primary level and 2.6% at upper primary level. This percentage was higher among non-
Muslim students but their number was so low that no generalization can be made.
The reasons of dropping out given by parents were mainly the children being required to help
parents in their occupation or in household work. Some felt that children dropped out because of
lack of parents’ interest in child’s education. Hardly anyone gave early marriage or long distance
from home as the reason of dropping out.
8.11.7 Absence rate of students in Madrasahs
The percentage of children present in primary Madrasahs on the day of visit by the investigator
was 77.3% while the percentage of children who were present in upper primary Madrasahs was
much higher, 86.9%. Similar was the situation in the case of regular schools. The percentage of
girls who were present was less in both cases than the percentage of boys who were present,
73.2% and 83.1% present in primary and upper primary Madrasahs respectively. As most
children were Muslim in Madrasahs, the absence rate of Muslim children was almost same as
that of all children. The reasons of long absence in the case of those who were absent for long
time, were the same as in regular schools. Their long absence was due to their being needed to
help parents in their occupational or household work, while in several cases it was also due to
lack of interest of parents in their children’s education. The reason of absence due to ^OJgOh

8.11.8 Madrasah Management Committees (MMCs)
Management Committees in Madrasahs functioned in the same way as in regular schools. The
average number of members per MMC was 10.8. The average percentage of female members
was 30%. The percentage of Muslims in these committees was 76%. The attendance rate in
meetings of MMCs was quite high. When asked about attendance in the latest meeting, it was
found that 80% male members and 78% female members had attended this meeting. The average
attendance of Muslim members was only marginally less, 76%.
8.11.9 Support from the community to Madrasahs
There is some support from the community to Madrasahs. Let us see what kind of support
(partial or adequate) the community provided to Madrasahs in facilitating education of all
children and particularly of Muslim children. As mentioned earlier, almost all students (99.5%)
enrolled in primary and upper primary Madrasahs belonged to Muslim community, hence the
support received by Madrasahs is mainly for Muslim students. Majority of Madrasahs had
received support from the community in admission process and ensuring children’s retention and
attendance (66%) and in organization of religious or moral education programmes (60%). In
more than one-half of the Madrasahs some support was received in the form of donations in cash
or kind for improvement of facilities in school (56.7%) and providing help in studies (53.6%).
Nearly one-third of Madrasahs were supported by the community in the form of teaching some
skills to children.
8.12 Parents’ Opinion about Schools and Madrasahs
Opinion of parents of children who were in school or Madrasah has been presented about what
they felt about the educational facilities in school or Madrasah, incentives etc being given to
children and reasons of absence from school if they had remained absent for long. They were
also asked questions on schooling of other children in the family and about their own education,
age and occupation. The sample of parents who were interviewed consisted of parents of 4 ^OJgOh
involvement in household work was quite significant in the case of girls, 59% against 29% in the
case of boys.

randomly selected students from each school; the total sample consisted of 4583 parents from the
12 states covered in the study.
8.12.1 Characteristics of the interviewed parents
Among the parents who were interviewed, 3383 were from rural area and 1200 (26.2%) from
urban area. Also, 3179 were men and 1404 (30.6%) were women. Among them, 35.6% were of
age 35 or less, 46% were of age between 36 and 45 and 18.4% were of age 45 years or more.
Their occupational pattern varied depending on whether they were in rural area or urban area.
Overall, 44.5% were below Poverty Line (44.5% in rural area and 35% in urban area). Further,
the percentage of mothers who were engaged in any economic activity was 21.4% (24% in rural
area and 14.3% in urban area). Majority of the parents were illiterate or had maximum primary
level education. The percentage of such parents was higher in rural area. About 39% mothers
were illiterate, while only 21.7% fathers were illiterate. Further, 27.1% fathers and 19.5%
mothers had secondary or higher level of education.
8.12.2 Education of children in the family
Parents were asked about educational status of all the children in the age group 6 to below 14
(that is, 6 - 13) in the family - whether they were going to any school and if yes what type of
school. It was found that only 4.5% children in the 6 - 10 age group and 6.7% children in the 11
- 13 age group were out of school. Among them the percentage of girls was less, 44% and 45%
respectively in these two age groups. In the 6 -10 age group, the highest percentage of OOSC
was in Jharkhand (14.8%) and the lowest in Karnataka and Uttarakhand (1%). In the 11 - 13 age
group, the percentage of OOSC was between 2% and 10% in most of the states except Gujarat,
Kerala and Uttarakhand where this percentage was less than 2%. Among the OOSC in the age
group 6 - 10, 35.4% had never gone to any school; the rest were either drop outs or were
attending unrecognized Madrasahs. In the age group 11 - 13, among the OOSC the percentage of
those who had never gone to any school, was only 18.6%; the rest were either dropouts or were
attending Madrasahs which provide only religious education.
t-HOJegOh

Out of 9182 children in the 6 - 13 age group, 94.9% were attending school; among them, 70.5%
were attending government schools, 21.1% were in private schools and 8.4% were attending
Madrasahs. The percentage of boys attending government schools was 69.9% against 71.2%
girls in government schools; the percentage of boys in private schools was slightly more (21.9%)
than that of girls in private schools (20.2%). Perhaps there some preference is given to boys
when it comes to sending them to a private school.
So far as preference of private schools is concerned there is considerable difference between
rural and urban areas. In rural areas only 17.8% of school going children in the age group 6 - 13
went to private schools, whereas this percentage was 30.8% in urban areas. Also although there
was not much difference between percentage of boys and girls going to private schools in rural
areas, the percentage of school going boys who attended private schools (32.6%) was
substantially higher than that of girls (29.0%) in urban areas.
8.12.3 Perception of parents about incentives
According to parents almost all children studying at primary level in government schools were
served mid-day meal in school and were given free textbooks, their percentage being 92.6% and
90.6% respectively. Free uniforms were given to 57.7% children (51.7% boys and 64.0% girls)
and free school bags to 19.6% children (13.2% boys and 26.6% girls), there being apparently
some priority given to girls in providing these items. While under Sarva Shiksha Abhiyan, there
is provision of free uniform for all children it appears that only about half of them are getting it.
Scholarship is generally for girls, but as large number of children are from poor families 47.7%
children are getting scholarship (46.1% boys and 49.5% girls). It appears that girls in urban areas
are benefitting more from this incentive, their percentage being 58.1% against 49.3% for boys.
In private schools also some children get these incentives, though not from government
resources. The percentage of children getting free textbooks, mid-day meal and scholarship is
39.6%, 45.3% and 40.4% respectively. The percentage of those getting free uniform is rather
low, only 9%. In Madrasahs while, 52.5% get free textbooks, 39.3% get mid-day meal, very few ''-O
get other items free. ^OJgOh

At upper primary level also, most children in government schools (about 90%) get free textbooks
and mid-day meal. But the percentage of those getting free uniform is only 55% (47.2% boys and
62.6% girls); the percentage of girls getting free uniform, free school bags and scholarships is
higher in the case of girls than boys. In private schools, only 36.8% children were reportedly
getting free textbooks and only 41.9%, free mid-day meal. In the case of Madrasahs, 55.4%
children were given free textbooks and 58.3% free mid-day meal, but very few (about18%) got
scholarships or free uniform.
8.12.4 Provision of escort for children
Some schools have arrangement for providing escort to children for going to and returning from
school from the point of view of their safety. Schools provided this facility to only about 7%
children in government schools, 10% children in private schools and 7.6% children in
Madrasahs. The percentage of girls availing this facility was slightly more than the percentage of
who availed this facility. Perhaps more girls needed escort than boys for accompanying them
while going to school.
8.12.5 Long absence from school and reasons thereof
Parents were asked whether any child had remained absent from school for over 15 days at a
stretch. At the primary level, 92.4% children and at upper primary level 90.6% children had not
remained absent from school for such a long time. The major reason for long absence was being
involved in household work as 4.1% children of primary classes and 4.6% children of upper
primary classes had remained absent for long due to being engaged in household work. Other
reasons such as sickness accounted for less than 5% of long absence cases.
8.12.6 Perception of parents about school and teachers
Parents were asked to give their opinion about the schools that their children attended andV .Dt-HOJ gwhether their children faced any problem of discrimination or being punished. They gave

opinion about each school going child in the family. In about 95% cases parents were satisfied
with the school. Also according to them 93% children in government schools and Madrasahs
enjoyed going to school/ Madrasah while this percentage was 96% in private schools. Thus most
children liked their schools and also parents were satisfied with the teaching in school.
Very few children apparently faced any type of discrimination in school. The percentage of
children reporting discrimination was 3.8% in government schools and even less (only 2.3%) in
private schools. Although no child is to be punished after implementation of RTE Act (2009),
according to parents 7.7% children attending government schools had received punishment in
school, whereas this percentage was only 4% in private schools and 5.4% in Madrasahs.
0 0V .D
OJgO h

Appendix -Supplementary Tables for Chapter 3
Table A3.1: Availability of Schools/Madrasahs having Primary Classes in the Habitation
State Item Habitations having primary classesAllHabitations
Within the habitation
Up to 1 km from the
habitation
Beyond 1 km from
the habitation
(1) (2) (3) (4) (5) (6)
AssamNo. of Habitations 388 185 153 50Their total population 416878 209166 176317 31395Muslim Population 275119 145324 103145 26650% of Muslim Population 100.0 52.8 37.5 9.7
BiharNo. of Habitations 238 172 26 40Their total population 370648 329700 26948 14000Muslim Population 200675 177786 15089 7800% of Muslim Population 100.0 88.6 7.5 3.9
GujaratNo. of Habitations 31 30 1 0Their total population 93702 92230 1472 0Muslim Population 63004 62317 687 0% of Muslim Population 100.0 98.9 1.1 0.0
Haryana
No. of Habitations 30 30 0 0Their total population 131514 131514 0 0Muslim Population 121123 121123 0 0% of Muslim Population 100.0 100.0 0.0 0.0
Jammu & Kashmir
No. of Habitations 216 158 20 38Their total population 174487 148757 5510 20220Muslim Population 140712 118638 4740 17334% of Muslim Population 100.0 84.3 3.4 12.3
JharkhandNo. of Habitations 158 106 21 31Their total population 134726 98335 19532 16859Muslim Population 76944 47307 14515 15122% of Muslim Population 100.0 61.5 18.9 19.7
KarnatakaNo. of Habitations 32 31 1 0Their total population 85839 84920 919 0Muslim Population 21736 21541 195 0% of Muslim Population 100.0 99.1 0.9 0.0
KeralaNo. of Habitations 79 60 11 8Their total population 533532 419844 102696 10992Muslim Population 232647 187287 40300 5060% of Muslim Population 100.0 80.5 17.3 2.2
a ^V .D
OJgO h

MadhyaPradesh
No. of Habitations 35 34 1 0Their total population 49047 48247 800 0Muslim Population 22843 22443 400 0% of Muslim Population 100.0 98.2 1.8 0.0
Table A3.1 (contd.): Availability of Schools/Madrasahs having Primary Classes in the Habitation
State Item Habitations having primary classesAllHabitations
Within the habitation
Up to 1 km from the
habitation
Beyond 1 km from
the habitation
(1) (2) (3) (4) (5) (6)
RajasthanNo. of Habitations 52 33 7 12Their total population 51601 44502 3119 3980Muslim Population 26916 21473 2333 3110% of Muslim Population 100.0 79.8 8.7 11.6
UttarPradesh
No. of Habitations 203 181 9 13Their total population 925959 906007 6662 13290Muslim Population 575793 565590 3013 7190% of Muslim Population 100.0 98.2 0.5 1.2
UttarakhandNo. of Habitations 35 34 1 0Their total population 190009 187809 2200 0Muslim Population 121116 118916 2200 0% of Muslim Population 100.0 98.2 1.8 0.0
TotalNo. of Habitations 1497 1054 251 192Their total population 3157942 2701031 346175 110736Muslim Population 1878628 1609745 186617 82266% of Muslim Population 100.0 85.7 9.9 4.4
Table A3.2: No. of habitations having primary classes beyond 1 km from the habitation
StateHabitation Population Slab
Up to 300
301 to 500
501 to 1000
1001 to 2000
2001 to 5000
> 5000 Total
Assam 17 6 17 10 0 0 50Bihar 32 0 4 2 2 0 40Gujarat 0 0 0 0 0 0 0Haryana 0 0 0 0 0 0 0Jammu & Kashmir 25 6 2 2 3 0 38Jharkhand 12 3 13 2 1 0 31Karnataka 0 0 0 0 0 0 0Kerala 0 0 0 7 1 0 8Madhya Pradesh 0 0 0 0 0 0 0

Rajasthan 10 0 1 1 0 0 12Uttar Pradesh 1 3 5 3 1 0 13Uttarakhand 0 0 0 0 0 0 0
Total 97 18 42 27 8 0 192(50.5) (9.4) (21.9) (14.1) (4.2) (0.0) (100.0)
Table A3.3: Availability of Schools/Madrasahs having Upper Primary Classesin the Habitation
State ItemHabitations having upper primary classes
AllHabitations
Within the habitation
Up to 3 km from the
habitation
Beyond 3 km from the
habitation(1) (2) (3) (4) (5) (6)
Assam
No. of Habitations 388 89 256 43Their total population 416878 142971 253107 20800Muslim Population 275119 73626 182193 19300% of Muslim Population served 100.0 26.8 66.2 7.0
Bihar
No. of Habitations 238 142 63 33Their total population 370648 283948 84443 2257Muslim Population 200675 153653 45982 1040% of Muslim Population served 100.0 76.6 22.9 0.5
Gujarat
No. of Habitations 31 25 3 3Their total population 93702 89277 2698 1727Muslim Population 63004 61684 985 335% of Muslim Population served 100.0 97.9 1.6 0.5
Haryana
No. of Habitations 30 18 6 6Their total population 131514 68558 48780 14176Muslim Population 121123 60537 47350 13236% of Muslim Population served 100.0 50.0 39.1 10.9
Jammu & Kashmir
No. of Habitations 216 77 108 31Their total population 174487 111522 43088 19877Muslim Population 140712 88275 36832 15605% of Muslim Population served 100.0 62.7 26.2 11.1
Jharkhand
No. of Habitations 158 92 49 17Their total population 134726 82441 43293 8992Muslim Population 76944 36729 32731 7484% of Muslim Population served 100.0 47.7 42.5 9.7
Karnataka No. of Habitations 32 27 5 0Their total population 85839 69495 16344 0 OJg
O h

Muslim Population 21736 17739 3997 0% of Muslim Population served 100.0 81.6 18.4 0.0
KeralaNo. of Habitations 79 31 47 1Their total population 533532 240960 291122 1450Muslim Population 232647 104057 127638 952% of Muslim Population served 100.0 44.7 54.9 0.4
MadhyaPradesh
No. of Habitations 35 18 14 3Their total population 49047 39357 7145 2545Muslim Population 22843 17172 3706 1965% of Muslim Population served 100.0 75.2 16.2 8.6
RajasthanNo. of Habitations 52 18 11 23Their total population 51601 40587 4035 6979Muslim Population 26916 18349 2405 6162% of Muslim Population served 100.0 68.2 8.9 22.9
Table A3.3 (Contd.): Availability of Schools/Madrasahs having Upper Primary Classesin the Habitation
State ItemHabitations having upper primary classes
AllHabitations
Within the habitation
Up to 3 km from the
habitation
Beyond 3 km from the
habitation(1) (2) (3) (4) (5) (6)
UttarPradesh
No. of Habitations 203 124 54 25Their total population 925959 783741 119424 22794Muslim Population 575793 496418 65887 13488% of Muslim Population served 100.0 86.2 11.4 2.3
UttarakhandNo. of Habitations 35 26 5 4Their total population 190009 178459 4302 7248Muslim Population 121116 111436 3532 6148% of Muslim Population served 100.0 92.0 2.9 5.1
Total
No. of Habitations 1497 687 621 189Their total population 3157942 2131316 917781 108845Muslim Population 1878628 1239675 553238 85715% of Muslim Population 100.0 66.0 29.4 4.6
CN
Table A3.4: No. of habitations having upper primary classes beyond 3 km from the habitation OJgO h

Habitation Population SlabState Up to
300301 to
500501 to 1000
1001 to 2000
2001 to 5000 > 5000 Total
Assam 10 16 13 3 1 0 43Bihar 32 0 0 1 0 0 33Gujarat 1 2 0 0 0 0 3Haryana 0 0 2 2 1 1 6Jammu & Kashmir 16 6 3 3 3 0 31Jharkhand 8 0 7 2 0 0 17Karnataka 0 0 0 0 0 0 0Kerala 0 0 0 1 0 0 1Madhya Pradesh 0 0 2 1 0 0 3Rajasthan 14 5 4 0 0 0 23Uttar Pradesh 4 4 9 7 1 0 25Uttarakhand 1 0 0 1 2 0 4
Total 86 33 40 21 8 1 189(45.5) (17.5) (21.2) (11.1) (4.2) (0.5) (100.0)
Table A3.5: Number of Schools/Madrasahs in the Village according to Level,Type and Management
State Management
Level of school Recognized Madrasahs
Primary UpperPrimary
Sec./Hr. Sec having UP
Classes
with Primary Classes
with Upper Primary Classes
N % N % N % N % N %
Assam
Government 222 77.6 41 54.7 11 61.1 3 100.0 8 100.0Private Aided 23 8.0 22 29.3 3 16.7 0 0.0 0 0.0Private Unaided 24 8.4 10 13.3 1 5.6 0 0.0 0 0.0Unrecognized 17 5.9 2 2.7 3 16.7 - - - -Total 286 100.0 75 100.0 18 100.0 3 100.0 8 100.0
Bihar
Government 153 81.8 39 86.7 3 60.0 1 50.0 3 60.0Private Aided 17 9.1 3 6.7 1 20.0 1 50.0 2 40.0Private Unaided 17 9.1 3 6.7 1 20.0 0 0.0 0 0.0Unrecognized 0 0.0 0 0.0 0 0.0 - - - -Total 187 100.0 45 100.0 5 100.0 2 100.0 5 100.0
Gujarat
Government 13 92.9 37 92.5 5 71.4 0 0.0 0 0.0Private Aided 1 7.1 2 5.0 1 14.3 0 0.0 0 0.0Private Unaided 0 0.0 1 2.5 1 14.3 0 0.0 0 0.0Unrecognized 0 0.0 0 0.0 0 0.0 - - - -Total 14 100.0 40 100.0 7 100.0 0 0.0 0 0.0
Haryana Government 33 100.0 17 85.0 1 100.0 0 0.0 0 0.0
c n
OJegO h

Private Aided 0 0.0 3 15.0 0 0.0 0 0.0 2 100.0Private Unaided 0 0.0 0 0.0 0 0.0 0 0.0 0 0.0Unrecognized 0 0.0 0 0.0 0 0.0 - - - -Total 33 100.0 20 100.0 1 100.0 0 0.0 2 100.0
Jammu & Kashmir
Government 146 96.1 84 97.7 6 85.7 0 0.0 0 0.0Private Aided 5 3.3 0 0.0 0 0.0 0 0.0 0 0.0Private Unaided 1 0.7 1 1.2 1 14.3 0 0.0 0 0.0Unrecognized 0 0.0 1 1.2 0 0.0 - - - -Total 152 100.0 86 100.0 7 100.0 0 0.0 0 0.0
Jharkhand
Government 68 95.8 21 95.5 4 80.0 0 0.0 3 100.0Private Aided 1 1.4 1 4.5 1 20.0 1 100.0 0 0.0Private Unaided 2 2.8 0 0.0 0 0.0 0 0.0 0 0.0Unrecognized 0 0.0 0 0.0 0 0.0 - - - -Total 71 100.0 22 100.0 5 100.0 1 100.0 3 100.0
Karnataka
Government 9 69.2 14 82.4 0 0.0 0 0.0 0 0.0Private Aided 1 7.7 3 17.6 0 0.0 0 0.0 0 0.0Private Unaided 3 23.1 0 0.0 2 100.0 0 0.0 0 0.0Unrecognized 0 0.0 0 0.0 0 0.0 - - - -Total 13 100.0 17 100.0 2 100.0 0 0.0 0 0.0
Continued . . .
Table A3.5 (contd.): Number of Schools/Madrasahs in the Village according toLevel, Type and Management
State Management
Level of school Recognized Madrasahs
Primary UpperPrimary
Sec./Hr. Sec having UP
Classes
with Primary Classes
with Upper Primary Classes
N % N % N % N % N %
Kerala
Government 96 31.5 61 35.1 0 0.0 0 0.0 0 0.0Private Aided 209 68.5 111 63.8 0 0.0 1 100.0 0 0.0Private Unaided 0 0.0 2 1.1 0 0.0 0 0.0 0 0.0Unrecognized 0 0.0 0 0.0 0 0.0 - - - -Total 305 100.0 174 100.0 0 0.0 1 100.0 0 0.0
MadhyaPradesh
Government 38 88.4 12 48.0 1 100.0 0 0.0 0 0.0Private Aided 0 0.0 6 24.0 0 0.0 0 0.0 1 100.0Private Unaided 5 11.6 7 28.0 0 0.0 3 100.0 0 0.0Unrecognized 0 0.0 0 0.0 0 0.0 - - - -Total 43 100.0 25 100.0 1 100.0 3 100.0 1 100.0
RajasthanGovernment 60 83.3 18 85.7 2 100.0 0 0.0 0 0.0Private Aided 10 13.9 3 14.3 0 0.0 1 100.0 0 0.0Private Unaided 1 1.4 0 0.0 0 0.0 0 0.0 0 0.0 OJg
O h

Unrecognized 1 1.4 0 0.0 0 0.0 - - - -Total 72 100.0 21 100.0 2 100.0 1 100.0 0 0.0
UttarPradesh
Government 219 66.0 114 63.7 0 0.0 3 12.0 0 0.0Private Aided 68 20.5 41 22.9 7 31.8 7 28.0 2 66.7Private Unaided 40 12.0 23 12.8 12 54.5 15 60.0 1 33.3Unrecognized 5 1.5 1 .6 3 13.6 - - - -Total 332 100.0 179 100.0 22 100.0 25 100.0 3 100.0
Uttarakhand
Government 40 47.1 15 60.0 1 25.0 0 0.0 0 0.0Private Aided 13 15.3 1 4.0 0 0.0 0 0.0 1 100.0Private Unaided 31 36.5 9 36.0 3 75.0 0 0.0 0 0.0Unrecognized 1 1.2 0 0.0 0 0.0 - - - -Total 85 100.0 25 100.0 4 100.0 0 0.0 1 100.0
Total
Government 1097 68.9 473 64.9 34 45.9 7 19.4 14 60.9Private Aided 348 21.8 196 26.9 13 17.6 11 30.6 8 34.8Private Unaided 124 7.8 56 7.7 21 28.4 18 50.0 1 4.3Unrecognized 24 1.5 4 0.5 6 8.1 - - - -Total 1593 100.0 729 100.0 74 100.0 36 100.0 23 100.0
Note: Government schools include Local Body schools also.
Table A3.6: Management-wise Schools in Sampled districts in the year 2011
StatePrimary schools Upper primary schools
Total Govt Non-Govt Total Govt Non-Govt
N % N % N % N %Assam 5644 5446 96.5 198 3.5 2516 1224 48.6 1292 51.4Bihar 3789 3789 100.0 0 0.0 2220 2210 99.5 10 0.5Gujarat 269 240 89.2 29 10.8 913 709 77.7 204 22.3Haryana 556 548 98.6 8 1.4 463 352 76.0 111 24.0Jammu & Kashmir 2524 2327 92.2 197 7.8 1910 1608 84.2 302 15.8Jharkhand 1393 1373 98.6 20 1.4 837 765 91.4 72 8.6Karnataka 354 290 81.9 64 18.1 1586 841 53.0 745 47.0Kerala 1341 408 30.4 933 69.6 1053 318 30.2 735 69.8Madhya Pradesh 932 822 88.2 110 11.8 1500 370 24.7 1130 75.3Rajasthan 1002 919 91.7 83 8.3 608 470 77.3 138 22.7Uttar Pradesh 11295 7260 64.3 4035 35.7 5805 3083 53.1 2722 46.9Uttarakhand 1198 774 64.6 424 35.4 608 240 39.5 368 60.5
Total 30297 2419 79.9 6101 20.1 20019 1219 60.9 7829 39.1LO
Source: DISE. OJgO h

V.D
OJegH3O h

Table A3.7: Enrolment in Primary and Upper Primary Classes in Schools of Sampled Villages
State ClassesTotal Muslim % of
Muslim students
% of girls amongTotal Girls Total Girls Muslim Non-
Muslim
AssamI - IV/V 34048 16299 26026 12915 76.4 49.6 42.2V/VI - VII/VIII 13373 6651 10028 4950 75.0 49.4 50.91 - VII/VIII 47421 22950 36054 17865 76.0 49.6 44.7
BiharI - IV/V 54799 26933 29165 14074 53.2 48.3 50.2V/VI - VII/VIII 14493 7735 7605 4197 52.5 55.2 51.41 - VII/VIII 69292 34668 36770 18271 53.1 49.7 50.4
GujaratI - IV/V 8421 4054 4922 2458 58.4 49.9 45.6V/VI - VII/VIII 4185 1967 2867 1336 68.5 46.6 47.91 - VII/VIII 12606 6021 7789 3794 61.8 48.7 46.2
HaryanaI - IV/V 11244 6148 9492 5527 84.4 58.2 35.4V/VI - VII/VIII 2629 976 2004 761 76.2 38.0 34.41 - VII/VIII 13873 7124 11496 6288 82.9 54.7 35.2
Jammu & Kashmir
I - IV/V 8003 3827 6943 3372 86.8 48.6 42.9V/VI - VII/VIII 3759 1917 3086 1524 82.1 49.4 58.41 - VII/VIII 11762 5744 10029 4896 85.3 48.8 48.9
JharkhandI - IV/V 15577 8174 10409 5150 66.8 49.5 58.5V/VI - VII/VIII 3573 1577 2653 1053 74.3 39.7 57.01 - VII/VIII 19150 9751 13062 6203 68.2 47.5 58.3
KarnatakaI - IV/V 3481 1607 1856 894 53.3 48.2 43.9V/VI - VII/VIII 1536 762 791 397 51.5 50.2 49.01 - VII/VIII 5017 2369 2647 1291 52.8 48.8 45.5
KeralaI - IV/V 54478 27217 28304 14285 52.0 50.5 49.4V/VI - VII/VIII 39455 19434 20012 10160 50.7 50.8 47.71 - VII/VIII 93933 46651 48316 24445 51.4 50.6 48.7
MadhyaPradesh
I - IV/V 5623 2717 2680 1474 47.7 55.0 42.2V/VI - VII/VIII 3104 1651 1401 784 45.1 56.0 50.91 - VII/VIII 8727 4368 4081 2258 46.8 55.3 45.4
RajasthanI - IV/V 6220 3054 4139 2051 66.5 49.6 48.2V/VI - VII/VIII 1041 433 507 171 48.7 33.7 49.11 - VII/VIII 7261 3487 4646 2222 64.0 47.8 48.4
Uttar PradeshI - IV/V 68005 33080 37616 19096 55.3 50.8 46.0V/VI - VII/VIII 20490 10192 8821 4650 43.1 52.7 47.51 - VII/VIII 88495 43272 46437 23746 52.5 51.1 46.4
UttarakhandI - IV/V 17684 8374 12216 5556 69.1 45.5 51.5V/VI - VII/VIII 3972 1952 1990 977 50.1 49.1 49.21 - VII/VIII 21656 10326 14206 6533 65.6 46.0 50.9
TotalI - IV/V 287583 141484 173768 86852 60.4 50.0 48.0V/VI - VII/VIII 111610 55247 61765 30960 55.3 50.1 48.71 - VII/VIII 399193 196731 235533 117812 59.0 50.0 48.2

Table A3.8: Percentage of Girls in Primary and Upper primary Classes in Recognised Madrasahs in sampled Villages
State ClassesTotal Muslim % of
Muslim students
% of girls amongTotal Girls Total Girls Muslim Non-
Muslim
AssamI - IV/V 443 306 395 270 89.2 68.4 75.0V/VI - VII/VIII 1543 921 1473 866 95.5 58.8 78.61 - VII/VIII 1986 1227 1868 1136 94.1 60.8 77.1
BiharI - IV/V 2048 985 1948 885 95.1 45.4 100.0V/VI - VII/VIII 207 152 207 152 100.0 73.41 - VII/VIII 2255 1137 2155 1037 95.6 48.1 100.0
GujaratI - IV/V - - - - - - -V/VI - VII/VIII - - - - - - -1 - VII/VIII - - - - - - -
HaryanaI - IV/V 379 79 364 71 96.0 19.5 53.3V/VI - VII/VIII 154 52 129 37 83.8 28.7 60.01 - VII/VIII 533 131 493 108 92.5 21.9 57.5
Jammu & Kashmir
I - IV/V - - - - - - -V/VI - VII/VIII - - - - - - -1 - VII/VIII - - - - - - -
JharkhandI - IV/V 695 551 695 551 100.0 78.6 -V/VI - VII/VIII 85 66 85 66 100.0 77.6 -1 - VII/VIII 780 617 780 617 100.0 78.5 -
KarnatakaI - IV/V - - - - - - -V/VI - VII/VIII - - - - - - -1 - VII/VIII - - - - - - -
KeralaI - IV/V 64 37 59 33 92.2 55.9 80.0V/VI - VII/VIII - - - - - - -1 - VII/VIII 64 37 59 33 92.2 55.9 80.0
MadhyaPradesh
I - IV/V 402 131 402 131 100.0 32.6 -V/VI - VII/VIII 25 15 25 15 100.0 60.0 -1 - VII/VIII 427 146 427 146 100.0 34.2 -
RajasthanI - IV/V 24 14 24 14 100.0 58.3 -V/VI - VII/VIII - - - - - - -1 - VII/VIII 24 14 24 14 100.0 58.3 -
Uttar PradeshI - IV/V 1340 696 1274 696 95.1 54.6 -V/VI - VII/VIII 144 69 144 69 100.0 47.9 -1 - VII/VIII 1484 765 1418 765 95.6 53.9 -
UttarakhandI - IV/V 635 281 635 281 100.0 44.3 -V/VI - VII/VIII 81 18 81 18 100.0 22.2 -1 - VII/VIII 716 299 716 299 100.0 41.8 -
TotalI - IV/V 6030 3080 5796 2932 96.1 50.6 63.2V/VI - Vn/Viii 2239 1293 2144 1223 95.8 57.0 73.71 - VII/VIII 8269 4373 7940 4155 77.3 52.3 67.8

Table A3.9: Number of Classrooms and Average Student-Classroom Ratio (SCR)in Primary Schools in 2011-12
State Area Total No. of schools
% of schools with classrooms
No. of classrooms Total enrol
ment in all
schools
Average SCR
1 - 2 3 - 5 > 5 Total Average
Average(DISEstatelevel)
Surve y data
StatelevelDISEdata
(1) (2) (3) (4) (5) (6) (7) (8) (9) (10) (11) (12)
Assam
Total 76 52.6 47.4 0.0 182 2.4 2.4 10604 58 33Rural 60 56.7 43.3 0.0 134 2.2 7046 53Urban 16 37.5 62.5 0.0 48 3.0 3558 74Govt. 73 50.7 49.3 0.0 179 2.5 10279 57Private 3 100.0 0.0 0.0 3 1.0 325 108
Bihar
Total 74 41.9 51.4 6.8 222 3.0 2.3 16549 75 78Rural 60 45.0 48.3 6.7 174 2.9 13357 77Urban 14 28.6 64.3 7.1 48 3.4 3192 67Govt. 70 41.4 52.9 5.7 208 3.0 15808 76Private 4 50.0 25.0 25.0 14 3.5 741 53
Gujarat
Total 26 7.7 61.5 30.8 131 5.0 2.8 4336 33 25Rural 20 10.0 65.0 25.0 94 4.7 3128 33Urban 6 0.0 50.0 50.0 37 6.2 1208 33Govt. 26 7.7 61.5 30.8 131 5.0 4336 33Private - - - - - - - -
Haryana
Total 25 8.0 52.0 40.0 132 5.3 4.6 7761 59 32Rural 19 10.5 47.4 42.1 100 5.3 6039 60Urban 6 0.0 66.7 33.3 32 5.3 1722 54Govt. 24 8.3 50.0 41.7 127 5.3 7665 60Private 1 0.0 100.0 0.0 5 5.0 96 19
Jammu & Kashmir
Total 56 64.3 28.6 7.1 202 3.6 2.4 2912 14 12Rural 45 66.7 28.9 4.4 102 2.3 1323 13Urban 11 54.5 27.3 18.2 100 9.1 1589 16Govt. 51 70.6 29.4 0.0 106 2.1 1324 12Private 5 0.0 20.0 80.0 96 19.2 1588 17
Jharkhand
Total 46 43.5 45.7 10.9 158 3.4 2.6 5530 35 28Rural 40 47.5 50.0 2.5 122 3.1 4766 39Urban 6 16.7 16.7 66.7 36 6.0 764 21Govt. 42 47.6 47.6 4.8 130 3.1 4995 38Private 4 0.0 25.0 75.0 28 7.0 535 19
Karnataka
Total 18 11.1 72.2 16.7 81 4.5 2.6 808 10 15Rural 10 20.0 50.0 30.0 47 4.7 384 9 cUrban 8 0.0 100.0 0.0 34 4.3 424 13 ITGovt. 13 15.4 69.2 15.4 56 4.3 470 9 T
Private 5 0.0 80.0 20.0 25 5.0 338 14 ________

Table A3.9 (Contd.): Number of Classrooms and Average Student-Classroom Ratio (SCR)in Primary Schools in 2011-12
State Area Total No. of schools
% of schools with No. of classrooms Total enrol
ment in all
schools
Average SCR
1 - 2 3 - 5 > 5 Total Average
Average(DISEstatelevel)
Surveydata
StatelevelDISEdata
(1) (2) (3) (4) (5) (6) (7) (8) (9) (10) (11) (12)
Kerala
Total 101 3.0 56.4 40.6 639 6.3 5.8 11946 19 20Rural 76 2.6 56.6 40.8 470 6.2 8401 18Urban 25 4.0 56.0 40.0 169 6.8 3545 21Govt. 34 5.9 58.8 35.3 190 5.6 3272 18Private 67 1.5 55.2 43.3 449 6.7 8674 20
MadhyaPradesh
Total 24 41.7 41.7 16.7 92 3.8 3.2 3073 33 26Rural 20 45.0 40.0 15.0 71 3.6 1774 25Urban 4 25.0 50.0 25.0 21 5.3 1299 62Govt. 24 41.7 41.7 16.7 92 3.8 3073 33Private - - - - - - - -
Rajasthan
Total 24 33.3 66.7 0.0 74 3.1 2.8 1297 18 21Rural 20 25.0 75.0 0.0 65 3.3 966 15Urban 4 75.0 25.0 0.0 9 2.3 331 37Govt. 22 31.8 68.2 0.0 69 3.1 1097 16Private 2 50.0 50.0 0.0 5 2.5 200 40
UttarPradesh
Total 130 10.8 63.8 25.4 640 4.9 4.4 20712 32 37Rural 98 8.2 67.3 24.5 487 5.0 14787 30Urban 32 18.8 53.1 28.1 153 4.8 5925 39Govt. 102 12.7 66.7 20.6 474 4.6 15241 32Private 28 3.6 53.6 42.9 166 5.9 5471 33
Uttarakhand
Total 27 18.5 63.0 18.5 124 4.6 3.0 4923 40 19Rural 19 5.3 68.4 26.3 102 5.4 3945 39Urban 8 50.0 50.0 0.0 22 2.8 978 44Govt. 18 16.7 66.7 16.7 75 4.2 3481 46Private 9 22.2 55.6 22.2 49 5.4 1442 29
Total
Total 627 27.6 53.6 18.8 2677 4.3 90451 34 N.A.
Rural 487 29.0 53.4 17.7 1968 4.0 65916 34 cUrban 140 22.9 54.3 22.9 709 5.1 24535 35 c
Govt. 499 32.7 54.1 13.2 1837 3.7 71041 39T

Private 128 7.8 51.6 40.6 840 6.6 19410 24
Table A3.10: Primary Schools with Average Student-Classroom Ratio (SCR)
StateArea/
Management
Availability of classrooms Average SCR % schools with
SCR > 30Available
Notavailable
up to20
21 - 30
31 - 40
41 -50 > 50 Survey
dataDISEdata
Assam
Total 76 0 2 12 5 13 44 81.6 50.7Rural 60 0 2 11 5 8 34 78.3Urban 16 0 0 1 0 5 10 93.8Govt 73 0 2 12 5 13 41 80.8 45.3Private 3 0 0 0 0 0 3 100.0
Bihar
Total 74 0 0 3 14 5 52 95.9 76.1Rural 60 0 0 3 10 4 43 95.0Urban 14 0 0 0 4 1 9 100.0Govt 70 0 0 3 13 4 50 95.7 76.2Private 4 0 0 0 1 1 2 100.0
Gujarat
Total 26 0 6 4 9 5 2 61.5 47.9Rural 20 0 5 3 6 5 1 60.0Urban 6 0 1 1 3 0 1 66.7Govt 26 0 6 4 9 5 2 61.5 47.2Private 0 0 0 0 0 0 0 0
Haryana
Total 24 1 2 4 3 3 12 75.0 36.5Rural 18 1 1 3 2 3 9 77.8Urban 6 0 1 1 1 0 3 66.7Govt 23 1 1 4 3 3 12 78.3 44.3Private 1 0 1 0 0 0 0 0.0
Jammu & Kashmir
Total 49 8 42 5 2 0 0 4.1 10.9Rural 38 8 33 4 1 0 0 2.6Urban 11 0 9 1 1 0 0 9.1Govt 44 8 38 5 1 0 0 2.3 12.3Private 5 0 4 0 1 0 0 20.0
Jharkhand
Total 46 0 13 7 6 6 14 56.5 45.2Rural 40 0 11 5 5 5 14 60.0Urban 6 0 2 2 1 1 0 33.3Govt 42 0 11 6 5 6 14 59.5 45.7Private 4 0 2 1 1 0 0 25.0
Karnataka
Total 18 0 16 2 0 0 0 0.0 19.3Rural 10 0 10 0 0 0 0 0.0Urban 8 0 6 2 0 0 0 0.0Govt 13 0 13 0 0 0 0 0.0 15.4Private 5 0 3 2 0 0 0 0.0

Table A3.10 (Contd.): Primary Schools with Average Student-Classroom Ratio (SCR)
StateArea/
Management
Availability of classrooms Average SCR % schools with
SCR > 30Available
Notavailable
up to20
21 - 30
31 - 40
41 -50 > 50 Survey
dataDISEdata
Kerala
Total 100 1 67 27 4 1 1 6.0 16.9Rural 76 0 51 20 3 1 1 6.6Urban 24 1 16 7 1 0 0 4.2Govt 34 0 21 10 1 1 1 8.8 13.9Private 66 1 46 17 3 0 0 4.5
MadhyaPradesh
Total 24 0 10 3 3 2 6 45.8 32.9Rural 20 0 10 3 3 1 3 35.0Urban 4 0 0 0 0 1 3 100.0Govt 24 0 10 3 3 2 6 45.8 34.3Private 0 0 0 0 0 0 0 0
Rajasthan
Total 24 0 17 3 1 2 1 16.7 25.0Rural 20 0 16 2 1 1 0 10.0Urban 4 0 1 1 0 1 1 50.0Govt 22 0 17 3 0 2 0 9.1 26.1Private 2 0 0 0 1 0 1 100.0
UttarPradesh
Total 130 0 35 41 16 13 25 41.5 55.0Rural 98 0 28 34 13 10 13 36.7Urban 32 0 7 7 3 3 12 56.3Govt 102 0 29 34 10 8 21 38.2 51.4Private 28 0 6 7 6 5 4 53.6
Utarakhand
Total 27 0 3 4 4 8 8 74.1 14.3Rural 19 0 2 4 3 4 6 68.4Urban 8 0 1 0 1 4 2 87.5Govt 18 0 1 3 1 7 6 77.8 12.6Private 9 0 2 1 3 1 2 66.7
Total
Total 618 10 213 115 67 58 165 46.9 N.A.Rural 479 9 169 92 52 42 124 45.5Urban 139 1 44 23 15 16 41 51.8Govt 491 9 149 87 51 51 153 51.9 N.A.Private 127 1 64 28 16 7 12 27.6
CN0 0
OJgO h

Table A3.11: Number of Classrooms in Upper Primary Schools
State Area Total No. of schools
% of schools with classrooms
No. of classrooms
Total enrolment
in allschools
Average enrolment per class
room1 - 2 3 - 5 > 5 Total Average
(1) (2) (3) (4) (5) (6) (7) (8) (9) (10)
Assam
Total 46 8.7 76.1 15.2 173 3.8 7064 41Rural 30 10.0 76.7 13.3 105 3.5 4738 45Urban 16 6.3 75.0 18.8 68 4.3 2326 34Govt. 41 9.8 75.6 14.6 151 3.7 6493 43Private 5 .0 80.0 20.0 22 4.4 571 26
Bihar
Total 44 4.5 27.3 68.2 293 6.7 20427 70Rural 30 6.7 33.3 60.0 186 6.2 13166 71Urban 14 .0 14.3 85.7 107 7.6 7261 68Govt. 43 4.7 27.9 67.4 283 6.6 20302 72Private 1 .0 .0 100.0 10 10.0 125 13
Gujarat
Total 16 .0 31.3 68.8 117 7.3 4213 36Rural 10 .0 30.0 70.0 70 7.0 2274 32Urban 6 .0 33.3 66.7 47 7.8 1939 41Govt. 15 .0 26.7 73.3 114 7.6 4045 35Private 1 .0 100.0 .0 3 3.0 168 56
Haryana
Total 17 17.6 11.8 70.6 176 10.4 5232 30Rural 11 27.3 18.2 54.5 65 5.9 2454 38Urban 6 .0 .0 100.0 111 18.5 2778 25Govt. 13 23.1 15.4 61.5 133 10.2 4425 33Private 4 .0 .0 100.0 43 10.8 807 19
Jammu & Kashmir
Total 55 32.7 29.1 38.2 332 6.0 5715 17Rural 42 38.1 33.3 28.6 186 4.4 3739 20Urban 13 15.4 15.4 69.2 146 11.2 1976 14Govt. 45 40.0 35.6 24.4 184 4.1 3678 20Private 10 .0 .0 100.0 148 14.8 2037 14
Jharkhand
Total 26 7.7 30.8 61.5 172 6.6 7930 46Rural 20 5.0 25.0 70.0 138 6.9 5963 43Urban 6 16.7 50.0 33.3 34 5.7 1967 58Govt. 22 4.5 31.8 63.6 146 6.6 6322 43Private 4 25.0 25.0 50.0 26 6.5 1608 62
KarnatakaTotal 37 .0 10.8 89.2 338 9.1 17389 51Rural 26 .0 15.4 84.6 227 8.7 13509 60
c n0 0
OJgO h

Urban 11 .0 .0 100.0 111 10.1 3880 35Govt. 21 .0 14.3 85.7 161 7.7 3904 24Private 16 .0 6.3 93.8 177 11.1 13485 76
Table A3.11 (Contd.): Number of Classrooms in Upper Primary Schools
State Area Total No. of schools
% of schools with classrooms
No. of classrooms
Total enrolment
in allschools
Average enrolment per class
room1 - 2 3 - 5 > 5 Total Average
(1) (2) (3) (4) (5) (6) (7) (8) (9) (10)
Kerala
Total 67 1.5 3.0 95.5 995 14.9 8726 9Rural 44 .0 4.5 95.5 635 14.4 7003 11Urban 23 4.3 .0 95.7 360 15.7 1723 5Govt. 21 .0 4.8 95.2 271 12.9 1691 6Private 46 2.2 2.2 95.7 724 15.7 7035 10
MadhyaPradesh
Total 14 14.3 42.9 42.9 67 4.8 2202 33Rural 10 10.0 50.0 40.0 43 4.3 1678 39Urban 4 25.0 25.0 50.0 24 6.0 524 22Govt. 11 .0 54.5 45.5 55 5.0 1874 34Private 3 66.7 .0 33.3 12 4.0 328 27
Rajasthan
Total 14 .0 50.0 50.0 79 5.6 1833 23Rural 10 .0 50.0 50.0 56 5.6 1122 20Urban 4 .0 50.0 50.0 23 5.8 711 31Govt. 13 .0 53.8 46.2 72 5.5 1642 23Private 1 .0 .0 100.0 7 7.0 191 27
Uttar Pradesh
Total 76 3.9 73.7 22.4 369 4.9 11670 32Rural 52 1.9 78.8 19.2 243 4.7 7312 30Urban 24 8.3 62.5 29.2 126 5.3 4358 35Govt. 56 3.6 85.7 10.7 232 4.1 4830 21Private 20 5.0 40.0 55.0 137 6.9 6840 50
Uttarakhand
Total 14 .0 57.1 42.9 92 6.6 2897 31Rural 10 .0 40.0 60.0 79 7.9 2500 32Urban 4 .0 100.0 .0 13 3.3 397 31Govt. 5 .0 80.0 20.0 33 6.6 1071 32Private 9 .0 44.4 55.6 59 6.6 1826 31
Total Total 426 8.2 37.8 54.0 3203 7.5 95298 30
0 0
OJegH3O h

Rural 295 9.2 40.0 50.8 2033 6.9 65458 33Urban 131 6.1 32.8 61.1 1170 8.9 29840 26Govt. 306 9.8 46.1 44.1 1835 6.0 60277 33Private 120 4.2 16.7 79.2 1368 11.4 35021 26
Table A3.12: Upper Primary Schools with Average Student-Classroom Ratio (SCR)
StateArea/
Management
Availability of classrooms Average SCR % schools with
SCR > 35Available
Notavailable
up to20
21 - 35
36 - 50 > 50 Survey
dataDISEdata
Assam
Total 46 0 4 17 10 15 54.3 35.1Rural 30 0 1 9 9 11 66.7Urban 16 0 3 8 1 4 31.3Govt 41 0 3 15 8 15 56.1 41.6Private 5 0 1 2 2 0 40.0
Bihar
Total 44 0 2 4 7 31 86.4 88.9Rural 30 0 0 3 5 22 90.0Urban 14 0 2 1 2 9 78.6Govt 43 0 1 4 7 31 88.4 89.8Private 1 0 1 0 0 0 0.0
Gujarat
Total 16 0 1 7 7 1 50.0 38.7Rural 10 0 1 6 3 0 30.0Urban 6 0 0 1 4 1 83.3Govt 15 0 1 7 7 0 46.7 37.0Private 1 0 0 0 0 1 100.0
Haryana
Total 17 0 7 3 2 5 41.2 24.4Rural 11 0 3 3 1 4 45.5Urban 6 0 4 0 1 1 33.3Govt 13 0 4 3 2 4 46.2 30.2Private 4 0 3 0 0 1 25.0
Jammu & Kashmir
Total 54 1 29 16 4 5 16.7 10.7Rural 41 1 18 15 3 5 19.5Urban 13 0 11 1 1 0 7.7Govt 44 1 20 15 4 5 20.5 13.8Private 10 0 9 1 0 0 0.0
JharkhandTotal 26 0 3 6 7 10 65.4 45.6Rural 20 0 1 6 6 7 65.0Urban 6 0 2 0 1 3 66.7
LO0 0
OJegO h

Govt 22 0 2 6 6 8 63.6 48.1Private 4 0 1 0 1 2 75.0
Karnataka
Total 37 0 16 13 8 0 21.6 14.5Rural 26 0 13 9 4 0 15.4Urban 11 0 3 4 4 0 36.4Govt 21 0 11 9 1 0 4.8 12.7Private 16 0 5 4 7 0 43.8
Table A3.12 (Contd.): Upper Primary Schools with Average Student-Classroom Ratio (SCR)
StateArea/
Management
Availability of classrooms Average SCR % schools with
SCR > 35Available
Notavailable
up to20
21 - 35
36 - 50 > 50 Survey
dataDISEdata
Kerala
Total 66 1 19 35 10 2 18.2 15.8Rural 44 0 8 29 6 1 15.9Urban 22 1 11 6 4 1 22.7Govt 21 0 8 8 4 1 23.8 15.0Private 45 1 11 27 6 1 15.6
MadhyaPradesh
Total 14 0 6 1 3 4 50.0 31.4Rural 10 0 5 0 1 4 50.0Urban 4 0 1 1 2 0 50.0Govt 11 0 5 1 2 3 45.5 37.6Private 3 0 1 0 1 1 66.7
Rajasthan
Total 14 0 5 7 2 0 14.3 19.1Rural 10 0 5 4 1 0 10.0Urban 4 0 0 3 1 0 25.0Govt 13 0 5 6 2 0 15.4 22.2Private 1 0 0 1 0 0 0.0
UttarPradesh
Total 76 0 36 24 6 10 21.1 30.7Rural 52 0 26 18 3 5 15.4Urban 24 0 10 6 3 5 33.3Govt 56 0 32 19 4 1 8.9 21.8Private 20 0 4 5 2 9 55.0
Utarakhand
Total 14 0 1 7 5 1 42.9 12.4Rural 10 0 1 4 4 1 50.0Urban 4 0 0 3 1 0 25.0Govt 5 0 0 4 1 0 20.0 9.7Private 9 0 1 3 4 1 55.6
TotalTotal 424 2 129 140 71 84 36.6 N.A.Rural 294 1 82 106 46 60 36.1Urban 130 1 47 34 25 24 37.7
V.D0 0
OJegO h

Govt 305 1 92 97 48 68 38.0 N.A.Private 119 1 37 43 23 16 32.8
Table A3.13: Primary Schools with Number of Classrooms having adverse SCR
State AreaTotal No.
ofschools
Schools having adverse SCR Total No. of classrooms
No. of classrooms having adverse SCR
% of Col. 7 to Col. 6Number %
(1) (2) (3) (4) (5) (6) (7) (8)
Assam
Total 76 57 75.0 182 80 44.0Rural 60 47 78.3 134 64 47.8Urban 16 10 62.5 48 16 33.3Govt. 73 54 74.0 179 77 43.0Private 3 3 100.0 3 3 100.0
Bihar
Total 74 36 48.6 222 71 32.0Rural 60 30 50.0 174 55 31.6Urban 14 6 42.9 48 16 33.3Govt. 70 32 45.7 208 63 30.3Private 4 4 100.0 14 8 57.1
Gujarat
Total 26 4 15.4 131 8 6.1Rural 20 3 15.0 94 5 5.3Urban 6 1 16.7 37 3 8.1Govt. 26 4 15.4 131 8 6.1Private - - - - - -
Haryana
Total 25 10 40.0 132 33 25.0Rural 19 8 42.1 100 29 29.0Urban 6 2 33.3 32 4 12.5Govt. 24 10 41.7 127 33 26.0Private 1 0 0.0 5 0 0.0
Jammu & Kashmir
Total 57 28 49.1 202 44 21.8Rural 46 20 43.5 102 33 32.4Urban 11 8 72.7 100 11 11.0Govt. 52 28 53.8 106 44 41.5Private 5 0 0.0 96 0 0.0
JharkhandTotal 46 18 39.1 158 32 20.3Rural 40 17 42.5 122 31 25.4Urban 6 1 16.7 36 1 2.8
0 0
OJgO h

Govt. 42 17 40.5 130 31 23.8Private 4 1 25.0 28 1 3.6Total 18 2 11.1 81 6 7.4
KarnatakaRural 10 0 0.0 47 0 0.0Urban 8 2 25.0 34 6 17.6Govt. 13 2 15.4 56 6 10.7Private 5 0 0.0 25 0 0.0
Table A3.13 (Contd.): Primary Schools with Number of Classrooms having adverse SCR
State AreaTotal No.
ofschools
Schools having adverse SCR Total No. of classrooms
No. of classrooms having adverse SCR
% of Col. 7 to Col. 6
Number %
(1) (2) (3) (4) (5) (6) (7) (8)
Kerala
Total 101 21 20.8 639 81 12.7Rural 76 16 21.1 470 61 13.0Urban 25 5 20.0 169 20 11.8Govt. 34 13 38.2 190 46 24.2Private 67 8 11.9 449 35 7.8
MadhyaPradesh
Total 24 10 41.7 92 22 23.9Rural 20 8 40.0 71 19 26.8Urban 4 2 50.0 21 3 14.3Govt. 24 10 41.7 92 22 23.9Private - - - - - -
Rajasthan
Total 24 7 29.2 74 13 17.6Rural 20 4 20.0 65 7 10.8Urban 4 3 75.0 9 6 66.7Govt. 22 5 22.7 69 10 14.5Private 2 2 100.0 5 3 60.0
UttarPradesh
Total 130 27 20.8 640 59 9.2Rural 98 16 16.3 487 41 8.4Urban 32 11 34.4 153 18 11.8Govt. 102 21 20.6 474 44 9.3Private 28 6 21.4 166 15 9.0
Uttarakhand
Total 27 11 40.7 124 25 20.2Rural 19 5 26.3 102 9 8.8Urban 8 6 75.0 22 16 72.7Govt. 18 8 44.4 75 18 24.0
0 00 0
OJegO h

Private 9 3 33.3 49 7 14.3Total 628 231 36.8 2677 474 17.7Rural 488 174 35.7 1968 354 18.0
Total Urban 140 57 40.7 709 120 16.9Govt. 500 204 40.8 1837 402 21.9Private 128 27 21.1 840 72 8.6
Table A3.14: Upper Primary Schools with Number of Classrooms having adverse SCR
State AreaTotal No. of schools
Schools having adverse SCR Total No. of
classroomsNo. of classrooms havingadverse SCR
% Col. 7 to Col. 6Number %
(1) (2) (3) (4) (5) (6) (7) (8)
Assam
Total 46 24 52.2 173 48 27.7Rural 30 14 46.7 105 26 24.8Urban 16 10 62.5 68 22 32.4Govt. 41 21 51.2 151 41 27.2Private 5 3 60.0 22 7 31.8
Bihar
Total 44 25 56.8 293 65 22.2Rural 30 18 60.0 186 34 18.3Urban 14 7 50.0 107 31 29.0Govt. 43 24 55.8 283 61 21.6Private 1 1 100.0 10 4 40.0
Gujarat
Total 16 4 25.0 117 11 9.4Rural 10 2 20.0 70 6 8.6Urban 6 2 33.3 47 5 10.6Govt. 15 4 26.7 114 11 9.6Private 1 - - 3 - -
Haryana
Total 17 7 41.2 176 30 17.0Rural 11 6 54.5 65 23 35.4Urban 6 1 16.7 111 7 6.3Govt. 13 5 38.5 133 22 16.5Private 4 2 50.0 43 8 18.6
Jammu & Kashmir
Total 55 28 50.9 332 81 24.4Rural 42 24 57.1 186 70 37.6Urban 13 4 30.8 146 11 7.5Govt. 45 26 57.8 184 69 37.5Private 10 2 20.0 148 12 8.1Total 26 8 30.8 172 36 20.9
a ^0 0
OJgO h

Jharkhand Rural 20 5 25.0 138 19 13.8Urban 6 3 50.0 34 17 50.0Govt. 22 6 27.3 146 21 14.4Private 4 2 50.0 26 15 57.7Total 37 4 10.8 338 8 2.4
KarnatakaRural 26 3 11.5 227 6 2.6Urban 11 1 9.1 111 2 1.8Govt. 21 2 9.5 161 5 3.1Private 16 2 12.5 177 3 1.7
Table A3.14 (Contd.): Upper Primary Schools with Number of Classroomshaving adverse SCR
State AreaTotal No. of schools
Schools having adverse SCR Total No. of
classroomsNo. of classrooms havingadverse SCR
% Col. 7 to Col. 6Number %
(1) (2) (3) (4) (5) (6) (7) (8)
Kerala
Total 67 8 11.9 995 55 5.5Rural 44 4 9.1 635 32 5.0Urban 23 4 17.4 360 23 6.4Govt. 21 3 14.3 271 17 6.3Private 46 5 10.9 724 38 5.2
MadhyaPradesh
Total 14 3 21.4 67 7 10.4Rural 10 2 20.0 43 6 14.0Urban 4 1 25.0 24 1 4.2Govt. 11 1 9.1 55 4 7.3Private 3 2 - 12 3 -
Rajasthan
Total 14 8 57.1 79 21 26.6Rural 10 5 50.0 56 14 25.0Urban 4 3 75.0 23 7 30.4Govt. 13 7 53.8 72 18 25.0Private 1 1 100.0 7 3 42.9
UttarPradesh
Total 76 12 15.8 369 37 10.0Rural 52 6 11.5 243 21 8.6Urban 24 6 25.0 126 16 12.7Govt. 56 8 14.3 232 17 7.3Private 20 4 20.0 137 20 14.6
UttarakhandTotal 14 7 50.0 92 33 35.9Rural 10 5 50.0 79 27 34.2Urban 4 2 50.0 13 6 46.2
OJgH3O h

Govt. 5 3 60.0 33 16 48.5Private 9 4 44.4 59 17 28.8Total 426 138 32.4 3203 432 13.5Rural 295 94 31.9 2033 284 14.0
Total Urban 131 44 33.6 1170 148 12.6Govt. 306 110 35.9 1835 302 16.5Private 120 28 23.3 1368 130 9.5
Table A3.15: Availability of Drinking Water and Toilet Facilities in Schools
State Area
Total No. of primar
yschools
% of primary schools having Total No. of upper
primary schools
% of upper primary schools having
Drinkin g Water
FunctionalToilet
s
Separate functional toilet for
girls
Drinkin g Water
Functional
Toilets
Separate functional toilet for
girls(1) (2) (3) (4) (5) (6) (7) (8) (9) (10)
Assam
Total 76 68.4 53.9 40.8 46 63.0 60.9 37.0Rural 60 63.3 50.0 38.3 30 53.3 56.7 33.3Urban 16 87.5 68.8 50.0 16 81.3 68.8 43.8Govt. 73 68.5 54.8 42.5 41 68.3 65.9 41.5Private 3 66.7 33.3 0.0 5 20.0 20.0 0.0
Bihar
Total 74 82.4 52.7 36.5 44 95.5 88.6 70.5Rural 60 80.0 48.3 36.7 30 93.3 83.3 66.7Urban 14 92.9 71.4 35.7 14 100.0 100.0 78.6Govt. 70 84.3 54.3 38.6 43 95.3 88.4 72.1Private 4 50.0 25.0 0.0 1 100.0 100.0 0.0
Gujarat
Total 26 92.3 96.2 50.0 16 100.0 93.8 68.8Rural 20 90.0 100.0 55.0 10 100.0 90.0 60.0Urban 6 100.0 83.3 33.3 6 100.0 100.0 83.3Govt. 26 92.3 96.2 50.0 15 100.0 93.3 66.7Private 0 0.0 0.0 0.0 1 100.0 100.0 100.0
Haryana
Total 25 72.0 88.0 68.0 17 88.2 82.4 70.6Rural 19 63.2 84.2 63.2 11 81.8 72.7 54.5Urban 6 100.0 100.0 83.3 6 100.0 100.0 100.0Govt. 24 70.8 87.5 66.7 13 84.6 76.9 61.5Private 1 100.0 100.0 100.0 4 100.0 100.0 100.0
Jammu & Kashmir
Total 57 47.4 29.8 19.3 55 61.8 45.5 30.9Rural 46 41.3 17.4 13.0 42 52.4 38.1 23.8Urban 11 72.7 81.8 45.5 13 92.3 69.2 53.8Govt. 52 42.3 25.0 15.4 45 55.6 33.3 17.8 OJg
O h

Private 5 100.0 80.0 60.0 10 90.0 100.0 90.0
Jharkhand
Total 46 78.3 78.3 58.7 26 92.3 84.6 65.4Rural 40 80.0 77.5 60.0 20 90.0 85.0 70.0Urban 6 66.7 83.3 50.0 6 100.0 83.3 50.0Govt. 42 78.6 78.6 59.5 22 90.9 81.8 68.2Private 4 75.0 75.0 50.0 4 100.0 100.0 50.0
Karnataka
Total 18 94.4 88.9 77.8 37 100.0 100.0 97.3Rural 10 100.0 100.0 90.0 26 100.0 100.0 96.2Urban 8 87.5 75.0 62.5 11 100.0 100.0 100.0Govt. 13 100.0 92.3 84.6 21 100.0 100.0 95.2Private 5 80.0 80.0 60.0 16 100.0 100.0 100.0
Table A3.15 (Contd.): Availability of Drinking Water and Toilet Facilities in Schools
State Area
Total No. of primar
yschools
% of primary schools having Total No. of upper
primary schools
% of upper primary schools having
Drinkin g Water
FunctionalToilet
s
Separate functional toilet for
girls
Drinkin g Water
Functional
Toilets
Separate functional toilet for
girls(1) (2) (3) (4) (5) (6) (7) (8) (9) (10)
Kerala
Total 101 95.0 97.0 65.3 67 100.0 98.5 95.5Rural 76 97.4 97.4 71.1 44 100.0 100.0 93.2Urban 25 88.0 96.0 48.0 23 100.0 95.7 100.0Govt. 34 97.1 97.1 79.4 21 100.0 100.0 100.0Private 67 94.0 97.0 58.2 46 100.0 97.8 93.5
MadhyaPradesh
Total 24 83.3 62.5 62.5 14 92.9 71.4 57.1Rural 20 80.0 55.0 55.0 10 90.0 70.0 50.0Urban 4 100.0 100.0 100.0 4 100.0 75.0 75.0Govt. 24 83.3 62.5 62.5 11 90.9 72.7 54.5Private 0 0.0 0.0 0.0 3 100.0 66.7 66.7
Rajasthan
Total 24 70.8 66.7 62.5 14 92.9 85.7 64.3Rural 20 65.0 65.0 60.0 10 90.0 90.0 60.0Urban 4 100.0 75.0 75.0 4 100.0 75.0 75.0Govt. 22 68.2 72.7 68.2 13 92.3 84.6 69.2Private 2 100.0 0.0 0.0 1 100.0 100.0 0.0
UttarPradesh
Total 130 90.8 90.8 83.1 76 88.2 88.2 78.9Rural 98 91.8 92.9 86.7 52 84.6 84.6 78.8Urban 32 87.5 84.4 71.9 24 95.8 95.8 79.2Govt. 102 88.2 89.2 80.4 56 83.9 87.5 76.8Private 28 100.0 96.4 92.9 20 100.0 90.0 85.0

Uttarakhand
Total 27 96.3 92.6 70.4 14 92.9 100.0 92.9Rural 19 94.7 94.7 73.7 10 90.0 100.0 90.0Urban 8 100.0 87.5 62.5 4 100.0 100.0 100.0Govt. 18 94.4 94.4 77.8 5 80.0 100.0 80.0Private 9 100.0 88.9 55.6 9 100.0 100.0 100.0
Total
Total 628 81.5 74.5 57.8 426 86.9 81.9 69.2Rural 488 79.5 71.9 58.0 295 82.7 78.6 65.4Urban 140 88.6 83.6 57.1 131 96.2 89.3 77.9Govt. 500 78.6 70.8 56.8 306 83.3 77.5 62.7Private 128 93.0 89.1 61.7 120 95.8 93.3 85.8
Table A3.16: Number of Primary Schools having Electricity, Library Books and Sports material Facilities
StateArea/Manage-ment
Total No. of primar
yschools
Electricity %schoolshavingelectri
city(DISEdata)
Library Books Sports Material
Available
Irre-gula
r
Notavailable
Avail-able
Availablebut
mostlynot
used
Notavail-
able
Avail-able
Availablebut
mostlynot
used
Notavailable
(1) (2) (3) (4) (5) (6) (7) (8) (9) (10) (11) (12) (13)
Assam
Total 76 18.4 26.3 55.3 5.74 22.4 26.3 51.3 22.4 26.3 51.3Rural 60 6.7 28.3 65.0 21.7 25.0 53.3 18.3 30.0 51.7Urban 16 62.5 18.8 18.8 25.0 31.3 43.8 37.5 12.5 50.0Govt. 73 19.2 26.0 54.8 23.3 26.0 50.7 23.3 26.0 50.7Private 3 0.0 33.3 66.7 0.0 33.3 66.7 0.0 33.3 66.7
Bihar
Total 74 5.4 33.8 60.8 2.76 63.5 27.0 9.5 44.6 29.7 25.7Rural 60 5.0 40.0 55.0 60.0 30.0 10.0 48.3 28.3 23.3Urban 14 7.1 7.1 85.7 78.6 14.3 7.1 28.6 35.7 35.7Govt. 70 5.7 32.9 61.4 64.3 25.7 10.0 45.7 27.1 27.1Private 4 0.0 50.0 50.0 50.0 50.0 0.0 25.0 75.0 0.0
Gujarat
Total 26 100.0 0.0 0.0 97.58 76.9 15.4 7.7 38.5 26.9 34.6Rural 20 100.0 0.0 0.0 75.0 20.0 5.0 45.0 20.0 35.0Urban 6 100.0 0.0 0.0 83.3 0.0 16.7 16.7 50.0 33.3Govt. 26 100.0 0.0 0.0 76.9 15.4 7.7 38.5 26.9 34.6Private 0 - - - - - - - - -
Haryana
Total 25 68.0 28.0 4.0 96.56 60.0 12.0 28.0 68.0 4.0 28.0-Rural 19 57.9 36.8 5.3 52.6 15.8 31.6 57.9 5.3 36.8:Urban 6 100.0 0.0 0.0 83.3 0.0 16.7 100.0 0.0 0.0rGovt. 24 66.7 29.2 4.2 58.3 12.5 29.2 66.7 4.2 29.2

Private 1 100.0 0.0 0.0 100.0 0.0 0.0 100.0 0.0 0.0
Jammu&Kashmir
Total 57 14.0 33.3 52.6 8.64 14.0 26.3 59.6 24.6 17.5 57.9Rural 46 4.3 37.0 58.7 10.9 30.4 58.7 17.4 21.7 60.9Urban 11 54.5 18.2 27.3 27.3 9.1 63.6 54.5 0.0 45.5Govt. 52 9.6 34.6 55.8 7.7 28.8 63.5 19.2 19.2 61.5Private 5 60.0 20.0 20.0 80.0 0.0 20.0 80.0 0.0 20.0
Jharkhand
Total 46 8.7 23.9 67.4 4.44 41.3 34.8 23.9 60.9 23.9 15.2Rural 40 2.5 22.5 75.0 37.5 37.5 25.0 57.5 25.0 17.5Urban 6 50.0 33.3 16.7 66.7 16.7 16.7 83.3 16.7 0.0Govt. 42 2.4 23.8 73.8 40.5 35.7 23.8 59.5 23.8 16.7Private 4 75.0 25.0 0.0 50.0 25.0 25.0 75.0 25.0 0.0
Karnataka
Total 18 94.4 0.0 5.6 93.07 88.9 0.0 11.1 77.8 0.0 22.2Rural 10 100.0 0.0 0.0 90.0 0.0 10.0 90.0 0.0 10.0Urban 8 87.5 0.0 12.5 87.5 0.0 12.5 62.5 0.0 37.5Govt. 13 100.0 0.0 0.0 100.0 0.0 0.0 76.9 0.0 23.1Private 5 80.0 0.0 20.0 60.0 0.0 40.0 80.0 0.0 20.0
Table A3.16 (Contd.): Number of Primary Schools having Electricity, Library Booksand Sports material Facilities
StateArea/Manage-ment
Total No. of primar
yschools
Electricity %schoolshavingelectri
city
Library Books Sports Material
Available
Irre-gula
r
Notavailable
Avail-able
Availablebut
mostlynot
used
Notavailable
Available
Availablebut
mostlynot
used
Notavailable
(1) (2) (3) (4) (5) (6) (7) (8) (9) (10) (11) (12) (13)
Kerala
Total 101 92.1 6.9 1.0 85.66 94.1 4.0 2.0 49.5 8.9 41.6Rural 76 92.1 7.9 0.0 94.7 2.6 2.6 50.0 7.9 42.1Urban 25 92.0 4.0 4.0 92.0 8.0 0.0 48.0 12.0 40.0Govt. 34 97.1 2.9 0.0 94.1 2.9 2.9 44.1 8.8 47.1Private 67 89.6 9.0 1.5 94.0 4.5 1.5 52.2 9.0 38.8
MadhyaPradesh
Total 24 25.0 12.5 62.5 10.62 37.5 33.3 29.2 20.8 37.5 41.7Rural 20 10.0 15.0 75.0 40.0 30.0 30.0 20.0 30.0 50.0Urban 4 100.0 0.0 0.0 25.0 50.0 25.0 25.0 75.0 0.0Govt. 24 25.0 12.5 62.5 37.5 33.3 29.2 20.8 37.5 41.7Private 0 - - - - - - - - -
Rajasthan
Total 24 16.7 0.0 83.3 15.54 12.5 16.7 70.8 29.2 16.7 54.2Rural 20 10.0 0.0 90.0 10.0 15.0 75.0 20.0 15.0 65.0Urban 4 50.0 0.0 50.0 25.0 25.0 50.0 75.0 25.0 0.0Govt. 22 9.1 0.0 90.9 13.6 18.2 68.2 27.3 18.2 54 5jPrivate 2 100.0 0.0 0.0 0.0 0.0 100.0 50.0 0.0 50^gj
Uttar Total 130 37.7 19.2 43.1 32.28 75.4 7.7 16.9 62.3 3.8 33.8 Sj--------- rc

Pradesh
Rural 98 31.6 22.4 45.9 79.6 7.1 13.3 63.3 3.1 33.7Urban 32 56.3 9.4 34.4 62.5 9.4 28.1 59.4 6.3 34.4Govt. 102 29.4 22.5 48.0 78.4 8.8 12.7 57.8 4.9 37.3Private 28 67.9 7.1 25.0 64.3 3.6 32.1 78.6 0.0 21.4
Uttarakhand
Total 27 74.1 0.0 25.9 43.55 55.6 0.0 44.4 55.6 3.7 40.7Rural 19 73.7 0.0 26.3 57.9 0.0 42.1 57.9 5.3 36.8Urban 8 75.0 0.0 25.0 50.0 0.0 50.0 50.0 0.0 50.0Govt. 18 83.3 0.0 16.7 61.1 0.0 38.9 55.6 5.6 38.9Private 9 55.6 0.0 44.4 44.4 0.0 55.6 55.6 0.0 44.4
Total
Total 628 41.7 18.6 39.6 NA 57.6 16.6 25.8 46.3 15.8 37.9Rural 488 34.8 21.5 43.6 56.1 17.8 26.0 44.9 16.2 38.9Urban 140 65.7 8.6 25.7 62.9 12.1 25.0 51.4 14.3 34.3Govt. 500 33.0 20.8 46.2 53.0 19.2 27.8 43.0 17.6 39.4Private 128 75.8 10.2 14.1 75.8 6.3 18.0 59.4 8.6 32.0
Table A3.17: Number of Upper Primary Schools having Electricity, Library Booksand Sports material Facilities
StateArea/Manage-ment
Total No. of upper primar
yschools
E ectricity Li brary Boo cs Sports Material
Available
Irregular
Notavailable
Avail-able
Availablebut
mostlynot
used
Notavailable
Avail-able
Availablebut
mostlynot
used
Notavailable
(1) (2) (3) (4) (5) (6) (7) (8) (9) (10) (11) (12)
Assam
Total 46 32.6 21.7 45.7 30.4 17.4 52.2 43.5 15.2 41.3Rural 30 26.7 20.0 53.3 20.0 13.3 66.7 43.3 13.3 43.3Urban 16 43.8 25.0 31.3 50.0 25.0 25.0 43.8 18.8 37.5Govt. 41 36.6 19.5 43.9 34.1 12.2 53.7 41.5 14.6 43.9Private 5 0.0 40.0 60.0 0.0 60.0 40.0 60.0 20.0 20.0
Bihar
Total 44 13.6 29.5 56.8 65.9 22.7 11.4 68.2 18.2 13.6Rural 30 10.0 26.7 63.3 56.7 26.7 16.7 66.7 20.0 13.3Urban 14 21.4 35.7 42.9 85.7 14.3 0.0 71.4 14.3 14.3Govt. 43 14.0 30.2 55.8 65.1 23.3 11.6 67.4 18.6 14.0Private 1 0.0 0.0 100.0 100.0 0.0 0.0 100.0 0.0 0.0
Gujarat
Total 16 100.0 0.0 0.0 87.5 6.3 6.3 31.3 31.3 37.5Rural 10 100.0 0.0 0.0 90.0 10.0 0.0 30.0 30.0 40.0Urban 6 100.0 0.0 0.0 83.3 0.0 16.7 33.3 33.3 33.3Govt. 15 100.0 0.0 0.0 93.3 6.7 0.0 33.3 33.3 33.3Private 1 100.0 0.0 0.0 0.0 0.0 100.0 0.0 0.0 100.0
HaryanaTotal 17 47.1 47.1 5.9 82.4 11.8 5.9 70.6 11.8 17.6Rural 11 18.2 72.7 9.1 81.8 18.2 0.0 63.6 18.2 18.2
LO
OJegO h

Urban 6 100.0 0.0 0.0 83.3 0.0 16.7 83.3 0.0 16.7Govt. 13 30.8 61.5 7.7 84.6 15.4 0.0 76.9 15.4 7.7Private 4 100.0 0.0 0.0 75.0 0.0 25.0 50.0 0.0 50.0
Jammu & Kashmir
Total 55 23.6 25.5 50.9 40.0 25.5 34.5 54.5 14.5 30.9Rural 42 14.3 28.6 57.1 38.1 28.6 33.3 45.2 16.7 38.1Urban 13 53.8 15.4 30.8 46.2 15.4 38.5 84.6 7.7 7.7Govt. 45 11.1 26.7 62.2 31.1 28.9 40.0 44.4 17.8 37.8Private 10 80.0 20.0 0.0 80.0 10.0 10.0 100.0 0.0 0.0
Jharkhand
Total 26 23.1 15.4 61.5 69.2 23.1 7.7 84.6 7.7 7.7Rural 20 10.0 20.0 70.0 65.0 30.0 5.0 85.0 5.0 10.0Urban 6 66.7 0.0 33.3 83.3 0.0 16.7 83.3 16.7 0.0Govt. 22 9.1 18.2 72.7 68.2 27.3 4.5 86.4 4.5 9.1Private 4 100.0 0.0 0.0 75.0 0.0 25.0 75.0 25.0 .0
Karnataka
Total 37 97.3 0.0 2.7 100.0 0.0 0.0 97.3 0.0 2.7Rural 26 96.2 0.0 3.8 100.0 0.0 0.0 96.2 0.0 3.8Urban 11 100.0 0.0 0.0 100.0 0.0 0.0 100.0 0.0 0.0Govt. 21 100.0 0.0 0.0 100.0 0.0 0.0 95.2 0.0 4.8Private 16 93.8 0.0 6.3 100.0 0.0 0.0 100.0 0.0 0.0
Table A3.17(Contd.): Number of Upper Primary Schools having Electricity, Library Booksand Sports material Facilities
StateArea/Manage-ment
Total No. of upper primar
yschools
Electricity Library Books Sports Material
Available
Irregular
Notavailable
Avail-able
Availablebut
mostlynot
used
Notavailable
Avail-able
Availablebut
mostlynot
used
Notavailable
(1) (2) (3) (4) (5) (6) (7) (8) (9) (10) (11) (12)
Kerala
Total 67 98.5 1.5 0.0 97.0 3.0 0.0 83.6 6.0 10.4Rural 44 97.7 2.3 0.0 95.5 4.5 0.0 79.5 6.8 13.6Urban 23 100.0 0.0 0.0 100.0 0.0 0.0 91.3 4.3 4.3Govt. 21 100.0 0.0 0.0 100.0 0.0 0.0 76.2 9.5 14.3Private 46 97.8 2.2 0.0 95.7 4.3 0.0 87.0 4.3 8.7
MadhyaPradesh
Total 14 35.7 14.3 50.0 42.9 35.7 21.4 21.4 35.7 42.9Rural 10 20.0 20.0 60.0 50.0 30.0 20.0 20.0 40.0 40.0Urban 4 75.0 .0 25.0 25.0 50.0 25.0 25.0 25.0 50.0Govt. 11 18.2 18.2 63.6 36.4 45.5 18.2 9.1 45.5 45.5Private 3 100.0 0.0 0.0 66.7 0.0 33.3 66.7 0.0 33.3
Rajasthan
Total 14 42.9 14.3 42.9 35.7 28.6 35.7 28.6 50.0 21.4Rural 10 20.0 20.0 60.0 30.0 30.0 40.0 40.0 60.0 0.0Urban 4 100.0 0.0 0.0 50.0 25.0 25.0 0.0 25.0 75.0

Govt. 13 38.5 15.4 46.2 38.5 30.8 30.8 30.8 53.8 15.4Private 1 100.0 0.0 0.0 0.0 0.0 100.0 0.0 0.0 100.0
UttarPradesh
Total 76 43.4 21.1 35.5 72.4 9.2 18.4 60.5 6.6 32.9Rural 52 34.6 28.8 36.5 73.1 7.7 19.2 63.5 5.8 30.8Urban 24 62.5 4.2 33.3 70.8 12.5 16.7 54.2 8.3 37.5Govt. 56 39.3 17.9 42.9 71.4 10.7 17.9 55.4 8.9 35.7Private 20 55.0 30.0 15.0 75.0 5.0 20.0 75.0 0.0 25.0
Uttarakhand
Total 14 92.9 0.0 7.1 64.3 0.0 35.7 64.3 0.0 35.7Rural 10 90.0 0.0 10.0 50.0 0.0 50.0 60.0 0.0 40.0Urban 4 100.0 0.0 0.0 100.0 0.0 0.0 75.0 0.0 25.0Govt. 5 80.0 0.0 20.0 60.0 0.0 40.0 60.0 0.0 40.0Private 9 100.0 0.0 0.0 66.7 0.0 33.3 66.7 0.0 33.3
Total
Total 426 52.3 16.4 31.2 67.6 13.8 18.5 64.1 12.4 23.5Rural 295 44.1 19.7 36.3 64.1 15.3 20.7 62.4 13.2 24.4Urban 131 71.0 9.2 19.8 75.6 10.7 13.7 67.9 10.7 21.4Govt. 306 39.9 19.3 40.8 62.1 17.0 20.9 57.2 16.0 26.8Private 120 84.2 9.2 6.7 81.7 5.8 12.5 81.7 3.3 15.0
Appendix - Chapter 4
Table A4.1: Number of Teachers in Sampled Schools (Rural)
State Category of TeachersNumber of Teachers in Primary
SchoolsNumber of Teachers in Schools
with Upper Primary ClassesTotal Muslim Total Muslim
Total Female Total Female Total Female Total Female
AssamTotal 155 34 114 22 183 49 106 20Regular 130 22 98 15 166 43 92 17Contract & Community Paid 25 12 16 7 17 6 14 3
BiharTotal 264 117 126 51 227 84 127 48Regular 74 23 38 9 106 21 69 8Contract & Community Paid 190 94 88 42 121 63 58 40
GujaratTotal 89 51 53 31 83 41 41 17Regular 88 50 53 31 77 38 38 16Contract & Community Paid 1 1 0 0 6 3 3 1
HaryanaTotal 106 4 32 0 77 10 23 2Regular 78 2 29 0 49 4 18 0Contract & Community Paid 28 2 3 0 28 6 5 2
Jammu & Kashmir
Total 116 31 82 20 226 86 135 39Regular 56 14 36 8 161 59 84 21Contract & Community Paid 60 17 46 12 65 27 51 18
JharkhandTotal 133 28 83 12 116 37 37 8Regular 32 7 18 2 55 16 15 3Contract & Community Paid 101 21 65 10 61 21 22 5
OJgO h

KarnatakaTotal 35 28 6 5 196 153 21 17Regular 34 27 6 5 191 149 20 16Contract & Community Paid 1 1 0 0 5 4 1 1
KeralaTotal 491 333 164 91 798 493 161 47Regular 490 332 163 90 786 482 160 47Contract & Community Paid 1 1 1 1 12 11 1 0
MadhyaPradesh
Total 58 24 9 6 40 24 14 6Regular 50 22 8 5 39 23 14 6Contract & Community Paid 8 2 1 1 1 1 0 0
RajasthanTotal 34 5 13 0 36 5 4 0Regular 20 5 3 0 34 5 4 0Contract & Community Paid 14 0 10 0 2 0 0 0
UttarPradesh
Total 405 210 119 50 195 89 63 23Regular 212 116 54 28 164 72 50 18Contract & Community Paid 193 94 65 22 31 17 13 5
Uttarakhand
Total 111 65 37 22 95 56 33 13Regular 86 55 13 6 43 34 4 3Contract & Community Paid 25 10 24 16 52 22 29 10
TotalTotal 1997 930 838 310 2272 1127 765 240Regular 1350 675 519 199 1871 946 568 155Contract & Community 647 255 319 111 401 181 197 85
Table A4.2: Number of Teachers in Sampled Schools (Urban)
State Category of TeachersNumber of Teachers in Primary
SchoolsNumber of Teachers in Schools
with Upper Primary ClassesTotal Muslim Total Muslim
Total Female Total Female Total Female Total Female
AssamTotal 97 62 27 14 147 61 52 17Regular 83 56 16 11 140 57 52 17Contract & Community Paid 14 6 11 3 7 4 0 0
BiharTotal 79 54 36 24 178 125 55 33Regular 50 34 23 15 124 88 44 26Contract & Community Paid 29 20 13 9 54 37 11 7
GujaratTotal 35 21 18 10 59 36 27 18Regular 35 21 18 10 55 34 25 17Contract & Community Paid 0 0 0 0 4 2 2 1
HaryanaTotal 35 26 2 1 86 31 53 20Regular 21 17 2 1 60 26 37 17Contract & Community Paid 14 9 0 0 26 5 16 3
Jammu & Kashmir
Total 76 58 27 24 165 119 108 71Regular 74 57 25 23 97 76 64 48Contract & Community Paid 2 1 2 1 68 43 44 23
JharkhandTotal 41 31 12 7 80 64 16 15Regular 13 10 6 4 35 26 4 4Contract & Community Paid 28 21 6 3 45 38 12 11

KarnatakaTotal 27 25 5 5 112 95 5 3Regular 26 24 5 5 103 87 5 3Contract & Community Paid 1 1 0 0 9 8 0 0
KeralaTotal 178 124 62 37 431 312 54 42Regular 177 123 62 37 431 312 54 42Contract & Community Paid 1 1 0 0 0 0 0 0
MadhyaPradesh
Total 30 18 4 4 36 26 7 5Regular 30 18 4 4 27 19 7 5Contract & Community Paid 0 0 0 0 9 7 0 0
RajasthanTotal 8 4 1 0 25 5 5 0Regular 8 4 1 0 21 5 3 0Contract & Community Paid 0 0 0 0 4 0 2 0
UttarPradesh
Total 165 115 52 29 138 69 54 32Regular 103 66 32 14 133 66 53 31Contract & Community Paid 62 49 20 15 5 3 1 1
Uttarakhand
Total 20 14 6 4 21 17 6 6Regular 9 7 4 4 14 13 5 5Contract & Community Paid 11 7 2 0 7 4 1 1
TotalTotal 791 552 252 159 1478 960 442 262Regular 629 437 198 128 1240 809 353 215Contract & Community 162 115 54 31 238 151 89 47
Table A4.3: Number of Teachers in Sampled Schools (Government)
State Category of TeachersNumber of Teachers in Primary
SchoolsNumber of Teachers in Schools
with Upper Primary ClassesTotal Muslim Total Muslim
Total Female Total Female Total Female Total Female
AssamTotal 243 90 135 33 291 92 139 30Regular 208 75 111 25 267 82 125 27Contract & Community Paid 35 15 24 8 24 10 14 3
BiharTotal 328 159 157 72 390 203 175 80Regular 110 46 56 21 219 105 108 34Contract & Community Paid 218 113 101 51 171 98 67 46
GujaratTotal 124 72 71 41 139 76 68 35Regular 123 71 71 41 129 71 63 33Contract & Community Paid 1 1 0 0 10 5 5 2
HaryanaTotal 133 22 34 1 101 16 32 3Regular 91 11 31 1 59 8 21 0Contract & Community Paid 42 11 3 0 42 8 11 3
Jammu & Kashmir
Total 126 52 92 38 248 118 160 74Regular 83 41 56 28 195 92 117 54Contract & Community Paid 43 11 36 10 53 26 43 20
JharkhandTotal 141 33 89 16 127 45 38 9Regular 40 12 24 6 66 24 16 4Contract & Community Paid 101 21 65 10 61 21 22 5

KarnatakaTotal 38 30 6 5 137 101 5 2Regular 37 29 6 5 135 100 5 2Contract & Community Paid 1 1 0 0 2 1 0 0
KeralaTotal 205 133 75 46 329 197 59 25Regular 204 132 74 45 327 195 59 25Contract & Community Paid 1 1 1 1 2 2 0 0
MadhyaPradesh
Total 88 42 13 10 43 25 8 4Regular 80 40 12 9 40 23 8 4Contract & Community Paid 8 2 1 1 3 2 0 0
RajasthanTotal 38 9 12 0 54 10 4 0Regular 27 9 3 0 52 10 4 0Contract & Community Paid 11 0 9 0 2 0 0 0
UttarPradesh
Total 403 226 104 45 168 81 57 22Regular 236 138 52 27 163 78 55 21Contract & Community Paid 167 88 52 18 5 3 2 1
Uttarakhand
Total 74 43 22 16 38 12 29 4Regular 60 38 13 9 13 12 5 4Contract & Community Paid 14 5 9 7 25 0 24 0
TotalTotal 1941 911 810 323 2065 976 774 288Regular 1299 642 509 217 1665 800 586 208Contract & Community 642 269 301 106 400 176 188 80
Table A4.4: Number of Teachers in Sampled Schools (Private)
State Category of TeachersNumber of Teachers in Primary
SchoolsNumber of Teachers in Schools
with Upper Primary ClassesTotal Muslim Total Muslim
Total Female Total Female Total Female Total Female
AssamTotal 9 6 6 3 39 18 19 7Regular 5 3 3 1 39 18 19 7Contract & Community Paid 4 3 3 2 0 0 0 0
BiharTotal 15 12 5 3 15 6 7 1Regular 14 11 5 3 11 4 5 0Contract & Community Paid 1 1 0 0 4 2 2 1
GujaratTotal 3 1 0 0Regular 3 1 0 0Contract & Community Paid 0 0 0 0
HaryanaTotal 8 8 0 0 62 25 44 19Regular 8 8 0 0 50 22 34 17Contract & Community Paid 0 0 0 0 12 3 10 2
Jammu & Kashmir
Total 66 37 17 6 143 87 83 36Regular 47 30 5 3 63 43 31 15Contract & Community Paid 19 7 12 3 80 44 52 21
JharkhandTotal 33 26 6 3 69 56 15 14Regular 5 5 0 0 24 18 3 3Contract & Community Paid 28 21 6 3 45 38 12 11

KarnatakaTotal 24 23 5 5 171 147 21 18Regular 23 22 5 5 159 136 20 17Contract & Community Paid 1 1 0 0 12 11 1 1
KeralaTotal 464 324 151 82 900 608 156 64Regular 463 323 151 82 890 599 155 64Contract & Community Paid 1 1 0 0 10 9 1 0
MadhyaPradesh
Total 33 25 13 7Regular 26 19 13 7Contract & Community Paid 7 6 0 0
RajasthanTotal 4 0 2 0 7 0 5 0Regular 1 0 1 0 3 0 3 0Contract & Community Paid 3 0 1 0 4 0 2 0
UttarPradesh
Total 167 99 67 34 165 77 60 33Regular 79 44 34 15 134 60 48 28Contract & Community Paid 88 55 33 19 31 17 12 5
Uttarakhand
Total 57 36 21 10 78 61 10 15Regular 35 24 4 1 44 35 4 4Contract & Community Paid 22 12 17 9 34 26 6 11
TotalTotal 847 571 280 146 1685 1111 433 214Regular 680 470 208 110 1446 955 335 162Contract & Community 167 101 72 36 239 156 98 52
Table A4.5: Number of Teachers in all Sampled Schools
State Category of TeachersNumber of Teachers in Primary
SchoolsNumber of Teachers in Schools
with Upper Primary ClassesTotal Muslim Total Muslim
Total Female Total Female Total Female Total Female
AssamTotal 252 96 141 36 330 110 158 37Regular 213 78 114 26 306 100 144 34Contract & Community Paid 39 18 27 10 24 10 14 3
BiharTotal 343 171 162 75 405 209 182 81Regular 124 57 61 24 230 109 113 34Contract & Community Paid 219 114 101 51 175 100 69 47
GujaratTotal 124 72 71 41 142 77 68 35Regular 123 71 71 41 132 72 63 33Contract & Community Paid 1 1 0 0 10 5 5 2
HaryanaTotal 141 30 34 1 163 41 76 22Regular 99 19 31 1 109 30 55 17Contract & Community Paid 42 11 3 0 54 11 21 5
Jammu & Kashmir
Total 192 89 109 44 391 205 243 110Regular 130 71 61 31 258 135 148 69Contract & Community Paid 62 18 48 13 133 70 95 41
JharkhandTotal 174 59 95 19 196 101 53 23Regular 45 17 24 6 90 42 19 7Contract & Community Paid 129 42 71 13 106 59 34 16

KarnatakaTotal 62 53 11 10 308 248 26 20Regular 60 51 11 10 294 236 25 19Contract & Community Paid 2 2 0 0 14 12 1 1
KeralaTotal 669 457 226 128 1229 805 215 89Regular 667 455 225 127 1217 794 214 89Contract & Community Paid 2 2 1 1 12 11 1 0
MadhyaPradesh
Total 88 42 13 10 76 50 21 11Regular 80 40 12 9 66 42 21 11Contract & Community Paid 8 2 1 1 10 8 0 0
RajasthanTotal 42 9 14 0 61 10 9 0Regular 28 9 4 0 55 10 7 0Contract & Community Paid 14 0 10 0 6 0 2 0
UttarPradesh
Total 570 325 171 79 333 158 117 55Regular 315 182 86 42 297 138 103 49Contract & Community Paid 255 143 85 37 36 20 14 6
Uttarakhand
Total 131 79 43 26 116 73 39 19Regular 95 62 17 10 57 47 9 8Contract & Community Paid 36 17 26 16 59 26 30 11
TotalTotal 2788 1482 1090 469 3750 2087 1207 502Regular 1979 1112 717 327 3111 1755 921 370Contract & Community 809 370 373 142 639 332 286 132
Table A4.6: Educational Qualification of Teachers
Area: Rural
State EducationalQualification
No. of Teachers in Primary Schools No. of Teachers in Schools with Upper Primary Classes
Muslim Non-Muslim
Total Muslim Non-Muslim
TotalNumber % Number %
Assam
Total 114 41 155 100.0 106 77 183 100.0Secondary 37 23 60 38.7 8 6 14 7.7Hr. Secondary 57 14 71 45.8 44 34 78 42.6Graduate & 20 4 24 15.5 53 37 90 49.2Others 0 0 0 0.0 1 0 1 0.5
Bihar
Total 126 138 264 100.0 127 100 227 100.0Secondary 19 27 46 17.4 19 13 32 14.1Hr. Secondary 81 77 158 59.8 66 41 107 47.1Graduate & 26 34 60 22.7 42 46 88 38.8Othees 0 0 0 0.0 0 0 0 0.0
Gujarat
Total 53 36 89 100.0 41 42 83 100.0Secondary 43 19 62 69.7 32 16 48 57.8Hr. Secondary 10 8 18 20.2 3 7 10 12.0Graduate & 0 9 9 10.1 6 19 25 30.1Othees 0 0 0 0.0 0 0 0 0.0
Haryana Total 32 74 106 100.0 23 54 77 100.0Secondary 0 0 0 0.0 0 1 1 1.3
CNOCNOJg
O h

Hr. Secondary 4 4 8 7.5 2 1 3 3.9Graduate & 27 70 97 91.5 21 52 73 94.8Others 1 0 1 0.9 0 0 0 0.0
Jammu & Kashmir
Total 82 34 116 100.0 135 91 226 100.0Secondary 5 2 7 6.0 13 5 18 8.0Hr. Secondary 50 16 66 56.9 70 23 93 41.2Graduate & 27 16 43 37.1 52 63 115 50.9Othees 0 0 0 0.0 0 0 0 0.0
Jharkhand
Total 83 50 133 100.0 37 79 116 100.0Secondary 6 8 14 10.5 3 17 20 17.2Hr. Secondary 34 15 49 36.8 9 11 20 17.2Graduate & 41 27 68 51.1 25 51 76 65.5Othees 2 0 2 1.5 0 0 0 0.0
Karnataka
Total 6 29 35 100.0 21 175 196 100.0Secondary 3 11 14 40.0 7 19 26 13.3Hr. Secondary 0 13 13 37.1 8 95 103 52.6Graduate & 3 5 8 22.9 6 61 67 34.2Othees 0 0 0 0.0 0 0 0 0.0
Area: Rural
Table A4.6 (Contd.): Educational Qualification of Teachers
State EducationalQualification
No. of Teachers in Primary Schools No. of Teachers in Schools with Upper Primary Classes
Muslim Non-Muslim
Total Muslim Non-Muslim
TotalNumber % Number %
Kerala
Total 164 327 491 100.0 161 637 798 100.0Secondary 65 70 135 27.5 60 147 207 25.9Hr. Secondary 62 152 214 43.6 43 175 218 27.3Graduate & 34 105 139 28.3 54 297 351 44.0Othees 3 0 3 0.6 4 18 22 2.8
MadhyaPradesh
Total 9 49 58 100.0 14 26 40 100.0Secondary 0 0 0 0.0 0 0 0 0.0Hr. Secondary 3 16 19 32.8 2 0 2 5.0Graduate & 6 33 39 67.2 12 26 38 95.0Othees 0 0 0 0.0 0 0 0 0.0
Rajasthan
Total 13 21 34 100.0 4 32 36 100.0Secondary 5 0 5 14.7 0 0 0 0.0Hr. Secondary 6 7 13 38.2 1 5 6 16.7Graduate & 2 14 16 47.1 3 27 30 83.3Othees 0 0 0 0.0 0 0 0 0.0
c noCNOJg
O h

UttarPradesh
Total 119 286 405 100.0 63 132 195 100.0Secondary 9 8 17 4.2 1 3 4 2.1Hr. Secondary 16 35 51 12.6 9 12 21 10.8Graduate & 94 243 337 83.2 53 117 170 87.2Others 0 0 0 0.0 0 0 0 0.0
Uttarakhand
Total 37 74 111 100.0 33 62 95 100.0Secondary 0 0 0 0.0 3 0 3 3.2Hr. Secondary 17 3 20 18.0 2 7 9 9.5Graduate & 20 71 91 82.0 12 55 67 70.5Othees 0 0 0 0.0 16 0 16 16.8
Total
Total 838 1159 1997 100.0 765 1507 2272 100.0Secondary 192 168 360 18.0 146 227 373 16.4Hr. Secondary 340 360 700 35.1 259 411 670 29.5Graduate & 300 631 931 46.6 339 851 1190 52.4Others 6 0 6 0.3 21 18 39 1.7
Area: Urban
Table A4.7: Educational Qualification of Teachers
State EducationalQualification
No. of Teachers in Primary Schools No. of Teachers in Schools with Upper Primary Classes
Muslim Non-Muslim
Total Muslim Non-Muslim
TotalNumber % Number %
Assam
Total 27 70 97 100.0 52 95 147 100.0Secondary 1 42 43 44.3 6 7 13 8.8Hr. Secondary 19 21 40 41.2 22 22 44 29.9Graduate & 7 7 14 14.4 24 66 90 61.2Othees 0 0 0 0.0 0 0 0 0.0
Bihar
Total 36 43 79 100.0 55 123 178 100.0Secondary 10 14 24 30.4 5 31 36 20.2Hr. Secondary 17 15 32 40.5 38 45 83 46.6Graduate & 9 14 23 29.1 12 47 59 33.1Othees 0 0 0 0.0 0 0 0 0.0
Gujarat
Total 18 17 35 100.0 27 32 59 100.0Secondary 14 15 29 82.9 19 15 34 57.6Hr. Secondary 2 1 3 8.6 4 2 6 10.2Graduate & 2 1 3 8.6 4 15 19 32.2Othees 0 0 0 0.0 0 0 0 0.0
Haryana Total 2 33 35 100.0 53 33 86 100.0
oCNOJeg
O h

Secondary 0 1 1 2.9 0 0 0 0.0Hr. Secondary 0 10 10 28.6 0 0 0 0.0Graduate & 2 22 24 68.6 53 33 86 100.0Othees 0 0 0 0.0 0 0 0 0.0
Jammu & Kashmir
Total 27 49 76 100.0 108 57 165 100.0Secondary 7 1 8 10.5 10 2 12 7.3Hr. Secondary 2 0 2 2.6 28 16 44 26.7Graduate & 16 47 63 82.9 68 38 106 64.2Othees 2 1 3 3.9 2 1 3 1.8
Jharkhand
Total 12 29 41 100.0 16 64 80 100.0Secondary 0 0 0 0.0 11 2 13 16.3Hr. Secondary 4 18 22 53.7 1 17 18 22.5Graduate & 8 11 19 46.3 4 45 49 61.3Othees 0 0 0 0.0 0 0 0 0.0
Karnataka
Total 5 22 27 100.0 5 107 112 100.0Secondary 0 8 8 29.6 0 36 36 32.1Hr. Secondary 2 8 10 37.0 4 37 41 36.6Graduate & 3 6 9 33.3 1 34 35 31.3Othees 0 0 0 0.0 0 0 0 0.0
Area: Urban
Table A4.7 (Contd.): Educational Qualification of Teachers
State EducationalQualification
No. of Teachers in Primary Schools No. of Teachers in Schools with Upper Primary Classes
Muslim Non-Muslim
Total Muslim Non-Muslim
TotalNumber % Number %
Kerala
Total 62 116 178 100.0 54 377 431 100.0Secondary 27 27 54 30.3 16 70 86 20.0Hr. Secondary 26 44 70 39.3 13 116 129 29.9Graduate & 6 45 51 28.7 24 190 214 49.7Othees 3 0 3 1.7 1 1 2 0.5
MadhyaPradesh
Total 4 26 30 100.0 7 29 36 100.0Secondary 0 0 0 0.0 0 0 0 0.0Hr. Secondary 0 7 7 23.3 1 2 3 8.3Graduate & 4 19 23 76.7 6 27 33 91.7Othees 0 0 0 0.0 0 0 0 0.0
Rajasthan
Total 1 7 8 100.0 5 20 25 100.0Secondary 0 0 0 0.0 1 0 1 4.0Hr. Secondary 0 2 2 25.0 0 9 9 36.0Graduate & 1 5 6 75.0 4 11 15 60.0
LOoCNOJgH3
O h

Others 0 0 0 0.0 0 0 0 0.0
UttarPradesh
Total 52 113 165 100.0 54 84 138 100.0Secondary 2 6 8 4.8 0 0 0 0.0Hr. Secondary 9 15 24 14.5 4 4 8 5.8Graduate & 41 92 133 80.6 49 80 129 93.5Othees 0 0 0 0.0 1 0 1 0.7
Uttarakhand
Total 6 14 20 100.0 6 15 21 100.0Secondary 1 0 1 5.0 0 0 0 0.0Hr. Secondary 1 0 1 5.0 2 1 3 14.3Graduate & 4 14 18 90.0 4 14 18 85.7Othees 0 0 0 0.0 0 0 0 0.0
Total
Total 252 539 791 100.0 442 1036 1478 100.0Secondary 62 114 176 22.3 68 163 231 15.6Hr. Secondary 82 141 223 28.2 117 271 388 26.3Graduate & 103 283 386 48.8 253 600 853 57.7Others 5 1 6 0.8 4 2 6 0.4
Table A4.8: Educational Qualification of Teachers
Management: Government
State EducationalQualification
No. of Teachers in Primary Schools No. of Teachers in Schools with Upper Primary Classes
Muslim Non-Muslim
Total Muslim Non-Muslim
TotalNumber % Number %
Assam
Total 135 108 243 100.0 139 152 291 100.0Secondary 36 63 99 40.7 13 13 26 8.9Hr. Secondary 73 34 107 44.0 58 47 105 36.1Graduate & 26 11 37 15.2 68 92 160 55.0Othees 0 0 0 0.0 0 0 0 0.0
Bihar
Total 157 171 328 100.0 175 215 390 100.0Secondary 27 35 62 18.9 24 44 68 17.4Hr. Secondary 97 91 188 57.3 102 83 185 47.4Graduate & 33 45 78 23.8 49 88 137 35.1Othees 0 0 0 0.0 0 0 0 0.0
Gujarat
Total 71 53 124 100.0 68 71 139 100.0Secondary 57 34 91 73.4 51 31 82 59.0Hr. Secondary 12 9 21 16.9 7 9 16 11.5Graduate & 2 10 12 9.7 10 31 41 29.5Othees 0 0 0 0.0 0 0 0 0.0
V .DOCNOJgH3
O h

Haryana
Total 34 99 133 100.0 32 69 101 100.0Secondary 0 1 1 0.8 0 1 1 1.0Hr. Secondary 4 9 13 9.8 2 1 3 3.0Graduate & 29 89 118 88.7 30 67 97 96.0Othees 1 0 1 0.8 0 0 0 0.0
Jammu & Kashmir
Total 92 34 126 100.0 160 88 248 100.0Secondary 11 3 14 11.1 18 5 23 9.3Hr. Secondary 46 11 57 45.2 72 22 94 37.9Graduate & 33 19 52 41.3 70 60 130 52.4Othees 2 1 3 2.4 0 1 1 0.4
Jharkhand
Total 89 52 141 100.0 38 89 127 100.0Secondary 6 8 14 9.9 4 18 22 17.3Hr. Secondary 34 16 50 35.5 9 13 22 17.3Graduate & 47 28 75 53.2 25 58 83 65.4Othees 2 0 2 1.4 0 0 0 0.0
Karnataka
Total 6 32 38 100.0 5 132 137 100.0Secondary 3 11 14 36.8 1 27 28 20.4Hr. Secondary 0 14 14 36.8 2 62 64 46.7Graduate & 3 7 10 26.3 2 43 45 32.8Othees 0 0 0 0.0 0 0 0 0.0
Table A4.8 (Contd.): Educational Qualification of Teachers
Management: Government
State EducationalQualification
No. of Teachers in Primary Schools No. of Teachers in Schools with Upper Primary Classes
Muslim Non-Muslim
Total Muslim Non-Muslim
TotalNumber % Number %
Kerala
Total 75 130 205 100.0 59 270 329 100.0Secondary 29 28 57 27.8 19 45 64 19.5Hr. Secondary 29 63 92 44.9 19 126 145 44.1Graduate & 17 39 56 27.3 19 96 115 35.0Othees 0 0 0 0.0 2 3 5 1.5
MadhyaPradesh
Total 13 75 88 100.0 8 35 43 100.0Secondary 0 0 0 0.0 0 0 0 0.0Hr. Secondary 3 23 26 29.5 1 0 1 2.3Graduate & 10 52 62 70.5 7 35 42 97.7Othees 0 0 0 0.0 0 0 0 0.0
RajasthanTotal 12 26 38 100.0 4 50 54 100.0Secondary 5 0 5 13.2 0 0 0 0.0Hr. Secondary 6 9 15 39.5 1 13 14 25.9
oCNOJgH3
O h

Graduate & 1 17 18 47.4 3 37 40 74.1Othees 0 0 0 0.0 0 0 0 0.0
UttarPradesh
Total 104 299 403 100.0 57 111 168 100.0Secondary 9 13 22 5.5 1 1 2 1.2Hr. Secondary 14 44 58 14.4 9 14 23 13.7Graduate & 81 242 323 80.1 47 96 143 85.1Othees 0 0 0 0.0 0 0 0 0.0
Uttarakhand
Total 22 52 74 100.0 29 9 38 100.0Secondary 0 0 0 0.0 2 0 2 5.3Hr. Secondary 9 1 10 13.5 4 1 5 13.2Graduate & 13 51 64 86.5 7 8 15 39.5Othees 0 0 0 0.0 16 0 16 42.1
Total
Total 810 1131 1941 100.0 774 1291 2065 100.0Secondary 183 196 379 19.5 133 185 318 15.4Hr. Secondary 327 324 651 33.5 286 391 677 32.8Graduate & 295 610 905 46.6 337 711 1048 50.8Others 5 1 6 0.3 18 4 22 1.1
Management: Private
Table A4.9: Educational Qualification of Teachers
State EducationalQualification
No. of Teachers in Primary Schools No. of Teachers in Schools with Upper Primary Classes
Muslim Non-Muslim
Total Muslim Non-Muslim
TotalNumber % Number %
Assam
Total 6 3 9 100.0 19 20 39 100.0Secondary 2 2 4 44.4 1 0 1 2.6Hr. Secondary 3 1 4 44.4 8 9 17 43.6Graduate & 1 0 1 11.1 9 11 20 51.3Othees 0 0 0 0.0 1 0 1 2.6
Bihar
Total 5 10 15 100.0 7 8 15 100.0Secondary 2 6 8 53.3 0 0 0 0.0Hr. Secondary 1 1 2 13.3 2 3 5 33.3Graduate & 2 3 5 33.3 5 5 10 66.7Othees 0 0 0 0.0 0 0 0 0.0
GujaratTotal . . 0 3 3 100.0Secondary 0 0 0 0.0Hr. Secondary 0 0 0 0.0Graduate & 0 3 3 100.0
0 0oCNOJegH3
O h

Others 0 0 0 0.0
Haryana
Total 0 8 8 100.0 44 18 62 100.0Secondary 0 0 0 0.0 0 0 0 0.0Hr. Secondary 0 5 5 62.5 0 0 0 0.0Graduate & 0 3 3 37.5 44 18 62 100.0Othees 0 0 0 0.0 0 0 0 0.0
Jammu & Kashmir
Total 17 49 66 100.0 83 60 143 100.0Secondary 1 0 1 1.5 5 2 7 4.9Hr. Secondary 6 5 11 16.7 26 17 43 30.1Graduate & 10 44 54 81.8 50 41 91 63.6Othees 0 0 0 0.0 2 0 2 1.4
Jharkhand
Total 6 27 33 100.0 15 54 69 100.0Secondary 0 0 0 0.0 10 1 11 15.9Hr. Secondary 4 17 21 63.6 1 15 16 23.2Graduate & 2 10 12 36.4 4 38 42 60.9Othees 0 0 0 0.0 0 0 0 0.0
Karnataka
Total 5 19 24 100.0 21 150 171 100.0Secondary 0 8 8 33.3 6 28 34 19.9Hr. Secondary 2 7 9 37.5 10 70 80 46.8Graduate & 3 4 7 29.2 5 52 57 33.3Othees 0 0 0 0.0 0 0 0 0.0
Management: Private
Table A4.9 (Contd.): Educational Qualification of Teachers
State EducationalQualification
No. of Teachers in Primary Schools No. of Teachers in Schools with Upper Primary Classes
Muslim Non-Muslim
Total Muslim Non-Muslim
TotalNumber % Number %
Kerala
Total 151 313 464 100.0 156 744 900 100.0Secondary 63 69 132 28.4 57 172 229 25.4Hr. Secondary 59 133 192 41.4 37 165 202 22.4Graduate & 23 111 134 28.9 59 391 450 50.0Othees 6 0 6 1.3 3 16 19 2.1
MadhyaPradesh
Total . 13 20 33 100.0Secondary 0 0 0 0.0Hr. Secondary 2 2 4 12.1Graduate & 11 18 29 87.9Othees 0 0 0 0.0
Rajasthan Total 2 2 4 100.0 5 2 7 100.0Secondary 0 0 0 0.0 1 0 1 14.3
a ^oCNOJgH3
O h

Hr. Secondary 0 0 0 0.0 0 1 1 14.3Graduate & 2 2 4 100.0 4 1 5 71.4Othees 0 0 0 0.0 0 0 0 0.0
UttarPradesh
Total 67 100 167 100.0 60 105 165 100.0Secondary 2 1 3 1.8 0 2 2 1.2Hr. Secondary 11 6 17 10.2 4 2 6 3.6Graduate & 54 93 147 88.0 55 101 156 94.5Othees 0 0 0 0.0 1 0 1 0.6
Uttarakhand
Total 21 36 57 100.0 10 68 78 100.0Secondary 1 0 1 1.8 1 0 1 1.3Hr. Secondary 9 2 11 19.3 0 7 7 9.0Graduate & 11 34 45 78.9 9 61 70 89.7Othees 0 0 0 0.0 0 0 0 0.0
Total
Total 280 567 847 100.0 433 1252 1685 100.0Secondary 71 86 157 18.5 81 205 286 17.0Hr. Secondary 95 177 272 32.1 90 291 381 22.6Graduate & 108 304 412 48.6 255 740 995 59.1Others 6 0 6 0.7 7 16 23 1.4
Table A4.10: Educational Qualification of Teachers in all Sampled Schools
Area/Management: Total
State EducationalQualification
No. of Teachers in Primary Schools No. of Teachers in Schools with Upper Primary Classes
Muslim Non-Muslim
Total Muslim Non-Muslim
TotalNumber % Number %
Assam
Total 141 111 252 100.0 158 172 330 100.0Secondary 38 65 103 40.9 14 13 27 8.2Hr. Secondary 76 35 111 44.0 66 56 122 37.0Graduate & 27 11 38 15.1 77 103 180 54.5Othees 0 0 0 0.0 1 0 1 0.3
Bihar
Total 162 181 343 100.0 182 223 405 100.0Secondary 29 41 70 20.4 24 44 68 16.8Hr. Secondary 98 92 190 55.4 104 86 190 46.9Graduate & 35 48 83 24.2 54 93 147 36.3Othees 0 0 0 0.0 0 0 0 0.0
GujaratTotal 71 53 124 100.0 68 74 142 100.0Secondary 57 34 91 73.4 51 31 82 57.7Hr. Secondary 12 9 21 16.9 7 9 16 11.3
ot-HCNOJeg
O h

Graduate & 2 10 12 9.7 10 34 44 31.0Othees 0 0 0 0.0 0 0 0 0.0
Haryana
Total 34 107 141 100.0 76 87 163 100.0Secondary 0 1 1 0.7 0 1 1 0.6Hr. Secondary 4 14 18 12.8 2 1 3 1.8Graduate & 29 92 121 85.8 74 85 159 97.5Othees 1 0 1 0.7 0 0 0 0.0
Jammu & Kashmir
Total 109 83 192 100.0 243 148 391 100.0Secondary 12 3 15 7.8 23 7 30 7.7Hr. Secondary 52 16 68 35.4 98 39 137 35.0Graduate & 43 63 106 55.2 120 101 221 56.5Othees 2 1 3 1.6 2 1 3 0.8
Jharkhand
Total 95 79 174 100.0 53 143 196 100.0Secondary 6 8 14 8.0 14 19 33 16.8Hr. Secondary 38 33 71 40.8 10 28 38 19.4Graduate & 49 38 87 50.0 29 96 125 63.8Othees 2 0 2 1.1 0 0 0 0.0
Karnataka
Total 11 51 62 100.0 26 282 308 100.0Secondary 3 19 22 35.5 7 55 62 20.1Hr. Secondary 2 21 23 37.1 12 132 144 46.8Graduate & 6 11 17 27.4 7 95 102 33.1Othees 0 0 0 0.0 0 0 0 0.0
Table A4.10 (Contd.): Educational Qualification of Teachers in all Sampled Schools
Area/Management: Total
State EducationalQualification
No. of Teachers in Primary Schools No. of Teachers in Schools with Upper Primary Classes
Muslim Non-Muslim
Total Muslim Non-Muslim
TotalNumber % Number %
Kerala
Total 226 443 669 100.0 215 1014 1229 100.0Secondary 92 97 189 28.3 76 217 293 23.8Hr. Secondary 88 196 284 42.5 56 291 347 28.2Graduate & 40 150 190 28.4 78 487 565 46.0Othees 6 0 6 0.9 5 19 24 2.0
MadhyaPradesh
Total 13 75 88 100.0 21 55 76 100.0Secondary 0 0 0 0.0 0 0 0 0.0Hr. Secondary 3 23 26 29.5 3 2 5 6.6Graduate & 10 52 62 70.5 18 53 71 93.4Othees 0 0 0 0.0 0 0 0 0.0
Rajasthan Total 14 28 42 100.0 9 52 61 100.0CNOJeg
O h

Secondary 5 0 5 11.9 1 0 1 1.6Hr. Secondary 6 9 15 35.7 1 14 15 24.6Graduate & 3 19 22 52.4 7 38 45 73.8Othees 0 0 0 0.0 0 0 0 0.0
UttarPradesh
Total 171 399 570 100.0 117 216 333 100.0Secondary 11 14 25 4.4 1 3 4 1.2Hr. Secondary 25 50 75 13.2 13 16 29 8.7Graduate & 135 335 470 82.5 102 197 299 89.8Othees 0 0 0 0.0 1 0 1 0.3
Uttarakhand
Total 43 88 131 100.0 39 77 116 100.0Secondary 1 0 1 0.8 3 0 3 2.6Hr. Secondary 18 3 21 16.0 4 8 12 10.3Graduate & 24 85 109 83.2 16 69 85 73.3Othees 0 0 0 0.0 16 0 16 13.8
Total
Total 1090 1698 2788 100.0 1207 2543 3750 100.0Secondary 254 282 536 19.2 214 390 604 16.1Hr. Secondary 422 501 923 33.1 376 682 1058 28.2Graduate & 403 914 1317 47.2 592 1451 2043 54.5Others 11 1 12 0.4 25 20 45 1.2
Table A4.11: Professional Qualification of Teachers
Area: Rural
State ProfessionalQualification
No. of Teachers in Primary Schools No. of Teachers in Schools with Upper Primary Classes
Muslim Non-Muslim
Total Muslim Non-Muslim
TotalNo. % No. %
Assam
Total 114 41 155 100.0 106 77 183 100.0Untrained 62 15 77 49.7 65 52 117 63.9Diploma/BTC/JBT 39 18 57 36.8 20 16 36 19.7B.Ed. 8 1 9 5.8 11 3 14 7.7Any Other 5 7 12 7.7 10 6 16 8.7
Bihar
Total 126 138 264 100.0 127 100 227 100.0Untrained 65 67 132 50.0 51 40 91 40.1Diploma/BTC/JBT 34 49 83 31.4 31 39 70 30.8B.Ed. 20 7 27 10.2 42 17 59 26.0Any Other 7 15 22 8.3 3 4 7 3.1
Gujarat Total 53 36 89 100.0 41 42 83 100.0
CNt-HCNOJgH3
O h

Untrained 0 0 0 0.0 1 0 1 1.2Diploma/BTC/ JBT 53 25 78 87.6 36 27 63 75.9B.Ed. 0 8 8 9.0 3 10 13 15.7Any Other 0 3 3 3.4 1 5 6 7.2
Haryana
Total 32 74 106 100.0 23 54 77 100.0Untrained 0 1 1 0.9 0 5 5 6.5Diploma/BTC/ JBT 27 47 74 69.8 10 19 29 37.7B.Ed. 5 26 31 29.2 12 27 39 50.6Any Other 0 0 0 0.0 1 3 4 5.2
Jammu & Kashmir
Total 82 34 116 100.0 135 91 226 100.0Untrained 47 15 62 53.4 73 31 104 46.0Diploma/BTC/ JBT 18 12 30 25.9 32 23 55 24.3B.Ed. 14 7 21 18.1 18 33 51 22.6Any Other 3 0 3 2.6 12 4 16 7.1
Jharkhand
Total 83 50 133 100.0 37 79 116 100.0Untrained 43 21 64 48.1 9 22 31 26.7Diploma/BTC/ JBT 21 17 38 28.6 10 36 46 39.7B.Ed. 16 3 19 14.3 15 12 27 23.3Any Other 3 9 12 9.0 3 9 12 10.3
Karnataka
Total 6 29 35 100.0 21 175 196 100.0Untrained 0 1 1 2.9 12 18 30 15.3Diploma/BTC/ JBT 3 22 25 71.4 7 112 119 60.7B.Ed. 3 4 7 20.0 2 43 45 23.0Any Other 0 2 2 5.7 0 2 2 1.0
Table A4.11 (Contd.): Professional Qualification of Teachers
Area: Rural
State ProfessionalQualification
No. of Teachers in Primary Schools No. of Teachers in Schools with Upper Primary Classes
Muslim Non-Muslim
Total Muslim Non-Muslim
TotalNo. % No. %
Kerala
Total 164 327 491 100.0 161 637 798 100.0Untrained 5 5 10 2.0 18 29 47 5.9Diploma/BTC/JBT 108 215 323 65.8 64 243 307 38.5B.Ed. 17 61 78 15.9 39 266 305 38.2Any Other 34 46 80 16.3 40 99 139 17.4
MadhyaPradesh
Total 9 49 58 100.0 14 26 40 100.0Untrained 0 6 6 10.3 6 0 6 15.0Diploma/BTC/JBT 6 39 45 77.6 5 7 12 30.0B.Ed. 3 4 7 12.1 3 19 22 55.0
c nt-HCNOJegH3
O h

Any Other 0 0 0 0.0 0 0 0 0.0
Rajasthan
Total 13 21 34 100.0 4 32 36 100.0Untrained 9 1 10 29.4 0 2 2 5.6Diploma/BTC/ JBT 2 12 14 41.2 2 7 9 25.0B.Ed. 2 8 10 29.4 2 23 25 69.4Any Other 0 0 0 0.0 0 0 0 0.0
UttarPradesh
Total 119 286 405 100.0 63 132 195 100.0Untrained 56 115 171 42.2 21 27 48 24.6Diploma/BTC/ JBT 51 62 113 27.9 27 47 74 37.9B.Ed. 11 48 59 14.6 9 46 55 28.2Any Other 1 61 62 15.3 6 12 18 9.2
Uttarakhand
Total 37 74 111 100.0 33 62 95 100.0Untrained 14 19 33 29.7 28 28 56 58.9Diploma/BTC/ JBT 11 23 34 30.6 4 8 12 12.6B.Ed. 5 29 34 30.6 1 26 27 28.4Any Other 7 3 10 9.0 0 0 0 0.0
Total
Total 838 1159 1997 100.0 765 1507 2272 100.0Untrained 301 266 567 28.4 284 254 538 23.7Diploma/BTC/ JBT 373 541 914 45.8 248 584 832 36.6B.Ed. 104 206 310 15.5 157 525 682 30.0Any Other 60 146 206 10.3 76 144 220 9.7
Table A4.12: Professional Qualification of Teachers
Area: Urban
State ProfessionalQualification
No. of Teachers in Primary Schools No. of Teachers in Schools with Upper Primary Classes
Muslim Non-Muslim
Total Muslim Non-Muslim
TotalNo. % No. %
Assam
Total 27 70 97 100.0 52 95 147 100.0Untrained 13 21 34 35.1 24 59 83 56.5Diploma/BTC/JBT 5 47 52 53.6 18 8 26 17.7B.Ed. 8 0 8 8.2 5 11 16 10.9Any Other 1 2 3 3.1 5 17 22 15.0
BiharTotal 36 43 79 100.0 55 123 178 100.0Untrained 20 6 26 32.9 12 23 35 19.7Diploma/BTC/JBT 10 27 37 46.8 17 88 105 59.0B.Ed. 4 1 5 6.3 25 5 30 16.9
tHCNOJgH3
O h

Any Other 2 9 11 13.9 1 7 8 4.5
Gujarat
Total 18 17 35 100.0 27 32 59 100.0Untrained 0 0 0 0.0 0 0 0 0.0Diploma/BTC/ JBT 18 14 32 91.4 23 16 39 66.1B.Ed. 0 1 1 2.9 2 13 15 25.4Any Other 0 2 2 5.7 2 3 5 8.5
Haryana
Total 2 33 35 100.0 53 33 86 100.0Untrained 0 8 8 22.9 13 9 22 25.6Diploma/BTC/ JBT 2 12 14 40.0 13 9 22 25.6B.Ed. 0 13 13 37.1 25 9 34 39.5Any Other 0 0 0 0.0 2 6 8 9.3
Jammu & Kashmir
Total 27 49 76 100.0 108 57 165 100.0Untrained 9 17 26 34.2 61 32 93 56.4Diploma/BTC/ JBT 6 2 8 10.5 9 4 13 7.9B.Ed. 7 30 37 48.7 32 21 53 32.1Any Other 5 0 5 6.6 6 0 6 3.6
Jharkhand
Total 12 29 41 100.0 16 64 80 100.0Untrained 6 21 27 65.9 5 34 39 48.8Diploma/BTC/ JBT 5 6 11 26.8 1 13 14 17.5B.Ed. 1 2 3 7.3 0 14 14 17.5Any Other 0 0 0 0.0 10 3 13 16.3
Karnataka
Total 5 22 27 100.0 5 107 112 100.0Untrained 0 2 2 7.4 1 2 3 2.7Diploma/BTC/ JBT 1 14 15 55.6 1 72 73 65.2B.Ed. 2 5 7 25.9 3 33 36 32.1Any Other 2 1 3 11.1 0 0 0 0.0
Table A4.12 (Contd.): Professional Qualification of Teachers
Area: Urban
State ProfessionalQualification
No. of Teachers in Primary Schools No. of Teachers in Schools with Upper Primary Classes
Muslim Non-Muslim
Total Muslim Non-Muslim
TotalNo. % No. %
Kerala
Total 62 116 178 100.0 54 377 431 100.0Untrained 4 0 4 2.2 3 15 18 4.2Diploma/BTC/JBT 32 73 105 59.0 22 178 200 46.4B.Ed. 2 36 38 21.3 19 164 183 42.5Any Other 24 7 31 17.4 10 20 30 7.0
MadhyaTotal 4 26 30 100.0 7 29 36 100.0Untrained 0 0 0 0.0 0 9 9 25.0
LOt-HCNOJg
O h

Pradesh Diploma/BTC/JBT 0 10 10 33.3 1 3 4 11.1B.Ed. 4 16 20 66.7 6 17 23 63.9Any Other 0 0 0 0.0 0 0 0 0.0
Rajasthan
Total 1 7 8 100.0 5 20 25 100.0Untrained 0 0 0 0.0 3 2 5 20.0Diploma/BTC/ JBT 0 6 6 75.0 0 10 10 40.0B.Ed. 1 0 1 12.5 2 8 10 40.0Any Other 0 1 1 12.5 0 0 0 0.0
UttarPradesh
Total 52 113 165 100.0 54 84 138 100.0Untrained 28 37 65 39.4 15 10 25 18.1Diploma/BTC/ JBT 16 37 53 32.1 29 23 52 37.7B.Ed. 5 25 30 18.2 10 50 60 43.5Any Other 3 14 17 10.3 0 1 1 0.7
Uttarakhand
Total 6 14 20 100.0 6 15 21 100.0Untrained 1 5 6 30.0 1 2 3 14.3Diploma/BTC/ JBT 1 3 4 20.0 3 5 8 38.1B.Ed. 0 6 6 30.0 2 8 10 47.6Any Other 4 0 4 20.0 0 0 0 0.0
Total
Total 252 539 791 100.0 442 1036 1478 100.0Untrained 81 117 198 25.0 138 197 335 22.7Diploma/BTC/ JBT 96 251 347 43.9 137 429 566 38.3B.Ed. 34 135 169 21.4 131 353 484 32.7Any Other 41 36 77 9.7 36 57 93 6.3
Table A4.13: Professional Qualification of Teachers
Management: Government
State ProfessionalQualification
No. of Teachers in Primary Schools No. of Teachers in Schools with Upper Primary Classes
Muslim Non-Muslim
Total Muslim Non-Muslim
TotalNo. % No. %
Assam
Total 135 108 243 100.0 139 152 291 100.0Untrained 69 34 103 42.4 72 92 164 56.4Diploma/BTC/JBT 44 65 109 44.9 38 23 61 21.0B.Ed. 16 1 17 7.0 14 14 28 9.6Any Other 6 8 14 5.8 15 23 38 13.1
Bihar Total 157 171 328 100.0 175 215 390 100.0Untrained 83 72 155 47.3 63 63 126 32.3
V.Dt-HCNOJeg
O h

Diploma/BTC/JBT 43 76 119 36.3 43 119 162 41.5B.Ed. 24 8 32 9.8 65 22 87 22.3Any Other 7 15 22 6.7 4 11 15 3.8
Gujarat
Total 71 53 124 100.0 68 71 139 100.0Untrained 0 0 0 0.0 1 0 1 0.7Diploma/BTC/ JBT 71 39 110 88.7 59 43 102 73.4B.Ed. 0 9 9 7.3 5 20 25 18.0Any Other 0 5 5 4.0 3 8 11 7.9
Haryana
Total 34 99 133 100.0 32 69 101 100.0Untrained 0 1 1 0.8 0 3 3 3.0Diploma/BTC/ JBT 29 59 88 66.2 10 27 37 36.6B.Ed. 5 39 44 33.1 21 31 52 51.5Any Other 0 0 0 0.0 1 8 9 8.9
Jammu & Kashmir
Total 92 34 126 100.0 160 88 248 100.0Untrained 44 10 54 42.9 75 28 103 41.5Diploma/BTC/ JBT 24 14 38 30.2 36 23 59 23.8B.Ed. 16 10 26 20.6 33 33 66 26.6Any Other 8 0 8 6.3 16 4 20 8.1
Jharkhand
Total 89 52 141 100.0 38 89 127 100.0Untrained 43 21 64 45.4 9 22 31 24.4Diploma/BTC/ JBT 26 18 44 31.2 11 45 56 44.1B.Ed. 17 4 21 14.9 15 13 28 22.0Any Other 3 9 12 8.5 3 9 12 9.4
Karnataka
Total 6 32 38 100.0 5 132 137 100.0Untrained 0 1 1 2.6 2 4 6 4.4Diploma/BTC/ JBT 3 24 27 71.1 3 99 102 74.5B.Ed. 3 5 8 21.1 0 27 27 19.7Any Other 0 2 2 5.3 0 2 2 1.5
Table A4.13 (Contd.): Professional Qualification of Teachers
Management: Government
State ProfessionalQualification
No. of Teachers in Primary Schools No. of Teachers in Schools with Upper Primary Classes
Muslim Non-Muslim
Total Muslim Non-Muslim
TotalNo. % No. %
Kerala
Total 75 130 205 100.0 59 270 329 100.0Untrained 2 0 2 1.0 2 7 9 2.7Diploma/BTC/JBT 39 89 128 62.4 32 180 212 64.4B.Ed. 9 21 30 14.6 8 74 82 24.9Any Other 25 20 45 22.0 17 9 26 7.9
t-HCNOJg
O h

MadhyaPradesh
Total 13 75 88 100.0 8 35 43 100.0Untrained 0 6 6 6.8 0 2 2 4.7Diploma/BTC/JBT 6 49 55 62.5 5 9 14 32.6B.Ed. 7 20 27 30.7 3 24 27 62.8Any Other 0 0 0 0.0 0 0 0 0.0
Rajasthan
Total 12 26 38 100.0 4 50 54 100.0Untrained 9 1 10 26.3 0 2 2 3.7Diploma/BTC/ JBT 2 18 20 52.6 2 17 19 35.2B.Ed. 1 6 7 18.4 2 31 33 61.1Any Other 0 1 1 2.6 0 0 0 0.0
UttarPradesh
Total 104 299 403 100.0 57 111 168 100.0Untrained 40 97 137 34.0 3 0 3 1.8Diploma/BTC/ JBT 54 86 140 34.7 44 51 95 56.5B.Ed. 9 49 58 14.4 6 50 56 33.3Any Other 1 67 68 16.9 4 10 14 8.3
Uttarakhand
Total 22 52 74 100.0 29 9 38 100.0Untrained 2 5 7 9.5 21 0 21 55.3Diploma/BTC/ JBT 12 23 35 47.3 7 8 15 39.5B.Ed. 0 21 21 28.4 1 1 2 5.3Any Other 8 3 11 14.9 0 0 0 0.0
Total
Total 810 1131 1941 100.0 774 1291 2065 100.0Untrained 292 248 540 27.8 248 223 471 22.8Diploma/BTC/ JBT 353 560 913 47.0 290 644 934 45.2B.Ed. 107 193 300 15.5 173 340 513 24.8Any Other 58 130 188 9.7 63 84 147 7.1
Management: Private
Table A4.14: Professional Qualification of Teachers
State ProfessionalQualification
No. of Teachers in Primary Schools No. of Teachers in Schools with Upper Primary Classes
Muslim Non-Muslim
Total Muslim Non-Muslim
TotalNo. % No. %
Assam
Total 6 3 9 100.0 19 20 39 100.0Untrained 6 2 8 88.9 17 19 36 92.3Diploma/BTC/JBT 0 0 0 0.0 0 1 1 2.6B.Ed. 0 0 0 0.0 2 0 2 5.1Any Other 0 1 1 11.1 0 0 0 0.0
0 0t-HCNOJg
O h

Bihar
Total 5 10 15 100.0 7 8 15 100.0Untrained 2 1 3 20.0 0 0 0 0.0Diploma/BTC/JBT 1 0 1 6.7 5 8 13 86.7B.Ed. 0 0 0 0.0 2 0 2 13.3Any Other 2 9 11 73.3 0 0 0 0.0
Gujarat
Total . . 0 3 3 100.0Untrained 0 0 0 0.0Diploma/BTC/ JBT 0 0 0 0.0B.Ed. 0 3 3 100.0Any Other 0 0 0 0.0
Haryana
Total 0 8 8 100.0 44 18 62 100.0Untrained 0 8 8 100.0 13 11 24 38.7Diploma/BTC/ JBT 0 0 0 0.0 13 1 14 22.6B.Ed. 0 0 0 0.0 16 5 21 33.9Any Other 0 0 0 0.0 2 1 3 4.8
Jammu & Kashmir
Total 17 49 66 100.0 83 60 143 100.0Untrained 12 22 34 51.5 59 35 94 65.7Diploma/BTC/ JBT 0 0 0 0.0 5 4 9 6.3B.Ed. 5 27 32 48.5 17 21 38 26.6Any Other 0 0 0 0.0 2 0 2 1.4
Jharkhand
Total 6 27 33 100.0 15 54 69 100.0Untrained 6 21 27 81.8 5 34 39 56.5Diploma/BTC/ JBT 0 5 5 15.2 0 4 4 5.8B.Ed. 0 1 1 3.0 0 13 13 18.8Any Other 0 0 0 0.0 10 3 13 18.8
Karnataka
Total 5 19 24 100.0 21 150 171 100.0Untrained 0 2 2 8.3 11 16 27 15.8Diploma/BTC/ JBT 1 12 13 54.2 5 85 90 52.6B.Ed. 2 4 6 25.0 5 49 54 31.6Any Other 2 1 3 12.5 0 0 0 0.0
Table A4.14 (Contd.): Professional Qualification of Teachers
Management: Private
State ProfessionalQualification
No. of Teachers in Primary Schools No. of Teachers in Schools with Upper Primary Classes
Muslim Non-Muslim
Total Muslim Non-Muslim
TotalNo. % No. %
KeralaTotal 151 313 464 100.0 156 744 900 100.0Untrained 7 5 12 2.6 19 37 56 6.2Diploma/BTC/JBT 101 199 300 64.7 54 241 295 32.8
a ^
CNOJgH3O h

B.Ed. 10 76 86 18.5 50 356 406 45.1Any Other 33 33 66 14.2 33 110 143 15.9
MadhyaPradesh
Total 13 20 33 100.0Untrained 6 7 13 39.4Diploma/BTC/JBT 1 1 2 6.1B.Ed. 6 12 18 54.5Any Other 0 0 0 0.0
Rajasthan
Total 2 2 4 100.0 5 2 7 100.0Untrained 0 0 0 0.0 3 2 5 71.4Diploma/BTC/ JBT 0 0 0 0.0 0 0 0 0.0B.Ed. 2 2 4 100.0 2 0 2 28.6Any Other 0 0 0 0.0 0 0 0 0.0
UttarPradesh
Total 67 100 167 100.0 60 105 165 100.0Untrained 44 55 99 59.3 33 37 70 42.4Diploma/BTC/ JBT 13 13 26 15.6 12 19 31 18.8B.Ed. 7 24 31 18.6 13 46 59 35.8Any Other 3 8 11 6.6 1 4 5 3.0
Uttarakhand
Total 21 36 57 100.0 10 68 78 100.0Untrained 13 19 32 56.1 8 30 38 48.7Diploma/BTC/ JBT 0 3 3 5.3 0 5 5 6.4B.Ed. 5 14 19 33.3 2 33 35 44.9Any Other 3 0 3 5.3 0 0 0 0.0
Total
Total 280 567 847 100.0 433 1252 1685 100.0Untrained 90 135 225 26.6 174 228 402 23.9Diploma/BTC/ JBT 116 232 348 41.1 95 369 464 27.5B.Ed. 31 148 179 21.1 115 538 653 38.8Any Other 43 52 95 11.2 49 117 166 9.9
Table A4.15: Professional Qualification of Teachers
Area/Management: Total
State ProfessionalQualification
No. of Teachers in Primary Schools No. of Teachers in Schools with Upper Primary Classes
Muslim Non-Muslim
Total Muslim Non-Muslim
TotalNo. % No. %
Assam Total 141 111 252 100.0 158 172 330 100.0Untrained 75 36 111 44.0 89 111 200 60.6
oCNCNOJgH3
O h

Diploma/BTC/JBT 44 65 109 43.3 38 24 62 18.8B.Ed. 16 1 17 6.7 16 14 30 9.1Any Other 6 9 15 6.0 15 23 38 11.5
Bihar
Total 162 181 343 100.0 182 223 405 100.0Untrained 85 73 158 46.1 63 63 126 31.1Diploma/BTC/JBT 44 76 120 35.0 48 127 175 43.2B.Ed. 24 8 32 9.3 67 22 89 22.0Any Other 9 24 33 9.6 4 11 15 3.7
Gujarat
Total 71 53 124 100.0 68 74 142 100.0Untrained 0 0 0 0.0 1 0 1 0.7Diploma/BTC/ JBT 71 39 110 88.7 59 43 102 71.8B.Ed. 0 9 9 7.3 5 23 28 19.7Any Other 0 5 5 4.0 3 8 11 7.7
Haryana
Total 34 107 141 100.0 76 87 163 100.0Untrained 0 9 9 6.4 13 14 27 16.6Diploma/BTC/ JBT 29 59 88 62.4 23 28 51 31.3B.Ed. 5 39 44 31.2 37 36 73 44.8Any Other 0 0 0 0.0 3 9 12 7.4
Jammu & Kashmir
Total 109 83 192 100.0 243 148 391 100.0Untrained 56 32 88 45.8 134 63 197 50.4Diploma/BTC/ JBT 24 14 38 19.8 41 27 68 17.4B.Ed. 21 37 58 30.2 50 54 104 26.6Any Other 8 0 8 4.2 18 4 22 5.6
Jharkhand
Total 95 79 174 100.0 53 143 196 100.0Untrained 49 42 91 52.3 14 56 70 35.7Diploma/BTC/ JBT 26 23 49 28.2 11 49 60 30.6B.Ed. 17 5 22 12.6 15 26 41 20.9Any Other 3 9 12 6.9 13 12 25 12.8
Karnataka
Total 11 51 62 100.0 26 282 308 100.0Untrained 0 3 3 4.8 13 20 33 10.7Diploma/BTC/ JBT 4 36 40 64.5 8 184 192 62.3B.Ed. 5 9 14 22.6 5 76 81 26.3Any Other 2 3 5 8.1 0 2 2 0.6
Table A4.15 (Contd.): Professional Qualification of Teachers
Area/Management: Total
State ProfessionalQualification
No. of Teachers in Primary Schools No. of Teachers in Schools with Upper Primary Classes
Muslim Non-Muslim
Total Muslim Non-Muslim
TotalNo. % No. %
Kerala Total 226 443 669 100.0 215 1014 1229 100.0
CNCNOJgH3
O h

Untrained 9 5 14 2.1 21 44 65 5.3Diploma/BTC/JBT 140 288 428 64.0 86 421 507 41.3B.Ed. 19 97 116 17.3 58 430 488 39.7Any Other 58 53 111 16.6 50 119 169 13.8
MadhyaPradesh
Total 13 75 88 100.0 21 55 76 100.0Untrained 0 6 6 6.8 6 9 15 19.7Diploma/BTC/JBT 6 49 55 62.5 6 10 16 21.1B.Ed. 7 20 27 30.7 9 36 45 59.2Any Other 0 0 0 0.0 0 0 0 0.0
Rajasthan
Total 14 28 42 100.0 9 52 61 100.0Untrained 9 1 10 23.8 3 4 7 11.5Diploma/BTC/ JBT 2 18 20 47.6 2 17 19 31.1B.Ed. 3 8 11 26.2 4 31 35 57.4Any Other 0 1 1 2.4 0 0 0 0.0
UttarPradesh
Total 171 399 570 100.0 117 216 333 100.0Untrained 84 152 236 41.4 36 37 73 21.9Diploma/BTC/ JBT 67 99 166 29.1 56 70 126 37.8B.Ed. 16 73 89 15.6 19 96 115 34.5Any Other 4 75 79 13.9 6 13 19 5.7
Uttarakhand
Total 43 88 131 100.0 39 77 116 100.0Untrained 15 24 39 29.8 29 30 59 50.9Diploma/BTC/ JBT 12 26 38 29.0 7 13 20 17.2B.Ed. 5 35 40 30.5 3 34 37 31.9Any Other 11 3 14 10.7 0 0 0 0.0
Total
Total 1090 1698 2788 100.0 1207 2543 3750 100.0Untrained 382 383 765 27.4 422 451 873 23.3Diploma/BTC/ JBT 469 792 1261 45.2 385 1013 1398 37.3B.Ed. 138 341 479 17.2 288 878 1166 31.1Any Other 101 182 283 10.2 112 201 313 8.3
Table A4.16: Percentage of Teachers present in School on the day of visit
State Area/No. of Teachers in Primary Schools No. of Teachers in Schools with
Upper Primary Classes
ManagementTotal Present on
day of visit% of
Teachers present
Total Present on day of visit
% of Teachers present
CNCNCNOJg
O h

Assam
Total 252 180 71.4 330 207 62.7Rural 155 115 74.2 183 105 57.4Urban 97 65 67.0 147 102 69.4Government 243 173 71.2 291 184 63.2Private 9 7 77.8 39 23 59.0
Bihar
Total 343 267 77.8 405 308 76.0Rural 264 206 78.0 227 173 76.2Urban 79 61 77.2 178 135 75.8Government 328 255 77.7 390 295 75.6Private 15 12 80.0 15 13 86.7
Gujarat
Total 124 116 93.5 142 126 88.7Rural 89 82 92.1 83 73 88.0Urban 35 34 97.1 59 53 89.8Government 124 116 93.5 139 123 88.5Private 3 3 100.0
Haryana
Total 141 133 94.3 163 144 88.3Rural 106 106 100.0 77 62 80.5Urban 35 27 77.1 86 82 95.3Government 133 128 96.2 101 84 83.2Private 8 5 62.5 62 60 96.8
Jammu & Kashmir
Total 192 164 85.4 391 329 84.1Rural 116 102 87.9 226 179 79.2Urban 76 62 81.6 165 150 90.9Government 126 110 87.3 248 196 79.0Private 66 54 81.8 143 133 93.0
Jharkhand
Total 174 139 79.9 196 164 83.7Rural 133 105 78.9 116 95 81.9Urban 41 34 82.9 80 69 86.3Government 141 112 79.4 127 104 81.9Private 33 27 81.8 69 60 87.0
Karnataka
Total 62 24 38.7 308 108 35.1Rural 35 14 40.0 196 57 29.1Urban 27 10 37.0 112 51 45.5Government 38 12 31.6 137 28 20.4Private 24 12 50.0 171 80 46.8
Table A4.16 (Contd.): Percentage of Teachers present in School on the day of visit
c nCNCN
State Area/ No. of Teachers in Primary Schools No. of Teachers in Schools with Upper Primary Classes
OJegH3O h

ManagementTotal
Present on day of
visit
% of Teachers present
Total Present on day of visit
% of Teachers present
Kerala
Total 669 302 45.1 1229 463 37.7Rural 491 247 50.3 798 384 48.1Urban 178 55 30.9 431 79 18.3Government 205 101 49.3 329 163 49.5Private 464 201 43.3 900 300 33.3
MadhyaPradesh
Total 88 77 87.5 76 65 85.5Rural 58 51 87.9 40 31 77.5Urban 30 26 86.7 36 34 94.4Government 88 77 87.5 43 32 74.4Private 33 33 100.0
Rajasthan
Total 42 39 92.9 61 54 88.5Rural 34 32 94.1 36 33 91.7Urban 8 7 87.5 25 21 84.0Government 38 35 92.1 54 47 87.0Private 4 4 100.0 7 7 100.0
UttarPradesh
Total 570 479 84.0 333 293 88.0Rural 405 338 83.5 195 163 83.6Urban 165 141 85.5 138 130 94.2Government 403 317 78.7 168 142 84.5Private 167 162 97.0 165 151 91.5
Uttarakhand
Total 131 98 74.8 116 98 84.5Rural 111 81 73.0 95 81 85.3Urban 20 17 85.0 21 17 81.0Government 74 43 58.1 38 27 71.1Private 57 55 96.5 78 71 91.0
Total
Total 2788 2018 77.1 3750 2359 75.2Rural 1997 1479 78.3 2272 1436 73.2Urban 791 539 74.6 1478 923 77.1Government 1941 1479 75.2 2065 1425 71.5Private 847 539 77.1 1685 934 82.1
Table A4.17: Type of relaxation given to Muslim teachers and students in School Hours during Ramzan month
State Area Relaxation Total % of schools provided relaxationCNCN
OJgO h

to teacher/ students
No. of schools
NoRelaxation
Leavingschoolearly
Coming late to school
Changingschoolhours
Others
Assam
Rural Teachers 90 68.9 16.7 1.1 3.3 10.0Students 90 82.2 16.7 1.1 0.0 0.0
Urban Teachers 32 78.1 15.6 0.0 3.1 3.1Students 32 78.1 21.9 0.0 0.0 0.0
Total Teachers 122 71.3 16.4 0.8 3.3 8.2Students 122 81.1 18.0 0.8 0.0 0.0
Bihar
Rural Teachers 90 46.7 6.7 23.3 14.4 8.9Students 90 70.0 11.1 18.9 0.0 0.0
Urban Teachers 28 60.7 0.0 7.1 21.4 10.7Students 28 82.1 10.7 7.1 0.0 0.0
Total Teachers 118 50.0 5.1 19.5 16.1 9.3Students 118 72.9 11.0 16.1 0.0 0.0
Gujarat
Rural Teachers 30 13.3 0.0 0.0 86.7 0.0Students 30 96.7 3.3 0.0 0.0 0.0
Urban Teachers 12 0.0 0.0 0.0 100.0 0.0Students 12 100.0 0.0 0.0 0.0 0.0
Total Teachers 42 9.5 0.0 0.0 90.5 0.0Students 42 97.6 2.4 0.0 0.0 0.0
Haryana
Rural Teachers 30 96.7 3.3 0.0 0.0 0.0Students 30 93.3 6.7 0.0 0.0 0.0
Urban Teachers 12 75.0 8.3 0.0 8.3 8.3Students 12 91.7 8.3 0.0 0.0 0.0
Total Teachers 42 90.5 4.8 0.0 2.4 2.4Students 42 92.9 7.1 0.0 0.0 0.0
Jammu & Kashmir
Rural Teachers 88 86.4 8.0 1.1 3.4 1.1Students 88 87.5 11.4 1.1 0.0 0.0
Urban Teachers 24 70.8 12.5 0.0 8.3 8.3Students 24 83.3 16.7 0.0 0.0 0.0
Total Teachers 112 83.0 8.9 0.9 4.5 2.7Students 112 86.6 12.5 0.9 0.0 0.0
Jharkhand
Rural Teachers 60 68.3 8.3 8.3 8.3 6.7Students 60 81.7 8.3 10.0 0.0 0.0
Urban Teachers 12 41.7 16.7 0.0 16.7 25.0Students 12 66.7 33.3 0.0 0.0 0.0
Total Teachers 72 63.9 9.7 6.9 9.7 9.7Students 72 79.2 12.5 8.3 0.0 0.0
Karnataka
Rural Teachers 36 75.0 0.0 0.0 5.6 19.4Students 36 100.0 0.0 0.0 0.0 0.0
Urban Teachers 19 57.9 15.8 0.0 0.0 26.3Students 19 78.9 21.1 0.0 0.0 0.0
Total Teachers 55 69.1 5.5 0.0 3.6 21.8Students 55 92.7 7.3 0.0 0.0 0.0
Continued....
Table A4.17 (Contd.): Type of relaxation given to Muslim teachers and students in School Hours during Ramzan month
LOCNCNOJeg
O h

State AreaRelaxation to teacher/ students
Total No. of
schools
% of schools provided relaxationNo
RelaxationLeavingschoolearly
Coming late to school
Changingschoolhours
Others
Kerala
Rural Teachers 120 60.0 10.0 0.8 20.0 9.2Students 120 87.5 10.8 1.7 0.0 0.0
Urban Teachers 48 68.8 16.7 0.0 8.3 6.3Students 48 85.4 10.4 4.2 0.0 0.0
Total Teachers 168 62.5 11.9 0.6 16.7 8.3Students 168 86.9 10.7 2.4 0.0 0.0
MadhyaPradesh
Rural Teachers 30 63.3 36.7 0.0 0.0 0.0Students 30 13.3 83.3 3.3 0.0 0.0
Urban Teachers 8 50.0 50.0 0.0 0.0 0.0Students 8 12.5 87.5 0.0 0.0 0.0
Total Teachers 38 60.5 39.5 0.0 0.0 0.0Students 38 13.2 84.2 2.6 0.0 0.0
Rajasthan
Rural Teachers 30 63.3 36.7 0.0 0.0 0.0Students 30 13.3 86.7 0.0 0.0 0.0
Urban Teachers 8 62.5 37.5 0.0 0.0 0.0Students 8 12.5 87.5 0.0 0.0 0.0
Total Teachers 38 63.2 36.8 0.0 0.0 0.0Students 38 13.2 86.8 0.0 0.0 0.0
UttarPradesh
Rural Teachers 150 73.3 14.7 0.7 0.7 10.7Students 150 71.3 28.0 0.7 0.0 0.0
Urban Teachers 56 69.6 12.5 1.8 5.4 10.7Students 56 76.8 21.4 1.8 0.0 0.0
Total Teachers 206 72.3 14.1 1.0 1.9 10.7Students 206 72.8 26.2 1.0 0.0 0.0
Uttarakhand
Rural Teachers 29 48.3 24.1 0.0 20.7 6.9Students 29 65.5 34.5 0.0 0.0 0.0
Urban Teachers 12 75.0 16.7 0.0 8.3 0.0Students 12 75.0 25.0 0.0 0.0 0.0
Total Teachers 41 56.1 22.0 0.0 17.1 4.9Students 41 68.3 31.7 0.0 0.0 0.0
Total
Rural Teachers 783 65.8 12.4 3.8 10.6 7.4Students 783 76.0 20.3 3.7 0.0 0.0
Urban Teachers 271 64.2 14.0 1.1 11.8 8.9Students 271 77.1 21.0 1.8 0.0 0.0
Total Teachers 1054 65.4 12.8 3.1 10.9 7.8Students 1054 76.3 20.5 3.2 0.0 0.0
Table A4.18: Type of relaxation given to Muslim teachers and students in School Hours for the Friday Prayer
V .DCNCN
OJgO h

Relaxation Number of Schools provided relaxationState Area to teacher/ No relaxation Break for about School closed Total
students 1 hour earlyN % N % N % N %
Rural Teachers 46 51.1 38 42.2 6 6.7 90 100.0Students 44 48.9 40 44.4 6 6.7 90 100.0
Assam Urban Teachers 21 65.6 9 28.1 2 6.3 32 100.0Students 21 65.6 9 28.1 2 6.3 32 100.0
Total Teachers 67 54.9 47 38.5 8 6.6 122 100.0Students 65 53.3 49 40.2 8 6.6 122 100.0
Rural Teachers 36 40.0 34 37.8 20 22.2 90 100.0Students 31 34.4 36 40.0 23 25.6 90 100.0
Bihar Urban Teachers 21 75.0 6 21.4 1 3.6 28 100.0Students 16 57.1 11 39.3 1 3.6 28 100.0
Total Teachers 57 48.3 40 33.9 21 17.8 118 100.0Students 47 39.8 47 39.8 24 20.3 118 100.0
Rural Teachers 4 13.3 26 86.7 0 .0 30 100.0Students 4 13.3 26 86.7 0 .0 30 100.0
Gujarat Urban Teachers 0 .0 12 100.0 0 .0 12 100.0Students 0 .0 12 100.0 0 .0 12 100.0
Total Teachers 4 9.5 38 90.5 0 .0 42 100.0Students 4 9.5 38 90.5 0 .0 42 100.0
Rural Teachers 26 86.7 3 10.0 1 3.3 30 100.0Students 26 86.7 3 10.0 1 3.3 30 100.0
Haryana Urban Teachers 6 50.0 5 41.7 1 8.3 12 100.0Students 6 50.0 5 41.7 1 8.3 12 100.0
Total Teachers 32 76.2 8 19.0 2 4.8 42 100.0Students 32 76.2 8 19.0 2 4.8 42 100.0
Rural Teachers 24 27.3 43 48.9 21 23.9 88 100.0
Jammu & Kashmir
Students 24 27.3 41 46.6 23 26.1 88 100.0Urban Teachers 5 20.8 7 29.2 12 50.0 24 100.0
Students 3 12.5 9 37.5 12 50.0 24 100.0Total Teachers 29 25.9 50 44.6 33 29.5 112 100.0
Students 27 24.1 50 44.6 35 31.3 112 100.0Rural Teachers 21 35.0 37 61.7 2 3.3 60 100.0
Students 20 33.3 37 61.7 3 5.0 60 100.0Jharkhand Urban Teachers 8 66.7 4 33.3 0 .0 12 100.0
Students 8 66.7 4 33.3 0 .0 12 100.0Total Teachers 29 40.3 41 56.9 2 2.8 72 100.0
Students 28 38.9 41 56.9 3 4.2 72 100.0Rural Teachers 25 69.4 11 30.6 0 .0 36 100.0
Students 24 66.7 12 33.3 0 .0 36 100.0Karnataka Urban Teachers 8 42.1 11 57.9 0 .0 19 100.0
Students 6 31.6 13 68.4 0 .0 19 100.0Total Teachers 33 60.0 22 40.0 0 .0 55 100.0
Students 30 54.5 25 45.5 0 .0 55 100.0Continued
OJgH3O h

Table A4.18 (Contd.): Type of relaxation given to Muslim teachers and studentsin School Hours for the Friday Prayer
State AreaRelaxation to teacher/ students
Number of Schools provided relaxationNo relaxation Break for about 1
hourSchool closed
earlyTotal
N % N % N % N %
Kerala
Rural Teachers 54 45.0 59 49.2 7 5.8 120 100.0Students 52 43.3 62 51.7 6 5.0 120 100.0
Urban Teachers 12 25.0 35 72.9 1 2.1 48 100.0Students 15 31.3 32 66.7 1 2.1 48 100.0
Total Teachers 66 39.3 94 56.0 8 4.8 168 100.0Students 67 39.9 94 56.0 7 4.2 168 100.0
MadhyaPradesh
Rural Teachers 23 76.7 6 20.0 1 3.3 30 100.0Students 2 6.7 27 90.0 1 3.3 30 100.0
Urban Teachers 5 62.5 3 37.5 0 .0 8 100.0Students 1 12.5 7 87.5 0 .0 8 100.0
Total Teachers 28 73.7 9 23.7 1 2.6 38 100.0Students 3 7.9 34 89.5 1 2.6 38 100.0
Rajasthan
Rural Teachers 19 63.3 11 36.7 0 .0 30 100.0Students 4 13.3 26 86.7 0 .0 30 100.0
Urban Teachers 5 62.5 3 37.5 0 .0 8 100.0Students 1 12.5 7 87.5 0 .0 8 100.0
Total Teachers 24 63.2 14 36.8 0 .0 38 100.0Students 5 13.2 33 86.8 0 .0 38 100.0
Uttar Pradesh
Rural Teachers 45 30.0 77 51.3 28 18.7 150 100.0Students 26 17.3 94 62.7 30 20.0 150 100.0
Urban Teachers 27 48.2 19 33.9 10 17.9 56 100.0Students 19 33.9 25 44.6 12 21.4 56 100.0
Total Teachers 72 35.0 96 46.6 38 18.4 206 100.0Students 45 21.8 119 57.8 42 20.4 206 100.0
Uttarakhand
Rural Teachers 15 51.7 10 34.5 4 13.8 29 100.0Students 14 48.3 10 34.5 5 17.2 29 100.0
Urban Teachers 8 66.7 3 25.0 1 8.3 12 100.0Students 9 75.0 2 16.7 1 8.3 12 100.0
Total Teachers 23 56.1 13 31.7 5 12.2 41 100.0Students 23 56.1 12 29.3 6 14.6 41 100.0
Total
Rural Teachers 338 43.2 355 45.3 90 11.5 783 100.0Students 271 34.6 414 52.9 98 12.5 783 100.0
Urban Teachers 126 46.5 117 43.2 28 10.3 271 100.0Students 105 38.7 136 50.2 30 11.1 271 100.0
Total Teachers 464 44.0 472 44.8 118 11.2 1054 100.0Students 376 35.7 550 52.2 128 12.1 1054 100.0
OJgO h

Appendix - Chapter 5
Table A5.1: Enrolment as on 30th September in Primary Classes in the year 2009, 2010 and 2011
Area: Rural
State YearEnrolment in primary classes
Total Muslim % of MuslimsTotal Girls % of girls Total Girls % of girls Total Girls
Assam2009 8385 4180 49.9 7043 3555 50.5 84.0 85.02010 8375 4250 50.7 7058 3490 49.4 84.3 82.12011 6682 3261 48.8 5716 2753 48.2 85.5 84.4
Bihar2009 23400 11177 47.8 14299 6843 47.9 61.1 61.22010 23946 11831 49.4 14648 7287 49.7 61.2 61.62011 24474 11986 49.0 14346 7016 48.9 58.6 58.5
Gujarat2009 4848 1908 39.4 2897 1032 35.6 59.8 54.12010 4752 1881 39.6 2792 1025 36.7 58.8 54.52011 4645 1903 41.0 2669 973 36.5 57.5 51.1
Haryana2009 5870 2766 47.1 5290 2540 48.0 90.1 91.82010 6394 3177 49.7 5300 2870 54.2 82.9 90.32011 7415 3628 48.9 6199 3402 54.9 83.6 93.8
Jammu & Kashmir
2009 3505 1723 49.2 2831 1388 49.0 80.8 80.62010 3385 1671 49.4 2715 1299 47.8 80.2 77.72011 3361 1622 48.3 2701 1294 47.9 80.4 79.8
Jharkhand2009 10631 5414 50.9 7061 3439 48.7 66.4 63.52010 10365 5305 51.2 7061 3456 48.9 68.1 65.12011 9523 4781 50.2 6460 3219 49.8 67.8 67.3
Karnataka2009 4137 1992 48.2 2317 1121 48.4 56.0 56.32010 4037 1992 49.3 2329 1118 48.0 57.7 56.12011 3932 1911 48.6 2313 1101 47.6 58.8 57.6
Kerala2009 16087 8035 49.9 9920 5065 51.1 61.7 63.02010 15492 7924 51.1 9570 4907 51.3 61.8 61.92011 14801 7407 50.0 9776 4632 47.4 66.0 62.5
MadhyaPradesh
2009 2108 977 46.3 1057 541 51.2 50.1 55.42010 2094 997 47.6 1050 541 51.5 50.1 54.32011 1894 901 47.6 996 519 52.1 52.6 57.6
Rajasthan2009 1992 892 44.8 1547 675 43.6 77.7 75.72010 1929 909 47.1 1506 652 43.3 78.1 71.72011 2194 1031 47.0 1733 801 46.2 79.0 77.7
UttarPradesh
2009 17156 8220 47.9 10644 5053 47.5 62.0 61.52010 17659 8590 48.6 10860 5192 47.8 61.5 60.42011 16921 8022 47.4 10439 4905 47.0 61.7 61.1
Uttarakhand2009 5630 2488 44.2 3768 1678 44.5 66.9 67.42010 5662 2609 46.1 4025 1749 43.5 71.1 67.02011 5809 2645 45.5 4198 1905 45.4 72.3 72.0
Total 2009 10374 49772 48.0 68674 32930 48.0 66.2 66.22010 10409 51136 49.1 68914 33586 48.7 66.2 65.72011 10165 49098 48.3 67546 32520 48.1 66.4 66.2
a ^CNCN
OJgO h

Table A5.2: Enrolment as on 30th September in Primary Classes in the year 2009, 2010 and 2011
Area: Urban
State YearEnrolment in primary classes
Total Muslim % of MuslimsTotal Girls % of girls Total Girls % of girls Total Girls
Assam2009 3538 1720 48.6 2240 1136 50.7 63.3 66.02010 3513 1713 48.8 2294 1214 52.9 65.3 70.92011 2773 1340 48.3 1834 949 51.7 66.1 70.8
Bihar2009 10725 5468 51.0 4836 2496 51.6 45.1 45.62010 9937 5257 52.9 4780 2533 53.0 48.1 48.22011 10819 5539 51.2 5015 2448 48.8 46.4 44.2
Gujarat2009 2492 1327 53.3 1467 802 54.7 58.9 60.42010 2352 1260 53.6 1373 731 53.2 58.4 58.02011 2449 1291 52.7 1410 813 57.7 57.6 63.0
Haryana2009 2939 1507 51.3 1729 799 46.2 58.8 53.02010 2946 1631 55.4 1729 886 51.2 58.7 54.32011 2682 1704 63.5 1499 957 63.8 55.9 56.2
Jammu & Kashmir
2009 1857 725 39.0 1073 434 40.4 57.8 59.92010 1880 765 40.7 1147 471 41.1 61.0 61.62011 1832 724 39.5 1110 420 37.8 60.6 58.0
Jharkhand2009 1851 843 45.5 770 336 43.6 41.6 39.92010 2071 825 39.8 883 364 41.2 42.6 44.12011 2011 825 41.0 972 402 41.4 48.3 48.7
Karnataka2009 2861 1409 49.2 1608 791 49.2 56.2 56.12010 2786 1375 49.4 1580 756 47.8 56.7 55.02011 2870 1397 48.7 1630 766 47.0 56.8 54.8
Kerala2009 7775 3531 45.4 4428 2040 46.1 57.0 57.82010 7357 3384 46.0 4227 2040 48.3 57.5 60.32011 7210 3301 45.8 3953 2011 50.9 54.8 60.9
MadhyaPradesh
2009 1560 860 55.1 323 202 62.5 20.7 23.52010 1531 859 56.1 319 201 63.0 20.8 23.42011 1411 748 53.0 285 162 56.8 20.2 21.7
Rajasthan2009 912 371 40.7 421 171 40.6 46.2 46.12010 728 326 44.8 366 157 42.9 50.3 48.22011 835 393 47.1 359 149 41.5 43.0 37.9
UttarPradesh
2009 6973 3315 47.5 4202 2015 48.0 60.3 60.82010 7132 3370 47.3 4117 1977 48.0 57.7 58.72011 6714 3201 47.7 4249 2111 49.7 63.3 65.9
Uttarakhand2009 937 482 51.4 662 324 48.9 70.7 67.22010 943 520 55.1 768 345 44.9 81.4 66.32011 887 481 54.2 576 321 55.7 64.9 66.7
Total 2009 44420 21558 48.5 23759 11546 48.6 53.5 53.62010 43176 21285 49.3 23583 11675 49.5 54.6 54.92011 42493 20944 49.3 22892 11509 50.3 53.9 55.0
oc nCN
OJgO h

Table A5.3: Enrolment as on 30th September in Primary Classes in the year 2009, 2010 and 2011
Area: Total (Rural + Urban)
State YearEnrolment in primary classes
Total Muslim % of MuslimsTotal Girls % of girls Total Girls % of girls Total Girls
Assam2009 11923 5900 49.5 9283 4691 50.5 77.9 79.52010 11888 5963 50.2 9352 4704 50.3 78.7 78.92011 9455 4601 48.7 7550 3702 49.0 79.9 80.5
Bihar2009 34125 16645 48.8 19135 9339 48.8 56.1 56.12010 33883 17088 50.4 19428 9820 50.5 57.3 57.52011 35293 17525 49.7 19361 9464 48.9 54.9 54.0
Gujarat2009 7340 3235 44.1 4364 1834 42.0 59.5 56.72010 7104 3141 44.2 4165 1756 42.2 58.6 55.92011 7094 3194 45.0 4079 1786 43.8 57.5 55.9
Haryana2009 8809 4273 48.5 7019 3339 47.6 79.7 78.12010 9340 4808 51.5 7029 3756 53.4 75.3 78.12011 10097 5332 52.8 7698 4359 56.6 76.2 81.8
Jammu & Kashmir
2009 5362 2448 45.7 3904 1822 46.7 72.8 74.42010 5265 2436 46.3 3862 1770 45.8 73.4 72.72011 5193 2346 45.2 3811 1714 45.0 73.4 73.1
Jharkhand2009 12482 6257 50.1 7831 3775 48.2 62.7 60.32010 12436 6130 49.3 7944 3820 48.1 63.9 62.32011 11534 5606 48.6 7432 3621 48.7 64.4 64.6
Karnataka2009 6998 3401 48.6 3925 1912 48.7 56.1 56.22010 6823 3367 49.3 3909 1874 47.9 57.3 55.72011 6802 3308 48.6 3943 1867 47.3 58.0 56.4
Kerala2009 23862 11566 48.5 14348 7105 49.5 60.1 61.42010 22849 11308 49.5 13797 6947 50.4 60.4 61.42011 22011 10708 48.6 13729 6643 48.4 62.4 62.0
MadhyaPradesh
2009 3668 1837 50.1 1380 743 53.8 37.6 40.42010 3625 1856 51.2 1369 742 54.2 37.8 40.02011 3305 1649 49.9 1281 681 53.2 38.8 41.3
Rajasthan2009 2904 1263 43.5 1968 846 43.0 67.8 67.02010 2657 1235 46.5 1872 809 43.2 70.5 65.52011 3029 1424 47.0 2092 950 45.4 69.1 66.7
UttarPradesh
2009 24129 11535 47.8 14846 7068 47.6 61.5 61.32010 24791 11960 48.2 14977 7169 47.9 60.4 59.92011 23635 11223 47.5 14688 7016 47.8 62.1 62.5
Uttarakhand2009 6567 2970 45.2 4430 2002 45.2 67.5 67.42010 6605 3129 47.4 4793 2094 43.7 72.6 66.92011 6696 3126 46.7 4774 2226 46.6 71.3 71.2
Total 2009 14816 71330 48.1 92433 44476 48.1 62.4 62.42010 14726 72421 49.2 92497 45261 48.9 62.8 62.52011 14414 70042 48.6 90438 44029 48.7 62.7 62.9 0 0
CNOJg
O h

Table A5.4: Enrolment as on 30th September in Upper Primary Classesin the years 2009, 2010 and 2011
Area: Rural
State YearEnrolment in upper primary classes
Total Muslim % of MuslimsTotal Girls % of girls Total Girls % of girls Total Girls
Assam2009 2949 1520 51.5 2285 1229 53.8 77.5 80.92010 2879 1533 53.2 2251 1259 55.9 78.2 82.12011 3101 1692 54.6 2438 1321 54.2 78.6 78.1
Bihar2009 2669 1142 42.8 1469 668 45.5 55.0 58.52010 3273 1521 46.5 1668 824 49.4 51.0 54.22011 4147 2100 50.6 2176 1107 50.9 52.5 52.7
Gujarat2009 589 215 36.5 403 151 37.5 68.4 70.22010 661 243 36.8 436 159 36.5 66.0 65.42011 786 312 39.7 483 183 37.9 61.5 58.7
Haryana2009 933 282 30.2 670 223 33.3 71.8 79.12010 1030 324 31.5 755 248 32.8 73.3 76.52011 1493 485 32.5 1066 449 42.1 71.4 92.6
Jammu & Kashmir
2009 1465 665 45.4 1066 476 44.7 72.8 71.62010 1629 766 47.0 1204 561 46.6 73.9 73.22011 1737 842 48.5 1338 656 49.0 77.0 77.9
Jharkhand2009 1782 981 55.1 849 468 55.1 47.6 47.72010 1756 934 53.2 795 391 49.2 45.3 41.92011 2184 1206 55.2 1066 529 49.6 48.8 43.9
Karnataka2009 1809 885 48.9 1023 486 47.5 56.6 54.92010 1786 864 48.4 927 453 48.9 51.9 52.42011 1907 927 48.6 1030 505 49.0 54.0 54.5
Kerala2009 12737 6462 50.7 7110 3594 50.5 55.8 55.62010 12764 6469 50.7 7198 3645 50.6 56.4 56.32011 13509 6475 47.9 7137 3606 50.5 52.8 55.7
MadhyaPradesh
2009 1245 615 49.4 557 271 48.7 44.7 44.12010 1402 742 52.9 666 359 53.9 47.5 48.42011 1578 875 55.4 837 489 58.4 53.0 55.9
Rajasthan2009 274 50 18.2 174 25 14.4 63.5 50.02010 333 92 27.6 190 46 24.2 57.1 50.02011 432 196 45.4 230 99 43.0 53.2 50.5
UttarPradesh
2009 4694 2127 45.3 2024 843 41.7 43.1 39.62010 5074 2388 47.1 2298 1057 46.0 45.3 44.32011 5123 2250 43.9 2405 1043 43.4 46.9 46.4
Uttarakhand2009 908 337 37.1 409 169 41.3 45.0 50.12010 920 366 39.8 442 171 38.7 48.0 46.72011 904 382 42.3 493 193 39.1 54.5 50.5
Total2009 32054 15281 47.7 18039 8603 47.7 56.3 56.32010 33507 16242 48.5 18830 9173 48.7 56.2 56.52011 36901 17742 48.1 20699 10180 49.2 56.1 57.4
CNc nCN
OJgO h

Table A5.5: Enrolment as on 30th September in Upper Primary Classesin the years 2009, 2010 and 2011
Area: Urban
State YearEnrolment in upper primary classes
Total Muslim % of MuslimsTotal Girls % of girls Total Girls % of girls Total Girls
Assam2009 1752 947 54.1 1053 584 55.5 60.1 61.72010 1752 972 55.5 1132 648 57.2 64.6 66.72011 1734 954 55.0 1148 685 59.7 66.2 71.8
Bihar2009 5566 3084 55.4 1931 1171 60.6 34.7 38.02010 5870 3399 57.9 2421 1386 57.2 41.2 40.82011 6121 3212 52.5 2524 1108 43.9 41.2 34.5
Gujarat2009 654 403 61.6 285 210 73.7 43.6 52.12010 605 375 62.0 317 217 68.5 52.4 57.92011 703 441 62.7 358 256 71.5 50.9 58.0
Haryana2009 886 283 31.9 628 185 29.5 70.9 65.42010 955 334 35.0 698 223 31.9 73.1 66.82011 953 325 34.1 635 227 35.7 66.6 69.8
Jammu & Kashmir
2009 1070 404 37.8 673 244 36.3 62.9 60.42010 1023 397 38.8 665 255 38.3 65.0 64.22011 1037 398 38.4 671 260 38.7 64.7 65.3
Jharkhand2009 377 118 31.3 132 37 28.0 35.0 31.42010 418 146 34.9 157 55 35.0 37.6 37.72011 468 189 40.4 168 67 39.9 35.9 35.4
Karnataka2009 1215 581 47.8 617 302 48.9 50.8 52.02010 1145 544 47.5 654 332 50.8 57.1 61.02011 1075 551 51.3 603 302 50.1 56.1 54.8
Kerala2009 5583 2339 41.9 2913 1251 42.9 52.2 53.52010 5315 2278 42.9 2821 1175 41.7 53.1 51.62011 5303 2285 43.1 2397 1142 47.6 45.2 50.0
MadhyaPradesh
2009 507 269 53.1 243 148 60.9 47.9 55.02010 491 253 51.5 261 145 55.6 53.2 57.32011 475 247 52.0 254 142 55.9 53.5 57.5
Rajasthan2009 243 64 26.3 94 12 12.8 38.7 18.82010 220 44 20.0 92 17 18.5 41.8 38.62011 236 56 23.7 107 14 13.1 45.3 25.0
UttarPradesh
2009 3195 1554 48.6 1313 614 46.8 41.1 39.52010 3354 1572 46.9 1452 690 47.5 43.3 43.92011 3371 1570 46.6 1522 750 49.3 45.1 47.8
Uttarakhand2009 387 221 57.1 140 155 110.7 36.2 70.12010 391 229 58.6 160 164 102.5 40.9 71.62011 426 267 62.7 159 189 118.9 37.3 70.8
Total2009 21435 10267 47.9 10022 4913 49.0 46.8 47.92010 21539 10543 48.9 10830 5307 49.0 50.3 50.32011 21902 10495 47.9 10546 5142 48.8 48.2 49.0 c n
c nCNOJeg
O h

Table A5.6: Enrolment as on 30th September in Upper Primary Classesin the years 2009, 2010 and 2011
Area: Total (Rural + Urban)
State YearEnrolment in upper primary classes
Total Muslim % of MuslimsTotal Girls % of girls Total Girls % of girls Total Girls
Assam2009 4701 2467 52.5 3338 1813 54.3 71.0 73.52010 4631 2505 54.1 3383 1907 56.4 73.1 76.12011 4835 2646 54.7 3586 2006 55.9 74.2 75.8
Bihar2009 8235 4226 51.3 3400 1839 54.1 41.3 43.52010 9143 4920 53.8 4089 2210 54.0 44.7 44.92011 10268 5312 51.7 4700 2215 47.1 45.8 41.7
Gujarat2009 1243 618 49.7 688 361 52.5 55.3 58.42010 1266 618 48.8 753 376 49.9 59.5 60.82011 1489 753 50.6 841 439 52.2 56.5 58.3
Haryana2009 1819 565 31.1 1298 408 31.4 71.4 72.22010 1985 658 33.1 1453 471 32.4 73.2 71.62011 2446 810 33.1 1701 676 39.7 69.5 83.5
Jammu & Kashmir
2009 2535 1069 42.2 1739 720 41.4 68.6 67.42010 2652 1163 43.9 1869 816 43.7 70.5 70.22011 2774 1240 44.7 2009 916 45.6 72.4 73.9
Jharkhand2009 2159 1099 50.9 981 505 51.5 45.4 46.02010 2174 1080 49.7 952 446 46.8 43.8 41.32011 2652 1395 52.6 1234 596 48.3 46.5 42.7
Karnataka2009 3024 1466 48.5 1640 788 48.0 54.2 53.82010 2931 1408 48.0 1581 785 49.7 53.9 55.82011 2982 1478 49.6 1633 807 49.4 54.8 54.6
Kerala2009 18320 8801 48.0 10023 4845 48.3 54.7 55.12010 18079 8747 48.4 10019 4820 48.1 55.4 55.12011 18812 8760 46.6 9534 4748 49.8 50.7 54.2
MadhyaPradesh
2009 1752 884 50.5 800 419 52.4 45.7 47.42010 1893 995 52.6 927 504 54.4 49.0 50.72011 2053 1122 54.7 1091 631 57.8 53.1 56.2
Rajasthan2009 517 114 22.1 268 37 13.8 51.8 32.52010 553 136 24.6 282 63 22.3 51.0 46.32011 668 252 37.7 337 113 33.5 50.4 44.8
UttarPradesh
2009 7889 3681 46.7 3337 1457 43.7 42.3 39.62010 8428 3960 47.0 3750 1747 46.6 44.5 44.12011 8494 3820 45.0 3927 1793 45.7 46.2 46.9
Uttarakhand2009 1295 558 43.1 549 324 59.0 42.4 58.12010 1311 595 45.4 602 335 55.6 45.9 56.32011 1330 649 48.8 652 382 58.6 49.0 58.9
Total2009 53489 25548 47.8 28061 13516 48.2 52.5 52.92010 55046 26785 48.7 29660 14480 48.8 53.9 54.12011 58803 28237 48.0 31245 15322 49.0 53.1 54.3
c nCN
OJgO h

Table A5.7: Percentage of School leavers and dropout at Primary Stage in 2009-10 and 2010-11
State Area YearSchool Leavers Dropouts
Muslim Non-Muslim Muslim Non-MuslimTotal Girls Total Girls Total Girls Total Girls
Assam
Rural 2009-10 11.1 11.6 9.0 1.9 8.1 7.3 4.6 4.32010-11 14.4 15.4 11.8 3.8 10.5 11.4 8.6 2.6
Urban 2009-10 5.1 3.9 2.7 0.7 3.7 3.0 1.8 0.52010-11 5.4 5.1 5.4 6.0 4.9 4.9 4.3 4.8
Total 2009-10 9.6 9.8 5.9 1.3 7.1 6.2 3.2 2.52010-11 12.2 12.7 8.7 4.7 9.2 9.7 6.5 3.5
Bihar
Rural 2009-10 1.9 1.6 1.6 1.6 0.9 0.8 0.6 0.32010-11 1.6 1.0 0.3 0.7 0.6 0.5 0.5 0.4
Urban 2009-10 1.9 2.7 1.3 1.0 0.7 1.0 0.5 0.22010-11 2.8 4.3 1.7 1.8 1.3 2.1 0.8 0.6
Total 2009-10 1.9 1.9 1.5 1.3 0.9 0.9 0.5 0.32010-11 1.9 1.9 0.8 1.1 0.8 0.9 0.6 0.5
Gujarat
Rural 2009-10 3.5 4.6 5.6 4.3 0.6 0.6 2.1 1.82010-11 4.0 4.6 5.8 4.3 0.5 0.5 3.0 2.0
Urban 2009-10 8.0 7.7 9.7 9.7 1.1 1.0 1.4 1.02010-11 6.1 6.7 6.6 5.1 0.8 0.5 1.2 1.1
Total 2009-10 5.0 5.9 7.0 6.4 0.8 0.8 1.8 1.52010-11 4.7 5.5 6.1 4.6 0.6 0.5 2.4 1.7
Haryana
Rural 2009-10 1.3 1.4 1.2 1.3 0.4 0.6 0.0 0.42010-11 2.1 1.5 5.9 8.8 1.2 0.9 5.0 4.9
Urban 2009-10 1.3 1.3 7.8 6.1 0.6 0.4 4.2 1.62010-11 1.4 2.7 7.9 6.6 0.3 0.7 2.2 0.0
Total 2009-10 1.3 1.3 5.6 4.9 0.5 0.6 2.8 1.32010-11 1.9 1.8 7.0 7.2 1.0 0.8 3.5 1.4
Jammu & Kashmir
Rural 2009-10 7.2 7.6 7.3 9.9 2.2 2.9 3.3 2.72010-11 5.4 6.2 6.9 3.5 2.1 2.6 2.1 1.3
Urban 2009-10 4.0 4.8 3.6 2.4 0.4 0.0 0.6 0.02010-11 3.4 4.0 4.5 5.4 0.3 0.0 1.4 1.4
Total 2009-10 6.3 6.9 5.3 6.4 1.7 2.2 1.9 1.42010-11 4.8 5.6 5.6 4.4 1.6 1.9 1.7 1.4
Jharkhand
Rural 2009-10 2.2 1.7 0.6 1.7 1.0 0.3 0-.4 0.72010-11 1.9 1.9 1.2 1.1 0.4 0.4 0.9 0.6
Urban 2009-10 3.1 2.1 3.5 3.7 0.6 0.6 1.1 1.62010-11 3.2 4.7 2.9 2.6 1.0 2.5 0.4 0.7
Total 2009-10 2.2 1.7 1.3 2.1 0.9 0.3 0.0 0.92010-11 2.1 2.2 1.6 1.4 0.5 0.6 0.8 0.6
Karnataka
Rural 2009-10 1.8 1.7 2.7 3.0 0.0 0.0 0.0 0.02010-11 .9 0.6 1.8 1.9 0.0 0.0 0.0 0.0
Urban 2009-10 1.3 2.4 3.1 0.8 0.0 0.0 0.0 0.02010-11 2.0 2.6 0.7 0.6 0.0 0.0 0.0 0.0
Total 2009-10 1.6 2.0 2.9 2.1 0.0 0.0 0.0 0.02010-11 1.3 1.4 1.4 1.4 0.0 0.0 0.0 0.0
Continued...OJg
O h

Table 5.7 (contd.): Percentage of School leavers and dropout at Primary Stagein 2009-10 and 2010-11
State Area YearSchool Leavers Dropouts
Muslim Non-Muslim Muslim Non-MuslimTotal Girls Total Girls Total Girls Total Girls
Kerala
Rural 2009-10 1.6 1.7 1.3 1.1 0.1 0.1 0.1 0.12010-11 1.6 1.6 1.7 1.5 0.1 0.1 0.1 0.0
Urban 2009-10 1.4 1.5 0.8 0.7 0.0 0.0 0.1 0.02010-11 1.6 1.4 1.5 1.9 0.1 0.1 0.6 0.8
Total 2009-10 1.5 1.6 1.2 1.0 0.1 0.1 0.1 0.02010-11 1.6 1.5 1.6 1.6 0.1 0.1 0.3 0.3
MadhyaPradesh
Rural 2009-10 9.5 8.3 9.8 10.6 4.0 3.9 3.8 3.22010-11 7.9 7.8 13.0 12.7 3.0 4.1 5.3 4.6
Urban 2009-10 13.3 12.4 10.1 11.2 6.2 7.4 3.6 3.32010-11 7.5 5.5 9.2 8.2 4.7 4.5 1.2 .6
Total 2009-10 10.4 9.4 10.0 11.0 4.5 4.8 3.7 3.32010-11 7.8 7.1 11.0 10.1 3.4 4.2 3.1 2.2
Rajasthan
Rural 2009-10 18.9 20.6 17.8 18.4 15.2 17.3 11.0 12.42010-11 14.5 13.8 10.2 8.6 11.3 10.3 6.4 6.6
Urban 2009-10 24.0 23.4 33.2 27.5 19.2 17.5 17.9 12.02010-11 18.6 17.2 21.0 13.0 10.4 9.6 8.3 7.1
Total 2009-10 20.0 21.2 25.9 22.8 16.1 17.4 14.6 12.22010-11 15.3 14.5 15.2 10.3 11.1 10.1 7.3 6.8
Uttar Pradesh
Rural 2009-10 7.3 6.7 4.9 5.0 3.0 3.1 1.1 1.02010-11 8.8 8.5 7.8 7.7 4.8 4.5 4.1 3.4
Urban 2009-10 4.1 4.7 4.7 3.8 1.7 2.1 3.1 2.22010-11 5.8 6.1 4.3 4.5 2.7 2.6 3.4 3.5
Total 2009-10 6.4 6.1 4.8 4.7 2.7 2.8 1.7 1.42010-11 8.0 7.8 6.7 6.7 4.2 4.0 3.9 3.4
Uttarakhand
Rural 2009-10 11.9 9.8 7.4 7.7 2.4 3.0 2.5 2.82010-11 7.5 8.8 6.7 5.7 2.1 2.6 1.5 2.7
Urban 2009-10 8.6 9.6 14.5 10.1 1.8 2.2 2.9 3.82010-11 7.0 9.6 4.6 5.7 3.0 4.3 3.4 1.7
Total 2009-10 11.4 9.7 8.3 8.1 2.3 2.8 2.5 3.02010-11 7.4 8.9 6.5 5.7 2.3 2.9 1.7 2.5
Total
Rural 2009-10 4.9 4.7 3.5 3.3 2.3 2.2 1.1 1.12010-11 5.1 4.9 4.0 3.5 2.6 2.7 2.0 1.5
Urban 2009-10 3.7 3.9 4.3 3.6 1.4 1.4 1.8 1.12010-11 3.9 4.5 3.9 3.8 1.7 1.9 1.6 1.4
Total 2009-10 4.6 4.5 3.8 3.4 2.1 2.0 1.3 1.12010-11 4.8 4.8 3.9 3.6 2.4 2.5 1.9 1.5
OJegH3O h

Table A5.8: Percentage of School leavers and dropout at Upper Primary Stage in 2009-10 and 2010-11
State Area YearSchool Leavers Dropouts
Muslim Non-Muslim Muslim Non-MuslimTotal Girls Total Girls Total Girls Total Girls
Assam
Rural 2009-10 13.3 12.9 7.1 4.8 10.9 10.7 6.0 3.82010-11 9.1 7.1 11.9 6.9 6.4 5.0 9.1 4.4
Urban 2009-10 11.8 10.3 4.1 1.7 9.3 6.8 3.1 0.82010-11 11.7 11.9 14.0 -2.8 9.5 9.6 7.9 -4.3
Total 2009-10 12.8 12.0 5.6 3.1 10.4 9.4 4.5 2.12010-11 10.0 8.8 13.0 1.7 7.5 6.6 8.5 -0.3
Bihar
Rural 2009-10 2.9 1.2 -1.6 0.6 1.1 0.9 0.7 0.42010-11 0.2 0.2 0.0 0.0 0.0 0.0 0.0 0.0
Urban 2009-10 1.7 2.7 0.6 0.4 0.9 1.1 0.4 0.32010-11 0.9 1.3 0.6 0.6 0.6 0.7 0.6 0.6
Total 2009-10 2.2 2.2 0.1 0.4 1.0 1.0 0.5 0.32010-11 0.6 0.9 0.4 0.5 0.4 0.5 0.4 0.4
Gujarat
Rural 2009-10 1.0 1.3 5.9 6.3 0.0 0.0 1.1 0.02010-11 1.8 3.1 7.1 7.1 0.2 0.0 1.8 1.2
Urban 2009-10 8.1 9.5 4.3 4.7 0.0 0.0 0.0 0.02010-11 4.4 2.3 2.8 1.9 0.0 0.0 1.4 1.3
Total 2009-10 3.9 6.1 4.9 5.1 0.0 0.0 0.4 0.02010-11 2.9 2.7 4.7 3.7 0.1 0.0 1.6 1.2
Haryana
Rural 2009-10 20.6 17.0 7.6 28.8 6.0 6.3 4.6 5.12010-11 13.5 12.1 25.5 42.1 7.4 7.3 15.6 18.4
Urban 2009-10 0.5 0.5 1.9 3.1 0.2 0.0 0.8 1.02010-11 7.3 9.0 10.9 15.3 5.9 4.9 5.4 6.3
Total 2009-10 10.9 9.6 4.8 12.7 3.2 3.4 2.7 2.52010-11 10.5 10.6 18.4 26.2 6.7 6.2 10.7 11.2
Jammu & Kashmir
Rural 2009-10 5.5 5.9 5.0 2.6 1.1 1.9 0.5 0.02010-11 13.3 14.4 8.5 3.9 2.6 4.6 2.1 2.0
Urban 2009-10 6.7 6.1 3.0 2.5 1.2 2.5 0.3 0.02010-11 6.6 6.3 2.0 2.1 1.7 2.0 0.6 0.7
Total 2009-10 6.0 6.0 4.0 2.6 1.2 2.1 0.4 0.02010-11 10.9 11.9 5.5 3.2 2.2 3.8 1.4 1.4
Jharkhand
Rural 2009-10 7.7 6.8 7.5 4.9 7.7 6.6 6.4 4.52010-11 3.9 3.1 6.5 3.7 2.1 2.0 3.9 2.4
Urban 2009-10 0.0 0.0 0.0 0.0 0.0 0.0 0.0 0.02010-11 2.5 5.5 2.3 1.1 1.9 5.5 2.3 1.1
Total 2009-10 6.6 6.3 5.9 4.2 6.6 6.1 5.1 3.92010-11 3.7 3.4 5.6 3.3 2.1 2.5 3.5 2.2
Karnataka
Rural 2009-10 0.7 1.0 1.9 1.3 0.0 0.0 0.0 0.02010-11 0.9 0.7 2.4 1.9 0.0 0.0 0.0 0.0
Urban 2009-10 1.5 1.0 1.5 1.1 0.0 0.0 0.0 0.02010-11 2.3 1.5 2.6 1.9 0.0 0.0 0.0 0.0
Total 2009-10 1.0 1.0 1.7 1.2 0.0 0.0 0.0 0.02010-11 1.5 1.0 2.5 1.9 0.0 0.0 0.0 0.0
Continued.OJeg
O h

Table A5.8 (contd.): Percentage of School leavers and dropout at Upper Primary Stagein 2009-10 and 2010-11
State Area YearSchool Leavers Dropouts
Muslim Non-Muslim Muslim Non-MuslimTotal Girls Total Girls Total Girls Total Girls
Kerala
Rural 2009-10 0.3 0.3 0.2 0.3 0.0 0.0 0.0 0.02010-11 0.4 0.2 0.6 0.4 0.0 0.0 0.0 0.0
Urban 2009-10 0.9 1.0 0.5 0.6 0.0 0.0 0.0 0.02010-11 1.0 0.8 1.0 0.8 0.1 0.1 0.2 0.1
Total 2009-10 0.5 0.5 0.3 0.4 0.0 0.0 0.0 0.02010-11 0.6 0.3 0.8 0.5 0.0 0.0 0.1 0.0
MadhyaPradesh
Rural 2009-10 7.4 5.2 8.1 6.4 2.9 3.0 3.9 1.72010-11 3.6 2.8 3.3 3.4 1.7 1.9 0.7 0.8
Urban 2009-10 14.8 12.2 25.0 24.0 6.6 3.4 6.1 5.02010-11 4.6 2.1 8.3 13.0 3.1 1.4 3.0 2.8
Total 2009-10 9.6 7.6 12.8 11.0 4.0 3.1 4.5 2.62010-11 3.9 2.6 4.5 5.5 2.0 1.8 1.2 1.2
Rajasthan
Rural 2009-10 12.1 24.0 10.0 24.0 9.2 12.0 8.0 24.02010-11 7.9 4.3 8.4 6.5 4.2 2.2 7.7 6.5
Urban 2009-10 22.3 16.7 12.1 19.2 11.7 16.7 8.1 13.52010-11 10.9 23.5 11.7 14.8 5.4 11.8 8.6 14.8
Total 2009-10 15.7 21.6 11.2 20.8 10.1 13.5 8.0 16.92010-11 8.9 9.5 10.0 9.6 4.6 4.8 8.1 9.6
Uttar Pradesh
Rural 2009-10 8.3 9.0 8.2 6.6 1.6 2.6 1.5 1.22010-11 9.8 9.5 7.7 5.0 3.9 3.9 2.3 1.4
Urban 2009-10 3.3 4.2 6.3 6.3 1.8 2.3 5.0 4.32010-11 4.1 4.8 7.2 7.8 2.7 2.6 5.9 5.0
Total 2009-10 6.3 7.0 7.4 6.5 1.7 2.5 2.9 2.52010-11 7.6 7.6 7.5 6.1 3.4 3.4 3.8 2.8
Uttarakhand
Rural 2009-10 13.0 13.6 12.4 7.7 1.5 8.3 3.6 1.82010-11 6.1 1.8 9.2 6.7 0.7 0.0 1.0 1.0
Urban 2009-10 7.9 7.1 2.4 9.1 7.1 6.5 0.4 1.52010-11 10.6 9.8 3.5 10.8 8.1 7.3 1.3 3.1
Total 2009-10 11.7 10.5 9.1 8.1 2.9 7.4 2.5 1.72010-11 7.3 5.7 7.3 7.7 2.7 3.6 1.1 1.5
Total
Rural 2009-10 5.1 4.6 3.7 3.1 2.5 2.8 1.5 1.02010-11 4.5 3.8 4.1 2.8 1.9 1.8 1.6 1.0
Urban 2009-10 3.7 4.1 2.8 2.7 1.8 1.8 1.4 1.22010-11 3.8 3.9 3.5 2.6 2.3 2.4 2.2 1.2
Total 2009-10 4.6 4.4 3.3 2.9 2.3 2.4 1.5 1.12010-11 4.2 3.8 3.9 2.7 2.0 2.0 1.8 1.1
OJgH3O h

Table A5.9: Enrolment and Number of students found present on the day of visit
State Area CategoryPrimary Schools Schools having Upper Primary Classes
All Students Muslim Students All Students Muslim StudentsEnrolment
%Present
Enrolment
%Present
Enrolment
%Present
Enrolment
%Present
Assam
Rural Total 6978 68.3 6261 67.3 4738 61.5 3773 59.2Girls 3486 67.2 3086 65.3 2555 62.0 2044 61.5
Urban Total 3558 56.3 2308 57.3 2326 65.6 1503 68.4Girls 1739 59.6 1270 52.3 1306 68.2 872 73.4
Total Total 10536 64.3 8569 64.6 7064 62.9 5276 61.8Girls 5225 64.7 4356 61.5 3861 64.1 2916 65.1
Bihar
Rural Total 13135 61.6 8070 64.1 12939 59.8 7082 62.5Girls 6565 60.9 3551 68.7 6717 58.0 4398 54.5
Urban Total 3192 58.3 1530 55.9 7261 55.0 2989 58.1Girls 1640 54.6 753 52.1 5487 59.6 2411 61.0
Total Total 16327 61.0 9600 62.8 20200 58.0 10071 61.2Girls 8205 59.6 4304 65.8 12204 58.7 6809 56.8
Gujarat
Rural Total 2916 89.0 1851 93.0 2274 86.2 1291 95.1Girls 1151 91.0 638 92.8 899 82.8 520 92.9
Urban Total 1208 86.8 753 90.8 1939 80.4 1124 85.0Girls 492 85.8 327 91.7 1233 78.2 733 87.0
Total Total 4124 88.4 2604 92.4 4213 83.6 2415 90.4Girls 1643 89.4 965 92.4 2132 80.1 1253 89.5
Haryana
Rural Total 6039 76.5 5240 77.0 2364 77.5 2042 80.4Girls 2870 80.5 2581 75.3 1027 79.9 917 79.1
Urban Total 1210 84.5 639 60.1 1056 83.0 891 80.1Girls 734 88.3 524 46.2 382 84.6 330 80.3
Total Total 7249 77.8 5879 75.2 3420 79.2 2933 80.3Girls 3604 82.0 3105 70.4 1409 81.2 1247 79.4
Jammu & Kashmir
Rural Total 1283 75.1 1058 71.4 3250 75.6 2526 78.9Girls 614 79.0 540 75.0 1594 76.5 1224 76.1
Urban Total 1558 90.1 922 94.7 1976 90.4 1156 89.5Girls 616 86.7 331 88.5 667 90.7 420 91.4
Total Total 2841 83.3 1980 82.2 5226 81.2 3682 82.2Girls 1230 82.8 871 80.1 2261 80.7 1644 80.0
Jharkhand
Rural Total 4649 60.6 3760 60.0 5963 58.4 3296 59.8Girls 2601 61.6 2156 59.2 3162 54.0 1559 59.7
Urban Total 764 75.7 341 67.4 1967 70.1 831 68.0Girls 351 74.1 160 71.3 778 78.7 339 70.2
Total Total 5413 62.8 4101 60.6 7930 61.3 4127 61.5Girls 2952 63.1 2316 60.0 3940 58.9 1898 61.5
Karnataka
Rural Total 136 95.6 87 96.6Girls 68 94.1 42 95.2
Urban Total 51 100.0 38 100.0 518 100.0 413 100.0Girls 26 100.0 19 100.0 242 100.0 195 100.0
Total Total 51 100.0 38 100.0 654 99.1 500 99.4Girls 26 100.0 19 100.0 310 98.7 237 99.2
Continued... OJgO h

Table A5.9 (Contd.): Enrolment and Number of students found present on the day of visit
State Area CategoryPrimary Schools Schools having Upper Primary Classes
All Students Muslim Students All Students Muslim StudentsEnrolment
%Present
Enrolment
%Present
Enrolment
%Present
Enrolment
%Present
Kerala
Rural Total 3455 90.9 2458 96.9 5711 79.9 3090 83.1Girls 1695 94.0 1202 96.3 2962 71.8 1626 91.4
Urban Total 202 97.0 98 99.0 1492 89.1 613 80.3Girls 97 97.9 49 100.0 658 90.7 232 60.8
Total Total 3657 91.2 2556 97.0 7203 81.8 3703 82.6Girls 1792 94.2 1251 96.4 3620 75.2 1858 87.6
MadhyaPradesh
Rural Total 1705 53.3 903 49.4 1329 43.3 757 38.4Girls 821 53.6 470 53.0 744 38.3 436 39.4
Urban Total 1299 57.5 260 62.7 308 61.4 118 51.7Girls 707 50.5 152 61.8 151 63.6 63 54.0
Total Total 3004 55.1 1163 52.4 1637 46.7 875 40.2Girls 1528 52.2 622 55.1 895 42.6 499 41.3
Rajasthan
Rural Total 966 52.1 851 49.8 1122 68.4 526 63.5Girls 491 50.5 444 48.4 524 54.0 226 60.6
Urban Total 331 50.8 165 73.9 711 48.1 311 83.3Girls 179 49.7 83 75.9 244 63.5 85 80.0
Total Total 1297 51.7 1016 53.7 1833 60.6 837 70.8Girls 670 50.3 527 52.8 768 57.0 311 65.9
UttarPradesh
Rural Total 14540 61.7 8662 60.5 7126 75.9 3742 78.9Girls 7262 61.1 4481 63.1 2921 72.4 1568 74.4
Urban Total 5809 71.8 3587 71.3 4357 87.0 2234 80.8Girls 2773 76.0 1766 78.3 1917 83.4 1066 83.5
Total Total 20349 64.6 12249 63.6 11483 80.1 5976 79.6Girls 10035 65.2 6247 67.4 4838 76.7 2634 78.1
Uttarakhand
Rural Total 3835 70.9 2882 72.2 2248 84.4 1476 81.2Girls 1820 72.6 1381 73.1 878 86.2 603 85.4
Urban Total 978 67.7 592 71.8 292 72.9 190 74.7Girls 471 69.0 315 66.7 220 68.2 160 67.5
Total Total 4813 70.2 3474 72.2 2540 83.1 1666 80.5Girls 2291 71.9 1696 71.9 1098 82.6 763 81.7
Total
Rural Total 59501 67.4 41996 68.4 49200 68.6 29688 70.5Girls 29376 67.5 20530 68.8 24051 64.9 15163 67.5
Urban Total 20160 69.0 11233 69.0 24203 72.3 12373 74.4Girls 9825 69.2 5749 66.5 13285 71.5 6906 73.4
Total Total 79661 67.8 53229 68.5 73403 69.8 42061 71.6Girls 39201 67.9 26279 68.3 37336 67.2 22069 69.4
Note: Since the data was collected during vacation in many schools in Karnataka and Kerala, no data were received in relation to attendance of teachers and students for those schools.
OJegO h

Table A5.10: Number of Members in School Management Committee (SMC) and Number of those whoattended the last meeting
State Area Category Total Members Muslim MembersMale Female Total Male Female Total
Assam
Rural Total Number of Members 636 514 1150 503 372 875% those who attended the last meeting 76.9 74.3 75.7 76.1 74.5 75.4
Urban Total Number of Members 230 187 417 115 74 189% those who attended the last meeting 67.4 70.6 68.8 74.8 81.1 77.2
Total Total Number of Members 866 701 1567 618 446 1064% those who attended the last meeting 74.4 73.3 73.9 75.9 75.6 75.8
Bihar
Rural Total Number of Members 241 397 638 140 201 341% those who attended the last meeting 95.4 89.9 92.0 100.0 100.0 100.0
Urban Total Number of Members 55 136 191 30 46 76% those who attended the last meeting 100.0 94.1 95.8 96.7 95.7 96.1
Total Total Number of Members 288 533 821 169 245 414% those who attended the last meeting 99.0 91.0 93.8 100.0 100.0 100.0
Gujarat
Rural Total Number of Members 199 182 381 116 112 228% those who attended the last meeting 75.4 81.9 78.5 79.3 88.4 83.8
Urban Total Number of Members 66 74 140 41 47 88% those who attended the last meeting 65.2 71.6 68.6 63.4 76.6 70.5
Total Total Number of Members 265 256 521 157 159 316% those who attended the last meeting 72.8 78.9 75.8 75.2 84.9 80.1
Haryana
Rural Total Number of Members 253 175 428 206 140 346% those who attended the last meeting 93.3 87.4 90.9 88.8 90.0 89.3
Urban Total Number of Members 78 64 142 41 19 60% those who attended the last meeting 91.0 92.2 91.5 100.0 100.0 100.0
Total Total Number of Members 331 239 570 246 159 405% those who attended the last meeting 92.7 88.7 91.1 91.1 91.2 91.1
Jammu & Kashmir
Rural Total Number of Members 450 117 567 327 82 409% those who attended the last meeting 64.4 67.5 65.1 65.7 70.7 66.7
Urban Total Number of Members 126 31 157 69 16 85% those who attended the last meeting 85.7 100.0 88.5 82.6 100.0 85.9
Total Total Number of Members 576 148 724 396 98 494% those who attended the last meeting 69.1 74.3 70.2 68.7 75.5 70.0
Jharkhand
Rural Total Number of Members 516 408 924 315 239 554% those who attended the last meeting 67.1 57.1 62.7 72.4 62.8 68.2
Urban Total Number of Members 36 32 68 8 13 21% those who attended the last meeting 88.9 75.0 82.4 100.0 69.2 81.0
Total Total Number of Members 552 440 992 319 252 571% those who attended the last meeting 68.5 58.4 64.0 74.0 63.1 69.2
Karnataka
Rural Total Number of Members 209 119 328 81 47 128% those who attended the last meeting 70.8 92.4 78.7 79.0 89.4 82.8
Urban Total Number of Members 107 66 173 64 24 88% those who attended the last meeting 71.0 83.3 75.7 75.0 62.5 71.6
Total Total Number of Members 316 185 501 145 71 216% those who attended the last meeting 70.9 89.2 77.6 77.2 80.3 78.2
Continued.OJg
O h

Table A5.10 (Contd.): Number of Members in School Management Committee (SMC) and Number of thosewho attended the last meeting
State Area Category Total Members Muslim MembersMale Female Total Male Female Total
Kerala
Rural Total Number of Members 910 901 1811 412 475 887% those who attended the last meeting 71.3 81.5 76.4 78.9 73.3 75.9
Urban Total Number of Members 271 379 650 114 204 318% those who attended the last meeting 75.3 79.7 77.8 78.9 80.4 79.9
Total Total Number of Members 1181 1280 2461 526 679 1205% those who attended the last meeting 72.2 80.9 76.8 78.9 75.4 76.9
MadhyaPradesh
Rural Total Number of Members 218 203 421 80 80 160% those who attended the last meeting 59.2 36.9 48.5 66.3 32.5 49.4
Urban Total Number of Members 45 52 97 6 9 15% those who attended the last meeting 44.4 40.4 42.3 16.7 55.6 40.0
Total Total Number of Members 263 255 518 86 89 175% those who attended the last meeting 56.7 37.6 47.3 62.8 34.8 48.6
Rajasthan
Rural Total Number of Members 206 190 396 159 131 290% those who attended the last meeting 63.6 35.3 50.0 64.8 35.9 51.7
Urban Total Number of Members 57 56 113 25 18 43% those who attended the last meeting 68.4 53.6 61.1 76.0 55.6 67.4
Total Total Number of Members 263 246 509 184 149 333% those who attended the last meeting 64.6 39.4 52.5 66.3 38.3 53.8
UttarPradesh
Rural Total Number of Members 1098 873 1971 435 295 730% those who attended the last meeting 75.0 69.9 72.7 76.1 71.9 74.4
Urban Total Number of Members 424 255 679 183 115 298% those who attended the last meeting 81.6 80.8 81.3 80.9 74.8 78.5
Total Total Number of Members 1522 1128 2650 618 410 1028% those who attended the last meeting 76.8 72.3 74.9 77.5 72.7 75.6
Uttra-khand
Rural Total Number of Members 227 112 339 110 56 166% those who attended the last meeting 77.5 79.5 78.2 80.9 75.0 78.9
Urban Total Number of Members 74 62 136 30 36 66% those who attended the last meeting 81.1 85.5 83.1 80.0 86.1 83.3
Total Total Number of Members 301 174 475 140 92 232% those who attended the last meeting 78.4 81.6 79.6 80.7 79.3 80.2
Total
Rural Total Number of Members 5163 4191 9354 2880 2226 5106% those who attended the last meeting 73.5 72.5 73.1 76.6 73.1 75.1
Urban Total Number of Members 1561 1394 2955 721 621 1342% those who attended the last meeting 77.5 78.5 77.9 80.0 79.7 79.9
Total Total Number of Members 6724 5585 12309 3601 2847 6448% those who attended the last meeting 74.4 74.0 74.2 77.3 74.6 76.1
CN
CNOJg
O h

Table A5.11: Support received by schools from the community in facilitating Education of all children andMuslim students in particular in Rural Areas
State Item% of schools received support
For all children Particularly for Muslim children
No Partial Adequate No Partial Adequate
Assam
Enrolling Children and ensuring their retention and attendance
65.6 25.6 8.9 64.4 26.7 8.9
Getting donation in cash or kind for improvement of facilities in school
77.8 21.1 1.1 77.8 21.1 1.1
Providing help in studies 73.3 25.6 1.1 73.3 25.6 1.1Organising religious or moral education programmes
75.6 21.1 3.3 74.4 22.2 3.3
Teaching some skills to children 73.3 23.3 3.3 71.1 25.6 3.3
Bihar
Enrolling Children and ensuring their retention and attendance
38.9 34.4 26.7 38.9 34.4 26.7
Getting donation in cash or kind for improvement of facilities in school
62.2 27.8 10.0 64.4 24.4 11.1
Providing help in studies 54.4 34.4 11.1 56.7 31.1 12.2Organising religious or moral education programmes
60.0 28.9 11.1 63.3 24.4 12.2
Teaching some skills to children 60.0 28.9 11.1 61.1 28.9 10.0
Gujarat
Enrolling Children and ensuring their retention and attendance
20.0 66.7 13.3 26.7 50.0 23.3
Getting donation in cash or kind for improvement of facilities in school
50.0 33.3 16.7 53.3 30.0 16.7
Providing help in studies 60.0 36.7 3.3 66.7 30.0 3.3Organising religious or moral education programmes
93.3 6.7 .0 23.3 53.3 23.3
Teaching some skills to children 93.3 6.7 .0 90.0 6.7 3.3
Haryana
Enrolling Children and ensuring their retention and attendance
50.0 50.0 .0 50.0 50.0 .0
Getting donation in cash or kind for improvement of facilities in school
60.0 36.7 3.3 63.3 33.3 3.3
Providing help in studies 63.3 30.0 6.7 63.3 30.0 6.7Organising religious or moral education programmes
53.3 40.0 6.7 53.3 40.0 6.7
Teaching some skills to children 60.0 33.3 6.7 60.0 33.3 6.7
Jammu & Kashmir
Enrolling Children and ensuring their retention and attendance
63.6 36.4 .0 64.8 35.2 .0
Getting donation in cash or kind for improvement of facilities in school
84.1 14.8 1.1 84.1 14.8 1.1
Providing help in studies 85.2 12.5 2.3 86.4 11.4 2.3Organising religious or moral education programmes
68.2 29.5 2.3 69.3 28.4 2.3
Teaching some skills to children 86.4 11.4 2.3 86.4 11.4 2.3Continued... OJg
O h

Table A5.11 (Contd.): Support received by schools from the community in facilitating Education of allchildren and Muslim students in particular in Rural Areas
State Item% of schools received support
For all children Particularly for Muslim children
No Partial Adequate No Partial Adequate
Jharkhand
Enrolling Children and ensuring their retention and attendance
28.3 26.7 45.0 28.3 26.7 45.0
Getting donation in cash or kind for improvement of facilities in school
80.0 6.7 13.3 78.3 10.0 11.7
Providing help in studies 75.0 16.7 8.3 73.3 20.0 6.7Organising religious or moral education programmes
78.3 13.3 8.3 76.7 15.0 8.3
Teaching some skills to children 70.0 13.3 16.7 70.0 15.0 15.0
Karnataka
Enrolling Children and ensuring their retention and attendance
27.8 30.6 41.7 27.8 44.4 27.8
Getting donation in cash or kind for improvement of facilities in school
47.2 33.3 19.4 47.2 33.3 19.4
Providing help in studies 41.7 41.7 16.7 41.7 41.7 16.7Organising religious or moral education programmes
41.7 41.7 16.7 41.7 41.7 16.7
Teaching some skills to children 38.9 38.9 22.2 38.9 38.9 22.2
Kerala
Enrolling Children and ensuring their retention and attendance
15.0 48.3 36.7 18.3 43.3 38.3
Getting donation in cash or kind for improvement of facilities in school
60.0 30.0 10.0 60.8 29.2 10.0
Providing help in studies 29.2 45.8 25.0 28.3 47.5 24.2Organising religious or moral education programmes
60.0 30.8 9.2 60.8 29.2 10.0
Teaching some skills to children 36.7 42.5 20.8 38.3 41.7 20.0
MadhyaPradesh
Enrolling Children and ensuring their retention and attendance
40.0 50.0 10.0 43.3 46.7 10.0
Getting donation in cash or kind for improvement of facilities in school
93.3 3.3 3.3 96.7 0.0 3.3
Providing help in studies 83.3 16.7 0.0 80.0 20.0 0.0Organising religious or moral education programmes
83.3 16.7 0.0 83.3 16.7 0.0
Teaching some skills to children 90.0 10.0 0.0 90.0 6.7 3.3
Rajasthan
Enrolling Children and ensuring their retention and attendance
60.0 33.3 6.7 60.0 33.3 6.7
Getting donation in cash or kind for improvement of facilities in school
63.3 26.7 10.0 63.3 26.7 10.0
Providing help in studies 66.7 26.7 6.7 66.7 26.7 6.7Organising religious or moral education programmes
80.0 13.3 6.7 70.0 23.3 6.7
Teaching some skills to children 83.3 16.7 0.0 83.3 16.7 0.0Continued... OJgH3
O h

Table A5.11 (Contd.): Support received by schools from the community in facilitating Education of allchildren and Muslim students in particular in Rural Areas
State Item
% of schools received support
For all children Particularly for Muslim children
No Partial Adequate No Partial Adequate
UttarPradesh
Enrolling Children and ensuring their retention and attendance
66.0 24.7 9.3 66.7 24.0 9.3
Getting donation in cash or kind for improvement of facilities in school
93.3 2.7 4.0 93.3 4.0 2.7
Providing help in studies 88.7 6.0 5.3 88.7 7.3 4.0
Organising religious or moral education programmes
80.0 13.3 6.7 81.3 13.3 5.3
Teaching some skills to children 88.0 8.7 3.3 88.0 8.0 4.0
Uttarakhand
Enrolling Children and ensuring their retention and attendance
55.2 41.4 3.4 51.7 44.8 3.4
Getting donation in cash or kind for improvement of facilities in school
89.7 10.3 0.0 86.2 10.3 3.4
Providing help in studies 82.8 17.2 0.0 79.3 17.2 3.4
Organising religious or moral education programmes
79.3 20.7 0.0 72.4 24.1 3.4
Teaching some skills to children 79.3 20.7 0.0 75.9 20.7 3.4
Total
Enrolling Children and ensuring their retention and attendance
46.1 35.8 18.1 47.0 34.9 18.1
Getting donation in cash or kind for improvement of facilities in school
74.5 18.6 6.9 75.0 18.3 6.8
Providing help in studies 66.9 24.5 8.6 67.0 24.6 8.3
Organising religious or moral education programmes
70.5 23.0 6.5 67.8 24.6 7.5
Teaching some skills to children 70.1 21.6 8.3 70.0 21.6 8.4
LO
CNOJgH3O h

Table A5.12: Mean Values, Mean difference scores and t-values for different parameters
State: Assam
Parameter
Mean scores t-value df Sig. (2tailed)Muslim
studentsNon-Muslimstudents
difference
i) Regularity of attendance 2.53 1.43 1.098 7.799 121 .000ii) Punctuality in coming to school 2.61 1.47 1.148 8.113 121 .000iii) Participation in classroom activities 2.58 1.41 1.172 8.947 121 .000iv) Achievement in language 2.40 1.35 1.049 7.705 121 .000v) Achievement in Maths 2.34 1.38 .959 7.540 121 .000vi) Achievement in EVS/ Science 2.85 1.79 1.066 8.903 121 .000vii) Interaction with teacher 2.78 1.56 1.221 9.081 121 .000viii) Level of self confidence 2.58 1.46 1.123 8.475 121 .000ix) Parents’ interest in children’s studies 2.26 1.44 .820 5.951 121 .000x) Participation in sports/ games 3.52 1.89 1.631 7.724 121 .000xi) Participation in dance/drama/music prog. 3.44 1.89 1.557 7.042 121 .000xii) Participation in debates/ elocution contest 3.65 1.90 1.746 7.921 121 .000xiii) Participation in Art/ craft activities 3.51 1.89 1.615 7.666 121 .000
Table A5.12 (contd.): Mean Values, Mean difference scores and t-values for different parameters
State: Bihar
Parameter
Mean scores t-value df Sig. (2tailed)Muslim
studentsNon-Muslimstudents
difference
i) Regularity of attendance 3.13 2.53 .602 4.971 117 .000ii) Punctuality in coming to school 3.19 2.56 .636 5.162 117 .000iii) Participation in classroom activities 2.99 2.43 .559 5.347 117 .000iv) Achievement in language 2.90 2.37 .525 4.829 117 .000v) Achievement in Maths 2.81 2.36 .458 4.157 117 .000vi) Achievement in EVS/ Science 2.82 2.39 .432 3.978 117 .000vii) Interaction with teacher 2.93 2.45 .483 4.213 117 .000viii) Level of self confidence 2.83 2.44 .390 3.512 117 .001ix) Parents’ interest in children’s studies 2.80 2.46 .339 3.291 117 .001x) Participation in sports/ games 2.81 2.43 .381 3.661 117 .000xi) Participation in dance/drama/music prog. 2.76 2.47 .288 2.536 117 .013xii) Participation in debates/ elocution contest 2.66 2.42 .246 2.343 117 .021xiii) Participation in Art/ craft activities 2.47 2.49 -.017 -.160 117 .873

Table A5.12 (contd.): Mean Values, Mean difference scores and t-values for different parameters
State: Gujarat
Parameter
Mean scores t-value df Sig. (2tailed)Muslim
studentsNon-Muslimstudents
difference
i) Regularity of attendance 3.26 2.43 .833 3.241 41 .002ii) Punctuality in coming to school 2.95 2.86 .095 .474 41 .638iii) Participation in classroom activities 2.93 2.43 .500 2.313 41 .026iv) Achievement in language 2.83 2.36 .476 2.424 41 .020v) Achievement in Maths 2.79 2.36 .429 2.184 41 .035vi) Achievement in EVS/ Science 2.71 2.31 .405 2.098 41 .042vii) Interaction with teacher 3.10 2.76 .333 1.480 41 .146viii) Level of self confidence 3.05 2.60 .452 2.120 41 .040ix) Parents’ interest in children’s studies 3.05 2.26 .786 3.344 41 .002x) Participation in sports/ games 2.90 2.64 .262 1.426 41 .162xi) Participation in dance/drama/music prog. 2.81 2.88 -.071 -.224 41 .824xii) Participation in debates/ elocution contest 3.40 3.10 .310 1.000 41 .323xiii) Participation in Art/ craft activities 4.57 4.43 .143 .461 41 .647
Table A5.12 (contd.): Mean Values, Mean difference scores and t-values for different parameters
State: Haryana
Parameter
Mean scores t-value df Sig. (2tailed)Muslim
studentsNon-Muslimstudents
difference
i) Regularity of attendance 2.86 3.08 -.222 -1.754 35 .088ii) Punctuality in coming to school 2.58 3.25 -.667 -4.183 35 .000iii) Participation in classroom activities 2.72 2.78 -.056 -.403 35 .689iv) Achievement in language 2.50 2.75 -.250 -2.311 35 .027v) Achievement in Maths 2.56 2.61 -.056 -.572 35 .571vi) Achievement in EVS/ Science 2.50 2.64 -.139 -1.405 35 .169vii) Interaction with teacher 3.25 3.28 -.028 -.298 35 .768viii) Level of self confidence 2.83 2.94 -.111 -1.276 35 .210ix) Parents’ interest in children’s studies 1.75 2.14 -.389 -2.786 35 .009x) Participation in sports/ games 2.08 2.17 -.083 -.723 35 .475xi) Participation in dance/drama/music prog. 1.58 1.72 -.139 -1.094 35 .281xii) Participation in debates/ elocution contest 1.72 1.86 -.139 -1.221 35 .230xiii) Participation in Art/ craft activities 1.67 1.78 -.111 -.941 35 .353

Table A5.12 (contd.): Mean Values, Mean difference scores and t-values for different parameters
State: Jammu & Kashmir
Parameter
Mean scores t-value df Sig. (2tailed)Muslim
studentsNon-Muslimstudents
difference
i) Regularity of attendance 3.11 3.07 .040 .686 74 .495ii) Punctuality in coming to school 3.08 3.03 .052 1.270 76 .208iii) Participation in classroom activities 3.00 3.04 -.040 -1.000 74 .321iv) Achievement in language 2.88 2.88 .000 .000 76 1.000v) Achievement in Maths 2.71 2.75 -.039 -1.136 76 .260vi) Achievement in EVS/ Science 2.73 2.73 .000 .000 77 1.000vii) Interaction with teacher 3.29 3.26 .038 1.000 77 .320viii) Level of self confidence 2.91 2.88 .026 .705 77 .483ix) Parents’ interest in children’s studies 2.42 2.45 -.026 -.445 77 .658x) Participation in sports/ games 2.68 2.64 .038 1.000 77 .320xi) Participation in dance/drama/music prog. 2.36 2.61 -.247 -1.039 76 .302xii) Participation in debates/ elocution contest 2.34 2.36 -.026 -.815 76 .418xiii) Participation in Art/ craft activities 2.00 1.95 .053 1.651 75 .103
Table A5.12 (contd.): Mean Values, Mean difference scores and t-values for different parameters
State: Jharkhand
Parameter
Mean scores t-value df Sig. (2tailed)Muslim
studentsNon-Muslimstudents
difference
i) Regularity of attendance 2.63 1.90 .722 4.238 71 .000ii) Punctuality in coming to school 2.81 2.08 .722 4.238 71 .000iii) Participation in classroom activities 2.57 1.88 .694 4.238 71 .000iv) Achievement in language 2.53 1.85 .681 4.525 71 .000v) Achievement in Maths 2.54 1.79 .750 4.508 71 .000vi) Achievement in EVS/ Science 2.50 1.71 .792 4.449 71 .000vii) Interaction with teacher 2.57 1.81 .764 4.666 71 .000viii) Level of self confidence 2.65 1.88 .778 4.907 71 .000ix) Parents’ interest in children’s studies 2.29 1.85 .444 2.632 71 .010x) Participation in sports/ games 3.64 2.50 1.139 4.336 71 .000xi) Participation in dance/drama/music prog. 3.78 2.68 1.097 4.033 71 .000xii) Participation in debates/ elocution contest 3.71 2.76 .944 3.344 71 .001xiii) Participation in Art/ craft activities 3.76 2.75 1.014 3.695 71 .000

Table A5.12 (contd.): Mean Values, Mean difference scores and t-values for different parameters
State: Karnataka
Parameter
Mean scores t-value df Sig. (2tailed)Muslim
studentsNon-Muslimstudents
difference
i) Regularity of attendance 3.24 3.33 -.091 -2.324 54 .024ii) Punctuality in coming to school 3.18 3.27 -.091 -1.695 54 .096iii) Participation in classroom activities 3.13 3.15 -.018 -.574 54 .568iv) Achievement in language 2.87 2.93 -.055 -1.137 54 .261v) Achievement in Maths 2.84 2.82 .018 .375 54 .709vi) Achievement in EVS/ Science 2.96 2.98 -.018 -1.000 54 .322vii) Interaction with teacher 3.13 3.15 -.018 -1.000 54 .322viii) Level of self confidence 3.07 3.04 .036 1.000 54 .322ix) Parents’ interest in children’s studies 2.65 2.82 -.164 -2.425 54 .019x) Participation in sports/ games 3.09 3.11 -.018 -.444 54 .659xi) Participation in dance/drama/music prog. 2.75 3.02 -.273 -2.673 54 .010xii) Participation in debates/ elocution contest 2.80 2.89 -.091 -1.299 54 .199xiii) Participation in Art/ craft activities 2.87 2.98 -.109 -1.627 54 .109
Table A5.12 (contd.): Mean Values, Mean difference scores and t-values for different parameters
State: Kerala
Parameter
Mean scores t-value df Sig. (2tailed)Muslim
studentsNon-Muslimstudents
difference
i) Regularity of attendance 3.27 3.10 .173 2.179 167 .031ii) Punctuality in coming to school 3.20 3.05 .149 1.872 167 .063iii) Participation in classroom activities 3.16 2.96 .202 2.687 167 .008iv) Achievement in language 2.86 2.77 .095 1.327 167 .186v) Achievement in Maths 2.89 2.61 .280 3.934 167 .000vi) Achievement in EVS/ Science 3.00 2.82 .179 2.331 167 .021vii) Interaction with teacher 3.37 3.10 .268 3.392 167 .001viii) Level of self confidence 2.98 2.83 .149 1.939 167 .054ix) Parents’ interest in children’s studies 2.83 2.78 .048 .612 167 .541x) Participation in sports/ games 3.01 2.82 .185 2.513 167 .013xi) Participation in dance/drama/music prog. 2.62 2.68 -.060 -.629 167 .530xii) Participation in debates/ elocution contest 2.73 2.58 .155 1.901 167 .059xiii) Participation in Art/ craft activities 2.83 2.71 .125 1.623 167 .106

Table A5.12 (contd.): Mean Values, Mean difference scores and t-values for different parameters
State: Madhya Pradesh
Parameter
Mean scores t-value df Sig. (2tailed)Muslim
studentsNon-Muslimstudents
difference
i) Regularity of attendance 1.68 2.03 -.342 -2.066 37 .046ii) Punctuality in coming to school 1.89 2.24 -.342 -2.014 37 .051iii) Participation in classroom activities 1.92 2.18 -.263 -1.377 37 .177iv) Achievement in language 1.55 2.03 -.474 -2.694 37 .011v) Achievement in Maths 1.63 1.87 -.237 -1.598 37 .118vi) Achievement in EVS/ Science 1.71 1.84 -.132 -.961 37 .343vii) Interaction with teacher 2.24 2.32 -.079 -.595 37 .556viii) Level of self confidence 2.05 2.24 -.184 -1.556 37 .128ix) Parents’ interest in children’s studies 1.61 1.97 -.368 -2.340 37 .025x) Participation in sports/ games 2.03 2.42 -.395 -2.431 37 .020xi) Participation in dance/drama/music prog. 3.26 3.50 -.237 -1.055 37 .298xii) Participation in debates/ elocution contest 3.74 3.89 -.158 -.770 37 .446xiii) Participation in Art/ craft activities 4.79 4.68 .105 .432 37 .668
Table A5.12 (contd.): Mean Values, Mean difference scores and t-values for different parameters
State: Rajasthan
Parameter
Mean scores t-value df Sig. (2tailed)Muslim
studentsNon-Muslimstudents
difference
i) Regularity of attendance 1.95 1.21 .737 3.063 37 .004ii) Punctuality in coming to school 2.00 1.26 .737 2.800 37 .008iii) Participation in classroom activities 1.84 1.29 .553 2.018 37 .051iv) Achievement in language 1.74 1.21 .526 2.214 37 .033v) Achievement in Maths 1.37 .95 .421 2.051 37 .047vi) Achievement in EVS/ Science 1.42 1.05 .368 1.665 37 .104vii) Interaction with teacher 2.50 1.39 1.105 4.646 37 .000viii) Level of self confidence 2.26 1.34 .921 4.359 37 .000ix) Parents’ interest in children’s studies 1.45 1.21 .237 1.070 37 .291x) Participation in sports/ games 3.21 1.74 1.474 4.245 37 .000xi) Participation in dance/drama/music prog. 4.58 2.37 2.211 4.367 37 .000xii) Participation in debates/ elocution contest 4.84 2.55 2.289 4.440 37 .000xiii) Participation in Art/ craft activities 4.95 2.58 2.368 4.515 37 .000

Table A5.12 (contd.): Mean Values, Mean difference scores and t-values for different parameters
State: Uttar Pradesh
Parameter
Mean scores t-value df Sig. (2tailed)Muslim
studentsNon-Muslimstudents
difference
i) Regularity of attendance 2.76 2.82 -.062 -1.640 192 .103ii) Punctuality in coming to school 2.88 2.96 -.082 -2.158 193 .032
iii) Participation in classroom activities 2.93 2.92 .015 .492 193 .623iv) Achievement in language 2.83 2.86 -.026 -.962 192 .337v) Achievement in Maths 2.60 2.65 -.057 -2.060 192 .041vi) Achievement in EVS/ Science 2.58 2.58 -.005 -.218 191 .828vii) Interaction with teacher 3.40 3.38 .015 .654 193 .514viii) Level of self confidence 2.95 2.90 .048 2.083 188 .039
ix) Parents’ interest in children’s studies 2.21 2.30 -.093 -2.638 193 .009x) Participation in sports/ games 2.84 2.78 .062 1.910 193 .058xi) Participation in dance/drama/music prog. 2.72 2.80 -.078 -2.078 191 .039xii) Participation in debates/ elocution contest 2.61 2.66 -.048 -1.345 186 .180xiii) Participation in Art/ craft activities 2.72 2.77 -.042 -1.336 188 .183
Table A5.12 (contd.): Mean Values, Mean difference scores and t-values for different parameters
State: Uttarakhand
Parameter
Mean scores t-value df Sig. (2tailed)Muslim
studentsNon-Muslimstudents
difference
i) Regularity of attendance 2.83 2.93 -.103 -1.000 28 .326ii) Punctuality in coming to school 2.77 2.93 -.167 -1.542 29 .134iii) Participation in classroom activities 2.93 2.97 -.033 -.328 29 .745iv) Achievement in language 2.97 3.07 -.100 -.902 29 .375v) Achievement in Maths 2.83 2.80 .033 .372 29 .712vi) Achievement in EVS/ Science 2.77 2.80 -.033 -.441 29 .662vii) Interaction with teacher 3.37 3.47 -.100 -1.000 29 .326viii) Level of self confidence 2.93 3.10 -.167 -1.223 29 .231ix) Parents’ interest in children’s studies 2.47 2.67 -.200 -1.989 29 .056x) Participation in sports/ games 3.00 2.93 .067 .528 29 .601xi) Participation in dance/drama/music prog. 2.90 2.87 .033 .183 29 .856xii) Participation in debates/ elocution contest 3.13 3.07 .067 .441 29 .662xiii) Participation in Art/ craft activities 2.90 2.77 .133 1.278 29 .211

Appendix - Chapter 7
Table A7.1: Educational level of Parents
State Area Parents Total(N)
% of parents having educational level asIlliterate
Literate with no/
little schooling
completedprimary
completedupper
primary
completed Secondary (class x)
completed Sr. Secon
dary
Graduate & above
(1) (2) (3) (4) (5) (6) (7) (8) (9) (10) (11)
Assam
Rural Father 397 13.4 15.1 32.5 18.6 10.8 4.8 4.8Mother 397 23.7 32.5 18.9 13.1 7.6 4.0 0.3
Urban Father 134 11.2 10.4 21.6 24.6 14.2 11.2 6.7Mother 134 14.9 19.4 23.9 23.9 11.2 3.7 3.0
Total Father 531 12.8 13.9 29.8 20.2 11.7 6.4 5.3Mother 531 21.5 29.2 20.2 15.8 8.5 4.0 0.9
Bihar
Rural Father 396 43.7 21.7 11.9 8.3 5.3 5.8 3.3Mother 396 57.1 18.4 8.6 5.1 5.3 4.5 1.0
Urban Father 128 14.1 27.3 15.6 10.9 10.2 9.4 12.5Mother 128 20.3 33.6 17.2 11.7 4.7 10.2 2.3
Total Father 524 36.5 23.1 12.8 9.0 6.5 6.7 5.5Mother 524 48.1 22.1 10.7 6.7 5.2 5.9 1.3
GujaratRural Father 120 1.7 4.2 13.3 35.8 29.2 10.0 5.8
Mother 120 5.0 5.0 27.5 33.3 20.0 5.0 4.2Urban Father 48 4.2 6.3 16.7 27.1 29.2 10.4 6.3
Mother 48 4.2 6.3 20.8 37.5 29.2 2.1 0.0Total Father 168 2.4 4.8 14.3 33.3 29.2 10.1 6.0
Mother 168 4.8 5.4 25.6 34.5 22.6 4.2 3.0
Haryana
Rural Father 120 38.3 8.3 23.3 12.5 10.0 4.2 3.3Mother 120 82.5 7.5 4.2 4.2 0.8 0.0 0.8
Urban Father 48 16.7 12.5 20.8 8.3 10.4 6.3 25.0Mother 48 50.0 16.7 8.3 6.3 6.3 2.1 10.4
Total Father 168 32.1 9.5 22.6 11.3 10.1 4.8 9.5Mother 168 73.2 10.1 5.4 4.8 2.4 0.6 3.6
Jammu & Kashmir
Rural Father 304 35.5 13.5 13.2 19.1 12.5 4.6 1.6Mother 304 76.6 9.2 4.3 4.3 3.0 2.6 0.0
Urban Father 80 47.5 10.0 6.3 10.0 7.5 7.5 11.3Mother 80 58.8 8.8 2.5 6.3 7.5 11.3 5.0
Total Father 384 38.0 12.8 11.7 17.2 11.5 5.2 3.6Mother 384 72.9 9.1 3.9 4.7 3.9 4.4 1.0
Jharkhand
Rural Father 246 27.6 29.3 19.5 6.5 7.7 5.7 3.7Mother 246 55.7 29.3 6.1 2.4 4.1 1.6 0.8
Urban Father 54 13.0 18.5 27.8 13.0 16.7 1.9 9.3Mother 54 42.6 27.8 18.5 5.6 3.7 1.9 0.0
Total Father 300 25.0 27.3 21.0 7.7 9.3 5.0 4.7Mother 300 53.3 29.0 8.3 3.0 4.0 1.7 0.7
CNLOCN
OJgO h

Table A7.1 (contd.): Educational level of Parents
State Area Parents Total(N)
% of parents having educational level asIlliterate
Literate with no/
little schooling
completedprimary
completedupper
primary
completed Secondary (class x)
completed Sr. Secon
dary
Graduate & above
(1) (2) (3) (4) (5) (6) (7) (8) (9) (10) (11)
Karnataka
Rural Father 194 1.5 16.0 24.2 20.6 10.3 14.4 12.9Mother 194 5.2 20.1 32.0 9.8 11.9 9.8 11.3
Urban Father 90 0.0 11.1 20.0 23.3 20.0 14.4 11.1Mother 90 8.9 14.4 23.3 20.0 16.7 7.8 8.9
Total Father 284 1.1 14.4 22.9 21.5 13.4 14.4 12.3Mother 284 6.3 18.3 29.2 13.0 13.4 9.2 10.6
Kerala
Rural Father 552 0.7 4.3 10.9 26.1 37.1 13.2 7.6Mother 552 1.1 4.5 8.3 27.7 39.9 11.1 7.4
Urban Father 234 0.4 0.0 4.7 27.8 40.6 15.4 11.1Mother 234 0.4 3.0 4.3 23.1 44.9 13.2 11.1
Total Father 786 0.6 3.1 9.0 26.6 38.2 13.9 8.7Mother 786 0.9 4.1 7.1 26.3 41.3 11.7 8.5
MadhyaPradesh
Rural Father 132 29.5 24.2 22.0 13.6 4.5 2.3 3.8Mother 132 46.2 22.7 18.9 6.8 3.8 0.0 1.5
Urban Father 40 10.0 12.5 37.5 20.0 10.0 7.5 2.5Mother 40 25.0 30.0 17.5 17.5 2.5 7.5 0.0
Total Father 172 25.0 21.5 25.6 15.1 5.8 3.5 3.5Mother 172 41.3 24.4 18.6 9.3 3.5 1.7 1.2
Rajasthan
Rural Father 131 41.2 35.1 11.5 6.9 3.8 1.5 0.0Mother 131 81.7 16.8 1.5 0.0 0.0 0.0 0.0
Urban Father 41 12.2 26.8 26.8 9.8 12.2 2.4 9.8Mother 41 48.8 29.3 9.8 12.2 0.0 0.0 0.0
Total Father 172 34.3 33.1 15.1 7.6 5.8 1.7 2.3Mother 172 73.8 19.8 3.5 2.9 0.0 0.0 0.0
UttarPradesh
Rural Father 662 36.9 18.9 23.1 13.3 4.1 1.8 2.0Mother 662 64.5 21.3 10.9 1.8 0.8 0.5 0.3
Urban Father 256 23.4 24.6 19.5 11.3 5.5 8.2 7.4Mother 256 44.1 24.2 12.5 7.8 6.6 3.9 0.8
Total Father 918 33.1 20.5 22.1 12.7 4.5 3.6 3.5Mother 918 58.8 22.1 11.3 3.5 2.4 1.4 0.4
Uttarakhand
Rural Father 129 24.0 27.1 24.8 7.0 7.8 2.3 7.0Mother 129 51.9 30.2 7.8 3.1 2.3 1.6 3.1
Urban Father 47 21.3 14.9 25.5 12.8 17.0 6.4 2.1Mother 47 51.1 25.5 8.5 4.3 6.4 2.1 2.1
Total Father 176 23.3 23.9 25.0 8.5 10.2 3.4 5.7Mother 176 51.7 29.0 8.0 3.4 3.4 1.7 2.8
Total
Rural Father 3383 24.4 16.8 19.0 16.2 13.0 6.1 4.5Mother 3383 43.5 18.1 11.6 9.8 10.4 4.0 2.5
Urban Father 1200 14.0 14.3 17.0 17.7 17.5 9.9 9.6Mother 1200 26.5 18.3 13.2 15.2 15.6 6.8 4.4
Total Father 4583 21.7 16.1 18.5 16.6 14.2 7.1 5.8Mother 4583 39.1 18.2 12.0 11.2 11.7 4.8 3.0

Table A7.2: Distribution of Children in the age-group 6 to below 14 years in homes ofParents according to their Educational status
State Area GenderAge-group 6 to below 11 years
Age-group 11 to below 14 years
Age-group 6 to below 14 years
Total no. of
children
% of children Total no. of
children
% of children Total no. of
children
% of childrenout-ofschool
attendingschool
out-ofschool
attendingschool
out-ofschool
attendingschool
(1) (2) (3) (4) (5) (6) (7) (8) (9) (10) (11) (12)
Assam
Rural
Boys 179 7.3 92.7 141 9.9 90.1 320 8.4 91.6Girls 181 1.1 98.9 125 8.0 92.0 306 3.9 96.1Total 360 4.2 95.8 266 9.0 91.0 626 6.2 93.8
Urban
Boys 51 11.8 88.2 55 10.9 89.1 106 11.3 88.7Girls 43 .0 100.0 59 1.7 98.3 102 1.0 99.0Total 94 6.4 93.6 114 6.1 93.9 208 6.3 93.8
Total
Boys 230 8.3 91.7 196 10.2 89.8 426 9.2 90.8Girls 224 .9 99.1 184 6.0 94.0 408 3.2 96.8Total 454 4.6 95.4 380 8.2 91.8 834 6.2 93.8
Bihar
Rural
Boys 263 6.8 93.2 177 5.6 94.4 440 6.4 93.6Girls 257 4.7 95.3 190 1.6 98.4 447 3.4 96.6Total 520 5.8 94.2 367 3.5 96.5 887 4.8 95.2
Urban
Boys 70 4.3 95.7 51 7.8 92.2 121 5.8 94.2Girls 69 18.8 81.2 73 16.4 83.6 142 17.6 82.4Total 139 11.5 88.5 124 12.9 87.1 263 12.2 87.8
Total
Boys 333 6.3 93.7 228 6.1 93.9 561 6.2 93.8Girls 326 7.7 92.3 263 5.7 94.3 589 6.8 93.2Total 659 7.0 93.0 491 5.9 94.1 1150 6.5 93.5
Gujarat
Rural
Boys 78 .0 100.0 58 .0 100.0 136 .0 100.0Girls 73 .0 100.0 45 .0 100.0 118 .0 100.0Total 151 .0 100.0 103 .0 100.0 254 .0 100.0
Urban
Boys 25 .0 100.0 21 .0 100.0 46 .0 100.0Girls 30 6.7 93.3 24 .0 100.0 54 3.7 96.3Total 55 3.6 96.4 45 .0 100.0 100 2.0 98.0
Total
Boys 103 .0 100.0 79 .0 100.0 182 .0 100.0Girls 103 1.9 98.1 69 .0 100.0 172 1.2 98.8Total 206 1.0 99.0 148 .0 100.0 354 .6 99.4
Haryana
Rural
Boys 121 7.4 92.6 63 7.9 92.1 184 7.6 92.4Girls 68 2.9 97.1 42 7.1 92.9 110 4.5 95.5Total 189 5.8 94.2 105 7.6 92.4 294 6.5 93.5
Urban
Boys 27 11.1 88.9 16 12.5 87.5 43 11.6 88.4Girls 28 7.1 92.9 18 0.0 100.0 46 4.3 95.7Total 55 9.1 90.9 34 5.9 94.1 89 7.9 92.1
Total
Boys 148 8.1 91.9 79 8.9 91.1 227 8.4 91.6Girls 96 4.2 95.8 60 5.0 95.0 156 4.5 95.5Total 244 6.6 93.4 139 7.2 92.8 383 6.8 93.2
LOCNOJeg
O h

Table A7.2 (contd.): Distribution of Children in the age-group 6 to below 14 years in homes ofParents according to their Educational status
State Area GenderAge-group 6 to below 11 years
Age-group 11 to below 14 years
Age-group 6 to below 14 years
Total no. of
children
% of children Total no. of
children
% of children Total no. of
children
% of childrenout-ofschool
attendingschool
out-ofschool
attendingschool
out-ofschool
attendingschool
(1) (2) (3) (4) (5) (6) (7) (8) (9) (10) (11) (12)
Jammu & Kashmir
Rural
Boys 206 4.9 95.1 118 11.9 88.1 324 7.4 92.6Girls 150 4.0 96.0 109 7.3 92.7 259 5.4 94.6Total 356 4.5 95.5 227 9.7 90.3 583 6.5 93.5
Urban
Boys 55 0.0 100.0 43 4.7 95.3 98 2.0 98.0Girls 36 0.0 100.0 31 9.7 90.3 67 4.5 95.5Total 91 0.0 100.0 74 6.8 93.2 165 3.0 97.0
Total
Boys 261 3.8 96.2 161 9.9 90.1 422 6.2 93.8Girls 186 3.2 96.8 140 7.9 92.1 326 5.2 94.8Total 447 3.6 96.4 301 9.0 91.0 748 5.7 94.3
Jharkhand
Rural
Boys 148 10.1 89.9 131 13.0 87.0 279 11.5 88.5Girls 118 7.6 92.4 114 5.3 94.7 232 6.5 93.5Total 266 9.0 91.0 245 9.4 90.6 511 9.2 90.8
Urban
Boys 36 44.4 55.6 23 8.7 91.3 59 30.5 69.5Girls 36 27.8 72.2 14 14.3 85.7 50 24.0 76.0Total 72 36.1 63.9 37 10.8 89.2 109 27.5 72.5
Total
Boys 184 16.8 83.2 154 12.3 87.7 338 14.8 85.2Girls 154 12.3 87.7 128 6.3 93.8 282 9.6 90.4Total 338 14.8 85.2 282 9.6 90.4 620 12.4 87.6
Karnataka
Rural
Boys 121 .0 100.0 70 .0 100.0 191 .0 100.0Girls 84 .0 100.0 58 1.7 98.3 142 .7 99.3Total 205 .0 100.0 128 .8 99.2 333 .3 99.7
Urban
Boys 41 17.1 82.9 40 7.5 92.5 81 12.3 87.7Girls 59 20.3 79.7 46 15.2 84.8 105 18.1 81.9Total 100 19.0 81.0 86 11.6 88.4 186 15.6 84.4
Total
Boys 162 4.3 95.7 110 2.7 97.3 272 3.7 96.3Girls 143 8.4 91.6 104 7.7 92.3 247 8.1 91.9Total 305 6.2 93.8 214 5.1 94.9 519 5.8 94.2
Kerala
Rural
Boys 285 1.1 98.9 139 1.4 98.6 424 1.2 98.8Girls 303 .7 99.3 122 .8 99.2 425 .7 99.3Total 588 .9 99.1 261 1.1 98.9 849 .9 99.1
Urban
Boys 99 .0 100.0 65 .0 100.0 164 .0 100.0Girls 98 .0 100.0 59 .0 100.0 157 .0 100.0Total 197 .0 100.0 124 .0 100.0 321 .0 100.0
Total
Boys 384 .8 99.2 204 1.0 99.0 588 .9 99.1Girls 401 .5 99.5 181 .6 99.4 582 .5 99.5Total 785 .6 99.4 385 .8 99.2 1170 .7 99.3
LOLOCN
OJgO h

Table A7.2 (Contd.): Distribution of Children in the age-group 6 to below 14 years in homes ofParents according to their Educational status
State Area GenderAge-group 6 to below 11 years
Age-group 11 to below 14 years
Age-group 6 to below 14 years
Total no. of
children
% of children Total no. of
children
% of children Total no. of
children
% of childrenout-ofschool
attendingschool
out-ofschool
attendingschool
out-ofschool
attendingschool
(1) (2) (3) (4) (5) (6) (7) (8) (9) (10) (11) (12)
MadhyaPradesh
RuralBoys 78 3.8 96.2 71 7.0 93.0 149 5.4 94.6Girls 93 4.3 95.7 88 1.1 98.9 181 2.8 97.2Total 171 4.1 95.9 159 3.8 96.2 330 3.9 96.1
UrbanBoys 31 9.7 90.3 17 5.9 94.1 48 8.3 91.7Girls 29 6.9 93.1 31 .0 100.0 60 3.3 96.7Total 60 8.3 91.7 48 2.1 97.9 108 5.6 94.4
TotalBoys 109 5.5 94.5 88 6.8 93.2 197 6.1 93.9Girls 122 4.9 95.1 119 .8 99.2 241 2.9 97.1Total 231 5.2 94.8 207 3.4 96.6 438 4.3 95.7
Rajasthan
RuralBoys 115 1.7 98.3 67 4.5 95.5 182 2.7 97.3Girls 63 7.9 92.1 49 20.4 79.6 112 13.4 86.6Total 178 3.9 96.1 116 11.2 88.8 294 6.8 93.2
UrbanBoys 20 .0 100.0 34 5.9 94.1 54 3.7 96.3Girls 22 .0 100.0 21 4.8 95.2 43 2.3 97.7Total 42 .0 100.0 55 5.5 94.5 97 3.1 96.9
TotalBoys 135 1.5 98.5 101 5.0 95.0 236 3.0 97.0Girls 85 5.9 94.1 70 15.7 84.3 155 10.3 89.7Total 220 3.2 96.8 171 9.4 90.6 391 5.9 94.1
UttarPradesh
RuralBoys 461 4.8 95.2 325 9.8 90.2 786 6.9 93.1Girls 417 4.3 95.7 333 9.6 90.4 750 6.7 93.3Total 878 4.6 95.4 658 9.7 90.3 1536 6.8 93.2
UrbanBoys 163 1.8 98.2 149 10.1 89.9 312 5.8 94.2Girls 168 2.4 97.6 150 10.0 90.0 318 6.0 94.0Total 331 2.1 97.9 299 10.0 90.0 630 5.9 94.1
TotalBoys 624 4.0 96.0 474 9.9 90.1 1098 6.6 93.4Girls 585 3.8 96.2 483 9.7 90.3 1068 6.5 93.5Total 1209 3.9 96.1 957 9.8 90.2 2166 6.5 93.5
Uttarakhand
RuralBoys 111 0.0 100.0 58 1.7 98.3 169 0.6 99.4Girls 85 2.4 97.6 51 0.0 100.0 136 1.5 98.5Total 196 1.0 99.0 109 0.9 99.1 305 1.0 99.0
UrbanBoys 34 0.0 100.0 20 10.0 90.0 54 3.7 96.3Girls 25 0.0 100.0 25 0.0 100.0 50 0.0 100.0Total 59 0.0 100.0 45 4.4 95.6 104 1.9 98.1
TotalBoys 145 0.0 100.0 78 3.8 96.2 223 1.3 98.7Girls 110 1.8 98.2 76 0.0 100.0 186 1.1 98.9Total 255 0.8 99.2 154 1.9 98.1 409 1.2 98.8
Total
RuralBoys 2156 4.4 95.6 1415 7.3 92.7 3571 5.5 94.5Girls 1887 3.3 96.7 1325 5.7 94.3 3212 4.3 95.7Total 4043 3.9 96.1 2740 6.5 93.5 6783 4.9 95.1
UrbanBoys 662 6.2 93.8 537 7.3 92.7 1199 6.7 93.3Girls 648 6.9 93.1 552 7.4 92.6 1200 7.2 92.8Total 1310 6.6 93.4 1089 7.3 92.7 2399 6.9 93.1
TotalBoys 2818 4.8 95.2 1952 7.3 92.7 4770 5.8 94.2Girls 2535 4.2 95.8 1877 6.2 93.8 4412 5.1 94.9Total 5353 4.5 95.5 3829 6.7 93.3 9182 5.5 94.5

Table A7.3: Number of out-of-school children in homes of parents
State Area GenderAge-group 6 to below 11 years Age-group 11 to below 14 years
Total no. of
children
% of children Total no. of
children
% of childrennever went to school
haddropped
-out
attendingMadrasah/Maktab*
never went to school
haddropped
-out
attendingMadrasah/Maktab*
(1) (2) (3) (4) (5) (6) (7) (8) (9) (10) (11)
Assam
RuralBoys 13 61.5 30.8 7.7 14 7.1 57.1 35.7Girls 2 0.0 0.0 100.0 10 0.0 30.0 70.0Total 15 53.3 26.7 20.0 24 4.2 45.8 50.0
UrbanBoys 6 50.0 50.0 0.0 0.0 50.0 50.0Girls 0 0.0 0.0 0.0 1 0.0 0.0 100.0Total 6 50.0 50.0 0.0 7 0.0 42.9 57.1
Total
Boys 19 57.9 36.8 5.3 20 5.0 55.0 40.0Girls 2 0.0 0.0 100.0 11 .0 27.3 72.7Total 21 52.4 33.3 14.3 31 3.2 45.2 51.6
Bihar
RuralBoys 18 61.1 22.2 16.7 10 50.0 50.0 0.0Girls 12 75.0 16.7 8.3 3 33.3 33.3 33.3Total 30 66.7 20.0 13.3 13 46.2 46.2 7.7
UrbanBoys 3 0.0 33.3 66.7 4 25.0 75.0 0.0Girls 13 7.7 61.5 30.8 12 58.3 41.7 0.0Total 16 6.3 56.3 37.5 16 50.0 50.0 0.0
Total
Boys 21 52.4 23.8 23.8 14 42.9 57.1 0.0Girls 25 40.0 40.0 20.0 15 53.3 40.0 6.7Total 46 45.7 32.6 21.7 29 48.3 48.3 3.4
Gujarat
RuralBoys 0 0.0 0.0 0.0 0 0.0 0.0 0.0Girls 0 0.0 0.0 0.0 0 0.0 0.0 0.0Total 0 0.0 0.0 0.0 0 0.0 0.0 0.0
UrbanBoys 0 0.0 0.0 0.0 0 0.0 0.0 0.0Girls 2 0.0 100.0 0.0 0 0.0 0.0 0.0Total 2 0.0 100.0 0.0 0 0.0 0.0 0.0
Total
Boys 0 0.0 0.0 0.0 0 0.0 0.0 0.0Girls 2 0.0 100.0 0.0 0 0.0 0.0 0.0Total 2 0.0 100.0 0.0 0 0.0 0.0 0.0
Haryana
RuralBoys 9 55.6 22.2 22.2 5 0.0 100.0 0.0Girls 2 100.0 0.0 0.0 3 33.3 66.7 0.0Total 11 63.6 18.2 18.2 8 12.5 87.5 0.0
UrbanBoys 3 66.7 33.3 .0 2 0.0 0.0 100.0Girls 2 50.0 .0 50.0 0 0.0 0.0 0.0Total 5 60.0 20.0 20.0 2 0.0 0.0 100.0
Total
Boys 12 58.3 25.0 16.7 7 0.0 71.4 28.6Girls 4 75.0 0.0 25.0 3 33.3 66.7 0.0Total 16 62.5 18.8 18.8 10 10.0 70.0 20.0
* providing only religious education.
LOCNOJeg
O h

Table A7.3 (contd.): Number of out-of-school children in homes of parents
State Area GenderAge-group 6 to below 11 years Age-group 11 to below 14 years
Total no. of
children
% of children Total no. of
children
% of childrennever went to school
haddropped
-out
attendingMadrasah/Maktab*
never went to school
haddropped
-out
attendingMadrasah/Maktab*
(1) (2) (3) (4) (5) (6) (7) (8) (9) (10)
Jammu & Kashmir
RuralBoys 10 40.0 60.0 0.0 14 7.1 85.7 7.1Girls 6 83.3 16.7 0.0 8 50.0 50.0 0.0Total 16 56.3 43.8 0.0 22 22.7 72.7 4.5
UrbanBoys 0 0.0 0.0 0.0 2 0.0 50.0 50.0Girls 0 0.0 0.0 0.0 3 0.0 100.0 0.0Total 0 0.0 0.0 0.0 5 0.0 80.0 20.0
Total
Boys 10 40.0 60.0 0.0 16 6.3 81.3 12.5Girls 6 83.3 16.7 0.0 11 36.4 63.6 0.0Total 16 56.3 43.8 0.0 27 18.5 74.1 7.4
Jharkhand
RuralBoys 15 20.0 40.0 40.0 17 17.6 47.1 35.3Girls 9 44.4 11.1 44.4 6 50.0 50.0 0.0Total 24 29.2 29.2 41.7 23 26.1 47.8 26.1
UrbanBoys 16 0.0 37.5 62.5 2 0.0 0.0 100.0Girls 10 0.0 60.0 40.0 2 0.0 100.0 0.0Total 26 0.0 46.2 53.8 4 0.0 50.0 50.0
Total
Boys 31 9.7 38.7 51.6 19 15.8 42.1 42.1Girls 19 21.1 36.8 42.1 8 37.5 62.5 0.0Total 50 14.0 38.0 48.0 27 22.2 48.1 29.6
Karnataka
RuralBoys 0 0.0 0.0 0.0 0 0.0 0.0 0.0Girls 0 0.0 0.0 0.0 1 100.0 0.0 0.0Total 0 0.0 0.0 0.0 1 100.0 0.0 0.0
UrbanBoys 7 14.3 28.6 57.1 3 0.0 66.7 33.3Girls 12 0.0 25.0 75.0 7 14.3 14.3 71.4Total 19 5.3 26.3 68.4 10 10.0 30.0 60.0
Total
Boys 7 14.3 28.6 57.1 3 .0 66.7 33.3Girls 12 0.0 25.0 75.0 8 25.0 12.5 62.5Total 19 5.3 26.3 68.4 11 18.2 27.3 54.5
Kerala
RuralBoys 3 .0 100.0 0.0 2 100.0 0.0 0.0Girls 2 50.0 50.0 0.0 1 0.0 100.0 0.0Total 5 20.0 80.0 0.0 3 66.7 33.3 0.0
UrbanBoys 0 0.0 0.0 0.0 0 0.0 0.0 0.0Girls 0 0.0 0.0 0.0 0 0.0 0.0 0.0Total 0 0.0 0.0 0.0 0 0.0 0.0 0.0
Total
Boys 3 0.0 100.0 0.0 2 100.0 0.0 0.0Girls 2 50.0 50.0 0.0 1 0.0 100.0 0.0Total 5 20.0 80.0 0.0 3 66.7 33.3 0.0
MadhyaPradesh
RuralBoys 3 66.7 0.0 33.3 5 0.0 40.0 60.0Girls 4 50.0 50.0 0.0 1 0.0 100.0 0.0Total 7 57.1 28.6 14.3 6 0.0 50.0 50.0
UrbanBoys 3 66.7 33.3 0.0 1 0.0 100.0 0.0Girls 2 100.0 0.0 0.0 0 0.0 0.0 0.0Total 5 80.0 20.0 0.0 1 0.0 100.0 0.0
Total
Boys 6 66.7 16.7 16.7 6 0.0 50.0 50.0Girls 6 66.7 33.3 0.0 1 0.0 100.0 0.0Total 12 66.7 25.0 8.3 7 0.0 57.1 42.9
providing only religious education. OJgO h

Table A7.3 (contd.): Number of out-of-school children in homes of parents
State Area GenderAge-group 6 to below 11 years Age-group 11 to below 14 years
Total no. of
children
% of children Total no. of
children
% of childrennever went to school
haddropped
-out
attendingMadrasah/Maktab*
never went to school
haddropped
-out
attendingMadrasah/Maktab*
(1) (2) (3) (4) (5) (6) (7) (8) (9) (10)
Rajasthan
RuralBoys 2 0.0 100.0 0.0 3 0.0 100.0 0.0Girls 5 40.0 60.0 0.0 10 40.0 60.0 0.0Total 7 28.6 71.4 0.0 13 30.8 69.2 0.0
UrbanBoys 0 0.0 0.0 0.0 2 0.0 100.0 0.0Girls 0 0.0 0.0 0.0 1 0.0 100.0 0.0Total 0 0.0 0.0 0.0 3 0.0 100.0 0.0
Total
Boys 2 0.0 100.0 0.0 5 0.0 100.0 0.0Girls 5 40.0 60.0 0.0 11 36.4 63.6 0.0Total 7 28.6 71.4 0.0 16 25.0 75.0 0.0
Uttar Pradesh
RuralBoys 22 31.8 36.4 31.8 32 12.5 75.0 12.5Girls 18 16.7 27.8 55.6 32 15.6 81.3 3.1Total 40 25.0 32.5 42.5 64 14.1 78.1 7.8
UrbanBoys 3 66.7 33.3 0.0 15 6.7 80.0 13.3Girls 4 100.0 0.0 0.0 15 20.0 66.7 13.3Total 7 85.7 14.3 0.0 30 13.3 73.3 13.3
Total
Boys 25 36.0 36.0 28.0 47 10.6 76.6 12.8Girls 22 31.8 22.7 45.5 47 17.0 76.6 6.4Total 47 34.0 29.8 36.2 94 13.8 76.6 9.6
Uttarakhand
RuralBoys 0 0.0 0.0 0.0 1 0.0 100.0 0.0Girls 2 0.0 50.0 50.0 0 0.0 0.0 0.0Total 2 0.0 50.0 50.0 1 0.0 100.0 0.0
UrbanBoys 0 0.0 0.0 0.0 2 0.0 50.0 50.0Girls 0 0.0 0.0 0.0 0 0.0 0.0 0.0Total 0 0.0 0.0 0.0 2 0.0 50.0 50.0
Total
Boys 0 0.0 0.0 0.0 3 0.0 66.7 33.3Girls 2 0.0 50.0 50.0 0 0.0 0.0 0.0Total 2 0.0 50.0 50.0 3 0.0 66.7 33.3
Total
RuralBoys 95 42.1 36.8 21.1 103 15.5 66.0 18.4Girls 62 45.2 25.8 29.0 75 25.3 62.7 12.0Total 157 43.3 32.5 24.2 178 19.7 64.6 15.7
UrbanBoys 41 24.4 36.6 39.0 39 5.1 64.1 30.8Girls 45 17.8 42.2 40.0 41 26.8 53.7 19.5Total 86 20.9 39.5 39.5 80 16.3 58.8 25.0
Total
Boys 136 36.8 36.8 26.5 142 12.7 65.5 21.8Girls 107 33.6 32.7 33.6 116 25.9 59.5 14.7Total 243 35.4 35.0 29.6 258 18.6 62.8 18.6
a ^LOCN
* providing only religious education.
OJgO h

Table A7.4: Number of Children of the sampled Parents in the age group 6 to below 14 yearswho were attending School/Recognized Madrasahs
Area: Rural
State Type of SchoolNo. of children attending school/Madrasah
6 to below 11 years 11 to below 14 years 6 to below 14 yearsBoys Girls Total Boys Girls Total Boys Girls Total
(1) (2) (3) (4) (5) (6) (7) (8) (9) (10) (11)
Assam
Govt. School 141 150 291 104 95 199 245 245 490Private School 2 5 7 11 5 16 13 10 23Madrasah 23 24 47 12 15 27 35 39 74Total 166 179 345 127 115 242 293 294 587
Bihar
Govt. School 206 189 395 137 133 270 343 322 665Private School 4 15 19 7 7 14 11 22 33Madrasah 35 41 76 23 47 70 58 88 146Total 245 245 490 167 187 354 412 432 844
Gujarat
Govt. School 78 72 150 57 42 99 135 114 249Private School 0 0 0 1 2 3 1 2 3Madrasah 0 1 1 0 1 1 0 2 2Total 78 73 151 58 45 103 136 118 254
Haryana
Govt. School 90 48 138 49 32 81 139 80 219Private School 8 6 14 4 3 7 12 9 21Madrasah 4 7 11 2 3 5 6 10 16Total 102 61 163 55 38 93 157 99 256
Jammu & Kashmir
Govt. School 178 137 315 91 96 187 269 233 502Private School 17 6 23 10 5 15 27 11 38Madrasah 1 1 2 3 0 3 4 1 5Total 196 144 340 104 101 205 300 245 545
Jharkhand
Govt. School 115 106 221 102 92 194 217 198 415
Private School 1 0 1 3 5 8 4 5 9Madrasah 17 3 20 9 11 20 26 14 40Total 133 109 242 114 108 222 247 217 464
Karnataka
Govt. School 89 59 148 45 42 87 134 101 235Private School 32 25 57 25 15 40 57 40 97Madrasah 0 0 0 0 0 0 0 0 0Total 121 84 205 70 57 127 191 141 332
OJegO h

Table A7.4 (Contd.): Number of Children of the sampled Parents in the age group6 to below 14 years who were attending School/Recognized Madrasahs
Area: Rural
State Type of SchoolNo. of children attending school/Madrasah
6 to below 11 years 11 to below 14 years 6 to below 14 years
Boys Girls Total Boys Girls Total Boys Girls Total
(1) (2) (3) (4) (5) (6) (7) (8) (9) (10) (11)
Kerala
Govt. School 112 108 220 71 52 123 183 160 343
Private School 169 189 358 65 69 134 234 258 492
Madrasah 1 4 5 1 0 1 2 4 6
Total 282 301 583 137 121 258 419 422 841
MadhyaPradesh
Govt. School 63 83 146 57 78 135 120 161 281
Private School 8 1 9 5 3 8 13 4 17
Madrasah 4 5 9 4 6 10 8 11 19
Total 75 89 164 66 87 153 141 176 317
Rajasthan
Govt. School 93 52 145 51 35 86 144 87 231
Private School 10 4 14 2 2 4 12 6 18
Madrasah 10 2 12 11 2 13 21 4 25
Total 113 58 171 64 39 103 177 97 274
UttarPradesh
Govt. School 291 297 588 198 219 417 489 516 1005
Private School 95 63 158 79 55 134 174 118 292
Madrasah 53 39 92 16 27 43 69 66 135
Total 439 399 838 293 301 594 732 700 1432
Uttarakhand
Govt. School 46 46 92 14 19 33 60 65 125
Private School 36 21 57 26 19 45 62 40 102
Madrasah 29 16 45 17 13 30 46 29 75
Total 111 83 194 57 51 108 168 134 302
Total
Govt. School 1502 1347 2849 976 935 1911 2478 2282 4760
Private School 382 335 717 238 190 428 620 525 1145
Madrasah 177 143 320 98 125 223 275 268 543
Total 2061 1825 3886 1312 1250 2562 3373 3075 6448
V .DCN
OJgO h

Table A7.5: Number of Children of the sampled Parents in the age group 6 to below 14 yearswho were attending School/Recognized Madrasahs
Area: Urban
State Type of SchoolNo. of children attending school/Madrasah
6 to below 11 years 11 to below 14 years 6 to below 14 yearsBoys Girls Total Boys Girls Total Boys Girls Total
(1) (2) (3) (4) (5) (6) (7) (8) (9) (10) (11)
Assam
Govt. School 43 35 78 41 49 90 84 84 168Private School 2 8 10 4 9 13 6 17 23Madrasah 0 0 0 4 0 4 4 0 4Total 45 43 88 49 58 107 94 101 195
Bihar
Govt. School 50 47 97 42 48 90 92 95 187Private School 6 1 7 2 5 7 8 6 14Madrasah 11 8 19 3 8 11 14 16 30Total 67 56 123 47 61 108 114 117 231
Gujarat
Govt. School 22 27 49 19 23 42 41 50 91Private School 3 1 4 2 1 3 5 2 7Madrasah 0 0 0 0 0 0 0 0 0Total 25 28 53 21 24 45 46 52 98
Haryana
Govt. School 22 20 42 12 18 30 34 38 72Private School 11 9 20 2 0 2 13 9 22Madrasah 1 2 3 3 1 4 4 3 7Total 34 31 65 17 19 36 51 50 101
Jammu & Kashmir
Govt. School 32 26 58 31 20 51 63 46 109Private School 22 10 32 10 8 18 32 18 50Madrasah 1 0 1 0 0 0 1 0 1Total 55 36 91 41 28 69 96 64 160
Jharkhand
Govt. School 9 9 18 8 5 13 17 14 31
Private School 11 16 27 12 7 19 23 23 46Madrasah 0 1 1 1 0 1 1 1 2Total 20 26 46 21 12 33 41 38 79
Karnataka
Govt. School 18 27 45 23 18 41 41 45 86Private School 16 20 36 14 21 35 30 41 71Madrasah 0 0 0 0 0 0 0 0 0Total 34 47 81 37 39 76 71 86 157
OJegO h

Table A7.5 (Contd.): Number of Children of the sampled Parents in the age group6 to below 14 years who were attending School/Recognized Madrasahs
Area: Urban
State Type of SchoolNo. of children attending school/Madrasah
6 to below 11 years 11 to below 14 years 6 to below 14 years
Boys Girls Total Boys Girls Total Boys Girls Total
(1) (2) (3) (4) (5) (6) (7) (8) (9) (10) (11)
Kerala
Govt. School 36 41 77 27 34 61 63 75 138
Private School 63 57 120 38 25 63 101 82 183
Madrasah 0 0 0 0 0 0 0 0 0
Total 99 98 197 65 59 124 164 157 321
MadhyaPradesh
Govt. School 14 16 30 10 20 30 24 36 60
Private School 11 7 18 4 6 10 15 13 28
Madrasah 3 4 7 2 5 7 5 9 14
Total 28 27 55 16 31 47 44 58 102
Rajasthan
Govt. School 10 14 24 21 12 33 31 26 57
Private School 3 0 3 1 0 1 4 0 4
Madrasah 7 8 15 10 8 18 17 16 33
Total 20 22 42 32 20 52 52 42 94
UttarPradesh
Govt. School 67 76 143 79 88 167 146 164 310
Private School 63 61 124 41 34 75 104 95 199
Madrasah 30 27 57 14 13 27 44 40 84
Total 160 164 324 134 135 269 294 299 593
Uttarakhand
Govt. School 19 14 33 6 15 21 25 29 54
Private School 13 8 21 11 9 20 24 17 41
Madrasah 2 3 5 1 1 2 3 4 7
Total 34 25 59 18 25 43 52 50 102
Total
Govt. School 342 352 694 319 350 669 661 702 1363
Private School 224 198 422 141 125 266 365 323 688
Madrasah 55 53 108 38 36 74 93 89 182
Total 621 603 1224 498 511 1009 1119 1114 2233
c n
CNOJegO h

Area: Total (Rural + Urban)
Table A7.6: Number of Children of the sampled Parents in the age group 6 to below 14 yearswho were attending School/Recognized Madrasahs
State Type of SchoolNo. of children attending school/Madrasah
6 to below 11 years 11 to below 14 years 6 to below 14 yearsBoys Girls Total Boys Girls Total Boys Girls Total
(1) (2) (3) (4) (5) (6) (7) (8) (9) (10) (11)
Assam
Govt. School 184 185 369 145 144 289 329 329 658Private School 4 13 17 15 14 29 19 27 46Madrasah 23 24 47 16 15 31 39 39 78Total 211 222 433 176 173 349 387 395 782
Bihar
Govt. School 256 236 492 179 181 360 435 417 852
Private School 10 16 26 9 12 21 19 28 47Madrasah 46 49 95 26 55 81 72 104 176Total 312 301 613 214 248 462 526 549 1075
Gujarat
Govt. School 100 99 199 76 65 141 176 164 340Private School 3 1 4 3 3 6 6 4 10Madrasah 0 1 1 0 1 1 0 2 2Total 103 101 204 79 69 148 182 170 352
Haryana
Govt. School 112 68 180 61 50 111 173 118 291Private School 19 15 34 6 3 9 25 18 43Madrasah 5 9 14 5 4 9 10 13 23Total 136 92 228 72 57 129 208 149 357
Jammu & Kashmir
Govt. School 210 163 373 122 116 238 332 279 611Private School 39 16 55 20 13 33 59 29 88Madrasah 2 1 3 3 0 3 5 1 6Total 251 180 431 145 129 274 396 309 705
Jharkhand
Govt. School 124 115 239 110 97 207 234 212 446Private School 12 16 28 15 12 27 27 28 55Madrasah 17 4 21 10 11 21 27 15 42Total 153 135 288 135 120 255 288 255 543
Karnataka
Govt. School 107 86 193 68 60 128 175 146 321Private School 48 45 93 39 36 75 87 81 168Madrasah 0 0 0 0 0 0 0 0 0Total 155 131 286 107 96 203 262 227 489
OJgO h

Table A7.6 (Contd.): Number of Children of the sampled Parents in the age group6 to below 14 years who were attending School/Recognized Madrasahs
Area: Total (Rural + Urban)
State Type of SchoolNo. of children attending school/Madrasah
6 to below 11 years 11 to below 14 years 6 to below 14 years
Boys Girls Total Boys Girls Total Boys Girls Total
(1) (2) (3) (4) (5) (6) (7) (8) (9) (10) (11)
Kerala
Govt. School 148 149 297 98 86 184 246 235 481
Private School 232 246 478 103 94 197 335 340 675
Madrasah 1 4 5 1 0 1 2 4 6
Total 381 399 780 202 180 382 583 579 1162
MadhyaPradesh
Govt. School 77 99 176 67 98 165 144 197 341
Private School 19 8 27 9 9 18 28 17 45
Madrasah 7 9 16 6 11 17 13 20 33
Total 103 116 219 82 118 200 185 234 419
Rajasthan
Govt. School 103 66 169 72 47 119 175 113 288
Private School 13 4 17 3 2 5 16 6 22
Madrasah 17 10 27 21 10 31 38 20 58
Total 133 80 213 96 59 155 229 139 368
UttarPradesh
Govt. School 358 373 731 277 307 584 635 680 1315
Private School 158 124 282 120 89 209 278 213 491
Madrasah 83 66 149 30 40 70 113 106 219
Total 599 563 1162 427 436 863 1026 999 2025
Uttarakhand
Govt. School 65 60 125 20 34 54 85 94 179
Private School 49 29 78 37 28 65 86 57 143
Madrasah 31 19 50 18 14 32 49 33 82
Total 145 108 253 75 76 151 220 184 404
Total
Govt. School 1844 1699 3543 1295 1285 2580 3139 2984 6123
Private School 606 533 1139 379 315 694 985 848 1833
Madrasah 232 196 428 136 161 297 368 357 725
Total 2682 2428 5110 1810 1761 3571 4492 4189 8681
LOV .DCN
OJgO h

Table A7.7: Number of Children of sampled parents studying at Primary level (Classes I-V)getting different incentives in Rural areas
Total No. of % of children getting
State Type of school Gender
childrenattendingprimaryclasses
free textbooks
freeuniform
freeschool
bag
Mid day meal
Scholarship
Govt.School
Boys 181 95.6 68.0 6.1 77.9 12.7Girls 172 97.7 71.5 5.2 80.2 5.8Total 353 96.6 69.7 5.7 79.0 9.3
PrivateSchool
Boys 6 66.7 16.7 0.0 16.7 33.3Girls 6 50.0 16.7 0.0 16.7 0.0
AssamTotal 12 58.3 16.7 0.0 16.7 16.7
Madrasah/Maktab
Boys 29 100.0 31.0 6.9 41.4 6.9Girls 26 96.2 26.9 3.8 46.2 3.8Total 55 98.2 29.1 5.5 43.6 5.5Boys 216 95.4 61.6 6.0 71.3 12.5
Total Girls 204 96.1 64.2 4.9 74.0 5.4Total 420 95.7 62.9 5.5 72.6 9.0
Govt.School
Boys 289 88.6 65.7 15.9 74.0 28.7Girls 254 90.2 68.9 15.4 74.0 27.2Total 543 89.3 67.2 15.7 74.0 28.0
PrivateSchool
Boys 6 33.3 66.7 50.0 33.3 0.0Girls 17 41.2 88.2 17.6 82.4 35.3
Bihar Total 23 39.1 82.6 26.1 69.6 26.1
Madrasah/Maktab
Boys 45 62.2 37.8 6.7 64.4 11.1Girls 45 51.1 11.1 6.7 57.8 13.3Total 90 56.7 24.4 6.7 61.1 12.2Boys 340 84.1 62.1 15.3 72.1 25.9
Total Girls 316 82.0 61.7 14.2 72.2 25.6Total 656 83.1 61.9 14.8 72.1 25.8
Govt.School
Boys 102 100.0 95.1 0.0 100.0 53.9Girls 90 100.0 93.3 0.0 100.0 48.9Total 192 100.0 94.3 0.0 100.0 51.6
PrivateSchool
Boys 0 0.0 0.0 0.0 0.0 0.0Girls 0 0.0 0.0 0.0 0.0 0.0
GujaratTotal 0 0.0 0.0 0.0 0.0 0.0
Madrasah/Maktab
Boys 0 0.0 0.0 0.0 0.0 0.0Girls 1 100.0 0.0 0.0 100.0 0.0Total 1 100.0 0.0 0.0 100.0 0.0Boys 102 100.0 95.1 0.0 100.0 53.9
Total Girls 91 100.0 92.3 0.0 100.0 48.4Total 193 100.0 93.8 0.0 100.0 51.3
OJegO h

Table A7.7 (Contd.): Number of Children of sampled parents studying at Primary level(Classes I-V) getting different incentives in Rural areas
Total No. of % of children getting
State Type of school Gender
childrenattendingprimaryclasses
free textbooks
freeuniform
freeschool
bag
Mid day meal
Scholarship
Govt.School
Boys 122 93.4 94.3 44.3 95.9 52.5Girls 72 95.8 97.2 62.5 98.6 66.7Total 194 94.3 95.4 51.0 96.9 57.7
PrivateSchool
Boys 10 10.0 10.0 10.0 10.0 0.0Girls 7 42.9 42.9 0.0 42.9 0.0
HaryanaTotal 17 23.5 23.5 5.9 23.5 0.0
Madrasah/Maktab
Boys 5 20.0 0.0 0.0 60.0 0.0Girls 8 37.5 0.0 0.0 87.5 0.0Total 13 30.8 0.0 0.0 76.9 0.0Boys 137 84.7 84.7 40.1 88.3 46.7
Total Girls 87 86.2 83.9 51.7 93.1 55.2Total 224 85.3 84.4 44.6 90.2 50.0
Govt.School
Boys 199 99.5 1.0 0.5 98.5 47.2Girls 162 98.8 1.2 0.6 98.1 46.3Total 361 99.2 1.1 0.6 98.3 46.8
PrivateSchool
Boys 20 25.0 5.0 0.0 20.0 30.0Girls 8 25.0 25.0 0.0 0.0 12.5
Jammu & Total 28 25.0 10.7 0.0 14.3 25.0Kashmir
Madrasah/Maktab
Boys 4 0.0 25.0 0.0 75.0 50.0Girls 1 0.0 0.0 0.0 0.0 0.0Total 5 0.0 20.0 0.0 60.0 40.0Boys 223 91.0 1.8 0.4 91.0 45.7
Total Girls 171 94.7 2.3 0.6 93.0 44.4Total 394 92.6 2.0 0.5 91.9 45.2
Govt.School
Boys 164 93.9 24.4 5.5 88.4 26.2Girls 158 96.2 24.1 3.2 87.3 27.8Total 322 95.0 24.2 4.3 87.9 27.0
PrivateSchool
Boys 3 33.3 0.0 66.7 33.3 0.0Girls 1 100.0 0.0 0.0 100.0 0.0
JharkhandTotal 4 50.0 0.0 0.0 50.0 0.0
Madrasah/Maktab
Boys 17 35.3 5.9 0.0 88.2 0.0Girls 6 33.3 0.0 33.3 66.7 0.0Total 23 34.8 0.0 8.7 82.6 0.0Boys 184 87.5 0.0 6.0 87.5 23.4
Total Girls 165 93.9 23.0 4.2 86.7 28.5Total 349 90.5 22.6 5.2 87.1 25.8
OJgO h

Table A7.7 (Contd.): Number of Children of sampled parents studying at Primary level(Classes I-V) getting different incentives in Rural areas
Total No. of % of children getting
State Type of school Gender
childrenattendingprimaryclasses
free textbooks
freeuniform
freeschool
bag
Mid day meal
Scholarship
Govt.School
Boys 89 77.5 73.0 7.9 96.6 40.4Girls 59 88.1 72.9 15.3 98.3 45.8Total 148 81.8 73.0 10.8 97.3 42.6
PrivateSchool
Boys 32 28.1 12.5 3.1 40.6 18.8Girls 25 28.0 16.0 8.0 40.0 16.0
KarnatakaTotal 57 28.1 14.0 5.3 40.4 17.5
Madrasah/Maktab
Boys 0 0.0 0.0 0.0 0.0 0.0Girls 0 0.0 0.0 0.0 0.0 0.0Total 0 0.0 0.0 0.0 0.0 0.0Boys 121 64.5 57.0 6.6 81.8 34.7
Total Girls 84 70.2 56.0 13.1 81.0 36.9Total 205 66.8 56.6 9.3 81.5 35.6
Govt.School
Boys 122 68.0 9.8 4.9 88.5 36.9Girls 110 77.3 10.0 5.5 90.0 43.6Total 232 72.4 9.9 5.2 89.2 40.1
PrivateSchool
Boys 179 83.8 7.3 5.6 96.1 43.0Girls 191 87.4 12.0 5.2 93.2 46.1
KeralaTotal 370 85.7 9.7 5.4 94.6 44.6
Madrasah/Maktab
Boys 1 100.0 100.0 100.0 100.0 .0Girls 4 75.0 25.0 .0 75.0 50.0Total 5 80.0 40.0 20.0 80.0 40.0Boys 302 77.5 8.6 5.6 93.0 40.4
Total Girls 305 83.6 11.5 5.2 91.8 45.2Total 607 80.6 10.0 5.4 92.4 42.8
Govt.School
Boys 83 100.0 100.0 0.0 98.8 7.2Girls 103 100.0 99.0 0.0 100.0 8.7Total 186 100.0 99.5 0.0 99.5 8.1
PrivateSchool
Boys 9 0.0 0.0 0.0 0.0 0.0Girls 1 0.0 0.0 0.0 0.0 0.0
Madhya Total 10 0.0 0.0 0.0 0.0 0.0Pradesh
Madrasah/Maktab
Boys 4 100.0 75.0 0.0 100.0 0.0Girls 5 100.0 60.0 0.0 80.0 0.0Total 9 100.0 66.7 0.0 88.9 0.0Boys 96 90.6 89.6 0.0 89.6 6.3
Total Girls 109 99.1 96.3 0.0 98.2 9.2Total 205 95.1 93.2 0.0 94.1 7.8
OJgO h

Table A7.7 (Contd.): Number of Children of sampled parents studying at Primary level(Classes I-V) getting different incentives in Rural areas
Total No. % of children getting
State Type of school Gender
of children attending primary classes
free textbooks
freeuniform
freeschool
bag
Mid day meal
Scholarship
Govt.School
Boys 118 98.3 0.0 0.0 98.3 11.0Girls 74 97.3 0.0 0.0 100.0 9.5Total 192 97.9 0.0 0.0 99.0 10.4
PrivateSchool
Boys 11 18.2 0.0 0.0 18.2 0.0Girls 5 20.0 20.0 20.0 20.0 0.0
RajasthanTotal 16 18.8 6.3 6.3 18.8 0.0
Madrasah/Maktab
Boys 18 100.0 0.0 0.0 100.0 0.0Girls 3 100.0 0.0 0.0 100.0 0.0Total 21 100.0 0.0 0.0 100.0 0.0Boys 147 92.5 0.0 0.0 92.5 8.8
Total Girls 82 92.7 2.4 1.2 95.1 9.8Total 229 92.6 .9 .4 93.4 9.2
Govt.School
Boys 369 90.5 58.5 32.2 91.9 94.6Girls 390 95.1 93.8 89.0 95.4 95.6Total 759 92.9 76.7 61.4 93.7 95.1
PrivateSchool
Boys 117 3.4 2.6 2.6 3.4 75.2Girls 81 1.2 1.2 1.2 1.2 71.6
Uttar Total 198 2.5 2.0 2.0 2.5 73.7Pradesh
Madrasah/Maktab
Boys 65 23.1 0.0 3.1 1.5 35.4Girls 58 24.1 1.7 1.7 1.7 29.3Total 123 23.6 0.8 2.4 1.6 32.5Boys 551 64.1 39.7 22.5 62.4 83.5
Total Girls 529 73.0 69.6 66.0 70.7 84.7Total 1080 68.4 54.4 43.8 66.5 84.1
Govt.School
Boys 52 94.2 59.6 5.8 94.2 90.4Girls 58 96.6 86.2 1.7 96.6 84.5Total 110 95.5 73.6 3.6 95.5 87.3
PrivateSchool
Boys 41 0.0 0.0 0.0 0.0 36.6Girls 22 0.0 0.0 0.0 0.0 36.4
Uttara Total 63 0.0 0.0 0.0 0.0 36.5khand
Madrasah/Maktab
Boys 42 47.6 0.0 16.7 40.5 26.2Girls 25 36.0 4.0 12.0 20.0 16.0Total 67 43.3 1.5 14.9 32.8 22.4Boys 135 51.1 23.0 7.4 48.9 54.1
Total Girls 105 61.9 48.6 3.8 58.1 58.1Total 240 55.8 34.2 5.8 52.9 55.8
OJgH3O h

Table A7.7 (Contd.): Number of Children of sampled parents studying at Primary level(Classes I-V) getting different incentives in Rural areas
Total No. of % of children getting
State Type of school Genderchildrenattendingprimaryclasses
free textbooks
freeuniform
freeschool
bag
Mid day meal
Scholarship
Boys 1890 91.6 51.5 13.5 89.7 45.4Govt.School Girls 1702 94.4 62.6 27.1 90.8 47.2
Total 3592 92.9 56.8 20.0 90.2 46.2
Boys 434 41.0 6.2 4.6 46.1 44.7
Private School Girls 364 52.7 13.7 4.7 57.4 45.9
TotalTotal 798 46.4 9.6 4.6 51.3 45.2
Boys 230 53.0 13.9 6.5 44.8 18.7Madrasah/Maktab Girls 182 48.4 9.9 5.5 36.3 18.1
Total 412 51.0 12.1 6.1 41.0 18.4
Boys 2554 79.5 40.4 11.4 78.2 42.9
Total Girls 2248 83.9 50.4 21.7 81.0 44.6
Total 4802 81.6 45.1 16.2 79.5 43.6
o
CNOJgH3O h

Table A7.8: Number of Children of sampled parents studying at Primary level(Classes I-V) getting different incentives in Urban areas
Total No. % of children getting
State Type of school Gender
of children attending primary classes
free textbooks
freeuniform
freeschool
bag
Mid day meal
Scholarship
Govt.School
Boys 54 100.0 92.6 9.3 94.4 9.3Girls 47 97.9 89.4 8.5 95.7 12.8Total 101 99.0 91.1 8.9 95.0 10.9
PrivateSchool
Boys 2 50.0 0.0 0.0 50.0 0.0Girls 11 81.8 9.1 9.1 81.8 0.0
AssamTotal 13 76.9 7.7 7.7 76.9 0.0
Madrasah/Maktab
Boys 0 0.0 0.0 0.0 0.0 0.0Girls 0 0.0 0.0 0.0 0.0 0.0Total 0 0.0 0.0 0.0 0.0 0.0Boys 56 98.2 89.3 8.9 92.9 8.9
Total Girls 58 94.8 74.1 8.6 93.1 10.3Total 114 96.5 81.6 8.8 93.0 9.6
Govt.School
Boys 68 88.2 72.1 13.2 89.7 38.2Girls 68 89.7 83.8 13.2 85.3 50.0Total 136 89.0 77.9 13.2 87.5 44.1
PrivateSchool
Boys 8 62.5 62.5 50.0 62.5 50.0Girls 6 66.7 66.7 33.3 50.0 16.7
BiharTotal 14 64.3 64.3 42.9 57.1 35.7
Madrasah/Maktab
Boys 12 58.3 58.3 16.7 41.7 8.3Girls 12 100.0 33.3 0.0 66.7 0.0Total 24 79.2 45.8 8.3 54.2 4.2Boys 88 81.8 69.3 17.0 80.7 35.2
Total Girls 86 89.5 75.6 12.8 80.2 40.7Total 174 85.6 72.4 14.9 80.5 37.9
Govt.School
Boys 29 93.1 86.2 0.0 96.6 58.6Girls 32 96.9 100.0 0.0 100.0 68.8Total 61 95.1 93.4 0.0 98.4 63.9
PrivateSchool
Boys 3 0.0 0.0 0.0 0.0 0.0Girls 1 0.0 0.0 0.0 0.0 0.0
GujaratTotal 4 0.0 0.0 0.0 0.0 0.0
Madrasah/Maktab
Boys 0 0.0 0.0 0.0 0.0 0.0Girls 0 0.0 0.0 0.0 0.0 0.0Total 0 0.0 0.0 0.0 0.0 0.0Boys 32 84.4 78.1 .0 87.5 53.1
Total Girls 33 93.9 97.0 .0 97.0 66.7Total 65 89.2 87.7 .0 92.3 60.0
OJgH3O h

Table A7.8 (Contd.): Number of Children of sampled parents studying at Primary level(Classes I-V) getting different incentives in Urban areas
Total No. % of children getting
State Type of school Gender
of children attending primary classes
free textbooks
freeuniform
freeschool
bag
Mid day meal
Scholarship
Govt.School
Boys 16 75.0 56.3 31.3 68.8 56.3Girls 24 91.7 87.5 45.8 87.5 83.3Total 40 85.0 75.0 40.0 80.0 72.5
PrivateSchool
Boys 10 0.0 0.0 0.0 0.0 0.0Girls 8 25.0 25.0 0.0 25.0 25.0
HaryanaTotal 18 11.1 11.1 0.0 11.1 11.1
Madrasah/Maktab
Boys 2 100.0 0.0 0.0 100.0 0.0Girls 2 100.0 0.0 0.0 100.0 50.0Total 4 100.0 0.0 0.0 100.0 25.0Boys 28 44.7 32.2 17.9 46.5 32.2
Total Girls 34 77.5 67.6 32.3 73.5 67.6Total 62 61.5 51.6 25.8 61.3 51.6
Govt.School
Boys 41 95.1 0.0 0.0 95.1 26.8Girls 32 100.0 3.1 0.0 100.0 21.9Total 73 97.3 1.4 0.0 97.3 24.7
PrivateSchool
Boys 18 0.0 0.0 0.0 .0 11.1Girls 9 11.1 0.0 0.0 11.1 11.1
Jammu & Total 27 3.7 0.0 0.0 3.7 11.1Kashmir
Madrasah/Maktab
Boys 1 100.0 100.0 0.0 100.0 100.0Girls 0 0.0 0.0 0.0 0.0 0.0Total 1 100.0 100.0 0.0 100.0 100.0Boys 60 66.7 1.7 0.0 66.7 23.3
Total Girls 41 80.5 2.4 0.0 80.5 19.5Total 101 72.3 2.0 0.0 72.3 21.8
Govt.School
Boys 10 90.0 20.0 10.0 70.0 40.0Girls 9 66.7 11.1 0.0 66.7 11.1Total 19 78.9 15.8 5.3 68.4 26.3
PrivateSchool
Boys 17 11.8 11.8 0.0 11.8 0.0Girls 15 13.3 6.7 0.0 13.3 6.7
JharkhandTotal 32 12.5 9.4 0.0 12.5 3.1
Madrasah/Maktab
Boys 0 0.0 0.0 0.0 0.0 0.0Girls 1 100.0 100.0 0.0 100.0 0.0Total 1 100.0 100.0 0.0 100.0 0.0Boys 27 40.7 14.8 3.7 33.3 14.8
Total Girls 25 36.0 12.0 0.0 36.0 8.0Total 52 38.5 13.5 1.9 34.6 11.5
OJgH3O h

Table A7.8 (Contd.): Number of Children of sampled parents studying at Primary level(Classes I-V) getting different incentives in Urban areas
Total No. of % of children getting
State Type of school Gender
childrenattendingprimaryclasses
free textbooks
freeuniform
freeschool
bag
Mid day meal
Scholarship
Govt.School
Boys 18 55.6 61.1 16.7 88.9 33.3Girls 27 48.1 51.9 3.7 74.1 63.0Total 45 51.1 55.6 8.9 80.0 51.1
PrivateSchool
Boys 16 18.8 6.3 0.0 68.8 25.0Girls 20 5.0 0.0 0.0 40.0 5.0
KarnatakaTotal 36 11.1 2.8 0.0 52.8 13.9
Madrasah/Maktab
Boys 0 0.0 0.0 0.0 0.0 0.0Girls 0 0.0 0.0 0.0 0.0 0.0Total 0 0.0 0.0 0.0 0.0 0.0Boys 34 38.2 35.3 8.8 79.4 29.4
Total Girls 47 29.8 29.8 2.1 59.6 38.3Total 81 33.3 32.1 4.9 67.9 34.6
Govt.School
Boys 38 86.8 31.6 5.3 89.5 44.7Girls 43 95.3 18.6 4.7 100.0 51.2Total 81 91.4 24.7 4.9 95.1 48.1
PrivateSchool
Boys 67 82.1 16.4 0.0 94.0 37.3Girls 61 73.8 18.0 0.0 93.4 50.8
KeralaTotal 128 78.1 17.2 0.0 93.8 43.8
Madrasah/Maktab
Boys 0 0.0 0.0 0.0 0.0 0.0Girls 0 0.0 0.0 0.0 0.0 0.0Total 0 0.0 0.0 0.0 0.0 0.0Boys 105 83.8 21.9 1.9 92.4 40.0
Total Girls 104 82.7 18.3 1.9 96.2 51.0Total 209 83.3 20.1 1.9 94.3 45.5
Govt.School
Boys 18 100.0 100.0 0.0 100.0 16.7Girls 19 100.0 100.0 0.0 100.0 26.3Total 37 100.0 100.0 0.0 100.0 21.6
PrivateSchool
Boys 11 0.0 0.0 0.0 0.0 0.0Girls 10 0.0 0.0 0.0 0.0 0.0
Madhya Total 21 0.0 0.0 0.0 0.0 0.0Pradesh
Madrasah/Maktab
Boys 3 100.0 0.0 0.0 33.3 0.0Girls 4 100.0 25.0 0.0 100.0 0.0Total 7 100.0 14.3 0.0 71.4 0.0Boys 32 65.6 56.3 0.0 59.4 9.4
Total Girls 33 69.7 60.6 0.0 69.7 15.2Total 65 67.7 58.5 0.0 64.6 12.3
OJgH3O h

Table A7.8 (Contd.): Number of Children of sampled parents studying at Primary level(Classes I-V) getting different incentives in Urban areas
Total No. of % of children getting
State Type of school Gender
childrenattendingprimaryclasses
free textbooks
freeuniform
freeschool
bag
Mid day meal
Scholarship
Govt.School
Boys 17 100.0 0.0 0.0 100.0 11.8Girls 19 100.0 21.1 5.3 100.0 21.1Total 36 100.0 11.1 2.8 100.0 16.7
PrivateSchool
Boys 3 0.0 0.0 0.0 0.0 0.0Girls 0 0.0 0.0 0.0 0.0 0.0
RajasthanTotal 3 0.0 0.0 0.0 0.0 0.0
Madrasah/Maktab
Boys 9 100.0 11.1 11.1 100.0 22.2Girls 12 83.3 .0 .0 83.3 33.3Total 21 90.5 4.8 4.8 90.5 28.6Boys 29 89.7 3.4 3.4 89.7 13.8
Total Girls 31 93.5 12.9 3.2 93.5 25.8Total 60 91.7 8.3 3.3 91.7 20.0
Govt.School
Boys 108 88.9 30.6 23.1 91.7 87.0Girls 118 98.3 85.6 66.1 93.2 94.9Total 226 93.8 59.3 45.6 92.5 91.2
PrivateSchool
Boys 78 0.0 0.0 0.0 1.3 44.9Girls 80 3.8 1.3 1.3 3.8 50.0
Uttar Total 158 1.9 0.6 0.6 2.5 47.5Pradesh
Madrasah/Maktab
Boys 41 29.3 0.0 0.0 0.0 26.8Girls 39 30.8 0.0 0.0 0.0 28.2Total 80 30.0 0.0 0.0 0.0 27.5Boys 227 47.6 14.5 11.0 44.1 61.7
Total Girls 237 55.3 43.0 33.3 47.7 68.8Total 464 51.5 29.1 22.4 45.9 65.3
Govt.School
Boys 25 100.0 96.0 12.0 100.0 96.0Girls 18 88.9 88.9 22.2 88.9 83.3Total 43 95.3 93.0 16.3 95.3 90.7
PrivateSchool
Boys 18 11.1 0.0 0.0 11.1 33.3Girls 12 16.7 0.0 0.0 16.7 41.7
Uttara Total 30 13.3 0.0 0.0 13.3 36.7khand
Madrasah/Maktab
Boys 3 100.0 66.7 66.7 100.0 33.3Girls 4 100.0 50.0 25.0 100.0 0.0Total 7 100.0 57.1 42.9 100.0 14.3Boys 46 65.2 56.5 10.9 65.2 67.4
Total Girls 34 64.7 52.9 14.7 64.7 58.8Total 80 65.0 55.0 12.5 65.0 63.8
OJgH3O h
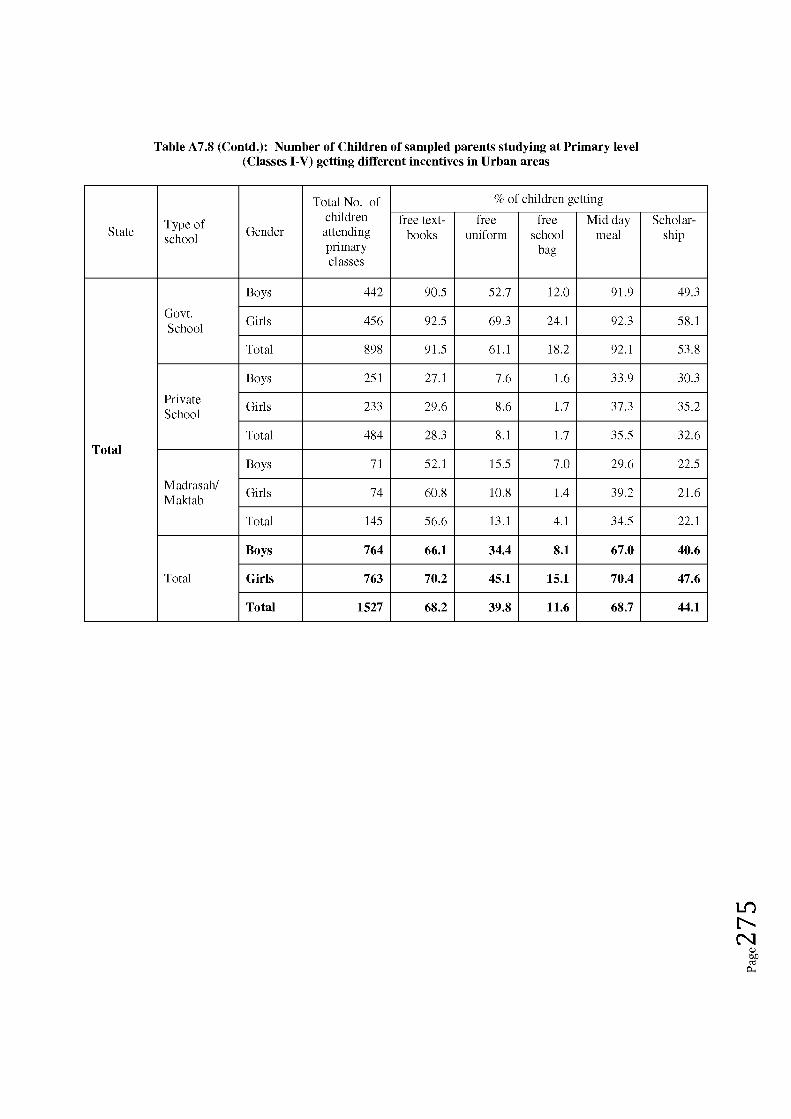
Table A7.8 (Contd.): Number of Children of sampled parents studying at Primary level(Classes I-V) getting different incentives in Urban areas
Total No. of % of children getting
State Type of school Gender
childrenattendingprimaryclasses
free textbooks
freeuniform
freeschool
bag
Mid day meal
Scholarship
Boys 442 90.5 52.7 12.0 91.9 49.3Govt.School Girls 456 92.5 69.3 24.1 92.3 58.1
Total 898 91.5 61.1 18.2 92.1 53.8
Boys 251 27.1 7.6 1.6 33.9 30.3PrivateSchool Girls 233 29.6 8.6 1.7 37.3 35.2
TotalTotal 484 28.3 8.1 1.7 35.5 32.6
Boys 71 52.1 15.5 7.0 29.6 22.5Madrasah/Maktab Girls 74 60.8 10.8 1.4 39.2 21.6
Total 145 56.6 13.1 4.1 34.5 22.1
Boys 764 66.1 34.4 8.1 67.0 40.6
Total Girls 763 70.2 45.1 15.1 70.4 47.6
Total 1527 68.2 39.8 11.6 68.7 44.1
LO
CNOJgH3O h

Table A7.9: Number of Children of sampled parents studying at Primary level(Classes I-V) getting different incentives in Rural and Urban areas
Total No. of % of children getting
State Type of school Gender
childrenattendingprimaryclasses
free textbooks
freeuniform
freeschool
bag
Mid day meal
Scholarship
Govt.School
Boys 235 96.6 73.6 6.8 81.7 11.9Girls 219 97.7 75.3 5.9 83.6 7.3Total 454 97.1 74.4 6.4 82.6 9.7
PrivateSchool
Boys 8 62.5 12.5 0.0 25.0 25.0Girls 17 70.6 11.8 5.9 58.8 0.0
AssamTotal 25 68.0 12.0 4.0 48.0 8.0
Madrasah/Maktab
Boys 29 100.0 31.0 6.9 41.4 6.9Girls 26 96.2 26.9 3.8 46.2 3.8Total 55 98.2 29.1 5.5 43.6 5.5Boys 272 96.0 67.3 6.6 75.7 11.8
Total Girls 262 95.8 66.4 5.7 78.2 6.5Total 534 95.9 66.9 6.2 77.0 9.2
Govt.School
Boys 357 88.5 66.9 15.4 77.0 30.5Girls 322 90.1 72.0 14.9 76.4 32.0Total 679 89.2 69.4 15.2 76.7 31.2
PrivateSchool
Boys 14 50.0 64.3 50.0 50.0 28.6Girls 23 47.8 82.6 21.7 73.9 30.4
Bihar Total 37 48.6 75.7 32.4 64.9 29.7
Madrasah/Maktab
Boys 57 61.4 42.1 8.8 59.6 10.5Girls 57 61.4 15.8 5.3 59.6 10.5Total 114 61.4 28.9 7.0 59.6 10.5Boys 428 83.6 63.6 15.7 73.8 27.8
Total Girls 402 83.6 64.7 13.9 73.9 28.9Total 830 83.6 64.1 14.8 73.9 28.3
Govt.School
Boys 131 98.5 93.1 0.0 99.2 55.0Girls 122 99.2 95.1 0.0 100.0 54.1Total 253 98.8 94.1 0.0 99.6 54.5
PrivateSchool
Boys 3 0.0 0.0 0.0 0.0 0.0Girls 1 0.0 0.0 0.0 0.0 0.0
GujaratTotal 4 0.0 0.0 0.0 0.0 0.0
Madrasah/Maktab
Boys 0 0.0 0.0 0.0 0.0 0.0Girls 1 100.0 0.0 0.0 100.0 0.0Total 1 100.0 0.0 0.0 100.0 0.0Boys 134 96.3 91.0 0.0 97.0 53.7
Total Girls 124 98.4 93.5 0.0 99.2 53.2Total 258 97.3 92.2 0.0 98.1 53.5
OJegH3O h

Table A7.9 (Contd.): Number of Children of sampled parents studying at Primary level(Classes I-V) getting different incentives in Rural and Urban areas
Total No. of % of children getting
State Type of school Gender
childrenattendingprimaryclasses
free textbooks
freeuniform
freeschool
bag
Mid day meal
Scholarship
Govt.School
Boys 138 91.3 89.9 42.8 92.8 52.9Girls 96 94.8 94.8 58.3 95.8 70.8Total 234 92.7 91.9 49.1 94.0 60.3
PrivateSchool
Boys 20 5.0 5.0 5.0 5.0 0.0Girls 15 33.3 33.3 0.0 33.3 13.3
HaryanaTotal 35 17.1 17.1 2.9 17.1 5.7
Madrasah/Maktab
Boys 7 42.9 0.0 0.0 71.4 0.0Girls 10 50.0 0.0 0.0 90.0 10.0Total 17 47.1 0.0 0.0 82.4 5.9Boys 165 78.8 75.8 36.4 81.2 44.2
Total Girls 121 83.5 79.3 46.3 87.6 58.7Total 286 80.8 77.3 40.6 83.9 50.3
Govt.School
Boys 240 98.8 0.8 0.4 97.9 43.8Girls 194 99.0 1.5 0.5 98.5 42.3Total 434 98.8 1.2 0.5 98.2 43.1
PrivateSchool
Boys 38 13.2 2.6 0.0 10.5 21.1Girls 17 17.6 11.8 0.0 5.9 11.8
Jammu & Total 55 14.5 5.5 0.0 9.1 18.2Kashmir
Madrasah/Maktab
Boys 5 20.0 40.0 0.0 80.0 60.0Girls 1 0.0 0.0 0.0 0.0 0.0Total 6 16.7 33.3 0.0 66.7 50.0Boys 283 85.9 1.8 0.4 85.9 41.0
Total Girls 212 92.0 2.4 0.5 90.6 39.6Total 495 88.5 2.0 0.4 87.9 40.4
Govt.School
Boys 174 93.7 24.1 5.7 87.4 27.0Girls 167 94.6 23.4 3.0 86.2 26.9Total 341 94.1 23.8 4.4 86.8 27.0
PrivateSchool
Boys 20 15.0 10.0 10.0 15.0 0.0Girls 16 18.8 6.3 0.0 18.8 12.5
JharkhandTotal 36 16.7 8.3 5.6 16.7 5.6
Madrasah/Maktab
Boys 17 35.3 5.9 0.0 88.2 0.0Girls 7 42.9 14.3 28.6 71.4 28.6Total 24 37.5 8.3 8.3 83.3 8.3Boys 211 81.5 21.3 5.7 80.6 22.3
Total Girls 190 86.3 21.6 3.7 80.0 25.8Total 401 83.8 21.4 4.7 80.3 23.9
OJgH3O h

Table A7.9 (Contd.): Number of Children of sampled parents studying at Primary level(Classes I-V) getting different incentives in Rural and Urban areas
Total No. of % of children getting
State Type of school Gender
childrenattendingprimaryclasses
free textbooks
freeuniform
freeschool
bag
Mid day meal
Scholarship
Govt.School
Boys 108 74.1 71.3 10.2 95.4 38.9Girls 87 74.7 65.5 11.5 90.8 50.6Total 195 74.4 68.7 10.8 93.3 44.1
PrivateSchool
Boys 48 25.0 10.4 2.1 50.0 20.8Girls 45 17.8 8.9 4.4 40.0 11.1
KarnatakaTotal 93 21.5 9.7 3.2 45.2 16.1
Madrasah/Maktab
Boys 00 0.0 0.0 0.0 0.0 0.0Girls 00 0.0 0.0 0.0 0.0 0.0Total 00 0.0 0.0 0.0 0.0 0.0Boys 156 59.0 52.6 7.7 81.4 33.3
Total Girls 132 55.3 46.2 9.1 73.5 37.1Total 288 57.3 49.7 8.3 77.8 35.1
Govt.School
Boys 160 72.5 15.0 5.0 88.8 38.8Girls 153 82.4 12.4 5.2 92.8 45.8Total 313 77.3 13.7 5.1 90.7 42.2
PrivateSchool
Boys 246 83.3 9.8 4.1 95.5 41.5Girls 252 84.1 13.5 4.0 93.3 47.2
KeralaTotal 498 83.7 11.6 4.0 94.4 44.4
Madrasah/Maktab
Boys 1 100.0 100.0 100.0 100.0 0.0Girls 4 75.0 25.0 0.0 75.0 50.0Total 5 80.0 40.0 20.0 80.0 40.0Boys 407 79.1 12.0 4.7 92.9 40.3
Total Girls 409 83.4 13.2 4.4 92.9 46.7Total 816 81.3 12.6 4.5 92.9 43.5
Govt.School
Boys 102 100.0 99.0 0.0 99.0 8.8Girls 122 100.0 99.2 0.0 100.0 11.5Total 224 100.0 99.1 0.0 99.6 10.3
PrivateSchool
Boys 20 0.0 0.0 0.0 0.0 0.0Girls 11 0.0 0.0 0.0 0.0 0.0
Madhya Total 31 0.0 0.0 0.0 0.0 0.0Pradesh
Madrasah/Maktab
Boys 7 100.0 42.9 0.0 71.4 0.0Girls 9 100.0 44.4 0.0 88.9 11.1Total 16 100.0 43.8 0.0 81.3 6.3Boys 129 84.5 80.6 0.0 82.2 7.0
Total Girls 142 92.3 88.0 0.0 91.5 10.6Total 271 88.6 84.5 0.0 87.1 8.9
OJgH3O h

Table A7.9 (Contd.): Number of Children of sampled parents studying at Primary level(Classes I-V) getting different incentives in Rural and Urban areas
Total No. of % of children getting
State Type of school Gender
childrenattendingprimaryclasses
free textbooks
freeuniform
freeschool
bag
Mid day meal
Scholarship
Govt.School
Boys 138 98.6 0.0 0.0 98.6 10.9Girls 99 98.0 5.1 1.0 100.0 11.1Total 237 98.3 2.1 0.4 99.2 11.0
PrivateSchool
Boys 14 14.3 0.0 0.0 14.3 0.0Girls 5 20.0 20.0 20.0 20.0 20.0
RajasthanTotal 19 15.8 5.3 5.3 15.8 5.3
Madrasah/Maktab
Boys 27 100.0 3.7 3.7 100.0 7.4Girls 15 86.7 0.0 0.0 86.7 26.7Total 42 95.2 2.4 2.4 95.2 14.3Boys 179 92.2 0.6 0.6 92.2 9.5
Total Girls 119 93.3 5.0 1.7 95.0 13.4Total 298 92.6 2.3 1.0 93.3 11.1
Govt.School
Boys 477 90.1 52.2 30.2 91.8 92.9Girls 508 95.9 91.9 83.7 94.9 95.5Total 985 93.1 72.7 57.8 93.4 94.2
PrivateSchool
Boys 195 2.1 1.5 1.5 2.6 63.1Girls 161 2.5 1.2 1.2 2.5 60.9
Uttar Total 356 2.2 1.4 1.4 2.5 62.1Pradesh
Madrasah/Maktab
Boys 106 25.5 0.0 1.9 0.9 32.1Girls 97 26.8 1.0 1.0 1.0 28.9Total 203 26.1 0.5 1.5 1.0 30.5Boys 778 59.3 32.4 19.2 57.1 77.1
Total Girls 766 67.5 61.4 55.9 63.6 79.8Total 1544 63.3 46.8 37.4 60.3 78.4
Govt.School
Boys 77 96.1 71.4 7.8 96.1 92.2Girls 76 94.7 86.8 6.6 94.7 84.2Total 153 95.4 79.1 7.2 95.4 88.2
PrivateSchool
Boys 59 3.4 0.0 0.0 3.4 35.6Girls 34 5.9 0.0 0.0 5.9 38.2
Uttara Total 93 4.3 0.0 0.0 4.3 36.6khand
Madrasah/Maktab
Boys 45 51.1 4.4 20.0 44.4 26.7Girls 29 44.8 10.3 13.8 31.0 13.8Total 74 48.6 6.8 17.6 39.2 21.6Boys 181 54.7 31.5 8.3 53.0 57.5
Total Girls 139 62.6 49.6 6.5 59.7 58.3Total 320 58.1 39.4 7.5 55.9 57.8
OJegH3O h

Table A7.9 (Contd.): Number of Children of sampled parents studying at Primary level(Classes I-V) getting different incentives in Rural and Urban areas
Total No. of children attending primary classes
% of children getting
State Type of school Gender free text
booksfree
uniformfree
schoolbag
Mid day meal
Scholarship
Boys 2337 91.4 51.7 13.3 90.1 46.0Govt.School Girls 2165 94.0 63.8 26.4 91.2 49.3
Total 4502 92.6 57.5 19.6 90.6 47.6
Boys 685 35.9 6.7 3.5 41.6 39.4PrivateSchool Girls 597 43.7 11.7 3.5 49.6 41.7
TotalTotal 1282 39.5 9.0 3.5 45.3 40.5
Boys 301 52.8 14.3 6.6 41.2 19.6Madrasah/Maktab Girls 256 52.0 10.2 4.3 37.1 19.1
Total 557 52.4 12.4 5.6 39.3 19.4
Boys 3323 76.5 39.0 10.7 75.7 42.3
Total Girls 3018 80.5 48.9 20.0 78.4 45.3
Total 6341 78.4 43.7 15.1 77.0 43.7
o0 0CNOJeg
O h

Table A7.10: Number of Children of sampled parents studying at Upper Primary level(Classes VI-VIII) getting different incentives in Rural areas
Total No. % of children getting
State Type of school Gender
of children attending primary classes
free textbooks
freeuniform
freeschool
bag
Mid day meal
Scholarship
Govt.School
Boys 64 92.2 64.1 4.7 73.4 6.3Girls 73 100.0 69.9 6.8 86.3 6.8Total 137 96.4 67.2 5.8 80.3 6.6
PrivateSchool
Boys 7 57.1 0.0 0.0 42.9 0.0Girls 4 50.0 0.0 0.0 0.0 0.0
AssamTotal 11 54.5 0.0 0.0 27.3 0.0
Madrasah/Maktab
Boys 6 100.0 16.7 0.0 66.7 0.0Girls 13 92.3 7.7 0.0 84.6 0.0Total 19 94.7 10.5 0.0 78.9 0.0Boys 77 89.6 54.5 3.9 70.1 5.2
Total Girls 90 96.7 57.8 5.6 82.2 5.6Total 167 93.4 56.3 4.8 76.6 5.4
Govt.School
Boys 54 79.6 63.0 13.0 79.6 31.5Girls 68 77.9 80.9 19.1 69.1 23.5Total 122 78.7 73.0 16.4 73.8 27.0
PrivateSchool
Boys 5 0.0 20.0 20.0 0.0 0.0Girls 5 40.0 80.0 40.0 40.0 0.0
BiharTotal 10 20.0 50.0 30.0 20.0 0.0
Madrasah/Maktab
Boys 13 53.8 30.8 0.0 84.6 30.8Girls 43 25.6 9.3 55.8 34.9 7.0Total 56 32.1 14.3 42.9 46.4 12.5Boys 72 69.4 54.2 11.1 75.0 29.2
Total Girls 116 56.9 54.3 33.6 55.2 16.4Total 188 61.7 54.3 25.0 62.8 21.3
Govt.School
Boys 33 100.0 90.9 0.0 100.0 90.9Girls 24 91.7 79.2 0.0 83.3 91.7Total 57 96.5 86.0 0.0 93.0 91.2
PrivateSchool
Boys 1 0.0 0.0 0.0 0.0 0.0Girls 2 0.0 0.0 0.0 0.0 0.0
GujaratTotal 3 0.0 0.0 0.0 0.0 0.0
Madrasah/Maktab
Boys 0 0.0 0.0 0.0 0.0 0.0Girls 1 100.0 0.0 0.0 100.0 0.0Total 1 100.0 0.0 0.0 100.0 0.0Boys 34 97.1 88.2 0.0 97.1 88.2
Total Girls 27 85.2 70.4 0.0 77.8 81.5Total 61 91.8 80.3 0.0 88.5 85.2
OJegO h

Table A7.10 (Contd.): Number of Children of sampled parents studying at Upper Primary level(Classes VI-VIII) getting different incentives in Rural areas
Total No. of % of children getting
State Type of school Gender
childrenattendingprimaryclasses
free textbooks
freeuniform
freeschool
bag
Mid day meal
Scholarship
Govt.School
Boys 25 84.0 92.0 76.0 92.0 88.0Girls 14 100.0 100.0 92.9 100.0 64.3Total 39 89.7 94.9 82.1 94.9 79.5
PrivateSchool
Boys 4 25.0 25.0 25.0 25.0 0.0Girls 2 0.0 0.0 0.0 0.0 0.0
HaryanaTotal 6 16.7 16.7 16.7 16.7 0.0
Madrasah/Maktab
Boys 1 0.0 0.0 0.0 100.0 0.0Girls 2 0.0 0.0 0.0 50.0 0.0Total 3 0.0 0.0 0.0 66.7 0.0Boys 30 73.3 80.0 66.7 83.3 73.3
Total Girls 18 77.8 77.8 72.2 83.3 50.0Total 48 75.0 79.2 68.8 83.3 64.6
Govt.School
Boys 70 98.6 1.4 0.0 97.1 51.4Girls 71 97.2 1.4 4.2 97.2 47.9Total 141 97.9 1.4 2.1 97.2 49.6
PrivateSchool
Boys 7 14.3 0.0 0.0 14.3 0.0Girls 3 33.3 0.0 0.0 33.3 33.3
Jammu & Total 10 20.0 0.0 0.0 20.0 10.0Kashmir
Madrasah/Maktab
Boys 0 0.0 0.0 0.0 0.0 0.0Girls 0 0.0 0.0 0.0 0.0 0.0Total 0 0.0 0.0 0.0 0.0 0.0Boys 77 90.9 1.3 0.0 89.6 46.8
Total Girls 74 94.6 1.4 4.1 94.6 47.3Total 151 92.7 1.3 2.0 92.1 47.0
Govt.School
Boys 53 84.9 24.5 13.2 84.9 45.3Girls 40 92.5 27.5 10.0 85.0 40.0Total 93 88.2 25.8 11.8 84.9 43.0
PrivateSchool
Boys 1 0.0 0.0 0.0 0.0 0.0Girls 4 75.0 0.0 0.0 50.0 0.0
JharkhandTotal 5 60.0 0.0 0.0 40.0 0.0
Madrasah/Maktab
Boys 9 33.3 11.1 44.4 44.4 22.2Girls 8 62.5 12.5 0.0 75.0 0.0Total 17 47.1 11.8 23.5 58.8 11.8Boys 63 76.2 22.2 17.5 77.8 41.3
Total Girls 52 86.5 23.1 7.7 80.8 30.8Total 115 80.9 22.6 13.0 79.1 36.5
OJegO h

Table A7.10 (Contd.): Number of Children of sampled parents studying at Upper Primary level(Classes VI-VIII) getting different incentives in Rural areas
Total No. of % of children getting
State Type of school Gender
childrenattendingprimaryclasses
free textbooks
freeuniform
freeschool
bag
Mid day meal
Scholarship
Govt.School
Boys 45 82.2 80.0 13.3 95.6 37.8Girls 42 97.6 92.9 14.3 97.6 40.5Total 87 89.7 86.2 13.8 96.6 39.1
PrivateSchool
Boys 25 16.0 4.0 0.0 64.0 24.0Girls 15 20.0 6.7 6.7 40.0 .0
KarnatakaTotal 40 17.5 5.0 2.5 55.0 15.0
Madrasah/Maktab
Boys 0 0.0 0.0 0.0 0.0 0.0Girls 0 0.0 0.0 0.0 0.0 0.0Total 0 0.0 0.0 0.0 0.0 0.0Boys 70 58.6 52.9 8.6 84.3 32.9
Total Girls 57 77.2 70.2 12.3 82.5 29.8Total 127 66.9 60.6 10.2 83.5 31.5
Govt.School
Boys 61 82.0 9.8 3.3 90.2 36.1Girls 50 78.0 .0 2.0 78.0 44.0Total 111 80.2 5.4 2.7 84.7 39.6
PrivateSchool
Boys 55 90.9 1.8 1.8 96.4 34.5Girls 67 86.6 0.0 0.0 92.5 47.8
KeralaTotal 122 88.5 .8 .8 94.3 41.8
Madrasah/Maktab
Boys 1 100.0 0.0 0.0 100.0 0.0Girls 0 0.0 0.0 0.0 0.0 0.0Total 1 100.0 0.0 0.0 100.0 0.0Boys 117 86.3 6.0 2.6 93.2 35.0
Total Girls 117 82.9 .0 .9 86.3 46.2Total 234 84.6 3.0 1.7 89.7 40.6
Govt.School
Boys 37 100.0 100.0 0.0 100.0 81.1Girls 58 100.0 98.3 0.0 98.3 89.7Total 95 100.0 98.9 0.0 98.9 86.3
PrivateSchool
Boys 4 0.0 0.0 0.0 0.0 25.0Girls 3 0.0 0.0 0.0 0.0 0.0
Madhya Total 7 0.0 0.0 0.0 0.0 14.3Pradesh
Madrasah/Maktab
Boys 4 75.0 50.0 0.0 50.0 50.0Girls 6 100.0 66.7 0.0 100.0 50.0Total 10 90.0 60.0 0.0 80.0 50.0Boys 45 88.9 86.7 0.0 86.7 73.3
Total Girls 67 95.5 91.0 0.0 94.0 82.1Total 112 92.9 89.3 0.0 91.1 78.6
OJegO h

Table A7.10 (Contd.): Number of Children of sampled parents studying at Upper Primary level(Classes VI-VIII) getting different incentives in Rural areas
Total No. of % of children getting
State Type of school Gender
childrenattendingprimaryclasses
free textbooks
freeuniform
freeschool
bag
Mid day meal
Scholarship
Govt.School
Boys 26 100.0 0.0 0.0 100.0 11.5Girls 13 100.0 0.0 0.0 100.0 30.8Total 39 100.0 0.0 0.0 100.0 17.9
PrivateSchool
Boys 1 0.0 0.0 0.0 0.0 0.0Girls 1 0.0 0.0 0.0 0.0 0.0
RajasthanTotal 2 0.0 0.0 0.0 0.0 0.0
Madrasah/Maktab
Boys 3 100.0 0.0 0.0 100.0 0.0Girls 1 100.0 0.0 0.0 100.0 0.0Total 4 100.0 0.0 0.0 100.0 0.0Boys 30 96.7 0.0 0.0 96.7 10.0
Total Girls 15 93.3 0.0 0.0 93.3 26.7Total 45 95.6 0.0 0.0 95.6 15.6
Govt.School
Boys 120 94.2 55.8 41.7 92.5 93.3Girls 126 97.6 93.7 94.4 96.0 96.8Total 246 95.9 75.2 68.7 94.3 95.1
PrivateSchool
Boys 57 5.3 3.5 0.0 7.0 82.5Girls 37 10.8 10.8 10.8 10.8 73.0
Uttar Total 94 7.4 6.4 4.3 8.5 78.7Pradesh
Madrasah/Maktab
Boys 4 50.0 0.0 0.0 0.0 100.0Girls 8 25.0 0.0 0.0 0.0 37.5Total 12 33.3 0.0 0.0 0.0 58.3Boys 181 65.2 38.1 27.6 63.5 90.1
Total Girls 171 75.4 71.3 71.9 73.1 88.9Total 352 70.2 54.3 49.1 68.2 89.5
Govt.School
Boys 8 87.5 75.0 0.0 87.5 87.5Girls 7 71.4 71.4 0.0 71.4 85.7Total 15 80.0 73.3 0.0 80.0 86.7
PrivateSchool
Boys 21 9.5 4.8 0.0 9.5 19.0Girls 18 0.0 0.0 0.0 0.0 22.2
Uttara Total 39 5.1 2.6 0.0 5.1 20.5khand
Madrasah/Maktab
Boys 4 50.0 0.0 50.0 50.0 0.0Girls 4 75.0 0.0 50.0 75.0 0.0Total 8 62.5 0.0 50.0 62.5 0.0Boys 33 33.3 21.2 6.1 33.3 33.3
Total Girls 29 27.6 17.2 6.9 27.6 34.5Total 62 30.6 19.4 6.5 30.6 33.9
OJegO h

Table A7.10 (Contd.): Number of Children of sampled parents studying at Upper Primary level(Classes VI-VIII) getting different incentives in Rural areas
Total No. of children attending primary classes
% of children getting
State Type of school Gender free text
booksfree
uniformfree
schoolbag
Mid day meal
Scholarship
Boys 596 90.6 49.3 15.8 90.3 54.4Govt.School Girls 586 93.3 63.1 28.0 89.2 55.5
Total 1182 92.0 56.2 21.8 89.8 54.9
Boys 188 34.6 3.7 1.6 42.6 41.0PrivateSchool Girls 161 45.3 5.6 4.3 47.8 39.8
TotalTotal 349 39.5 4.6 2.9 45.0 40.4
Boys 45 60.0 17.8 13.3 62.2 26.7Madrasah/Maktab Girls 86 47.7 11.6 30.2 51.2 10.5
Total 131 51.9 13.7 24.4 55.0 16.0
Boys 829 76.2 37.3 12.4 77.9 49.8
Total Girls 833 79.4 46.7 23.6 77.3 47.8
Total 1662 77.8 42.0 18.1 77.6 48.8
LO0 0CNOJeg
O h

Table A7.11: Number of Children of sampled parents studying at Upper Primary level(Classes VI-VIII) getting different incentives in Urban areas
Total No. % of children getting
State Type of school Gender
of children attending primary classes
free textbooks
freeuniform
freeschool
bag
Mid day meal
Scholarship
Govt.School
Boys 30 100.0 53.3 .0 90.0 6.7Girls 37 91.9 59.5 2.7 94.6 18.9Total 67 95.5 56.7 1.5 92.5 13.4
PrivateSchool
Boys 4 50.0 0.0 0.0 25.0 0.0Girls 6 66.7 50.0 0.0 83.3 0.0
AssamTotal 10 60.0 30.0 0.0 60.0 0.0
Madrasah/Maktab
Boys 4 100.0 100.0 0.0 100.0 25.0Girls 0 0.0 0.0 0.0 0.0 0.0Total 4 100.0 100.0 .0 100.0 25.0Boys 38 94.7 52.6 .0 84.2 7.9
Total Girls 43 88.4 58.1 2.3 93.0 16.3Total 81 91.4 55.6 1.2 88.9 12.3
Govt.School
Boys 24 66.7 66.7 20.8 70.8 29.2Girls 27 92.6 92.6 22.2 92.6 44.4Total 51 80.4 80.4 21.6 82.4 37.3
PrivateSchool
Boys 0 0.0 0.0 0.0 0.0 0.0Girls 0 0.0 0.0 0.0 0.0 0.0
Bihar Total 0 0.0 0.0 0.0 0.0 0.0
Madrasah/Maktab
Boys 2 0.0 0.0 50.0 50.0 0.0Girls 4 0.0 75.0 100.0 0.0 0.0Total 6 0.0 50.0 83.3 16.7 0.0Boys 26 61.5 61.5 23.1 69.2 26.9
Total Girls 31 80.6 90.3 32.3 80.6 38.7Total 57 71.9 77.2 28.1 75.4 33.3
Govt.School
Boys 12 91.7 83.3 0.0 91.7 66.7Girls 18 94.4 100.0 0.0 100.0 100.0Total 30 93.3 93.3 0.0 96.7 86.7
PrivateSchool
Boys 2 0.0 0.0 0.0 0.0 0.0Girls 1 0.0 0.0 0.0 0.0 0.0
GujaratTotal 3 0.0 0.0 0.0 0.0 0.0
Madrasah/Maktab
Boys 0 0.0 0.0 0.0 0.0 0.0Girls 0 0.0 0.0 0.0 0.0 0.0Total 0 0.0 0.0 0.0 0.0 0.0Boys 14 78.6 71.4 0.0 78.6 57.1
Total Girls 19 89.5 94.7 0.0 94.7 94.7Total 33 84.8 84.8 0.0 87.9 78.8
OJgO h

Table A7.11 (Contd.): Number of Children of sampled parents studying at Upper Primary level(Classes VI-VIII) getting different incentives in Urban areas
Total No. of % of children getting
State Type of school Gender
childrenattendingprimaryclasses
free textbooks
freeuniform
freeschool
bag
Mid day meal
Scholarship
Govt.School
Boys 10 60.0 60.0 10.0 60.0 50.0Girls 8 50.0 50.0 25.0 50.0 50.0Total 18 55.6 55.6 16.7 55.6 50.0
PrivateSchool
Boys 1 0.0 0.0 0.0 0.0 0.0Girls 1 0.0 0.0 0.0 0.0 0.0
HaryanaTotal 2 0.0 0.0 0.0 0.0 0.0
Madrasah/Maktab
Boys 2 100.0 0.0 0.0 100.0 100.0Girls 1 0.0 0.0 0.0 100.0 0.0Total 3 66.7 0.0 0.0 100.0 66.7Boys 13 61.5 46.2 7.7 61.5 53.8
Total Girls 10 40.0 40.0 20.0 50.0 40.0Total 23 52.2 43.5 13.0 56.5 47.8
Govt.School
Boys 22 95.5 0.0 0.0 95.5 27.3Girls 14 85.7 14.3 14.3 85.7 35.7Total 36 91.7 5.6 5.6 91.7 30.6
PrivateSchool
Boys 14 7.1 7.1 7.1 0.0 14.3Girls 9 0.0 0.0 0.0 0.0 11.1
Jammu & Total 23 4.3 4.3 4.3 0.0 13.0Kashmir
Madrasah/Maktab
Boys 0 0.0 0.0 0.0 0.0 0.0Girls 0 0.0 0.0 0.0 0.0 0.0Total 0 0.0 0.0 0.0 0.0 0.0Boys 36 61.1 2.8 2.8 58.3 22.2
Total Girls 23 52.2 8.7 8.7 52.2 26.1Total 59 57.6 5.1 5.1 55.9 23.7
Govt.School
Boys 7 57.1 0.0 14.3 42.9 14.3Girls 5 80.0 0.0 20.0 60.0 20.0Total 12 66.7 0.0 16.7 50.0 16.7
PrivateSchool
Boys 6 16.7 33.3 0.0 0.0 0.0Girls 8 25.0 25.0 0.0 0.0 0.0
JharkhandTotal 14 21.4 28.6 0.0 0.0 0.0
Madrasah/Maktab
Boys 1 100.0 0.0 0.0 100.0 0.0Girls 0 0.0 0.0 0.0 0.0 0.0Total 1 100.0 0.0 0.0 100.0 0.0Boys 14 42.9 14.3 7.1 28.6 7.1
Total Girls 13 46.2 15.4 7.7 23.1 7.7Total 27 44.4 14.8 7.4 25.9 7.4
OJgO h

Table A7.11 (Contd.): Number of Children of sampled parents studying at Upper Primary level(Classes VI-VIII) getting different incentives in Urban areas
Total No. of % of children getting
State Type of school Gender
childrenattendingprimaryclasses
free textbooks
freeuniform
freeschool
bag
Mid day meal
Scholarship
Govt.School
Boys 23 91.3 78.3 13.0 95.7 34.8Girls 18 72.2 66.7 5.6 100.0 61.1Total 41 82.9 73.2 9.8 97.6 46.3
PrivateSchool
Boys 14 42.9 7.1 7.1 64.3 21.4Girls 21 42.9 14.3 9.5 57.1 4.8
KarnatakaTotal 35 42.9 11.4 8.6 60.0 11.4
Madrasah/Maktab
Boys 0 0.0 0.0 0.0 0.0 0.0Girls 0 0.0 0.0 0.0 0.0 0.0Total 0 0.0 0.0 0.0 0.0 0.0Boys 37 73.0 51.4 10.8 83.8 29.7
Total Girls 39 56.4 38.5 7.7 76.9 30.8Total 76 64.5 44.7 9.2 80.3 30.3
Govt.School
Boys 25 96.0 16.0 0.0 96.0 52.0Girls 32 75.0 28.1 3.1 93.8 56.3Total 57 84.2 22.8 1.8 94.7 54.4
PrivateSchool
Boys 34 67.6 11.8 2.9 79.4 55.9Girls 21 61.9 14.3 0.0 76.2 47.6
KeralaTotal 55 65.5 12.7 1.8 78.2 52.7
Madrasah/Maktab
Boys 0 0.0 0.0 0.0 0.0 0.0Girls 0 0.0 0.0 0.0 0.0 0.0Total 0 0.0 0.0 0.0 0.0 0.0Boys 59 79.7 13.6 1.7 86.4 54.2
Total Girls 53 69.8 22.6 1.9 86.8 52.8Total 112 75.0 17.9 1.8 86.6 53.6
Govt.School
Boys 6 100.0 100.0 0.0 100.0 83.3Girls 17 100.0 100.0 0.0 100.0 47.1Total 23 100.0 100.0 0.0 100.0 56.5
PrivateSchool
Boys 4 0.0 0.0 0.0 0.0 0.0Girls 3 0.0 0.0 0.0 0.0 0.0
Madhya Total 7 0.0 0.0 0.0 0.0 0.0Pradesh
Madrasah/Maktab
Boys 2 100.0 0.0 0.0 100.0 0.0Girls 5 100.0 20.0 0.0 100.0 20.0Total 7 100.0 14.3 0.0 100.0 14.3Boys 12 66.7 50.0 0.0 66.7 41.7
Total Girls 25 88.0 72.0 0.0 88.0 36.0Total 37 81.1 64.9 0.0 81.1 37.8

Table A7.11 (Contd.): Number of Children of sampled parents studying at Upper Primary level(Classes VI-VIII) getting different incentives in Urban areas
Total No. of % of children getting
State Type of school Gender
childrenattendingprimaryclasses
free textbooks
freeuniform
freeschool
bag
Mid day meal
Scholarship
Govt.School
Boys 14 92.9 7.1 7.1 92.9 42.9Girls 7 100.0 0.0 0.0 85.7 14.3Total 21 95.2 4.8 4.8 90.5 33.3
PrivateSchool
Boys 1 0.0 0.0 0.0 0.0 0.0Girls 0 0.0 0.0 0.0 0.0 0.0
RajasthanTotal 1 0.0 0.0 0.0 0.0 0.0
Madrasah/Maktab
Boys 8 75.0 25.0 25.0 75.0 37.5Girls 4 100.0 25.0 25.0 100.0 75.0Total 12 83.3 25.0 25.0 83.3 50.0Boys 23 82.6 13.0 13.0 82.6 39.1
Total Girls 11 100.0 9.1 9.1 90.9 36.4Total 34 88.2 11.8 11.8 85.3 38.2
Govt.School
Boys 38 81.6 26.3 10.5 76.3 71.1Girls 46 84.8 58.7 54.3 78.3 78.3Total 84 83.3 44.0 34.5 77.4 75.0
PrivateSchool
Boys 26 3.8 0.0 0.0 3.8 80.8Girls 15 20.0 0.0 0.0 13.3 60.0
Uttar Total 41 9.8 0.0 0.0 7.3 73.2Pradesh
Madrasah/Maktab
Boys 3 33.3 0.0 0.0 0.0 0.0Girls 1 0.0 0.0 0.0 0.0 0.0Total 4 25.0 0.0 0.0 0.0 0.0Boys 67 49.3 14.9 6.0 44.8 71.6
Total Girls 62 67.7 43.5 40.3 61.3 72.6Total 129 58.1 28.7 22.5 52.7 72.1
Govt.School
Boys 0 0.0 0.0 0.0 0.0 0.0Girls 11 100.0 100.0 18.2 100.0 90.9Total 11 100.0 100.0 18.2 100.0 90.9
PrivateSchool
Boys 6 0.0 0.0 0.0 0.0 0.0Girls 5 0.0 0.0 0.0 0.0 0.0
Uttara Total 11 0.0 0.0 0.0 0.0 0.0khand
Madrasah/Maktab
Boys 0 0.0 0.0 0.0 0.0 0.0Girls 0 0.0 0.0 0.0 0.0 0.0Total 0 0.0 0.0 0.0 0.0 0.0Boys 6 0.0 0.0 0.0 0.0 0.0
Total Girls 16 68.8 68.8 12.5 68.8 62.5Total 22 50.0 50.0 9.1 50.0 45.5
OJgO h

Table A7.11 (Contd.): Number of Children of sampled parents studying at Upper Primary level(Classes VI-VIII) getting different incentives in Urban areas
Total No. of children attending primary classes
% of children getting
State Type of school Gender free text
booksfree
uniformfree
schoolbag
Mid day meal
Scholarship
Boys 211 86.7 41.2 7.1 84.8 41.7Govt.School Girls 240 86.3 61.3 17.1 89.6 54.6
Total 451 86.5 51.9 12.4 87.4 48.6
Boys 112 30.4 7.1 2.7 33.9 40.2PrivateSchool Girls 90 34.4 12.2 2.2 38.9 23.3
TotalTotal 202 32.2 9.4 2.5 36.1 32.7
Boys 22 72.7 27.3 13.6 72.7 27.3Madrasah/Maktab Girls 15 60.0 33.3 33.3 66.7 26.7
Total 37 67.6 29.7 21.6 70.3 27.0
Boys 345 67.5 29.3 6.1 67.5 40.3
Total Girls 345 71.6 47.2 13.9 75.4 45.2
Total 690 69.6 38.3 10.0 71.4 42.8
o
CNOJg
O h

Table A7.12: Number of Children of sampled parents studying at Upper Primary level(Classes VI-VIII) getting different incentives in Rural and Urban areas
Total No. % of children getting
State Type of school Gender
of children attending primary classes
free textbooks
freeuniform
freeschool
bag
Mid day meal
Scholarship
Govt.School
Boys 94 94.7 60.6 3.2 78.7 6.4Girls 110 97.3 66.4 5.5 89.1 10.9Total 204 96.1 63.7 4.4 84.3 8.8
PrivateSchool
Boys 12 50.0 0.0 0.0 41.7 0.0Girls 10 60.0 30.0 0.0 50.0 0.0
AssamTotal 22 54.5 13.6 0.0 45.5 0.0
Madrasah/Maktab
Boys 10 100.0 50.0 0.0 80.0 10.0Girls 13 92.3 7.7 0.0 84.6 0.0Total 23 95.7 26.1 0.0 82.6 4.3Boys 116 90.5 53.4 2.6 75.0 6.0
Total Girls 133 94.0 57.9 4.5 85.7 9.0Total 249 92.4 55.8 3.6 80.7 7.6
Govt.School
Boys 78 75.6 64.1 15.4 76.9 30.8Girls 95 82.1 84.2 20.0 75.8 29.5Total 173 79.2 75.1 17.9 76.3 30.1
PrivateSchool
Boys 5 0.0 20.0 20.0 0.0 0.0Girls 5 40.0 80.0 40.0 40.0 0.0
BiharTotal 10 20.0 50.0 30.0 20.0 0.0
Madrasah/Maktab
Boys 15 46.7 26.7 6.7 80.0 26.7Girls 47 23.4 14.9 59.6 31.9 6.4Total 62 29.0 17.7 46.8 43.5 11.3Boys 98 67.3 56.1 14.3 73.5 28.6
Total Girls 147 61.9 61.9 33.3 60.5 21.1Total 245 64.1 59.6 25.7 65.7 24.1
Govt.School
Boys 45 97.8 88.9 0.0 97.8 84.4Girls 42 92.9 88.1 0.0 90.5 95.2Total 87 95.4 88.5 0.0 94.3 89.7
PrivateSchool
Boys 3 0.0 0.0 0.0 0.0 0.0Girls 3 0.0 0.0 0.0 0.0 0.0
GujaratTotal 6 0.0 0.0 0.0 0.0 0.0
Madrasah/Maktab
Boys 0 0.0 0.0 0.0 0.0 0.0Girls 1 100.0 0.0 0.0 100.0 0.0Total 1 100.0 0.0 0.0 100.0 0.0Boys 48 91.7 83.3 0.0 91.7 79.2
Total Girls 46 87.0 80.4 0.0 84.8 87.0Total 94 89.4 81.9 0.0 88.3 83.0
OJgO h

Table A7.12 (Contd.): Number of Children of sampled parents studying at Upper Primary level(Classes VI-VIII) getting different incentives in Rural and Urban areas
Total No. of % of children getting
State Type of school Gender
childrenattendingprimaryclasses
free textbooks
freeuniform
freeschool
bag
Mid day meal
Scholarship
Govt.School
Boys 35 77.1 82.9 57.1 82.9 77.1Girls 22 81.8 81.8 68.2 81.8 59.1Total 57 78.9 82.5 61.4 82.5 70.2
PrivateSchool
Boys 5 20.0 20.0 20.0 20.0 0.0Girls 3 0.0 0.0 0.0 0.0 0.0
HaryanaTotal 8 12.5 12.5 12.5 12.5 0.0
Madrasah/Maktab
Boys 3 66.7 0.0 0.0 100.0 66.7Girls 3 0.0 0.0 0.0 66.7 0.0Total 6 33.3 0.0 0.0 83.3 33.3Boys 43 69.8 69.8 48.8 76.7 67.4
Total Girls 28 64.3 64.3 53.6 71.4 46.4Total 71 67.6 67.6 50.7 74.6 59.2
Govt.School
Boys 92 97.8 1.1 0.0 96.7 45.7Girls 85 95.3 3.5 5.9 95.3 45.9Total 177 96.6 2.3 2.8 96.0 45.8
PrivateSchool
Boys 21 9.5 4.8 4.8 4.8 9.5Girls 12 8.3 0.0 0.0 8.3 16.7
Jammu & Total 33 9.1 3.0 3.0 6.1 12.1Kashmir
Madrasah/Maktab
Boys 0 0.0 0.0 0.0 0.0 0.0Girls 0 0.0 0.0 0.0 0.0 0.0Total 0 0.0 0.0 0.0 0.0 0.0Boys 113 81.4 1.8 .9 79.6 38.9
Total Girls 97 84.5 3.1 5.2 84.5 42.3Total 210 82.9 2.4 2.9 81.9 40.5
Govt.School
Boys 60 81.7 21.7 13.3 80.0 41.7Girls 45 91.1 24.4 11.1 82.2 37.8Total 105 85.7 22.9 12.4 81.0 40.0
PrivateSchool
Boys 7 14.3 28.6 0.0 0.0 0.0Girls 12 41.7 16.7 0.0 16.7 0.0
JharkhandTotal 19 31.6 21.1 0.0 10.5 0.0
Madrasah/Maktab
Boys 10 40.0 10.0 40.0 50.0 20.0Girls 8 62.5 12.5 0.0 75.0 0.0Total 18 50.0 11.1 22.2 61.1 11.1Boys 77 70.1 20.8 15.6 68.8 35.1
Total Girls 65 78.5 21.5 7.7 69.2 26.2Total 142 73.9 21.1 12.0 69.0 31.0

Table A7.12 (Contd.): Number of Children of sampled parents studying at Upper Primary level(Classes VI-VIII) getting different incentives in Rural and Urban areas
Total No. % of children getting
State Type of school Gender
of children attending primary classes
free textbooks
freeuniform
freeschool
bag
Mid day meal
Scholarship
Govt.School
Boys 69 85.5 78.3 13.0 95.7 36.2Girls 60 90.0 85.0 11.7 98.3 46.7Total 129 87.6 81.4 12.4 96.9 41.1
PrivateSchool
Boys 41 26.8 4.9 2.4 63.4 24.4Girls 36 33.3 11.1 8.3 50.0 2.8
KarnatakaTotal 77 29.9 7.8 5.2 57.1 14.3
Madrasah/Maktab
Boys 0 0.0 0.0 0.0 0.0 0.0Girls 0 0.0 0.0 0.0 0.0 0.0Total 0 0.0 0.0 0.0 0.0 0.0Boys 110 63.6 50.9 9.1 83.6 31.8
Total Girls 96 68.8 57.3 10.4 80.2 30.2Total 206 66.0 53.9 9.7 82.0 31.1
Govt.School
Boys 86 86.0 11.6 2.3 91.9 40.7Girls 82 76.8 11.0 2.4 84.1 48.8Total 168 81.5 11.3 2.4 88.1 44.6
PrivateSchool
Boys 89 82.0 5.6 2.2 89.9 42.7Girls 88 80.7 3.4 .0 88.6 47.7
KeralaTotal 177 81.4 4.5 1.1 89.3 45.2
Madrasah/Maktab
Boys 1 100.0 0.0 0.0 100.0 0.0Girls 0 0.0 0.0 0.0 0.0 0.0Total 1 100.0 0.0 0.0 100.0 0.0Boys 176 84.1 8.5 2.3 90.9 41.5
Total Girls 170 78.8 7.1 1.2 86.5 48.2Total 346 81.5 7.8 1.7 88.7 44.8
Govt.School
Boys 43 100.0 100.0 0.0 100.0 81.4Girls 75 100.0 98.7 0.0 98.7 80.0Total 118 100.0 99.2 0.0 99.2 80.5
PrivateSchool
Boys 8 0.0 0.0 0.0 0.0 12.5Girls 6 0.0 0.0 0.0 0.0 0.0
Madhya Total 14 0.0 0.0 0.0 0.0 7.1Pradesh
Madrasah/Maktab
Boys 6 83.3 33.3 0.0 66.7 33.3Girls 11 100.0 45.5 0.0 100.0 36.4Total 17 94.1 41.2 0.0 88.2 35.3Boys 57 84.2 78.9 0.0 82.5 66.7
Total Girls 92 93.5 85.9 0.0 92.4 69.6Total 149 89.9 83.2 0.0 88.6 68.5

Table A7.12 (Contd.): Number of Children of sampled parents studying at Upper Primary level(Classes VI-VIII) getting different incentives in Rural and Urban areas
Total No. of % of children getting
State Type of school Gender
childrenattendingprimaryclasses
free textbooks
freeuniform
freeschool
bag
Mid day meal
Scholarship
Govt.School
Boys 40 97.5 2.5 2.5 97.5 22.5Girls 20 100.0 0.0 0.0 95.0 25.0Total 60 98.3 1.7 1.7 96.7 23.3
PrivateSchool
Boys 2 0.0 0.0 0.0 0.0 0.0Girls 1 0.0 0.0 0.0 0.0 0.0
RajasthanTotal 3 0.0 0.0 0.0 0.0 0.0
Madrasah/Maktab
Boys 11 81.8 18.2 18.2 81.8 27.3Girls 5 100.0 20.0 20.0 100.0 60.0Total 16 87.5 18.8 18.8 87.5 37.5Boys 53 90.6 5.7 5.7 90.6 22.6
Total Girls 26 96.2 3.8 3.8 92.3 30.8Total 79 92.4 5.1 5.1 91.1 25.3
Govt.School
Boys 158 91.1 48.7 34.2 88.6 88.0Girls 172 94.2 84.3 83.7 91.3 91.9Total 330 92.7 67.3 60.0 90.0 90.0
PrivateSchool
Boys 83 4.8 2.4 0.0 6.0 81.9Girls 52 13.5 7.7 7.7 11.5 69.2
Uttar Total 135 8.1 4.4 3.0 8.1 77.0Pradesh
Madrasah/Maktab
Boys 7 42.9 0.0 0.0 0.0 57.1Girls 9 22.2 0.0 0.0 0.0 33.3Total 16 31.3 0.0 0.0 0.0 43.8Boys 248 60.9 31.9 21.8 58.5 85.1
Total Girls 233 73.4 63.9 63.5 70.0 84.5Total 481 66.9 47.4 42.0 64.0 84.8
Govt.School
Boys 8 87.5 75.0 0.0 87.5 87.5Girls 18 88.9 88.9 11.1 88.9 88.9Total 26 88.5 84.6 7.7 88.5 88.5
PrivateSchool
Boys 27 7.4 3.7 0.0 7.4 14.8Girls 23 0.0 0.0 0.0 0.0 17.4
Uttara Total 50 4.0 2.0 0.0 4.0 16.0khand
Madrasah/Maktab
Boys 4 50.0 0.0 50.0 50.0 0.0Girls 4 75.0 0.0 50.0 75.0 0.0Total 8 62.5 0.0 50.0 62.5 0.0Boys 39 28.2 17.9 5.1 28.2 28.2
Total Girls 45 42.2 35.6 8.9 42.2 44.4Total 84 35.7 27.4 7.1 35.7 36.9
OJgO h

Table A7.12 (Contd.(Classes
): Number of Children of sampled parents studying at Upper Primary levelVI-VIII) getting different incentives in Rural and Urban areas
Total No. of children attending primary classes
% of children getting
State Type of school Gender free text
booksfree
uniformfree
schoolbag
Mid day meal
Scholarship
Boys 808 89.6 47.2 13.5 88.9 51.0Govt.School Girls 826 91.3 62.6 24.8 89.3 55.2
Total 1634 90.5 55.0 19.2 89.1 53.1
Boys 303 33.0 5.0 2.0 39.6 40.6PrivateSchool Girls 251 41.4 8.0 3.6 44.6 33.9
TotalTotal 554 36.8 6.3 2.7 41.9 37.5
Boys 67 64.2 20.9 13.4 65.7 26.9Madrasah/Maktab Girls 101 49.5 14.9 30.7 53.5 12.9
Total 168 55.4 17.3 23.8 58.3 18.5
Boys 1178 73.6 34.8 10.5 74.9 46.9
Total Girls 1178 77.1 46.9 20.8 76.7 47.0
Total 2356 75.3 40.8 15.7 75.8 47.0
LOa ^CN
OJgH3O h

Table A7.13: Number of children who were provided escorts for going to School/Madrasah
Type of school attended
Children provided escortState Gender Total Yes No
N % N %Boys 329 17 5.2 312 94.8
Government School Girls 329 26 7.9 303 92.1Total 658 43 6.5 615 93.5Boys 20 1 5.0 19 95.0
Private School Girls 27 3 11.1 24 88.9
Assam Total 47 4 8.5 43 91.5Boys 39 0 0.0 39 100.0
Madrasah/Maktab Girls 39 1 2.6 38 97.4Total 78 1 1.3 77 98.7Boys 388 18 4.6 370 95.4
Total Girls 395 30 7.6 365 92.4Total 783 48 6.1 735 93.9Boys 435 44 10.1 391 89.9
Government School Girls 417 38 9.1 379 90.9Total 852 82 9.6 770 90.4Boys 19 4 21.1 15 78.9
Private School Girls 28 15 53.6 13 46.4
Bihar Total 47 19 40.4 28 59.6Boys 72 5 6.9 67 93.1
Madrasah/Maktab Girls 104 11 10.6 93 89.4Total 176 16 9.1 160 90.9Boys 526 53 10.1 473 89.9
Total Girls 549 64 11.7 485 88.3Total 1075 117 10.9 958 89.1Boys 176 1 0.6 175 99.4
Government School Girls 164 5 3.0 159 97.0Total 340 6 1.8 334 98.2Boys 6 0 0.0 6 100.0
Private School Girls 4 0 0.0 4 100.0
Gujarat Total 10 0 0.0 10 100.0Boys 0 0 0.0 0 0.0
Madrasah/Maktab Girls 2 1 50.0 1 50.0Total 2 1 50.0 1 50.0Boys 182 1 0.5 181 99.5
Total Girls 170 6 3.5 164 96.5Total 352 7 2.0 345 98.0Boys 173 24 13.9 149 86.1
Government School Girls 118 15 12.7 103 87.3Total 291 39 13.4 252 86.6Boys 25 11 44.0 14 56.0
Private School Girls 18 7 38.9 11 61.1
Haryana Total 43 18 41.9 25 58.1Boys 10 3 30.0 7 70.0
Madrasah/Maktab Girls 13 1 7.7 12 92.3Total 23 4 17.4 19 82.6Boys 208 38 18.3 170 81.7
Total Girls 149 23 15.4 126 84.6Total 357 61 17.1 296 82.9

Table A7.13 (Contd.): Number of children who were provided escorts for going to School/Madrasah
Type of school attended
Children provided escortState Gender Total Yes No
N % N %Boys 332 23 6.9 309 93.1
Government School Girls 279 32 11.5 247 88.5Total 611 55 9.0 556 91.0Boys 59 7 11.9 52 88.1
Private School Girls 29 6 20.7 23 79.3Jammu & Total 88 13 14.8 75 85.2Kashmir Boys 5 2 40.0 3 60.0
Madrasah/Maktab Girls 1 0 0.0 1 100.0Total 6 2 33.3 4 66.7Boys 396 32 8.1 364 91.9
Total Girls 309 38 12.3 271 87.7Total 705 70 9.9 635 90.1Boys 234 26 11.1 208 88.9
Government School Girls 212 24 11.3 188 88.7Total 446 50 11.2 396 88.8Boys 27 2 7.4 25 92.6
Private School Girls 28 0 .0 28 100.0
Jharkhand Total 55 2 3.6 53 96.4Boys 27 3 11.1 24 88.9
Madrasah/Maktab Girls 15 2 13.3 13 86.7Total 42 5 11.9 37 88.1Boys 288 31 10.8 257 89.2
Total Girls 255 26 10.2 229 89.8Total 543 57 10.5 486 89.5Boys 177 15 8.5 162 91.5
Government School Girls 147 18 12.2 129 87.8Total 324 33 10.2 291 89.8Boys 89 6 6.7 83 93.3
Private School Girls 81 6 7.4 75 92.6
Karnataka Total 170 12 7.1 158 92.9Boys 0 0 0.0 0 0.0
Madrasah/Maktab Girls 0 0 0.0 0 0.0Total 0 0 0.0 0 0.0Boys 266 21 7.9 245 92.1
Total Girls 228 24 10.5 204 89.5Total 494 45 9.1 449 90.9Boys 246 32 13.0 214 87.0
Government School Girls 235 24 10.2 211 89.8Total 481 56 11.6 425 88.4Boys 335 19 5.7 316 94.3
Private School Girls 340 26 7.6 314 92.4
Kerala Total 675 45 6.7 630 93.3Boys 2 0 0.0 2 100.0
Madrasah/Maktab Girls 4 0 0.0 4 100.0Total 6 0 0.0 6 100.0Boys 583 51 8.7 532 91.3
Total Girls 579 50 8.6 529 91.4Total 1162 101 8.7 1061 91.3

Table A7.13 (Contd.): Number of children who were provided escorts for going to School/Madrasah
State Type of school attended Gender Total
Children provided escortYes No
N % N %
MadhyaPradesh
Government SchoolBoys 145 0 0.0 145 100.0Girls 197 0 0.0 197 100.0Total 342 0 0.0 342 100.0
Private SchoolBoys 28 0 0.0 28 100.0Girls 17 0 0.0 17 100.0Total 45 0 0.0 45 100.0
Madrasah/MaktabBoys 13 0 0.0 13 100.0Girls 20 0 0.0 20 100.0Total 33 0 0.0 33 100.0
TotalBoys 186 0 0.0 186 100.0Girls 234 0 0.0 234 100.0Total 420 0 0.0 420 100.0
Rajasthan
Government SchoolBoys 178 0 0.0 178 100.0Girls 119 0 0.0 119 100.0Total 297 0 0.0 297 100.0
Private SchoolBoys 16 0 0.0 16 100.0Girls 6 0 0.0 6 100.0Total 22 0 0.0 22 100.0
Madrasah/MaktabBoys 38 0 0.0 38 100.0Girls 20 0 0.0 20 100.0Total 58 0 0.0 58 100.0
TotalBoys 232 0 0.0 232 100.0Girls 145 0 0.0 145 100.0Total 377 0 0.0 377 100.0
UttarPradesh
Government SchoolBoys 635 24 3.8 611 96.2Girls 680 38 5.6 642 94.4Total 1315 62 4.7 1253 95.3
Private SchoolBoys 278 24 8.6 254 91.4Girls 213 23 10.8 190 89.2Total 491 47 9.6 444 90.4
Madrasah/MaktabBoys 113 8 7.1 105 92.9Girls 106 12 11.3 94 88.7Total 219 20 9.1 199 90.9
TotalBoys 1026 56 5.5 970 94.5Girls 999 73 7.3 926 92.7Total 2025 129 6.4 1896 93.6
Uttarakhand
Government SchoolBoys 85 1 1.2 84 98.8Girls 94 1 1.1 93 98.9Total 179 2 1.1 177 98.9
Private SchoolBoys 86 13 15.1 73 84.9Girls 57 11 19.3 46 80.7Total 143 24 16.8 119 83.2
Madrasah/MaktabBoys 49 4 8.2 45 91.8Girls 33 2 6.1 31 93.9Total 82 6 7.3 76 92.7
TotalBoys 220 18 8.2 202 91.8Girls 184 14 7.6 170 92.4Total 404 32 7.9 372 92.1

Table A7.13 (Contd.): Number of children who were provided escorts for going to School/Madrasah
Type of school attended
Children provided escortState Gender Total Yes No
N % N %Boys 3145 207 6.6 2938 93.4
Government School Girls 2991 221 7.4 2770 92.6Total 6136 428 7.0 5708 93.0Boys 988 87 8.8 901 91.2
Private School Girls 848 97 11.4 751 88.6
TotalTotal 1836 184 10.0 1652 90.0Boys 368 25 6.8 343 93.2
Madrasah/Maktab Girls 357 30 8.4 327 91.6Total 725 55 7.6 670 92.4Boys 4501 319 7.1 4182 92.9
Total Girls 4196 348 8.3 3848 91.7Total 8697 667 7.7 8030 92.3
Table A7.14: Perception of parents about schooling facilities for their childrenstudying in Primary classes
State Type of school attended
Total No. of parents
Perception of ParentsNo. of Parents satisfied with
teaching at school
No. of Parents saying child
enjoys going to school
No. of Parents saying Child faced discrimination at
school
No. of Parents saying Child gets
punnished by teachers
N % N % N % N %
Assam
Govt. School 454 433 95.4 414 91.2 19 4.2 27 5.9Private School 25 23 92.0 25 100.0 0 0.0 0 0.0Madrasah/Maktab 55 52 94.5 50 90.9 0 0.0 8 14.5Total 534 508 95.1 489 91.6 19 3.6 35 6.6
Bihar
Govt. School 679 616 90.7 608 89.5 77 11.3 159 23.4Private School 37 27 73.0 20 54.1 4 10.8 15 40.5Madrasah/Maktab 114 101 88.6 96 84.2 2 1.8 7 6.1Total 830 744 89.6 724 87.2 83 10.0 181 21.8
Gujarat
Govt. School 253 251 99.2 248 98.0 0 0.0 0 0.0Private School 4 4 100.0 4 100.0 0 0.0 0 0.0Madrasah/Maktab 1 1 100.0 1 100.0 0 0.0 0 0.0Total 258 256 99.2 253 98.1 0 0.0 0 0.0
Haryana
Govt. School 234 223 95.3 223 95.3 4 1.7 25 10.7Private School 35 28 80.0 34 97.1 1 2.9 10 28.6Madrasah/Maktab 17 17 100.0 17 100.0 0 0.0 4 23.5Total 286 268 93.7 274 95.8 5 1.7 39 13.6
a ^
CNOJgO h

Table A7.14 (Contd.): Perception of parents about schooling facilities for their childrenstudying in Primary classes
State Type of school attended
Total No. of parents
Perception of ParentsNo. of Parents satisfied with
teaching at school
No. of Parents saying child
enjoys going to school
No. of Parents saying Child faced discrimination at
school
No. of Parents saying Child gets
punnished by teachers
N % N % N % N %
Jammu & Kashmir
Govt. School 434 414 95.4 409 94.2 7 1.6 6 1.4Private School 55 52 94.5 50 90.9 3 5.5 4 7.3Madrasah/Maktab 6 6 100.0 5 83.3 0 0.0 0 0.0Total 495 472 95.4 464 93.7 10 2.0 10 2.0
Jharkhand
Govt. School 341 309 90.6 277 81.2 38 11.1 102 29.9Private School 36 36 100.0 36 100.0 1 2.8 5 13.9Madrasah/Maktab 24 21 87.5 20 83.3 0 0.0 1 4.2Total 401 366 91.3 333 83.0 39 9.7 108 26.9
Karnataka
Govt. School 195 195 100.0 187 95.9 3 1.5 3 1.5Private School 93 90 96.8 92 98.9 6 6.5 0 0.0Madrasah/Maktab 0 0 0.0 0 0.0 0 0.0 0 0.0Total 288 285 99.0 279 96.9 9 3.1 3 1.0
Kerala
Govt. School 313 309 98.7 303 96.8 0 0.0 0 0.0Private School 498 485 97.4 489 98.2 8 1.6 6 1.2Madrasah/Maktab 5 4 80.0 5 100.0 0 0.0 0 0.0Total 816 798 97.8 797 97.7 8 1.0 6 0.7
MadhyaPradesh
Govt. School 224 215 96.0 211 94.2 0 0.0 0 0.0Private School 31 31 100.0 31 100.0 0 0.0 0 0.0Madrasah/Maktab 16 16 100.0 16 100.0 0 0.0 0 0.0Total 271 262 96.7 258 95.2 0 0.0 0 0.0
Rajasthan
Govt. School 237 230 97.0 230 97.0 1 0.4 0 0.0Private School 19 19 100.0 19 100.0 0 0.0 0 0.0Madrasah/Maktab 42 42 100.0 39 92.9 0 0.0 0 0.0Total 298 291 97.7 288 96.6 1 0.3 0 0.0
Uttar Pradesh
Govt. School 985 939 95.3 934 94.8 24 2.4 25 2.5Private School 356 345 96.9 345 96.9 6 1.7 11 3.1Madrasah/Maktab 203 197 97.0 197 97.0 8 3.9 10 4.9Total 1544 1481 95.9 1476 95.6 38 2.5 46 3.0
Uttarakhand
Govt. School 153 148 96.7 147 96.1 0 0.0 0 0.0Private School 93 93 100.0 90 96.8 0 0.0 0 0.0Madrasah/Maktab 74 72 97.3 72 97.3 0 0.0 0 0.0Total 320 313 97.8 309 96.6 0 0.0 0 0.0
Total
Govt. School 4502 4282 95.1 4191 93.1 173 3.8 347 7.7Private School 1282 1233 96.2 1235 96.3 29 2.3 51 4.0Madrasah/Maktab 557 529 95.0 518 93.0 10 1.8 30 5.4Total 6341 6044 95.3 5944 93.7 212 3.3 428 6.7
OJgO h

Table A7.15: Perception of parents about schooling facilities for their childrenstudying in Upper Primary Classes
State Type of school attended
Total No. of parents
Perception of Parents
No. of Parents satisfied with teaching at
school
No. of Parents saying child
enjoys going to school
No. of Parents saying Child
faced discrimination
at school
No. of Parents saying Child gets
punnished by teachers
N % N % N % N %
Assam
Govt. School 204 194 95.1 189 92.6 3 1.5 8 3.9
Private School 22 22 100.0 22 100.0 1 4.5 1 4.5
Madrasah/Maktab 23 19 82.6 19 82.6 0 0.0 4 17.4
Total 249 235 94.4 230 92.4 4 1.6 13 5.2
Bihar
Govt. School 173 156 90.2 151 87.3 23 13.3 34 19.7
Private School 10 6 60.0 6 60.0 2 20.0 2 20.0
Madrasah/Maktab 62 44 71.0 33 53.2 2 3.2 2 3.2
Total 245 206 84.1 190 77.6 27 11.0 38 15.5
Gujarat
Govt. School 87 86 98.9 84 96.6 0 0.0 0 0.0
Private School 6 6 100.0 6 100.0 0 0.0 0 0.0
Madrasah/Maktab 1 1 100.0 1 100.0 0 0.0 0 0.0
Total 94 93 98.9 91 96.8 0 0.0 0 0.0
Haryana
Govt. School 57 57 100.0 55 96.5 0 0.0 2 3.5
Private School 8 7 87.5 7 87.5 0 0.0 0 0.0
Madrasah/Maktab 6 5 83.3 5 83.3 1 16.7 2 33.3
Total 71 69 97.2 67 94.4 1 1.4 4 5.6
Jammu & Kashmir
Govt. School 177 170 96.0 171 96.6 1 0.6 0 0.0
Private School 33 28 84.8 32 97.0 1 3.0 3 9.1
Madrasah/Maktab - - - - - - - - -
Total 210 198 94.3 203 96.7 2 1.0 3 1.4
Jharkhand
Govt. School 105 92 87.6 82 78.1 4 3.8 24 22.9
Private School 19 18 94.7 18 94.7 0 .0 15 78.9
Madrasah/Maktab 18 15 83.3 16 88.9 1 5.6 2 11.1
Total 142 125 88.0 116 81.7 5 3.5 41 28.9
OJgO h

Table A7.15 (Contd.): Perception of parents about schooling facilities for their childrenstudying in Upper Primary Classes
State Type of school attended
Total No. of parents
Perception of Parents
No. of Parents satisfied with
teaching at school
No. of Parents saying child
enjoys going to school
No. of Parents saying Child faced discrimination at
school
No. of Parents saying Child gets
punnished by teachers
N % N % N % N %
Karnataka
Govt. School 129 127 98.4 125 96.9 0 0.0 0 0.0Private School 77 76 98.7 75 97.4 2 2.6 3 3.9Madrasah/Maktab 0 0 0.0 0 0.0 0 0.0 0 0.0Total 206 203 98.5 200 97.1 2 1.0 3 1.5
Kerala
Govt. School 168 166 98.8 165 98.2 0 0.0 0 0.0Private School 177 172 97.2 169 95.5 4 2.3 2 1.1Madrasah/Maktab 1 1 100.0 1 100.0 0 0.0 0 0.0Total 346 339 98.0 335 96.8 4 1.2 2 0.6
MadhyaPradesh
Govt. School 118 115 97.5 113 95.8 0 0.0 0 0.0Private School 14 14 100.0 14 100.0 0 0.0 1 7.1Madrasah/Maktab 17 17 100.0 17 100.0 0 0.0 0 0.0Total 149 146 98.0 144 96.6 0 0.0 1 0.7
Rajasthan
Govt. School 60 60 100.0 60 100.0 0 0.0 0 0.0Private School 3 3 100.0 3 100.0 0 0.0 0 0.0Madrasah/Maktab 16 16 100.0 15 93.8 1 6.3 0 0.0Total 79 79 100.0 78 98.7 1 1.3 0 0.0
Uttar Pradesh
Govt. School 330 321 97.3 319 96.7 3 0.9 3 0.9Private School 135 130 96.3 131 97.0 3 2.2 2 1.5Madrasah/Maktab 16 10 62.5 10 62.5 0 0.0 0 0.0Total 481 461 95.8 460 95.6 6 1.2 5 1.0
Uttarakhand
Govt. School 26 25 96.2 23 88.5 0 0.0 0 0.0Private School 50 48 96.0 47 94.0 0 0.0 0 0.0Madrasah/Maktab 8 8 100.0 8 100.0 0 0.0 0 0.0Total 84 81 96.4 78 92.9 0 0.0 0 0.0
Total
Govt. School 1634 1569 96.0 1537 94.1 34 2.1 71 4.3Private School 554 530 95.7 530 95.7 13 2.3 29 5.2Madrasah/Maktab 168 136 81.0 125 74.4 5 3.0 10 6.0Total 2356 2235 94.9 2192 93.0 52 2.2 110 4.7
OJgO h

PROFILE OF PARTNER AGENCIES
A. Shiv Charan Mathur Social Policy Research Institute, Jaipur (SPRI) set up in 1985 by Shri Shiv Charan Mathur, former Chief Minister of Rajasthan has been attempting to produce scientifically gathered social knowledge and first-hand information and data of field insight on policy issues. Its main objective is to sharpen the effectiveness and impact of public policies by uncovering bottlenecks and anomalies that hamper the flow of benefits to the people, so that their maximum understanding, cooperation and active participation is promoted in the realization of the policy purposes.
Developing Training Modules for the Elected Representatives in the Panchayati Raj in Rajasthan sponsored by Rosa Luxemburg Foundation, Germany (2013)Annual Work Plan & Budget, 2013-2014 for Rashtriya Madhyamik Shiksha Abhiyaan (RMSA), Rajasthan (2013)Trends in the process of Universalizing Elementary Education in Rajasthan - The context of SSA (2013)Annual Plan 2013-2014 for Backward Region Grant Fund (BRGF) for 4 districts of Rajasthan (Karauli, Sawai Madhopur, Jhalawar & Tonk) sponsored by Department of Panchayat Raj, Government of Rajasthan (2013)Third Half Yearly Report of Monitoring of Implementation of SSA Programme for the State of Rajasthan - Kota & Jhalawar (1st October, 2011 to 31st March, 2012)A Study on the Impact of NPEGEL Element on Girls for Government of Rajasthan sponsored by Sarva Shisha Abhiyaan, Government of Rajasthan (2012)Need Assessment of Urban Local Bodies & Panchayati Raj Institutions in Rajasthan, sponsored by Fourth State Finance Commission, Govt. of Rajasthan, Jaipur (2012)Agriculture Scenario in Rajasthan (2011)Study on Status of Women Representatives in Urban Local Bodies of Rajasthan (2011).Study of the Role and Effectiveness of District Education Officer in the Enrichment of Elementary Education (2009)Study on effectiveness of Block Resource Centres (BRCs & CRCs) and Cluster Resource Centres in providing academic support and supervision to elementary schools in Himachal Pradesh, Rajasthan and Madhya Pradesh (2008)A Study on Attitudinal Difference towards Girl Child in Rajasthan (2007) Mid Term Evaluation of DPAP in Tonk District and Integrated Wasteland Development Project (IWPD) in Baran district (2007)A Study on Students Attendance of Primary and Upper Primary Schools of Rajasthan (2007)
For more details please see: http: //www.sprij aipur. org/ 0 0Oc nOJg
Oh

B. Rajagiri College of Social Sciences (Rajagiri) was established as a result of the indefatigable industry and foresight of the Carmelites of Mary Immaculate (CMI). The School of Social Work was one of the pioneering institutions in South India, establishing programmes and setting the standards for the field. RCSS got the National Award for the research work on ”Women and Governance at the Grassroots Level” sponsored by the IC Centre for Governance and Vadilal Gandhi Foundation, New Delhi, 'A' level Acrediation from the ST Development Department, Government of Kerala, 'and acts as an Empanelled Agency' for undertaking research studies / training programmes by the Tsunami Emergency Assistance project (TEAP) of the Fisheries Department, Government of Kerala. The School of Management is nationally ranked and recognized.
RCSS has completed more than 100 Research Studies on socially relevant Topics. To cite a few of the Major Research Studies undertaken:• Role of Mahila Samajams in CPWP and ICDS (sponsored by WFP & UNICEF)• Socio-economic aspects of water supply, health, and sanitation, (Dutch Danida Foundation)• Socio-economic Study of Kochi , Thrissur & Calicut Corporations (ADB)• Baseline Survey of ICDS Phase III Project (World Bank)• Evaluation of SC Hostels (Ministry of SJE)• Problems of the Senior Citizens in Kerala (SRC)• Domestic Violence Against Women in Kerala (HRD)• Problems of Single Women in Kerala (NCW)• Impact Assessment study of LNG port at Kayamkulam and Kochi (STUP)• Need Assessment study of the Workers of Kalamassery unit of Apollo Tyres Ltd.- sponsored by Federation of Indian Chamber of Commerce and Industries- (FICCI) Aditya Birla CSR Centre for Excellence, New Delhi• Organizational Work Study of NORKA- ROOTS sponsored by NORKA ROOTS, Govt. of Kerala• RSBY- CHIS, Evaluation Survey sponsored by Labour & Rehabilitation Department,Govt. of Kerala.• Impact Study on Ente Gramam Project of IT Mission Project Govt. of Kerala• Problems of NRI Women in Kerala, sponsored by Indian Council for Social ScienceResearch, (ICSSR) New Delhi• Assessment of Satellite Communication requirements of Indian Coastal Areas sponsored by ISRO, Ahmadabad
For more details please see: http://rcss.raj agiri.edu/
C. Rabindra Bharati University, Kolkatta (RBU): was founded in 1962 under the Rabindra Bharati Act to mark the birth centenary of poet Rabindranath Tagore at his residential house at Calcutta for the advancement of learning and culture. The study was awarded to Prof Sanat Kumar Ghosh, Dean, Faculty of Arts and Professor in the Department of Education. Prof Ghosh has an M.Sc., B.T., Ph.D., D.D.E. and is an expert in the areas of Pedagogy, Educational Technology & Inclusive Education
c nOJegOh

D. Society for Applied Research in Education and Development (SARED): is a registered society that has educational research as its core mandate. SARED has a panel of experienced and competent researchers including many with decades of experience in handling educational research. SARED has undertaken the following research projects:
• Study on time on task for teachers teaching primary classes in Uttar Pradesh;• Study of reasons for gender-wise class -wise dropout and repetition rate at elementary
level and transition to upper primary level in Uttaranchal;• Study of achievement level in language and mathematics of the students passing class I
and IV in Uttaranchal;• Study on impact and effectiveness of innovative programmes in girls education in
Uttaranchal;• Study of role preferences of educational administrators;• Study on role of BRC and CRC in quality improvement;• Study of teacher and students attendance;• Data analysis of terminal assessment survey of 36 DPEP Phase III districts of UP;• Evaluation of adolescence education programme in secondary schools of Gujarat;• Teacher management study in two districts of Uttar Pradesh;• Study of use of question box method for providing adolescence education in secondary
schools under CBSE;• Cohort study in 32 phase III districts of UP;• Trends in access and retention in six districts of Uttar Pradesh;• Study of mathematics and science kits supplied under OBB;• Evaluation of operation blackboard scheme in 4 states;• Evaluation of operation blackboard scheme in 2 states;• Post test survey of educational achievement in schools under Lok Jumbish Project;
E. Development & Research Services Pvt. Ltd. (DRS) is set up by a team of experienced and eminent social scientists, planners and management professionals with a capability to provide a wide range of research and consultancy services in the fields of rural development, planning, infrastructure development and social-research. Since its inception DRS has been working extensively in the rural areas on a wide range of projects and has established its name in the rural sector. DRS professionals have proven capability in successfully completing small as well as large projects in the rural areas all over the country including some difficult and remote areas like the northeastern states.
DRS has undertaken several studies like evaluation of Total Literacy Campaigns (TLCs),Operation Black Board Programme, Adult Education Programmes, Non-formal Education Programmes, etc. Specific studies like the Evaluation of Passed-out Students of Jawahar Navodaya Vidyalayas deserve special mention in terms of their coverage at the national level.
O h
LOoc n

Similarly, studies on participation of children in primary education and assessment of teacher absenteeism in schools have received appreciation from the clients due to their quality output. DRS clients for research studies on education range from the central and state government bodies (like the DPEP Bureau) to agencies like NIEPA, JNV Samiti and UNESCO. Geographical coverage in terms of education related studies is also wide and covers states all over the country.
V.DOc nOJeg
O h

State Schedule 1
Part A: General Information
1. Name of the State:
2. Total number of Madrasahs which have benefitted from
i. Scheme for providing quality education in Madrasahs (SPQEM)
ii. Infrastructure development for minority institutions (IDMI)
iii. Sarva Shiksha Abhiyan (SSA)
3. Which of the following facilities/ incentives have been made available by theGovernment for education of all children and for the education of Muslim children in particular? Answer for primary and upper primary level using codes: Available (1); N ot available (2)
Sl.No.
Facilities/Incentives
Primary Upper Primary
£2
5=1^
-w
a 5? 5= S
E3i:3
S c5 1?
pH
a 5?'oo =3 =3
5= S
E3i:3
S c51 Free Textbooks
2 Free Uniform
3 Scholarships
4 Free Transport
5 Escort for children
6 HostelsOc nOJeg
O h

Any other (specify)
4. Information regarding Kasturba Gandhi Balika Vidyalayas ( KGBVs) i) Number of sanctioned KGBVs in the state
ii) Number of functional KGBVs in the state
iii) Number of functional KGBVs located in blocks with Predominant Muslim population
5 (a) From the latest household survey conducted in your district provide the number of out-ofschool children.
Out of school children
Age group
6 to below 11 years 11 to below 14 years
Boys Girls Total Boys Girls Total
Total
Muslim
(b) Year of Survey
6. (a) Has the state provided the facility of escorting children to school anywhere in the state?
Yes (1); N o (2)
(b) If yes, provide the number of children who benefitted from this facility in 2010-11.(i) Boys (ii) Girls (iii) Muslim Girls
7. Whether Muslim parents have demanded teaching of Urdu as second language?Yes (1);N o (2)
8. a. Have text books in Urdu been prepared in the State? Yes (1); N o (2)
b. If Yes, to how many students were these distributed in 2010-11?
0 0Oc nOJeg
O h
7

9. Give the number of teachers given training for the teaching of Urdu in 2010-11.
(i) Primary level (ii) Upper Primary level
10. a. Is there a State Madrasah Board in the state? Yes (1); N o (2)
b. Number of Madrasahs under this Board
Part B: Fact Sheet for State and District Level Data
11. Total number of districts in the State
12. Population of sampled districts
Sl.No. District Code Total Population
(Census,2011)(%) Population
of Muslims (Estimated)
Estimated Child population
(6 to below14years)
Estimated Muslim Child population
(6 to below14years)1 Mewat
District Total
State Total
13. District-wise number of schools and teachers
Sl.No.
District Code Stage
Governmentschools
Private recognized schools o
fo. cs
lta de
Madrasahs
sy
e1oC
sllriG
s. ^o h. co a N et
sy0
.de1oC
sllriG
s. ^o h. co a N et
0 s. ^o h. co a N et
1 MewatPrimary
UpperPrimary
District TotalPrimaryUpperPrimary C
State Total Primary ccOJeg
O h

Governmentschools
Private recognized schools o
fo. cs
lta de
Madrasahs
Sl.No.
District Code Stage sy
e1oC
sllriG
s. ^o h. co a N et
sy0
.de1oC
sllriG
s. ^o h. co a N et
0 st-M (U o h . c o a N et
UpperPrimary
14. Enrolment in Primary Schools
Sl.No.
District Code Government schools Private Recognized schools
All Students Muslims All Students Muslims
Total Girls Total Girls Total Girls Total Girls
1 Mewat
District Total
State Total
15. Enrolment in Government Upper Primary Schools
Sl.No. District
All Students Muslim Students
Total Girls Total Girls
I-V VI-VIII I-V VI-VIII I-V VI-VIII I-V VI-VIII
1 Mewat
District Total
State Total
16. Enrolment in Private Recognized Upper Primary Schools 0 0OJg
O h

Sl.No. District
All Students Muslim Students
Total Girls Total Girls
I-V VI-VIII I-V VI-VIII I-V VI-VIII I-V VI-VIII
1 Mewat
District Total
State Total
OJegH3O h

17. Enrolment in Recognized Madrasahs
Sl.No. District
All Students Muslim Students
Total Girls Total Girls
I-V VI-VIII I-V VI-VIII I-V VI-VIII I-V VI-VIII
1 Mewat
District Total
State Total
18. Information regarding Kasturba Gandhi Balika Vidyalayas (KGBVs)
Sl.No.
District Number of KGBVs
Enrolment, in KGBVsAll Students Muslim Students
Total Girls Total Girls1 Mewat
District Total
State Total
Name and Signature of the person who collected the Data
CNt-Hc n
OJgO h

2
Questionnaire for District Project Coordinator
1. Name of the State:
2. Name of the District:
3.a) Name of District project Coordinator:
b) Telephone Number
Schoolcategory
Primary Upper primaryTotal Muslim Total Muslim
Boys Girls Boys Girls Boys Girls Boys GirlsGovernment
Private
Madrasahs
eachers in primary and upper primary schoolsGovernment schools Private schools
Primary Upper primary Primary Upper primaryNo. of schools
No.ofteachers
Total
Muslim
No. of recogni Madrasahs
ised
No. of teachers
Total
Muslim
5.
c nt-Hc n
OJgH3O h

6. No. of Madrasahs which have benefitted fromi. Scheme for Providing Quality Education in Madrasahs (SPQEM)
ii. Infrastructure Development for Minority Institutions (IDMI)
iii. Sarva Shiksha Abhiyan (SSA)
7. Number of students who benefitted from the specific facilities/ incentives in your district in 2010-11.Sl.No.
Facilities/Incentives
Primary Upper Primary
Boys Girls Muslim Boys Girls MuslimBoys Girls Boys Girls
1 Free textbooks
2 Free uniform
3 Scholarships
4 Free transport
5 Escort for children
6 Hostels
7 Any other (specify)
8 . Information regarding Kasturba Gandhi Balika Vidyalayas ( KGBVs)
iv) Number of sanctioned KGBVs in the state
v) Number of functional KGBVs in the state
vi) Number of functional KGBVs located in blocks with Predominant Muslim population
9. From the latest household survey conducted in your district provide the number of out of school children. (Year of Survey___________)
Out of school children
Age group 6 to below 11 years Age group 11 to below 14 yearsBoys Girls Total Boys Girls Total
TotalMuslim
tHc n
OJgO h

10. Whether there has been a demand for provision of escort to girls. (Use code: 1 for Yes and 2 for No)
(i) General
(ii) In Muslim predominant areas?
11. Number of children who were provided escort for going to school in 2010-11.
Total boys Total girls Muslim boys Muslim girls
12 (a) Whether the Muslim parents have demanded teaching of Urdu as second language?Yes (1); No (2)
(b) Number of schools in which Urdu is taught(i) Primary(ii) Upper Primary
(c) Number of teachers trained for teaching Urdu?
Investigator’s Name and Signature with date Signature of the District Project Coordinator
LOt-Hc n
OJgO h

3Village/ Town Fact Sheet
(To be collected from Chairperson/ Secretary, Panchayat / Chairperson VEC/ CEO/or any other personwho can provide the required information)
1. State 2. District
3. Block/Town 4. Village/ Ward
5. Area (rural/urban) Rural(1); Urban (2)
6 a. Name and address of the sampled school:
b. DISE code
7(a) Name of the respondent
(b) Designation : Chairperson of VEC or CEO, Municipal Committee (1); Secretary,Panchayat (2); Member (3); Any other (Specify) (4)
8. Telephone number
9. Estimated present population of the village/ town
i. Total
ii. Muslim
10. Number of households in this village/town living below poverty line (BPL).
V.Dt-H0 0OJg
O h

11. Number of children in the age group ‘6 to below 14 years’ in the village/ town as per the records ofVEC/ Municipal Corporation/ committee.
6 to below 11 years 11 to below 14 yearsTotal Muslim Total Muslim
Boys Girls Total Boys Girls Total Boys Girls Total Boys Girls Total
Yes (1); No (2)12. Is there a KGBV located in your block?
13. If yes, what is its distance (in km) of the KGBV from the centre of the village?
14. Number of girls of this village enrolled in the KGBV?(a) Total girls (b) Muslim girls
15. Provide habitation wise information of the village in the following table. Write 1 if available and 2 if not available in the cells.
Name of the
Habitation
Presentestimatedpopulation
Availability of facilities of schools/ Madrasahs* having
Primary classes
Availability of facilities of schools/ Madrasahs* having Upper Primary
classesTotal Muslim Within the
HabitationUp to
**1 km
Beyond 1 km
Within the Habitation
Up to ** 1.0 km
1.1 to 3.0 km
Beyond 3 km
Note: Distance should be from the centre of the Habitation.*only recognized Madrasahs following regular school curriculum should be considered.
**But not within the habitation.
t-Hc n
OJgO h

16. Provide information about schools/ Madrasahs in the village/ ward.
Sl.No.
Name of the School/
Madrasah
Levelandtype
*
Management @
EnrolmentClasses I- IV/ V Classes VI- VII/ VIII
Total Muslim Total MuslimTotal Girls Total Girls Total Girls Total Girls
*Level and type: Primary (1); Upper Primary (2); Secondary or higher secondary school having primary or upper primary classes (3); Recognized Madrasahs with primary classes (4); Recognized Madrasahs with upper primary classes (5); EGS centre (6).
@ Management: Government (1); Private aided (2); Private Unaided (3); Unrecognized (4). Schools supported by Waqf may be included under private unaided.
Investigator’s Name and Signature Name and Signature of the person who provided the information
0 0
0 0OJg
O h

Sch o o l Schedule4
N te (a): The head-teacher or senior most teacher o f school should provide the required information in this form. In Part A, most o f the information is factual to be given from school records/ registers while in Part B, the questions have to be answered on the basis o f the respondent’s own judgment or opinion.
Note (b): In some items, number codes are given in brackets against the possible responses. The appropriate number code should be written in the box against each item. For example, in the items in which the answer is ‘y e s ’ or ‘n o ’, write 1 fo r ‘y e s ’ and 2 fo r ‘N o ’ in the box
Part A
1. State: 2. District:
3. Block/Town: 4. Village/Ward:
5. Name and address of the school
6 (i) Name of respondent:
(ii) Designation: Head teacher (1); Teacher (2)
(iii) Gender: Male (1); Female (2)
(iv) Religion: Muslim (1); Non- Muslim (2)
(v) Telephone Number
7. DISE code of the school
8. Location : Rural (1); Urban (2)
9. Management : Government/Local body (1) ; Private (2)
10. Classes taught: From class
11. Are nursery/pre-primary classes attached to the school?
to class
Yes (1) ; No (2) gcC H

12. Number of days on which the school was open (for teaching) during 2010-11
13 Working hours:
a) Summer:b) Winter:
From
From _
_a.m
a.m
to
to
p.m
p.m
14 (a) Class-wise number of sections
Classes I II III IV V VI VII VIII
Number of Sections @
@ : Provide the number of sections in each class. If a particular class is not being taught in school leave the cell blank.
(b) If there are multi- grade classes give the number of such classes.
For example, if classes 1 and 2 are being taught together and classes 3, 4 and 5 are being taught together, the number of multi-grade classes will be 2. If there is no multi- grade class, write 0.
15 (a) Number of classrooms in the school:
(b) Number of classes held in Verandah:
16 No. of classrooms in which sitting space for students is insufficient?
17 Availability of the following facilities in school
i) Drinking waterii) Functional toiletsiii) Separate functional toilet for girlsiv) Electricity in schoolv) Library booksvi) Sports material
Available( 1 ) /Not available(2) A vailable(l)/N ot available(2) Available( 1)/ Not available(2)
Available( 1 )/Irregular(2)/ Not available(3) Available( 1 )/Available but mostly not used (2)/ Not available(3) Available(1)/Available but mostly not used (2 )/Not available(3)
oCNc n
OJgO h

Note: In secondary schools, only those teachers will be consid^^ed here who are devoting more than 50%c time in teaching classes up to VIII.
18. Number of teachers in position and present on the day of visit.
Teachers in Position by Category
Muslim Non-Muslim Total
Total Female Total Female Total Female
Regular
Contract
Community paid
Total
Present out of total
19. Number of teachers by Qualification
Academicqualification
Muslim Non-Muslim
Total Professionalqualification
Muslim Non-Muslim
Total
Secondary Untrained
Higher Secondary Diploma/ BTC/ JBT
Graduate or above B.Ed.
Any other (mention)
Any other mention)
20. Enrolment as on 30th September in classes I to V (2009, 2010, 2011)
Year I II III IV V Total
Total Girls Total Girls Total Girls Total Girls Total Girls Total Girls
2009 Total
Muslim
2010 Total
Muslim
2011 Total t-HMuslim CN
c nOJg
O h

21. Enrolment as on 30th September in classes VI to VIII (2009, 2010, 2011)Year VI VII VIII Total (VI-VIII)
Total Girls Total Girls Total Girls Total Girls
2009 Total
Muslim
2010 Total
Muslim
2011 Total
Muslim
22. Number of repeaters in Class I/ VI as on 30th September 2010 and 2011Year Class I Class VI
Total Muslim Total Muslim
B+G Girls B+G Girls B+G Girls B+G Girls
2010
2011
B=Boys; G=Girls
23. At primary stage, number of students enrolled, school leavers and the number of students
Item Total Muslim2009-10 Total Girls Total Girls
(a) Total enrolment at primary stage as on 30.9.09
(b)# No. of students who left school out of (a) before 30.9.10 excluding those who left after passing class V
(c) * No. of students out of (b) who joined another school after leaving or who left with TC
(d) Number of students out of (b) about whom no information is available
2010-11 Total Girls Total Girls
(a) Total enrolment at primary stage as on 30.9.10
(b)# No. of students who left school out of (a) before 30.9.11 excluding those who left after passing class V
(c) * No. of students out of (b) who joined other schools after leaving or who left with TC
(d) Number of students out of (b) about whom no information is available CN
CNc n* Check with other students/parents, if necessary, to get required information.
# Total of (c) and (d) should be equal to (b)OJg
O h

24. At upper primary stage, number of students enrolled, school leavers and the number of
students who joined other schools
Item Total Muslim
2009-10 Total Girls Total Girls
(a) Total enrolment at upper primary stage as on 30.9.09
(b)# No. of students who left school out of (a) before 30.9.10 excluding those who left after passing class VIII
(c)* No. of students out of (b) who joined another schools after leaving or who left with TC
(d) Number of students out of (b) about whom no information is available
2010-11 Total Girls Total Girls
(a) Total enrolment at upper primary stage as on 30.9.10
(b) # No. of students who left school out of (a) before 30.9.11 excluding those who left after passing class VIII
(c) * No. of students out of (b) who joined another schools after leaving or who left with TC
(d) Number of students out of (b) about whom no information is available
* Check with other students or parents if necessary, to get required information.
#Total of (c) and (d) should be equal to (b)
25. Number of children who dropped out( discontinued studies) during 2010 - 11. Give one or two
main reasons for their dropping out, using codes given below for reasons.
Ail Muslim
Boys Girls Boys Girls
Number of dropouts
Reasons for dropping out(codes)
Code for reasons : Child needed to help parents in their occupation or income generating activity (1);
Child needed to help in domestic work and care of siblings (2); Lack of parental interest in studies(3);
Early marriage (4); No facility fo r teaching Urdu(5); School being fa r from home (6);
Any other (M ention)_________________________________ (7).
c nCNc n
OJgO h

26. Special incentives being provided to students in the school. Use codes: Not provided to any student (0); provided to all students (1); provided to only girls (2); provided to all Muslim students (3); provided to only Muslim girls (4); provided to all SC or ST or BPL category students (5); provided to only girls o f SC / S T / BPL category (6).
Item Code
(a) Free text books
(b) Free school uniform
(c) Scholarship
(d) Cycles (in upper primary classes)
(e) Any other (specify)
27. Two main reasons for long or frequent absence of children from school. Answer using codes givenbelow. Codes fo r reasons o f absence : Parents lack o f interest in the children’s school attendance (1) ; Students’ engagement in wage earning activities or helping parents in their occupation (2); Students’ involvement in household work/taking care o f younger brother/sister (3); Participation in religious and social functions(4); Family migrating to other place in search o f work (5);Any other (m ention)________________________ (6).
(c)
Code for reasons
(a) In general (irrespective of religion)
(b) Particularly for Muslim boys
Particularly for Muslim Girls
28. (i) Is any relaxation given to Muslim (a) teachers (b) students in school hours during Ramazan month? Answer using codes.
(a)teachers (b) students
Codes: No relaxation given (1); Leaving school early (2); Coming late to school (3); changing school hours (4); Any other (m ention)__________________ (5).
(ii) Is there any relaxation in school hours for the Friday prayers.Answer using code : No relaxation (1); break fo r about 1 hour(2);
School closed early(3)

29. Number of students who appeared at the end of the terminal class examination and number of those who scored 60% or more marks in 2010 and 2011.
Category Number of t appeared
students who in the exam
Number of students who got 60% or more marks
Year 2010: Total Muslim Total Muslim
i. At the end of class IV/V
ii. At the end of class VII/ VIII
Year 2011:
iii. At the end of class IV/V
iv. At the end of class VII/VIII
30. Enrolment and Number of students found present on the day of visit
Category All students Muslim studentsEnrolment No. present Enrolment No. Present
Total
Girls
31. In the School Management Committee (SMC) of your school, what is the total number of members and how many attended the last meeting?
Total Members Muslim Members
Male Female Male Female
Total number of membersNumber of those who attended the last meeting
LOCNc n
OJgO h

Part B
32. Does the school face any of the following problems? Respond by writing codes in the relevant cells:
Codes: Problem faced (1); Problem not faced (2).
Problem For all Particularly for Muslim
Boys Girls Boys Girls
a) Getting new students admitted
b) Dropping out of students from school
c) Irregularity in students’ attendance
d) Poor achievement level of students
33. Do you get some support from the community in facilitating education of all children and Muslim students in particular? Answer by using codes if the support is received from the community.
Codes : No support received (1); Partial support is received (2); Adequate support is received (3).
Item For all children Particularly for Muslim children
(i) Enrolling children and ensuring their retention and attendance
(ii) Getting donations in cash or kind for improvement of facilities in school.
(iii) Providing help in studies
(iv) Organising religious or moral education programmes
(v) Teaching some skills to children.
CNc n
OJgO h

34. How do you rate your students (particularly Muslim students, if there are both Muslim and non-Muslim students) in respect of the following parameters? (Give your response by writing codes in the appropriate cell of each row).
Codes: Very good (1); good (2); average (3); poor (4); very poor (5). In the case o f items (x) to (xiii), i f the facility is not available or no event has taken place, write code (6).
Parameter Muslim students Others
i) Regularity of attendanceii) Punctuality in coming to school
iii) Participation in classroom activities
iv) Achievement in language
v) Achievement in Maths
vi) Achievement in EVS/ Sciencevii) Interaction with teacher
viii) Level of self confidence
ix) Parents’ interest in children’s studies
x) Participation in sports/ games
xi) Participation in dance/drama/music programmesxii) Participation in debates/ elocution contest
xiii) Participation in Art/ craft activities
Note: If there are very few (less than 10%) Non- Muslim students, leave the cell for ‘others’ blank.
Investigator’s Name and Signature Head teacher’s Name and signature
CNc n
OJgO h

Recognised Madrasah and Maktab Schedule 5
Note: In some items, number codes are given in brackets against the possible responses. The appropriate number code should be written in the box against each item. For example, in the items in which the answer is ‘y e s ’ o r ’ n o ’, write 1 fo r ‘y e s ’ and 2 fo r ‘N o ’ in the box
3.
5.
1. State: --------
Block/Town:
Name and address of the Madrasah/ Maktab
2. District : .............................
4. Village/Ward : .........................
9.
10.
11.
12.
6. a. Specify the year when the Madrasah/Maktab was provided special recognition for providing general education.
b. Board which provided the recognition (Also write code): --- W aqf Board (1); State Madrasah (2);Any Mention (3)
7. Madrasah type (respond by putting response code in the response cell)
a) Residential (1) ; Non- residential (2); Both residential & non- residential (3)
b) For Boys only (1); For Girls only ( 2) ; Coeducational (3); Coeducational up to primary only (4)
8. (i) Name of respondent:
Location :
Management :
Classes taught:
Are nursery/pre-primary classes attached to the Madrasah/ Maktab?
Rural (1); Urban (2)
Government/Local body (1); Private (2)
From class to class
Yes (1); No (2)
(ii) Designation: Head teacher (1); Teacher (2)
(iii) Gender: Male (1); Female (2)
(iv) Religion: Muslim (1); Non- Muslim (2)
(v) Telephone Number

13. Number of days on which the Madrasah/ Maktab was open (for teaching) during 2010-11
14. Working hours:c) Summer: From
d) Winter: From
a.m to_
a.m to
p.m
p.m
15 (a) Class-wise number of sections
Classes I II III IV V VI VII VIII
Number of Sections @
@ : Provide the number of sections in each class. If a particular class is not being taught in Madrasah/ Maktab, leave the cell blank.
(b) If there are multi- grade classes give the number of such classes.For example, if classes 1 and 2 are being taught together and classes 3,4 and 5 are being taught together, the number of multi- grade classes will be 2. If there is no multi - grade class, write 0.
16 (a) Number of classrooms in the Madrasah/ Maktab:(b) Number of classes held in Verandah:
17. No. of classrooms in which sitting space for students is insufficient?
18. Availability of the following facilities in Madrasah/ Maktabvii) Drinking water Available(1)/Not available(2)
viii) Functional toilets Available(1)/ Not available(2)
ix) Separate functional toilet for girls Available(1)/ Not available(2)
x) Electricity in Madrasah/ Maktab Available(1)/Irregular(2)/ Not available(3)
xi) Library books Available(1)/Available but mostly not used (2)/ Not available(3)
xii) Sports material Available(1)/Available but mostly not used (2)/ Not available(3)
a ^CNc n
OJegO h

19. Number of teachers in position and present on the day of visit
Teachers in Position by Category
Muslim Non-Muslim Total
Total Female Total Female Total FemaleRegular
Contract
Community paid
Total
Present out of total
20. Number of teachers by Qualification
Academic
qualificationNo. of teachers Professional
qualificationNo. of teachers
Muslims Others Total Muslims Others Total
Secondary Untrained
Higher Secondary Diploma/ BTC/ JBT
Graduate or above B.Ed.
Any other (mention) Any other (mention)
Hafiz Mufti
Alim
21. Enrolment as on 30th September in classes I to V (2009, 2010, 2011)
Year I II III IV V Total (I-V)Total Girls Total Girls Total Girls Total Girls Total Girls Total Girls
2009
MuslimNon-MuslimTotal
2010
MuslimNon-MuslimTotal
2011
MuslimNon-MuslimTotal
oc nc nOJeg
O h

22 Enrolment as on 30th September in classes VI to VIII (2009, 2010, 2011)
Year VI VII V][II Total (VI-VIII)Total Girls Total Girls Total Girls Total Girls
2009
MuslimNon-MuslimTotal
2010
MuslimNon-MuslimTotal
2011
MuslimNon-MuslimTotal
23. Number of repeaters in grade I /grade VI as on 30th September 2010 and 2011
YearClass I Classes VI
Muslims Non-Muslims Total Muslims Non-Muslims TotalB+G Girls B+G Girls B+G Girls B+G Girls B+G Girls B+G Girls
2010
2011
B=Boys; G=Girls
24. At primary stage, number of students enrolled, ‘Madrasah/ Maktab leavers’ and the number of students who joined other Madrasah/ Maktabs
Item Total Muslim2009-10 Total Girls Total Girls(a) Total enrolment at primary stage as on 30.9.09(b)# No. of students who left Madrasah/ Maktab out of (a) before
30.9.10 excluding those who left after passing class V(c) * No. of students out of (b) who joined another Madrasah/
Maktab after leaving or who left with TC(d) Number of students out of (b) about whom no information
is available2010-11 Total Girls Total Girls(a) Total enrolment at primary stage as on 30.9.10(b)# No. of students who left Madrasah/ Maktab out of (a) before
30.9.11 excluding those who left after passing class V(c) * No. of students out of (b) who joined other Madrasah/
Maktabs after leaving or who left with TC(d) Number of students out of (b) about whom no information
is available 0 0c n* Check with other students/parents, if necessary, to get required information.
# Total of (c) and (d) should be equal to (b). OJgO h

25. At upper primary stage, number of students enrolled, ‘Madrasah/ Maktab leavers’ and the number of students who joined other Madrasah/ Maktabs
Item Total Muslim
2009-10 Total Girls Total Girls
(a) Total enrolment at upper primary stage as on 30.9.09
(b)# No. of students who left Madrasah/ Maktab out of (a) before 30.9.10 excluding those who left after passing class VIII
(c) * No. of students out of (b) who joined another Madrasah/ Maktab after leaving or who left with TC
(d) Number of students out of (b) about whom no information is available
2010-11 Total Girls Total Girls
(a) Total enrolment at upper primary stage as on 30.9.10
(b)# No. of students who left Madrasah/ Maktab out of (a) before 30.9.11 excluding those who left after passing class VIII
(c) * No. of students out of (b) who joined other Madrasah/ Maktabs after leaving or who left with TC
(d) Number of students out of (b) about whom no information is available
* Check with other students or parents if necessary, to get required information. #Total of (c) and (d) should be equal to (b).
26. Number of children who dropped out( discontinued studies) during 2010-11. Give one or two main reasons for their dropping out, using codes given below for reasons.
All Muslim
Boys Girls Boys Girls
Number of Dropouts
Reasons for dropping out(codes)
Code for reasons : Child needed to help parents in their occupation or income generating activity (1); Child needed to help in domestic work and care o f siblings (2); Lack o f parental interest in studies(3); Early marriage (4); No facility fo r teaching Urdu(5); M adrasah/ Maktab being fa r from home (6);
Any other (m ention)------------------------ (7).
CNc nc nOJeg
O h

27. Special incentives being provided to students in the Madrasah/ Maktab. Use codes: Not provided to any student (0); provided to all students (1); provided to only girls (2); provided to all Muslim students (3); provided to only Muslim girls (4); provided to all SC or ST or BPL category students (5); provided to only girls o f SC / ST / BPL category (6). Also specify the agency providing these facilities. Use codes to give your answer: Education Dept. (1); Ministry o f Minority Affairs (2); NGO (3);Local Community (4);
Other agency( mention the name o f the agency)--------------------------------- (5).
Item Availability code Agency code
(a) Free text books
(b) Free Madrasah/ Maktab uniform
(c) Scholarship
(d) Cycles (in upper primary classes)
(e) Science kit & other pedagogical equipment
(f) Books for school/class library
(g) Computers for upper primary sections
(h) Vocational Training
(i) Any other (specify)
28. Do you get some support from community in facilitating education of the children in general and Muslim students in particular? Answer by using codes.
Codes : No support received (1); some support is received (2); adequate support is received (3)
Item For all children Muslim children
i) Enrolling children and ensuring their retention and attendance
ii) Getting donations in cash or kind for improvement of facilities in school.
iii) Providing help in studies
iv) Organising religious or moral education programmes
v) Teaching some skills to children.
c nc nc nOJeg
O h

29.
(a)
(b)
(c)
Two main reasons for long or frequent absence of the children from school. Answer using codes given below.Codes for reasons of absence: Parents lack o f interest in the children’s M adrasah/ Maktab
attendance (1); Students’ engagement in wage earning activities or helping parents in their occupation (2); Students’ involvement in household work/taking care o f younger brother/sister (3); Participation in religious and social functions(4); Family migrating to other place in search o f work (5); Any other (m ention)-------------------- (6).
Code for reasonsIn general (irrespective of religion)
Particularly for Muslim boys
Particularly for Muslim Girls
30. (i) Is any relaxation given to Muslim (a) teachers (b) students in Madrasah/ Maktab hours during Ramazan month? Answer using codes:No relaxation given (1); Leaving M adrasah/ Maktab early (2); Coming late to M adrasah/ Maktab (3); changing M adrasah/ Maktab hours (4);Any other (mention) ----------------------- (5).
(a) Teachers (b) Students
(ii) Is there any relaxation in Madrasah/ Maktab hours for the Friday prayers. Answer using code.
Codes: No relaxation (1); break fo r about 1 hour(2);M adrasah/ Maktab closed early(3)
(a) Teachers (b) Students
31. Number of students who appeared at the end of the terminal class examination and number of those who scored 60% or more marks in 2010 and 2011.
Category Number of students who appeared in the exam
Number of students who got 60% or more marks
Year 2010: Total Muslim Total Muslim
i) At the end of class IV/V
ii) At the end of class VII/ VIII
Year 2011:
i) At the end of class IV/V
ii) At the end of class VII/VIII
c nc n
OJgO h

32. Enrolment and Number of students found present on the day of visit
Category All students Muslim students
Enrolment No. present Enrolment No. Present
Total
Girls
33. In the Madrasah/ Maktab Management Committee (SMC) of your Madrasah/ Maktab, what is the total number of members and how many attended the last meeting?
Total Members Muslim Members
Male Female Male Female
Total number of membersNumber of those who attended the last meeting
Investigator’s Name and Signature Head teacher’s Name and signature
LOc n c n
OJgO h

P aren ts Schedule
Note: In some items, number codes are given in brackets against the possible responses. The appropriate number code should be written in the box against each item. For example, in the items in which the answer is ‘y e s ’ o r ’ n o ’, write 1 fo r ‘ye s ’ and 2 fo r ‘N o ’ in the box
1. State 2. District
3. Block 4. Villase/Town
5. Area Rural (1); Urban (2)
6. Name of the respondent
7. Age in complete years 8. Gender: Male (1); Female (2)
9. Primary source* of income :
* Codes :Agriculture on own land (1); Agriculture on rented land (2); Agricultural labour (3);Casual labour (4); Non-farm se lf employment/Trading (5); Traditional handicraft/craft work (6); Service (7)
6

10. Do you belong to the BPL category? Yes (1) ; No (2)
11. Is the mother of the child engaged in any income generating activity? Yes (1); No(2)
12. Educational level of parents (Use codes to answer).Illiterate (1); Literate with no/little schooling (2); Completed primary (3); Completed upper primary (4); Completed Secondary school (Class X) (5), Completed Sr. Secondary (6); Graduate and above (7)
a. Educational level of father:
b. Educational level of mother:
13. Information about children in the age group 6 to below 14 years not going to any school/ recognized Madrasah.
Sl.No.
Name of the Child Gender@ Age (in complete years)
Status*
@ Gender code: M ale (1); Female (2)*Status code: Never went to school (1); dropped out (2); Attending M adrasah/Maktab providing only religious education (3)
CJDh

14. Information about school going children in the age group 6 to below 14 years.
Sl.No.
Name of
the child
Sex
(Boy- 1
Girl - 2)egA
dednetta
da
oohcS
U
dedirptrrocs
Whether provided to the child in school
soobtxeteerrF
ofc
Ueer[in
g-Q"oooc/DOJ
laemyadd
*pihsrallohcS
roftnea s as yad 5hcrehtteh
ecnesbarofsnosae
00ey
eh
w oohccsf t si ait g
de
u ho c y aere etA
gniiog
e lod olihc hcs
eh
cea loofa ohd cshcehtseo
Qcsiid
dehsi*
^ O'e s g redllihcehtseo
Q
hcaetb
Codes: * Yes(1); No(2)# school Attended: Governm^ent School(1); Private School(2); M adrasah/M aktab(3)©Reasons for Absence: Child was sick(1); to assist with household chores(2); to assist with household incom.e generating work(3) ** Yes, very Often(1); Yes, sometimes (2); Not at all (3)
Signature with Date_ Name of Investigator_
0 0c nc n
egH3Dh

Focused Group Discussions with Community Members 7
Date of Focus Group Discussion:
Start Time:
Name of Facilitator/ Moderator:
Name of Recorder:
Names of Participants: (should not be more than 12 and less than 5)
S.No Name Sex:M/F
Age Children in school : Yes / No
1
2
3
4
5
6
7
8
9
10
11
12
End Time:a ^c nc nOJgH3
O h
339

Moderator explains purpose of the discussion:
In this age and day it is important for your children to get educate The purpose of this Discussion is to get your views on the education of your children and to know what problems you and your children are facing in getting educated. We are interested in your perceptions and your experiences. There may be disagreements within the group, but we want everyone to contribute freely.
The Moderator tells participants:
1. There are no right or wrong answers
2. It is important to hear everybody’s opinions.
3. Please do not all speak at the same time (only when two or more people speak at the same time.)
4. For the sake of remembering what you are saying, one of our colleagues shall be recording the responses and discussions. Everything you say is confidential and your name will not be associated with anything you say.
Discussion Issue No: 01: Muslim parents’ perception about the importance and relevance of education for their children:
I would like to start the discussion by asking your opinion on the importance and relevance o f education fo r your children.
1. We are free to discuss issues relating to education of children, problems faced by parents in educating them and problems experienced particularly by members of Muslim community.
2. What is your vision for the future of your children in terms of :
01. The minimum educational level to be completed by :
• Boys
• Girls
02. Type of Employment / Livelihood:
• Boys
• Girls
3. What changes do you want to suggest in the present education system? O
c nOJegOh
340

Discussion Issue No: 02
Let us discuss what you fee l about the schooling facilities, amenities and incentives offered under SSA
Discussion Issue No: 03
We would like to know the obstacles to schooling o f Muslim children in general and girls in particular:
1. Do you feel that Muslim children either do not get enrolled in schools or drop out of them earlier than children from other social groups? Facilitator may share some o f the reasons given below to facilitate discussion.
2. Girls and boys study together in the same school. Do you feel this causes any problems?
3. Is the school environment good / conducive for the Muslim children to study?
4. Do the Muslim children face any discrimination in the school?
5. Have your children face harassment / corporal punishment at the hands of the teachers?
Discussion Issue No: 04
We would like to know whether there is any type o f discrimination o f muslim children in genera and girls in particular in morning assemblies, class rooms, co curricular activites, school functions etc.
I f yes, kindly try to give examples o f the form in which discrimination occurs and give your opinion on how serious it is.
c nOJg
O h
341

8
INVESTIGATOR’S OBSERVATION SCHEDULE
Points for observer to take note of at school level
1. Distance of school from main road (in km).
2. Cleanliness in and around the school (status and responsibility)
3. Maintenance of school building (status and responsibility)
4. Activities undertaken in Morning assembly
5. Grouping of students during mid-day meal5.1 Mixed5.2 Gender wise5.3 Religion wise5.4 Based on caste
6. Observed incidences of corporal punishment
7. Teachers’ behaviour7.1 Are all students treated in the same way in the classrooms/ school campus?
7.2 Did you observe any difference in teachers’ attitude and behaviour with boys and girls?
7.3 Difference in attitude/ behaviour towards students belonging to different religions/castes ?
CN
7.4 Is there a common source of drinking water available to all students? 0 0g
Oh
342

8.1 Are girls, particularly Muslim girls, taking active part in co-curricular activities?
8.2 Did you observe any incidence of disharmony amongst the students belonging to different religious groups?
8. Students behaviour
9. If Some Muslim boys and girls did not go to school or have dropped out, comment on the reasons of the same based on your discussion with community members.
10. Is there a School Management committee? If yes, give the number of meeting held in school?
Also provide following detail about the members of the committee
Name Age Sex Education No. of Meting attended
Signature of Investigator
c n
c nOJgH3O h
343