Evaluation and application of dye tracing in a karst terrain
Upload
independentCategory
view
0download
0
EARTH SURFACE PROCESSES AND LANDFORMSEarth Surf. Process. Landforms 36, 1183–1192 (2011)Copyright © 2011 John Wiley & Sons, Ltd.Published online 3 March 2011 in Wiley Online Library(wileyonlinelibrary.com) DOI: 10.1002/esp.2144
Assessment of doline geometry using geophysicson the Quercy plateau karst (South France)Rémi Valois,1* Christian Camerlynck,1 Amine Dhemaied,1 Roger Guerin,1 Gaghik Hovhannissian,2 Valérie Plagnes,1
Faycal Rejiba1 and Henri Robain21 Université Pierre et Marie Curie‐Paris 6, 75252 Paris cedex 05, France2 Institut de Recherche pour le Développement, Bondy Cedex, France
Received 22 July 2010; Revised 25 January 2011; Accepted 26 January 2011
* Correspondence to: R. Valois, Université Pierre et Marie Curie‐Paris 6, UMR 7619 Sisyphe, case 105, 4 place Jussieu, 75252 Paris cedex 05, France.E-mail: [email protected]
ABSTRACT: In the protection of karstic aquifers, the role played by dolines is of interest as these shallow structures can bepreferential infiltration pathways for groundwater recharge. In this study, three depressions in South France (Orniac, Lot) wereidentified and characterized using combined geophysical methods. Apparent conductivity mapping allows precise definition ofdolines corresponding to topographic depressions. It also reveals other dolines that are hidden by soil cover. Electrical resistivityand seismic refraction tomography provide detailed cross‐sections. Even though the dolines studied are close one to another,they exhibit great variability in shape and content. Moreover, time‐lapse data show that the most saturated regions are on theedges of the first doline. Such information helps to evaluate human impacts and forecast potential groundwater contamination.Copyright © 2011 John Wiley & Sons, Ltd.
KEYWORDS: electrical resistivity tomography; seismic refraction tomography; sinkhole; electromagnetic survey; Quercy plateau karst
Introduction
Dolines (or sinkholes in engineering and North Americanliterature) are enclosed depressions in karstic landscapes.They are usually subcircular and their diameter can varyfrom a few meters to several hundred meters. Severalclassifications of dolines have recently been published(Waltham and Fookes, 2003; Williams, 2003; Beck, 2004;Waltham et al., 2005; Ford and Williams, 2007; Gutiérrezet al., 2008). They are the consequence of various processesincluding corrosion of the ground surface, sagging, suffusionand collapse (Figure 1). The first process is the dissolution ofkarst rocks exposed at the surface or merely soil‐mantled andthe creation of a bowl‐shaped ‘solution doline’. The ‘sagging’process is the continuous flexure of the overlying units duringdissolution. Interstratal dissolution could create a bending ofthe limestone whereas corrosion between soil cover andsubstratum (i.e. crypto‐corrosion) may lead to a depression bysagging of the cover. ‘Collapse dolines’ are depressionsassociated with cavity roof breakdown and movement of theoverlying soil: cohesive soil creates ‘cover collapse dolines’and non‐cohesive soils create ‘suffusion dolines’.In hydrogeology, dolines are considered as potential
infiltration pathways for surface water. Since environmen-tal agencies are concerned with the protection of karsticaquifers, which constitute an important groundwater resourcein calcareous zones, dolines are under scrutiny becausethey are vulnerable areas and have to be protected fromanthropogenic pollution.
As the karstic system is generally complex and can be highlyheterogeneous, geophysics could help to characterize theinternal structure of the karst system like cavity boundaries,preferential pathways and fractured zones (Chalikakis et al., ).For dolines, sedimentological, geomorphologic surveys, andeven trenching provide useful information (Sustersic, 2006;Zambo and Ford, 1997). Geophysics could be used tocharacterize the internal geometry of dolines (Ahmed andCarpenter, 2003; Jardani et al., 2007; Pueyo‐Anchuela et al.,2009; Sauro et al., 2009; Siart et al., 2010). Moreover, a multi‐methods approach enables the researcher to cross‐validate theinterpretations of all the results. In this paper, several methods,namely electromagnetic mapping, seismic refraction andelectric resistivity tomography (SRT and ERT) are used tocharacterize doline shape and content in order to betterunderstand the links between karstic morphologies at thesurface and underground units.
Geological and Geomorphological Context
The depressions under study are located on the ‘Causses duQuercy’ in south‐west France (Orniac, Lot). This Jurassiccarbonate platform evolved in continental environments sincethe Late Cretaceous (Astruc et al., 2000). Karst was initiatedduring the Latest Cretaceous– Paleocene time span, and furtherkarst elaboration developed during the Paleogene. Theinduced tectonic subsidence related to the Pyrenean rangeuplift resulted in marine and lacustrine flooding and thedeposits covered the karstified Quercy marine limestone. Later
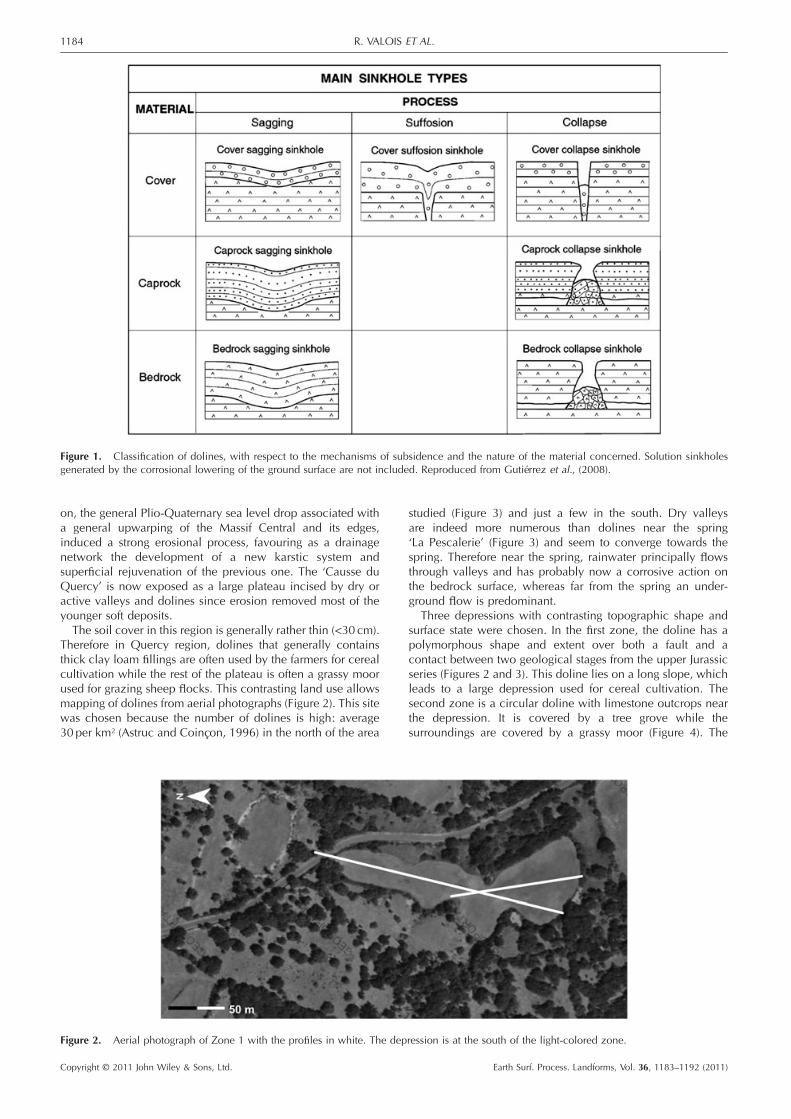
Figure 1. Classification of dolines, with respect to the mechanisms of subsidence and the nature of the material concerned. Solution sinkholesgenerated by the corrosional lowering of the ground surface are not included. Reproduced from Gutiérrez et al., (2008).
1184 R. VALOIS ET AL.
on, the general Plio‐Quaternary sea level drop associated witha general upwarping of the Massif Central and its edges,induced a strong erosional process, favouring as a drainagenetwork the development of a new karstic system andsuperficial rejuvenation of the previous one. The ‘Causse duQuercy’ is now exposed as a large plateau incised by dry oractive valleys and dolines since erosion removed most of theyounger soft deposits.The soil cover in this region is generally rather thin (<30 cm).
Therefore in Quercy region, dolines that generally containsthick clay loam fillings are often used by the farmers for cerealcultivation while the rest of the plateau is often a grassy moorused for grazing sheep flocks. This contrasting land use allowsmapping of dolines from aerial photographs (Figure 2). This sitewas chosen because the number of dolines is high: average30per km² (Astruc and Coinçon, 1996) in the north of the area
Figure 2. Aerial photograph of Zone 1 with the profiles in white. The dep
Copyright © 2011 John Wiley & Sons, Ltd.
studied (Figure 3) and just a few in the south. Dry valleysare indeed more numerous than dolines near the spring‘La Pescalerie’ (Figure 3) and seem to converge towards thespring. Therefore near the spring, rainwater principally flowsthrough valleys and has probably now a corrosive action onthe bedrock surface, whereas far from the spring an under-ground flow is predominant.
Three depressions with contrasting topographic shape andsurface state were chosen. In the first zone, the doline has apolymorphous shape and extent over both a fault and acontact between two geological stages from the upper Jurassicseries (Figures 2 and 3). This doline lies on a long slope, whichleads to a large depression used for cereal cultivation. Thesecond zone is a circular doline with limestone outcrops nearthe depression. It is covered by a tree grove while thesurroundings are covered by a grassy moor (Figure 4). The
ression is at the south of the light‐colored zone.
Earth Surf. Process. Landforms, Vol. 36, 1183–1192 (2011)
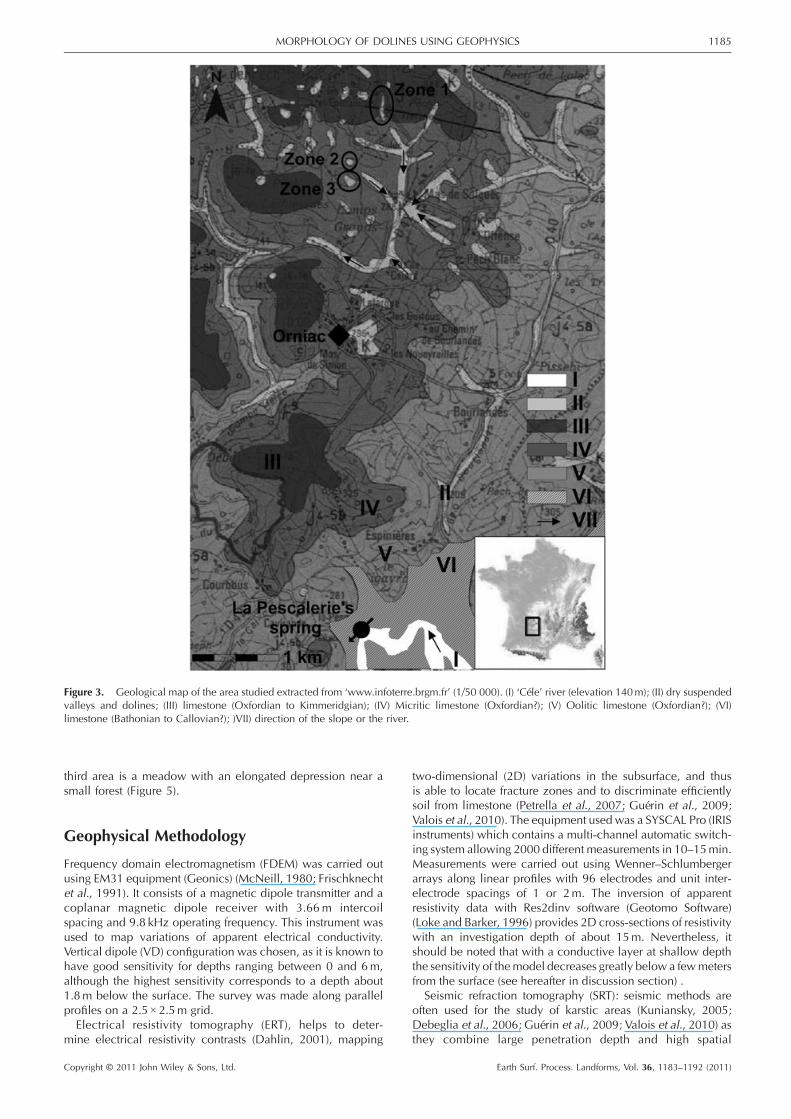
Figure 3. Geological map of the area studied extracted from ‘www.infoterre.brgm.fr’ (1/50 000). (I) ‘Céle’ river (elevation 140m); (II) dry suspendedvalleys and dolines; (III) limestone (Oxfordian to Kimmeridgian); (IV) Micritic limestone (Oxfordian?); (V) Oolitic limestone (Oxfordian?); (VI)limestone (Bathonian to Callovian?); )VII) direction of the slope or the river.
1185MORPHOLOGY OF DOLINES USING GEOPHYSICS
third area is a meadow with an elongated depression near asmall forest (Figure 5).
Geophysical Methodology
Frequency domain electromagnetism (FDEM) was carried outusing EM31 equipment (Geonics) (McNeill, 1980; Frischknechtet al., 1991). It consists of a magnetic dipole transmitter and acoplanar magnetic dipole receiver with 3.66m intercoilspacing and 9.8 kHz operating frequency. This instrument wasused to map variations of apparent electrical conductivity.Vertical dipole (VD) configuration was chosen, as it is known tohave good sensitivity for depths ranging between 0 and 6m,although the highest sensitivity corresponds to a depth about1.8m below the surface. The survey was made along parallelprofiles on a 2.5 × 2.5m grid.Electrical resistivity tomography (ERT), helps to deter-
mine electrical resistivity contrasts (Dahlin, 2001), mapping
Copyright © 2011 John Wiley & Sons, Ltd.
two‐dimensional (2D) variations in the subsurface, and thusis able to locate fracture zones and to discriminate efficientlysoil from limestone (Petrella et al., 2007; Guérin et al., 2009;Valois et al., 2010). The equipment used was a SYSCAL Pro (IRISinstruments) which contains a multi‐channel automatic switch-ing system allowing 2000 different measurements in 10–15min.Measurements were carried out using Wenner–Schlumbergerarrays along linear profiles with 96 electrodes and unit inter‐electrode spacings of 1 or 2m. The inversion of apparentresistivity data with Res2dinv software (Geotomo Software)(Loke and Barker, 1996) provides 2D cross‐sections of resistivitywith an investigation depth of about 15m. Nevertheless, itshould be noted that with a conductive layer at shallow depththe sensitivity of themodel decreases greatly below a fewmetersfrom the surface (see hereafter in discussion section) .
Seismic refraction tomography (SRT): seismic methods areoften used for the study of karstic areas (Kuniansky, 2005;Debeglia et al., 2006; Guérin et al., 2009; Valois et al., 2010) asthey combine large penetration depth and high spatial
Earth Surf. Process. Landforms, Vol. 36, 1183–1192 (2011)

Figure 4. Photograph of the doline in Zone 2 with the profile in white. The doline is surrounded by a tree grove.
Figure 5. Photograph of the depression in Zone 3 with the profile in white. This elongated depression is bordered by a small forest.
1186 R. VALOIS ET AL.
resolution. The equipment used was a StrataVisor seismograph(Geometrics). The seismic lines were recorded along the sameprofiles as the ERT. Forty‐eight geophones were used with unitspacings of 4 or 5m The shots were made between eachgeophone using a hammer source. The inversion of refractiondata with Rayfract software (Intelligent Resources Inc.) provides2D cross‐sections of P waves velocity linked to the mechanicalbehaviour of materials. The depth of investigation is about15m as for ERT, but with the ray coverage corresponding tothe chosen shots scheme, the resolution at depth is higher(see hereafter in discussion section).
Results
Root mean square errors (RMS ) between calculated andobserved data are lower than 9% for all ERT cross‐sections. Forall SRT cross‐sections, RMS are low too: lower than 1.2ms.Therefore, calculated models are consistent with measureddata from a mathematical point of view. All elevations are
Copyright © 2011 John Wiley & Sons, Ltd.
referenced to NGF (Nivellement Général de la France), whichis the elevation above the Mediterranean mean sea level.
Figure 6 shows a perspective view of the apparent electricalconductivity map for Zone 1 with the location of the ERTprofiles and the interpreted electrical resistivity cross‐sections.The north‐trending linear anomaly with low electrical con-ductivity edged on both sides by high conductivity correspondsto a metallic pipe for water supply. The map reveals threecircular conductive anomalies, but only the southern one isassociated with a topographic depression. ERT 1A, collectedover this anomaly, shows a funnel‐shaped conductive structurewith a step at about 5m below the surface. In fact, the bowl‐shaped body progresses to a funnel‐shaped geometry below.This structure is 40m wide and at least 10m deep and filledwith low resistivity materials. ERT allows us to distinguish threeregions with contrasting resistivity: a high resistivity region atthe bottom (>1000Ω m), an area with resistivity rangingbetween 100 and 1000Ω m at intermediate depth and a lowresistivity region (<100Ω m) at the top. In the north of profileERT 1A, the intermediate resistivity zone overlies high
Earth Surf. Process. Landforms, Vol. 36, 1183–1192 (2011)

Figure 6. 3D figure of zone 1. Topography is the land surface (5m×5m); vertical scale is exaggerated (4 times). The map overlaid is the apparentconductivity map made with EM31 (2.5m×2.5m) with the isocontour 10mS/m highlighted. The white linear anomaly on the map corresponds tometallic water duct. ERT 1A and 1B are electrical resistivity cross‐sections (1 and 2m inter‐electrode spacings, respectively), with isocontours 100and 1000 1.m highlighted with white and black line, respectively.
1187MORPHOLOGY OF DOLINES USING GEOPHYSICS
resistivities. Towards the south, the low resistivity area appearsat the surface and the high resistivity body deepens. Thethickness of the low resistivity body increases and highresistivities are not detected at the bottom of the cross‐section.Nevertheless, the model sensitivity is low at the bottom of ERTcross‐section because of the low resistivity region at shallowdepth, so these results have to be constrained by other data. Thisanalysis is presented in the discussion section of this article.On the apparent conductivity map, a slight conductive
anomaly (about 10mS/m) was detected near the middle of thesouth part and a more pronounced one is identified at the north(about 20mS/m). The profile ERT 1B crosses this strongeranomaly and shows a low resistivity bowl‐shaped structure inthe high resistivity body. This well‐defined structure does notcorrespond to a noticeable topographic feature.Figure 7 presents the results of seismic refraction investigations.L1A shows a low velocity dissymmetric structure and the
bottom of the structure is detected at 15m depth. Its shape isroughly the same as the low resistivity body observed alongERT 1A cross‐section. Nevertheless the sensitivity at depth isbetter here with seismic than with ERT (see the Discussionsection). Moreover, both methods reveal a sub‐horizontalregion at the surface, which is between 4 and 5m thick withlow velocity and between 2 and 4m thick with low resistivity.L1B reveals a bowl‐shaped low velocity structure, 40m long
and 15m deep, which has a shape similar to the low resistivitybody observed in the ERT 1B profile. Both ERT and seismicmethods reveal that this anomaly is closed at its bottom.
Copyright © 2011 John Wiley & Sons, Ltd.
The doline in Zone 2 (Figure 8) is associated with aconductive anomaly (5mS/m), which is much smaller than inZone 1. A rather low resistivity structure in a resistive medium isalso shown in the doline on ERT 2 but this anomaly does notexhibit as much contrast as the ones observed in Zone 1 (300 vs30Ω m). It is interesting to notice that ERT does not reveal thebottom of the structure while seismic detects only a very smallanomaly. In fact, the profile for L2 shows a low velocity body(5m thick) close to the surface and its thickness increasesslightly in the doline (8m thick). Moreover, electrical results donot show a conductive region at shallow depth outside of thedoline as observed for Zone 1.
Figure 9 shows a FDEM apparent conductivity map and ERTcalculated cross‐section for Zone 3. Seismic refraction was notcarried out for this zone. The conductive anomaly (around18mS/m) in the north part of FDEMmap was not expected sinceno topographic feature exists. The other conductive anomaly(to the south‐east) agrees with topography and looks like a smallbasin, which is more conductive in the lowest elevation area.ERT 3 shows a bowl‐shaped structure in the north‐western partof the depression. Further south, a small and less resistivestructure appears at lower elevation, and finally, at the end ofthe cross‐section the model indicates a horizontal anomaly withlow resistivity covered with a more resistive structure. This lastanomaly could be a 3D effect of the conductive region detectedon the conductivity map at 10m of the profile towards thenorth‐east. However, ERT does not detect any low resistivitybody at shallow depth outside the doline.
Earth Surf. Process. Landforms, Vol. 36, 1183–1192 (2011)

Figure 7. Apparent conductivity map of zone 1 (upper‐left) with the isocontour 10mS/m highlighted. L1A and L1B are P wave velocity cross‐sections (5m inter‐geophone spacings) with isocontours 2000 and 3500m/s highlighted with white line and black dash, respectively.
Figure 8. 3D figure of zone 2. Topography is the land surface; vertical scale is exaggerated (3 times). The map overlaid is the apparent conductivitymap made with EM31 (5m×5m) with the isocontour 5mS/m highlighted. ERT 2 is a resistivity cross‐section (2m inter‐electrode spacings) withisocontours of 100 and 1000m highlighted with white and black lines, respectively. L2 is a P wave velocity cross‐section (4m inter‐geophonespacings) with isocontours of 2000 and 3500m/s highlighted with white line and black dash, respectively.
1188 R. VALOIS ET AL.
Copyright © 2011 John Wiley & Sons, Ltd. Earth Surf. Process. Landforms, Vol. 36, 1183–1192 (2011)
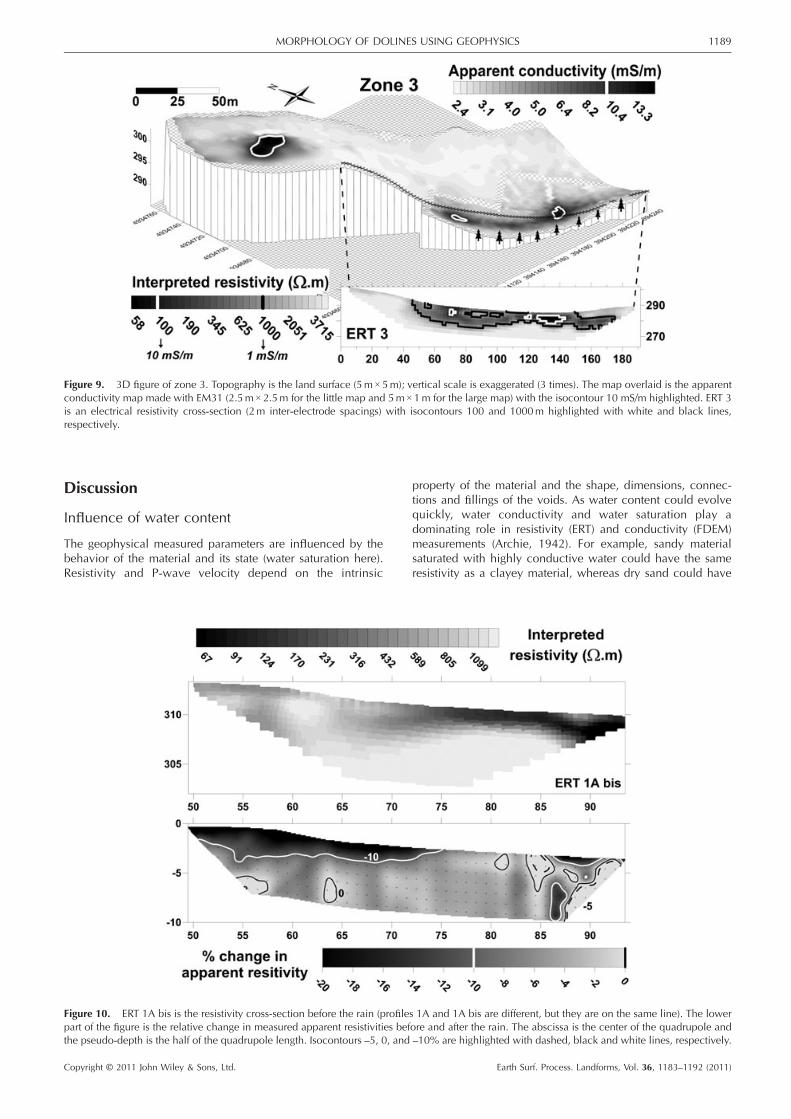
Figure 9. 3D figure of zone 3. Topography is the land surface (5m×5m); vertical scale is exaggerated (3 times). The map overlaid is the apparentconductivity map made with EM31 (2.5m×2.5m for the little map and 5m×1m for the large map) with the isocontour 10 mS/m highlighted. ERT 3is an electrical resistivity cross‐section (2m inter‐electrode spacings) with isocontours 100 and 1000m highlighted with white and black lines,respectively.
1189MORPHOLOGY OF DOLINES USING GEOPHYSICS
Discussion
Influence of water content
The geophysical measured parameters are influenced by thebehavior of the material and its state (water saturation here).Resistivity and P‐wave velocity depend on the intrinsic
Figure 10. ERT 1A bis is the resistivity cross‐section before the rain (profilepart of the figure is the relative change in measured apparent resistivities befthe pseudo‐depth is the half of the quadrupole length. Isocontours –5, 0, and
Copyright © 2011 John Wiley & Sons, Ltd.
property of the material and the shape, dimensions, connec-tions and fillings of the voids. As water content could evolvequickly, water conductivity and water saturation play adominating role in resistivity (ERT) and conductivity (FDEM)measurements (Archie, 1942). For example, sandy materialsaturated with highly conductive water could have the sameresistivity as a clayey material, whereas dry sand could have
s 1A and 1A bis are different, but they are on the same line). The lowerore and after the rain. The abscissa is the center of the quadrupole and–10% are highlighted with dashed, black and white lines, respectively.
Earth Surf. Process. Landforms, Vol. 36, 1183–1192 (2011)

1190 R. VALOIS ET AL.
the same resistivity as a limestone (Guéguen and Palciauskas,1992). On the other hand, unweathered limestone saturatedwith highly conductive water could not have the samesignature as a clayey soil.An example of water saturation influence is shown in
Figure 10, which shows the relative difference betweenapparent (i.e. measured) resistivities after 12mm of rain in Zone1. The apparent resistivities decrease 5% on average and themaximumdrop (27%) is seen on the upper‐left part of the profile.These results provide information about the quality of thesubsoil, because the pseudo‐section points out the mostsaturated regions after the rain. It corresponds with resistivezones close to the surface, which are located on an edge andoutside of the depression. The increase in resistivities observedin the right part of the profile. may be the effect of the raintemperature on resistivity (Campbell et al., 1948). Indeeddecrease of soil temperature caused by the low temperature ofrain water could correspond to an increase in resistivity of about2% per degree Celsius as given by log tables or Schlumbergertables (Serra, 1979). In any case, water saturation is an importantparameter because it tends to reduce contrast between high andlow resistivity bodies. As a consequence the detection ofgeological boundaries could become less obvious followingincrease in overall water saturation. Nevertheless, the contrastbetween unweathered limestone and clayey materials is stillsubstantial.The seismic velocity is also influenced by water saturation
(Gassmann, 1951). Since the velocity ofwater is about 1500m/s,it is difficult to discriminate the effect of water or geology whenobserved velocities are close to 1500m/s. From a practicalpoint of view, water content has negligible influence in a highvelocity medium whereas in a low velocity medium high watercontent could increase the velocity significantly.
Model sensitivity
The inversion process produces models which fit data as well aspossible, but depending on the method, model constraints arenot the same for all regions. Figure 11 presents a sensitivityanalysis of ERT and a ray‐tracing section for SRT in Zone 2(the other zones show a similar trend). The sensitivity of ERT
Figure 11. The upper‐image is the ray‐tracing section of profile L2. The lo
Copyright © 2011 John Wiley & Sons, Ltd.
model is good for the first 5–10m and decreases strongly inlower regions. Even if the true resistivity at depth is not wellconstrained, resistivity contrast between clayey material andunweathered limestone is sufficient to discriminate thesematerials, if concerned volumes are large. For SRT, the modelis well constrained between 5–10m and 20–30m below thesurface because rays tend to bypass low velocity regions, whichare located at the surface here. Finally, it appears that for thisstudy ERT and SRT are complementary methods in terms ofmodel sensitivity.
Furthermore, FDEM mapping which indicates the lateralextension of the conductive anomalies allows the investigatorto select relevant locations for more intensive, time‐consumingand expensive cross‐section studies, identified after FDEMmapping, which estimate the vertical dimensions of theanomalies. Finally, such a multi‐methods approach combiningFDEM, ERT and SRT enables optimal layout of the profiles andcross‐validation of the results, which reduces uncertaintyregarding shape and content.
Morphological interpretations
Clay, sand, silt and broken stone could be expected close tothe surface, which could come from allogenic processes(natural or anthropogenic) (Bruxelles et al., 2006). Limestone isexpected below these sediments, according to the geologicalobservations made in this region. Nevertheless, the limestoneis probably weathered by the frost/thaw cycle or by crypto‐corrosion (dissolution through contact between deposits andthe substratum). SRT could discriminate here unconsolidatedsediments or weathered limestones from an unweatheredbedrock whereas ERT could identify clayey and water bearingmaterials very well.
Analysis of the three SRT and their corresponding ray‐pathsection points out the refractor with an approximate velocityof 3500m/s. It corresponds here to the area with themaximum vertical variation in velocity. The region abovethe refractor could have high velocities, ranging from 400 to3500m/s, because the inversion process creates smoothvelocity variations. A refractor with this velocity (3500m/s)may correspond to limestone here. Therefore, the overlying
wer part is the relative sensitivity of cross‐section ERT 2.
Earth Surf. Process. Landforms, Vol. 36, 1183–1192 (2011)

1191MORPHOLOGY OF DOLINES USING GEOPHYSICS
regions might be soil or highly weathered limestone withpoor mechanical properties.Resistivity below 100Ω m is interpreted here as clayey
(or silty) material. According to field observations, there is justa small quantity of sand which is mixed with clay. In Zone 1,this iso‐resistivity line shows good correlation with the velocitycontour 2000m/s (Figures 6 and 7). Regions in ERT 1A and L1Abelow these limits are considered here as clayey sedimentfilling the depression. The refractor at 3500m/s correspondsapproximately with the iso‐resistivity line 1000Ω m. More-over, the limit at 1000Ω m corresponds to a strong verticalgradient. Therefore, this limit is interpreted as the limestonesubstratum with good mechanical properties. The samegeophysical signature is found in ERT 1B, L1B and on theconductivity map, so the anomaly is probably a buried doline.It is important to notice that the shapes of anomalies from ERT
and SRT in Zone 1 are similar, so the funnel‐shaped and bowl‐shaped structures probably correspond to the geometry of richclay doline fillings. Moreover, the long slope might produce bothsurface and subsurface flows through the epikarst, which on theone hand, fill the doline with transported allochtonous sedimentsand on the other hand, increase its size by enhancing thecorrosion of embanking autochtonous limestone.In Zone 2, the correlation between the shapes delimited by
ERT and SRT is low (Figure 8), but this difference has to beexploited and explained. In fact, the resistivity outside thedoline is very high (>2000Ω m) at the surface, while thevelocity variations resemble the variations from Zone 1. Sinceweathered limestone outcrops are visible at the surface, highresistivity and low velocity are explained by a weatheredlimestone. Inside the doline, the thickness of the low velocityregion increases from 5m to 8m. For ERT 2, the low resistivityanomaly is thick with a small‐size very low resistivity area. Theanomaly is not as pronounced as in Zone 1 for both ERT andSRT, but it reveals a subvertical structure with intermediateresistivity and high velocities. It could be interpreted as afracturated limestone filled with low resistivity materialencompassing a small‐sized area with less blocs and/or higherclay content.In Zone 3 (Figure 9), ERT 3 shows the same range of
resistivity; high resistivity medium (>2000Ω m) outside thedepression and intermediate resistivity regions inside withsome low resistivity areas. This elongated depression could beconsidered as paleo‐topography with sediment accumulationand clayey materials located at the lowest level. These small‐localized clayey areas could be evidence of karstificationprocess by void creation and clay concentration. Theacceleration or the prolongation of the process (crypto‐corrosion?) might transform this depression into a doline.The conductive anomaly in the north of Zone 3 might be a
buried doline, because the FDEM signature looks like thedoline signature of Zone 1. However, further investigations, forexample ERT and SRT surveys, are needed to confirm thisinterpretation.
Conclusion
ERT and SRT are complementary in terms of sensitivity becausethe sensitivity of ERT is good in conductive fillings while raysbypass unconsolidated doline fillings and are concentratedbelow these fillings. They are also complementary because SRTis linked to the mechanical behavior (unweathered limestone vsunconsolidated sediments or very weathered limestone) andERT discriminates clayey and water‐bearing materials from aresistive medium. They both provide information about theshape and content of doline fillings.
Copyright © 2011 John Wiley & Sons, Ltd.
Differences of geophysical signature in Zone 1 could beexplained by the clay content and its geometry. The size of thestructures indicates that karstification processes have beenimportant. The funnel‐shaped structure suggests vertical con-nections because the doline filling is deep. Moreover, thecrypto‐corrosion activity and future development is expectedon the margins of the doline between the substratum anddeposits. The doline in Zone 2 may contain a thin soil coveroverlying a lightly fracturated limestone filled with clayeymaterials. The last depression seems to be a paleo‐topographywith a beginning of corrosion process.
Another important result is the discovery of buried dolines,which can occur beneath inclined hill slope or flat plateau,without morphologic evidence at the surface. Indeed, FDEMconductivity mapping has proven its utility by characterizingthe lateral extensions of dolines and by detecting at least oneburied doline. This study shows that the analysis of topographyis not sufficient to identify dolines and to make subsequentvulnerability maps for building projects (subsidence risks) or forthe protection of karstic aquifers. Aerial photographs andleveling topographies offer preliminary information, whichshould be followed up with geophysical surveys to help detectthese structures.
Finally, the three depressions studied, which differ in theirtopographic morphology and surface state, exhibit a largevariability in their geophysical signature. These differencescould be explained by the shape and size of the filling materialand by the weathering degree of the limestone. Karstic activityor history may account for these differences. A multi‐study withgeophysics, trenches and sedimentological analysis could linkdolines and illuminate their geological history and the processesinvolved for better comprehension of the karstic system.
Acknowledgements—The authors wish to thank the students from theMaster of Applied Geophysics 2009 (M2 GARE, University Pierre etMarie Curie‐Paris 6) who participated to the field survey. We also thankCyril Delporte, Andre Tarisse and Joël Tremoulet who providedregional and local useful information. The authors will like to thankthe reviewers, especially Óscar Pueyo and Phil Carpenter for theircomments and suggestions that help to improve this paper.
ReferencesAhmed S, Carpenter P. 2003. Geophysical response of filled sinkholes,soil pipes and associated bedrock fractures in thinly mantled karst,east‐central Illinois. Environmental Geology 44: 705–716.
Archie GE. 1942. The electrical resistivity log as an aid in determiningsome reservoir characteristics. Journal of Petroleum Technology 5:1–8.
Astruc JG, Coinçon R. 1996. Les dépressions karstiques sur les caussesdu Quercy. Quercy‐Recherche 83.
Astruc JG, Escarguel G, Marandat B, Coinçon R, Sigé B. 2000. Floor‐age constraining of a tectonic paroxysm of the Pyrenean orogen.Late Middle Eocene mammal age of a faulted karstic filling of theQuercy phosphorites, south‐western France. Geodinamica Acta 13:271–280.
Beck BF. 2004. Soil piping and sinkhole failures. In Encyclopedia ofCaves. White WB (ed). Elsevier: New York; 523–528.
Bruxelles L, Colonge D, Salgues T. 2006. Morphologie et remplissagedes dolines du Causse de Martel d’après les observations réalisées aucours du diagnostic archéologique de l’aérodrome de Brive‐Souillac(Corrèze et Lot). Karstologia 47: 21–32.
Campbell RB, Bower CA, Richards LA. 1948. Change of electricalconductivity with temperature and the relation of osmotic pressure toelectrical conductivity and ion concentration for soil extracts. SoilScience Society of America Proceedings 13: 66–69.
Chalikakis K, Plagnes V, Guérin R, Valois R, Bosch F. In Press.Contribution of geophysical methods for karst system exploration.An overview. Hydrogeology Journal.
Earth Surf. Process. Landforms, Vol. 36, 1183–1192 (2011)

1192 R. VALOIS ET AL.
Dahlin T. 2001. The development of electrical imaging techniques.Computers and Geosciences 27: 1019–1029.
Debeglia N, Bitri A, Thierry P. 2006. Karst investigations usingmicrogravity and MASW; application to Orleans, France. NearSurface Geophysics 4: 215–225.
Ford D, Williams P. 2007. Karst landform development in humidregion. In Karst Hydrogeology and Geomorphology, Ford D,Williams P (eds). Wiley: Chichester; 339–351.
Frischknecht FC, Labson VF, Spies BR, Anderson WL. 1991. Profilingmethods using small sources. In Electromagnetic Methods in AppliedGeophysics 2, Nabighian MN (ed). Society of Exploration Geophysi-cists: 105–270.
Gassmann F. 1951. Uber die elastizitat poroser medien. Vierteljahrsschriftder Naturforschenden Gesellschaft in Zurich 96: 1–23.
GuéguenY, Palciauskas V. 1992. Conductivité électrique. In Introductionà la physique des roches. Hermann: Paris; 185–214.
Guérin R, Baltassat JM, Boucher M, Chalikakis K, Galibert PY, Girard JF,Plagnes V, Valois R. 2009. Geophysical characterisation of karsticnetworks ‐ application to the Ouysse system (Poumeyssen, France).Comptes Rendus Geoscience 341: 810–817.
Gutiérrez F, Guerrero J, Lucha P. 2008. A genetic classification ofsinkholes illustrated from evaporite paleokarst exposures in Spain.Environmental Geology 53: 993–1006.
Jardani A, Revil A, Santos F, Fauchard C, Dupont JP. 2007. Detection ofpreferential infiltration pathways in sinkholes using joint inversion ofself‐potential and EM‐34 conductivity data. Geophysical Prospecting55: 749–760.
Kuniansky EL. 2005. US Geological Survey karst interest group,Proceedings. USGS Scientific Investigations Report, 2005–5160.
Loke MH, Barker RD. 1996. Rapid least‐square inversion of apparentresistivity pseudo‐sections by a quasi‐newton method. GeophysicalProspecting 44: 131–152.
McNeill JD. 1980. Electrical terrain conductivity measurement at lowinduction numbers. Technical Notes TN‐6, Geonics Limited.
Copyright © 2011 John Wiley & Sons, Ltd.
Petrella E, Capuano P, Celico F. 2007. Unusual behaviour of epikarst inthe Acqua dei Faggi carbonate aquifer (Southern Italy). Terra Nova19: 82–88.
Pueyo‐Anchuela Ó, Juan AP, Soriano MA, Casas‐Sainz AM. 2009.Characterization of karst hazards from the perspective of the dolinetriangle using GPR – examples from Central Ebro Basin (Spain).Engineering Geology 108: 225–236.
Sauro U, Ferrarese F, Francese R,Miola A, Mozzi P, RandoGQ, TrombinoL, Valentini G. 2009. Doline fills – case study of the Faverghera plateau(Venetian pre‐alps, Italy). Acta Carsologica 38: 51–63.
Serra O. 1979. Diagraphies différées – bases de l’interprétation. Tome 1 :Acquisition des données diagraphiques. Bulletin des Centres deRecherches Exploration-Production Elf‐Aquitaine, Mém. 1.
Siart C, Hecht S, Holzhauer I, Altherr R, Meyer HP, Schukraft G, Eitel B,BubenzerO, Panagiotopoulos D. 2010. Karst depressions as geoarchaeo-logical archives: the palaeoenvironmental reconstruction of Zominthos(Central Crete), based on geophysical prospection, sedimentologicalinvestigations and GIS.Quaternary International 216: 75–92.
Sustersic F. 2006. A power function model for the basic geometry ofsolution dolines: considerations from the classical karst of south‐central Slovenia. Earth Surface Processes and Landforms 31: 293–302.
Valois R, Bermejo L, Guérin R, Hinguant S, Pigeaud R, Rodet J. 2010.Karstic morphologies identified with geophysics around Saulgescaves (Mayenne, France). Archaeological Prospection 17: 151–160.
Waltham AC, Fookes PG. 2003. Engineering classification of karstground conditions. Quarterly Journal of Engineering Geology andHydrogeology 36: 101–118.
Waltham T, Bell F, Culshaw M. 2005. Sinkholes and Subsidence.Springer: Chichester.
Williams P. 2003. Dolines. In Encyclopedia of Caves and Karst Science,Gunn J (ed). Fitzroy Dearborn: New York; 304–310.
Zambo L, Ford DC. 1997. Limestone dissolution processes in BekeDoline Aggtelek National Park, Hungary. Earth Surface Processes andLandforms 22: 531–543.
Earth Surf. Process. Landforms, Vol. 36, 1183–1192 (2011)
Copyright © 2022 FDOKUMEN


![genetic variation of norway spruce (picea abies [l.] karst ...](https://static.fdokumen.com/doc/165x107/633d6582b988f9753c06267d/genetic-variation-of-norway-spruce-picea-abies-l-karst-.jpg)