ASSESSMENT DAY - Daytona State College
43
ASSESSMENT DAY College of Business, Engineering and Technology School of Business – BAS February 12, 2020 1
-
Upload
khangminh22 -
Category
Documents
-
view
0 -
download
0
Transcript of ASSESSMENT DAY - Daytona State College

ASSESSMENT DAYCollege of Business, Engineering and TechnologySchool of Business – BASFebruary 12, 2020
1

2
Strengths Challenges
Recommendations
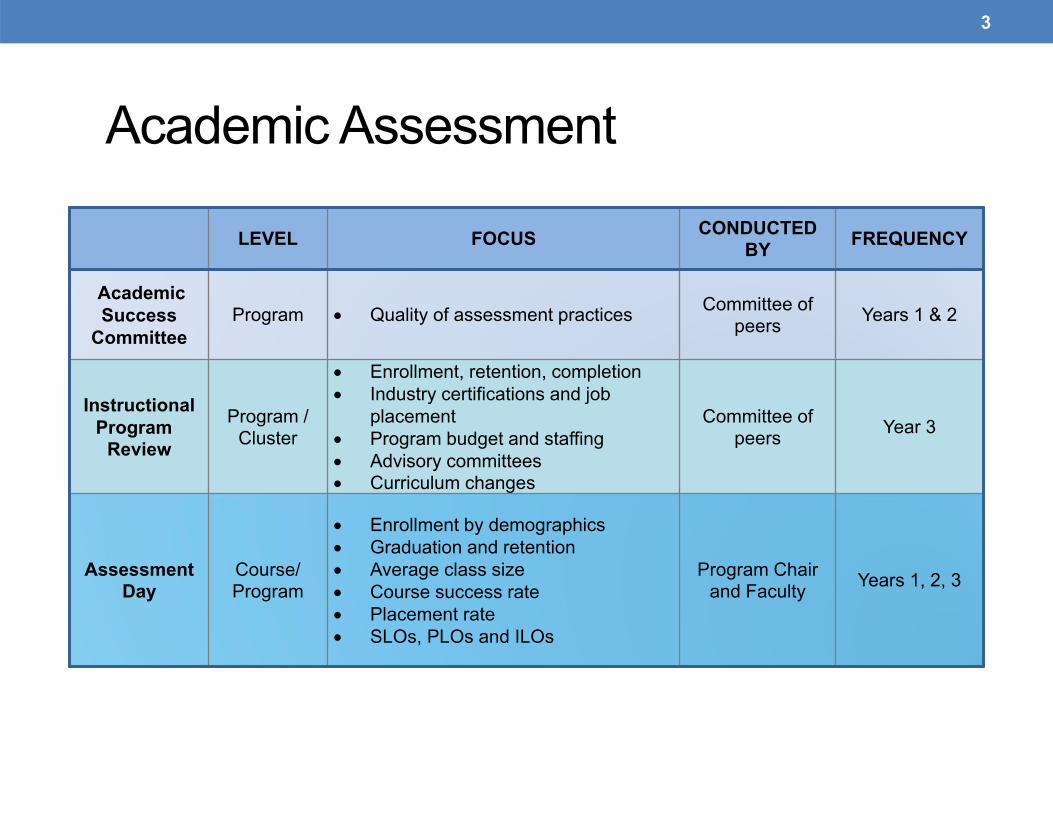
Academic Assessment
3
LEVEL FOCUS CONDUCTED BY FREQUENCY
Academic Success
CommitteeProgram Quality of assessment practices Committee of
peers Years 1 & 2
Instructional Program
ReviewProgram /
Cluster
Enrollment, retention, completion Industry certifications and job
placement Program budget and staffing Advisory committees Curriculum changes
Committee of peers Year 3
Assessment Day
Course/ Program
Enrollment by demographics Graduation and retention Average class size Course success rate Placement rate SLOs, PLOs and ILOs
Program Chair and Faculty Years 1, 2, 3

Programs - BAS
4
6000 - Bachelor of Applied Science in Supervision and Management3005 - Project Management
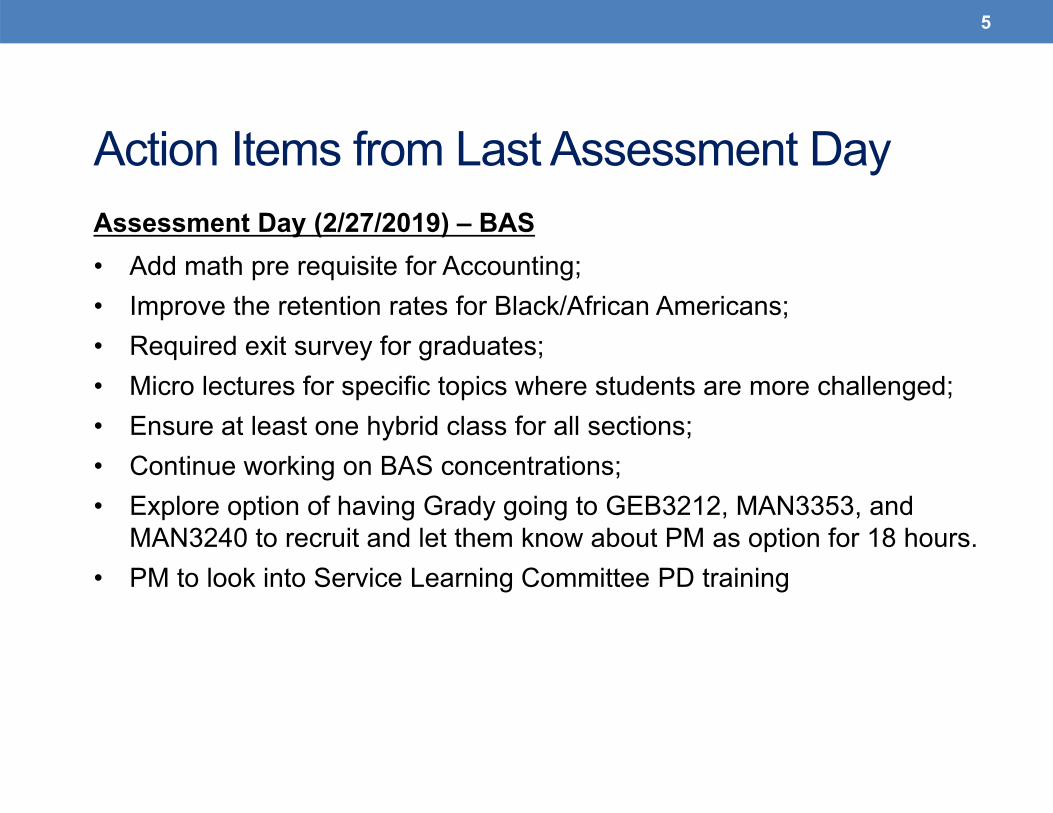
Action Items from Last Assessment DayAssessment Day (2/27/2019) – BAS• Add math pre requisite for Accounting;• Improve the retention rates for Black/African Americans;• Required exit survey for graduates;• Micro lectures for specific topics where students are more challenged;• Ensure at least one hybrid class for all sections;• Continue working on BAS concentrations;• Explore option of having Grady going to GEB3212, MAN3353, and
MAN3240 to recruit and let them know about PM as option for 18 hours.• PM to look into Service Learning Committee PD training
5

Program Learning OutcomesBAS – Bachelor of Applied Science in Supervision and Management #6000
1. Demonstrate effective communications that integrate decision-making and analytical thinking skills.
2. Identify and apply management decision-making to include an appreciation for diversity, cultural awareness, and organizational behavior.
3. Apply human resource methods and concepts that are consistent with community, industry, and organizational standards, policies, and procedures.
4. Integrate effective and efficient management and behavioral principles for leading and managing resources.
5. Demonstrate the ability to apply legal and ethical decision-making in management situations.
6. Formulate and apply effective customer relations techniques and applications.7. Demonstrate skill in managerial accounting concepts, analysis, and applications.8. Integrate operational processes and information systems into a managerial-specific context.9. Identify the strategic planning process to include development of an organizational mission
statement with measurable goals, objectives, and activities.10. Apply team processes, practices, and collaboration in a management-related context.11. Manage a project from inception to successful conclusion using critical thinking,
communications, problem solving, and decision-making.
6

100%
87.3% 91%
0%10%20%30%40%50%60%70%80%90%100%
Applied ResearchExperiment
Research assignments Final business plan
PLO3 Results
100%92%
100%
0%10%20%30%40%50%60%70%80%90%100%
Case studies or writtenanalysis
Quizzes,homework/outside
assignments
Journaling assignment
PLO2 Results92.1%
100% 96%
0%10%20%30%40%50%60%70%80%90%100%
Resume and coverletter
Teamwork AnalysisReport or Research
pape
Capstone team project
PLO1 Results
Assessment Results 2018-2019
Demonstrate effective communications that integrate decision-making and analytical thinking skills. Target: 70% of students achieving 70% or higher
Identify and apply management decision-making to include an appreciation for diversity, cultural awareness, and organizational behavior. Target: 70% of
students achieving 70% or higher
Apply human resource methods and concepts that are consistent with community, industry, and organizational standards, policies, and procedures.
Target: 70% of students achieving 70% or higher
7

92.5% 92.5% 94%
0%10%20%30%40%50%60%70%80%90%100%
Research PaperCustomer Relations
ComprehensiveBusiness Plan Project
Capstone Project
PLO6 Results
92.00% 89% 90%
0%10%20%30%40%50%60%70%80%90%100%
Research Paper Comprehensive BusinessPlan Project
Legal Assignment
PLO5 Results
90%100%
94.2%
0%10%20%30%40%50%60%70%80%90%100%
Reflection Memo Applied Research Experiment Management Manifesto, timedassessments, case study
assignments, and discussions
PLO4 Results
Integrate effective and efficient management and behavioral principles for leading and managing resources. Target: 70% of students achieving 70% or
higher
Demonstrate the ability to apply legal and ethical decision-making in management situations. Target: 70% of students achieving 70% or higher
Formulate and apply effective customer relations techniques and applications. Target: 70% of students achieving 70% or higher
8
Assessment Results 2018-2019

94.7% 91.4% 93%
0%10%20%30%40%50%60%70%80%90%100%
Applied Research TeamProject, timed assessments,discussions and/or case study
Applied research teamproject,discussions and/or
case study
Final Project
PLO9 Results
90% 91.40% 94.4%
0%10%20%30%40%50%60%70%80%90%100%
Applied Research ProjectComprehensive businessplan
Applied Research Project
PLO8 Results
92.5%87.9% 87%
0%10%20%30%40%50%60%70%80%90%100%
Financial statement caseassignment
Homework Portfolio Capstone Project
PLO7 Results
Demonstrate skill in managerial accounting concepts, analysis, and applications. Target: 70% of students achieving 70% or higher
Integrate operational processes and information systems into a managerial-specific context. Target: 70% of students achieving 70% or higher
Identify the strategic planning process to include development of an organizational mission statement with measurable goals, objectives, and activities. Target: 70% of
students achieving 70% or higher
9
Assessment Results 2018-2019

95% 94.5% 92.3% 91.4%
0%
10%
20%
30%
40%
50%
60%
70%
80%
90%
100%
Final Project Applied ResearchProject
Applied ResearchTeam Project
Applied ResearchTeam Project
PLO11 Results
92.4%86%
91.4%
0%
10%
20%
30%
40%
50%
60%
70%
80%
90%
100%
Applied Research TeamProject
Comprehensive businessplan
Applied Research Project
PLO10 Results
Apply team processes, practices, and collaboration in a management-related context. Target: 70% of students achieving 70% or higher
Manage a project from inception to successful conclusion using critical thinking, communications, problem solving, and decision-making. Target: 70% of students
achieving 70% or higher
10
Assessment Results 2018-2019

Program Learning Outcomes300500 - Project Management
1. Demonstrate understanding of the fundamental knowledge, terminology and processes of effective project management.
2. Perform in the role of a project manager, leading and directing projects and teams.
3. Use industry recognized project management software.4. Apply agile principles and practices on projects.5. Integrate stakeholder business requirements to shape the output of
projects and drive successful business outcomes.6. Assess and analyze projects risks along with plans to mitigate threats
and capitalize on opportunities.7. Apply principles of quality management throughout the Project Life
Cycle.8. Demonstrate knowledge and advanced experience in the specialized
area of developing and maintaining project schedules.
11

100%
84%95%
100%
0%10%20%30%40%50%60%70%80%90%100%
Initial Assignment: ControllingProject Cost Discovery
Reinforced Assignment: Discussion3 Iteration/Release Planning *
Proficiency Assignment: Create aX‐Y matrix
PLO4 Assessment Results
FA18 SP19
94% 97%100% 100%
74%
0%10%20%30%40%50%60%70%80%90%100%
Initial Assignment: Discussion 1 MSProject Basics Lesson 1
Reinforced Assignment: Milestone& Activity List *
Proficiency Assignment: Create aNetwork Diagram
PLO3 Assessment Results
FA18 SP19
84%100% 100%
0%
20%
40%
60%
80%
100%
Initial Assignment: Discussion 1Perform a project SWOT analysis*
Reinforced Assignment: Develop aProject Charter *
Proficiency Assignment: Create aProcess FMEA
PLO2 Assessment Results
Results
94% 97%88% 87%
74%
0%
20%
40%
60%
80%
100%
Initial Assignment: Discussion 1Initiating the Project
Reinforced Assignment:Discussion 1 Understanding Six
Sigma *
Proficiency Assignment: SMARTERGOAL ‐ Team Project
PLO1 Assessment Results
FA18 SP19
PLO1.Demonstrate understanding of the fundamental knowledge, terminology and processes of effective project management. Target: 90% of students
achieving 70% or higher
PLO2.Perform in the role of a project manager, leading and directing projects and teams. Target: 90% of students achieving 70% or higher
PLO3.Use industry recognized project management software. Target: 90% of students achieving 70% or higher
12
PLO4.Apply agile principles and practices on projects. Target: 90% of students achieving 70% or higher
* course was offered only in one semester
Assessment Results 2018-2019

100% 97%100% 100%
74%
0%
20%
40%
60%
80%
100%
Initial Assignment: Lesson 13Project Schedule Optimization
Reinforced Assignment:Creating a Fishbone Diagram*
Proficiency Assignment:Creating the Final Project
Network Diagram
PLO8 Assessment Results
FA18 SP19
97% 100%94% 100%
0%
20%
40%
60%
80%
100%
Initial Assignment:Discussion 2 Defining the
Cost, Quality, and Risk Plans
Reinforced Assignment:Identify Cost of Poor Quality
*
Proficiency Assignment:Create an Activity List withEstimated Resources/ Cost/
Time/ Relationships *
PLO7 Assessment Results
FA18 SP19
100% 100% 97%100%
74%
0%10%20%30%40%50%60%70%80%90%100%
Initial Assignment: Performinga Qualitative Risk Analysis
Reinforced Assignment:Perform a Quantitative Risk
Analysis *
Proficiency Assignment: Createa Risk Response Plan
PLO6 Assessment Results
FA18 SP19
76%85%
100%
0%10%20%30%40%50%60%70%80%90%100%
Initial Assignment:Discussion 3 Plan for
evaluation of the solutions
Reinforced Assignment:Discussion 2 DefineElements of Waste
Proficiency Assignment:Define Statement of Work
(SOW)
PLO5 Assessment Results
PLO5.Integrate stakeholder business requirements to shape the output of projects and drive successful business outcomes. Target: 90% of students
achieving 70% or higher
PLO6.Assess and analyze projects risks along with plans to mitigate threats and capitalize on opportunities. Target: 90% of students achieving 70% or higher
13
PLO8.Demonstrate knowledge and advanced experience in the specialized area of developing and maintaining project schedules. Target: 90% of students achieving
70% or higher
PLO7.Apply principles of quality management throughout the Project Life Cycle. Target: 90% of students achieving 70% or higher
Assessment Results 2018-2019

Assessment Data 2017-2018 and 2018-2019:Programs and Institutional Learning Outcomes
Program
Critical/ CreativeThinking Communication Cultural Literacy Information and
Technical Literacy
17/18 18/19 17/18 18/19 17/18 18/19 17/18 18/19
6000 ‐ BAS 94.4%‐97% 91.4%‐95% 92.1%‐100% 92.1%‐100% 87%‐94% 89.9%‐92% 53%‐98% 92.5%‐95%
3005 – Project Management Cert
72%‐91% 69%‐100% 67%‐100% 76%‐93% 50%‐100% 76%‐96% 100% 74%‐100%
14

Source: IR Program Assessment Data Students are duplicated across programs, unduplicated in the total.
15
46
1,1431,065 1,074 1,024
20 6 5 130
500
1000
1500
2000
2015‐2016 2016‐2017 2017‐2018 2018‐2019
Headcount in Major
6001 ‐ BAS HOSPITALITY CONC. 6000 ‐ BAS‐SUPERVISION/MGMT 3005 ‐ PROJECT MANAGEMENT ATC
College Enrollment Decreased: 0.7%(14/15); 1.15% (15/16); 3.7%(16/17); 0.7%(17/18)

Source: IR Program Assessment Data
16
4
268
299
252270
8 10
50
100
150
200
250
300
350
400
2015‐2016 2016‐2017 2017‐2018 2018‐2019
Graduates in Major
6001 ‐ BAS ‐ HOSPITALITY CONC. 6000 ‐ BAS‐SUPERVISION/MGMT
3005 ‐ PROJECT MANAGEMENT ATC

Source: IR Program Assessment Data
17
33536
1
65
1
185
3
0 20 40 60 80 100 120 140 160 180 200
3005 - Project Management
6000 - BAS
6001 - BAS - Hospitality Conc.
Number of Graduates by Race/Ethnicity
White Unknown Two or More Races Hispanic Black Asian
Source: IR Program Assessment Data
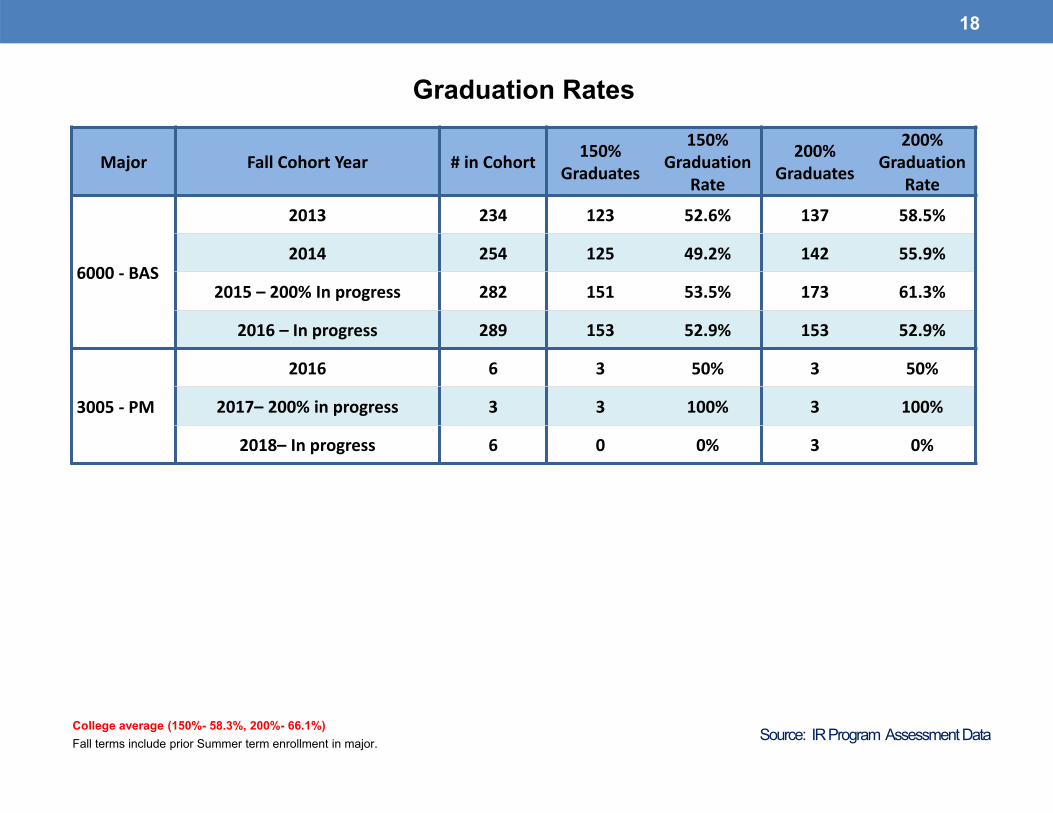
Graduation Rates
18
College average (150%- 58.3%, 200%- 66.1%)Fall terms include prior Summer term enrollment in major.
Major Fall Cohort Year # in Cohort 150% Graduates
150% Graduation
Rate
200% Graduates
200% Graduation
Rate
6000 ‐ BAS
2013 234 123 52.6% 137 58.5%
2014 254 125 49.2% 142 55.9%
2015 – 200% In progress 282 151 53.5% 173 61.3%
2016 – In progress 289 153 52.9% 153 52.9%
3005 ‐ PM
2016 6 3 50% 3 50%
2017– 200% in progress 3 3 100% 3 100%
2018– In progress 6 0 0% 3 0%

Source: IR Program Assessment Data
Graduation Rates by Race/Ethnicity (1 of 2)
19
Major Fall Cohort Year Race/Ethnicity # in Cohort 150% Graduates
150% Graduation
Rate
200% Graduates
200% Graduation
Rate
3005 -PM
2016Black 2 1 50% 1 50%White 4 2 50% 2 50%
2017 – 200% in progress
Hispanic 1 1 100% 1 100%White 2 2 100% 2 100%
2018 – In progressBlack 1 0 0% 0 0%Hispanic 2 0 0% 0 0%White 3 0 0% 0 0%

Source: IR Program Assessment Data
Graduation Rates by Race/Ethnicity (2 of 2)20
Major Fall Cohort Year Race/Ethnicity # in Cohort 150% Graduates
150% Graduation
Rate
200% Graduates
200% Graduation
Rate
6000 ‐BAS
2014
Asian 4 3 75.0% 3 75.0%Black 39 18 46.2% 19 48.7%Hawaii/Pac 2 1 50.0% 1 50.0%Hispanic 21 7 33.3% 11 52.4%Two or More Races 7 1 14.3% 1 14.3%Unknown 1 1 100% 1 100%White 180 94 52.2% 106 58.9%
2015 – 200% In progress
Am. Ind 1 0 0.0% 0 0.0%Asian 6 2 33.3% 3 50%Black 48 28 58.3% 31 64.6%Hawaii/Pac 2 1 50.0% 1 50.0%Hispanic 28 16 57.1% 21 75%Unknown 3 2 66.7% 3 100%White 194 102 52.6% 114 58.8%
2016 – In progress
Am. Ind 1 1 100.0% 1 100.0%Asian 5 2 40.0% 2 40.0%Black 41 15 36.6% 15 36.6%Hispanic 44 18 40.9% 18 40.9%Two or More Races 4 2 50.0% 2 50.0%Unknown 3 1 33.3% 1 33.3%White 191 114 59.7% 114 59.7%

Source: IR Program Assessment Data
Graduation Rates by Gender
21
College average (150%- 58.3%, 200%- 66.1%)Fall terms include prior Summer term enrollment in major.
Major Fall Cohort Year Gender # in Cohort 1250% Graduates
1510% Graduation
Rate
200% Graduates
200% Graduation
Rate
3005 -PM
2016Female 4 2 50% 2 50%Male 2 1 50% 1 50%
2017 – 200% in progress Female 3 3 100% 3 100%
2018 – In progressFemale 2 0 0% 0 0%Male 4 0 0% 0 0%
6000 -BAS
2014Female 161 81 50.3% 91 56.5%Male 89 42 47.2% 49 55.1%Unknown 4 2 50% 2 50%
2015 – 200% in progress
Female 165 90 54.5% 103 62.4%Male 114 60 52.6% 69 60.5%PrefNoAns 1 0 0% 0 0%Unknown 2 1 50% 1 50%
2016 – In progress
Female 177 101 57.1% 101 57.1%Male 109 51 46.8% 51 46.8%PrefNoAns 1 0 0% 0 0%Unknown 2 1 50% 1 50%

Source: IR Program Assessment Data
Persistence Rates 22
Registered - Includes all students enrolled in the fall term of the specified year, with the specified program as their primary major.Exclusions - Includes students who are deceased or graduated fall of the specified year or the following spring or summer.Not retained - Students who were not registered the following fall term.Retained by DSC - Students who were still registered at DSC the following fall but with a different primary major.Retained by Program - Students who were registered the following fall with the same primary major.
Program and Fall Cohort Year Registered Exclusions Adjusted Cohort
Retained by DSC
Retained by Program
DSC Total
RetainedN % N %
3005 – Project Management
FA16 to SP17 4 0 4 0 0% 3 75% 75%
FA17 to SP18 5 2 3 0 0% 1 33% 33%
FA18 to SP19 6 1 5 0 0% 5 100% 100%

Source: IR Program Assessment Data
Persistence Rates by Race/Ethnicity23
Program Cohort Race/Ethnicity Registered Exclusions Adjusted Cohort
Retained by Program
N %
3005 –Project Management
FA16 to SP17Black 2 0 2 1 50%
White 2 0 2 2 100%
FA17 to SP18
Black 1 0 1 0 0%
Hispanic 1 1 0
White 3 1 2 1 50%
FA18 to SP19
Black 1 0 1 1 100%
Hispanic 2 0 2 2 100%
White 3 1 2 2 100%
Registered ‐ Includes all students enrolled in the fall term of the specified year, with the specified program as their primary major.Exclusions ‐ Includes students who are deceased or graduated fall of the specified year or the following spring or summer.Adjusted Cohort ‐ Registered students less exclusions.Not retained ‐ Students who were not registered the following fall term.Retained by DSC ‐ Students who were still registered at DSC the following fall but with a different primary major.Retained by Program ‐ Students who were registered the following fall with the same primary major.

Source: IR Program Assessment Data
Persistence Rates by Gender24
Program Cohort Race/Ethnicity Registered Exclusions Adjusted Cohort
Retained by Program
N %
3005 –Project Management
FA16 to SP17Female 3 0 3 2 67%
Male 1 0 1 1 100%
FA17 to SP18Female 4 2 2 1 50%
Male 1 0 1 0 0%
FA18 to SP19Female 2 1 1 1 100%
Male 4 0 4 4 100%
Registered ‐ Includes all students enrolled in the fall term of the specified year, with the specified program as their primary major.Exclusions ‐ Includes students who are deceased or graduated fall of the specified year or the following spring or summer.Adjusted Cohort ‐ Registered students less exclusions.Not retained ‐ Students who were not registered the following fall term.Retained by DSC ‐ Students who were still registered at DSC the following fall but with a different primary major.Retained by Program ‐ Students who were registered the following fall with the same primary major.

Source: IR Program Assessment Data
Retention Rates 25
College average (67.1%)Registered - Includes all students enrolled in the fall term of the specified year, with the specified program as their primary major.Exclusions - Includes students who are deceased or graduated fall of the specified year or the following spring or summer.Not retained - Students who were not registered the following fall term.Retained by DSC - Students who were still registered at DSC the following fall but with a different primary major.Retained by Program - Students who were registered the following fall with the same primary major.
Program and Fall Cohort Year Registered Exclusions Adjusted Cohort
Retained by DSC
Retained by Program
DSC Total
RetainedN % N %
6000 ‐ BAS
2012 818 261 557 5 1% 391 70% 71%
2013 871 271 600 9 2% 407 68% 69%
2014 860 306 554 6 1% 366 66% 67%
2015 455 129 326 17 5.2% 203 62.3% 67.5%
2016 726 253 473 8 2% 310 66% 67%
2017 727 239 488 9 1.8% 314 64.3% 66.2%
6001 – BAS Hospitality Conc. 2017 8 0 8 0 0% 7 87.5% 87.5%

Source: IR Program Assessment Data
Fall 2017 to Fall 2018 Retention Rates by Race/Ethnicity26
Program Race/Ethnicity Registered Exclusions Adjusted Cohort
Retained by Program
N %
6000 ‐ BAS
American Indian 2 1 2 0 0.0%
Asian 11 1 10 4 40.0%
Black 95 25 70* 45 64.3%
Hispanic 98 30 68* 44 64.7%
Two or More Races 18 8 10* 7 70.0%
Unknown 10 4 6 3 50.0%
White 493 170 323** 211 65.3%
6001 – BAS Hospitality Conc.
Hispanic 3 0 3 3 100%
White 4 0 4 4 100%
College average (African American: 49.9%, Hispanic: 66.3%)Registered ‐ Includes all students enrolled in the fall term of the specified year, with the specified program as their primary major.Exclusions ‐ Includes students who are deceased or graduated fall of the specified year or the following spring or summer.Adjusted Cohort ‐ Registered students less exclusions.Not retained ‐ Students who were not registered the following fall term.Retained by DSC ‐ Students who were still registered at DSC the following fall but with a different primary major.Retained by Program ‐ Students who were registered the following fall with the same primary major.
*one student retained by DSC, **six students retained by DSC
Source: IR Program Assessment Data
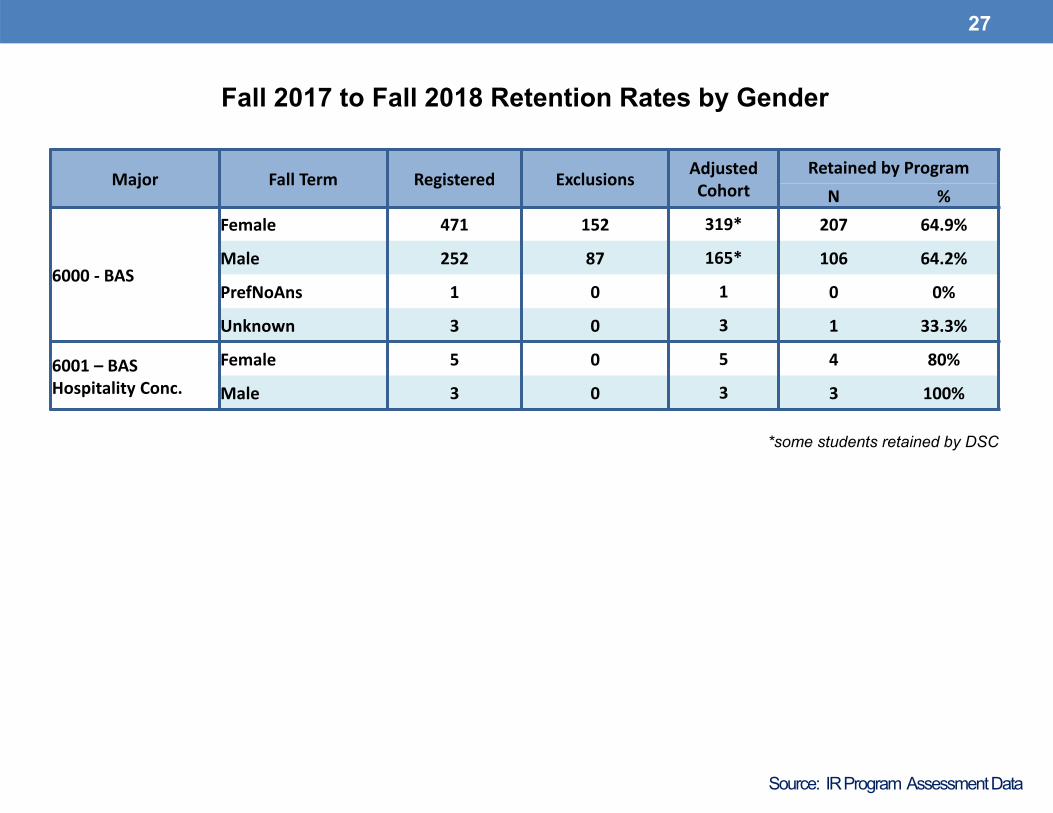
Fall 2017 to Fall 2018 Retention Rates by Gender
27
Major Fall Term Registered Exclusions Adjusted Cohort
Retained by ProgramN %
6000 ‐ BAS
Female 471 152 319* 207 64.9%
Male 252 87 165* 106 64.2%
PrefNoAns 1 0 1 0 0%
Unknown 3 0 3 1 33.3%
6001 – BAS Hospitality Conc.
Female 5 0 5 4 80%
Male 3 0 3 3 100%
*some students retained by DSC

28
Placement Rates(College average: 95.5%)
Program Title Cohort Year Grads Reported
Continuing Education
Employed Estimated Average Annual Full-Time Wage
DSC FCS DSC FCS
BAS -Supervision Management
2016/17 288 28 71% 78% $42,652 $46,212
2015/16 272 9% 76% 78% $44,488 $44,672
2014/15 326 9% 69% 77% $43,456 $46,564
2013/14 304 6% 72% 77% $ 41,312 $ 42,300
2012/13 267 6% 75% 76% $ 39,492 $ 42,168
2011/12 281 12% 75% 75% $ 35,712 $ 40,564
ATC - Project Management 2016/17 50% 80% $**,***
Indicates the College average above the State AveragesIndicates the College average same as the State AveragesIndicates the College average below the State Averages

Course Success Rates (1 of 2)
Source: IR Program Assessment Data
Major Course2015‐2016 2016‐2017 2017‐2018 2018‐2019
Attempted % Successful Attempted % Successful Attempted % Successful Attempted % Successful
6000 ‐ BAS
ACG3024 396 83% 385 77% 387 72% 416 74%
BUL3130 401 86% 398 84% 360 83% 405 82%
GEB3213 605 91% 538 92% 554 93% 576 91%
GEB4891 314 96% 437 90% 336 90% 306 92%
GEB4905 1 100% 1 100%
ISM4011 348 93% 352 91% 341 90% 337 89%
ISM4905
MAN3240 442 86% 359 87% 372 84% 388 84%
MAN3353 423 95% 333 94% 318 90% 359 91%
MAN3593 12 100% 6 100% 17 100%
MAN4120 381 89% 366 92% 324 93% 325 92%
MAN4162 414 89% 353 88% 329 89% 350 89%
MAN4301 365 87% 284 86% 281 83% 339 84%
MAN4504 384 91% 321 91% 309 92% 316 90%
29
Indicates a success rate of 90% or higherIndicates a success rate between 70% and 89% Indicates a success rate below 70%

Course Success Rates (2 of 2)
Source: IR Program Assessment Data
Major Course2015‐2016 2016‐2017 2017‐2018 2018‐2019
Attempted % Successful Attempted % Successful Attempted % Successful Attempted % Successful
3005 ‐Project Management
MAN4520 11 91% 7 86% 22 95%
MAN4535 13 92% 9 78% 15 87%
MAN4583 50 84% 11 100% 34 82%
MAN4584 11 100% 7 86% 21 100%
MAN4741 13 85% 9 67% 15 87%
6000 ‐BAS/3005 ‐Project Management
GEB4930 358 90% 504 92% 354 91% 365 90%
MAN4900 312 98% 410 97% 284 97% 293 97%
30
Indicates a success rate of 90% or higherIndicates a success rate between 70% and 89% Indicates a success rate below 70%

Course Success Rates by Race/Ethnicity (1 of 3)31
Program, Course, and Race/ Ethnicity
2018‐2019
Enrolled Success Rate
3005 ‐ Project Management 107 90%MAN4520 22 95%Black 1 0%Hispanic/Latino 4 100%Native Hawaiian/Paci 1 100%Two or More Races 1 100%White 15 100%
MAN4535 15 87%Black 1 0%Hispanic/Latino 5 80%Native Hawaiian/Paci 1 100%Two or More Races 1 100%White 7 100%
MAN4583 34 82%Black 3 0%Hispanic/Latino 5 60%Native Hawaiian/Paci 1 100%Two or More Races 1 100%White 24 96%
MAN4584 21 100%Hispanic/Latino 6 100%Two or More Races 1 100%White 14 100%
MAN4741 15 87%Black 1 0%Hispanic/Latino 4 75%Native Hawaiian/Paci 1 100%Two or More Races 1 100%White 8 100%
Indicates a success rate of 90% or higherIndicates a success rate between 70% and 89% Indicates a success rate below 70%
Program, Course, and Race/ Ethnicity
2018‐2019Enrolled Success Rate
6000 ‐ BAS 4134 87%ACG3024 416 74%American Indian/Alas 1 100%Asian 7 100%Black 57 49%Hispanic/Latino 57 74%Two or More Races 10 60%Unknown 6 83%White 278 79%
BUL3130 405 82%Asian 10 100%Black 58 78%Hispanic/Latino 65 69%Native Hawaiian/Paci 1 100%Two or More Races 10 100%Unknown 5 100%White 256 84%
GEB3213 576 91%Asian 9 100%Black 72 89%Hispanic/Latino 93 84%Two or More Races 19 100%Unknown 10 100%White 373 93%
GEB4891 306 92%Asian 9 100%Black 39 85%Hispanic/Latino 45 82%Native Hawaiian/Paci 1 0%Two or More Races 6 100%Unknown 3 100%White 203 95%

Course Success Rates by Race/Ethnicity (2 of 3)32
Program, Course, and Race/ Ethnicity
2018‐2019Enrolled Success Rate
6000 ‐ BAS 4134 87%ISM4011 337 89%Asian 6 100%Black 40 85%Hispanic/Latino 48 85%Native Hawaiian/Paci 1 100%Two or More Races 10 100%Unknown 4 50%White 228 91%
MAN3240 388 84%Asian 4 100%Black 56 75%Hispanic/Latino 69 78%Two or More Races 13 100%Unknown 4 100%White 242 86%
MAN3353 359 91%Asian 8 100%Black 55 93%Hispanic/Latino 57 89%Native Hawaiian/Paci 1 100%Two or More Races 12 100%Unknown 4 100%White 222 90%
MAN3593 17 100%Black 1 100%Hispanic/Latino 3 100%Two or More Races 1 100%White 12 100%
Program, Course, and Race/ Ethnicity
2018‐2019Enrolled Success Rate
6000 ‐ BAS 4134 87%MAN4120 325 92%Asian 9 78%Black 47 89%Hispanic/Latino 50 90%Native Hawaiian/Paci 1 100%Two or More Races 8 100%Unknown 3 100%White 207 93%
MAN4162 350 89%Asian 7 100%Black 46 85%Hispanic/Latino 64 81%Two or More Races 8 75%Unknown 3 100%White 222 92%
MAN4301 339 84%Asian 7 86%Black 56 77%Hispanic/Latino 50 76%Native Hawaiian/Paci 1 100%Two or More Races 8 100%Unknown 2 100%White 215 87%
MAN4504 316 90%Asian 4 100%Black 50 82%Hispanic/Latino 51 78%Native Hawaiian/Paci 1 100%Two or More Races 9 100%Unknown 3 100%White 198 94%

Course Success Rates by Race/Ethnicity (3 of 3)
33
Indicates a success rate of 90% or higherIndicates a success rate between 70% and 89% Indicates a success rate below 70%
Program, Course, and Race/ Ethnicity
2018‐2019Enrolled Success Rate
6000 – BAS / 3005 658 93%GEB4930 365 90%Asian 8 75%Black 52 90%Hispanic/Latino 56 82%Two or More Races 13 92%Unknown 5 100%White 231 92%
MAN4900 293 97%Asian 7 100%Black 40 100%Hispanic/Latino 36 97%Native Hawaiian/Paci 1 0%Two or More Races 7 100%Unknown 4 100%White 198 96%
Grand Total 4899 88%

Program Success by Race/Ethnicity
34
Program and Race/ Ethnicity2018‐2019
Enrolled Success Rate
3005 107 90%Black 6 0%Hispanic/Latino 24 83%Native Hawaiian/Paci 4 100%Two or More Races 5 100%White 68 99%6000 4134 87%American Indian/Alas 1 100%Asian 80 96%Black 577 80%Hispanic/Latino 652 81%Native Hawaiian/Paci 7 86%Two or More Races 114 95%Unknown 47 94%White 2656 89%6000/3005 658 93%Asian 15 87%Black 92 95%Hispanic/Latino 92 88%Native Hawaiian/Paci 1 0%Two or More Races 20 95%Unknown 9 100%White 429 94%Grand Total 4899 88%
Indicates a success rate of 90% or higherIndicates a success rate between 70% and 89% Indicates a success rate below 70%

Civitas – illume Students 35
Captured on 1/28/20
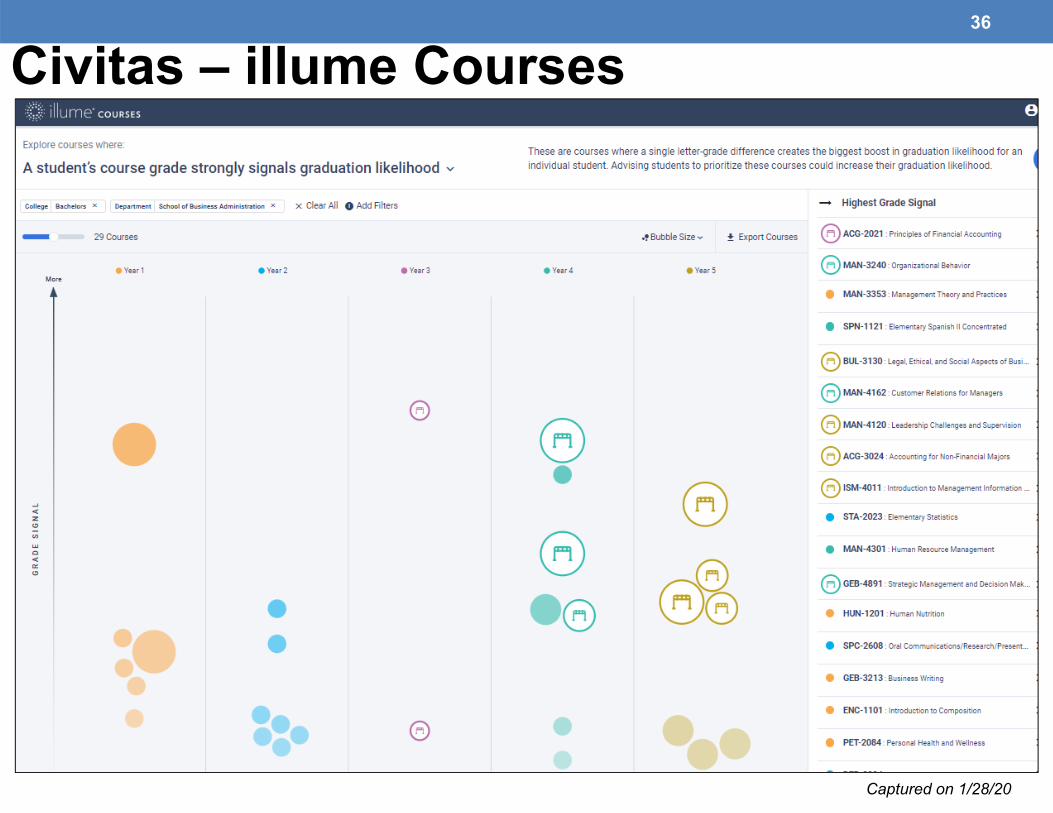
Civitas – illume Courses36
Captured on 1/28/20

2019-2020Academic Affairs
Assessment Day – Program Guides
A Review of Program Guide and Course Catalog Information
37

Program Guides - Overview
• Given Assessment Day results, are there anychanges needed to or desired for the ProgramGuide?
• Please Review:
– Program Information
– General Education Course Selections (if applicable)
– Program Course Catalog Information
– Program of Study
38

Program Guides – Information Review
• Mission statement
– Does it accurately state the purpose and goals of the program?
• Description
–Does it clearly portray the nature of the program and any unique characteristics (i.e. embedded certificates, industry certifications, program accreditations, etc.)?
39
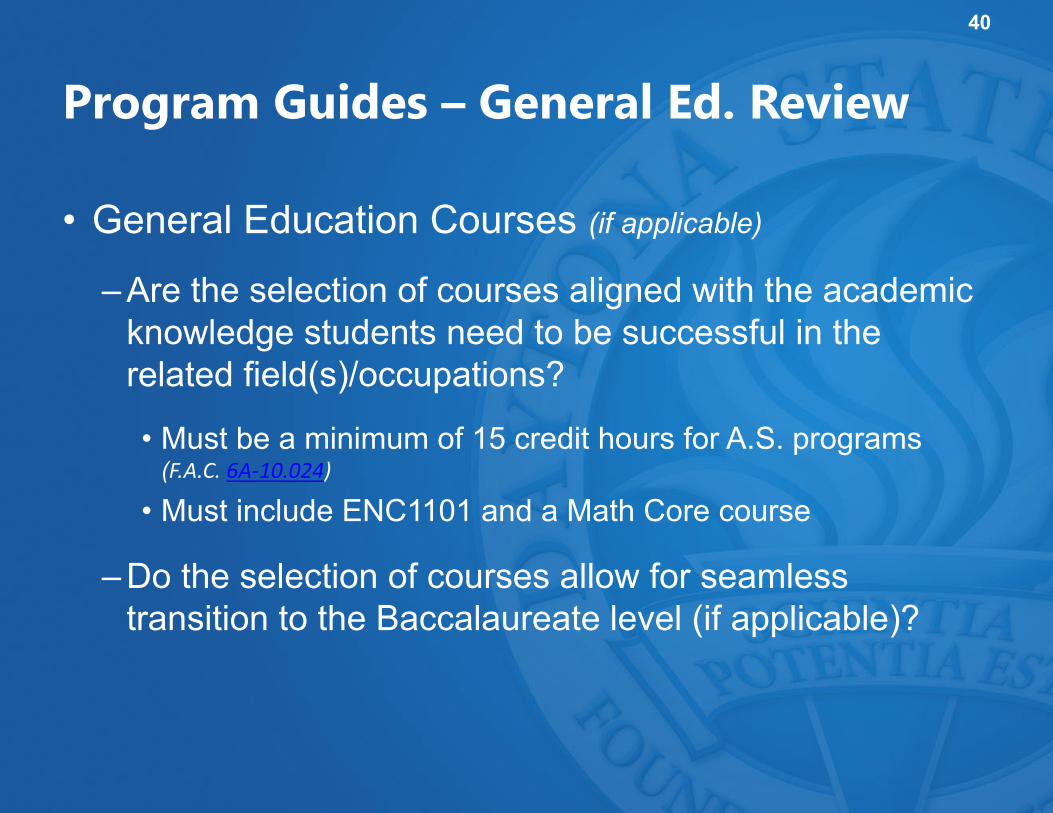
Program Guides – General Ed. Review
• General Education Courses (if applicable)
– Are the selection of courses aligned with the academic knowledge students need to be successful in the related field(s)/occupations?
• Must be a minimum of 15 credit hours for A.S. programs (F.A.C. 6A‐10.024)
• Must include ENC1101 and a Math Core course
– Do the selection of courses allow for seamless transition to the Baccalaureate level (if applicable)?
40

Program Guides – Course Reqs. Review
• Program Specific Course Requirements
– Are the courses relevant to the academic and technical skills required in the related field(s)/occupation(s)?
– Are there any required courses offered by another department? If so, consult with that department on upcoming changes (if any).
– Are there any courses that have not been offered in over 5 years?
41

Program Guides – Course Info. Review
• Program Specific Course Catalog Information
– Is the course description accurate?
– Are the course prefix, number and/or title relevant?
– Are the term offerings up-to-date?
– Are the prerequisite and corequisite course assignments appropriate to what students need to know to be successful in the requisite (required) course?
42

Program Guide – Program of Study Review
• Program of Study
– Is the sequence of courses structured from foundational to advanced content, as appropriate?
– Does the sequence align with course, term offerings?
– Does the sequence align with course, prerequisite/co-requisite assignments?
– Are there any special notes/information missing, incorrect or desired?
43