Assessment and Propagation of Input Uncertainty in Tree-based Option Pricing Models
41
arXiv:0704.1768v1 [cs.CE] 13 Apr 2007 Assessment and Propagation of Input Uncertainty in Tree- based Option Pricing Models Henryk Gzyl German Molina Enrique ter Horst IESA Vega Capital Services Ltd. IESA Abstract This paper aims to provide a practical example on the assessment and propagation of input uncertainty for option pricing when using tree-based methods. Input uncertainty is propagated into output uncertainty, reflecting that option prices are as unknown as the inputs they are based on. Option pricing formulas are tools whose validity is conditional not only on how close the model represents reality, but also on the quality of the inputs they use, and those inputs are usually not observable. We provide three alternative frameworks to calibrate option pricing tree models, propagating parameter uncertainty into the resulting option prices. We finally compare our methods with classical calibration-based results assuming that there is no options market established. These methods can be applied to pricing of instruments for which there is not an options market, as well as a methodological tool to account for parameter and model uncertainty in theoretical option pricing. Key words and phrases. CRR, Cox-Ross-Rubinstein model, uncertainty propagation, Bayesian Statistics, Option Pricing, Mixture Models, Metropolis-Hastings, Markov Chain Monte Carlo. Acknowledgements We wish to thank Lars Stentoft and The Centre for Analytical Finance, University of Aarhus Denmark for providing us with the S&P 500 option data; and Sabatino Constanzo, Samuel Malone, Miguel Mayo, Abel Rodriguez, and Loren Trigo for providing us helpful comments. 1. Introduction 1.1. Option pricing dependencies Option pricing has become a major topic in quantitative finance. Pricing models and algorithms, rang- ing from the now-basic Black & Scholes (1973) to more complex Partial Integro Differential Equations (PIDE) (Cont et al., 2004) and tree-based methods (Cox et al., (1979), Gustafsson et al., (2002)) are being proposed continuously in what has become a very extensive literature in mathematical finance. All these option pricing models rely on some set of inputs, obtained by either estimation (Polson et al., (2003)) or calibration (Cont et al., (2004)) to implied market values, with most of them relying on no-arbitrage arguments. Garcia et al., (2003) provides a good econometric review. 1
Transcript of Assessment and Propagation of Input Uncertainty in Tree-based Option Pricing Models

arX
iv:0
704.
1768
v1 [
cs.C
E]
13
Apr
200
7
Assessment and Propagation of Input Uncertainty in Tree-based Option Pricing Models
Henryk Gzyl German Molina Enrique ter Horst
IESA Vega Capital Services Ltd. IESA
Abstract
This paper aims to provide a practical example on the assessment and propagation of input uncertainty for
option pricing when using tree-based methods. Input uncertainty is propagated into output uncertainty,
reflecting that option prices are as unknown as the inputs they are based on. Option pricing formulas
are tools whose validity is conditional not only on how close the model represents reality, but also on the
quality of the inputs they use, and those inputs are usually not observable. We provide three alternative
frameworks to calibrate option pricing tree models, propagating parameter uncertainty into the resulting
option prices. We finally compare our methods with classical calibration-based results assuming that
there is no options market established. These methods can be applied to pricing of instruments for which
there is not an options market, as well as a methodological tool to account for parameter and model
uncertainty in theoretical option pricing.
Key words and phrases. CRR, Cox-Ross-Rubinstein model, uncertainty propagation,
Bayesian Statistics, Option Pricing, Mixture Models, Metropolis-Hastings, Markov Chain
Monte Carlo.
Acknowledgements
We wish to thank Lars Stentoft and The Centre for Analytical Finance, University of Aarhus Denmark
for providing us with the S&P 500 option data; and Sabatino Constanzo, Samuel Malone, Miguel Mayo,
Abel Rodriguez, and Loren Trigo for providing us helpful comments.
1. Introduction
1.1. Option pricing dependencies
Option pricing has become a major topic in quantitative finance. Pricing models and algorithms, rang-
ing from the now-basic Black & Scholes (1973) to more complex Partial Integro Differential Equations
(PIDE) (Cont et al., 2004) and tree-based methods (Cox et al., (1979), Gustafsson et al., (2002)) are
being proposed continuously in what has become a very extensive literature in mathematical finance.
All these option pricing models rely on some set of inputs, obtained by either estimation (Polson et
al., (2003)) or calibration (Cont et al., (2004)) to implied market values, with most of them relying on
no-arbitrage arguments. Garcia et al., (2003) provides a good econometric review.
1

Once a set of input values is determined, they are passed to complex mathematical functions, whenever
closed-form solutions are available, or computational algorithms to determine anything from plain vanilla
to very exotic option prices. This common framework provides, in most cases, a unique solution, a unique
option price that practitioners consider the theoretical, risk-neutral value of the option, and around which
the market players will add the risk premium and spread. However, throughout all this process, we must
not forget that the quality of such output relies extremely on the quality of the inputs used.
In most cases, a key input, expressed one way or another, is the volatility of the underlying asset (or
combination of assets) that defines the option. The realized volatility literature (Andersen et al., 2003)
has brought us closer to making this parameter locally observable at higher frequencies. Some problems
still persist such as the lack of data, and the existence of other parameters (nuisance parameters), which
render the task of making accurate assessments of our uncertainty about inputs for option pricing models
more difficult. In practice, it is common to use the most likely input values or calibrated input values to
price options, and focus the efforts on good modelling of parameter dynamics.
During the last few years, there have been many advances in the modelling of the underlying (stochas-
tic volatility (Jacquier et al., (1994)), jump-diffusion models (Duffie et al., (2000))) and/or modelling
jointly the underlying and the observed options movements (Eraker et al., 2003, Barndorff-Nielsen and
Shephard (2001)). However, no matter how accurate our models become to estimate unobservable inputs,
a proper accounting of their flaws and pitfalls as well as assessment of input uncertainty is as important
to option pricing as the quality of the pricing model itself. Propagation of input uncertainty through
complex mathematical model output uncertainty has been explored in other fields, like traffic engineering
(Molina et al., 2005) or climatology (Coles and Pericchi (2003)).
The focus of this paper is the assessment and propagation of input uncertainty, and its effects on
option pricing through the computation of a posterior distribution of the option prices, conditional on the
observed data, that we use to integrate out the parameter’s uncertainty from the option functional. That
is, we look for option prices that are unconditional from the parameters they rely on. We illustrate this
idea through an alternative way to calibrate a tree-based model. By using the historical returns of the
underlying, and looking at the up/down returns with respect to the risk-free rate, but by using a related
statistical parametric approach, we not only from the sample variation of the up/down returns, but also
from the scale and location parameters from the return probability generating process as well. As time
passes by, we are able to observe more returns, and adjust our knowledge about the parameters (assuming
that they are constant). We undertake a bayesian approach to the modelling and the estimation of the
underlying (Hastings (1970)). Parameter posterior distributions lead us to posterior probabilities on the
trees that we use afterwards to price options. However, our goal is not to provide a better pricing model
but a new method to estimate model parameters and propagate parameter uncertainty through the use
of Bayesian methods, illustrating how uncertainty of inputs can be reflected into uncertainty of outputs.
Therefore, we confine our application to the tree-based classic approach of Cox et al., (1979), and build a
statistical model that accounts for input uncertainty, and propagate it into option price uncertainty under
the framework set by that model.// In sections two and three we motivate our approach to assessment
and propagation of input uncertainty into pricing model outputs together with a basic decision-theoretic
argument, and show that most likely parameter values do not necessarily lead to optimal option price
reference choices. In section four we propose a statistical method for the estimation of such input
2

uncertainty and construct the link between the statistical model, input uncertainty and the Cox-Ross-
Rubinstein (CRR) model. Section five contains an application of this method for the S&P500 as well
as a comparison with bootstrap-based calibrations of the tree model, together with potential further
applications in section 6. Finally, section 7 concludes. We will consider throughout the paper the
situation where there are no options markets in place to produce a better calibration, and option prices
must be developed solely from the information contained in the underlying instrument.
2. Assessment and Propagation of input uncertainty
2.1. Motivation
Why should parameter uncertainty matter? Does it really make a difference for option pricing? After
all, if we fit a model to the most likely values through classical maximum likelihood methods, we should
be as close as we can to the ”true” option theoretical, risk-neutral value by the invariance principle of
the MLE estimator (assuming one-to-one relationships between input and output). Furthermore, most
practitioners want a simple, unique answer as to what the market price should be.
There are four major reasons why we might not know the true value of an option: First, our model
might incorrectly represent the dynamics of the underlying (Cont, R. (2006)) leading to incorrect and
biased option prices. We choose to ignore model uncertainty in this paper (understanding models as
different pricing tools, and not as different trees), although it should be accounted for through the use of
model averaging approaches (Hoeting et al., (1999), Cont, R. (2006)). Second, even if our option pricing
model was correct, the option’s payoff is random. However, we can price the latter under risk-neutral
assumptions. Third, which is the focus of our paper, even if the model was correct, the model parameters
are not known, and different combinations of inputs lead to different values of the option. Finally, when
we have more than one parameter defining the trees, the one-to-one relationship between parameters and
option prices breaks down.
The true value of options is not in terms of actual discounted payoffs, but in terms of expected ones.
For example, the value of a digital option is either zero or some fixed amount, depending on the path of
the underlying until maturity, but what we try to model is the expected value of that option as of today.
The theoretical value of the option will be considered known if we were to know the exact value of the
inputs that drive the underlying, but not the realized path of the underlying. When pricing options, the
most we can aspire to learn from the dynamics of the underlying are the model parameters, as the path
will remain stochastic. That is why we define ”value” of an option at a given period only in terms of
the risk-neutral valuation based on the true, unknown inputs. Even if the model accurately represents
the dynamics of the underlying, the model parameters are still unknown. This is especially true as we
construct more complicated models, where parameters could not only be dynamic but stochastic as well,
and even an infinite amount of data would not suffice to learn about their future values.
It is common for practitioners to price options by using the mode of the inputs’ probability distribu-
tions (eg most likely value of the volatility). A first glitch comes when mapping a multi-dimensional input
parameter vector into a 1-dimensional output, as the most likely value of the input does not necessarily
lead to the most likely value of the output. This is a strong argument in favor of finding approaches that
reflect actual parameter uncertainty. All we want to know is an options most likely value? Perhaps its
3

value based on the most likely input? What about its expected value? If we obtain the option price’s
probability distribution, we can extract much more information, including but not restricted to all those.
2.2. How to propagate input uncertainty
Calibrating a model with the most likely input value does not lead to the ”true” option value, nor to the
expected/optimal option value. The most likely value of the parameter has probability zero of being the
true value in continuous parameter spaces. This is quite important, since option prices are asymmetric
with respect to most of their inputs, making the effect on the option price of a small parameter error in
either direction very different.
We illustrate this idea with a simple example. Suppose that the volatility for an underlying can take
only three possible values: v−a with probability 30%, v with probability 40% , and v+a with probability
30%. v is not only the most likely value, but also the expected value. Without loss of generality, we
assume that this is the only parameter needed to price an option. The option theoretical, risk-neutral
price with volatility v is equal to P (v). However, if the true volatility were to be v − a, v or v + a
respectively, the option price would be equal to P (v − a) < P (v) < P (v + a). Due to the asymmetric
effect of the inputs over the outputs, we know that P (v)−P (v−a) 6= P (v+a)−P (v). Therefore, although
v is both the most likely and the expected value for the input, P (v) is not the expected value of the
output. To what extent should we use v to price this option? The expected option price is not P (v), but
a larger value, even under this symmetric and relatively nice distribution of the input v. Considering that
60% of the time we will be wrong by choosing the most likely value for the input, we need to consider not
only one possible value, but all possible values of the inputs, together with their probability distributions
when assessing the possible values for the output. The question now becomes how to propagate the
uncertainty about v into a final option price for more general settings.
This argument can be formalized more properly. Suppose that, instead of three possible values, the
parameter v has a probability distribution of possible values. Therefore, for each value of v, we have a
possible option price P (v), with probability π(v). This would represent the uncertainty about the output
P as a function of the inputs uncertainty v.
Even if we wanted a single option value as an answer, we can still do so by integrating out the option
price with respect to the distribution π(v) yielding Eπ(P ) =∫
P (v)π(v)dv 6= P (∫
vπ(v)dv) 6= P (v), where
the first expression is the expected option value, the second is the price under the expected parameter
value, and the third is the price under the most likely parameter value. Our focus is on the first expression.
This expected option value propagates the input’s uncertainty when passing it to a final option price that
is not dependent on a single volatility value v or Eπ(v), but rather on the overall features of the input’s
probability distribution π(v) and their effect on the output pricing formula. The resulting option price
is no-longer conditional on the volatility, but marginalized over it. The estimation problem has not
disappeared, but has been transformed. We no longer focus on a single estimate v, but rather on the
assessment of the inputs uncertainty through π(v). In other words, our focus changes from how much
we know (most likely value) to how much we do not know (probability distribution). In general a unique
option value deprives us from a full assessment of the uncertainty in option valuation. It is not the same
to know that the option price is with 99% probability between 40 and 42 than if it is between 37 and 45,
even if in both cases the expected and most likely values happened to be the same. Market players will
4

act differently on those two cases. This happens when the option value is asymmetric, as we will show
later in the paper.
We can naturally generalize the formulae above to several parameters, making the expected option
price P a mere integral over the probability distributions of the possible parameters/inputs. Eπ(P ) =∫
P (ξ)π(ξ)dξ, where ξ = (d, u) is a bi-dimensional vector that calibrates a tree to model the price of an
underlying, where u and d are the upward and downward returns respectively. We must here assess the
(joint) probability distribution for all the parameters π(ξ) as parameter correlations influence inferential
results. Assessing parameter values is of special difficulty when either limited data is available or the
dynamics of the underlying are difficult to model, leading to inferential problems.
2.3. Uncertainty estimation as a feature in pricing tools
We outlined how the importance of uncertainty estimation impacts the option value through a probability
distribution of the inputs ξ. In practice, such a probability distribution must be estimated/updated using
available data for the underlying, more so when options markets do not yet exist.
Our approach bears on model uncertainty. Following Cont (2006), if we regard the data on the
prices of the underlying as prior data at t = 0, the posterior probabilities describe the model uncertainty
regarding the option pricing model through the posterior probability distribution of ξ, or the model
misspecification. Bayesian model averaging as described in Hoeting et al., (1999), Cont (2006) is thus a
way to incorporate model uncertainty .
We take a Bayesian approach to the statistical estimation of the CRR model in this paper. This has
several advantages. First, it allows for prior information to be naturally included whenever available.
This is especially useful in situations where the data is scarce, distributions vary over time or we cannot
rely on asymptotics for calibration. Second, it provides a natural way to account for uncertainty in
the parameters after we observe the underlying’s historical return series, and the necessary dynamic
updating as new information becomes available. The posterior distribution of parameters given the data
fits conceptually well into this framework, allowing to sequentially update and learn about the parameters
ξ of the tree-generating process.
Let Xt be the data available regarding the observable ξ to make inference about its parameter vector
θ at time t, linked through the likelihood function f(Xt|θ). Without loss of generality, assume that the
inputs are not time-dependent. Given the data and any additional information regarding the parameter
vector θ, prior to collecting that data, π(θ), we can update that information with the data to obtain
the posterior distribution for θ: π(θ|Xt) ∝ f(Xt|θ)π(θ). One can then use this probability distribution
to propagate our uncertainty about ξ through its posterior distribution once θ is integrated out in the
following way:
π(ξ|Xt) =
∫
Θ
f(ξ|θ)π(θ|Xt)dθ
The posterior distribution for ξ given the data will in turn propage the uncertainty into the option
prices, in the following way:
Eπ(P ) =
∫
P (ξ)π(ξ|Xt)dξ.
The likelihood function f(Xt|θ) (under the physical measure) becomes the main tool to obtain uncertainty
estimates about the parameters θ, and, consequently, about the option prices P . The likelihood function
5

must be consistent with the option pricing tools, as the parameters must have the same meaning under
both, or allow some mapping from the physical measure P to the risk neutral measure Q. Therefore,
the function f is model specific, and must be constructed accordingly, not only to properly reflect the
dynamics of the underlying, but also its relationship with the inputs as defined in the option pricing
model.
3. Decision-Theoretic justification
3.1. Motivation
We assume that our pricing model perfectly characterizes the dynamics of the underlying, and therefore,
if we knew the parameter vector θ driving the underlying, we could price options correctly. In this section,
the input θ can be ξ as in the previous section or any more general parameter governing the probability
model for the underlying model.
A calibration method for an option pricing model must not rely on an existing and liquid option’s
market, as otherwise option prices can only be defined if they already exist. Therefore, we will assume
that there is not any existing option’s market for that underlying to use as a reference, and to determine,
in this case, optimal decisions for pricing.
We assume that as market makers, we must determine the best option price to quote (which in
principle needs not be its value), around which we are to add a spread for bid/ask market making. In
principle we can assume that this spread is constant and symmetric around that value, so it can be
ignored for utility computation purposes, as it becomes a constant for every trade. Therefore, assume
that the trader will bid/offer options at the same level.
Define θ as the set of inputs driving the underlying, whose true value is unknown. Let θM the set of
implied inputs at which we end up making a market, and P (θ) as the price of an option under any given
parameter set θ. The utility function of a buyer of such an option can be defined as UB(P (θM ), P (θ)),
while the utility function for a seller can be defined as US(P (θM ), P (θ)). They could be asymmetric (eg
better to overprice than underprice if I would rather buy than sell the option) given the asymmetry of
the payoff or other aspects, like the current portfolio or views of the trader, or limited risks he is allowed
to undertake. We are defining utility functions at the time the decision is made. We are not considering
the true value of the option as a function of the (still unknown) maturity price or path, but instead as a
function of the inputs driving the underlying since we estimate them at time t.
Since the true value of θ is unknown to us, we have a probability distribution, π(θ) representing our
knowledge/uncertainty about its true value. This measure of uncertainty is assumed to be accurate. To
proceed, we maximize our expected utility given the information available, represented by π(θ). As a
market maker, we do not know a priori whether we are going to be buying or selling the option. Suppose
that with probability p we sell, and with probability 1−p we buy, then our utility function, as a function
of θ is equal to U(P (θM ), P (θ)) = p ∗ US(P (θM ), P (θ)) + (1 − p) ∗ UB(P (θM ), P (θ)), for each possible
value of the true unknown parameter θ. Our target is, therefore, to find the optimal value for θM that
maximizes Eπ[U(P (θM ), P (θ))] with respect to the probability distribution π(θ). The optimal θM varies
depending on our utility function, pricing model P and posterior distribution π.
6

3.2. Utility functions
• 0-1 Utility function When our utility is 1 if P (θM ) = P (true θ), and 0 otherwise, we maximize it
by hitting the true value of the parameters (assuming a one-to-one relationship between parameters
and outputs, which is not necessarily the case). In this case the optimal solution is achieved when
θM = θ, which is our most likely value. The optimal decision would be to value all options using
the most likely set of inputs. Unfortunately, given the unobservability of θ, the utility can not
be quantifiable. Plus, under a continuous θ, we know that we reach the maximized utility with
probability zero, so the operational exercise is futile.
• Market volatility utility function Say we want to become a market-maker only if we have
enough knowledge regarding the market value of the option. Then our utility function could be
written as U((P (θM ), P (θ)) if σP (θ) ≤ threshold, and 0 otherwise. The optimal decision will depend
not on a single input value, but instead on the uncertainty about the potential output values, as, if
the uncertainty is too large, the optimal decision is not to make a market (or make it at a different
spread). The utility is purely based on a measure of the input’s propagated uncertainty, instead of
a single input estimate.
• General utility functions In general, the optimal parameter set would be the one that maximizes
some risk-averse utility function, that is θM = argmaxθEπ[U(P (θM ), P (θ))].
We show an example in Figure 1. We assume a simple quadratic utility function that penalizes diver-
gence of the price we quote, from the true (unknown) value implied by the true (unknown) θ, that is
U(P (θM ), P (θ)) = −[P (θM )−P (θ)]2. Furthermore, our knowledge of θ will be represented through
a gamma density π(θ) ∼ Ga(θ|2, 1). Using Black & Scholes for pricing an at-the-money, 1-period
maturity call, assuming the risk-free rate is equal to zero, and strike price at 1, the pricing function
becomes a simple expression of the volatility parameter θ, namely P (θ) = Φ(θ/2)−Φ(−θ/2), where
Φ is the normal cumulative distribution function. In this case, a maximum of the expected utility
is obtained at P (θM ) around 0.59, which corresponds to argmaxθM
∫
[−[P (θM ) − P (θ)]2] ∗ π(θ)dθ.
This optimal price is neither the price at the expected value of the parameter, P(Eπ(θ)=2)=0.68 nor
the price at its most likely value, P(θ=1)=0.38. The optimal and expected prices are different for
different distributions of (estimates of uncertainty about) the inputs π(θ), therefore, a full measure
of the input uncertainty will affect the optimal option value to use for decision-making purposes.
Parameter uncertainty assessment and propagation to the final output would allow the market-
maker to adjust market valuations according to his own views on the probability of being bid/offer
p and his own views/utility function about the parameter, in a more systematic way. Notice that an
easy extension would be to consider p random and perform the previous integral also over p as well,
according to some probability distribution for this parameter, which would incorporate the market
maker’s uncertainty regarding the side that the counterparty takes. We must incorporate full input
uncertainty into output uncertainty if we are to target optimal decision-making procedures.
7

Figure 1: Expected utility under each call price (curve) using the posterior π(θ) versus call price
and corresponding utility if we were to use the most likely value of the parameter (vertical line).
We must stress that what we are computing probability distributions and credible intervals for the
risk-neutral option value given the information available at each point in time, and not credible intervals
for any actual discounted payoff of that option, which remain stochastic.
4. Likelihood and model equations
Cox et al., (1979) proposed a tree model for valuing options. We propose a new method to calibrate their
model to asses the propagation of uncertainty.
4.1. The Probability Model
We start with the classical binomial model, where the value of the underlying at time t, St, follows
dynamics as defined in Cox et al., (1979):
St+1 = Stξ (4.1)
where ξ is a dichotomic random variable that represents the possible up and downs of the underlying
(only those two moves are assumed possible), and that generates a whole binomial tree, with the following
probability distribution:
ξ =
{
u with probability p
d with probability 1 − p.
where u is the movement of the underlying in the up direction, and d is the movement of the underlying
in the down direction.
8

In practice, ξ is unobservable, and so are the values u and d. However, conditional on u and d, the
value of ξ is specified and a whole binomial tree is specified as well, allowing us to price options. Cali-
bration methods using observed option prices are typically used to obtain the values of u and d implied
by the market under the model.
In most cases, however, options market prices could be unreliable, the options market could be
underdeveloped or simply options price discovery could prove expensive or unfeasible. Additionally, they
include market risk premia, which distorts calculations if the target is the theoretical, risk-neutral value.
Furthermore an options market needs not exist, especially for ad-hoc or client-specific options. In these
cases, calibration is not possible, and the most we should expect is to extract some information about
potential u and d from the historical return series of the underlying, to value an option on it.
Let Ri for i = 1, . . . n be the returns of the underlying over the n periods in our sample, where n could
be, indeed, quite small. In this case we can only attempt to use this model to price options by extracting
u and d from this sample. Therefore what we observe are noisy realizations of ξ, which we denote as
ξi = 1 + Ri = ri. Our aim is to extract from the observed ξi information about the underlying process to
properly value options on that underlying, as well as to account for the uncertainty about that process.
Then one can update the tree in a sequential manner as soon as more realizations of ξ are observed.
The first problem we face is that we cannot assume to know (or estimate without uncertainty) the
value of the u and d with which to generate the binomial tree. Accounting for the level of parameter
uncertainty is vital for proper practical option pricing. This is even more important in the case of unde-
veloped options markets, where spreads tend to be sometimes unreasonably large due to the uncertainty
felt by market makers as not being accounted for in the theoretical (point estimate) values.
Additionally, option uncertainty will reflect a skewed nature, as we will show, so the most likely
price could be quite different from the expected price or even from the optimal price under a certain loss
function (for example drawdown-based loss functions). All these elements lead us to consider computing
not only a calibrated parameters, but the overall uncertainty we have about them.
Assuming that the CRR model is true, we would, therefore, observe n values of ξi that could poten-
tially have been the true value of some underlying ξ generating the process. Additionally, we know that
the no-arbitrage condition must be met, and, therefore, ξi under the down moves must be between 0 and
1 + rf , and ξi under the up moves must be between 1 + rf and ∞. One might have the temptation to
model the ξi as a simple mixture of normals or any other overlapping mixture. This would intrinsically
violate the no-arbitrage condition, as nothing would prevent the ξi under the up moves to be smaller
than the ξi under the down moves. We need a statistical approach that accommodates to the restrictions
(truncation) in the pricing model for the up and down returns.
In summary, if we want to extract the information contained in the series ξi about the generating
process of an underlying, and additionally we assume the CRR pricing mechanisms are proper for pricing
this underlying, a natural choice would be a mixture of non-overlapping (truncated) densities for the up
and down moves. We consider the simplest of these mixtures in our formulation, that is the mixture of
Truncated Normal densities. For simplicity, we also assume that the generating process is constant in
time, although this assumption could easily be relaxed.
9

Our choice for a parametric formulation, as opposed to, for example, Monte-Carlo/bootstrap-based
methods, is that the observed range of data could easily be much more narrow than the potential range,
leading to underestimation of the tails/extreme values that could eventually happen. This is of key
importance when the pricing tools are applied to risk management, as measures like VaR and expected
shortfall would be heavily affected by a correct accounting for potential extreme values.
Our goal, therefore, is to update our knowledge of some unknown potential value of ξ that describes
the future moves of the underlying (and the corresponding option prices), but accounting for the inherent
uncertainty and variability of ξ.
4.2. Risk neutral measure for the CRR model
Given a ξ, that is, given a value of both u and d, we can generate a whole binomial tree, and in order to
rule out arbitrage and under the condition of market equilibrium in any node of the tree, the expected
value of the underlying at the end of a given node t in the binomial tree is Eq [St+1|Ft] = St(1 + rf ),
where St is the underlying price at the beginning of the node t, and Eq denotes expected value with
respect to the risk neutral measure q. In our model, this last condition is formalized as:
St(1 + rf ) = qStu + (1 − q)Std (4.2)
solving for q yields:
q =(1 + rf ) − d
u − d(4.3)
4.3. Description of other classical methods
In this section we present alternative methods to ours. In the next section we present our method. Both
of the alternative methods we describe aim at reconstructing the probabilistic nature of a recombinant
tree describing the dynamics of the underlying from the observed option prices.
• Rubinstein’s method It is based on the following natural assumptions:
1. The underlying asset follows a binomial process.
2. The binomial tree is recombinant.
3. Ending nodal values are ordered from lowest to highest.
4. The interest rate is constant.
5. All paths leading to the same ending node have the same probability.
Once the probabilities and returns of the final nodes are established, the recombinant nature of
the binomial tree plus the non-arbitrage condition, are used to inductively obtain the probabilities
of arrival at the previous set of nodes along the tree as well as the returns at these nodes.
10

The implied posterior node probabilities are obtained solving the following quadratic program:
min{
n∑
i=1
(qi − q′i)2 | (q1, ...qn) ∈ C},
where C is the following set of constraints:
(i) qi ≥ 0,∑
qj = 1,
(ii) Sb ≤∑
qjSj/(1 + rf )n ≤ Sa,
(iii)P (θ)bi ≤
∑
qj(Sj − Ki)+ ≤ P (θ)a
i , i = 1, ..., m.
Here Sa, Sb are respectively the current ask and bid prices of the underlying asset. P (θ)ai and
P (θ)bi are the prices of the European calls on the assets with strike prices Ki for i = 1, ..., m. The
Sj are the end nodal prices and the q′j are some prior set of risk neutral probabilities associated
with the given tree.
• Derman and Kani’s procedure
Their aim is to understand how the underlying must evolve in such a way that the prices of the
European calls and puts coincide with the market prices for the different strike prices.
The method ends up with the construction of a recombinant tree for which the up and down shifts
and the transition probabilities may change from node to node at each time lapse.
If the prices at the nodes at time tn have been reconstructed, they propose the following routine
for reconstructing the prices at time tn+1 as well as the transition probabilities out of each node
at time tn.
If si is the stock price at the i-th node at time tn, then the end-prices at time tn+1 are Si+1 > Si
and the probabilities Pi of such a move are reconstructed from a risk neutral requirement and a
matching of the option price at time tn+1 as if strike price were si.
This procedure provides 2n equations of the 2n + 1 needed to for for determining the n + 1 prices
and the n transition probability. They propose a centering condition, to make the center coincide
with the center of the standard CRR tree, to close the system of equations.
In both methods outlined above, one ends up with a recombinant tree, describing the dynamics of an
underlying in which the prices and/or transition probabilities may change from time to time and from
node to node. Once the tree is at hand, one may carry out the computation of all quantities of interest.
In our approach, the historical record of up and down prices of the underlying is used to update a
standard binomial tree describing the time evolution of the asset, except that what we have is a whole
collection of trees, each occurring with a posterior probability. For each of these trees, we can compute
whatever we want, for example the price of a European call, except that each of these values has a
posterior probability of occurrence.
4.4. The Statistical Modelling and Estimation
For the purpose of our estimation, we assume that we observe independent, equally-spaced realizations
of ξi from the past. Then the joint likelihood is just but the product of n independent realizations:
L(ξ1, ..., ξn|u∗, σ2
u, d∗, σ2d, p) =
n
Πi=1
(
pTN(ξi|u∗, σ2
u, 1 + rf , +∞) + (1 − p)TN(ξi|d∗, σ2
d, 0, 1 + rf ))
11
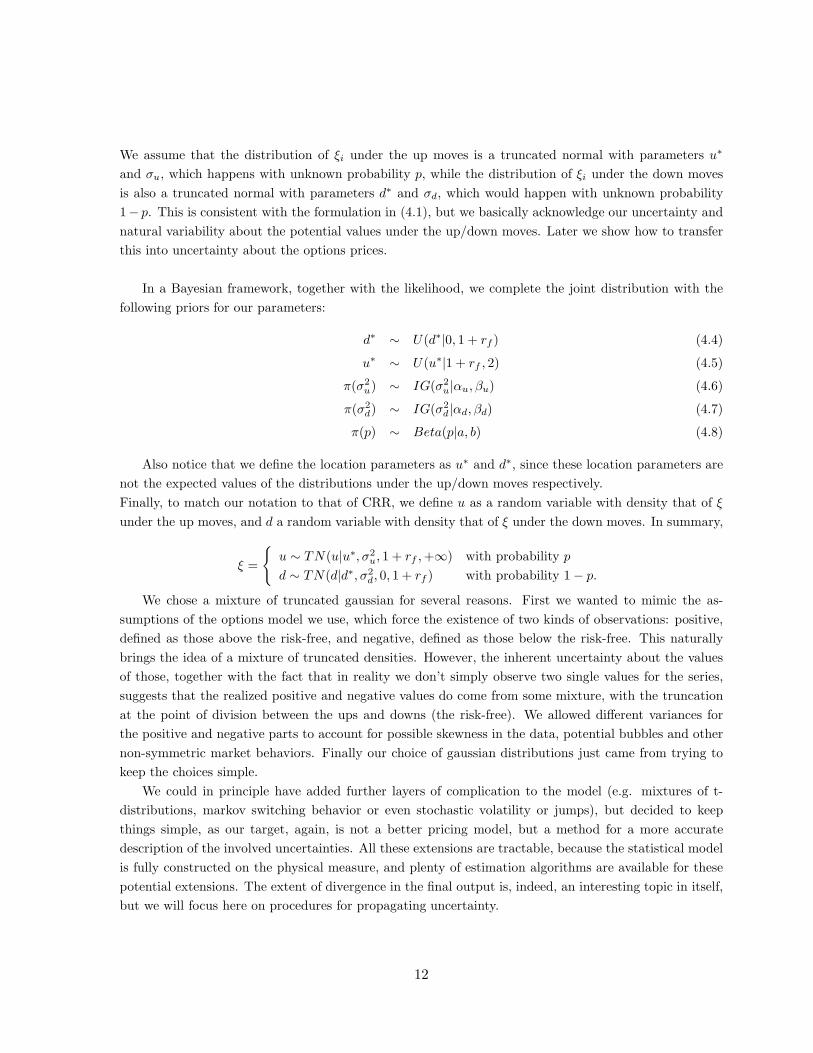
We assume that the distribution of ξi under the up moves is a truncated normal with parameters u∗
and σu, which happens with unknown probability p, while the distribution of ξi under the down moves
is also a truncated normal with parameters d∗ and σd, which would happen with unknown probability
1− p. This is consistent with the formulation in (4.1), but we basically acknowledge our uncertainty and
natural variability about the potential values under the up/down moves. Later we show how to transfer
this into uncertainty about the options prices.
In a Bayesian framework, together with the likelihood, we complete the joint distribution with the
following priors for our parameters:
d∗ ∼ U(d∗|0, 1 + rf ) (4.4)
u∗ ∼ U(u∗|1 + rf , 2) (4.5)
π(σ2u) ∼ IG(σ2
u|αu, βu) (4.6)
π(σ2d) ∼ IG(σ2
d|αd, βd) (4.7)
π(p) ∼ Beta(p|a, b) (4.8)
Also notice that we define the location parameters as u∗ and d∗, since these location parameters are
not the expected values of the distributions under the up/down moves respectively.
Finally, to match our notation to that of CRR, we define u as a random variable with density that of ξ
under the up moves, and d a random variable with density that of ξ under the down moves. In summary,
ξ =
{
u ∼ TN(u|u∗, σ2u, 1 + rf , +∞) with probability p
d ∼ TN(d|d∗, σ2d, 0, 1 + rf ) with probability 1 − p.
We chose a mixture of truncated gaussian for several reasons. First we wanted to mimic the as-
sumptions of the options model we use, which force the existence of two kinds of observations: positive,
defined as those above the risk-free, and negative, defined as those below the risk-free. This naturally
brings the idea of a mixture of truncated densities. However, the inherent uncertainty about the values
of those, together with the fact that in reality we don’t simply observe two single values for the series,
suggests that the realized positive and negative values do come from some mixture, with the truncation
at the point of division between the ups and downs (the risk-free). We allowed different variances for
the positive and negative parts to account for possible skewness in the data, potential bubbles and other
non-symmetric market behaviors. Finally our choice of gaussian distributions just came from trying to
keep the choices simple.
We could in principle have added further layers of complication to the model (e.g. mixtures of t-
distributions, markov switching behavior or even stochastic volatility or jumps), but decided to keep
things simple, as our target, again, is not a better pricing model, but a method for a more accurate
description of the involved uncertainties. All these extensions are tractable, because the statistical model
is fully constructed on the physical measure, and plenty of estimation algorithms are available for these
potential extensions. The extent of divergence in the final output is, indeed, an interesting topic in itself,
but we will focus here on procedures for propagating uncertainty.
12

It is worth noting that this truncated normal approach becomes a single gaussian distribution in the
limit (as u∗ gets close to d∗, and both to 1 + rf , p gets close to 0.5 and σu gets close to σd). Also we can
see that as σu and σd get close to zero, the model is equivalent to the original CRR framework, as we
have two point masses at u∗ and d∗.
We use a Markov Chain Monte Carlo (MCMC) approach to estimate the parameters in the model.
Details of the actual algorithm are outlined in the Appendix.
4.5. Monte Carlo use of the MCMC output
In the following subsections, we present three alternative methods for calibration that we shall refer to
as the θ method, the ξ method and the expected ξ method. This names will become clear in the next
subsections.
4.5.1. The θ method
The approach described in the previous section allows us to assess the level of uncertainty in the inputs
of the option pricing formula. Our posterior distribution for the parameters θ = [u∗, d∗, σ2u, σ2
d] given the
data represents our uncertainty about the parameters driving the dynamics of the underlying, where each
combination of values has associated a certain likelihood under the posterior distribution.
The next step is to use those values to generate possible option prices. A Monte Carlo approach suffices
here to propagate the uncertainty of the inputs into uncertainty about the outputs (option prices). The
idea is to draw random samples from the posterior distribution, generate potential up and down moves,
and pass them to the option pricing formula to obtain (random) possible outputs. This will effectively
provide us with the posterior distribution of the option prices given the data.
In our problem, what we are trying to compute is the following double integral, where data={
u1, ..., ul, d1, ..., dk}
,
where l + k = n, and since P (ξ) only depends on (u, d), it is independent of θ given ξ = (u, d):
P |data =
∫
Θ
[∫
Ξ
P (ξ)f(ξ|θ)dξ
]
π(θ|Data)dθ
P |data =
∫
Θ
Eξ|θ [P (ξ)] π(θ|Data)dθ
where P |data is the risk neutral price conditional on the data available and averaged over all the
values of θ. The quantity Eξ|θ [P (ξ)] is a function of θ, averaged over the different ξ|θ. We refer to
Eξ|θ [P (ξ)] as the option price given θ. Therefore, we need to integrate out θ from every Eξ|θ [P (ξ)] by
integrating Eξ|θ [P (ξ)] with respect to the posterior of θ. The pseudo-code for the Monte Carlo part of
this first method is comprised by the following steps:
1. Draw (uniformly) a sample from the MCMC output θi = {u∗, d∗, σ2u, σ2
d}.
2. From θi, generate a sequence {(ui, di)}M
i=1 of possible values for u and d using f(ξ|θ).
13

3. Use these values of ui and di to generate qi from equation (4.3) and the corresponding ξi:
ξi =
{
ui with probability qi
di with probability 1− qi
Compute {P (ξi)}M
i=1 which is a sequence of binomial trees for that given θ.
4. Go back to step 1 and repeat L times in order to generate a set of averages.
5. If we want a single price P |data, then average these averages.
4.5.2. The ξ method
Here we draw random samples from the posterior distribution of u∗, d∗, σ2u, σ2
d, generate potential up and
down moves through ξ, and pass them to the option pricing formula to obtain (random) possible outputs.
This will effectively provide us with the posterior distribution of the option prices given the data. There
are two possible outcomes that we are interested in. First we are interested in the overall distribution
of the option price given the data, as we motivated in subsection 2.3. and section 3. In this case, we
need to draw a sequence of θi form the posterior distribution π(θ|data) in order to generate as many
Monte Carlo samples from f(ξ|θ). Finally, since we do not know analytically the predictive marginal
posterior distribution f(ξ|data), we need to partition the values of u and d into many bins and compute
the proportion of ξ’s falling in each bin. The option price is computed by solving the following double
integral:
P |data =
∫
Θ
[∫
Ξ
P (ξ)f(ξ|θ)dξ
]
π(θ|data)dθ
P |data =
∫
Ξ
P (ξ)
[∫
Θ
f(ξ|θ)π(θ|data)dθ
]
dξ
P |data =
∫
Ξ
P (ξ)π(ξ|data)dξ
where θ ≡ [u∗, d∗, σ2u, σ2
d], P (ξ) is the option price generated by a tree given ξ = (d, u). Given that we do
not know analytically π(ξ|data), we can approximate it by generating a sequence {ξi}L
i=1 for L big enough,
and construct M bins with center ξk = (uk, dk) in order to approximate f(ξ|data) ≈∑M
k=1 pξkδξk , where
pξkis computed as the number of elements1 in {ξi}
L
i=1 that fall in the k-th bin with center ξk.
We now propose a pseudo-code for the Monte Carlo that is comprised by the following steps:
1. Draw (uniformly) a sample from the MCMC output θi = [u∗, d∗, σ2u, σ2
d].
2. Generate M possible values for ξ = (u, d), given θ = [u∗, d∗, σ2u, σ2
d], using f(ξ|θi).
3. Iterate many times steps 1 and 2 in order to generate a sequence {ξi}L
i=1.
4. Use {ξi}L
i=1 generated in steps 1 through 3 to approximate π(ξ|data) ≈∑M
k=1 pξδξ with the use of
bins.
1δξk is the Dirac delta function.
14

11.002
1.0041.006
1.0081.01
1.012 1.014
xi_up0.988
0.99
0.992
0.994
0.996
0.998
1
xi_down
00.0
005
0.001
0.001
5f(x
i|data
)
Figure 2: Posterior probability distribution for ξ given the data using the ξ method.
5. Sample ξi = (ui, di) with probability given by π(ξi|data) for i = 1, ..., L computed in the previous
step, and construct its associated tree given by:
ξi =
{
ui with probability qi
di with probability 1− qi
ξi generates a binomial trees that allows us to compute an option value unconditional of θ.
It is worthwhile noticing that the posterior distribution π(ξi|data) quantifies model uncertainty regarding
the space of all available tree models for the underlying. Indeed, each ξi parameterizes a whole tree model
which has its associated probability given by π(ξi|data) (Cont, R. (2006)). The posterior probability
distribution of each model is given in figure 2. As the amount of data increases, the posterior distribution
π(ξ|data) becomes tighter as can be seen in figure 3.
15

11.002 1.004 1.006 1.008 1.01 1.012 1.014
xi_up0.988
0.99
0.992
0.994
0.996
0.998
1
xi_down
00.
0005
0.00
10.
0015
f(xi|d
ata)
11.002 1.004 1.006 1.008 1.01 1.012 1.014
xi_up0.988
0.99
0.992
0.994
0.996
0.998
1
xi_down
00.
0005
0.00
10.
0015
f(xi|d
ata)
11.002 1.004 1.006 1.008 1.01 1.012 1.014
xi_up0.988
0.99
0.992
0.994
0.996
0.998
1
xi_down
00.
0005
0.00
10.
0015
f(xi|d
ata)
11.002 1.004 1.006 1.008 1.01 1.012 1.014
xi_up0.988
0.99
0.992
0.994
0.996
0.998
1
xi_down
00.
0005
0.00
10.
0015
f(xi|d
ata)
11.002 1.004 1.006 1.008 1.01 1.012 1.014
xi_up0.988
0.99
0.992
0.994
0.996
0.998
1
xi_down
00.
0005
0.00
10.
0015
f(xi|d
ata)
11.002 1.004 1.006 1.008 1.01 1.012 1.014
xi_up0.988
0.99
0.992
0.994
0.996
0.998
1
xi_down
00.
0005
0.00
10.
0015
f(xi|d
ata)
Figure 3: Posterior probability distribution for ξ given the data using the ξ method. Plots are
for 252, 126, 65, 21, 15 and 10 business days from left to right, top to bottom, respectively.
4.5.3. The expected ξ method
In this subsection we present the third and last method that consists of using the expected value of ξ as
inputs for the tree model. The idea behind this derivation can be found in Cox et al., (1979), where u and
d are known with probability one. However, as these are model parameters, they can only be partially
16

observed together with some noise. Therefore, it is the expected value of u and d and not their realization
which is the quantity of interest under this last approach. What is therefore observable is u = E(u) + ǫ1
and d = E(d) + ǫ2, where ǫ1, and ǫ2 are normally distributed random variables. The idea of this method
is to propagate the uncertainty of the parameters [u∗, d∗, σ2u, σ2
d] through both E(u) and E(d) as inputs
for the tree model. This method can be seen similar to the Bootstrapped Mean method (BM) that will
be described in section 5.2. The expected ξ method method accounts for parameter uncertainty, whereas
the Bootstrap mean method does not, even so for small sample sizes.
The option price is computed by solving the following integral:
P |data =
∫
Θ
P[
Eξ|θ(ξ)]
π(θ|data)dθ
P |data =
∫
Θ
P
[∫
Ξ
ξf(ξ|θ)dξ
]
π(θ|data)dθ
We now describe the following pseudo-code for the Monte Carlo:
1. Draw (uniformly) a sample from the MCMC output. The sample is a vector of parameters θ =
[u∗, d∗, σ2u, σ2
d].
2. Given θ = [u∗, d∗, σ2u, σ2
d], compute the following moments2:
E(u) = u∗ + σu
φ(c0)
1 − Φ(c0)(4.9)
E(d) = d∗ − σd
φ(b0) − φ(a0)
Φ(b0) − Φ(a0)(4.10)
3. Compute the expected value of ξ
E(ξ) =
{
E(u) with probability q
E(d) with probability 1 − q.
4. Compute P [E(ξ)]
5. Go to step 1 and repeat many times.
Here c0 =1+rf−u∗
σu, a0 = 0−d∗
σd, b0 =
1+rf−d∗
σd, φ is the standard normal density and Φ is the standard
normal cdf. The risk neutral probability q is equal to:
q =1 + rf −
[
d∗ − σdφ(b0)−φ(a0)Φ(b0)−Φ(a0)
]
u∗ + σuφ(c0)
1−Φ(c0) −(
d∗ − σdφ(b0)−φ(a0)Φ(b0)−Φ(a0)
) (4.11)
5. Empirical results
5.1. S&P500 Application
We apply the three methodologies from the previous section to determine the uncertainty in the price
of call options3 for the S&P500 for a period of 1993. We use this simple example, for which pricing
2Given that u ∼ TN(u|u∗, σ2
u, 1 + rf , +∞) and d ∼ TN(d|d∗, σ2
d, 0, 1 + rf )3USD LIBOR is used as the risk-free interest rate as suggested by Bliss and Panigirtzoglou (2004).
17

8 10 12 14 16
0.00.2
0.40.6
0.8Call Posterior distribution
Call Price (T=118, K=450, P=449.81, rf=1.3%)
Poste
rior dis
tributio
n
Figure 4: Posterior density (histogram) under the θ method and market price (triangle) for a
call price for July 1st, 1993.
has become simple and almost automatic, to show the actual uncertainty we have about the call prices
due to uncertainty about the pricing tool inputs. Again, we must stress that our target in this paper
is not to propose a better pricing tool, but instead to show the effects of the uncertainty in inputs into
option pricing, and to show an example of how to propagate that uncertainty for a simple and well-known
tree-based model.
Our data consists of daily returns for the S&P500 index, from the years 1992 and 1993. We will use, at
time t, the returns of the previous 252 business days, to estimate the parameters u∗, d∗, σ2u, σ2
d, using the
procedures outlined in section 4.5. We show summaries of the convergence of the Markov Chains in the
Appendix.
We use the posterior distribution of the parameters, together with the underlying price at that time St
and for a strike of constant K = 450 to price an European call option with maturity on Friday, December
17th, 1993.
18

0 5 10 15 20 25 30
0.00.0
20.0
40.0
60.0
8Call Posterior distribution
Call Price (T=118, K=450, P=449.81, rf=1.3%)
Poste
rior dis
tributio
n
Figure 5: Posterior density (histogram) under the ξ method and market price (triangle) for a
call price for July 1st, 1993.
Figures 4, 5, and 6 show the posterior distribution for the theoretical call value on July 1st, 1993
under the three methods. The triangle represents the actual market price of the option. There are three
features that are worth noting. First, we can clearly see that the posterior distribution from figure 5 is
far from concentrated, which is not the case for figures 4 and 6. The three figures reflect the uncertainty
about the inputs and how this propagates into uncertainty about the call price output. Second, they
show that the call price is skewed, as also observed by Karolyi (1993). This shows us that even the
most likely value of the actual output is not necessarily the most representative one. Under the three
methods we obtain similar results with different levels of uncertainty as shown in table 1. Third, we
should note that this valuation is still being done under a risk-neutral approach, so the actual call market
price is (much) larger than one would expect under risk neutrality. This by no means invalidates the
risk-neutral approach, but allows us a better perception and even quantification of the extent of the risk
premia in the market as well as empirically the considerable overpricing (underpricing) of in-the-money
(out-of-the-money) options (MacBeth and Merville (1979), Rubinstein (1985)). Our work differs from
Karolyi (1993) since our bayesian analysis is performed for a greater class of stochastic processes as limits
in continuous time, than the classical geometric brownian motion as treated in Karolyi (1993), which is
19

8 10 12 14 16
0.00.2
0.40.6
0.8Call Posterior distribution
Call Price (T=118, K=450, P=449.81, rf=1.3%)
Poste
rior dis
tributio
n
Figure 6: Posterior density (histogram) under the expected ξ method and market price (triangle)
for a call price for July 1st, 1993.
a special case.
The top-left plot in figures 7, , and represent the call market prices (points) as we move closer to
maturity (vertical line). The x-axis represents time, and as we move towards the right we get closer to
the maturity date of that call. The two lines represent the 0.5% and 99.5% percentiles for the posterior
distribution of the call prices, at each point in time. We have run the MCMC analysis on a rolling basis
for the three methods based on the information available until each time point, computing the Monte
Carlo-based percentiles for each posterior sample, and those lines represent the 99% credible intervals for
the call prices for each period until maturity. Several interesting things can be extracted from these plots:
First, we can see that the range of the 99% credible interval gets narrower as we get closer to ma-
turity. We can see this more clearly in the top-right plot, where we see that range size over time. We
20

•
•
••
••••
•
••••
••
••••
••••
•••••
••
•••
•
••
•
•
••
••
••
•
•
•••
••
••••••
••••
•
•
••
•
••
•
••
••
•
•
•
•
•
•••
••••
•••
••
•
•
Call 99% C.I. (lines) versus market call price (points)
Period
call pr
ice
0 20 40 60 80
05
1015
20
•••
•••
•
•••••
•••••
•••••••
•••
•
•••••
•
••••
••
••••
•
•
•
••••••••••
•••
•
•••••
••
•••••
••••
•
•••••
•••••••••
Call 99% C.I. width
Period
Credib
le inte
rval w
idth
0 20 40 60 80
0.00.5
1.01.5
2.02.5
3.0
•
•
••
•••
•
•
••••
•
•
•
•
••
••
••
•
••
••
•
•
•••
•
••
•
•
•
•
••
••
•
•
•
••
••
••
••••
••
••
•
•
••
•
••
•
••
••
•
•
•
•
•
•
••••
•
•
•••
••
•
•
Underlying, Strike (points, line)
Period
Price
0 20 40 60 80
445450
455460
465470
••
•
•
•••
••
••
•••••
•
••••
•
•
•••
•••
•••••••
•
•
•
•
•
••
••
•
•
•
•••
•
•
••
••
••
••
••
•
•
•
••
•
•
•
•
•
•
••
•
•
•
••••
•
•••
•
••
••
Market price minus mean, q_0.99 (points, line)
Period
Call R
isk Pr
emium
0 20 40 60 80
01
23
45
6
Figure 7: 99% credible interval and market call prices (top-left), 99% credible interval range
(top-right), underlying level and strike (bottom-left) and estimates of risk premium (bottom-
right) under the expected θ method
should expect to be more certain about where the call price should be as we get closer to maturity, since
any uncertainty we might have about the inputs will have a smaller impact. This is more evident for
smooth payoffs, where small differences in the inputs only become large differences in payoffs if there is
a long time to maturity. The overall extent of the input uncertainty will be a function of time, so this
methodology is specially suitable for options with longer maturities.
Second, we can see the gap between the credible interval and the actual market price. This gap,
which represents the risk premium for the call in the market, gets smaller as we get closer to maturity.
The markets are adding a larger nominal spread for larger maturities, which is reasonable, since larger
maturity implies larger uncertainty and larger risks associated with the instrument. We can see this more
clearly in the bottom-right plot, where we see the risk premium over time, expressed as market call price
minus expected call price under the posterior (points) or market call price minus 99% percentile under
the posterior (line). In all three cases, as we get closer to maturity, the risk premium goes to zero.
Third, we can see that whenever there is a jump in the underlying, a strong movement in the market,
the risk premium tends to increase. The bottom-left plot represents the underlying (points) versus the
21

•
•
••
••••
•
••••
••••••
•••••••••
••••
•
•
••
•
•
••
••
••
•
•
•••
••
••••••
••••
•
•
••
•
••
•
••
••
••
•
•
•
•••
••••
•••
••
•
•
Call 99% C.I. (lines) versus market call price (points)
Period
call pr
ice
0 20 40 60 80
05
1015
2025
30
••
••
•••••••••
•
•••••
••••
•••••
•••••
•
••••••
•••••
•
•
••
••••••
••••••
•••••
••
•••••
••••
•
••••
••••••••••
Call 99% C.I. width
Period
Credib
le inte
rval w
idth
0 20 40 60 80
05
1015
2025
•
•
••
•••
•
•
••••
•
•
•
•
••
••
••
•
••
••
•
•
•••
•
••
•
•
•
•
••
••
•
•
•
••
••
••
••••
••
••
•
•
••
•
••
•
••
••
•
•
•
•
•
•
••••
•
•
•••
••
•
•
Underlying, Strike (points, line)
Period
Price
0 20 40 60 80
445450
455460
465470
••
•••••
••••
••••••••••
•••••
••••••••••
•••••••
••
•
•••••
••••••
••••
•••••
••
•••••
•••
•
•
•••••
•••••
••••
Market price minus mean, q_0.99 (points, line)
Period
Call R
isk Pr
emium
0 20 40 60 80
−10−5
05
Figure 8: 99% credible interval and market call prices (top-left), 99% credible interval range
(top-right), underlying level and strike (bottom-left) and estimates of risk premium (bottom-
right) under the ξ method
strike (line). For example, we can see that there is a strong price movement on the 42nd point. The
underlying falls rapidly, and at the same time, we can see in the top left plot how both the market call
price and the credible interval move accordingly. What is more interesting is the behavior of these during
this period. First, we can see that the credible interval has a wider range at that point (top-left plot),
showing a larger uncertainty about the true call price. Second, we can see that the actual market risk
premium increases in figures 7 and 9 (bottom-right plot) showing that the market not only repriced the
call by shifting its value down, but it did it in such a way that the actual premium increased.
Fourth, from figure 3, we observe that parameter uncertainty because of lack of data means higher
option prices.
We only need to run one MCMC analysis per instrument and time period. The MCMC algorithm can
be partitioned and parallelized, as we mention in the appendix. However, the major advantage comes
from the Monte Carlo step, where we can indeed fully parallelize the algorithm to compute the (iid)
Monte Carlo samples. This is especially useful if there were time constraints in the pricing and/or the
pricing algorithm was slow. In any case, the level of precision required will be the determining factor of
22

•
•
••
••••
•
••••
••
••••
••••
•••••
••
•••
•
••
•
•
••
••
••
•
•
•••
••
••••••
••••
•
•
••
•
••
•
••
••
•
•
•
•
•
•••
••••
•••
••
•
•
Call 99% C.I. (lines) versus market call price (points)
Period
call pr
ice
0 20 40 60 80
05
1015
20
••
••
••
•
•••
••
•
•
•
•
•••
•••••
••••
•
•
•
•
•
•
••••••
••••
•••
••
••••
••••
••
••
•
•
•••
••
•
••
••••
••
•
•••••
•••••••••
Call 99% C.I. width
Period
Credib
le inte
rval w
idth
0 20 40 60 80
0.00.5
1.01.5
2.02.5
3.0
•
•
••
•••
•
•
••••
•
•
•
•
••
••
••
•
••
••
•
•
•••
•
••
•
•
•
•
••
••
•
•
•
••
••
••
••••
••
••
•
•
••
•
••
•
••
••
•
•
•
•
•
•
••••
•
•
•••
••
•
•
Underlying, Strike (points, line)
Period
Price
0 20 40 60 80
445450
455460
465470
•
•
•
•
•••
••
••
•••••
•
••••
•
•
•••
•••
••••
•••
•
••
•
•
••
••
•
••
•••
•
•
••
••
••
••
••
•
•
•
••
•
•
•
•
•
•
••
•
•
•
••••
•
•••
•
••
••
Market price minus mean, q_0.99 (points, line)
Period
Call R
isk Pr
emium
0 20 40 60 80
01
23
45
6
Figure 9: 99% credible interval and market call prices (top-left), 99% credible interval range
(top-right), underlying level and strike (bottom-left) and estimates of risk premium (bottom-
right) under the expected ξ method
the actual speed of the algorithm. In our example, it took a few seconds to run each MCMC step, and
the major computational cost came from the Monte Carlo step for options with very long maturities, as
it takes longer to price the tree. Still the algorithm is quite tractable and simple to code, and we feel the
additional computational burden is very limited compared to the additional information it provides. Of
course, for closed-form pricing models, these steps are even more trivial and quick to construct.
5.2. Comparison with naıve calibration methods
This section includes a comparison between the three bayesian parametric results from the mixture model
proposed and several possible naive calibration approaches that practitioners might consider. We again
use the S&P500 data in a rolling fashion as we did in the previous example, and will assume that there
is no options market.
The naive calibration procedures we consider are as follows:
• Sample Means (SM): For each (rolling) sample of returns that we use for calibration of the models,
we take the sample mean of the returns larger/smaller than the libor, which will be our up/down
moves. This provides a point estimate of the theoretical value of the option, without a confidence
23

region to account for errors around it.
• Bootstrapped means (BM): For each (rolling) sample of returns that we use for calibration of the
models, we take random samples (with replacement) of the observed data, with sample lengths
equal to the number of up/down returns observed in the original (rolling) sample. For each sample
we compute the up/down means. We take 5000 such pairs of means and compute the corresponding
call prices (on a rolling basis). This provides us with (rolling) confidence regions.
• Bootstrapped values (BV ): For each (rolling) sample of returns that we use for calibration of the
models, we take random samples of length 1 of the up and down returns. We take 5000 such pairs
of random data points and compute the corresponding call prices (on a rolling basis). This provides
us with (rolling) confidence regions.
Plots 10, 11, and 12 contain the 99% bayesian credible interval as well as each of the bootstrapped
equivalent confidence intervals. We perform the analysis in a similar rolling fashion (with 252 business
days of rolling data) as we did in the previous subsection.
The points represent the calibrated values under the SM method. Notice that those values will account
for variability in the final payoff (through the trees), but not for parameter uncertainty. We show in Table
1 that these point estimates are very close to those under the bayesian parametric approach. Indeed,
in terms of interval width and mean values, the ξ method and the BV are similar. The same similarity
applies to the θ and the expected ξ methods compared to the BM method.
The dotted line represents the 99% confidence interval based on the BM method. The confidence inter-
vals are clearly very narrow.
The thin continuous line represents the 99% bayesian credible interval, while the thick line represents the
equivalent under the BV method. We can see that the results are in this case quite close. In any case
all methods converge as we approach maturity, and the option theoretical value is more certain.
There are several reasons that explain why we should use the Bayesian approach in this paper instead
of using the bootstrapping one:
• A bootstrapping approach would suffer under low sample sizes. For example, under a 1-period
maturity and a sample of n points, there are at most n possible call prices. As n gets smaller, this
would hinder the ability to create bootstrapped intervals. The estimation of the tail of the call
price distribution would be quite unreliable. For example, the 1% and 5% quantiles for the call
price would be equal under a sample size of n = 20.
24

•
Call 99% C.I. for all calibration methods
Period
call pr
ice
0 20 40 60 80
05
1015
2025
30
•
•
••
••••
•••••
•
•••
••••
••
•••
••
•••••
•
••
•
•
••
••
••
•
•
•••
••••
••••
••
••
•
•
••
•
••
•
••
••
•
•
•
•
•
•
••••
•
•
•••
••
•
•
Figure 10: 99% intervals for the Bootstrapped values approach (thick line), bayesian approach
(thin line), bootstrapped means (dashed) and the sample means calibrated estimates (points)
under the θ method.
Table 1: Summary of results for the S&P500 for different calibration methods
ξ Method θ Method Expected ξ Method SM BM BV
Mean 12.04 12.52 12.04 12.06 12.06 11.54
Median 12.46 12.62 12.46 12.22 12.27 12.30
99% Range width 12.49 1.17 1.25 0.00 1.30 13.57
Means, medians, and 99% range for the call prices on the S&P500 data. All values are averages
over Monte Carlo samples and over maturities.
• A bootstrapping approach would suffer from outliers under low sample sizes more than a parametric
approach, that would be more flexible to model/identify them. For example, we proposed a gaussian
mixture, but non-gaussian approaches would be possible, like mixtures of t-distributions, that would
account for outliers. A small sample size with 1 outlier could heavily bias confidence intervals under
the bootstrapping approach. A parametric approach allows to incorporate and impose the expected
shape of the population, as opposed to the sample shape.
• If we have a large enough iid sample, the bootstrapping approach and our approach provide quite
25

•
Call 99% C.I. for all calibration methods
Period
call pr
ice
0 20 40 60 80
05
1015
2025
30
•
•
••
••••
•••••
•
•••
••••
••
•••
••
•••••
•
••
•
•
••
••
••
•
•
•••
••••
••••
••
••
•
•
••
•
••
•
••
••
•
•
•
•
•
•
••••
•
•
•••
••
•
•
Figure 11: 99% intervals for the Bootstrapped values approach (thick line), bayesian approach
(thin line), bootstrapped means (dashed) and the sample means calibrated estimates (points)
under the ξ method.
similar results, as long as we correctly represent the population.
• If the data is not iid, we can have more flexible parametric approaches (markov switching, stochastic
volatility), which could not possible under the bootstrapping method.
• The use of a bayesian approach (parametric and/or nonparametric) is more appealing when in
presence of low sample sizes, and where prior process or parameter knowledge can be incorporated
into the analysis.
• Simple variations would allow parameter learning, which would be of special relevance on overly-
trending markets. For example, if we assumed a common variance in the up/down moves, having a
small sample of down moves would be a problem under the bootstrap approach, whereas it would
not be a problem under the parametric setting, as it would learn from the distribution of the
positives about the variability of the negatives.
The use of a bayesian parametric approach to propagate uncertainty is justified, therefore, not only by its
ability to mimic benchmarks in simple cases, but also adjust to situations when the bootstrapping fails.
26

•
Call 99% C.I. for all calibration methods
Period
call pr
ice
0 20 40 60 80
05
1015
2025
30
•
•
••
••••
•••••
•
•••
••••
••
•••
••
•••••
•
••
•
•
••
••
••
•
•
•••
••••
••••
••
••
•
•
••
•
••
•
••
••
•
•
•
•
•
•
••••
•
•
•••
••
•
•
Figure 12: 99% intervals for the Bootstrapped values approach (thick line), bayesian approach
(thin line), bootstrapped means (dashed) and the sample means calibrated estimates (points)
under the expected ξ method.
6. Other potential applications
6.1. Application to instruments without an options market
We have provided a method that utilizes the data available about some instrument and linked that data
to the parameters of the option pricing formula through a statistical model. We then have proceeded
to estimate these parameters and pass the uncertainty about them, through the pricing formula, into
uncertainty about the outputs. It is worth noting that at no point we needed to use implied or options
market prices to do this. Therefore, this method has a very natural use in pricing of instruments for
which there is not an options market defined, and for which calibration-based methods that use options
prices fail to provide an answer (Rubinstein, M. (1994)). This is the case for most real options (Mun,
J. (2005)), as well as client-specific options for which we might want to make a market or anything else
where limited data is available.
27

6 8 10 12 14
0.00.2
0.40.6
0.8Call posterior vs Bootstrapped Means density
Call price (T=118, K=450, P=449.81, rf=1.3%)
Densi
ty
Figure 13: Posterior distribution for a call price (histogram) versus the density estimate based
on bootstrapping means from the sample (BM calibration), both based on 5,000 Monte Carlo
samples. θ method.
6.2. Potential applications and extensions
When managing a portfolio of options, it is of great importance to compute and track the Value-at-Risk
(VaR) which tells us that with a certainty of α percent, we will not lose more than X dollars in the next N
days (Hull, J. 2006). Since derivatives are non-linear instruments, one needs to map the option position
into an equivalent cash position in its underlying in order to then proceed to compute the VaR. In our
framework, the VaR is the percentile of the
Option prices depend on the parameter ξ. Therefore, once ξ is known one can compute the option
price P (ξ). Furthermore, one can generate the price distribution of the option with one of the three
methods described above. α is the confidence level and percentile of the profit and loss distribution
of the derivative that one can choose (usually equal to 0.95). As we notice, the risk measures such as
the VaR will depend on parameters (just as we saw with option theoretical values) that we will have
to estimate. We therefore need to integrate the VaR (and any other coherent risk measure such as the
Expected Shortfall) analytically or numerically with respect to the posterior distribution of π(ξ|data)
given the data and current information set. The same analysis applies to other coherent risk measures.
The VaR will be influenced by the uncertainty through the posterior distribution of the model parameter
28

0 5 10 15 20 25 30
0.00.2
0.40.6
0.8Call posterior vs Bootstrapped Means density
Call price (T=118, K=450, P=449.81, rf=1.3%)
Densi
ty
Figure 14: Posterior distribution for a call price (histogram) versus the density estimate based
on bootstrapping means from the sample (BM calibration), both based on 5,000 Monte Carlo
samples. ξ method.
vector ξ. Furthermore, since the posterior distributions can be asymmetric and skewed we get that
Eξ|data {V aR(P (ξ))} =∫
ΞV aR {P (ξ)} π(ξ|data)dξ 6= V aR
{
P (Eξ|data(ξ))}
.
When generating trees through the sampling of the posterior distribution of the model parameter
through any of the three methods, we can produce the posterior distribution of the hedging ratio4 δ.
This distribution, together with the observed underlying returns, allows computation of profit and loss
distribution of the derivative. Also, it is worth noticing that the option pricing statistical link that
we have developed throughout this paper can be expanded and enhanced. Several improvements could
include modelling the variance of the returns of the ups and downs through two stochastic volatility
models (Jacquier et al., 1994), or modelling truncated t-students instead of truncated normals.
7. Conclusion
The problem of finding theoretical option values is one where, as we saw in section 3., is a non-linear
function of several inputs, making it therefore highly sensitive to small variations from its inputs. We
4See Hull (2006).
29

6 8 10 12 14
0.00.2
0.40.6
0.8Call posterior vs Bootstrapped Means density
Call price (T=118, K=450, P=449.81, rf=1.3%)
Densi
ty
Figure 15: Posterior distribution for a call price (histogram) versus the density estimate based
on bootstrapping means from the sample (BM calibration), both based on 5,000 Monte Carlo
samples. Expected ξ method.
therefore illustrated why it is more adequate to use the whole posterior distributions from model param-
eter as inputs instead of their most likely values. We then proceeded to show the effects of parameter
uncertainty into model outputs and how this should be considered as a joint problem when defining
option pricing tools. The link between the pricing tools in mathematical finance and the inferential tools
from modern statistics should be stronger if we are to provide full and more accurate answers not only
about our current knowledge, but about our ignorance as well.
In section 4. we showed how to construct a posterior distribution on the space of model trees for
option pricing indexed by ξ. A posteriori, we described three related methods for model calibration and
determination of posterior option price probability distribution.
In section 5. we commented why the bootstrap approach suffers from low sample sizes, hindering
the ability to create bootstrapped intervals that would make the estimation of the tail of the call price
distribution quite unreliable. For a large sample, the bootstrap method and our approach provided
similar results. However, the use of a bayesian approach (parametric and/or nonparametric) is more
appealing when in presence of low sample sizes, and where prior process or parameter knowledge can
be incorporated into the analysis. Simple variations would allow parameter learning, which would be of
special relevance on overly-trending markets, as well as computing theoretical option values when the
30

historical data on the underlying and option prices are quite small.
As a concluding remark, the naive method of plugging into an option pricing model the most likely
value of the model parameters poses the problem that the results might not be optimal in a utility-based
framework. Considering the whole probability distribution of inputs to express uncertainty about outputs
is one of the advantages of our methodology, and allows for a full bayesian update of the tree as we observe
more and more realizations of the underlying ξ. The drawback of our methodology is computational, as
the simulation needs are much larger.
31

8. Appendix 1: Bayesian implementation of the MCMC sam-
pler
We derive in this appendix the full conditional posterior distributions. For full details about Bayesian
estimation methods and algorithms see Chen et al. (2000) or Robert and Casella (1999).
The likelihood L(u∗, σ2u, d∗, σ2
d, p|ξ1, ..., ξN ) times the priors is proportional to:
N
Πi=1
[pTN(ξi|u∗, σu, 1 + rf , +∞) + (1 − p)TN(ξi|d
∗, σd, 0, 1 + rf )] ×
×pa−1(1 − p)b−1 ×
×(σ2u)−αu−1 exp
[
−βu
σ2u
]
(σ2d)−αd−1 exp
[
−βd
σ2d
]
1{0<d∗<1+rf <u∗<2}
Rewriting it in an easier form we get:
∝ pa−1+
PNi=1
1{ξi>1+rf}(1 − p)
b−1+PN
i=11{0<ξi<1+rf}1{0<d∗<1+rf <u∗<2} ×
×(σ2u)−αu−1 exp
[
−βu
σ2u
]
(σ2d)−αd−1 exp
[
−βd
σ2d
]
N
Πi:ξi>1+rf
φ(ξi|u∗, σu)
1 − Φ(ξi|u∗, σu, 1 + rf )×
×N
Πi:0<ξi<1+rf
φ(ξi|d∗, σd)
Φ(ξi|d∗, σd, 1 + rf ) − Φ(ξi|d∗, σd, 0)
Notice that the full conditional of p does not depend on any other parameter. Therefore we compute
it in closed form. This eases the computation significantly.
8.1. Adaptive variance proposal over pre-burn-in period
The proposals for the remaining parameters are simply formulated as a random walk around the current
value, with fixed variances vu, vd, vσ2u, vσ2
d. To set these variance we allow a pre-burn-in period. We
monitor the acceptance ratios for the Metropolis algorithm over this period, and adjust the variance up
or down to reach a target Metropolis acceptance ratio between 10% and 50%. Then, after we reach this
ratio for all parameters, we fix that variance and allow the MCMC to start in its regular form.
There are three major advantages of this kind of proposals. First, it allows the user a more black-box
approach, where the algorithm will adjust itself to reach an acceptable mixing of the chain. There-
fore, it requires less user inputs to run, making it more automatic and appealing for practitioners.
Second, it makes most of the actual metropolis ratios in the sampling algorithm simpler, as the con-
tributions of the proposals cancel on numerator and denominator, due to the symmetry of the proposal
p(proposed|current) = p(current|proposed). Third, it actually does work quite effectively in practice,
requiring in our S&P analysis less than 500 iterations in most cases to achieve good proposals.
The pseudo-code for the sampling procedure looks as follows:
32

1. Preset a number of iterations N, over which we are going to monitor the acceptance frequencies of
the Metropolis steps. We chose N=100
2. Assign starting values for vu, vd, σ2u, σ2
d. For practical purposes we chose the variances of the positive
(negative) returns to set vu, σ2u (vd, σ2
d).
3. Assign starting values for u∗, d∗, σ2u, σ2
d. For practical purposes we chose the means and variances
of positive (negative) returns.
4. Set the iteration index n=1.
5. Sample p from its full conditional.
6. Sample the remaining parameters according to the sampling algorithms detailed below using the
current values for the proposal variances.
7. Record whether we accepted the proposal in the metropolis steps for each of the four parameters
u∗, d∗, σ2u, σ2
d.
8. If n<N, then set n=n+1 and go back to step 5.
9. If n=N iterations, then check the acceptance frequencies for each parameter. If
we accepted the proposal more than N/2 times, reduce the proposal variance by half.
we accepted the proposal less than N/10 times, double the proposal variance.
we accepted the proposal between N/10 and N/2 times, keep the current proposal.
10. If we modified any proposal variance at step 9, then go back to 4. Otherwise, set the current values
for the proposal variances and start the actual MCMC.
One could refine this even further, as we can partition the parameter space (and the MCMC) into
the up and down blocks, which are independent, and parallelize the computations.
8.2. Full conditionals and the MCMC sampler
Sampling p
Draw [p|Data] ∼ Beta[
a +∑N
i=1 1{ξi>1+rf}, b +∑N
i=1 1{0<ξi<1+rf}
]
Notice that p is the proportion of ups versus downs (adjusted by the prior proportion), and with
variance tending to 0 as N tends to +∞. A sufficient statistics for this full conditional is the number of
up and down moves in the sample, defined with respect to the risk-free rate.
Sampling u
Draw up ∼ N [up|u∗, vu] and set u∗ = up with probability
33

min
1,
1{0<d∗<1+rf <up<2}
[
N
Πi:ξi>1+rf
φ(ξi|up,σu)
1−Φ(ξi|up,σu,1+rf )
]
1{0<d∗<1+rf <u∗<2}
[
N
Πi:ξi>1+rf
φ(ξi|u∗,σu)1−Φ(ξi|u∗,σu,1+rf )
]
Sampling d
Draw dp ∼ N [dp|d∗, vd] and set d∗ = dp with probability:
min
1,
1{0<dp<1+rf}
[
N
Πi:0<ξi<1+rf
φ(ξi|dp,σd)
Φ(ξi|dp,σd,1+rf )−Φ(ξi|dp,σd,0)
]
1{0<d∗<1+rf}
N
Πi:0<ξi<1+rf
φ(ξi|d∗,σd)Φ(ξi|d∗,σd,1+rf )−Φ(ξi|d∗,σd,0)
Sampling σ2u
Draw σ2,pu ∼ N
[
σ2,pu |σ2
u, vσ2u
]
and set σ2u = σ2,p
u with probability:
min
1,
(
σ2,pu
)−αu−1exp
(
− βu
σ2,pu
)
[
N
Πi:ξi>1+rf
φ(ξi|u,σpu)
1−Φ(ξi|u,σpu,1+rf )
]
(σ2u)
−αu−1exp
(
−βu
σ2u
)
[
N
Πi:ξi>1+rf
φ(ξi|u,σ∗
u)1−Φ(ξi|u,σ∗
u,1+rf )
]
We could in principle adjust the proposal to be a truncated normal, so that we ensure that we never
sample outside the parameter space, and adjust the metropolis ratios with the normalizing constants.
However, in practice, we did not draw a single value smaller than zero, so this adjustment, although
technically more correct, would not make any difference in practice, as the mass of the points below zero
for the proposal was effectively zero (under most choices of v).
Sampling σ2d
Draw σ2,pd ∼ N
[
σ2,pd |σ2
d, vσ2d
]
and set σ2d = σ2,p
d with probability:
min
1,
(
σ2,pd
)−αd−1
exp(
− βd
σ2,p
d
)
[
N
Πi:0<ξi<1+rf
φ(ξi|d∗,σ
p
d)
Φ(ξi|d∗,σp
d,1+rf )−Φ(ξi|d∗,σ
p
d,0)
]
(σ2d)
−αd−1exp
(
−βd
σ2d
)
[
N
Πi:0<ξi<1+rf
φ(ξi|d∗,σd)Φ(ξi|d∗,σd,1+rf )−Φ(ξi|d∗,σd,0)
]
9. Appendix: Markov Chain Monte Carlo summary
In this section we include a small summary for one of the Markov Chains we have ran.
34
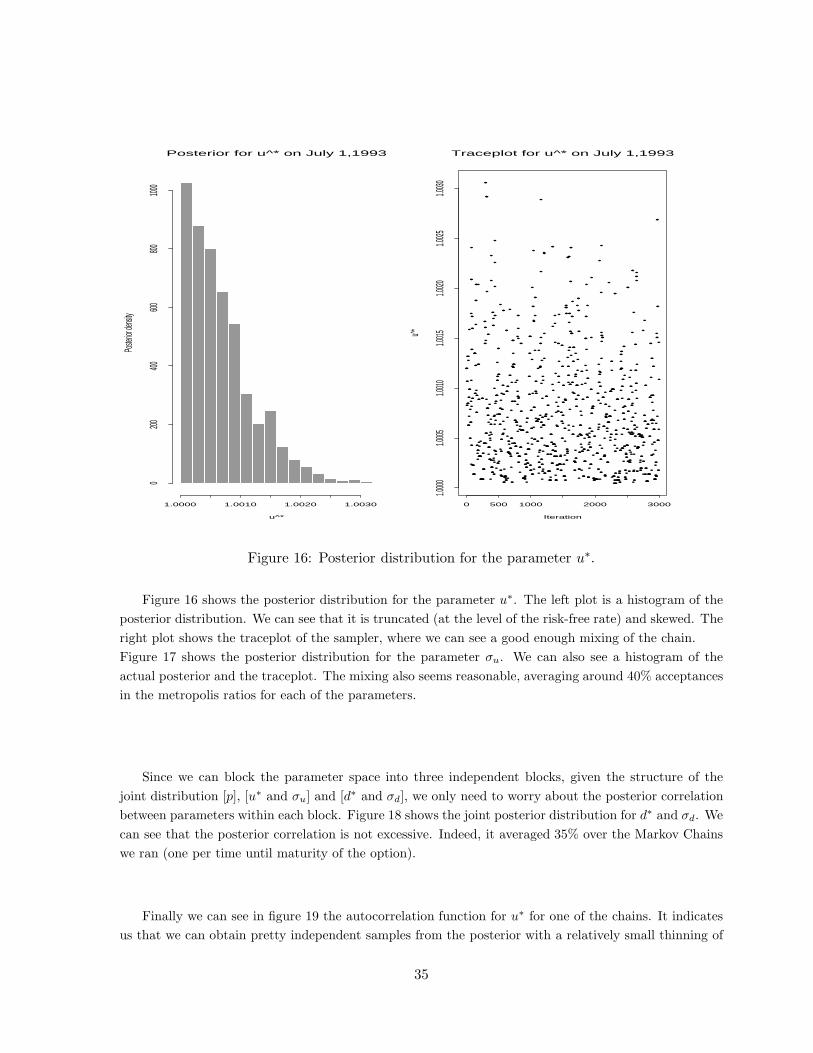
1.0000 1.0010 1.0020 1.0030
0200
400600
800100
0Posterior for u^* on July 1,1993
u^*
Poste
rior de
nsity
•••
••
••
•
•••
••
•••
••
•
•
•••
••
•
•••
•
•
•
•
••
•
•
••
••
••
••
••
••••
•••••
••••
••
••
•
••
••
•
••
••
••
••
•••
•
•••
••
•
•••
•
•••••
•
•••••••
•••
•••
••
••••
••••
••
••
••
••
•
•
•••
•
•••
•
••••••
••
•
•••••
•
•
•••
••
•
•
•••
•
•
••
•
•••••••
••
•••
••
•
••
•
•
•
•
•
•
•
•
•
••
•
•
•••
••
•
••••
•
•
••••
•••
••
•••
•
••••
••
••
•
•
••
•
••
••
••
•
•••
••
••
••
•
•
••
••
•••
•
•
•••••••••••
••
•••
•
•
••
•
••••
•••
••••
•
••
••••
••
•
•
•••
•
••
•
••
••
•••
•
••••••
•••
••
•••
•
•••
•••••
•
••
•
•
•
•
••
••
•
•
•
••
•
•••••
•
•
••
•••
••
••
••••••••
••••••••••••
••
••••••••
•
•
••
••
•••
•••••••
••
••
••
•••
•••••
••
••
••
•
•
•••
•
••
•
•
•
•
•
•••
•••
•
•
••
••
•
••
••
••••••
••
•
•
••••
•
•
••
•
•••
••
••
•
••
•••
•
•
•••
•
••
••
•
•
••
•
••
••
••
•
•
•••••
••
•
•
•
•••
•••••
•••
•••••
••
••
•
••••••
••••••
••
•••
••
•
•••
•
••
•
•••
•
••••••
•••
•
•
•
•••
•
•
•
••
•
••
•
•
••
•••
••
••
•••
••
•••
•
•
•
•••••••
•••
••
••
••
••
••
••
•
••
••
••
••
•••••
•
••
•
••
••
••
••••
•••
••
••••••
•
••
••
•••
•
•
•
••
•
••
••
•
•••
••
••
••
•
••••
••
••
•
•
•••
•
••
•••
••
•••
••
••
•
••
•
••
••
••••
••••
•
•
•
••
••
••
••
••
•
•••
••
•••
•••
•
•
•••
•
•
•
••
•
•••
••
•••
•••
•
••••
•
•
•••
••
•
•
•
••
••
•
•
••
••
•••
•••••
•
•
••
•••
•••
••
•
•
••
••
•••••••
•
••••••
••
•••••••••
••••
••
•
•
••
•
•
••
••
•
•
••
•
•
••
•
•
••
••
•
•
•
•
•••
•
•••
•••
•••
•••
•
••
••••
•
••
•••••••
•••
•••
•••••
•
•
•••••
••
••••
••
••
•
•
•••••••
••••••
•
••
•
••
•
••
••
••
••••
•••
•
••••
•
••••••••••
••
•••
•
•
•••
••
••
•
•
••
•
••
•••
••
••••
•
••
••
••
••
•
•••
••••
•••
•••
•
••
••••
••
••
••
••
•••
•
••
•
•
••••
•
•
•
•
•
••
•
•
••
••
••
•
•
•
••
••
•
•
••
•
•
•
••
••••
•
••
•
••
••
•••
•••
•
•
•
•
••
•••••••
•••••••••
••
••••••
••
•••••••
•
•
•
••
••
••
•
•••
••
••
•••
••
••••••
•••
••••••
••
•••
••
•
••
•
•
••
••
•
•
•
•••••
•
•
••
••
•••
••
•••••
•
•
••
••
•
•••
•••
••
•
••
•••
••
•
•
•
Traceplot for u^* on July 1,1993
Iteration
u^*
0 500 1000 2000 3000
1.0000
1.0005
1.0010
1.0015
1.0020
1.0025
1.0030
Figure 16: Posterior distribution for the parameter u∗.
Figure 16 shows the posterior distribution for the parameter u∗. The left plot is a histogram of the
posterior distribution. We can see that it is truncated (at the level of the risk-free rate) and skewed. The
right plot shows the traceplot of the sampler, where we can see a good enough mixing of the chain.
Figure 17 shows the posterior distribution for the parameter σu. We can also see a histogram of the
actual posterior and the traceplot. The mixing also seems reasonable, averaging around 40% acceptances
in the metropolis ratios for each of the parameters.
Since we can block the parameter space into three independent blocks, given the structure of the
joint distribution [p], [u∗ and σu] and [d∗ and σd], we only need to worry about the posterior correlation
between parameters within each block. Figure 18 shows the joint posterior distribution for d∗ and σd. We
can see that the posterior correlation is not excessive. Indeed, it averaged 35% over the Markov Chains
we ran (one per time until maturity of the option).
Finally we can see in figure 19 the autocorrelation function for u∗ for one of the chains. It indicates
us that we can obtain pretty independent samples from the posterior with a relatively small thinning of
35

0.07 0.09 0.11 0.13
010
2030
4050
Posterior for sigma_u on July 1,1993
sigma_u (ann)
Poste
rior de
nsity
•••
•••
••
••
••
••••••
••
•
•
•
•
•••
••
••
••••
•••••
••
•
•
••
•••
••
••
•
•••
•
•
•
••
••
•
••
•
••
••
••••••
••
•
•
••
••
••
••
••
•
•
•
•
•
•
•
•
••
••
•
•••
•
•
••
•
•••
••
•
•
•
•
••
•
•
•
•
••
••
••
•
•
••
•••
•
••
••
•
•
•••
••
••
••
••••
••
•
••
•
••
•
•
•
•
•
••
•••••
••
••
•
•••
••
•••
•
••
•
•••
••
•
••
•
••
•••
•
•
•
•
•
•
••
••
•
••
•••
•
•
••
••
•
•••••
•
•
•••
•
••
•
•
•
••
•••••
•
••
••
•
•
••
••
••
•
•••••
••
••
••
••
••
•
•
••
•
•
•
•
•••
••
••
••
•
•••
•
••
•
•
•
••••
••
•
••
••••
•
••
••
•••
•
••
••••
•
••
••
•
•
•
••
•••
••
•
••
•
•
•
•
•
••
•
•••
••
•••
••
•
••
••
••
••
•
•
•
•••
•
•••
••
•••
••
•
••
•••
•••
•
•
••
•••
•••
••
••
•
•
•
••••
•
•
••••
•
••
••
•••
•••
•
•
••
•
•
••
••
••
•
•
•
••
•
•••••
•
•••
•
•
••
••
•
••
•
••
•••
•
•••
••
••
••••
•
••
•••
•
••
•
•
•••••
••
••
••••
••
•••••
•
•
•
••
•
•
••
••
••
••
••
•
•••
••••
••
•
••••
•••
••
••••••••
•••
••
•••
•
•••
••
•••
•
•
•
•
•••
•
•
•
•
••
•
•
•
••
••
•
•
•
••••••
•••
••••
••
•••
••
•
••
••••
••
••
•
•
•
•
•
•
•
•••
•
•
••
•
•
•
••
•••
•
•
•
•
•
•
••••
••
•
••
•
••
••
•
••
••
•
••
•
•
•
••••
•
•••
•
••
••
••••••
•
•
•
••
••
•
•
•••
•
•
•
•
••••
•
•••
•
••
•
•
•••
••••
•
•
•
•
•
•
••••
••
••
•
••
••
••
••
•
•••
••
•
•
•••••
••
•
•••
•••
•
•
•••
•••
•
•
•
•••
••
•
•
•
•
••
••
•••
•
•••
•
•
•
•
•
••
•
•
•
•
•
••••
•
•••••
•
••
••
•
••
•
•••••
•••
•
••••••••
••••••
•
••
••
••
••
••
•
•
•
•
••
•••
•
•
••
•
•••••
•••••
•••
••
•
•••
••
•
••
••
•
••••
•
•
••
••••••••
•
•••
••
••
•
••
•
••
•••••
•••
•
•
•
•
•••
•
••
•••
••••
•
•••
••
•
•••
••
••
••
•
••
••
•••
••
••••
•
••••
••••
••
••
•••••
•
•
•
•
••
•
•
••
•••
••••
••
••
••
•
••
•
•
•
•
•
••
•
•••
••
•
•••
••••
•
•
•••
•
••••
••
••
•
•
••••••
••
•
•
•••••
•
•••
••••
••
••
•
•
••
•
••
•
•
•
•
•
•
•
•
••
••
••
••
••
••
•
••
•
••
•
•
•
•
•
•
••••
•
•
•
••
•
•
•
••
•
•
•
•
•
•
•
•
••
••
•••••
•
•
•••
••
••
••
••
••
•
••
••
••
••
••
••
••
•
•
•
••
•
•
••
••
•••
••••
•
•
••
•
•
••
••
••••
•
••
••
•
•
•••
••
••
•
••
••
••
•••
••
•
••••••••
•
••
•
••
••••
••
••
••
•
•
•
•••
•
•
•••
••
••
•••
••
•
•
••
•••
••
•••
••
•
••
••
•
•••
•••
••
•••
•
•
•••
•
••
••
••••
•
•
•
••
•••
••
•
•••
•
••
•
••
•
••
•
•
•
•
•
•••
•
•
•
••
••
•
••
•
•
••
••
••••••
•
•••
•••••
•
•••
••
•
•
••
•
•
•
•
•
••
•
•
•
••
•
•
•
•
•
•
•
••
••
•••••
•
•••
•
•
•
•
•
•
•
•••
•
••
•
••••
••
•
•••••••••
••
•
••
••
•
•••
•••
••••••
•
••••
••••
••
•
••
•
•••
•
•
••••
••
•
••
••
••
••
••
Traceplot for sigma_u on July 1,1993
Iteration
sigma
_u (an
n)
0 500 1000 2000 3000
0.08
0.09
0.10
0.11
0.12
Figure 17: Posterior distribution for the parameter σu.
the chain.
36
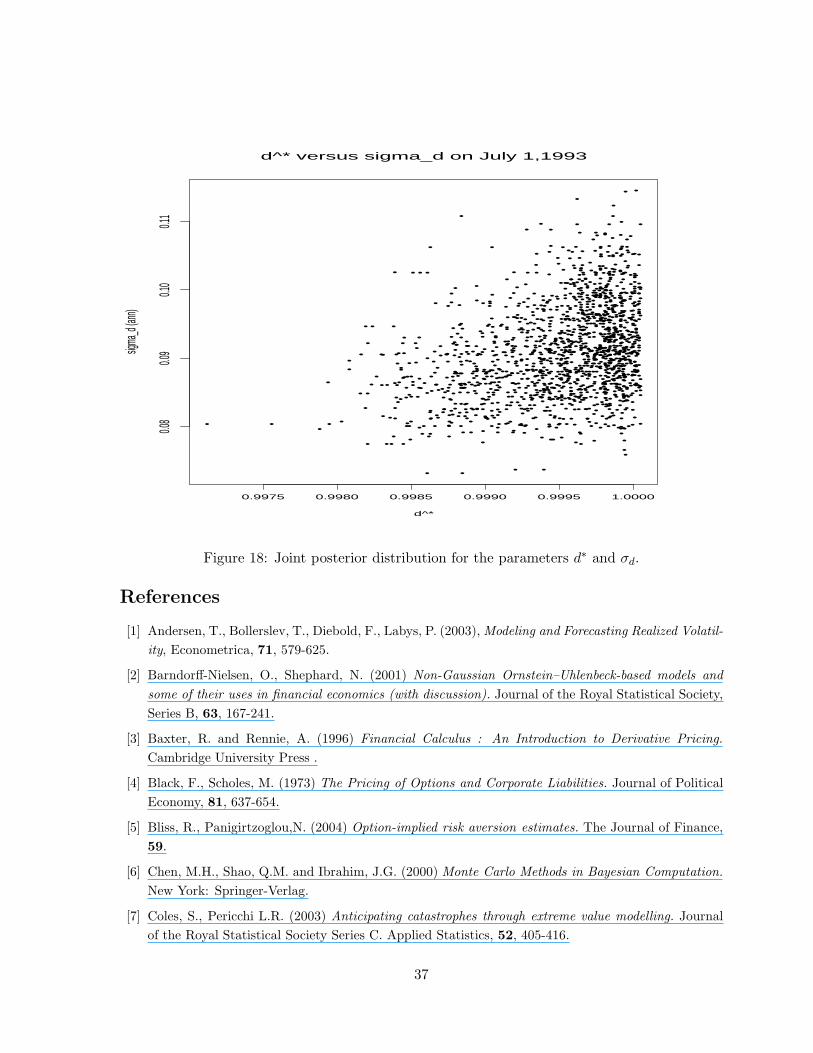
••
• ••
• ••
••
• ••
•
••
•
•
•
•
• •
•••
•• ••• •
•
•
• ••
• •••
•••
•
•• •
•
•
•
•
• •
•
•
•••• •
••
•••
••
•
•
•
•••
•
•
• •
•
•
•
•
•• • •
•
••
•
•
•
• ••
• •
••
•
•
•
•
••• •• •••• •• •
••• ••
•
•
•
•
• • •
•• • ••
•
•
• ••
••
• •• •••
•••• ••
••
• • •
••
• •
•• • • • •
••
••
•
•
• •••
• •••
•
• •
• • ••
•
•
••
• •••
•
•
••• •
• •
• •
• •
•••
••
••
•
••
• •
•
•
•••
•
•
••• •• •• •
•
••
•
• ••
• •• •• •
•
•• •
•
• ••• •
••• •
• •
•
•
•
•
•
•
•••••
••• ••
• •
••
••
•
•• • • •• •
•••
• •• •
•• • ••
••
• •
•
•••
•
•
••
••
••
•
•• •
•
•
•
• •
•
•••
•
••
••
• ••
•• •• • ••••
•
• •
• •
• •
••
••
••
• • •
••
•
•
•
•• •
•
•
•••
••
• •
• ••
•
•
•
•
•
•••• • • ••• •
•
••
•
••
•••
•
•
•
••• •••• • •
• •
•
•••
•
• •••• •
•
•••
•
•
•
•
•
••
••• ••
•
•
•
• •
•
•
•
•
•
•••••••
••
•
• •
•
•••
••
•
• •
•
•• •
•
• •
•
•
•
•
••
•
•
• • •
•
•
•
•
• ••
•
•
••
• •• ••
•
• •
• •
• •
•
•
•
• ••
••
• ••
• • ••
• •
•
••
•
••• •
•••
• • •
•••
•
•
•
•• •
•
••
•
•
•
•••
•• •• •• •
••
•••• • •
•
•
••
••
• •
•
•
••
• •
•• •
•
••
••
• •
•
•
•
•
•
•
••• •• ••
•
••
•
•••
••
•
• • •
• •
•••
•
•
•• ••••••
•
• ••
•••
• •• •
••• •
• •
• •
••• •••
•
•
• ••
•
•
••
••••
••
•
••
•• •
••
•
•
•• •
• •
•••• • •
••• • •
•
•
••
•• •
•
•
•
•
•
•
•
• • ••• • •
• •
•
• •
• •
•
• ••
•
•
• •
• •
• •• •
• •
•
•
••
•••
•
•• • ••
• •• •• •
•
• •
••
••••
•
••
•
••
•
•
• •
•••
•
• •
••
•
•
••• •
••
•
•
•
•
•
•
•
•
••
•
•
•
•
•
•
•
•
•
•
••
•
• •
•
••
• •
•• ••
•
•
•
••
•• •
•
••
•
•
••
• •• •
• •
•
••• •
•• •
•
• •
•• •••
••
•
•
•
••
•
•
•
•
•
• • ••
•
• •• ••••
•
••
•
•
•
• •
••
•• •
•
•
•
••
•
•
•
•
•••
•
•
•• • •
•
•
•
•• •
•
••
••
• ••
•
• • •
•••
•• •
•
••• •••
•
•
••
• ••
••
• ••
•
•• •••
•
••
• •
•
•
• •• ••
• •
•
•
•
•• •
•
• •••
•
• • •
••
•
•
••
•
•••
•
••••• •
•
••
• •
•• ••
•
•
• •
•
•
••• • •
•
••
• •
•
••
•
••
• ••••
•• •
• •
•• ••• •• •
•
•
••
•• •• ••
•
••
••• •
•
•
•
••
••
•
•
•
• •
• • •
•
••• •
•
• ••
• ••
•
•
•• • • • •••
•
••
• ••
••
• •
• • • ••
•
••
•
•
• ••• •••
•
•• •
•
• •
••• • •
•••• •
•
•
•
•
••
• •
••
• •
••• •
••
•
••
•
•
•
•
•
•
•
•
•
•
•
•
•••
• •
••
• • ••• • •
•
• • •
•
•
••
•
•
•
• •
••
•
•••• •
•
•
•
•
•
•
•
•••• •
•
•
•
•
•
•
•
•
••
••
• •
••••
• • ••
•
•
••
•
•
•
•
•• •
•
•
•
•
•
••
•
•
• •
• •
••
••
•• •• •
• •
•••
•• • •
•••••• •
•• •
••••• •
• • •••• •
•
• •••
••
• •
•
•
•
•
•• • •
••
• •
•
••
•
•••
•
• •
•• •• • •
•
•
•
•
•
•
••
••
••••
•••
•
•••
••
•
•••• • •
•
•
•
•
•
•
•
•
•
•
•••
• ••
•
•
•• •
•
•
••
•
••
•
•
•
•• •
•
•
••
•
•
••
•
•• •
•
• •
•
•
• •
•
••
•
•••
•
•
• ••• ••
•
•
•
•
•• •
•
•
••
•••
••
•
•
••
•
•••
••
•• •
••
•
••
•
•• •
•
•
•
•
••
•
••
• •
•••
•
• ••
•
•••
••
•
•• •
• • • ••• • ••
••• • •• • • • • ••• ••••
••• •
• •
•
••
• • •
••
•
••
•
•
•
•
•
•
••
•
•
• • •
•
•
•
•
•
••
••
•
•••
•
d^* versus sigma_d on July 1,1993
d^*
sigma
_d (an
n)
0.9975 0.9980 0.9985 0.9990 0.9995 1.0000
0.08
0.09
0.10
0.11
Figure 18: Joint posterior distribution for the parameters d∗ and σd.
References
[1] Andersen, T., Bollerslev, T., Diebold, F., Labys, P. (2003), Modeling and Forecasting Realized Volatil-
ity, Econometrica, 71, 579-625.
[2] Barndorff-Nielsen, O., Shephard, N. (2001) Non-Gaussian Ornstein–Uhlenbeck-based models and
some of their uses in financial economics (with discussion). Journal of the Royal Statistical Society,
Series B, 63, 167-241.
[3] Baxter, R. and Rennie, A. (1996) Financial Calculus : An Introduction to Derivative Pricing.
Cambridge University Press .
[4] Black, F., Scholes, M. (1973) The Pricing of Options and Corporate Liabilities. Journal of Political
Economy, 81, 637-654.
[5] Bliss, R., Panigirtzoglou,N. (2004) Option-implied risk aversion estimates. The Journal of Finance,
59.
[6] Chen, M.H., Shao, Q.M. and Ibrahim, J.G. (2000) Monte Carlo Methods in Bayesian Computation.
New York: Springer-Verlag.
[7] Coles, S., Pericchi L.R. (2003) Anticipating catastrophes through extreme value modelling. Journal
of the Royal Statistical Society Series C. Applied Statistics, 52, 405-416.
37

Lag
ACF
0 10 20 30
0.00.2
0.40.6
0.81.0
ACF for the MCMC output for u^*
Figure 19: Autocorrelation function of the MCMC output for one parameter.
[8] Cox, J., Ross, S., Rubinstein, M.(1979) Option Pricing: A Simplified Approach. Journal of Financial
Economics, 7, 229-264.
[9] Cont, R. (2006) Model Uncertainty and its impact on the Pricing of Derivative Instruments. Math-
ematical Finance, 13 519-547. .
[10] Cont, R., Tankov, P. (2004)Financial Modelling with Jump Processes., Chapman & Hall.
[11] Cont, R., Tankov, P. (2004) Calibration of jump-diffusion option pricing models: a robust non-
parametric approach. Journal of Computational Finance, 7, 1-49.
[12] Dowd, K. (2005) Measuring Market Risk. John Wiley & Sons.
[13] Eraker,B., Johannes, M., Polson, N. (2003) The Impact of Jumps in Volatility and Returns. Journal
of Finance.
[14] Derman,E. And Kani, J. (1994) The volatility smile and its implied tree. RISK, 7, 139-145.
[15] Duffie, D., Pan, J., Singleton, K. (2000) Transform Analysis and Asset Pricing for Affine Jump-
Diffusions. Econometrica, 68, 1343-1376.
[16] Garcia, R., Ghysels, E., Renault, E. (2003) The Econometrics of Option Pricing. Handbook of
Financial Econometrics (Edited by Yacine Ait-Sahalia and Lars Peter Hansen.)
38

[17] Gustafsson, T., Merabet, H. (2002) A generalized multinomial method for option pricing in several
dimensions. Journal of Computational Finance, 5.
[18] Hastings, W.K. (1970) Monte Carlo sampling methods using Markov chains and their applications.
Biometrika, 57, 97-109.
[19] Hoeting, J., Madigan, D., Raftery, A., Volinsky, C. (1999) Bayesian Model Averaging. Statistical
Science 14, 382-401.
[20] Hull, J. (2006) Risk Management and Financial Institutions. Prentice-Hall.
[21] Jacquier, E., Polson, N.G. and Rossi, P.E. (1994) Bayesian analysis of stochastic volatility models.
Journal of Business and Economic Statistics, 12, 371-415.
[22] Karolyi, G.A. (1994) A Bayesian Approach to Modeling Stock Return Volatility for Option Valuation.
The Journal of Financial and Quantitative Analysis, 28, 579-594.
[23] MacBeth,J., Merville, L. (1979) An Empirical Examination of the Black&Scholes Call Option Pricing
Model. Journal of Finance, 12, 1173-1186.
[24] Molina, G., Bayarri, M.J. and Berger, J.O. (2005) Statistical Inverse Analysis for a Network Mi-
crosimulator. Technometrics, 47, 388-398.
[25] Mun, J. (2005) Real Options Analysis. John Wiley & Sons.
[26] Polson, N. G., Stroud, J. R. (2003) Bayesian Inference for Derivative Prices. Bayesian Statistics 7
(Bernardo et al., eds.), Oxford University Press, 641-650.
[27] Robert, C.P. and Casella, G. (1999) Monte Carlo Statistical Methods. New York: Springer-Verlag.
[28] Rubinstein, M. (1993) Nonparametric Tests of Alternative Option Pricing Models Using All Reported
Trades and Quotes on the 30 Most Active CBOE OPtion Classes from August 23, 1976, through
August 31, 1978. Journal of Finance, 40, 455-480.
[29] Rubinstein, M. (1994) Implied Binomial Trees. Journal of Finance, 49, 771-818.
39

1.0040 1.0050 1.0060
020
040
060
080
010
0012
00
Posterior for E[xi.up] on July 1, 1993
E[xi.up]
Pos
terio
r de
nsity
•
••
••
••
••
•
•
•
••
••
••
•••
••
•
•
•
•
•
•
•
•
•
••
••
•
••
••••
•
•
•
•
••
•
•
••
••
•
•
•
••
•••••
•
••
••
•
••••
•
•
•
••
••
•
•
••
•
••
••
•
••
•••
•
••
•
••
•
•
•
•
••
•
••
•
••
••
•
•
•
•
•
•
•
•
•
•
••
•
•
•••
•
••
•
•
•••
•
•••
••
•
•
•
•
••
•
•
•
•
•
••
•
••
••
•
•
•
••
•
•••
•
••
•
••
•
•
••
••
••
•••
•
••
•
•
••••
••
•
••
•
••
•
•
•
•
•
••
••••
••
•
•••
••
•
•••
•
•
••
••
••
•
•
•••
•
•
••
••
•
•
••
•
••
••••
•
•
•
•
•
•
•
••
••
•
•
••
•
•
••
•
•
•
•
•
•
•
•
•
•
•
•
•••
•
••
••
•
•
••
•
•
•
•
••
••••
••••
••
•
•
•
••
••
••
•
•
•
•••••
••
••
•••
••
•
•
•
•
•
•
•
••
•
•
•
•
•
••••
••
•
•
••
•
•
•
••
••
•
••
•
•
•
•••
•
•
••
•
••
••••
•
••
••
•••
•
•
••
•••
•
•
•
•
••
•
•
•
•
•
••
••••
••
•
•••
•
•
•
•
•
•
•
••
•
••••
••
•••
•
••
•
••
•
•
•
••
•
••
•
•
•
•
••••
•
••••
••
••
•
••
•
••
•
••
•
••
•
•
••
•
•
••
••
••
••
••
•
•
•
••
•
•
•
•
••
•
•
•
••
•
•••
••
••
••
•••
•
•
•
•
•
•
••
•
•
••
••
••
•
•
•
•
••
•
•••••
•
•••
•
•
••
••
•
••
•
••
•••
•
•••••
•••
•••
••
••
•
•
•
•••
•
•••
•
•
•
••
•••
••
••
••
•••
••
•
••
••••
•
•
•
••
•
•
•
••
••
••
•••
•
•
•
•
•
••
•
•
••
•
•
•
•
•
•
•••
•
••
•
•
••
••
•
••••
••••
•••
•
••
•
•
•
•
•••
••
•
••
•
•
•••
•
••••
•
•
•
•
•
•
•
••
•
•
•
•
•
•
••
•
••
•
•••
•
•••
•
••
•
•
••
•
•
••
••
•••
•
••
•
•
•
•••••
••
•
•
•
•
•
•
•
•
•
•
•••
•
•
••
•
•
•
••
•••
••
•
•
•
•
•
•
••••
••
•
••
•
••
••
•
••
••
•
••
•
••
•
•
•
••
•
•
•
•••
•
•
••
•
••
••
•
•
•••
•
•
•
••
••
••
•
••
••
•
•
•
•
•
••
•
•
•
•
•
•
•
••
•
•
•
••
•
•
••
•••
•••
•
•
•
••
•
•••
•••
•
•
•
••
•
••
••
••
••
•
••••
•••
•
•
••
••••
••
•
•
••
•••••
•
•
•••
•••
••
•
•
•
•
•••
••
•
•
•
•
•
•••
••
•
••
••
•
••••
••
•
•
•
•
•••
•
•
•
•
•
•
••
••••
•
•
•
•
•
••
••
•
••
••
•
•
••
•
••
•••
•
•
••
•
•
•
••••••
•••
••
•
•
•••
•
••
••
••
•
••
•
••
•
•
•
•
••
•••
•
•
•
••
•
•
•
••
••••
••
••••
•••
•
•
•
•
••
••
•
••
•
••
•
••
•
•••
••
•
•
••
••
••••
••••
•
•
•
•
•••
•
••
••
•
•
•
•
••
•••
•••
•••
•
•
•
•
•••
•
•
•
•
•••
••
•
•
•
••
••
•
•
•
•
•
••
••
••
•
•
•
••
••
•
•
•
•••
•
•••
••
•
••••
•
•
••
••
•
•
••
••
•
•••••
•
••
•
••
•
•
•
••
•••
••
••
••
••
••
•
••
•
•
•
•
•
••
•
•••
•
•
•
•
•
•
••
•
•
•••
•
•
•
•
•
••
•
•
•
•
••
•
•
•
••
••
•
•
•
•
••••
•
•
•
•
•
•••
••
•
•••
•
•••
••
•
••
•
•
•
••
•
••
•
•
•
•
•
•
•
•
••••
••
••
••
••
••
•
•
••
•
••
•
•
•
•
•
•
••
•
•
•
•
•
••
•
•
•
••
•
•
•••
•
•
•
•
•
••
•
••
••
•••
•
•
•
•
•••
••
••
••
••
•
••
•
••
•••
•
•
•••
••
••
••
••
•
•
•
•
••
•
•
••
•
•
•••
•
••••
•
•
•
•
•
•
•
•••
••
••••
•
••
••
•
•
•••
•
•
•
•
••
••
••
•
•
•
•
••
••
•
•••
•
••
••
•
••
•
•••
••
••
••
•
•
•
••
•
•
••
•••••
•
••
••
••
••
•
•
•••
•
•
••
••
•
••
•••
•••
•
•
•
•
•
•
••
•••
•
•
•
•••
•
••
•
•
•
•
•
•
••••
•
••
••
•
•
••
••
••
•
••
••
•
•
•
•••
••
•
•••
•••
•
•
•
•
••
•
•••
•
•••
••
•
••
•
••
•
••
•
••
•
•
•
•
•
••••
•
•
•
••
••
•
••
•
•
•
••
•••
••••••
•
•
••
•••••
•
••
•
•
•
•
•
•
•
•
•
•
•
•
•
•
•
•
•
••
•
•
•
•
•
•
•
••
••
••
••••
•
••
••
•
•
•
•
•
•
•
•••
•
••
•
•
••
••
••
•
••
••
•
••
•
•••
•
•
••
•
•
•
•
••
•
•••
•
•
•
••
••••••••
•
•••
•••••
•
••
•
•
•
••
•
••
•
•
•
•
•••
•
•
••
•
••
••
•
••
•
•
•
•
•
Traceplot for E[xi.up] on July 1, 1993
Iteration
E[x
i.up]
0 500 1000 2000 3000
1.00
451.
0050
1.00
551.
0060
1.00
65

11.002 1.004 1.006 1.008 1.01 1.012 1.014
xi_up0.988
0.99
0.992
0.994
0.996
0.998
1
xi_down
00.
0005
0.00
10.
0015
f(xi
|dat
a)
11.002 1.004 1.006 1.008 1.01 1.012 1.014
xi_up0.988
0.99
0.992
0.994
0.996
0.998
1
xi_down
00.
0005
0.00
10.
0015
f(xi
|dat
a)
11.002 1.004 1.006 1.008 1.01 1.012 1.014
xi_up0.988
0.99
0.992
0.994
0.996
0.998
1
xi_down
00.
0005
0.00
10.
0015
f(xi
|dat
a)
11.002 1.004 1.006 1.008 1.01 1.012 1.014
xi_up0.988
0.99
0.992
0.994
0.996
0.998
1
xi_down
00.
0005
0.00
10.
0015
f(xi
|dat
a)