QTL Mapping and Phenotypic Variation for Seedling Vigour ...

Geoderma 160 (2011) 292–303
Contents lists available at ScienceDirect
Geoderma
j ourna l homepage: www.e lsev ie r.com/ locate /geoderma
Assessment and mapping of spatial variation of soil physical health in a farm
Ali Ashraf Amirinejad, Kalpana Kamble, Pramila Aggarwal ⁎, Debashis Chakraborty,Sanatan Pradhan, Raj Bala MittalDivision of Agricultural Physics, Indian Agricultural Research Institute, New Delhi-110012, India
⁎ Corresponding author. Tel.: +91 11 25833303, +9E-mail address: [email protected] (P. Aggarw
0016-7061/$ – see front matter © 2010 Elsevier B.V. Adoi:10.1016/j.geoderma.2010.09.021
a b s t r a c t
a r t i c l e i n f oArticle history:Received 11 January 2010Received in revised form 4 September 2010Accepted 9 September 2010Available online 30 October 2010
Keywords:Soil physical healthSpatial variability analysisPhysical rating index
Productivity rating systems are important tools to quantitatively assess soil health. In precision farming suchinformation is required for planning appropriate soil and crop management strategies. In order todemonstrate a proper procedure for assessing the soil physical health of a farm, an experiment wasconducted in a rice–wheat field. Spatial variability analysis of soil physical properties measured on arectangular grid (30 m×45 m) was carried out by using geostatistical analyst extension of Arc GIS software.Indicators for soil physical health assessment included bulk density (BD), field saturated hydraulicconductivity (Kfs), available water retention capacity (AWRC), organic carbon content (OC) and non capillaryporosity (NCP). Rating values of soil physical parameters were different for wheat and rice as the optimumphysical environment for both systems were different. Physical rating index (PI) at each sampling point wasdetermined by multiplying the rating values for all five parameters. Results revealed that for BD, Kfs, OC andsoil physical health index (PI), major andminor ranges of semivariogram varied between 300–380 m and 55–90 m, respectively. Whereas for NCP and AWRC, they were relatively short (major range between 114–140 mand minor around 60 m). Results also revealed that BD and PI for both surface and subsurface layers showedstrong spatial dependence whereas the rest of the parameters showed moderate spatial dependence. Ratingmaps of mentioned parameters for wheat and rice cultivations were prepared as series of coloured contoursby using kriging or other appropriate interpolation techniques and suitable semivariogram models. Overallsoil physical health of the farmwas medium to good for paddy cultivation but was not suitable for succeedingwheat crop mainly because of increased BD and reduced Kfs, NCP and AWRC of the farm during wheat growth.Correlations between PI and grain yield of both wheat and rice were fairly good (r2=0.67). The results thussupported earlier findings that good soil physical health is essential for optimum sustained crop production.
19650603608 (mobile)al).
ll rights reserved.
© 2010 Elsevier B.V. All rights reserved.
1. Introduction
Intense cultivation for meeting the demand of growing populationhas adversely affected the natural resources. A better understandingof the impact of continuous cropping on physical, chemical, andbiological soil properties is needed to optimize the soil conditionsnecessary to enhance the cropping system sustainability. In order toquantify and evaluate changes in soil quality, various combinations ofmanagement practices and their interactions with different soilindicators must be understood. Soil quality has historically beenequated with agricultural productivity. Beginning in the 1930s, soilproductivity ratings were developed in the United States andelsewhere to help farmers select crops and management practicesthat would maximize production and minimize erosion or otheradverse environmental effects (Huddleston, 1984). In the 1970s,
attempts were made to identify and protect soils of the highestproductive capacity by defining ‘prime agricultural lands (Miller,1979). Soils with high productivity and high carrying capacity wereconsidered to be high quality. Soil health termwaswidely usedwithindiscussions on sustainable agriculture to describe the generalcondition or quality of the soil resource. Soil health and soil qualitywere often used synonymously (Warkentin, 1995). Later, importantsoil functions associated with soil quality, such as accommodatingwater entry, accommodating water transfer and absorption, resistingsurface degradation, and supporting plant growth, were chosen toevaluate the effects of the different soil management systems on soilquality. A minimum number of indicators (minimum data set (MSD))need to be measured to evaluate changes in soil quality resulting fromvarious management systems. Soil quality indicators refer tomeasurable soil attributes that influence the capacity of soil toperform crop production or environmental functions. Attributes thatare most sensitive to management are most desirable as indicators(Sparling and Schipper, 2004; Rezaei et al., 2006; Shukla et al., 2006;Masto et al., 2007; Imaz et al., 2010).
Case studies in different agro-ecological zones have been con-ducted by identifying minimum set of data on soil indicators and
293A.A. Amirinejad et al. / Geoderma 160 (2011) 292–303
relevant sampling strategies so as to develop meaningful soil qualityassessment and monitoring program (Doran and Jones, 1996;Hussain, et al., 1999; Schjønning et al., 2004; Govaerts et al., 2006;Aparicio and Costa, 2007).
In a given agro-climatic region, the measurable soil attributes thatare primarily influenced are — soil-depth, organic matter, respiration,aggregation, texture, bulk density, infiltration, nutrient availabilityand retention capacity, microbial population (Karlen et al., 2001; Chenet al., 2006; Masto et al., 2007).
Several systematic approaches have been taken to develop anintegrated soil quality index. Shukla et al. (2006) and Imaz et al.(2010) determined soil quality indicators by factor analysis.
Pierce and Larson (1993) proposed statistical quality controlprocedures to assess temporal changes in soil quality. Smith et al.(1993) employed multiple variable kriging, based on nonparametricgeostatistics, to determine soil quality probabilities for a land area inorder to integrate soil quality indicators into an index. Doran andParkin (1994) recommended using a simpler multiplicative functionto assess soil quality; such a framework takes into accountgeographical, climatic and socioeconomic concerns. Karlen and Stott(1994) utilized normalized scoring curves developed through asystems engineering approach (Wymore, 1993) for evaluating aproduction system's effect on soil quality. Glover et al. (2000)described guidelines for monitoring soil quality, which includeddefining the goal for sustainability (the goal could be production of acrop or a group of crops, environmental protection or any other use)and selection of minimum set of indicators for a given ecological zone.For each indicator, after reviewing the past research records, baselinevalue along with upper and lower limits were defined andtransformed into appropriate scores through the use of the standard-ized scoring functions that normalize indicator measurements to avalue between 0 and 1.0 by using the systems engineering approachgiven by Wymore (1993). After scoring all soil quality indicators, soilfunction scores are determined by summing the products of thenumerical weights of their associated indicators and the normalizedsoil parameter scores. Soil function scores were then summed to givean overall soil quality index (Karlen et al., 1994; Harris et al., 1996;Hussain et al., 1999; Glover et al., 2000; Arshad and Martin, 2002;Mohanty et al., 2007) . The resulting soil quality index was used inevaluating the effect of different management programmes andcropping systems on soil quality.
For computing the potential productivity loss due to soil erosion(Neill, 1979), soil quality was presented in terms of Productivity index(PRI). The PRImodel rated soils on the sufficiency for root growth basedon potential available water storage capacity, bulk density, aeration, pH,and electrical conductivity. A value from zero to one was assigned toeach property describing the importance of that parameter for rootdevelopment. The product of these five index values was used todescribe the fractional sufficiency of any soil layer for root development.
Physical rating index (PI) by Gupta and Abrol (1993) was alsoanother index used in soil physical constraint analysis for assessingthe production potential of soils. It was one step beyond landcapability classification. In this method, in addition to basic soilphysical parameters, few more dynamic parameters such as bulkdensity, infiltration rate, soil organic matter, water table depth andavailable water storage capacity were used for physical constraintidentification along with the estimation of relative magnitude of theirseverity. Accordingly, the production potential of these soils werepredicted under optimum levels of water and fertilizer inputs alongwith the adoption of appropriate plant protection measures. Efficien-cy of any suggested management practice for alleviating theseconstraints could be assessed in terms of changes in its rating valueand hence its production potential (Aggarwal and Choudhury, 2005).
Site-specific crop and soil management often incorporates precisespatial information about soil properties across farm fields to helpmeetthe goal of optimizing fertilizer inputs while maintaining or increasing
yields (Huang and Jin, 2002; Huang et al., 2006). The evaluation of soilproperty levels across farm fields is typically performed by taking soilobservations on a rectangular grid or on places whose spatialcoordinated were recorded by global positioning systems and interpo-lating values between sampling points by making use of geostatistics(Bai et al., 2001; Baxter et al., 2003; Anderson et al., 2005). Geostatisticsprovides a set of tools for presenting the spatial structure of soilparameter by defining its range, sill and nugget values and prediction ofthe parameter value at unknown locations by kriging and alsoassessment of the uncertainty attached to these predictions (Franciscaet al., 2002; Huang and Jin, 2002; Jin and Jiang, 2002).
As the concept of precision farming is gaining importance, there isa need for presenting a procedure for assessment of spatial variationin soil physical health of the farm and correlating it with the variationin crop yields. For this purpose prediction maps of the importantphysical properties along with their ratings should be prepared byappropriate interpolation technique. The overall soil physical healthshould be quantified in terms of a unified soil physical health indexprepared from the individual rating values of the important soilphysical parameters.
Hence an attempt was made in this paper to assess and map thespatial variation of soil physical health of an agriculture farm and toexamine correlation between spatial variation of soil physical healthand yield of crop in the farm.
2. Materials and methods
2.1. Details of field experimental site
The present investigation was carried out in a rice-wheat field, nearKherli village, Dankaur Block (28° 17′59″ N, 77° 32′04″ E) in NationalCapital Region (Fig. 1). The soil was an Inceptisol with sandy clay loamtexture. In order to measure relevant soil physical parameter, 145observation sites were chosen at a grid spacing of about 30 m×45mcovering a total area of 19.6 ha. The coordinates of each samplinglocation were recorded using a differential global positioning systemunit. At each sampling location, disturbed and undisturbed soil sampleswere collected from 0–15 cm and 15–30 cm soil layers.
2.2. Soil parameters studied at each location
2.2.1. Field saturated hydraulic conductivity (Kfs)The Field saturated hydraulic conductivity was measured by
Guelph permeameter (GP).The GP method involves drilling a small,vertical, cylindrical well of radius a and determining the steady waterdischarge Qswhen a constant depth of ponding H is maintained in thewell. In the present study a single depth of ponding at 7.5 cmwas usedto represent Kfs of 0–15 cm soil layer and 22.5 cm for 15–30 cm soillayer and following formula was used to evaluate Kfs (Elrick andReynolds, 1992; Reynolds, 1993):
Kfs=C Qs
2πH=α*+Cπa2+2πH2 ð1Þ
whereC is a dimensionless shape factor andα* is a soil texture/structureparameter. For the present study the value of α* used was 0.12 cm−1.The steady flow rate Qswas estimated using the following relationships(Reynolds and Elrick, 1986):
Ri=ΔLΔt
=Rs=constant i≥4 and Qs=RsA ð2Þ
where Ri is the rate of fall of thewater level in the GP reservoir,ΔL is thechange in water level in the reservoir over time period Δt, Rs is thesteady value of Ri, and A is the cross-sectional area of the reservoir(equal to 35.43 cm2 for the permeameter used in this study).
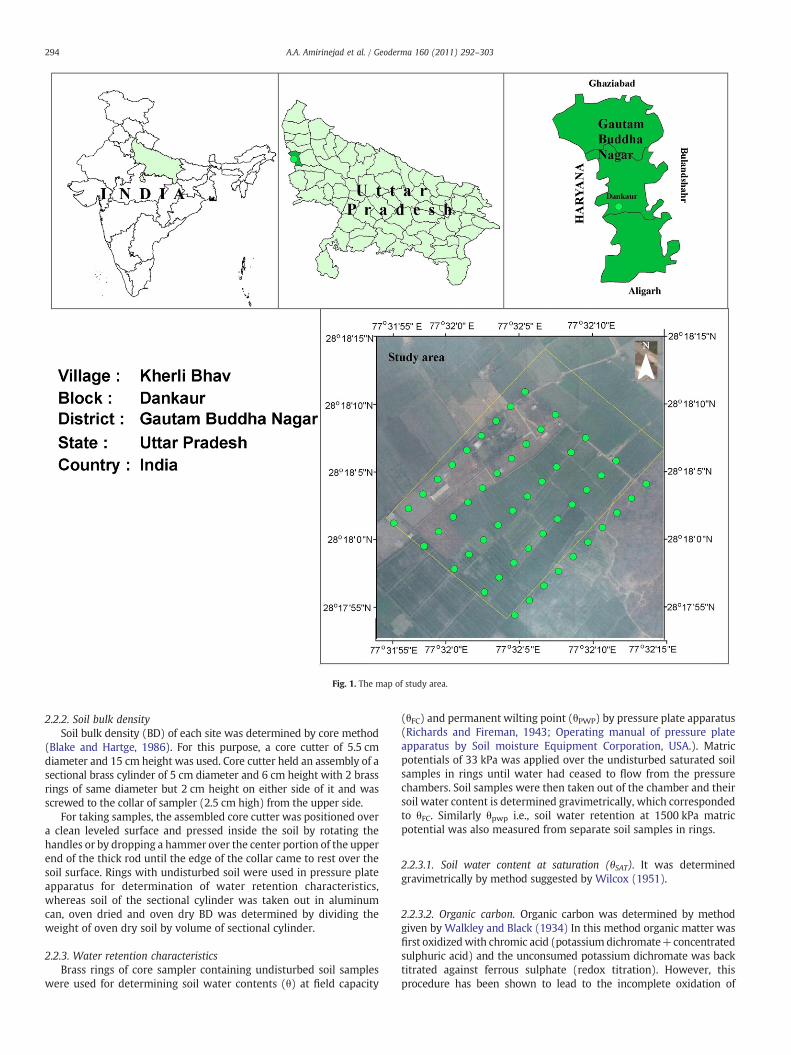
Fig. 1. The map of study area.
294 A.A. Amirinejad et al. / Geoderma 160 (2011) 292–303
2.2.2. Soil bulk densitySoil bulk density (BD) of each site was determined by core method
(Blake and Hartge, 1986). For this purpose, a core cutter of 5.5 cmdiameter and 15 cm height was used. Core cutter held an assembly of asectional brass cylinder of 5 cm diameter and 6 cm height with 2 brassrings of same diameter but 2 cm height on either side of it and wasscrewed to the collar of sampler (2.5 cm high) from the upper side.
For taking samples, the assembled core cutter was positioned overa clean leveled surface and pressed inside the soil by rotating thehandles or by dropping a hammer over the center portion of the upperend of the thick rod until the edge of the collar came to rest over thesoil surface. Rings with undisturbed soil were used in pressure plateapparatus for determination of water retention characteristics,whereas soil of the sectional cylinder was taken out in aluminumcan, oven dried and oven dry BD was determined by dividing theweight of oven dry soil by volume of sectional cylinder.
2.2.3. Water retention characteristicsBrass rings of core sampler containing undisturbed soil samples
were used for determining soil water contents (θ) at field capacity
(θFC) and permanent wilting point (θPWP) by pressure plate apparatus(Richards and Fireman, 1943; Operating manual of pressure plateapparatus by Soil moisture Equipment Corporation, USA.). Matricpotentials of 33 kPa was applied over the undisturbed saturated soilsamples in rings until water had ceased to flow from the pressurechambers. Soil samples were then taken out of the chamber and theirsoil water content is determined gravimetrically, which correspondedto θFC. Similarly θpwp i.e., soil water retention at 1500 kPa matricpotential was also measured from separate soil samples in rings.
2.2.3.1. Soil water content at saturation (θSAT). It was determinedgravimetrically by method suggested by Wilcox (1951).
2.2.3.2. Organic carbon. Organic carbon was determined by methodgiven by Walkley and Black (1934) In this method organic matter wasfirst oxidizedwith chromic acid (potassium dichromate+concentratedsulphuric acid) and the unconsumed potassium dichromate was backtitrated against ferrous sulphate (redox titration). However, thisprocedure has been shown to lead to the incomplete oxidation of

Table 1aRating of different soil physical parameters for wheat cultivation.
Parameters
BD (Mgm−3) Kfs (cm h−1) AWRC (cm m−1) OC (%) NCP (%)
Range Rating Range Rating Range Rating Range Rating Range Rating
1.30–1.45 1.00 1.0–3.0 1.00 N15.0 1.00 N1.20 1.00 N15.00 0.901.45–1.50 0.95 0.5–1.0 0.95 12.5–15.0 0.95 0.90–1.20 0.95 12.50–15.00 1.001.50–1.55 0.90 0.2–0.5 0.90 10.0–12.5 0.90 0.60–0.90 0.90 10.00–12.5 0.901.55–1.60 0.85 0.1–0.2 0.85 7.5–10.0 0.80 0.45–0.60 0.85 7.5–10.00 0.801.60–1.65 0.80 0.05–0.1 0.8 5.0–7.5 0.75 0.30–0.45 0.80 5.00–7.50 0.701.65–1.70 0.75 0.01–0.05 0.75 b5.0 0.70 0.20–0.30 0.75 b5.00 0.651.70–1.75 0.70 b0.01 0.701.75–1.85 0.65
Table 1bRating of different soil physical parameters for rice cultivation.
BD (Mgm−3) Kfs (cm h−1) AWRC (cm m−1) OC (%) NCP(%)
Range Rating Range Rating Range Rating Range Rating Range Rating
1.55–1.60 1.00 b0.10 1.00 N15.0 1.00 b 0.60 1.00 b 5.0 1.001.60–1.65 1.50–1.55 0.95 0.10–0.20 0.95 12.5–15.0 0.95 0.60–0.90 0.95 5.0–10.0 0.951.65–1.70 1.45–1.50 0.90 0.20–0.50 0.90 10.0–12.5 0.90 0.9–1.20 0.90 10.0–12.5 0.901.70–1.75 1.30–1.45 0.85 0.50–1.00 0.85 7.5–10.0 0.80 N1.20 0.85 12.5–15.0 0.851.75–1.85 0.80 1.00–3.00 0.80 5.0–7.5 0.75 N 15.0 0.80
295A.A. Amirinejad et al. / Geoderma 160 (2011) 292–303
organic C. A correction factor of 1.33 was applied to result to adjust theorganic C recovery.
2.2.4. Noncapillary porosity, capillary porosity and available water contentNoncapillary pores and available water retention capacity were
determined by following formulae:
Noncapillary porosity NCPð Þ %ð Þ = θSAT %v=vð Þ−θFC %v=vð ÞandAvailable water retention capacity AWRCð Þ % orincm=mð Þ
= θFC %v=vð Þ−θPWP %v=vð ÞCapillary porosity CPð Þ %v=vð Þ=Field capacity water content %v=vð ÞTotal porosity TPð Þ %ð Þ=100* 1− Bulkdensity=Particledensityð Þ½ �
2.2.5. Criteria for choosing minimum data set for computing soil physicalheath index
The parameters suggested for computing soil physical rating indexby Gupta and Abrol (1993) were bulk density (BD in Mg m−3),saturated hydraulic conductivity in cm h−1 (Kfc),available waterretention capacity of soil in cm m−1 (AWRC), Aggregation in termsof % soil organic carbon (OC), % non capillary porosity (NCP), watertable depth in cm and % land slope.
Since the soil depth of the study area was more than 100 cm, landwas flat (slopeb1%) and water table was deep (N100 cm), theseparameters did not pose any constraint to crop production. Hence theparameters chosen for rating were BD, Kfs, AWRC, OC and NCP.
Table 2Spatial structure of soil physical parameters for surface (0–15 cm) soil layer.
Parameter Interpolationtechnique
Best modelused
Lag size (m) andno. of lags
Major rangedirection (de
PI Ordinary kriging Spherical 32.36 and 12 380.79 and 5BD (Mg m−3) Ordinary kriging Spherical 25.53 and 12 300.69 and 6Kfs (cm h−1) Ordinary kriging Gaussian 32.36 and 12 380.73 and 6OC (%) Ordinary kriging Gaussian 32.36 and 12 380.73 and 7AWRC (cm m−1) IDW∫ – – 114.41NCP (%) Simple kriging Hole effect 11.78 and 12 139.66 and 5
∫ IDW=Inverse distance weighting.
2.2.6. Spatial variability analysis of soil physical parameters for preparationof soil physical health map of the farm
Spatial variability analysis of soil physical properties measured ona rectangular grid was carried out by using Arc GIS software. Firstly,exploratory spatial data analysis (ESDA) was conducted on the data todetect outliers and trends, as well as determine the degree ofnormality and range of spatial dependence.
2.2.7. Spatial structure analysis and kriging using geostatistical analystwizard
2.2.7.1. Step1: choice of suitable interpolation method. The first step ofthis analysis was to choose the appropriate geostatistical method ofinterpolation. For this purpose, cross validation statistics of predicteddata prepared by using different interpolation techniques werecompared which included plotting the predicted values againstobserved values and fitting a least squares regression through thescatter plot. The closer the regression to the 1:1 line, the more accuratethepredicted values. For both layers, the best suited interpolation optionwas theonewhichgave lowest RMSE and also its average standard error(AVSE) nearest to root mean square prediction error or alternativelyroot mean square standardized error (RMSS) nearest to one.
2.2.7.2. Step2: choice of suitable semivariogram model. In order tochoose a suitable semivariogrammodel, the total data set was dividedinto two parts — “training data set” for developing semivariogram
(m) andgree)
Minor Range(m)
Nuggetvariance (C0)
Partial sill(C)
% C0/(C+C0)
Spatialdependence
2° 60.14 0.0009 0.012957 6.49 Strong3° 54.17 0.0000 0.0156 0.00 Strong3° 69.93 0.004 0.112 3.45 Strong2° 89.24 0.0143 0.022 39.39 Moderate
– – – – –
4° 60.162 14.977 28.268 34.63 Moderate

Table 3Spatial structure of soil physical parameters for subsurface (15–30 cm) soil layer.
Parameters Interpolationtechnique
Best suitedmodel
Lag size(m) andNo. of lags
Major range (m) anddirection (degree)
Minor Range(m)
Nuggetvariance (C0)
Partial Sill(C)
% C0/(C+C0)
Spatialdependence
PI Ordinary kriging Spherical 32.36 and 12 377.9 and 63° 129.43 0.0015 0.0078 16.13 StrongBD (Mgm−3) Ordinary kriging Spherical 23.31 and 12 275.52 and 63° 62.23 0.002 0.011 15.38 StrongKfs (cm h−1) Ordinary kriging Gaussian 17.32 and 12 205.35 and 64° 92.35 0.00136 0.00185 42.37 ModerateOC (%) Ordinary kriging Gaussian 32.30 and 12 380.23 and 72° 108.33 0.0109 0.0160 40.52 ModerateAWRC (cm m−1) Ordinary kriging Hole effect 11.80 and 12 139.86 and 63° 128.29 3.35 7.88 29.83 ModerateNCP (%) Simple kriging Hole effect 11.78 and 12 139.66 and 79° 60.162 14.90 17.50 45.99 Moderate
296 A.A. Amirinejad et al. / Geoderma 160 (2011) 292–303
model by fitting the empirical semivariogram to different modeloptions available inwizard and “testing data set” to test the developedsemivariogram model. Validation statistics of all fitted models werecompared in a manner similar to that in the earlier step for choosingthe best suited model.
After choosing the appropriate interpolation technique, method ofdata transformation, semivariogram model, neighborhood searchshape and size for interpolation (elliptical shape if data is anisotropic,circular if isotropic with no of neighbor data points between 8–20),prediction maps of BD, Kfsc, OC, NCP, AWRC and PI (see below) wereprepared. Prediction map of each parameter showed different rangesof parameter values as series of filled colour contours.
2.2.8. Methodology for computing PIPhysical rating score chart by Gupta and Abrol (1993) for fine
textured soil was used for rating different soil physical parameters.Scores for different soil parameters were given as per the rating ofTables 1a and 1b for both wheat crop and lowland rice. The aboverating chart was prepared by analyzing the soil physical and yield data
Fig. 2. Rating maps of bulk density (Mg m−3) of surface (0–15 cm
of 30 years of research experiments reported in All India coordinatedresearch project on ‘Improvement of soil physical conditions toincrease agricultural production of problematic areas’. These experi-ments were conducted for different cropping systems at variouslocations with different soil types and agro climatic zones. Sameranges of soil parameters were assigned different rating values underrice and wheat cultivations because optimum soil physical environ-ment required for their growth were different.
For a given site, each of these parameters was assigned a ratingvalue corresponding to its actual value by referring to rating chart.Each of this parameter was given a score of 1 if the parameter valuelies within the optimum range. If the value lies below or above thecritical limit, a score less than 1 were given. Greater the deviation ofparameter value from optimum range, lesser the score given to it. Theproduct of rating values of all the eight parameters gave the physicalrating index (PI). PI was an indicator of overall soil physical healthstatus. For range of PIN0.75, 0.50–0.75, 0.25–0.50 and b0.25, soilphysical health status and accordingly its production potential couldbe labeled as very good, good, medium or poor, respectively.
) and subsurface (15–30 cm) soil layers for wheat cultivation.

Fig. 3. Rating maps of hydraulic conductivity (cm h−1) of surface (0–15 cm) and subsurface (15–30 cm) soil layers for wheat cultivation.
297A.A. Amirinejad et al. / Geoderma 160 (2011) 292–303
3. Results and discussion
3.1. Spatial variability analysis of soil physical properties
The exploratory spatial data analysis (ESDA) was a prerequisite forcarrying out the geospatial analysis of data by use of geostatisticalanalyst extension of ARC GIS 9.1. It was mainly conducted to examinethe data for presence of outliers, trend, normality, spatial dependenceand directional dependence of variogram. In all cases, data were
Fig. 4. Rating maps of available water retention capacity (cm m−1) of surface (0–15
skewed and in case of Kfs it became normal on log transformation.There was no trend present in data as the field was almost flat(slopeb0.5%). On examining empirical semivariogram, in general,data showed spatial dependence and anisotropic nature.
For carrying out geospatial analysis for surface (0–15 cm) soillayer, firstly appropriate interpolation method was chosen byexamining the validation statistics of spherical model (default option)for different kriging types. The most suited interpolation method wasone where slope the best fitted line was closer to 1: 1 line. The other
cm) and subsurface (15–30 cm) soil layers for both wheat and rice cultivation.

Fig. 5. Rating maps of non capillary pores (%) of surface (0–15 cm) and subsurface (15–30 cm) soil layers for wheat cultivation.
298 A.A. Amirinejad et al. / Geoderma 160 (2011) 292–303
important criteria for choosing the best interpolation type was toensure that predictions were unbiased. For data of BD, Kfs and OC,ordinary kriging without any data transformation was found to be thebest (Table 2). The results supported the earlier reports that forkriging, data need not be normal (Mulla and McBratney, 2002).Similarly for NCP, simple kriging and for AWRC, Inverse distanceweighting (IDW) methods were found most suited methods.
After choosing appropriate interpolation method, next step was toselect best suited semivariogram model by examining the validationstatistics of various available models by dividing the total data set into
Fig. 6. Rating maps of OC (%) of surface (0–15 cm) and su
two parts — “training data set” for developing the model and “testingdata set” for validating the model. Best suited models for theseparameters are also presented in Table 2. Spatial structural analysis ofdata by use of geostatistical analyst extension revealed that for BD, Kfs
OC and PI, major and minor ranges of semivariogram varied between300–380 m and 55–90 m, respectively. Whereas for NCP and AWRC,theywere relatively short (major range between 114–140 m andminoraround 60 m). The above resultswere in agreementwith those reportedbyMulla andMcBratney (2002) and Iqbal et al. (2005). Degree of spatialdependence of these parameters was computed by finding the
bsurface (15–30 cm) soil layers for wheat cultivation.
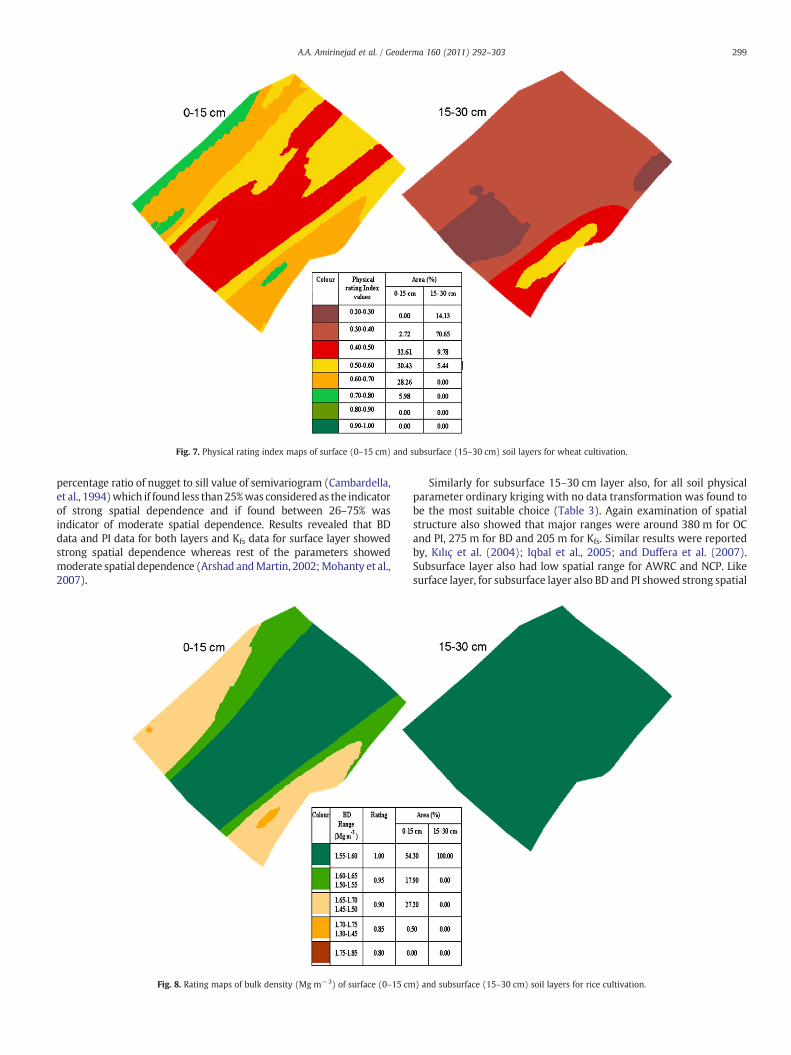
Fig. 7. Physical rating index maps of surface (0–15 cm) and subsurface (15–30 cm) soil layers for wheat cultivation.
299A.A. Amirinejad et al. / Geoderma 160 (2011) 292–303
percentage ratio of nugget to sill value of semivariogram (Cambardella,et al., 1994)which if found less than25%was considered as the indicatorof strong spatial dependence and if found between 26–75% wasindicator of moderate spatial dependence. Results revealed that BDdata and PI data for both layers and Kfs data for surface layer showedstrong spatial dependence whereas rest of the parameters showedmoderate spatial dependence (Arshad andMartin, 2002;Mohanty et al.,2007).
Fig. 8. Rating maps of bulk density (Mg m−3) of surface (0–15 cm
Similarly for subsurface 15–30 cm layer also, for all soil physicalparameter ordinary kriging with no data transformation was found tobe the most suitable choice (Table 3). Again examination of spatialstructure also showed that major ranges were around 380 m for OCand PI, 275 m for BD and 205 m for Kfs. Similar results were reportedby, Kılıç et al. (2004); Iqbal et al., 2005; and Duffera et al. (2007).Subsurface layer also had low spatial range for AWRC and NCP. Likesurface layer, for subsurface layer also BD and PI showed strong spatial
) and subsurface (15–30 cm) soil layers for rice cultivation.

Fig. 9. Rating maps of hydraulic conductivity (cm h−1) of surface (0–15 cm) and subsurface (15–30 cm) soil layers for rice cultivation.
300 A.A. Amirinejad et al. / Geoderma 160 (2011) 292–303
dependence whereas rest of the parameters showed moderate spatialdependence.
3.2. Rating of soil parameters for wheat cultivation
Rating maps of BD for both layers were prepared by using ordinarykriging with spherical semivariogram models. Rating map of BD forupland crop cultivation was prepared as series of coloured contours(Fig. 2).The range of parameter for a given colour was assigned aparticular rating value. As explained earlier in the Materials andMethods section, a rating value of 1 was assigned to that parameterrange which was found optimum for plant growth. More was the
Fig. 10. Rating maps of non capillary pores (%) of surface (0–15 c
deviationof a given range fromoptimumrange, lesswas the ratingvalueassigned. As the overall textural class of the area was fine to mediumtexture, hence BD range of 1.3–1.45 Mgm−3 was assigned a value of1 (optimum range), 1.45–1.50 Mg m−3 as 0.95 and 1.75–1.85 Mg m−3
as 0.65. Computation of area under different BD ranges revealedthat for surface layer, nearly 50% area was severely compacted(BDN1.6 Mgm−3 and rating value b0.8), whereas for subsurface layerit was more than 90%. The results thus indicated that subsurface com-paction was a severe constraint for root growth and overall productionof succeeding wheat crop in this area.
For preparing prediction maps of Kfs, Gaussian was found the bestmodel for both layers (Fig. 3). Optimum range for Kfs in soil was
m) and subsurface (15–30 cm) soil layers for rice cultivation.

Fig. 11. Rating maps of OC (%) of surface (0–15 cm) and subsurface (15–30 cm) soil layers for rice cultivation.
301A.A. Amirinejad et al. / Geoderma 160 (2011) 292–303
N0.5 cm h−1 and was assigned a rating value of ≥0.90. Computationof area under different Kfs ranges revealed that for surface layer,nearly 80% area had Kfs range between 0.10–0.05 cm h−1 and ratingvalue 0.75–0.85, whereas for subsurface layer, 100% of the study areahad same range and rating value.
Prediction maps of AWRC were prepared by using IDW for surfacelayer and ordinary kriging with whole effect semivariogrammodel forthe subsurface layer (Fig. 4). As suggested in physical rating criteria(Tables 1a and 1b), AWRC values more than 15 cm m−1 wereconsidered as optimum for all soil types. Values less than optimumwere rated less and rating map of AWRC along with % area in differentclasses was prepared. It was shown that N75% of the surface layer hadAWRC value N10 cm/m (rating value ≥0.9), whereas for subsurface
Fig. 12. Physical rating index maps of surface (0–15 cm) an
layer nearly 90% of the area had AWRC range b10 cm/m (≤0.8).Henceit was concluded that subsurface layer had lesser capillary pores (CP)for water retention and this constraint was probably because of severecompaction which reduced the overall pores and hence the volume ofcapillary pores. Less water retention capacity of soils could lead toappreciable reduction in wheat yields.
Prediction maps of NCP were prepared by using simple krigingwith “Hole effect” semivariogram model for both layers (Fig. 5).Optimum range of NCP (%) in soil suggested for upland cultivationwas 12.5–15.0 and assigned a rating value of one. The results showedthat more than 95% of surface layer had NCP range N10% and ratingvalue ≥0.90. Whereas for subsurface layer, nearly 75% area wasbetween NCP range of 5–10% and therefore had rating between
d subsurface (15–30 cm) soil layers for rice cultivation.
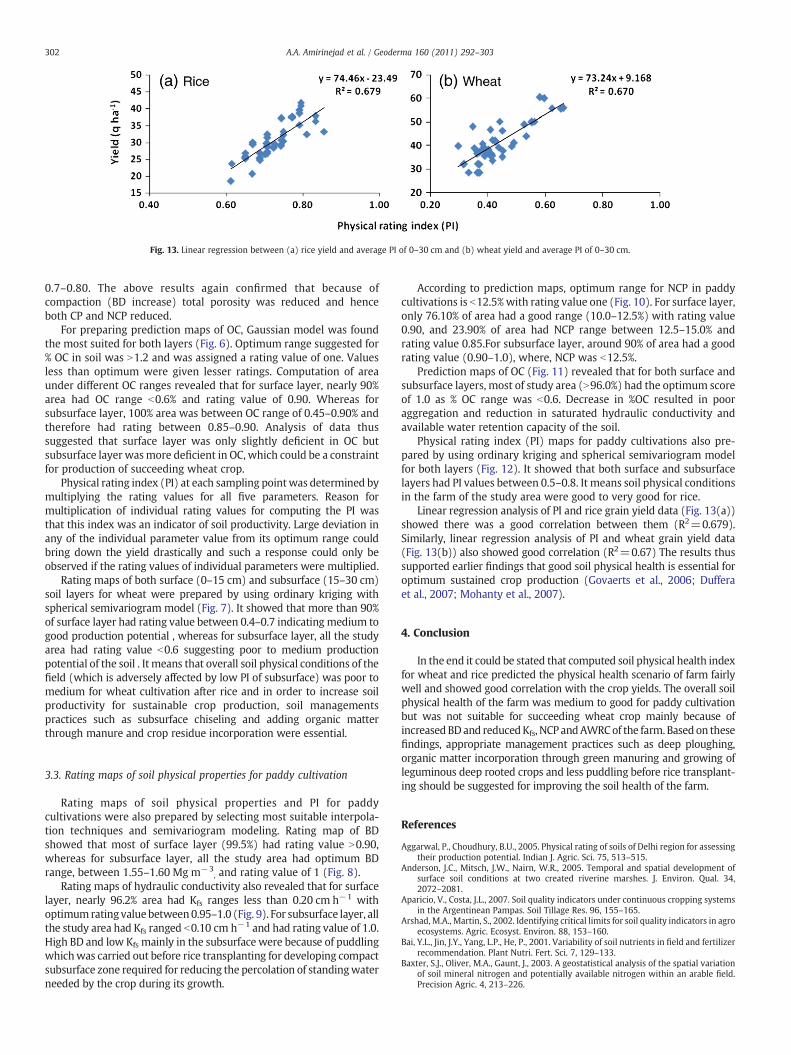
Fig. 13. Linear regression between (a) rice yield and average PI of 0–30 cm and (b) wheat yield and average PI of 0–30 cm.
302 A.A. Amirinejad et al. / Geoderma 160 (2011) 292–303
0.7–0.80. The above results again confirmed that because ofcompaction (BD increase) total porosity was reduced and henceboth CP and NCP reduced.
For preparing prediction maps of OC, Gaussian model was foundthe most suited for both layers (Fig. 6). Optimum range suggested for% OC in soil was N1.2 and was assigned a rating value of one. Valuesless than optimum were given lesser ratings. Computation of areaunder different OC ranges revealed that for surface layer, nearly 90%area had OC range b0.6% and rating value of 0.90. Whereas forsubsurface layer, 100% area was between OC range of 0.45–0.90% andtherefore had rating between 0.85–0.90. Analysis of data thussuggested that surface layer was only slightly deficient in OC butsubsurface layer wasmore deficient in OC, which could be a constraintfor production of succeeding wheat crop.
Physical rating index (PI) at each sampling pointwas determined bymultiplying the rating values for all five parameters. Reason formultiplication of individual rating values for computing the PI wasthat this index was an indicator of soil productivity. Large deviation inany of the individual parameter value from its optimum range couldbring down the yield drastically and such a response could only beobserved if the rating values of individual parameters were multiplied.
Rating maps of both surface (0–15 cm) and subsurface (15–30 cm)soil layers for wheat were prepared by using ordinary kriging withspherical semivariogram model (Fig. 7). It showed that more than 90%of surface layer had rating value between 0.4–0.7 indicating medium togood production potential , whereas for subsurface layer, all the studyarea had rating value b0.6 suggesting poor to medium productionpotential of the soil . It means that overall soil physical conditions of thefield (which is adversely affected by low PI of subsurface) was poor tomedium for wheat cultivation after rice and in order to increase soilproductivity for sustainable crop production, soil managementspractices such as subsurface chiseling and adding organic matterthrough manure and crop residue incorporation were essential.
3.3. Rating maps of soil physical properties for paddy cultivation
Rating maps of soil physical properties and PI for paddycultivations were also prepared by selecting most suitable interpola-tion techniques and semivariogram modeling. Rating map of BDshowed that most of surface layer (99.5%) had rating value N0.90,whereas for subsurface layer, all the study area had optimum BDrange, between 1.55–1.60 Mg m−3
, and rating value of 1 (Fig. 8).Rating maps of hydraulic conductivity also revealed that for surface
layer, nearly 96.2% area had Kfs ranges less than 0.20 cm h−1 withoptimumratingvaluebetween0.95–1.0 (Fig. 9). For subsurface layer, allthe study area had Kfs ranged b0.10 cm h−1 and had rating value of 1.0.High BD and low Kfs mainly in the subsurface were because of puddlingwhichwas carried out before rice transplanting for developing compactsubsurface zone required for reducing the percolation of standingwaterneeded by the crop during its growth.
According to prediction maps, optimum range for NCP in paddycultivations is b12.5%with rating value one (Fig. 10). For surface layer,only 76.10% of area had a good range (10.0–12.5%) with rating value0.90, and 23.90% of area had NCP range between 12.5–15.0% andrating value 0.85.For subsurface layer, around 90% of area had a goodrating value (0.90–1.0), where, NCP was b12.5%.
Prediction maps of OC (Fig. 11) revealed that for both surface andsubsurface layers, most of study area (N96.0%) had the optimum scoreof 1.0 as % OC range was b0.6. Decrease in %OC resulted in pooraggregation and reduction in saturated hydraulic conductivity andavailable water retention capacity of the soil.
Physical rating index (PI) maps for paddy cultivations also pre-pared by using ordinary kriging and spherical semivariogram modelfor both layers (Fig. 12). It showed that both surface and subsurfacelayers had PI values between 0.5–0.8. It means soil physical conditionsin the farm of the study area were good to very good for rice.
Linear regression analysis of PI and rice grain yield data (Fig. 13(a))showed there was a good correlation between them (R2=0.679).Similarly, linear regression analysis of PI and wheat grain yield data(Fig. 13(b)) also showed good correlation (R2=0.67) The results thussupported earlier findings that good soil physical health is essential foroptimum sustained crop production (Govaerts et al., 2006; Dufferaet al., 2007; Mohanty et al., 2007).
4. Conclusion
In the end it could be stated that computed soil physical health indexfor wheat and rice predicted the physical health scenario of farm fairlywell and showed good correlation with the crop yields. The overall soilphysical health of the farm was medium to good for paddy cultivationbut was not suitable for succeeding wheat crop mainly because ofincreasedBDand reducedKfs, NCP andAWRCof the farm.Based on thesefindings, appropriate management practices such as deep ploughing,organic matter incorporation through green manuring and growing ofleguminous deep rooted crops and less puddling before rice transplant-ing should be suggested for improving the soil health of the farm.
References
Aggarwal, P., Choudhury, B.U., 2005. Physical rating of soils of Delhi region for assessingtheir production potential. Indian J. Agric. Sci. 75, 513–515.
Anderson, J.C., Mitsch, J.W., Nairn, W.R., 2005. Temporal and spatial development ofsurface soil conditions at two created riverine marshes. J. Environ. Qual. 34,2072–2081.
Aparicio, V., Costa, J.L., 2007. Soil quality indicators under continuous cropping systemsin the Argentinean Pampas. Soil Tillage Res. 96, 155–165.
Arshad, M.A., Martin, S., 2002. Identifying critical limits for soil quality indicators in agroecosystems. Agric. Ecosyst. Environ. 88, 153–160.
Bai, Y.L., Jin, J.Y., Yang, L.P., He, P., 2001. Variability of soil nutrients in field and fertilizerrecommendation. Plant Nutri. Fert. Sci. 7, 129–133.
Baxter, S.J., Oliver, M.A., Gaunt, J., 2003. A geostatistical analysis of the spatial variationof soil mineral nitrogen and potentially available nitrogen within an arable field.Precision Agric. 4, 213–226.
303A.A. Amirinejad et al. / Geoderma 160 (2011) 292–303
Blake, G.R., Hartge, K.H., 1986. Bulk Density, In: Klute, A. (Ed.), Methods of Soil Analysis,Part I. Physical and Mineralogical Methods: Agronomy Monograph no. 9, 2nd ed. ,pp. 363–375.
Cambardella, C.A., Moorman, T.B., Novak, J.M., Parkin, T.B., Karlen, D.L., Turco, R.F.,Konopka, A.E., 1994. Field-scale variability of soil properties in central Iowa soils.Soil Sci. Soc. Am. J. 58, 1501–1511.
Chen, J., Yu, Z., Ouyang, J., van Mensvoort, M.E.F., 2006. Factors affecting soil qualitychanges in the North China Plain: a case study of Quzhou County. Agric. Syst. 91,171–188.
Doran, J.W., Jones, A.J. (Eds.), 1996. Methods for Assessing Soil Quality. : Soil ScienceSociety of America Special Publication, vol. 49. Soil Science Society of America,Madison, Wisconsin.
Doran, J.W., Parkin, T.B., 1994.DefiningandAssessingSoilQuality. In:Doran, J.W., Coleman,D.C., Bezdicek, D.F., Stewart, B.A. (Eds.), Defining Soil Quality for a SustainableEnvironment. : Soil Science Society of America Special Publication, vol. 35. Soil ScienceSociety of America, Madison, Wisconsin, pp. 3–21.
Duffera,M.,White, J.G.,Weisz, R., 2007. Spatial variability of SoutheasternU.S. Coastal Plainsoil physical properties: implications for site-specific management. Geoderma 137,327–339.
Elrick, D.E., Reynolds, W.D., 1992. Methods for analyzing constant-head wellpermeameter data. Soil Sci. Soc. Am. J. 56, 320–323.
Francisca, L.G., Montserrat, J.E., Silvia, A., Alfonso, G.F., Manuel, S.O., Luis, G.T., 2002.Spatial variability of agricultural soil parameters in southern Spain. Plant Soil 246,97–105.
Glover, J.D., Reganold, J.P., Andrews, P.K., 2000. Systematic method for rating soilquality of conventional, organic and integrated apple orchards in WashingtonState. Agric. Ecosyst. Environ. 80, 29–45.
Govaerts, B., Sayre,K.D., Deckers, J., 2006. Aminimumdata set for soil quality assessment ofwheat and maize in the highlands of Mexico. Soil Tillage Res. 87, 163–174.
Gupta, R.P., Abrol, I.P., 1993. A study of some tillage practices for sustainable cropproduction in India. Soil Tillage Res. 27, 253–273.
Harris, R.F., Karlen, D.L., Mulla, D.J., 1996. A Conceptual Framework for Assessment andManagement of Soil Quality and Health. In: Doran, J.W., Jones, A.L. (Eds.), Methodsfor Assessing Soil Quality. SSSA Special Publication No. 49, ASA and SSSA, pp. 61–82.Madison, WI.
Huang, S.W., Jin, J.Y., 2002. Advance in study on spatial variability of soil chemicalproperties. Soils Fert. 1, 8–14.
Huang, S.W., Jin, J.Y., Yang, L.P., Bai, Y.L., 2006. Spatial variability of soil nutrients andinfluencing factors in a vegetable production area of Hebei Province in China. Nutr.Cycling Agroecosyst. 75, 201–212.
Huddleston, J.H., 1984. Development and use of soil productivity ratings in the UnitedStates. Geoderma 32, 297–317.
Hussain, I., Olson, K.R., Wander, M.M., Karlen, D.L., 1999. Adaptation of soil qualityindices and application to three tillage systems in southern Illinois. Soil Tillage Res.50, 237–249.
Imaz, M.J., Virto, I., Bescansa, P., Enrique, A., Fernandez-Ugalde, O., Karlen, D.L., 2010.Soil quality indicator response to tillage and residue management on semi-aridMediterranean cropland. Soil Tillage Res. 107, 17–25.
Iqbal, J., Thomasson, A.J., Jenkins, N.J., Owens, R.P., Whisler, D.F., 2005. Spatial variabilityanalysis of soil physical properties of alluvial soils. Soil Sci. Soc. Am. J. 69, 1338–1350.
Jin, J.Y., Jiang, C., 2002. Spatial variability of soil nutrients and site specific nutrientmanagement in the PR China. Comput. Electron. Agric. 36, 165–172.
Karlen, D.L., Stott, D.E., 1994. A Framework for Evaluating Physical and ChemicalIndicators of Soil Quality. In: Doran, J.W., Coleman, D.C., Bezdicek, D.F., Stewart, B.A.(Eds.), Defining Soil Quality for a Sustainable Environment. SSSA SpecialPublication No. 35, ASAand SSSA, pp. 53–72. Madison, WI.
Karlen, D.L., Wollenhaupt, N.C., Erbach, D.C., Berry, E.C., Swan, J.B., Eash, N.S., Jordahl, J.L.,1994. Crop residue effects on soil quality following 10-years of no-till corn. Soil TillageRes. 31, 149–167.
Karlen, D.L., Andrews, S.S., Doran, J.W., 2001. Soil quality: current concepts andapplications. Adv. Agron. 74, 1–40.
Kılıç, K., Özgözb, E., Akba, F., 2004. Assessment of spatial variability in penetrationresistance as related to some soil physical properties of two fluvents in Turkey. SoilTillage Res. 76, 1–11.
Masto, R.E., Chhonkar, P.K., Singh, D., Patra, A.K., 2007. Soil quality response to long-termnutrient and cropmanagement on a semi-arid Inceptisol. Agric. Ecosyst. Environ. 118,130–142.
Miller, F.P., 1979. Defining, Delineating and Designating Uses for Prime and UniqueAgricultural Lands. P.291-318. In: Beatty, M.T., Peterson, G.W., Swindale, L.D. (Eds.),Planning the uses and management of land. Madison. WI, Soil Science Society ofAmerica.
Mohanty, M., Painuli, D.K., Misra, A.K., Ghosh, P.K., 2007. Soil quality effects of tillageand residue under rice–wheat cropping on a Vertisol in India. Soil Tillage Res. 92,243–250.
Mulla, D.J., McBratney, A.B., 2002. Soil Spatial Variability. In: Warrick, A.W. (Ed.), SoilPhysics Companion.
L.L. Neill, An evaluation of soil productivity based on root growth and water depletion.M.S. Thesis. University of Missouri, Columbia, MO, 1979.
Operatingmanual of pressure plate apparatus by Soil moisture Equipment Corporation, USA.Pierce, F.J., Larson, W.E., 1993. Developing Criteria to Evaluate Sustainable Land
Management. In: Kimble, J.M. (Ed.), Proceedings of the Eighth International SoilManagementWorkshop: Utilization of Soil survey Information for Sustainable LandUse, May 3, 1993. USDA Soil Conservation Service, National Soil Survey Center,Lincoln, NE, pp. 7–14.
Reynolds, W.D., 1993. Saturated Hydraulic Conductivity: Field Measurement. In: Carter,M.R. (Ed.), Soil Sampling and Methods of Analysis. Canadian Soc, Soil Sci, LewisPublishers, Boca Raton, pp. 599–613.
Reynolds, W.D., Elrick, D.E., 1986. A method for simultaneous in situ measurement inthe vadose zone of field-saturated hydraulic conductivity, sorptivity and theconductivity-pressure head relationship. Ground Water Monit. Rev. 6, 84–95.
Rezaei, S.A., Gilkes, R.J., Andrews, S.S., 2006. A minimum data set for assessing soilquality in rangelands. Geoderma 136, 229–234.
Richards, L.A., Fireman, M., 1943. Pressure-plate apparatus for measuring moisturesorption and transmission by soils. Soil Sci. 56, 395–406.
Schjønning, P., Elmholt, S., Christensen, B.T., 2004. Soil Quality Management — Synthesis.In: Schjønning, P., Elmholt, S., Christensen, B.T. (Eds.), Managing Soil Quality:Challenges in Modern Agriculture. CABI Publishing, Wallingford, UK, pp. 315–334.
Shukla, M.K., Lal, R., Ebinger, M., 2006. Determining soil quality indicators by factoranalysis. Soil Tillage Res. 87, 194–204.
Smith, J.L., Halvorson, J.J., Papendick, R.I., 1993. Usingmultiple variable indicator krigingfor evaluating soil quality. Soil Sci. Soc. Am. J. 57, 743–749.
Sparling, G., Schipper, L., 2004. Soil quality monitoring in New Zealand: trends andissues arising from a broad-scale survey. Agric. Ecosyst. Environ. 104, 545–552.
Walkley, A., Black, C.A., 1934. An examination of Degtareff method for determining soilorganic matter and a proposed modification of the chromic acid titration method.Soil Sci. 37, 29–38.
Warkentin, B.P., 1995. The changing concept of soil quality. J. SoilWater Conserv. 50, 26–228.Wilcox, L.V., 1951. A method for calculating the saturation percentage from the weight
of a known volume of saturated soil paste. Soil Sci. 72, 233–238.Wymore, A.W., 1993. Model-Based Systems Engineering. An Introduction to the
Mathematical Theory of Discrete Systems and to the Tricotyledon Theory of SystemDesign. CRC, Boca Raton, FL.
Copyright © 2022 FDOKUMEN