Assessment and exemplary solutions for cost reduction in the ...
214
Solution sets for the Cost reduction of new Nearly Zero‐Energy Buildings – CoNZEBs EU H2020‐EE‐2016‐CSA Projekt ID: 754046 Assessment and exemplary solutions for cost reduction in the design and construction process Deliverable D3.1 Authors: Michele Zinzi, Benedetta Mattoni, Gaetano Fasano (ENEA) Heike Erhorn‐Kluttig, Micha Illner, Antje Bergmann, Hans Erhorn (Fraunhofer IBP) Ove C. Mørck, Ole Balslev‐Olesen (Kuben Management) Kirsten Engelund Thomsen, Kim B. Wittchen (SBi/AAU) Marjana Šijanec Zavrl, Neva Jejčič, Marko Jaćimović (ZRMK)
-
Upload
khangminh22 -
Category
Documents
-
view
1 -
download
0
Transcript of Assessment and exemplary solutions for cost reduction in the ...
Solution sets for the Cost reduction of new
Nearly Zero‐Energy Buildings – CoNZEBs
EU H2020‐EE‐2016‐CSA
Projekt ID: 754046
Assessment and exemplary solutions for cost reduction in the design and
construction process Deliverable D3.1
Authors:
Michele Zinzi, Benedetta Mattoni, Gaetano Fasano (ENEA)
Heike Erhorn‐Kluttig, Micha Illner, Antje Bergmann, Hans Erhorn (Fraunhofer IBP)
Ove C. Mørck, Ole Balslev‐Olesen (Kuben Management)
Kirsten Engelund Thomsen, Kim B. Wittchen (SBi/AAU)
Marjana Šijanec Zavrl, Neva Jejčič, Marko Jaćimović (ZRMK)
Disclaimer:
The CoNZEBs project has received funding from the European Union’s Horizon 2020
research and innovation programme under grant agreement no. 754046.
The report reflects the author’s view. The Commission is not responsible for any use that
may be made of the information it contains.
Date: 16/10/18
Title page:
© shutterstock / Franck Boston
EU H2020 754046 CoNZEBs
D3.1: Assessment & proposal for cost reduction in the design & construction process 3
Content
About CoNZEBs ........................................................................................................................... 7
1. Introduction ...................................................................................................................... 9
2. Actual costs in the design and construction process ...................................................... 11
2.1. The case of Italy .................................................................................................. 11
2.1.1. Design and planning costs .................................................................... 12
2.1.2. Construction process costs ................................................................... 19
2.2. The case of Denmark........................................................................................... 24
2.2.1. Design and planning costs .................................................................... 26
2.2.2. Construction process costs ................................................................... 28
2.3. The case of Germany .......................................................................................... 30
2.3.1. Design and planning costs .................................................................... 32
2.3.2. Construction process costs ................................................................... 35
2.4. The case of Slovenia ............................................................................................ 37
2.4.1. Design and planning costs .................................................................... 38
2.4.2. Construction process costs ................................................................... 43
2.5. Design and planning costs in other European Countries .................................... 44
2.5.1. France ................................................................................................... 45
2.5.2. England ................................................................................................. 45
2.5.3. Spain ...................................................................................................... 46
2.5.4. Ireland ................................................................................................... 47
2.5.5. Poland ................................................................................................... 47
2.5.6. Switzerland ........................................................................................... 47
2.6. Construction process costs in other European Countries .................................. 49
2.7. Summary of actual costs in the design and construction process ...................... 59
3. Identification of common boundary conditions and areas for potential cost
reduction ......................................................................................................................... 61
3.1. The design and construction process actors ...................................................... 61
3.2. The social housing framework ............................................................................ 62

EU H2020 754046 CoNZEBs
D3.1: Assessment & proposal for cost reduction in the design & construction process 4
3.3. The construction site: organisation and worker skills ........................................ 63
3.4. Supporting instruments ...................................................................................... 65
3.4.1. Test and inspections to assure the compliance of work with the
design specification .............................................................................. 65
3.4.2. The Energy Performance Contract ....................................................... 67
3.4.3. Technical commissioning ...................................................................... 68
3.5. Conclusions ......................................................................................................... 70
4. Exploring possible solutions for cost reductions in the design and construction
process ............................................................................................................................ 71
4.1. Implementation of the questionnaire ................................................................ 71
4.2. Italian results ....................................................................................................... 73
4.2.1. Results of the design questionnaires .................................................... 73
4.2.2. Results of the construction questionnaires .......................................... 81
4.3. Danish results ...................................................................................................... 89
4.3.2. Results of the design questionnaires .................................................... 89
4.3.3. Results of the construction questionnaires .......................................... 94
4.4. German results .................................................................................................. 100
4.4.1. Results of the design questionnaires .................................................. 100
4.4.2. Results of the construction questionnaires ........................................ 106
4.5. Slovenian results ............................................................................................... 108
4.5.1. Results of the design questionnaires .................................................. 109
4.5.2. Results of the construction questionnaires ........................................ 117
4.6. Summary of the results of design and construction questionnaires in the
four countries .................................................................................................... 121
5. Exemplary solution to optimise the design and construction process ........................ 125
5.1. Reducing design and construction process cost with building envelope
and building system technologies ..................................................................... 125
5.1.1. The case of large autoclaved concrete blocks in Italy ........................ 126
5.1.2. The case of mono‐block windows in Italy ........................................... 128
5.1.3. Reducing construction process cost by integrating renewable
energy and building technologies ....................................................... 130
5.1.4. Hygro‐sensible ventilation .................................................................. 132
EU H2020 754046 CoNZEBs
D3.1: Assessment & proposal for cost reduction in the design & construction process 5
5.2. Reducing design and construction process cost with specific design
solutions ............................................................................................................ 134
5.2.1. Design of passive cooling solutions to avoid overheating and
active air‐conditioning systems .......................................................... 134
5.2.2. Use of external staircases to reduce costs ......................................... 137
5.2.3. Alternative design for space heating system in NZEBs ....................... 139
5.2.4. Structural cross‐laminated timber for the building envelope ............ 144
5.3. Reducing design and construction process cost with innovative project
management solutions ..................................................................................... 149
5.4. Conclusions ....................................................................................................... 154
6. Lessons learned ............................................................................................................. 156
7. References .................................................................................................................... 159
Annex ‐ Questionnaires in English and in participant countries languages ........................... 167
English design process questionnaire ........................................................................... 168
English construction process questionnaire ................................................................. 174
Italian design process questionnaire ............................................................................ 179
Italian construction process questionnaire .................................................................. 184
Danish design process questionnaire ........................................................................... 189
Danish construction process questionnaire ................................................................. 194
German design process questionnaire ......................................................................... 196
German construction process questionnaire ............................................................... 202
Slovenian design and construction process questionnaire .......................................... 207

EU H2020 754046 CoNZEBs
D3.1: Assessment & proposal for cost reduction in the design & construction process 6
EU H2020 754046 CoNZEBs
D3.1: Assessment & proposal for cost reduction in the design & construction process 7
About CoNZEBs
This report is one of the outcomes of the work within CoNZEBs. CoNZEBs is a EU Horizon
2020 project on the topic ‘Cost reduction of new Nearly Zero‐Energy buildings‘ (call
H2020‐EE‐2016‐CSA, topic EE‐13‐2016). As such it receives co‐funding by the European
Union under the Grant Agreement No. 750046. The project period is from 01/06/17 to
30/11/19.
The planned work can be summarised as follows:
CoNZEBs identifies and assesses technology solution sets that lead to significant cost
reductions of new Nearly Zero‐Energy Buildings (NZEBs). The focus of the project is on multi‐
family houses. Close cooperation with housing associations allows for an intensive
interaction with stakeholders and tenants. The project starts by setting baseline costs for
conventional new buildings, currently available NZEBs and buildings that go beyond the
NZEB level based on the experience of the consortium. It analyses planning and construction
processes to identify possible cost reductions.
An investigation of end‐users' experiences and expectations together with a guide on
co‐benefits of NZEBs promotes living in these buildings and enhances the energy
performance by conducive user behaviour.
The technology solution sets include approaches that can reduce costs for installations or
generation systems, pre‐fabrication and construction acceleration, local low temperature
district heating including RES, and many more. All solution sets are assessed regarding cost
savings, energy performance and applicability in multi‐family houses. A life cycle assessment
of different building levels and NZEBs using the solution sets provides a longer‐term
perspective.
Communication to stakeholders and dissemination of the project results includes events and
discussions with the national housing associations.
EU H2020 754046 CoNZEBs
D3.1: Assessment & proposal for cost reduction in the design & construction process 8
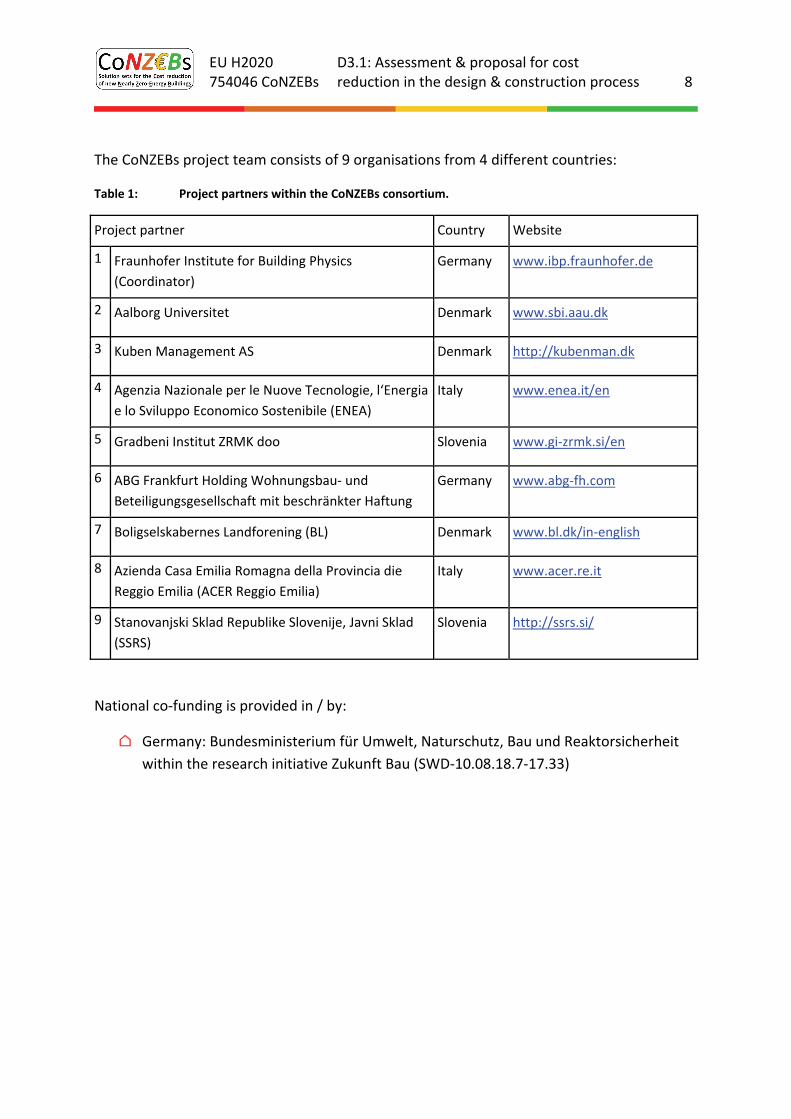
The CoNZEBs project team consists of 9 organisations from 4 different countries:
Table 1: Project partners within the CoNZEBs consortium.
Project partner Country Website
1 Fraunhofer Institute for Building Physics
(Coordinator)
Germany www.ibp.fraunhofer.de
2 Aalborg Universitet Denmark www.sbi.aau.dk
3 Kuben Management AS Denmark http://kubenman.dk
4 Agenzia Nazionale per le Nuove Tecnologie, l‘Energia
e lo Sviluppo Economico Sostenibile (ENEA)
Italy www.enea.it/en
5 Gradbeni Institut ZRMK doo Slovenia www.gi‐zrmk.si/en
6 ABG Frankfurt Holding Wohnungsbau‐ und
Beteiligungsgesellschaft mit beschränkter Haftung
Germany www.abg‐fh.com
7 Boligselskabernes Landforening (BL) Denmark www.bl.dk/in‐english
8 Azienda Casa Emilia Romagna della Provincia die
Reggio Emilia (ACER Reggio Emilia)
Italy www.acer.re.it
9 Stanovanjski Sklad Republike Slovenije, Javni Sklad
(SSRS)
Slovenia http://ssrs.si/
National co‐funding is provided in / by:
⌂ Germany: Bundesministerium für Umwelt, Naturschutz, Bau und Reaktorsicherheit
within the research initiative Zukunft Bau (SWD‐10.08.18.7‐17.33)
EU H2020 754046 CoNZEBs
D3.1: Assessment & proposal for cost reduction in the design & construction process 9
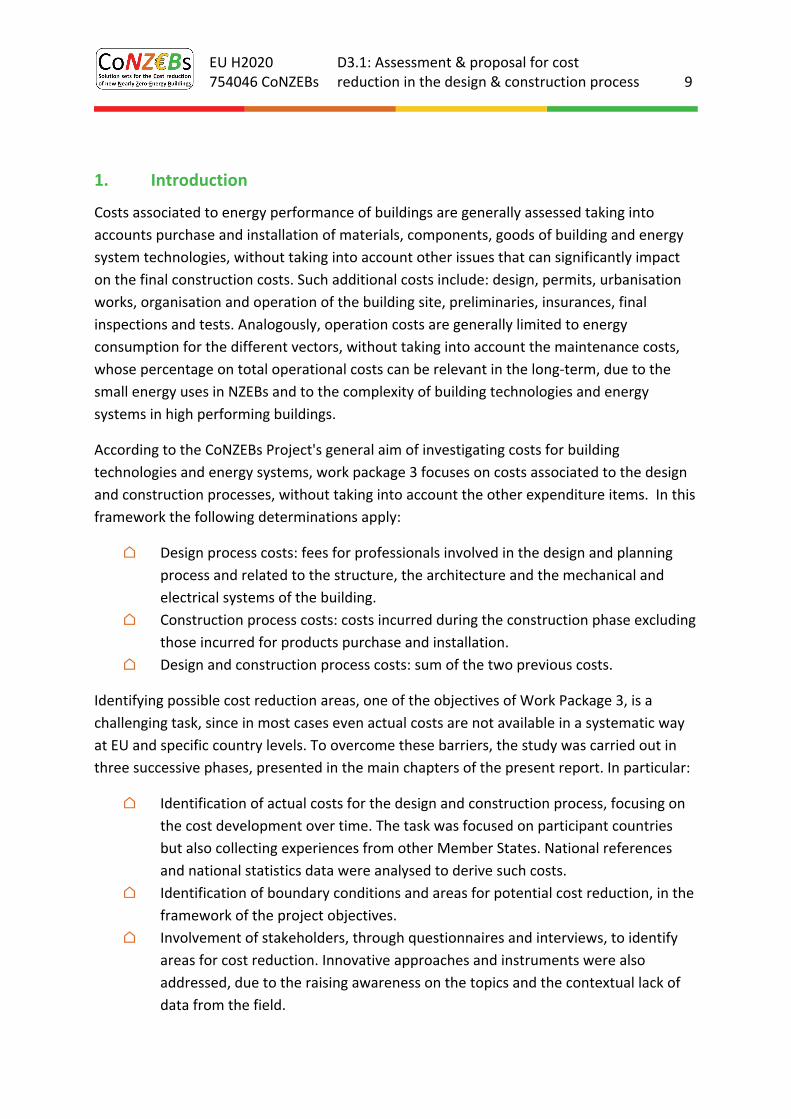
1. Introduction
Costs associated to energy performance of buildings are generally assessed taking into
accounts purchase and installation of materials, components, goods of building and energy
system technologies, without taking into account other issues that can significantly impact
on the final construction costs. Such additional costs include: design, permits, urbanisation
works, organisation and operation of the building site, preliminaries, insurances, final
inspections and tests. Analogously, operation costs are generally limited to energy
consumption for the different vectors, without taking into account the maintenance costs,
whose percentage on total operational costs can be relevant in the long‐term, due to the
small energy uses in NZEBs and to the complexity of building technologies and energy
systems in high performing buildings.
According to the CoNZEBs Project's general aim of investigating costs for building
technologies and energy systems, work package 3 focuses on costs associated to the design
and construction processes, without taking into account the other expenditure items. In this
framework the following determinations apply:
⌂ Design process costs: fees for professionals involved in the design and planning
process and related to the structure, the architecture and the mechanical and
electrical systems of the building.
⌂ Construction process costs: costs incurred during the construction phase excluding
those incurred for products purchase and installation.
⌂ Design and construction process costs: sum of the two previous costs.
Identifying possible cost reduction areas, one of the objectives of Work Package 3, is a
challenging task, since in most cases even actual costs are not available in a systematic way
at EU and specific country levels. To overcome these barriers, the study was carried out in
three successive phases, presented in the main chapters of the present report. In particular:
⌂ Identification of actual costs for the design and construction process, focusing on
the cost development over time. The task was focused on participant countries
but also collecting experiences from other Member States. National references
and national statistics data were analysed to derive such costs.
⌂ Identification of boundary conditions and areas for potential cost reduction, in the
framework of the project objectives.
⌂ Involvement of stakeholders, through questionnaires and interviews, to identify
areas for cost reduction. Innovative approaches and instruments were also
addressed, due to the raising awareness on the topics and the contextual lack of
data from the field.
EU H2020 754046 CoNZEBs
D3.1: Assessment & proposal for cost reduction in the design & construction process 10
⌂ Description of technological and methodological solutions to optimise the design
and construction process, to be considered as exemplary measure to implement
future assessment method based on costs related to the whole construction
process.
The findings and results of this work can be used in support of the technical solutions sets
for the cost reduction of NZEBs identified by CoNZEBs (see work package 5) and may open
new research scenarios, where energy and cost performances of NZEBs might be assessed at
a broader level with respect to actual approaches and methods.
EU H2020 754046 CoNZEBs
D3.1: Assessment & proposal for cost reduction in the design & construction process 11
2. Actual costs in the design and construction process
This chapter explores the actual situation for costs in the design and construction processes
in the participating countries. The depth of the available information is strictly related to the
way information are collected and normalised in a specific state, hence the results may differ
from country to country. A section of this chapter is dedicated to other EU countries not
represented in the CoNZEBs project. The results of the analysis are the basis to develop
eventual scenarios for cost reduction in the design and construction phases.
Concerning the design and planning process, the main work group of specialists involved in
the design phase generally includes: architects, structural engineers and service (mechanical
and electricity) engineers. Additional specialists may be also required depending on the
characteristics and the nature of the project (i.e. technical consultants, local consultants, fire
engineers, costs consultants and contractors, legal consultants). The fees of these additional
specialists are even more complicated to be quantified and may not be included within the
main design fees. Equally, also the payment of ancillary costs (i.e. expenses for travelling)
may be excluded from the main design fees and be computed separately.
Concerning the construction process, a critical issue to deal with is the construction cost
development over time, eventually disaggregated according to the different cost items, since
this information could have an influence on the identification of solutions for cost reduction
in the process. Another aspect is the identification of works associated to the building site
operations: transport, rents, preparation of the building site, connection with public service
for the construction phase (electricity, water….), board and lodging of workers, professionals
involved in the construction process (e.g. site manager of the construction company and
works director appointed by the client). This information can be useful to quantify potential
cost savings when applying solutions that can reduce the duration of the building site and
the associated costs.
2.1. The case of Italy
The construction sector is one of the most important industry sectors in Italy, with an
investment of 122 billion Euro in 2016; the investment in the residential construction sector
was 66 B€ in the same year. The situation, however, is still suffering from the long crisis that
heavily hit the country in the last decade, with first positive figures registered in 2017.
Concerning the objectives of CoNZEBs project, it can be observed that refurbishment and
maintenance investments in the 2007‐2017 period increased by 20%, while investments in
new houses decreased by 64% in the same period. It is expected that 55,000 building
permits will be issued in 2017. This is an inversion of the negative trend of the last years.
However, these figures remain very low in a country with 24 million dwellings and 0.2% of
EU H2020 754046 CoNZEBs
D3.1: Assessment & proposal for cost reduction in the design & construction process 12
these as new constructions per year). To give a temporal comparison of the severe economic
context, the amount of new building permits is lower than any year since 1936 (excluding
the year of World War Two). For 2018 a 2.8% increment respect to 2017 is estimated. To
push the new residential building market, the national association of construction
companies (ANCE) is asking for financial support measures for the urban regeneration, in
which new energy efficient houses will play a key role.
In this context the national trends for design and construction costs are investigated, with
the objective of detecting possible areas for cost reduction, according to the actual and
future Italian framework.
2.1.1. Design and planning costs
The costs for the design and planning in the construction sector are defined at national level
by the decree issued by the Ministry of Justice, in concert with the Ministry of
Infrastructures and Transports adopted according to the updated national Public
Procurement Code as established by the decree Law n.50/2016 [1]. The decree fixes the fees
related to all aspects of the design process and the involved professional categories in the
construction sector (from geological prospecting to planning of safety during construction
and maintenance during operation). According to the cost categories taken into account in
CoNZEBs (i.e. civil works and technical systems), the figures involved in the design phase
include graduate professionals (architects and engineers), as well as surveyors and technical
experts.
According to the decree, the fees for the design fee (PF), expressed as a percentage of the
total construction costs, can be calculated using the following formula:
∗ ∗ ∗
where:
V: Value of the work according to the specific category cost
G: Parameter related to the complexity of the task
Q: Parameter related to the specificity of the task
P: Parameter which is a function of the value of the work, calculated according to the
following equation
0.0310.
EU H2020 754046 CoNZEBs
D3.1: Assessment & proposal for cost reduction in the design & construction process 13
The decree also fixes maximum amounts: 25% for works up to 1 million € and 10% for works
above 25 million €; for intermediate construction costs, the maximum fee can be calculated
as linear interpolation of the previous two figures. In order to quantify the design fee for the
building typology covered in CoNZEBs, it was asked to the National Association of Architects
to simulate the design fees according to the decree indications. The analysis, carried out by
an architect on behalf of the Association, regarded a 12‐apartment building with a gross
floor area of 1,200 m2 (which also includes common areas, according to the way of assessing
the construction costs in Italy). The calculation was carried out for two reference climatic
zones of the national classification: D (reference city Rome having between 1401 and 2100
heating degree days with base 20°) and E (reference city Milan having between 2101 and
3000 heating degree days with base 20°). According to this input data, the ratio of the design
fees compared to the construction costs was 12%, with no difference between conventional
buildings and NZEBs.
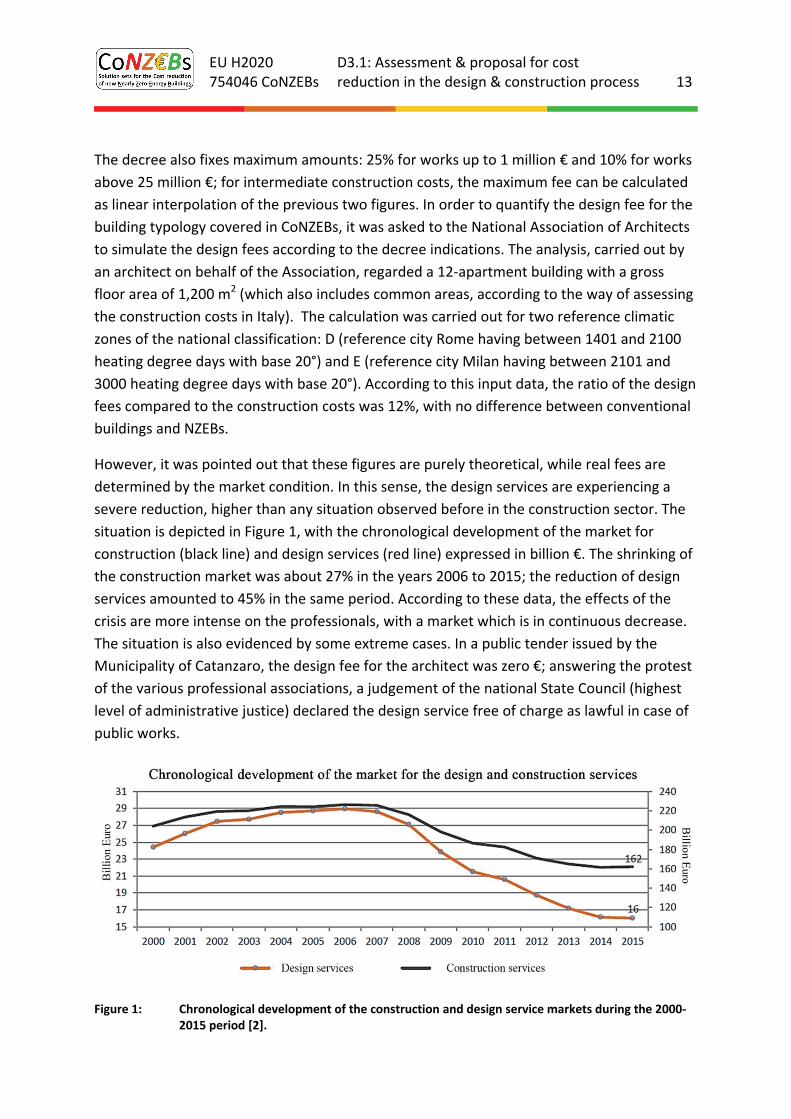
However, it was pointed out that these figures are purely theoretical, while real fees are
determined by the market condition. In this sense, the design services are experiencing a
severe reduction, higher than any situation observed before in the construction sector. The
situation is depicted in Figure 1, with the chronological development of the market for
construction (black line) and design services (red line) expressed in billion €. The shrinking of
the construction market was about 27% in the years 2006 to 2015; the reduction of design
services amounted to 45% in the same period. According to these data, the effects of the
crisis are more intense on the professionals, with a market which is in continuous decrease.
The situation is also evidenced by some extreme cases. In a public tender issued by the
Municipality of Catanzaro, the design fee for the architect was zero €; answering the protest
of the various professional associations, a judgement of the national State Council (highest
level of administrative justice) declared the design service free of charge as lawful in case of
public works.
Figure 1: Chronological development of the construction and design service markets during the 2000‐2015 period [2].
EU H2020 754046 CoNZEBs
D3.1: Assessment & proposal for cost reduction in the design & construction process 14
To provide data more coherent to the real market conditions for the design fees of multi‐
family houses (MFH), it was decided to collect practical experiences from experts working in
the sector. In the questionnaires presented in chapter 3, costs for the design of new MFHs
were asked. Answers were received from:
⌂ 18 individual designers/planners;
⌂ 25 design/planning offices;
⌂ 8 construction companies with design/planning experience.
Moreover four other stakeholders were invited to submit their experience, and among them
also the association of construction companies of Reggio Emilia, in Emilia Romagna region.
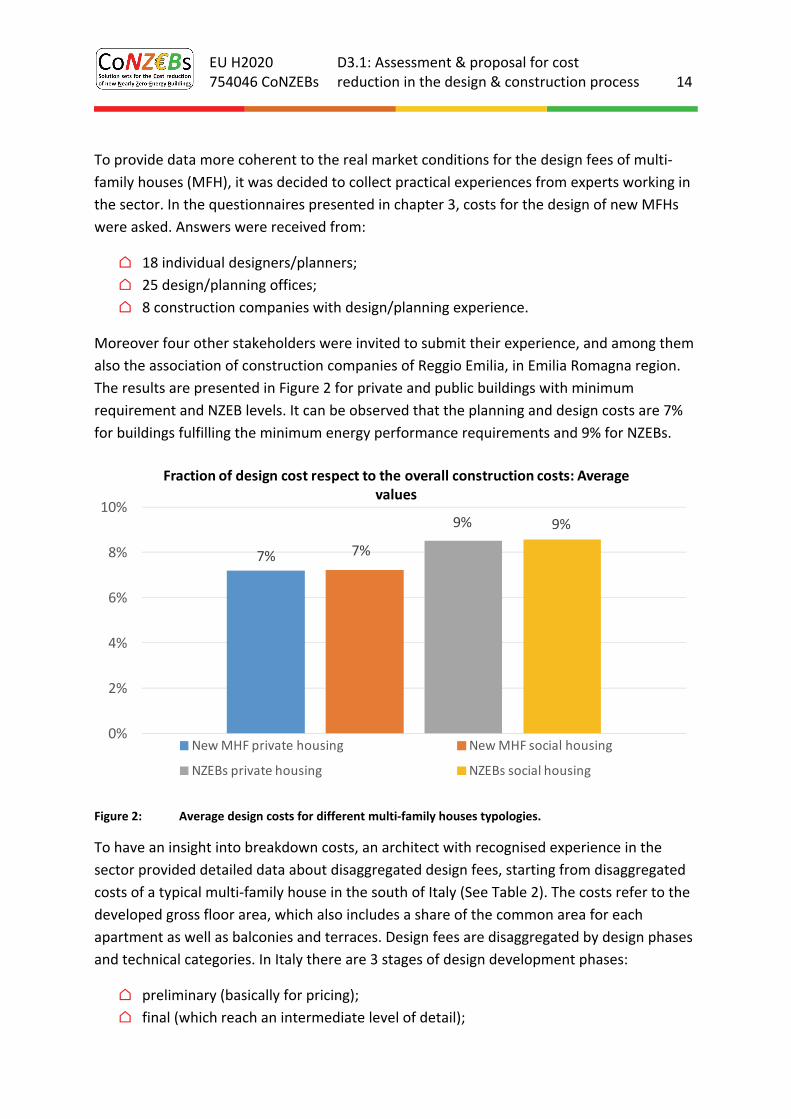
The results are presented in Figure 2 for private and public buildings with minimum
requirement and NZEB levels. It can be observed that the planning and design costs are 7%
for buildings fulfilling the minimum energy performance requirements and 9% for NZEBs.
Figure 2: Average design costs for different multi‐family houses typologies.
To have an insight into breakdown costs, an architect with recognised experience in the
sector provided detailed data about disaggregated design fees, starting from disaggregated
costs of a typical multi‐family house in the south of Italy (See Table 2). The costs refer to the
developed gross floor area, which also includes a share of the common area for each
apartment as well as balconies and terraces. Design fees are disaggregated by design phases
and technical categories. In Italy there are 3 stages of design development phases:
⌂ preliminary (basically for pricing);
⌂ final (which reach an intermediate level of detail);
7% 7%
9% 9%
0%
2%
4%
6%
8%
10%
Fraction of design cost respect to the overall construction costs: Average values
New MHF private housing New MHF social housing
NZEBs private housing NZEBs social housing
EU H2020 754046 CoNZEBs
D3.1: Assessment & proposal for cost reduction in the design & construction process 15
⌂ detailed (which include the working the working drawings).
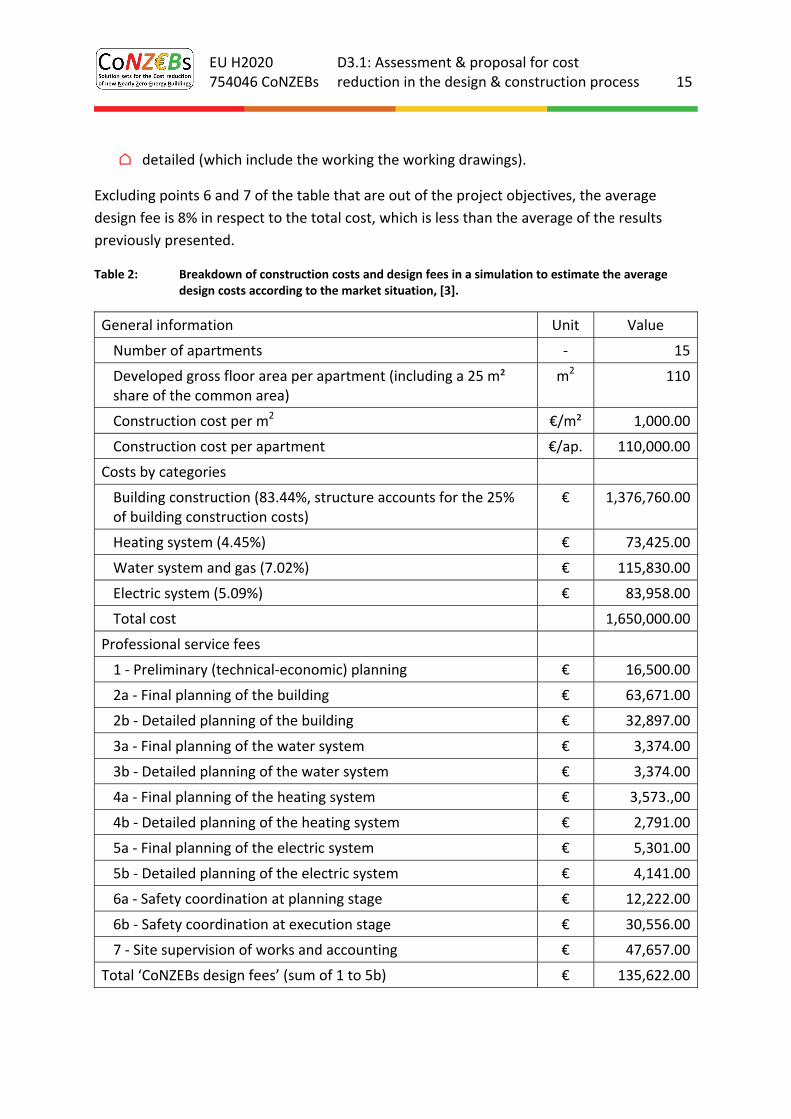
Excluding points 6 and 7 of the table that are out of the project objectives, the average
design fee is 8% in respect to the total cost, which is less than the average of the results
previously presented.
Table 2: Breakdown of construction costs and design fees in a simulation to estimate the average design costs according to the market situation, [3].
General information Unit Value
Number of apartments ‐ 15
Developed gross floor area per apartment (including a 25 m² share of the common area)
m2 110
Construction cost per m2 €/m² 1,000.00
Construction cost per apartment €/ap. 110,000.00
Costs by categories
Building construction (83.44%, structure accounts for the 25% of building construction costs)
€ 1,376,760.00
Heating system (4.45%) € 73,425.00
Water system and gas (7.02%) € 115,830.00
Electric system (5.09%) € 83,958.00
Total cost 1,650,000.00
Professional service fees
1 ‐ Preliminary (technical‐economic) planning € 16,500.00
2a ‐ Final planning of the building € 63,671.00
2b ‐ Detailed planning of the building € 32,897.00
3a ‐ Final planning of the water system € 3,374.00
3b ‐ Detailed planning of the water system € 3,374.00
4a ‐ Final planning of the heating system € 3,573.,00
4b ‐ Detailed planning of the heating system € 2,791.00
5a ‐ Final planning of the electric system € 5,301.00
5b ‐ Detailed planning of the electric system € 4,141.00
6a ‐ Safety coordination at planning stage € 12,222.00
6b ‐ Safety coordination at execution stage € 30,556.00
7 ‐ Site supervision of works and accounting € 47,657.00
Total ‘CoNZEBs design fees’ (sum of 1 to 5b) € 135,622.00
EU H2020 754046 CoNZEBs
D3.1: Assessment & proposal for cost reduction in the design & construction process 16
Going into details of the presented results and feedback of the contributor the following
relevant outcomes were found:
⌂ The difference of the design fees between minimum energy performance
requirements and nearly zero‐energy multi‐family houses is about 2%. It has to be
noted that the sources for the two building energy performance levels were
different. They were based on the experience of the offices and the professionals.
⌂ There is no significant dependency of the design fees in respect to the
geographical area. High design fees (8% and above) are indicated in the south and
in the north of the country.
⌂ There is an evidence of fee reductions for the construction companies with
internal design office, where average fees well below 5% are declared in two
cases. Similar fees apply for a case in Rome, where a design office that is able to
implement all design phases and tasks could optimise costs and offer competitive
fees to customers.
⌂ In the other cases the design processes involve different professionals in charge
of different aspects of the design (architecture and general planning, structure
and seismic safety, and mechanical, electric and energy systems). The fact
whether these professionals belong to the same office or to different companies
affect the final design fee.
It has to be noted that differences in building construction technologies between the two
energy performance levels basically are the amount of the applied insulation, which has no
impact on the complexity and, as a consequence, on the costs of the design process.
Conversely, according to current building and system technologies, as well as to feedback
from representatives of the construction sector, it can be observed that the increment of
design fees for NZEBs multi‐family houses may depend on the more complex and costly
energy systems, including the renewable energy production on site.
Therefore the national association of technical experts operating in the building sector
(CNPI) was asked to set‐up an exemplificative estimation of design fees for the energy
systems for a typical building. The study was carried out in a very detailed way for the
minimum energy performance requirements level and the NZEB level and for different
climatic conditions. The typical building consisted of 12 apartments and costs were provided
in EURO. In order to obtain the fees as ratio compared to the overall construction costs, the
amounts were scaled up to be in line with the typical building described in Table 2.
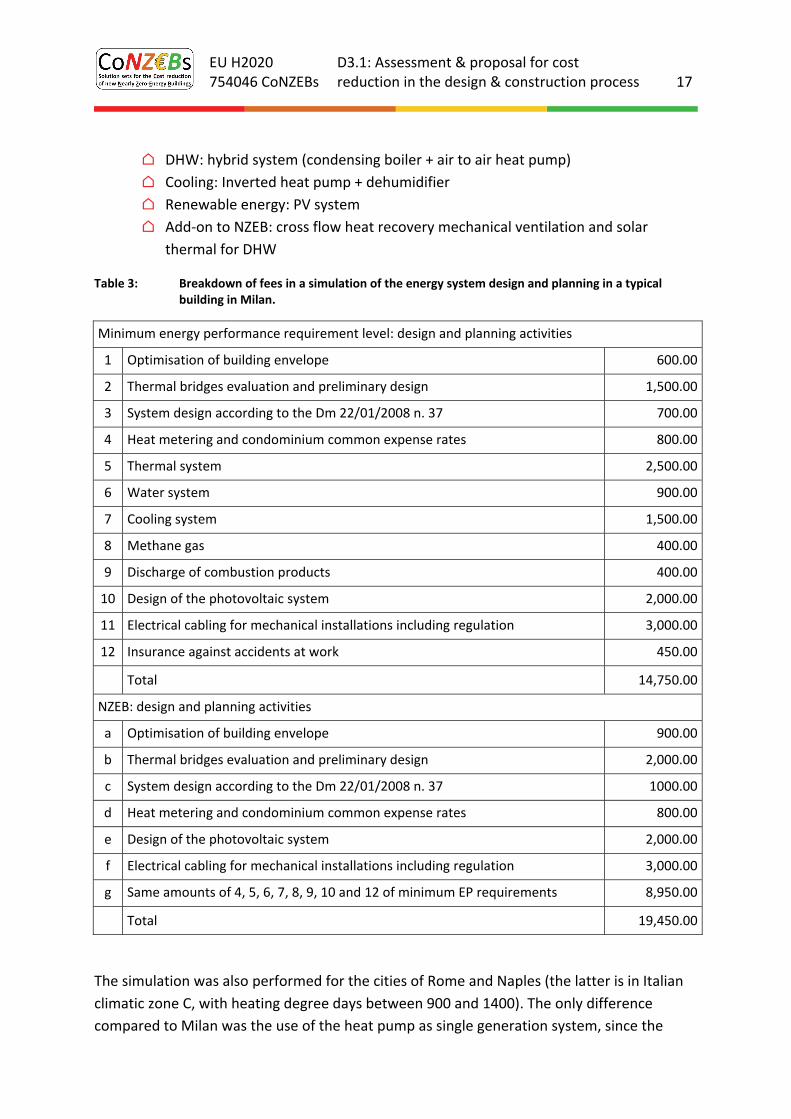
The results of the estimation are presented in Table 3 for the city of Milan, for which the
following centralised energy system configurations were considered:
⌂ Heating: hybrid system (air to air heat pump+ condensing boiler) generation,
heating floor.
EU H2020 754046 CoNZEBs
D3.1: Assessment & proposal for cost reduction in the design & construction process 17
⌂ DHW: hybrid system (condensing boiler + air to air heat pump)
⌂ Cooling: Inverted heat pump + dehumidifier
⌂ Renewable energy: PV system
⌂ Add‐on to NZEB: cross flow heat recovery mechanical ventilation and solar
thermal for DHW
Table 3: Breakdown of fees in a simulation of the energy system design and planning in a typical building in Milan.
Minimum energy performance requirement level: design and planning activities
1 Optimisation of building envelope 600.00
2 Thermal bridges evaluation and preliminary design 1,500.00
3 System design according to the Dm 22/01/2008 n. 37 700.00
4 Heat metering and condominium common expense rates 800.00
5 Thermal system 2,500.00
6 Water system 900.00
7 Cooling system 1,500.00
8 Methane gas 400.00
9 Discharge of combustion products 400.00
10 Design of the photovoltaic system 2,000.00
11 Electrical cabling for mechanical installations including regulation 3,000.00
12 Insurance against accidents at work 450.00
Total 14,750.00
NZEB: design and planning activities
a Optimisation of building envelope 900.00
b Thermal bridges evaluation and preliminary design 2,000.00
c System design according to the Dm 22/01/2008 n. 37 1000.00
d Heat metering and condominium common expense rates 800.00
e Design of the photovoltaic system 2,000.00
f Electrical cabling for mechanical installations including regulation 3,000.00
g Same amounts of 4, 5, 6, 7, 8, 9, 10 and 12 of minimum EP requirements 8,950.00
Total 19,450.00
The simulation was also performed for the cities of Rome and Naples (the latter is in Italian
climatic zone C, with heating degree days between 900 and 1400). The only difference
compared to Milan was the use of the heat pump as single generation system, since the
EU H2020 754046 CoNZEBs
D3.1: Assessment & proposal for cost reduction in the design & construction process 18
climatic condition does not require the installation of the back‐up boiler. In these cases the
costs for design and planning activities 7 and 8 of Table 3 are not necessary anymore. This
implies that the design fees in Rome and Naples were respectively: 13,950.00 € for the
minimum energy performance requirements configuration and 18,650.00 € for the NZEB.
The results of the simulation show that the ratio of the energy systems design costs on the
total construction costs is 1‐1.1% for the multi‐family houses built according to the minimum
energy performance requirements multi‐familyand 1.4‐1.5% for the nearly zero‐energy
houses. An additional simulation was run to identify the design and planning cost ratio in
case of individual energy systems instead of the centralised ones: differences were in the
0.1% range; hence they can be considered negligible. It has to be noted that these costs
might be further reduced for higher market competitiveness.
There is a significant difference between the two energy configurations the NZEB
configuration includes the mechanical ventilation and the solar thermal panels as additional
service systems compared to the conventional solution. The mechanical ventilation system
provides better indoor air quality, but this is not a mandatory requirement for residential
buildings in Italy: the NZEB requirements are met even without the mechanical ventilation
system. Without the additional fee for the mechanical ventilation system the costs for the
two configurations are practically the same (difference 0.1 ‐ 0.2%).
Based on the current cost survey for design and planning fees for multi‐family houses in
Italy, the following conclusions can be drawn:
⌂ According to the national legislative framework, the design fees should be about
12% of the total costs. Data derived from this source, however, seem to have
relevance only in lawsuits and legal disputes.
⌂ According to the collected results from …, the average design fee is between 7
and 9%, depending on the energy quality of the building. These figures are 30 ‐
40% lower than those indicated by legislative standards. These severe conditions
derived from the economic crisis and from the situation of the construction
sector in the country, including the always increasing number of professionals on
the market.
⌂ Lower design costs are observed in some cases. However, such reductions seem
to be intimately connected with specific working frameworks (design process
insourcing by the construction company) more than to be the result of an
optimisation process.
⌂ It is claimed that lowering fees for the design might have a negative impact on the
overall construction process; especially because poor design/planning quality is
one of the main causes for extra costs during construction.
EU H2020 754046 CoNZEBs
D3.1: Assessment & proposal for cost reduction in the design & construction process 19
⌂ Since 2018 the requirements of the national building code make the differences
between minimum requirements and NZEBs very small in terms of energy
performances. Hence differences in design fees will tend towards zero in a short
time. Moreover, as documented by dedicated studies, the energy related
design/planning costs are very small in relation to the overall construction costs
and further reduction should be carefully evaluated.
2.1.2. Construction process costs
The construction process for multi‐family houses in Italy is characterised by a traditional
approach, with a very low penetration level of industrialised systems and of information
technology‐based management. Some new approaches have been emerging in recent years,
as X‐lam wood technology, which is able to merge seismic safety and good energy
performance. However, such applications are too limited to be representative of a new
systematic construction method. Costs during the construction process can be summarised
as follows:
⌂ Direct costs including expenses directly used for the construction process:
⌂ Materials
⌂ Products
⌂ Labour
⌂ Indirect costs (also called preliminaries): These costs however include expenses not
related to the building site, as commercial and administrative costs which cannot be
directly imputed to the construction process itself. In this sense the indirect costs are
intended as " site overheads". They include expenses needed to carry out the works
on the site, typical examples are:
⌂ Site administration preparation and management of the building site;
⌂ Transport for workers and to supply and dismantle goods;
⌂ Rent of construction equipment, tools and vehicles;
⌂ Connection and costs to supply sources needed for works (water, lighting and
electricity);
⌂ Professionals involved in the construction process (building site manager, works
manager, final check experts)
⌂ Temporary facilities (site administration, roads, accommodation, etc.).
The ratio of indirect costs related to the total construction costs is dependent on a number
of factors: whether the company owns the equipment and does not need to rent; whether
they hire workers located near the site with consequent savings on their transport and
EU H2020 754046 CoNZEBs
D3.1: Assessment & proposal for cost reduction in the design & construction process 20
lodging; on the duration of the works, that affects cost of temporary facilities and so on.
Some examples of the ratio of indirect costs were collected:
⌂ 10% for two NZEB buildings in Treviso, north‐east of Italy, funded by the provincial
social housing association;
⌂ 3% as usual value for a construction company in Bari, south‐east of Italy, for
conventional and NZEB multi‐family houses (in this case only cost for rents are
included);
⌂ 5% as usual value for a construction company specialised on private single‐family
NZEB houses in Treviso, north‐east of Italy;
⌂ 5% for a private NZEB project in Turin, north‐west of Italy;
⌂ 7% for a social housing project in Catanzaro, south of Italy:
It has to be noted that the values listed above might not include all the expensed correlated
to preliminaries and that such data might not be representative of the Italian average. Some
useful national data about the process can be derived by the National Institute of Statistics
(ISTAT), which provide information about construction costs every three months. These
average costs are "measured" as the variation of a reference residential building, whose
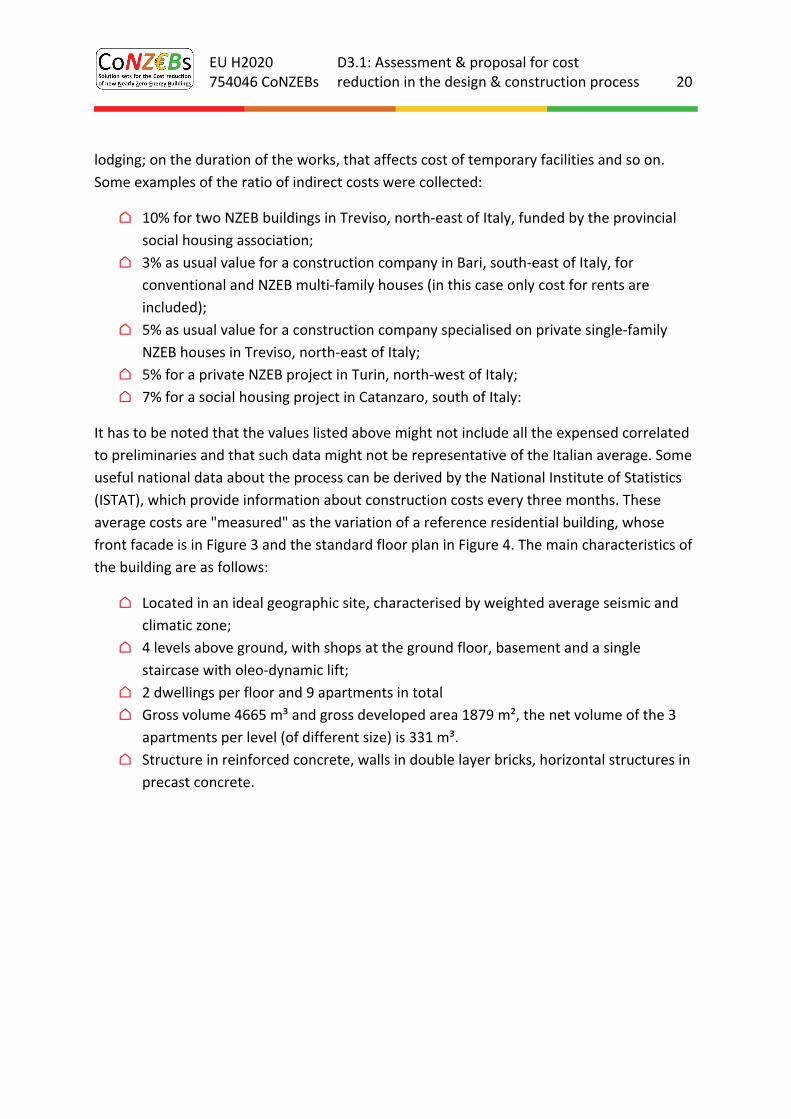
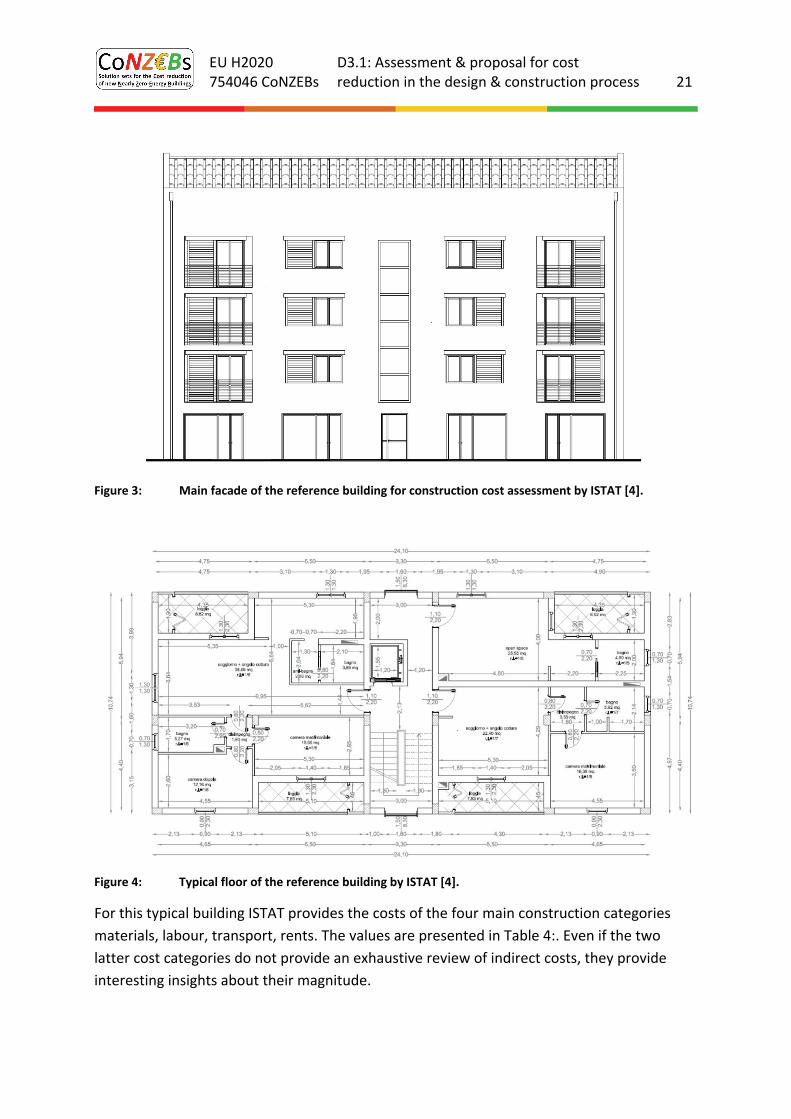
front facade is in Figure 3 and the standard floor plan in Figure 4. The main characteristics of
the building are as follows:
⌂ Located in an ideal geographic site, characterised by weighted average seismic and
climatic zone;
⌂ 4 levels above ground, with shops at the ground floor, basement and a single
staircase with oleo‐dynamic lift;
⌂ 2 dwellings per floor and 9 apartments in total
⌂ Gross volume 4665 m³ and gross developed area 1879 m², the net volume of the 3
apartments per level (of different size) is 331 m³.
⌂ Structure in reinforced concrete, walls in double layer bricks, horizontal structures in
precast concrete.
EU H2020 754046 CoNZEBs
D3.1: Assessment & proposal for cost reduction in the design & construction process 21
Figure 3: Main facade of the reference building for construction cost assessment by ISTAT [4].
Figure 4: Typical floor of the reference building by ISTAT [4].
For this typical building ISTAT provides the costs of the four main construction categories
materials, labour, transport, rents. The values are presented in Table 4:. Even if the two
latter cost categories do not provide an exhaustive review of indirect costs, they provide
interesting insights about their magnitude.
EU H2020 754046 CoNZEBs
D3.1: Assessment & proposal for cost reduction in the design & construction process 22
Table 4: Ratio of costs for different costruction categories for the reference building by ISTAT [4].
Ratio of costs [%]
Cost category Cost_base_2005 Cost_base_2010 Cost_base_2015
Material 39.0 43.6 42.0
Labour 54.4 51.6 53.1
Transport 1.7 1.1 1.0
Rents 4.9 3.7 3.7
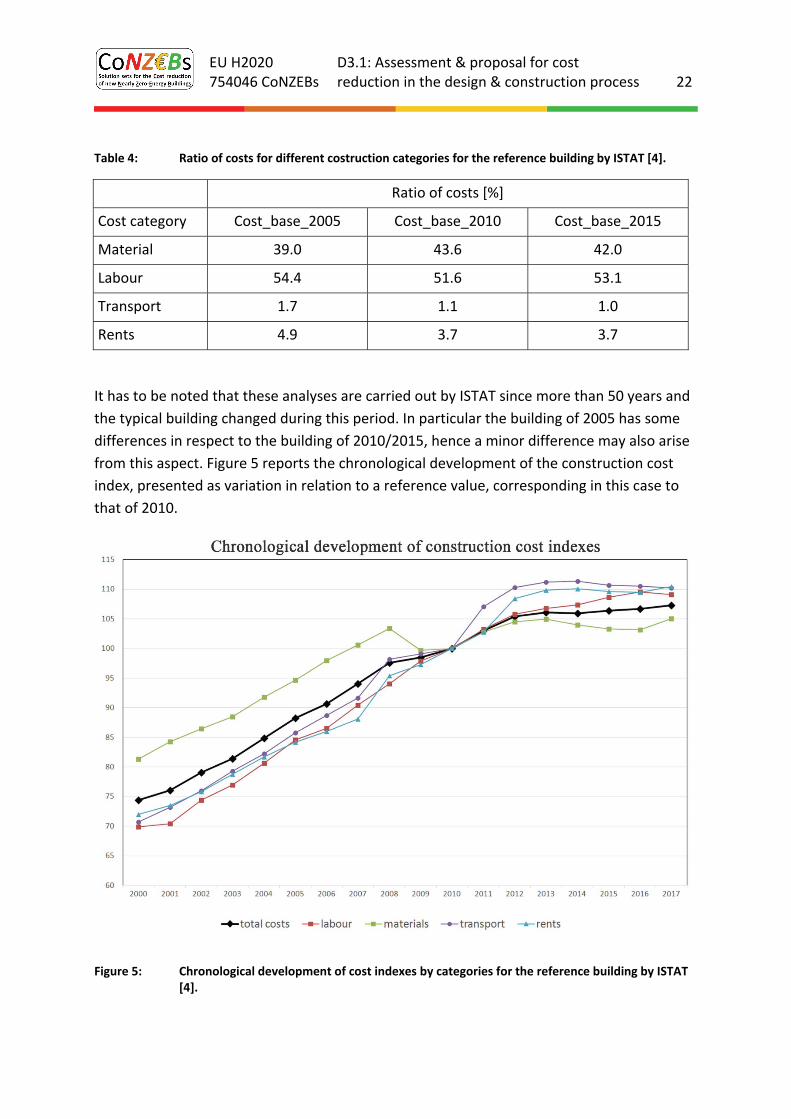
It has to be noted that these analyses are carried out by ISTAT since more than 50 years and
the typical building changed during this period. In particular the building of 2005 has some
differences in respect to the building of 2010/2015, hence a minor difference may also arise
from this aspect. Figure 5 reports the chronological development of the construction cost
index, presented as variation in relation to a reference value, corresponding in this case to
that of 2010.
Figure 5: Chronological development of cost indexes by categories for the reference building by ISTAT [4].
EU H2020 754046 CoNZEBs
D3.1: Assessment & proposal for cost reduction in the design & construction process 23
According to the figure above, the construction cost index scored only 7% increase in the
2010 ‐ 2017 period corresponding to the economic crisis. Conversely the index increased by
more than one third in the previous 10 years. Most of the cost categories had a similar trend
all over the monitoring period, but the material category presents some "anomalies". Here
the increase during the years 2010 ‐ 2017 was about 23% and only 5%. This aspect is partly
surprising since new advanced construction products were introduced on the market the
during the last decade. As an example, high performance bricks started penetrating the
market, these envelope solutions are characterised by high product costs but lower labour
cost, because of the construction process is quicker and easier. The change of the reference
building could be, hence, a contributory cause of this result.
Aiming at detecting possible areas of cost reduction during the construction process, the
optimal solutions are those that minimise the construction process, reducing cost and
duration of the construction site. The aim is to intervene on labour, rents, transports and
other site overheads. In Italy, however, the specific technology costs are provided
comprehensively for materials and labour as indicated in standardised price lists. Once the
most favourable technology for a given work category is selected, space for additional
reductions can be found only in the indirect costs.
Based on the present analysis for costs during the construction process for multi‐family
houses in Italy, some conclusions can be drawn:
⌂ The cost ratio of the construction process related to the overall construction
works is about 58%. In this sense, there is a wide space for cost reduction during
the construction process, using technologies that reduce the time and money
needed for the execution of the works.
⌂ However, according to the price‐listing of building technologies, the general aim
of CoNZEBs to reduce the overall construction costs appear to be limited to
minimising the indirect costs.
⌂ According to a small survey and to some statistical indicators, such costs range
between 5 and 10%, figures that make it very difficult to significantly reduce the
overall construction costs.
⌂ In this sense, life‐cost analyses should be carried out, taking into account all cost
categories associated to a given technology, not only as a function of the direct
costs.
⌂ The way construction companies assess indirect costs is not standardised.
Therefore figures might not be comparable, nor accurate. Moreover, construction
companies frequently sub‐contract the construction as a whole, with the
consequence that many details about the process get lost.
EU H2020 754046 CoNZEBs
D3.1: Assessment & proposal for cost reduction in the design & construction process 24
2.2. The case of Denmark
The total turnover in the Danish building construction sector in 2017 was 33 billion Euro with
an increase of 13% over the last three years. It should be noted that the biggest increase is
with the area of new housing, where it is almost 40%. The renovation of existing housing has
increased with about 25% over the same three years. It places the building sector in the top
of the sectors contributing to the Danish gross national product.
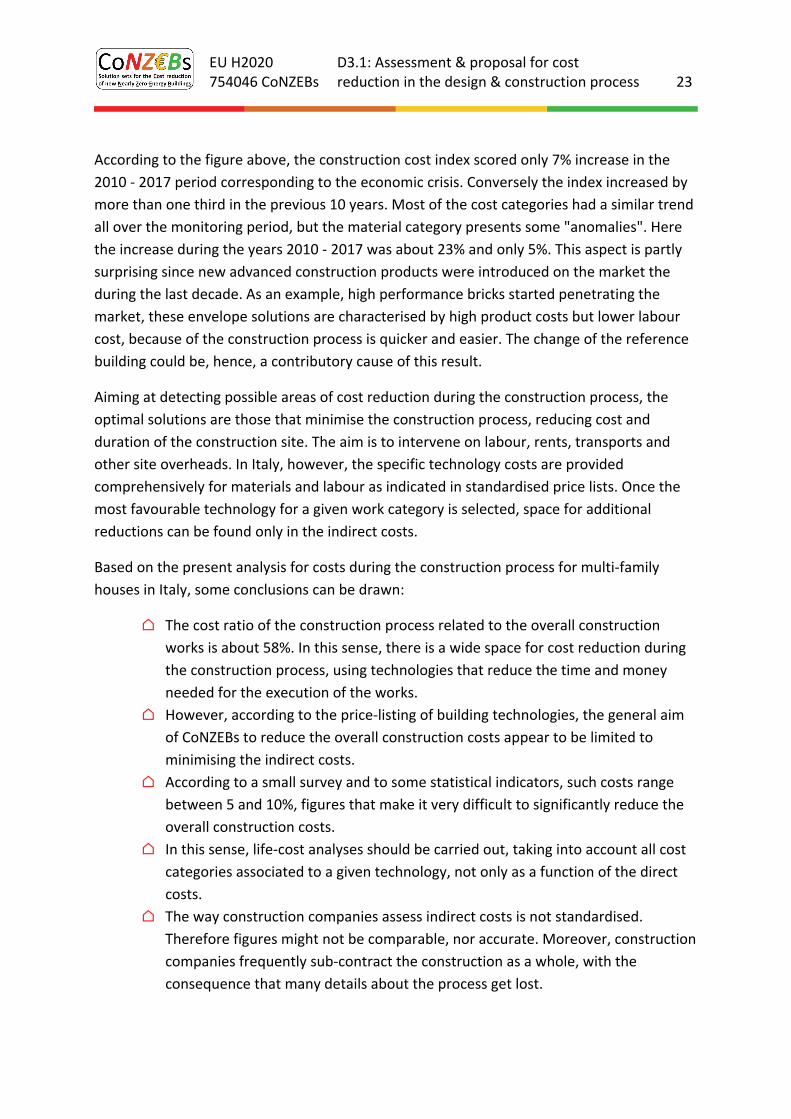
Table 6 shows the turnover in construction and its distribution. The data is established due
to recommendations from the Productivity Commission and is used for calculations of
productivity in million Euro. The statistic is comparable from 2015 and onwards. Note that
these numbers besides the construction work includes civil engineering and other
occupation.
The turnover for the construction also includes the construction work on the buildings and
the building components. In some statistics the components are counted under industry, so
the accounting plays a large role.
Table 6: Turnover in construction in Denmark over three years (DK statistics) mil. Euro; total is the sum of the sub‐totals.
2015 2016 2017 % change
Turnover, total 29'427 30'720 33'242 13.0%
New buildings and extensions, total 11'177 12'415 14'845 32.8%
New buildings and extensions, housing 6'031 6'380 8'384 39.0%
New buildings and extensions, other 5'147 6'035 6'461 25.5%
Repair and maintenance, total 10'265 10'895 10'621 3.5%
Repair and maintenance, major repair,
housing
3'244 3'625 4'033 24.3%
Repair and maintenance, major repair, other 2'781 2'820 2'669 ‐4.0%
Repair and maintenance, maintenance,
housing
2'471 2'544 2'231 ‐9.7%
Repair and maintenance, maintenance, other 1'769 1'906 1'687 ‐4.6%
Civil engineering, total 6'758 6'455 6'607 ‐2.2%
Civil engineering, new construction 4'687 4'258 4'486 ‐4.3%
Civil engineering, major repair 997 1'087 963 ‐3.4%
Civil engineering, maintenance 1'074 1'110 1'157 7.7%
Other occupation 1'226 955 1'170 ‐4.5%
EU H2020 754046 CoNZEBs
D3.1: Assessment & proposal for cost reduction in the design & construction process 25
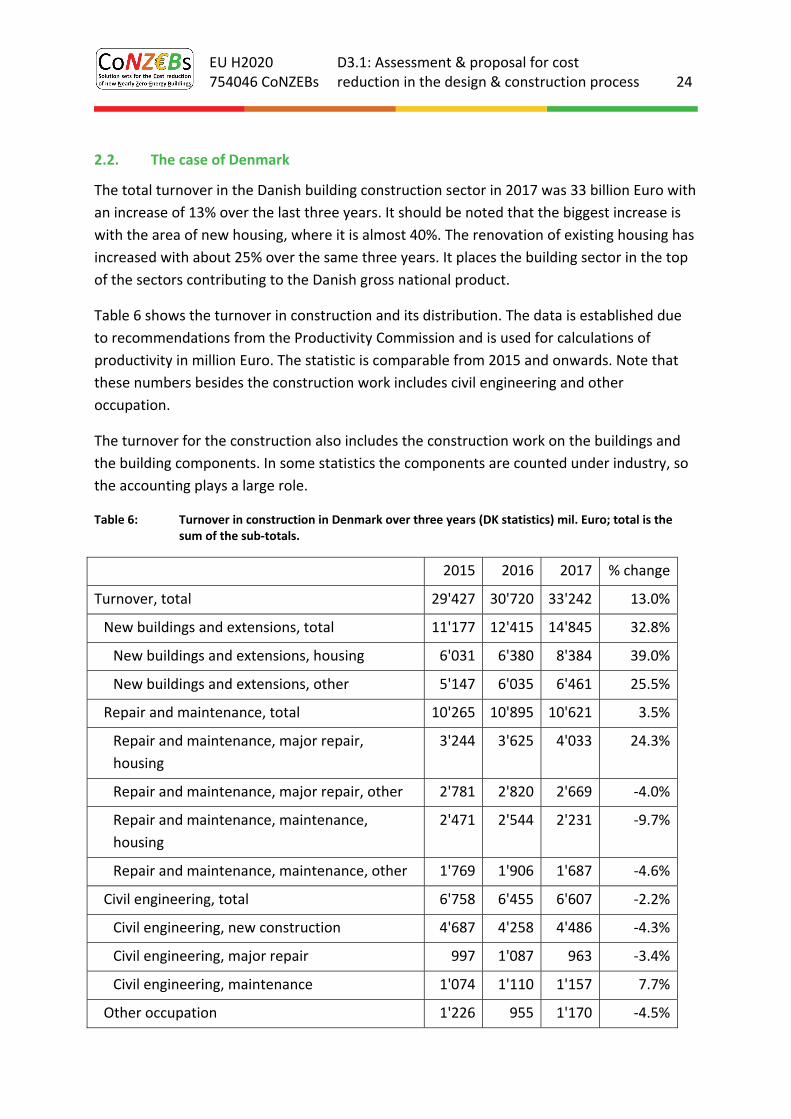
Changes over time in the construction of new dwellings
The new dwelling construction statistics are compiled based on data extracted from the
registers on buildings and dwellings. The statistics are based on building permits, etc.
compiled by the municipalities, when construction results in an increase of the floor area or
the number of dwellings. The statistics show the state of the building projects (permitted,
started, completed and under construction) with information on type of building,
geographical groups and type of client. Because of delays in the municipalities' registrations
in the Central Register of Buildings and Dwellings provisional figures are published, which
give an estimate of the construction activity. Data are revised back in time. Figure 6 presents
an extract of these numbers as a single number of initiated dwellings and extensions over
the past years.
Figure 6: Number of new dwellings and extensions initiated over the past 12 years (DK Statistics)
There is a clear market increase in the activity of initiating the construction of new dwellings
since a minimum in year 2013.
The total turnover for dwellings still increase
The newest statistics show that from the 4th quarter 2017 to the 1st quarter of 2018 the total
costs for the construction of new dwellings has increased with 0,7%. This covers both single‐
family houses (0,6%) and apartment blocks (0,7%). The total turnover for new dwellings has
increased by 1% in the 1st quarter of 2018 compared to the 1st quarter of 2017. The main
reason for that is that the construction cost for single‐family houses has increased by 0,8%
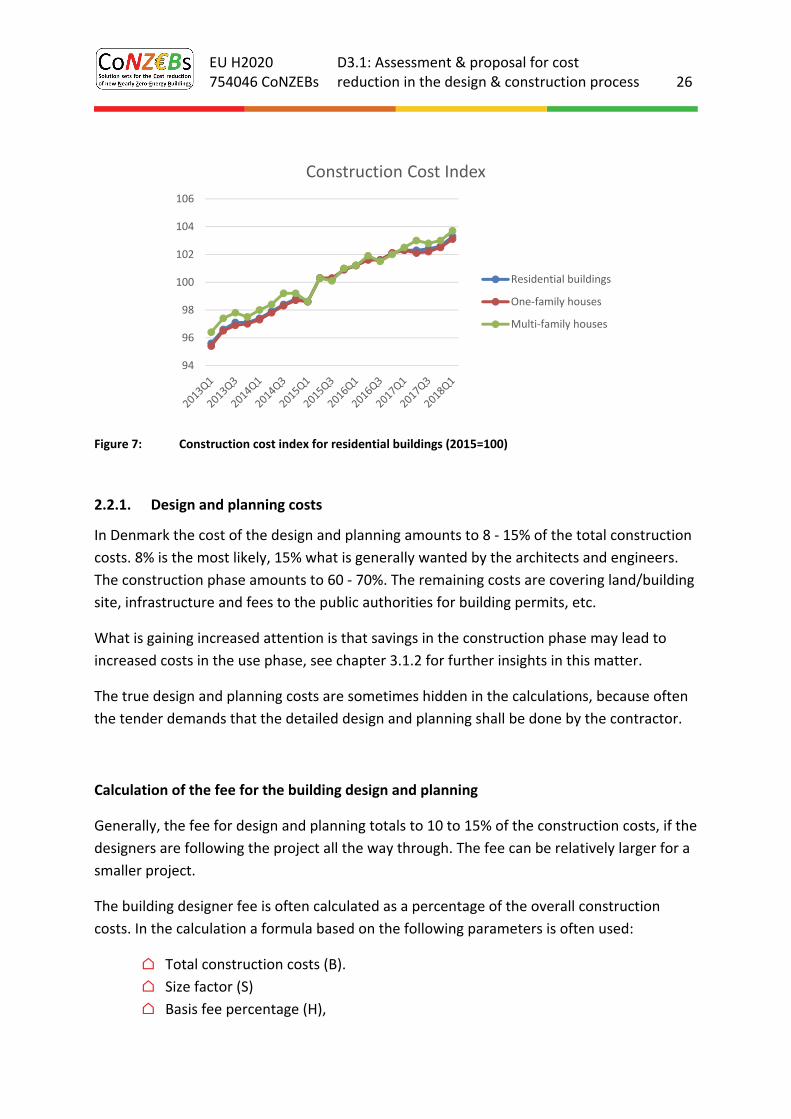
and for apartment blocks by 1,2%, see Figure 7.
EU H2020 754046 CoNZEBs
D3.1: Assessment & proposal for cost reduction in the design & construction process 26
Figure 7: Construction cost index for residential buildings (2015=100)
2.2.1. Design and planning costs
In Denmark the cost of the design and planning amounts to 8 ‐ 15% of the total construction
costs. 8% is the most likely, 15% what is generally wanted by the architects and engineers.
The construction phase amounts to 60 ‐ 70%. The remaining costs are covering land/building
site, infrastructure and fees to the public authorities for building permits, etc.
What is gaining increased attention is that savings in the construction phase may lead to
increased costs in the use phase, see chapter 3.1.2 for further insights in this matter.
The true design and planning costs are sometimes hidden in the calculations, because often
the tender demands that the detailed design and planning shall be done by the contractor.
Calculation of the fee for the building design and planning
Generally, the fee for design and planning totals to 10 to 15% of the construction costs, if the
designers are following the project all the way through. The fee can be relatively larger for a
smaller project.
The building designer fee is often calculated as a percentage of the overall construction
costs. In the calculation a formula based on the following parameters is often used:
⌂ Total construction costs (B).
⌂ Size factor (S)
⌂ Basis fee percentage (H),
94
96
98
100
102
104
106
Construction Cost Index
Residential buildings
One‐family houses
Multi‐family houses
EU H2020 754046 CoNZEBs
D3.1: Assessment & proposal for cost reduction in the design & construction process 27
The fee is then calculated as B x S x H %
The fee is normally subdivided according to these five phases:
⌂ Conceptual design: 25%
⌂ Proposal: 20%
⌂ Initial project design: 15%
⌂ Main project design: 25%
⌂ Follow up: 15%:
The basis fee B is calculated based on the percentages in Table 5 (DK Architects).
Table 5: The architectural design fee in relation to construction costs
Degree of complexity Simple Intermediate Complicated
Uniform apartment block in large series
with a large element of repetition and
few variants
3.3% 3.6% 4.2 %
Dwellings 3.9 % 4.2 % 4.5 %
Surcharge for additions 0.75 % 1.0 % 1.25 %
Surcharge for management of the
construction 1.0 % 1.5 % 2.0 %
Surcharge for quality control 1.5 % 2.25 % 3.0 %
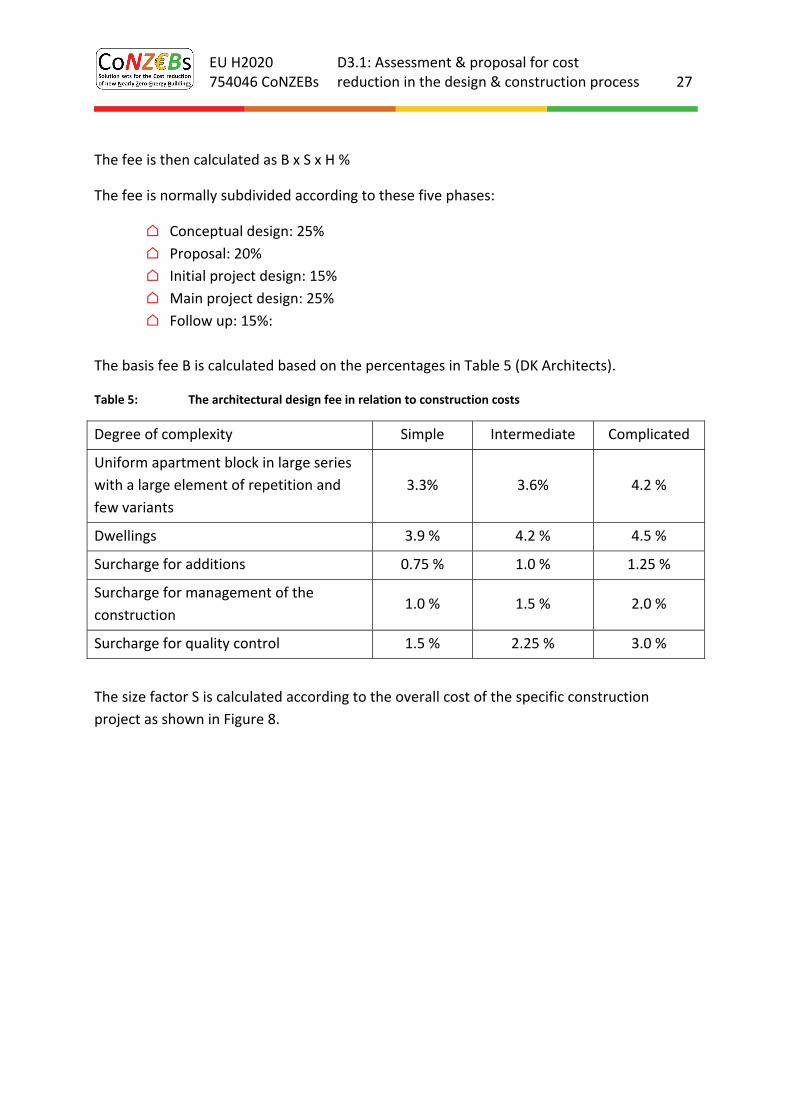
The size factor S is calculated according to the overall cost of the specific construction
project as shown in Figure 8.
EU H2020 754046 CoNZEBs
D3.1: Assessment & proposal for cost reduction in the design & construction process 28
Figure 8: Size factor – as a function of total construction costs.
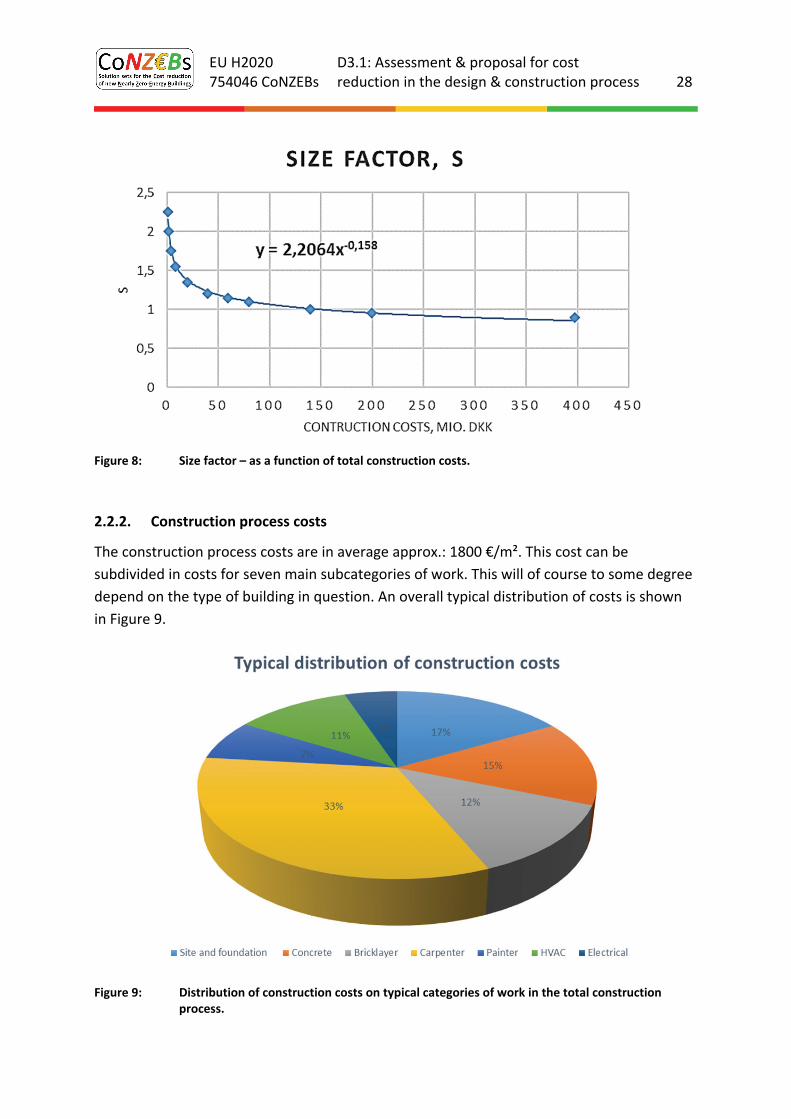
2.2.2. Construction process costs
The construction process costs are in average approx.: 1800 €/m². This cost can be
subdivided in costs for seven main subcategories of work. This will of course to some degree
depend on the type of building in question. An overall typical distribution of costs is shown
in Figure 9.
Figure 9: Distribution of construction costs on typical categories of work in the total construction process.
EU H2020 754046 CoNZEBs
D3.1: Assessment & proposal for cost reduction in the design & construction process 29
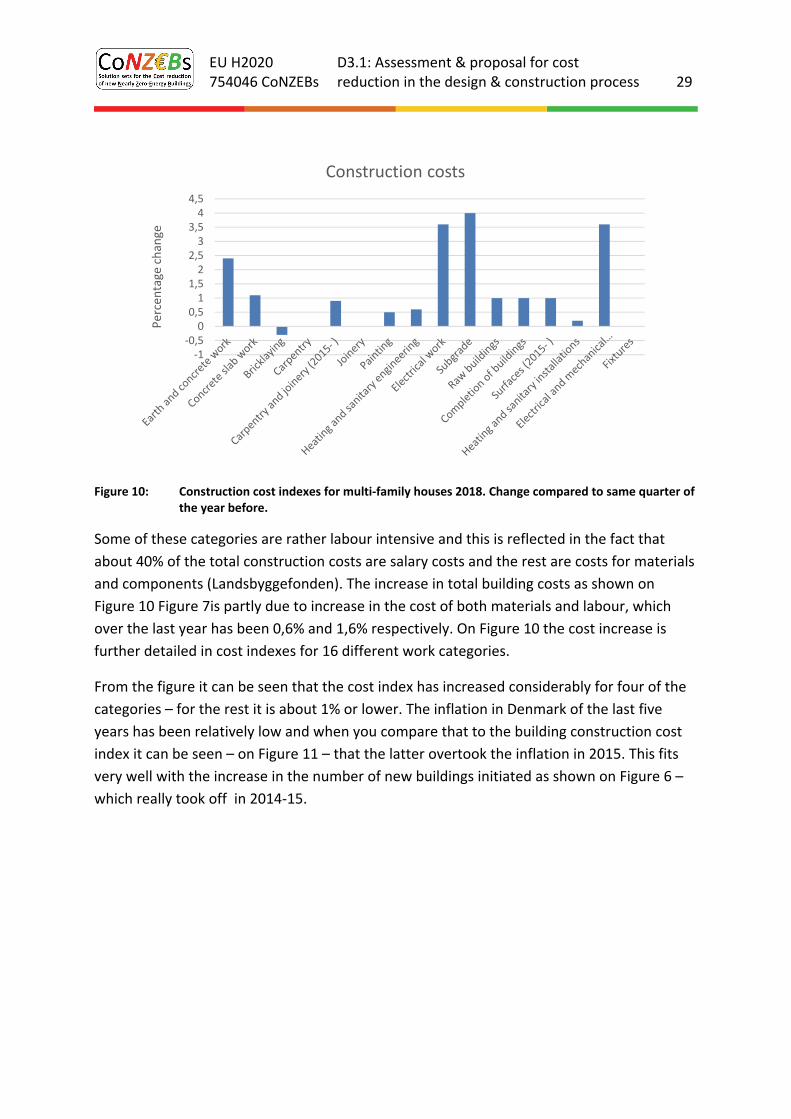
Figure 10: Construction cost indexes for multi‐family houses 2018. Change compared to same quarter of the year before.
Some of these categories are rather labour intensive and this is reflected in the fact that
about 40% of the total construction costs are salary costs and the rest are costs for materials
and components (Landsbyggefonden). The increase in total building costs as shown on
Figure 10 Figure 7is partly due to increase in the cost of both materials and labour, which
over the last year has been 0,6% and 1,6% respectively. On Figure 10 the cost increase is
further detailed in cost indexes for 16 different work categories.
From the figure it can be seen that the cost index has increased considerably for four of the
categories – for the rest it is about 1% or lower. The inflation in Denmark of the last five
years has been relatively low and when you compare that to the building construction cost
index it can be seen – on Figure 11 – that the latter overtook the inflation in 2015. This fits
very well with the increase in the number of new buildings initiated as shown on Figure 6 –
which really took off in 2014‐15.
‐1‐0,5
00,51
1,52
2,53
3,54
4,5
Percentage change
Construction costs

EU H2020 754046 CoNZEBs
D3.1: Assessment & proposal for cost reduction in the design & construction process 30
Figure 11: Construction cost index compared to the general consumer costs index (=inflation).
2.3. The case of Germany
The construction sector (i. e. main construction trade without finishing trade) is the sixth
most important industrial sector in Germany (after automotive engineering, machine
construction, chemical‐pharmaceutical industry, nutrition and electro‐technic) with sales
volumes of 112.8 billion € in 2017 (currently still an estimation), 107.3 billion € in 2016 and
101.0 billion € in 2015. This is roughly 6% of the total sales volume of the German industry.
The estimated sales volume for the year 2018 is 117.2 billion €. The sales volume of the
residential building sector was 40.0 billion € in 2016 [5], [6], [7].
Table 6: Annual sales volumes of the main construction trade in Germany according to Statista [6], [7]
Sales volume
2015 2016 increase
2015/16 2017
increase
2016/17
billion € billion € % billion € %
Main construction trade 101.0 107.3 6.2 112.8* 5.4
Residential buildings ‐ 40.0 ‐ n.y.a. ‐
Commercial buildings ‐ 37.4 ‐ n.y.a. ‐
Public buildings ‐ 30.0 ‐ n.y.a. ‐
* value is based on estimates
The annual building refurbishment rate was in the years 2015 and 2016 on a level of about
1% [8]. In 2016 a total of 154,000 permits for new buildings have been issued, thereof
125,000 permits for residential buildings [9]. This equates to 316,550 new residential units
with building permissions of which 172,679 units were foreseen in multi‐family houses,
90
92
94
96
98
100
102
104
2013 2014 2015 2016 2017 2018
Index
Construction costs Consumer costs
EU H2020 754046 CoNZEBs
D3.1: Assessment & proposal for cost reduction in the design & construction process 31
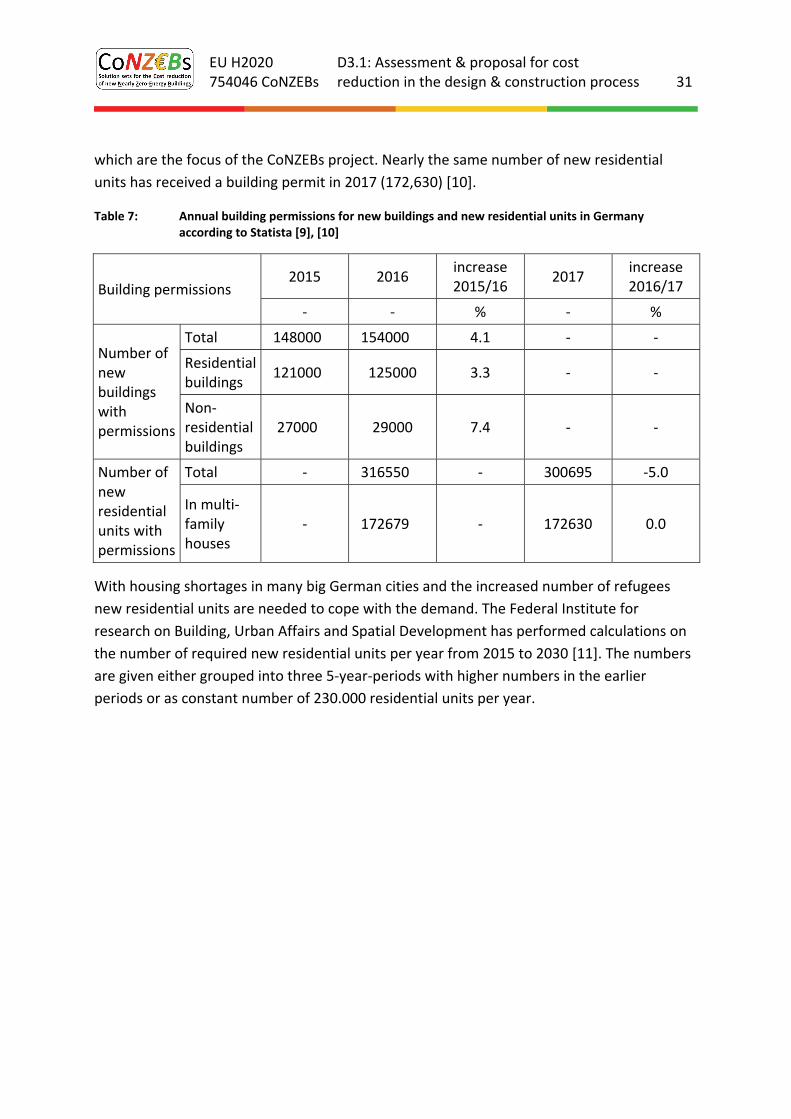
which are the focus of the CoNZEBs project. Nearly the same number of new residential
units has received a building permit in 2017 (172,630) [10].
Table 7: Annual building permissions for new buildings and new residential units in Germany according to Statista [9], [10]
Building permissions 2015 2016
increase 2015/16
2017 increase 2016/17
‐ ‐ % ‐ %
Number of new buildings with permissions
Total 148000 154000 4.1 ‐ ‐
Residential buildings
121000 125000 3.3 ‐ ‐
Non‐residential buildings
27000 29000 7.4 ‐ ‐
Number of new residential units with permissions
Total ‐ 316550 ‐ 300695 ‐5.0
In multi‐family houses
‐ 172679 ‐ 172630 0.0
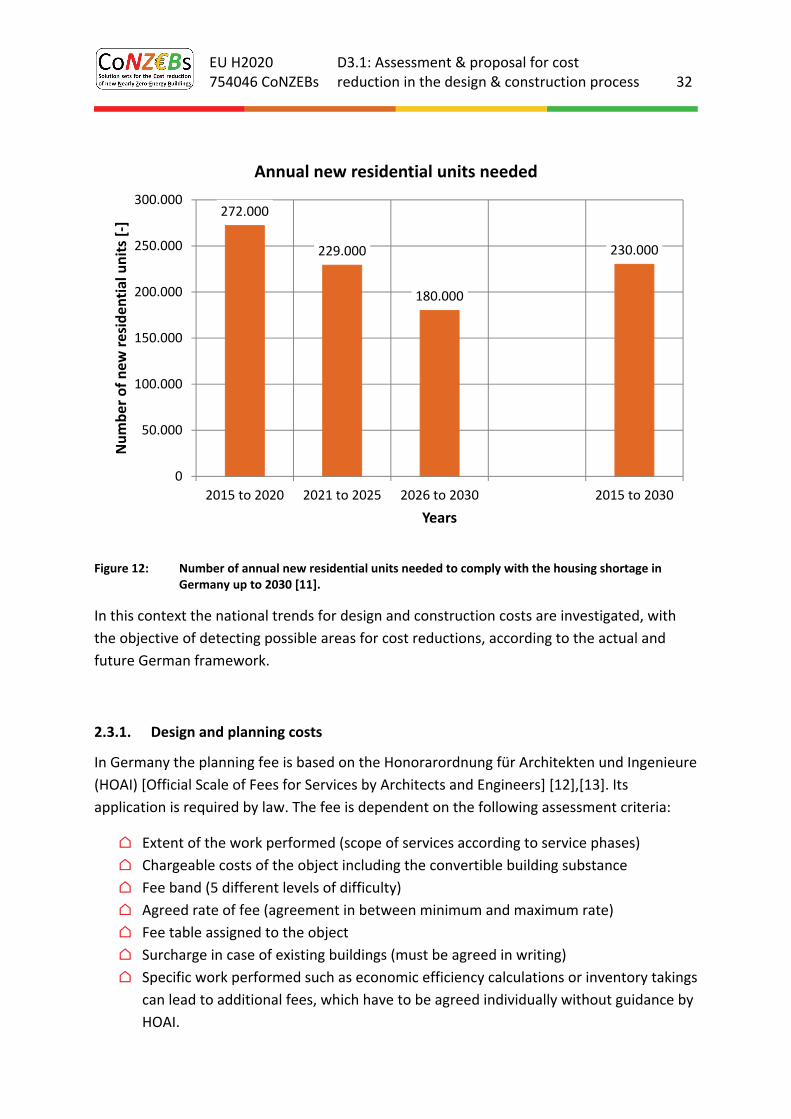
With housing shortages in many big German cities and the increased number of refugees
new residential units are needed to cope with the demand. The Federal Institute for
research on Building, Urban Affairs and Spatial Development has performed calculations on
the number of required new residential units per year from 2015 to 2030 [11]. The numbers
are given either grouped into three 5‐year‐periods with higher numbers in the earlier
periods or as constant number of 230.000 residential units per year.
EU H2020 754046 CoNZEBs
D3.1: Assessment & proposal for cost reduction in the design & construction process 32
Figure 12: Number of annual new residential units needed to comply with the housing shortage in Germany up to 2030 [11].
In this context the national trends for design and construction costs are investigated, with
the objective of detecting possible areas for cost reductions, according to the actual and
future German framework.
2.3.1. Design and planning costs
In Germany the planning fee is based on the Honorarordnung für Architekten und Ingenieure
(HOAI) [Official Scale of Fees for Services by Architects and Engineers] [12],[13]. Its
application is required by law. The fee is dependent on the following assessment criteria:
⌂ Extent of the work performed (scope of services according to service phases)
⌂ Chargeable costs of the object including the convertible building substance
⌂ Fee band (5 different levels of difficulty)
⌂ Agreed rate of fee (agreement in between minimum and maximum rate)
⌂ Fee table assigned to the object
⌂ Surcharge in case of existing buildings (must be agreed in writing)
⌂ Specific work performed such as economic efficiency calculations or inventory takings
can lead to additional fees, which have to be agreed individually without guidance by
HOAI.
272.000
229.000
180.000
230.000
0
50.000
100.000
150.000
200.000
250.000
300.000
2015 to 2020 2021 to 2025 2026 to 2030 2015 to 2030
Number of new residential units [‐]
Years
Annual new residential units needed
EU H2020 754046 CoNZEBs
D3.1: Assessment & proposal for cost reduction in the design & construction process 33
The extent of the work performed is defined by the scope of services divided into 9 service
phases. The weighting of the service phases is shown below.
Table 8: Weighting of the services phases for the determination of the extent of work performed as defined in the German HOAI [12], [13].
Service phase Activity Share
[%]
1 Establishing the basis of the project 2
2 Preliminary design 7
3 Final design 15
4 Building permission application 3
5 Execution drawings 25
6 Preparation of contracted award 10
7 Assisting award process 4
8 Project supervision 32
9 Project control and documentation 2
100
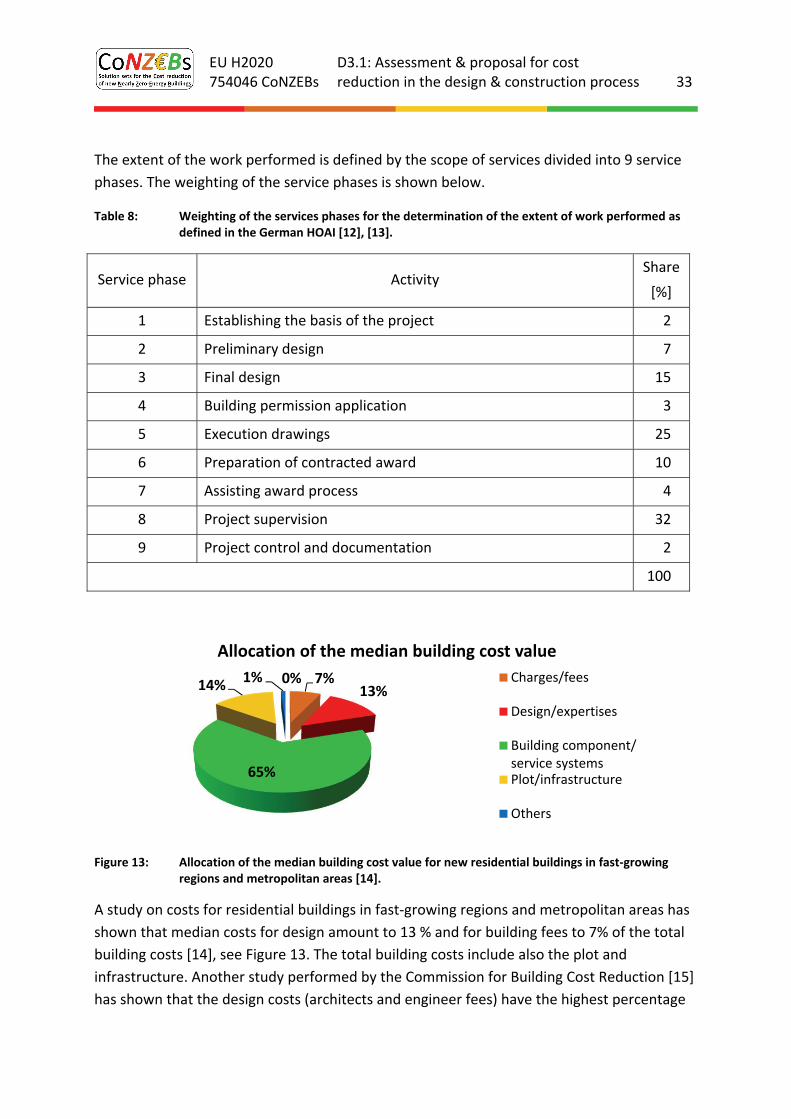
Figure 13: Allocation of the median building cost value for new residential buildings in fast‐growing regions and metropolitan areas [14].
A study on costs for residential buildings in fast‐growing regions and metropolitan areas has
shown that median costs for design amount to 13 % and for building fees to 7% of the total
building costs [14], see Figure 13. The total building costs include also the plot and
infrastructure. Another study performed by the Commission for Building Cost Reduction [15]
has shown that the design costs (architects and engineer fees) have the highest percentage
0% 7%13%
65%
14% 1%
Allocation of the median building cost value
Charges/fees
Design/expertises
Building component/service systemsPlot/infrastructure
Others
EU H2020 754046 CoNZEBs
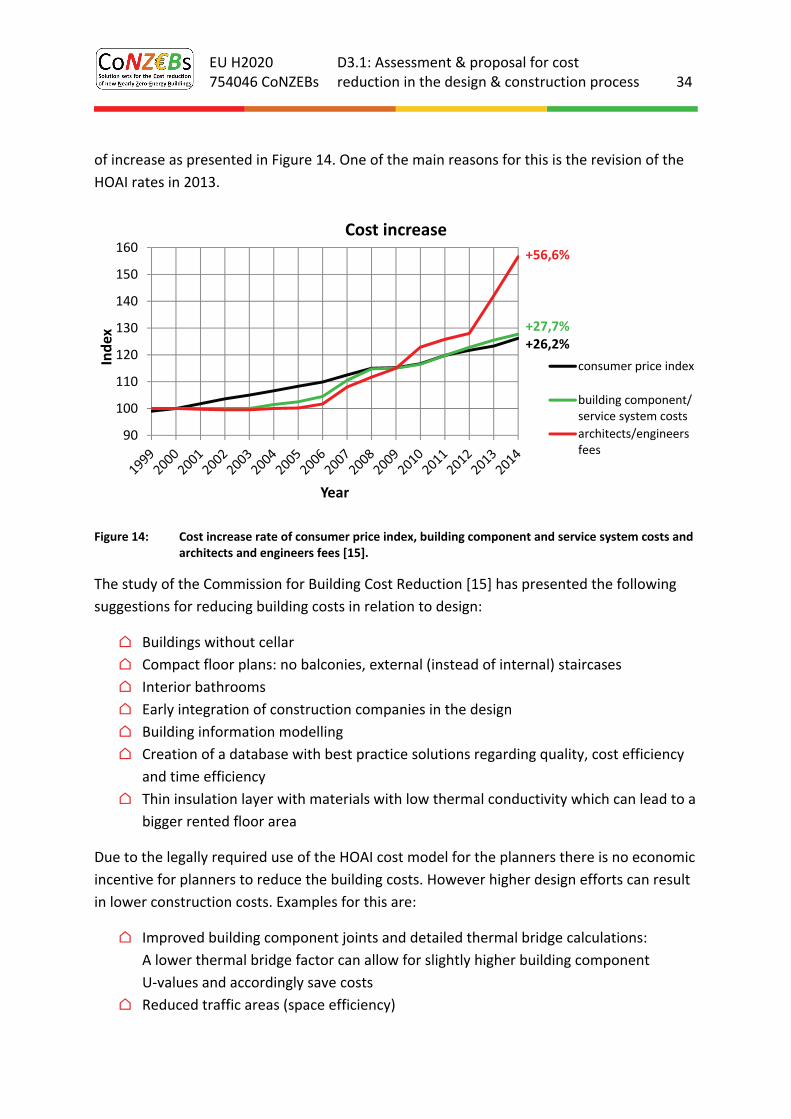
D3.1: Assessment & proposal for cost reduction in the design & construction process 34
of increase as presented in Figure 14. One of the main reasons for this is the revision of the
HOAI rates in 2013.
Figure 14: Cost increase rate of consumer price index, building component and service system costs and architects and engineers fees [15].
The study of the Commission for Building Cost Reduction [15] has presented the following
suggestions for reducing building costs in relation to design:
⌂ Buildings without cellar
⌂ Compact floor plans: no balconies, external (instead of internal) staircases
⌂ Interior bathrooms
⌂ Early integration of construction companies in the design
⌂ Building information modelling
⌂ Creation of a database with best practice solutions regarding quality, cost efficiency
and time efficiency
⌂ Thin insulation layer with materials with low thermal conductivity which can lead to a
bigger rented floor area
Due to the legally required use of the HOAI cost model for the planners there is no economic
incentive for planners to reduce the building costs. However higher design efforts can result
in lower construction costs. Examples for this are:
⌂ Improved building component joints and detailed thermal bridge calculations:
A lower thermal bridge factor can allow for slightly higher building component
U‐values and accordingly save costs
⌂ Reduced traffic areas (space efficiency)
90
100
110
120
130
140
150
160
Index
Year
Cost increase
consumer price index
building component/service system costs
architects/engineersfees
+56,6% +27,7% +26,2%
EU H2020 754046 CoNZEBs
D3.1: Assessment & proposal for cost reduction in the design & construction process 35
⌂ Reduced glazing ratio (but still fulfilling the minimum window ratio set by the legal
authorities)
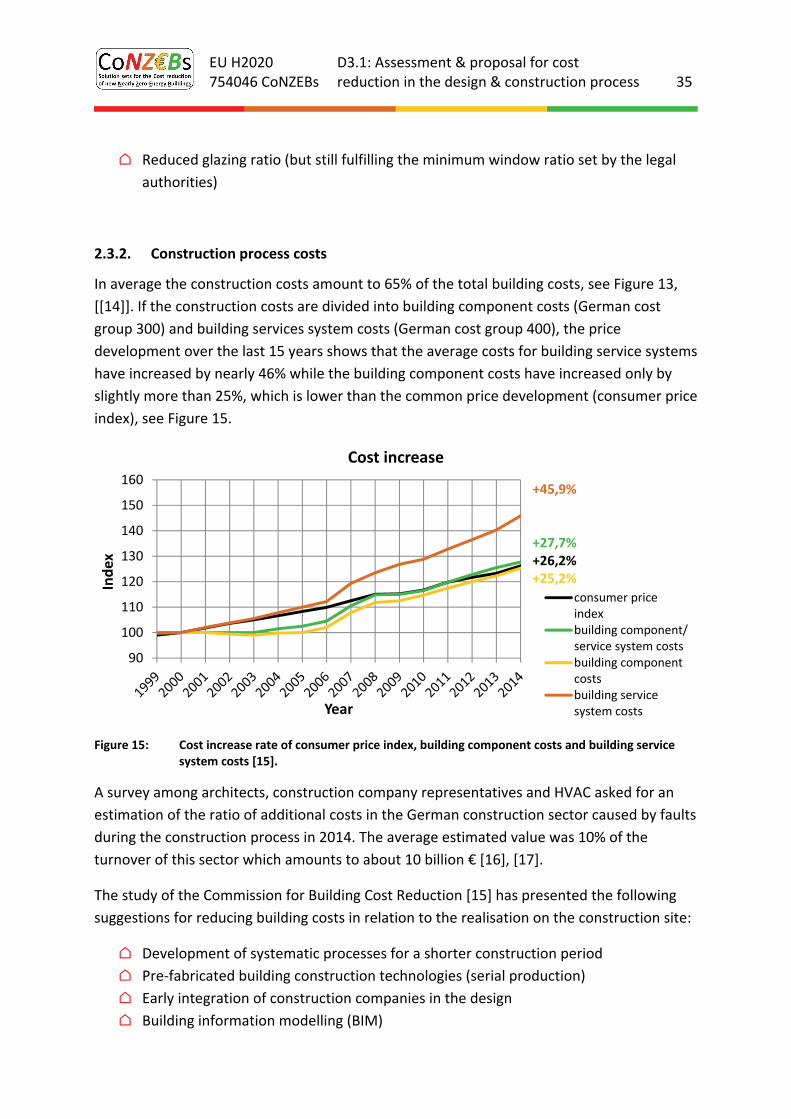
2.3.2. Construction process costs
In average the construction costs amount to 65% of the total building costs, see Figure 13,
[[14]]. If the construction costs are divided into building component costs (German cost
group 300) and building services system costs (German cost group 400), the price
development over the last 15 years shows that the average costs for building service systems
have increased by nearly 46% while the building component costs have increased only by
slightly more than 25%, which is lower than the common price development (consumer price
index), see Figure 15.
Figure 15: Cost increase rate of consumer price index, building component costs and building service system costs [15].
A survey among architects, construction company representatives and HVAC asked for an
estimation of the ratio of additional costs in the German construction sector caused by faults
during the construction process in 2014. The average estimated value was 10% of the
turnover of this sector which amounts to about 10 billion € [16], [17].
The study of the Commission for Building Cost Reduction [15] has presented the following
suggestions for reducing building costs in relation to the realisation on the construction site:
⌂ Development of systematic processes for a shorter construction period
⌂ Pre‐fabricated building construction technologies (serial production)
⌂ Early integration of construction companies in the design
⌂ Building information modelling (BIM)
90
100
110
120
130
140
150
160
Index
Year
Cost increase
consumer priceindexbuilding component/service system costsbuilding componentcostsbuilding servicesystem costs
+45,9% +27,7% +26,2% +25,2%
EU H2020 754046 CoNZEBs
D3.1: Assessment & proposal for cost reduction in the design & construction process 36
⌂ Creation of a database with best practice solutions regarding quality, cost efficiency
and time efficiency
There are several studies available which focus on the impact of modular building
construction or the use of prefabricated components. A few of them include rough
assessments of cost or construction time savings:
⌂ Economic construction with large‐sized brickwork [18]: Reduced labour costs of up to
50% compared to conventional brickwork, up to 7% increase of floor area by using
thinner walls
⌂ Modular building construction [19]: Reduced construction time of up to 70% based
on serial pre‐fabrication, simplified static proof and independence from weather
conditions
A study performed by the University of Wuppertal [20] has identified the following reduction
potentials for serial construction without quantifying them:
⌂ Cost‐saving production of prefabricated components in the factory
⌂ Shorter construction time and omitted buffer times
⌂ Reduced assembly on the construction site
⌂ Direct load carrying capacity after the assembly
⌂ Independence from weather conditions
⌂ Reduced labour costs and therefore also building costs
Similar potentials for cost reductions without quantification are listed in a report of the BBSR
[21]. The question of the minimum project size (floor area or number of residential units) for
which standardised building processes make sense is dependent on the particular approach
and can’t be answered in general. Some studies available at [22] consider the cost‐neutral
production of small series and unicums as possible based on computer‐assisted and robot‐
fabricated methods, while others assume that a repetition factor off 50 and more is required
for a cost‐efficient production.
Last but not least the chamber of architects of Baden‐Württemberg [23] refers to the cost
saving potential of the addition of another floor to an existing multi‐family house. Costs are
saved because the building plot and the infrastructure are already available. They do not
mention a magnitude of the possible cost saving. The addition of another floor is in many
cases combined with the renovation of the existing building.
EU H2020 754046 CoNZEBs
D3.1: Assessment & proposal for cost reduction in the design & construction process 37
2.4. The case of Slovenia
The construction sector in Slovenia one of the most important economic branches and as
such it is closely related to economic situation in the country. Slovenia’s economy suffered a
very deep recession in 2009, when GDP declined by almost 8%. After a short small economic
growth (of 1% on average in 2010 and 2011), it slipped back into recession in 2012, and
consequently that resulted in the collapse of Slovenia’s construction sector [24].
EUROSTAT data showed that in 2016 the construction growth in the Euro area was 3.2% and
2.7% in the European Union (EU). In the same year, due to economic recovery, Slovenia
recorded the largest, almost 28% growth in construction in the EU. However, the absolute
level of activities in the construction sector is still far from that prior to the recession [25].
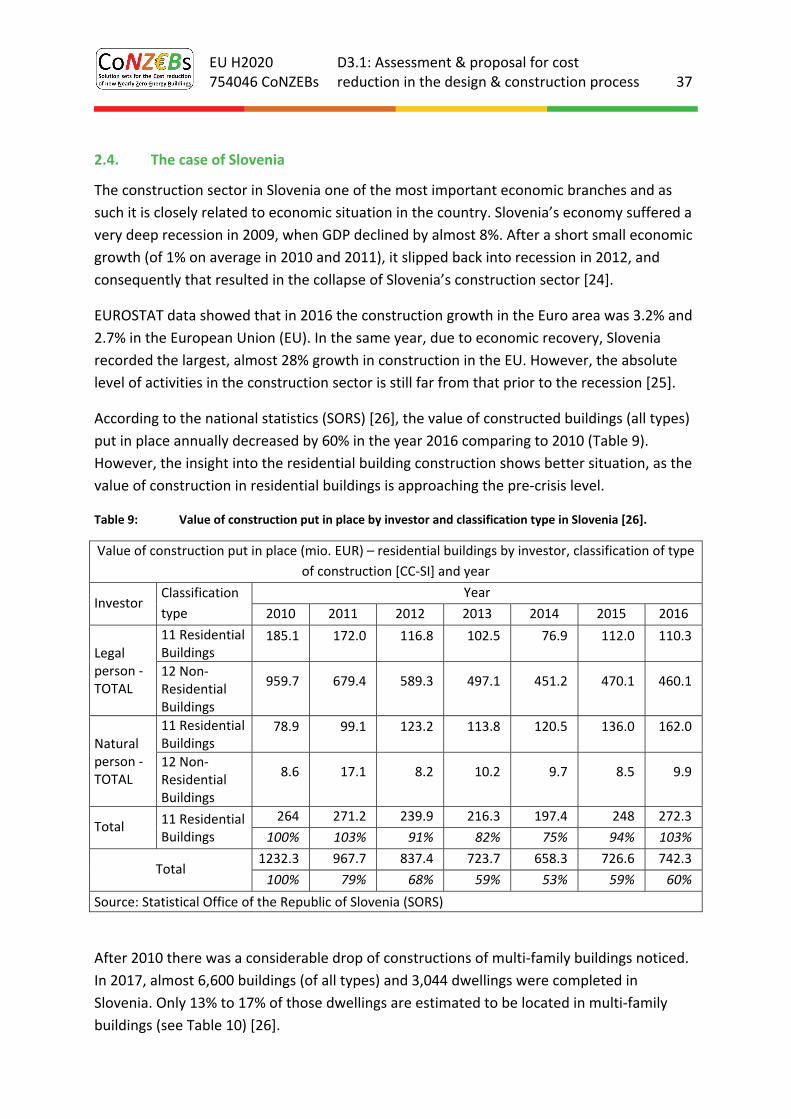
According to the national statistics (SORS) [26], the value of constructed buildings (all types)
put in place annually decreased by 60% in the year 2016 comparing to 2010 (Table 9).
However, the insight into the residential building construction shows better situation, as the
value of construction in residential buildings is approaching the pre‐crisis level.
Table 9: Value of construction put in place by investor and classification type in Slovenia [26].
Value of construction put in place (mio. EUR) – residential buildings by investor, classification of type
of construction [CC‐SI] and year
Investor Classification
type
Year
2010 2011 2012 2013 2014 2015 2016
Legal person ‐ TOTAL
11 Residential Buildings
185.1 172.0 116.8 102.5 76.9 112.0 110.3
12 Non‐Residential Buildings
959.7 679.4 589.3 497.1 451.2 470.1 460.1
Natural person ‐ TOTAL
11 Residential Buildings
78.9 99.1 123.2 113.8 120.5 136.0 162.0
12 Non‐Residential Buildings
8.6 17.1 8.2 10.2 9.7 8.5 9.9
Total 11 Residential Buildings
264 271.2 239.9 216.3 197.4 248 272.3
100% 103% 91% 82% 75% 94% 103%
Total 1232.3 967.7 837.4 723.7 658.3 726.6 742.3
100% 79% 68% 59% 53% 59% 60%
Source: Statistical Office of the Republic of Slovenia (SORS)
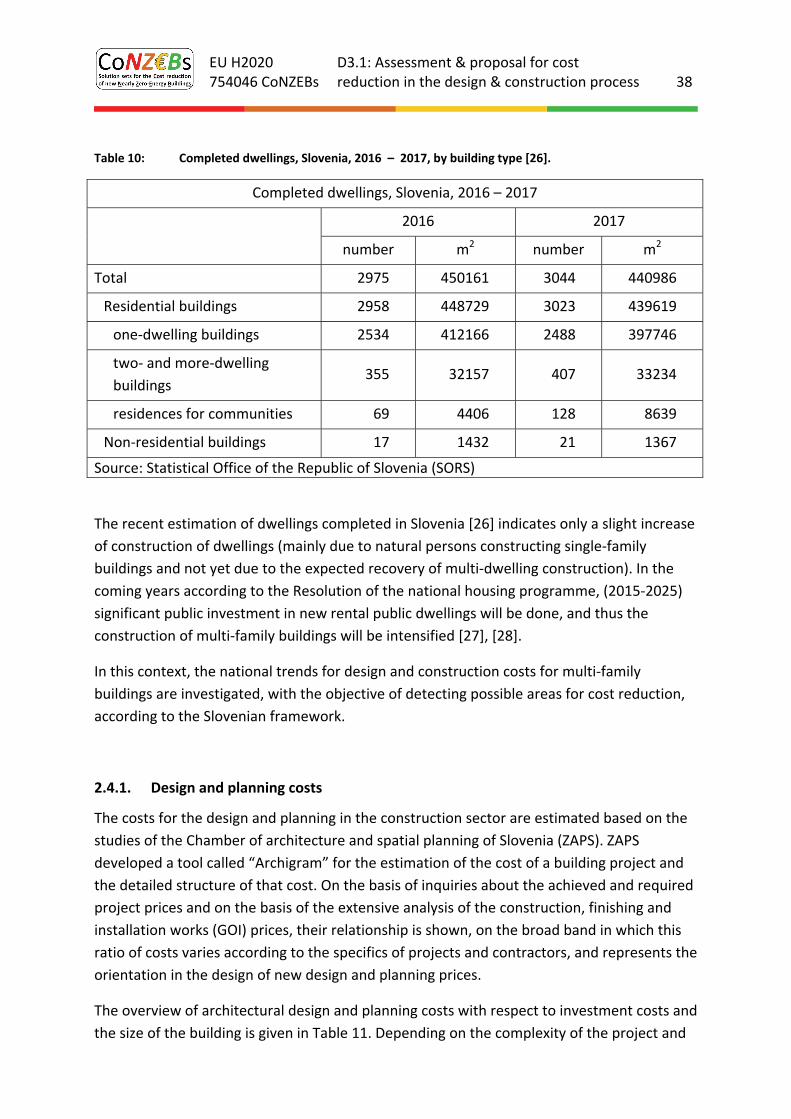
After 2010 there was a considerable drop of constructions of multi‐family buildings noticed.
In 2017, almost 6,600 buildings (of all types) and 3,044 dwellings were completed in
Slovenia. Only 13% to 17% of those dwellings are estimated to be located in multi‐family
buildings (see Table 10) [26].
EU H2020 754046 CoNZEBs
D3.1: Assessment & proposal for cost reduction in the design & construction process 38
Table 10: Completed dwellings, Slovenia, 2016 – 2017, by building type [26].
Completed dwellings, Slovenia, 2016 – 2017
2016 2017
number m2 number m2
Total 2975 450161 3044 440986
Residential buildings 2958 448729 3023 439619
one‐dwelling buildings 2534 412166 2488 397746
two‐ and more‐dwelling
buildings 355 32157 407 33234
residences for communities 69 4406 128 8639
Non‐residential buildings 17 1432 21 1367
Source: Statistical Office of the Republic of Slovenia (SORS)
The recent estimation of dwellings completed in Slovenia [26] indicates only a slight increase
of construction of dwellings (mainly due to natural persons constructing single‐family
buildings and not yet due to the expected recovery of multi‐dwelling construction). In the
coming years according to the Resolution of the national housing programme, (2015‐2025)
significant public investment in new rental public dwellings will be done, and thus the
construction of multi‐family buildings will be intensified [27], [28].
In this context, the national trends for design and construction costs for multi‐family
buildings are investigated, with the objective of detecting possible areas for cost reduction,
according to the Slovenian framework.
2.4.1. Design and planning costs
The costs for the design and planning in the construction sector are estimated based on the
studies of the Chamber of architecture and spatial planning of Slovenia (ZAPS). ZAPS
developed a tool called “Archigram” for the estimation of the cost of a building project and
the detailed structure of that cost. On the basis of inquiries about the achieved and required
project prices and on the basis of the extensive analysis of the construction, finishing and
installation works (GOI) prices, their relationship is shown, on the broad band in which this
ratio of costs varies according to the specifics of projects and contractors, and represents the
orientation in the design of new design and planning prices.
The overview of architectural design and planning costs with respect to investment costs and
the size of the building is given in Table 11. Depending on the complexity of the project and
EU H2020 754046 CoNZEBs
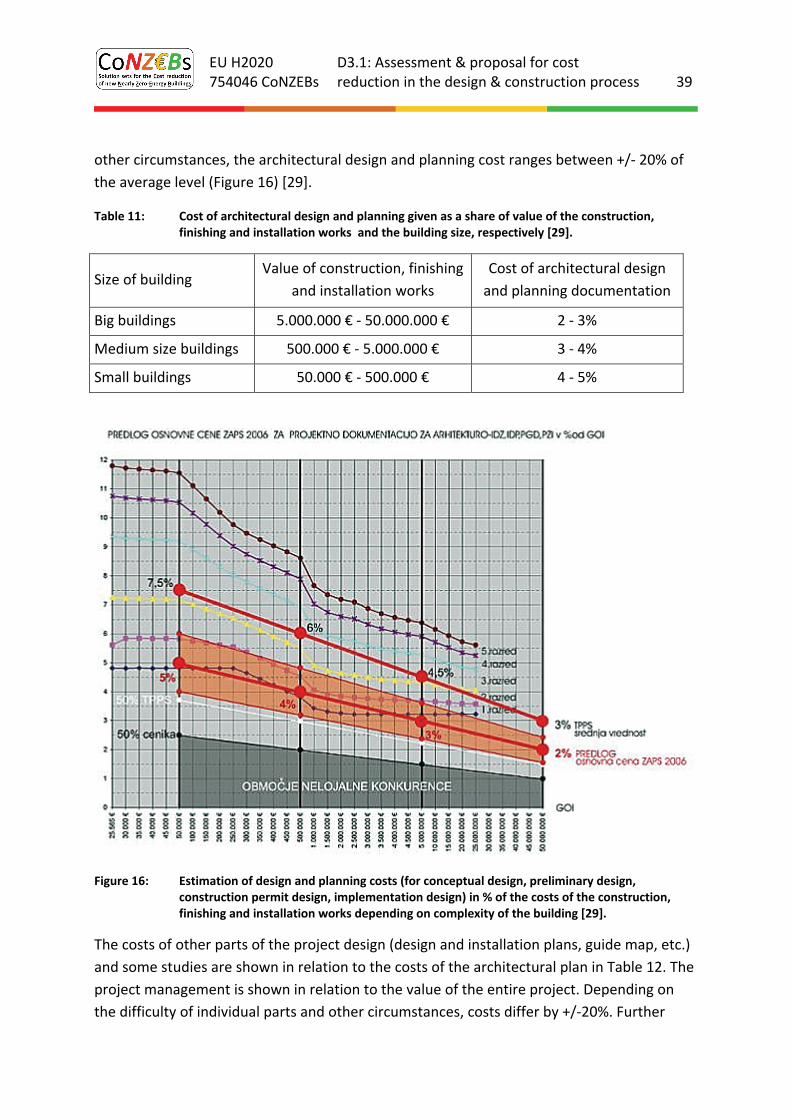
D3.1: Assessment & proposal for cost reduction in the design & construction process 39
other circumstances, the architectural design and planning cost ranges between +/‐ 20% of
the average level (Figure 16) [29].
Table 11: Cost of architectural design and planning given as a share of value of the construction, finishing and installation works and the building size, respectively [29].
Size of building Value of construction, finishing
and installation works
Cost of architectural design
and planning documentation
Big buildings 5.000.000 € ‐ 50.000.000 € 2 ‐ 3%
Medium size buildings 500.000 € ‐ 5.000.000 € 3 ‐ 4%
Small buildings 50.000 € ‐ 500.000 € 4 ‐ 5%
Figure 16: Estimation of design and planning costs (for conceptual design, preliminary design, construction permit design, implementation design) in % of the costs of the construction, finishing and installation works depending on complexity of the building [29].
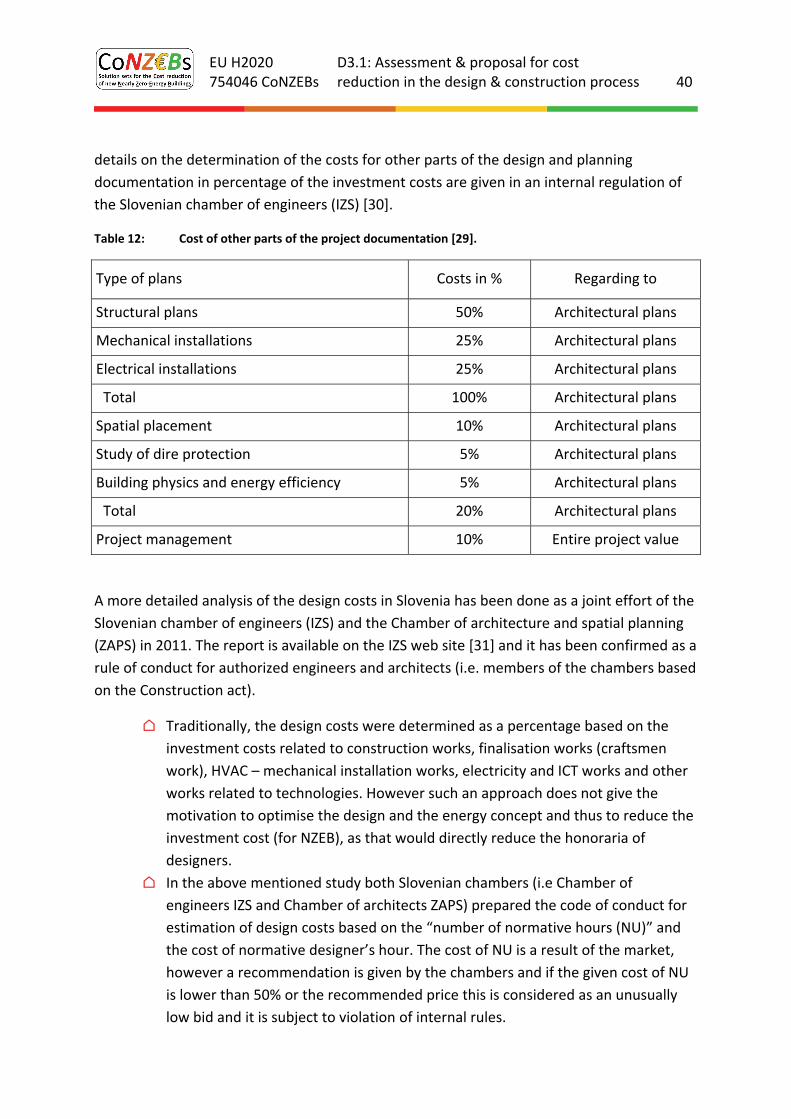
The costs of other parts of the project design (design and installation plans, guide map, etc.)
and some studies are shown in relation to the costs of the architectural plan in Table 12. The
project management is shown in relation to the value of the entire project. Depending on
the difficulty of individual parts and other circumstances, costs differ by +/‐20%. Further
EU H2020 754046 CoNZEBs
D3.1: Assessment & proposal for cost reduction in the design & construction process 40
details on the determination of the costs for other parts of the design and planning
documentation in percentage of the investment costs are given in an internal regulation of
the Slovenian chamber of engineers (IZS) [30].
Table 12: Cost of other parts of the project documentation [29].
Type of plans Costs in % Regarding to
Structural plans 50% Architectural plans
Mechanical installations 25% Architectural plans
Electrical installations 25% Architectural plans
Total 100% Architectural plans
Spatial placement 10% Architectural plans
Study of dire protection 5% Architectural plans
Building physics and energy efficiency 5% Architectural plans
Total 20% Architectural plans
Project management 10% Entire project value
A more detailed analysis of the design costs in Slovenia has been done as a joint effort of the
Slovenian chamber of engineers (IZS) and the Chamber of architecture and spatial planning
(ZAPS) in 2011. The report is available on the IZS web site [31] and it has been confirmed as a
rule of conduct for authorized engineers and architects (i.e. members of the chambers based
on the Construction act).
⌂ Traditionally, the design costs were determined as a percentage based on the
investment costs related to construction works, finalisation works (craftsmen
work), HVAC – mechanical installation works, electricity and ICT works and other
works related to technologies. However such an approach does not give the
motivation to optimise the design and the energy concept and thus to reduce the
investment cost (for NZEB), as that would directly reduce the honoraria of
designers.
⌂ In the above mentioned study both Slovenian chambers (i.e Chamber of
engineers IZS and Chamber of architects ZAPS) prepared the code of conduct for
estimation of design costs based on the “number of normative hours (NU)” and
the cost of normative designer’s hour. The cost of NU is a result of the market,
however a recommendation is given by the chambers and if the given cost of NU
is lower than 50% or the recommended price this is considered as an unusually
low bid and it is subject to violation of internal rules.
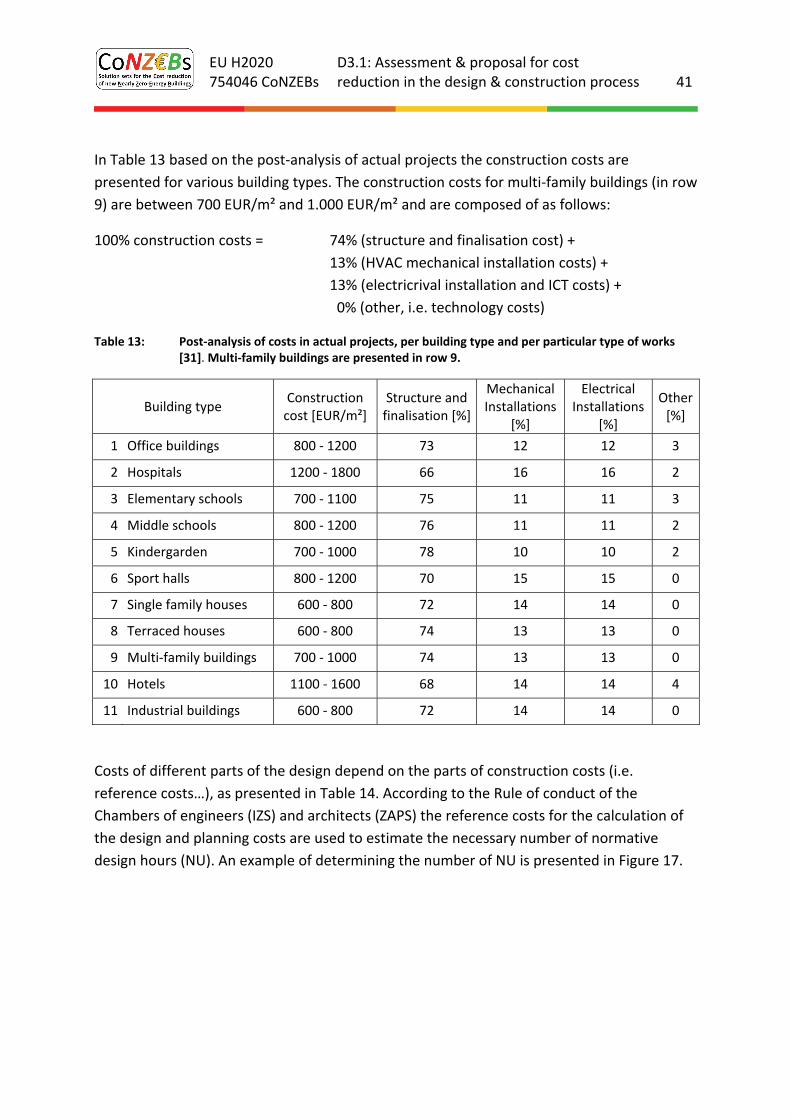
EU H2020 754046 CoNZEBs
D3.1: Assessment & proposal for cost reduction in the design & construction process 41
In Table 13 based on the post‐analysis of actual projects the construction costs are
presented for various building types. The construction costs for multi‐family buildings (in row
9) are between 700 EUR/m² and 1.000 EUR/m² and are composed of as follows:
100% construction costs = 74% (structure and finalisation cost) +
13% (HVAC mechanical installation costs) +
13% (electricrival installation and ICT costs) +
0% (other, i.e. technology costs)
Table 13: Post‐analysis of costs in actual projects, per building type and per particular type of works [31]. Multi‐family buildings are presented in row 9.
Building type Construction cost [EUR/m²]
Structure and finalisation [%]
Mechanical Installations
[%]
Electrical Installations
[%]
Other [%]
1 Office buildings 800 ‐ 1200 73 12 12 3
2 Hospitals 1200 ‐ 1800 66 16 16 2
3 Elementary schools 700 ‐ 1100 75 11 11 3
4 Middle schools 800 ‐ 1200 76 11 11 2
5 Kindergarden 700 ‐ 1000 78 10 10 2
6 Sport halls 800 ‐ 1200 70 15 15 0
7 Single family houses 600 ‐ 800 72 14 14 0
8 Terraced houses 600 ‐ 800 74 13 13 0
9 Multi‐family buildings 700 ‐ 1000 74 13 13 0
10 Hotels 1100 ‐ 1600 68 14 14 4
11 Industrial buildings 600 ‐ 800 72 14 14 0
Costs of different parts of the design depend on the parts of construction costs (i.e.
reference costs…), as presented in Table 14. According to the Rule of conduct of the
Chambers of engineers (IZS) and architects (ZAPS) the reference costs for the calculation of
the design and planning costs are used to estimate the necessary number of normative
design hours (NU). An example of determining the number of NU is presented in Figure 17.
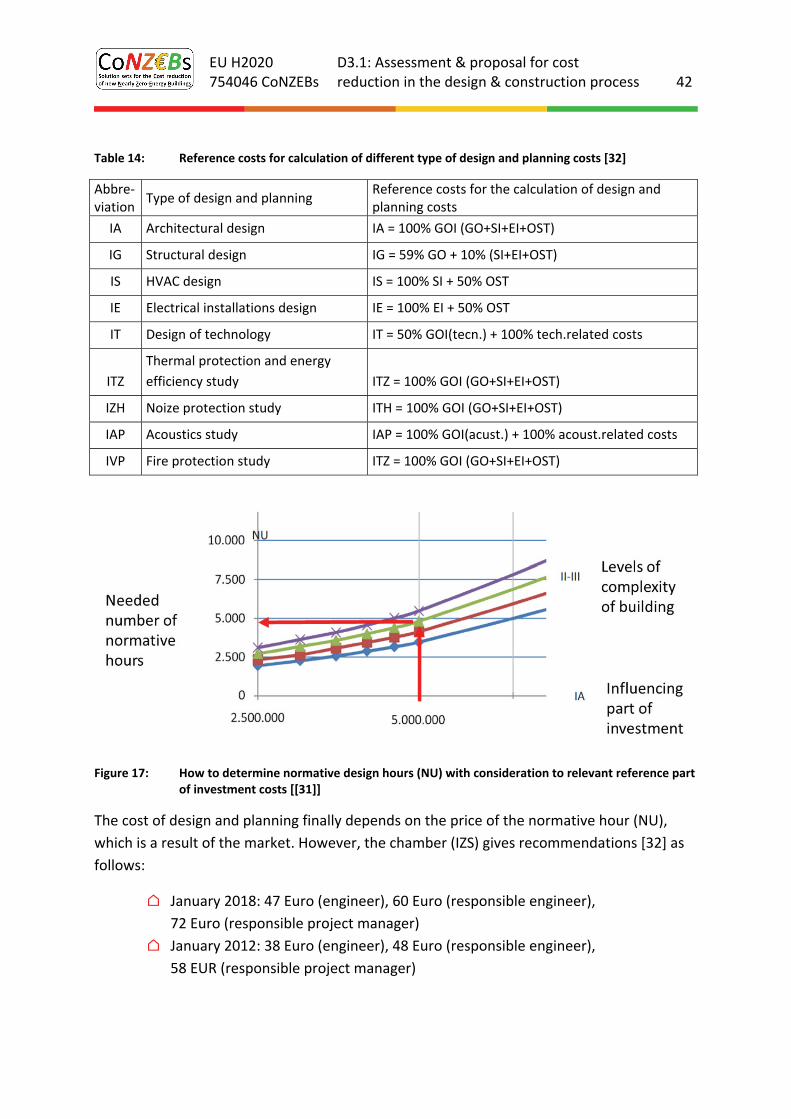
EU H2020 754046 CoNZEBs
D3.1: Assessment & proposal for cost reduction in the design & construction process 42
Table 14: Reference costs for calculation of different type of design and planning costs [32]
Abbre‐viation
Type of design and planning Reference costs for the calculation of design and planning costs
IA Architectural design IA = 100% GOI (GO+SI+EI+OST)
IG Structural design IG = 59% GO + 10% (SI+EI+OST)
IS HVAC design IS = 100% SI + 50% OST
IE Electrical installations design IE = 100% EI + 50% OST
IT Design of technology IT = 50% GOI(tecn.) + 100% tech.related costs
ITZ
Thermal protection and energy
efficiency study ITZ = 100% GOI (GO+SI+EI+OST)
IZH Noize protection study ITH = 100% GOI (GO+SI+EI+OST)
IAP Acoustics study IAP = 100% GOI(acust.) + 100% acoust.related costs
IVP Fire protection study ITZ = 100% GOI (GO+SI+EI+OST)
Figure 17: How to determine normative design hours (NU) with consideration to relevant reference part of investment costs [[31]]
The cost of design and planning finally depends on the price of the normative hour (NU),
which is a result of the market. However, the chamber (IZS) gives recommendations [32] as
follows:
⌂ January 2018: 47 Euro (engineer), 60 Euro (responsible engineer),
72 Euro (responsible project manager)
⌂ January 2012: 38 Euro (engineer), 48 Euro (responsible engineer),
58 EUR (responsible project manager)
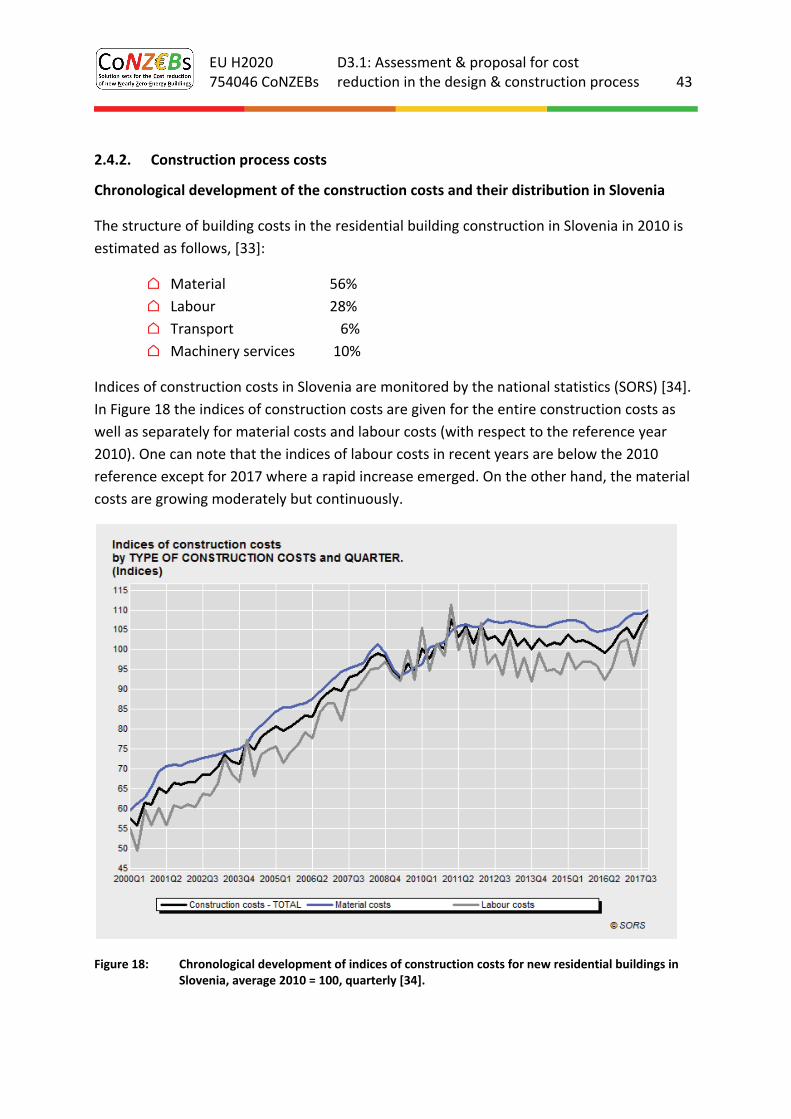
EU H2020 754046 CoNZEBs
D3.1: Assessment & proposal for cost reduction in the design & construction process 43
2.4.2. Construction process costs
Chronological development of the construction costs and their distribution in Slovenia
The structure of building costs in the residential building construction in Slovenia in 2010 is
estimated as follows, [33]:
⌂ Material 56%
⌂ Labour 28%
⌂ Transport 6%
⌂ Machinery services 10%
Indices of construction costs in Slovenia are monitored by the national statistics (SORS) [34].
In Figure 18 the indices of construction costs are given for the entire construction costs as
well as separately for material costs and labour costs (with respect to the reference year
2010). One can note that the indices of labour costs in recent years are below the 2010
reference except for 2017 where a rapid increase emerged. On the other hand, the material
costs are growing moderately but continuously.
Figure 18: Chronological development of indices of construction costs for new residential buildings in Slovenia, average 2010 = 100, quarterly [34].
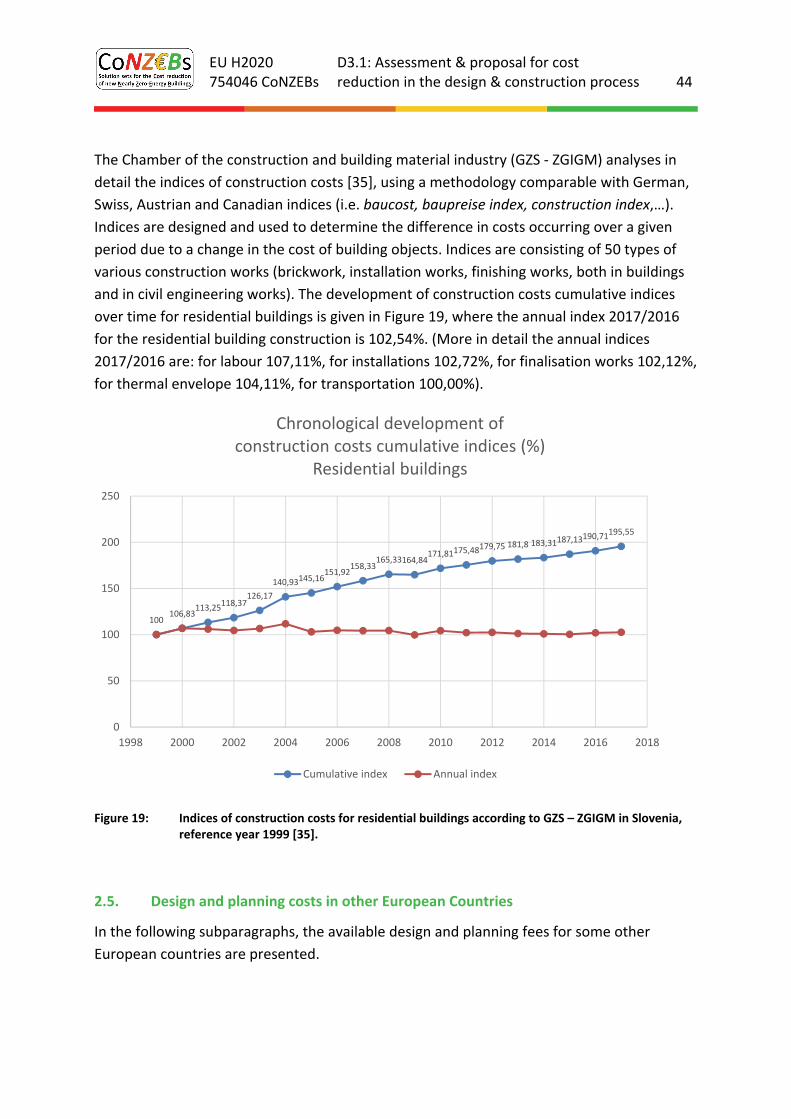
EU H2020 754046 CoNZEBs
D3.1: Assessment & proposal for cost reduction in the design & construction process 44
The Chamber of the construction and building material industry (GZS ‐ ZGIGM) analyses in
detail the indices of construction costs [35], using a methodology comparable with German,
Swiss, Austrian and Canadian indices (i.e. baucost, baupreise index, construction index,…).
Indices are designed and used to determine the difference in costs occurring over a given
period due to a change in the cost of building objects. Indices are consisting of 50 types of
various construction works (brickwork, installation works, finishing works, both in buildings
and in civil engineering works). The development of construction costs cumulative indices
over time for residential buildings is given in Figure 19, where the annual index 2017/2016
for the residential building construction is 102,54%. (More in detail the annual indices
2017/2016 are: for labour 107,11%, for installations 102,72%, for finalisation works 102,12%,
for thermal envelope 104,11%, for transportation 100,00%).
Figure 19: Indices of construction costs for residential buildings according to GZS – ZGIGM in Slovenia, reference year 1999 [35].
2.5. Design and planning costs in other European Countries
In the following subparagraphs, the available design and planning fees for some other
European countries are presented.
100106,83
113,25118,37
126,17
140,93145,16151,92
158,33165,33164,84
171,81175,48179,75 181,8 183,31
187,13190,71195,55
0
50
100
150
200
250
1998 2000 2002 2004 2006 2008 2010 2012 2014 2016 2018
Chronological development of construction costs cumulative indices (%)
Residential buildings
Cumulative index Annual index
EU H2020 754046 CoNZEBs
D3.1: Assessment & proposal for cost reduction in the design & construction process 45
2.5.1. France
In France there is no fixed regulation for the calculation of design fees. In [36] it is stated
that fees can be negotiated between clients and the design team and they are normally
based on the percentage of construction costs. Normally, at least 3% of the construction
costs are payed for the planning phase with an addition of 5 ‐ 10% for supervising the
construction works. The percentage distribution of the total design costs is: 30% for the
planning phase, 35% for works specification and administrative process, 30% for the
supervision of works and 5% at the end of the works [36].
A free software provided by the Ministerial Mission for the Quality of Public Buildings
(MIQCP) is available online which allows to forecast the fees for project management in new
buildings [37].
This tool could help administrators to make a first indicative evaluation of design costs in the
phase of the programme budgeting. The tool takes into account the estimated cost of the
works, the nature of the work, the complexity of the design process (which can be calculated
in a simplified or detailed way), the request of additional services (i.e. coordination of fire
safety systems, dynamic thermal simulation, building energy audit) and the expected
duration of the building construction. The percentage expressed by the tool is considered
excluding taxes.
For the construction of a multi‐family building with an average level of complexity an
estimated time of construction of 12 months and without considering additional services,
the tool suggests a percentage fee of about 12% for the design phase when construction
costs are low (500.000 €) and a percentage fee of about 8% for higher commissioning
(20.000.000 €).
2.5.2. England
In 2009 the Royal Institute of British Architects (RIBA) abolished their indicative fee scales
[38]. These scales were expressed as a percentage of construction costs for a range of
different building types, but Laws forced to abolish them in order to prevent anti‐
competitive behaviours and allow free negotiation based on market forces. Due to this, only
few information is freely available. According to a recent benchmarking [39], fees are
commonly quoted as being between 8 and 12%, mainly depending on the nature of the
building and the construction costs. In general, it is estimated that large new building
projects require much lower design percentage fees than small work on existing buildings
and also design fees for commercial works are payed less than private residential works.
EU H2020 754046 CoNZEBs
D3.1: Assessment & proposal for cost reduction in the design & construction process 46
2.5.3. Spain
As in England, there were standard fee rates until the adoption of the Law 7/1997 on
liberalization measures on soil and professional colleges which transformed the required fee
scales into indicative suggestions. Since 2009, also the development of guiding scales or
indicative rules on professional fees is prohibited for guaranteeing free market negotiation.
An average value of design fees is reported in [40] and it is around 10% to 13% of the official
cost of the works. The cost of the works (called Precio Ejecución Material or PEM) does not
correspond to the real costs but they are substantially lower (around 50% lower). Infact
these costs were given by the College of Architects many years ago and are still used by
some local authorities and depend on the type of work, the location and size of the
project. In [41] some indication of possible fee rates depending on the different tasks and
PEM of the building are suggested. As shown in Table 15, for both the planning and
construction management phases of a building characterized by a PEM of 1,000,000 € the
fees are about 13%; for higher commissioning (more than 10,000,000 €) the percentage rate
is about 7%. Considering that, as aforementioned, the PEM are almost half of the real costs
available on the market, it can be stated that architect fees in Spain are highly lower than in
the other countries in Europe. The percentage distribution of the total design costs is: 5% for
the preliminary studies, 20% for the preliminary design, 15% for the definitive project, 30%
for the executive project, 25% for the construction management and finally 5% at the end of
all the works.
Table 15: Suggested fee rates for the design and construction management phases depending on the PEM of the building [41]
Design and planning phase
Cost of the works (PEM) [€] Percentage of (PEM)
1 Minimum 6000 €
2 1,000,000 7.23 %
3 3,000,000 6.1 %
4 6,000,000 5 %
5 10,000,000 4.41 %
6 more than 10,000,000 3.84 %
Management of the construction phase
Cost of the works (PEM) [€] Percentage of (PEM)
1 Minimum 5000 €
2 1,000,000 6.2 %
3 3,000,000 5.2 %
4 6,000,000 4.3 %
5 10,000,000 3.8 %
6 more than 10,000,000 3.3 %
EU H2020 754046 CoNZEBs
D3.1: Assessment & proposal for cost reduction in the design & construction process 47
2.5.4. Ireland
Fixed planning fees in Ireland are not provided. The Royal Institute of the Architect of Ireland
(RIAI) developed a survey to assess the average charges payed in the open market place for
building projects in private and public‐sector [42]. Typically for a project up to 500,000 € the
percentage fee is between 9 % and 11% of the contract sum. From this survey, it can be also
noticed that the variation of the percentage fees is not dependant on the construction costs
of the building. In a more recent update of the survey developed by RIAI [43] it was
confirmed that there is huge variation of planning fees based on the budget, location,
complexity of site and building but 5 ‐ 6% is not unusual for 'up to planning permission' and 8
‐ 11% for full project engagements for budgets from 100,000 ‐200,000 €.
In Ireland design fees are usually provided at various project stages: initial design (25%),
developed design to planning (25%), detail design for tenders (25%) and construction
management (25%).
2.5.5. Poland
The association of Polish Architects (SARP) provides a design fee scale depending on
estimated construction costs, degree of complexity and size of the building, but these data
are not available online. In [44] it is stated that the architect’s design fee (including other
engineers and consultants) generally varies from 3% to 8% of the building construction costs.
These percentage charges are based on a survey developed in 2007 so they might have been
varied in these years.
2.5.6. Switzerland
In Switzerland there are fixed scales for defining the design fees. These charges are provided
and update periodically by the Swiss Society of Engineers and Architects (SIA) and
Coordination Group for Construction and Property Services (KBOB) [45]. The calculation is
performed by means of specific equations depending on related variables: building type,
construction cost of the building, average time needed for completion of design and
planning works, degree of complexity of the building (comprised between 0 and 1), the
percentage part of the appointment respect to the overall design phase and the complexity
of the appointment.
Design and planning fee are calculated as follows:
(1)
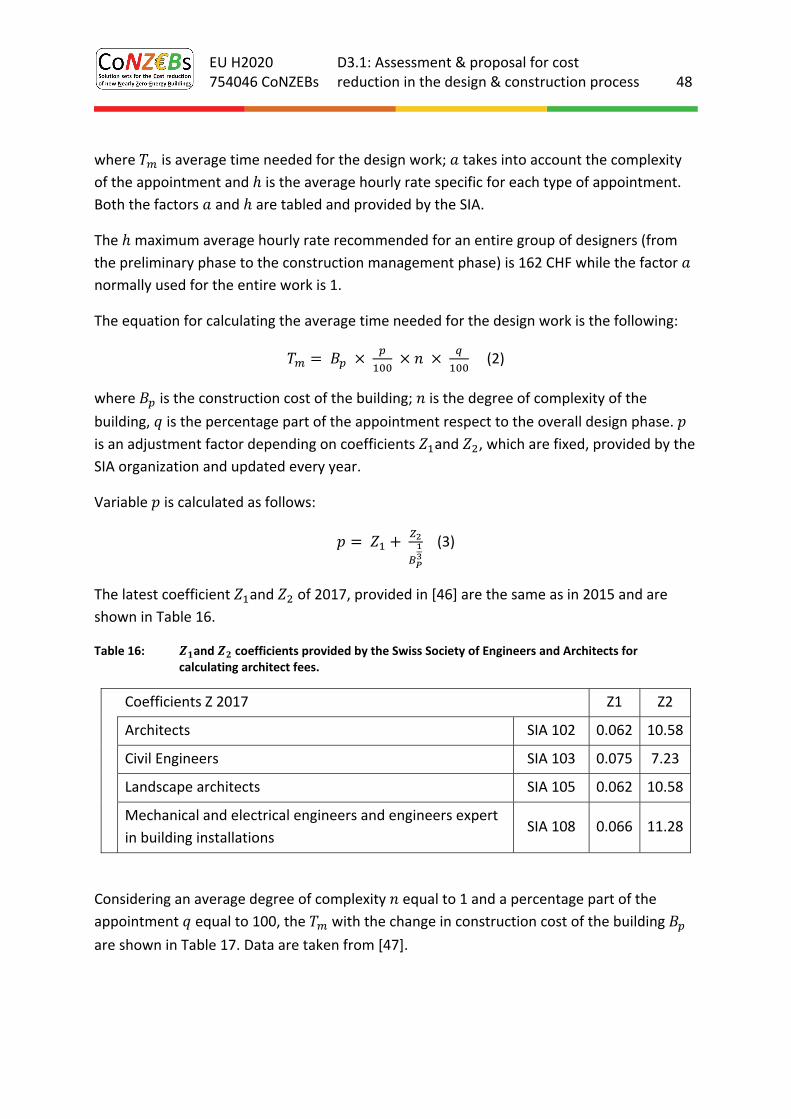
EU H2020 754046 CoNZEBs
D3.1: Assessment & proposal for cost reduction in the design & construction process 48
where is average time needed for the design work; takes into account the complexity
of the appointment and is the average hourly rate specific for each type of appointment.
Both the factors and are tabled and provided by the SIA.
The maximum average hourly rate recommended for an entire group of designers (from
the preliminary phase to the construction management phase) is 162 CHF while the factor
normally used for the entire work is 1.
The equation for calculating the average time needed for the design work is the following:
(2)
where is the construction cost of the building; is the degree of complexity of the
building, is the percentage part of the appointment respect to the overall design phase.
is an adjustment factor depending on coefficients and , which are fixed, provided by the
SIA organization and updated every year.
Variable is calculated as follows:
(3)
The latest coefficient and of 2017, provided in [46] are the same as in 2015 and are
shown in Table 16.
Table 16: and coefficients provided by the Swiss Society of Engineers and Architects for calculating architect fees.
Coefficients Z 2017 Z1 Z2
Architects SIA 102 0.062 10.58
Civil Engineers SIA 103 0.075 7.23
Landscape architects SIA 105 0.062 10.58
Mechanical and electrical engineers and engineers expert
in building installations SIA 108 0.066 11.28
Considering an average degree of complexity equal to 1 and a percentage part of the
appointment equal to 100, the with the change in construction cost of the building
are shown in Table 17. Data are taken from [47].
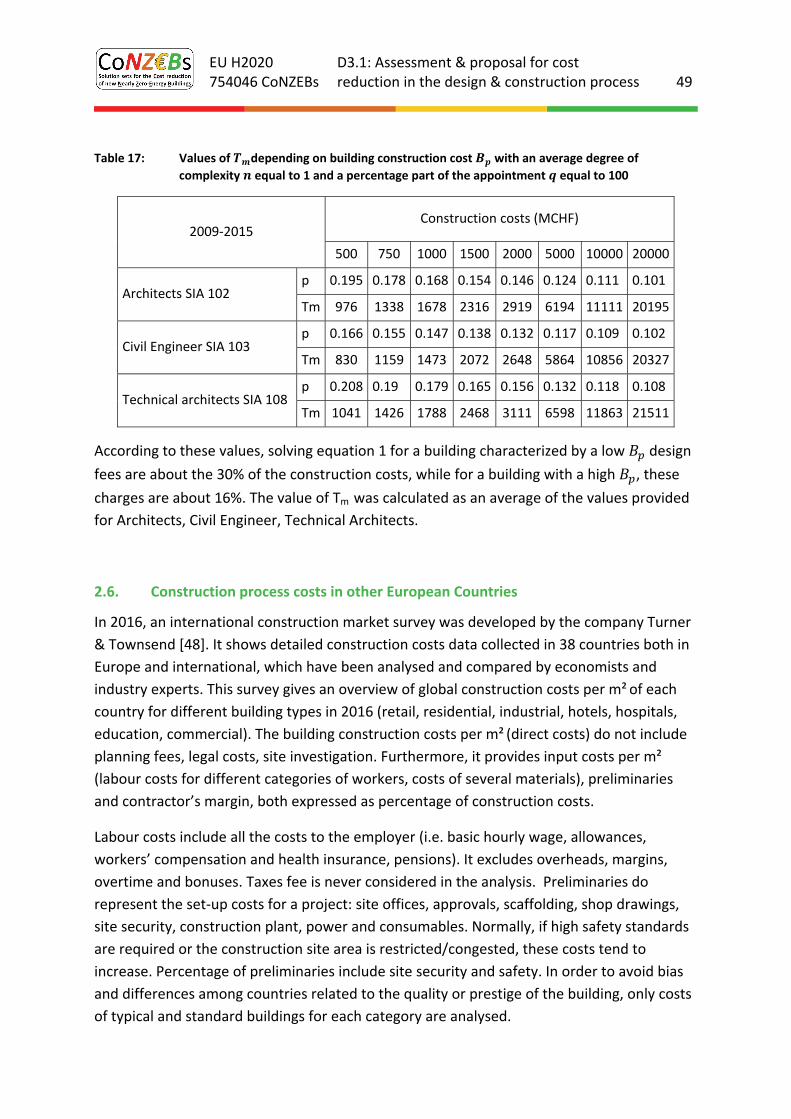
EU H2020 754046 CoNZEBs
D3.1: Assessment & proposal for cost reduction in the design & construction process 49
Table 17: Values of depending on building construction cost with an average degree of
complexity equal to 1 and a percentage part of the appointment equal to 100
2009‐2015 Construction costs (MCHF)
500 750 1000 1500 2000 5000 10000 20000
Architects SIA 102 p 0.195 0.178 0.168 0.154 0.146 0.124 0.111 0.101
Tm 976 1338 1678 2316 2919 6194 11111 20195
Civil Engineer SIA 103 p 0.166 0.155 0.147 0.138 0.132 0.117 0.109 0.102
Tm 830 1159 1473 2072 2648 5864 10856 20327
Technical architects SIA 108 p 0.208 0.19 0.179 0.165 0.156 0.132 0.118 0.108
Tm 1041 1426 1788 2468 3111 6598 11863 21511
According to these values, solving equation 1 for a building characterized by a low design
fees are about the 30% of the construction costs, while for a building with a high , these
charges are about 16%. The value of Tm was calculated as an average of the values provided
for Architects, Civil Engineer, Technical Architects.
2.6. Construction process costs in other European Countries
In 2016, an international construction market survey was developed by the company Turner
& Townsend [48]. It shows detailed construction costs data collected in 38 countries both in
Europe and international, which have been analysed and compared by economists and
industry experts. This survey gives an overview of global construction costs per m² of each
country for different building types in 2016 (retail, residential, industrial, hotels, hospitals,
education, commercial). The building construction costs per m² (direct costs) do not include
planning fees, legal costs, site investigation. Furthermore, it provides input costs per m²
(labour costs for different categories of workers, costs of several materials), preliminaries
and contractor’s margin, both expressed as percentage of construction costs.
Labour costs include all the costs to the employer (i.e. basic hourly wage, allowances,
workers’ compensation and health insurance, pensions). It excludes overheads, margins,
overtime and bonuses. Taxes fee is never considered in the analysis. Preliminaries do
represent the set‐up costs for a project: site offices, approvals, scaffolding, shop drawings,
site security, construction plant, power and consumables. Normally, if high safety standards
are required or the construction site area is restricted/congested, these costs tend to
increase. Percentage of preliminaries include site security and safety. In order to avoid bias
and differences among countries related to the quality or prestige of the building, only costs
of typical and standard buildings for each category are analysed.
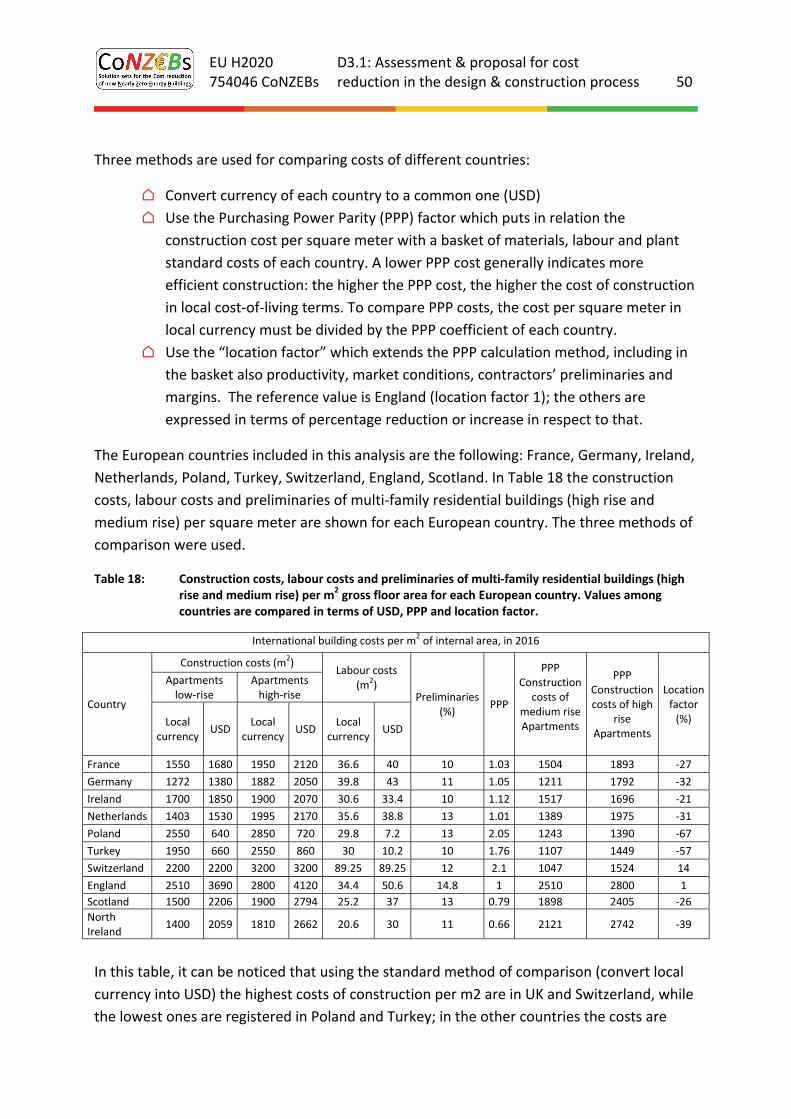
EU H2020 754046 CoNZEBs
D3.1: Assessment & proposal for cost reduction in the design & construction process 50
Three methods are used for comparing costs of different countries:
⌂ Convert currency of each country to a common one (USD)
⌂ Use the Purchasing Power Parity (PPP) factor which puts in relation the
construction cost per square meter with a basket of materials, labour and plant
standard costs of each country. A lower PPP cost generally indicates more
efficient construction: the higher the PPP cost, the higher the cost of construction
in local cost‐of‐living terms. To compare PPP costs, the cost per square meter in
local currency must be divided by the PPP coefficient of each country.
⌂ Use the “location factor” which extends the PPP calculation method, including in
the basket also productivity, market conditions, contractors’ preliminaries and
margins. The reference value is England (location factor 1); the others are
expressed in terms of percentage reduction or increase in respect to that.
The European countries included in this analysis are the following: France, Germany, Ireland,
Netherlands, Poland, Turkey, Switzerland, England, Scotland. In Table 18 the construction
costs, labour costs and preliminaries of multi‐family residential buildings (high rise and
medium rise) per square meter are shown for each European country. The three methods of
comparison were used.
Table 18: Construction costs, labour costs and preliminaries of multi‐family residential buildings (high rise and medium rise) per m2 gross floor area for each European country. Values among countries are compared in terms of USD, PPP and location factor.
International building costs per m2 of internal area, in 2016
Country
Construction costs (m2)
Labour costs (m2)
Preliminaries (%)
PPP
PPP Construction
costs of medium rise Apartments
PPP
Construction costs of high
rise Apartments
Location factor (%)
Apartments low‐rise
Apartments high‐rise
Local currency
USD Local
currency USD
Local currency
USD
France 1550 1680 1950 2120 36.6 40 10 1.03 1504 1893 ‐27
Germany 1272 1380 1882 2050 39.8 43 11 1.05 1211 1792 ‐32
Ireland 1700 1850 1900 2070 30.6 33.4 10 1.12 1517 1696 ‐21
Netherlands 1403 1530 1995 2170 35.6 38.8 13 1.01 1389 1975 ‐31
Poland 2550 640 2850 720 29.8 7.2 13 2.05 1243 1390 ‐67
Turkey 1950 660 2550 860 30 10.2 10 1.76 1107 1449 ‐57
Switzerland 2200 2200 3200 3200 89.25 89.25 12 2.1 1047 1524 14
England 2510 3690 2800 4120 34.4 50.6 14.8 1 2510 2800 1
Scotland 1500 2206 1900 2794 25.2 37 13 0.79 1898 2405 ‐26
North Ireland
1400 2059 1810 2662 20.6 30 11 0.66 2121 2742 ‐39
In this table, it can be noticed that using the standard method of comparison (convert local
currency into USD) the highest costs of construction per m2 are in UK and Switzerland, while
the lowest ones are registered in Poland and Turkey; in the other countries the costs are
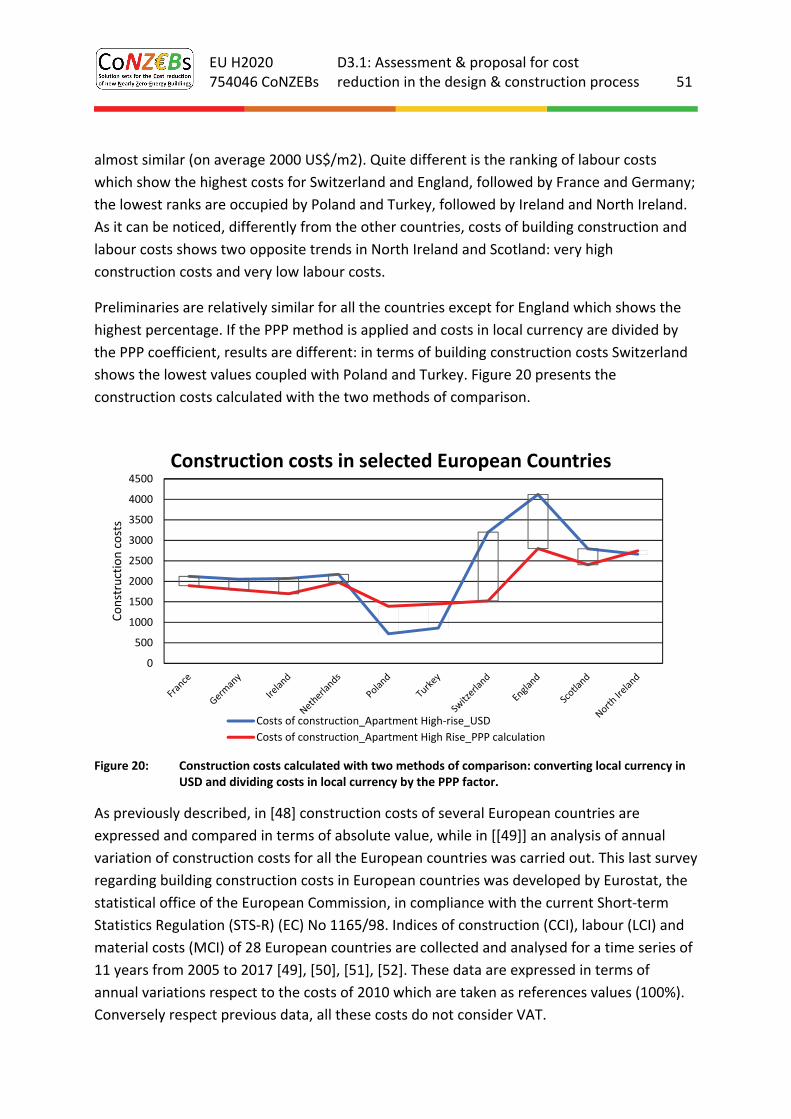
EU H2020 754046 CoNZEBs
D3.1: Assessment & proposal for cost reduction in the design & construction process 51
almost similar (on average 2000 US$/m2). Quite different is the ranking of labour costs
which show the highest costs for Switzerland and England, followed by France and Germany;
the lowest ranks are occupied by Poland and Turkey, followed by Ireland and North Ireland.
As it can be noticed, differently from the other countries, costs of building construction and
labour costs shows two opposite trends in North Ireland and Scotland: very high
construction costs and very low labour costs.
Preliminaries are relatively similar for all the countries except for England which shows the
highest percentage. If the PPP method is applied and costs in local currency are divided by
the PPP coefficient, results are different: in terms of building construction costs Switzerland
shows the lowest values coupled with Poland and Turkey. Figure 20 presents the
construction costs calculated with the two methods of comparison.
Figure 20: Construction costs calculated with two methods of comparison: converting local currency in USD and dividing costs in local currency by the PPP factor.
As previously described, in [48] construction costs of several European countries are
expressed and compared in terms of absolute value, while in [[49]] an analysis of annual
variation of construction costs for all the European countries was carried out. This last survey
regarding building construction costs in European countries was developed by Eurostat, the
statistical office of the European Commission, in compliance with the current Short‐term
Statistics Regulation (STS‐R) (EC) No 1165/98. Indices of construction (CCI), labour (LCI) and
material costs (MCI) of 28 European countries are collected and analysed for a time series of
11 years from 2005 to 2017 [49], [50], [51], [52]. These data are expressed in terms of
annual variations respect to the costs of 2010 which are taken as references values (100%).
Conversely respect previous data, all these costs do not consider VAT.
0
500
1000
1500
2000
2500
3000
3500
4000
4500
Construction costs
Construction costs in selected European Countries
Costs of construction_Apartment High‐rise_USD
Costs of construction_Apartment High Rise_PPP calculation
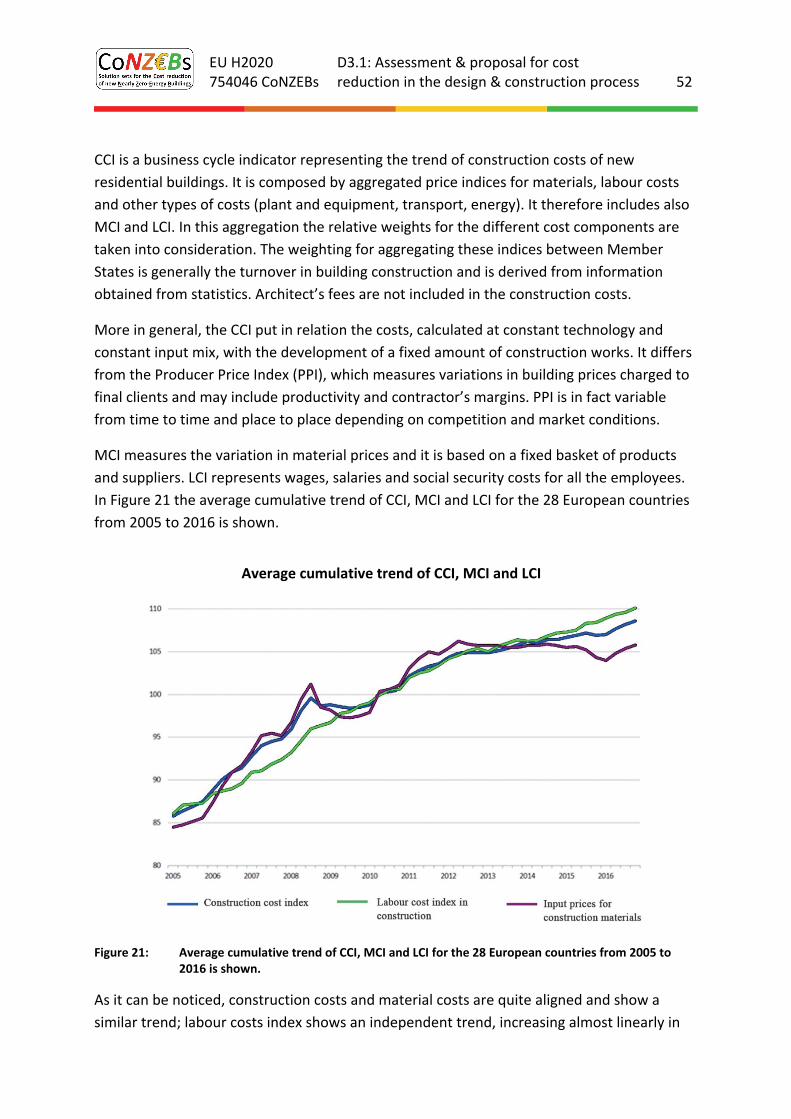
EU H2020 754046 CoNZEBs
D3.1: Assessment & proposal for cost reduction in the design & construction process 52
CCI is a business cycle indicator representing the trend of construction costs of new
residential buildings. It is composed by aggregated price indices for materials, labour costs
and other types of costs (plant and equipment, transport, energy). It therefore includes also
MCI and LCI. In this aggregation the relative weights for the different cost components are
taken into consideration. The weighting for aggregating these indices between Member
States is generally the turnover in building construction and is derived from information
obtained from statistics. Architect’s fees are not included in the construction costs.
More in general, the CCI put in relation the costs, calculated at constant technology and
constant input mix, with the development of a fixed amount of construction works. It differs
from the Producer Price Index (PPI), which measures variations in building prices charged to
final clients and may include productivity and contractor’s margins. PPI is in fact variable
from time to time and place to place depending on competition and market conditions.
MCI measures the variation in material prices and it is based on a fixed basket of products
and suppliers. LCI represents wages, salaries and social security costs for all the employees.
In Figure 21 the average cumulative trend of CCI, MCI and LCI for the 28 European countries
from 2005 to 2016 is shown.
Figure 21: Average cumulative trend of CCI, MCI and LCI for the 28 European countries from 2005 to 2016 is shown.
As it can be noticed, construction costs and material costs are quite aligned and show a
similar trend; labour costs index shows an independent trend, increasing almost linearly in
Average cumulative trend of CCI, MCI and LCI

EU H2020 754046 CoNZEBs
D3.1: Assessment & proposal for cost reduction in the design & construction process 53
these 11 years of observation. Between 2005 and 2008 CCI increased and began to fall only
in 2008 reaching the lowest level for all the countries due to the economic crisis which has
been experienced in the EU. In the year 2010, which is assumed as base year, the index
started to rise, reaching the same levels as before the crisis in a few years. A detailed
analysis of CCI of each country from 2008 to 2017 is shown in Table 19.
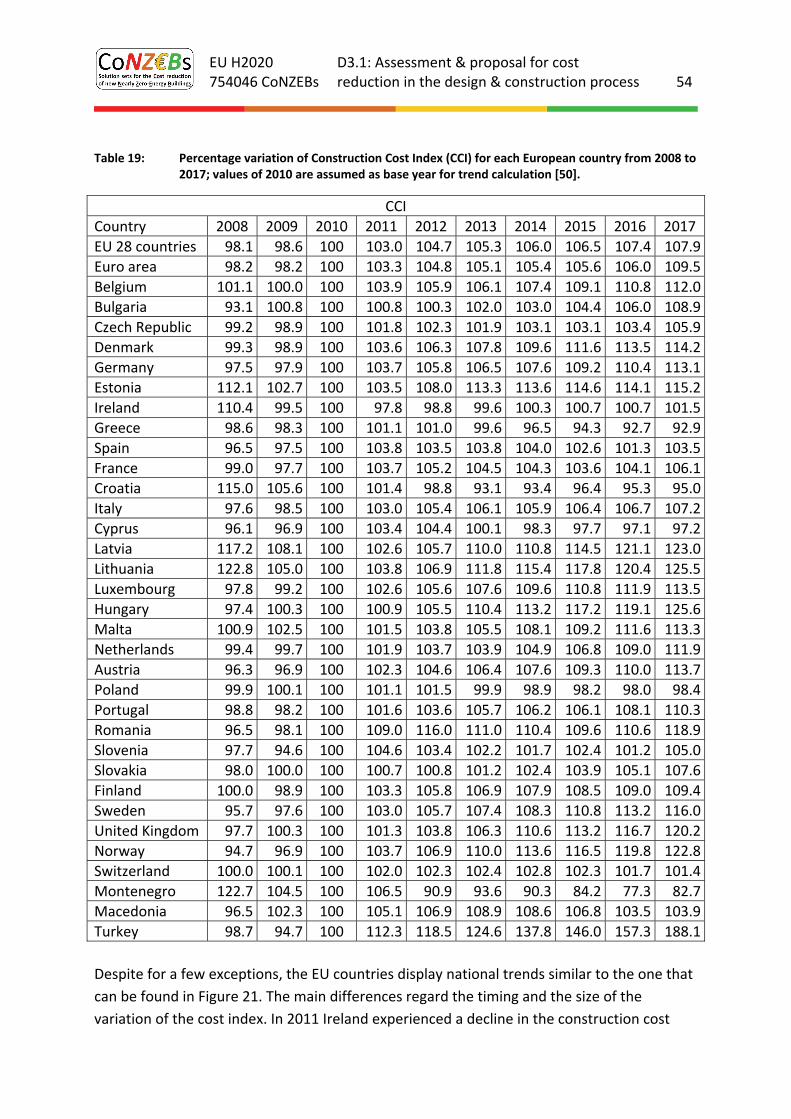
EU H2020 754046 CoNZEBs
D3.1: Assessment & proposal for cost reduction in the design & construction process 54
Table 19: Percentage variation of Construction Cost Index (CCI) for each European country from 2008 to
2017; values of 2010 are assumed as base year for trend calculation [50].
CCI
Country 2008 2009 2010 2011 2012 2013 2014 2015 2016 2017
EU 28 countries 98.1 98.6 100 103.0 104.7 105.3 106.0 106.5 107.4 107.9
Euro area 98.2 98.2 100 103.3 104.8 105.1 105.4 105.6 106.0 109.5
Belgium 101.1 100.0 100 103.9 105.9 106.1 107.4 109.1 110.8 112.0
Bulgaria 93.1 100.8 100 100.8 100.3 102.0 103.0 104.4 106.0 108.9
Czech Republic 99.2 98.9 100 101.8 102.3 101.9 103.1 103.1 103.4 105.9
Denmark 99.3 98.9 100 103.6 106.3 107.8 109.6 111.6 113.5 114.2
Germany 97.5 97.9 100 103.7 105.8 106.5 107.6 109.2 110.4 113.1
Estonia 112.1 102.7 100 103.5 108.0 113.3 113.6 114.6 114.1 115.2
Ireland 110.4 99.5 100 97.8 98.8 99.6 100.3 100.7 100.7 101.5
Greece 98.6 98.3 100 101.1 101.0 99.6 96.5 94.3 92.7 92.9
Spain 96.5 97.5 100 103.8 103.5 103.8 104.0 102.6 101.3 103.5
France 99.0 97.7 100 103.7 105.2 104.5 104.3 103.6 104.1 106.1
Croatia 115.0 105.6 100 101.4 98.8 93.1 93.4 96.4 95.3 95.0
Italy 97.6 98.5 100 103.0 105.4 106.1 105.9 106.4 106.7 107.2
Cyprus 96.1 96.9 100 103.4 104.4 100.1 98.3 97.7 97.1 97.2
Latvia 117.2 108.1 100 102.6 105.7 110.0 110.8 114.5 121.1 123.0
Lithuania 122.8 105.0 100 103.8 106.9 111.8 115.4 117.8 120.4 125.5
Luxembourg 97.8 99.2 100 102.6 105.6 107.6 109.6 110.8 111.9 113.5
Hungary 97.4 100.3 100 100.9 105.5 110.4 113.2 117.2 119.1 125.6
Malta 100.9 102.5 100 101.5 103.8 105.5 108.1 109.2 111.6 113.3
Netherlands 99.4 99.7 100 101.9 103.7 103.9 104.9 106.8 109.0 111.9
Austria 96.3 96.9 100 102.3 104.6 106.4 107.6 109.3 110.0 113.7
Poland 99.9 100.1 100 101.1 101.5 99.9 98.9 98.2 98.0 98.4
Portugal 98.8 98.2 100 101.6 103.6 105.7 106.2 106.1 108.1 110.3
Romania 96.5 98.1 100 109.0 116.0 111.0 110.4 109.6 110.6 118.9
Slovenia 97.7 94.6 100 104.6 103.4 102.2 101.7 102.4 101.2 105.0
Slovakia 98.0 100.0 100 100.7 100.8 101.2 102.4 103.9 105.1 107.6
Finland 100.0 98.9 100 103.3 105.8 106.9 107.9 108.5 109.0 109.4
Sweden 95.7 97.6 100 103.0 105.7 107.4 108.3 110.8 113.2 116.0
United Kingdom 97.7 100.3 100 101.3 103.8 106.3 110.6 113.2 116.7 120.2
Norway 94.7 96.9 100 103.7 106.9 110.0 113.6 116.5 119.8 122.8
Switzerland 100.0 100.1 100 102.0 102.3 102.4 102.8 102.3 101.7 101.4
Montenegro 122.7 104.5 100 106.5 90.9 93.6 90.3 84.2 77.3 82.7
Macedonia 96.5 102.3 100 105.1 106.9 108.9 108.6 106.8 103.5 103.9
Turkey 98.7 94.7 100 112.3 118.5 124.6 137.8 146.0 157.3 188.1
Despite for a few exceptions, the EU countries display national trends similar to the one that
can be found in Figure 21. The main differences regard the timing and the size of the
variation of the cost index. In 2011 Ireland experienced a decline in the construction cost
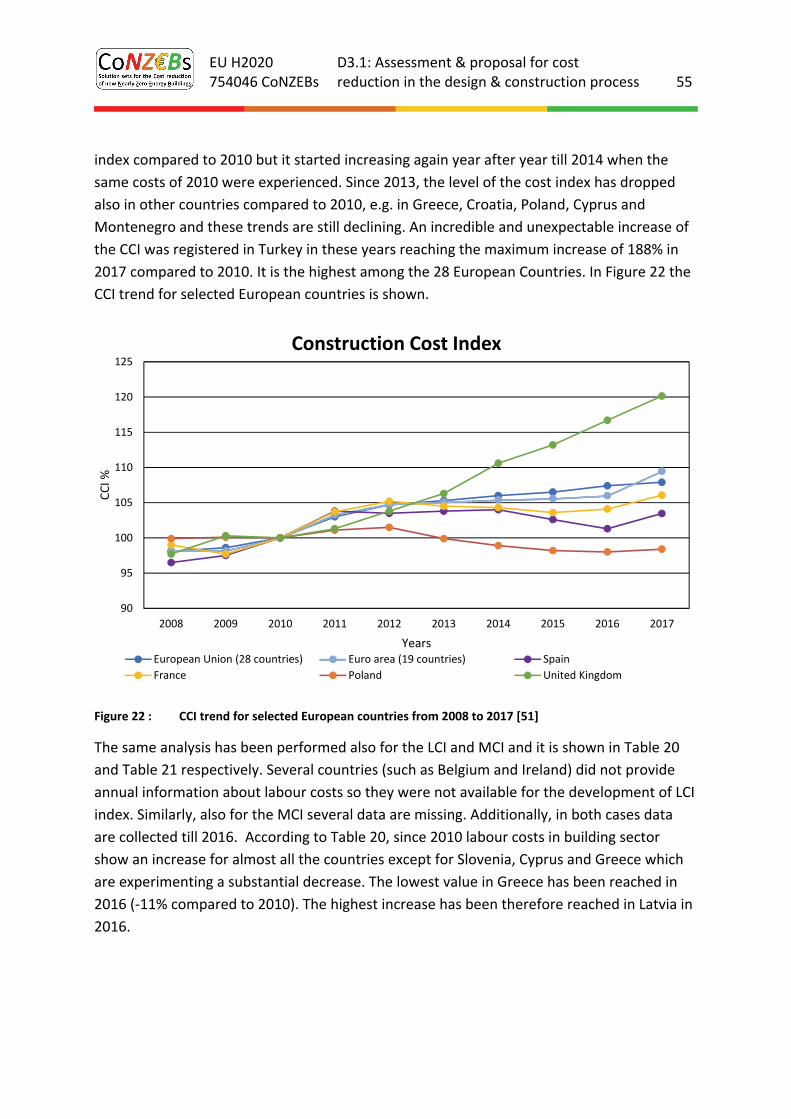
EU H2020 754046 CoNZEBs
D3.1: Assessment & proposal for cost reduction in the design & construction process 55
index compared to 2010 but it started increasing again year after year till 2014 when the
same costs of 2010 were experienced. Since 2013, the level of the cost index has dropped
also in other countries compared to 2010, e.g. in Greece, Croatia, Poland, Cyprus and
Montenegro and these trends are still declining. An incredible and unexpectable increase of
the CCI was registered in Turkey in these years reaching the maximum increase of 188% in
2017 compared to 2010. It is the highest among the 28 European Countries. In Figure 22 the
CCI trend for selected European countries is shown.
Figure 22 : CCI trend for selected European countries from 2008 to 2017 [51]
The same analysis has been performed also for the LCI and MCI and it is shown in Table 20
and Table 21 respectively. Several countries (such as Belgium and Ireland) did not provide
annual information about labour costs so they were not available for the development of LCI
index. Similarly, also for the MCI several data are missing. Additionally, in both cases data
are collected till 2016. According to Table 20, since 2010 labour costs in building sector
show an increase for almost all the countries except for Slovenia, Cyprus and Greece which
are experimenting a substantial decrease. The lowest value in Greece has been reached in
2016 (‐11% compared to 2010). The highest increase has been therefore reached in Latvia in
2016.
90
95
100
105
110
115
120
125
2008 2009 2010 2011 2012 2013 2014 2015 2016 2017
CCI %
Years
Construction Cost Index
European Union (28 countries) Euro area (19 countries) Spain
France Poland United Kingdom
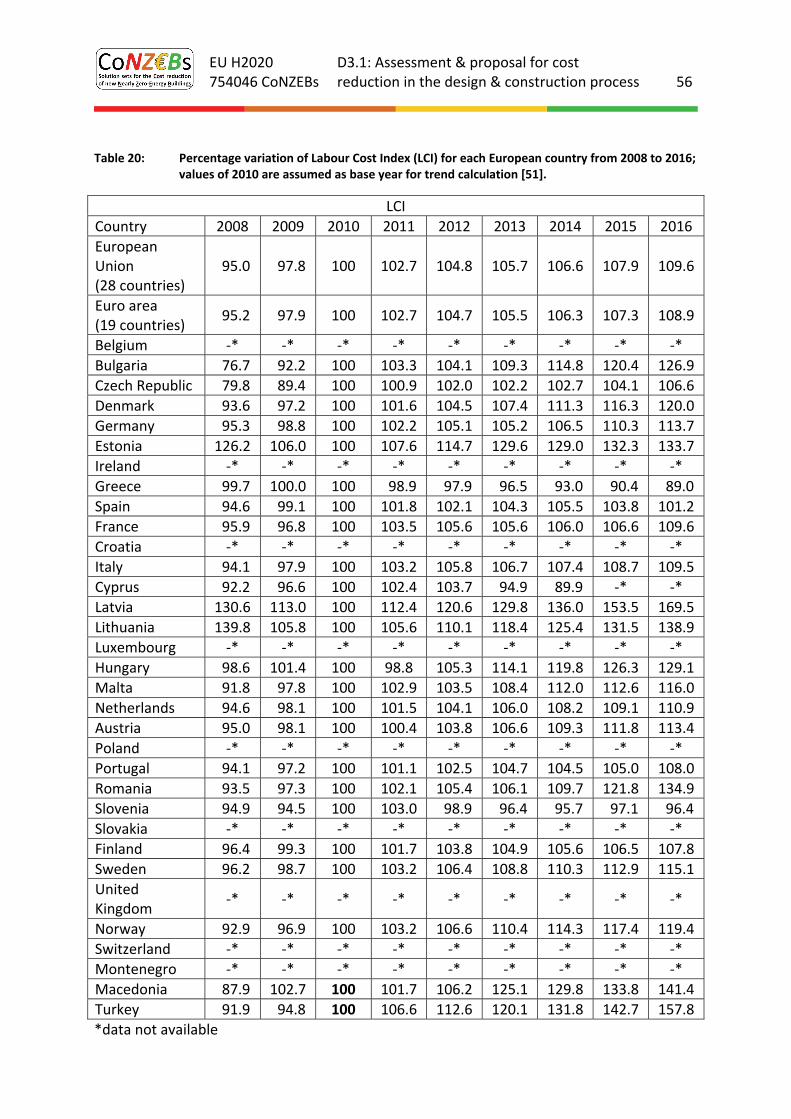
EU H2020 754046 CoNZEBs
D3.1: Assessment & proposal for cost reduction in the design & construction process 56
Table 20: Percentage variation of Labour Cost Index (LCI) for each European country from 2008 to 2016;
values of 2010 are assumed as base year for trend calculation [51].
LCI
Country 2008 2009 2010 2011 2012 2013 2014 2015 2016
European Union (28 countries)
95.0 97.8 100 102.7 104.8 105.7 106.6 107.9 109.6
Euro area (19 countries)
95.2 97.9 100 102.7 104.7 105.5 106.3 107.3 108.9
Belgium ‐* ‐* ‐* ‐* ‐* ‐* ‐* ‐* ‐*
Bulgaria 76.7 92.2 100 103.3 104.1 109.3 114.8 120.4 126.9
Czech Republic 79.8 89.4 100 100.9 102.0 102.2 102.7 104.1 106.6
Denmark 93.6 97.2 100 101.6 104.5 107.4 111.3 116.3 120.0
Germany 95.3 98.8 100 102.2 105.1 105.2 106.5 110.3 113.7
Estonia 126.2 106.0 100 107.6 114.7 129.6 129.0 132.3 133.7
Ireland ‐* ‐* ‐* ‐* ‐* ‐* ‐* ‐* ‐*
Greece 99.7 100.0 100 98.9 97.9 96.5 93.0 90.4 89.0
Spain 94.6 99.1 100 101.8 102.1 104.3 105.5 103.8 101.2
France 95.9 96.8 100 103.5 105.6 105.6 106.0 106.6 109.6
Croatia ‐* ‐* ‐* ‐* ‐* ‐* ‐* ‐* ‐*
Italy 94.1 97.9 100 103.2 105.8 106.7 107.4 108.7 109.5
Cyprus 92.2 96.6 100 102.4 103.7 94.9 89.9 ‐* ‐*
Latvia 130.6 113.0 100 112.4 120.6 129.8 136.0 153.5 169.5
Lithuania 139.8 105.8 100 105.6 110.1 118.4 125.4 131.5 138.9
Luxembourg ‐* ‐* ‐* ‐* ‐* ‐* ‐* ‐* ‐*
Hungary 98.6 101.4 100 98.8 105.3 114.1 119.8 126.3 129.1
Malta 91.8 97.8 100 102.9 103.5 108.4 112.0 112.6 116.0
Netherlands 94.6 98.1 100 101.5 104.1 106.0 108.2 109.1 110.9
Austria 95.0 98.1 100 100.4 103.8 106.6 109.3 111.8 113.4
Poland ‐* ‐* ‐* ‐* ‐* ‐* ‐* ‐* ‐*
Portugal 94.1 97.2 100 101.1 102.5 104.7 104.5 105.0 108.0
Romania 93.5 97.3 100 102.1 105.4 106.1 109.7 121.8 134.9
Slovenia 94.9 94.5 100 103.0 98.9 96.4 95.7 97.1 96.4
Slovakia ‐* ‐* ‐* ‐* ‐* ‐* ‐* ‐* ‐*
Finland 96.4 99.3 100 101.7 103.8 104.9 105.6 106.5 107.8
Sweden 96.2 98.7 100 103.2 106.4 108.8 110.3 112.9 115.1
United Kingdom
‐* ‐* ‐* ‐* ‐* ‐* ‐* ‐* ‐*
Norway 92.9 96.9 100 103.2 106.6 110.4 114.3 117.4 119.4
Switzerland ‐* ‐* ‐* ‐* ‐* ‐* ‐* ‐* ‐*
Montenegro ‐* ‐* ‐* ‐* ‐* ‐* ‐* ‐* ‐*
Macedonia 87.9 102.7 100 101.7 106.2 125.1 129.8 133.8 141.4
Turkey 91.9 94.8 100 106.6 112.6 120.1 131.8 142.7 157.8
*data not available
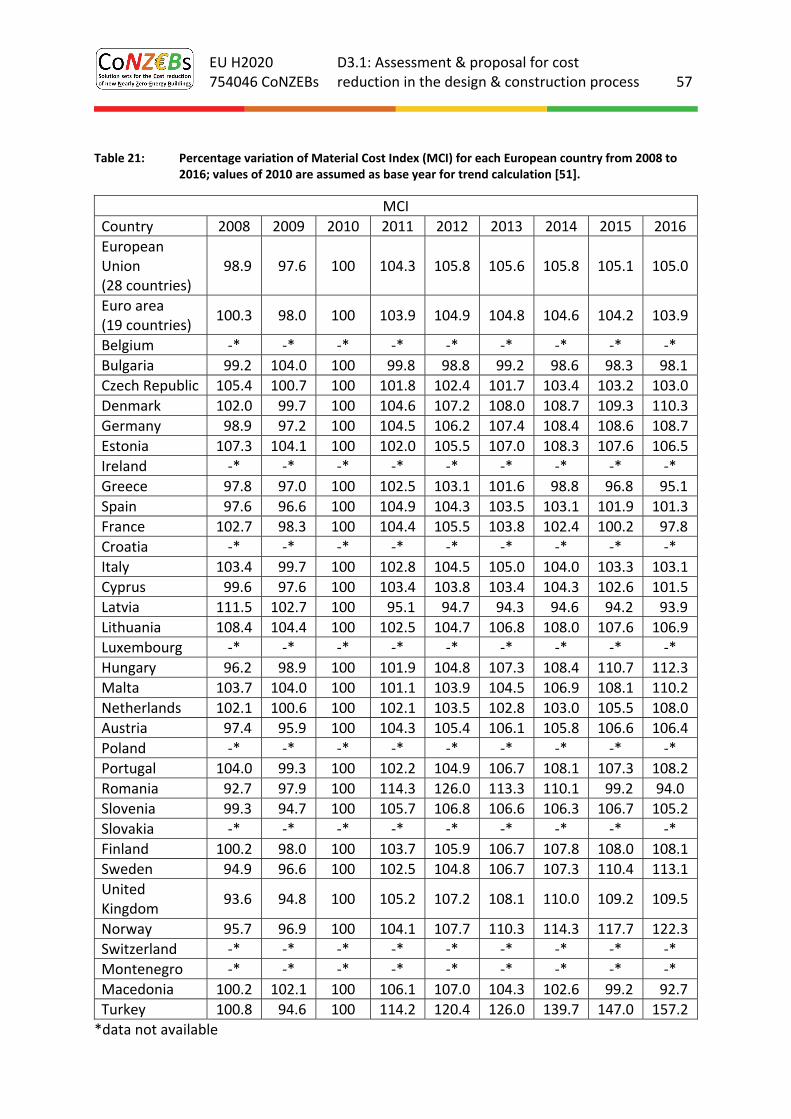
EU H2020 754046 CoNZEBs
D3.1: Assessment & proposal for cost reduction in the design & construction process 57
Table 21: Percentage variation of Material Cost Index (MCI) for each European country from 2008 to
2016; values of 2010 are assumed as base year for trend calculation [51].
MCI
Country 2008 2009 2010 2011 2012 2013 2014 2015 2016
European Union (28 countries)
98.9 97.6 100 104.3 105.8 105.6 105.8 105.1 105.0
Euro area (19 countries)
100.3 98.0 100 103.9 104.9 104.8 104.6 104.2 103.9
Belgium ‐* ‐* ‐* ‐* ‐* ‐* ‐* ‐* ‐*
Bulgaria 99.2 104.0 100 99.8 98.8 99.2 98.6 98.3 98.1
Czech Republic 105.4 100.7 100 101.8 102.4 101.7 103.4 103.2 103.0
Denmark 102.0 99.7 100 104.6 107.2 108.0 108.7 109.3 110.3
Germany 98.9 97.2 100 104.5 106.2 107.4 108.4 108.6 108.7
Estonia 107.3 104.1 100 102.0 105.5 107.0 108.3 107.6 106.5
Ireland ‐* ‐* ‐* ‐* ‐* ‐* ‐* ‐* ‐*
Greece 97.8 97.0 100 102.5 103.1 101.6 98.8 96.8 95.1
Spain 97.6 96.6 100 104.9 104.3 103.5 103.1 101.9 101.3
France 102.7 98.3 100 104.4 105.5 103.8 102.4 100.2 97.8
Croatia ‐* ‐* ‐* ‐* ‐* ‐* ‐* ‐* ‐*
Italy 103.4 99.7 100 102.8 104.5 105.0 104.0 103.3 103.1
Cyprus 99.6 97.6 100 103.4 103.8 103.4 104.3 102.6 101.5
Latvia 111.5 102.7 100 95.1 94.7 94.3 94.6 94.2 93.9
Lithuania 108.4 104.4 100 102.5 104.7 106.8 108.0 107.6 106.9
Luxembourg ‐* ‐* ‐* ‐* ‐* ‐* ‐* ‐* ‐*
Hungary 96.2 98.9 100 101.9 104.8 107.3 108.4 110.7 112.3
Malta 103.7 104.0 100 101.1 103.9 104.5 106.9 108.1 110.2
Netherlands 102.1 100.6 100 102.1 103.5 102.8 103.0 105.5 108.0
Austria 97.4 95.9 100 104.3 105.4 106.1 105.8 106.6 106.4
Poland ‐* ‐* ‐* ‐* ‐* ‐* ‐* ‐* ‐*
Portugal 104.0 99.3 100 102.2 104.9 106.7 108.1 107.3 108.2
Romania 92.7 97.9 100 114.3 126.0 113.3 110.1 99.2 94.0
Slovenia 99.3 94.7 100 105.7 106.8 106.6 106.3 106.7 105.2
Slovakia ‐* ‐* ‐* ‐* ‐* ‐* ‐* ‐* ‐*
Finland 100.2 98.0 100 103.7 105.9 106.7 107.8 108.0 108.1
Sweden 94.9 96.6 100 102.5 104.8 106.7 107.3 110.4 113.1
United Kingdom
93.6 94.8 100 105.2 107.2 108.1 110.0 109.2 109.5
Norway 95.7 96.9 100 104.1 107.7 110.3 114.3 117.7 122.3
Switzerland ‐* ‐* ‐* ‐* ‐* ‐* ‐* ‐* ‐*
Montenegro ‐* ‐* ‐* ‐* ‐* ‐* ‐* ‐* ‐*
Macedonia 100.2 102.1 100 106.1 107.0 104.3 102.6 99.2 92.7
Turkey 100.8 94.6 100 114.2 120.4 126.0 139.7 147.0 157.2
*data not available
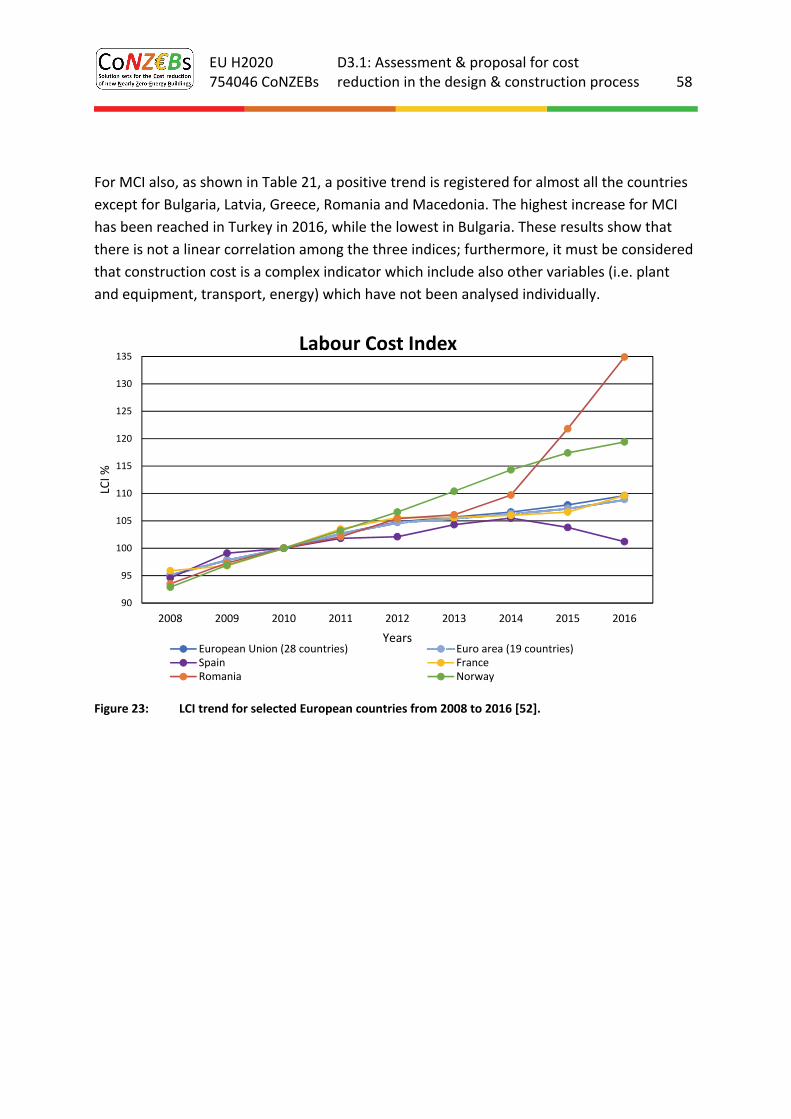
EU H2020 754046 CoNZEBs
D3.1: Assessment & proposal for cost reduction in the design & construction process 58
For MCI also, as shown in Table 21, a positive trend is registered for almost all the countries
except for Bulgaria, Latvia, Greece, Romania and Macedonia. The highest increase for MCI
has been reached in Turkey in 2016, while the lowest in Bulgaria. These results show that
there is not a linear correlation among the three indices; furthermore, it must be considered
that construction cost is a complex indicator which include also other variables (i.e. plant
and equipment, transport, energy) which have not been analysed individually.
Figure 23: LCI trend for selected European countries from 2008 to 2016 [52].
90
95
100
105
110
115
120
125
130
135
2008 2009 2010 2011 2012 2013 2014 2015 2016
LCI %
Years
Labour Cost Index
European Union (28 countries) Euro area (19 countries)Spain FranceRomania Norway
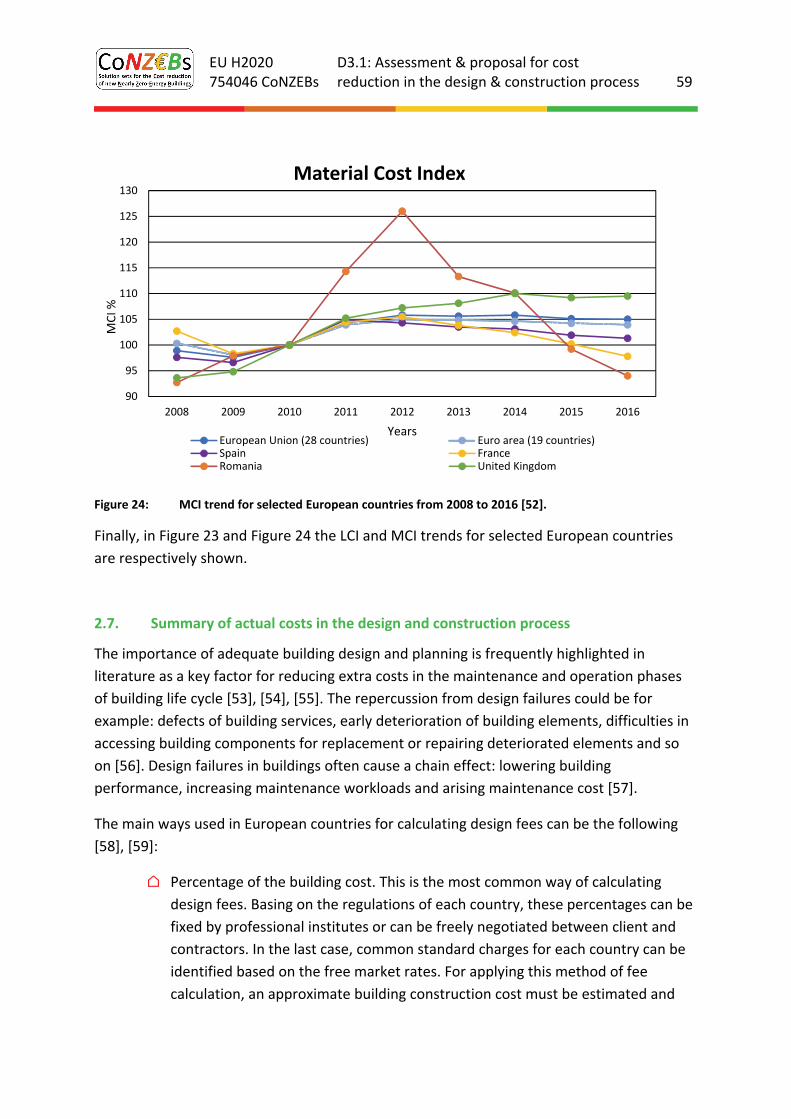
EU H2020 754046 CoNZEBs
D3.1: Assessment & proposal for cost reduction in the design & construction process 59
Figure 24: MCI trend for selected European countries from 2008 to 2016 [52].
Finally, in Figure 23 and Figure 24 the LCI and MCI trends for selected European countries
are respectively shown.
2.7. Summary of actual costs in the design and construction process
The importance of adequate building design and planning is frequently highlighted in
literature as a key factor for reducing extra costs in the maintenance and operation phases
of building life cycle [53], [54], [55]. The repercussion from design failures could be for
example: defects of building services, early deterioration of building elements, difficulties in
accessing building components for replacement or repairing deteriorated elements and so
on [56]. Design failures in buildings often cause a chain effect: lowering building
performance, increasing maintenance workloads and arising maintenance cost [57].
The main ways used in European countries for calculating design fees can be the following
[58], [59]:
⌂ Percentage of the building cost. This is the most common way of calculating
design fees. Basing on the regulations of each country, these percentages can be
fixed by professional institutes or can be freely negotiated between client and
contractors. In the last case, common standard charges for each country can be
identified based on the free market rates. For applying this method of fee
calculation, an approximate building construction cost must be estimated and
90
95
100
105
110
115
120
125
130
2008 2009 2010 2011 2012 2013 2014 2015 2016
MCI %
Years
Material Cost Index
European Union (28 countries) Euro area (19 countries)Spain FranceRomania United Kingdom
EU H2020 754046 CoNZEBs
D3.1: Assessment & proposal for cost reduction in the design & construction process 60
consequently also the scope and category of the services required from
the design team must be known.
⌂ Pre‐defined fixed fees. It is normally used for private commissioning and small
projects because the certainty about the total cost should be guaranteed since
the beginning of the process. Furthermore, the exact role of the design team
must be defined. Only in cases of big changes in terms of the nature of the
appointments or of the project characteristics, then the fees could be re‐
negotiated.
⌂ Time charge based on hourly rates. This solution can be adopted in three cases:
when the scope of the work or the nature of the service are difficult to be
defined at the early stage; in some European countries (such as Switzerland)
where the fixed charge of the design team is based on the sum of the expected
working hours and the average hourly rates; for the assessment of additional or
complementary fees such as measured survey.
Even if the definition of design costs follows the above mainlines, such costs are sometimes
strongly lowered to face the market competitiveness; this is the case of Italy or of Spain,
while in other countries, as Germany and Switzerland, costs are fixed, hence possible area of
cost reduction cannot be pursued in the design process. Concerning average costs, they
strongly change from country to country. In the participating countries the following average
design costs are found:
⌂ Italy 8% (7% for minimum requirement buildings and 9% for NZEBs)
⌂ Denmark 8‐15% of the total construction costs
⌂ Slovenia 4%
⌂ Germany 13% of the total building costs (median costs)
Concerning the construction process, the study in the participating countries showed the
evolution of the building construction, disaggregating data for the most important cost items
(labour, materials and goods, preliminary, rents and transports). Unfortunately, not many
data are available for preliminaries, which are a crucial issue for cost reduction in the
construction process, excluding labour and materials/products, which are covered in another
work package of the CoNZEBs project.
Preliminaries are the cost items that can be further reduced by using appropriate methods,
construction technologies and management. It was found out that preliminaries (or indirect
costs) for new multi‐family houses are in the range of 5 ‐ 10% of the total construction costs
in Italy. Based on the data provided in [48] the average value of preliminaries for the other
European Countries is about 12% of the total construction costs (ranges from 10 to 15%).
EU H2020 754046 CoNZEBs
D3.1: Assessment & proposal for cost reduction in the design & construction process 61
3. Identification of common boundary conditions and areas for potential
cost reduction
This section aims at identifying common boundary conditions, among the participant
countries, and initially screen areas with potential for cost reduction in the design and
construction process to be further analysed through the involvement of stakeholders.
3.1. The design and construction process actors
The design and construction process is a complex process in which several categories are
involved, in particular:
⌂ The client/building owner, public or private.
⌂ The designers and planners.
⌂ The contractors/construction company and subcontractors
⌂ The industry actors: suppliers and manufacturers
Concerning the design and planning phase, several tasks need to be carried out: the design
itself, the quantity survey, reporting and procedures to obtain construction permits.
Depending on the specific project, one or more design offices can be involved in the process
for specific design and planning tasks: architectural, structural, mechanical. The main
professionals are architect and engineers. In some cases, also specialised technicians can be
part of the design process, as an example this applies in Italy for specific and limited cases,
including the residential sector. Consultants can also be part of the process. A typical case is
an expert in charge for the design of energy efficiency and renewable energy aspects. In
larger and complex construction projects, also consultants for the financial aspects can be
hired.
Concerning the construction process, the main actor is the contractors, appointed by the
client or by the construction manager, in turn appointed by the client. The contractors can
be companies of various nature kinds (e.g. savings management companies), but in case of
residential buildings they are mainly construction companies. In some cases, the contractor
can be appointed to carry out the whole design and construction process. The contractors
can directly execute all the construction works using the own staff and building craft, or hire
sub‐contractors, which become responsible for specific tasks of the construction process. It
has to be noted that the bidding procedures may change from country to country, especially
when the client is a public body, as it applies in the case of social housing.
Concerning social housing, it has to be noted that these companies/institutes can be clients
but are also able to carry on the design and/or construction process, according to
EU H2020 754046 CoNZEBs
D3.1: Assessment & proposal for cost reduction in the design & construction process 62
specificities, which depend on several issues: legal status, capacity of carrying on technical
activities and national legislative framework.
Industry actors are gaining relevance in the design and construction process, due to the
potential complexity of high energy performance buildings, even if this applies with
moderate intensity for residential buildings. The involvement of the suppliers is typically
connected to the construction chain. E.g. they become involved during the design phase
when the technological solutions for the envelope and the energy systems need to be
identified and properly planned. Recently, manufacturers are also directly involved in the
construction process due to the development towards industrialisation and prefabrication in
the building sector. In this case stronger connections need to be established also with the
company in charge of the execution of the works, and not only with designers and planners.
According to this analysis, it can be observed that higher synergies are required among
actors involved in the design of high energy performing buildings. The involvement of the
construction company and of the industry suppliers and manufacturers should start in the
early stages of the design and planning process to identify the most efficient solutions in
terms of cost and technical performances. It is, hence, important to consider them also for
the identification of possible cost reduction in the design and construction process. In this
framework, ICT solutions as BIM that are able to easily interconnect the involved actors may
play a relevant role in the construction industry.
3.2. The social housing framework
The situation regarding the social housing is dependent on national social, economic and
normative framework. Some relevant information related to the building stock, as well as
policy development and market trends can be found in [60]. Concerning the participant
countries, the following situation applies:
⌂ In Denmark social housing, built and let by non‐profit associations, accounts for
about 20% of the building stock. Moreover, more than a half million of tenants
received subsidies in 2013. Recently Danish policies focused on energy and
environment performances of housing and a wide energy renovation program
was launched in 2014, with the objective to reduce space heating and hot water
used by 35% in 2050. A review carried out in 2015 showed a 1% increase of
dwellings in respect to the previous decade, confirming that new construction
presents a small slice of the sector [61].
⌂ The situation in Germany is different. The social housing sector decreased from
2.51 million units in 2002 to 1.24 in 2016. With a total of 41.968 million
residential units in Germany in 2016, the stock of social housing units amounts to
EU H2020 754046 CoNZEBs
D3.1: Assessment & proposal for cost reduction in the design & construction process 63
3%. In 2016 a total of 24,550 new social housing units have been built, about
10,000 units more than in 2015 [62].
⌂ In Italy about 3% of 24 million dwellings are managed by social housing
companies, operating at provincial level. However, the economic crisis of the past
decade changed the rental market and today an increase of social housing
demand by low and middle‐income families is observed, due to difficulties in
affording an accommodation in the private rental market. A new program was
launched for the renovation of the housing stock managed by public housing
companies and municipalities, accounting for 490 million € by 2019. The number
of new social housing dwellings is, however, close to negligible.
⌂ In Slovenia, social housing accounts for 6% of the total stock. A new 2015‐2025
national program aims at increasing the social housing stock to support the most
vulnerable population groups, with focus in young families and elderly. The
construction of new communities for the social categories and the
implementation of policy instruments to support low cost maintenance in these
buildings are planned.
According to the framework above and internal communication among project partners, it
can be observed that:
⌂ Conditions for new constructions of NZE multifamily houses can be found mainly
in Germany and Slovenia, while in Denmark and Italy the focus in on the retrofit
of the existing stock.
⌂ Cost related issues are country dependent, as an example Denmark the maximum
costs are independent on the level of building in Denmark, while in Italy the
maximum construction costs for social housing are fixed by the local public
administration.
3.3. The construction site: organisation and worker skills
The construction process finds potential for cost reduction during the construction site
development, where most of the cost for preliminaries are used. The construction site is
going under a significant evolution, with a clear, yet difficult to assess in a quantitative way,
shift from a traditional working place to a more industrialised site. It is expected that a
significant amount of construction works will move from the site to the factory, with
increase of pre‐fabrication and industrialised products. An accurate management of the
construction site might hence provide cost reductions [63].
Applied research on the layout optimisation of the construction site is on‐going since more
than two decades, with approaches based on sophisticated modelling [64]. The optimisation
EU H2020 754046 CoNZEBs
D3.1: Assessment & proposal for cost reduction in the design & construction process 64
takes into account the positioning of materials, tools, products, as well as the time
development of the different work phases.
The lifetime of the site is, in this sense, a crucial topic. The construction company needs the
optimal time for completing a work task: shorter periods cause extra‐costs for additional
non‐productive overtime, more intensive management of workers and subcontractors.
Longer periods will lead to increased and not necessary preliminaries. According to this
framework, the adoption of technological solutions with optimal construction time lower
than conventional solutions may lead to reduced preliminaries.
The role of workers and their skill becomes crucial to improve the productivity, in a
framework strongly influenced by human factors. The latter includes: skill of the worker, his
learning curve, the equipment to be used and the motivation, in turn depending on safety
security and health issues. This particularly applies in high energy‐efficient buildings, a field
in which a lack of skill was detected. According to the European Construction Sector
Observatory more than 3 million workers in the sector will need to increase their skills in
energy in building‐related systems by 2020 [65]; moreover, the sector is experiencing a lack
of workers such as electrical and mechanical operators, roofers, carpenters due to working
conditions and emigration phenomena. In some EU countries such as Italy, Spain, Greece,
half or more of the workers have low individual skills.
The Build UP Skills initiative [66], launched in EU in the past years was set‐up to tackle this
situation, which also led to the birth of national platforms dedicated to increase skills of
workers through vocational training, as well as qualification schemes for workers. Projects
on national basis were launched to develop vocation training for workers and a large
database is available on a dedicated website. In this framework, as exemplary case, the
Bricks Project can be cited [67], in which 11 different qualification and/or certification
models were implemented in Italy. Topics covered were:
⌂ Installation of ETICS
⌂ Energy audit
⌂ Installation of geothermal heat pumps
⌂ Installation and management of building automation systems
⌂ Installation, management and maintenance of solar thermal systems
⌂ Installation of biomass systems
⌂ Maintenance of shunts
⌂ Installation of PV systems
⌂ Installation of boilers (<35 kW)
⌂ Training on energy issues for classroom teaching
⌂ Training for building site operations.
EU H2020 754046 CoNZEBs
D3.1: Assessment & proposal for cost reduction in the design & construction process 65
Even if all the issues presented in this section are of high relevance in the construction
sector, up to now negligible data exists about their impact on the cost reduction in the
design and construction process of nearly zero‐energy buildings. These aspects need further
insight and investigation.
Another screened topic, related to the construction process, was the availability of local
resources as a mean to reduce cost. Unfortunately, no quantitative generalized data were
collected in participant countries. However according to the results of the Italian survey, it is
found that transport accounts for 1% of the overall construction costs. Even if data can
significantly fluctuate among countries, the magnitude of this cost is sufficiently low to state
that this issue has negligible impact on potential cost reduction in the design and
construction process. On the contrary, the topic remains relevant for life cycle assessment,
in which the use of local resources can have a stronger impact.
3.4. Supporting instruments
Today several instruments exist or are under development to improve the performance of
the construction sector in EU. A short review is carried out, to check the way they can
positively affect the design and construction process, especially for what is related to cost
reduction.
3.4.1. Test and inspections to assure the compliance of work with the design
specification
Although significant efforts have been undertaken in Member States since about 10‐15 years
to drastically reduce the energy use in the building sector, improving the compliance of
building energy performance assessments and the quality of building works are two aspects
that remain critical to generalise nearly zero‐energy buildings in Europe, both for new and
existing buildings. An analysis of the additional costs in the German construction sector
caused by faults during the construction process in 2014 identified approx. 10 billion € or
nearly 10% of the turnover of this sector [68]. Comparable values have been reported from
France.
The EU IEE project QUALICHeCK [69] has addressed this issue and has on the one hand
provided field data concerning the quality of works and on the other hand identified
interesting approaches to overcome the existing problems concerning the quality in design
and the realisation on the construction site. The following significant non‐compliance issues
have been found in field studies in 9 countries with building samples of 25+ buildings:
EU H2020 754046 CoNZEBs
D3.1: Assessment & proposal for cost reduction in the design & construction process 66
⌂ In Austria, 20% of the EPC input data had not been updated between design and
completion, resulting in errors in space feating demand assessments in the range
of 5‐28%.
⌂ In Belgium, 46% of the cavity wall insulation of existing buildings investigated
reported a single value for the cavity width, while multiple measurements should
have been reported.
⌂ In Cyprus, 37% of the buildings examined did not comply with the applicable
decree in terms of U‐values.
⌂ In Estonia, 68% of the buildings investigated did not comply with the regulatory
summer comfort requirement.
⌂ In Greece, with respect to the U‐values of door and window frames, 41% of the
buildings under investigation were not compliant with the national legislation.
The percentages of noncompliance for the U‐values of external insulation and for
the solar collectors area are 56% and 73% respectively.
⌂ In Romania, recalculation of the EPCs lead to a change in energy class in almost
40% of the sample for the total energy use, 50% for the space heating energy use.
⌂ In Spain, very significant differences were found between the results given by
several EPC software tools—a deviation up to 6 energy classes in one case.
⌂ In Sweden, the non‐compliance rate based on the availability of the EPC alone
was found of 56% on a sample of 100 new houses.
The identified national and international approaches to check and improve the quality of
planning and construction include the following schemes:
⌂ Voluntary green building schemes or national support programs for highly energy
efficient buildings that include mandatory checks of the design and the
construction on the building site
⌂ Several training and certification programs for designers and installers of heat
pumps, solar thermal systems and ventilation systems
⌂ Several product characteristics databases, harmonised formats for publishing
product performance data and catalogues of pre‐calculated values for thermal
bridges to ease access to input data and thereby reduce the probability of using
incorrect input data.
⌂ The certification frameworks developed in the UK and Belgium for the insulation
of existing cavity walls.
⌂ A framework developed by German manufacturers to certify window installation.
⌂ AMA – general material and workmanship specifications used in Sweden
⌂ The scheme implemented in the Salzburg region of Austria for subsidised
buildings requiring energy performance certificates to be updated upon building
completion.
EU H2020 754046 CoNZEBs
D3.1: Assessment & proposal for cost reduction in the design & construction process 67
⌂ Competent tester schemes for building airtightness testers that reduce the risk of
using an incorrect airtightness value for the energy performance assessment.
⌂ The quality management scheme introduced in the French regulation to improve
building airtightness.
The field studies and the quality schemes are described in detail in reports and fact sheets of
the QUALICHeCK project [69].
3.4.2. The Energy Performance Contract
The energy performance contract is an instrument promoted by EU since more than two
decades, which received formal input thanks to 32/2006/UE and 27/2014/UE Energy Service
Directives and started to find an operative application in Member States. An energy
performance contract is basically a contract between a client and a contractor, typically an
Energy Service Company (ESCO), who undertakes energy efficiency measures with guarantee
of expected energy and economic savings. The contents of the are defined on voluntary
basis, under specific conditions, in the private sector; while they must comply with
requirements set by the above cited Directive and its national implementation for the public
administration. The energy performance contract process is carried out in the following
steps:
⌂ Preliminary study
⌂ Detailed analysis
⌂ Implementation
⌂ Guarantee phase
A relevant aspect of EPC is that, beside the guarantee of expected savings, it allows the
control and monitoring of the energy performance of the building on the long term, thus
ensuring the transparency between the public administration and the energy service
company. It has to be noted that the instrument is still underestimated and still today
several barriers remain:
⌂ Confusion about the definition, only recently solved with the last above cited
Directive.
⌂ Still lack of awareness about the instrument, unlike in the United States.
⌂ Clear and definitive implementation in the Member States, even if national based
approaches are going on.
⌂ Financial conditions of public and private owners, which make difficult to set up
upgrade of energy performance of buildings.
EU H2020 754046 CoNZEBs
D3.1: Assessment & proposal for cost reduction in the design & construction process 68
In order to identify barriers and to propose solutions for a better market penetration, the
energy performance contract was the core topic of EU funded projects such as FRESH
(Financing Energy Refurbishment for Social Housing) and GuarantEE [70][71]. The former
was addressed to the identification of energy performance contracting schemes and testing
them at pilot projects in the social housing sector; the latter explored several aspects to
exploit the market penetration, such as: energy performance contracting in rented buildings,
flexible contracts to make the instruments more appealing in different context and
introduce the role of facilitator, a third figure intermediating between the client and the
energy service company.
The flexible solutions investigated in the GuarantEE project, which is still on going, might be
of interest within the CoNZEBs framework. In fact, even if the energy performance
contracting has potentially higher benefits for the energy renovation of existing buildings, it
could be applied also for new buildings, especially for the social housing companies, which
operate as public companies. Most of the benefits of the energy performance contracts are
concentrated during the operation phase, however the ESCO may contribute in detecting
and suggesting lower costs solutions than those implemented in the original design and thus
reduce the planned construction costs. Another option for cost reduction might be in
buildings beyond nearly zero‐energy performances, in which the ESCO takes charge of extra
cost needed to achieve such performances. This scheme would allow to construct a building
with upgraded energy performance at the cost of a NZEB.
3.4.3. Technical commissioning
The technical commissioning is a specific process, representing the final step of the design
and construction process, in which it is verified that the commissioned building, or its
commissioned systems, are designed, installed and operated, according to the client
requirements, the compliance with standards and normative references that discipline the
topic, the compliance with the project specification and the respect of the economic plan in
all the aspect. According to Annex 40 ‘Commissioning of building HVAC systems for
improving energy performance’ [72], of the Energy in Buildings and Communities program of
the International Energy Agency, the technical commissioning should be applied through the
whole life of the building. The task is carried out by highly skilled third‐party professionals, or
in case of the public administration by staff professionals entitled to perform this activity.
To exploit the full potential of commissioning during the whole lifetime of the buildings, it
should be included in all phases of the design and construction process:
⌂ pre‐design
⌂ design
EU H2020 754046 CoNZEBs
D3.1: Assessment & proposal for cost reduction in the design & construction process 69
⌂ construction
⌂ acceptance
⌂ post‐acceptance
The technical commissioning finds its background on a number of European Directives,
implemented by Member States, in particular:
⌂ Directive 2014/23/EU of 26 February 2014 on the award of concession contracts;
⌂ Directive 2014/24/EU of 26 February 2014 on public procurement and repealing
Directive 2004/18/EC;
⌂ Directive 2014/25/EU of 26 February 2014 on procurement by entities operating
in the water, energy, transport and postal services sectors and repealing Directive
2004/17/EC. It has foreseen, for Member Countries, innovations on tenders to be
carried out by the Public Administration since April 2016;
⌂ Directive 2012/27/EU of 25 October 2012 on energy efficiency, amending
Directives 2009/125/EC and 2010/30/EU and repealing Directives 2004/8/EC and
2006/32/EC which also provides for controls and checks, in terms of compliance,
guarantee, quality and transparency, of the work performed.
The issue of technical commissioning is implemented with different levels of details and
fields of applications. Relevant examples are:
⌂ Austria: gridline on sustainable facility management (Leitlinien für nachhaltiges
facility management in der betriebs‐ und nutzungsphase);
⌂ Denmark: official commissioning standard (DS 3090:2014 ‐ Commissioning‐
processen for bygninger ‐ Installationer i nybyggeri og større ombygninger):
⌂ Germany: technical standard of DHW systems (DIN EN 14336:2005‐01‐
Heizungsanlagen in Gebäuden ‐ Installation und Abnahme der Warmwasser‐
Heizungsanlagen);
⌂ Italy: normative reference to commissioning are contained in Legislative Decree
50/2017 of April 19, under Article 102, paragraph 8, set up by the Ministry of
Infrastructures ‐ High Council for Public Works. Technical standards are under
development;
⌂ United Kingdom: commissioning technical standard (BS 7000‐4:2013 Design
management systems. Guide to managing design in construction).
While the technical commissioning may provide 5‐15% of energy cost savings, with
associated co benefits, it asks for increase of total development costs in 0.3‐0.7% range [73].
In a not‐published study, the commissioning may increase costs for mechanical and electric
installation in 1‐4% range. This indication suggests that, despite the significant impact of the
process across the whole building project lifetime, the commissioning cannot be pursued to
reduce cost in the design and construction process.
EU H2020 754046 CoNZEBs
D3.1: Assessment & proposal for cost reduction in the design & construction process 70
3.5. Conclusions
The screening review carried out in this chapter allowed to identify: actors, settings and
instruments, which address the next steps of the report, that are aimed at detecting areas
for cost reduction and develop exemplary solutions.
It has to be noted that few quantitative data are available for most of the examined
conditions; moreover, several instruments that have potentials for improving the energy and
cost performance across the whole lifetime of the building cannot be taken into
consideration for the present activity since it is focused on cost reduction during the design
and construction process only.
EU H2020 754046 CoNZEBs
D3.1: Assessment & proposal for cost reduction in the design & construction process 71
4. Exploring possible solutions for cost reductions in the design and
construction process
After having assessed actual costs in the design and construction processes, the next phase
was to detect areas for possible cost reductions, taking into account all the aspects
connected with the whole building process. Unfortunately, not many sources and literature
data are available regarding the interaction between the building energy solutions and the
impact on the design and construction processes on the overall construction costs. It was
hence decided to set‐up closer connections between the projects partners and the market
stakeholders, to collect idea, barriers and try to identify potential solutions to reduce
construction process costs.
The first step was the direct involvement of stakeholders, asking their perspective on the
construction sectors in terms of cost reduction for new buildings. Designers, construction
companies, social housing bodies, contractors were asked to share their view by filling a
dedicated questionnaire and through vis‐a‐vis interviews. The national partners had to
identify the most efficient approach to collect the needed information.
4.1. Implementation of the questionnaire
This section presents the process to involve stakeholders with adequate means:
questionnaires and/or direct interviews. The work was carried out by the national research
partners, using the most promising approach to reach the stakeholders. This section
describes the contents and the structure of the questionnaire. The following chapters
present the results achieved at national level, while the last one summarises the main
findings data that can be observed at international level. It has to be noted that no specific
protocols were identified to carry on interviews, but it was up to the interviewer to ask
questions using the questionnaire as starting point for discussion.
The development of the questionnaire aimed at identifying the most crucial issues to discuss
with the stakeholders, in order to better understand if and how cost reduction strategies
might be possible in the design and construction processes. The questionnaires, developed
by the project partners, were prepared having in mind the two main phases and stakeholder
categories of the construction process:
⌂ A questionnaire for designers and planners
⌂ A questionnaire for construction companies, social housing associations and
contractors.
Companies that are able to carry out the whole process, were asked to complete both
questionnaires. A common structure and common contents were identified for the two
EU H2020 754046 CoNZEBs
D3.1: Assessment & proposal for cost reduction in the design & construction process 72
questionnaires, even if room was left in the national versions for integrating issues
considered relevant in a specific country. When needed it was asked to provide
disaggregated details for the building levels minimum energy performance requirements and
private and public NZEB multi‐family houses.
For the designers/planners questionnaire the following issues were considered worth of
investigation:
⌂ Actual design costs, to support the actual cost analysis presented in chapter 2.
⌂ Awareness about and experience with the design and planning of NZEBs.
⌂ Method of calculating the costs for design and planning.
⌂ Solutions to reduce design and planning costs or to reduce costs during the whole
construction process (to be tailored at national level).
⌂ Experience and impact of the long‐term maintenance costs.
In the construction company/social housing/contractor questionnaire the following issues
were to be investigated:
⌂ Awareness and experience about design and planning of NZEBs.
⌂ Adopted process to execute the construction works.
⌂ Magnitude and causes for cost variations in respect to the planned costs.
⌂ Internal process to reduce construction costs.
⌂ Solutions to reduce overall construction costs (to be tailored at national level).
In some specific questions, it was asked to rank the potential impact of a proposed solution
to reach the indicated objective. The ranking is defined as follows:
1. No impact
2. Low impact
3. Neutral
4. High impact
5. Very high impact
The final version of the questionnaires included a short introduction to the CoNZEBs project
and a short text explaining the aims and objectives of this study. Additional information on
the companies were confidentially asked for eventual statistical analyses. The questionnaires
were distributed to stakeholders via email or in person.
The two questionnaires, in English and in the languages of the participating countries are in
Appendix A at the end of the present report.
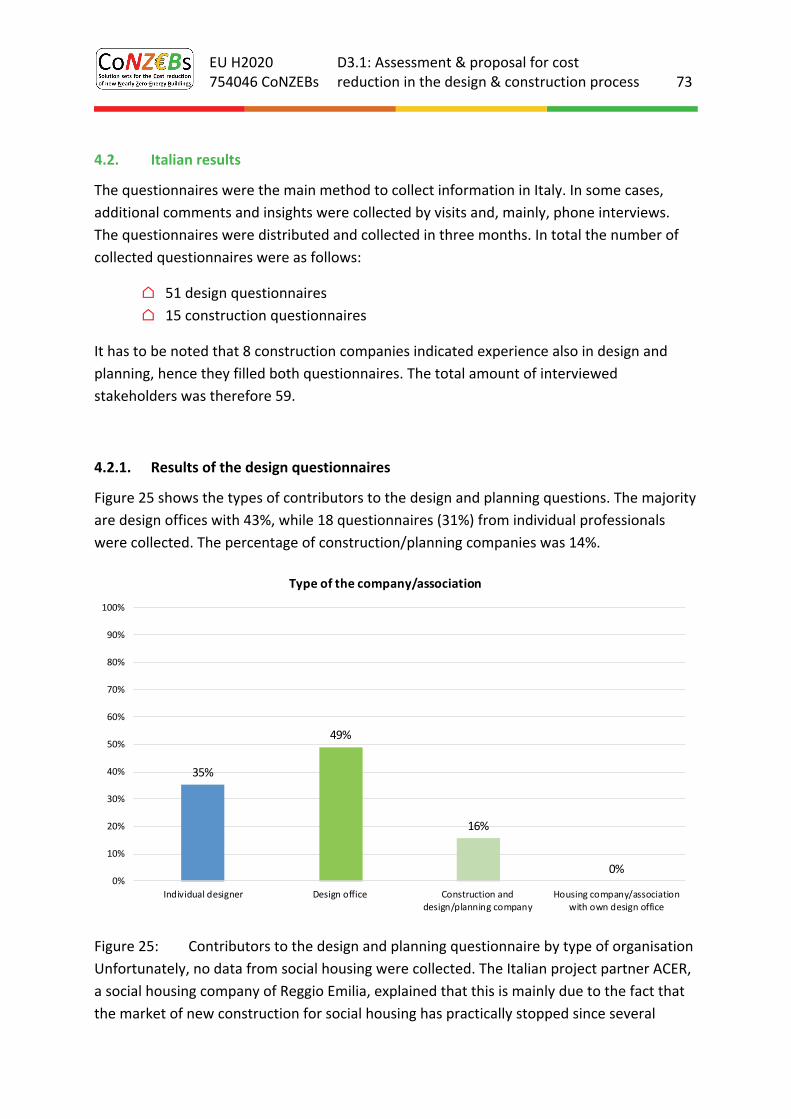
EU H2020 754046 CoNZEBs
D3.1: Assessment & proposal for cost reduction in the design & construction process 73
4.2. Italian results
The questionnaires were the main method to collect information in Italy. In some cases,
additional comments and insights were collected by visits and, mainly, phone interviews.
The questionnaires were distributed and collected in three months. In total the number of
collected questionnaires were as follows:
⌂ 51 design questionnaires
⌂ 15 construction questionnaires
It has to be noted that 8 construction companies indicated experience also in design and
planning, hence they filled both questionnaires. The total amount of interviewed
stakeholders was therefore 59.
4.2.1. Results of the design questionnaires
Figure 25 shows the types of contributors to the design and planning questions. The majority
are design offices with 43%, while 18 questionnaires (31%) from individual professionals
were collected. The percentage of construction/planning companies was 14%.
Figure 25: Contributors to the design and planning questionnaire by type of organisation
Unfortunately, no data from social housing were collected. The Italian project partner ACER,
a social housing company of Reggio Emilia, explained that this is mainly due to the fact that
the market of new construction for social housing has practically stopped since several
35%
49%
16%
0%0%
10%
20%
30%
40%
50%
60%
70%
80%
90%
100%
Individual designer Design office Construction anddesign/planning company
Housing company/associationwith own design office
Type of the company/association
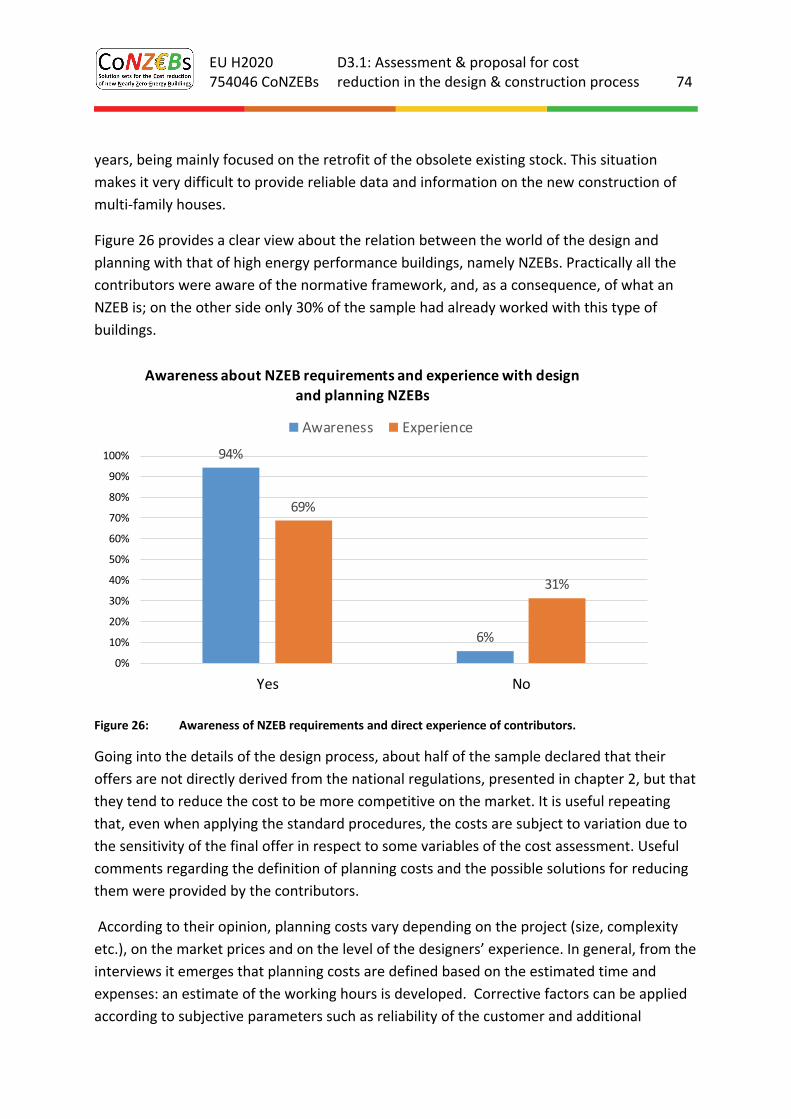
EU H2020 754046 CoNZEBs
D3.1: Assessment & proposal for cost reduction in the design & construction process 74
years, being mainly focused on the retrofit of the obsolete existing stock. This situation
makes it very difficult to provide reliable data and information on the new construction of
multi‐family houses.
Figure 26 provides a clear view about the relation between the world of the design and
planning with that of high energy performance buildings, namely NZEBs. Practically all the
contributors were aware of the normative framework, and, as a consequence, of what an
NZEB is; on the other side only 30% of the sample had already worked with this type of
buildings.
Figure 26: Awareness of NZEB requirements and direct experience of contributors.
Going into the details of the design process, about half of the sample declared that their
offers are not directly derived from the national regulations, presented in chapter 2, but that
they tend to reduce the cost to be more competitive on the market. It is useful repeating
that, even when applying the standard procedures, the costs are subject to variation due to
the sensitivity of the final offer in respect to some variables of the cost assessment. Useful
comments regarding the definition of planning costs and the possible solutions for reducing
them were provided by the contributors.
According to their opinion, planning costs vary depending on the project (size, complexity
etc.), on the market prices and on the level of the designers’ experience. In general, from the
interviews it emerges that planning costs are defined based on the estimated time and
expenses: an estimate of the working hours is developed. Corrective factors can be applied
according to subjective parameters such as reliability of the customer and additional
94%
6%
69%
31%
0%
10%
20%
30%
40%
50%
60%
70%
80%
90%
100%
Yes No
Awareness about NZEB requirements and experience with design
and planning NZEBs
Awareness Experience
EU H2020 754046 CoNZEBs
D3.1: Assessment & proposal for cost reduction in the design & construction process 75
economic analysis. The amount obtained is then “validated" through the comparison with
previous similar experiences and with the rate provided by the standards. One designer
underlined that there is a difference between private and public commissions: in public
works, planning costs can be discounted up to 50%.
For reducing planning costs one designer suggested defining a precise time schedule of the
different construction works on the building site to reduce delays; two others suggested to
replicate design solutions adopted in previous projects. For some of the designers it is very
important to increase expertise (knowledge, skills and competences) in order to minimize
the costs of re‐working and to adequately plan the activities.
Very interesting is the position of three interviewed designers. They do not agree in reducing
planning costs since:
⌂ Planning plays a small role in the whole commission and it has a very low impact on
the global cost
⌂ A good design phase (even if it is more expensive) can guarantee a reduction of the
overall costs in the construction and maintenance phases.
Based on this framework, it is important to observe the opinions of the designers regarding
the probability of several proposed solutions to reduce the planning costs presented in
Figure 27 and Figure 28. The most efficient solution was considered to be the integrated
project approach, scoring 4. It allows planners and designers to work in synergy avoiding
delay and errors that are often observed in the standard design process, which is
approached as a series of isolated design phases. A few designers provided additional
comments justifying their answer. The analysis of these comments shows that despite that
the highest score was achieved by this solution, the opinions were not uniform. From half of
the comments it emerges that it is not a good approach to centralize the whole design
process in the hands of a single office for two main reasons: having many specialists within a
single company is not always a factor of efficiency and furthermore it is not cost‐efficient
because the management costs are too high. One designer suggested not to consider a
single office but a single network of different designers and experts.
The other half of the comments were positive: cost reductions can be achieved when single
working groups develop a project from the early design stages up to the drafting of the
executive project. Furthermore, it facilitates the exchange of information and, consequently,
the solution of problems that may arise and therefore shortens the time required to design
the building.
One interviewee took a middle road: a single office can manage the whole design of small or
medium‐sized buildings, but buildings of considerable size often require specialized design
and therefore more than one office.
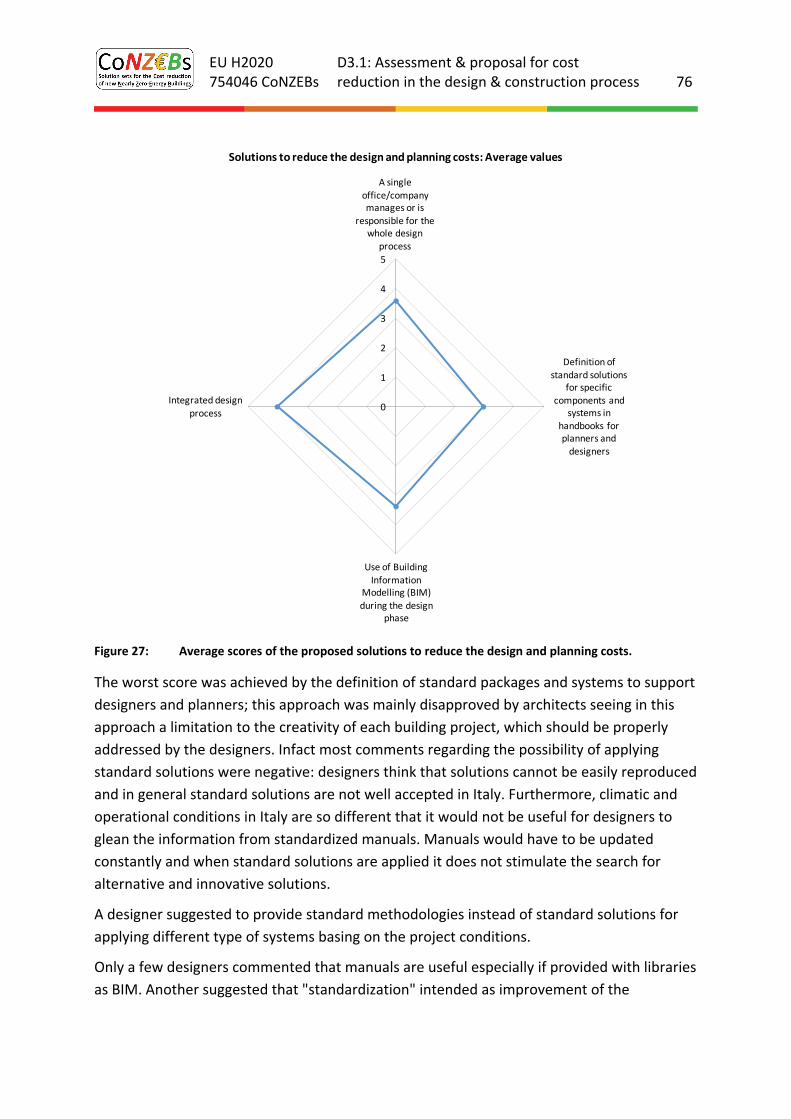
EU H2020 754046 CoNZEBs
D3.1: Assessment & proposal for cost reduction in the design & construction process 76
Figure 27: Average scores of the proposed solutions to reduce the design and planning costs.
The worst score was achieved by the definition of standard packages and systems to support
designers and planners; this approach was mainly disapproved by architects seeing in this
approach a limitation to the creativity of each building project, which should be properly
addressed by the designers. Infact most comments regarding the possibility of applying
standard solutions were negative: designers think that solutions cannot be easily reproduced
and in general standard solutions are not well accepted in Italy. Furthermore, climatic and
operational conditions in Italy are so different that it would not be useful for designers to
glean the information from standardized manuals. Manuals would have to be updated
constantly and when standard solutions are applied it does not stimulate the search for
alternative and innovative solutions.
A designer suggested to provide standard methodologies instead of standard solutions for
applying different type of systems basing on the project conditions.
Only a few designers commented that manuals are useful especially if provided with libraries
as BIM. Another suggested that "standardization" intended as improvement of the
0
1
2
3
4
5
A single
office/company manages or is
responsible for the whole design
process
Definition of standard solutions
for specific components and
systems in handbooks for planners and designers
Use of Building
Information Modelling (BIM)
during the design phase
Integrated design
process
Solutions to reduce the design and planning costs: Average values
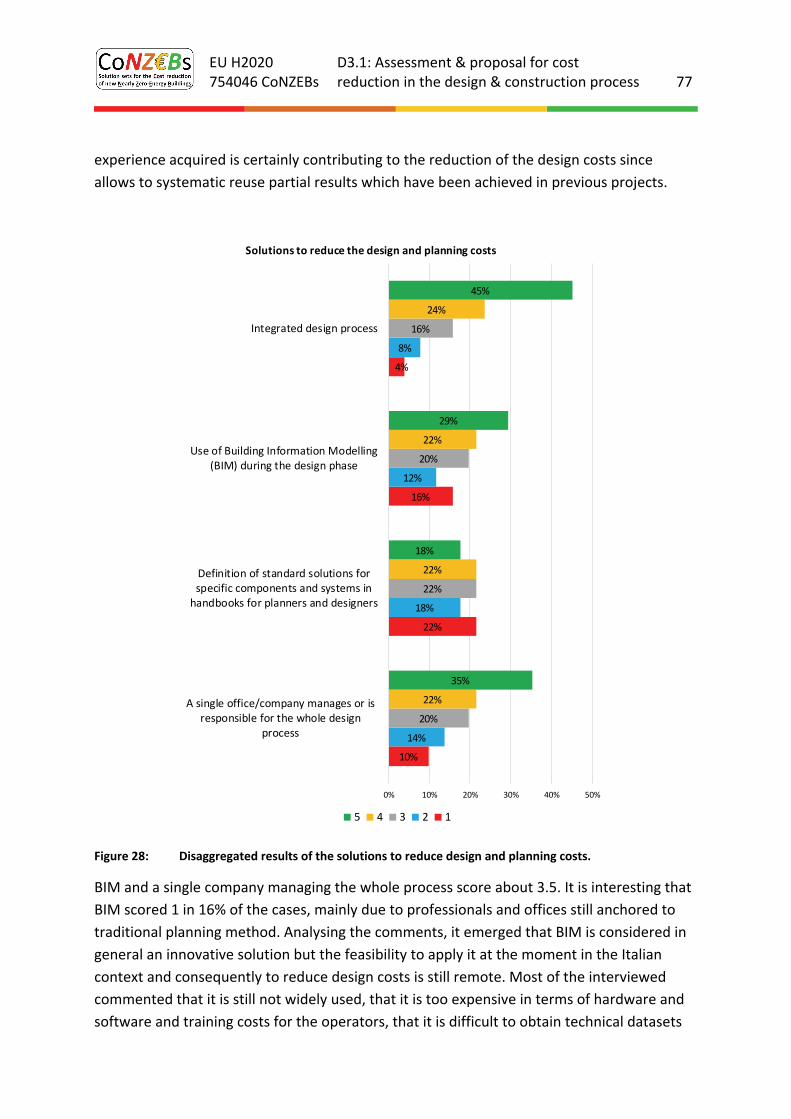
EU H2020 754046 CoNZEBs
D3.1: Assessment & proposal for cost reduction in the design & construction process 77
experience acquired is certainly contributing to the reduction of the design costs since
allows to systematic reuse partial results which have been achieved in previous projects.
Figure 28: Disaggregated results of the solutions to reduce design and planning costs.
BIM and a single company managing the whole process score about 3.5. It is interesting that
BIM scored 1 in 16% of the cases, mainly due to professionals and offices still anchored to
traditional planning method. Analysing the comments, it emerged that BIM is considered in
general an innovative solution but the feasibility to apply it at the moment in the Italian
context and consequently to reduce design costs is still remote. Most of the interviewed
commented that it is still not widely used, that it is too expensive in terms of hardware and
software and training costs for the operators, that it is difficult to obtain technical datasets
10%
22%
16%
4%
14%
18%
12%
8%
20%
22%
20%
16%
22%
22%
22%
24%
35%
18%
29%
45%
0% 10% 20% 30% 40% 50%
A single office/company manages or isresponsible for the whole design
process
Definition of standard solutions forspecific components and systems inhandbooks for planners and designers
Use of Building Information Modelling(BIM) during the design phase
Integrated design process
Solutions to reduce the design and planning costs
5 4 3 2 1
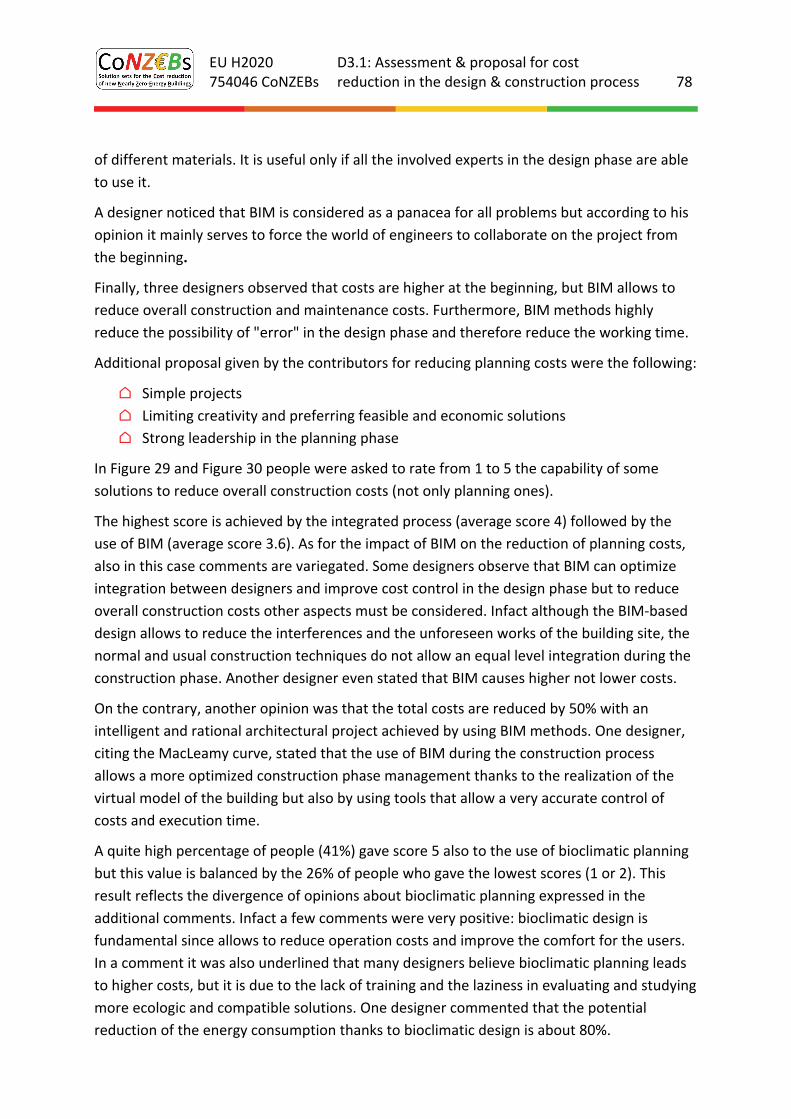
EU H2020 754046 CoNZEBs
D3.1: Assessment & proposal for cost reduction in the design & construction process 78
of different materials. It is useful only if all the involved experts in the design phase are able
to use it.
A designer noticed that BIM is considered as a panacea for all problems but according to his
opinion it mainly serves to force the world of engineers to collaborate on the project from
the beginning.
Finally, three designers observed that costs are higher at the beginning, but BIM allows to
reduce overall construction and maintenance costs. Furthermore, BIM methods highly
reduce the possibility of "error" in the design phase and therefore reduce the working time.
Additional proposal given by the contributors for reducing planning costs were the following:
⌂ Simple projects
⌂ Limiting creativity and preferring feasible and economic solutions
⌂ Strong leadership in the planning phase
In Figure 29 and Figure 30 people were asked to rate from 1 to 5 the capability of some
solutions to reduce overall construction costs (not only planning ones).
The highest score is achieved by the integrated process (average score 4) followed by the
use of BIM (average score 3.6). As for the impact of BIM on the reduction of planning costs,
also in this case comments are variegated. Some designers observe that BIM can optimize
integration between designers and improve cost control in the design phase but to reduce
overall construction costs other aspects must be considered. Infact although the BIM‐based
design allows to reduce the interferences and the unforeseen works of the building site, the
normal and usual construction techniques do not allow an equal level integration during the
construction phase. Another designer even stated that BIM causes higher not lower costs.
On the contrary, another opinion was that the total costs are reduced by 50% with an
intelligent and rational architectural project achieved by using BIM methods. One designer,
citing the MacLeamy curve, stated that the use of BIM during the construction process
allows a more optimized construction phase management thanks to the realization of the
virtual model of the building but also by using tools that allow a very accurate control of
costs and execution time.
A quite high percentage of people (41%) gave score 5 also to the use of bioclimatic planning
but this value is balanced by the 26% of people who gave the lowest scores (1 or 2). This
result reflects the divergence of opinions about bioclimatic planning expressed in the
additional comments. Infact a few comments were very positive: bioclimatic design is
fundamental since allows to reduce operation costs and improve the comfort for the users.
In a comment it was also underlined that many designers believe bioclimatic planning leads
to higher costs, but it is due to the lack of training and the laziness in evaluating and studying
more ecologic and compatible solutions. One designer commented that the potential
reduction of the energy consumption thanks to bioclimatic design is about 80%.
EU H2020 754046 CoNZEBs
D3.1: Assessment & proposal for cost reduction in the design & construction process 79
Figure 29: Average scores of the proposed solutions to reduce the overall construction costs.
On the contrary there were a few negative comments pointing out that bioclimatic
philosophy is not cost‐efficient since it rarely guarantees a reduction in consumption that
will justify the higher initial expenditure. In addition, it was stated that it influences
operational costs but not construction costs. A couple of designers wrote that a bioclimatic
approach is useful only if it requires simple solutions (i.e to take into account orientation or
wind exposure) since complex systems (i.e. trombe walls) are normally ineffective. The
lowest scores were equally achieved by the definition of standard solutions and the absence
of underground cellars and parking. These solution score 1 in respectively 20% and 22% of
the cases.
In the relative comments, all designers agreed that underground cellars have a significant
impact on the general costs of construction but on the other side, according to the current
standards, it is very difficult to guarantee the number of parking required per apartment
without using underground spaces. Furthermore, other variables must be taken into account
such as soil value and characteristics of the soil and the value of each parking lot. According
to this it is difficult to uniformly state if the absence of underground spaces allows to reduce
the construction costs.
0
1
2
3
4
5
Use of Building InformationModelling (BIM) during theoverall construction process
Integrated design process
Definition of standard solutionsfor specific components andsystems in handbooks forplanners and designers
Bioclimatic planning
No underground cellar andparking
Optimization of service andcommon spaces
Solutions to reduce NZEB buildings costs in terms of overall construction costs
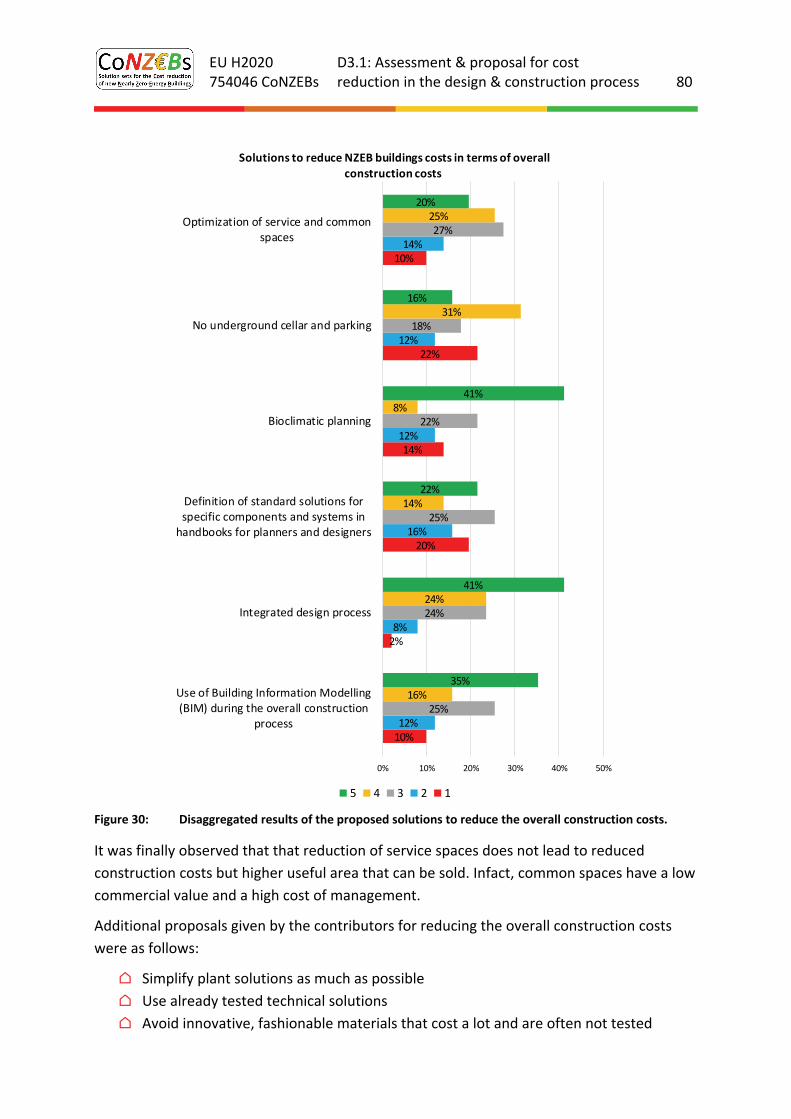
EU H2020 754046 CoNZEBs
D3.1: Assessment & proposal for cost reduction in the design & construction process 80
Figure 30: Disaggregated results of the proposed solutions to reduce the overall construction costs.
It was finally observed that that reduction of service spaces does not lead to reduced
construction costs but higher useful area that can be sold. Infact, common spaces have a low
commercial value and a high cost of management.
Additional proposals given by the contributors for reducing the overall construction costs
were as follows:
⌂ Simplify plant solutions as much as possible
⌂ Use already tested technical solutions
⌂ Avoid innovative, fashionable materials that cost a lot and are often not tested
10%
2%
20%
14%
22%
10%
12%
8%
16%
12%
12%
14%
25%
24%
25%
22%
18%
27%
16%
24%
14%
8%
31%
25%
35%
41%
22%
41%
16%
20%
0% 10% 20% 30% 40% 50%
Use of Building Information Modelling(BIM) during the overall construction
process
Integrated design process
Definition of standard solutions forspecific components and systems inhandbooks for planners and designers
Bioclimatic planning
No underground cellar and parking
Optimization of service and commonspaces
Solutions to reduce NZEB buildings costs in terms of overall construction costs
5 4 3 2 1
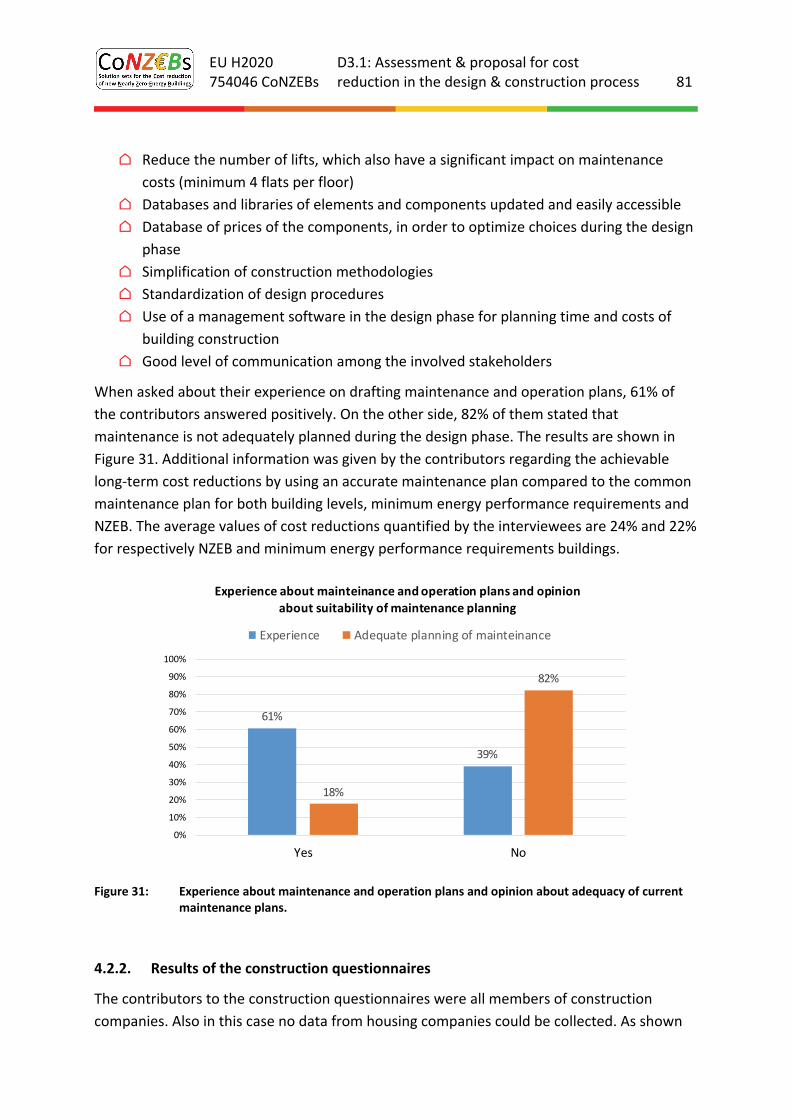
EU H2020 754046 CoNZEBs
D3.1: Assessment & proposal for cost reduction in the design & construction process 81
⌂ Reduce the number of lifts, which also have a significant impact on maintenance
costs (minimum 4 flats per floor)
⌂ Databases and libraries of elements and components updated and easily accessible
⌂ Database of prices of the components, in order to optimize choices during the design
phase
⌂ Simplification of construction methodologies
⌂ Standardization of design procedures
⌂ Use of a management software in the design phase for planning time and costs of
building construction
⌂ Good level of communication among the involved stakeholders
When asked about their experience on drafting maintenance and operation plans, 61% of
the contributors answered positively. On the other side, 82% of them stated that
maintenance is not adequately planned during the design phase. The results are shown in
Figure 31. Additional information was given by the contributors regarding the achievable
long‐term cost reductions by using an accurate maintenance plan compared to the common
maintenance plan for both building levels, minimum energy performance requirements and
NZEB. The average values of cost reductions quantified by the interviewees are 24% and 22%
for respectively NZEB and minimum energy performance requirements buildings.
Figure 31: Experience about maintenance and operation plans and opinion about adequacy of current maintenance plans.
4.2.2. Results of the construction questionnaires
The contributors to the construction questionnaires were all members of construction
companies. Also in this case no data from housing companies could be collected. As shown
61%
39%
18%
82%
0%
10%
20%
30%
40%
50%
60%
70%
80%
90%
100%
Yes No
Experience about mainteinance and operation plans and opinion
about suitability of maintenance planning
Experience Adequate planning of mainteinance
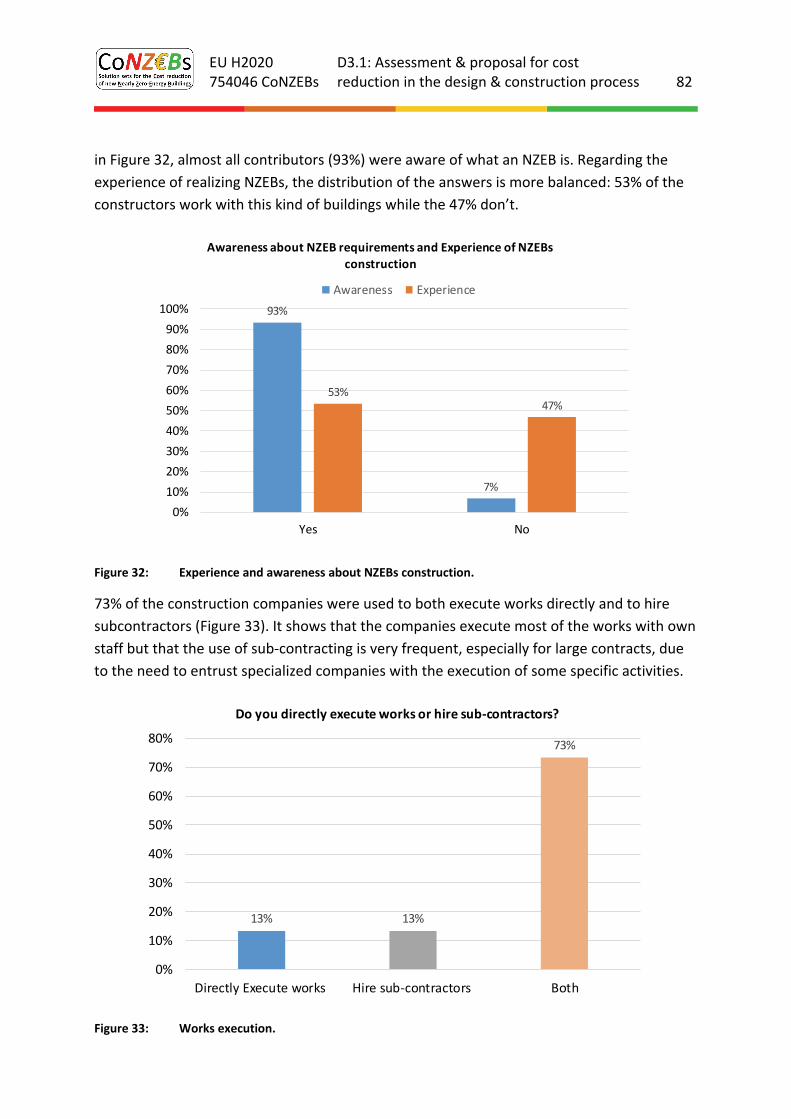
EU H2020 754046 CoNZEBs
D3.1: Assessment & proposal for cost reduction in the design & construction process 82
in Figure 32, almost all contributors (93%) were aware of what an NZEB is. Regarding the
experience of realizing NZEBs, the distribution of the answers is more balanced: 53% of the
constructors work with this kind of buildings while the 47% don’t.
Figure 32: Experience and awareness about NZEBs construction.
73% of the construction companies were used to both execute works directly and to hire
subcontractors (Figure 33). It shows that the companies execute most of the works with own
staff but that the use of sub‐contracting is very frequent, especially for large contracts, due
to the need to entrust specialized companies with the execution of some specific activities.
Figure 33: Works execution.
93%
7%
53%47%
0%
10%
20%
30%
40%
50%
60%
70%
80%
90%
100%
Yes No
Awareness about NZEB requirements and Experience of NZEBs
construction
Awareness Experience
13% 13%
73%
0%
10%
20%
30%
40%
50%
60%
70%
80%
Directly Execute works Hire sub‐contractors Both
Do you directly execute works or hire sub‐contractors?
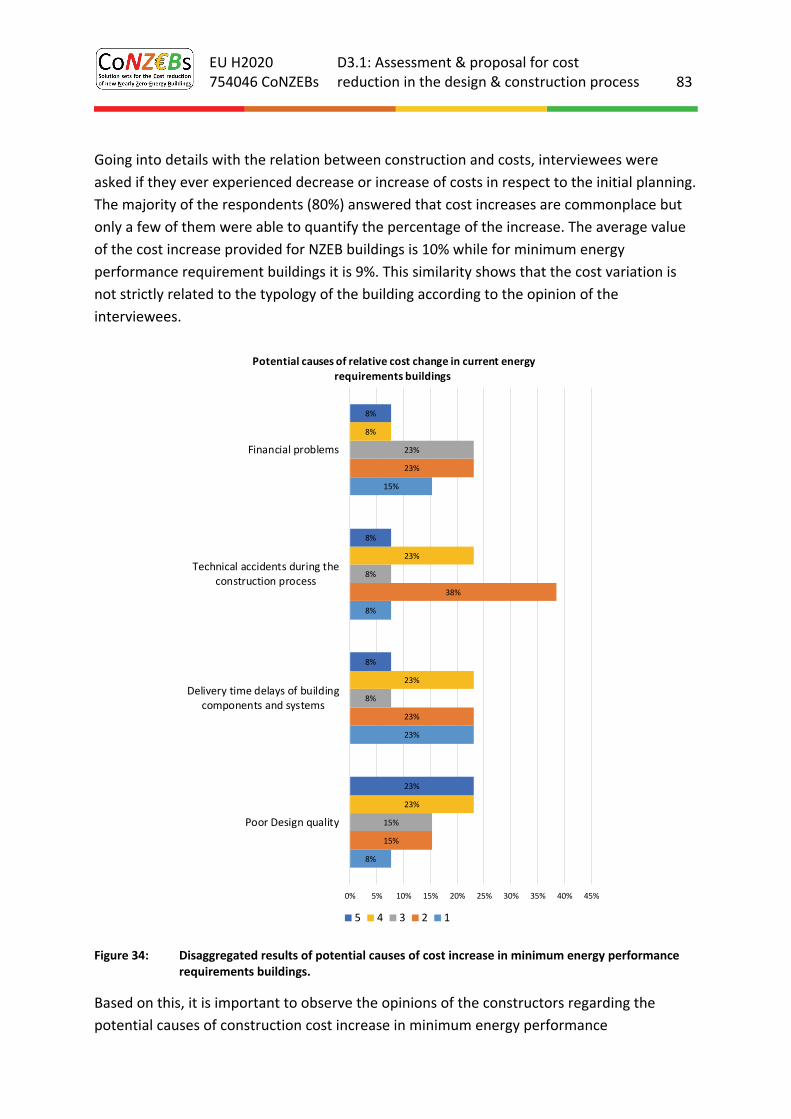
EU H2020 754046 CoNZEBs
D3.1: Assessment & proposal for cost reduction in the design & construction process 83
Going into details with the relation between construction and costs, interviewees were
asked if they ever experienced decrease or increase of costs in respect to the initial planning.
The majority of the respondents (80%) answered that cost increases are commonplace but
only a few of them were able to quantify the percentage of the increase. The average value
of the cost increase provided for NZEB buildings is 10% while for minimum energy
performance requirement buildings it is 9%. This similarity shows that the cost variation is
not strictly related to the typology of the building according to the opinion of the
interviewees.
Figure 34: Disaggregated results of potential causes of cost increase in minimum energy performance requirements buildings.
Based on this, it is important to observe the opinions of the constructors regarding the
potential causes of construction cost increase in minimum energy performance
8%
23%
8%
15%
15%
23%
38%
23%
15%
8%
8%
23%
23%
23%
23%
8%
23%
8%
8%
8%
0% 5% 10% 15% 20% 25% 30% 35% 40% 45%
Poor Design quality
Delivery time delays of buildingcomponents and systems
Technical accidents during theconstruction process
Financial problems
Potential causes of relative cost change in current energy
requirements buildings
5 4 3 2 1
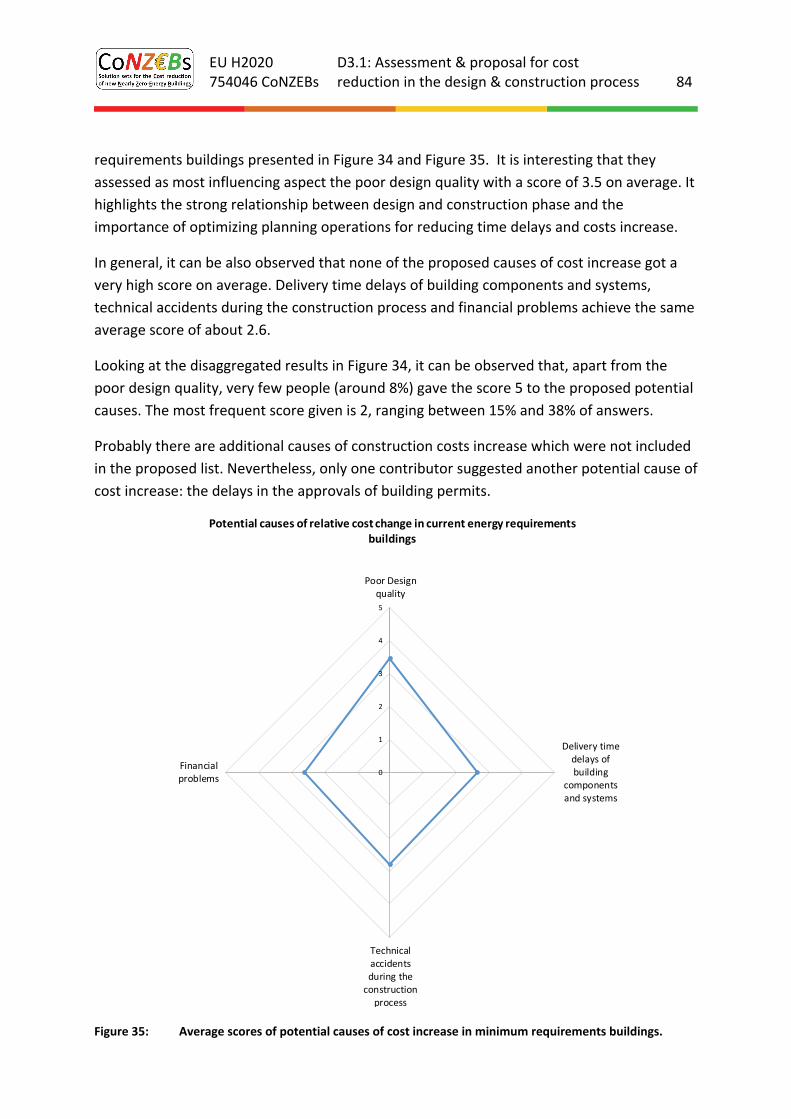
EU H2020 754046 CoNZEBs
D3.1: Assessment & proposal for cost reduction in the design & construction process 84
requirements buildings presented in Figure 34 and Figure 35. It is interesting that they
assessed as most influencing aspect the poor design quality with a score of 3.5 on average. It
highlights the strong relationship between design and construction phase and the
importance of optimizing planning operations for reducing time delays and costs increase.
In general, it can be also observed that none of the proposed causes of cost increase got a
very high score on average. Delivery time delays of building components and systems,
technical accidents during the construction process and financial problems achieve the same
average score of about 2.6.
Looking at the disaggregated results in Figure 34, it can be observed that, apart from the
poor design quality, very few people (around 8%) gave the score 5 to the proposed potential
causes. The most frequent score given is 2, ranging between 15% and 38% of answers.
Probably there are additional causes of construction costs increase which were not included
in the proposed list. Nevertheless, only one contributor suggested another potential cause of
cost increase: the delays in the approvals of building permits.
Figure 35: Average scores of potential causes of cost increase in minimum requirements buildings.
0
1
2
3
4
5
Poor Designquality
Delivery timedelays ofbuilding
componentsand systems
Technicalaccidentsduring theconstructionprocess
Financialproblems
Potential causes of relative cost change in current energy requirements buildings
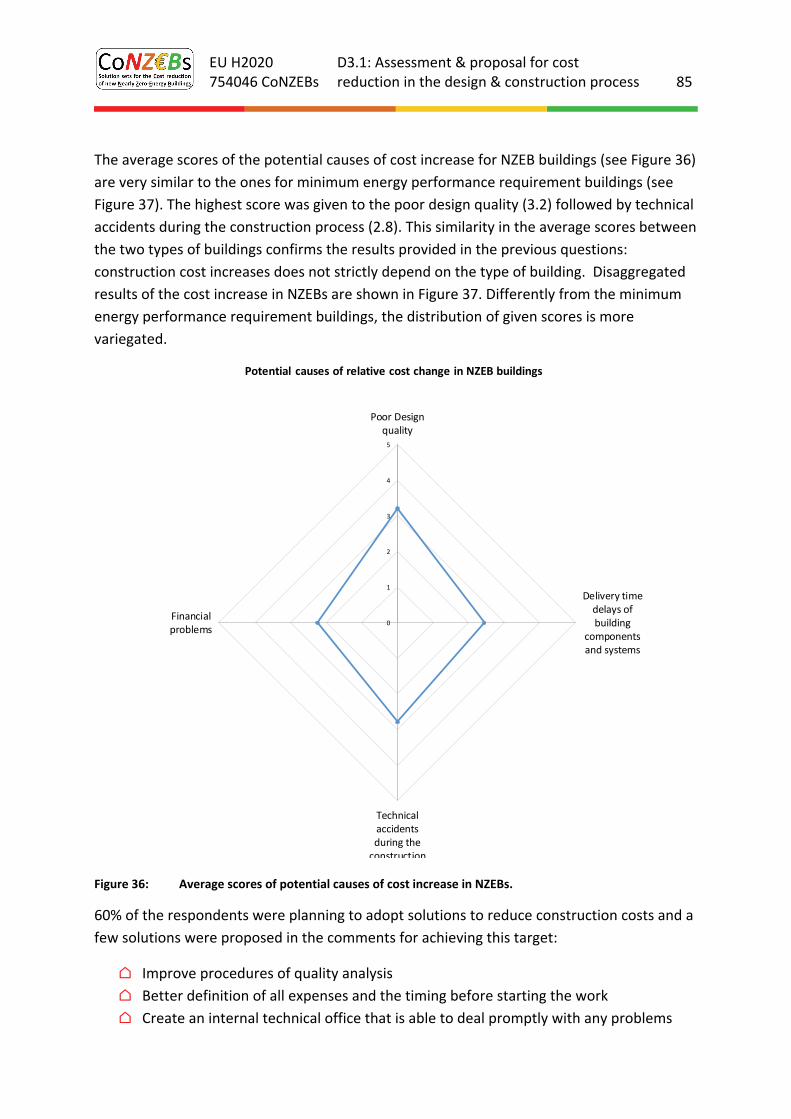
EU H2020 754046 CoNZEBs
D3.1: Assessment & proposal for cost reduction in the design & construction process 85
The average scores of the potential causes of cost increase for NZEB buildings (see Figure 36)
are very similar to the ones for minimum energy performance requirement buildings (see
Figure 37). The highest score was given to the poor design quality (3.2) followed by technical
accidents during the construction process (2.8). This similarity in the average scores between
the two types of buildings confirms the results provided in the previous questions:
construction cost increases does not strictly depend on the type of building. Disaggregated
results of the cost increase in NZEBs are shown in Figure 37. Differently from the minimum
energy performance requirement buildings, the distribution of given scores is more
variegated.
Figure 36: Average scores of potential causes of cost increase in NZEBs.
60% of the respondents were planning to adopt solutions to reduce construction costs and a
few solutions were proposed in the comments for achieving this target:
⌂ Improve procedures of quality analysis
⌂ Better definition of all expenses and the timing before starting the work
⌂ Create an internal technical office that is able to deal promptly with any problems
0
1
2
3
4
5
Poor Designquality
Delivery timedelays ofbuilding
componentsand systems
Technicalaccidentsduring theconstruction
Financialproblems
Potential causes of relative cost change in NZEB buildings
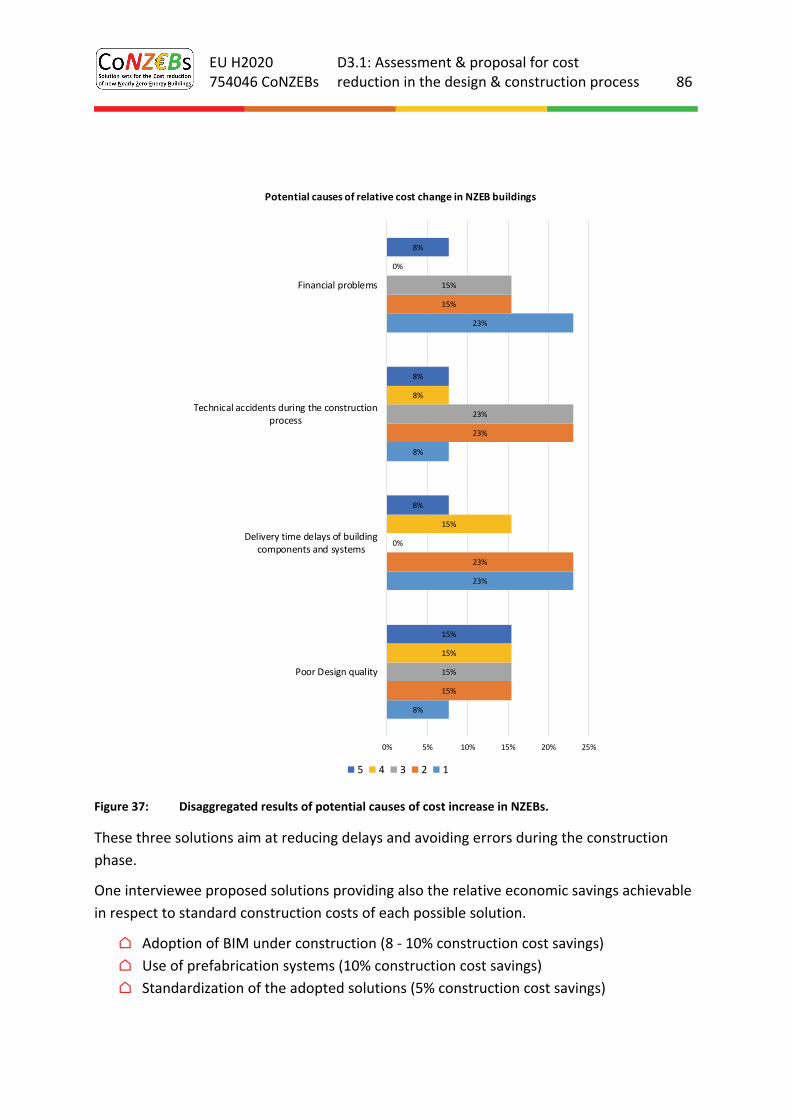
EU H2020 754046 CoNZEBs
D3.1: Assessment & proposal for cost reduction in the design & construction process 86
Figure 37: Disaggregated results of potential causes of cost increase in NZEBs.
These three solutions aim at reducing delays and avoiding errors during the construction
phase.
One interviewee proposed solutions providing also the relative economic savings achievable
in respect to standard construction costs of each possible solution.
⌂ Adoption of BIM under construction (8 ‐ 10% construction cost savings)
⌂ Use of prefabrication systems (10% construction cost savings)
⌂ Standardization of the adopted solutions (5% construction cost savings)
8%
23%
8%
23%
15%
23%
23%
15%
15%
0%
23%
15%
15%
15%
8%
0%
15%
8%
8%
8%
0% 5% 10% 15% 20% 25%
Poor Design quality
Delivery time delays of buildingcomponents and systems
Technical accidents during the constructionprocess
Financial problems
Potential causes of relative cost change in NZEB buildings
5 4 3 2 1
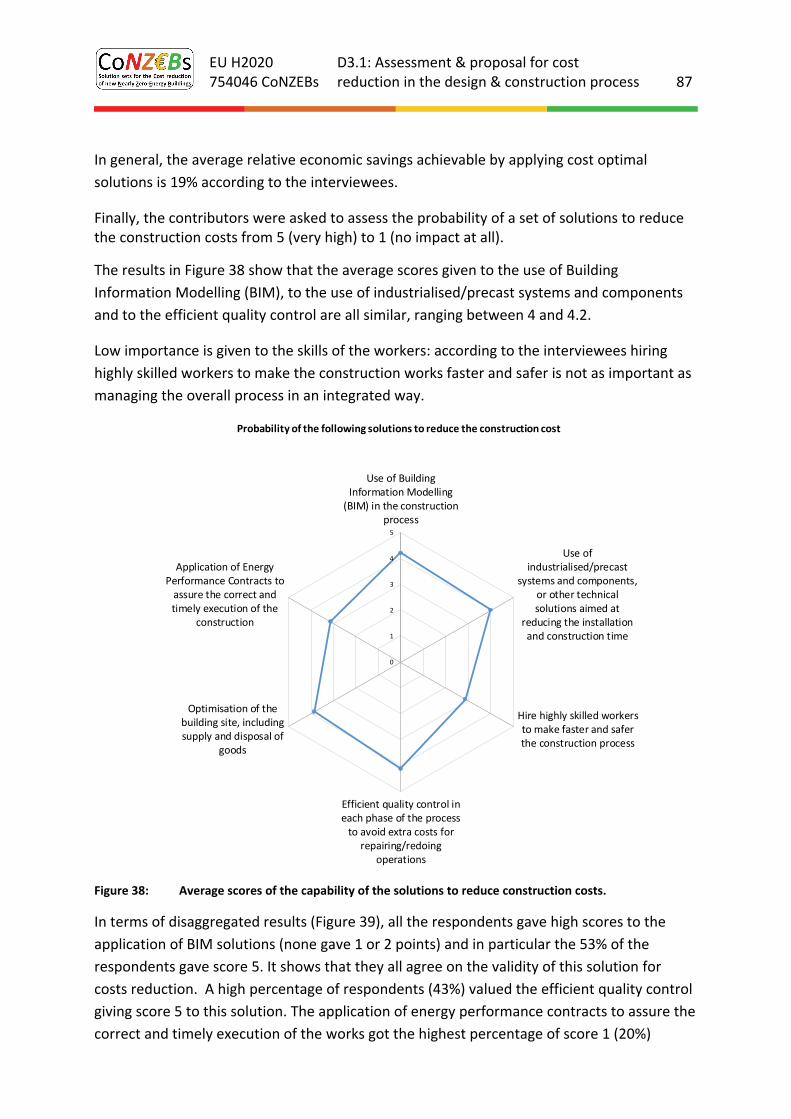
EU H2020 754046 CoNZEBs
D3.1: Assessment & proposal for cost reduction in the design & construction process 87
In general, the average relative economic savings achievable by applying cost optimal
solutions is 19% according to the interviewees.
Finally, the contributors were asked to assess the probability of a set of solutions to reduce the construction costs from 5 (very high) to 1 (no impact at all).
The results in Figure 38 show that the average scores given to the use of Building
Information Modelling (BIM), to the use of industrialised/precast systems and components
and to the efficient quality control are all similar, ranging between 4 and 4.2.
Low importance is given to the skills of the workers: according to the interviewees hiring
highly skilled workers to make the construction works faster and safer is not as important as
managing the overall process in an integrated way.
Figure 38: Average scores of the capability of the solutions to reduce construction costs.
In terms of disaggregated results (Figure 39), all the respondents gave high scores to the
application of BIM solutions (none gave 1 or 2 points) and in particular the 53% of the
respondents gave score 5. It shows that they all agree on the validity of this solution for
costs reduction. A high percentage of respondents (43%) valued the efficient quality control
giving score 5 to this solution. The application of energy performance contracts to assure the
correct and timely execution of the works got the highest percentage of score 1 (20%)
0
1
2
3
4
5
Use of BuildingInformation Modelling(BIM) in the construction
process
Use ofindustrialised/precast
systems and components,or other technicalsolutions aimed at
reducing the installationand construction time
Hire highly skilled workersto make faster and saferthe construction process
Efficient quality control ineach phase of the processto avoid extra costs for
repairing/redoingoperations
Optimisation of thebuilding site, includingsupply and disposal of
goods
Application of EnergyPerformance Contracts toassure the correct andtimely execution of the
construction
Probability of the following solutions to reduce the construction cost
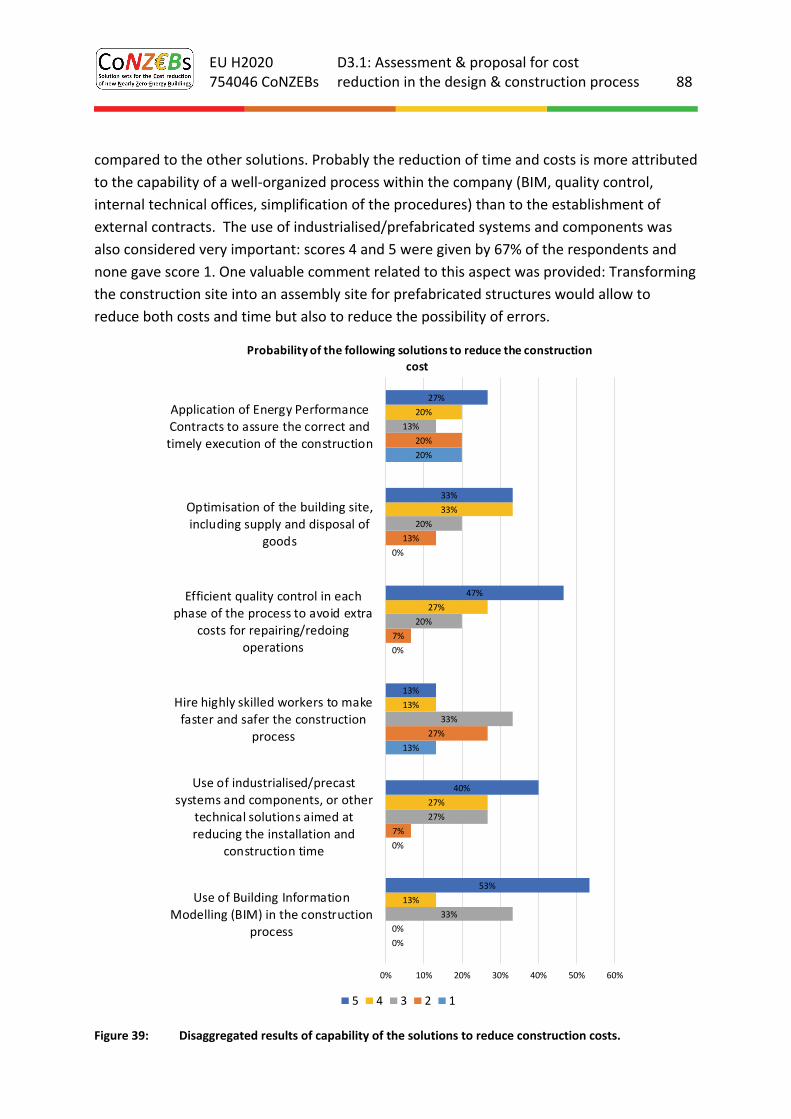
EU H2020 754046 CoNZEBs
D3.1: Assessment & proposal for cost reduction in the design & construction process 88
compared to the other solutions. Probably the reduction of time and costs is more attributed
to the capability of a well‐organized process within the company (BIM, quality control,
internal technical offices, simplification of the procedures) than to the establishment of
external contracts. The use of industrialised/prefabricated systems and components was
also considered very important: scores 4 and 5 were given by 67% of the respondents and
none gave score 1. One valuable comment related to this aspect was provided: Transforming
the construction site into an assembly site for prefabricated structures would allow to
reduce both costs and time but also to reduce the possibility of errors.
Figure 39: Disaggregated results of capability of the solutions to reduce construction costs.
0%
0%
13%
0%
0%
20%
0%
7%
27%
7%
13%
20%
33%
27%
33%
20%
20%
13%
13%
27%
13%
27%
33%
20%
53%
40%
13%
47%
33%
27%
0% 10% 20% 30% 40% 50% 60%
Use of Building InformationModelling (BIM) in the construction
process
Use of industrialised/precastsystems and components, or other
technical solutions aimed atreducing the installation and
construction time
Hire highly skilled workers to makefaster and safer the construction
process
Efficient quality control in eachphase of the process to avoid extra
costs for repairing/redoingoperations
Optimisation of the building site,including supply and disposal of
goods
Application of Energy PerformanceContracts to assure the correct andtimely execution of the construction
Probability of the following solutions to reduce the construction
cost
5 4 3 2 1
EU H2020 754046 CoNZEBs
D3.1: Assessment & proposal for cost reduction in the design & construction process 89
4.3. Danish results
The investigation in Denmark was carried out primarily by sending out the questionnaires to
architects, engineers, contractors and building associations, but also by making interviews
based on the questionnaire with two contractors in Denmark. This paragraph presents the
results in two subsections:
⌂ Direct answers to the questionnaire
and
⌂ Compiled additional comments
In total 9 answers to the questionnaire were received from two building design offices (one
architect and one engineering office), five contractors and two building associations. The
answers have been arranged in an overview table with the following numbering:
1. Large architect office with 300 employees
2. Very large engineering company with 13,000 employees.
3. Contractor with 20 employees ‐ no internal design department.
4. Contractor with 60 employees
5. Contractor with 2,000 employees
6. Contractor with 700 employees
7. Contractor with 100 employees
8. Building association – one of the largest in DK: owns/administers > 50,000 dwellings.
9. Building association from Jutland – owns/administers > 7,000 dwellings.
The questionnaire held 12 questions concerning the design phase and 6 for the construction
phase. The questionnaire sequence of the questions is used in the following presentation of
the answers received.
4.3.2. Results of the design questionnaires
The results show that all respondents were aware of the Danish definition of NZEB and the
Danish Building Regulation requirements. All except one contractor and the two building
associations had experience with designing and planning NZEBs.
The majority agreed on an estimate of the fraction of design cost in respect to the overall
construction costs of new MFH, meeting the 2018 energy performance requirements, for
both private and social housing of 6 ‐ 9%. For the NZEB (Q5 and Q6) the percentages are very
similar – about 1%‐point higher. Note that two of the contractor’s answers were in a higher
EU H2020 754046 CoNZEBs
D3.1: Assessment & proposal for cost reduction in the design & construction process 90
category: 10 ‐ 14%. They claimed that this percentage recently had gone up, not especially
because of NZEB, but because of the increased activity in the Danish building sector.
When asked about the methods for defining design costs, three of the nine answered that
the design cost often is fixed either as DKK/m² for the whole design team, or as a percentage
of the construction costs, i.e. 7% for the whole design team. Five answers claim that this is
not the case – it varies according to size, level of complexity and number of repetitions of
each case. Generally, the builder decides. One comment was added to this question
highlighting that the final detailing of the design work is sometimes reduced and transferred
to the contractor. It is hard to judge whether this is more rational and cost effective.
Regarding the possibility of several proposed solutions to reduce planning costs, answers
showed large disagreements as presented in Figure 1Figure 40, being in the range from 1‐5
(4 in one case) for the different suggestions. The engineer and most of the contractors were
in favour of using standard solutions and components though the architect and one of the
building associations were opposed to this. The architect and engineer agreed on the
benefits of one large design office to handle the whole project and that was supported by
the comment from one of the contractors to choose a single design office for a given project.
The use of BIM didn’t yet seem to be the way to go. Despite that it is a fact that BIM is used
in several places and required in public constructions.
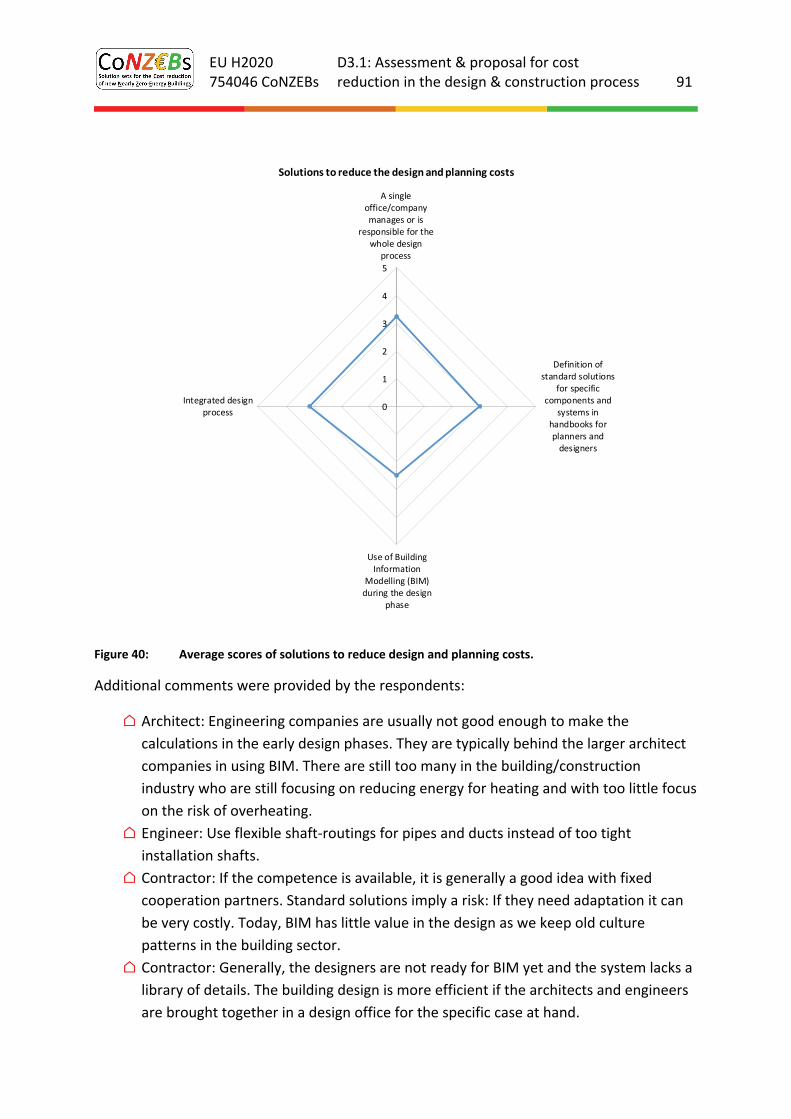
EU H2020 754046 CoNZEBs
D3.1: Assessment & proposal for cost reduction in the design & construction process 91
Figure 40: Average scores of solutions to reduce design and planning costs.
Additional comments were provided by the respondents:
⌂ Architect: Engineering companies are usually not good enough to make the
calculations in the early design phases. They are typically behind the larger architect
companies in using BIM. There are still too many in the building/construction
industry who are still focusing on reducing energy for heating and with too little focus
on the risk of overheating.
⌂ Engineer: Use flexible shaft‐routings for pipes and ducts instead of too tight
installation shafts.
⌂ Contractor: If the competence is available, it is generally a good idea with fixed
cooperation partners. Standard solutions imply a risk: If they need adaptation it can
be very costly. Today, BIM has little value in the design as we keep old culture
patterns in the building sector.
⌂ Contractor: Generally, the designers are not ready for BIM yet and the system lacks a
library of details. The building design is more efficient if the architects and engineers
are brought together in a design office for the specific case at hand.
0
1
2
3
4
5
A singleoffice/companymanages or is
responsible for thewhole design
process
Definition ofstandard solutions
for specificcomponents and
systems inhandbooks forplanners anddesigners
Use of BuildingInformation
Modelling (BIM)during the design
phase
Integrated designprocess
Solutions to reduce the design and planning costs
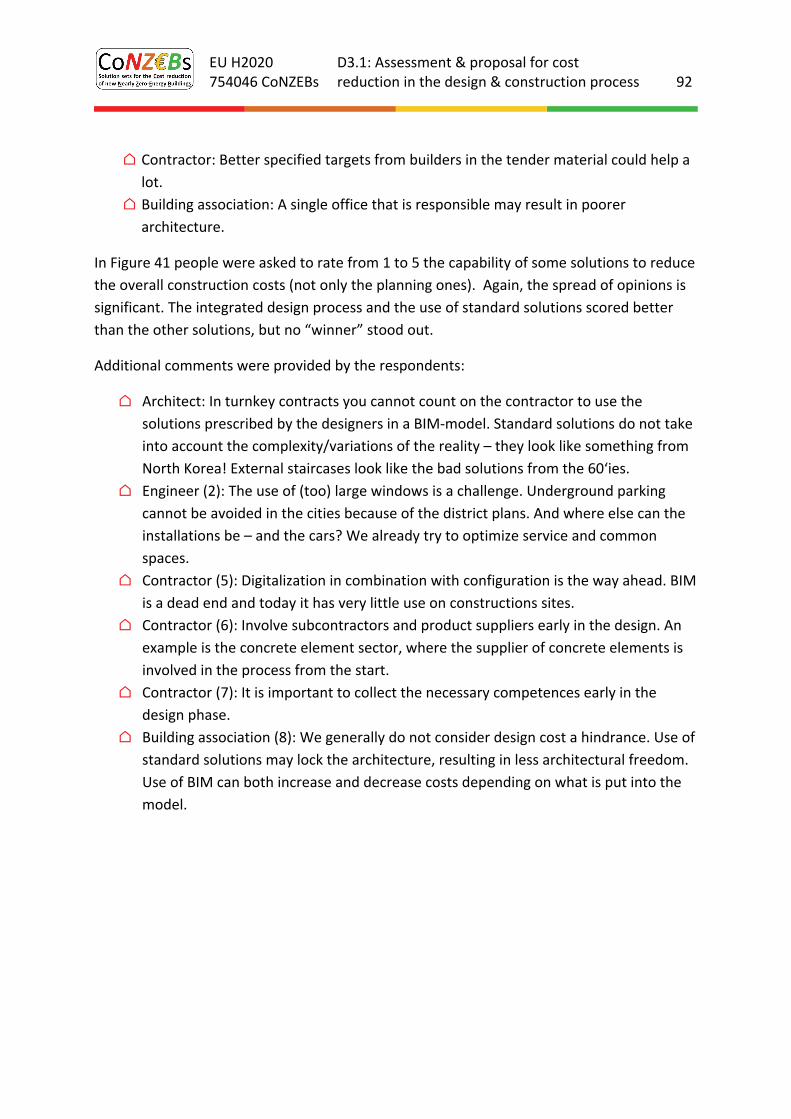
EU H2020 754046 CoNZEBs
D3.1: Assessment & proposal for cost reduction in the design & construction process 92
⌂ Contractor: Better specified targets from builders in the tender material could help a
lot.
⌂ Building association: A single office that is responsible may result in poorer
architecture.
In Figure 41 people were asked to rate from 1 to 5 the capability of some solutions to reduce
the overall construction costs (not only the planning ones). Again, the spread of opinions is
significant. The integrated design process and the use of standard solutions scored better
than the other solutions, but no “winner” stood out.
Additional comments were provided by the respondents:
⌂ Architect: In turnkey contracts you cannot count on the contractor to use the
solutions prescribed by the designers in a BIM‐model. Standard solutions do not take
into account the complexity/variations of the reality – they look like something from
North Korea! External staircases look like the bad solutions from the 60‘ies.
⌂ Engineer (2): The use of (too) large windows is a challenge. Underground parking
cannot be avoided in the cities because of the district plans. And where else can the
installations be – and the cars? We already try to optimize service and common
spaces.
⌂ Contractor (5): Digitalization in combination with configuration is the way ahead. BIM
is a dead end and today it has very little use on constructions sites.
⌂ Contractor (6): Involve subcontractors and product suppliers early in the design. An
example is the concrete element sector, where the supplier of concrete elements is
involved in the process from the start.
⌂ Contractor (7): It is important to collect the necessary competences early in the
design phase.
⌂ Building association (8): We generally do not consider design cost a hindrance. Use of
standard solutions may lock the architecture, resulting in less architectural freedom.
Use of BIM can both increase and decrease costs depending on what is put into the
model.
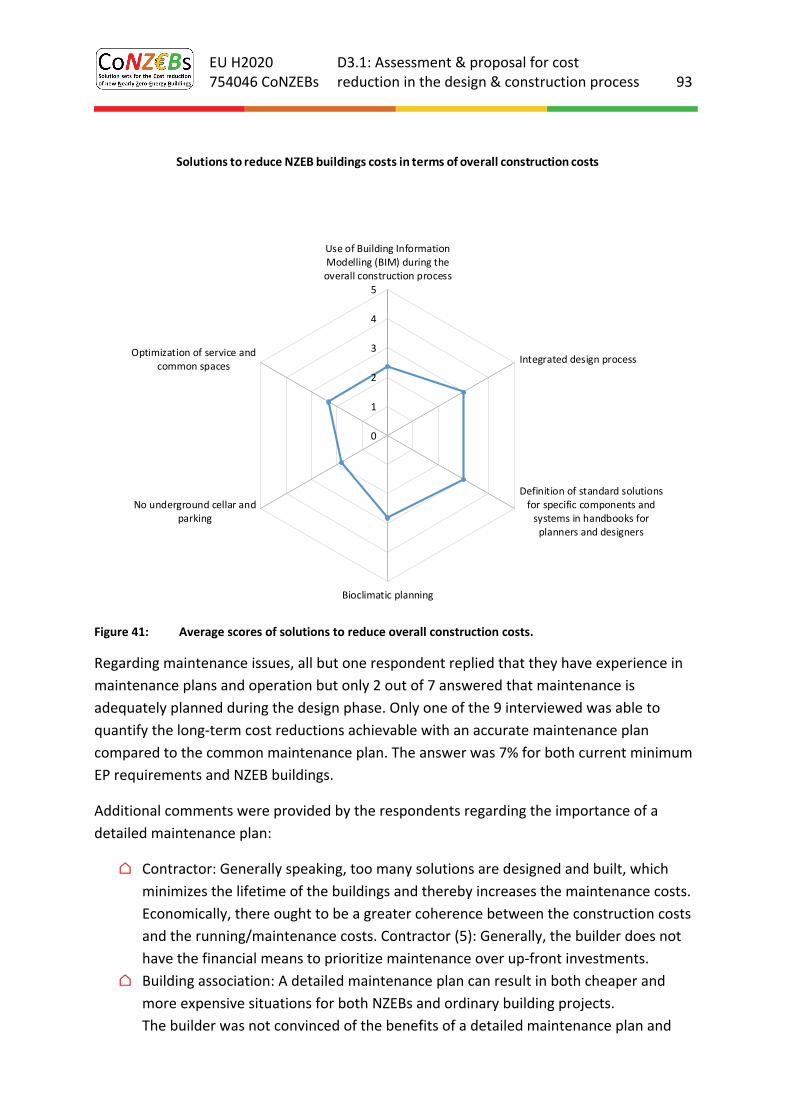
EU H2020 754046 CoNZEBs
D3.1: Assessment & proposal for cost reduction in the design & construction process 93
Figure 41: Average scores of solutions to reduce overall construction costs.
Regarding maintenance issues, all but one respondent replied that they have experience in
maintenance plans and operation but only 2 out of 7 answered that maintenance is
adequately planned during the design phase. Only one of the 9 interviewed was able to
quantify the long‐term cost reductions achievable with an accurate maintenance plan
compared to the common maintenance plan. The answer was 7% for both current minimum
EP requirements and NZEB buildings.
Additional comments were provided by the respondents regarding the importance of a
detailed maintenance plan:
⌂ Contractor: Generally speaking, too many solutions are designed and built, which
minimizes the lifetime of the buildings and thereby increases the maintenance costs.
Economically, there ought to be a greater coherence between the construction costs
and the running/maintenance costs. Contractor (5): Generally, the builder does not
have the financial means to prioritize maintenance over up‐front investments.
⌂ Building association: A detailed maintenance plan can result in both cheaper and
more expensive situations for both NZEBs and ordinary building projects.
The builder was not convinced of the benefits of a detailed maintenance plan and
0
1
2
3
4
5
Use of Building InformationModelling (BIM) during theoverall construction process
Integrated design process
Definition of standard solutionsfor specific components andsystems in handbooks forplanners and designers
Bioclimatic planning
No underground cellar andparking
Optimization of service andcommon spaces
Solutions to reduce NZEB buildings costs in terms of overall construction costs
EU H2020 754046 CoNZEBs
D3.1: Assessment & proposal for cost reduction in the design & construction process 94
one contractor claimed that is doesn’t matter, because the builder doesn’t have the
money up‐front anyway.
Additional ideas for cost savings during the design process:
⌂ Engineer: It can be difficult to point out savings in the design phase, which do not
imply the risk of resulting in a poorer project and with that a more expensive
construction. Redesign should be avoided, but if you have to wait for clarifications, it
may prolong the design phase. Detailed simulations of the indoor climate can reduce
the need for ventilation and/or cooling (better and cheaper buildings), but that
means increased design work.
4.3.3. Results of the construction questionnaires
All the construction companies were aware of what an NZEB is and 4 out of 5 contractors
had experience in the construction of NZEBs. The majority of the respondents both directly
execute works or hire sub‐contractors (4 out of 5).
Going into details with the relation between construction and costs, interviewees were
asked if they ever experienced decrease or increase in costs in respect to the initial planning.
All the 5 respondents answered that they did experience increase in costs for the
construction of minimum EP requirement buildings. The percentage of increase expressed
range between 3% and 10%, with an average value of 8%.
When asked to rate from 5 to 1 the potential causes of relative cost change in current
energy performance requirements buildings, they gave high importance to the poor design
quality as shown in Figure 42.
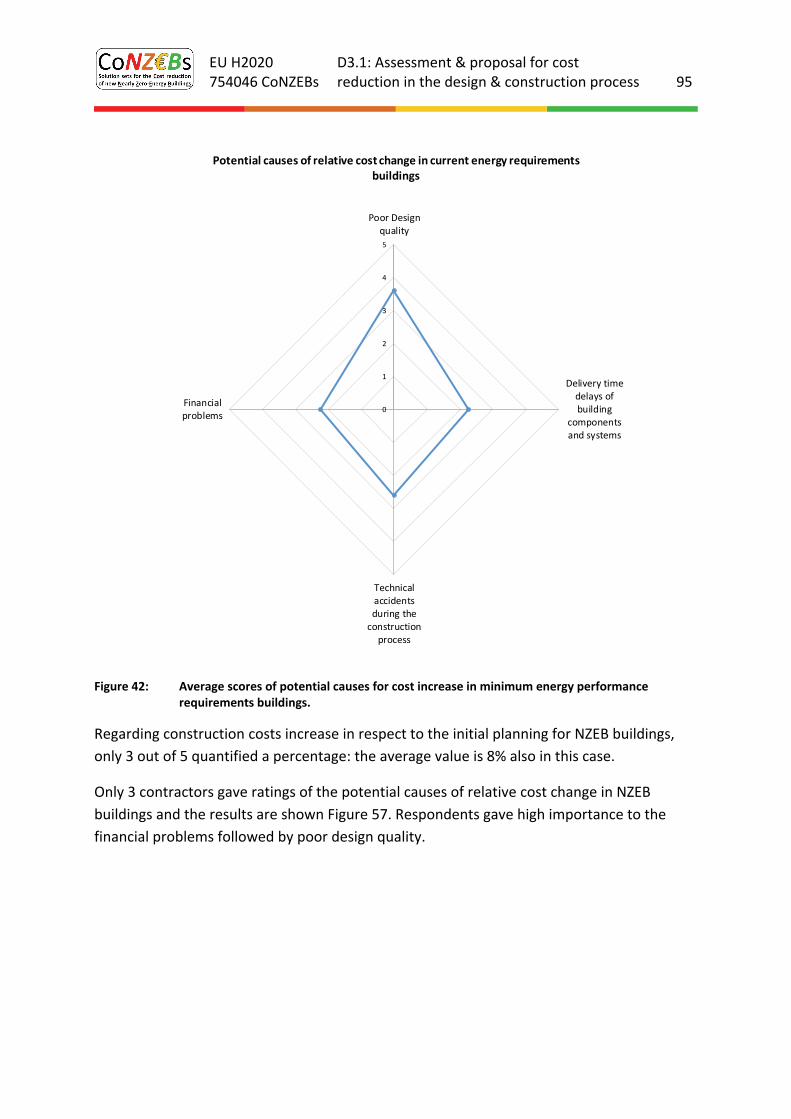
EU H2020 754046 CoNZEBs
D3.1: Assessment & proposal for cost reduction in the design & construction process 95
Figure 42: Average scores of potential causes for cost increase in minimum energy performance requirements buildings.
Regarding construction costs increase in respect to the initial planning for NZEB buildings,
only 3 out of 5 quantified a percentage: the average value is 8% also in this case.
Only 3 contractors gave ratings of the potential causes of relative cost change in NZEB
buildings and the results are shown Figure 57. Respondents gave high importance to the
financial problems followed by poor design quality.
0
1
2
3
4
5
Poor Designquality
Delivery timedelays ofbuilding
componentsand systems
Technicalaccidentsduring theconstructionprocess
Financialproblems
Potential causes of relative cost change in current energy requirements buildings
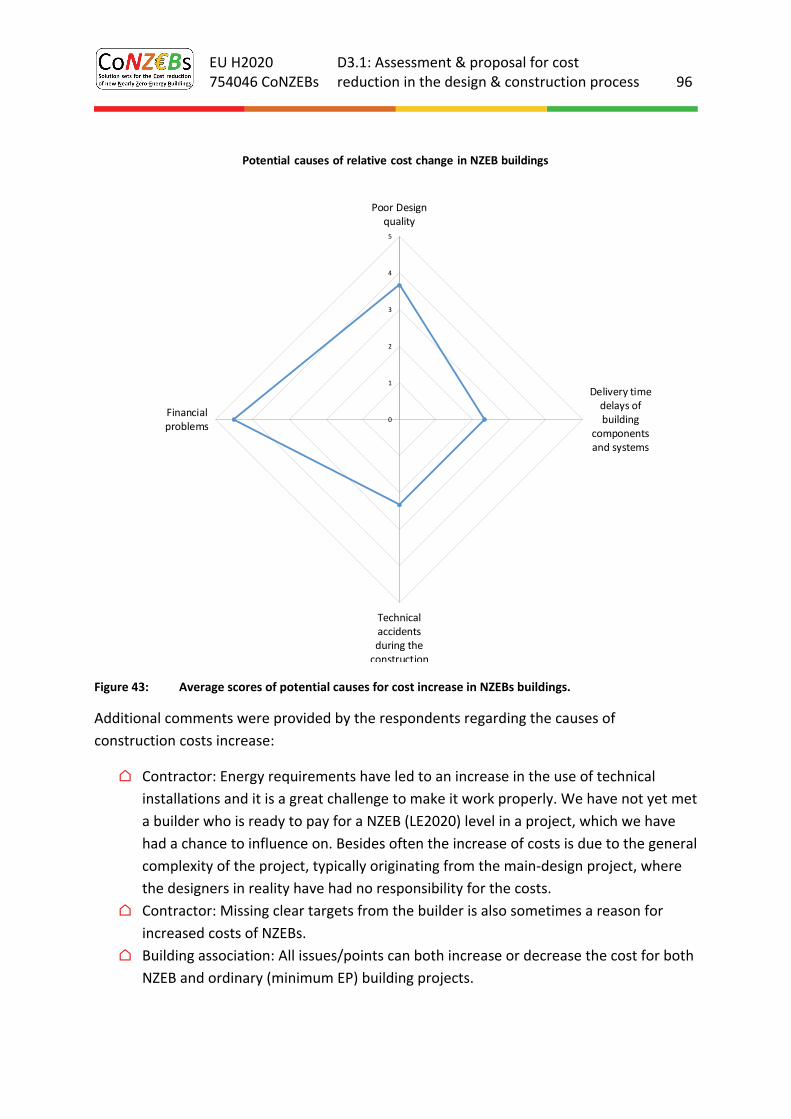
EU H2020 754046 CoNZEBs
D3.1: Assessment & proposal for cost reduction in the design & construction process 96
Figure 43: Average scores of potential causes for cost increase in NZEBs buildings.
Additional comments were provided by the respondents regarding the causes of
construction costs increase:
⌂ Contractor: Energy requirements have led to an increase in the use of technical
installations and it is a great challenge to make it work properly. We have not yet met
a builder who is ready to pay for a NZEB (LE2020) level in a project, which we have
had a chance to influence on. Besides often the increase of costs is due to the general
complexity of the project, typically originating from the main‐design project, where
the designers in reality have had no responsibility for the costs.
⌂ Contractor: Missing clear targets from the builder is also sometimes a reason for
increased costs of NZEBs.
⌂ Building association: All issues/points can both increase or decrease the cost for both
NZEB and ordinary (minimum EP) building projects.
0
1
2
3
4
5
Poor Designquality
Delivery timedelays ofbuilding
componentsand systems
Technicalaccidentsduring theconstruction
Financialproblems
Potential causes of relative cost change in NZEB buildings
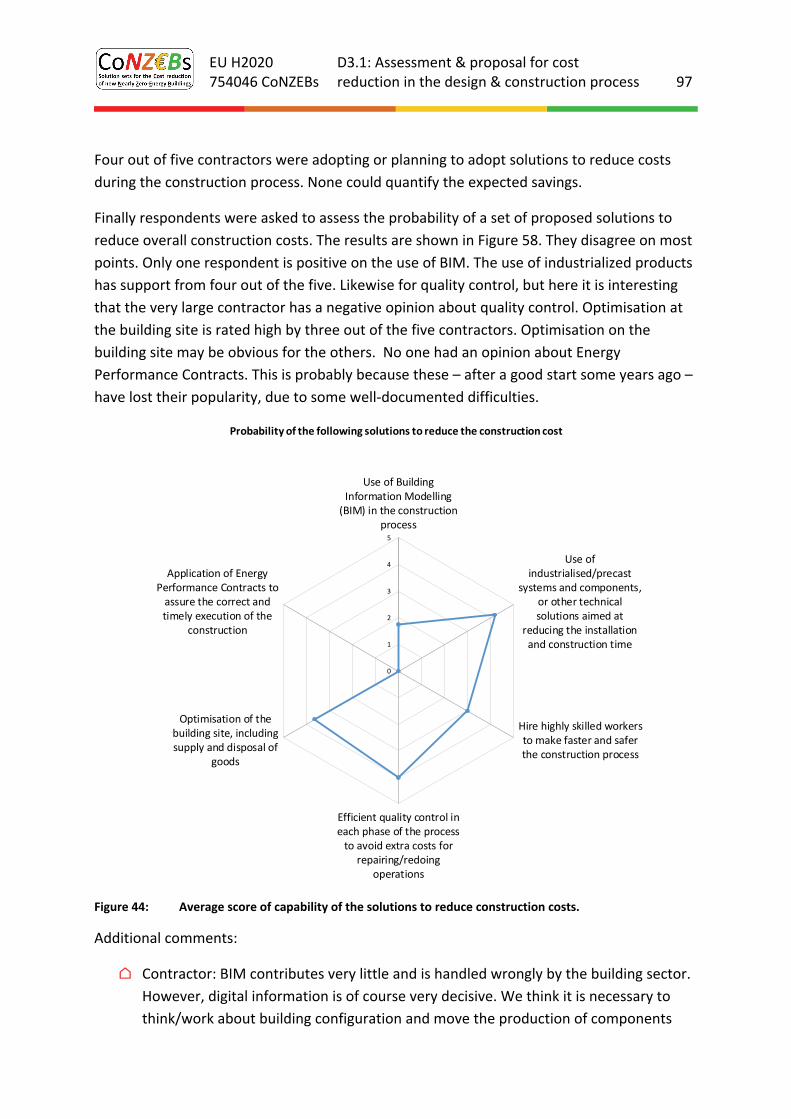
EU H2020 754046 CoNZEBs
D3.1: Assessment & proposal for cost reduction in the design & construction process 97
Four out of five contractors were adopting or planning to adopt solutions to reduce costs
during the construction process. None could quantify the expected savings.
Finally respondents were asked to assess the probability of a set of proposed solutions to
reduce overall construction costs. The results are shown in Figure 58. They disagree on most
points. Only one respondent is positive on the use of BIM. The use of industrialized products
has support from four out of the five. Likewise for quality control, but here it is interesting
that the very large contractor has a negative opinion about quality control. Optimisation at
the building site is rated high by three out of the five contractors. Optimisation on the
building site may be obvious for the others. No one had an opinion about Energy
Performance Contracts. This is probably because these – after a good start some years ago –
have lost their popularity, due to some well‐documented difficulties.
Figure 44: Average score of capability of the solutions to reduce construction costs.
Additional comments:
⌂ Contractor: BIM contributes very little and is handled wrongly by the building sector.
However, digital information is of course very decisive. We think it is necessary to
think/work about building configuration and move the production of components
0
1
2
3
4
5
Use of BuildingInformation Modelling(BIM) in the construction
process
Use ofindustrialised/precast
systems and components,or other technicalsolutions aimed at
reducing the installationand construction time
Hire highly skilled workersto make faster and saferthe construction process
Efficient quality control ineach phase of the processto avoid extra costs for
repairing/redoingoperations
Optimisation of thebuilding site, includingsupply and disposal of
goods
Application of EnergyPerformance Contracts toassure the correct andtimely execution of the
construction
Probability of the following solutions to reduce the construction cost
EU H2020 754046 CoNZEBs
D3.1: Assessment & proposal for cost reduction in the design & construction process 98
away from the construction site. Configuration requires skilled workers in the
production, but to a less extent in the assembly/mounting on site. Configuration also
leads to better planning – one of the most important side effects. Quality control in
the traditional construction process has become a farce. For components produced
off‐site quality control is obviously needed.
⌂ Contractor: We use daily quality control by using tablets, so any faults can be
immediately corrected. There may be cost savings in buying and having delivered
large quantities of components, but that also involves risks for damages and thefts at
the building site. Digitalization supported by configuration is the road ahead. BIM is a
dead end which has little room in the construction phase today.
Additional proposals were given by the contributors for reducing both planning and overall
construction costs. These comments are summarized under three headings: political issues,
industrialize and roles of the involved partners in the whole process and planning.
1. Political issues
⌂ Architect: We think the Danish NZEB‐class (LE2020) is a waste of time, because it
results in sub‐optimisation. We prefer holistic solutions in which for example LCA is
integrated in the energy frame, as currently under development for an optional
sustainability class – or with DGNB (sustainability certification).
⌂ Contractor: The Danish thinking in Building Regulations (BR) is a very traditional
approach to construction, which blocks industrialisation. Some time ago, there was a
step in the direction of requirements based on function, but especially within the
energy area this drowns in all kinds of detailed requirements to components and
parts. A detailed regulation, which on top of it all is even taken to the individual
building classes with the actual problem that LE2020 today does not have any
economic justification, even for long‐sighted investors.
BR should be limited to general minimum requirements and a level for the energy
demand. Then it would be possible, in any given project, to juggle with the “swings
and carousels” and a manufacturer, of e.g. facades, would much more efficiently be
able to optimise his product. Likewise, the Danish energy policy blocks more efficient
solutions by preventing the use of renewable energy systems and the protection of
district heating. When you remember that the buildings we build today shall be in an
electricity‐based energy network for 80% of their lifetime and that electrical solutions
are markedly cheaper than hydro‐based solutions it is absurd that we still use a
primary energy factor for electricity of 2.5. To reach NZEB primarily by savings, as in
LE2020, is economically a really bad solution.
EU H2020 754046 CoNZEBs
D3.1: Assessment & proposal for cost reduction in the design & construction process 99
2. Industrialize:
⌂ Contractor: If we really want to increase the productivity and make use of
digitalization, we need to change the practice from design to configuration. This does
not mean re‐inventing the wheel every time we start a new project but instead use
already known solutions. Any building could be configured/combined from known
solutions – say for 90% of the building ‐ with a controlled variation – say 10% of
selected building parts are designed for this particular project. This is a decisive
premise for effectively being able to use the potential of digitalization, put the
building sector into a competition framework, close the gap of missing labour and
address the challenge for sustainability. Today we use a lot of energy to design
technical installation shafts, even if nobody is interested in them, except that they
work.
⌂ Contractor: The only thing that can really reduce construction costs is to industrialise.
Not understood as factories, but to use the possibility for continuous improvements
through repetitions. This requires configuration instead of design and is much more
than standard solutions and handbooks.
3. Roles of the involved partners in the whole process and planning:
⌂ Contractor: The builder needs to be more active and more conscious about how he
assures value for money in the best way possible. Today, builders are too passive and
uncritical.
⌂ Contractor: Better planning of the construction phases. Contractor (4): Involve the
contractors in the design phase.
⌂ Contractor: Break up of demarcations between different crafts combined with time
studies can bring down costs considerably. Time studies show that in average a
craftsman is only productive in 30% of his time. The rest goes to looking at drawings,
transport and discussions. If all the workers receive a tablet with the drawings and
based on the assumption that the design material is available, the 30% could be
raised to 45%.
⌂ Building association: Use of strategic cooperation involving designers and
contractors, who all have been involved in several cases (not necessarily with the
same architecture), but with re‐use of technical solutions and construction methods
as well as logistics. This idea corresponds to a new initiative from one of the largest
building associations in Denmark, who will organize construction partnerships for a
framework contract for a number of future building projects. With a common
framework contract, the whole team has a motivation to deliver a successful project,
which then will lead to the next job. So, the teams do not always have to fight for
each job but can use their efforts on doing a good job in their present construction
project. The roles of each partner will be well‐known. They will have a project leader,
a follow‐up group and different responsibilities distributed among the partners.
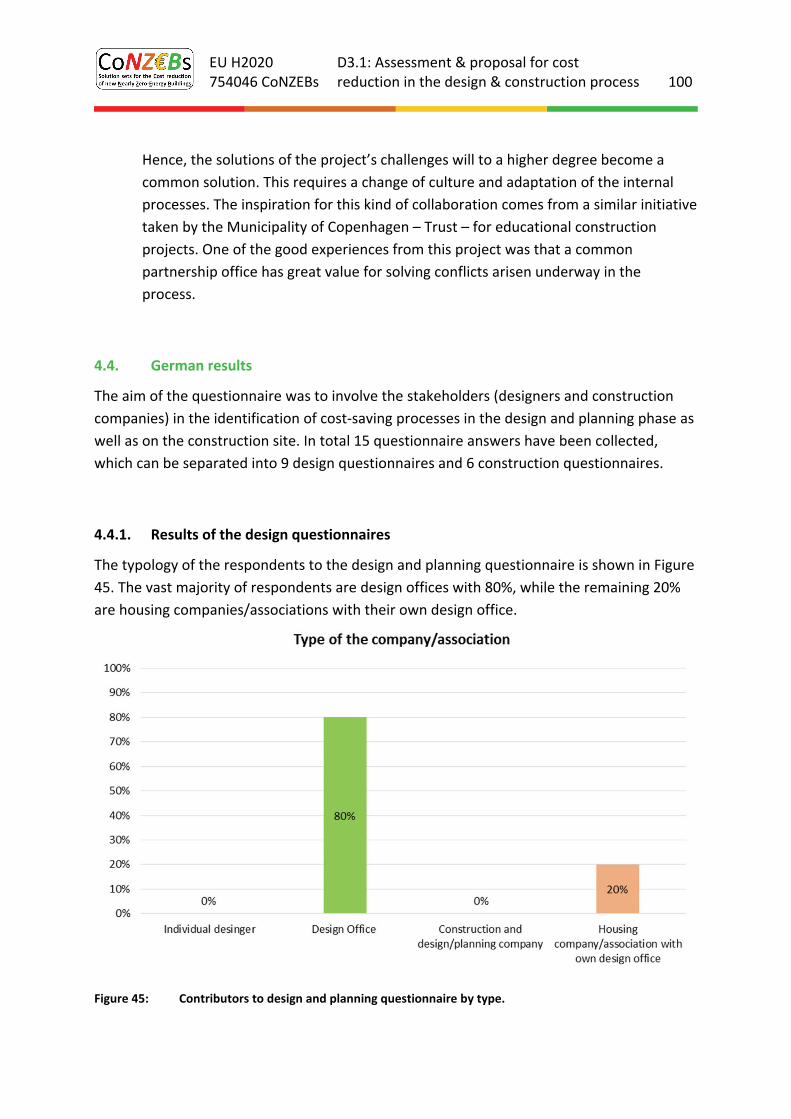
EU H2020 754046 CoNZEBs
D3.1: Assessment & proposal for cost reduction in the design & construction process 100
Hence, the solutions of the project’s challenges will to a higher degree become a
common solution. This requires a change of culture and adaptation of the internal
processes. The inspiration for this kind of collaboration comes from a similar initiative
taken by the Municipality of Copenhagen – Trust – for educational construction
projects. One of the good experiences from this project was that a common
partnership office has great value for solving conflicts arisen underway in the
process.
4.4. German results
The aim of the questionnaire was to involve the stakeholders (designers and construction
companies) in the identification of cost‐saving processes in the design and planning phase as
well as on the construction site. In total 15 questionnaire answers have been collected,
which can be separated into 9 design questionnaires and 6 construction questionnaires.
4.4.1. Results of the design questionnaires
The typology of the respondents to the design and planning questionnaire is shown in Figure
45. The vast majority of respondents are design offices with 80%, while the remaining 20%
are housing companies/associations with their own design office.
Figure 45: Contributors to design and planning questionnaire by type.

EU H2020 754046 CoNZEBs
D3.1: Assessment & proposal for cost reduction in the design & construction process 101
All contributors to the design and planning questionnaire were well aware of the NZEB
requirements and all of them had experience with the design and planning on NZEBs, which
makes them a reliable and high‐quality source of information.
The questions presented in the following are specifically targeting the design process. First of
all, the fraction of the design costs in respect to the overall construction costs of newly built
multi‐family houses (MFH) has been asked. The contributors agreed that the fraction of the
design costs is around or above 24%. This is considerably higher than described in chapter
2.3.1 where 13% were indicated as median design and planning costs in respect to the total
building costs. We assume that the costs given by the questionnaire contributors are related
to the building construction costs (German costs groups KG300 and KG400). These do not
include for example the building plot, the infrastructure, etc. Accordingly, the percentage of
the design and planning costs are considerable higher. The questionnaire asked for design
costs in relation to the total building costs, but in many cases the costs outside of KG300 and
KG400 are not known to the designers.
Figure 46: Fraction of design cost in respect to the overall construction cost of new MFH in private housing and social housing.
Now asked for the fraction of the design costs in respect to the overall construction costs of
newly built NZEB MFH (shown in Figure 47), the respondents answered similar to the
conventional new MFH, indicating that the fraction of design costs is about 24%. An
explanation for this high ratio is presented above.
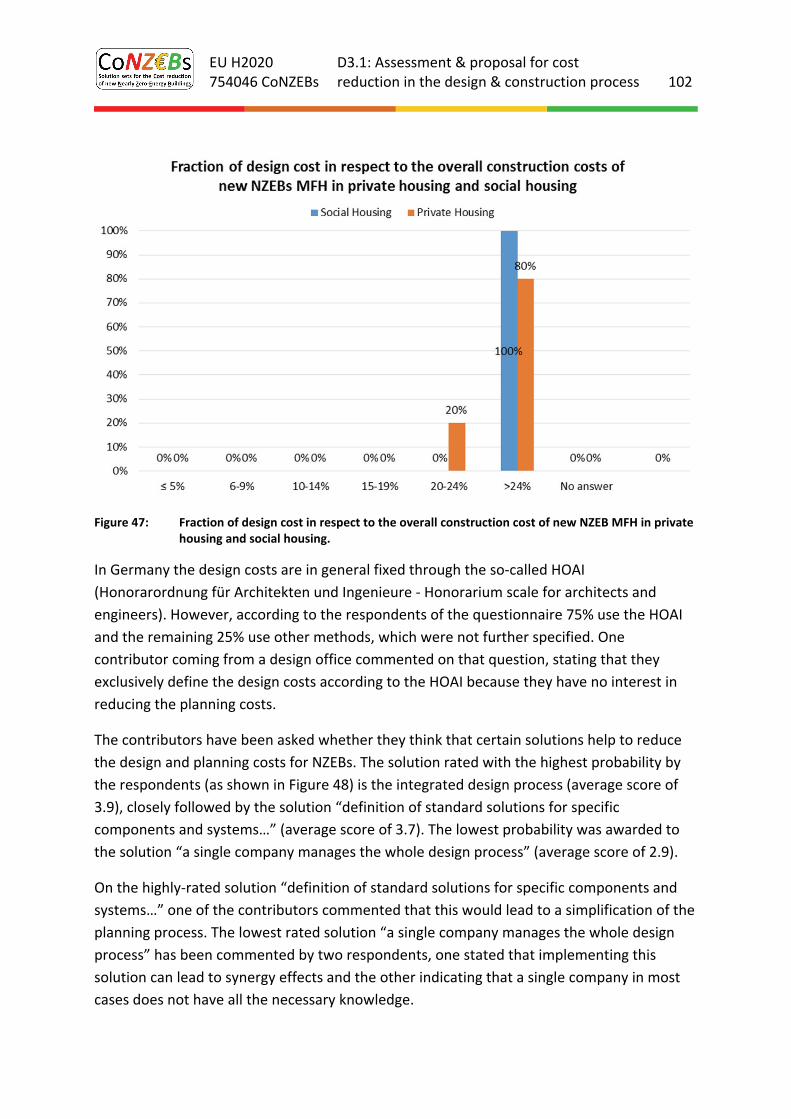
EU H2020 754046 CoNZEBs
D3.1: Assessment & proposal for cost reduction in the design & construction process 102
Figure 47: Fraction of design cost in respect to the overall construction cost of new NZEB MFH in private housing and social housing.
In Germany the design costs are in general fixed through the so‐called HOAI
(Honorarordnung für Architekten und Ingenieure ‐ Honorarium scale for architects and
engineers). However, according to the respondents of the questionnaire 75% use the HOAI
and the remaining 25% use other methods, which were not further specified. One
contributor coming from a design office commented on that question, stating that they
exclusively define the design costs according to the HOAI because they have no interest in
reducing the planning costs.
The contributors have been asked whether they think that certain solutions help to reduce
the design and planning costs for NZEBs. The solution rated with the highest probability by
the respondents (as shown in Figure 48) is the integrated design process (average score of
3.9), closely followed by the solution “definition of standard solutions for specific
components and systems…” (average score of 3.7). The lowest probability was awarded to
the solution “a single company manages the whole design process” (average score of 2.9).
On the highly‐rated solution “definition of standard solutions for specific components and
systems…” one of the contributors commented that this would lead to a simplification of the
planning process. The lowest rated solution “a single company manages the whole design
process” has been commented by two respondents, one stated that implementing this
solution can lead to synergy effects and the other indicating that a single company in most
cases does not have all the necessary knowledge.

EU H2020 754046 CoNZEBs
D3.1: Assessment & proposal for cost reduction in the design & construction process 103
Figure 48: Probability that certain predefined solutions will reduce the design and planning costs according to the questionnaire contributors.
The contributors were also asked for their opinion about certain solutions to reduce the
overall construction costs of NZEB buildings (see Figure 49). The highest probability to
reduce construction costs has, according to the respondents, the solution “no underground
cellar and parking” (average score of 4.7). The lowest probability to reduce the overall
construction costs was awarded to the solution that suggests the use of BIM during the
overall construction process (average score of 3.1).
Commenting on the highest rated solution “no underground cellar and parking” one
contributor pointed out, that not building an underground cellar or parking would lead to a
reduction of the total construction costs but this raises the question where tenant cellars
and boiler and other technical equipment will be located. To implement BIM in the overall
construction process would lead to an increased effort, as one contributor commented on
the lowest rated solution.
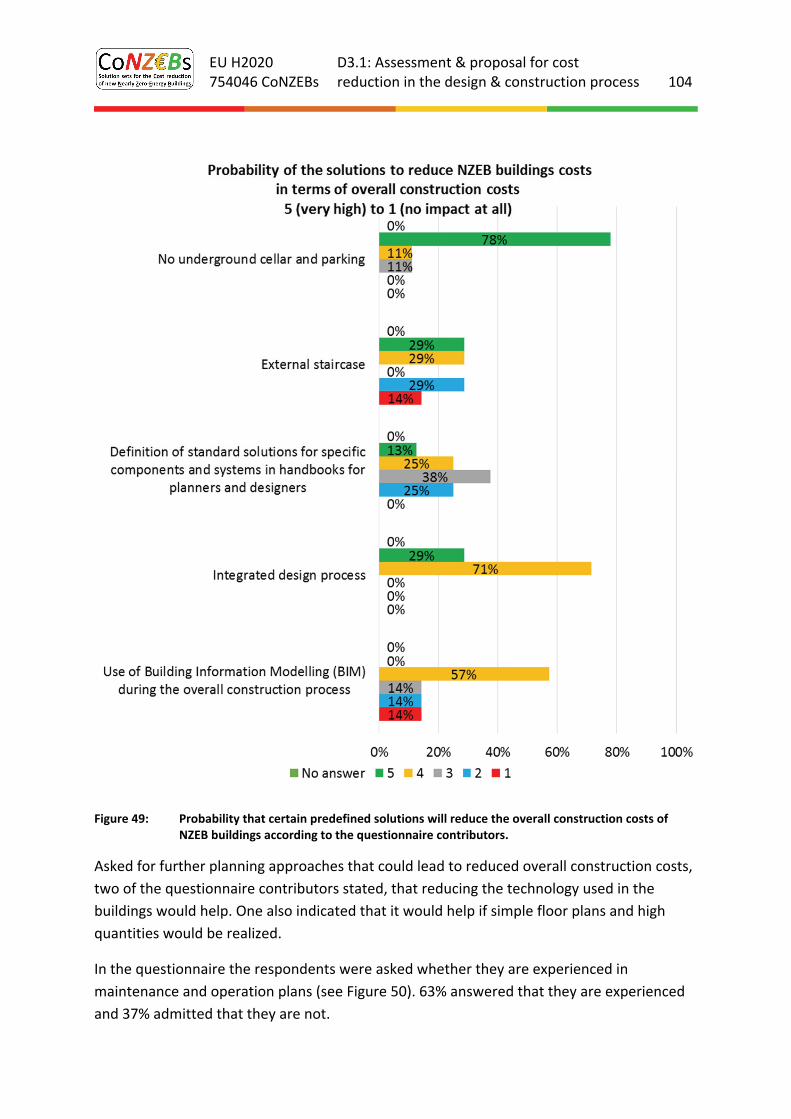
EU H2020 754046 CoNZEBs
D3.1: Assessment & proposal for cost reduction in the design & construction process 104
Figure 49: Probability that certain predefined solutions will reduce the overall construction costs of NZEB buildings according to the questionnaire contributors.
Asked for further planning approaches that could lead to reduced overall construction costs,
two of the questionnaire contributors stated, that reducing the technology used in the
buildings would help. One also indicated that it would help if simple floor plans and high
quantities would be realized.
In the questionnaire the respondents were asked whether they are experienced in
maintenance and operation plans (see Figure 50). 63% answered that they are experienced
and 37% admitted that they are not.
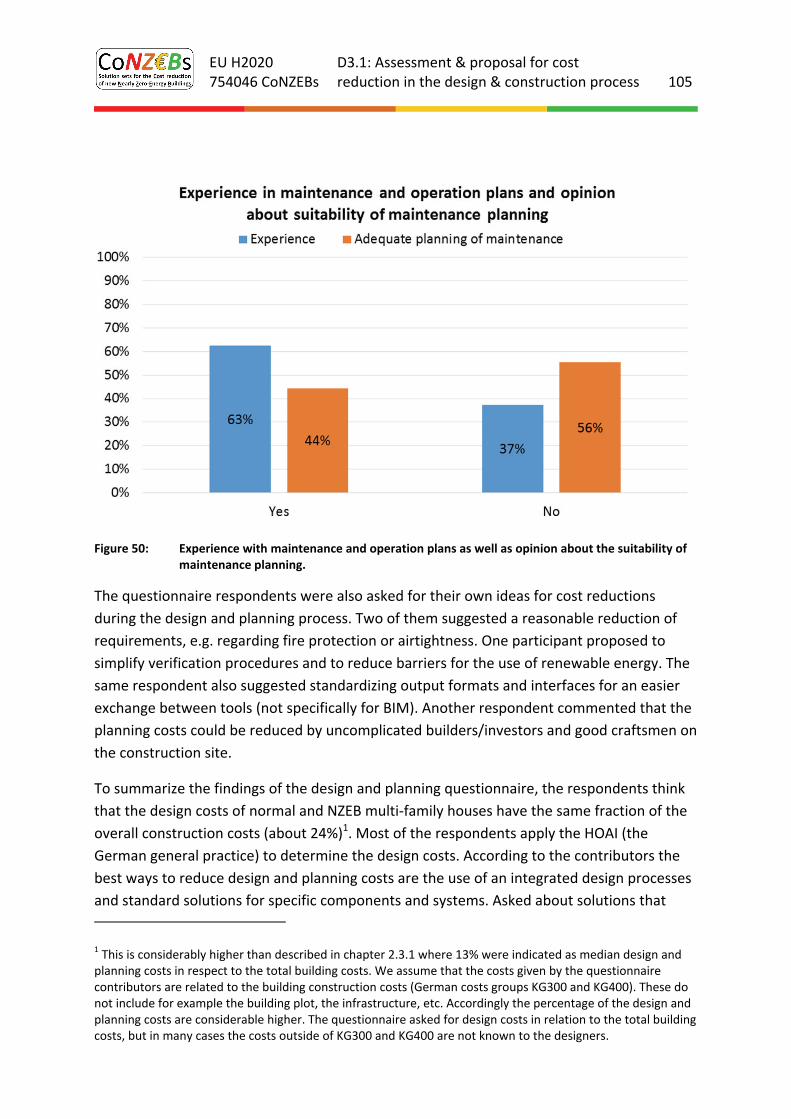
EU H2020 754046 CoNZEBs
D3.1: Assessment & proposal for cost reduction in the design & construction process 105
Figure 50: Experience with maintenance and operation plans as well as opinion about the suitability of maintenance planning.
The questionnaire respondents were also asked for their own ideas for cost reductions
during the design and planning process. Two of them suggested a reasonable reduction of
requirements, e.g. regarding fire protection or airtightness. One participant proposed to
simplify verification procedures and to reduce barriers for the use of renewable energy. The
same respondent also suggested standardizing output formats and interfaces for an easier
exchange between tools (not specifically for BIM). Another respondent commented that the
planning costs could be reduced by uncomplicated builders/investors and good craftsmen on
the construction site.
To summarize the findings of the design and planning questionnaire, the respondents think
that the design costs of normal and NZEB multi‐family houses have the same fraction of the
overall construction costs (about 24%)1. Most of the respondents apply the HOAI (the
German general practice) to determine the design costs. According to the contributors the
best ways to reduce design and planning costs are the use of an integrated design processes
and standard solutions for specific components and systems. Asked about solutions that
1 This is considerably higher than described in chapter 2.3.1 where 13% were indicated as median design and planning costs in respect to the total building costs. We assume that the costs given by the questionnaire contributors are related to the building construction costs (German costs groups KG300 and KG400). These do not include for example the building plot, the infrastructure, etc. Accordingly the percentage of the design and planning costs are considerable higher. The questionnaire asked for design costs in relation to the total building costs, but in many cases the costs outside of KG300 and KG400 are not known to the designers.
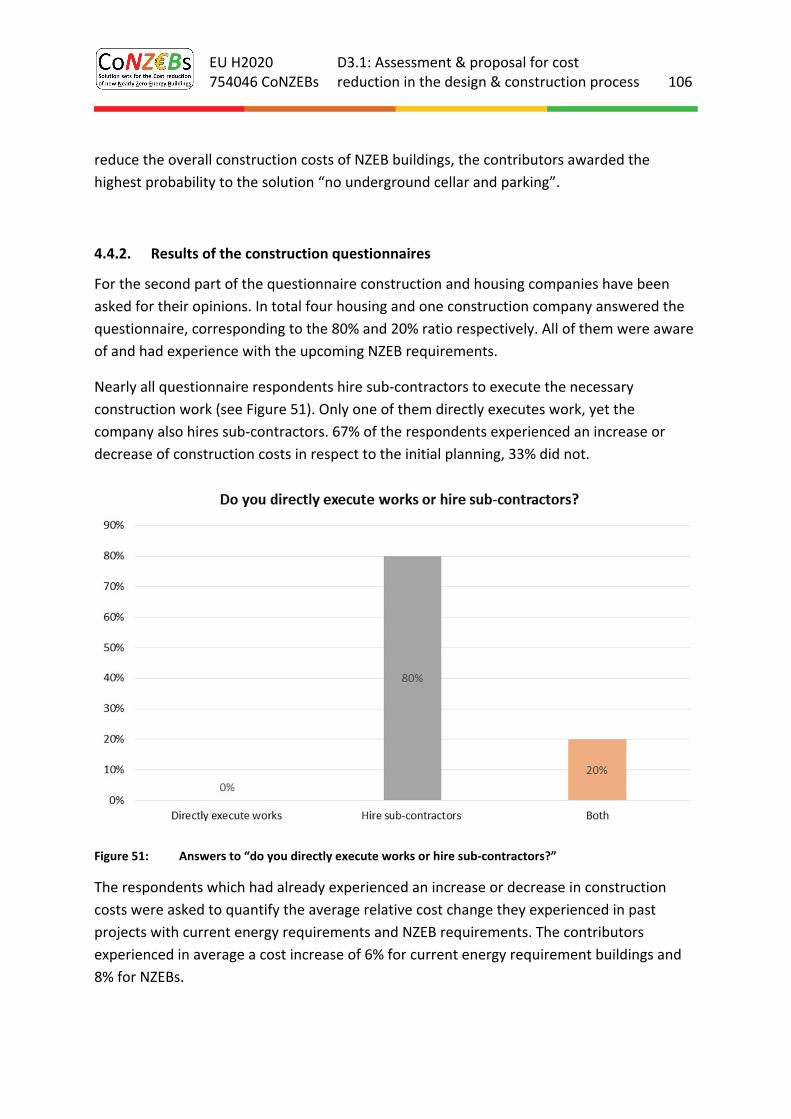
EU H2020 754046 CoNZEBs
D3.1: Assessment & proposal for cost reduction in the design & construction process 106
reduce the overall construction costs of NZEB buildings, the contributors awarded the
highest probability to the solution “no underground cellar and parking”.
4.4.2. Results of the construction questionnaires
For the second part of the questionnaire construction and housing companies have been
asked for their opinions. In total four housing and one construction company answered the
questionnaire, corresponding to the 80% and 20% ratio respectively. All of them were aware
of and had experience with the upcoming NZEB requirements.
Nearly all questionnaire respondents hire sub‐contractors to execute the necessary
construction work (see Figure 51). Only one of them directly executes work, yet the
company also hires sub‐contractors. 67% of the respondents experienced an increase or
decrease of construction costs in respect to the initial planning, 33% did not.
Figure 51: Answers to “do you directly execute works or hire sub‐contractors?”
The respondents which had already experienced an increase or decrease in construction
costs were asked to quantify the average relative cost change they experienced in past
projects with current energy requirements and NZEB requirements. The contributors
experienced in average a cost increase of 6% for current energy requirement buildings and
8% for NZEBs.
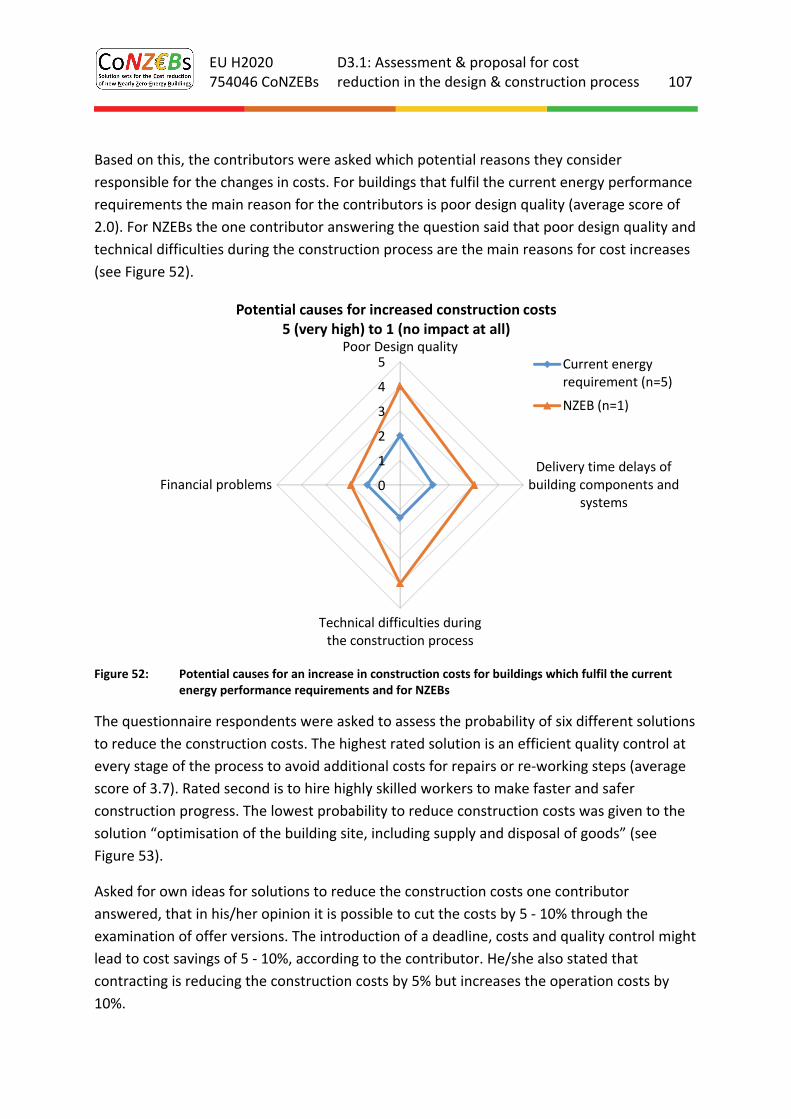
EU H2020 754046 CoNZEBs
D3.1: Assessment & proposal for cost reduction in the design & construction process 107
Based on this, the contributors were asked which potential reasons they consider
responsible for the changes in costs. For buildings that fulfil the current energy performance
requirements the main reason for the contributors is poor design quality (average score of
2.0). For NZEBs the one contributor answering the question said that poor design quality and
technical difficulties during the construction process are the main reasons for cost increases
(see Figure 52).
Figure 52: Potential causes for an increase in construction costs for buildings which fulfil the current energy performance requirements and for NZEBs
The questionnaire respondents were asked to assess the probability of six different solutions
to reduce the construction costs. The highest rated solution is an efficient quality control at
every stage of the process to avoid additional costs for repairs or re‐working steps (average
score of 3.7). Rated second is to hire highly skilled workers to make faster and safer
construction progress. The lowest probability to reduce construction costs was given to the
solution “optimisation of the building site, including supply and disposal of goods” (see
Figure 53).
Asked for own ideas for solutions to reduce the construction costs one contributor
answered, that in his/her opinion it is possible to cut the costs by 5 ‐ 10% through the
examination of offer versions. The introduction of a deadline, costs and quality control might
lead to cost savings of 5 ‐ 10%, according to the contributor. He/she also stated that
contracting is reducing the construction costs by 5% but increases the operation costs by
10%.
0
1
2
3
4
5Poor Design quality
Delivery time delays ofbuilding components and
systems
Technical difficulties duringthe construction process
Financial problems
Potential causes for increased construction costs 5 (very high) to 1 (no impact at all)
Current energyrequirement (n=5)
NZEB (n=1)
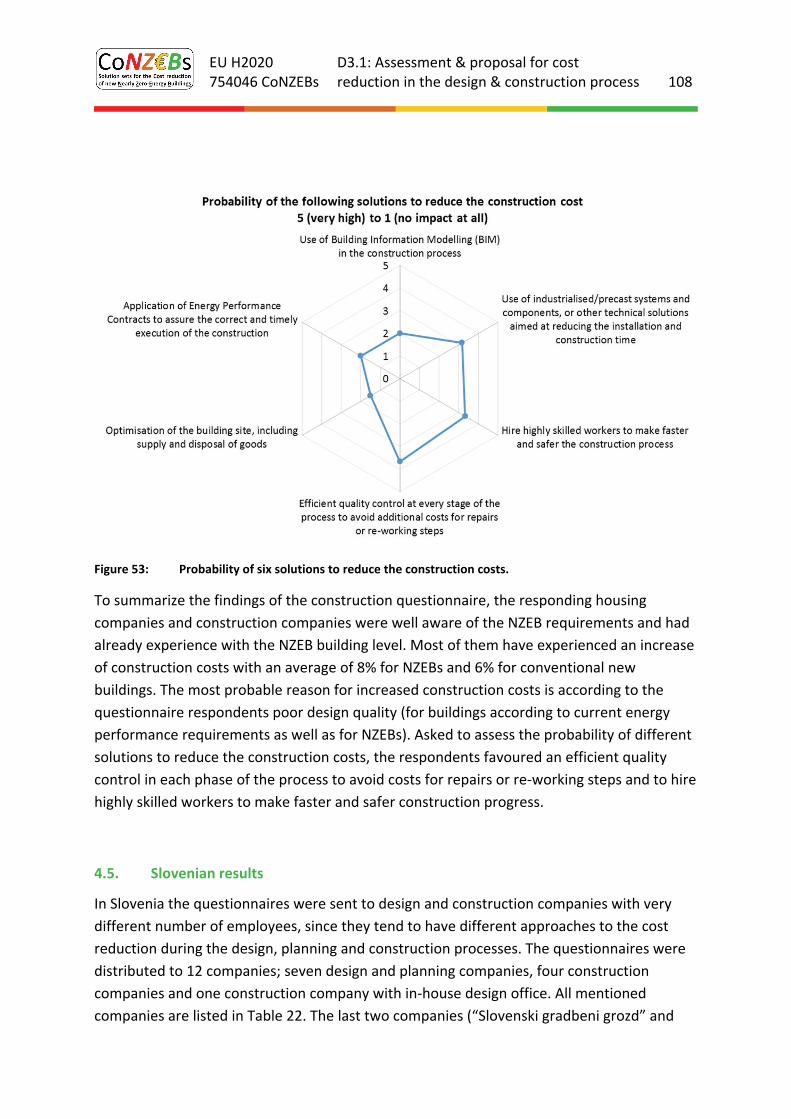
EU H2020 754046 CoNZEBs
D3.1: Assessment & proposal for cost reduction in the design & construction process 108
Figure 53: Probability of six solutions to reduce the construction costs.
To summarize the findings of the construction questionnaire, the responding housing
companies and construction companies were well aware of the NZEB requirements and had
already experience with the NZEB building level. Most of them have experienced an increase
of construction costs with an average of 8% for NZEBs and 6% for conventional new
buildings. The most probable reason for increased construction costs is according to the
questionnaire respondents poor design quality (for buildings according to current energy
performance requirements as well as for NZEBs). Asked to assess the probability of different
solutions to reduce the construction costs, the respondents favoured an efficient quality
control in each phase of the process to avoid costs for repairs or re‐working steps and to hire
highly skilled workers to make faster and safer construction progress.
4.5. Slovenian results
In Slovenia the questionnaires were sent to design and construction companies with very
different number of employees, since they tend to have different approaches to the cost
reduction during the design, planning and construction processes. The questionnaires were
distributed to 12 companies; seven design and planning companies, four construction
companies and one construction company with in‐house design office. All mentioned
companies are listed in Table 22. The last two companies (“Slovenski gradbeni grozd” and
EU H2020 754046 CoNZEBs
D3.1: Assessment & proposal for cost reduction in the design & construction process 109
“GZS ZGIGM”) are professional organizations of construction companies, which participated
in the part of the questionnaire for construction companies. The aim was to connect with
the companies who have adequate references, experiences and as well showed a desire for
cooperation.
The questionnaires were delivered to all listed companies and with a majority of them also
the interviews were done. Namely, interviews proved to be a more appropriate way to
receive proper answers and information, since it was possible to give to the respondent
additional questions and also explanations.
Table 22: List of interviewed companies (N=12, Slovenia)
Company Type of company Number of employees
NAVA Arhitekti d.o.o. Design and planning company 11
Marko Kramar Arhitekt s.p. Design and planning company 1
RAP ‐ ING d.o.o. Design and planning company 7
Biro APIS d.o.o. Design and planning company 1
Euro3000 d.o.o. Design and planning company from 5 to 10
Lenassi d.o.o. Design and planning company 4
Ljubljanski urbanistični zavod d.d. Design and planning company 40
POMGRAD d.d. Construction company 600
Družba HTZ Velenje, I.P., d.o.o. Construction company 500
Kostak GIP d.o.o. Construction company with in‐house design office
from 10 to 19
Slovenski gradbeni grozd Construction company 4
GZS Zbornica gradbeništva in industrije gradbenega materiala ‐ ZGIGM
Construction company 3 and other additional external partners (23)
4.5.1. Results of the design questionnaires
In the Figure 54 the type of interviewed companies is presented. Most of the companies
(86%) were design offices, the other 14 % were individual designers.
All respondents were aware of the fact that all new buildings have to fulfil the nearly zero‐
energy (NZEB) level starting from 01/01/2021 and that the date for public buildings is
01/01/2019. Also, they all had experience in design and planning of NZEBs.
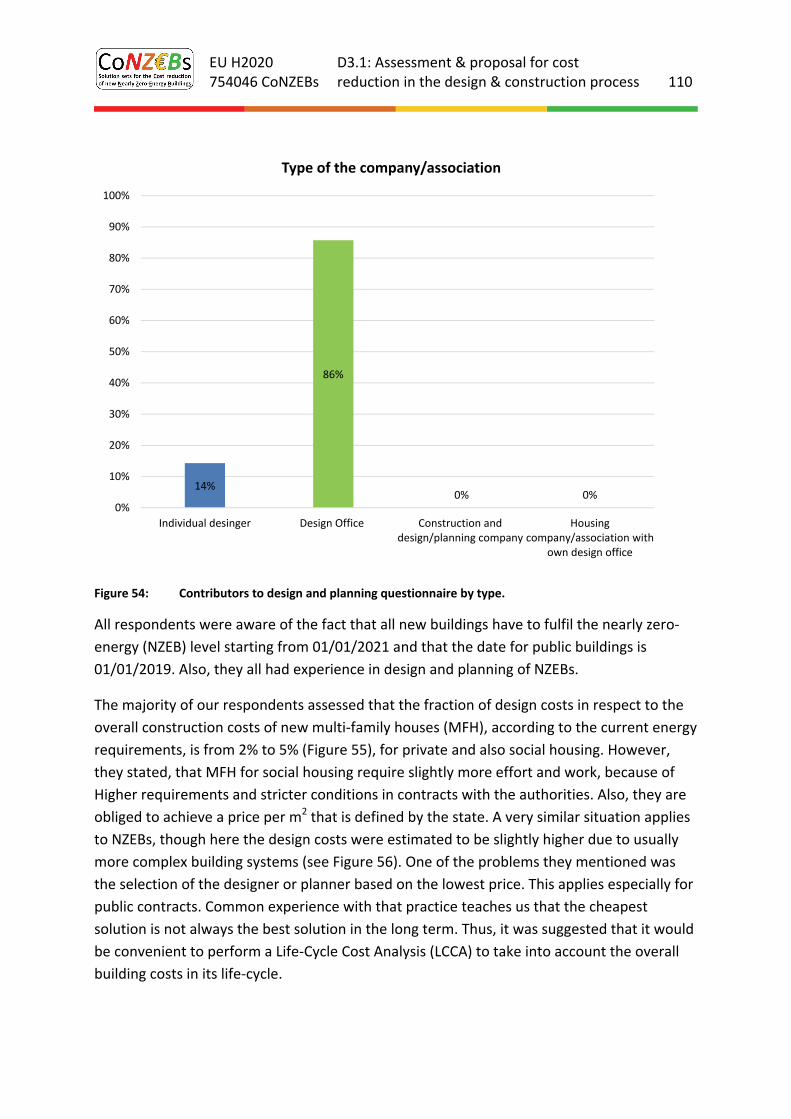
EU H2020 754046 CoNZEBs
D3.1: Assessment & proposal for cost reduction in the design & construction process 110
Figure 54: Contributors to design and planning questionnaire by type.
All respondents were aware of the fact that all new buildings have to fulfil the nearly zero‐
energy (NZEB) level starting from 01/01/2021 and that the date for public buildings is
01/01/2019. Also, they all had experience in design and planning of NZEBs.
The majority of our respondents assessed that the fraction of design costs in respect to the
overall construction costs of new multi‐family houses (MFH), according to the current energy
requirements, is from 2% to 5% (Figure 55), for private and also social housing. However,
they stated, that MFH for social housing require slightly more effort and work, because of
Higher requirements and stricter conditions in contracts with the authorities. Also, they are
obliged to achieve a price per m2 that is defined by the state. A very similar situation applies
to NZEBs, though here the design costs were estimated to be slightly higher due to usually
more complex building systems (see Figure 56). One of the problems they mentioned was
the selection of the designer or planner based on the lowest price. This applies especially for
public contracts. Common experience with that practice teaches us that the cheapest
solution is not always the best solution in the long term. Thus, it was suggested that it would
be convenient to perform a Life‐Cycle Cost Analysis (LCCA) to take into account the overall
building costs in its life‐cycle.
14%
86%
0% 0%0%
10%
20%
30%
40%
50%
60%
70%
80%
90%
100%
Individual desinger Design Office Construction anddesign/planning company
Housingcompany/association with
own design office
Type of the company/association
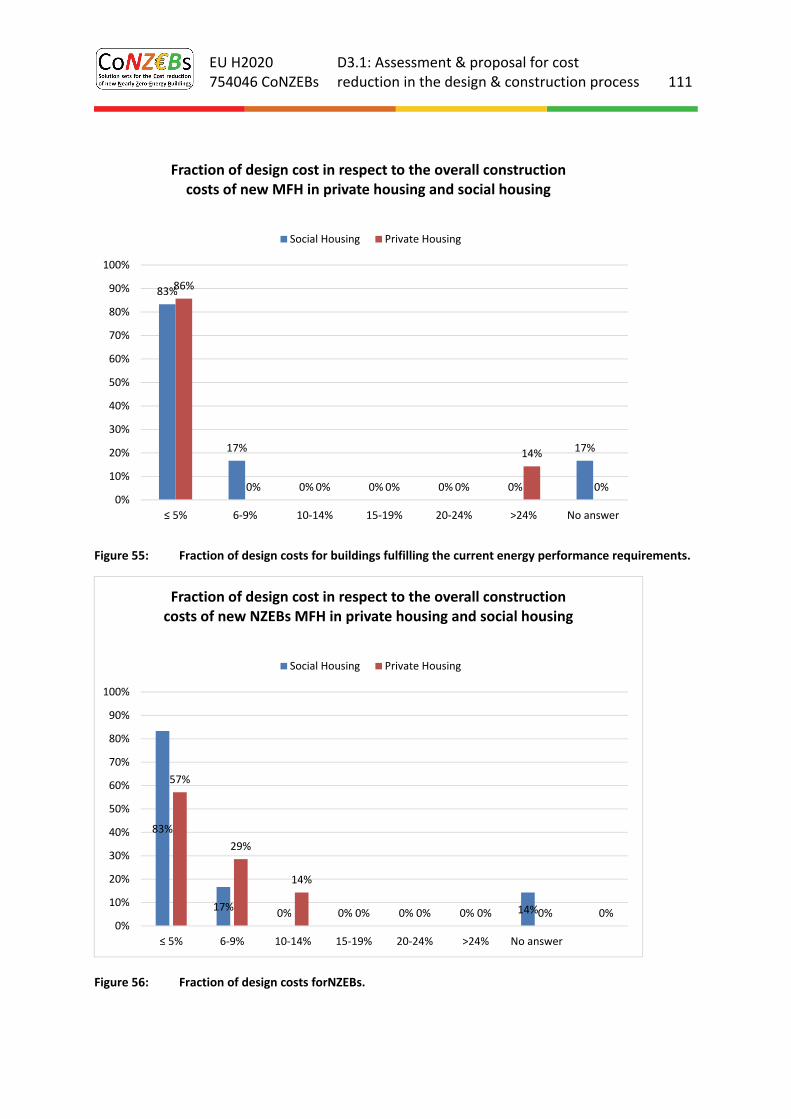
EU H2020 754046 CoNZEBs
D3.1: Assessment & proposal for cost reduction in the design & construction process 111
Figure 55: Fraction of design costs for buildings fulfilling the current energy performance requirements.
Figure 56: Fraction of design costs forNZEBs.
83%
17%
0% 0% 0% 0%
17%
86%
0% 0% 0% 0%
14%
0%0%
10%
20%
30%
40%
50%
60%
70%
80%
90%
100%
≤ 5% 6‐9% 10‐14% 15‐19% 20‐24% >24% No answer
Fraction of design cost in respect to the overall construction costs of new MFH in private housing and social housing
Social Housing Private Housing
83%
17%0% 0% 0% 0% 14%
57%
29%
14%
0% 0% 0% 0% 0%0%
10%
20%
30%
40%
50%
60%
70%
80%
90%
100%
≤ 5% 6‐9% 10‐14% 15‐19% 20‐24% >24% No answer
Fraction of design cost in respect to the overall construction costs of new NZEBs MFH in private housing and social housing
Social Housing Private Housing
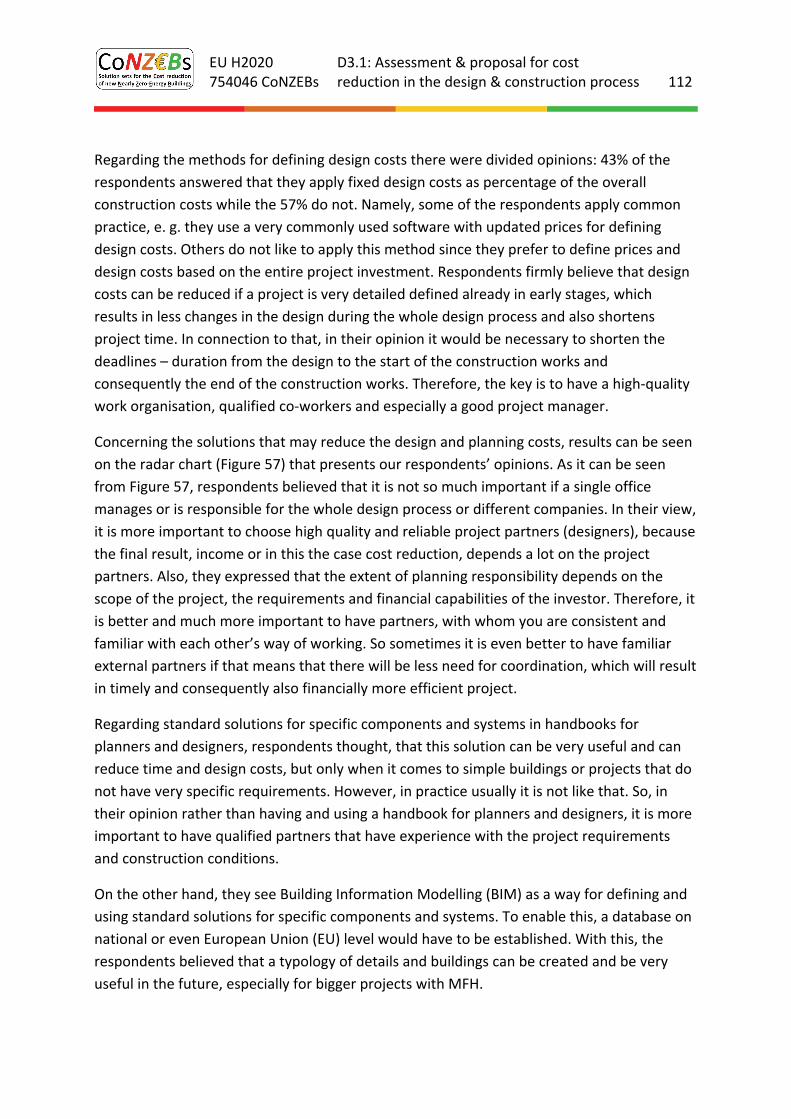
EU H2020 754046 CoNZEBs
D3.1: Assessment & proposal for cost reduction in the design & construction process 112
Regarding the methods for defining design costs there were divided opinions: 43% of the
respondents answered that they apply fixed design costs as percentage of the overall
construction costs while the 57% do not. Namely, some of the respondents apply common
practice, e. g. they use a very commonly used software with updated prices for defining
design costs. Others do not like to apply this method since they prefer to define prices and
design costs based on the entire project investment. Respondents firmly believe that design
costs can be reduced if a project is very detailed defined already in early stages, which
results in less changes in the design during the whole design process and also shortens
project time. In connection to that, in their opinion it would be necessary to shorten the
deadlines – duration from the design to the start of the construction works and
consequently the end of the construction works. Therefore, the key is to have a high‐quality
work organisation, qualified co‐workers and especially a good project manager.
Concerning the solutions that may reduce the design and planning costs, results can be seen
on the radar chart (Figure 57) that presents our respondents’ opinions. As it can be seen
from Figure 57, respondents believed that it is not so much important if a single office
manages or is responsible for the whole design process or different companies. In their view,
it is more important to choose high quality and reliable project partners (designers), because
the final result, income or in this the case cost reduction, depends a lot on the project
partners. Also, they expressed that the extent of planning responsibility depends on the
scope of the project, the requirements and financial capabilities of the investor. Therefore, it
is better and much more important to have partners, with whom you are consistent and
familiar with each other’s way of working. So sometimes it is even better to have familiar
external partners if that means that there will be less need for coordination, which will result
in timely and consequently also financially more efficient project.
Regarding standard solutions for specific components and systems in handbooks for
planners and designers, respondents thought, that this solution can be very useful and can
reduce time and design costs, but only when it comes to simple buildings or projects that do
not have very specific requirements. However, in practice usually it is not like that. So, in
their opinion rather than having and using a handbook for planners and designers, it is more
important to have qualified partners that have experience with the project requirements
and construction conditions.
On the other hand, they see Building Information Modelling (BIM) as a way for defining and
using standard solutions for specific components and systems. To enable this, a database on
national or even European Union (EU) level would have to be established. With this, the
respondents believed that a typology of details and buildings can be created and be very
useful in the future, especially for bigger projects with MFH.
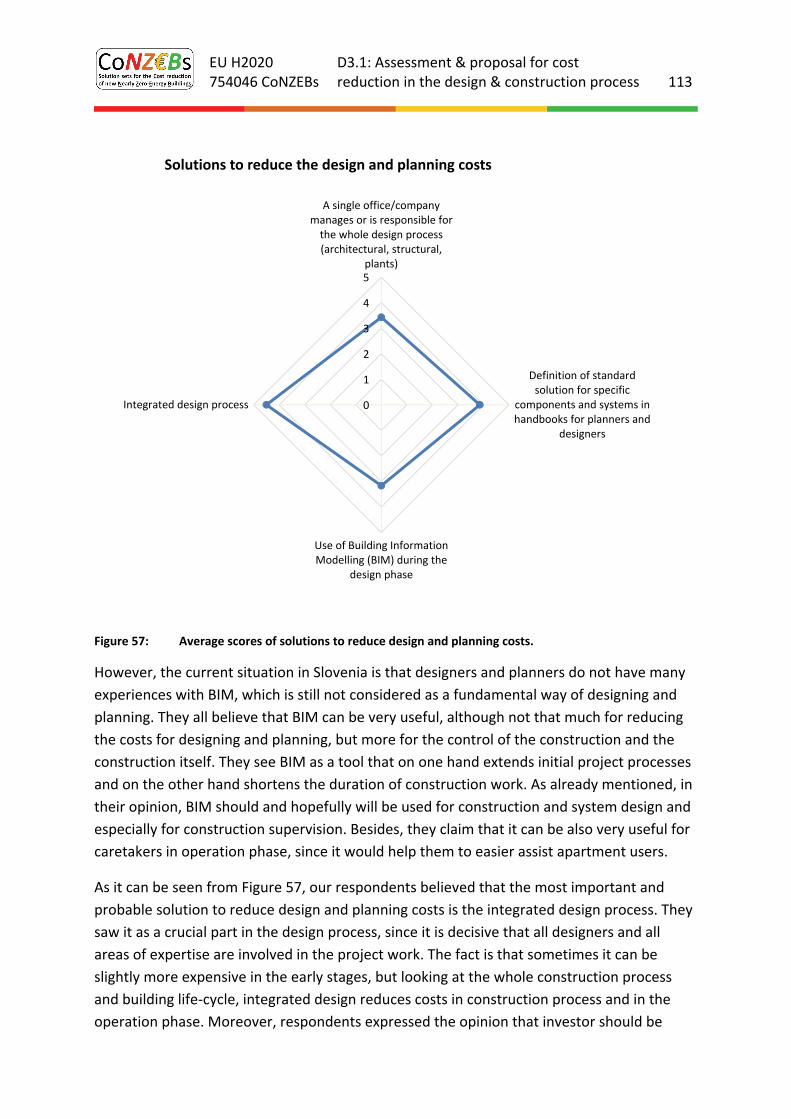
EU H2020 754046 CoNZEBs
D3.1: Assessment & proposal for cost reduction in the design & construction process 113
Figure 57: Average scores of solutions to reduce design and planning costs.
However, the current situation in Slovenia is that designers and planners do not have many
experiences with BIM, which is still not considered as a fundamental way of designing and
planning. They all believe that BIM can be very useful, although not that much for reducing
the costs for designing and planning, but more for the control of the construction and the
construction itself. They see BIM as a tool that on one hand extends initial project processes
and on the other hand shortens the duration of construction work. As already mentioned, in
their opinion, BIM should and hopefully will be used for construction and system design and
especially for construction supervision. Besides, they claim that it can be also very useful for
caretakers in operation phase, since it would help them to easier assist apartment users.
As it can be seen from Figure 57, our respondents believed that the most important and
probable solution to reduce design and planning costs is the integrated design process. They
saw it as a crucial part in the design process, since it is decisive that all designers and all
areas of expertise are involved in the project work. The fact is that sometimes it can be
slightly more expensive in the early stages, but looking at the whole construction process
and building life‐cycle, integrated design reduces costs in construction process and in the
operation phase. Moreover, respondents expressed the opinion that investor should be
0
1
2
3
4
5
A single office/companymanages or is responsible forthe whole design process(architectural, structural,
plants)
Definition of standardsolution for specific
components and systems inhandbooks for planners and
designers
Use of Building InformationModelling (BIM) during the
design phase
Integrated design process
Solutions to reduce the design and planning costs
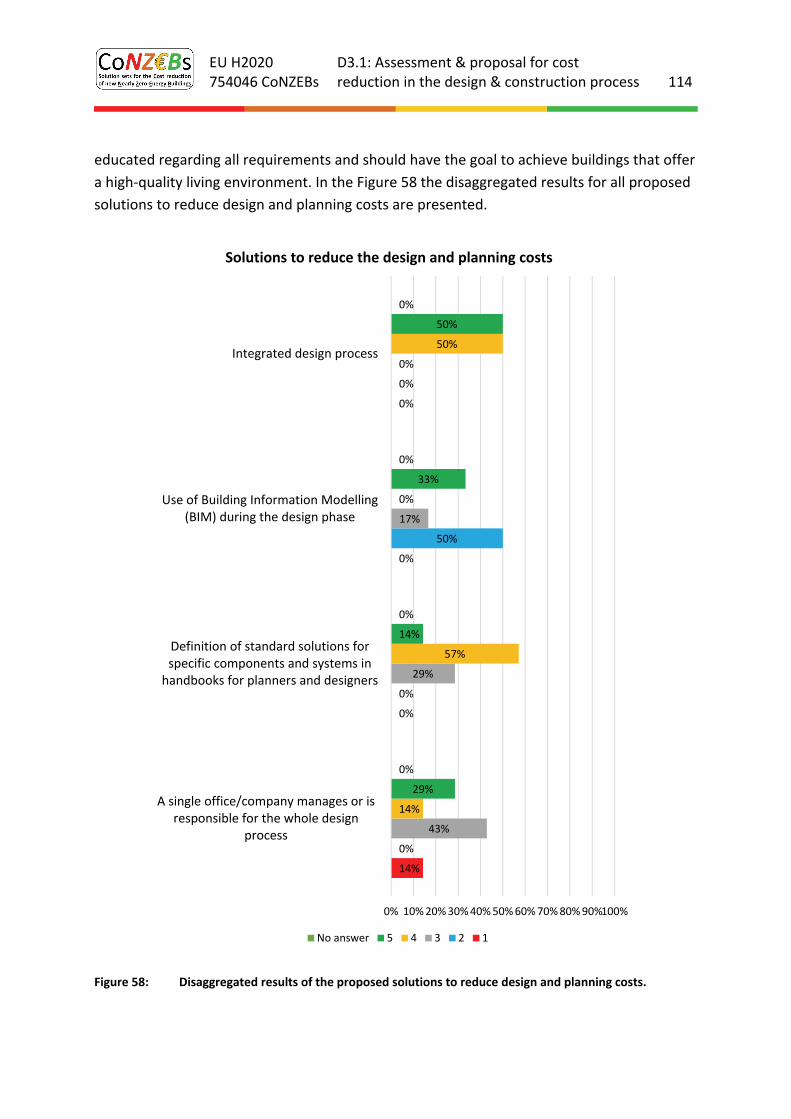
EU H2020 754046 CoNZEBs
D3.1: Assessment & proposal for cost reduction in the design & construction process 114
educated regarding all requirements and should have the goal to achieve buildings that offer
a high‐quality living environment. In the Figure 58 the disaggregated results for all proposed
solutions to reduce design and planning costs are presented.
Figure 58: Disaggregated results of the proposed solutions to reduce design and planning costs.
14%
0%
0%
0%
0%
0%
50%
0%
43%
29%
17%
0%
14%
57%
0%
50%
29%
14%
33%
50%
0%
0%
0%
0%
0% 10%20%30%40%50%60%70%80%90%100%
A single office/company manages or isresponsible for the whole design
process
Definition of standard solutions forspecific components and systems inhandbooks for planners and designers
Use of Building Information Modelling(BIM) during the design phase
Integrated design process
Solutions to reduce the design and planning costs
No answer 5 4 3 2 1
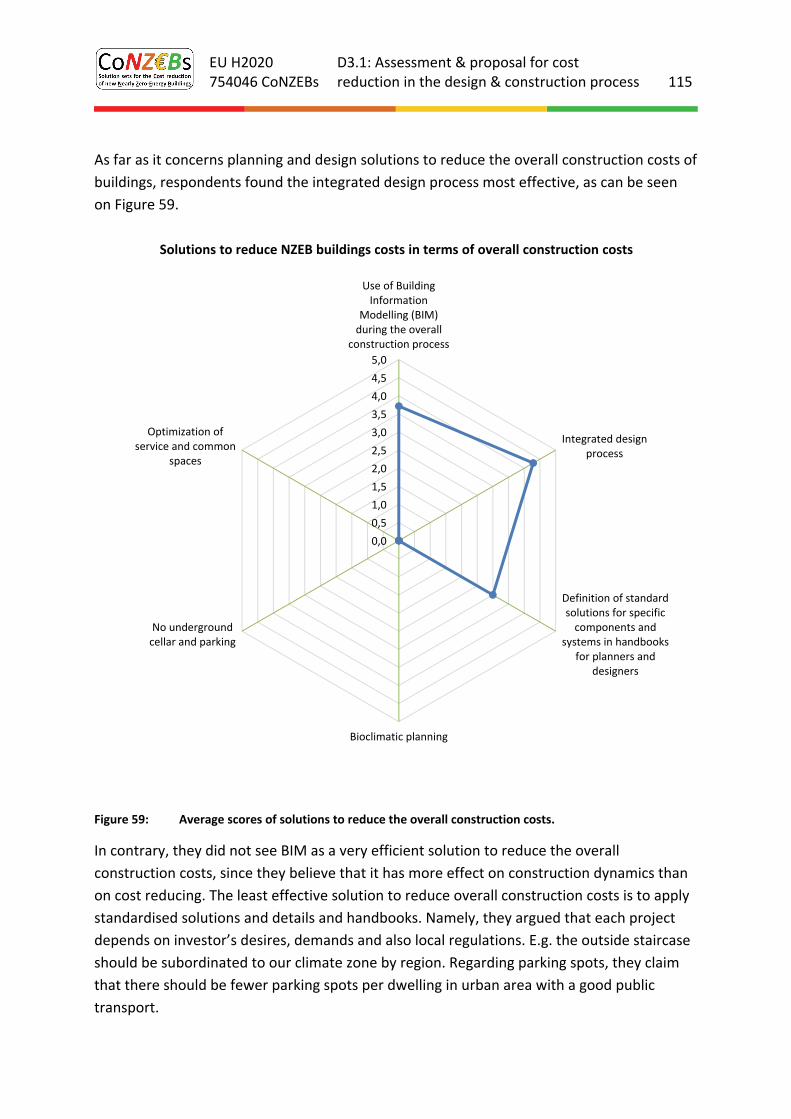
EU H2020 754046 CoNZEBs
D3.1: Assessment & proposal for cost reduction in the design & construction process 115
As far as it concerns planning and design solutions to reduce the overall construction costs of
buildings, respondents found the integrated design process most effective, as can be seen
on Figure 59.
Figure 59: Average scores of solutions to reduce the overall construction costs.
In contrary, they did not see BIM as a very efficient solution to reduce the overall
construction costs, since they believe that it has more effect on construction dynamics than
on cost reducing. The least effective solution to reduce overall construction costs is to apply
standardised solutions and details and handbooks. Namely, they argued that each project
depends on investor’s desires, demands and also local regulations. E.g. the outside staircase
should be subordinated to our climate zone by region. Regarding parking spots, they claim
that there should be fewer parking spots per dwelling in urban area with a good public
transport.
0,0
0,5
1,0
1,5
2,0
2,5
3,0
3,5
4,0
4,5
5,0
Use of BuildingInformation
Modelling (BIM)during the overall
construction process
Integrated designprocess
Definition of standardsolutions for specificcomponents and
systems in handbooksfor planners and
designers
Bioclimatic planning
No undergroundcellar and parking
Optimization ofservice and common
spaces
Solutions to reduce NZEB buildings costs in terms of overall construction costs
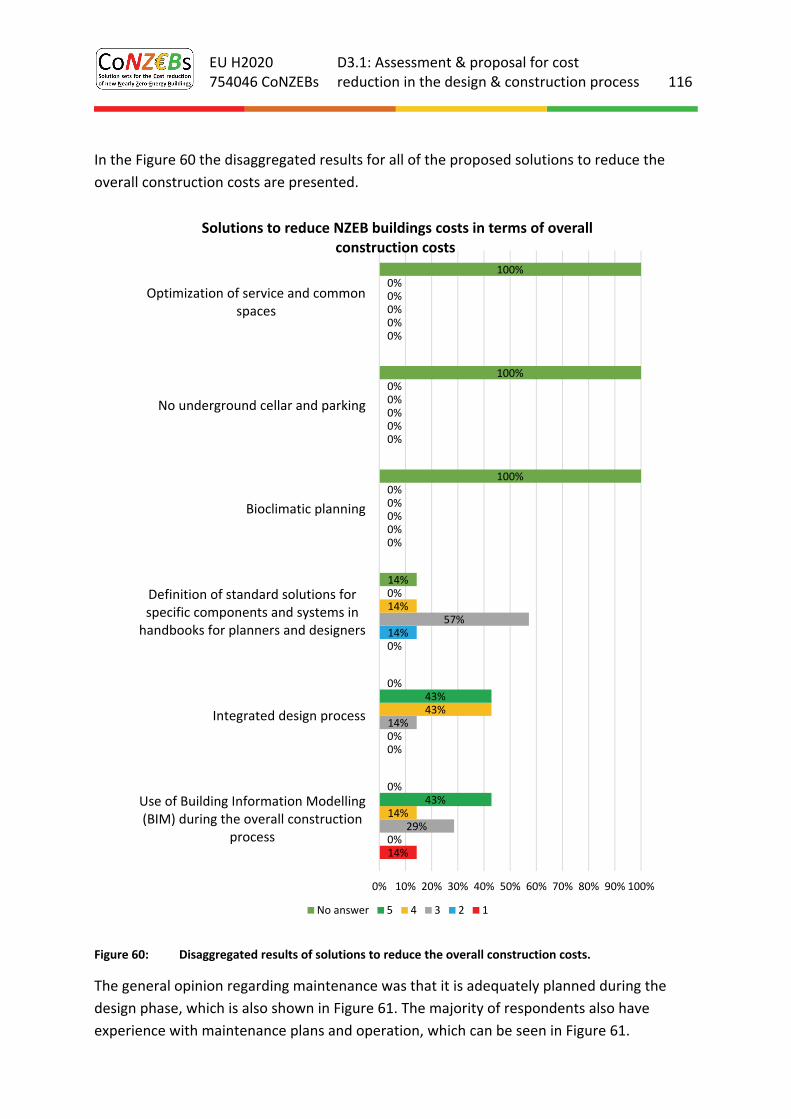
EU H2020 754046 CoNZEBs
D3.1: Assessment & proposal for cost reduction in the design & construction process 116
In the Figure 60 the disaggregated results for all of the proposed solutions to reduce the
overall construction costs are presented.
Figure 60: Disaggregated results of solutions to reduce the overall construction costs.
The general opinion regarding maintenance was that it is adequately planned during the
design phase, which is also shown in Figure 61. The majority of respondents also have
experience with maintenance plans and operation, which can be seen in Figure 61.
14%
0%
0%
0%
0%
0%
0%
0%
14%
0%
0%
0%
29%
14%
57%
0%
0%
0%
14%
43%
14%
0%
0%
0%
43%
43%
0%
0%
0%
0%
0%
0%
14%
100%
100%
100%
0% 10% 20% 30% 40% 50% 60% 70% 80% 90% 100%
Use of Building Information Modelling(BIM) during the overall construction
process
Integrated design process
Definition of standard solutions forspecific components and systems inhandbooks for planners and designers
Bioclimatic planning
No underground cellar and parking
Optimization of service and commonspaces
Solutions to reduce NZEB buildings costs in terms of overall construction costs
No answer 5 4 3 2 1
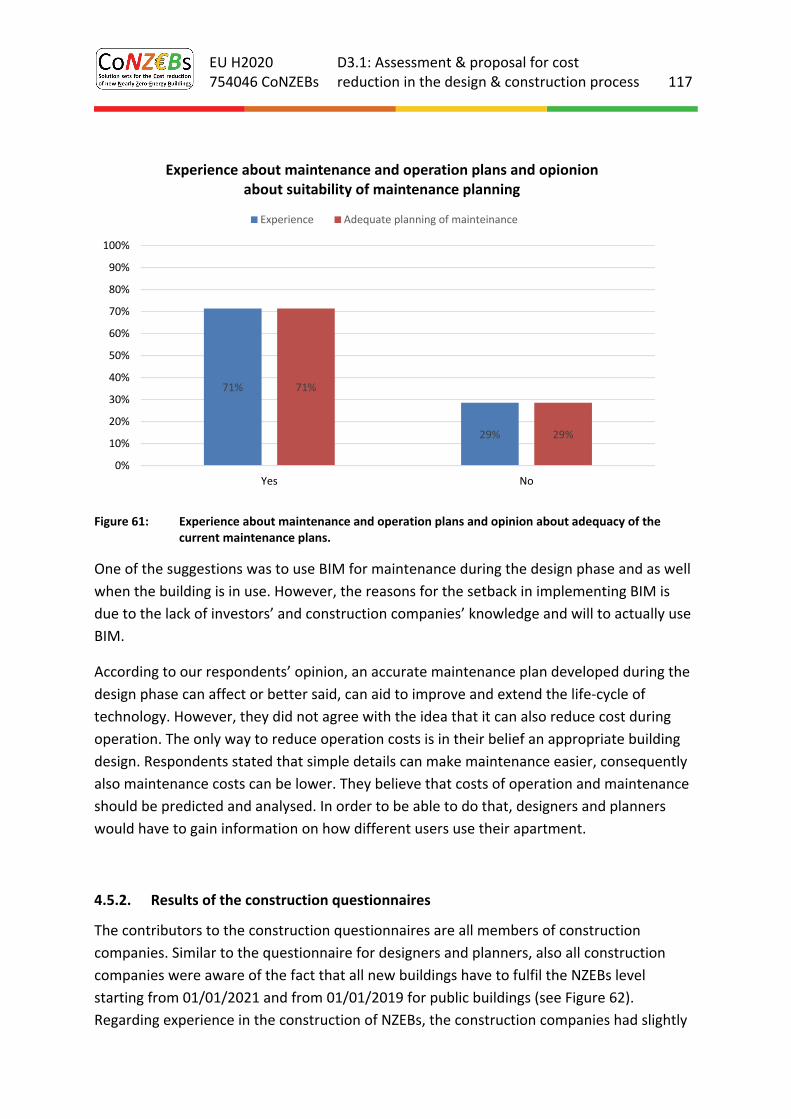
EU H2020 754046 CoNZEBs
D3.1: Assessment & proposal for cost reduction in the design & construction process 117
Figure 61: Experience about maintenance and operation plans and opinion about adequacy of the current maintenance plans.
One of the suggestions was to use BIM for maintenance during the design phase and as well
when the building is in use. However, the reasons for the setback in implementing BIM is
due to the lack of investors’ and construction companies’ knowledge and will to actually use
BIM.
According to our respondents’ opinion, an accurate maintenance plan developed during the
design phase can affect or better said, can aid to improve and extend the life‐cycle of
technology. However, they did not agree with the idea that it can also reduce cost during
operation. The only way to reduce operation costs is in their belief an appropriate building
design. Respondents stated that simple details can make maintenance easier, consequently
also maintenance costs can be lower. They believe that costs of operation and maintenance
should be predicted and analysed. In order to be able to do that, designers and planners
would have to gain information on how different users use their apartment.
4.5.2. Results of the construction questionnaires
The contributors to the construction questionnaires are all members of construction
companies. Similar to the questionnaire for designers and planners, also all construction
companies were aware of the fact that all new buildings have to fulfil the NZEBs level
starting from 01/01/2021 and from 01/01/2019 for public buildings (see Figure 62).
Regarding experience in the construction of NZEBs, the construction companies had slightly
71%
29%
71%
29%
0%
10%
20%
30%
40%
50%
60%
70%
80%
90%
100%
Yes No
Experience about maintenance and operation plans and opionion about suitability of maintenance planning
Experience Adequate planning of mainteinance
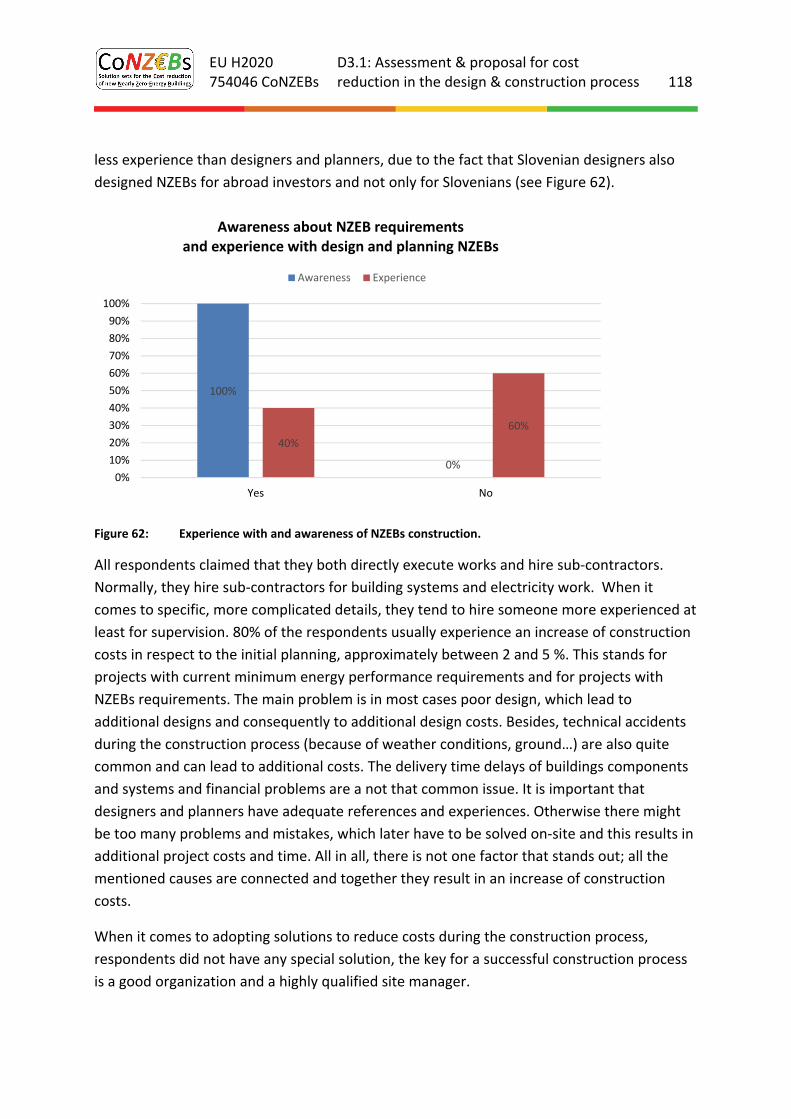
EU H2020 754046 CoNZEBs
D3.1: Assessment & proposal for cost reduction in the design & construction process 118
less experience than designers and planners, due to the fact that Slovenian designers also
designed NZEBs for abroad investors and not only for Slovenians (see Figure 62).
Figure 62: Experience with and awareness of NZEBs construction.
All respondents claimed that they both directly execute works and hire sub‐contractors.
Normally, they hire sub‐contractors for building systems and electricity work. When it
comes to specific, more complicated details, they tend to hire someone more experienced at
least for supervision. 80% of the respondents usually experience an increase of construction
costs in respect to the initial planning, approximately between 2 and 5 %. This stands for
projects with current minimum energy performance requirements and for projects with
NZEBs requirements. The main problem is in most cases poor design, which lead to
additional designs and consequently to additional design costs. Besides, technical accidents
during the construction process (because of weather conditions, ground…) are also quite
common and can lead to additional costs. The delivery time delays of buildings components
and systems and financial problems are a not that common issue. It is important that
designers and planners have adequate references and experiences. Otherwise there might
be too many problems and mistakes, which later have to be solved on‐site and this results in
additional project costs and time. All in all, there is not one factor that stands out; all the
mentioned causes are connected and together they result in an increase of construction
costs.
When it comes to adopting solutions to reduce costs during the construction process,
respondents did not have any special solution, the key for a successful construction process
is a good organization and a highly qualified site manager.
100%
0%
40%
60%
0%
10%
20%
30%
40%
50%
60%
70%
80%
90%
100%
Yes No
Awareness about NZEB requirements and experience with design and planning NZEBs
Awareness Experience
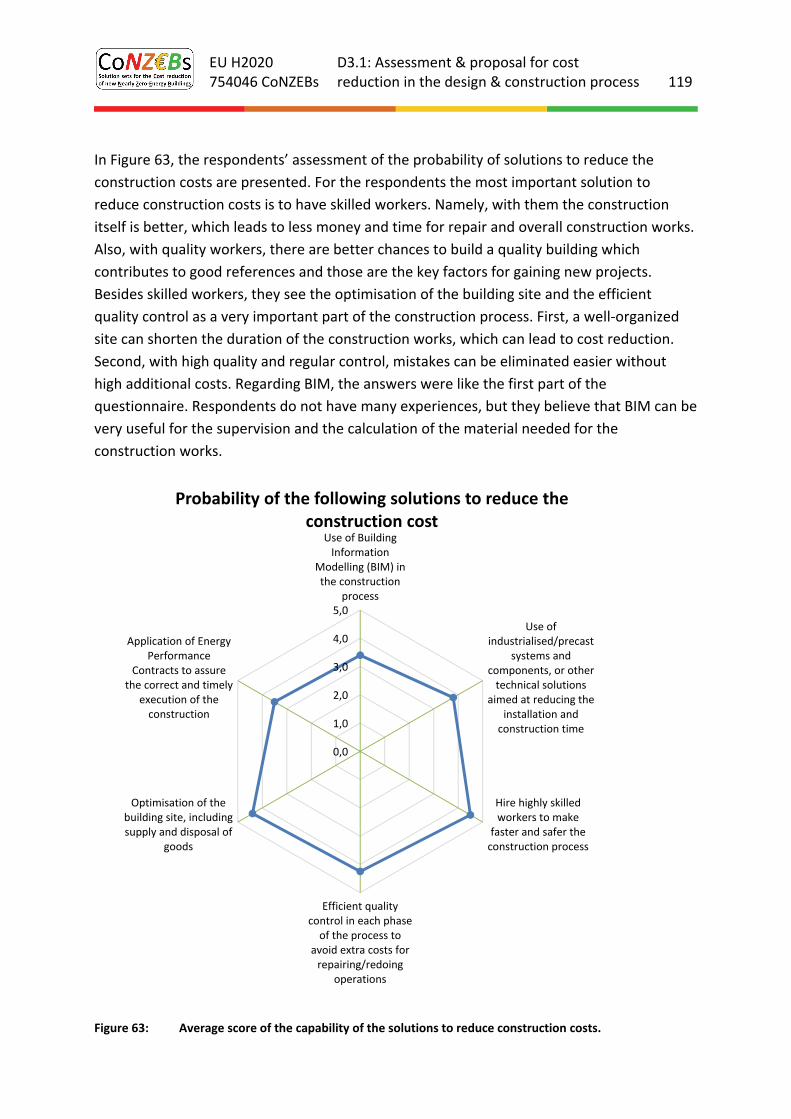
EU H2020 754046 CoNZEBs
D3.1: Assessment & proposal for cost reduction in the design & construction process 119
In Figure 63, the respondents’ assessment of the probability of solutions to reduce the
construction costs are presented. For the respondents the most important solution to
reduce construction costs is to have skilled workers. Namely, with them the construction
itself is better, which leads to less money and time for repair and overall construction works.
Also, with quality workers, there are better chances to build a quality building which
contributes to good references and those are the key factors for gaining new projects.
Besides skilled workers, they see the optimisation of the building site and the efficient
quality control as a very important part of the construction process. First, a well‐organized
site can shorten the duration of the construction works, which can lead to cost reduction.
Second, with high quality and regular control, mistakes can be eliminated easier without
high additional costs. Regarding BIM, the answers were like the first part of the
questionnaire. Respondents do not have many experiences, but they believe that BIM can be
very useful for the supervision and the calculation of the material needed for the
construction works.
Figure 63: Average score of the capability of the solutions to reduce construction costs.
0,0
1,0
2,0
3,0
4,0
5,0
Use of BuildingInformation
Modelling (BIM) inthe construction
process
Use ofindustrialised/precast
systems andcomponents, or othertechnical solutions
aimed at reducing theinstallation andconstruction time
Hire highly skilledworkers to make
faster and safer theconstruction process
Efficient qualitycontrol in each phaseof the process to
avoid extra costs forrepairing/redoing
operations
Optimisation of thebuilding site, includingsupply and disposal of
goods
Application of EnergyPerformance
Contracts to assurethe correct and timely
execution of theconstruction
Probability of the following solutions to reduce the construction cost
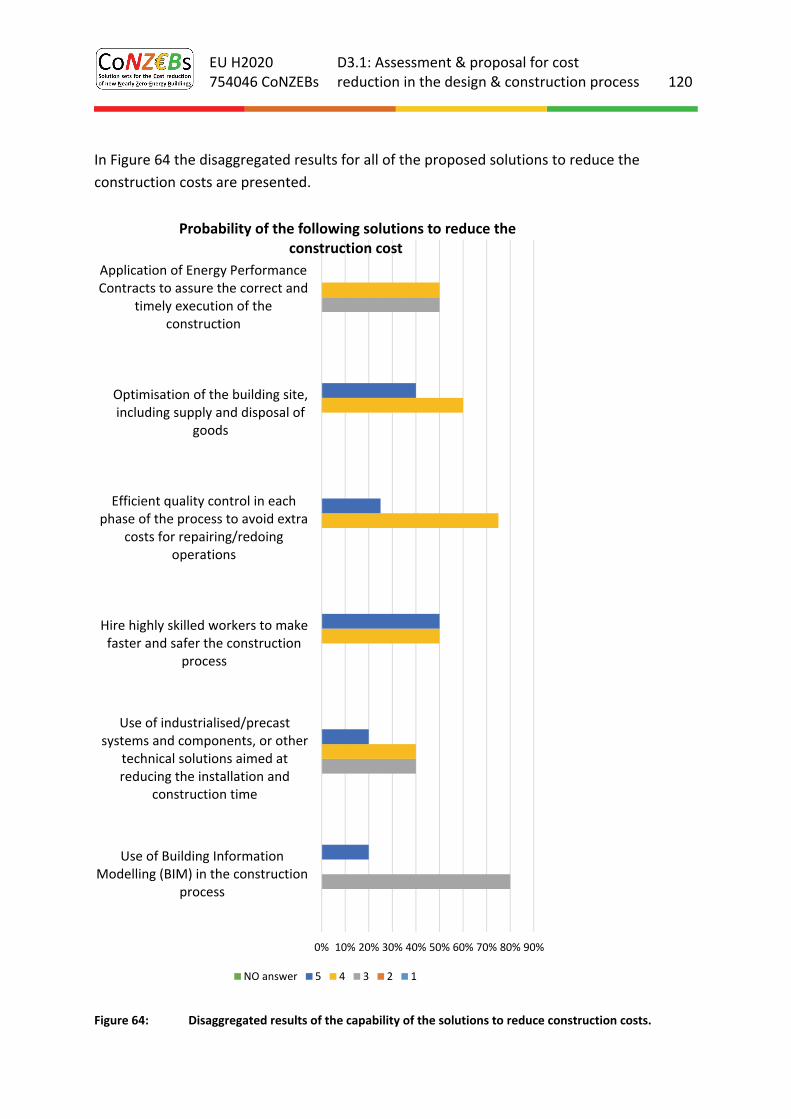
EU H2020 754046 CoNZEBs
D3.1: Assessment & proposal for cost reduction in the design & construction process 120
In Figure 64 the disaggregated results for all of the proposed solutions to reduce the
construction costs are presented.
Figure 64: Disaggregated results of the capability of the solutions to reduce construction costs.
0% 10% 20% 30% 40% 50% 60% 70% 80% 90%
Use of Building InformationModelling (BIM) in the construction
process
Use of industrialised/precastsystems and components, or other
technical solutions aimed atreducing the installation and
construction time
Hire highly skilled workers to makefaster and safer the construction
process
Efficient quality control in eachphase of the process to avoid extra
costs for repairing/redoingoperations
Optimisation of the building site,including supply and disposal of
goods
Application of Energy PerformanceContracts to assure the correct and
timely execution of theconstruction
Probability of the following solutions to reduce the construction cost
NO answer 5 4 3 2 1
EU H2020 754046 CoNZEBs
D3.1: Assessment & proposal for cost reduction in the design & construction process 121
4.6. Summary of the results of design and construction questionnaires in the four
countries
Analysing the results of the design and construction questionnaires in the participating
countries, the following general conclusions have been drawn.
From the design questionnaires, it emerged that contributors in all four countries are aware
and have experience in the design and planning of NZEBs. When asked to estimate the
fraction of design cost in respect to the overall construction costs of minimum energy
requirement buildings and NZEBs, the following percentages were found:
⌂ Italy: 7% for minimum energy requirement buildings and 9% for NZEBs (private and
social housing)
⌂ Denmark: 6 ‐ 9% for minimum energy requirement buildings and 10% for NZEBs
(private and social housing)
⌂ Germany: 24% for both minimum energy requirement buildings and NZEBs (private
and social housing)2
⌂ Slovenia: < 5% for minimum energy requirement buildings (private and social
housing); < 5% for NZEBs social housing and 6 ‐ 9% for private NZEBs.
Going into the details of the design process, in Italy, Slovenia and Denmark about half of the
contributors declared that their offers are not directly derived from the national regulations:
planning costs vary depending on the project (size, complexity etc.) and on the market
prices. In Germany on the contrary most of the contributors say the design costs are general
fixed through the HOAI (Honorarium Scale for Architects and Engineers).
Regarding the possibility of several proposed solutions to reduce planning costs, the most
efficient solution in all countries was the integrated project approach. Nevertheless,
comments provided by the respondents showed large disagreements within each country
regarding all proposed solutions. In Italy the least effective option was the definition of
standard packages and systems to support designers and planners: it was considered as a
limitation and could prevent designers to develop specific proposal for each project. On the
contrary in Germany and Slovenia, this solution was rated quite good since it would lead to a
simplification of the planning process. Additionally, in Italy, Denmark and Slovenia the use of
BIM didn’t seem yet to be the way to go. It was considered in general an innovative solution
but the feasibility to apply it now at large scale is still remote. In Slovenia, the opinion of the
2 This is considerably higher than described in chapter 2.3.1 where 13% were indicated as median design and planning costs in respect to the total building costs. We assume that the costs given by the questionnaire contributors are related to the building construction costs (German costs groups KG300 and KG400). These do not include for example the building plot, the infrastructure, etc. Accordingly the percentage of the design and planning costs are considerable higher. The questionnaire asked for design costs in relation to the total building costs, but in many cases the costs outside of KG300 and KG400 are not known to the designers.
EU H2020 754046 CoNZEBs
D3.1: Assessment & proposal for cost reduction in the design & construction process 122
interviewees was that BIM could be very useful, although not that much for reducing costs
for designing and planning, but more for control of construction and construction itself.
Regarding the capability of some solutions to reduce overall construction costs, in Denmark,
Slovenia and Italy the highest score was again achieved by the integrated design process
while the lowest score was given to the absence of underground cellars and parking. In
Germany it is the opposite: avoiding construction of underground cellars and parking is the
most rated option. It is worth to notice that in Italy also in this case there is a big divergence
of opinions about the possibility of bioclimatic planning and to reduce overall construction
costs: some contributors gave very positive comments about it, others considered them
either useless or even negative. In Slovenia the optimization of service and common spaces
and the bioclimatic planning were considered totally ineffective for overall cost reduction,
getting a score of 0.
All responding designers in the four countries had experience in maintenance plans but
thought that maintenance was not adequately planned. In Italy and Denmark, contributors
also provided percentages of the long‐term cost reduction achievable with an accurate
maintenance plan compared to the common maintenance plan for both minimum
requirements buildings and NZEBs: 24% and 22% for respectively NZEB and minimum energy
performance requirements buildings in Italy and 7% for both current minimum EP
requirements and NZEB buildings in Denmark.
Additional proposals given by the contributors for reducing planning costs were the
following:
⌂ Simple projects and reduction of requirements in buildings (i.e. fire protection or
airtightness)
⌂ Limiting creativity and preferring feasible and economic solutions
⌂ Strong leadership in the planning phase
⌂ Databases and libraries of elements and components updated and easily accessible
⌂ Database of prices of the components, in order to optimize choices during the design
phase
⌂ Good level of communication among the involved stakeholders
⌂ Very detailed projects in the design phase
⌂ Increase expertise (knowledge, skills and competences)
A few interviewed designers in Italy, Germany and Denmark also expressed their doubts in
the effectiveness of reducing planning costs at all. It was pointed out that savings in the
design phase frequently imply the risk of designing a poorer project, causing cost increase in
the construction and maintenance phases.

EU H2020 754046 CoNZEBs
D3.1: Assessment & proposal for cost reduction in the design & construction process 123
From the construction questionnaires, it emerged that all the companies were aware of
what an NZEB is and in Germany and Denmark all of them had experience with NZEB
constructions. Differently, in Italy and Slovenia only half of the respondents had built NZEBs
before, showing that the spreading of this type of buildings in these countries is still on‐
going. Construction companies were used to both execute works directly and hire
subcontractors in Italy and Denmark and Slovenia. In Germany they all hire subcontractors.
Respondents were asked if they had ever experienced decrease or increase of costs in
respect to the initial planning. The average value of cost increase provided by the
contributors for minimum energy performance requirement buildings are as follows:
⌂ Italy: 9%
⌂ Denmark: 8%
⌂ Germany: 6%
⌂ Slovenia: 2 ‐ 5%
while for NZEBs:
⌂ Italy: 10%
⌂ Denmark: 8%
⌂ Germany: 8%
⌂ Slovenia: 2 ‐ 5%
As it can be noticed, according to the opinion of the interviewed, cost variation is not strictly
related to the typology of the building.
Regarding the potential causes of construction costs increase in minimum energy
performance requirement buildings, in all the four countries the highest rated aspect was
poor design quality. It was also considered to be the most influencing parameter for NZEBs
in Slovenia, Italy and Germany. Differently in Denmark, the most relevant cause of cost
increase for NZEBs are financial problems. In Italy and Denmark two other aspects were
mentioned in the comments: the delays in the approvals of building permits and the missing
of clear targets by the builders.
The contributors were also asked to assess the probability of a set of solutions to reduce the
construction costs: the most quoted was the development of an efficient quality control in
all countries to avoid additional costs for repairs or re‐working steps. The use of
industrialised/precast systems and components was also considered to be of very high
importance. Finally, in Germany and Slovenia it was also fundamental to have skilled
workers for reducing mistakes and for having better chances to build a high‐quality building
which contributes to good references.
Additional proposals given by the contributors for reducing construction costs are the
following:
EU H2020 754046 CoNZEBs
D3.1: Assessment & proposal for cost reduction in the design & construction process 124
⌂ Improve the procedures of quality analysis
⌂ A better definition of all expenses and the timing before starting with the work
⌂ Create an internal technical office with a site manager that is able to deal promptly
with any problems
⌂ Use of prefabrication systems (10% construction cost savings)
⌂ Standardization of the solutions adopted (5% construction cost savings) and
industrialization
⌂ Simplify standards and regulations
⌂ Use of strategic cooperation involving designers and contractors
EU H2020 754046 CoNZEBs
D3.1: Assessment & proposal for cost reduction in the design & construction process 125
5. Exemplary solution to optimise the design and construction process
This section explores and demonstrates the potentials of specific solutions for reducing costs
in the design and construction process. While previous sections explored general approaches
as they are observed and evaluated by stakeholders, the present one provides exemplary
cases of process optimisation developed by the project partners, eventually with the
contribution of specific stakeholders. It is important to state that, according to this
approach, the proposed solutions can’t be considered of general validity, but mainly as
optimised answers for specific contexts. The final objective is, in fact, to show the existence
of different paths to achieve cost reduction, which need to be carefully addressed according
to several variables of the specific project.
The selected solutions include:
⌂ Technologies, which significantly affect the design and construction process, and may
be related to the building envelope, the energy systems or to renewable energy;
⌂ Design approaches, which ensure the same or an even better energy performance at
low construction costs. This section also includes technologies which affect the
design process;
⌂ Method and tools, which optimise the construction process and the construction
costs.
5.1. Reducing design and construction process cost with building envelope and
building system technologies
The construction of the building envelope is one of the most challenging phases because of
the associated costs and the related impact on the construction process. Concerning the
latter, the following aspects can be mentioned: duration of the building site with associated
management costs; strong dependence on the climatic conditions to execute works; impact
on all works successive to the completion of the building shell; impact on works interacting
with envelope components (e.g. piping running in vertical and horizontal components).
A crucial issue is to make the construction process faster and timely, since delays and
preliminaries can severely affect the construction costs. The industrialisation process in the
building sector positively affects the construction process, moving most part of the action
from the building site to the factory. Pre‐fabrication is a typical example, with heavy (the
whole facade) and light (pre‐fabricated elements dry mounted on the site) solutions that are
able to drastically reduce the construction process time and the duration of the building site
with all the related general costs. Such advanced solutions currently remain significantly
more expensive than conventional construction technologies [74].

EU H2020 754046 CoNZEBs
D3.1: Assessment & proposal for cost reduction in the design & construction process 126
However specific solutions that are able to reduce the construction time and thus, the
general cost related to the construction process, can be identified and compared versus
mainstream solutions. Quantitative examples, coming from the Italian and Danish market,
are presented and discussed in the following sections.
5.1.1. The case of large autoclaved concrete blocks in Italy
Large autoclaved blocks are manufactured using natural elements, mixed and then ripened;
the reaction taking place during the latter phase produce micro air bubbles, which remain
inside the concrete matrix, providing high insulation properties. The blocks have fixed length
and height (624x200 mm), while the depth can be varied (up to 480 mm) so that different
thermal transmittance values can be achieved by an external wall consisting of a single block
layer with internal and external finishing layers, see Figure 65. Thanks to the limited weight
and to ad‐hoc designed profiles, the blocks can be easily handled and put in place by
workers.
Figure 65: Example of construction works using autoclaved blocks. Courtesy of Xella Italia S.r.l.
To assess the impact on the construction process, this solution is compared with the
reference solution for vertical facades in Italian NZEBs, i.e. an internal layer of clay
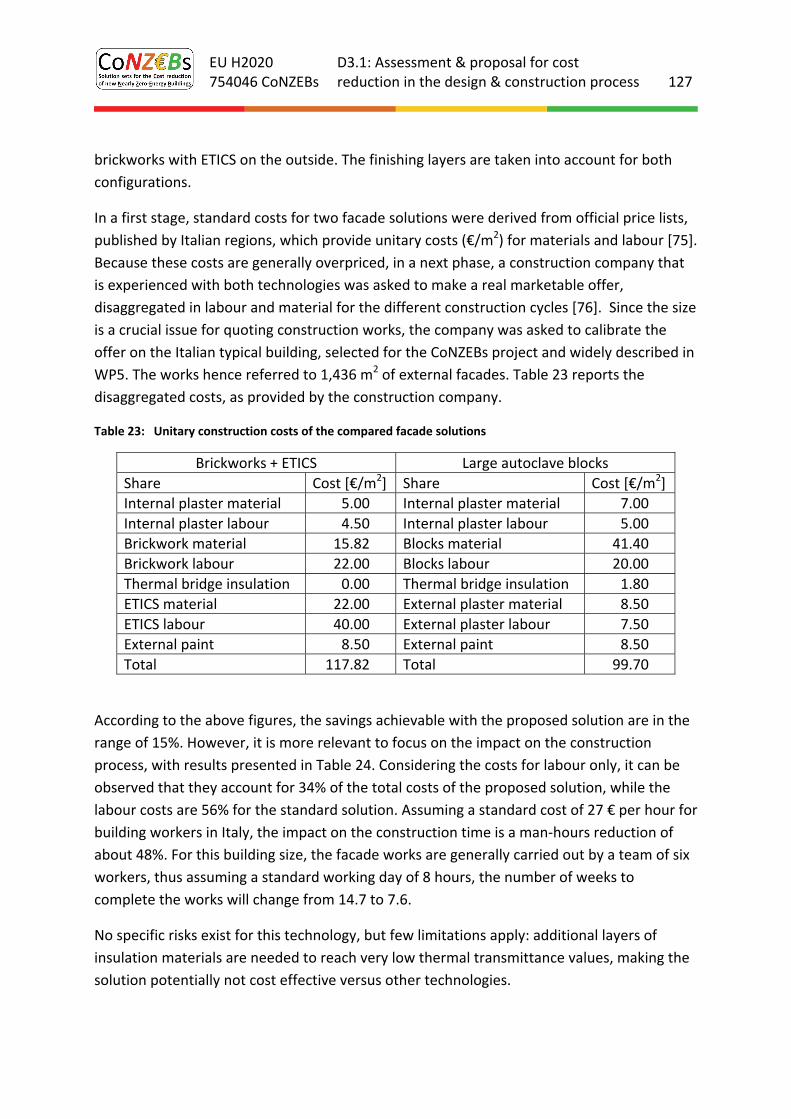
EU H2020 754046 CoNZEBs
D3.1: Assessment & proposal for cost reduction in the design & construction process 127
brickworks with ETICS on the outside. The finishing layers are taken into account for both
configurations.
In a first stage, standard costs for two facade solutions were derived from official price lists,
published by Italian regions, which provide unitary costs (€/m2) for materials and labour [75].
Because these costs are generally overpriced, in a next phase, a construction company that
is experienced with both technologies was asked to make a real marketable offer,
disaggregated in labour and material for the different construction cycles [76]. Since the size
is a crucial issue for quoting construction works, the company was asked to calibrate the
offer on the Italian typical building, selected for the CoNZEBs project and widely described in
WP5. The works hence referred to 1,436 m2 of external facades. Table 23 reports the
disaggregated costs, as provided by the construction company.
Table 23: Unitary construction costs of the compared facade solutions
Brickworks + ETICS Large autoclave blocks
Share Cost [€/m2] Share Cost [€/m2]
Internal plaster material 5.00 Internal plaster material 7.00
Internal plaster labour 4.50 Internal plaster labour 5.00
Brickwork material 15.82 Blocks material 41.40
Brickwork labour 22.00 Blocks labour 20.00
Thermal bridge insulation 0.00 Thermal bridge insulation 1.80
ETICS material 22.00 External plaster material 8.50
ETICS labour 40.00 External plaster labour 7.50
External paint 8.50 External paint 8.50
Total 117.82 Total 99.70
According to the above figures, the savings achievable with the proposed solution are in the
range of 15%. However, it is more relevant to focus on the impact on the construction
process, with results presented in Table 24. Considering the costs for labour only, it can be
observed that they account for 34% of the total costs of the proposed solution, while the
labour costs are 56% for the standard solution. Assuming a standard cost of 27 € per hour for
building workers in Italy, the impact on the construction time is a man‐hours reduction of
about 48%. For this building size, the facade works are generally carried out by a team of six
workers, thus assuming a standard working day of 8 hours, the number of weeks to
complete the works will change from 14.7 to 7.6.
No specific risks exist for this technology, but few limitations apply: additional layers of
insulation materials are needed to reach very low thermal transmittance values, making the
solution potentially not cost effective versus other technologies.

EU H2020 754046 CoNZEBs
D3.1: Assessment & proposal for cost reduction in the design & construction process 128
Table 24: Total costs and construction time for the Italian typical building with two construction types.
Characteristics Unit Brickworks + ETICS Large autoclave blocks
Total costs € 169,189 143,170
Total labour costs € 95,494 49,255
Ratio of labour costs in comparison with total costs
% 56 34
Man hours h 3537 1824
Construction phase day 73 38
5.1.2. The case of mono‐block windows in Italy
Italian windows for residential applications are always equipped with subframe or roller
shutters, used for safety and solar protection. Roller shutters are generally cheaper than
casement and more often used for multi‐family houses, especially for social housing.
Standard windows generally consist of: a subframe, mounted on the hole of the façade; the
shutter box, placed above the window; and the window itself. The market is quickly moving
towards simplification of the construction process: many companies sell mono‐block
windows, in which the window and the shutter box are produced as a single piece in factory.
However, the construction phase remains one of the most time consuming: masonry works
for the hole, treatment of thermal bridges, installation of the reveal, drying of wet materials,
installation of the remaining window. In this phase also workers with several different skills
are required and the windows' supplier has to organise shipping at different stages: first
subframe mounted by masonry workers, then windows mounted by specialised workers.
Figure 66: Example of mono‐block window. Left the hole in the wall without subframe, right the window
installed. Courtesy of Alpacom S.r.l.
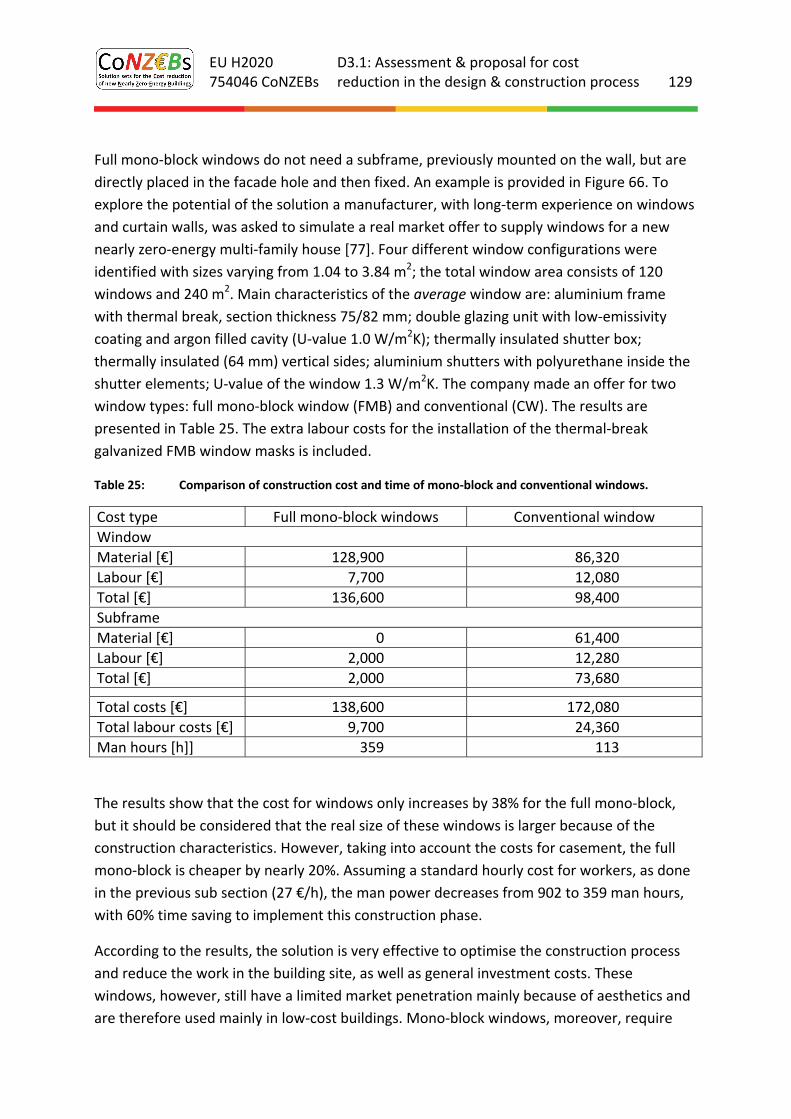
EU H2020 754046 CoNZEBs
D3.1: Assessment & proposal for cost reduction in the design & construction process 129
Full mono‐block windows do not need a subframe, previously mounted on the wall, but are
directly placed in the facade hole and then fixed. An example is provided in Figure 66. To
explore the potential of the solution a manufacturer, with long‐term experience on windows
and curtain walls, was asked to simulate a real market offer to supply windows for a new
nearly zero‐energy multi‐family house [77]. Four different window configurations were
identified with sizes varying from 1.04 to 3.84 m2; the total window area consists of 120
windows and 240 m2. Main characteristics of the average window are: aluminium frame
with thermal break, section thickness 75/82 mm; double glazing unit with low‐emissivity
coating and argon filled cavity (U‐value 1.0 W/m2K); thermally insulated shutter box;
thermally insulated (64 mm) vertical sides; aluminium shutters with polyurethane inside the
shutter elements; U‐value of the window 1.3 W/m2K. The company made an offer for two
window types: full mono‐block window (FMB) and conventional (CW). The results are
presented in Table 25. The extra labour costs for the installation of the thermal‐break
galvanized FMB window masks is included.
Table 25: Comparison of construction cost and time of mono‐block and conventional windows.
Cost type Full mono‐block windows Conventional window
Window
Material [€] 128,900 86,320
Labour [€] 7,700 12,080
Total [€] 136,600 98,400
Subframe
Material [€] 0 61,400
Labour [€] 2,000 12,280
Total [€] 2,000 73,680
Total costs [€] 138,600 172,080
Total labour costs [€] 9,700 24,360
Man hours [h]] 359 113
The results show that the cost for windows only increases by 38% for the full mono‐block,
but it should be considered that the real size of these windows is larger because of the
construction characteristics. However, taking into account the costs for casement, the full
mono‐block is cheaper by nearly 20%. Assuming a standard hourly cost for workers, as done
in the previous sub section (27 €/h), the man power decreases from 902 to 359 man hours,
with 60% time saving to implement this construction phase.
According to the results, the solution is very effective to optimise the construction process
and reduce the work in the building site, as well as general investment costs. These
windows, however, still have a limited market penetration mainly because of aesthetics and
are therefore used mainly in low‐cost buildings. Mono‐block windows, moreover, require
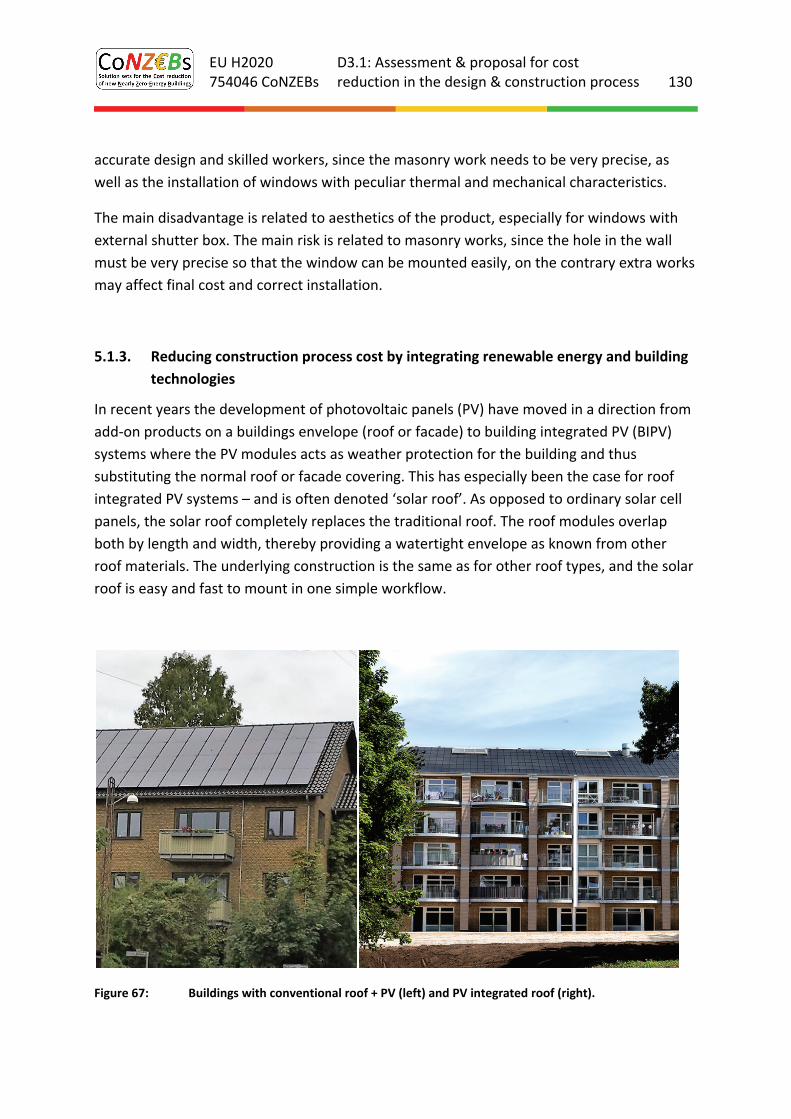
EU H2020 754046 CoNZEBs
D3.1: Assessment & proposal for cost reduction in the design & construction process 130
accurate design and skilled workers, since the masonry work needs to be very precise, as
well as the installation of windows with peculiar thermal and mechanical characteristics.
The main disadvantage is related to aesthetics of the product, especially for windows with
external shutter box. The main risk is related to masonry works, since the hole in the wall
must be very precise so that the window can be mounted easily, on the contrary extra works
may affect final cost and correct installation.
5.1.3. Reducing construction process cost by integrating renewable energy and building
technologies
In recent years the development of photovoltaic panels (PV) have moved in a direction from
add‐on products on a buildings envelope (roof or facade) to building integrated PV (BIPV)
systems where the PV modules acts as weather protection for the building and thus
substituting the normal roof or facade covering. This has especially been the case for roof
integrated PV systems – and is often denoted ‘solar roof’. As opposed to ordinary solar cell
panels, the solar roof completely replaces the traditional roof. The roof modules overlap
both by length and width, thereby providing a watertight envelope as known from other
roof materials. The underlying construction is the same as for other roof types, and the solar
roof is easy and fast to mount in one simple workflow.
Figure 67: Buildings with conventional roof + PV (left) and PV integrated roof (right).
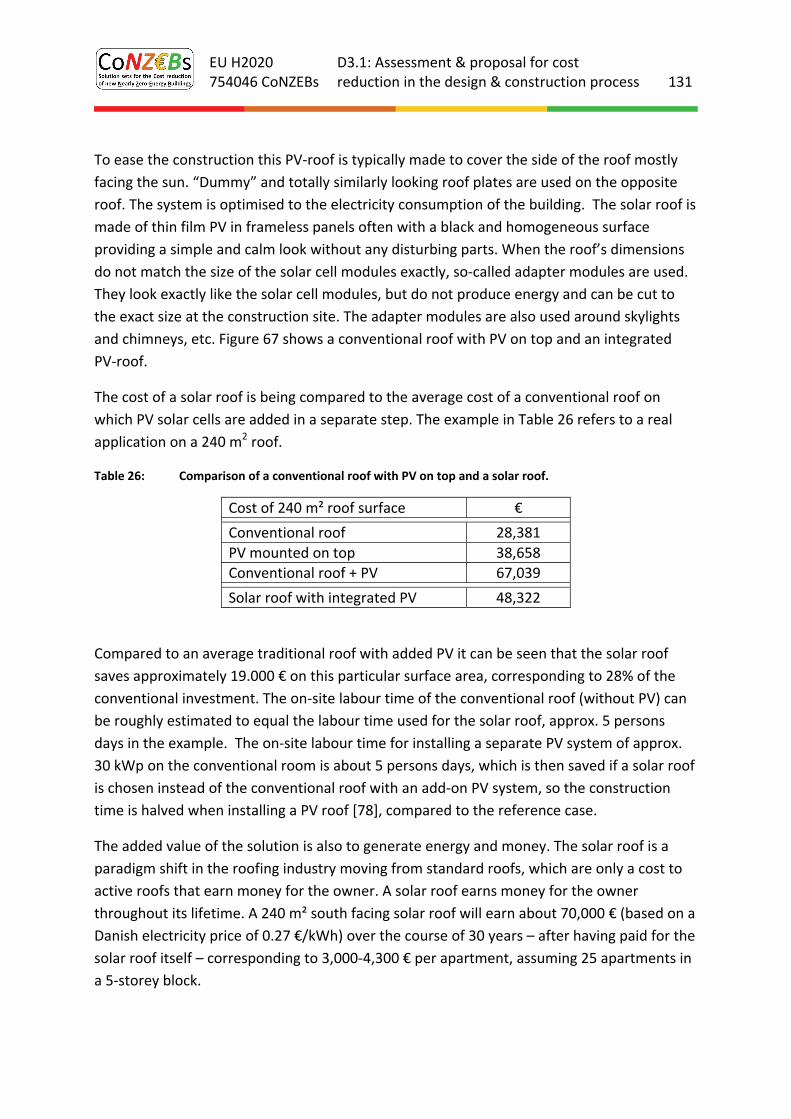
EU H2020 754046 CoNZEBs
D3.1: Assessment & proposal for cost reduction in the design & construction process 131
To ease the construction this PV‐roof is typically made to cover the side of the roof mostly
facing the sun. “Dummy” and totally similarly looking roof plates are used on the opposite
roof. The system is optimised to the electricity consumption of the building. The solar roof is
made of thin film PV in frameless panels often with a black and homogeneous surface
providing a simple and calm look without any disturbing parts. When the roof’s dimensions
do not match the size of the solar cell modules exactly, so‐called adapter modules are used.
They look exactly like the solar cell modules, but do not produce energy and can be cut to
the exact size at the construction site. The adapter modules are also used around skylights
and chimneys, etc. Figure 67 shows a conventional roof with PV on top and an integrated
PV‐roof.
The cost of a solar roof is being compared to the average cost of a conventional roof on
which PV solar cells are added in a separate step. The example in Table 26 refers to a real
application on a 240 m2 roof.
Table 26: Comparison of a conventional roof with PV on top and a solar roof.
Cost of 240 m² roof surface €
Conventional roof 28,381
PV mounted on top 38,658
Conventional roof + PV 67,039
Solar roof with integrated PV 48,322
Compared to an average traditional roof with added PV it can be seen that the solar roof
saves approximately 19.000 € on this particular surface area, corresponding to 28% of the
conventional investment. The on‐site labour time of the conventional roof (without PV) can
be roughly estimated to equal the labour time used for the solar roof, approx. 5 persons
days in the example. The on‐site labour time for installing a separate PV system of approx.
30 kWp on the conventional room is about 5 persons days, which is then saved if a solar roof
is chosen instead of the conventional roof with an add‐on PV system, so the construction
time is halved when installing a PV roof [78], compared to the reference case.
The added value of the solution is also to generate energy and money. The solar roof is a
paradigm shift in the roofing industry moving from standard roofs, which are only a cost to
active roofs that earn money for the owner. A solar roof earns money for the owner
throughout its lifetime. A 240 m² south facing solar roof will earn about 70,000 € (based on a
Danish electricity price of 0.27 €/kWh) over the course of 30 years – after having paid for the
solar roof itself – corresponding to 3,000‐4,300 € per apartment, assuming 25 apartments in
a 5‐storey block.
EU H2020 754046 CoNZEBs
D3.1: Assessment & proposal for cost reduction in the design & construction process 132
If a building just meet the energy performance requirements due to local electricity
production from a solar roof (or a conventional PV installation) and the electrical yield
declines, the building may not be in compliance with the building regulation any longer and
the PV will thus require replacement/repair. Due to decay of the electricity production, a
solar roof needs replacement more frequent than a traditional roof to be able to keep up
production.
5.1.4. Hygro‐sensible ventilation
Hygro‐sensible (H‐SV) ventilation is a system of controlled forced ventilation for multi‐family
buildings. The flow of forced ventilation is regulated by materials that react to the relative
indoor humidity: when the rooms are empty, the flow is minimal (0.2 exchanges per hour);
when people are in the premises, the flow increases to the optimum (0.5 to 0.8 exchanges
per hour). The air comes to the living space through special rosettes with a hygroscopic tape.
The used air leaves the living space through slots in or under the door and continues the way
to the sanitary facilities and the kitchen, where fans blow it out. An example is shown in
Figure 68. Hygro‐sensible ventilation doesn’t have heat recovery but controls the air
exchange rate. Therefore, in comparison with mechanical ventilation with heat recovery the
energy savings are lower.
The main advantage is the lower investment costs at a moderate increase of operation
(space heating) costs, comparing to the mechanical ventilation with heat recovery (MVHR).
The mechanical ventilation with heat recovery is approximately three times more expensive
than a hygro‐sensible ventilation system, because of a more complex equipment, pipes and
ducts. Besides the investment, also the labour costs for the installation are higher for the
mechanical ventilation with heat recovery.
Table 27 shows the comparison of ventilation system investment cost, installation time,
labour costs and also electricity usage and operational costs, which were calculated for the
Slovenian reference building described in work package 5.
The mechanical ventilation with heat recovery can be also more expensive than the hygro‐
sensible ventilation system on a long run, due to higher maintenance costs, filter change and
higher energy demand for its operation. Besides, the design of the mechanical ventilation
system with heat recovery is more complex, which presumably leads to higher design costs.
In any case the hygro‐sensible ventilation reduces costs due to ventilation heat losses
comparing to the natural ventilation.
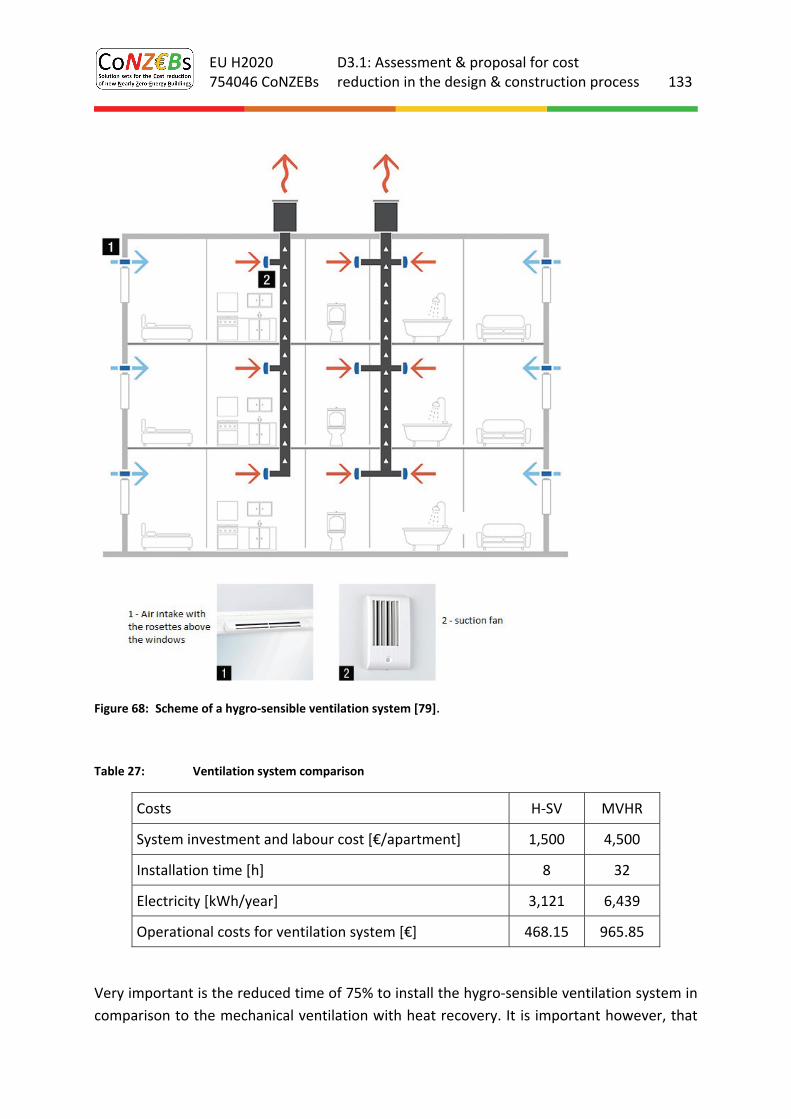
EU H2020 754046 CoNZEBs
D3.1: Assessment & proposal for cost reduction in the design & construction process 133
Figure 68: Scheme of a hygro‐sensible ventilation system [79].
Table 27: Ventilation system comparison
Costs H‐SV MVHR
System investment and labour cost [€/apartment] 1,500 4,500
Installation time [h] 8 32
Electricity [kWh/year] 3,121 6,439
Operational costs for ventilation system [€] 468.15 965.85
Very important is the reduced time of 75% to install the hygro‐sensible ventilation system in
comparison to the mechanical ventilation with heat recovery. It is important however, that
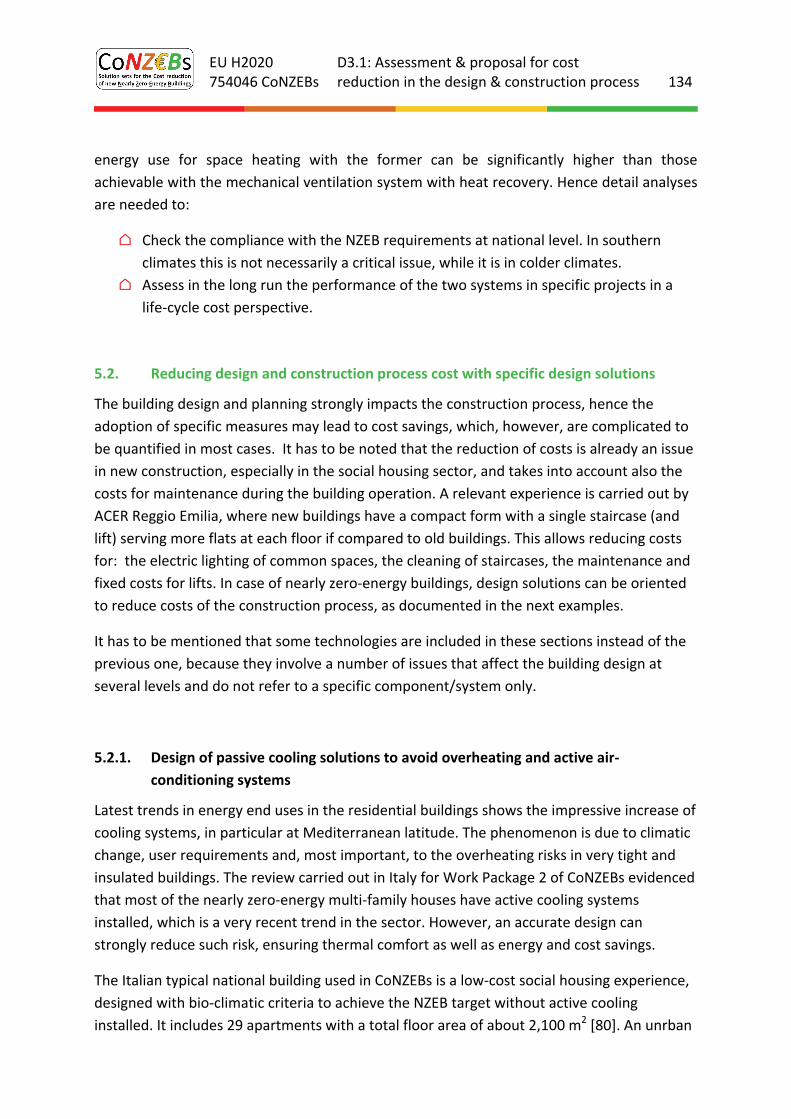
EU H2020 754046 CoNZEBs
D3.1: Assessment & proposal for cost reduction in the design & construction process 134
energy use for space heating with the former can be significantly higher than those
achievable with the mechanical ventilation system with heat recovery. Hence detail analyses
are needed to:
⌂ Check the compliance with the NZEB requirements at national level. In southern
climates this is not necessarily a critical issue, while it is in colder climates.
⌂ Assess in the long run the performance of the two systems in specific projects in a
life‐cycle cost perspective.
5.2. Reducing design and construction process cost with specific design solutions
The building design and planning strongly impacts the construction process, hence the
adoption of specific measures may lead to cost savings, which, however, are complicated to
be quantified in most cases. It has to be noted that the reduction of costs is already an issue
in new construction, especially in the social housing sector, and takes into account also the
costs for maintenance during the building operation. A relevant experience is carried out by
ACER Reggio Emilia, where new buildings have a compact form with a single staircase (and
lift) serving more flats at each floor if compared to old buildings. This allows reducing costs
for: the electric lighting of common spaces, the cleaning of staircases, the maintenance and
fixed costs for lifts. In case of nearly zero‐energy buildings, design solutions can be oriented
to reduce costs of the construction process, as documented in the next examples.
It has to be mentioned that some technologies are included in these sections instead of the
previous one, because they involve a number of issues that affect the building design at
several levels and do not refer to a specific component/system only.
5.2.1. Design of passive cooling solutions to avoid overheating and active air‐
conditioning systems
Latest trends in energy end uses in the residential buildings shows the impressive increase of
cooling systems, in particular at Mediterranean latitude. The phenomenon is due to climatic
change, user requirements and, most important, to the overheating risks in very tight and
insulated buildings. The review carried out in Italy for Work Package 2 of CoNZEBs evidenced
that most of the nearly zero‐energy multi‐family houses have active cooling systems
installed, which is a very recent trend in the sector. However, an accurate design can
strongly reduce such risk, ensuring thermal comfort as well as energy and cost savings.
The Italian typical national building used in CoNZEBs is a low‐cost social housing experience,
designed with bio‐climatic criteria to achieve the NZEB target without active cooling
installed. It includes 29 apartments with a total floor area of about 2,100 m2 [80]. An unrban
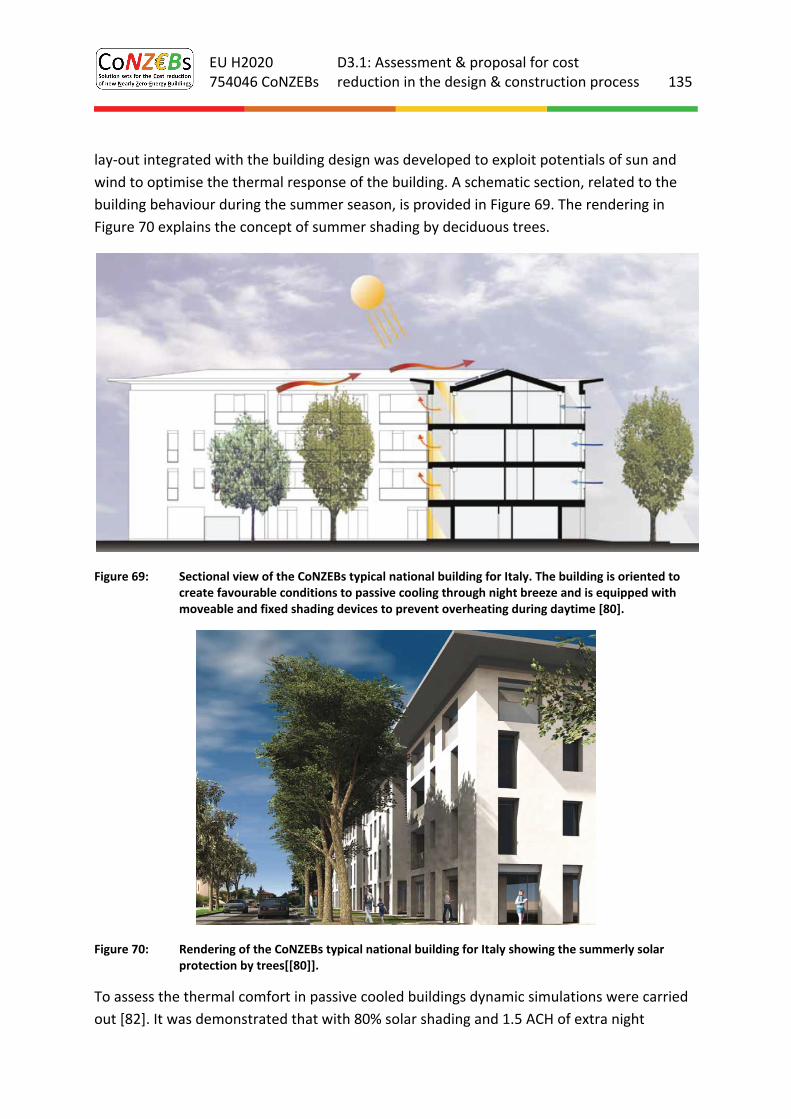
EU H2020 754046 CoNZEBs
D3.1: Assessment & proposal for cost reduction in the design & construction process 135
lay‐out integrated with the building design was developed to exploit potentials of sun and
wind to optimise the thermal response of the building. A schematic section, related to the
building behaviour during the summer season, is provided in Figure 69. The rendering in
Figure 70 explains the concept of summer shading by deciduous trees.
Figure 69: Sectional view of the CoNZEBs typical national building for Italy. The building is oriented to create favourable conditions to passive cooling through night breeze and is equipped with moveable and fixed shading devices to prevent overheating during daytime [80].
Figure 70: Rendering of the CoNZEBs typical national building for Italy showing the summerly solar protection by trees[[80]].
To assess the thermal comfort in passive cooled buildings dynamic simulations were carried
out [82]. It was demonstrated that with 80% solar shading and 1.5 ACH of extra night
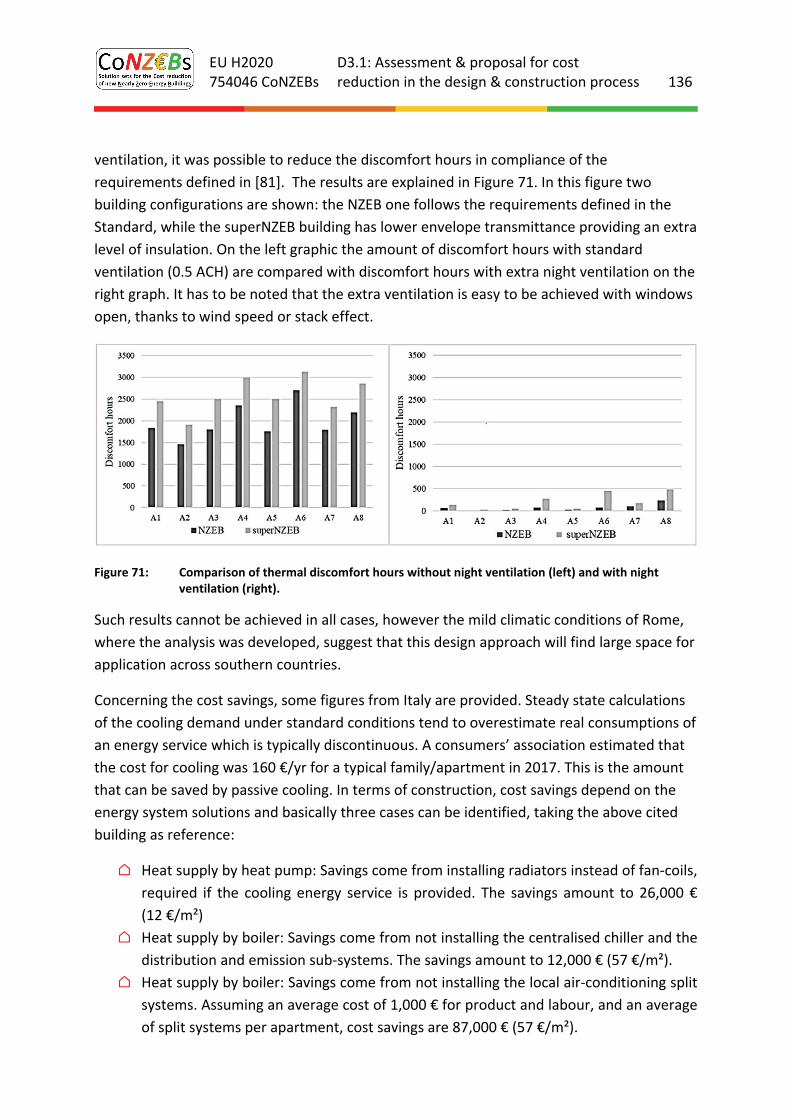
EU H2020 754046 CoNZEBs
D3.1: Assessment & proposal for cost reduction in the design & construction process 136
ventilation, it was possible to reduce the discomfort hours in compliance of the
requirements defined in [81]. The results are explained in Figure 71. In this figure two
building configurations are shown: the NZEB one follows the requirements defined in the
Standard, while the superNZEB building has lower envelope transmittance providing an extra
level of insulation. On the left graphic the amount of discomfort hours with standard
ventilation (0.5 ACH) are compared with discomfort hours with extra night ventilation on the
right graph. It has to be noted that the extra ventilation is easy to be achieved with windows
open, thanks to wind speed or stack effect.
Figure 71: Comparison of thermal discomfort hours without night ventilation (left) and with night ventilation (right).
Such results cannot be achieved in all cases, however the mild climatic conditions of Rome,
where the analysis was developed, suggest that this design approach will find large space for
application across southern countries.
Concerning the cost savings, some figures from Italy are provided. Steady state calculations
of the cooling demand under standard conditions tend to overestimate real consumptions of
an energy service which is typically discontinuous. A consumers’ association estimated that
the cost for cooling was 160 €/yr for a typical family/apartment in 2017. This is the amount
that can be saved by passive cooling. In terms of construction, cost savings depend on the
energy system solutions and basically three cases can be identified, taking the above cited
building as reference:
⌂ Heat supply by heat pump: Savings come from installing radiators instead of fan‐coils,
required if the cooling energy service is provided. The savings amount to 26,000 €
(12 €/m²)
⌂ Heat supply by boiler: Savings come from not installing the centralised chiller and the
distribution and emission sub‐systems. The savings amount to 12,000 € (57 €/m²).
⌂ Heat supply by boiler: Savings come from not installing the local air‐conditioning split
systems. Assuming an average cost of 1,000 € for product and labour, and an average
of split systems per apartment, cost savings are 87,000 € (57 €/m²).
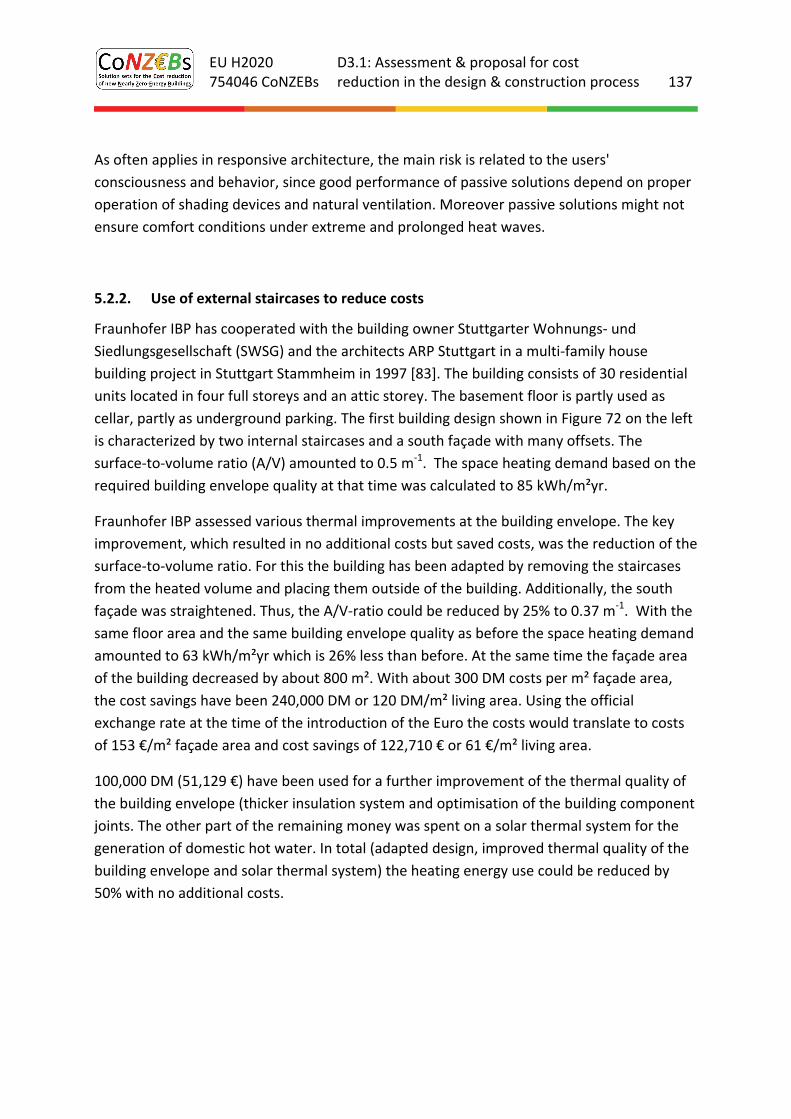
EU H2020 754046 CoNZEBs
D3.1: Assessment & proposal for cost reduction in the design & construction process 137
As often applies in responsive architecture, the main risk is related to the users'
consciousness and behavior, since good performance of passive solutions depend on proper
operation of shading devices and natural ventilation. Moreover passive solutions might not
ensure comfort conditions under extreme and prolonged heat waves.
5.2.2. Use of external staircases to reduce costs
Fraunhofer IBP has cooperated with the building owner Stuttgarter Wohnungs‐ und
Siedlungsgesellschaft (SWSG) and the architects ARP Stuttgart in a multi‐family house
building project in Stuttgart Stammheim in 1997 [83]. The building consists of 30 residential
units located in four full storeys and an attic storey. The basement floor is partly used as
cellar, partly as underground parking. The first building design shown in Figure 72 on the left
is characterized by two internal staircases and a south façade with many offsets. The
surface‐to‐volume ratio (A/V) amounted to 0.5 m‐1. The space heating demand based on the
required building envelope quality at that time was calculated to 85 kWh/m²yr.
Fraunhofer IBP assessed various thermal improvements at the building envelope. The key
improvement, which resulted in no additional costs but saved costs, was the reduction of the
surface‐to‐volume ratio. For this the building has been adapted by removing the staircases
from the heated volume and placing them outside of the building. Additionally, the south
façade was straightened. Thus, the A/V‐ratio could be reduced by 25% to 0.37 m‐1. With the
same floor area and the same building envelope quality as before the space heating demand
amounted to 63 kWh/m²yr which is 26% less than before. At the same time the façade area
of the building decreased by about 800 m². With about 300 DM costs per m² façade area,
the cost savings have been 240,000 DM or 120 DM/m² living area. Using the official
exchange rate at the time of the introduction of the Euro the costs would translate to costs
of 153 €/m² façade area and cost savings of 122,710 € or 61 €/m² living area.
100,000 DM (51,129 €) have been used for a further improvement of the thermal quality of
the building envelope (thicker insulation system and optimisation of the building component
joints. The other part of the remaining money was spent on a solar thermal system for the
generation of domestic hot water. In total (adapted design, improved thermal quality of the
building envelope and solar thermal system) the heating energy use could be reduced by
50% with no additional costs.
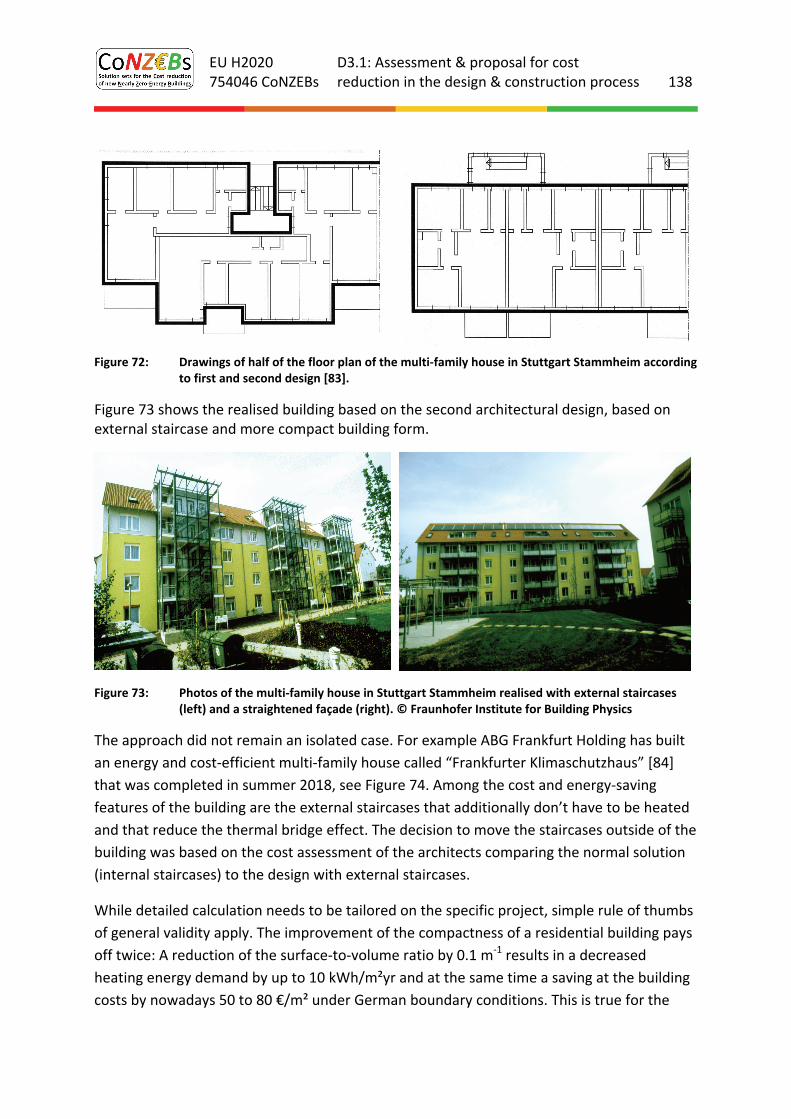
EU H2020 754046 CoNZEBs
D3.1: Assessment & proposal for cost reduction in the design & construction process 138
Figure 72: Drawings of half of the floor plan of the multi‐family house in Stuttgart Stammheim according to first and second design [83].
Figure 73 shows the realised building based on the second architectural design, based on external staircase and more compact building form.
Figure 73: Photos of the multi‐family house in Stuttgart Stammheim realised with external staircases (left) and a straightened façade (right). © Fraunhofer Institute for Building Physics
The approach did not remain an isolated case. For example ABG Frankfurt Holding has built
an energy and cost‐efficient multi‐family house called “Frankfurter Klimaschutzhaus” [84]
that was completed in summer 2018, see Figure 74. Among the cost and energy‐saving
features of the building are the external staircases that additionally don’t have to be heated
and that reduce the thermal bridge effect. The decision to move the staircases outside of the
building was based on the cost assessment of the architects comparing the normal solution
(internal staircases) to the design with external staircases.
While detailed calculation needs to be tailored on the specific project, simple rule of thumbs
of general validity apply. The improvement of the compactness of a residential building pays
off twice: A reduction of the surface‐to‐volume ratio by 0.1 m‐1 results in a decreased
heating energy demand by up to 10 kWh/m²yr and at the same time a saving at the building
costs by nowadays 50 to 80 €/m² under German boundary conditions. This is true for the
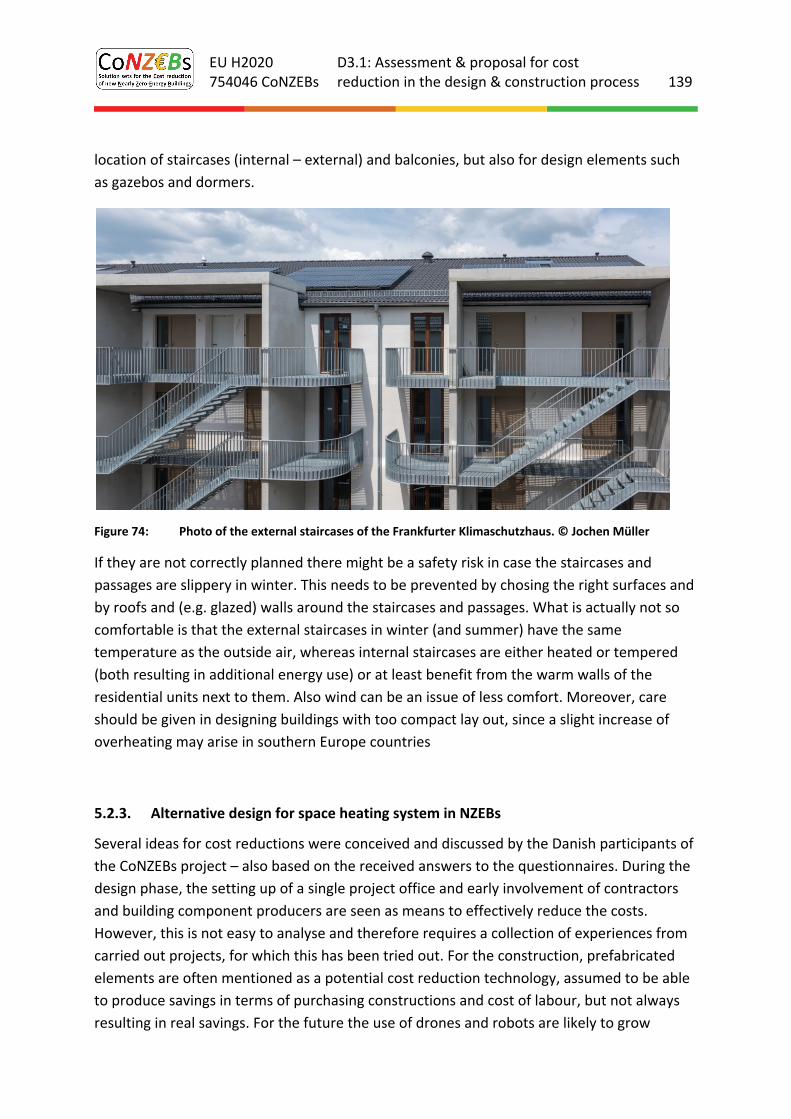
EU H2020 754046 CoNZEBs
D3.1: Assessment & proposal for cost reduction in the design & construction process 139
location of staircases (internal – external) and balconies, but also for design elements such
as gazebos and dormers.
Figure 74: Photo of the external staircases of the Frankfurter Klimaschutzhaus. © Jochen Müller
If they are not correctly planned there might be a safety risk in case the staircases and
passages are slippery in winter. This needs to be prevented by chosing the right surfaces and
by roofs and (e.g. glazed) walls around the staircases and passages. What is actually not so
comfortable is that the external staircases in winter (and summer) have the same
temperature as the outside air, whereas internal staircases are either heated or tempered
(both resulting in additional energy use) or at least benefit from the warm walls of the
residential units next to them. Also wind can be an issue of less comfort. Moreover, care
should be given in designing buildings with too compact lay out, since a slight increase of
overheating may arise in southern Europe countries
5.2.3. Alternative design for space heating system in NZEBs
Several ideas for cost reductions were conceived and discussed by the Danish participants of
the CoNZEBs project – also based on the received answers to the questionnaires. During the
design phase, the setting up of a single project office and early involvement of contractors
and building component producers are seen as means to effectively reduce the costs.
However, this is not easy to analyse and therefore requires a collection of experiences from
carried out projects, for which this has been tried out. For the construction, prefabricated
elements are often mentioned as a potential cost reduction technology, assumed to be able
to produce savings in terms of purchasing constructions and cost of labour, but not always
resulting in real savings. For the future the use of drones and robots are likely to grow
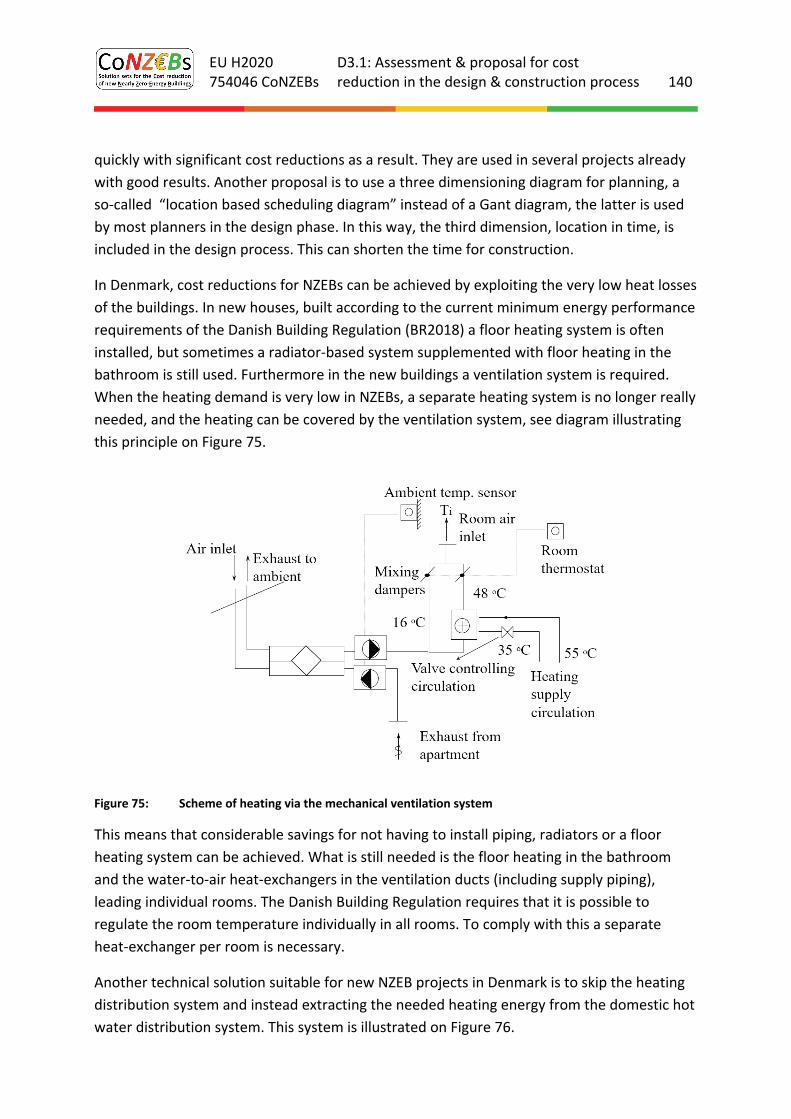
EU H2020 754046 CoNZEBs
D3.1: Assessment & proposal for cost reduction in the design & construction process 140
quickly with significant cost reductions as a result. They are used in several projects already
with good results. Another proposal is to use a three dimensioning diagram for planning, a
so‐called “location based scheduling diagram” instead of a Gant diagram, the latter is used
by most planners in the design phase. In this way, the third dimension, location in time, is
included in the design process. This can shorten the time for construction.
In Denmark, cost reductions for NZEBs can be achieved by exploiting the very low heat losses
of the buildings. In new houses, built according to the current minimum energy performance
requirements of the Danish Building Regulation (BR2018) a floor heating system is often
installed, but sometimes a radiator‐based system supplemented with floor heating in the
bathroom is still used. Furthermore in the new buildings a ventilation system is required.
When the heating demand is very low in NZEBs, a separate heating system is no longer really
needed, and the heating can be covered by the ventilation system, see diagram illustrating
this principle on Figure 75.
Figure 75: Scheme of heating via the mechanical ventilation system
This means that considerable savings for not having to install piping, radiators or a floor
heating system can be achieved. What is still needed is the floor heating in the bathroom
and the water‐to‐air heat‐exchangers in the ventilation ducts (including supply piping),
leading individual rooms. The Danish Building Regulation requires that it is possible to
regulate the room temperature individually in all rooms. To comply with this a separate
heat‐exchanger per room is necessary.
Another technical solution suitable for new NZEB projects in Denmark is to skip the heating
distribution system and instead extracting the needed heating energy from the domestic hot
water distribution system. This system is illustrated on Figure 76.
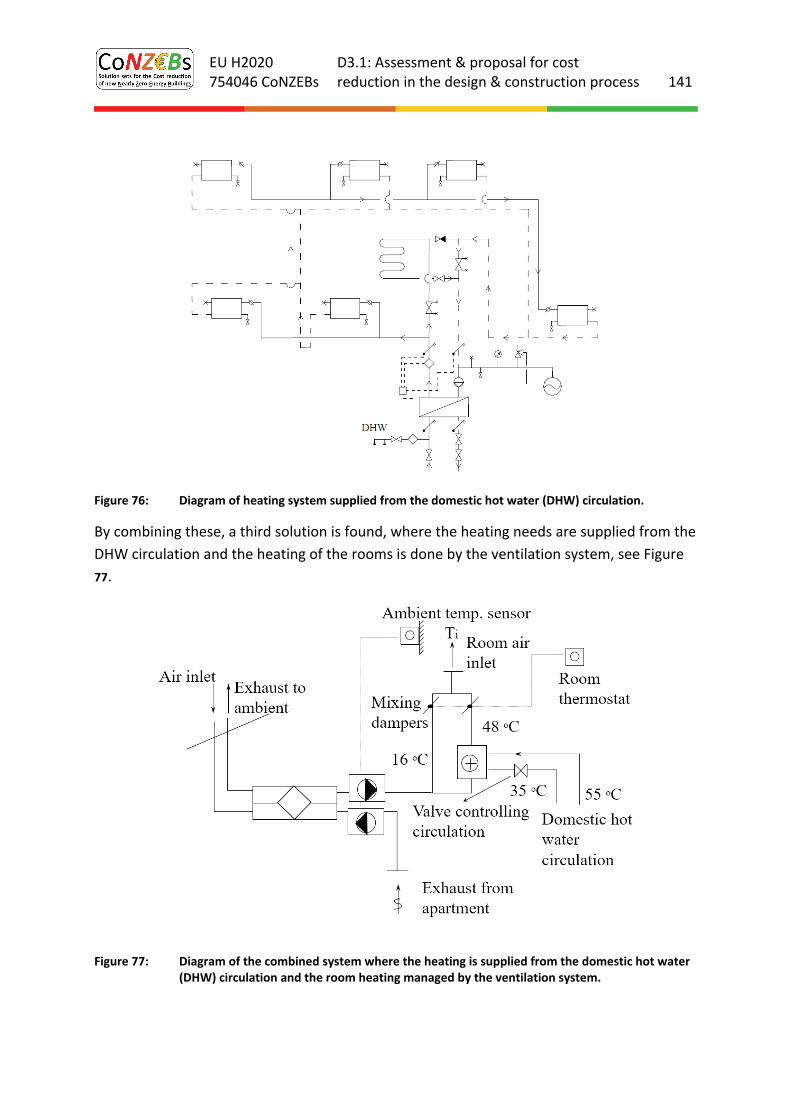
EU H2020 754046 CoNZEBs
D3.1: Assessment & proposal for cost reduction in the design & construction process 141
Figure 76: Diagram of heating system supplied from the domestic hot water (DHW) circulation.
By combining these, a third solution is found, where the heating needs are supplied from the
DHW circulation and the heating of the rooms is done by the ventilation system, see Figure
77.
Figure 77: Diagram of the combined system where the heating is supplied from the domestic hot water (DHW) circulation and the room heating managed by the ventilation system.
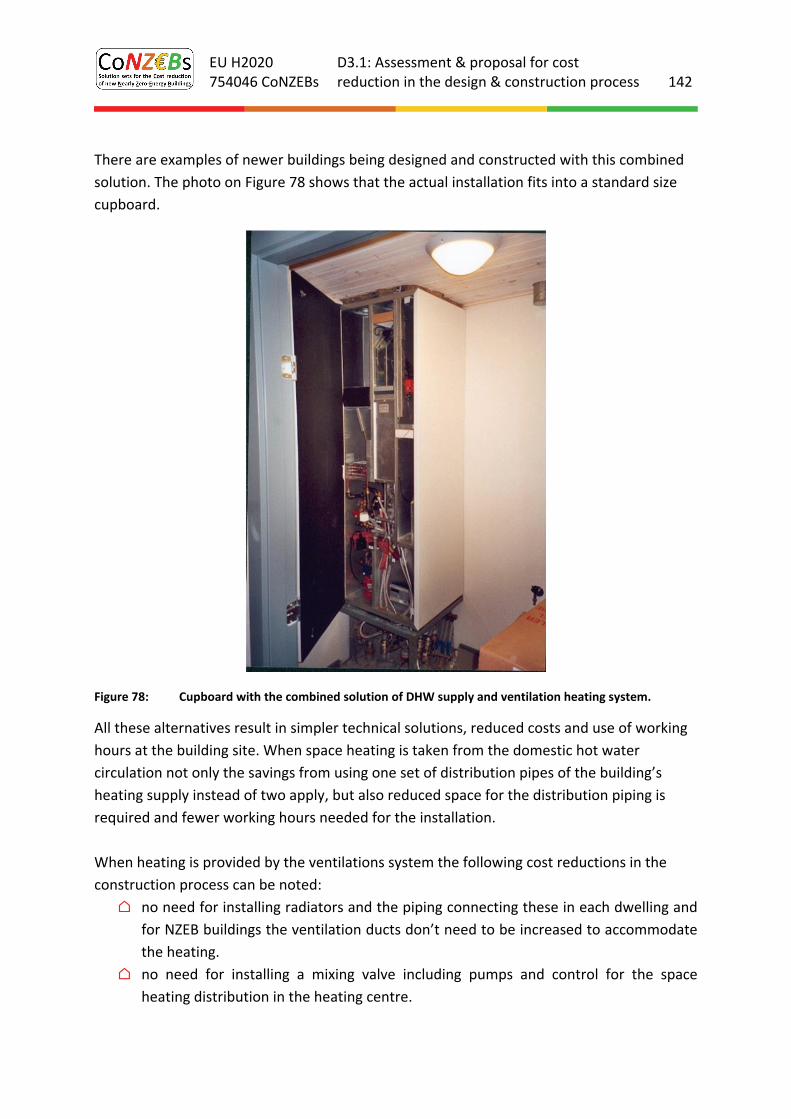
EU H2020 754046 CoNZEBs
D3.1: Assessment & proposal for cost reduction in the design & construction process 142
There are examples of newer buildings being designed and constructed with this combined
solution. The photo on Figure 78 shows that the actual installation fits into a standard size
cupboard.
Figure 78: Cupboard with the combined solution of DHW supply and ventilation heating system.
All these alternatives result in simpler technical solutions, reduced costs and use of working
hours at the building site. When space heating is taken from the domestic hot water
circulation not only the savings from using one set of distribution pipes of the building’s
heating supply instead of two apply, but also reduced space for the distribution piping is
required and fewer working hours needed for the installation.
When heating is provided by the ventilations system the following cost reductions in the
construction process can be noted:
⌂ no need for installing radiators and the piping connecting these in each dwelling and
for NZEB buildings the ventilation ducts don’t need to be increased to accommodate
the heating.
⌂ no need for installing a mixing valve including pumps and control for the space
heating distribution in the heating centre.

EU H2020 754046 CoNZEBs
D3.1: Assessment & proposal for cost reduction in the design & construction process 143
For the combined solution these savings can be added. The potential cost reductions from
implementing these solutions is shown in Table 28. The costs in the table are taken from a
Danish building cost catalogue [85]. The idea of the table is to show the costs of a traditional
heating system in the first column (A), then the costs of a system in which the space heating
energy requirement is extracted from the domestic hot water distribution system (B). In the
third column, the cost of a system based on space heating by ventilation air (C) and finally
the fourth column show the cost of a combined system (D). It appears from the table that
savings from the two individual solutions are in the range of 18 ‐ 20 €/m² and for the
combined system around 46 €/m². This approach can be fine‐tuned by changing one or more
of the cost parameters. For example, it may be sufficient to insert an electrical heat surface
in the ducts leading to the individual rooms instead of a water‐to‐air heat‐exchanger, which
would reduce the costs considerably. The savings of solution C could thereby increase to
31 €/m² and for D to approx. 60 €/m².
Table 28: Extract of the table with cost assessment of the analysed technological solutions.
The cost accounted for in the table are total costs, which for solution A, B and C are
distributed in 63% for materials and 37% for labour. For solution D these percentages are
64% and 36%. This corresponds to construction labour times for the solutions for the
apartment block in question of respectively: A=2.8, B=2.3, C=2.4 and D=1.7 person months.
This has probably little influence on the length of the total construction period.
The main risk related to this solusion is in case of a period with extreme cold weather, since
capacity for space heating may not be sufficient when the distribution system are to supply
both domestic hot water and space heating.
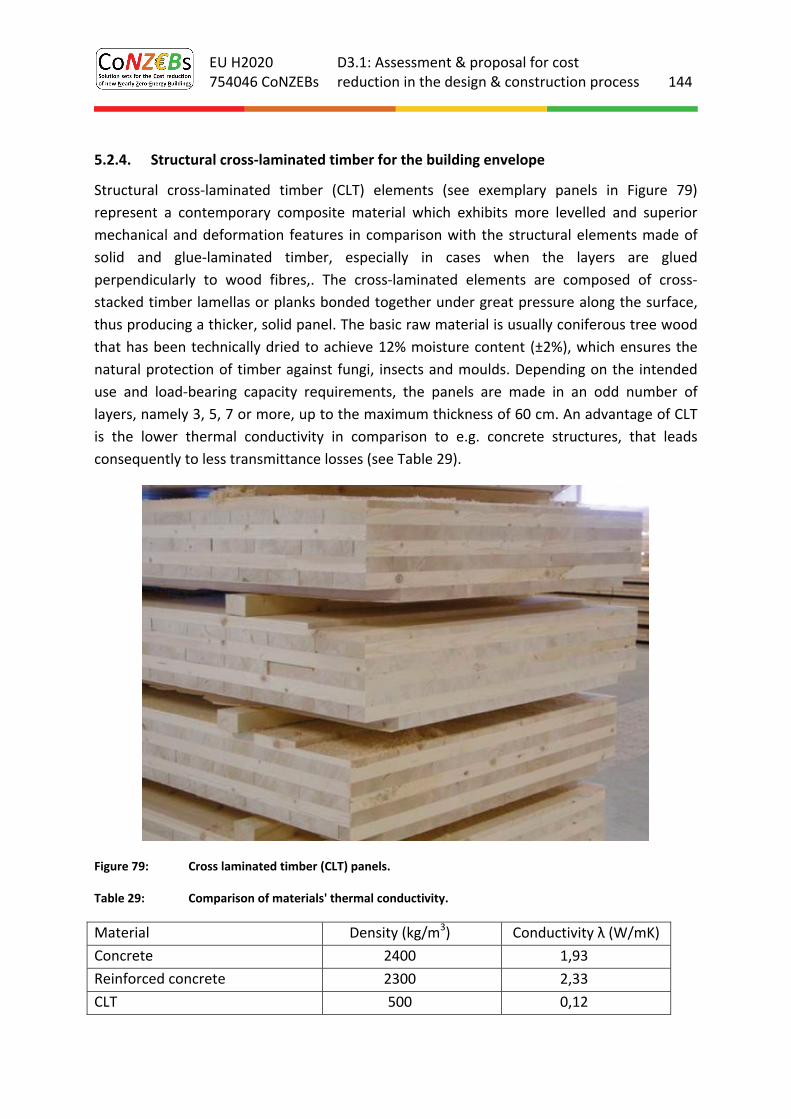
EU H2020 754046 CoNZEBs
D3.1: Assessment & proposal for cost reduction in the design & construction process 144
5.2.4. Structural cross‐laminated timber for the building envelope
Structural cross‐laminated timber (CLT) elements (see exemplary panels in Figure 79)
represent a contemporary composite material which exhibits more levelled and superior
mechanical and deformation features in comparison with the structural elements made of
solid and glue‐laminated timber, especially in cases when the layers are glued
perpendicularly to wood fibres,. The cross‐laminated elements are composed of cross‐
stacked timber lamellas or planks bonded together under great pressure along the surface,
thus producing a thicker, solid panel. The basic raw material is usually coniferous tree wood
that has been technically dried to achieve 12% moisture content (±2%), which ensures the
natural protection of timber against fungi, insects and moulds. Depending on the intended
use and load‐bearing capacity requirements, the panels are made in an odd number of
layers, namely 3, 5, 7 or more, up to the maximum thickness of 60 cm. An advantage of CLT
is the lower thermal conductivity in comparison to e.g. concrete structures, that leads
consequently to less transmittance losses (see Table 29).
Figure 79: Cross laminated timber (CLT) panels.
Table 29: Comparison of materials' thermal conductivity.
Material Density (kg/m3) Conductivity λ (W/mK)
Concrete 2400 1,93
Reinforced concrete 2300 2,33
CLT 500 0,12
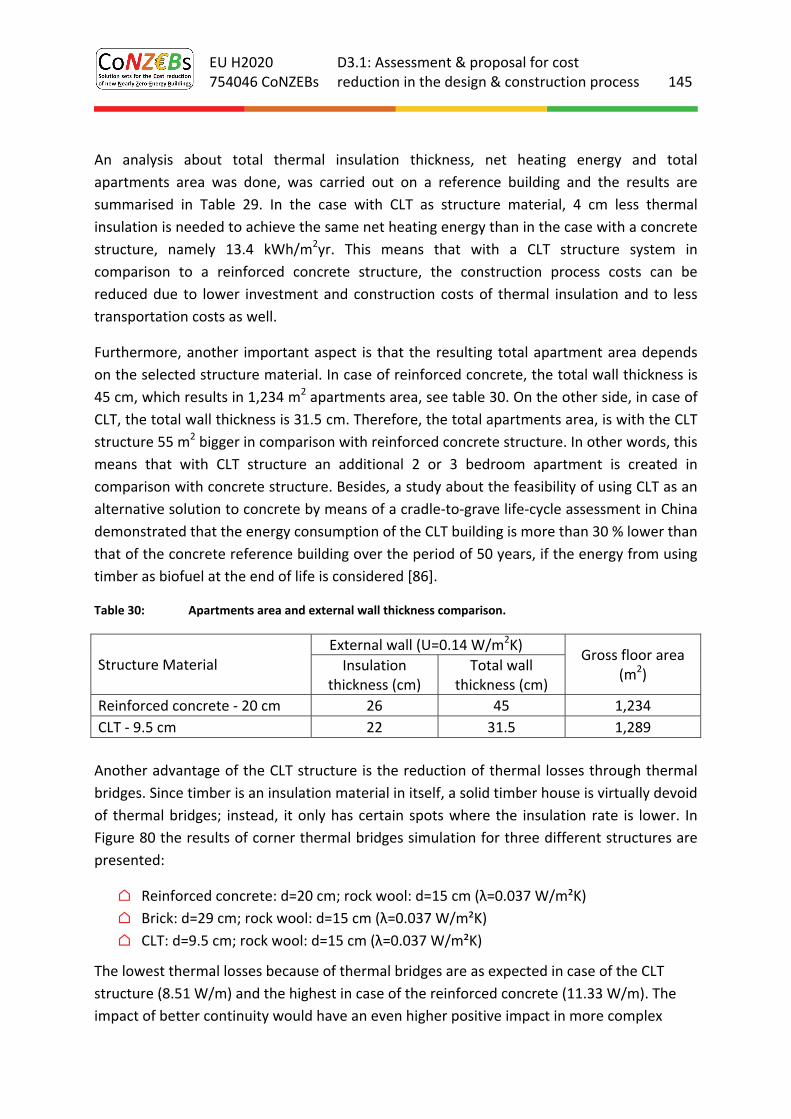
EU H2020 754046 CoNZEBs
D3.1: Assessment & proposal for cost reduction in the design & construction process 145
An analysis about total thermal insulation thickness, net heating energy and total
apartments area was done, was carried out on a reference building and the results are
summarised in Table 29. In the case with CLT as structure material, 4 cm less thermal
insulation is needed to achieve the same net heating energy than in the case with a concrete
structure, namely 13.4 kWh/m2yr. This means that with a CLT structure system in
comparison to a reinforced concrete structure, the construction process costs can be
reduced due to lower investment and construction costs of thermal insulation and to less
transportation costs as well.
Furthermore, another important aspect is that the resulting total apartment area depends
on the selected structure material. In case of reinforced concrete, the total wall thickness is
45 cm, which results in 1,234 m2 apartments area, see table 30. On the other side, in case of
CLT, the total wall thickness is 31.5 cm. Therefore, the total apartments area, is with the CLT
structure 55 m2 bigger in comparison with reinforced concrete structure. In other words, this
means that with CLT structure an additional 2 or 3 bedroom apartment is created in
comparison with concrete structure. Besides, a study about the feasibility of using CLT as an
alternative solution to concrete by means of a cradle‐to‐grave life‐cycle assessment in China
demonstrated that the energy consumption of the CLT building is more than 30 % lower than
that of the concrete reference building over the period of 50 years, if the energy from using
timber as biofuel at the end of life is considered [86].
Table 30: Apartments area and external wall thickness comparison.
Structure Material External wall (U=0.14 W/m2K)
Gross floor area (m2)
Insulation thickness (cm)
Total wall thickness (cm)
Reinforced concrete ‐ 20 cm 26 45 1,234
CLT ‐ 9.5 cm 22 31.5 1,289
Another advantage of the CLT structure is the reduction of thermal losses through thermal
bridges. Since timber is an insulation material in itself, a solid timber house is virtually devoid
of thermal bridges; instead, it only has certain spots where the insulation rate is lower. In
Figure 80 the results of corner thermal bridges simulation for three different structures are
presented:
⌂ Reinforced concrete: d=20 cm; rock wool: d=15 cm (λ=0.037 W/m²K)
⌂ Brick: d=29 cm; rock wool: d=15 cm (λ=0.037 W/m²K)
⌂ CLT: d=9.5 cm; rock wool: d=15 cm (λ=0.037 W/m²K)
The lowest thermal losses because of thermal bridges are as expected in case of the CLT
structure (8.51 W/m) and the highest in case of the reinforced concrete (11.33 W/m). The
impact of better continuity would have an even higher positive impact in more complex
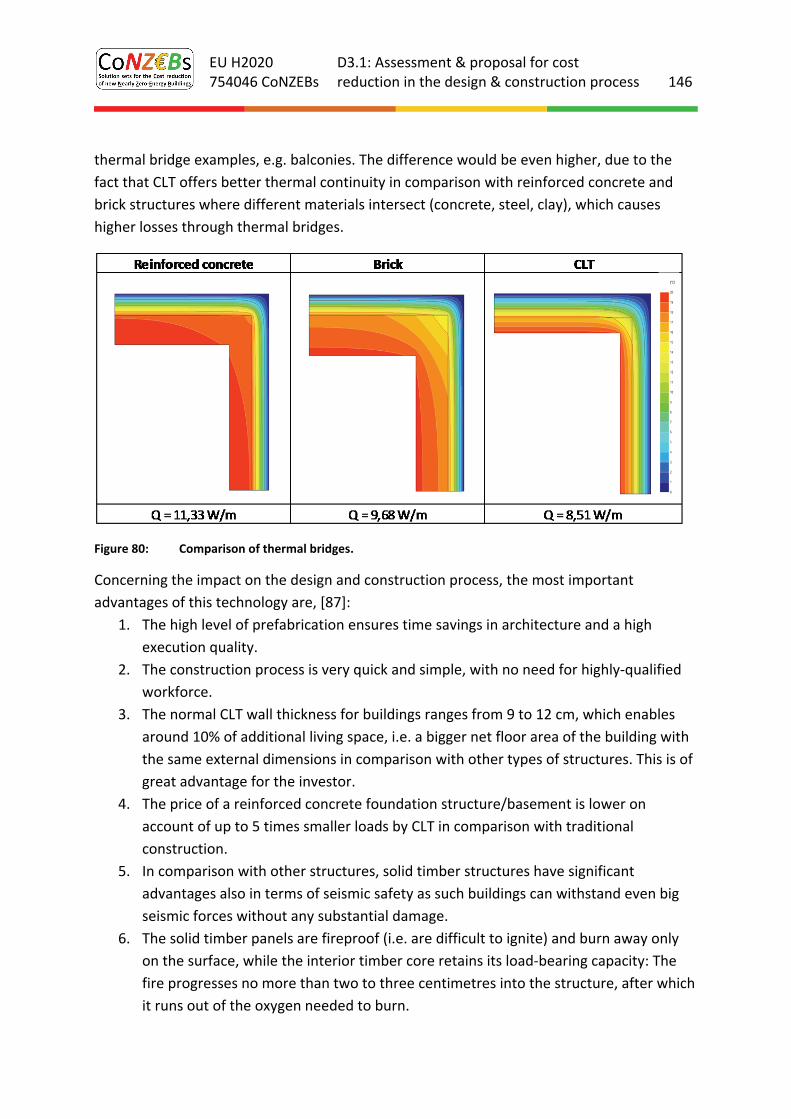
EU H2020 754046 CoNZEBs
D3.1: Assessment & proposal for cost reduction in the design & construction process 146
thermal bridge examples, e.g. balconies. The difference would be even higher, due to the
fact that CLT offers better thermal continuity in comparison with reinforced concrete and
brick structures where different materials intersect (concrete, steel, clay), which causes
higher losses through thermal bridges.
Figure 80: Comparison of thermal bridges.
Concerning the impact on the design and construction process, the most important
advantages of this technology are, [87]:
1. The high level of prefabrication ensures time savings in architecture and a high
execution quality.
2. The construction process is very quick and simple, with no need for highly‐qualified
workforce.
3. The normal CLT wall thickness for buildings ranges from 9 to 12 cm, which enables
around 10% of additional living space, i.e. a bigger net floor area of the building with
the same external dimensions in comparison with other types of structures. This is of
great advantage for the investor.
4. The price of a reinforced concrete foundation structure/basement is lower on
account of up to 5 times smaller loads by CLT in comparison with traditional
construction.
5. In comparison with other structures, solid timber structures have significant
advantages also in terms of seismic safety as such buildings can withstand even big
seismic forces without any substantial damage.
6. The solid timber panels are fireproof (i.e. are difficult to ignite) and burn away only
on the surface, while the interior timber core retains its load‐bearing capacity: The
fire progresses no more than two to three centimetres into the structure, after which
it runs out of the oxygen needed to burn.
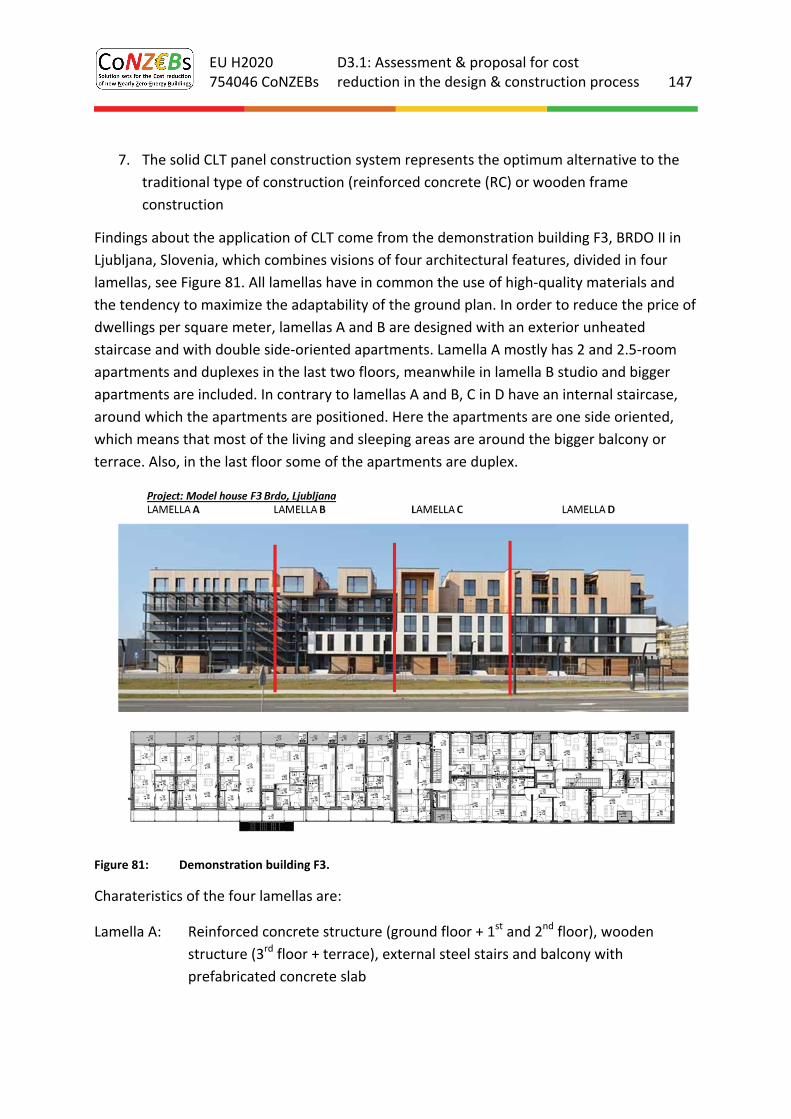
EU H2020 754046 CoNZEBs
D3.1: Assessment & proposal for cost reduction in the design & construction process 147
7. The solid CLT panel construction system represents the optimum alternative to the
traditional type of construction (reinforced concrete (RC) or wooden frame
construction
Findings about the application of CLT come from the demonstration building F3, BRDO II in
Ljubljana, Slovenia, which combines visions of four architectural features, divided in four
lamellas, see Figure 81. All lamellas have in common the use of high‐quality materials and
the tendency to maximize the adaptability of the ground plan. In order to reduce the price of
dwellings per square meter, lamellas A and B are designed with an exterior unheated
staircase and with double side‐oriented apartments. Lamella A mostly has 2 and 2.5‐room
apartments and duplexes in the last two floors, meanwhile in lamella B studio and bigger
apartments are included. In contrary to lamellas A and B, C in D have an internal staircase,
around which the apartments are positioned. Here the apartments are one side oriented,
which means that most of the living and sleeping areas are around the bigger balcony or
terrace. Also, in the last floor some of the apartments are duplex.
Figure 81: Demonstration building F3.
Charateristics of the four lamellas are:
Lamella A: Reinforced concrete structure (ground floor + 1st and 2nd floor), wooden
structure (3rd floor + terrace), external steel stairs and balcony with
prefabricated concrete slab
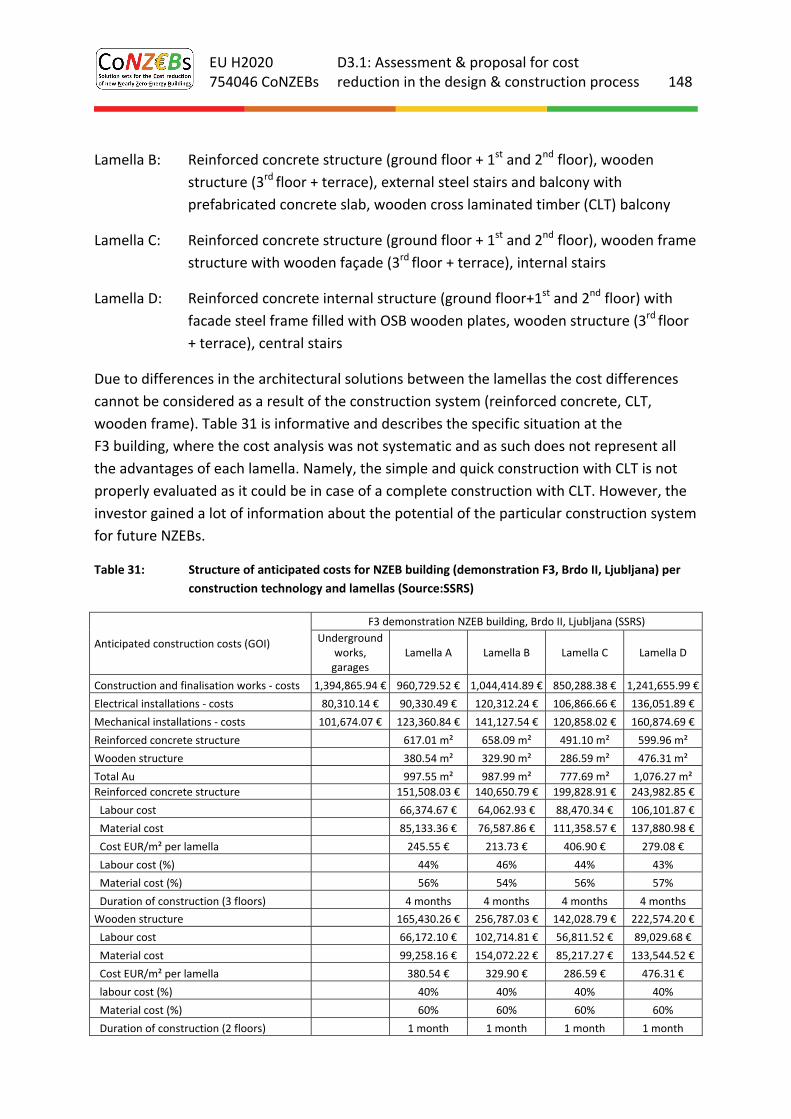
EU H2020 754046 CoNZEBs
D3.1: Assessment & proposal for cost reduction in the design & construction process 148
Lamella B: Reinforced concrete structure (ground floor + 1st and 2nd floor), wooden
structure (3rd floor + terrace), external steel stairs and balcony with
prefabricated concrete slab, wooden cross laminated timber (CLT) balcony
Lamella C: Reinforced concrete structure (ground floor + 1st and 2nd floor), wooden frame
structure with wooden façade (3rd floor + terrace), internal stairs
Lamella D: Reinforced concrete internal structure (ground floor+1st and 2nd floor) with
facade steel frame filled with OSB wooden plates, wooden structure (3rd floor
+ terrace), central stairs
Due to differences in the architectural solutions between the lamellas the cost differences
cannot be considered as a result of the construction system (reinforced concrete, CLT,
wooden frame). Table 31 is informative and describes the specific situation at the
F3 building, where the cost analysis was not systematic and as such does not represent all
the advantages of each lamella. Namely, the simple and quick construction with CLT is not
properly evaluated as it could be in case of a complete construction with CLT. However, the
investor gained a lot of information about the potential of the particular construction system
for future NZEBs.
Table 31: Structure of anticipated costs for NZEB building (demonstration F3, Brdo II, Ljubljana) per
construction technology and lamellas (Source:SSRS)
Anticipated construction costs (GOI)
F3 demonstration NZEB building, Brdo II, Ljubljana (SSRS)
Underground works, garages
Lamella A Lamella B Lamella C Lamella D
Construction and finalisation works ‐ costs 1,394,865.94 € 960,729.52 € 1,044,414.89 € 850,288.38 € 1,241,655.99 €
Electrical installations ‐ costs 80,310.14 € 90,330.49 € 120,312.24 € 106,866.66 € 136,051.89 €
Mechanical installations ‐ costs 101,674.07 € 123,360.84 € 141,127.54 € 120,858.02 € 160,874.69 €
Reinforced concrete structure 617.01 m² 658.09 m² 491.10 m² 599.96 m²
Wooden structure 380.54 m² 329.90 m² 286.59 m² 476.31 m²
Total Au 997.55 m² 987.99 m² 777.69 m² 1,076.27 m²
Reinforced concrete structure 151,508.03 € 140,650.79 € 199,828.91 € 243,982.85 €
Labour cost 66,374.67 € 64,062.93 € 88,470.34 € 106,101.87 €
Material cost 85,133.36 € 76,587.86 € 111,358.57 € 137,880.98 €
Cost EUR/m² per lamella 245.55 € 213.73 € 406.90 € 279.08 €
Labour cost (%) 44% 46% 44% 43%
Material cost (%) 56% 54% 56% 57%
Duration of construction (3 floors) 4 months 4 months 4 months 4 months
Wooden structure 165,430.26 € 256,787.03 € 142,028.79 € 222,574.20 €
Labour cost 66,172.10 € 102,714.81 € 56,811.52 € 89,029.68 €
Material cost 99,258.16 € 154,072.22 € 85,217.27 € 133,544.52 €
Cost EUR/m² per lamella 380.54 € 329.90 € 286.59 € 476.31 €
labour cost (%) 40% 40% 40% 40%
Material cost (%) 60% 60% 60% 60%
Duration of construction (2 floors) 1 month 1 month 1 month 1 month
EU H2020 754046 CoNZEBs
D3.1: Assessment & proposal for cost reduction in the design & construction process 149
In average in case of concrete structure, the cost per square meter of material is between
54% and 56%, while the labour costs are between 43% and 46%. The concrete structure is
cheaper, but the construction time is 4 months for 3 floors, that is 4‐times the construction
time of the wooden structure (2 floors). The wooden structure is still more expensive than
the concrete structure, i.e. between 70% to 171%. However, an important benefit is the
construction time (estimated to 1 month for the CLT structure), as shorter construction time
leads to earlier revenues for the investor. Moreover, this was one of the first bigger projects
with the CLT construction, therefore it is expected that prices are going to be significantly
reduced.
According to investors’ (SSRS) experiences, the CLT construction was more expensive, but
the process itself was undoubtedly much faster. This needs to be taken into account as well
as other facts, such as simpler foundations, bigger net floor area with the same gross floor
area, lower thermal conductivity of wood and simpler indoor wall works in case of CLT use.
On the other hand, a very precise and deliberate approach in the complete design process is
needed, since additional interventions in CLT constructions are not allowed.
The disadvantage is related to the acoustic performance of CLT systems. The acoustic
problems usually occur due to shortcomings in the installation and the lack of proper linings.
Besides, some technological barriers exist due to the solid nature of the CLT system,
requiring architects/professionals to change the way they design buildings.
5.3. Reducing design and construction process cost with innovative project
management solutions
The questionnaire analysis highlighted that stakeholders find rooms for cost reduction in the
proper management of the whole construction process, more than ad‐hoc technological and
design solutions. According to the questionnaire results, the integrated design project
appears as the most effective solution to reduce costs. The collaborative work of the
different professionals involved and the higher effort in the design phase may increase costs
during this phase (about 5%) but ensure a safe and cost‐effective construction phase.
Another potential solution, still with very few data from the field, is to use a three‐
dimensioning diagram for planning, a so‐called “location‐based scheduling diagram” instead
of a Gant diagram, which is used by most planners in the design phase. In this way, the third
dimension, location in time is included in the design process. This can shorten the time for
construction.
The approaches presented above are a typical example of the change taking place in the
project management of building construction, clearly explained by the MacLeamy curve,
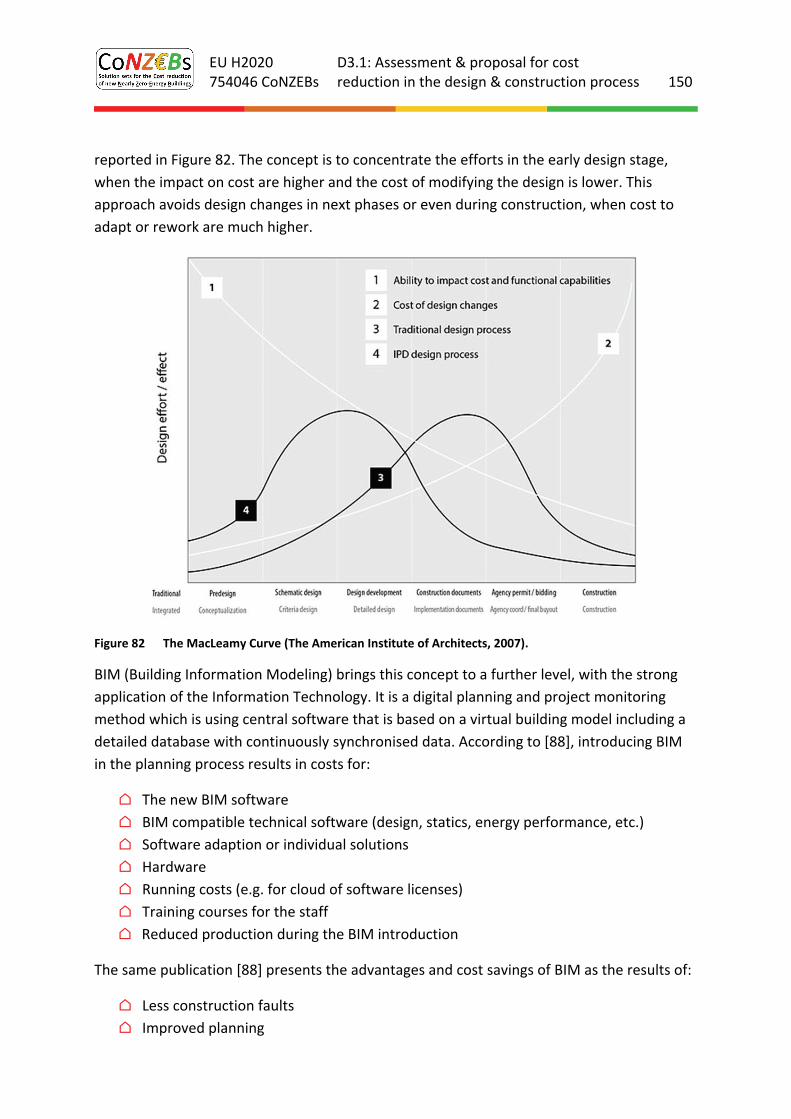
EU H2020 754046 CoNZEBs
D3.1: Assessment & proposal for cost reduction in the design & construction process 150
reported in Figure 82. The concept is to concentrate the efforts in the early design stage,
when the impact on cost are higher and the cost of modifying the design is lower. This
approach avoids design changes in next phases or even during construction, when cost to
adapt or rework are much higher.
Figure 82 The MacLeamy Curve (The American Institute of Architects, 2007).
BIM (Building Information Modeling) brings this concept to a further level, with the strong
application of the Information Technology. It is a digital planning and project monitoring
method which is using central software that is based on a virtual building model including a
detailed database with continuously synchronised data. According to [88], introducing BIM
in the planning process results in costs for:
⌂ The new BIM software
⌂ BIM compatible technical software (design, statics, energy performance, etc.)
⌂ Software adaption or individual solutions
⌂ Hardware
⌂ Running costs (e.g. for cloud of software licenses)
⌂ Training courses for the staff
⌂ Reduced production during the BIM introduction
The same publication [88] presents the advantages and cost savings of BIM as the results of:
⌂ Less construction faults
⌂ Improved planning
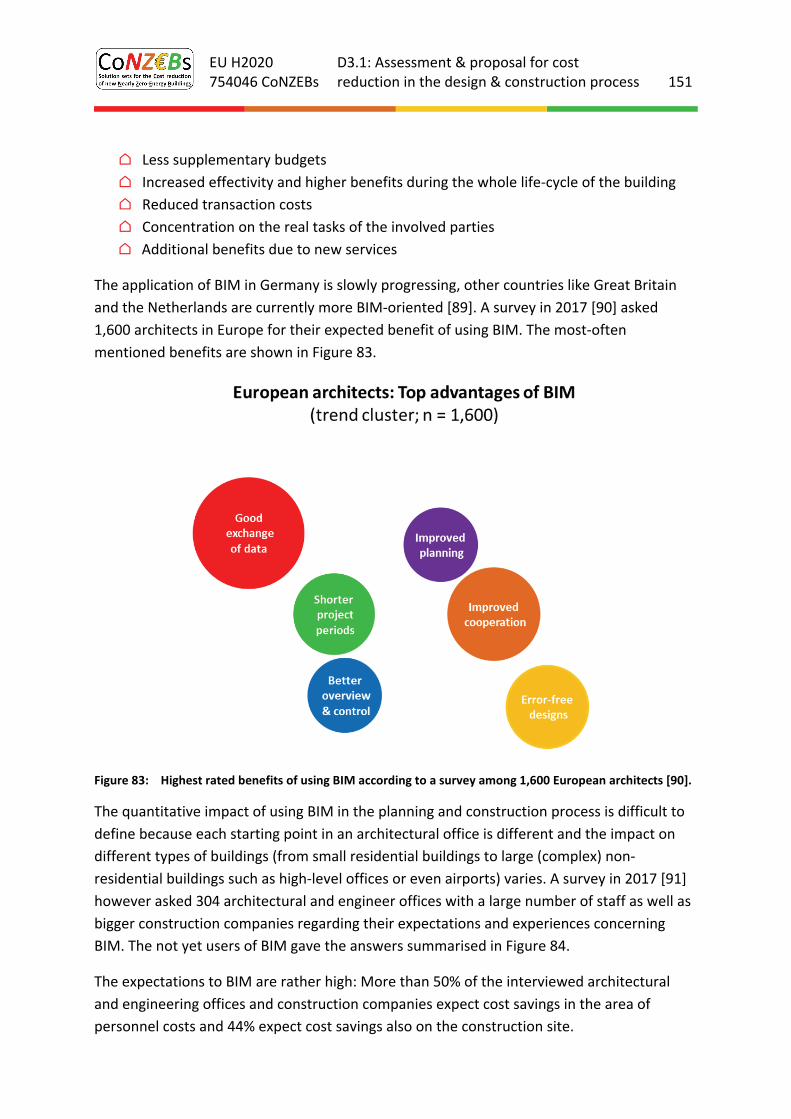
EU H2020 754046 CoNZEBs
D3.1: Assessment & proposal for cost reduction in the design & construction process 151
⌂ Less supplementary budgets
⌂ Increased effectivity and higher benefits during the whole life‐cycle of the building
⌂ Reduced transaction costs
⌂ Concentration on the real tasks of the involved parties
⌂ Additional benefits due to new services
The application of BIM in Germany is slowly progressing, other countries like Great Britain
and the Netherlands are currently more BIM‐oriented [89]. A survey in 2017 [90] asked
1,600 architects in Europe for their expected benefit of using BIM. The most‐often
mentioned benefits are shown in Figure 83.
Figure 83: Highest rated benefits of using BIM according to a survey among 1,600 European architects [90].
The quantitative impact of using BIM in the planning and construction process is difficult to
define because each starting point in an architectural office is different and the impact on
different types of buildings (from small residential buildings to large (complex) non‐
residential buildings such as high‐level offices or even airports) varies. A survey in 2017 [91]
however asked 304 architectural and engineer offices with a large number of staff as well as
bigger construction companies regarding their expectations and experiences concerning
BIM. The not yet users of BIM gave the answers summarised in Figure 84.
The expectations to BIM are rather high: More than 50% of the interviewed architectural
and engineering offices and construction companies expect cost savings in the area of
personnel costs and 44% expect cost savings also on the construction site.
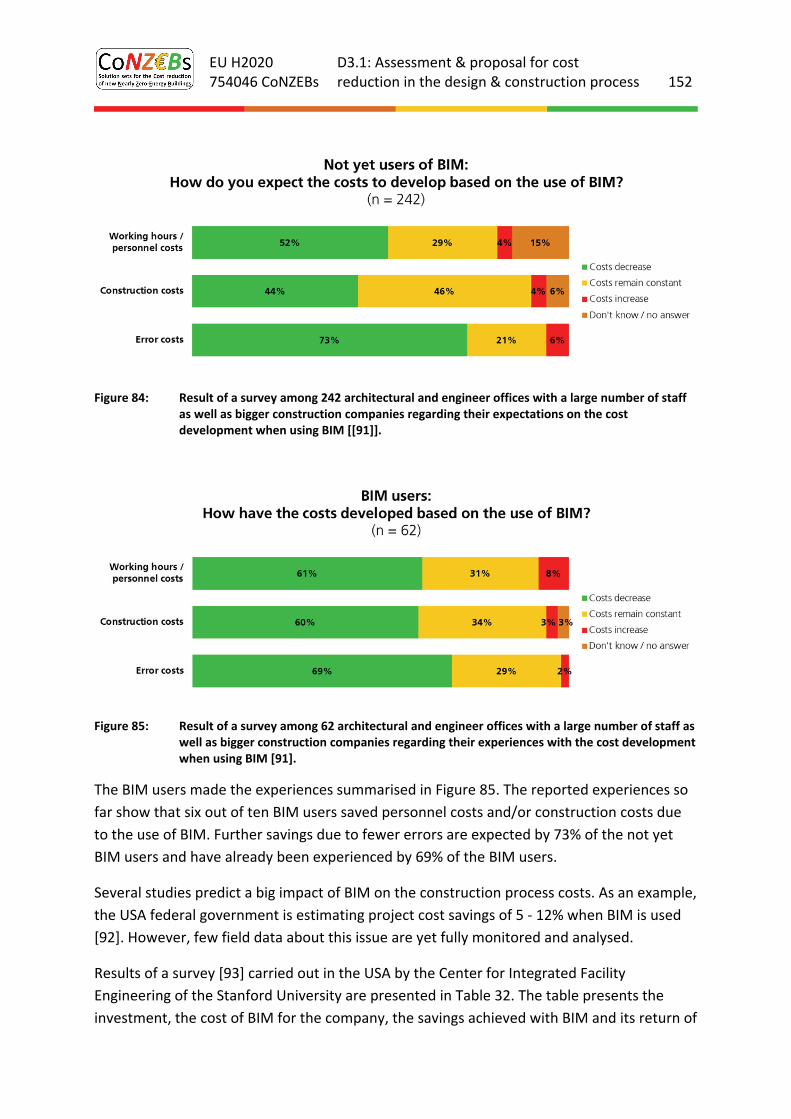
EU H2020 754046 CoNZEBs
D3.1: Assessment & proposal for cost reduction in the design & construction process 152
Figure 84: Result of a survey among 242 architectural and engineer offices with a large number of staff as well as bigger construction companies regarding their expectations on the cost development when using BIM [[91]].
Figure 85: Result of a survey among 62 architectural and engineer offices with a large number of staff as well as bigger construction companies regarding their experiences with the cost development when using BIM [91].
The BIM users made the experiences summarised in Figure 85. The reported experiences so
far show that six out of ten BIM users saved personnel costs and/or construction costs due
to the use of BIM. Further savings due to fewer errors are expected by 73% of the not yet
BIM users and have already been experienced by 69% of the BIM users.
Several studies predict a big impact of BIM on the construction process costs. As an example,
the USA federal government is estimating project cost savings of 5 ‐ 12% when BIM is used
[92]. However, few field data about this issue are yet fully monitored and analysed.
Results of a survey [93] carried out in the USA by the Center for Integrated Facility
Engineering of the Stanford University are presented in Table 32. The table presents the
investment, the cost of BIM for the company, the savings achieved with BIM and its return of
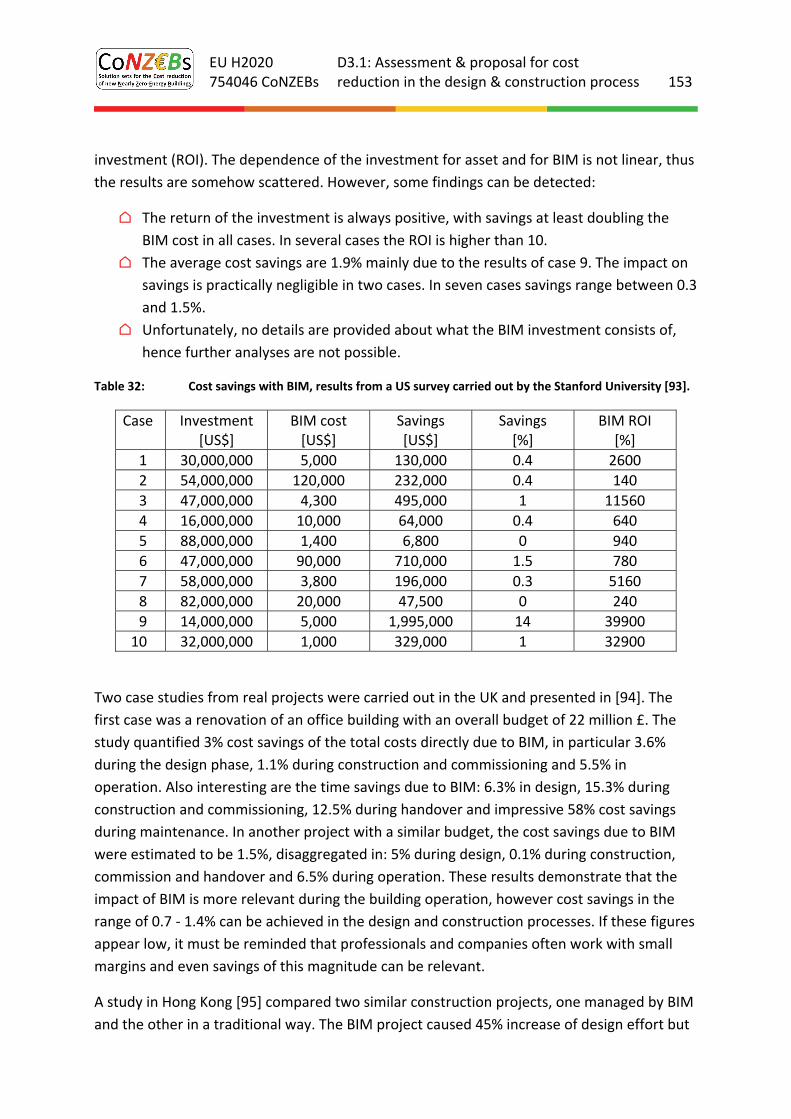
EU H2020 754046 CoNZEBs
D3.1: Assessment & proposal for cost reduction in the design & construction process 153
investment (ROI). The dependence of the investment for asset and for BIM is not linear, thus
the results are somehow scattered. However, some findings can be detected:
⌂ The return of the investment is always positive, with savings at least doubling the
BIM cost in all cases. In several cases the ROI is higher than 10.
⌂ The average cost savings are 1.9% mainly due to the results of case 9. The impact on
savings is practically negligible in two cases. In seven cases savings range between 0.3
and 1.5%.
⌂ Unfortunately, no details are provided about what the BIM investment consists of,
hence further analyses are not possible.
Table 32: Cost savings with BIM, results from a US survey carried out by the Stanford University [93].
Case Investment [US$]
BIM cost [US$]
Savings [US$]
Savings [%]
BIM ROI [%]
1 30,000,000 5,000 130,000 0.4 2600
2 54,000,000 120,000 232,000 0.4 140
3 47,000,000 4,300 495,000 1 11560
4 16,000,000 10,000 64,000 0.4 640
5 88,000,000 1,400 6,800 0 940
6 47,000,000 90,000 710,000 1.5 780
7 58,000,000 3,800 196,000 0.3 5160
8 82,000,000 20,000 47,500 0 240
9 14,000,000 5,000 1,995,000 14 39900
10 32,000,000 1,000 329,000 1 32900
Two case studies from real projects were carried out in the UK and presented in [94]. The
first case was a renovation of an office building with an overall budget of 22 million £. The
study quantified 3% cost savings of the total costs directly due to BIM, in particular 3.6%
during the design phase, 1.1% during construction and commissioning and 5.5% in
operation. Also interesting are the time savings due to BIM: 6.3% in design, 15.3% during
construction and commissioning, 12.5% during handover and impressive 58% cost savings
during maintenance. In another project with a similar budget, the cost savings due to BIM
were estimated to be 1.5%, disaggregated in: 5% during design, 0.1% during construction,
commission and handover and 6.5% during operation. These results demonstrate that the
impact of BIM is more relevant during the building operation, however cost savings in the
range of 0.7 ‐ 1.4% can be achieved in the design and construction processes. If these figures
appear low, it must be reminded that professionals and companies often work with small
margins and even savings of this magnitude can be relevant.
A study in Hong Kong [95] compared two similar construction projects, one managed by BIM
and the other in a traditional way. The BIM project caused 45% increase of design effort but
EU H2020 754046 CoNZEBs
D3.1: Assessment & proposal for cost reduction in the design & construction process 154
9% reduction in the construction time. BIM provided also close to 7% reduction of the
overall costs in the construction process. The Bristol Business School of the University of the
West of England was a 55 million £ construction project [96], managed by BIM, which
assured 2 million £ savings, accounting for 3.6% of the total budget.
Coming to the conclusion, BIM has big potentials in terms of construction cost reduction,
especially according to the expectation of stakeholders. However, many variables affect the
process: geographical area, technological level of the project management, size of the
construction works and BIM level. In this sense most of the literature is based on
questionnaires about expectations, and less on measured data. The latter remain limited
and, even if economic benefits were generally monitored, no statistically consistent figures
can be derived.
Main risks related to BIM are:
⌂ Slow return of investment for companies working mainly with small projects
⌂ Construction companies and/or subcontractors do not change to BIM as quickly
as the designers. The approach is then lost on the construction site for at least a
few years. Additionally there might be misunderstandings and more faults on the
construction site due to the new way of communication and information
exchange based on BIM.
5.4. Conclusions
The overview of the proposed solutions shows that the costs of the design and construction
process can be reduced in several ways. Of course, most of the presented methods and their
results are just exemplary cases and do not provide a definitive framework of what is
available on the market. In fact, the proposed solutions to optimise building design and
construction are gaining access to the market and thus find room to reduce process costs,
but they might be not applicable in all buildings, neither in all countries. Some solutions are
energy invariant; other solutions may reduce costs during the construction process but
increase the costs during operation, hence they might not result in cost savings at the end of
the building lifetime.
Most relevant findings were:
⌂ High energy performance buildings require additional effort during the design phase
to properly detect crucial issues that might lead to cost savings during the process.
This aspect may lead to additional costs during the design phase but provide an
optimisation of the process. This is the case for example, in a detailed study to assess
the overheating risks and select architectural features that exploit passive cooling
and save money for active cooling systems in Italy.
EU H2020 754046 CoNZEBs
D3.1: Assessment & proposal for cost reduction in the design & construction process 155
⌂ BIM is expected as the lever that will change the managing of the construction
process and provide large savings. While some benefits are evident right now, few
data from the field exist that are able to quantify cost reductions specifically due to
BIM. A major benefit is already detected: the large reduction of extra costs for
mistakes and rework. This aspect is related to cost reduction, but it is worth
reminding that avoiding extra costs and build as planned is often a hard task, as
documented via the included questionnaires.
⌂ Assessing the economic benefits for construction technologies might be not enough
to optimise the construction process costs. It was found that preliminaries or indirect
costs may account for 10% of the total construction costs, hence it is very important
to assess the efficacy of the adopted solutions taking into account also these costs.
However, it is also impossible to quantify them in a disaggregated way with actual
knowledge. Since several solutions have a strong impact on the construction time,
and thus on preliminaries and duration of the project and the construction site, it is
important to assess the benefits of the building technologies in a holistic estimation
of the whole costs related to them. In this sense, many of the proposed solutions
have potentials to be cost effective in the whole process, even if not necessarily
resulting the savings in terms of product and labour only.
EU H2020 754046 CoNZEBs
D3.1: Assessment & proposal for cost reduction in the design & construction process 156
6. Lessons learned
This report intended assess actual costs in the design and construction (D&C) process and,
eventually, identify potentials for cost reductions. The activity was focused on: reviewing
existing documentation in participant countries, as well as in the rest of EU; involving the
stakeholders (designers, construction companies, contractor, etc.) in sharing their
experience on the D&C process, according to their man field of action, to asses actual costs
and, in a next phase, to identify potential solutions for cost reduction; assessment of
exemplary solutions of cost reductions in the D&C process, on the basis of qualitative and
quantitative analyses, carried out by research partners with the support of relevant
stakeholders, e.g. producers and manufactures of building technologies, as well as designers,
planners and housing companies skilled in the sector of high energy performance multi‐
family houses. The activity required a strong effort, since few data are available from official
sources or from literature, hence it had to be built thanks to a continuous exchange of
information flow to and from stakeholder.
Each chapter draws conclusions about the specific action and result, achieved in each phase.
Following the most important lessons learned are summarised:
⌂ Design cost are essentially the fees paid to architects, engineers and other technical
figures involved in the design process; and are expressed as ratio respect to the
construction costs. The analyses also showed relevant variation in Europe, ranging
from 4% in Slovenia up to 20% in Germany, with Italy and Denmark in between. High
variation was also found reviewing the situation in the other Member States.
Concerning the fee estimation, two basic approaches were detected in the
investigated markets: i) in some countries, e.g. Germany, the design fees are set by
law; ii) in some other countries, e.g. Italy, the existing legislative framework fixes the
ceiling of the fee, which as to be lowered by designers according to the market. In
the latter case, is the market itself that ask for cost reduction; in the former there are
no condition to pursue cost reduction in the design fees. The results of the
questionnaire, however, showed the interest in possible solution for cost reduction,
mainly intended as a possibility to optimize internal resources more than lowering
fee versus the customer. It is interesting noting that the only question strictly related
to the energy efficiency and performance ‐ i.e. the usefulness of predefined
technological package for different elements of the building ‐ had positive reactions
from electrical and mechanical designers and negative from architects. Here the main
difference is the simplification of the work for the sizing and designing of energy
system, seen as a positive support, while, on the other hand, architects see this
solution as a restraint in defining form, materials and aesthetics of the building.
EU H2020 754046 CoNZEBs
D3.1: Assessment & proposal for cost reduction in the design & construction process 157
⌂ Concerning the construction process, time evolution of costs was documented,
however few useful disaggregated data were available. In fact, while the impact of
low costs technologies is part of WP5 and can rely on robust data (cost for products
and labour), the potential to reduce costs in the process need detailed data about
how the process is carried out. In particular, preliminaries represent the cost related
to the process (transports, rents, scaffolding, management of the building site, etc.),
but only for Italy it was possible to make a partial estimation 5 ‐ 10%. Literature
sources fix this cost in the 10 ‐ 15% in many EU countries, but unfortunately none of
them represented in the CoNZEBs. These figures suggest the idea the optmisation of
D&C process may lead to not negligible cost reductions. Another important issue is
the documented increase of final costs respect to the planned ones as documented
the majority of the interviews, average increase ranges from 3% in Slovenia and
Germany, up to 9% in Italy. Hence, the optimisation solutions should have a first
effect on avoiding this extra‐cost, and next to reduce the overall costs. In this sense,
the questionnaire results show a growing interest versus solutions oriented to
industrialization ‐ move construction works from the site to the factory ‐ and the
utilisation of information technologies, with the objective of surpassing the risks
associated to the traditional management of the D&C process and move versus a
modern and effective organisation of the design office and construction site.
⌂ Specific relevant aspects related to the questionnaire results, and thus to
stakeholders experience and expectations, are:
⌂ The importance of the maintenance that will be crucial in NZEBs equipped
with more advanced technological solutions, respect to conventional
buildings; more over in buildings with close to zero energy bills, the
maintenance are bound to be the main voice in energy bills, hence this aspect
should be carefully address since the design phase;
⌂ The integrated project is seen as an effective solution to optimise the overall
D&C process, even if with minor extra costs in the design phase, the process
should see the participation of the designer teams and construction company
from the early stage of the design phase;
⌂ The use of BIM (Building Information Modeling) is seen as the mayor change
in the construction industry in the next years, and big expectations are there
to achieve cost reductions, thanks to a fully optimised management. Few data
are still available from the field; however several documented cases show
potential reduction of the overall process in 1 ‐ 10% range.
⌂ Several solutions to reduce D&C costs, through optimization of the process were
investigated taking into account costs and construction time. It was found out that
smaller effort in the design phase can have a big benefit on the overall construction
process, as documented by the bio‐climatic design in Italy or building form optimized
with external staircase in Germany. The screened technologies showed that

EU H2020 754046 CoNZEBs
D3.1: Assessment & proposal for cost reduction in the design & construction process 158
construction time might be halved respect to most used solutions, still providing
economic benefits and strongly reducing the preliminaries associated to the
indicated solution. The proposed solutions are however exemplary and not of
general validity, and this issue calls the attention to the role of designers, who should
not follow the mainstream but identify the best performing solutions in each specific
project. Finally, the study highlights the importance of a full life cycle cost for the
construction of new multi‐family houses, in which all the costs related to the process
should be taken into account: design, construction (including: materials and
products, preliminaries and indirect costs), energy operation, maintenance.
EU H2020 754046 CoNZEBs
D3.1: Assessment & proposal for cost reduction in the design & construction process 159
7. References
[1] D.M. 7 giugno 2016 ‐ Approvazione delle tabelle dei corrispettivi commisurati al
livello qualitativo delle prestazioni di progettazione adottato ai sensi dell'articolo
24, comma 8, del decreto legislativo n. 50 del 2016 [D.M. June, 7th 2016 ‐ Approval
of fee tables commensurate to the qualitative level of the design performance]
[2] CNAPP & CRESME, Professione architetto, January 2016
[3] Personal communication with Arch. Massimo Mercurio
[4] Gli indici dei costi di costruzione di un fabbricato residenziale, ISTAT, Nota
informative, Marzo 2013.
[5] VCI. n.d.: Umsätze der wichtigsten Industriebranchen in Deutschland in den Jahren
von 2014 bis 2016 (in Milliarden Euro) [Sales volumes of the most important industry
sectors in Germany in the years 2014 to 2016 (in billion euro)]. Statista. Access on 15.
Mai 2018. Available at
https://de.statista.com/statistik/daten/studie/241480/umfrage/umsaetze‐der‐
wichtigsten‐industriebranchen‐in‐deutschland/.
[6] ZDB. n.d.: Umsatzentwicklung im Bauhauptgewerbe in Deutschland in den Jahren
2000 bis 2018 (in Milliarden Euro) [Sales volumes of the main construction trade in
Germany in the years 2000 to 2018 (in billion euro)]. Statista. Access on 15 May 2018.
Available at https://de.statista.com/statistik/daten/studie/154592/umfrage/umsatz‐
im‐bauhauptgewerbe‐seit‐2000/.
[7] ZDB. n.d.: Umsatz im Bauhauptgewerbe nach Bereichen in Deutschland im
Jahresvergleich 2005 und 2016 (in Millionen Euro) [Sales volumes of the main
construction trade in Germany divided into sectors as annual comparison of 2005
and 2016 (in billion euro)]. Statista. Access on 15 May 2018. Available at
https://de.statista.com/statistik/daten/studie/5732/umfrage/baugewerbliche‐
umsaetze‐seit‐2005/.
[8] Deutsche Energieagentur (dena): dena‐Gebäudereport: Sanierungsrate weiterhin viel
zu gering [dena building report: Renovation rate still much too low]. Press release of
6. February 2018. Access on 15 May 2018. Available at
https://www.dena.de/de/newsroom/meldungen/2017/dena‐gebaeudereport‐
sanierungsrate‐weiterhin‐viel‐zu‐gering/.
[9] Statistisches Bundesamt. n.d.: Anzahl der Baugenehmigungen zur Errichtung neuer
Wohn‐ und Nichtwohngebäude in Deutschland in den Jahren 2000 bis 2016 [Number
of building permissions for new residential and non‐residential buildings in Germany
in the years 2000 to 2017]. Statista. Access on 15 May 2018. Available at
https://de.statista.com/statistik/daten/studie/254596/umfrage/baugenehmigungen‐
in‐westdeutschland/.
EU H2020 754046 CoNZEBs
D3.1: Assessment & proposal for cost reduction in the design & construction process 160
[10] Statistisches Bundesamt. n.d.: Vergleich der Anzahl von Wohnungsbau‐
genehmigungen nach Gebäudeart in Deutschland in den Jahren 2016 und 2017
[Comparison of the number of building permissions for residential units in Germany
in the years 2016 and 2017]. Statista. Access on 15 May 2018. Available at
https://de.statista.com/statistik/daten/studie/167128/umfrage/baugenehmigungen‐
von‐wohnungen‐nach‐gebaeudearten‐in‐deutschland/.
[11] BBSR. n.d.: Jährlicher Neubaubedarf von Wohnungen in Deutschland in den Jahren
2015 bis 2030 [Annual demand of new residential units in Germany in the years 2015
to 2030]. Statista. Access on 15 May 2018. Available at
https://de.statista.com/statistik/daten/studie/453004/umfrage/neubaubedarf‐von‐
wohungen‐in‐deutschland/.
[12] Bundesregierung: Honorarordnung für Architekten und Ingenieure vom 10. Juli 2013
[Official Scale of Fees for Services by Architects and Engineers of 10 July 2013].
Bundesgesetzblatt I, page 2276. Available at https://www.gesetze‐im‐
internet.de/hoai_2013/HOAI.pdf.
[13] Architektenkammer Baden‐Württember: Wie rechnet der Architekt sein Honorar ab
[How does the architect charge his fee]? Information for the building owner on the
actual fee structure for architects and engineers of 10 July 2013. Information no. 52.
Available at
https://www.akbw.de/fileadmin/download/dokumenten_datenbank/AKBW_Merkbl
aetter/Honorar_und_Vertragsrecht/Merkblatt52‐Architektenhonorar‐2013.pdf
[14] Walberg, D.; Gniechwitzs, T.; Halstenberg, M.: Kostentreiber für den Wohnungsbau ‐
Untersuchung und Betrachtung der wichtigsten Einflussfaktoren auf die
Gestehungskosten und auf die aktuelle Kostenentwicklung von Wohnraum in
Deutschland [Cost drivers for residential buildings – analysis and reflection of the key
impact factors on the costs and the actual cost development of living space in
Germany]. Arbeitsgemeinschaft für zeitgemäßes Bauen e.V. April 2015. ISBN 978‐3‐
939268‐29‐1. Available at
http://web.gdw.de/uploads/pdf/studien_gutachten/ARGE_2015_kostentreiber‐fuer‐
den‐wohnungsbau_studie.pdf
[15] Neitzel, M. et al.: Bericht der Baukostensenkungskommission [Report of the
Commission for the Reduction of Building Costs]. Bündnis für bezahlbares Wohnen
und Bauen. Publisher: Bundesministerium für Umwelt, Naturschutz und
Reaktorsicherheit. November 2015. Available at
www.bmu.de/fileadmin/Daten_BMU/Download_PDF/Wohnungswirtschaft/buendnis
_baukostensenkungskommission_bf.pdf.
[16] BauInfoConsult: Jahresanalyse 2014/2015: Marktdaten, Prognosen und Trends für
die Branche [Annual analysis 2014/2015: Market data, prognoses and trends for the
sector. Extract regarding construction faults presented in CCI‐Dialog. Available at
https://www.cci‐
EU H2020 754046 CoNZEBs
D3.1: Assessment & proposal for cost reduction in the design & construction process 161
dialog.de/branchenticker/2015/kw38/01/fehlerkosten_am_deutschen_bau_2014_w
ar_erneut_katastrophenjahr.html?backLink=/branchenticker/2015/kw38/01/fehlerk
osten_am_deutschen_bau_2014_war_erneut_katastrophenjahr.html.
[17] Erhorn, H. et al.: Source book on Guidelines for better enforcement of quality of the
works. EU IEE project QUALICHeCK. February 2017. Available at http://qualicheck‐
platform.eu/wp‐content/uploads/2017/02/QUALICHeCK‐source‐book‐Works.pdf.
[18] Kalksandstein Planungshandbuch: Planung, Konstruktion, Ausführung [Sand‐lime
brick planning guideline: design, construction, realisation]. Auflage 6.1 Januar 2014.
ISBN 978‐3‐7640‐0591‐7. Available at https://www.ks‐
original.de/sites/default/files/downloads/2016/pka_gesamt_ks‐
original_aufl_6_1_grau.pdf
[19] ALHO Modulare Gebäude: Modulgebäude aus der Raumfabrik [Mudular building of
the room factory]. Available at
https://www.alho.com/fileadmin/blaetterkataloge/de/broschueren/a_d_modulgeba
eude/blaetterkatalog/index.html.
[20] Spars, G.; Obadovic, O.: Baukostenentwicklung in Deutschland – Treiber und
Eindämmungsmaßnahmen [Development of building costs in Germany – Drivers and
reduction measures]. Article published at VDI Wissensforum. Available at
https://www.vdi‐wissensforum.de/news/baukostenentwicklung‐in‐deutschland‐
treiber‐und‐eindaemmungsmassnahmen.
[21] Palzer, U. et al.: Einfluss von typisierten und vorgefertigten Bauteilen oder
Bauteilgruppen auf die Kosten von Neubauten und Bestandsmodernisierungen
[Impact of typical and pre‐fabricated building component groups on costs of new and
renovated buildings]. Final report. Available at
http://www.bbsr.bund.de/BBSR/DE/FP/ZB/Auftragsforschung/2NachhaltigesBauenB
auqualitaet/2015/Bauteile/Endbericht.pdf?__blob=publicationFile&v=4.
[22] Benze, A.; Gill, J.; Hebert, S.: Serieller Wohnungsbau – Standardisierung der Vielfalt
[Serial residential construction – standardisation of the diversity. Study and project
research for the IBA Berlin 2020. 2013. Available at
https://www.stadtentwicklung.berlin.de/staedtebau/baukultur/iba/download/studie
n/IBA‐Studie_Serieller_Wohnungsbau.pdf.
[23] Chamber of architects of Baden‐Württemberg: Konzept – Bezahlbar Bauen und
Wohnen [Concept – Affordable building and living]. Workbook for contemporary
living. November 2017. Available at
https://www.akbw.de/fileadmin/download/dokumenten_datenbank/AKBW_Broschu
eren/Konzept/KONZEPT_Ausgabe3.pdf.
[24] RaboResearch ‐ Economic Research. Accessed on 5 June 2018. Available at
https://economics.rabobank.com/publications/2013/may/country‐report‐slovenia/
[25] Rast gradbeništva v Sloveniji (Growth of construction in Slovenia). Accessed on 5 June
2018. Available at https://data.si/blog/2017/06/19/rast‐gradbenistva‐v‐sloveniji/
EU H2020 754046 CoNZEBs
D3.1: Assessment & proposal for cost reduction in the design & construction process 162
[26] Statistical Office of the Republic of Slovenia. (SORS). Accessed on 5 June 2018.
Available at http://www.stat.si/StatWeb/en/News/Index/7469
[27] Resolution of national housing programme, Republic of Slovenia (2015‐2025).
Accessed on 3 June 2018. Available at http://www.jss‐mok.si/files/nsp_‐
_javna_objava.pdf
[28] Podcrto. Accessed on 3 June 2018. Available at https://podcrto.si/drzava‐bo‐dala‐30‐
milijonov‐evrov‐za‐nova‐neprofitna‐stanovanja/
[29] ZAPS Arhigram. Accessed on 26 May 2018. Available at
https://www.zaps.si/index.php?m_id=47
[30] IZS. Accessed on 26 May 2018. Available at
http://www.izs.si/fileadmin/dokumenti/pravilniki/MVIS‐marec‐2012‐potrjen‐29‐
skupscina‐objava‐www.pdf
[31] IZS: Dobra praksa (Best practice). Accessed on 26 May 2018. Available at
http://www.izs.si/dobra‐praksa/merila‐za‐vrednotenje‐inzenirskih‐
storitev/poenostavljena‐merila‐za‐vrednotenje‐inzenirskih‐storitev/
[32] IZS: Dobra praksa (Best practice): Priporočena bruto plača in priporočena cena ura
(Recommended gross salary and recommended price per hour). Accessed on 26 May
2018. Available at
http://www.izs.si/fileadmin/dokumenti/Dobra_praksa/Priporocena_bruto_placa_in_
priporocena_cena_ure‐IZS‐10‐1‐2018.pdf
[33] Štefan Žemva, Gradbene kalkulacije z osnovami operativnega planiranja in
obračunom gradnje objektov, 2010. Accessed on 5 June 2018. Available at
https://www.gzs.si/Portals/Panoga‐
Gradbenistvo/IZ%20PUBLIAKCIJE%20grad%20kalk_STR%20%20616‐
621%20%C5%A0TEFAN%20%C5%BDEMVA%202010.pdf
[34] Statistical Office of Republic of Slovenia SORS), Time evolution of Indices of
construction costs for new residential buildings. Accessed on 1 June 2018. Available
at http://pxweb.stat.si/pxweb/Database/Economy/Economy.asp
[35] GZS – ZGIGM, Gradbeni indeksi. Accessed on 2 June 2018. Available at
https://www.gzs.si/zbornica_gradbenistva_in_industrije_gradbenega_materiala/vse
bina/Gradbeni‐indeksi
[36] Design fees in France: https://www.french‐property.com/guides/france/building/new‐
build/architect/fees/
[37] https://www.architectes.org/actualites/un‐simulateur‐d‐honoraires‐de‐maitrise‐d‐oeuvre‐
en‐ligne
[38] Percentage fees in England. Available at: https://ttia.wordpress.com/2009/10/29/riba‐
removes‐percentage‐fee‐graph/
[39] Design fees in England. Available at:
https://www.designingbuildings.co.uk/wiki/Architect%27s_fees/
EU H2020 754046 CoNZEBs
D3.1: Assessment & proposal for cost reduction in the design & construction process 163
[40] Design Fees in Spain. Available at: https://www.spanisharchitect.info/2015/11/02/spanish‐
architects‐and‐their‐fees/
[41] Design Fees in Spain. Available at: http://www.tvarquitectura.com/wp/wp‐
content/uploads/Honorarios‐Arquitectos‐TvArquitectura.pdf
[42] Design Fees in Ireland. Available at:
http://www.riai.ie/consumer_services/working_with_an_architect_larger_projects/appointi
ng_an_architect/
[43] Design Fees in Ireland. Available at: https://www.boards.ie/b/thread/2057705034
[44] Perkins Eastman Architects, International Practice for Architects, John Wiley & Sons, 2007.
[45] KBOB, Raccomandazioni relative agli onorari di architetti e ingegneri, Confederazione
Svizzera, 2017. Available at:
http://www.sia.ch/fileadmin/content/download/themen/vergabewesen/Raccomandazioni_
onorari_2017.pdf
[46] Società svizzera Ingegneri e Architetti, Calcolo del coefficiente Z per gli onorari professionali.
Available at: http://www.sia.ch/fileadmin/content/download/sia‐norm/download/z‐
werte.pdf
[47] KBOB, I coefficienti Z della SIA, un confront, Confederazione Svizzera, 2017. Available
at:
file:///C:/Users/test/Downloads/Confronto%20coefficienti%20Z%20della%20SIA%20(1).pdf
[48] Turner & Townsend, International construction market survey 2016. 2016.
[49] Eurostast statistics, Construction producer price and construction cost indices overview,
2018. Available at: http://ec.europa.eu/eurostat/statistics‐
explained/index.php/Construction_producer_price_and_construction_cost_indices_overvie
w
[50] Eurostast statistics, Construction cost (or producer prices), new residential buildings ‐ annual
data, 2018. Available at: http://ec.europa.eu/eurostat/en/web/products‐datasets/‐
/STS_COPI_A
[51] Eurostast statistics, Construction cost of new residential buildings, 2018. Available at:
http://ec.europa.eu/eurostat/tgm/table.do?tab=table&plugin=1&language=en&pcode=teiis
510
[52] Eurostast statistics, Short‐term business statistics, 2018. Available at:
http://ec.europa.eu/eurostat/web/short‐term‐business‐statistics/data/database
[53] Ishak, N.H.; Chochan, A. H.; Ramly, A. : Implications of design deficiency on building
maintenance at post‐occupational stage. Journal of Building Appraisal, vol. 3, pp. 115 – 124.
doi: 10.1057/palgrave.jba.2950061, 2007
[54] Zhu, L.; Shan, M.; Hwang, B.G.: Overview of Design for Maintainability in Building and
Construction Research. Journal of Performance of Constructed Facilities, vol. 32 (1), 2018.
[55] Hassanain, M.A.; Al‐Hammad, A.M.; Fatayer, F.: Assessment of architectural defects
attributed to lack of maintenance feedback to the design team. Architectural Science Review,
vol. 57(2), pp. 132‐138, 2014. DOI: 10.1080/00038628.2013.783459.
[56] Love, P.E.D.; Lopez, R.; Edwards, D.J.: Reviewing the past to learn in the future: making sense
of design errors and failures in construction. Structure and Infrastructure Engineering, vol
9(7), pp. 675‐688, 2013. DOI: 10.1080/15732479.2011.605369
EU H2020 754046 CoNZEBs
D3.1: Assessment & proposal for cost reduction in the design & construction process 164
[57] Ganisen, S.; Mohammad, I.S.; Nesan, L.J.; Mohammed,A.H.; Kanniyapan, G.: The
identification of design for maintainability imperatives to achieve cost effective building
maintenance: A delphi study. Jurnal Teknologi, vol 77(30), pp. 75‐88, 2015 DOI:
10.11113/jt.v77.6871
[58] Architect fees in England. Available at:
https://www.designingbuildings.co.uk/wiki/Architect's_fees.
[59] Working with an architect. Available at:
http://www.riai.ie/consumer_services/working_with_an_architect/the_project_stages.
[60] A. Pittini, G. Koessl, J. Dijol, E. Lakatos, L. Ghekiere (2017) The state of housing in Europe, the
European Federation of Public, Cooperative and Social Housing
[61] K. Scanlon, M. Fernández Arrigoitia, M. E. Whitehead (2015) Social housing in Europe.
European Policy Analysis (17), pp. 1‐12.
[62] Zeit online: Mehr Sozialwohnungen gebaut. 2017. Available at
https://www.zeit.de/news/2017‐05/12/wohnungspolitik‐mehr‐sozialwohnungen‐gebaut‐
12111003. Last access: 15.10.18.
[63] T, Cunningham (2013) Factors affecting the cosst of building work ‐ An overview, Dublin
Institute of Technology,
https://arrow.dit.ie/cgi/viewcontent.cgi?article=1028&context=beschreoth
[64] S.M. Abourizk, A framework for applying simulation in construction Can. J. Civil Eng., 25
(1998), pp. 604‐617
[65] European Construction Sector Observatory (2017) Analytical Report ‐ Improving the human
capital basis
[66] http://www.buildup.eu/en/skills
[67] BRICKS ‐Building Refurbishment with Increased Competences, Knowledge and Skills,
http://www.bricks.enea.it/
[68] Andresen, S.: Fehlerkosten am deutschen Bau: 2014 war erneut Katastrophenjahr. CCI
Ticker. 14. September 2015. Available at https://www.cci‐
dialog.de/branchenticker/2015/kw38/01/fehlerkosten_am_deutschen_bau_2014_war_erne
ut_katastrophenjahr.html?backLink=/branchenticker/?date=14.09.2015. Last access:
14.10.18.
[69] INIVE EEIG: QUALICHeCK – Towards better quality and compliance. QUALICHECK platform.
International Network for Information on Ventilation and Energy Performance. 2018.
Available at http://qualicheck‐platform.eu/. Last access: 14.10.18.
[70] FRESH – Social Housing comprehEnsive Refurbishment through energy Performance
contrActing (FRESH), https://ec.europa.eu/energy/intelligent/projects/en/projects/fresh
[71] GuarantEE Building Energy Service in Europe. https://guarantee‐project.eu/
[72] EBC Annex 40, Commissioning of Building HVAC Systems for Improving Energy Performance,
http://www.iea‐ebc.org/projects/project?AnnexID=40
[73] Z. Magyar, European commissioning practices today, Presentation at: ACREX India 2014, New
Delhi, 28 March,2014,
www.rehva.eu/fileadmin/events/eventspdf/ACREX_2014/Magyar_Acrex_2014.pdf
[74] Prezzi Informativi dell’edilizia, Nuove costruzioni, DEI, Febbraio 2018.
[75] Miliani, A.: Personal communication, Xella Italia S.r.l.
EU H2020 754046 CoNZEBs
D3.1: Assessment & proposal for cost reduction in the design & construction process 165
[76] Caminiti, D.: Personal communication, LL ITALIA ‐ Costruzione e Ingegneria
[77] Paolini, A.: Personal communication, Giuliani S. C.
[78] https://ennogie.com/
[79] https://www.dnevnik.si/1042715508
[80] Pappalettere, S.: Progetto Sperimentale nearly Zero energy a Prato, Alinea Editrice, 2012
[81] EN 15251:2007: Indoor environmental input parameters for design and assessment of energy
performance of buildings addressing indoor air quality, thermal environment, lighting and
acoustics, 2007
[82] Zinzi, M., Mattoni, B., Roda, R., Ponzo, V. On the cost reduction of a nearly zero energy multi‐
family house in Italy: technical and economic assessment, 10th International Conference on
Applied Energy (ICAE2018), 22‐25 August 2018, Hong Kong, China, Energy Procedia, In Press
[83] Erhorn, H.; Kluttig, H.; Reiß, J.: Kosten‐ und flächensparendes Konzept für ein Mehrfamilien‐
Niedrigenergiewohnhaus im sozialen Wohnungsbau [Cost and space saving concept for a
multi‐family house (social housing). IBP‐Mitteilung 312 (1997). Available at
https://www.ibp.fraunhofer.de/content/dam/ibp/de/documents/Publikationen/IBP‐
Mitteilungen‐optimiert/312.pdf. Last access: 27.08.18
[84] ABG Frankfurt Holding: Günstig wohnen „Im Wiener“ in Oberrad [Low price living „Im
Wiener“ in (Frankfurt‐)Oberrad]. Website of the ABG Frankfurt Holding. Available at
https://www.abg‐fh.com/projekte/projekte‐daten/1‐aktuell‐in‐
bau/Im_Wiener/Im_Wiener_Oberrad.php. Last access: 19.09.18
[85] Catalogue Molio Prisdata/before V&S Prisdata, 2017.
[86] Liu, Y.; Guo, H.; Sun, C.; Chang, W.S.: Assessing Cross Laminated Timber (CLT) as an
Alternative Material for Midrise Residential Buildings in Cold Regions in China – A Life‐Cylce
Assessment Approach. Sustainability. October 2016.
[87] https://www.aereco.co.uk/technology/ventilation‐systems/
[88] Spengler, A.; Karl, C. K.: Was kostest BIM – und was nutzt es [What are the costs for BIM and
what good is it]? Build‐Ing. Die Plattform für Building Information Modeling. Available at
https://www.build‐ing.de/fachartikel/detail/was‐kostet‐bim‐und‐was‐nutzt‐
es/?seite=4&cHash=e2efb66975b8542d6e38632ffd14910b. Last access: 27.08.18
[89] B_I MEDIEN: BIM – Architekten sehen die Vorteile, aber scheuen die Kosten [BIM – architects
see the advantages but balk at the costs]. Available at https://www.bi‐medien.de/artikel‐
25241‐bm‐studie‐bim‐bei‐europas‐architekten.bi. Last access: 27.08.18
[90] USP/BauInfoConsult: Arch‐Vision – European Architectural Barometer. Index & Trends Q4 –
2017. Available at https://www.usp‐mc.nl/en/insights/usp‐shop/shop/european‐
architectural‐barometer/
[91] BauInfoConsult: BIM‐Monitor 2017. Available at
http://www.bauinfoconsult.de/presse/pressemitteilungen/2017/studie_bim_spart_erkennb
ar_kosten_doch_es_ist_kein_wundermittel/2695. Last access: 27.08.18
[92] Fernigan, F. E. : Big BIM, little bim: the practical approach to building information modeling:
integrated practice done the right way!, Salisbury, Md. ISBN: 0979569923. 2008.
[93] Azhar, S.; Hein, M.; Sketo, B.: Building information modeling (BIM): benefits, risks and
challenges, 44th ASC Annual Conference Auburn, Alabama, edited, 2‐5. 2008.

EU H2020 754046 CoNZEBs
D3.1: Assessment & proposal for cost reduction in the design & construction process 166
[94] PwC: BIM Level 2 Benefits Measurement Methodology to Public Sector Capital Assets. 2018.
Available at
https://www.cdbb.cam.ac.uk/Downloads/Level2/4.PwCBMMApplicationReport.pdf
[95] Lu, W.; Fung, A.; Peng, Y.;Liang, C.; Rowlinson, S.: Cost‐benefit analysis of Building
Information Modeling implementation in building projects through demystification of time‐
effort distribution curves. Building and Environment. 82. 317–327.
10.1016/j.buildenv.2014.08.030. 2014.
[96] http://www.psbj.co.uk/features/from‐the‐magazine/upfront/1242‐isgplc‐the‐use‐of‐bim‐
has‐resulted‐in‐cost‐savings‐of‐over‐2m‐for‐bristol‐business‐school, 24/07/2017
EU H2020 754046 CoNZEBs
D3.1: Assessment & proposal for cost reduction in the design & construction process 167
Annex ‐ Questionnaires in English and in participant countries languages
The questionnaires for the design and construction process are agreed among the CoNZEBs
partners are presented. The common questionnaires are in English, but they were translated
in participant countries language and, if considered relevant, country specific questions were
edited, removed or added.
To be noted that the questionnaire sent to construction companies and contractors included
both questionnaires the one related to design and planning process, and the one related to
the construction. The objective was to collect more information from the companies with
internal design office. Here for brevity the construction questionnaire refers to the
construction phase only.
EU H2020 754046 CoNZEBs
D3.1: Assessment & proposal for cost reduction in the design & construction process 168
English design process questionnaire
Summary of the Project and scope of the questionnaire
CoNZEBs identifies and assesses technology solution sets that lead to significant cost
reductions of new Nearly Zero‐Energy Multi‐Family Houses. The project started by setting
baseline costs for conventional new buildings, currently available NZEBs and buildings that
go beyond the NZEB level based on the experience of the consortium. An investigation of
end‐user’s experiences and expectations together with a guide on co‐benefits of NZEBs
promotes living in these buildings and enhances the energy performance by conducive user
behaviour. The technology solution sets include approaches that can reduce costs for
installations or generation systems. All solution sets are assessed regarding cost savings,
energy performance and applicability in multi‐family houses. A life cycle assessment of
different building levels and NZEBs using the solution sets provides a longer‐term
perspective.
The present questionnaire is implemented in the framework of Work Package 3 ‐ Cost
reduction in design and construction processes. It is aimed at detecting potential solutions
for cost reductions. Few data related to such process are available, as well as the
identification of solutions able to reduce costs maintaining the same energy performance
level. Some potential areas of cost reduction exist, even if they are not applied in a
systematic way. We believe that the experience of the market actors can be relevant to let
such potential solutions emerge and contribute to achieve significant technical and
economic benefits.
This questionnaire aims at detecting possible area of cost reductions during the design and
planning process3, as well as detecting design and planning solutions that may reduce the
overall construction costs of nearly zero multi‐family houses.
According to the aims of the Project, we ask your valuable support filling the questionnaire
and providing insight comments in order to increase information and knowledge about the
construction of new multi‐family houses.
3 The design costs refer to the fees for professional in charge of the design and planning of the building.
EU H2020 754046 CoNZEBs
D3.1: Assessment & proposal for cost reduction in the design & construction process 169
General information
Name of the company:_______________________________________________
Person in charge of the questionnaire:___________________________________
Role in the office:____________________________________________________
Address and contacts________________________________________________
Typology of the company/association Staff number
Designer/planner ‐ individual ___________
Designer/planner ‐ office ___________
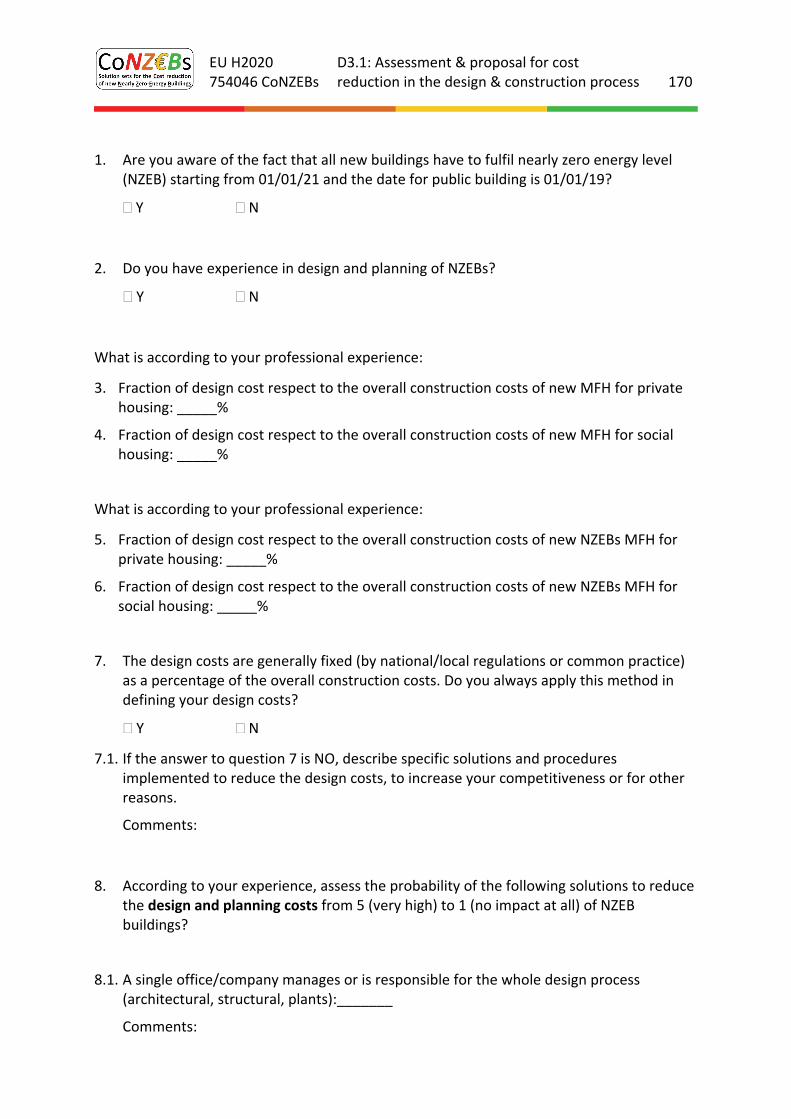
EU H2020 754046 CoNZEBs
D3.1: Assessment & proposal for cost reduction in the design & construction process 170
1. Are you aware of the fact that all new buildings have to fulfil nearly zero energy level
(NZEB) starting from 01/01/21 and the date for public building is 01/01/19?
Y N
2. Do you have experience in design and planning of NZEBs?
Y N
What is according to your professional experience:
3. Fraction of design cost respect to the overall construction costs of new MFH for private housing: _____%
4. Fraction of design cost respect to the overall construction costs of new MFH for social housing: _____%
What is according to your professional experience:
5. Fraction of design cost respect to the overall construction costs of new NZEBs MFH for private housing: _____%
6. Fraction of design cost respect to the overall construction costs of new NZEBs MFH for social housing: _____%
7. The design costs are generally fixed (by national/local regulations or common practice) as a percentage of the overall construction costs. Do you always apply this method in defining your design costs?
Y N
7.1. If the answer to question 7 is NO, describe specific solutions and procedures implemented to reduce the design costs, to increase your competitiveness or for other reasons.
Comments:
8. According to your experience, assess the probability of the following solutions to reduce the design and planning costs from 5 (very high) to 1 (no impact at all) of NZEB buildings?
8.1. A single office/company manages or is responsible for the whole design process (architectural, structural, plants):_______
Comments:
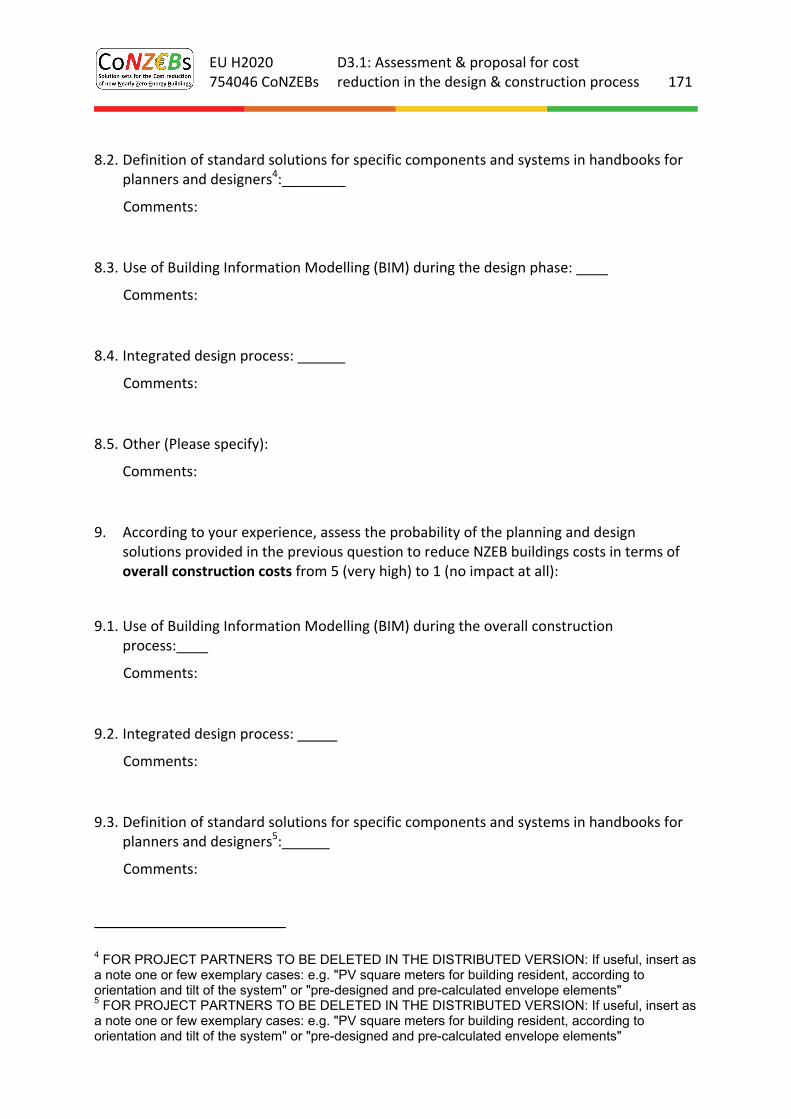
EU H2020 754046 CoNZEBs
D3.1: Assessment & proposal for cost reduction in the design & construction process 171
8.2. Definition of standard solutions for specific components and systems in handbooks for
planners and designers4:________
Comments:
8.3. Use of Building Information Modelling (BIM) during the design phase: ____
Comments:
8.4. Integrated design process: ______
Comments:
8.5. Other (Please specify):
Comments:
9. According to your experience, assess the probability of the planning and design solutions provided in the previous question to reduce NZEB buildings costs in terms of overall construction costs from 5 (very high) to 1 (no impact at all):
9.1. Use of Building Information Modelling (BIM) during the overall construction process:____
Comments:
9.2. Integrated design process: _____
Comments:
9.3. Definition of standard solutions for specific components and systems in handbooks for planners and designers5:______
Comments:
4 FOR PROJECT PARTNERS TO BE DELETED IN THE DISTRIBUTED VERSION: If useful, insert as a note one or few exemplary cases: e.g. "PV square meters for building resident, according to orientation and tilt of the system" or "pre-designed and pre-calculated envelope elements" 5 FOR PROJECT PARTNERS TO BE DELETED IN THE DISTRIBUTED VERSION: If useful, insert as a note one or few exemplary cases: e.g. "PV square meters for building resident, according to orientation and tilt of the system" or "pre-designed and pre-calculated envelope elements"
EU H2020 754046 CoNZEBs
D3.1: Assessment & proposal for cost reduction in the design & construction process 172
9.4. General design approach and criteria6:
9.4.1. External staircase: _______
Comments:
9.4.2. Bioclimatic planning: _______
Comments:
9.4.3. No underground cellar and parking: _______
Comments:
9.4.4. Optimization of service and common spaces: _______
Comments:
10. Maintenance is a crucial issue for cost optimisation during the building life cycle. Do you have experience about the maintenance plan and operation?
Y N
11. According to your professional opinion, is maintenance adequately planned during the design phase?
Y N
11.1. If the answer to questions 10 and 11 is YES, can you approximately quantify the long term cost reductions achievable with an accurate maintenance plan of current energy requirements MFH compared to common maintenance plan?_____[%]
Comments:
11.2. If the answer to questions 10 and 11 is YES, can you approximately quantify the long term cost reductions achievable with an accurate maintenance plan of NZEB compared to common maintenance plan?_____[%]
6 FOR PROJECT PARTNERS TO BE DELETED IN THE DISTRIBUTED VERSION: if useful you could include exemplary solutions as the ones I listed in brackets).

EU H2020 754046 CoNZEBs
D3.1: Assessment & proposal for cost reduction in the design & construction process 173
Comments:
12. Additional ideas for cost savings during the design process
EU H2020 754046 CoNZEBs
D3.1: Assessment & proposal for cost reduction in the design & construction process 174
English construction process questionnaire
Summary of the Project and scope of the questionnaire
CoNZEBs identifies and assesses technology solution sets that lead to significant cost
reductions of new Nearly Zero‐Energy Multi‐Family Houses. The project started by setting
baseline costs for conventional new buildings, currently available NZEBs and buildings that
go beyond the NZEB level based on the experience of the consortium. An investigation of
end‐user’s experiences and expectations together with a guide on co‐benefits of NZEBs
promotes living in these buildings and enhances the energy performance by conducive user
behaviour. The technology solution sets include approaches that can reduce costs for
installations or generation systems. All solution sets are assessed regarding cost savings,
energy performance and applicability in multi‐family houses. A life cycle assessment of
different building levels and NZEBs using the solution sets provides a longer‐term
perspective.
The present questionnaire is implemented in the framework of Work Package 3 ‐ Cost
reduction in design and construction processes. It is aimed at detecting potential solutions
for cost reductions. Few data related to such process are available, as well as the
identification of solutions able to reduce costs maintaining the same energy performance
level. Some potential areas of cost reduction exist, even if they are not applied in a
systematic way. We believe that the experience of the market actors can be relevant to let
such potential solutions emerge and contribute to achieve significant technical and
economic benefits.
This questionnaire aims at detecting possible area of cost reductions during the construction
process, including the design and planning process, as well as detecting design and planning
solutions that may reduce the overall construction costs of nearly zero multi‐family houses.
According to the aims of the Project, we ask your valuable support filling the questionnaire
and providing insight comments in order to increase information and knowledge about the
construction of new multi‐family houses.
EU H2020 754046 CoNZEBs
D3.1: Assessment & proposal for cost reduction in the design & construction process 175
General information
Name of the company:_______________________________________________
Person in charge of the questionnaire:___________________________________
Role in the office:____________________________________________________
Address and contacts________________________________________________
Typology of the company/association Staff number
Construction company ___________
Construction and design/planning company ___________
Housing company/association ___________
Housing company/association with own design office ___________
EU H2020 754046 CoNZEBs
D3.1: Assessment & proposal for cost reduction in the design & construction process 176
CONSTRUCTION PROCESS QUESTIONNAIRE
1. Are you aware of the fact that all new buildings have to fulfil nearly zero energy level (NZEB) starting from 01/01/21 and the date for public building is 01/01/19?
Y N
2. Do you have experience in construction of NZEBs?
Y N
3. Do you directly execute works or hire sub‐contractors?
Directly Execute works Hire sub‐contractors Both
4. Have you experienced increase/decrease of construction costs respect to the initial planning?
Y N
4.1. If the answer to question 4 is YES, quantify an average relative cost change you experienced in past projects with current energy requirements highlighting if it was an increase (+) or a decrease (‐):_____%
and rate from 5 (very high) to 1 (no impact at all) the following potential causes and
possibly provide details in the Comment section:
⌂ Poor design quality:___________
⌂ Delivery time delays of building components and systems:___________
⌂ Technical accidents during the construction process:_____
⌂ Financial problems:_________
Comment:
4.2. If the answer to question 4 is YES, quantify an average relative cost increase you experienced in past projects with NZEB requirements:_____%
and rate from 5 (very high) to 1 (no impact at all) the following potential causes and
possibly provide details in the Comment section:
⌂ Poor design quality:_________
⌂ Delivery time delays of building components and systems:________________
EU H2020 754046 CoNZEBs
D3.1: Assessment & proposal for cost reduction in the design & construction process 177
⌂ Technical accidents during the construction process:_________
⌂ Financial problems:_________
Comment:
5. Do you adopt or plan to adopt solutions to reduce costs during the construction process?
Y N
5.1. If the answer to question 5 is YES, describe solutions and measures, and quantify the relative economic savings (%) respect to standard construction costs of each possible solution
Comment:
6. According to your experience, assess the probability of the following solutions to reduce the construction costs from 5 (very high) to 1 (no impact at all):
6.1. Use of Building Information Modelling (BIM) in the construction process:____
Comments:
6.2. Use of industrialised/precast systems and components, or other technical solutions aimed at reducing the installation and construction time:____
Comments:
6.3. Hire highly skilled workers to make faster and safer the construction process:____
Comments:
6.4. Efficient quality control in each phase of the process to avoid extra costs for repairing/redoing operations:____
EU H2020 754046 CoNZEBs
D3.1: Assessment & proposal for cost reduction in the design & construction process 178
Comments:
6.5. Optimisation of the building site, including supply and disposal of goods:____
Comments:
6.6. Application of Energy Performance Contracts to assure the correct and timely execution of the construction:____
Comments:
7. Additional ideas for cost savings during the design process
Comments:
EU H2020 754046 CoNZEBs
D3.1: Assessment & proposal for cost reduction in the design & construction process 179
Italian design process questionnaire
Questionario sulla riduzione dei costi di progettazione di edifici a consumo
energetico quasi zero
Informazioni generali7
Nome dell’azienda/studio:
Persona incaricata di compilare il questionario (facoltativo):
Ruolo nell’azienda (facoltativo):
Indirizzo e contatti (facoltativo):
Città:
Progettista individuale
Studio di progettazione (numero di dipendenti/collaboratori:___)
Sommario del progetto e obiettivi del questionario
CoNZEBs (https://www.conzebs.eu), finanziato dall'Unione Europea, identifica e sviluppa
soluzioni tecnologiche mirate alla riduzione dei costi degli edifici multifamiliari ad Energia
quasi zero (NZEB). Il progetto è iniziato con une review dei costi per la realizzazione di edifici
convenzionali, di edifici NZEB e di edifici con prestazioni superiori agli NZEB. Una indagine
sulla esperienza e sulle aspettative degli utenti finali degli edifici in aggiunta ad una guida
illustrative sui benefici degli NZEB, permetteranno di promuovere la vita in questi edifici e
migliorare le performance energetiche degli stessi grazie al comportamento virtuoso degli
utenti. Il set di soluzioni tecnologiche proposte include strategie finalizzate alla riduzione dei
costi di installazione e generazione energetica. Tutte le soluzioni sono valutate in termini di
risparmio sui costi, rendimento energetico e applicabilità in edifici multifamiliari. La
valutazione del ciclo di vita di edifici convenzionali ed NZEB utilizzando il set di soluzioni
identificate permetterà di valutarne l’impatto con prospettiva a lungo termine.
Il presente questionario è stato sviluppato nell’ambito del Work Package 3‐ Riduzione dei
costi nelle fasi di progettazione e costruzione. Obiettivo del suddetto è l’identificazione di
potenziali soluzioni per la riduzione dei costi. Alcuni dati relative ai costi dei progettazione e
costruzione sono disponibili, così come è possibile identificare soluzioni in grado di ridurre
costi a parità di prestazione energetica. Infatti potenziali aree di ottimizzazione e riduzione
7 Le informazioni non saranno divulgate all'esterno ma usate da ENEA per analisi statistiche
EU H2020 754046 CoNZEBs
D3.1: Assessment & proposal for cost reduction in the design & construction process 180
dei costi sono presenti, per quanto non attualmente sfruttate in maniera sistematica. Gli
autori ritengono che l’esperienza di attori del mercato può essere rilevante e di grande aiuto
per far emergere l’importanza di tali soluzioni ottimizzate e contribuire al raggiungimento di
ragguardevoli benefici economici e tecnologici.
Il questionario mira alla definizione di possibili interventi per la riduzione dei costi nella fase
di progettazione dell’edificio e alla identificazione di soluzioni progettuali che riducano il
costo di costruzione totale di edifici multifamiliari a energia quasi zero. Per il conseguimento
degli obiettivi del Progetto, chiediamo il vostro prezioso supporto nella compilazione del
presente questionario fornendo quando possibile commenti aggiuntivi che possano
accrescere le nostre e conoscenze sulla costruzione di nuovi edifici plurifamiliari NZEB.
In linea con gli obiettivi del progetto i costi da considerare sono unicamente quelli per il
progetto: architettonico, impiantistico, strutturale.
1. E’ a conoscenza del fatto che tutti i nuovi edifici a partire dal 01/01/21 e gli edifici pubblici dal 01/01/19 dovranno soddisfare i requisiti degli edifici a energia quasi zero (NZEB) ?
Si No
2. Ha esperienza nel campo del design e della progettazione di edifici NZEB?
Si No
Sulla base della sua esperienza professionale, saprebbe quantificare:
3. La frazione del costo di progettazione rispetto al costo complessivo dell’opera nei nuovi edifici multifamiliari residenziale nell’edilizia privata: _____%
4. La frazione del costo di progettazione rispetto al costo complessivo dell’opera nei nuovi edifici multifamiliari residenziale nell’edilizia sociale pubblica: _____%
Sulla base della sua esperienza professionale, saprebbe quantificare:
5. La frazione del costo di progettazione rispetto al costo complessivo dell’opera nei nuovi edifici multifamiliari residenziale NZEB nell’edilizia privata: _____%
6. La frazione del costo di progettazione rispetto al costo complessivo dell’opera nei nuovi edifici multifamiliari residenziale NZEB nell’edilizia sociale pubblica: _____%
EU H2020 754046 CoNZEBs
D3.1: Assessment & proposal for cost reduction in the design & construction process 181
7. I costi di progettazione sono generalmente fissati (dai regolamenti nazionali / locali o
dalla prassi comune) come percentuale dei costi complessivi di costruzione. Applica sempre questo metodo nella definizione dei costi di progettazione?
Si No
7.1. Se la risposta alla domanda 7 è NO, descriva soluzioni e procedure specifiche implementate per ridurre i costi di progettazione, aumentare la competitività della sua azienda o per altri motivi.
Commenti:
8. Sulla base della sua esperienza, valuti la capacità delle seguenti soluzioni di ridurre i costi di progettazione da 5 (molto alto) a 1 (nessun impatto) degli edifici NZEB.
8.1. Un singolo studio gestisce o è responsabile dell'intero processo di progettazione (architettonico, strutturale, impiantistico):_______
Commenti:
8.2. Definizione di soluzioni standard per specifici componenti e sistemi raccolti in manuali per progettisti (ad esempio: definizione di pacchetti di involucro pre‐calcolati per diverse tecnologie costruttive, manuali con soluzioni standard di impianti per edifici NZEB, ecc.):________
Commenti:
8.3. Uso di metodi basati sul Building Information Modeling (BIM): ____
Commenti:
8.4. Progetto integrato: ______
Commenti:
8.5. Altro (Specificare):
Commenti:
9. Sulla base della sua esperienza, valuti la capacità delle seguenti soluzioni di ridurre I costi degli edifici NZEB in termini di costi complessivi del processo di costruzione da 5 (molto alto) a 1 (nessun impatto):
9.1. Uso di metodi basati sul Building Information Modeling (BIM):____
EU H2020 754046 CoNZEBs
D3.1: Assessment & proposal for cost reduction in the design & construction process 182
Commenti:
9.2. Progetto integrato: _____
Commenti:
9.3. Definizione di soluzioni standard per specifici componenti e sistemi raccolti in manuali per progettisti (vedi 8.2):______
Commenti:
9.4. Approccio e criteri generali di progettazione:
9.4.1. Progettazione bioclimatica: _______
Commenti:
9.4.2. Assenza di locali o parcheggi interrati: _______
Commenti:
9.4.3. Ottimizzazione e razionalizzazione di spazi comuni di distribuzione (ad esempio riduzione del numero di vani scala): _______
Commenti:
9.4.4. Altro (Specificare):
Commenti:
10. La manutenzione è un aspetto cruciale per l'ottimizzazione dei costi durante il ciclo di vita dell'edificio. Ha esperienza di redazione di piano di manutenzione e piani operativi?
Si No
11. Sulla base della sua opinion professionale, la manutenzione è adeguatamente pianificata durante la fase di progettazione dell’opera?
Si No
EU H2020 754046 CoNZEBs
D3.1: Assessment & proposal for cost reduction in the design & construction process 183
11.1. Se la risposta alle domande 10 e 11 è Sì, è in grado di quantificare
approssimativamente la riduzione dei costi a lungo termine ottenibile negli edifici residenziali multifamiliari convenzionali applicando un accurato piano di manutenzione piuttosto che un piano di manutenzione standard ?_____[%]
Commenti:
11.2. Se la risposta alle domande 10 e 11 è Sì, è in grado di quantificare approssimativamente la riduzione dei costi a lungo termine ottenibile negli edifici residenziali multifamiliari NZEB applicando un accurato piano di manutenzione piuttosto che un piano di manutenzione standard?_____[%]
Commenti:
12. Ulteriori strategie per risparmiare sui costi durante il processo di progettazione
EU H2020 754046 CoNZEBs
D3.1: Assessment & proposal for cost reduction in the design & construction process 184
Italian construction process questionnaire
Questionario sulla riduzione dei costi di realizzazione di edifici a consumo
energetico quasi zero
Sommario del progetto e obiettivi del questionario
CoNZEBs (www.conzebs.eu) identifica e sviluppa soluzioni tecnologiche mirate alla riduzione
dei costi degli edifici residenziali multifamiliari ad Energia quasi zero (NZEB). Il progetto è
iniziato con la definizione dei costi per a realizzazione di edifici convenzionali, di edifici NZEB
e di edifici con prestazioni superiori agli NZEB attualmente realizzati. Una indagine sulla
esperienza e sulle aspettative degli utenti finali degli edifici in aggiunta ad una guida
illustrative sui benefici degli NZEB, permetteranno di promuovere la vita in questi edifici e
migliorare le performance energetiche degli stessi grazie al comportamento virtuoso degli
utenti. Il set di soluzioni tecnologiche proposte include strategie finalizzate alla riduzione dei
costi di installazione e generazione energetica. Tutte le soluzioni sono valutate in termini di
risparmio sui costi, rendimento energetico e applicabilità in edifici multifamiliari. La
valutazione del ciclo di vita di edifici convenzionali ed NZEB utilizzando il set di soluzioni
identificate permetterà di valutarne l’impatto con prospettiva a lungo termine.
Il presente questionario è stato sviluppato nell’ambito del Work Package 3‐ Riduzione dei
costi nelle fasi di progettazione e costruzione. Obiettivo del suddetto è l’identificazione di
potenziali soluzioni per la riduzione dei costi. Alcuni dati relativi ai costi dei progettazione e
costruzione sono disponibili, così come è possibile identificare soluzioni in grado di ridurre
costi a parità di prestazione energetica. Gli autori sono convinti che l’esperienza di attori del
mercato può di grande aiuto per far emergere l’importanza di tali soluzioni ottimizzate e
contribuire al raggiungimento di ragguardevoli benefici economici e tecnologici.
Il questionario riguarda la costruzione di edifici multifamiliari a energia quasi zero, secondo
quanto stabilito dalla normativa di riferimento (Decreto interministeriale 26 giugno 2015 ‐
Applicazione delle metodologie di calcolo delle prestazioni energetiche e definizione delle
prescrizioni e dei requisiti minimi degli edifici). Per il conseguimento degli gli obiettivi del
Progetto, chiediamo il vostro prezioso supporto attraverso la compilazione del presente
questionario, fornendo quando possibile commenti aggiuntivi che possano accrescere le
nostre informazioni e conoscenze sul processo costruttivo di nuovi edifici plurifamiliari. Per
le imprese di costruzione prive di studio di progettazione interno si richiede la compilazione
della sola sezione B.
Per inviare il questionario compilato e per qualsiasi ulteriore informazione scrivere a:
EU H2020 754046 CoNZEBs
D3.1: Assessment & proposal for cost reduction in the design & construction process 185
Informazioni generali8
Nome dell’azienda/studio:
Persona incaricata di compilare il questionario (facoltativo):
Ruolo nell’azienda (facoltativo):
Indirizzo e contatti (facoltativo):
Città:
Tipologia di azienda Numero di dipendenti/collaboratori
Impresa di costruzioni ___________
Impresa di progettazione e costruzioni integrata ___________
Azienda di edilizia residenziale pubblica ___________
Azienda di edilizia residenziale pubblica provvista di
un proprio studio di progettazione __________
8 Le informazioni non saranno divulgate all'esterno ma usate da ENEA per analisi statistiche

EU H2020 754046 CoNZEBs
D3.1: Assessment & proposal for cost reduction in the design & construction process 186
1. E’ a conoscenza del fatto che tutti i nuovi edifici a partire dal 01/01/21 e gli edifici
pubblici dal 01/01/19 dovranno soddisfare i requisiti degli edifici a energia quasi zero (NZEB) ?
Si No
2. Ha esperienza nella costruzione di edifici NZEBs?
Si No
3. Lei esegue direttamente i lavori di costruzione oppure sub‐appalTa a ditte esterne?
Eseguo direttamente i lavori Sub‐appalto a ditte esterne Entrambi
4. Ha mai sperimentato una riduzione/aumento dei costi di costruzione rispetto ai costi pianificati inizialmente?
Si N
4.1. Se la risposta alla domanda 16 è SI, quantifichi in termini percentuali (aumento o decremento) la variazione tra costo pianificato e costo di costruzione effettivo per la realizzazione di edifici realizzati con prestazioni energetiche secondo i requisiti minimi di legge:_____%
E classifichi da 5 (molto elevato) a 1 (nessun impatto) le potenziali cause di questa
variazione possibilmente fornendo dettagli nella sezione “Commenti”:
⌂ Scarsa qualità della progettazione:___________
⌂ Ritardi nella consegna/realizzazione dei componenti dell’edificio o degli
impianti:___________
⌂ Imprevisti di tipo tecnico durante l’esecuzione dei lavori:_____
⌂ Problemi finanziari:_________
Commenti:
4.2. Se la risposta alla domanda 16 è SI, quantifichi in termini percentuali (aumento o decremento) la variazione sperimentata tra costo iniziale pianificato e costo di costruzione effettivo nella realizzazione di edifici NZEB :_____%
E classifichi da 5 (molto elevato) a 1 (nessun impatto) le potenziali cause di questa
variazione possibilmente fornendo dettagli nella sezione “Commenti”:
⌂ Scarsa qualità della progettazione:___________
EU H2020 754046 CoNZEBs
D3.1: Assessment & proposal for cost reduction in the design & construction process 187
⌂ Ritardi nella consegna/realizzazione dei componenti dell’edificio o degli
impianti:___________
⌂ Imprevisti di tipo tecnico durante l’esecuzione dei lavori:_____
⌂ Problemi finanziari:_________
Commenti:
5. Sta adottando o ha in mente di adottare soluzioni per la riduzione dei costi nella fase di costruzione dell’edificio?
Si No
5.1. Se la risposta alla domanda 17 è sì, descriva tali soluzioni per la riduzione dei costi e quantifichi il risparmio economico (%) di ogni soluzione rispetto agli standard Commenti:
6. Sulla base della sua esperienza, valuti la probabilità delle seguenti soluzioni di ridurre i costi di costruzione da 5 (molto alto) a 1 (nessun impatto):
6.1. Uso del Building Information Modeling (BIM) nel processo di costruzione:____
Commenti:
6.2. Utilizzo di sistemi e componenti industrializzati / prefabbricati o altre soluzioni tecniche volte a ridurre i tempi di installazione e di costruzione:____
Commenti:
6.3. Assumere lavoratori altamente qualificati per rendere più veloce e sicuro il processo di costruzione:____
Commenti:
6.4. Controllo efficiente e costante della qualità delle operazioni in ogni fase del processo per evitare costi aggiuntivi di riparazione / rifacimento:____
Commenti:
6.5. Ottimizzazione delle operazioni di cantiere, compresa la fornitura e lo smaltimento di merci:____
EU H2020 754046 CoNZEBs
D3.1: Assessment & proposal for cost reduction in the design & construction process 188
Commenti:
6.6. Applicazione dei Contratti di Performance Energetica per assicurare la corretta e tempestiva esecuzione della costruzione:____
Commenti:
7. Ulteriori strategie per risparmiare sui costi durante il processo di costruzione
EU H2020 754046 CoNZEBs
D3.1: Assessment & proposal for cost reduction in the design & construction process 189
Danish design process questionnaire
Resume af EU‐projektet CoNZEBs9 og spørgeskemaets formål
I CoNZEBs projektet arbejdes der med at identificere teknologiske pakkeløsninger, som fører
til reduktion af omkostningerne ved at opføre Bygningsklasse 2020 (BK2020) etage
boligbyggeri. Teknologipakkerne indeholder både klimaskærmstiltag og tiltag, der reducerer
omkostningerne til installationer og forsyningssystemer. Alle pakkeløsninger evalueres i
relation til besparelser, energi og egnethed til etagebyggeri. En livscyklus‐vurdering
omfattende drivhusgasudledninger og energibehov for BR15, BK2020 og Plus‐energi byggeri
vil give mulighed for at foretage sammenligninger mellem bygningsklasserne med et længere
tidsperspektiv.
Projektet påbegyndtes i juni 2017 og lagde ud med at fastsætte referenceomkostninger for:
Konventionelt opførte bygninger i henhold til bygningsreglementet
Eksisterende BK2020 byggeri og
Plus‐energi byggeri.
baseret på projektdeltagernes erfaring og indhentede oplysninger om nyligt gennemførte
byggerier.
Projektet analyserer mulige besparelser, der kan opnås i projekteringsfasen. Nærværende
spørgeskema er udformet til dette formål.
Ideen med spørgeskemaet er at identificere potentielle ideer og løsninger til opnåelse af
omkostningsreduktioner for Bygningsklasse 2020 (BK2020) byggeri i projekteringen.
Der er meget begrænsede data tilgængelige omkring disse spørgsmål. De muligheder for
omkostningsreduktion, der findes, benyttes ikke systematisk og vi tror på at branchens
erfaringer kan være særdeles relevante for at dokumentere disse løsninger, så de kan blive
mere udbredt og lede til betydelige tekniske og økonomiske fordele.
I overensstemmelse med projektets overordnede formål beder vi om din værdifulde hjælp
ved at udfylde dette spørgeskema og derved videregive din viden og indsigt på dette
område, således at vi kan opnå øget information og viden om mulige omkostnings‐
reduktioner ved opførelse af BK2020 etage boligbyggeri.
Med venlig hilsen, på vegne af de danske deltagere i CoNZEBs projektet:
Statens Byggeforskningsinstitut, Aalborg Universitet
Kuben Management
9 https://www.conzebs.eu/
EU H2020 754046 CoNZEBs
D3.1: Assessment & proposal for cost reduction in the design & construction process 190
BL, Danmarks almene boliger
General information
Virksomhedens navn: _______________________________________________
Navn: _______________________________________________
Rolle i virksomheden: _______________________________________________
Adresse og kontakt: _______________________________________________
Antal medarbejdere: _____
EU H2020 754046 CoNZEBs
D3.1: Assessment & proposal for cost reduction in the design & construction process 191
1. Er du opmærksom på, at alle nye bygninger, ifølge EU's bygningsdirektiv, skal opfylde
”næsten nul‐energi niveau” fra 01/01/21, og datoen for offentlige bygninger er 01/01/19? I Danmark er Bygningsklasse 2020 (den danske fortolkning af næsten nul‐energi niveau) indtil videre frivillig.
Ja Nej
2. Har du erfaring med projektering af Bygningsklasse 2020‐byggeri?
Ja Nej
Hvad er ifølge din erfaring:
3. Størrelsen af projekteringsomkostninger i forhold til de samlede byggeomkostninger for nye etageboliger til privat udlejning : _____%
4. Størrelsen af projekteringsomkostninger i forhold til de samlede byggeomkostninger for nye etageboliger til almene boliger: _____%
Hvad er ifølge din erfaring:
5. Størrelsen af projekteringsomkostninger i forhold til de samlede byggeomkostninger for nye Bygningsklasse 2020 etageboliger til private udlejning: _____%
6. Størrelsen af projekteringsomkostninger i forhold til de samlede byggeomkostninger for nye Bygningsklasse 2020 etageboliger til almene boliger: _____%
7. Projekteringsomkostningerne fastsættes ofte som en procentdel af de samlede byggeomkostninger. Anvender du altid denne metode til at definere dine projekteringsomkostninger?
Traditionelt byggeri Ja Nej
Bygningsklasse 2020 byggeri Ja Nej
7.1. Hvis svaret på spørgsmål 7 er NEJ, beskriv specifikke løsninger og procedurer, der er indført for at reducere projekteringsomkostningerne, for at øge din konkurrenceevne eller af andre grunde.
Kommentarer: ______________________________________________________
8. Vurdér sandsynligheden for følgende løsningers mulighed for reduktion af projekteringsomkostninger fra 5 (meget høj) til 1 (ingen indvirkning overhovedet) af Bygningsklasse 2020 etageboliger
EU H2020 754046 CoNZEBs
D3.1: Assessment & proposal for cost reduction in the design & construction process 192
8.1. Et enkelt firma er ansvarlig for hele projekteringsprocessen (arkitektur, konstruktioner, systemer):_______
Kommentarer: ______________________________________________________
8.2. Standardløsninger til specifikke komponenter og systemer i håndbøger til projekterende: ________
Kommentarer: ______________________________________________________
8.3. Brug af Building Information Modelling (BIM) i projekteringsfasen: ____
Kommentarer: ______________________________________________________
8.4. Integreret projekteringsproces: ______
Kommentarer: ______________________________________________________
8.5. Andet (beskriv venligst ):
Kommentarer: ______________________________________________________
9. Vurdér sandsynligheden for at nedenstående projekteringsløsninger, kan bruges for at reducere de samlede byggeomkostninger for Bygningsklasse 2020 i forhold til de samlede byggeomkostninger fra 5 (meget høj) til 1 (ingen indvirkning):
9.1. Standardløsninger til specifikke komponenter og systemer i håndbøger til projekterende: ______
Kommentarer: ______________________________________________________
9.2. Brug af Building Information Modeling (BIM) generelt i byggeprocessen:____
Kommentarer: ______________________________________________________
9.3. Integreret projekteringsproces: _____
Kommentarer: ______________________________________________________
9.4. Generel projektering af alternative løsninger
9.4.1. Udvendig trappe: _______
EU H2020 754046 CoNZEBs
D3.1: Assessment & proposal for cost reduction in the design & construction process 193
Kommentarer: ___________________________________________
9.4.2. Bioklimatisk projektering: _______
Kommentarer: ___________________________________________
9.4.3. Ingen underjordisk kælder og/eller parkering: _______
Kommentarer: ___________________________________________
9.4.4. Optimering af service‐ og fællesrum: _______
Kommentarer: ___________________________________________
9.5. Andet (beskriv venligst ):
Kommentarer: ______________________________________________________
10. Vedligeholdelse er et afgørende spørgsmål for omkostningsoptimering i løbet af bygningens levetid. Har du erfaring med vedligeholdelsesplaner og drift?
Traditionelt byggeri: Ja Nej
Bygningsklasse 2020 byggeri: Ja Nej
11. Ifølge din mening, er vedligeholdelse tilstrækkeligt ind tænkt i projekteringsfasen?
Traditionelt byggeri: Ja Nej
Bygningsklasse 2020 byggeri: Ja Nej
11.1. Hvis svaret på spørgsmål 10 og 11 er JA, kan du give et overslag på de langsigtede omkostningsreduktioner, der kan opnås med en detaljeret vedligeholdelsesplan for nuværende energikrav i etageboliger sammenlignet med en almindelig vedligeholdelsesplan? _____[%]
Kommentarer: ______________________________________________________
11.2. Hvis svaret på spørgsmål 10 og 11 er JA, kan du give et overslag på de langsigtede omkostningsreduktioner, der kan opnås med en detaljeret vedligeholdelsesplan for Bygningsklasse 2020 sammenlignet med en almindelig vedligeholdelsesplan?_____[%]
Kommentarer: ______________________________________________________
12. Yderligere ideer til omkostningsbesparelser under projekteringsprocessen og/eller som kan lede til besparelser for hele byggeprocessen?
13. Kommentarer: ______________________________________________________
EU H2020 754046 CoNZEBs
D3.1: Assessment & proposal for cost reduction in the design & construction process 194
Danish construction process questionnaire
SPØRGSMÅL TIL BYGGEFASEN FOR BYGNINGSKLASSE 2020
1. Har du selv ansvaret for udførelse af byggeriet eller hyrer du underentreprenører?
Udfører arbejdet direkte
Hyrer underentreprenører
Begge dele
2. Vurder de omkostningsændringer, som du har oplevet i projekter med de aktuelle energikrav, og indiker, om det var en stigning (+) eller et fald (‐):_____%
… og bedøm fra 5 (meget høj) til 1 (ingen indflydelse overhovedet) følgende mulige årsager og giv gerne detaljer i kommentarfeltet:
⌂ Dårlig projektering : ___________
⌂ Forsinkelser på levering af bygningskomponenter og ‐systemer: ___________
⌂ Uforudsete tekniske hændelser under byggeriet: _____
⌂ Finansielle problemer:_________
Kommentarer:
3. Vurder de omkostningsændringer, som du har oplevet i projekter med Bygningsklasse 2020 energikrav, og angiv, om det var en stigning (+) eller et fald (‐):_____%
og bedøm fra 5 (meget høj indflydelse) til 1 (ingen indflydelse overhovedet) følgende
mulige årsager og giv gerne detaljer i kommentarfeltet:
⌂ Dårlig projektering : ___________
⌂ Forsinkelser på levering af bygningskomponenter og ‐systemer:___________
⌂ Uforudsete tekniske hændelser under byggeriet:_____
⌂ Finansielle problemer:_________
Kommentarer:
4. Har I, eller planlægger I, at indføre løsninger til at reducere omkostningerne under byggeprocessen?
Traditionelt byggeri: …Ja Nej
NZEB byggeri: …Ja Nej
EU H2020 754046 CoNZEBs
D3.1: Assessment & proposal for cost reduction in the design & construction process 195
4.1. Hvis svaret på spørgsmål 5 er JA, beskriv løsninger og foranstaltninger og størrelsen af de relative økonomiske besparelser (%) i forhold til de normale byggeomkostninger for hver løsning?
Kommentarer:
5. Vurder sandsynligheden for effekten af følgende løsningsforslag til reduktion af byggeomkostninger fra 5 (meget høj) til 1 (ingen indflydelse) :
5.1. Brug af Building Information Modelling (BIM) i byggeprocessen:____
Kommentarer:
5.2. Anvendelse af industrialiserede / præfabrikerede systemer og komponenter eller andre tekniske løsninger med det formål at reducere byggetiden: ____
Kommentarer:
5.3. Højtuddannede arbejdere for at få en hurtigere og sikrere byggeproces:____
Kommentarer:
5.4. Effektiv kvalitetskontrol i hver fase af processen for at undgå ekstra omkostninger til fejlretning : ____
Kommentarer:
5.5. Optimering af byggepladsen, herunder levering af varer og bortskaffelse af affald?: ____
Kommentarer:
6. Yderligere ideer til omkostningsbesparelser under byggeprocessen?
Komme
EU H2020 754046 CoNZEBs
D3.1: Assessment & proposal for cost reduction in the design & construction process 196
German design process questionnaire
Überblick über das Projekt und den Fragebogen
Im Rahmen des CoNZEBs‐Projekts sollen technische Gesamtlösungen (technology solution
sets) erarbeitet und bewertet werden, die erhebliche Kostensenkungen bei der Erstellung
neuer Niedrigstenergie‐Mehrfamilienhäuser (NZEB‐MFH) ermöglichen. Basierend auf den
Erfahrungen des Konsortiums wurden zu Beginn des Projekts zunächst Referenzkosten für
konventionelle Neubauten, für derzeit am Markt verfügbare Niedrigstenergiegebäude sowie
für Gebäude, die energetisch noch höherwertiger als Niedrigstenergiegebäude sind,
festgelegt. Zusammen mit einem Leitfaden über den Zusatznutzen von NZEBs liefert eine
Studie zu den Erfahrungen und Erwartungen der Endnutzer Empfehlungen für das Wohnen
in diesen Gebäuden und trägt zur Verbesserung der Gebäudeenergieeffizienz durch
angemessenes Nutzerverhalten bei. Die technischen Gesamtlösungen beinhalten Ansätze,
durch die Kosten für die Gebäudetechnik oder Erzeugersysteme gesenkt werden können.
Alle Lösungspakete werden hinsichtlich Kostenersparnis, Energieeffizienz und
Anwendbarkeit bei Mehrfamilienhäusern bewertet. Darüber hinaus liefert eine
Lebenszyklusbilanz für unterschiedliche energetische Gebäudestandards und NZEBs unter
Einbeziehung der Lösungspakete eine langfristige Perspektive.
Der vorliegende Fragebogen ist Teil des Arbeitspakets 3 ‐ 'Kostensenkung bei Entwurf/
Planung und Ausführung von Gebäuden'. Die aufgeführten Fragen dienen zur Feststellung
von Kosteneinsparpotentialen. Einschlägige Daten zur Beschreibung dieser Abläufe stehen
bisher nur in geringem Umfang zur Verfügung; dies gilt ebenso für geeignete Lösungen, die
Kostensenkungen unter Beibehaltung des Energieeffizienzstandards ermöglichen. So gibt es
durchaus Bereiche mit Einsparpotentialen, auch wenn diese (noch) nicht systematisch
erschlossen werden. Wir sind allerdings überzeugt, dass die praktische Erfahrung der Markt‐
teilnehmer in diesem Zusammenhang dazu beitragen kann, Lösungsmöglichkeiten hervor‐
zubringen und somit erhebliche technische und wirtschaftliche Vorteile zu realisieren.
Der vorliegende Fragebogen zielt darauf ab, Kosteneinsparungspotenziale bereits während
der Entwurfs‐ und Planungsphase zu erkennen. Darüber hinaus sollen Lösungen für
Gebäude‐Entwurf und ‐Planung gefunden werden, die geeignet sind, das Gesamtvolumen
der Baukosten von Niedrigstenergie‐Mehrfamilienhäusern (NZEBs) zu senken.
Gemäß der Zielsetzung dieses Projekts bitten wir Sie um Ihre Unterstützung ‐ indem Sie
diesen Fragebogen ausfüllen und uns Ihre spezifischen Erfahrungen mitteilen, leisten Sie
einen wertvollen Beitrag zur Informationsverbesserung und zur Vertiefung weiterführender
Erkenntnisse beim Neubau von Mehrfamilienhäusern.
EU H2020 754046 CoNZEBs
D3.1: Assessment & proposal for cost reduction in the design & construction process 197
Allgemeine Informationen
Name des
Unternehmens:_______________________________________________________________
Bearbeiter des
Fragebogens:________________________________________________________
Funktion im
Unternehmen:_______________________________________________________________
Adresse:_____________________________________________________________
Art des Unternehmens/der Organisation Anzahl Mitarbeiter
Entwurf/Planung ‐ Einzelperson ___________
Entwurf/Planung ‐ Büro ___________

EU H2020 754046 CoNZEBs
D3.1: Assessment & proposal for cost reduction in the design & construction process 198
1. Ist Ihnen bekannt, dass alle Neubauten ab 01.01.2021 Niedrigstenergiestandard (NZEB)
erfüllen müssen (für staatliche Gebäude gilt dies bereits ab 01.01.2019)?
Ja Nein
2. Besitzen Sie Erfahrung im Zusammenhang mit Entwurf und Planung von Niedrigstenergiegebäuden (NZEBs)?
Ja Nein
Wie hoch ist nach Ihrer beruflichen Erfahrung der Anteil von
3. Planungskosten in Bezug auf die Höhe der gesamten Baukosten für neue Mehrfamilienhäuser im privaten Wohnungsbau: ______%
4. Planungskosten in Bezug auf die Höhe der gesamten Baukosten für neue Mehrfamilienhäuser im sozialen Wohnungsbau: ______%
Wie hoch ist nach Ihrer beruflichen Erfahrung der Anteil von
5. Planungskosten in Bezug auf die Höhe der gesamten Baukosten für neue Niedrigstenergie‐Mehrfamilienhäuser im privaten Wohnungsbau: ______%
6. Planungskosten in Bezug auf die Höhe der gesamten Baukosten für neue Niedrigstenergie‐Mehrfamilienhäuser im sozialen Wohnungsbau: ______%
7. Die Planungskosten werden üblicherweise (im Rahmen von nationalen/lokalen Bestimmungen oder allgemein üblicher Praxis) als Prozentsatz der gesamten Baukosten festgelegt. Wenden Sie bei der Ermittlung Ihrer Planungskosten stets diese Methode an?
J a Nein
7.1 Falls Frage 7 mit NEIN beantwortet wurde: Bitte erläutern Sie einschlägige Lösungen und Maßnahmen, die zur Senkung der Planungskosten, zur Verbesserung Ihrer Wettbewerbsfähigkeit oder aus anderen Gründen angewendet wurden.
Anmerkungen:
8. Bitte bewerten Sie aufgrund Ihrer beruflichen Erfahrung mittels einer Skala von 5 (sehr hohe Wahrscheinlichkeit) bis 1 (kein Einfluss), wie wahrscheinlich es ist, dass die
EU H2020 754046 CoNZEBs
D3.1: Assessment & proposal for cost reduction in the design & construction process 199
folgenden Lösungen die Entwurfs‐ und Planungskosten für Niedrigstenergiegebäude senken?
8.1 Ein einziges Büro/Unternehmen ist für den gesamten Planungsprozess verantwortlich (Architektur, Statik, Anlagentechnik): ______
Anmerkungen:
8.2 Definition von Standardlösungen für bestimmte Bauteile und Anlagen in Handbüchern für Planer: ______
Anmerkungen:
8.3 Verwendung von Building Information Modelling (BIM) in der Entwurfsphase: ______
Anmerkungen:
8.4 Integrierte/integrale Planung: ______
Anmerkungen:
8.5 Sonstiges (bitte angeben):
Anmerkungen:
9. Bitte bewerten Sie aufgrund Ihrer beruflichen Erfahrung mittels einer Skala von 5 (sehr hohe Wahrscheinlichkeit) bis 1 (kein Einfluss), wie wahrscheinlich es ist, dass die in der vorhergehenden Frage genannten Planungslösungen zur Senkung der gesamten Baukosten bei Niedrigstenergiegebäuden beitragen:
9.1 Verwendung von Building Information Modelling (BIM) während der gesamten Bauausführung: _____
Anmerkungen:
9.2 Integrierte Planung: _____
Anmerkungen:
9.3 Definition von Standardlösungen für bestimmte Bauteile und Anlagen in Handbüchern für Planer: ______
EU H2020 754046 CoNZEBs
D3.1: Assessment & proposal for cost reduction in the design & construction process 200
Anmerkungen:
9.4 Allgemeiner Planungsansatz:
9.4.1 Außenliegendes Treppenhaus: _______
Anmerkungen:
9.4.3 Keine Unterkellerung und Tiefgarage: _______
Anmerkungen:
9.4.4 Weitere Planungsansätze (bitte erläutern): _______
Anmerkungen:
10. Wartung/Instandhaltung ist ein entscheidender Faktor bei der Kostenoptimierung über den gesamten Lebenszyklus des Gebäudes. Haben Sie Erfahrung mit Wartungsplänen und Wartungsbetrieb/‐durchführung?
J a Nein
11. Nach Ihrer fachlichen Einschätzung, wird das Thema Wartung/ Instandhaltung in der Planungsphase adäquat berücksichtigt?
J a Nein
11.1 Falls die Fragen 10 und 11 mit JA beantwortet wurden: Können Sie ungefähr beziffern, in welcher Größenordnung sich die durch einen detaillierten Wartungsplan langfristig erzielbaren Kostensenkungen bei neuen Mehrfamilienhäusern bewegen (Vergleich detaillierter Wartungsplan mit einem gewöhnlichen Wartungsplan)? ______[%]
Anmerkungen:
11.2 Falls die Fragen 10 und 11 mit JA beantwortet wurden: Können Sie ungefähr beziffern, in welcher Größenordnung sich die durch einen detaillierten Wartungsplan langfristig erzielbaren Kostensenkungen bei Niedrigstenergiegebäuden bewegen (Vergleich detaillierter Wartungsplan mit einem gewöhnlichen Wartungsplan)? ______[%]
Anmerkungen:

EU H2020 754046 CoNZEBs
D3.1: Assessment & proposal for cost reduction in the design & construction process 201
12. Weitere Ideen für Kosteneinsparungen in der Planungsphase
Anmerkungen:
EU H2020 754046 CoNZEBs
D3.1: Assessment & proposal for cost reduction in the design & construction process 202
German construction process questionnaire
Überblick über das Projekt und den Fragebogen
Im Rahmen des CoNZEBs‐Projekts sollen technische Gesamtlösungen (technology solution
sets) erarbeitet und bewertet werden, die erhebliche Kostensenkungen bei der Erstellung
neuer Niedrigstenergie‐Mehrfamilienhäuser (NZEB‐MFH) ermöglichen. Basierend auf den
Erfahrungen des Konsortiums wurden zu Beginn des Projekts zunächst Referenzkosten für
konventionelle Neubauten, für derzeit am Markt verfügbare Niedrigstenergiegebäude sowie
für Gebäude, die energetisch noch höherwertiger als Niedrigstenergiegebäude sind,
festgelegt. Zusammen mit einem Leitfaden über den Zusatznutzen von NZEBs liefert eine
Studie zu den Erfahrungen und Erwartungen der Endnutzer Empfehlungen für das Wohnen
in diesen Gebäuden und trägt zur Verbesserung der Gebäudeenergieeffizienz durch
angemessenes Nutzerverhalten bei. Die technischen Gesamtlösungen beinhalten Ansätze,
durch die Kosten für die Gebäudetechnik oder Erzeugersysteme gesenkt werden können.
Alle Lösungspakete werden hinsichtlich Kostenersparnis, Energieeffizienz und
Anwendbarkeit bei Mehrfamilienhäusern bewertet. Darüber hinaus liefert eine
Lebenszyklusbilanz für unterschiedliche energetische Gebäudestandards und NZEBs unter
Einbeziehung der Lösungspakete eine langfristige Perspektive.
Der vorliegende Fragebogen ist Teil des Arbeitspakets 3 ‐ 'Kostensenkung bei Entwurf/
Planung und Ausführung von Gebäuden'. Die aufgeführten Fragen dienen zur Feststellung
von Kosteneinsparpotentialen. Einschlägige Daten zur Beschreibung dieser Abläufe stehen
bisher nur in geringem Umfang zur Verfügung; dies gilt ebenso für geeignete Lösungen, die
Kostensenkungen unter Beibehaltung des Energieeffizienzstandards ermöglichen. So gibt es
durchaus Bereiche mit Einsparpotentialen, auch wenn diese (noch) nicht systematisch
erschlossen werden. Wir sind allerdings überzeugt, dass die praktische Erfahrung der Markt‐
teilnehmer in diesem Zusammenhang dazu beitragen kann, Lösungsmöglichkeiten hervor‐
zubringen und somit erhebliche technische und wirtschaftliche Vorteile zu realisieren.
Der vorliegende Fragebogen zielt darauf ab, Kosteneinsparungspotenziale bereits während
der Entwurfs‐ und Planungsphase zu erkennen. Darüber hinaus sollen Lösungen für
Gebäude‐Entwurf und ‐Planung gefunden werden, die geeignet sind, das Gesamtvolumen
der Baukosten von Niedrigstenergie‐Mehrfamilienhäusern (NZEBs) zu senken.
Gemäß der Zielsetzung dieses Projekts bitten wir Sie um Ihre Unterstützung ‐ indem Sie
diesen Fragebogen ausfüllen und uns Ihre spezifischen Erfahrungen mitteilen, leisten Sie
einen wertvollen Beitrag zur Informationsverbesserung und zur Vertiefung weiterführender
Erkenntnisse beim Neubau von Mehrfamilienhäusern.
EU H2020 754046 CoNZEBs
D3.1: Assessment & proposal for cost reduction in the design & construction process 203
Allgemeine Informationen
Name des
Unternehmens:_______________________________________________________________
Bearbeiter des
Fragebogens:________________________________________________________
Funktion im
Unternehmen:_______________________________________________________________
Adresse:_____________________________________________________________
Art des Unternehmens/ der Organisation Anzahl Mitarbeiter
Baufirma ___________
Baufirma und Planungsbüro ___________
Wohnbaugesellschaft/Wohnbaugenossenschaft ___________
Wohnbaugesellschaft/Wohnbaugenossenschaft
mit eigenem Planungsbüro ___________
EU H2020 754046 CoNZEBs
D3.1: Assessment & proposal for cost reduction in the design & construction process 204
8. Ist Ihnen bekannt, dass alle Neubauten ab 01.01.2021 Niedrigstenergiestandard (NZEB)
erfüllen müssen (für staatliche Gebäude gilt dies bereits ab 01.01.2019)?
Ja Nein
9. Besitzen Sie Erfahrung im Zusammenhang mit der Bauausführung von Niedrigstenergiegebäuden (NZEBs)?
Ja Nein
10. Führen Sie die Arbeiten direkt aus oder beschäftigen Sie Unterauftragnehmer?
Direkte Ausführung Unterauftragnehmer Beides
11. Sind Ihnen aus Ihrer Erfahrung Fälle bekannt, in denen die tatsächlichen Baukosten höher/niedriger ausfielen als in der Planung anfänglich berechnet?
Ja Nein
11.1. Falls Frage 4 mit JA beantwortet wurde: Bitte beziffern Sie die durchschnittliche relative Kostenänderung bei früheren Bauvorhaben mit aktuellen energetischen Anforderungen (mit Angabe Kostensteigerung (+) bzw. Kostensenkung (‐): _____% .
Bitte bewerten Sie außerdem mittels einer Skala von 5 (sehr hohe Wahrscheinlichkeit) bis 1 (kein Einfluss) die unten aufgeführten möglichen Gründe hierfür (Details bitte ggf. unter ‚Anmerkungen‘ angeben):
⌂ Mangelhafte Qualität der Planung: _______
⌂ Verzögerungen bei den Lieferzeiten für Bauteile und Anlagen: _______
⌂ Technische Probleme während der Bauausführung: _______
⌂ Finanzielle Schwierigkeiten z. B. bei Unteraiftragnehmern: _______
Anmerkungen:
4.2 Falls Frage 4 mit JA beantwortet wurde:
Bitte beziffern Sie den durchschnittlichen relativen Kostenanstieg bei früheren
Niedrigstenergiebauvorhaben
(mit Angabe Kostensteigerung (+) bzw. Kostensenkung (‐): _____% .
EU H2020 754046 CoNZEBs
D3.1: Assessment & proposal for cost reduction in the design & construction process 205
Bitte bewerten Sie außerdem mittels einer Skala von
5 (sehr hohe Wahrscheinlichkeit) bis 1 (kein Einfluss) die unten aufgeführten möglichen
Gründe hierfür (Details bitte ggf. unter ‚Anmerkungen‘ angeben):
⌂ Mangelhafte Qualität der Planung:___________
⌂ Verzögerungen bei den Lieferzeiten für Bauteile und Anlagen:___________
⌂ Technische Probleme während der Bauausführung:_____
⌂ Finanzielle Schwierigkeiten, z. B. bei Unterauftragnehmern:_________
Anmerkungen:
5. Wenden Sie bereits Lösungen zur Kostensenkung während der Bauphase an oder planen Sie die Anwendung derartiger Maßnahmen?
Ja Nein
5.1 Falls Frage 5 mit JA beantwortet wurde: Bitte beschreiben Sie die betreffenden Lösungen und Maßnahmen und beziffern Sie für jede dieser Maßnahmen die relative Kostenersparnis (%) in Bezug auf Baukosten für Standard‐Bauausführungen
Anmerkungen:
6. Bitte bewerten Sie aufgrund Ihrer beruflichen Erfahrung mittels einer Skala von 5 (sehr hohe Wahrscheinlichkeit) bis 1 (kein Einfluss), wie wahrscheinlich es ist, dass die genannten Lösungen zur Senkung der Baukosten beitragen:
6.1 Verwendung von Building Information Modelling (BIM) bei der Bauausführung:_______
Anmerkungen:
6.2 Verwendung von industriell vorgefertigten Systemen oder Bauteilen oder anderen technischen Lösungen zur Senkung der Montage‐ und Bauzeiten: ______
Anmerkungen:
6.3 Einstellung von hochqualifizierten Arbeitskräften, um den Bauprozess zu beschleunigen und die Qualität zu verbessern: ______
Anmerkungen:
EU H2020 754046 CoNZEBs
D3.1: Assessment & proposal for cost reduction in the design & construction process 206
6.4 Durchführung effizienter Qualitätskontrollen in jeder Phase des Prozesses zur
Vermeidung von zusätzlichen Kosten für Reparaturen oder Wiederholungen von Arbeitsschritten: ______
Anmerkungen:
6.5 Optimierung der Baustelle, einschließlich Bereitstellung und Entsorgung der Güter: ____
Anmerkungen:
6.6 Einsatz von Energieeffizienz‐Contracting zur Sicherstellung der korrekten und termingerechten Ausführung der Bauarbeiten: ______
Anmerkungen:
7. Weitere Ideen für Kosteneinsparungen in der Ausführungsphase
Anmerkungen:
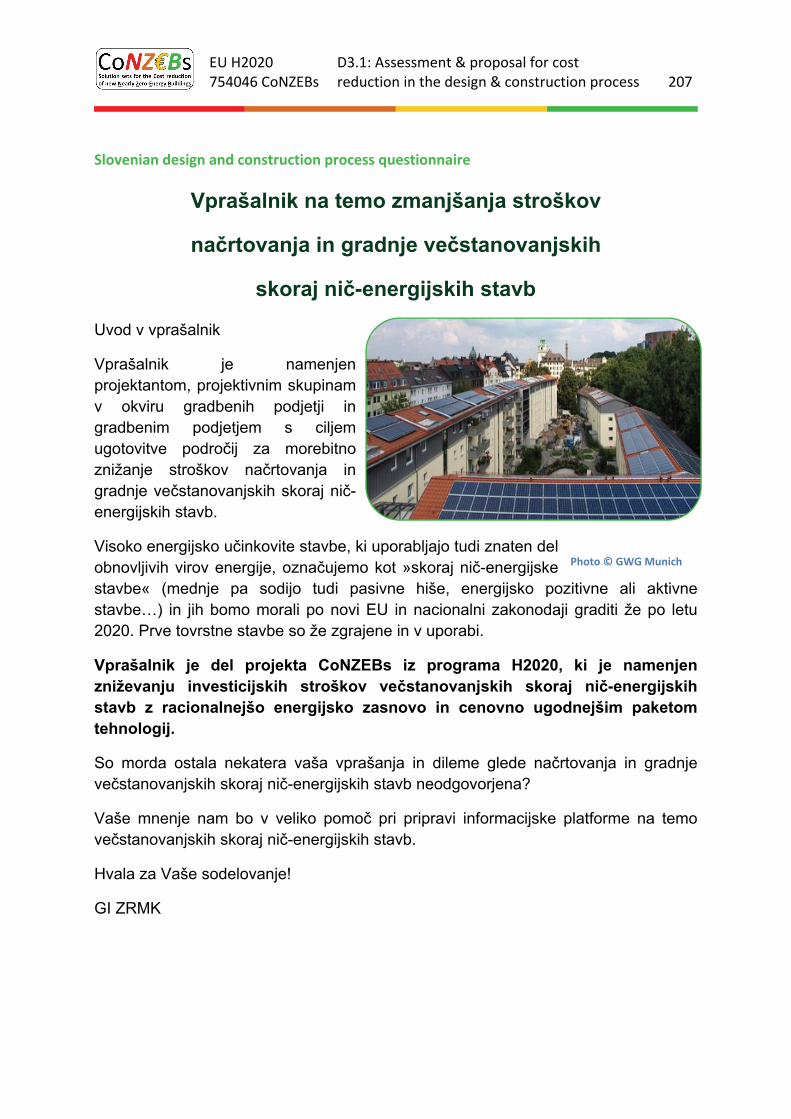
EU H2020 754046 CoNZEBs
D3.1: Assessment & proposal for cost reduction in the design & construction process 207
Slovenian design and construction process questionnaire
Vprašalnik na temo zmanjšanja stroškov
načrtovanja in gradnje večstanovanjskih
skoraj nič-energijskih stavb
Uvod v vprašalnik
Vprašalnik je namenjen projektantom, projektivnim skupinam v okviru gradbenih podjetji in gradbenim podjetjem s ciljem ugotovitve področij za morebitno znižanje stroškov načrtovanja in gradnje večstanovanjskih skoraj nič-energijskih stavb.
Visoko energijsko učinkovite stavbe, ki uporabljajo tudi znaten del obnovljivih virov energije, označujemo kot »skoraj nič-energijske stavbe« (mednje pa sodijo tudi pasivne hiše, energijsko pozitivne ali aktivne stavbe…) in jih bomo morali po novi EU in nacionalni zakonodaji graditi že po letu 2020. Prve tovrstne stavbe so že zgrajene in v uporabi.
Vprašalnik je del projekta CoNZEBs iz programa H2020, ki je namenjen zniževanju investicijskih stroškov večstanovanjskih skoraj nič-energijskih stavb z racionalnejšo energijsko zasnovo in cenovno ugodnejšim paketom tehnologij.
So morda ostala nekatera vaša vprašanja in dileme glede načrtovanja in gradnje večstanovanjskih skoraj nič-energijskih stavb neodgovorjena?
Vaše mnenje nam bo v veliko pomoč pri pripravi informacijske platforme na temo večstanovanjskih skoraj nič-energijskih stavb.
Hvala za Vaše sodelovanje!
GI ZRMK
Photo © GWG Munich
EU H2020 754046 CoNZEBs
D3.1: Assessment & proposal for cost reduction in the design & construction process 208
Projekt CoNZEBs (2017‐2020) sofinancira Evropska komisija v okviru programa Obzorje 2020.
Projekt CoNZEBs iz programa Obzorje 2020 je namenjen zniževanju investicijskih stroškov skoraj nič‐energijskih večstanovanjskih stavb z racionalnejšo energijsko zasnovo in cenovno ugodnejšim paketom tehnologij.
Ob tem želimo tudi končnim uporabnikom približati prednosti bivanja v visoko energijsko učinkovitih stavbah ter se seznaniti z morebitnimi stereotipnimi predstavami in dilemami uporabnikov.
Splošni podatki
Ime podjetja / samozaposlenega /:_______________________________________________
Ime osebe, ki izpolnjuje vprašalnik: ___________________________________
Funkcija: ____________________________________________________
Naslov in kontakt: ________________________________________________
Pravna oblika: Število
zaposlenih: ______
Projektant – samostojen
Projektant – projektivni biro
Projektivna skupina v okviru gradbenega podjetja Gradbeno podjetje
EU H2020 754046 CoNZEBs
D3.1: Assessment & proposal for cost reduction in the design & construction process 209
A. VPRAŠALNIK ZA PROJEKTANTE IN PROJEKTIVNE SKUPINE V OKVIRU
GRADBENIH PODJETJI
Cilj vprašalnika je ugotoviti možna področja znižanja stroškov v procesu načrtovanja, kot tudi
ugotoviti / predstaviti ukrepe in rešitve v fazi načrtovanja, ki pripomorejo k zmanjšanju
skupnih stroškov gradnje večstanovanjskih skoraj nič‐energijskih stavb.
1. Ali ste seznanjeni z dejstvom, da bodo morale vse nove stavbe izpolniti energetsko
raven skoraj nič‐energijskih stavb (sNES) ‐ po 31. decembru 2018 bo to veljalo za vse nove
stavbe, ki jih javni organi uporabljajo kot lastniki, dve leti kasneje, torej po 31. decembru
2020, pa bo to obvezno tudi za ostale stavbe?
DA NE
2. Ali imate izkušnje z načrtovanjem večstanovansjkih sNES?
DA NE
Načrtovanje novih večstanovansjkih stavb (VSS) glede na trenutne energijske zahteve
(PURES in ostali predpisi)
3. Delež stroškov za načrtovanje glede na celotne stroške gradnje novih VSS pri gradnji
stanovanj za trg: ______%
4. Delež stroškov za načrtovanje glede na celotne stroške gradnje novih VSS pri gradnji
neprofitnih stanovanj: ______%
⌂
Načrtovanje novih VSS glede na sNES energijske zahteve (AN sNES 2015 ‐ 2010)
5. Delež stroškov za načrtovanje glede na celotne stroške gradnje novih VSS pri gradnji
stanovanj za trg: ______%
6. Delež stroškov za načrtovanje glede na celotne stroške gradnje novih VSS pri gradnji
neprofitnih stanovanj: ______%
EU H2020 754046 CoNZEBs
D3.1: Assessment & proposal for cost reduction in the design & construction process 210
7. Stroški načrtovanja so v splošnem določeni (s strani državnih / lokalnih regulativ oz.
splošne prakse) kot delež celotnih stroškov gradnje. Se vedno poslužujete te metode pri
določanju stroškov za načrtovanje?
DA NE
7.1 Če ste na vprašanje 7 odgovorili z NE, opišite rešitve in postopke, ki se izvajajo za
zmanjšanje stroškov za načrtovanje, povečanje konkurenčnosti ali druge razloge.
Vaš komentar in predlogi:
8. Glede na vaše izkušnje ocenite verjetnost naslednjih rešitev za zmanjšanje stroškov
načrtovanja VSS od 5 (zelo visoko) do 1 (brez učinka):
8.1 Ena projektantska skupina / podjetje je odgovorno za celoten proces načrtovanja VSS
(arhitektura, konstrukcije, instalacije …): ____
Vaš komentar in predlogi:
8.2 Definiranje standardnih rešitev za določene proizvode, sisteme in tehnologije v
priročniku za projektante: ____
Vaš komentar in predlogi:
8.3 Uporaba Informacijskega modeliranja stavb (BIM) v fazi načrtovanja: ____
Vaš komentar in predlogi:
8.4 Integralno načrtovanje stavb: ____
Vaš komentar in predlogi:
8.5 Drugo
Vaš komentar in predlogi:
9. Glede na vaše izkušnje, ocenite verjetnost naslednjih rešitev v procesu načrtovanja
VSS za zmanjšanje celotnih stroškov gradnje od 5 (zelo visoko) do 1 (brez učinka):
EU H2020 754046 CoNZEBs
D3.1: Assessment & proposal for cost reduction in the design & construction process 211
9.1 Uporaba Informacijskega modeliranja stavb (BIM) tekom celotnega procesa gradnje:
____
Vaš komentar in predlogi:
9.2 Integralno načrtovanje stavb: ____
Vaš komentar in predlogi:
9.3 Splošni pristop k načrtovanju in konceptu, t.j. bioklimatsko načrtovanje, zunanje
stopnišče, kompaktne oblike, brez podzemnih kleti in parkirnih mest …: ____
Vaš komentar in predlogi:
10. Vzdrževanje je ključnega pomena za stroškovno optimizacijo tekom celotnega
življenjskega cikla stavbe. Je vzdrževanje ustrezno obravnavano že v fazi načrtovanja VSS?
DA NE
11. Imate izkušnje oz. ali ste že v fazi načrtovanja VSS glede na trenutne energijske
zahteve in sNES energijske zahteve, predvideli način za vzdrževanje / letno servisiranje (npr.
stavbno pohištvo, odtočne cevi, žlebovi …) in delovanje (sistemi za ogrevanje, prezračevanje
in hlajenje) stavbe?
DA NE
11.1 Če ste na vprašanje 11 odgovorili z DA, ocenite kako in koliko načrt vzdrževanja,
razvit že v fazi načrtovanja, dolgoročno zmanjša stroške delovanja VSS glede
trenutnih energijskih zahtev?
Vaš komentar in predlogi:
11.2 Če ste na vprašanje 11 odgovorili z DA, ocenite kako in koliko načrt vzdrževanja,
razvit že v fazi načrtovanja, dolgoročno zmanjša stroške delovanja VSS glede sNES
energijskih zahtev?
Vaš komentar in predlogi:
EU H2020 754046 CoNZEBs
D3.1: Assessment & proposal for cost reduction in the design & construction process 212
12. Dodatni komentarji in mnenja glede dotične tematike, ki niso bili zajeti z
vprašalnikom
Hvala za sodelovanje!
B. VPRAŠALNIK ZA GRADBENA PODJETJA
Cilj vprašalnika je ugotoviti možna področja znižanja stroškov v procesu gradnje
večstanovanjskih skoraj nič‐energijskih stavb.
1. Ali ste seznanjeni z dejstvom, da bodo morale vse nove stavbe izpolniti energijsko
raven skoraj nič‐energijskih stavb (sNES) ‐ po 31. decembru 2018 bo to veljalo za vse nove
stavbe, ki jih javni organi uporabljajo kot lastniki, dve leti kasneje, torej po 31. decembru
2020, pa bo to obvezno tudi za ostale stavbe?
DA NE
2. Ali imate izkušnje z gradnjo večstanovansjkih sNES?
DA NE
3. Ali neposredno izvajate dela ali najemate podizvajalce?
sami izvajamo dela najemamo podizvajalce oboje
4. Ali imate izkušnje s povečanjem / znižanjem stroškov gradnje večstanovansjkih stavb
(VSS) glede na začetno načrtovano investicijsko vrednost?
DA NE
4.1 Če ste na vprašanje 4 odgovorili z DA, ovrednotite povprečno relativno spremembo
stroškov, ki ste jo izkusili v preteklih projektih s trenutnimi energijskimi zahtevami (PURES‐2
iz leta 2010 in TSG‐1‐004:2010‐URE): ____%
in ocenite od 5 (zelo visoko) do 1 (brez učinka) naslednje možne vzroke in po možnosti
navedite podrobnosti v rubriki “Vaše komentar in predlogi”:
EU H2020 754046 CoNZEBs
D3.1: Assessment & proposal for cost reduction in the design & construction process 213
⌂ Slaba kakovost projekta: ____
⌂ Časovne zamude pri dostavi gradbenih proizvodov in sistemov: ____
⌂ Časovne zamude med procesom gradnje: ____
⌂ Finančne težave: ____
Vaš komentar in predlogi:
4.2 Če ste na vprašanje 4 odgovorili z DA, ovrednotite povprečno relativno spremembo
stroškov, ki ste jo izkusili v preteklih projektih s sNES energijskimi zahtevami (AN sNES 2015 –
2010): ____%
in ocenite od 5 (zelo visoko) do 1 (brez učinka) naslednje možne vzroke in po možnosti
navedite podrobnosti v rubriki “Vaš komentar in predlogi”:
⌂ Slaba kakovost projekta: ____
⌂ Časovne zamude pri dostavi gradbenih materialov, proizvodov, sistemov,
tehnologij: ____
⌂ Tehnične zamude med procesom gradnje: ____
⌂ Finančne težave: ____
⌂ Vaš komentar in predlogi:
5. Ali sprejemate oz. nameravate sprejeti ukrepe in rešitve za zmanjšanje stroškov med
procesom gradnje VSS?
DA NE
5.1 Če ste na vprašanje 5 odgovorili z DA, opišite ukrepe in rešitve ter ocenite relativne
ekonomske prihranke glede na standardne stroške gradnje VSS: ____%
Vaš komentar in predlogi:
6. Glede na vaše izkušnje ocenite verjetnost naslednjih ukrepov in rešitev za zmanjšanje
stroškov gradnje VSS od 5 (zelo visoko) do 1 (brez učinka):
6.1 Uporaba Informacijskega modeliranja stavb (BIM) v procesu gradnje VSS: ____
Vaš komentar in predlogi:

EU H2020 754046 CoNZEBs
D3.1: Assessment & proposal for cost reduction in the design & construction process 214
6.2 Uporaba prefabriciranih (montažnih) sistemov in proizvodov ter drugih tehničnih
rešitev za zmanjšanje časa (in stroškov) montaže in gradnje VSS: ____
Vaš komentar in predlogi:
6.3 Najem usposobljenih delavcev za hitrejši in varnejši proces gradnje VSS: ____
Vaš komentar in predlogi:
6.4 Učinkovit nadzor (stalna notranja kontrola kakovosti) v vsaki fazi procesa gradnje VSS
v izogib dodatnim stroškom: ____
Vaš komentar in predlogi:
6.5 Optimizacija (ureditev) gradbišča, vključno z dobavo, skladiščenjem in
odstranjevanjem materiala (npr. začasna deponija na gradbišču …): ____
Vaš komentar in predlogi:
6.6 Ali uporabljate mehanizme energetskega pogodbeništva za zagotovitev tehnične in
stroškovne učinkovitosti projekta?
Vaš komentar in predlogi:
7. Dodatni komentarji in predlogi glede dotične tematike, ki niso bili zajeti z
vprašalnikom
Hvala za sodelovanje!