Suitability of 'Guidelines for Screening of Prosthetic Candidates
Upload
independentCategory
view
2download
0
lable at ScienceDirect
Ocean & Coastal Management 104 (2015) 150e158
Contents lists avai
Ocean & Coastal Management
journal homepage: www.elsevier .com/locate/ocecoaman
Assessing the suitability of the minimum capture size and protectionregimes in the gooseneck barnacle shellfishery
Gorka Bidegain a, b, *, Xabier Guinda a, Marta Sestelo c, d, Javier Roca-Pardi~nas d,Araceli Puente a, Jos�e Antonio Juanes a
a Environmental Hydraulics Institute IH Cantabria, Universidad de Cantabria, C/ Isabel Torres 15 PCTCAN, 39011 Santander, Spainb Gulf Coast Research Laboratory, University of Southern Mississippi, 703 East Beach Drive, Ocean Springs 39564, MS, USAc Centre of Mathematics and Department of Mathematics and Applications, University of Minho, Campus de Azur�em, 4800-058 Guimar~aes, Portugald Department of Statistics and Operations Research, University of Vigo, C/ Torrecedeira, 86, E-36280 Vigo, Spain
a r t i c l e i n f o
Article history:Received 21 April 2014Received in revised form11 December 2014Accepted 12 December 2014Available online
Keywords:Pollicipes pollicipesFisheryBay of BiscayCatch-sizeProtection regimesKernel smoothersMDS
* Corresponding author. Gulf Coast Research LaborMississippi, 703 East Beach Drive, Ocean Springs 395
E-mail address: [email protected] (G. Bideg
http://dx.doi.org/10.1016/j.ocecoaman.2014.12.0150964-5691/© 2014 Elsevier Ltd. All rights reserved.
a b s t r a c t
The suitability of a total-length-based, minimum capture-size and different protection regimes wasinvestigated for the gooseneck barnacle Pollicipes pollicipes shellfishery in N Spain. For this analysis,individuals that were collected from 10 sites under different fishery protection regimes (permanentlyopen, seasonally closed, and permanently closed) were used. First, we applied a non-parametricregression model to explore the relationship between the capitulum Rostro-Tergum (RT) size and theTotal Length (TL). Important heteroskedastic disturbances were detected for this relationship, demon-strating a high variability of TL with respect to RT. This result substantiates the unsuitability of a TL-basedminimum size by means of a mathematical model. Due to these disturbances, an alternative growth-based minimum capture size of 26.3 mm RT (23 mm RC) was estimated using the first derivative of aKernel-based non-parametric regression model for the relationship between RT and dry weight. For thispurpose, data from the permanently protected area were used to avoid bias due to the fishery. Second,the size-frequency distribution similarity was computed using a MDS analysis for the studied sites toevaluate the effectiveness of the protection regimes. The results of this analysis indicated a positive effectof the permanent protection, while the effect of the seasonal closure was not detected. This result needsto be interpreted with caution because the current harvesting based on a potentially unsuitable mini-mum capture size may dampen the efficacy of the seasonal protection regime.
© 2014 Elsevier Ltd. All rights reserved.
1. Introduction
The primary geographical distribution area of the gooseneckbarnacle Pollicipes pollicipes ranges from the northwestern coast ofFrance (Brittany) to the northwestern coast of Africa (Senegal) andthe Mediterranean (Algeria) (Cruz and Araujo, 1999; Barnes, 1996).This species constitutes the most economically important shell-fishery resource on the intertidal rocky shores of Portugal and Spain(Cunha and Weber, 2001; Sousa et al., 2013). This species is highlyprized as food (>50 Euros Kg�1 (Jacinto et al., 2010)) and heavilyexploited by professional and recreational fishery. In recent years,this species has attracted increased harvesting pressure due to its
atory, University of Southern64, MS, USA.ain).
high market value (Sousa et al., 2013; Stewart et al., 2014), thedecline of other coastal fisheries has urged barnacle exploitation asa supplement to fishing activity (Bald and Borja, 2012), and theEuropean economic crisis. In many regions of the Iberian Peninsula,this decline has resulted in the overexploitation of the stocks (Borjaet al., 2011; Stewart et al., 2014). Likely, the current passive man-agement model of the resource (i.e., non-take zones and legalminimal size of capture) of the northern regions of Spain (Canta-bria, Basque Country) means a progressive decline of the resources(Jamieson et al., 1999; Bald and Borja, 2012).
However, the assessment of the performance of these man-agement measures is not easy. The fishery capture data are oftenscarce and lack precise localization information, which leads to notvery rigorous estimations of the fishery pressure upon this resource(Sousa et al., 2013). The highest abundances of P. pollicipes arelocated in the lower intertidal zone (Cruz et al., 2010; Pav�on, 2003)of significantly energetic shores that are exposed to dominant
G. Bidegain et al. / Ocean & Coastal Management 104 (2015) 150e158 151
swells, which are frequently related to high slopes and the presenceof caves and crevices (Barnes, 1996; Cruz, 2000; Borja et al., 2006b).Consequently, the poor capture data and the physical factorsdetermining the distribution of the genus Pollicipes and explainingthe difficulty of sampling (Bernard, 1988; Parada et al., 2012)contribute to the lack of large-scale population assessment studiesand adequate evaluations of the performance of the managementmeasures. As an alternative, the territorial use rights for fishing(TURF), i.e., an area-based management program that assigns aspecific area to an individual, group or community, has proven to bean effective approach for the small-scale management ofP. pollicipes fisheries in NW Spain (Molares and Freire, 2003). TheTURF programs grant exclusive fishing access to these communitieswhile giving them management responsibilities, including thedevelopment of annual management plans and the maintenance ofappropriate controls of fishing mortality (Young, 2013).
Regardless of the management model, the measures that areoriented toward the achievement of a sustainable exploitation ofthe resources in N Spain commonly include the minimum size ofcapture, protected areas (e.g., seasonal or permanent closures) andindividual quotas (e.g., Parada et al., 2012; Sousa et al., 2013). Inrecent years, to react to barnacle population decline in some re-gions, the establishment of a minimum capture size has receivedspecial attention from managers and researchers, particularlyregarding the adequacy of the part of the barnacle that is measured.The commonly used capture size in N Spain based on the totallength (TL) may be inappropriate because this measure includesboth the hard part (capitulum) and the soft part (the peduncle) ofthe barnacle. The latter has, a priori, an importantly variable ty-pology, with both barnacles with elongated and with smooth pe-duncles being able to have the same capitulum size (Parada et al.,2012). This finding may lead to heteroskedastic disturbances inthe relationship between TL and the capitulum length, i.e., animportant variance in TL with respect to the capitulum length asindividuals grow in size. This variability in TL depends on envi-ronmental factors, such as hydrodynamic patterns, degree of im-mersion, availability of food and intraspecific competition(Hoffman, 1988, 1989; Page, 1986; Lewis and Chia, 1981).
Several authors have regionally determined that the rostro-tergum (RT) (Pav�on, 2003) or rostrum-carina (RC) (Cruz, 1993)lengths are the best biometrical variables to explain the growth ofthis species. Consequently, these two measures and others alsobased on the capitulum have been considered more adequate forthe establishment of the minimum size of capture in NW Spain andSW Portugal (Parada et al., 2012; Sousa et al., 2013). Sestelo andRoca-Pardi~nas (2011) recently investigated the minimum capturesize for this species using a non-parametric model that analyzes thelengtheweight relationship and its derivatives. This author sug-gested an RC length-based capture size that ensures the maximumyield in weight from the fishery. To our knowledge, no informationhas been published on the impact of the change in the minimumcapture size from the TL-based measure to a capitulum-basedmeasure. Despite considering the alternative minimum size basedon the capitulum length, the assumed lower suitability of the TLmeasure compared to the RC or RT has not been properly investi-gated in terms of the variability of the TL with respect to the growthof the species, i.e., in terms of the heteroskedasticity in TLeRT orTLeRC relationships. However, along the northern coast of Spain(Gulf of Biscay), the minimum capture size is still based on the TL.
Regarding the effectiveness of closure regimes in enhancingpopulation stocks, Cruz (2000) and Sousa et al. (2013) did not findsignificant effects on the density between areas with different typesof exploitation regimes in SW Portugal. Temporal closures (fromMay to September) are not the most sustainable measures in NSpain because they may not permit the total recovery of the
resource after the capture season (Bald et al., 2006). These authorsobserved that temporal closures could lead to a reduction of thecaptures by half compared to other measures. These authorsdeveloped a dynamic model that is capable of predicting theresponse of P. pollicipes populations to different managementmeasures and suggested that the best management actions con-sisted of establishing permanently closed fishing areas that wouldact as important sources of larvae nourishing the exploited areasand biannual rotational temporal closures. Borja et al. (2006b)analyzed the effect of permanently protected zones in the densityand biomass of gooseneck barnacle in Basque Country (N Spain).These authors found a significantly higher density of individualsand biomass in permanently unexploited zones (~8.0 kg m�2)compared to that in unprotected areas (~1.5 kg m�2). The failure ofthe temporal closures might be in part linked to the current mini-mum size in N Spain.
The extraction of P. pollicipes in N Spain is regulated byregional-scale management models largely based in a legal capturesize of 40 mm of total length and different types of closure re-gimes. The purpose of this study was to investigate the effective-ness or suitability of these management measures, consideringthat the failure of the temporal closures may be in part associatedwith the potential unsuitability of the current minimum size. Forthis purpose, the coastline of Cantabria (Gulf of Biscay) of 215 kmwas selected as a case study due to (i) the fact that the manage-ment model in this region permits the analysis of three types ofprotection regimes (i.e., permanently open, seasonally closed, andpermanently closed) and (ii) the lack of previous assessments ofthe efficacy of these management measures. The conditionalvariance of the total length with respect to the growth wasanalyzed (i) to properly assess the suitability of the capture sizebased on a measure including the soft part of the barnacle and, ifunsuitable, (ii) to estimate an alternative capture size using anonparametric regression model for the capitulum lengtheweightrelationship. The results may confirm with a mathematical modelthe suitability of the capitulum length-based minimum size mea-sures that are already implemented in other regions. The size-frequency distribution similarity between zones with differentprotection regimes was analyzed to evaluate their effectiveness.The results of this latter analysis were interpreted according to thedifferences between the original minimum capture size and thealternative size that is proposed in this study.
2. Material and methods
2.1. Study area
The total area of study covered 215 km of coast in the Cantabriaregion (Fig. 1). Due to the lack of proper habitat suitability data (i.e.,mapping), the suitable habitat of gooseneck barnacle was identifiedusing a compilation of information coming from cartographic data,professional shellfishers and technical personnel of the RegionalFishing Directorate. A total of 10 coastal areas of different lengthscovering 60 km of coastline were considered common shellfishingzones. These areas were managed under different protection levelsaccording to their fishery closure regime: (1) Llaranza, Ubiarco,Liencres, Arnia, Diablo and Cerdigo were opened to the fisherythroughout the year; (2) Arena, Prellezo and Ore~na were seasonallyprotected, being closed to the fishery from 1st May to 1st October;and (3) Sonabia was permanently protected and closed to thefishery throughout the year (Fig. 1). A sampling site that wasrepresentative of the abundance of each fishing zone was selectedbased on the compiled information from shellfishermen andtechnical personnel. The criteria for this selection were to havesimilar accessibility and wave exposure for every site.

Fig. 1. Location of sampling sites on the coast of Cantabria (N Spain). * Seasonally protected and ** permanently protected zones. Sites without label represent open fishing zones.
G. Bidegain et al. / Ocean & Coastal Management 104 (2015) 150e158152
2.2. Sampling and laboratory procedures
Field surveys were carried out during the spring low tides inJune 2005, except at Diablo, which was surveyed in October 2005.At each of the 10 sites, 5 intertidal transects were established along200e300 m of coastline, except in Cerdigo and Diablo (4 transects)and in Llaranza (3 transects). At each transect, three differentintertidal levels were studied: higher littoral (H), medium littoral(M) and lower littoral (L). The shallow subtidal zone was notconsidered because this species is mainly distributed and profes-sionally harvested in the intertidal zone (Borja et al., 2006a). Theindividuals were collected by scraping the rock surface within50 � 50-cm sampling units. In the laboratory, several biometricvariables were measured: (i) Rostro-Tergum length (RT) (Pav�on,2003), also known as the maximal capitulum height (MCH) byCruz (1993) or the capitulum length by Bernard (1988); (ii) rostro-carina length (RC) following Cruz (1993); and (iii) total length (TL)(Hoffman, 1984) (Fig. 2). The dry weight (DW) was obtained bydrying organisms at 60 �C for 48 h following Cruz (1993).Encrusting and boring animals, mainly located on the capitulumplates, were removed before weighing.
Fig. 2. Longitudinal biometric variables measured in P. pollicipes following Cruz (1993).RT ¼ Rostrum-Tergum length, RC ¼ Rostrum-Carina length, TL ¼ Total length.
2.3. Data analysis
2.3.1. Evaluation of the total length-based minimum capture sizeThe suitability of the TL for use as a minimum capture size
measure was evaluated by analyzing the conditional variance bs2 ofTL, which includes both the soft part of the peduncle and the hardpart of the capitulum, with respect to the capitulum length, usingthe statistical software environment R (R Development Core Team,2009). bs2 values that were larger than 1.5 were considered signif-icant in terms of TL variability with respect to RT. The RT size wasselected as the capitulum length measure based on a locality cri-terion, as it was determined by Pav�on (2003) as the best biometricalvariable to explain the growth of this species in the neighboringcoast of Asturias (N Spain). Cruz (1993) found the RC size to bemoreadequate for this purpose in SW Portugal. In this study, the RCeRTrelationship was also first determined to compare our and otherresults based on the RT size with studies based on the RC size(Fig. 3).
The analysis of RTeTL relationship was conducted using arandom subsample of the whole dataset, including all sites and
Fig. 3. Relationship between Rostrum-Tergum length (RT) and Rostrum-Carina length(RC) (n ¼ 365). Coefficient of determination (R2cv Þ calculated by means of cross-validation is presented for the regression model. Confidence intervals (dashed lines)are hardly identifiable due to the good fit of the model.
G. Bidegain et al. / Ocean & Coastal Management 104 (2015) 150e158 153
tidal levels. A Kernel-based non-parametric regression model wasused for this analysis. The model equation was of the type
RT ¼ mðTLÞ þ sðTLÞ ε (1)
where the error variable ε is independent of the covariate TL withE(ε) ¼ 0 and Var(ε) ¼ 1,m(TL) ¼ E(RTjTL) is the unknown regressionfunction, and s2(TL) ¼ Var(RTjTL) is the conditional variance func-tion representing heteroskedasticity.
The estimation of the above model is based on the use of locallinear kernel smoothers (Wand and Jones, 1995). Let fðTLi;RTiÞgni¼1be an independent random sample, the kernel estimator
bm�tl� ¼ j
�tl; fðTLi;RTiÞgni¼1;h
�
at a location tl is defined as bmðtlÞ ¼ ba0ðtlÞ, where ba0ðtlÞ is the firstposition of the vector ðba0ðtlÞ; ba1ðtlÞÞ; which is the minimizer of
Xni¼1
fRTi � a0ðtlÞ � a1ðtlÞðTLi � tlÞg2KhðTLi � tlÞ;
where Khð$Þ ¼ Kð$=hÞ=h, Kð$Þ denotes a kernel function (a sym-metric density), and h > 0 is the smoothing parameter (or band-width). Additionally, the residual sum of square approach was usedto estimate the conditional variance as
bs2�tl�¼ j
�tl; fðTLi;RiÞgni¼1; hR
�
with Ri ¼ ðRTi � bmðTLiÞÞ2.Finally, to determine the model's adjustment, the coefficient of
determinationwas used, as calculated by means of cross-validation(Stone, 1977). This calculation is
R2cv ¼ 1�Pn
i¼1
�Yi � bY ð�iÞ
i
�2Pn
i¼1�Yi � Y
�2where bY ð�iÞ
i indicates the estimates of Yi leaving out the i-thelement of the sample as obtained by fitting the correspondingmodel and Y ¼ n�1Pn
i¼1Yi.
2.3.2. Estimation of the minimum size of captureThe conditional variance ðbs2Þ analysis of TL with respect to RT
showed values of bs2 that were larger than 1.5 beyond TL ¼ 15 mm.This result confirmed the current TL-based measure as unsuitablefor setting the minimum size of capture. Consequently, an alter-native catch size was estimated based on the growth-based RTlength measure. Prior to this estimation, the RT size correspondingto the current minimum size of capture in Cantabria (i.e.,TL ¼ 40 mm) was estimated using the regression model of theEquation (1). This estimation permitted the current TL size in RT tobe comparable to the alternative catch size that we estimated asfollows.
For individuals that collected from the permanently protectedzone of Sonabia, a minimum capture size was estimated using themethodology of Sestelo and Roca-Pardi~nas (2011) by means of theRTeDW lengtheweight relationship. The fact that the analysis wasconducted using data from a permanent protected zone ensuredthat results were not affected by the fishery pressure.
The following nonparametric model was applied to study theRTeDW relationship
DW ¼ m*�RT�þ s*�RT
�ε* (2)
wherem* is the unknown regression function, s*2 is the conditionalvariance function, and ε
* is the error independent of the covariateRT. The estimation of this model was obtained analogously to themodel in (1).
The first derivative of m* was calculated to determine an RT-based new suitable size of capture for this species. The ideal size,named rt0, was used as the maximizer of the first derivative of m*.This point could be define as
rt0 ¼ argmaxrtm*ð1Þ�rt�: (3)
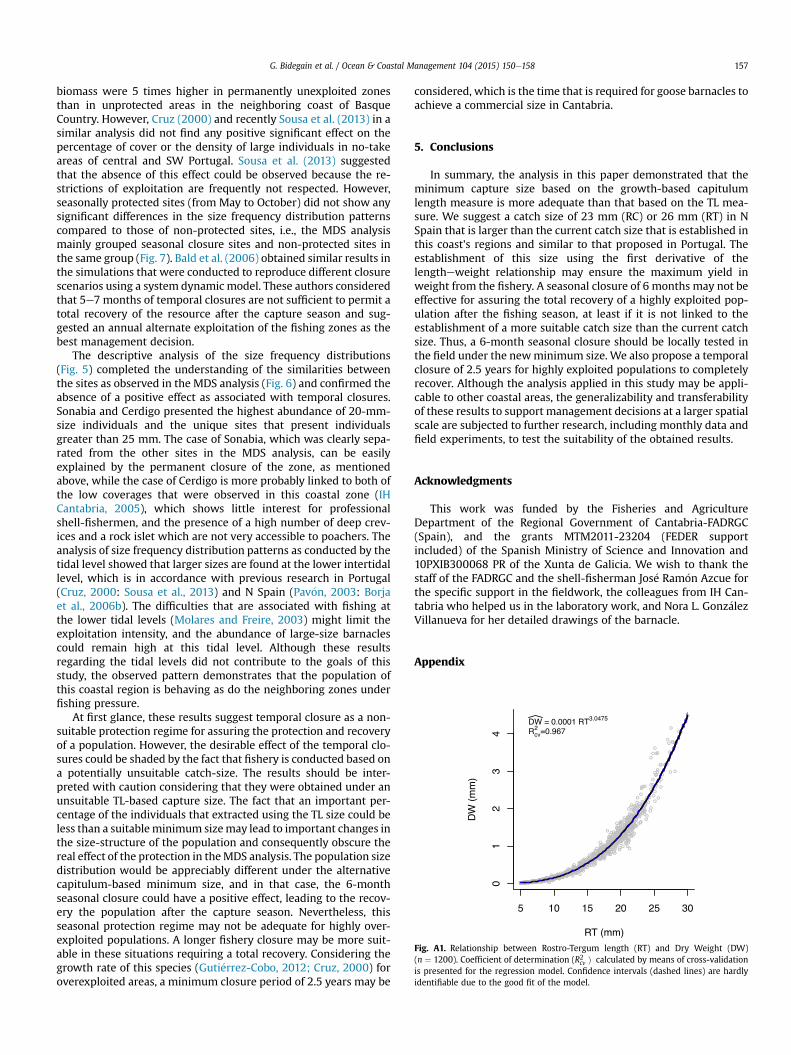
Beyond this point, the increase in weight per unit of size de-creases. Thus, this size ensures that individuals that smaller thanthis size had not yet attained the maximum yield in weight. See afull description of this methodology in Sestelo and Roca-Pardi~nas(2011). This RTeDW relationship was also analyzed using theclassic allometric model (Huxley, 1924) only with the purpose ofcomparing the results of both of the models (see Fig. A1 in theappendix). Note that the first derivative of the allometric modelcannot show a maximum due to its continuously increasing nature.
2.3.3. Size frequency distributionsSize frequency distributions with discrete size classes of 5-mm
RT intervals were obtained for each site. The population class dis-tributionwas also analyzed at each tidal level for the entire dataset.For the descriptive analyses of recruitment patterns and exploitablestocks, two barnacle sizes were selected: RT < 5 mm andRT > 20 mm. These sizes were assumed to correspond to the pre-vious year recruiters and to the minimum size of capture that isallowed in Cantabria, respectively. The capture size is 40 mm TL,with an approximately 20-mm RT length according to the valuethat was obtained in the present study (see Fig. 4a).
2.3.4. Evaluation of the protection regimesUsing the composition of the size frequency distributions at
each site as the input data, a similarity matrix was constructed toperform a multidimensional scaling analysis (MDS) (using Man-hattan distances) with PRIMER 6.0 software (Primer-e Ltd, 2006).The results of the ordination analyses were used to identify simi-larities and differences in the population size structure among siteswith different protection levels. Similar sites were then groupedusing the results that were provided by a single linkage clusteranalysis of the same data. The criterion to evaluate the effectivenessof the different protection levels was the following: the sites thatwere grouped in the same group of non-protected sites wereconsidered to have an ineffective protection regime, while sites thatwere grouped in a different group to that of non-protected siteswere considered to have an effective protection regime. This type ofanalysis was previously applied, with similar purposes, in SWPortugal by Cruz et al. (2010) and Sousa et al. (2013) for P. pollicipes.
3. Results
3.1. Evaluation of the total length-based minimum capture size
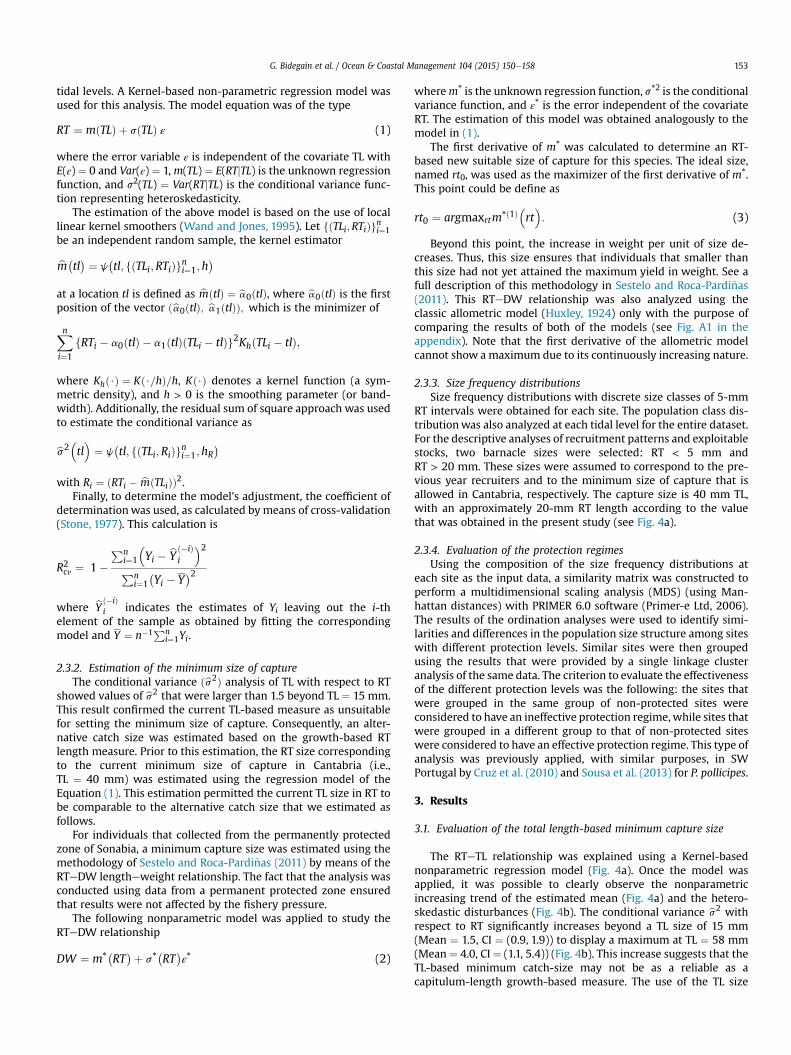
The RTeTL relationship was explained using a Kernel-basednonparametric regression model (Fig. 4a). Once the model wasapplied, it was possible to clearly observe the nonparametricincreasing trend of the estimated mean (Fig. 4a) and the hetero-skedastic disturbances (Fig. 4b). The conditional variance bs2 withrespect to RT significantly increases beyond a TL size of 15 mm(Mean ¼ 1.5, CI ¼ (0.9, 1.9)) to display a maximum at TL ¼ 58 mm(Mean¼ 4.0, CI ¼ (1.1, 5.4)) (Fig. 4b). This increase suggests that theTL-based minimum catch-size may not be as a reliable as acapitulum-length growth-based measure. The use of the TL size
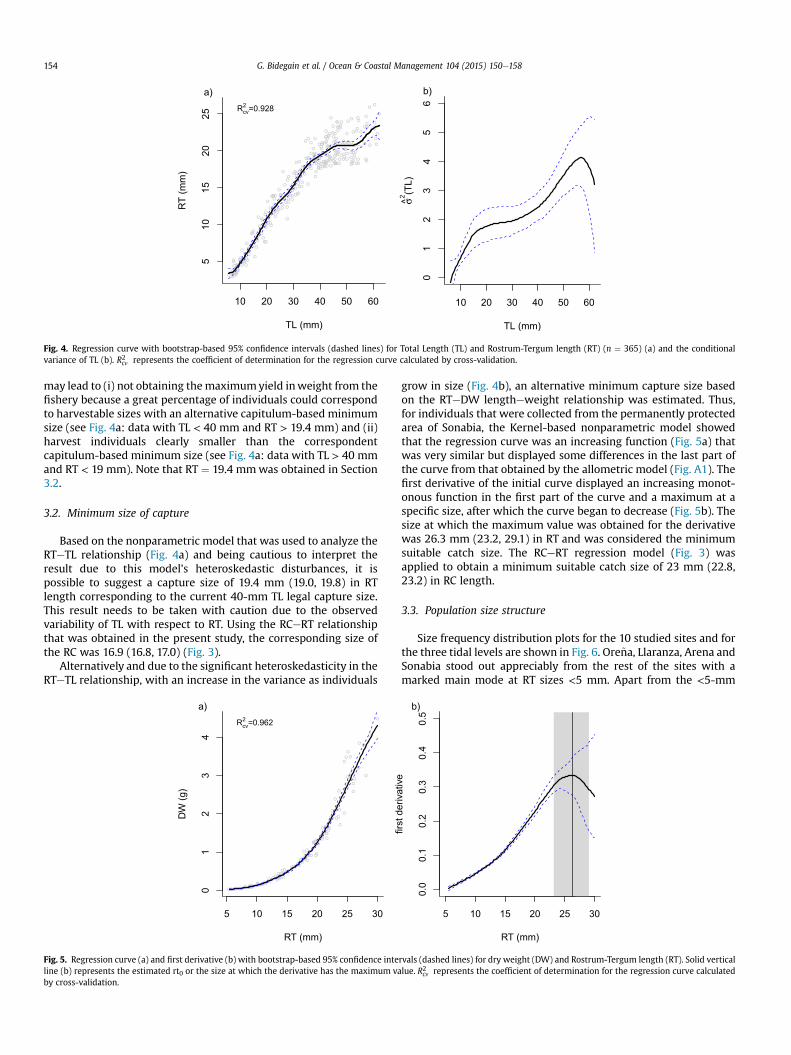
Fig. 4. Regression curve with bootstrap-based 95% confidence intervals (dashed lines) for Total Length (TL) and Rostrum-Tergum length (RT) (n ¼ 365) (a) and the conditionalvariance of TL (b). R2cv represents the coefficient of determination for the regression curve calculated by cross-validation.
G. Bidegain et al. / Ocean & Coastal Management 104 (2015) 150e158154
may lead to (i) not obtaining themaximumyield inweight from thefishery because a great percentage of individuals could correspondto harvestable sizes with an alternative capitulum-based minimumsize (see Fig. 4a: data with TL < 40 mm and RT > 19.4 mm) and (ii)harvest individuals clearly smaller than the correspondentcapitulum-based minimum size (see Fig. 4a: data with TL > 40 mmand RT < 19 mm). Note that RT ¼ 19.4 mmwas obtained in Section3.2.
3.2. Minimum size of capture
Based on the nonparametric model that was used to analyze theRTeTL relationship (Fig. 4a) and being cautious to interpret theresult due to this model's heteroskedastic disturbances, it ispossible to suggest a capture size of 19.4 mm (19.0, 19.8) in RTlength corresponding to the current 40-mm TL legal capture size.This result needs to be taken with caution due to the observedvariability of TL with respect to RT. Using the RCeRT relationshipthat was obtained in the present study, the corresponding size ofthe RC was 16.9 (16.8, 17.0) (Fig. 3).
Alternatively and due to the significant heteroskedasticity in theRTeTL relationship, with an increase in the variance as individuals
Fig. 5. Regression curve (a) and first derivative (b) with bootstrap-based 95% confidence inteline (b) represents the estimated rt0 or the size at which the derivative has the maximum vaby cross-validation.
grow in size (Fig. 4b), an alternative minimum capture size basedon the RTeDW lengtheweight relationship was estimated. Thus,for individuals that were collected from the permanently protectedarea of Sonabia, the Kernel-based nonparametric model showedthat the regression curve was an increasing function (Fig. 5a) thatwas very similar but displayed some differences in the last part ofthe curve from that obtained by the allometric model (Fig. A1). Thefirst derivative of the initial curve displayed an increasing monot-onous function in the first part of the curve and a maximum at aspecific size, after which the curve began to decrease (Fig. 5b). Thesize at which the maximum value was obtained for the derivativewas 26.3 mm (23.2, 29.1) in RT and was considered the minimumsuitable catch size. The RCeRT regression model (Fig. 3) wasapplied to obtain a minimum suitable catch size of 23 mm (22.8,23.2) in RC length.
3.3. Population size structure
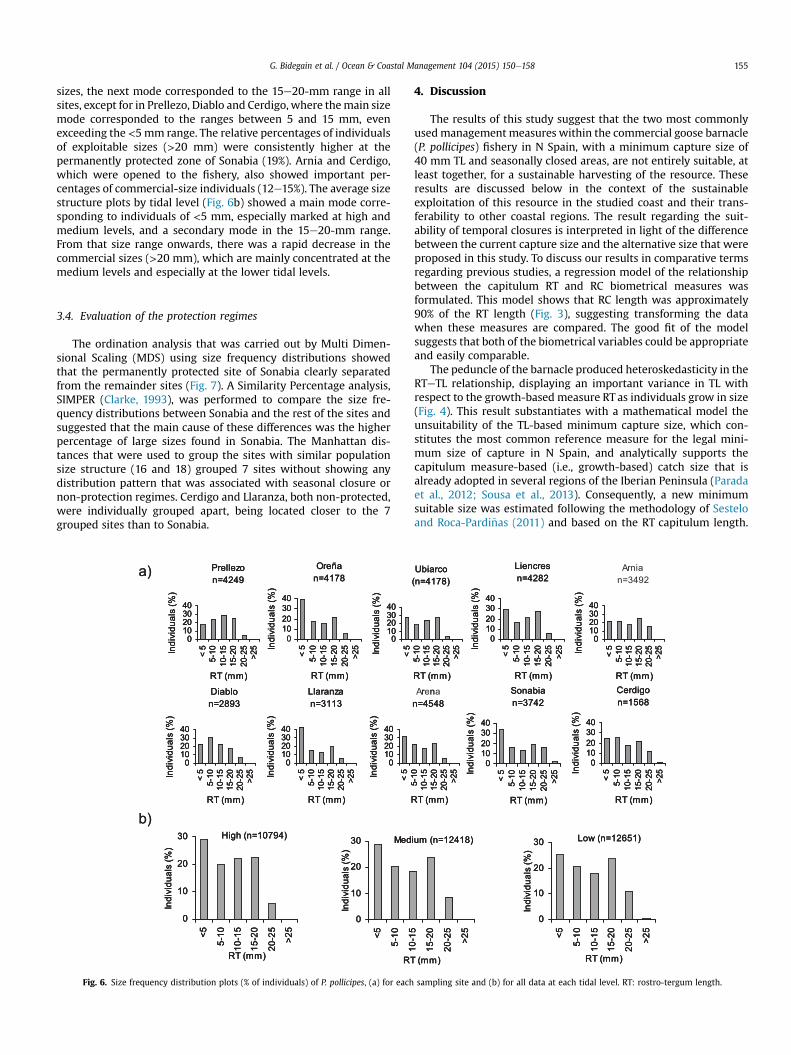
Size frequency distribution plots for the 10 studied sites and forthe three tidal levels are shown in Fig. 6. Ore~na, Llaranza, Arena andSonabia stood out appreciably from the rest of the sites with amarked main mode at RT sizes <5 mm. Apart from the <5-mm
rvals (dashed lines) for dry weight (DW) and Rostrum-Tergum length (RT). Solid verticallue. R2cv represents the coefficient of determination for the regression curve calculated
G. Bidegain et al. / Ocean & Coastal Management 104 (2015) 150e158 155
sizes, the next mode corresponded to the 15e20-mm range in allsites, except for in Prellezo, Diablo and Cerdigo, where themain sizemode corresponded to the ranges between 5 and 15 mm, evenexceeding the <5mm range. The relative percentages of individualsof exploitable sizes (>20 mm) were consistently higher at thepermanently protected zone of Sonabia (19%). Arnia and Cerdigo,which were opened to the fishery, also showed important per-centages of commercial-size individuals (12e15%). The average sizestructure plots by tidal level (Fig. 6b) showed a main mode corre-sponding to individuals of <5 mm, especially marked at high andmedium levels, and a secondary mode in the 15e20-mm range.From that size range onwards, there was a rapid decrease in thecommercial sizes (>20 mm), which are mainly concentrated at themedium levels and especially at the lower tidal levels.
3.4. Evaluation of the protection regimes
The ordination analysis that was carried out by Multi Dimen-sional Scaling (MDS) using size frequency distributions showedthat the permanently protected site of Sonabia clearly separatedfrom the remainder sites (Fig. 7). A Similarity Percentage analysis,SIMPER (Clarke, 1993), was performed to compare the size fre-quency distributions between Sonabia and the rest of the sites andsuggested that the main cause of these differences was the higherpercentage of large sizes found in Sonabia. The Manhattan dis-tances that were used to group the sites with similar populationsize structure (16 and 18) grouped 7 sites without showing anydistribution pattern that was associated with seasonal closure ornon-protection regimes. Cerdigo and Llaranza, both non-protected,were individually grouped apart, being located closer to the 7grouped sites than to Sonabia.
Fig. 6. Size frequency distribution plots (% of individuals) of P. pollicipes, (a) for each
4. Discussion
The results of this study suggest that the two most commonlyusedmanagement measures within the commercial goose barnacle(P. pollicipes) fishery in N Spain, with a minimum capture size of40 mm TL and seasonally closed areas, are not entirely suitable, atleast together, for a sustainable harvesting of the resource. Theseresults are discussed below in the context of the sustainableexploitation of this resource in the studied coast and their trans-ferability to other coastal regions. The result regarding the suit-ability of temporal closures is interpreted in light of the differencebetween the current capture size and the alternative size that wereproposed in this study. To discuss our results in comparative termsregarding previous studies, a regression model of the relationshipbetween the capitulum RT and RC biometrical measures wasformulated. This model shows that RC length was approximately90% of the RT length (Fig. 3), suggesting transforming the datawhen these measures are compared. The good fit of the modelsuggests that both of the biometrical variables could be appropriateand easily comparable.
The peduncle of the barnacle produced heteroskedasticity in theRTeTL relationship, displaying an important variance in TL withrespect to the growth-based measure RT as individuals grow in size(Fig. 4). This result substantiates with a mathematical model theunsuitability of the TL-based minimum capture size, which con-stitutes the most common reference measure for the legal mini-mum size of capture in N Spain, and analytically supports thecapitulum measure-based (i.e., growth-based) catch size that isalready adopted in several regions of the Iberian Peninsula (Paradaet al., 2012; Sousa et al., 2013). Consequently, a new minimumsuitable size was estimated following the methodology of Sesteloand Roca-Pardi~nas (2011) and based on the RT capitulum length.
sampling site and (b) for all data at each tidal level. RT: rostro-tergum length.
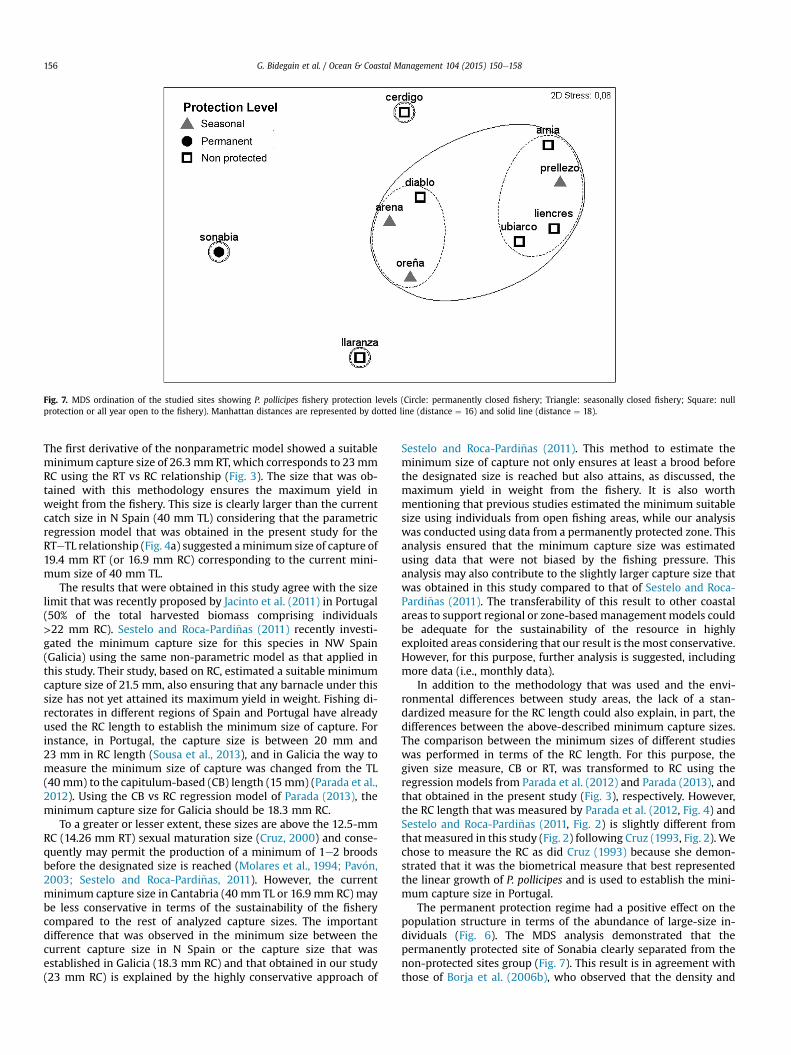
Fig. 7. MDS ordination of the studied sites showing P. pollicipes fishery protection levels (Circle: permanently closed fishery; Triangle: seasonally closed fishery; Square: nullprotection or all year open to the fishery). Manhattan distances are represented by dotted line (distance ¼ 16) and solid line (distance ¼ 18).
G. Bidegain et al. / Ocean & Coastal Management 104 (2015) 150e158156
The first derivative of the nonparametric model showed a suitableminimum capture size of 26.3 mmRT, which corresponds to 23mmRC using the RT vs RC relationship (Fig. 3). The size that was ob-tained with this methodology ensures the maximum yield inweight from the fishery. This size is clearly larger than the currentcatch size in N Spain (40 mm TL) considering that the parametricregression model that was obtained in the present study for theRTeTL relationship (Fig. 4a) suggested aminimum size of capture of19.4 mm RT (or 16.9 mm RC) corresponding to the current mini-mum size of 40 mm TL.
The results that were obtained in this study agree with the sizelimit that was recently proposed by Jacinto et al. (2011) in Portugal(50% of the total harvested biomass comprising individuals>22 mm RC). Sestelo and Roca-Pardi~nas (2011) recently investi-gated the minimum capture size for this species in NW Spain(Galicia) using the same non-parametric model as that applied inthis study. Their study, based on RC, estimated a suitable minimumcapture size of 21.5 mm, also ensuring that any barnacle under thissize has not yet attained its maximum yield in weight. Fishing di-rectorates in different regions of Spain and Portugal have alreadyused the RC length to establish the minimum size of capture. Forinstance, in Portugal, the capture size is between 20 mm and23 mm in RC length (Sousa et al., 2013), and in Galicia the way tomeasure the minimum size of capture was changed from the TL(40 mm) to the capitulum-based (CB) length (15 mm) (Parada et al.,2012). Using the CB vs RC regression model of Parada (2013), theminimum capture size for Galicia should be 18.3 mm RC.
To a greater or lesser extent, these sizes are above the 12.5-mmRC (14.26 mm RT) sexual maturation size (Cruz, 2000) and conse-quently may permit the production of a minimum of 1e2 broodsbefore the designated size is reached (Molares et al., 1994; Pav�on,2003; Sestelo and Roca-Pardi~nas, 2011). However, the currentminimum capture size in Cantabria (40 mm TL or 16.9 mm RC) maybe less conservative in terms of the sustainability of the fisherycompared to the rest of analyzed capture sizes. The importantdifference that was observed in the minimum size between thecurrent capture size in N Spain or the capture size that wasestablished in Galicia (18.3 mm RC) and that obtained in our study(23 mm RC) is explained by the highly conservative approach of
Sestelo and Roca-Pardi~nas (2011). This method to estimate theminimum size of capture not only ensures at least a brood beforethe designated size is reached but also attains, as discussed, themaximum yield in weight from the fishery. It is also worthmentioning that previous studies estimated the minimum suitablesize using individuals from open fishing areas, while our analysiswas conducted using data from a permanently protected zone. Thisanalysis ensured that the minimum capture size was estimatedusing data that were not biased by the fishing pressure. Thisanalysis may also contribute to the slightly larger capture size thatwas obtained in this study compared to that of Sestelo and Roca-Pardi~nas (2011). The transferability of this result to other coastalareas to support regional or zone-basedmanagement models couldbe adequate for the sustainability of the resource in highlyexploited areas considering that our result is the most conservative.However, for this purpose, further analysis is suggested, includingmore data (i.e., monthly data).
In addition to the methodology that was used and the envi-ronmental differences between study areas, the lack of a stan-dardized measure for the RC length could also explain, in part, thedifferences between the above-described minimum capture sizes.The comparison between the minimum sizes of different studieswas performed in terms of the RC length. For this purpose, thegiven size measure, CB or RT, was transformed to RC using theregression models from Parada et al. (2012) and Parada (2013), andthat obtained in the present study (Fig. 3), respectively. However,the RC length that was measured by Parada et al. (2012, Fig. 4) andSestelo and Roca-Pardi~nas (2011, Fig. 2) is slightly different fromthat measured in this study (Fig. 2) following Cruz (1993, Fig. 2). Wechose to measure the RC as did Cruz (1993) because she demon-strated that it was the biometrical measure that best representedthe linear growth of P. pollicipes and is used to establish the mini-mum capture size in Portugal.
The permanent protection regime had a positive effect on thepopulation structure in terms of the abundance of large-size in-dividuals (Fig. 6). The MDS analysis demonstrated that thepermanently protected site of Sonabia clearly separated from thenon-protected sites group (Fig. 7). This result is in agreement withthose of Borja et al. (2006b), who observed that the density and
G. Bidegain et al. / Ocean & Coastal Management 104 (2015) 150e158 157
biomass were 5 times higher in permanently unexploited zonesthan in unprotected areas in the neighboring coast of BasqueCountry. However, Cruz (2000) and recently Sousa et al. (2013) in asimilar analysis did not find any positive significant effect on thepercentage of cover or the density of large individuals in no-takeareas of central and SW Portugal. Sousa et al. (2013) suggestedthat the absence of this effect could be observed because the re-strictions of exploitation are frequently not respected. However,seasonally protected sites (from May to October) did not show anysignificant differences in the size frequency distribution patternscompared to those of non-protected sites, i.e., the MDS analysismainly grouped seasonal closure sites and non-protected sites inthe same group (Fig. 7). Bald et al. (2006) obtained similar results inthe simulations that were conducted to reproduce different closurescenarios using a system dynamic model. These authors consideredthat 5e7 months of temporal closures are not sufficient to permit atotal recovery of the resource after the capture season and sug-gested an annual alternate exploitation of the fishing zones as thebest management decision.
The descriptive analysis of the size frequency distributions(Fig. 5) completed the understanding of the similarities betweenthe sites as observed in the MDS analysis (Fig. 6) and confirmed theabsence of a positive effect as associated with temporal closures.Sonabia and Cerdigo presented the highest abundance of 20-mm-size individuals and the unique sites that present individualsgreater than 25 mm. The case of Sonabia, which was clearly sepa-rated from the other sites in the MDS analysis, can be easilyexplained by the permanent closure of the zone, as mentionedabove, while the case of Cerdigo is more probably linked to both ofthe low coverages that were observed in this coastal zone (IHCantabria, 2005), which shows little interest for professionalshell-fishermen, and the presence of a high number of deep crev-ices and a rock islet which are not very accessible to poachers. Theanalysis of size frequency distribution patterns as conducted by thetidal level showed that larger sizes are found at the lower intertidallevel, which is in accordance with previous research in Portugal(Cruz, 2000: Sousa et al., 2013) and N Spain (Pav�on, 2003: Borjaet al., 2006b). The difficulties that are associated with fishing atthe lower tidal levels (Molares and Freire, 2003) might limit theexploitation intensity, and the abundance of large-size barnaclescould remain high at this tidal level. Although these resultsregarding the tidal levels did not contribute to the goals of thisstudy, the observed pattern demonstrates that the population ofthis coastal region is behaving as do the neighboring zones underfishing pressure.
At first glance, these results suggest temporal closure as a non-suitable protection regime for assuring the protection and recoveryof a population. However, the desirable effect of the temporal clo-sures could be shaded by the fact that fishery is conducted based ona potentially unsuitable catch-size. The results should be inter-preted with caution considering that they were obtained under anunsuitable TL-based capture size. The fact that an important per-centage of the individuals that extracted using the TL size could beless than a suitableminimum sizemay lead to important changes inthe size-structure of the population and consequently obscure thereal effect of the protection in theMDS analysis. The population sizedistribution would be appreciably different under the alternativecapitulum-based minimum size, and in that case, the 6-monthseasonal closure could have a positive effect, leading to the recov-ery the population after the capture season. Nevertheless, thisseasonal protection regime may not be adequate for highly over-exploited populations. A longer fishery closure may be more suit-able in these situations requiring a total recovery. Considering thegrowth rate of this species (Guti�errez-Cobo, 2012; Cruz, 2000) foroverexploited areas, a minimum closure period of 2.5 years may be
considered, which is the time that is required for goose barnacles toachieve a commercial size in Cantabria.
5. Conclusions
In summary, the analysis in this paper demonstrated that theminimum capture size based on the growth-based capitulumlength measure is more adequate than that based on the TL mea-sure. We suggest a catch size of 23 mm (RC) or 26 mm (RT) in NSpain that is larger than the current catch size that is established inthis coast's regions and similar to that proposed in Portugal. Theestablishment of this size using the first derivative of thelengtheweight relationship may ensure the maximum yield inweight from the fishery. A seasonal closure of 6 months may not beeffective for assuring the total recovery of a highly exploited pop-ulation after the fishing season, at least if it is not linked to theestablishment of a more suitable catch size than the current catchsize. Thus, a 6-month seasonal closure should be locally tested inthe field under the newminimum size. We also propose a temporalclosure of 2.5 years for highly exploited populations to completelyrecover. Although the analysis applied in this study may be appli-cable to other coastal areas, the generalizability and transferabilityof these results to support management decisions at a larger spatialscale are subjected to further research, including monthly data andfield experiments, to test the suitability of the obtained results.
Acknowledgments
This work was funded by the Fisheries and AgricultureDepartment of the Regional Government of Cantabria-FADRGC(Spain), and the grants MTM2011-23204 (FEDER supportincluded) of the Spanish Ministry of Science and Innovation and10PXIB300068 PR of the Xunta de Galicia. We wish to thank thestaff of the FADRGC and the shell-fisherman Jos�e Ram�on Azcue forthe specific support in the fieldwork, the colleagues from IH Can-tabria who helped us in the laboratory work, and Nora L. Gonz�alezVillanueva for her detailed drawings of the barnacle.
Appendix
Fig. A1. Relationship between Rostro-Tergum length (RT) and Dry Weight (DW)(n ¼ 1200). Coefficient of determination (R2cv Þ calculated by means of cross-validationis presented for the regression model. Confidence intervals (dashed lines) are hardlyidentifiable due to the good fit of the model.
G. Bidegain et al. / Ocean & Coastal Management 104 (2015) 150e158158
References
Bald, J., Borja, A., 2012. The gooseneck barnacle (Pollicipes pollicipes) in the BasqueCountry (Northern Spain): facing the future of is management. Rev. Investig.Mar. 19 (6), 467e468.
Bald, J., Borja, A., Muxika, I., 2006. A system dynamics model for the management ofthe gooseneck barnacle (Pollicipes pollicipes) in the marine reserve of Gaz-telugatxe (Northern Spain). Ecol. Model. 194, 306e315.
Barnes, M., 1996. Pedunculate cirripedes of the genus Pollicipes. Oceanogr. Mar. Biol.Annu. Rev. 34, 303e394. Maritime Engineering and Technology e GuedesSoares et al.
Bernard, F.R., 1988. Potential fishery for the gooseneck barnacle Pollicipes polymerus(Sowerby, 1833) in British Columbia. Fish. Res. 6, 287e298.
Borja, A., Muxika, I., Bald, J., 2006a. Protection of the goose barnacle Pollicipespollicipes, Gmelin, 1790 population: the Gaztelugatxe Marine Reserve (BasqueCountry, northern Spain). Sci. Mar. 70, 235e242.
Borja, A., Liria, P., Muxika, I., Bald, J., 2006b. Relationships between wave exposureand biomass of the goose barnacle (Pollicipes pollicipes, Gmelin, 1790) in theGaztelugatxe Marine Reserve (Basque Country, northern Spain). ICES J. Mar. Sci.63, 626e636.
Borja, A., Liria, P., Bald, J., 2011. El Recurso Marisquero del Percebe (Pollicipes pol-licipes) en la Costa Vasca: Relaciones con la Energía del Oleaje, entre 2002 y2011, p. 47. Informe de AZTI-Tecnalia para el Departamento de Medio Ambiente,Planificaci�on Territorial, Agricultura y Pesca del Gobierno Vasco.
Clarke, K.R., 1993. Non-parametric multivariate analyses of changes in communitystructure. Aust. J. Ecol. 18, 117e143.
Cruz, T., 1993. Growth of Pollicipes pollicipes (Gmelin, 1790) (Cirripedia, Lep-adomorpha) on the SW coast of Portugal. Crustaceana 65, 151e158.
Cruz, T., 2000. Biologia e ecologia do percebe, Pollicipes pollicipes (Gmelin, 1790),no litoral sudoeste portugues. PhD thesis. Universidade de �Evora, Portugal.
Cruz, T., Castro, J.J., Hawkins, S.J., 2010. Recruitment, growth and population sizestructure of Pollicipes pollicipes in SW Portugal. J. Exp. Mar. Biol. Ecol. 392,200e209.
Cruz, T., Araújo, J., 1999. Reproductive patterns of Pollicipes pollicipes (Cirripedia:Scalpellomorpha) on the southwestern coast of Portugal. J. Crust. Biol. 19,260e267.
Cunha, I., Weber, M., 2001. Actividad reproductora del percebe Pollicipes pollicipesen el norte de Portugal. In: D.G.d. P. y. A.G.d. Cantabria (Ed.), Libro de resúmenesVII CongresoNacional de Acuicultura. Santander, pp. 173e175.
Guti�errez-Cobo, M.B., 2012. Recruitment, Growth and Population Size Structure ofPollicipes pollicipes on the Coast of Cantabria, Gulf of Biscay (N Spain). Consid-erations for Fisheries Management. Master of science thesis. University ofCantabria, Spain.
Hoffman, D.L., 1984. Size-frequency distribution patterns of the juvenile stages ofthe pedunculate barnacle, Pollicipes polymerus Sowerby, 1833 (Cirripedia, Lep-adomorpha). Crustaceana 46, 295e299.
Hoffman, D.L., 1988. Settlement and growth of the pedunculate barnacle Pollicipespolymerus Sowerby in an intake seawater system at the Scripps institution ofOceanography, La Jolla, California. Pac. Sci. 42, 154e159.
Hoffman, D.L., 1989. Settlement and recruitment patterns of a pedunculate barna-cle, Pollicipes polymerus Sowerby, off La Jolla, California. J. Exp. Mar. Biol. Ecol.125 (2), 83e98.
Huxley, J.S., 1924. Constant differential growth-ratios and their significance. Nature114, 895e896.
IH Cantabria, 2005. Evaluaci�on de recursos de inter�es marisquero en el litoral deCantabria y desarrollo de protocolos aplicables a su gesti�on. Technical report.University of Cantabria, Gobierno de Cantabria, p. 87 (in Spanish).
Jacinto, D., Cruz, T., Silva, T., Castro, J.J., 2010. Stalked barnacle (Pollicipes pollicipes)harvesting in the Berlengas Nature Reserve, Portugal: temporal variation andvalidation of logbook data. ICES J. Mar. Sci. 67, 19e25.
Jacinto, D., Cruz, T., Silva, T., Castro, J.J., 2011. Management of the stalked barnacle(Pollicipes pollicipes) fishery in the Berlengas Nature Reserve (Portugal): eval-uation of bag and size limit regulation measures. Sci. Mar. 75 (3), 439e445.
Jamieson, G.S., Lauzier, R., Gillespie, G., 1999. Phase 1 framework for undertaking anecological assessment for outer coast rocky intertidal zone. Can. Stock Assess.Secretariat Res. 209. Doc. 99.
Lewis, C.A., Chia, F., 1981. Growth, fecundity, and reproductive biology in thepedunculate cirripede Pollicipes polymerus at San Juan Island, Washington. Can.J. Zool. 59, 893e901.
Molares, J., Freire, J., 2003. Development and perspectives for community-basedmanagement of the goose barnacle (Pollicipes pollicipes) fisheries in Galicia(NW Spain). Fish. Res. 65, 485e492.
Molares, J., Tilves, F., Quintana, R., Rodriguez, S., Pascual, C., 1994. Gametogenesis ofPollicipes cornucopia (Cirripedia: Scalpellomorpha) in North-west Spain. Mar.Biol. 120, 553e560.
Page, H.M., 1986. Differences in population structure and growth rate of the stalkedbarnacle Pollicipes polymerus between a rocky headland and an o shore oilplatform. Mar. Ecol. Prog. Ser. 29 (2), 157e164.
Parada, J.M., 2013. A correction to “Assessment of goose barnacle (Pollicipes polli-cipes Gmelin, 1789) stocks in management plans: design of a sampling programbased on the harvesters' experience”. ICES J. Mar. Sci. 70 (1), 244.
Parada, J.M., Outeiral, R., Iglesias, E., Molares, J., 2012. Assessment of goose barnacle(Pollicipes pollicipes Gmelin, 1789) stocks in management plans: design of asampling program based on the harvesters' experience. ICES J. Mar. Sci. 69 (10),1840e1849.
Pav�on, C., 2003. Biología y variables poblacionales del percebe, Pollicipes pollicipes(Gmelin, 1790) en Asturias. PhD thesis. Universidad de Oviedo, Spain.
R Development Core Team, 2009. R: a Language and Environment for StatisticalComputing. R Foundation for Statistical Computing, Vienna, Austria, ISBN 3-900051-07-0.
Sestelo, M., Roca-Pardi~nas, J., 2011. A new approach to estimation of length-weightrelationship of Pollicipes pollicipes (Gmelin, 1789) on the Atlantic coast of Galicia(Northwest Spain): some aspects of its biology and management. J. ShellfishRes. 30, 939e948.
Sousa, A., Jacinto, D., Penteado, N., Martins, P., Fernandes, J., Silva, T., Castro, J.J.,Cruz, T., 2013. Patterns of distribution and abundance of the stalked barnacle(Pollicipes pollicipes) in the central and southwest coast of continental Portugal.J. Sea Res. 83, 187e194.
Stewart, A., Fragoso, B.D., Clímaco, R., Icely, J.D., 2014. Evaluation of stakeholderperspectives on the management of the stalked barnacles (Pollicipes pollicipes)resource in the Parque Natural do Sudoeste Alentejano e Costa Vicentina,Portugal. Mar. Policy 43, 71e79.
Stone, M., 1977. An asymptotic equivalence of choice of model by cross-validationand Akaike's criterion. J. R. Stat. Soc. Ser. B 39, 44e47.
Wand, M.P., Jones, M.C., 1995. Kernel Smoothing. Chapman & Hall, London.Young, J., 2013. Catch Shares in Action: Spanish Galicia Goose Barnacle Cofradía
System. Environmental Defense Fund. Technical Report, 10 pp.
Copyright © 2022 FDOKUMEN