ASSESSING THE SELF PURIFICATION OF LAKE MANINJAU ...
11
VOL. 16, NO. 12, JUNE 2021 ISSN 1819-6608 ARPN Journal of Engineering and Applied Sciences ©2006-2021 Asian Research Publishing Network (ARPN). All rights reserved. www.arpnjournals.com 1207 ASSESSING THE SELF PURIFICATION OF LAKE MANINJAU BASED ON DEPTH STRATIFICATION Puti Sri Komala, Ansiha Nur and Ikrima Nazifa Department of Environmental Engineering, Faculty of Engineering, Andalas University, Kampus Limau Manis, Padang, Sumatera Barat, Indonesia E-Mail: [email protected] ABSTRACT This study aims to determine the self-purification of Lake Maninjau based on the depth stratification. Sampling was carried out at the locations where there was lake water use, namely in the middle, domestically, in the hydropower area, in the endemic fisheries and at the aquaculture cages under SNI 6989.57: 2008. The measured parameters were BOD and the environmental parameters of pH, DO, and temperature were used to determine the lake stratification. Lake Maninjau's self-purification was determined by comparing the deoxygenation (K1) and reaeration (K2) coefficients. Based on the pH, DO, and temperature profiles, the epilimnion layer was found at 0-22 m depth and the hypolimnion layer started at a depth of 22 m. The BOD concentrations obtained did not meet the Government Regulation quality standards of 21.87- 47 mg/L. The deoxygenation coefficient K1 in the epilimnion layer ranged from 0.04-1.49/day while in the hypolimnion layer it ranged from 0.08-0.54/day. The reaeration coefficient K2 in the epilimnion layer ranged from 0.04 to 0.57/day while in the hypolimnion layer, it ranged from 0.005 to 0.04/day. Wind speed and depth play a significant role in determining the lake’s self-purification capacity. The self-purification of the lake was still held mainly in the epilimnion layer at depths of 0-9 m while in the hypolimnion layer deeper than 22 m, its ability begins to diminish. This indicates that most of the lake waters have a significantly decreased natural self-purification capacity. Keywords: lake maninjau; deoxygenation; lake stratification; reaeration; self-purification. 1. INTRODUCTION Lake Maninjau is one of the ancient lakes formed by the devastating eruption of the Sitinjau volcano. The lake is located in Agam regency, West Sumatra at an altitude of 461.5 m asl with a maximum length of 16,460 m and a width of 7,500 m. The total area of Lake Maninjau is 97.375,000 m 2 and it has a beach length of 52.68 km. The average depth is 105 m and a maximum depth of 165 m. The total water volume is 10,226,001,629 m 3 [1]. The lake has an important role in supporting the economy of the surrounding community through tourism, as a water source for hydroelectric power, for fishery and cage cultivation activities, and as a raw water source for drinking water [2]. As a result of the increasing burden of waste entering the lake due to anthropogenic activities, the quality of Lake Maninjau is deteriorating. The input of the organic pollutant load mainly caused by fish cages around the lake produces 13,894.52 kg BOD/day and 20,841.78 kg COD/day [3]. Meanwhile, the levels of TP (0,28-0,59 mg/L) and TN (0,96-2,09 mg/L) are already quite high, indicated hypereutrophic conditions [4]. Lakes have specific aquatic ecosystems capable of controlling the physical, chemical, and biotic processes that are essential for the formation of air quality and water purification [5]. Self-purification and ecological remediation are inseparable from the important multifunctional role of aquatic biota [6]. Biotic processes can control and influence the physical, chemical, and biological processes in the formation of the water quality in aquatic ecosystems. One quantitative measure that has been used to evaluate the purification of surface water from dissolved contaminants is the biological oxygen demand (BOD). This is the amount of oxygen consumed by bacteria in the decomposition process of organic matter [7]. In lakes, wind-induced currents and thermocline structures mainly control the vertical distribution of heat, solutes, and nutrients in the water column [8]. Thermal stratification is very important when determining the mixing patterns in lakes. In a tropical country such as Indonesia, the annual temperature variation is relatively small. As a consequence, the temperature difference between the epilimnion and hypolimnion is slight [9]. The thermal differences in the water column result in incomplete mixing in the aquatic layer forming stratification. Photosynthesis takes place at the lake surface, and the subsequent decomposition of organic material occurs in the deeper layers [9]. The high load of pollutants entering the body of water can change the physical and chemical conditions of the water and reduce the self-purification capacity. The self-purification of the water from dissolved organic contaminants is estimated by the amount of oxygen consumed by the bacteria in organic matter (OM) decomposition. The water purification from OM is based on the development and analysis of the oxygen sag curve, which represents the temporal development of BOD and dissolved oxygen (DO) concentrations [7]. Self-purification is expressed through the ratio of the coefficient of reaeration (K2) and the coefficient of deoxygenation (K1) or K2/K1 [10]. Self-purification research has been carried out previously in three sampling stations on the east and west sides of Lake Maninjau at a depth of 0, 2, 4, 6 and 10 m in the middle of the lake in rain and dry conditions [11]. The overall purification ratio (K2/K1) of Lake Maninjau was in the range of 1.28-5.05 in rainy conditions and 1.11- 7.23 in dry conditions. This shows that the Lake Maninjau epilimnion zone can still assimilate organic pollutants. The input of pollutant
-
Upload
khangminh22 -
Category
Documents
-
view
0 -
download
0
Transcript of ASSESSING THE SELF PURIFICATION OF LAKE MANINJAU ...
VOL. 16, NO. 12, JUNE 2021 ISSN 1819-6608
ARPN Journal of Engineering and Applied Sciences ©2006-2021 Asian Research Publishing Network (ARPN). All rights reserved.
www.arpnjournals.com
1207
ASSESSING THE SELF PURIFICATION OF LAKE MANINJAU BASED ON DEPTH STRATIFICATION
Puti Sri Komala, Ansiha Nur and Ikrima Nazifa
Department of Environmental Engineering, Faculty of Engineering, Andalas University, Kampus Limau Manis, Padang,
Sumatera Barat, Indonesia
E-Mail: [email protected]
ABSTRACT
This study aims to determine the self-purification of Lake Maninjau based on the depth stratification. Sampling
was carried out at the locations where there was lake water use, namely in the middle, domestically, in the hydropower
area, in the endemic fisheries and at the aquaculture cages under SNI 6989.57: 2008. The measured parameters were BOD
and the environmental parameters of pH, DO, and temperature were used to determine the lake stratification. Lake
Maninjau's self-purification was determined by comparing the deoxygenation (K1) and reaeration (K2) coefficients. Based
on the pH, DO, and temperature profiles, the epilimnion layer was found at 0-22 m depth and the hypolimnion layer started
at a depth of 22 m. The BOD concentrations obtained did not meet the Government Regulation quality standards of 21.87-
47 mg/L. The deoxygenation coefficient K1 in the epilimnion layer ranged from 0.04-1.49/day while in the hypolimnion
layer it ranged from 0.08-0.54/day. The reaeration coefficient K2 in the epilimnion layer ranged from 0.04 to 0.57/day
while in the hypolimnion layer, it ranged from 0.005 to 0.04/day. Wind speed and depth play a significant role in
determining the lake’s self-purification capacity. The self-purification of the lake was still held mainly in the epilimnion
layer at depths of 0-9 m while in the hypolimnion layer deeper than 22 m, its ability begins to diminish. This indicates that
most of the lake waters have a significantly decreased natural self-purification capacity.
Keywords: lake maninjau; deoxygenation; lake stratification; reaeration; self-purification.
1. INTRODUCTION
Lake Maninjau is one of the ancient lakes formed
by the devastating eruption of the Sitinjau volcano. The
lake is located in Agam regency, West Sumatra at an
altitude of 461.5 m asl with a maximum length of 16,460
m and a width of 7,500 m. The total area of Lake
Maninjau is 97.375,000 m2 and it has a beach length of
52.68 km. The average depth is 105 m and a maximum
depth of 165 m. The total water volume is 10,226,001,629
m3 [1]. The lake has an important role in supporting the
economy of the surrounding community through tourism,
as a water source for hydroelectric power, for fishery and
cage cultivation activities, and as a raw water source for
drinking water [2]. As a result of the increasing burden of
waste entering the lake due to anthropogenic activities, the
quality of Lake Maninjau is deteriorating. The input of the
organic pollutant load mainly caused by fish cages around
the lake produces 13,894.52 kg BOD/day and 20,841.78
kg COD/day [3]. Meanwhile, the levels of TP (0,28-0,59
mg/L) and TN (0,96-2,09 mg/L) are already quite high,
indicated hypereutrophic conditions [4].
Lakes have specific aquatic ecosystems capable
of controlling the physical, chemical, and biotic processes
that are essential for the formation of air quality and water
purification [5]. Self-purification and ecological
remediation are inseparable from the important
multifunctional role of aquatic biota [6]. Biotic processes
can control and influence the physical, chemical, and
biological processes in the formation of the water quality
in aquatic ecosystems. One quantitative measure that has
been used to evaluate the purification of surface water
from dissolved contaminants is the biological oxygen
demand (BOD). This is the amount of oxygen consumed
by bacteria in the decomposition process of organic matter
[7]. In lakes, wind-induced currents and thermocline
structures mainly control the vertical distribution of heat,
solutes, and nutrients in the water column [8].
Thermal stratification is very important when
determining the mixing patterns in lakes. In a tropical
country such as Indonesia, the annual temperature
variation is relatively small. As a consequence, the
temperature difference between the epilimnion and
hypolimnion is slight [9]. The thermal differences in the
water column result in incomplete mixing in the aquatic
layer forming stratification. Photosynthesis takes place at
the lake surface, and the subsequent decomposition of
organic material occurs in the deeper layers [9]. The high
load of pollutants entering the body of water can change
the physical and chemical conditions of the water and
reduce the self-purification capacity. The self-purification
of the water from dissolved organic contaminants is
estimated by the amount of oxygen consumed by the
bacteria in organic matter (OM) decomposition. The water
purification from OM is based on the development and
analysis of the oxygen sag curve, which represents the
temporal development of BOD and dissolved oxygen
(DO) concentrations [7].
Self-purification is expressed through the ratio of
the coefficient of reaeration (K2) and the coefficient of
deoxygenation (K1) or K2/K1 [10]. Self-purification
research has been carried out previously in three sampling
stations on the east and west sides of Lake Maninjau at a
depth of 0, 2, 4, 6 and 10 m in the middle of the lake in
rain and dry conditions [11]. The overall purification ratio
(K2/K1) of Lake Maninjau was in the range of 1.28-5.05 in
rainy conditions and 1.11- 7.23 in dry conditions. This
shows that the Lake Maninjau epilimnion zone can still
assimilate organic pollutants. The input of pollutant

VOL. 16, NO. 12, JUNE 2021 ISSN 1819-6608
ARPN Journal of Engineering and Applied Sciences ©2006-2021 Asian Research Publishing Network (ARPN). All rights reserved.
www.arpnjournals.com
1208
sources into the lake continuously causes the organic
burden of the waters to continue to increase. It creates an
increase in the BOD and COD concentrations as the depth
increases, whereas the shallow lake waters tend to be
mixed due to turbulence [11]. In this study, self-
purification in the hypolimnion layer and its relationship
to flow velocity and wind speed at the lake surface is not
yet known. This study's main objective is to evaluate the
natural purification of the biodegradable organic
contaminants in Lake Maninjau and its surrounding
locations using the purification ratio approach mentioned
above. Another goal is to determine if the changes in
temperature, pH, and DO profiles correspond to depth.
From these two aspects, self-purification was evaluated
based on depth stratification and the sources of
contaminants coming from around the lake.
2. METHODOLOGY
2.1 Sampling and Parameters Analysis
The study was conducted from February to May
2018, sampling 3 times every 2 weeks. The sampling
location and depth were determined based on the
Indonesian National Standard referring to the surface
water sampling method[12], which can be seen in Figure-
1. Based on this standard, 5 locations were established by
considering lake utilisation and the nearest pollutant
source, namely dense settlements, endemic fisheries,
aquaculture cages and hydropower, in addition to the
centre of the lake. The description of each sampling
location is presented in Table-1. Sampling was carried out
on a boat using a vertical water sampler. For the central
area of the lake with a depth of 160 m, 4 sampling
locations were taken while at a lake depth below 30 m, 3
sampling points. The analysed water parameters were
BOD5, temperature, DO and pH, while the measured
environmental parameters were wind speed, water
discharge and flow velocity. The BOD5 analysis refers to
the Standard Methods for the Examination of Water and
Wastewater [13]. The measurement of the lake water
quality parameters was then compared with the quality
standards of Government Regulation No. 82 of 2001
concerning the Management of Water Quality and Water
Pollution Control under class 2 quality standards [14].
Figure-1. Map of location.
2.2 Self-Purification Calculation
Lake Maninjau’s self-purification can be
determined through the purification ratio, K2/K1, where K1
is the deoxygenation rate constant and K2 is the reaeration
rate. The deoxygenation rate coefficient (K1) was
calculated using the slope method through the first-order
reaction equation from the result of 5 days BOD5
measurements and the temperature at each sampling

VOL. 16, NO. 12, JUNE 2021 ISSN 1819-6608
ARPN Journal of Engineering and Applied Sciences ©2006-2021 Asian Research Publishing Network (ARPN). All rights reserved.
www.arpnjournals.com
1209
location [15]. The K1 value according to the temperature
of each sample is calculated through equation 1.
K1(T) = K1(20C) x 1,047(T-20C) ………………………..…(1)
The reaeration coefficient (K2) is calculated using
the Thomann and Fitzpatrick equations [16]. The
coefficient value of the reaeration rate (K2) is determined
by the data on the depth of the sampling at each sampling
point (H), the lake flow velocity (Uo), and the wind speed
above the lake surface (Uw) which is then subsidised to
equation 2.
K2 = 3,93 √U0
H3/2 + 0,728Uw
0,5- 0,317Uw+0,037Uw2
H ………………(2)
Purification ratios are determined by comparing
the values of K2 and K1 (K2/K1) [10]. The purification ratio
value is higher than one. This means that the water can
purify itself naturally from the pollutant load that enters
the lake. However, if the value of the purification ratio is
smaller than 1, then this means that the water is not able to
purify itself naturally from the pollutant load that enters
the lake.
Table-1. Description of the sampling stations in Maninjau lake.
Sampling Location Position Description
Aquaculture cage S: 00º13’13,3’’
Dense aquaculture cage E: 100º10’08,8’’
Domestic S: 00º18’59,9’’ Densely-populated
settlement E: 100º09’53,3”
Endemic S: 00º15’33,2’’
Endemic fisheries E: 100º10’50,5’’
Centre of the lake S: 00º22’17’’ The deepest part of the
lake E: 100º11’22,3’’
Hydropower
S: 00º17’24,1’’ Hydropower intake,
conservation area,
sandy bottom substrate
and tourist area. E: 100º08’58,8’’
3. RESULTS AND DISCUSSIONS
3.1 Lake Stratification
The determination of self-purification is based on
lake stratification. Lake stratification is reviewed based on
the temperature, pH, and DO profiles in relation to depth.
The stratification profile was observed in the middle of the
lake as well as in other sites.
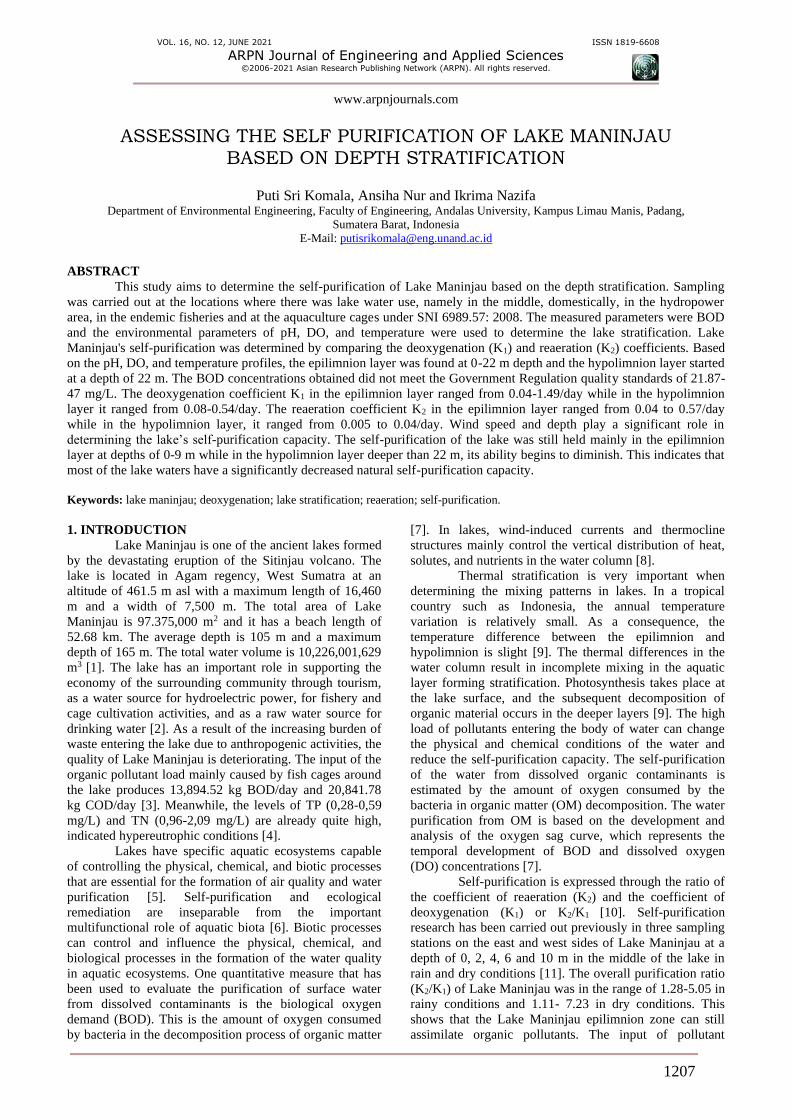
3.1.1 Temperature profile
The temperature profile of Lake Maninjau can be
seen in Figures 2a and 2 b. Lake Maninjau’s temperatures
in various depths range from 28.03 to 31.47oC. The range
in temperatures recorded at different depths does not differ
significantly, by 3⁰C. In the middle of the lake (Figure
2a.), the temperature at 0-22 m depth decreased by ± 1.5⁰C
while for deeper than 22 m, the temperature only changed
± 0.5⁰C. It tends to be stable until the bottom. It shows that
the epilimnion layer in the middle of the lake is at a depth
of 0-22 m and that the hypolimnion layer started at a depth
of 22 m. The difference in temperature between the two
layers is only around ± 2 oC.
In Monoun Lake, which has a maximum depth of
96 m, the higher thermal variation is 26.70°C at the
surface down to 20.4°C at 8 m (Kling, 1988). Surface
temperature and thermal stratification vary according to
the air temperature. The temperature difference between
the surface layer with the bottom ranging from 0.5-3.3°C
was also shown in the crater lake of Uganda with a 30 m
depth [17]. The temperature of tropical lake waters found
in several lakes in Africa ranges from 18.6 to 32.5°C. This
is closely related to the surrounding air temperature [18].
The number of lakes found in the tropics at higher
latitudes, often with little annual variation in solar
radiation and other factors such as seasonal winds, rainfall
and humidity, play a dominant role in determining the
passage of time and the rate of heat change and associated
thermal stratification[19].
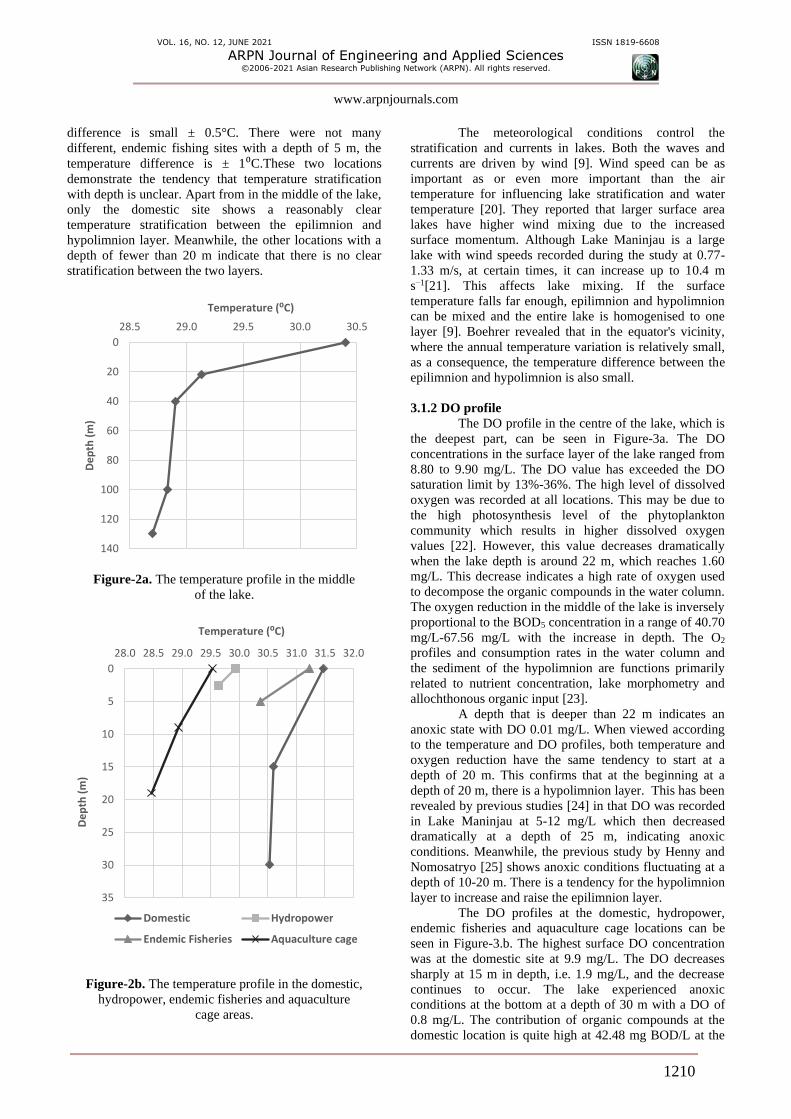
At the domestic sampling location, 0-15 m
indicates a temperature change of around 1⁰C. In contrast,
at a depth greater than 15 m, there is only a little
difference ± 0.05⁰C. Nevertheless, a trend can be seen in
that the epilimnion layer is 0-15 m deep and the
hypolimnion layer is >15 m deep. The aquaculture site has
a depth of 19 m and the temperature change at 0-9 m is
around 0.6⁰C, while the temperature change at a depth of
9-19 m is ± 0.46⁰C. The temperature profile at the
aquaculture location is similar to that of the domestic site
to a depth of 15 m. However, no stable temperature values
were seen in the deeper parts such as at the aquaculture
cage at depths >19 m. The boundary between the
epilimnion and hypolimnion layer at this location is not
clear. Meanwhile, the temperature at the hydropower
plants with a shallow depth of 2.5 m shows that the
VOL. 16, NO. 12, JUNE 2021 ISSN 1819-6608
ARPN Journal of Engineering and Applied Sciences ©2006-2021 Asian Research Publishing Network (ARPN). All rights reserved.
www.arpnjournals.com
1210
difference is small ± 0.5°C. There were not many
different, endemic fishing sites with a depth of 5 m, the
temperature difference is ± 1⁰C.These two locations
demonstrate the tendency that temperature stratification
with depth is unclear. Apart from in the middle of the lake,
only the domestic site shows a reasonably clear
temperature stratification between the epilimnion and
hypolimnion layer. Meanwhile, the other locations with a
depth of fewer than 20 m indicate that there is no clear
stratification between the two layers.
Figure-2a. The temperature profile in the middle
of the lake.
Figure-2b. The temperature profile in the domestic,
hydropower, endemic fisheries and aquaculture
cage areas.
The meteorological conditions control the
stratification and currents in lakes. Both the waves and
currents are driven by wind [9]. Wind speed can be as
important as or even more important than the air
temperature for influencing lake stratification and water
temperature [20]. They reported that larger surface area
lakes have higher wind mixing due to the increased
surface momentum. Although Lake Maninjau is a large
lake with wind speeds recorded during the study at 0.77-
1.33 m/s, at certain times, it can increase up to 10.4 m
s−1[21]. This affects lake mixing. If the surface
temperature falls far enough, epilimnion and hypolimnion
can be mixed and the entire lake is homogenised to one
layer [9]. Boehrer revealed that in the equator's vicinity,
where the annual temperature variation is relatively small,
as a consequence, the temperature difference between the
epilimnion and hypolimnion is also small.
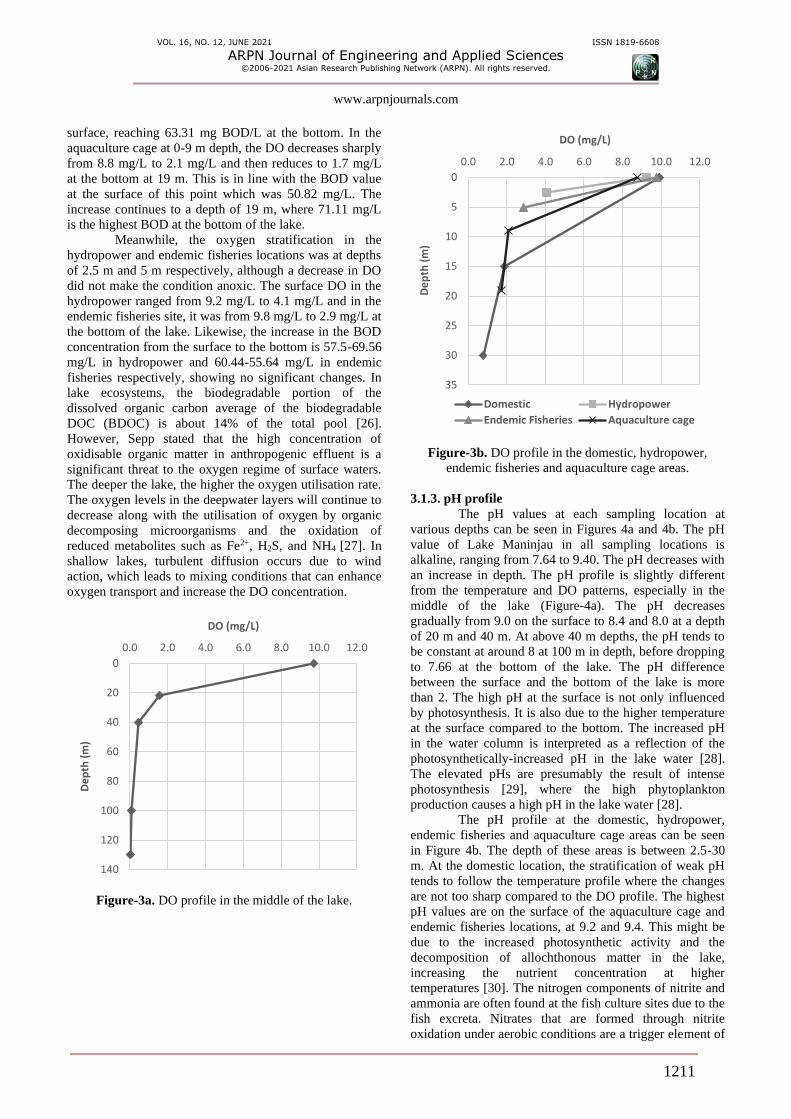
3.1.2 DO profile
The DO profile in the centre of the lake, which is
the deepest part, can be seen in Figure-3a. The DO
concentrations in the surface layer of the lake ranged from
8.80 to 9.90 mg/L. The DO value has exceeded the DO
saturation limit by 13%-36%. The high level of dissolved
oxygen was recorded at all locations. This may be due to
the high photosynthesis level of the phytoplankton
community which results in higher dissolved oxygen
values [22]. However, this value decreases dramatically
when the lake depth is around 22 m, which reaches 1.60
mg/L. This decrease indicates a high rate of oxygen used
to decompose the organic compounds in the water column.
The oxygen reduction in the middle of the lake is inversely
proportional to the BOD5 concentration in a range of 40.70
mg/L-67.56 mg/L with the increase in depth. The O2
profiles and consumption rates in the water column and
the sediment of the hypolimnion are functions primarily
related to nutrient concentration, lake morphometry and
allochthonous organic input [23].
A depth that is deeper than 22 m indicates an
anoxic state with DO 0.01 mg/L. When viewed according
to the temperature and DO profiles, both temperature and
oxygen reduction have the same tendency to start at a
depth of 20 m. This confirms that at the beginning at a
depth of 20 m, there is a hypolimnion layer. This has been
revealed by previous studies [24] in that DO was recorded
in Lake Maninjau at 5-12 mg/L which then decreased
dramatically at a depth of 25 m, indicating anoxic
conditions. Meanwhile, the previous study by Henny and
Nomosatryo [25] shows anoxic conditions fluctuating at a
depth of 10-20 m. There is a tendency for the hypolimnion
layer to increase and raise the epilimnion layer.
The DO profiles at the domestic, hydropower,
endemic fisheries and aquaculture cage locations can be
seen in Figure-3.b. The highest surface DO concentration
was at the domestic site at 9.9 mg/L. The DO decreases
sharply at 15 m in depth, i.e. 1.9 mg/L, and the decrease
continues to occur. The lake experienced anoxic
conditions at the bottom at a depth of 30 m with a DO of
0.8 mg/L. The contribution of organic compounds at the
domestic location is quite high at 42.48 mg BOD/L at the
0
20
40
60
80
100
120
140
28.5 29.0 29.5 30.0 30.5
De
pth
(m
)
Temperature (⁰C)
0
5
10
15
20
25
30
35
28.0 28.5 29.0 29.5 30.0 30.5 31.0 31.5 32.0
De
pth
(m
)
Temperature (⁰C)
Domestic Hydropower
Endemic Fisheries Aquaculture cage
VOL. 16, NO. 12, JUNE 2021 ISSN 1819-6608
ARPN Journal of Engineering and Applied Sciences ©2006-2021 Asian Research Publishing Network (ARPN). All rights reserved.
www.arpnjournals.com
1211
surface, reaching 63.31 mg BOD/L at the bottom. In the
aquaculture cage at 0-9 m depth, the DO decreases sharply
from 8.8 mg/L to 2.1 mg/L and then reduces to 1.7 mg/L
at the bottom at 19 m. This is in line with the BOD value
at the surface of this point which was 50.82 mg/L. The
increase continues to a depth of 19 m, where 71.11 mg/L
is the highest BOD at the bottom of the lake.
Meanwhile, the oxygen stratification in the
hydropower and endemic fisheries locations was at depths
of 2.5 m and 5 m respectively, although a decrease in DO
did not make the condition anoxic. The surface DO in the
hydropower ranged from 9.2 mg/L to 4.1 mg/L and in the
endemic fisheries site, it was from 9.8 mg/L to 2.9 mg/L at
the bottom of the lake. Likewise, the increase in the BOD
concentration from the surface to the bottom is 57.5-69.56
mg/L in hydropower and 60.44-55.64 mg/L in endemic
fisheries respectively, showing no significant changes. In
lake ecosystems, the biodegradable portion of the
dissolved organic carbon average of the biodegradable
DOC (BDOC) is about 14% of the total pool [26].
However, Sepp stated that the high concentration of
oxidisable organic matter in anthropogenic effluent is a
significant threat to the oxygen regime of surface waters.
The deeper the lake, the higher the oxygen utilisation rate.
The oxygen levels in the deepwater layers will continue to
decrease along with the utilisation of oxygen by organic
decomposing microorganisms and the oxidation of
reduced metabolites such as Fe2+, H2S, and NH4 [27]. In
shallow lakes, turbulent diffusion occurs due to wind
action, which leads to mixing conditions that can enhance
oxygen transport and increase the DO concentration.
Figure-3a. DO profile in the middle of the lake.
Figure-3b. DO profile in the domestic, hydropower,
endemic fisheries and aquaculture cage areas.
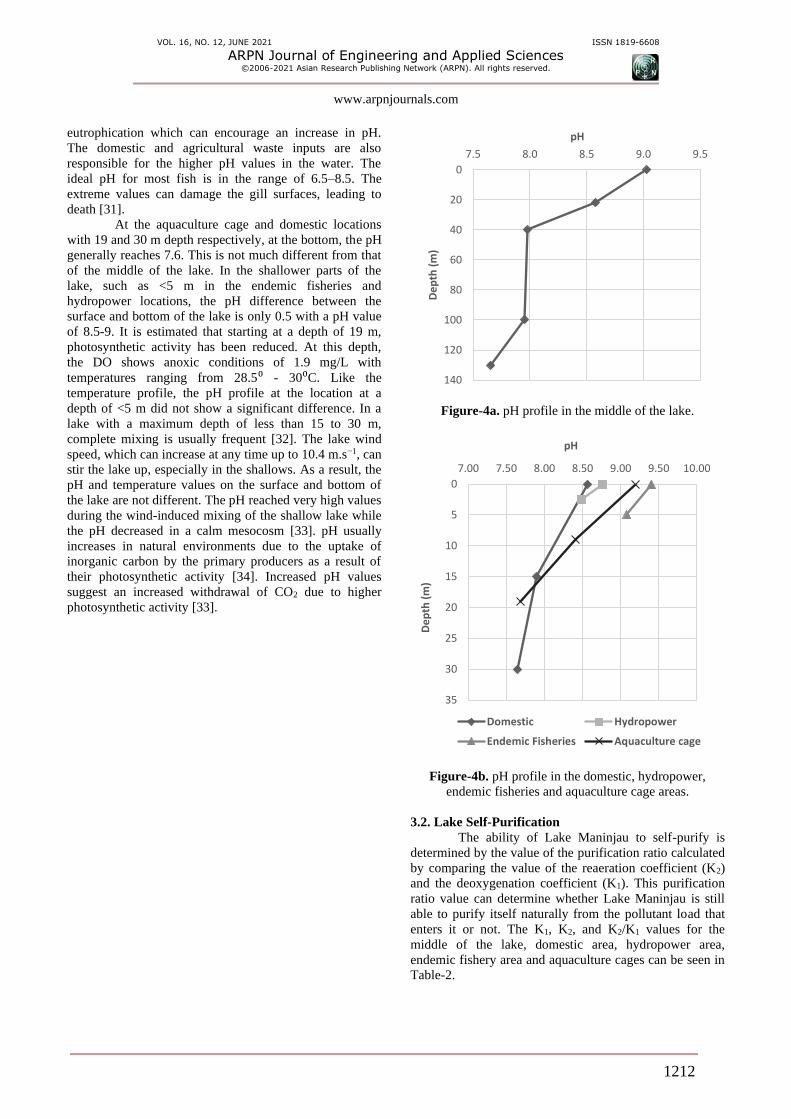
3.1.3. pH profile
The pH values at each sampling location at
various depths can be seen in Figures 4a and 4b. The pH
value of Lake Maninjau in all sampling locations is
alkaline, ranging from 7.64 to 9.40. The pH decreases with
an increase in depth. The pH profile is slightly different
from the temperature and DO patterns, especially in the
middle of the lake (Figure-4a). The pH decreases
gradually from 9.0 on the surface to 8.4 and 8.0 at a depth
of 20 m and 40 m. At above 40 m depths, the pH tends to
be constant at around 8 at 100 m in depth, before dropping
to 7.66 at the bottom of the lake. The pH difference
between the surface and the bottom of the lake is more
than 2. The high pH at the surface is not only influenced
by photosynthesis. It is also due to the higher temperature
at the surface compared to the bottom. The increased pH
in the water column is interpreted as a reflection of the
photosynthetically-increased pH in the lake water [28].
The elevated pHs are presumably the result of intense
photosynthesis [29], where the high phytoplankton
production causes a high pH in the lake water [28].
The pH profile at the domestic, hydropower,
endemic fisheries and aquaculture cage areas can be seen
in Figure 4b. The depth of these areas is between 2.5-30
m. At the domestic location, the stratification of weak pH
tends to follow the temperature profile where the changes
are not too sharp compared to the DO profile. The highest
pH values are on the surface of the aquaculture cage and
endemic fisheries locations, at 9.2 and 9.4. This might be
due to the increased photosynthetic activity and the
decomposition of allochthonous matter in the lake,
increasing the nutrient concentration at higher
temperatures [30]. The nitrogen components of nitrite and
ammonia are often found at the fish culture sites due to the
fish excreta. Nitrates that are formed through nitrite
oxidation under aerobic conditions are a trigger element of
0
20
40
60
80
100
120
140
0.0 2.0 4.0 6.0 8.0 10.0 12.0
De
pth
(m
)
DO (mg/L)
0
5
10
15
20
25
30
35
0.0 2.0 4.0 6.0 8.0 10.0 12.0
De
pth
(m
)
DO (mg/L)
Domestic Hydropower
Endemic Fisheries Aquaculture cage
VOL. 16, NO. 12, JUNE 2021 ISSN 1819-6608
ARPN Journal of Engineering and Applied Sciences ©2006-2021 Asian Research Publishing Network (ARPN). All rights reserved.
www.arpnjournals.com
1212
eutrophication which can encourage an increase in pH.
The domestic and agricultural waste inputs are also
responsible for the higher pH values in the water. The
ideal pH for most fish is in the range of 6.5–8.5. The
extreme values can damage the gill surfaces, leading to
death [31].
At the aquaculture cage and domestic locations
with 19 and 30 m depth respectively, at the bottom, the pH
generally reaches 7.6. This is not much different from that
of the middle of the lake. In the shallower parts of the
lake, such as <5 m in the endemic fisheries and
hydropower locations, the pH difference between the
surface and bottom of the lake is only 0.5 with a pH value
of 8.5-9. It is estimated that starting at a depth of 19 m,
photosynthetic activity has been reduced. At this depth,
the DO shows anoxic conditions of 1.9 mg/L with
temperatures ranging from 28.5⁰ - 30⁰C. Like the
temperature profile, the pH profile at the location at a
depth of <5 m did not show a significant difference. In a
lake with a maximum depth of less than 15 to 30 m,
complete mixing is usually frequent [32]. The lake wind
speed, which can increase at any time up to 10.4 m.s−1, can
stir the lake up, especially in the shallows. As a result, the
pH and temperature values on the surface and bottom of
the lake are not different. The pH reached very high values
during the wind-induced mixing of the shallow lake while
the pH decreased in a calm mesocosm [33]. pH usually
increases in natural environments due to the uptake of
inorganic carbon by the primary producers as a result of
their photosynthetic activity [34]. Increased pH values
suggest an increased withdrawal of CO2 due to higher
photosynthetic activity [33].
Figure-4a. pH profile in the middle of the lake.
Figure-4b. pH profile in the domestic, hydropower,
endemic fisheries and aquaculture cage areas.
3.2. Lake Self-Purification
The ability of Lake Maninjau to self-purify is
determined by the value of the purification ratio calculated
by comparing the value of the reaeration coefficient (K2)
and the deoxygenation coefficient (K1). This purification
ratio value can determine whether Lake Maninjau is still
able to purify itself naturally from the pollutant load that
enters it or not. The K1, K2, and K2/K1 values for the
middle of the lake, domestic area, hydropower area,
endemic fishery area and aquaculture cages can be seen in
Table-2.
0
20
40
60
80
100
120
140
7.5 8.0 8.5 9.0 9.5
De
pth
(m
)
pH
0
5
10
15
20
25
30
35
7.00 7.50 8.00 8.50 9.00 9.50 10.00
De
pth
(m
)
pH
Domestic Hydropower
Endemic Fisheries Aquaculture cage

VOL. 16, NO. 12, JUNE 2021 ISSN 1819-6608
ARPN Journal of Engineering and Applied Sciences ©2006-2021 Asian Research Publishing Network (ARPN). All rights reserved.
www.arpnjournals.com
1213
Table-2. Deoxygenation, reaeration coefficient, and self-purification ratios.
Location/depth Deoxygenation
Coefficient (K1)
Reaeration
Coefficient (K2)
Self Purification
Ratio (K2/K1)
Middle of the lake
0 0.54 - -
22 0.54 0.04 0.07
40 0.28 0.02 0.07
100 0.10 0.01 0.10
130 0.08 0.00 0.00
Domestic
0 0.99 - -
15 0.15 0.06 0.40
30 0.13 0.03 0.23
Hydropower
0 1.49 - -
2.5 0.07 0.57 8.14
Endemic fisheries
0 0.82 - -
5 0.04 0.21 5.25
Aquaculture cage
0 0.19 - -
9 0.08 0.10 1.25
19 0.14 0.04 0.28
3.2.1 Deoxygenation rate
The K1 value was calculated using the slope
method through the least square processing with equation
1. The K1 values from all of the sampling location points
ranged from 0.04 to 0.99/day. The K1 of each sampling
point decreases with the increase lake depth. The
epilimnion layer has a K1 value ranging from 0.19-
1.49/day. The oxygen concentration in the epilimnion at
all locations has exceeded the DO saturation, indicating
photosynthesis on the surface of the entirety of the lake
site. The highest K1 value is in hydropower, which is
1.49/day. At this location, it is estimated that there is a
water turbine that can mix the waters there, so the rate of
deoxygenation is faster. The K1 values that are also quite
high are in the domestic and endemic fisheries locations,
which are 0.99/day and 0.82/day respectively. At these
locations, the recorded temperature and DO were the
highest in all areas and these parameters also play a role in
the increasing deoxygenation. In the middle of the lake,
the K1 value has started to decrease compared to other
regions, which is 0.54/day. It shows that the level of
organic and nutrient pollution has spread to this area and
resulted in a high rate of deoxygenation. Meanwhile, in the
aquaculture cage area, the K1 value obtained was the
lowest at 0.19/day. Even though this location is a fish
culture area, compared to other sites the temperature in
this region is smaller so the deoxygenation rate is lower.
It proves that the deoxygenation rate is influenced by
temperature, turbulence, microbiological activity, and
nutrients [35].
In the hypolimnion layer, the K1 recorded was
around 0.04-0.54/day. The DO supply to the hypolimnion
is decreased due to the simultaneous consumption of
oxygen due to respiration and microbial degradation [36].
In these layers, large amounts of decomposing biomass
may lead to high oxygen depletion rates (ODRs),
potentially causing hypoxic or even anoxic conditions in
the hypolimnia [37]. Therefore the DO in the epilimnion
layer is higher than in the hypolimnion layer, which is
8.80-9.90 mg/L and 0.01-1.60 mg/L respectively,
indicating that the rate of oxygen utilisation for
decomposition is higher at depth. The K1 values ranging
from 0.3-0.6/day are included in the category of
wastewater requiring treatment [38]. From the K1 value
obtained, Lake Maninjau in all layers belongs to this
category. Compared to the deoxygenation rate during the
dry period of the previous study of 0.038-0.967/day [11],
the results obtained in this study are slightly higher.
Different environmental conditions in the sampling period
may contribute to the deoxygenation rate. The physical,
chemical and biological features of lakes have an
important role in the decomposition of organic matter.
The characteristics of the environmental
conditions, such as the photosynthetic rate, the permanent
stagnation of water below the chemocline, the oxygen
deficit, and the accumulation of sulphides in deep water
need to be considered [39]. The total sulphide
concentrations in Lake Maninjau have reached more than
400 μg/L and they have been higher in the water column
in recent years. This can be one of the causes of the oxic-
anoxic fluctuations in the lake [25]. Lake Maninjau waters
also have a relatively high level of organic pollutants
(BOD) but these are not accompanied by sufficient DO
concentrations. Consequently, the decomposition rate is
slower, as indicated by the low K1 value.
VOL. 16, NO. 12, JUNE 2021 ISSN 1819-6608
ARPN Journal of Engineering and Applied Sciences ©2006-2021 Asian Research Publishing Network (ARPN). All rights reserved.
www.arpnjournals.com
1214
3.2.2 Reaeration rate
In addition to the deoxygenation coefficient, the
ability of self-purification is also determined by the
reaeration coefficient. The reaeration coefficient is
calculated based on depth, water velocity, and wind speed
using equation 2 [40]. The average lake flow velocity
values obtained ranged from 0.1 to 0.3 m/s. The average
wind speed values obtained were between 0.77 - 1.33 m/s.
The magnitude of the ratio of flow velocity and air
velocity can affect the K2 value obtained. The K2 values
generally range between 0.00-0.57/day. The K2 for the
epilimnion layer ranged from 0.04 to 0.57/day while in the
hypolimnion layer, it ranged from 0.005 to 0.04/day. The
K2 value thus decreases with an increase in lake depth.
The reaeration rate is regulated by internal turbulence,
which in lakes is driven primarily by wind speed (Gelda &
Effler, 2002). Shallow water bodies tend to have higher
reaeration coefficients due to the ease of mixing in the
depth profile and more considerable surface turbulence
[35]. The importance of the depth of the lake on the K2
value can be seen more clearly in the middle part of the
lake, where the K2 at 22 m depth of 0.04/day is higher than
that of 130 m depth at 0.005/day, despite the similar flow
velocity (0.3 m/s) and wind speed (0.77 m/s).
The highest K2 value is found at the hydropower
site with a 2.5 m depth, i.e., 0.57/day, while the smallest
one is found in the middle of the lake with a 130 m depth,
i.e., 0.005/day. The reaeration rate of this study is lower
than that of previous studies at 0.161-0.691/day [11].
Besides depth, the K2 is also influenced by wind speed and
flow velocity. At the hydropower site, there is a higher
flow velocity of 0.15 m/s compared to the flow velocity
value in the middle of the lake, of 0.3 m/s. The
hydropower plant's wind speed is also higher than the
wind speed in the middle of the lake, which is 1.07 m/s at
the hydropower plant and 0.77 in the middle. The higher
flow rate and wind speed in the water increases the
absorption of oxygen from the atmosphere into the stream.
Lake Maninjau has a large surface. Lakes with a large
surface area have higher wind mixing due to the increased
surface momentum [20]. Lake size has been demonstrated
to influence the relative contribution of wind and
convective mixing to gas transfer, and both contribute to
turbulence in the upper water column [41]. Although the
solubility of oxygen decreases as the temperature
increases, the reaeration rate has been shown to increase
with temperature [42]. When the temperature in the lake
rises, the oxygen rebalances with the atmosphere. The
oxygen demand in tropical lakes continues because of the
high water temperatures even during the mixing period,
and this compensates for the surface oxygen
concentrations [36].
Even though most of the K2 values obtained at
each sampling location compared to the K2 value of the
Minister of Environment Regulation are very small, the K2
values obtained at the hydropower site are proportional to
the K2 for large rivers with an average speed of 0.46-
0.69/day. In comparison, the K2 value at the endemic
locations and cages is equivalent to a small pond (0.10-
0.23/day). Nevertheless, the K2 value shows that the rate
of the increase in oxygen into the lake waters is low
because, according to Government Regulations, the K2
value for large lake waters is around 0.23-0.35/day. The
small K2 value indicates that the lake water's oxygen
uptake rate from the atmosphere is relatively slow. The
time required to recover with a lower reaeration rates is
longer than a lake with a larger reaeration rate [42].
3.2.3 Self-purification ratio
The K1 and K2 values obtained in this study vary
according to depth and differ at each sampling location, so
the purification ratio also varies. Lake Maninjau’s
purification ratio values range between 0.06 - 8.14. The
ratio of purification of lakes in the epilimnion layer is
0.07-8.14 while in the hypolimnion layer that starts at a
depth of 22 m, it is 0.00-0.28. This shows that the closer
the sample is to the surface, the higher the value of the
lake's purification ratio and vice versa, as the further the
sample is away from the surface, the smaller the value. In
the middle of the lake at the bottom at 130 m, the
purification ratio is almost zero. On the surface of the lake,
the high intensity of the incoming solar radiation and the
ambient temperature causes an increase in the DO
saturation concentration. The result is an increase in DO
concentration in the epilimnion section. When organic
matter settles to the bottom of the lake, DO is consumed,
and hypolimnion which becomes anoxic. The high amount
of reduced substances stored in the hypolimnion must be
oxidised before the oxygen can be replenished[36].
Therefore, as the lake increases in depth, the rate of
incoming oxygen will decrease and the oxygen needed by
the microorganisms to decompose the organic compounds
increases, thus the value of the lake's purification ratio
decreases.
Among the sampling locations, the highest value
for the purification ratio was found in the hydropower
location, i.e., 8.14 followed by the endemic fisheries site,
i.e., 5.25. The relatively low depth and small organic
content at this location resulted in a low K1. The high
oxygen uptake rate can compensate for the oxygen deficits
characterised by high K2 values, so this location has a high
purification ratio. The lowest lake purification ratio value
is found in the middle of the lake at a depth of 130 m,
which is equal to 0.00 because there is no more oxygen at
the bottom. Meanwhile, in the domestic and aquaculture
cage areas which have depths below 30 m, a purification
ratio of 0.23 and 0.28 was obtained. The self-purification
in the middle of the lake and the domestic location is
relatively smaller when compared to the other sites. The
areas with higher depths and lower wind speed have lower
self-purification abilities, whereas those with lower depths
and higher wind speed have a higher capacity.
This indicates the effect of mixing at a lower lake
depth according to the value of the purification ratio. The
purification ratio of Maninjau lake obtained in this study at
a depth of 22 m ranged from 0.07-1.25, which is much
lower than that of previous studies of 1,107-7,230
conducted in the epilimnion layer at a depth of 10 m [11].
This value indicates a decrease in the self-purification
ability of Lake Maninjau where in this study overall, Lake

VOL. 16, NO. 12, JUNE 2021 ISSN 1819-6608
ARPN Journal of Engineering and Applied Sciences ©2006-2021 Asian Research Publishing Network (ARPN). All rights reserved.
www.arpnjournals.com
1215
Maninjau can perform a natural self-purification process in
the epilimnion layer at a depth of 0-9 m. In contrast, for
the depths deeper than 9 m, the lake cannot fulfil the
natural self-purification process. This indicates that most
of the lake waters have a significantly decreased natural
self-purification capacity. This is following the last trophic
status of Lake Maninjau, which classified it as a
hypereutrophic lake [4]. Changes in the physicochemical
parameters of ecosystems have a substantial impact on the
species that live within them [22]. Very eutrophic lakes
(Lake of Zurich until 1970) have a completely anaerobic
part near the bottom [43]. Eutrophication due to an
excessive P input is interpreted as stimulating
phytoplankton growth in the surface layer and the
subsequent O2 depletion in deep waters, resulting in
anoxic conditions [44]. Deteriorating water quality is a
disturbance that is expected to be less effective at
maintaining high diversity because the former allows for
competitive exceptions and the latter directly eliminates
many species [45].
Wind speed and depth play a significant role in
determining self-purification capacity but with the
presence of organic pollutants and nutrients, the function
is reduced. Lake Maninjau is classified as heavily polluted
where the incoming pollutant load, especially
biodegradable organic compounds, has exceeded the lake's
assimilation ability. The self-purification of the lake is still
mainly in the epilimnion layer at a depth of 0-9 m while in
the deeper layers, its ability begins to diminish. For further
self-lake purification calculations, it is necessary to
consider all aspects involved in deoxygenation and
reaeration including photosynthesis-respiration,
atmospheric reaeration, biochemical oxygen consumption,
and microbial oxygen transport in sediment.
4. CONCLUSIONS
The water quality of Lake Maninjau based on the
BOD parameters does not meet the PP 82 the Year 2001
quality standard 2. Based on the pH, DO, and temperature
profiles in the middle of the lake, the epilimnion layer was
found at 0-22 m depth and the hypolimnion layer started at
a depth of 22 m. Locations with depths greater than 30 m
have temperature, DO, and pH stratifications, while at
shallow depths, this is unclear. The purification ratio of
Lake Maninjau in the epilimnion layer is about 0.07-8.14
while in the hypolimnion layer, it is 0.00-0.28. Wind speed
and depth play a significant role in determining the ability
of the lake to self-purify, but with the presence of organic
pollutants and nutrients, the capacity is reduced. Lake
Maninjau is classified as heavily polluted as the incoming
pollutant load, especially biodegradable organic
compounds, has exceeded the lake's assimilation ability.
Most of the lake waters have a significantly decreased
natural self-purification capacity.
ACKNOWLEDGMENT
This work was supported by the Directorate
General of Research and Development Strengthening of
the Ministry of Research and Higher Education of the
Republic of Indonesia through the scheme of Excellent
Basic Research of Higher Education (PDUPT)
No.051/SP2H/LT/DRPM/2019, fiscal year 2019. Thanks
also go to the Faculty of Engineering Universitas Andalas
for their financial support of this publication (Grant
number 021/UN.16.09.D/PL/2020).
REFERENCES
[1] Fakhrudin M, Wibowo H, Subehi L, et al. 2002.
Karakterisasi Hidrologi Danau Maninjau Sumbar. In:
Prosiding Seminar Nasional Limnologi: Menuju
Kesinambungan Pemanfaatan Sumberdaya Perairan.
Bogor: Puslit Limnologi LIPI. pp. 65-75.
[2] Lukman, Setyobudiandi I, Muchsin I, et al. 2015.
Impact of Cage Aquaculture on Water Quality
Condition in Lake Maninjau, West Sumatera
Indonesia. Int J Sci Basic Appl Res. 23: 120-137.
[3] Pemerintah Kabupaten Agam. 2015. Buku Data Status
Lingkungan Hidup Daerah Kabupaten Agam. Lubuk
Basung.
[4] Syandri H. Kondisi Kualitas Air Pada Daerah
Pemeliharaan Ikan Keramba Jaring Apung di Danau
Maninjau. 2016. In: Prosiding Seminar Nasional
Tahunan Ke-V Hasil-Hasil Penelitian Perikanan dan
Kelautan B3. pp. 301-310.
[5] Ostroumov SA. 2004. On the Biotic Self-purification
of Aquatic Ecosystems: Elements of the Theory. Dokl
Biol Sci. 396: 136-141.
[6] Ostroumov SA. 2005. On the multifunctional role of
the biota in the self-purification of aquatic
ecosystems. Russ J Ecol. 36: 414-420.
[7] Semenov MY, Semenov YM, Silaev A V., et al. 2019.
Assessing the Self-Purification Capacity of Surface
Waters in Lake Baikal Watershed. Water. 11: 1505.
[8] Elçi Ş̧. 2008. Effects of thermal stratification and
mixing on reservoir water quality. Limnology. 9: 135-
142.
[9] Boehrer B, Schultze M. 2008. Stratification of lakes.
Rev Geophys. 46: 1-27.
[10] Fair GM, Geyer JC, Okun DA. 1965. Elements of
Water Supply and Wastewater Disposal. New York:
John Wiley and Sons, Inc.
[11] Komala PS, Afrianita R, Prima R. 2019.
Determination of purification ratio of Lake Maninjau

VOL. 16, NO. 12, JUNE 2021 ISSN 1819-6608
ARPN Journal of Engineering and Applied Sciences ©2006-2021 Asian Research Publishing Network (ARPN). All rights reserved.
www.arpnjournals.com
1216
in epilimnion zone. In: MATEC Web of Conferences.
p. 06008.
[12] Badan Standardisasi Nasional. SNI 6989.57:2008
Mengenai Air dan Air Limbah-Bagian 57:Metode
Pengambilan Contoh Air Permukaan. Epub ahead of
print 2008. DOI: SNI 6989.59:2008.
[13] APHA. 2005. Standard methods for the examination
of water and wastewater. 21st ed. Washington, D. C.:
APHA-AWWA-WEF.
[14] Peraturan Pemerintah Republik Indonesia Nomor 82.
Tentang Pengelolaan Kualitas Air dan Pengendalian
Pencemaran Air. 2001.
[15] Lee CC, Lin SD. 2007. Handbook of Environmental
Engineering Calculations. 2 nd Editi. McGraw-Hill
Companies, Inc.
[16] Chapra S. 1997. Surface Water-Quality Modeling.
McGraw-Hill Science/Engineering/Math.
[17] Chapman LJ, Chapman C a., Crisman TL, et al. 1998.
Dissolved oxygen and thermal regimes of a Ugandan
crater lake. Hydrobiologia. 385: 201-211.
[18] Kling GW. 1988. Comparative transparency, depth of
mixing, and stability of stratification in lakes of
Cameroon, West Africa. Limnol Oceanogr. 33: 27-40.
[19] Wood RB, Prosser M V., Baxter RM. 1976. The
seasonal pattern of thermal characteristics of four of
the Bishoftu crater lakes, Ethiopia. Freshw Biol. 6:
519-530.
[20] Magee MR, Wu CH. 2016. Response of water
temperatures and stratification to changing climate in
three lakes with different morphometry. Hydrol Earth
Syst Sci Discuss. 1-40.
[21] Fukushima T, Matsushita B, Subehi L, et al. 2018.
Will hypolimnetic waters become anoxic in all deep
tropical lakes? (Scientific Reports (2017) DOI:
10.1038/srep45320). Sci Rep. 8: 1-9.
[22] Sharma RC, Singh N, Chauhan A. 2016. The
influence of physico-chemical parameters on
phytoplankton distribution in a head water stream of
Garhwal Himalayas: A case study. Egypt J Aquat Res.
42: 11-21.
[23] Molot LA, Dillon PJ, Clark BJ, et al. 1992. Predicting
end-of-summer oxygen profiles in stratified lakes.
Can J Fish Aquat Sci. 49: 2363-2372.
[24] Lukman, Sutrisno, Hamdani A. 2013. Pengamatan
Pola Stratifikasi di Danau Maninjau Sebagai Potensi
Tubo Belerang. Limnotek. 20: 129-140.
[25] Henny C, Nomosatryo S. 2016. Changes in water
quality and trophic status associated with cage
aquaculture in Lake Maninjau, Indonesia. In:
Workshop and International Seminar on Science of
Complex Natural Systems 9-10 October 2015, Bogor,
Indonesia.
[26] Sepp M, Kõiv T, Nõges P, et al. 2018. Do organic
matter metrics included in lake surveillance
monitoring in Europe provide a broad picture of
brownification and enrichment with oxygen
consuming substances? Sci Total Environ. 610-611:
1288-1297.
[27] Higashino M, O’Connor BL, Hondzo M, et al. 2008.
Oxygen transfer from flowing water to microbes in an
organic sediment bed. Hydrobiologia. 614: 219-231.
[28] Søndergaard M. 1988. Seasonal variations in the
loosely sorbed phosphorus fraction of the sediment of
a shallow and hypereutrophic lake. Environ Geol
Water Sci. 11: 115-121.
[29] French TD, Petticrew EL. 2007. Chlorophyll a
seasonality in four shallow eutrophic lakes (northern
British Columbia, Canada) and the critical roles of
internal phosphorus loading and temperature.
Hydrobiologia. 575: 285-299.
[30] Devi PA, Padmavathy P, Aanand S, et al. 2017.
Review on water quality parameters in freshwater
cage fish culture. Int J Appl Res. 3: 114-120.
[31] Beveridge MCM. Cage Aquaculture. 2004. Third
Edit. Oxford, UK: Blackwell Publishing Ltd, 2004.
Epub ahead of print 2004. DOI:
10.2134/jeq2005.0025br.
[32] Baxter RM, Presser M V., J. F. Tailing A, et al. 1965.
Stratification in tropical African Lakes at moderate
altitudes (1,500 TO 2,000 m). Limnol Oceanogr. 10:
510-520.
[33] Blottiere L. The effects of wind-induced mixing on
the structure and functioning of shallow freshwater
lakes in a context of global change. Université Paris-
Saclay, 2016.

VOL. 16, NO. 12, JUNE 2021 ISSN 1819-6608
ARPN Journal of Engineering and Applied Sciences ©2006-2021 Asian Research Publishing Network (ARPN). All rights reserved.
www.arpnjournals.com
1217
[34] Kosten S, Huszar VLM, Bécares E, et al. 2012.
Warmer climates boost cyanobacterial dominance in
shallow lakes. Glob Chang Biol. 18: 118-126.
[35] de Menezes JPC, Bittencourt RP, De Sá Farias M, et
al. 2015. Deoxygenation rate, reaeration and potential
for sself-purification of a small tropical urban stream.
Rev Ambient Água. 10: 748-757.
[36] Calamita E, Schmid M, Kunz M, et al. 2019. Sixty
years since the creation of Lake Kariba : Thermal and
oxygen dynamics in the riverine and lacustrine sub-
basins. PLoS One. 14: 1-21.
[37] Rhodes J, Hetzenauer H, Frassl MA, et al. 2017.
Long-term development of hypolimnetic oxygen
depletion rates in the large Lake Constance. Ambio.
46: 554-565.
[38] Kementerian Negara Lingkungan Hidup. 2003.
Keputusan Menteri Lingkungan Hidup Nomor 110
Tahun 2003 tentang Pedoman Penetapan Daya
Tampung Beban Pencemaran Air pada Sumber Air.
[39] Matsuyama M, Saijo Y. 1971. Studies on biological
metabolism in a meromictic Lake Suigetsu. J
Oceanogr Soc Japan. 27: 197-206.
[40] Thomann RV, Fitzpatrick JF. 1982. Calibration and
verification of mathematical models of the
eutrophication of estuaries potomac. Mahwah:
Hydroqual Inc.
[41] Lewis WM, Wurtsbaugh WA, Paerl HW. 2011.
Rationale for control of anthropogenic nitrogen and
phosphorus to reduce eutrophication of inland waters.
Environ Sci Technol. 45: 10300-10305.
[42] Ice GG., Brown GW. 1978. Reaeration in a turbulent
stream system. Oregon,
http://ir.library.oregonstate.edu/xmlui/handle/1957/99
22.
[43] Golterman HL. 1975. Physiological Limnology: An
Approach to the Physiology of Lake Ecosystems.
Volume 2. Elsevier B.V.
[44] Müller B, Steinsberger T, Schwefel R, et al. 2019.
Oxygen consumption in seasonally stratified lakes
decreases only below a marginal phosphorus
threshold. Sci Rep. 9: 1-7.
[45] Yu Z, Yang J, Amalfitano S, et al. 2014. Effects of
water stratification and mixing on microbial
community structure in a subtropical deep reservoir.
Sci Rep. 4: 1-7.