Climate effects and benthic-pelagic coupling in the North Sea.

MARINE ECOLOGY PROGRESS SERIESMar Ecol Prog Ser
Vol. 289: 89–107, 2005 Published March 30
INTRODUCTION
Natural disturbance of benthic communities can po-tentially mask the effects of contamination by offshoreoil-related activities. Therefore, to identify disturbanceof macroinfauna assemblages from offshore oil activi-ties, suitable spatial and temporal designs that considernatural infaunal variability need to be employed (Clark
1982, Spies 1987). Background information, adequatecontrols and long-term monitoring, plus a combinationof samples taken on a regional basis and along radialgradients around oil drilling sites or productionplatforms, are required to ensure sampling designs areadequate for studying oil-related effects on marinebenthic assemblages (Carney 1987, Ellis & Schneider1997). Various sampling approaches have proved
© Inter-Research 2005 · www.int-res.com*Email: [email protected]
Assessing the impact of oil-related activities onbenthic macroinfauna assemblages of theCampeche shelf, southern Gulf of Mexico
Hector A. Hernández Arana*,1, 4, Richard M. Warwick1, 2, Martin J. Attrill1, Ashley A. Rowden1, 5, Gerardo Gold-Bouchot3
1Marine Biology and Ecology Research Group, School of Biological Sciences, University of Plymouth, Drake Circus, Plymouth PL4 8AA, UK
2Plymouth Marine Laboratory, Prospect Place, Plymouth PL1 3DH, UK3Centro de Investigación y de Estudios Avanzados del Instituto Politécnico Nacional (CINVESTAV-IPN),
Antigua Carr. a Progreso km 2.5, 97310 Mérida, Yucatán, Mexico4Present address: El Colegio de la Frontera Sur, Avenida Centenario km 5.5, Apartado Postal 424, Chetumal 77000,
Quintana Roo, Mexico5Present address: National Institute of Water and Atmospheric Research, PO Box 14-901, Wellington, New Zealand
ABSTRACT: Considering the long history of oil extraction and the numerous platforms that exist inthe southern Gulf of Mexico, a regional approach has been used to investigate the impact of oil-related activities on the macrobenthic community. The objective was to determine the effect of oil-related activity in a region known to have a highly variable benthic community composition due totemporal and spatial variability of its natural environment. A transect design along gradients of nat-ural variables and disturbance intensities, including active oil platforms, was implemented during therainy and winter storms (‘northers’) seasons of 1999 to 2000. Univariate and multivariate statisticalanalyses were applied to a data set of 2 macroinfauna size fractions retained on 0.5 and 2 mm sieves,in conjunction with levels of metals, oil hydrocarbons and a range of natural sediment variables. Apattern of contamination existed, with increased levels of contaminants at stations close to rigs and inareas of high oil platform densities. At these sites, macroinfauna abundance and biomass werereduced. Regression analyses and matching of Biotic to Environmental multivariate patterns(BIO–ENV) indicated that a combination of metals and natural sediment variables best explained thevariability in macroinfauna data for all sites. Meta-analysis at phylum level was employed to specifi-cally assess disturbance. The results of this technique were inconsistent between sampling dates dueto a complex influence of natural and anthropogenic disturbance. However, increased variability incommunity composition was linked to oil-related disturbance.
KEY WORDS: Oil disturbance · Infauna · Carbonate-terrigenous sediments · Multivariate statistics ·Gulf of Mexico
Resale or republication not permitted without written consent of the publisher

Mar Ecol Prog Ser 289: 89–107, 2005
successful in the North Sea for detecting and monitor-ing the effects of offshore oil activities (Dicks 1976,Hartley 1984, Daan & Mulder 1996). The main findingof these early oil-impact studies was that oil-relateddisturbance of benthic macrofauna assemblages waslocalised around the site of the oil platform; there was asevere reduction in fauna close to platforms (up to200 m away from the platform), a peak in opportunistspecies 500 to 1000 m away and subtle effects de-tectable up to 2 km from the centre of the disturbanceactivity (Addy et al. 1984, Davies et al. 1984, Kingston1992). Subsequent to these studies, effects of oil onmacrofauna assemblages have been detected up to6 km from platforms, suggesting that the local approachto studying oil-related disturbances was no longersuitable (Gray et al. 1990, Olsgard & Gray 1995).
In contrast, studies of the northern Gulf of Mexicosuggest that even the long-term effects of oil-relatedactivities on the benthos are highly localised aroundthe point source, where effects are only detectable upto 200 m from source (Middleditch 1981a, Montagna &Harper 1996) and up to 800 m from produced waterdischarge points (Rabalais et al. 1992). However, majordifferences exist between the sampling carried out inthe North Sea and the Gulf of Mexico; studies of oil-related impacts in the latter region often lack back-ground information and suitable controls (Green &Montagna 1996). In addition, the impact of oil on thebenthos in the Gulf of Mexico is potentially morechronic, as low levels of oil hydrocarbons are dispersedfrom natural oil seeps and non-natural sources of oilaugmented by a longer history of oil exploitation (Spies1987). Natural disturbances from river runoff, associ-ated anoxia-hypoxia and differences in other majornatural variables (e.g. depth and grain size) have alsopossibly hindered the identification of the generalisedeffects of oil-related activities on macrofauna assem-blages in the northern Gulf of Mexico (Green & Mon-tagna 1996). In the southern Gulf of Mexico, no previ-ous attempt has been made to evaluate oil-relatedinfluences on benthic infaunal assemblages (Vazquezet al. 2000), with the only available data coming from asingle survey of a natural seep (Gonzalez-Macias 1989)and assessments of the effect of oil on shrimp popula-tions (Soto & Gracia 1987).
The southern Gulf of Mexico has combined influ-ences from river runoff, winter storms (‘northers’) anda gradational sedimentary environment of terrigenousand carbonate sediments (Bello & Cano 1991, Fuentes-Yaco et al. 2001). Ecological research has emphasisedthat ‘northers’ and river runoff are the most importantphysical processes influencing large-scale benthiccommunity structure, function and interactions acrossand along the carbonate and terrigenous shelves(Yañez-Arancibia & Sanchez-Gil 1983, Soto & Escobar-
Briones 1995, Hernandez-Arana et al. 2003). In addi-tion, the presence of an extensive area of offshore oilproduction potentially contributes to changes in thestructure of benthic communities (Vazquez et al. 2000).Further work is still required, however, in relation tosmaller scales of spatial variation (10s to <100 km) andtemporal changes in community structure and compo-sition. This research needs to be focused along gradi-ents produced by the river influence on the shelf and,particularly, its interaction with offshore oil activities inorder to gather relevant information to differentiatebetween natural and anthropogenic disturbance.
The approach adopted for the present study is aregional one that involves sampling transects (on2 occasions) along gradients of the main natural vari-ables, encompassing sites both distant from, and closeto, oil platforms. Thus, the study design attempts toaccommodate spatial and temporal influences onassemblage composition due to natural disturbancefrom river discharges and storm events, and allows forthe fact that oil-related effects might extend beyondthe immediate area of a platform’s influence. The sam-pling design also allows a concomitant consideration ofthe influence of oil platform density on the seabedassemblages. The hypotheses to be addressed were:(1) macroinfauna assemblages located in areas of highoil platform density will exhibit a different composi-tion, and lower abundance and biomass than those inareas of low oil platform density or without oil-relatedactivities; (2) macroinfauna assemblages located rela-tively near to an oil platform will exhibit a differentassemblage composition, and lower abundance andbiomass than those located relatively distant from oilplatforms, similar to other oil-influenced continentalshelves. Univariate and multivariate statistical tech-niques were employed to test these hypotheses. Tem-poral differences were expected as a result of naturaldisturbance from river runoff and storm events; how-ever, it was expected that their influence would remainconstant and independent of the impact derived fromthe oil-related activities.
In addition to formal hypothesis testing, the meta-analysis pollution impact assessment technique pro-posed by Warwick & Clark (1993a) was utilised, and itsvalidity for tropical environments evaluated. This tech-nique was used to compensate for the lack of back-ground information, long-term monitoring and validspatial controls.
MATERIALS AND METHODS
Study site. The study location covers the areabetween 19° 00’ and 19° 40’ N and 91° 40’ and 92° 30’ W,within the relatively homogenous, muddy, ‘transi-
90

Hernández Arana et al.: Oil-related impact in the Campeche shelf
tional’ environment that occurs between the carbonateand terrigenous environments of the Campeche Bankand Bay (Fig. 1). The characteristics of these sedimentprovinces have been previously described (Gutierrez-Estrada & Galaviz-Solis 1991, Hernandez Arana 2003).Discharges from the Grijalva-Usumacinta and SanPedro-San Pablo rivers, ‘northers’ and associatedintrusion of oceanic water from the Caribbean currentare the driving physical processes on the shelf (Mon-real-Gomez et al. 1992, Vidal et al. 1994). The watercirculation pattern is driven by the Caribbean currentduring the spring and summer, with a south to south-west direction, but during autumn and winter, the flowreverts to an east to north-east direction (Boicourt et al.1998). Water column stability changes from stratified tohomogenous between the ‘rainy’ and the ‘northers’seasons, markedly affecting the inner shelf (<30 mdepth) (Czitrom et al. 1986). The study area includesthe largest offshore oil production region of Mexico,covering an area of 8000 km2 that includes natural oilseeps and approximately 200 platforms with a range offunctions (Valdes & Ortega Ramirez 2000). Oil activi-ties in the Campeche Bay have developed since 1974with the discovery of several oil fields (Santiago & Baro1992). The world’s largest offshore oil-related contam-ination event occurred in the Campeche Bay with theIxtoc I production-well blowout in 1979 (Boehm et al.1982, Botello et al. 1982). Subsequently, some rela-tively minor oil-spills have occurred in other oil fields
in the area during 1986, 1987 and 1988 (Lizarraga-Partida et al. 1991).
Study design. The sampling design consisted of 2across-shelf (A, B) and 2 along-shelf (C, D) transects,following natural variations of depth, river runoff influ-ence and depositional environment (Fig. 1). The origi-nal design for the across-shelf transects was to follow adepth gradient of 12 to 135 m. Based on previous large-scale studies, along-shelf transects were set to follow asediment gradient from clay/clay silt to fine sand andcarbonate content from 20 to 50%, whilst depth waskept relatively constant (30 to 50 m). Twelve stations,approximately 7 to 8 km apart, were allocated to eachtransect to represent the regional variation in macro-infauna assemblages and sediment types. Each pair oftransects transversed the oil production zone, allowinga more intense sampling in the area of high oil platformdensities. Information on the precise positions of oilplatforms on the Campeche Shelf (Nautical chart SM840, Secretaría de Marina 1994) and the spatial distrib-ution of stations on the 2 transects allowed 2 differentapproaches for assessing oil-related influences. Firstly,stations along both transects could be partitioned ac-cording to the density of oil platforms within a putativedistance of influence from the station and, secondly,their actual distance from oil platforms could beutilised. Due to the patchy distribution of platforms, oil-related influences on the benthic assemblages might bea combination of proximity to an oil platform and the
91
Fig. 1. Study area showing the location of stations along the 4 transects A to D in the southern Gulf of Mexico. The delimited polygon comprises the area of oil-related activities where fishing and commercial navigation is forbidden

Mar Ecol Prog Ser 289: 89–107, 2005
density of oil platforms within a putative radius ofinfluence. Therefore, the influences of proximity anddensity of oil platforms need to be examined separately.
Sampling methodology. Sampling was carried outfrom 11 to 13 November 1999 after the ‘rainy’ seasonand from 14 to 16 April 2000 after the ‘northers’season/beginning of the dry season. Stations werelocated and positioned using the satellite navigationsystem of the RV ‘Justo Sierra’ and sampled (withoutreplication) using a box corer. Sample size was 0.14and 0.23 m2 for November and April respectively, dueto different box corers being available on each cruise.Additional information recorded included the waterdepth and bottom salinity from each station. Therecovered core was sub-sampled for organic matter,carbonate content and grain size analysis. Such sam-ples were taken using a PVC core of 10 cm in diameterto a depth of 5 cm, transferred to a previously labelledplastic bag and frozen until analysis. Sub-samples foroil hydrocarbons and trace metals were taken using aTeflonTM core of 15 cm in diameter to a depth of 5 cm,which was then transferred to a high-density polyeth-ylene plastic jar, labelled and frozen until analysis.Two size fractions of macroinfauna were sampled fromeach station, with the purpose of obtaining a betterrepresentation of the large infauna, but also to takeinto account the contribution of the smaller infaunathat potentially survive better under stressful condi-tions (Warwick & Clarke 1994). Small macroinfaunawas sampled using a sub-core of 0.01 m2 × 20 cm depthand sieved through a 0.5 mm mesh. Large macroin-fauna was recovered from the remaining sedimentafter removing all the above samples, and sievedthrough a 2.0 mm mesh. Samples were fixed in 5%formaldehyde solution buffered in seawater andstained with Rose Bengal prior to initial storage. Due totechnical difficulties a number of stations were notsampled (A2 and B1 in November 1999 and A4, A10,B3, C5, C7, D4 and D6 in April 2000, i.e. 2 and 7 sta-tions out of 48).
Laboratory analyses. Macroinfauna samples weretransferred to a 70% ethanol solution. Organisms weresorted, counted, wet weighed and identified to familylevel. Identification of the fauna to family level hasproved to be sufficient for environmental studies in thesouthern Gulf of Mexico (Hernandez Arana et al. 2003)and other areas (Ferraro & Cole 1992, Somerfield &Clarke 1995). Organic matter content of sediment wasmeasured using the ignition technique (Dean 1974).Carbonate content was analysed by acid digestion andtitration (Holme & McIntyre 1984). Grain size distri-butions were measured with a Malvern Mastersizer Xlaser particle sizer (Wolfe & Michibayashi 1995) anddescriptive statistics (mean grain size, sorting or inclu-sive standard deviation) calculated in phi units using
the moment measure approach. Additional sedimentdata included the specific surface area of the sedimentsexpressed as m2 g–1 and calculated as spherical theoret-ical proxies assuming a density of 2.65 g cm–3 for thesediment, and the percentage of sand, silt and clay.
Concentrations of iron, manganese, zinc, copper,nickel, chromium and barium were quantified byinduction coupling to plasma emission spectroscopy.Samples were oven-dried at 50°C and then digestedwith 5% hydrochloric acid to extract the fraction ofmetals contained in the organic matter and solublesediments (APHA 1985). Iron was used to normalisemetal concentration following Macias-Zamora et al.(1999). Hydrocarbon analyses were undertaken usingsoxhlet reflux extraction for 12 h into dichloromethane,followed by clean up and fractionation through silica/alumina gel column chromatography (Sericano et al.1990, UNEP/IOC/IAEA 1992). The individual aliphatic(n-C10 to n-C34, pristane and phytane) and polycyclicaromatic hydrocarbons (PAH, 22 compounds) wereidentified and quantified by high-resolution gas chro-matography (GC) using a Hewlett Packard HP5890Series II with a flame ionisation detector. The measureof total hydrocarbons (TH) includes all resolved peaksof aliphatic and PAH hydrocarbons, and the area cov-ered by the unresolved complex mixture (UCM). Con-centrations of UCM and the fossil fuel pollution indexwere used to establish the origin of oil hydrocarbons(Boehm & Farrington 1984, Volkman et al. 1992). Toassure quality control, appropriate blanks and refer-ence materials were analysed simultaneously witheach batch of samples.
Data analyses. The individual matrices for small andlarge macroinfauna were standardised to 1 m2 andcombined (allowing a representation of the overall sizespectrum of the macroinfauna) into single matrices ofabundance and biomass per sampling occasion(2 times). All the statistical analyses were undertakenusing the combined data of small and large macroin-fauna, because the separated analysis of the 2 fractionsshowed similar results (Hernandez Arana 2003) andalso to incorporate the information provided by thelarger macroinfauna in terms of its contribution to thebiomass. Graphs of concentrations of total oil hydrocar-bons (of which more than 90% was an unresolvedcomplex mixture) and metals along transects for eachseason were constructed in order to identify spatialpatterns of possible contaminant distribution. Pear-son’s product-moment correlation coefficients werecalculated for metals, oil hydrocarbons, depth, meangrain size and distance to oil platforms, to establishrelationships with natural variables and sources ofputative contaminants. The set of 23 environmentalvariables (natural and oil-related) from each seasonwere subjected to principal component analysis (PCA)
92
Hernández Arana et al.: Oil-related impact in the Campeche shelf
on a normalised correlation matrix after suitable trans-formation (log10 for continuous measurements or arc-sin transformation for variables expressed as a per-centage).
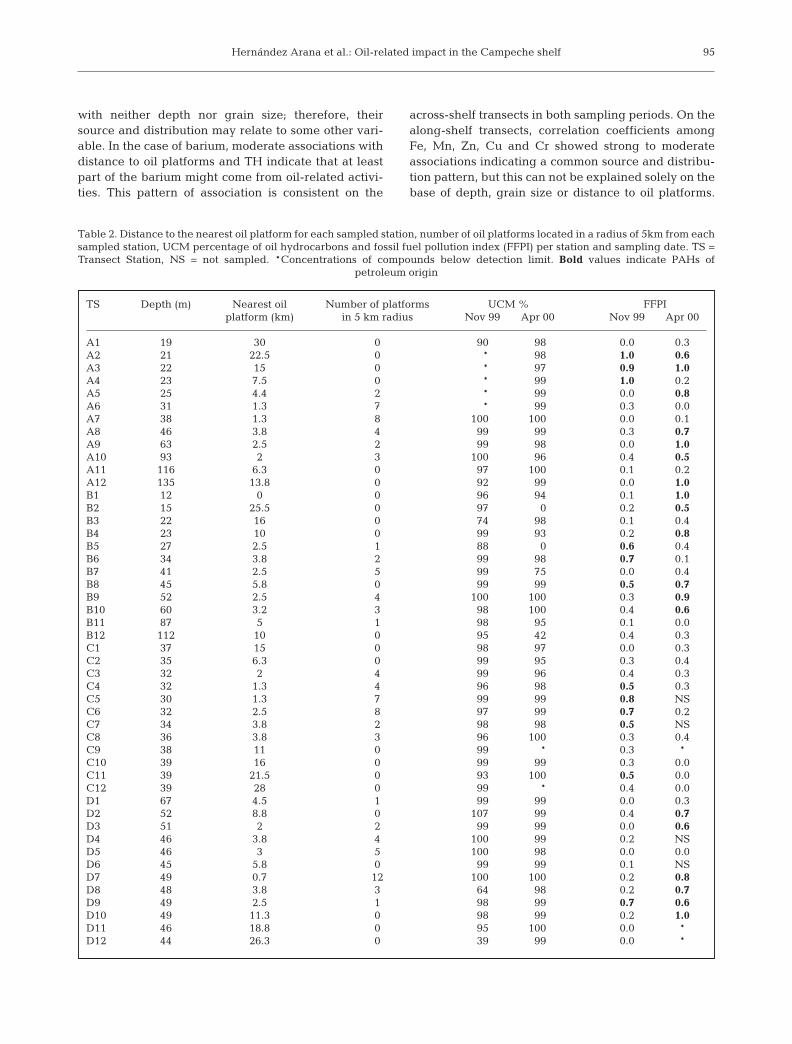
Hypothesis 1. Influence of oil platform density : Totest the hypothesis that stations located in areas of rel-atively high oil rig density present lower values ofmacroinfauna abundance and biomass, stations weregrouped in relation to the number of oil platformswithin a radius of 5 km: high density (4 to 12), low den-sity (1 to 3) and no oil platforms (see Table 2). The dis-tance of 5 km was chosen as this is the approximatedistance up to which oil-related influences have previ-ously been detected around oil platforms (Olsgard &Gray 1995) and also to maximise the number of sam-ples within each group. A 2-factor ANOVA balanceddesign was applied to test for differences in mean val-ues of abundance and biomass between samplingdates and among oil platform densities for a randomlyselected subset of 11 stations for each density. Thisanalysis was followed by multiple linear regressionanalysis to estimate and fit a structural model toexplain the variation in the observations of biologicalmeasures in terms of natural variables and concentra-tions of oil hydrocarbons and metals. Variables werechecked for colinearity using the Pearson’s product-moment correlation coefficients. Where a combinedcoefficient for a pair of variables was above 0.95 andsignificant at the 5% confidence level, one variablewas not included in the regression analysis. Thus, theselected variables were water depth, mean grain size,% silt, sorting, % organic matter, total hydrocarbons,iron, barium, chromium and nickel, the latter 3 nor-malised using iron. All variables were checked for nor-mality using the Wilk’s λ and transformed when neces-sary either with log10 for continuous measurements orarc-sin transformation for variables expressed as a per-centage (Sokal & Rohlf 1995).
Hypothesis 2. Influence of distance to oil platform:To test the null hypothesis of no difference in abun-dance and biomass between sampling dates with dis-tance to oil platforms, stations were grouped based ondistance to the nearest oil platform: <3, 3 to 8 and>8 km (see Table 2). The distances were chosen toapproximate those at which various influences onmacroinfauna have been previously detected in theNorth Sea studies (Olsgard & Gray 1995) and also tomaximise the number of samples within each group. A2-factor ANOVA balanced design was applied to testfor differences in mean values of abundance and bio-mass, as described in the previous section. To test thenull hypothesis of no difference in assemblage compo-sition, non-metric multidimensional scaling (MDS)ordination plots were produced using a ranked similar-ity matrix, based on Bray-Curtis similarity measures of
fourth root-transformed macroinfauna family abun-dance and biomass data for both seasons. Differencesin the macroinfauna assemblage composition for the apriori distance from oil-related activities groupingswere formally tested by a 2-way analysis of similarities(ANOSIM) (Clarke 1993) using an unbalanced designthat included all the stations. Canonical analysis ofprincipal coordinates (CAP) was used to contrast theresults of the unconstrained ordination from the MDSagainst the constrained ordination produced by CAP,which seeks to separate samples based on an a priorihypothesis by looking for group differences alonganother dimensions. CAP also takes into account thecorrelation structure among the variables (families) inthe abundance and biomass matrices (Anderson &Willis 2003). Differences in the macroinfauna assem-blage composition for the a priori distance groupingswere formally tested by random permutation proce-dures. The index of multivariate dispersion (IMD) foreach station group, and the relative dispersion of thegroups, were calculated from the similarity matrices toexplore the proposition that variability in communitycomposition increases with increased levels of stress(Warwick & Clarke 1993b). The relationship betweenassemblage composition and environmental variableswas examined by the matching of Biotic to Environ-mental multivariate patterns (BIO–ENV) procedure(Clarke & Ainsworth 1993). BIO–ENV uses a Spear-man’s rank correlation between the resulting rankedsimilarity matrices of fauna and correlation-based PCAof the normalised environmental variables. The analy-sis was performed using the same 10 variables used forthe regression analysis. All the above univariate andmultivariate routines were undertaken utilising thePRIMER (Plymouth Routines in Multivariate EcologicalResearch), GMAV5 for Windows and CAP softwarepackages (Clarke & Gorley 2001, Anderson 2003).
Regional comparison of pollution impact: A meta-analysis procedure was used to compare the macro-infauna assemblage response to oil-related distur-bance in the southern Gulf of Mexico with a datasetfrom the north east (NE) Atlantic that considers a cleargradient of contamination and also includes varioustypes of natural disturbances (Warwick & Clarke1993a). The meta-analysis comprises standardisedmeasures of production (P) at phylum level from theallometric equation P = (biomass/abundance)0.73 ×abundance. Thus, abundance and biomass data fromthe study area were aggregated to phylum, combinedto form the production matrix using the above formula,standardised and merged into the original database(supplied with the PRIMER software) before a MDSplot was produced (from fourth root-transformed datausing the Bray-Curtis similarity index) for visualanalysis.
93

Mar Ecol Prog Ser 289: 89–107, 2005
RESULTS
Environmental analysis
Pearson’s product-moment correlation analysis wasemployed in order to identify common sources of oiland metals on the across- and along-shelf transects
(Table 1). On across-shelf transects, Fe, Mn, Zn and Cuwere strongly associated with depth and grain size,similarly Mn, Zn, Cu and Cr were strongly associatedwith iron. These associations indicate a commonsource and distribution of these metals, with their con-centrations related to increasing depth and smallergrain size. However TH, Ba and Ni were associated
94
Depth Distplat MGS TH Fe Mn Zn Cu Cr Ba Ni
(A) November 1999Depth 1Distplat –0.33 1MGS 0.711 –0.415 1TH 0.056 –0.357 0.444 1Fe 0.819 –0.564 0.844 0.413 1Mn 0.802 –0.592 0.841 0.399 0.974 1Zn 0.855 –0.545 0.806 0.343 0.974 0.944 1Cu 0.851 –0.582 0.866 0.381 0.956 0.943 0.957 1Cr 0.518 –0.65 0.777 0.598 0.893 0.871 0.853 0.851 1Ba 0.007 –0.723 0.448 0.549 0.387 0.401 0.362 0.445 0.659 1Ni 0.376 –0.173 0.189 –0.332 0.195 0.19 0.271 0.193 –0.049 –0.093 1
(B) April 2000Depth 1Distplat –0.29 1MGS 0.719 –0.588 1TH 0.125 –0.468 0.52 1Fe 0.863 –0.486 0.879 0.397 1Mn 0.857 –0.501 0.89 0.434 0.978 1Zn 0.786 –0.559 0.892 0.436 0.942 0.934 1Cu 0.851 –0.549 0.924 0.418 0.967 0.962 0.957 1Cr 0.565 –0.625 0.864 0.581 0.895 0.874 0.886 0.881 1Ba –0.04 –0.628 0.557 0.806 0.312 0.327 0.439 0.399 0.615 1Ni 0.572 –0.069 0.532 0.322 0.537 0.6 0.514 0.573 0.398 0.177 1
(C) November 1999 Depth 1Distplat 0.158 1MGS 0.473 –0.022 1TH 0.238 –0.319 0.442 1Fe 0.477 –0.257 0.331 0.272 1Mn 0.393 –0.366 0.233 0.277 0.961 1Zn 0.479 –0.25 0.422 0.397 0.918 0.911 1Cu 0.38 –0.121 0.271 0.267 0.865 0.778 0.741 1Cr 0.19 –0.397 0.356 0.401 0.814 0.736 0.775 0.742 1Ba 0.135 –0.557 0.204 0.531 0.359 0.415 0.466 0.305 0.47 1Ni 0.249 –0.035 –0.026 0.146 0.359 0.465 0.364 0.16 0.025 0.049 1
(D) April 2000 Depth 1Distplat 0.172 1MGS 0.558 –0.363 1TH 0.509 –0.522 0.503 1Fe 0.224 –0.181 0.44 0.545 1Mn 0.286 –0.396 0.561 0.681 0.918 1Zn –0.001 –0.092 0.264 –0.013 0.188 0.123 1Cu 0.406 –0.308 0.66 0.717 0.836 0.838 0.269 1Cr –0.016 0.09 0.157 0.089 0.65 0.356 0.208 0.541 1Ba 0.112 –0.628 0.444 0.591 0.218 0.245 0.15 0.433 0.274 1Ni 0.04 0.072 0.052 0.059 –0.188 –0.193 0.047 –0.016 –0.048 0.302 1
Table 1. Pearson’s product-moment correlation coefficients between pairs of natural and oil-related variables on (A, B) across-shelf and (C, D) along-shelf transects at each sampling date. Distplat = distance from nearest oil platform; MGS = mean grain size;
TH = total hydrocarbons. Significant coefficients are in bold
Hernández Arana et al.: Oil-related impact in the Campeche shelf
with neither depth nor grain size; therefore, theirsource and distribution may relate to some other vari-able. In the case of barium, moderate associations withdistance to oil platforms and TH indicate that at leastpart of the barium might come from oil-related activi-ties. This pattern of association is consistent on the
across-shelf transects in both sampling periods. On thealong-shelf transects, correlation coefficients amongFe, Mn, Zn, Cu and Cr showed strong to moderateassociations indicating a common source and distribu-tion pattern, but this can not be explained solely on thebase of depth, grain size or distance to oil platforms.
95
TS Depth (m) Nearest oil Number of platforms UCM % FFPIplatform (km) in 5 km radius Nov 99 Apr 00 Nov 99 Apr 00
A1 19 30 0 90 98 0.0 0.3A2 21 22.5 0 * 98 1.0 0.6A3 22 15 0 * 97 0.9 1.0A4 23 7.5 0 * 99 1.0 0.2A5 25 4.4 2 * 99 0.0 0.8A6 31 1.3 7 * 99 0.3 0.0A7 38 1.3 8 100 100 0.0 0.1A8 46 3.8 4 99 99 0.3 0.7A9 63 2.5 2 99 98 0.0 1.0A10 93 2 3 100 96 0.4 0.5A11 116 6.3 0 97 100 0.1 0.2A12 135 13.8 0 92 99 0.0 1.0B1 12 0 0 96 94 0.1 1.0B2 15 25.5 0 97 0 0.2 0.5B3 22 16 0 74 98 0.1 0.4B4 23 10 0 99 93 0.2 0.8B5 27 2.5 1 88 0 0.6 0.4B6 34 3.8 2 99 98 0.7 0.1B7 41 2.5 5 99 75 0.0 0.4B8 45 5.8 0 99 99 0.5 0.7B9 52 2.5 4 100 100 0.3 0.9B10 60 3.2 3 98 100 0.4 0.6B11 87 5 1 98 95 0.1 0.0B12 112 10 0 95 42 0.4 0.3C1 37 15 0 98 97 0.0 0.3C2 35 6.3 0 99 95 0.3 0.4C3 32 2 4 99 96 0.4 0.3C4 32 1.3 4 96 98 0.5 0.3C5 30 1.3 7 99 99 0.8 NSC6 32 2.5 8 97 99 0.7 0.2C7 34 3.8 2 98 98 0.5 NSC8 36 3.8 3 96 100 0.3 0.4C9 38 11 0 99 * 0.3 *C10 39 16 0 99 99 0.3 0.0C11 39 21.5 0 93 100 0.5 0.0C12 39 28 0 99 * 0.4 0.0D1 67 4.5 1 99 99 0.0 0.3D2 52 8.8 0 107 99 0.4 0.7D3 51 2 2 99 99 0.0 0.6D4 46 3.8 4 100 99 0.2 NSD5 46 3 5 100 98 0.0 0.0D6 45 5.8 0 99 99 0.1 NSD7 49 0.7 12 100 100 0.2 0.8D8 48 3.8 3 64 98 0.2 0.7D9 49 2.5 1 98 99 0.7 0.6D10 49 11.3 0 98 99 0.2 1.0D11 46 18.8 0 95 100 0.0 *D12 44 26.3 0 39 99 0.0 *
Table 2. Distance to the nearest oil platform for each sampled station, number of oil platforms located in a radius of 5km from eachsampled station, UCM percentage of oil hydrocarbons and fossil fuel pollution index (FFPI) per station and sampling date. TS =Transect Station, NS = not sampled. *Concentrations of compounds below detection limit. Bold values indicate PAHs of
petroleum origin

Mar Ecol Prog Ser 289: 89–107, 2005
Again barium showed moderate associations with THand distance to oil platforms, and this pattern of associ-ation was consistent between sampling dates.
Oil hydrocarbons measured in this study showedthat, at most of the stations, >90% of the total hydrocar-bons was an unresolved complex mixture (UCM), indi-cating a highly weathered and biodegraded petroleumorigin. The fossil fuel pollution index demonstrated that12 stations sampled in November 1999 and 19 stationssampled in April 2000 had PAHs of petroleum origin(Table 2). The metal most likely to have a terrigenous
source, iron, showed a depth-related gradient and apattern of decreasing concentration from SW to NE,moving away from the rivers’ influence (Fig. 2). Thus,other metals were normalised for iron concentration, asiron is known to be a conservative element and its dis-tribution along the transects demonstrated a patterndictated by natural variation. There is evidence thatsuggests TH and barium are associated with distance tooil platforms, and because more than 90% of the THpresented in the samples corresponds to UCM, TH andbarium will be used as a proxy for oil-related activities.
96
120
100
80
60
40
20
01 2 3 4 5 6 7 8 9 10 11 12
m ‘Rainy’ (A)
j ‘Northers’ (A)
n ‘Rainy’ (B)
h ‘Northers’ (B)
120
100
80
60
40
20
0
500
400
300
200
100
0
500
400
300
200
100
0
1 2 3 4 5 6 7 8 9 10 11 12
1 2 3 4 5 6 7 8 9 10 11 12 1 2 3 4 5 6 7 8 9 10 11 12
1 2 3 4 5 6 7 8 9 10 11 12 1 2 3 4 5 6 7 8 9 10 11 12
1 2 3 4 5 6 7 8 9 10 11 12 1 2 3 4 5 6 7 8 9 10 11 12
25
20
15
10
5
0
25
20
15
10
5
0
20 000
16 000
12 000
8 000
4 000
0
20 000
16 000
12 000
8 000
4 000
0
Iron
μg
g–1C
hrom
ium
μg
g–1B
ariu
m μ
g g–1
To
tal h
ydro
carb
on μ
g g–1
Across-shelf transects
m ‘Rainy’ (C)
j ‘Northers’ (C)
n ‘Rainy’ (D)
h ‘Northers’ (D)
Along-shelf transects
Fig. 2. Patterns of variables indicative of oil-related activity measured at each station on across-shelf (Transects A, B: left panels)and along-shelf transects (Transects C, D: right panels) . Lines are provided as an aid to follow each transect. The region of oil
activities corresponds to Stns 6 to 9 on across-shelf transects and Stns 3 to 8 on along-shelf transects

Hernández Arana et al.: Oil-related impact in the Campeche shelf
There were no indications of oil-related activities onthe across-shelf transects at Stations A1 to 4 and B1 to4, which showed low concentrations of total hydrocar-bons (TH) and barium below 20 and 40 µg g–1 of drysediment respectively. These stations are located near-est to the coast with no oil-related activities and, ingeneral, had the lowest concentrations of metals(Fig. 2). TH, barium and chromium showed peak con-centrations between Stations A6 to 10 and B6 to 10(maximum concentrations of 135, 446 and 24 µg g–1 ofdry sediment respectively); these stations are locatedin the area of oil-related activity (Fig. 1). On the along-shelf transects, TH, barium and chromium all showedno consistent pattern, but had relatively high and lowvalues at stations close to and distant from oil fieldsrespectively (Fig. 2).
The physical and chemical features of the sampledstations are summarised by the PCA of the 23 mea-sured variables, including indicators of oil-relatedinfluence (Fig. 3). Principal component 1 (PC1)explains 47% of variation and the stations form 2 mainclusters, related mainly to the increasing values (fromleft to right) of sediment metal load and decreasingsediment size, followed by a weaker contribution fromoil hydrocarbons (Table 3). It is noticeable that oilhydrocarbons, barium and distance to oil platforms arenot among the most influential variables, althoughtheir influence is stronger than depth. The second PCaxis explains 15% of variation and is dominated bysalinity, silt, clay and organic matter, followed by a
weaker contribution of oil hydrocarbonsthat decreases in magnitude from the bot-tom to the top of the plot. The dominantvariables on this axis appear to representthe temporal variation caused by the riverrunoff and associated sedimentation.
Patterns of biota
Across-shelf transects (Fig. 4) presentedrelatively high values and low variabilityof abundance, biomass and number of taxaat Stns A1 to 5 and B1 to 5 (<30 m deep).Values then decreased at Stns A6 to 12and B6 to 12, except for Stn B8 where thehighest abundance and number of taxawere recorded after the ‘northers’ season.Generally, Stns A6 to 12 and B6 to 12 werefaunally impoverished and variabilityamong these stations was high comparedwith stations <30 m deep. On along-shelftransects (Fig. 4), values of abundance,biomass and number of taxa were as low
97
–8 –6 –4 –2 0 2 4 6–5
–4
–3
–2
–1
0
1
2
3
4
5
A1
A2A3A4
A5A6
A7A8
A9
A10
A11
A12
B1
B2B3
B4B5 B6
B7
B8B9
B10B11
B12
C1
C2C3
C4
C5
C6
C7C8C9
C10
C11C12
D1
D2D3
D4D5D6
D7
D8D9
D10D11
D12
1a
2a
3a4a
5a
6a 7a 8a9a
10a11a
12a
1b
2b
3b
4b5b
6b 7b8b 9b10b
11b12b
1c2c3c
4c6c
8c
9c
10c11c
12c
1d2d3d5d7d8d 9d
10d11d
12d
PC 1
PC
2
Fig. 3. PCA ordination plot of the 2 first PCs for 23 transformed environmen-tal variables based on normalised euclidean distances by season. (A1 to
D12 after the ‘rainy’ and 1a to 12d after the ‘northers season’)
PC1 PC2
% of variation 47.8 15.3
Variable/coefficientsDepth (m) 0.174 0.204Oil platforms (km) –0.168 0.080Log salinity 0.080 0.327Arc-sin % sand –0.216 0.208Arc-sin % silt 0.046 –0.430Arc-sin % clay 0.182 0.372Log surface area (m2 g m–1) 0.263 0.092Moment mean (phi) 0.269 0.022Moment sorting.(phi) –0.131 0.172Arc-sin % organic matter 0.176 0.304Arc-sin % carbonates –0.242 –0.219Log total hydrocarbons –0.212 –0.213Log total aliphatic 0.193 –0.228Log total aromatic 0.200 –0.181Log UCM aliphatic 0.188 –0.234Log UCM aromatic 0.206 –0.158Log iron 0.275 0.061Log manganese 0.274 0.104Log zinc 0.260 0.090Log copper 0.269 0.009Log chrome 0.268 0.002Log barium 0.205 –0.177Log nickel 0.006 0.189
Table 3. Percentage of variation explained, plus coefficients,for the linear combination of 23 variables making up the first2 principal components (PC) for 48 and 44 stations sampledafter the ‘rainy’ and ‘northers’ seasons respectively. Boldnumbers are coefficients for the most influential variables on
each PC. UCM: unresolved complex mixture

Mar Ecol Prog Ser 289: 89–107, 2005
as those recorded for Stns A6 to 12 and B6 to 12;however, there was no clear spatial pattern. In gen-eral, abundance and biomass were higher at moststations in samples taken after the ‘northers’ seasonthan after the ‘rainy’ season. Number of taxa cannotbe compared between sampling dates due to differ-ent sample size for the large macroinfauna fraction;nevertheless, an increase in number of taxa wasobserved when comparing only the small macro-infauna fraction.
Influence of density and distance to oil platformstested by univariate statistics
Table 4 presents the results from the 2-factorANOVA. For abundance data, statistical differenceswere evident between sampling dates and among den-sities and distance to oil platforms groups. For biomass,
however, no statistical differences were found be-tween sampling dates, only among densities and dis-tance groups. Post-hoc Student-Newman-Keuls (SNK)tests showed that the ‘high platform density’ and the‘most distant’ groups consistently had low mean val-ues. Thus, the hypothesis of lower abundance and bio-mass in areas of high oil platform density and at sta-tions close to oil platforms could not be rejected.Table 5 presents the best-fit models from regressionanalysis (statistically significant at p < 0.05) explainingthe highest variation in log10 abundance and biomassin terms of 5 natural and 5 anthropogenic variables.After the ‘rainy’ season, 48 and 27% of the total varia-tion in abundance and biomass respectively wasexplained by concentrations of chromium and barium.After the ‘northers’ season, however, chromium andorganic matter content were the best explanatory vari-ables for abundance and biomass respectively. Fromthe scatterplots displayed in Fig. 5, it can be generally
98
1 2 3 4 5 6 7 8 9 10 11 12 1 2 3 4 5 6 7 8 9 10 11 12
1 2 3 4 5 6 7 8 9 10 11 12 1 2 3 4 5 6 7 8 9 10 11 12
1 2 3 4 5 6 7 8 9 10 11 12 1 2 3 4 5 6 7 8 9 10 11 12
No.
fam
ilies
sam
ple
–1Lo
g 10 b
iom
ass
g m
–2 w
wLo
g 10 n
o. in
div
idua
ls m
–2
50
40
30
20
10
0
50
40
30
20
10
0
2.52.01.51.00.5
0–0.5–1.0
2.52.01.51.00.5
0–0.5–1.0
5.0
4.5
4.0
3.5
3.0
2.5
2.0
5.0
4.5
4.0
3.5
3.0
2.5
2.0
Across-shelf transects Along-shelf transects
m ‘Rainy’ (A)
j ‘Northers’ (A)
n ‘Rainy’ (B)
h ‘Northers’ (B)
m ‘Rainy’ (C)
j ‘Northers’ (C)
n ‘Rainy’ (D)
h ‘Northers’ (D)
Fig. 4. Patterns of biological measures at each station on across-shelf transects A and B (left panels), and along-shelf transects C and D (right panels). ww: wet weight

Hernández Arana et al.: Oil-related impact in the Campeche shelf
noted that stations located in areas with high oil plat-form density present low values of abundance and bio-mass and high values of barium and chromium; theopposite is true for sites located in areas where oil plat-forms are absent. A shift in the relationship betweenorganic matter and biomass between sampling dates isapparent (Fig. 5), as well as the lack of pattern in rela-tion to oil platform density.
Influence of distance to oil platform tested bymultivariate statistics
Fig. 6a, b presents the 2D MDS ordination plots fortransformed abundance data using the grouping criteriaof distance to the nearest oil platform for each season.The stress values are above 0.2, indicating difficulty inrepresenting the multivariate pattern in 2 dimensions.However, stations located at distances >8 km from oilplatforms appear to be more similar, whilst stations lo-cated at distances 3 to 8 and <3 km from oil platforms donot show a clear grouping (rather they are distributedthroughout the plot). MDS plots for biomass data dis-played the same pattern and are therefore not shown.The 2-way ANOSIM test for differences between sam-
pling dates, and among groups based ondistance to oil platforms, showed signif-icant differences in the main factors forboth abundance and biomass data(Table 6). Differences in assemblagecomposition (as indicated by the R-value) were smaller between samplingdates than among distance groupings.Pairwise comparison indicated signifi-cant differences between the >8 km ver-sus the 3 to 8 km and 0 to 3 km groups,but no significant differences in assem-blage composition between the latter2 distance groupings.
Fig. 6c, d presents the 2D constrainedCAP ordination plots for the same dataused in the MDS analyses. It is clearfrom the plots that group differencesexisted but occurred along anotherdimension than those represented byMDS. Taking the correlation structureamong the families into account pro-vides a better definition of the influ-ence of distance to the nearest oil plat-form on the community composition, inparticular for the group of stations at 0to 3 km and the April 2000 samplingperiod. Cross-validation of the stationclassification using the leave-one-outmethod with m values of 7 and 16 indi-
cated a mis-classification of 52 and 41% for Novemberand April respectively, with the highest degree of mis-classification between groups 2 and 3. The cumulativepercentage of variation explained by the first principalcoordinate axis was 64.8% for November (m = 7) and
99
Factor SS df MS F p
(a) AbundanceSeason 11.7276 1 11.7276 14.65 0.0003Density of platforms 9.3084 2 4.6542 5.81 0.0049Season × density of platforms 0.7501 2 0.3750 0.47 0.6283Residual 48.0452 60 0.8008Total 69.8313 65
BiomassSeason 1.9768 1 1.9768 1.63 0.2071Density of platforms 9.8101 2 4.9051 4.04 0.0227Season × density of platforms 1.0063 2 0.5032 0.41 0.6629Residual 72.9179 60 1.2153Total 85.7111 65
(b) AbundanceSeason 12.6677 1 12.6677 14.13 0.0004Density of platforms 11.2459 2 5.6230 6.27 0.0034Season × density of platforms 0.6608 2 0.3304 0.37 0.6933Residual 53.7889 60 0.8965Total 78.3633 65
BiomassSeason 1.4612 1 1.4612 1.90 0.1735Density of platforms 9.6100 2 4.8050 6.24 0.0035Season × density of platforms 0.0134 2 0.0067 0.01 0.9913Residual 46.2135 60 0.7702Total 57.2981 65
Table 4. Two-factor fixed-orthogonal ANOVA model testing for differences andinteractions in macrobenthos abundance and biomass between 2 samplingdates for (a) 3 densities of oil rig/platforms (high, low and zero oil rigs within a5 km radius) and (b) 3 groups of distance to the nearest oil platform (>8 km, 3 to
8 km and 0 to 3 km). Bold numbers indicate significant differences
Predictor Abundance BiomassCoefficient p-value Coefficient p-value
(a) After ‘rainy’ season (n = 43)Constant 5.06482 <0.0001 1.94365 <0.0001Chromium –1.20923 0.0163Barium –0.28966 0.0251 –0.59497 0.0003Regression <0.0001 0.0003R2 0.4842 0.2709
(b) After ‘northers’ season (n = 40)Constant 5.14345 <0.0001 1.53634 <0.0001Chromium –1.5271 0.0017Organic matter –1.16645 0.0002Regression 0.0017 0.0002R2 0.2247 0.2993
Table 5. Models from stepwise multiple linear regressionanalyses that best explain variation in the observations formacroinfauna abundance and biomass (both log10 trans-
formed) after the (a) ‘rainy’ and (b) ‘northers’ seasons

Mar Ecol Prog Ser 289: 89–107, 2005
93% for April (m = 16). Despite the degree of mis-clas-sification, the results of the permutation test indicateda significant difference in the composition and relativeabundance of macroinfauna families among the 3groups, based on distance to the nearest oil platformfor both sampling dates (trace statistics = 0.586, p =0.0109 and delta-12 = 0.459, p = 0.0058 for November1999, and trace statistics = 1.222, p = 0.0031 and delta-12 = 0.7798, p = 0.0006 for April 2000).
The following taxa had the highest positive individ-ual correlations (–0.4 to –0.75) with the first canonicalaxis for November 1999; polychaetes: Capitellidae,Cirratulidae, Goniadidae, Lumbrineridae, Spionidae;Mollusca: Corbulidae and Nemertea: Linneidae. All ofthem had their lowest abundances and biomass withinthe 0 to 3 km group. Only 2 taxa (Nephtyidae andSergestidae) were restricted or had higher abundancesin the 0 to 3 km group compared with the other 2, with
100
Log 10
bio
mas
s m
–2 w
w
1.7
1.2
0.7
0.2
–0.3
–0.80 2 4 6 8 10
Arcsin organic matter (%) Arcsin organic matter (%)
Log10
barium (μg g–1) 0.8 1.2 1.6 2.0 2.4 2.8
Log10
barium (μg g–1) 0.8 1.2 1.6 2.0 2.4 2.8
Log10
barium (μg g–1) 0.8 1.2 1.6 2.0 2.4 2.8
Log10
barium (μg g–1) 0 0.5 1.0 1.5 2.0 2.5 3.0
Log10
chromium (μg g–1) 0.78 0.88 0.98 1.08 1.18 1.28 1.38
Log10
chromium (μg g–1) 0.81 0.91 1.01 1.11 1.21 1.31 1.41
1.7
1.2
0.7
0.2
–0.3
–0.8
2.0
1.6
1.2
0.8
0.4
0
4.7
4.3
3.9
3.5
3.1
2.7
2.3
3.8
3.5
3.2
2.9
2.6
2.3
2.0
3.8
3.5
3.2
2.9
2.6
2.3
2.0
4.7
4.3
3.9
3.5
3.1
2.7
2.3
2.0
1.6
1.2
0.8
0.4
00 2 4 6 8 10
Log 10
bio
mas
s m
–2 w
w
Log 10
ab
und
ance
m–2
Lo
g 10 a
bun
dan
ce m
–2
‘Rainy’ season ‘Northers’ season
Fig. 5. Macroinfaunal abundance and biomass against environmental and oil-related variables selected as good descriptors fromthe multiple regression analysis. Left panels: after the ‘rainy’ season (n: 0 oil rigs, m: 1 to 3 oil rigs, m 4 to 12 oil rigs) and right
panels: after the ‘northers’ season (h: 0 oil rigs, j: 1 to 3 oil rigs, j: 4 to 12 oil rigs). ww: wet weight

Hernández Arana et al.: Oil-related impact in the Campeche shelf
negative correlation coefficients of –0.3 to –0.4. ForApril 2000, 7 families had negative correlation coeffi-cients of –0.4 to –0.6, and these taxa were; polychaetes:Capitellidae, Amphinomidae, Magelonidae, Onuphi-dae; Amphipoda: Ampeliscidae; Tanaidacea: Para-pseudidade and Sipuncula: Aspidosiphonidae. Thesefamilies were less abundant at the stations in the 0 to3 km group, similar to the pattern previously observedin November.
Spearman’s rank correlations between the similaritymatrices of macroinfauna and PCA ordinations of a setof 10 variables using the BIOENV technique were gen-erally low (rS < 0.4, Table 7). Water depth was the bestsingle explanatory variable for the multivariate config-uration of abundance and biomass during both sea-sons, and the second best correlation included nickel.The degree of association was higher after the‘northers’ season than after the ‘rainy’.
Table 8 presents the results of the relative multivari-ate dispersion within, and pairwise comparisons be-tween, distance groupings. The IMD within eachgroup (for both sampling dates) showed a gradient in-creasing from stations nearest to an oil platform tothose furthest away . Pairwise comparison of the IMDratio values presented differences between samplingdates. After the ‘rainy’ and ‘northers’ seasons, similari-ties among samples from the >8 km group were gener-ally higher than among samples from the 3 to 8 km and0 to 3 km distance groups, indicating higher variability
within the latter groups. After the ‘northers’ season,the difference in the order of dispersion between the 3to 8 km and 0 to 3 km distance groups was opposite tothat observed after the ‘rainy’ season, although on bothsampling dates the differences were small, as high-lighted by the low IMD ratio value, indicating a similardegree of within-group variability.
Regional comparison
The results of using the phylum-level meta-analysisdata to compare the severity of macroinfauna assem-blage disturbances in the southern Gulf of Mexico to
101
Axis 1–0.22 –0.12 –0.02 0.08 0.18 0.28
–0.14
–0.09
–0.04
0.01
0.06
0.11
0.16
Axis 1–0.22 –0.12 –0.02 0.08 0.18 0.28 0.38
–0.18
–0.08
0.02
0.12
0.22
0.32
a)
Stress: 0.27
b)
c) d)
Stress: 0.24
Axi
s 2
Fig. 6. (a, b) Two-dimensional MDS and (c, d) CAP ordination plots of assemblage data for macroinfauna (a, c) after the ‘rainy’season and (b, d) after the ‘northers’ season, based on Bray-Curtis similarities of abundance (fourth root-transformed). Symbols
represent groups of stations based on distance to the nearest oil field (s: >8 km, m: 3 to 8 km, j: 0 to 3 km)
Abundance BiomassGlobal R p-value Global R p-value
Season 0.091 0.003 0.063 0.012Distance to 0.158 0.001 0.157 0.001
oil platform
Pairwise>8 km, 3–8 km 0.107 0.006 0.113 0.011>8 km, 0–3 km 0.287 0.001 0.281 0.0013–8 km, 0–3 km 0.051 0.09 0.052 0.084
Table 6. Two-way ANOSIM test for differences in macroin-fauna assemblage composition between ‘rainy’ and ‘northers’season and among groups based on distance to the nearest oil
platform. Bold numbers indicate significant differences

Mar Ecol Prog Ser 289: 89–107, 2005
that encountered in the NE Atlantic are shown inFig. 7. Stations from the NE Atlantic (left of plot) areclearly separated from samples from the southernGulf of Mexico (right of plot). The pollution gradientof the NE Atlantic samples is primarily along the ver-tical axis, going from unpolluted stations (U) at thebottom to grossly polluted (GP) stations at the top ofthe plots. The distribution of samples from the south-ern Gulf of Mexico along this pollution axis variedbetween seasons. The vast majority of stations werelocated under the moderate pollution condition afterthe ‘rainy’ season and there was no clear pattern inrelation to distance to oil platforms. After the‘northers’ season, a relationship with distance to oilplatforms was apparent: the majority of stations fromthe >8 km distance group were located under theunpolluted condition, and the stations from theremaining intermediate and closest distance groupswere dispersed between the unpolluted to moder-ately polluted conditions.
DISCUSSION
For any impact study of oil-related ac-tivities, the contamination (i.e. in-creased levels of a chemical comparedto natural background levels, GESAMP1995) status of the area needs to be de-termined in order to relate that contam-ination to changes in the fauna (Olsgard& Gray 1995). Generally, in the south-ern Gulf of Mexico, the defined thresh-old for total hydrocarbons (TH) in un-polluted sediments is 70 µg g–1 dryweight and of biological origin (Botelloet al. 1991, Gold-Bouchot et al. 1999).Botello et al. (1982) reported back-ground levels of biogenic TH below
102
a)U
U
UMP
MP
GPGP
MPMP
U
U
U
U
U
U
UUU
U
MP
MP
MP
UUUU
UU
U
PP
P
P
P
U
ADAD
AD
UU
U
MP
UUU
U
BD
UU
Ua
ab
b
c
c
b
c
cba
a aab
b
c
b
c
bb
a
a
b
c
c
c
c
b
b
a
a
a
a
b
ac
b
c
b
c b
c
a
a
a
Stress: 0.19
b)U
U
UM P
M P
G P
G P
M PM P
U
U
U
U
U
U
UUUU
M P
M P
M P
UUUU
UU
U
P P
P
P
P
U
A DA D
A D
UU
U
M P
UU
U
U
B D
U
UU
aaab
c
cb
cb
a
aa
a
b
b
cb c
ba
a
bcc c
baa
aa
b
ac
c
c b c
a
a a
Stress: 0.17
Fig. 7. Two-dimensional nMDS (non-metric multidimensionalscaling) ordination plots of the meta-analysis of the NEAtlantic (GP: grossly polluted; P: polluted; MP: moderatelypolluted; U: unpolluted; BD: biodisturbed; AD: anoxic sites)and southern Gulf of Mexico data along transects A to D (a)after the ‘rainy’ and (b) after the ‘northers’ seasons, based onBray-Curtis similarities of standardised production data(fourth root-transformed). Letters a, b and c on ordinationsrepresent groups of stations based on distance to the nearest
oil platform (a = >8 km, b = 3 to 8 km, c = 0 to 3 km)
Distance to oil platform ‘Rainy’ season ‘Northers’ season
Relative dispersion>8 km 0.7 0.8423–8 km 1.13 1.0880–3 km 1.298 1.333
Pairwise IMD>8 km, 3–8 km –0.456 –0.48>8 km, 0–3 km –0.57 –0.2573–8 km, 0–3 km –0.206 0.272
Table 8. Relative dispersion and index of multivariate disper-sion (IMD) of macroinfauna abundance data sampled afterthe ‘rainy’ and ‘northers’ seasons for groups based on distance
to the nearest oil platform
Variables Abundance rS Variables Biomass rS
(a) After the ‘rainy’ seasonDepth, Silt, TH, Nickel 0.160 Depth, Sorting, TH, Nickel 0.137Depth, TH, Nickel 0.176 Depth, TH, Nickel 0.144Depth, Nickel 0.206 Depth, Nickel 0.188Depth 0.147 Nickel 0.173
(b) After the ‘northers’ seasonDepth, Iron, Barium, Nickel 0.242 Depth, Iron, Barium, Nickel 0.291Depth, Iron, Nickel 0.307 Depth, Iron, Nickel 0.353Depth, Nickel 0.327 Depth, Nickel 0.376Depth 0.348 Depth 0.404
Table 7. Relationship between environmental variables and faunal assemblagecomposition using the BIO–ENV procedure. The combinations of 1 to 4 vari-ables that best explain the faunal patterns based on abundance and biomass aregiven for each season. The coefficient (rS) is for Spearman’s rank correlation,
highest values are in bold. TH: total hydrocarbons

Hernández Arana et al.: Oil-related impact in the Campeche shelf
50 µg g–1 in recent sediments of the ‘transitional’ regionof the Campeche shelf. After the Ixtoc blowout in 1979,levels were above 100 µg g–1 of petroleum origin withinthe vicinity of the oil field (Boehm et al. 1982), returningto background levels after 12 months (Botello & Vil-lanueva 1987). The present study reports a range ofconcentrations from below detection limits at stationson the inner shelf to above 100 µg g–1 dry weight in thesediment at stations located within the oil productionzone. Between 90 and 100% of the TH load was an un-resolved complex mixture (UCM), indicating a chronicinput of highly weathered petroleum (NAS 1985, Volk-man et al. 1992). The fossil fuel pollution index also in-dicated a petroleum origin for PAHs (Boehm & Farring-ton 1984) from 25 and 50% of the stations duringNovember 1999 and April 2000 respectively.
There is no published background information onconcentrations of trace metals in the southern Gulf ofMexico oil production zone and little is known aboutthe amount of drilling fluids and produced water thathave been discharged since oil exploration started in1974. However, according to the environmental pro-tection office of the Mexican oil company (PEMEXpers. comm.), there have been no direct discharges ofoil-based drilling fluids or produced water to the watercolumn or seabed. Considering the information avail-able, it is therefore not possible to state how compara-tively high the present concentrations of metals are.Previous work has highlighted increasing levels ofmetals towards the south and south-western portion ofthe Campeche Bank, mainly as a result of river runoffand fine sedimentation (Macias-Zamora et al. 1999).The results of the present study confirm that theincreasing concentration of some metals, e.g. iron, inthe transitional area of the Campeche shelf is indeedthe result of river runoff and fine sedimentation. It hasalso been suggested that oil-related activities con-tribute to the concentrations of barium, nickel,chromium and vanadium (Rosales-Hoz et al. 1994,1999). Levels of barium unequivocally indicate influ-ence from drilling discharges (Kirkley 1984, Stein-hauer et al. 1994, Rezende et al. 2002) and it has beenpreviously demonstrated that barium levels in the sed-iment of the southern Gulf of Mexico increase frombelow detected levels to >500 µg g–1 when approach-ing the oil production zone (Rosales-Hoz et al. 1994).The present study recorded similar values rangingfrom <20 µg g–1 to a maximum of 446 µg g–1, with con-centrations reaching a maximum at stations close to oilplatforms. It appears that contamination from oil-related activities extends beyond the immediate sur-roundings of the point source, as noted from the uni-variate plots of stations and indicators of oil-relatedactivities in the present study. Additionally, resultsfrom the PCA clearly show that stations with high con-
centrations of oil hydrocarbons and metals clustertogether, independent of season, and do not follow thenatural pattern of depth and grain-size gradientsacross and along the shelf. It is therefore concludedthat the oil-impacted area in the southern Gulf of Mex-ico is comparatively extensive and thus differs from theapparent restriction of contamination to areas near thepoint source observed in the northern Gulf of Mexico(Middleditch 1981b, Kennicutt et al. 1996). Extensivecontaminated areas and overlapping influences fromneighbouring oil fields are expected from a long his-tory of oil exploitation (Olsgard & Gray 1995) and thisseems to be the case for the present area of study.
Producing unequivocal evidence of pollution fromoffshore oil-related activities is a difficult task due tothe pervasive effect of background variability linked tonatural disturbance (Clark 1982, Spies 1987). Somepossible results of oil disturbance on the benthicinfauna were observed in the distribution of faunaalong transects; faunally impoverished stations werelocated in areas where oil platforms are concentrated.A characteristic peak of opportunist taxa occurred atStns B8 and D7, although several families of poly-chaetes that are known to contain opportunistic spe-cies had much higher abundances at stations where nooil activities were present (e.g. Lumbrineridae, Spi-onidae, Capitellidae, Cirratulidae), and were appar-ently subjected to natural disturbance as shown by thedifferences in abundances between sampling dates.Thus, the responses of opportunists to natural andanthropogenic disturbance were not easily distin-guishable, perhaps as a consequence of the taxonomiclevel of identification for the fauna.
Overall, results from the present analyses showed thatstations located in areas of high oil platform densities,or close to oil-related activities, had significantlylower abundance/biomass and different assemblagecomposition than those stations located in areas of lowplatform density or further away from oil-related acti-
vities. These effects were generally independent of nat-ural differences between the sampling dates. The pat-tern of oil-related contamination partially explained thepatterns in biotic variables as noted from the multiple re-gression analysis and the BIOENV procedure. However,the data were characterised by high levels of variabilitydue, for example, to changes along depth gradients, theinteraction of terrigenous and carbonaceous sediments(incorporating natural disturbance from river runoff) andwinter storms supplementing the anthropogenic distur-bance from oil-related activities. Variability in thenatural pattern of macroinfauna assemblages couldtherefore be responsible for the lack of significant differ-ence found between groups of stations at <3 km and3 to 8 km from oil platforms, and stations with relativelylow and high oil platform densities in a 5 km radius.
103

Mar Ecol Prog Ser 289: 89–107, 2005
Although sediment characteristics in the area ofstudy are relatively homogeneous in comparison to thenorthern portion of the Campeche Bank, which is char-acterised by grain-size intervals from silt to coarsesand (Hernandez-Arana et al. 2003), the range of dis-turbance from natural and oil-related sources is likelyto account for much of the variability recorded for allbiological variables. The IMD indicated an increasedvariability for the group of stations located within 0 to3 km of an oil field, indicating increased levels of stress(Warwick et al. 1990, Warwick & Clarke 1993b). Thedispersion values for these stations resulted from thevery low similarities in community composition, evenbetween adjacent stations. This increased variability inthe multivariate patterns can be explained by the doc-umented response of infauna to both natural and oil-related disturbance. Natural disturbance after the‘rainy’ season produces an overall faunal impoverish-ment in the area, followed by a recovery when oppor-tunist species dramatically increase in numbers after alag of several months.
Despite the natural patchiness in relation to theeffect of this disturbance, the temporal response of fau-nal impoverishment and the peak of opportunists arestill driven mainly by the presence or absence of nat-ural disturbance. Offshore oil-related disturbance isusually represented by a progressive degradation ofthe benthic community structure, and the response ofopportunistic species is known to represent the finalstages of pollution rather than being a recoveryresponse to the absence of disturbance (Dicks & Hart-ley 1982, Gillmor et al. 1985, Patin 1999). Faunalimpoverishment resulting from natural disturbance isaggravated at stations close to oil fields or in areas ofhigh oil rig density. Here the recovery response, asobserved on the inner shelf following natural distur-bance, is prevented by the continuous disturbancefrom oil-related activity. Therefore, when natural dis-turbance from the ‘rainy’ season is absent, it is sug-gested that oil-related disturbance controls the multi-variate pattern of the macroinfauna, as noted from theanalysis after the ‘northers’ season.
The presence of an environmental gradient (across-shelf), and the lack of independent controls and previ-ous information on assemblage composition of thearea, required the use of alternative techniques thatcan overcome these problems and provide a means ofdetermining the impact of oil-related activities on themacroinfauna over shelf and regional scales. Themeta-analysis results were inconsistent between sam-pling dates, in terms of defining the status of stationsclose to the oil platforms with respect to a known pol-lution gradient from North Sea samples. However,what is clear from the results is a separation of thesouthern Gulf of Mexico samples from those of the NE
Atlantic. Such a partitioning has been previouslyreported with data obtained off Trinidad and Tobago(Agard et al. 1993) and southern Africa (Savage et al.2001). Agard et al. (1993) proposed that this could bedue to the estuarine character of their study site, whichfavoured a larger contribution to the estimated produc-tion matrix from crustaceans, but Savage et al. (2001)attributed the split to a greater contribution of molluscsand crustaceans that were physically robust and resis-tant to mining disturbance. In the southern Gulf ofMexico data, the separation of samples is due not onlyto crustaceans, but also to a greater contribution fromnemerteans and sipunculids, unusual taxa in the otherregions. The previous and present findings point to alimitation in the meta-analysis method proposed byWarwick & Clarke (1993a). The polluted status of theNE Atlantic samples is based on the major contributionof annelids to the estimated production matrix, as thistaxonomic group contains a great number of oppor-tunistic species known to dwell in areas with organicenrichment (Warwick & Clarke 1993a, 1994). How-ever, on the Campeche shelf, several stations locatedin areas of high oil platform density, where annelidscontribute little, were clustered with the unpollutedsites, particularly in the November 1999 sampling. Thisdifference in the relative contribution of phyla could bedriven by sediment differences between the 2 shelves,as the southern Gulf of Mexico is predominantly car-bonate. In summary, this method highlights 2 points:(1) the difficulties of differentiating between naturaland anthropogenic disturbance as reflected by theinconsistency of sample grouping between samplingdates, and (2) in the southern Gulf of Mexico, the com-munity response to the interaction of natural andhuman disturbances is driven by the response of taxain addition to polychaetes, linked perhaps to the car-bonate nature of the area. It is proposed that toincrease the applicability of the meta-analysis, morenaturally disturbed samples (e.g. storm- and river-influenced stations) from a range of sediment typesshould be included in the database. Alternatively, itmay be more valuable to create separate tropical andtemperate data sets, where a phylum other thanannelids controls the overall response.
The present study attempted to take into account themain sources of natural disturbance in the CampecheShelf study area by sampling macroinfauna after the‘rainy’ and ‘northers’ seasons, and to capture the puta-tive oil-related influence by sampling over a range ofsedimentary conditions. Despite the lack of adequatecontrols with which to compare the results, it is consid-ered that there is enough evidence to conclude that oil-related activities in the southern Gulf of Mexico arehaving a significant impact on the macroinfaunaassemblages.
104

Hernández Arana et al.: Oil-related impact in the Campeche shelf
Acknowledgements. The British Council and CONACYT(Mexico) are thanked for providing financial support througha scholarship to HAHA. Special thanks are due to D. Salas deLeon and E. Escobar-Briones for providing logistic supportwithin the oceanographic research program PROMEBIO 2and 3 (ICMyL UNAM, Mexico). Thanks are due to R. Hartley(Department of Geological Sciences, University of Plymouth,UK) for assistance in analysing data for sediment grain sizeand to V. Ceja, L. Sanchez, J. Dominguez and R. Castro (CIN-VESTAV, Merida, Mexico) for their help during the analysesof oil hydrocarbons and trace metals. The authors expresstheir gratitude to the commander and crew of the oceano-graphic vessel ‘B/O Justo Sierra’ and the MSc students thatprovided help during the sampling program and onboard pro-cessing of samples. Two anonymous referees are thanked fortheir comments which contributed to the improvement of thefinal manuscript.
LITERATURE CITED
Addy JM, Hartley JP, Tibbetts PJC (1984) Ecological effects oflow toxicity oil-based mud drilling in the Beatrice oilfield.Mar Pollut Bull 15:429–436
Agard JBR, Gobin J, Warwick RM (1993) Analysis of marinemacrobenthic community structure in relation to pollution,natural oil seepage and seasonal disturbance in a tropicalenvironment (Trinidad, West Indies). Mar Ecol Progr Ser92:233–243
Anderson MJ (2003) CAP: a FORTRAN computer program forcanonical analysis of principal coordinates. Department ofStatistics, University of Auckland, Auckland
Anderson MJ, Willis TJ (2003) Canonical analysis of principalcoordinates: a useful method of constrained ordination forecology. Ecology 84:511–525
APHA (American Public Health Association) (1985). Standardmethods for the analysis of water and wastewater, 16thedn. Washington, DC
Bello AA, Cano R (1991) Subsuelo marino en el area de laSonda de Campeche. In: Soil mechanics and foundationengineering. Panamerican conference on soil mechanicsand foundation engineering. Sociedad Chilena de Geo-tecnia, Viña del Mar, Chile, p 183–195
Boehm PD, Farrington JW (1984) Aspects of the polycyclicaromatic hydrocarbon geochemistry of recent sedimentsin the Georges Bank region. Environ Sci Technol 18:840–845
Boehm PD, Fiest DL, Hausknecht K, Barbash J, Perry G (1982)Investigation of the transport and fate of petroleum hydro-carbons from the Ixtoc-I blowout in the Bay of Campeche— Sampling and analytical approaches. In: Keith LH (ed)Energy and environmental chemistry, Vol 1. Fossil fuels.Ann Arbor Science, MI, p 129–159
Boicourt WC, William JWJ, Valle-Levinson A, Atkinson LP(1998) Continental shelf of the southeastern United Statesand the Gulf of Mexico: In the shadow of the westernboundary current. In: Robinson AR, Brink KH (eds) Thesea. The global coastal ocean. Regional studies and syn-theses, Vol 11. John Wiley and Sons, New York, p 135–181
Botello AV, Villanueva S (1987) Vigilancia de los hidro-carburos fosiles en sistemas costeros del Golfo de Mexicoy areas adyacentes. I. Sonda de Campeche. An Inst CiencMar Limnol Univ Nac Auton Mex 14:45–52
Botello AV, Castro SA, Guerrero R (1982) Baseline studies forhydrocarbons and organic carbon isotope ratios of recentsediments in the Bank of Campeche before the Ixtoc-I oilspill. In: Keith LH (ed) Energy and environmental chem-
istry, Vol 1 Fossil fuels. Ann Arbor Science, MI, p 119–128Botello AV, Gonzalez C, Diaz G (1991) Pollution by petroleum
hydrocarbons in sediments from continental shelf ofTabasco State, Mexico. Bull Environ Contam Toxicol 47:565–571
Carney RS (1987) A review of study design for the detection oflong-term environmental effects of offshore petroleumactivities. In: Boesch DF, Rabalais NN (eds) Long-termenvironmental effects of offshore oil and gas develop-ment. Elsevier Applied Science, London, p 651–696
Clark RB (1982) The long-term effect of oil pollution onmarine populations, communities and ecosystems: somequestions. Philos Trans R Soc Lond B 297:185–192
Clarke KR (1993) Non-parametric multivariate analyses ofchanges in community structure. Aust J Ecol 18:117–143
Clarke KR, Ainsworth M (1993) A method of linking multi-variate community structure to environmental variables.Mar Ecol Prog Ser 92:205–219
Clarke KR, Gorley RN (2001) PRIMER v5: User manual/tutorial. PRIMER-E, Plymouth
Czitrom SPR, Ruiz F, Alatorre MA, Padilla AR (1986) Prelimi-nary study of a front in the Campeche Bay, Mexico. In:Nihoul JCJ (ed) Marine interfaces ecohydrodynamics, Vol42. Elsevier, Amsterdam, p 301–311
Daan R, Mulder M (1996) On the short-term and long-termimpact of drilling activities in the Dutch sector of the NorthSea. ICES J Mar Sci 53:1036–1044
Davies JM, Addy JM, Blackman RA, Blanchard JR and 5 others (1984) Environmental effects of the use of oil-based drilling muds in the North Sea. Mar Pollut Bull 15:363–370
Dean WE Jr. (1974) Determination of carbonate and organicmatter in calcareous sediments and sedimentary rocks byloss on ignition: comparison with other methods. J Sedi-ment Petrol 44:242–248
Dicks B (1976) Offshore biological monitoring. In: Baker JM(ed) Marine ecology and oil pollution. Applied SciencePublishers, Barking, p 325–440
Dicks B, Hartley JP (1982) The effects of repeated small oilspillages and chronic discharges. Philos Trans R SocLondB 297:285–307
Ellis JI, Schneider DC (1997) Evaluation of a gradient sam-pling design for environmental impact assessment. Envi-ron Monit Assess 48:157–172
Ferraro SP, Cole FA (1992) Taxonomic level sufficient forassessing a moderate impact on macrobenthic communi-ties in Puget Sound, Washington, USA. Can J Fish AquatSci 49:1184–1188
Fuentes-Yaco C, Salas de Leon DA, Monreal-Gomez MA,Vera-Herrera F (2001) Environmental forcing in a tropicalestuarine ecosystem: the Palizada river in the southernGulf of Mexico. Mar Freshw Res 52:735–744
GESAMP (Group of Experts on the Scientific Aspects ofMarine Environmental Protection) (1995) Biological indi-cators and their use in the measurement of the condition ofthe marine environment. Report No. 55, United NationsEnvironment Programme, Nairobi
Gillmor RB, Menzie CA, Mariani GM, Levin DR, Ayers RC,Sauer TC Jr. (1985) Effects of exploratory-drilling dis-charges on the benthos. In: Duedall IW, Kester DA, ParkPK, Ketchum BH (eds) Energy wastes in the ocean, Vol 4.John Wiley & Sons, New York, p 243–270
Gold-Bouchot G, Zapata-Perez O, Noreña-Barroso E, Ceja-Moren V, Zavala-Coral M (1999) Oil pollution in thesouthern Gulf of Mexico. In: Kumpf H, Steidinger K, Sher-man K (eds) The Gulf of Mexico large marine ecosystemassessment, sustainability and management. Blackwell
105

Mar Ecol Prog Ser 289: 89–107, 2005
Scientific, Malde, MA, p 372–381Gonzalez-Macias C (1989) Las comunidades bentonicas y su
relacion con afloramientos naturales de hidrocarburos enel Golfo de Mexico: Crucero Chapo I. Universidad y Cien-cia 6:7–28
Gray JS, Clarke KR, Warwick RM, Hobbs G (1990) Detectionof initial effects of pollution on marine benthos: an exam-ple from the Ekofisk and Eldfisk oilfields, North Sea. MarEcol Prog Ser 66:285–299
Green RH, Montagna P (1996) Implications for monitoring:study designs and interpretation of results. Can J FishAquat Sci 53:2629–2636
Gutierrez-Estrada M, Galaviz-Solis A (1991) Clasificacionbinaria de los sedimentos superficiales del suroeste delGolfo de Mexico. Jaina 2:6
Hartley JP (1984) The benthic ecology of the Forties oilfield(North Sea). J Exp Mar Biol Ecol 80:161–195
Hernandez Arana HA (2003) Influence of natural and anthro-pogenic disturbance on the soft bottom macrobenthiccommunity of the Campeche Bank, Mexico. PhD thesis,University of Plymouth, Plymouth
Hernandez Arana HA, Rowden AA, Attrill MJ, Warwick RM,Gould-Bouchot G (2003) Large-scale environmental influ-ences on the benthic macroinfauna of the southern Gulf ofMexico. Est Coast Shelf Sci 58:825–841
Holme NA, McIntyre AD (1984) Methods for the study ofmarine benthos. Blackwell Scientific Publications, Oxford
Kennicutt MC II, Boothe PN, Wade TL, Sweet ST and 5 others(1996) Geochemical patterns in sediments near offshoreproduction platforms. Can J Fish Aquat Sci 53:2554–2566
Kingston PF (1992) Impact of offshore oil production installa-tions on the benthos of the North Sea. ICES J Mar Sci 49:45–53
Kirkley C (1984) Drilling mud. Division of Continuing Educa-tion. University of Texas at Austin, Houston, TX
Lizarraga-Partida ML, Izquierdo-Acuña FB, Chang IW (1991)Marine bacteria on the Campeche Bank oil field. Mar Pol-lut Bull 22:401–405
Macias-Zamora JV, Villaescusa-Celaya JA, Muñoz-BarbosaA, Gold-Bouchot G (1999) Trace metals in sediment coresfrom the Campeche shelf, Gulf of Mexico. Environ Pollut104:69–77
Middleditch BS (1981a) Environmental effects of offshore oilproduction. The Buccaneer gas and oil field study. PlenumPress, New York
Middleditch BS (ed) (1981b) Hydrocarbons and sulphur.In:Middleditch BS (ed) Environmental effects of offshoreoil production. Plenum Press, New York, Houston, Texas,p 15–54
Monreal-Gomez MA, Salas de Leon DA, Padilla-Pilotze AR,Alatorre-Mendieta MA (1992) Hydrography and estima-tion of density currents in the southern part of the Bay ofCampeche, Mexico. Cienc Mar 18:115–133
Montagna P, Harper DE Jr. (1996) Benthic infaunal long-termresponse to offshore production platforms in the Gulf ofMexico. Can J Fish Aquat Sci 53:2567–2588
NAS (National Academy of Science) (1985) Oil in the sea:inputs, fates and effects. National Academy of Science,Washington, DC
Olsgard F, Gray JS (1995) A comprehensive analysis of theeffects of offshore oil and gas exploration and productionon the benthic communities of the Norwegian continentalshelf. Mar Ecol Prog Ser 122:277–306
Patin S (1999) Environmental impact of the offshore oil andgas industry. Ecomonitor publishing, New York
Rabalais NN, McKee BA, Reed DJ, Means JC (1992) Fate andeffects of produced water discharges in coastal Louisiana,
Gulf of Mexico, USA. In: Ray JP, Engelhart FR (eds) Pro-duce water. Plenum Press, New York, p 355–369
Rezende CE, Lacerda LD, Ovalle ARC, Souza CMM, GoboAAR, Santos DO (2002) The effect of an oil drilling opera-tion on the trace metal concentrations in offshore bottomsediments of the Campos Basin oilfield, SE Brazil. MarPollut Bull 44:680–684
Rosales-Hoz L, Carranza-Edwards A, Mendez-Jaime C, Mon-real-Gomez MA (1999) Metals in shelf sediments and theirassociation with continental discharges in a tropical zone.Mar Freshw Res 50:189–196
Rosales-Hoz L, Carranza-Edwards A, Santiago-Perez S,Mendez-Jaime C, Doger-Badillo R (1994) Study of anthro-pogenically induced trace metals on the continental shelfin the southeastern part of the Gulf of Mexico. Rev IntContam Ambient 10:9–13
Santiago J, Baro A (1992) Mexico’s giant fields, 1978–1988decade. Am Assoc Pet Geol Mem 54:73–99
Savage C, Field JG, Warwick RM (2001) Comparative meta-analysis of the impact of offshore marine mining on mac-robenthic communities versus organic pollution studies.Mar Ecol Prog Ser 221:265–275
Secretaría de Marina (1994) Carta nautica S. M. 840 Bahía deCampeche. Direccion General de Oceanografia Naval,Mexico
Sericano JL, Atlas EL, Wade TL, Brooks JM (1990) NOAA’sstatus and trend mussel watch program: Chlorinated pes-ticides and PCBs in oysters (Crassostrea virginica) andsediments from the Gulf of Mexico, 1986–1987. MarEnviron Res 29:161–203
Sokal RR, Rohlf FJ (1995) Biometry. W. H. Freeman andCompany, New York
Somerfield PJ, Clarke KR (1995) Taxonomic levels, in marinecommunity studies, revisited. Mar Ecol Prog Ser 127:113–119
Soto LA, Escobar-Briones E (1995) Coupling mechanismsrelated to trophic benthic production in the SW Gulf ofMexico. In: Eleftheriou A, Ansell AD, Smith CJ (eds) Proc28th Eur Mar Biol Symp. Institute of Marine Biology ofCrete, Iraklio, Crete. Olsen and Olsen, Fredensborg,p 233–242
Soto LA, Gracia A (1987) Evaluacion de los efectos de hidro-carburos fosiles sobre las poblaciones de camaronespeneidos en el Banco de Campeche. An Inst Cienc MarLimnol Univ Nac Auton Mex 14:133–146
Spies RB (1987) The biological effects of petroleum hydrocar-bons in the sea: assessments from the field and micro-cosms. In: Boesch DF, Rabalais NN (eds) Long-term envi-ronmental effects of offshore oil and gas development.Elsevier Applied Science, London, p 411–467
Steinhauer M, Crecelius E, Steinhauer W (1994) Temporaland spatial changes in the concentrations of hydrocarbonsand trace metals in the vicinity of an offshore oil-produc-tion platform. Mar Environ Res 37:129–163
UNEP/IOC/IAEA (1992) Determination of petroleum hydro-carbons in sediments. Reference methods for marinepollution studies. Report No. 20, United Nations Environ-ment Programme
Valdes VM, Ortega Ramirez R (2000) Issues and challenges inthe requalification of offshore platforms in Mexico. J Off-shore Mech Arct Eng 122:65–71
Vazquez F, Rangel R, Quintero-Marmol AM, Fernandez J,Aguayo E, Palacio A, Sharma VK (2000) Southern Gulf ofMexico. In: Sheppard CRC (ed) Seas at the millennium: anenvironmental evaluation, Vol 1. Elsevier Science, Ams-terdam, p 467–482
Vidal VMV, Vidal VF, Hernandez FA, Meza E, Zambrano L
106

Hernández Arana et al.: Oil-related impact in the Campeche shelf
(1994) Winter water mass distributions in the western Gulfof Mexico affected by a colliding anticyclonic ring.J Oceanogr 50:559–588
Volkman JK, Holdsworth DG, Neill GP, Bavor HJ Jr. (1992)Identification of natural, anthropogenic and petroleumhydrocarbons in aquatic sediments. Sci Total Environ 112:203–219
Warwick RM, Clarke KR (1993a) Comparing the severity ofdisturbance: a meta-analysis of marine macrobenthiccommunity data. Mar Ecol Prog Ser 92:221–231
Warwick RM, Clarke KR (1993b) Increased variability as asymptom of stress in marine communities. J Exp Mar BiolEcol 172:215–226
Warwick RM, Clarke KR (1994) Relearning the ABC: Taxo-nomic changes and abundance/biomass relationships indisturbed benthic communities. Mar Biol 118:739–744
Warwick RM, Clarke KR, Suharsono (1990) A statistical analy-sis of coral community responses to the 1982–83 El Niño inthe Thousand Islands, Indonesia. Coral Reefs 8:171–179
Wolfe KJ, Michibayashi K (1995) ‘Basic’ entropy grouping oflaser derived grain-size data: an example from the greatbarrier reef. Comput Geosci 21:447–462
Yañez-Arancibia A, Sanchez-Gil P (1983) Environmental‘behavior’ of Campeche Sound ecological system, off Ter-minos Lagoon, Mexico: preliminary results. An Inst CiencMar Limnol Univ Nac Auton Mex 10:117–136
107
Editorial responsibility: John Gray (Contributing Editor), Oslo, Norway
Submitted: May 6, 2004; Accepted: October 6, 2004Proofs received from author(s): March 8, 2005
Copyright © 2022 FDOKUMEN