Assessing sounding-derived parameters as storm predictors in different latitudes
11
Assessing sounding-derived parameters as storm predictors in different latitudes José Luis Sánchez a , José Luis Marcos a , Jean Dessens b , Laura López a, ⁎, Carlos Bustos c , Eduardo García-Ortega a a Laboratory of Atmospheric Physics, IMA, University of León, Spain b ANELFA, Toulouse, France c Government of Mendoza, Argentina article info abstract Article history: Received 8 January 2008 Received in revised form 24 November 2008 Accepted 26 November 2008 Many thermodynamic parameters and indices are currently being used as thunderstorm predictors because of their high correlations with the beginning and development of convection. Many of these indices have been developed for one specific area and their forecasting accuracy has generally been assessed in that zone and not in others. It is a highly intriguing question whether there are parameters or indices that may function adequately as thunderstorm predictors, as far as the Probability of Detection is concerned, irrespective of the latitude of the study zone. In order to approach this issue the present study focuses on data from 1692 sounding days in León (Spain), Zaragoza (Spain), Bordeaux (France) and Mendoza (Argentina). Specific discriminant models have already been developed for these areas. When comparing the results found by the different models constructed for each of the four study zones it may be noticed that there are no indices that function extremely well in all of the zones. Rather, a common ingredient pattern is observed for the beginning of convection): atmospheric instability and moist layers in the low atmosphere. It may also be concluded that sounding data alone are not enough to detect accurately the triggering mechanism, which is the third ingredient necessary for convection. The aim of this paper is to build a logistic equation integrating the four study zones. The stepwise method was employed with this purpose because it allows for the gradual inclusion of variables in the final equation according to their discriminating power. The results obtained suggest that Showalter Index and 850 hPa Dew Point Temperature are the variables that best characterize preconvective conditions irrespective of the geographic area considered. The values for POD (Probability of Detection) and FAR (False Alarm Ratio) are acceptable, but they are clearly lower than the ones obtained by each of the models in the study zone for which they were developed. © 2008 Elsevier B.V. All rights reserved. Keywords: Forecast Hailstorms Logistic regression model Spain France South America 1. Introduction It is becoming increasingly evident that weather forecasts are the most important service that the societies demand from their National Meteorological Departments (Schmeits et al., 2005; Weiher, 2007). More accurate weather forecasts enable people to make better decisions in various situations: in activities where lives or properties may be at risk (Nicholls, 2001; Ebi et al., 2004), in planning daily activities or leisure activities (Lazo and Chestnut, 2002), or in any economic activity that depends to some extent on the weather (Murphy, 1994; Nicholls, 1996; Katz and Murphy, 1997; Mjelde et al., 1998; Brooks and Douglas, 1998; Lazo, 2005; Leston et al., 2007). Therefore, economic assessment and research in Atmospheric Research 93 (2009) 446–456 ⁎ Corresponding author. Group for Atmospheric Physics, Institute for the Environment, University of León, 24071 León, Spain. E-mail address: [email protected] (L. López). 0169-8095/$ – see front matter © 2008 Elsevier B.V. All rights reserved. doi:10.1016/j.atmosres.2008.11.006 Contents lists available at ScienceDirect Atmospheric Research journal homepage: www.elsevier.com/locate/atmos
Transcript of Assessing sounding-derived parameters as storm predictors in different latitudes

Atmospheric Research 93 (2009) 446–456
Contents lists available at ScienceDirect
Atmospheric Research
j ourna l homepage: www.e lsev ie r.com/ locate /atmos
Assessing sounding-derived parameters as storm predictorsin different latitudes
José Luis Sánchez a, José Luis Marcos a, Jean Dessens b, Laura López a,⁎,Carlos Bustos c, Eduardo García-Ortega a
a Laboratory of Atmospheric Physics, IMA, University of León, Spainb ANELFA, Toulouse, Francec Government of Mendoza, Argentina
a r t i c l e i n f o
⁎ Corresponding author. Group for Atmospheric PhEnvironment, University of León, 24071 León, Spain.
E-mail address: [email protected] (L. López).
0169-8095/$ – see front matter © 2008 Elsevier B.V.doi:10.1016/j.atmosres.2008.11.006
a b s t r a c t
Article history:Received 8 January 2008Received in revised form 24 November 2008Accepted 26 November 2008
Many thermodynamic parameters and indices are currently being used as thunderstormpredictors because of their high correlations with the beginning and development ofconvection. Many of these indices have been developed for one specific area and theirforecasting accuracy has generally been assessed in that zone and not in others. It is a highlyintriguing question whether there are parameters or indices that may function adequately asthunderstorm predictors, as far as the Probability of Detection is concerned, irrespective of thelatitude of the study zone.In order to approach this issue the present study focuses on data from 1692 sounding days inLeón (Spain), Zaragoza (Spain), Bordeaux (France) and Mendoza (Argentina). Specificdiscriminant models have already been developed for these areas.When comparing the results found by the different models constructed for each of the fourstudy zones it may be noticed that there are no indices that function extremely well in all of thezones. Rather, a common ingredient pattern is observed for the beginning of convection):atmospheric instability and moist layers in the low atmosphere. It may also be concluded thatsounding data alone are not enough to detect accurately the triggeringmechanism, which is thethird ingredient necessary for convection.The aim of this paper is to build a logistic equation integrating the four study zones. Thestepwise method was employed with this purpose because it allows for the gradual inclusion ofvariables in the final equation according to their discriminating power. The results obtainedsuggest that Showalter Index and 850 hPa Dew Point Temperature are the variables that bestcharacterize preconvective conditions irrespective of the geographic area considered. Thevalues for POD (Probability of Detection) and FAR (False Alarm Ratio) are acceptable, but theyare clearly lower than the ones obtained by each of the models in the study zone for which theywere developed.
© 2008 Elsevier B.V. All rights reserved.
Keywords:ForecastHailstormsLogistic regression modelSpainFranceSouth America
1. Introduction
It is becoming increasingly evident that weather forecastsare the most important service that the societies demandfrom their National Meteorological Departments (Schmeits
ysics, Institute for the
All rights reserved.
et al., 2005; Weiher, 2007). More accurate weather forecastsenable people to make better decisions in various situations:in activities where lives or properties may be at risk (Nicholls,2001; Ebi et al., 2004), in planning daily activities or leisureactivities (Lazo and Chestnut, 2002), or in any economicactivity that depends to some extent on theweather (Murphy,1994; Nicholls, 1996; Katz and Murphy, 1997; Mjelde et al.,1998; Brooks and Douglas, 1998; Lazo, 2005; Leston et al.,2007). Therefore, economic assessment and research in

447J.L. Sánchez et al. / Atmospheric Research 93 (2009) 446–456
communication and social perception should become anintegral part of weather forecast systems (Doswell, 2003;Llasat-Botija et al., 2007).
Forecasting the weather is a complex task becausedecisions must be made in situations with a certain degreeof uncertainty. Several authors (Tsonis and Elsner,1989; Elsnerand Tsonis, 1992; Wilks, 1991) have discussed the uncertaintyassociated to atmospheric phenomena, arguing that itrepresents one of the main challenges in short-term forecastsof severe convective events due to their intrinsic stochasticnature (Schmeits et al., 2005). To solve this problemwemakeuse of statistical models, which are very valuable toolsproviding one clearly defined response on the basis of anumber of meteorological data or variables measured in aparticular place. In other words, the aim is to establishautomatic procedures tomake the task of the forecaster easier.
Many studies have employed statistical regression equa-tions to forecast severe weather events, but the coefficients ofthese equations vary according to the geographic location ofthe study zone and according to the season of the year. In fact,the climatic conditions characteristic of a particular placemust be reflected somehow in the equations (Glahn andLowry, 1972; Charba, 1979; Dubrovsky, 1994; Hughes, 2004).
Logistic regression models offer their results in terms ofRisk/No Risk (binary forecast models) andmany authors haveused them to forecast storms (Angus et al., 1988; Dubrovsky,1994; Billet et al., 1997; Sánchez et al., 1998, 2001b, 2007a;Schmeits et al., 2005; López et al., 2007).
In a binary forecast a relationship is established between apredictand, i.e. the occurrence of a thunderstorm or hailfall,and a group of predictors which comprises a number ofmeteorological variables and stability indices. Obviously, theforecasting power of the equations will depend on theappropriate selection of the variables, and consequently,these variables must account for the physical mechanismsinvolved in convection. According to Johns and Doswell(1992), three ingredients are necessary:
i) A sufficiently moist and deep layer in the low or midatmosphere.
ii) Conditional instability.iii) A triggering mechanism to start convection.
The three ingredients are required, and even though theyinfluence convective activity in different ways, their interactiondetermines the likelihood of a particular phenomenon occur-ring or not occurring. In general, the data necessary to constructthe different models is provided by sounding balloons, on theone hand, and by meteorological variables measured at thesurface. Numerous studies claim that the ideal situation is theuse of parameters calculated on the basis of sounding data tocharacterize preconvective conditions and the actual beginningof convection. The values for moisture and instability requiredfor convection may thus be determined (Schultz, 1989; Johnsand Doswell, 1992; McNulty, 1995; Tudurí and Ramis, 1997;Llasat et al., 1997; Sánchez et al., 1998, 2001a, 2007a; López etal., 2007). It is much more difficult though to establish thetriggering mechanisms, which are best determined usingmesoscale models (García-Ortega et al., 2007).
One important issue with respect to the thermodynamicindices is thatmost of themhave been developed and validatedas diagnostic variables and not as forecasting variables. Doswell
and Schultz (2006) define a diagnostic variable being used as aforecast parameter as one that allows a forecaster to make anaccurate weather forecast based on the current values of thatvariable. That is, it is expected that for a proper forecastparameter there should be a time-lagged correlation betweenthe parameter and the weather being forecast.
Over the years a large number of indices provided by radiosoundings have been defined and tested to characterizesituations that could favor the formation and development ofthunderstorms: Showalter (Showalter, 1953), Lifted Index(Galway, 1956), K (George, 1960), Total Totals (Miller, 1975),CAPE (Moncrieff and Miller, 1976) and others. The valuesreached by these indices generally express ranges of theprobability for a particular meteorological phenomenon tooccur or not, making it possible to quantify the uncertaintyimplicit in any forecasts (Murphy, 1977).
It is essential to verify the quality of the prediction, so it isnecessary to compare the values of the indices with theoccurrence or non-occurrence of the phenomenon. For thispurpose, a number of skill scores are employed combining indifferent ways the hits and misses of the various indices. Themost widely used skill scores are Probability of Detection(POD), False Alarm Ratio (FAR), Frequency of Misses (FOM),and True Skill Score (TSS), among others.
The various stability indices have been used separately,and have later been compared with respect to their forecast-ing power in the case of storms and other related phenomenain many parts of the world: Anthes (1976); Schultz (1989) inthe U.S.A.; Jacovides and Yonetani (1990), Collier and Lilley(1994); Huntrieser et al. (1997); Haklander and Van Delden(2003); Marinaki et al. (2006) in Europe, or Takashi andHiroshi (2005) in Japan.
No indexmay characterize the state of the atmosphere on itsown (Blanchard, 1998) and contradictory results may beobtained when considering the indices separately (Schultz,1989). It is preferable to select combinations of variablesgrouped together in statistic regression models. This procedurehas proved to be adequate, as a considerable improvement inthe forecastingaccuracyhasbeennoticed (Bowmanet al.,1969).
In the case of regression models there are clearly definedstatistical techniques to select the variables that will better fitthe experimental data to the mathematical functions. Becausethe climatology in the study zone is important for determiningthe frequency of storms and their characteristics, the questionrises of whether there are variables that are systematicallyincluded in the equations due to their relative importance incharacterizing preconvective situations. According to Schultz(1989), considering stability indices separately, it is not likelythat any of themwill work better everywhere, and similarly, itis not likely that one particular stability index will be a betterstorm forecaster than any of the other indices.
The present paper will use a logistic regression model toanalyze common patterns in all of them, in particular withrespect to the systematic use of the same variables whenstudying the characteristics of storms or hailstorms in variousparts of the world: the province of León and the Central EbroValley in Spain, several parts of France, and the region ofMendoza in Argentina.
The results suggest that there are indeed commonvariables in different study zones, and the possible causesand implications of this fact will be analyzed in detail.

448 J.L. Sánchez et al. / Atmospheric Research 93 (2009) 446–456
2. Study areas and databases
Two basic issues were approached in each of the studyzones: first, the characterization of preconvective conditionsfavoring the occurrence of storms and related phenomenasuch as hailfalls, and second, the construction of a mathema-tical model to forecast these events.
A reliable ground truth database was constructed in allfour cases, enabling us to classify the meteorological situa-tion: in this case, storm/no-storm, hail/no-hail. The groundtruth database was built on the basis of meteorologicalobservations and using reliable methods that were some-times different in the different study zones.
A sufficiently large sounding sample was available in allcases, but in León and Argentina the databases did not includewind data. Since the aim of the study is to comparethunderstorm forecasting variables in different latitudes,only thermodynamic variables were considered becausethese were available in all cases. The lack of wind data,especially wind shear data, is a serious limitation in thedevelopment of the study. Wind shear is a limiting factor inclassifying storms according to their type and potential stormseverity. Vertical shear, interacts dynamically with thunder-storms to either enhance or diminish vertical draft strengths.
Vertical wind shear represents one of the primarykinematic parameters used in anticipating thunderstormtype (Arnold, 2008; Browning, 1964; Johns et al., 1990;Moncrieff and Green, 1972; Weisman and Klemp, 1982, 1984).The combination of wind parameters and thermodynamicparameters has even been used for identifying conditionsfavoring severe convection and tornados (Rasmussen andBlanchard, 1998).
Finally, it must be pointed out again that the forecast(storm/no-storm and hail/no-hail) has been carried outusing exclusively data on instability and moisture. Only thefuture inclusion of wind data will enable us to provide a moreaccurate forecast of the potential storm severity.
Table 1 shows the phenomena to be predicted in eachstudy zone established taking into account the material andtechnical means available for the verification. The result of theforecast was expressed in terms of Risk/No Risk.
The following paragraphs describe the study areas and thedatabases in each study zone used to construct the corre-sponding forecast models.
2.1. Province of León (Spain)
The province of León lies in the northwest of Spain and is anarea with frequent and intense convective activity (Fig. 1). Theprovince is surrounded by mountains on the north and west,whereas to the south and east there are plateaus. In 1986 a
Table 1Phenomena analyzed in each study zone.
Study zone Weather event to be predicted
Province of León (Spain) Storm (storm day/no storm day)Ebro Valley (Spain) Hail (hailstorm day/no storm day)Province of Mendoza (Argentina) Storm (storm day/no storm day)
Hail (hailstorm day/no storm day)Bordeaux (France) Hail (hailstorm day/no storm day)
Project began the study of the impact of storms on crops andtwo subzones were selected (see Fig. 1) separated bymountains from each other. The two subzones lie at altitudesof between 700 and 900 m and cover an area of 6825 Km2.
Networks of voluntary observers were set up in the twostudy zones represented in Fig. 1, with a total of 432individuals, mainly farmers, monitoring an area of around16 km2 each. In Fig. 1 each dot represents one observer, and itmay be noticed that the density was sufficient to believe thatany storm or hailfall would be registered by at least oneobserver (Sánchez et al., 1991). Each observer sent dailypostcards stating the occurrence or non-occurrence of storms,the type of precipitation registered, if any, and the approx-imate time of the event. The term storm day is used here torefer to a period of 24 h starting at 08 UTC every day and withthunderstormswith rain or hail precipitation anywhere in thestudy zones. In contrast, a no-storm day is a day with nostorms detected inside the study zone, although storms mayhave been detected outside the limits of this zone.
For constructing and validating the model 229 summerdays were used corresponding to five campaigns carried outbetween the years 1991 and 1995, beginning onMay 15th andending on September 15th. Following the definition givenabove, a total of 78 storm days were registered. Thethermodynamic characterization of the vertical structure ofthe atmosphere was carried out by means of soundingballoons. Additional data were provided by an automaticmeteorological station at the surface level installed at thesame point fromwhere the sounding balloons were launched.These devices were installed close to the geometric center ofthe eastern subzone (Fig. 1). Taking into account the locationof this point, the data obtained can be considered represen-tative of the preconvective conditions in the area. Huntrieseret al. (1997) argue that soundings are representative for anarea of approximately 250×100 km. Previous studies carriedout over this study zone (Sánchez et al., 1991) revealed thatconvective activity concentrates mainly in the time span from13 to 19 UTC. It was decided that 07 UTCwas the best momentfor launching the soundings because the data are consideredto be valid for about 12 h (Reuter and Atkary, 1995).
The convective phenomena registered were not classifiedaccording to their severity because of the nature of the dataavailable, but it may be noted that hail was registered on 43out of the total of 78 storm days.
2.2. Ebro Valley (Spain)
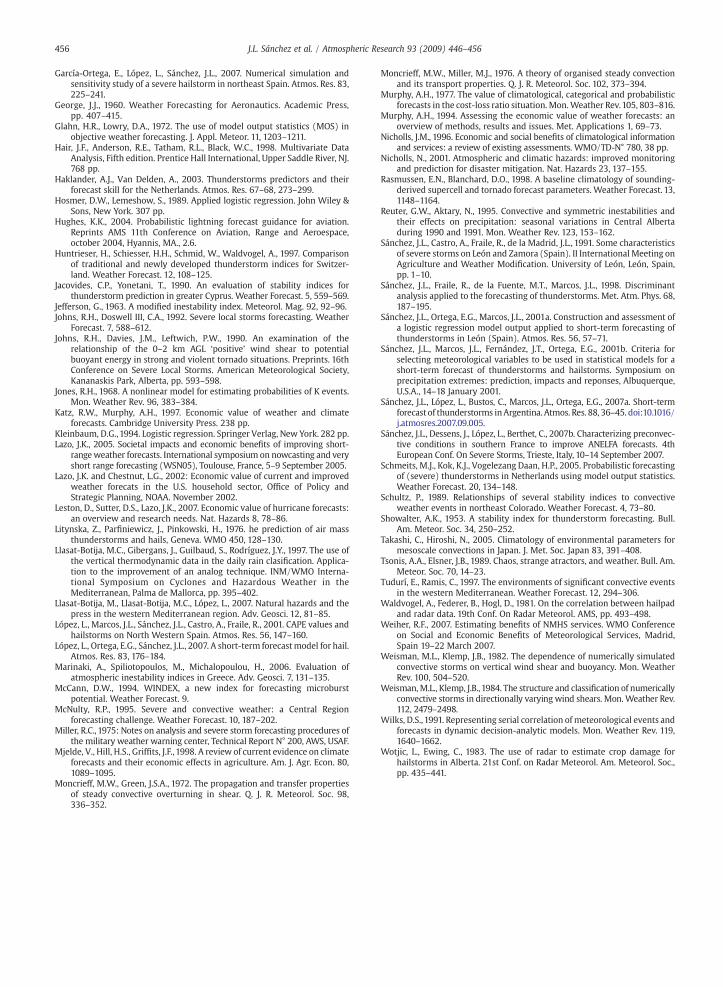
The study zone (Fig. 2) is located in the northeast of theIberian Peninsula and has an area of approximately50,000 km2. It lies in what is known as the Central EbroValley and comprises almost the whole of the region ofAragón and part of the province of Lleida (about 40 km of thearea known as Ponent de Lleida). The study zone is veryheterogeneous from the point of view of the topography(López et al., 2007). The basin of the River Ebro is surroundedby mountains in the form of a horseshoe, and the only openland is the one oriented towards the delta of the river.Summer storms are very frequent in this study zone.
The Laboratory for Atmospheric Physics at the University ofLeón has been carrying out summer campaigns in this areagathering data for detailed studies on the characteristics of
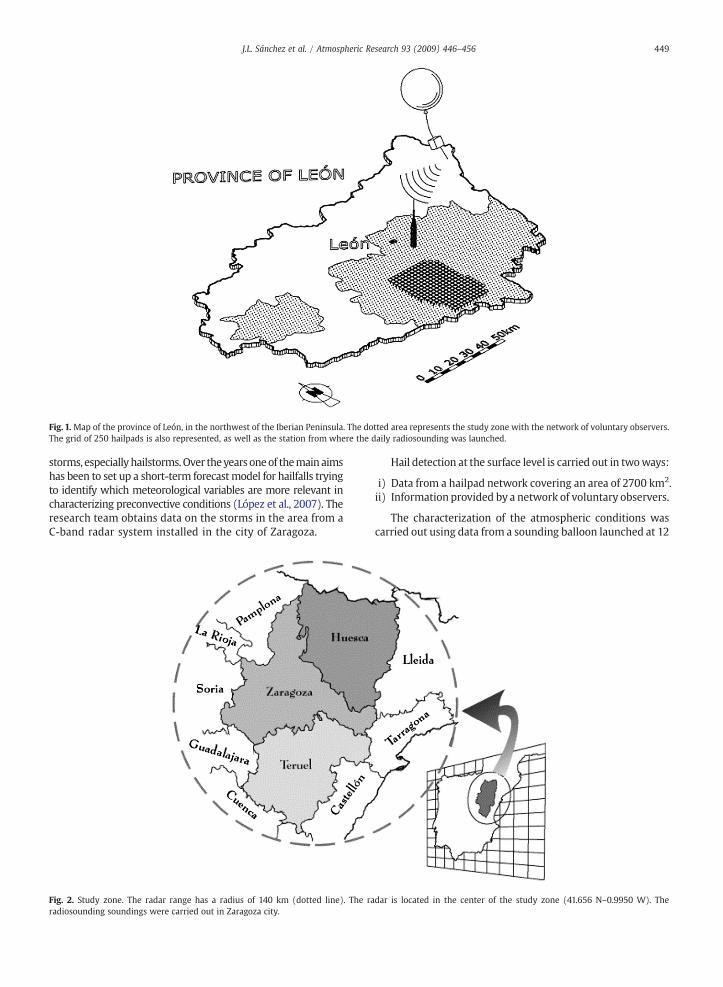
Fig. 1. Map of the province of León, in the northwest of the Iberian Peninsula. The dotted area represents the study zone with the network of voluntary observers.The grid of 250 hailpads is also represented, as well as the station from where the daily radiosounding was launched.
449J.L. Sánchez et al. / Atmospheric Research 93 (2009) 446–456
storms, especially hailstorms.Over theyears oneof themain aimshas been to set up a short-term forecastmodel for hailfalls tryingto identify which meteorological variables are more relevant incharacterizing preconvective conditions (López et al., 2007). Theresearch team obtains data on the storms in the area from aC-band radar system installed in the city of Zaragoza.
Fig. 2. Study zone. The radar range has a radius of 140 km (dotted line). The raradiosounding soundings were carried out in Zaragoza city.
Hail detection at the surface level is carried out in twoways:
i) Data from a hailpad network covering an area of 2700 km2.ii) Information provided by a network of voluntary observers.
The characterization of the atmospheric conditions wascarried out using data from a sounding balloon launched at 12
dar is located in the center of the study zone (41.656 N–0.9950 W). The

Fig. 3. Study zone. The radar is located in the town of La Llave (San Rafael). The radiosoundings were carried out in the area known as Cruz Negra.
Fig. 4. Study zone. The rawinsonde soundings were carried out in Bordeaux.
450 J.L. Sánchez et al. / Atmospheric Research 93 (2009) 446–456

451J.L. Sánchez et al. / Atmospheric Research 93 (2009) 446–456
UTC in Zaragoza, in the middle of the study zone. The validityof the datawas set at 12 h, i.e., from12UTC to 0000UTC. Lópezet al. (2007) found that, on average, the storms in this regionreach amaximumreflectivity of 45 dBZ at 1630UTC, this factorbeing related to an increase in the number of hailstorms.
To set up the forecast model 116 days were used withcomplete radar databases, ground truth databases andsounding databases. These days corresponded to the monthsof June to September of the years 1997, 2000 and 2001.Among these 116 days were 30 hail days and 86 no-hail days.
2.3. Province of Mendoza (Argentina)
This study zone comprises the north and center of the Ar-gentinean province ofMendoza, at the foot of the Andes (Fig. 3).TheAndes range runs fromnorth to south throughMendoza andin some areas widens towards the east for about 180 km. TheAndes occupies one third of the land and can be divided intothreemainparts: themain range,with thehighest peaks (MountAconcagua, 6982 m and Tupungato, 6570 m); the frontal range(average altitude of about 5000 m); and finally, eastwards, thepre-range (altitude of about 3000 m). Many storm formationnests are located in the pre-range area. The storms frequentlydrift fromwest to east towards the plateau (700 m).
The province of Mendoza in Argentina is one of the areas inthe world most affected by severe convective phenomena.Sánchez et al. (2007a) constructed two short-term forecastmodels: one for predicting storms and another one for predictingsevere storms. Cells with a reflectivity of over 30 dBZ will beconsidered storms, and if the reflectivity is over 55 dBZ the cellswill be classified as severe storms, following Waldvogel et al.(1981) and Wotjic and Ewing (1983). If no radar echo isregistered, the situation will be classified as no-storm. Thecharacterization of the meteorological conditions is also carriedout bymeans of soundings launched from the city of Cruz Negra(Fig. 3) and by using data from an automatic meteorologicalstation located there too. The sounding is launchedat 15UTCanda day is defined as the span of time between 15 UTC one day and15 UTC the following day. A total of 474 days were used toconstruct the forecastmodel, corresponding to themonths fromOctober to March (summer months in the Southern hemi-sphere) from 1999 to 2005. The sample contains 274 storm days(112 of which are severe storm days) and 200 no-storm days.
2.4. Bordeaux (France)
France is one of the regions of the world where hailstormsoccur more frequently. From 1951 the Association Nationaled'Etude et de Lutte contre les Fléaux Atmosphériques (ANELFA)focuses on the study of this type of phenomena and theireconomic impact (Fraile et al., 2003). In France, in the periodbetween 1999 and 2003, insurance companies paid an averageof 170million € per year in compensations for crops affected byhail. One third of the damages on crops due to hail in France isconcentrated in the south-west (region of Aquitaine et Midi-Pyrénées), another third in the south-east, and the rest all overthe other regions of the country (see Fig. 4). In these regionsthe ANELFA has installed a dense network with over 1,000hailpads (Dessens et al., 2007).
Datawere available for the study from600 daily soundingslaunched at 12 UTC in the city of Bordeaux. In 302 of these
days hail precipitation was registered in the French hailpadnetwork between the years 1997 and 2005 (southern andwestern regions) (Sánchez et al., 2007b).
2.5. Preselected variables and indices
In all the cases the characterization of preconvectivesituations was conducted using variables obtained from sound-ings together with data provided by meteorological stations atthe surface. The success rate of the forecast models will dependon the careful selection of the variables that are used for theanalysis as these variableswill have to account for the conditionsnecessary for the formation and development of thunderstorms(Johns andDoswell,1992; Sánchez et al., 2001a). Table 2 lists thevariables that were initially selected to construct the models.During the process the number of variableswas greatly reduced,except in the case of the province of León.
It can be seen that among the variables selected initiallythere are a number of indices that combine data on differentdegrees of stability, moisture and wind, as well as parametersrelated to temperatures, wind or altitudes of certain standardlevels. The stability indices include Showalter (Showalter,1953), Total Totals (Miller, 1975), K (George, 1960), Lifted(Galway, 1956), Jefferson index (Jefferson, 1963), H (Litynskaet al., 1976), CAPE (Moncrieff and Miller, 1976), Windex(McCann, 1994), T2 Gust (AWS/TR 200, 1972), SWEAT index(Miller, 1975). The parameters s-rH 2 and s-rH 3 refer toStorm-Relative Helicity measured at 2 km and 3 km, respec-tively (Davis and John, 1993).
The minimum temperature plays an important role andrefers to the minimum temperature registered early in themorning before the soundings were launched. The nighttimeminimum temperature is a rough estimate of the wet bulbpotential temperature of the low-level air during the followingday (Dessens,1995). Thephysical explanation is that the relativehumidity over land at night is often close to saturation, so thatthe minimum temperature is nearly equal to the wet bulbpotential temperature observed during the following afternoon.
This variable has been found to correlate strongly with hailprecipitation in a number of studies (Dessens, 1995; Sánchezet al., 2007a).
3. Statistical models and results in the study areas
Two mathematical models were used to fit the empiricaldata:
3.1. Logistic regression model
This model is widely used in meteorology and wasintroduced in this field by Brelsford and Jones (1967) andJones (1968). The model establishes the conditional prob-ability for a particular phenomenon to occur (responsevariable in mathematical terminology) employing a groupof explanatory variables {X1, X2,…,Xn}, following the equation:
P R = 1 jx1; x2; N ; xnð Þ = 1
1 + e− α +
Pni=1
βixi
� � ð1Þ
For the equation to be used as a discriminant function it isnecessary to establish a criterion to classify a particular day as

452 J.L. Sánchez et al. / Atmospheric Research 93 (2009) 446–456
part of the risk group or of the no-risk group. This criterion wasgiven by setting the cuttingpoint of P(R=1) at a value of 0.5, i.e.,if the value is b0.5, there will be no-risk, and if it is ≥0.5, therewill be risk (Hosmer and Lemeshow, 1989; Crosby et al., 1995).
3.2. Linear discriminant model
The model is based on the mathematical function:
Zjk = W1X1k + W2X2k + N + WnXnk + α ð2Þ
where,
Zjk discriminant Z scores of the discriminant function jfor object k
Wi discriminant loading of the independent variableXik value of the independent variable i corresponding
to object kα constant.
In regression models the selection of the variables (exceptin the case of León) was carried out using the forwardstepwise method (Wilks, 1991). In the four study zones twothirds of the sample days were used to set up themodel (mainsample) and the remaining third was used to validate it(validation sample). Table 3 shows the models used in eachstudy zone.
In the province of León the initial 15 variables were kept(Table 2), and the Wald test (Hosmer and Lemeshow, 1989;Kleinbaum,1994) was used to classify the variables accordingto their statistical significance. Table 4 lists the variableseventually selected.
Different Skill Scores based on binary contingency tableswere used to validate the forecasting power of the models. Ingeneral, as expected, the results are worse for the validation
Table 2Variables initially selected for the forecast models.
Province of León Ebro Valley
Surface pressure (hpa) Surface pressure (hpa)Minimum temperature (°C) Hsur relative humidity at surface levelSurface temperature (°C) Surface temperature (°C)Dew point surface temperature (°C) Dew point surface temperature (°C)CCL altitude (m) CCL altitude (m)Convective temperature (°C) LCL altitude (m)0 °C altitude (m) 0 °C altitude (m)Dew point 0 °C altitude (m) Convective temperature (°C)500 hpa altitude (m) T2 Gust300 hpa altitude (m) WINDEXSI-Showalter index (°C) SI-Showalter index (°C)LI-Lifted index (°C) LI-Lifted index (°C)TT-Total totals index (°C) TT-Total totals index (°C)K index (°C) K index (°C)H index (°C) WBZ (m)
JI-Jefferson index850 hpa dew point (°C)Wind 850 hpaWind 500 hpaWind 300 hpas-rH 2s-rH 3SWEAT Index
sample. In any case, the results can be considered satisfactory.Table 5 includes as an example some of the results (in thiscase from the validation sample).
No clear index pattern can be observed in Table 4 forcharacterizing preconvective conditions for storm or hailstormformation in the different study zones. The final model mustconsequently contain one group of indices or another depend-ing on the study zone. For example, in the province of Mendozain Argentina Showalter and Td 850 hPa are two of theparameters included in the final model. The same parametershave also proved to be useful for forecasting thunderstorms,more precisely hailstorms, in southwestern France. And inZaragoza 850 hPa Td is also included in the equation, butinstead of the Showalter index the model contains the K index,which accounts for atmospheric instability too. Thus, apreliminary consideration of the data does not suggest theexistence of any index that functions equally well in all thestudy zones (Schultz,1989), but it is observed that, even thoughno common index pattern is found, a common pattern ofingredients necessary for convection does appear, following themethodology put forward by Johns and Doswell (1992). Inother words, in all the cases there is an index accounting foratmospheric instability (either Showalter in France andArgentina, Lifted Index in León., or K Index in Zaragoza) andanother parameter accounting for atmospheric moisture (Td of850 hPa in all zones except León, where H Index is used). Theseare, as mentioned above, two of the ingredients necessary forthe beginning of convection. The third ingredient is thetriggering mechanism. We claim that this mechanism is notdirectly inferable using sounding data only.
As for the results shown in the contingency tables of eachof the study zones, it can be seen that the best results wereobtained in Mendoza for forecasting storm days (Sánchezet al., 2007a) and in Zaragoza for forecasting hail (López et al.,2007). In Mendoza the forecast of hailstorms provides worse
Province of Mendoza France
Surface pressure (hpa) Surface pressure (hpa)Minimum temperature (°C) Minimum temperature (°C)Surface temperature (°C) Surface temperature (°C)Dew point surface temperature (°C) Dew point surface temperature (°C)CCL (hpa) CCL (hpa)CCL (°C) CCL (°C)CCL (ft, AGL) CCL (ft, AGL)Convective temperature (°C) Convective temperature (°C)0 °C altitude (ft, AGL) 0 °C altitude (ft, AGL)−5 °C altitude (ft, AGL) −5 °C altitude (ft, AGL)−10 °C altitude (ft, AGL) −10 °C altitude (ft, AGL)1000–500 (m) 1000–500 (m)WBZ (ft, AGL) WBZ (ft, AGL)Boyden index Boyden indexCAPE (J/kg) CAPE (J/kg)850 hpa dew point (°C) 850 hpa dew point (°C)JI-Jefferson index JI-Jefferson indexSI-Showalter index (°C) SI-Showalter index (°C)LI-Lifted index (°C) LI-Lifted index (°C)K index (°C) K index (°C)TT-Total totals index (°C) TT-Total totals index (°C)

Table 3Models used in the different study zones.
Study zone Mathematical model
Province of León (Spain) LogisticEbro Valley (Spain) LogisticProvince of Mendoza (Argentina) Linear discriminantBordeaux (France) Logistic
453J.L. Sánchez et al. / Atmospheric Research 93 (2009) 446–456
results. This is due to the fact that an attempt was made atdiscriminating “Storm days” from “Storm days with hail”, asmentioned above. Calculating the degree of severity ofconvection is a more complex task and the results are,therefore, worse than the ones found in the Ebro Valley or inFrance, where the aim was merely to discriminate between“No-storm days” and “Storm days with hail”. Still, the resultsobtained in all the cases are quite satisfactory.
4. Assessment of the behavior of the thermodynamicparameters and indices irrespective of the study zone
4.1. Preliminary remarks
A model will be set up in this section comprising thedatabases of all the study zones. This model will include allthe variables common to the 4 study zones. The aim is to findout which variables accurately forecast thunderstorms irre-spective of the study zone. The result will be called GlobalModel.
First, it is necessary to take into account some of thelimitations inherent to the use of sounding data (Doswell andSchultz, 2006). Diurnal variations of the indices have ledsome authors to insist on the need to optimize the forecastthresholds, since they are greatly affected by variations in theboundary layer (Huntrieser et al., 1997). The same happens
Table 4Variables selected for the different models.
Province of León Ebro Valley
Storm Minimum TemperatureH indexSurface Pressure0 °C altitude (m)Lifted IndexDew point 0 °C altitude (m)CCL altitude (m)500 hpa altitudeSurface temperature (°C)Convective temp. (°C)TT-Total totals index (°C)300 hpa altitudeSI-Showalter index (°C)Dew point surface temperature (°C)K index (°C)
Hail TT-Total totals indeWind 850 hpaWind 500 hpaCCL altitude (m)
WBZ850 hpa dew pointT2 Gust
with seasonal variations. Haklader and Van Delden (2003)illustrate how the K Index varies seasonally, presenting alower storm threshold in summer than in winter. Tocompensate for these two limitations and compare the dataof the four study zones in the most objective way possible, allthe soundings assessedwere the ones launched in themonthsfrom June to September.
In addition, it is necessary to focus on the aim of theforecast. It is not the same thing to use a number of indices forforecasting thunderstorms than detecting only air massesthat may potentially lead to the formation of thunderstorms,or forecasting hailstorms. The indices employed will bedifferent because every single index has been designed withthe aim of describing one particular feature of convection. So,if we want to identify air masses that may eventually lead tothe formation of thunderstorms, we will use the JeffersonIndex or the K Index. If the aim is to distinguish betweenhailstorms and thunderstorms with no hail, the CAPE indexhas proved to be very useful (López et al., 2001), as well asSWEAT, among others.
In this case the construction of one single database withthe sounding data from all four study zones aims atidentifying from a list of preselected indices the ones thatpresent a better capacity for discriminating the preconvectivecharacteristics that lead to hailstorms from the conditionsthat cause thunderstorms only with no hail. The indicesassessed in the different zones are virtually the same, and,except in León, the stepwise method was used to constructthe final discriminant logarithm.
With respect to the spatial and temporal representative-ness of the soundings it must be said that in certain situations,especially in the case of fronts crossing the study zone withchanges in the air mass, this representativeness is virtuallynonexistent. And sometimes thunderstorms formed in an areafar from the study zone are eventually advected to it. In this
Province of Mendoza Bordeaux
Minimum TemperatureSI-Showalter index (°C)
850 hpa dew point (°C)
x (°C) Minimum Temperature SI-Showalter index (°C)Surface Pressure 850 hpa dew point (°C)CAPE (J/kg) BRNK index (°C) KO index
0 °C altitude (m)
(°C)

Table 5Some precision indices in the study zones.
Provinceof León(storm)
EbroValley(hail)
Province ofMendoza(storm)
Province ofMendoza(hail)
Bordeaux(hail)
Globalmodel
False alarmratio (FAR)
0.18 0.187 0.260 0.400 0.256 0.281
Probabilityof detection(POD)
0.69 0.867 0.832 0.670 0.812 0.746
True skillscore (TSS)
0.61 0.797 0.432 0.361 0.547 0.466
Table 6Logistic coefficient for each variable included and value of the constant α.
Variables B S.E. Wald df Sig. Exp (B)
Showalter Index −0.339 0.021 258.127 1 .000 .713850 hPa Td −0.048 0.015 10.091 1 .001 .953Constant 1.602 0.141 129.636 1 .000 4.965
All the variables are statistically significant at a level of 0.001, and sosusceptible of being interpreted from a meteorological perspective.
454 J.L. Sánchez et al. / Atmospheric Research 93 (2009) 446–456
case the preconvective conditions are obviously not repre-sentative either. Days in which squall lines have developedhave been left out of the database, as well as days where therehas been a change in the air mass between the moment thesoundingwas launched and the convection. The appearance ofsquall line conditions is related to the arrival of fronts. Radardata have enabled us to observe these structures and the dayswhen they appeared where taken out of the database.
Finally, the spatial representativeness of the soundingdepends greatly on the topography of the study zone. Thisrepresentativeness has been explained in the section on thedescription of the study zones. All the soundings werelaunched from the center of the zones.
4.2. Database and methodology
A first database was compiled with the data of all thestorm days in the four study zones in order to identify anyvariables that are particularly helpful in discriminating stormdays from no-storm days irrespective of the study zone. All inall, 1692 days were included in this database. The soundingswere carried out at 12 UTC in Toulouse and Zaragoza, at 07UTC in León and at 15 UTC in Argentina, and as mentionedabove in the description of the study zone, the temporal andspatial ranges of the soundings vary.
Logistic regression is a muchmore robust statistic than thediscriminant function, as it allows for the integration of non-linear effects that cannot be accounted for by discriminantanalyses. The coefficients of the variables included in logisticregression represent different points between the values ofthe independent variable and the variable to be calculated.Therefore, logistic regression was used to determine which ofthe parameters described the preconvective conditions moreaccurately.
The selection of the variables included in the final modelwas carried out using the automatic stepwise method (Hairet al., 1998). In this method the variables are includedor excluded from the final logarithm according to theirdiscriminating power. Wald statistic was used to include thevariables (Hair et al., 1998). The forecast algorithmwas set upafter two iterations. Finally, the variables included in theequation are Showalter and 850 hPa dew point temperature.These indices are the ones with the greatest discriminatingpower irrespective of the study zone.
Table 5 lists the standardized coefficients for the selectedvariables. It can be noticed that all the coefficients arestatistically significant pointing towards an adequate fit of
the model. To assess the global fit the Nagelkerke R Squarewas calculated. This indicator varies between −1 and 1. Thevalue is 0.331, i.e., an adequate fit.
Table 6 lists the results of a number of Skill Scores. TheProbability of Detection of the global model is 0.746. Thisresult is considered to be quite satisfactory, since it has beenpossible to detect correctly 74.6% of the days with convectiveactivity using only two atmospheric parameters. On the otherhand, FAR (0.281) is higher than the mean of the differentzones, but it is not a very high value.
4.3. Meteorological interpretation of the results
Stepwise methods may well be a useful tool in buildingdiscriminant equations. However, this combination of vari-ables must have a meteorological base supporting it. Doswelland Schultz (2006) argue that the individual diagnosticvariables used to form an index may have physical relevanceto the problem at hand, but when a specific formulacombining them is unphysical, this can be problematic.
However, the same authors claim that there is nothinginherently wrong with a quick look, unless the forecasterlimits the diagnosis to the analysis of thermodynamic indices.In fact, they state that using ingredients-based forecastingmethods (Doswell et al., 1996) is a scientifically sound way tokeep the diagnosis within practical time limitations in anoperational forecasting environment. Analyzing the resultswe may conclude that the indices represent two of theingredients necessary for convection mentioned above:atmospheric instability (Showaler Index) and a moist layerin the low atmosphere (850 hPa Td).
The Showalter Index is defined as the temperaturedifference between 500 hPa and the temperature of an airparcel in a pseudo-adiabatic ascent from 850 hPa to 500 hPa.This index has already proved its diagnostic power forecastingthunderstorms in Switzerland, and it proved to be particularlyuseful for soundings launched at 0000 UTC, but offering goodresults also for soundings launched at 1200UTC (Huntrieser etal., 1997) when it was used as the only predictor.
The two parameters chosen for the final model are the onesthat best describe the preconvective conditions required for theformation of thunderstorms in any latitude. Not surprisingly,they had already revealed themselves as useful in specific studyzones. As mentioned above, the Showalter Index appeared inthe final model of France and Mendoza, and 850 hPa Tdappeared in all the individual models except the one con-structed for León. Table 7 shows the mean values and thevariation rangeof the Showalter Index in eachof the studyzonesfor storm days (with or without hail) and for no-storm days.
The third ingredient necessary for convection is a trigger-ing mechanism. This mechanismmay vary from zone to zone.

Table 7Mean values, mode and the variation range of the Showalter Index in each ofthe study zones for storm days (with or without hail) and for no-storm days.
Study area Storm/no storm
Maximum Minimum Mode Mean
Ebro Valley (Spain) Hailstorms 5 −2 −1 2No storms 17 −1 7 6
Province of León (Spain) Storms 11 −6 0 2No storms 18 −5 8 6
Province of Mendoza(Argentina)
Storms 11 −10 0 1No storms 19 −5 4 6
Bordeaux (France) Hailstorms 19 −4 4 4No storms 19 −1 7 8
455J.L. Sánchez et al. / Atmospheric Research 93 (2009) 446–456
Unfortunately, triggering mechanisms may not be assessedexclusively by using sounding data. The availability of othermeteorological data of the study zone such as typicalmeteorological situations, or output from mesoscale models,makes it possible to produce hypotheses about the beginningof convection. But with data from one single sounding in thestudy zone the detection of the triggering mechanism ismerely a hypothesis that cannot be verified. In fact, Haklanderand Van Delden (2003) argue that it is very difficult to obtaininformation on possible triggering mechanisms based solelyon sounding data.
The same authors and also others (Haklander and VanDelden, 2003; Sánchez et al., 2007a) claim that it is necessaryto enrich the information provided by the indices with theoutput of statistical models that include vertical velocities atdifferent levels of the atmosphere and low level moisture fluxconvergence to detect triggering mechanisms more easily(estimated maximum temperatures, formation of conver-gence lines, appearance of thermal lows, or others).
However, the usual approach is to make estimates usingthe information available. This typically involves makingassumptions about the behavior of the fields where we haveno information (Doswell and Schultz, 2006).
5. Conclusions
Analyzing the various regression models constructed fordifferent geographic areas it was found that no index orparameter works equally well in all the zones. Very similarresults have been found in Schultz (1989). However, all theequations included indices or parameters accounting for someof the ingredients necessary for the beginning anddevelopmentof convection (Johns and Doswell, 1992): atmospheric instabil-ity andmoist layers in the low atmosphere. In most areas thesetwo ingredients were represented by the Showalter Index and850 hPa Td. Unfortunately, no wind data were available, inparticular nodata onverticalwindshear,whichwould enable usto determine the storm severity more accurately.
It is not possible to determine the triggering mechanism –
the third ingredient required for convection (Johns andDoswell, 1992) – in the different study zones by usingexclusively sounding data. The combination of these datawith the output of numerical models and/or the experience ofthe predictor is necessary to identify this mechanism in thedifferent areas.
The logistic regression equation built using the stepwisemethod for integrating variables gradually has enabled us toselect those parameters and indices that best characterize
preconvective conditions in the study zone. These variablesare the Showalter Index and 850 hPa Td. With theseparameters the Probability of Detection of thunderstormswas 0.746 and FAR was 0.281.
The calculation of specific models for each of the studyzones increases the Probability of Detection and decreases theFAR.
Acknowledgement
The study was supported by the CICYT through the grantsREN 2003-09617-C02-01 and CGL2006-13372-C02-01.
References
Angus, P.J., Rasmussen, S., Seiter, K., 1988. Short-term prediction of thunder-storm probability and intensity by screening observational and derivedpredictors. Reprints AMS 15th Conference on Severe Local Storms,Baltimore, MA, pp. 368–371.
Anthes, R.A., 1976. Numerical prediction of severe storms certainty,possibility or dream? Bull. Amer. Meteor. Soc. 57, 423–435.
Arnold, D.L., 2008. Severe deep moist convective storms: forecasting andmitigation.GeographyCompass30–66.doi:10.1111/j.1749-8198.2007.00069.x.
AWS/TR 200,1972. Notes on analysis and severe-storrm forecasting proceduresof the Military Weather Warning Center (Miller, R.C.). revised USAF.
Billet, J., Delisi, M., Smith, B., Gates, C., 1997. Use of regression techniques topredict hail size and the probability of large hail. Weather Forecast. 12,154–164.
Blanchard, D.O., 1998. Assessing the vertical distribution of convectiveavailable potential energy. Weather Forecast. 13, 870–877.
Bowman II, H.D., Shulman, D.S., Romboski, L.D., Chilko, D.M., 1969. Anobjective method of thunderstorm forecasting for Washington NationalAirport, Washington, D.C.1. J. Am. Water Resour. Assoc. 5, 31–42.
Brelsford,W.M., Jones, R.H., 1967. Estimating probabilities. Mon.Weather Rev.95, 570–576.
Brooks, H.E., Douglas, P.D., 1998. Value of weather forecasts for electric utilityload forecasting. Preprints, 16th AMS Conference on weather analysisand forecasting, Phoenix, Arizona, 11-6 January 1998, pp. J24–J27.
Browning, K.A., 1964. Airflow and precipitation trajectories within severe localstorms which travel to the right of the winds. J. Atmos. Sci. 21, 634–639.
Charba, J.P., 1979. Two to six hour severe local storm probabilities: anoperational forecasting system. Mon. Weather Rev. 107, 268–282.
Collier, C.G., Lilley, R.B.E., 1994. Forecasting thunderstorm initiation in north-west Europe using thermodynamic indices, satellite and radar data.Meteorol. Appl. 1, 74–84.
Crosby, D.S., Ferraro, R.R., Wu, H., 1995. Estimating the probability of rain in aSSM/I FOV using logistic regression. J. Appl. Met. 34, 2476–2480.
Davis, J.M., John, R.H., 1993. Somewind and instability parameters associatedwith strong and violent tornadoes. Part I: windshear and helicity. In:Church, C., et al. (Ed.), The Tornado: Its Structure, Dynamics, Predictionand Hazards. Geophys. Monogr., vol. 79. American Geophysical Union,pp. 573–582.
Dessens, J., 1995. Severe convective weather in the context of a night-timeglobal warming. Geophys. Res. Lett. 22, 1241–1244.
Dessens, J., Berthet, C., Sánchez, J.L., 2007. A point hailfall classification basedon hailpad measurements: the ANELFA scale. Atmos. Res. 83, 132–139.
Doswell III, C.A., 2003. Societal impacts of severe thunderstorms andtornadoes: lessons learned and implications for Europe. Atmos. Res.67–68, 135–152.
Doswell III, C.A., Schultz, D.M., 2006. On the use of indices and parameters inforecasting severe storms. Electronic J. Severe Storms Meteor. 1, 1–14.
Doswell, C.A., Brooks, H.E., Maddox, R.A., 1996. Flash flood forecasting: aningredients-based methodology. Weather Forecast. 11, 560–581.
Dubrovsky, M., 1994. Probabilistic prediction of thunderstorm occurrence.Meteorol. Zpr. 47, 103–112.
Ebi, K.L., Teisberg, T.J., Kalkstein, L.S., Robinson, L., Weiher, R.F., 2004. Heatwatch/warning systems save lives. Estimated costs and benefits forPhiladelphia 1995–98. Bull. Am. Meteor. Soc. 85, 1067–1073.
Elsner, J.B., Tsonis, A.A., 1992. Non-linear prediction, chaos and noise. Bull.Am. Meteor. Soc. 73, 49–60.
Fraile, R., Berthet, C., Dessens, J., Sánchez, J.L., 2003. Return periods of severehailfalls computed from hailpad data. Atmos. Res. 67–68, 189–202.
Galway, J.G., 1956. The lifted index as a predictor of latent inestability. Bull.Amer. Meteor. Soc. 37, 528–529.
456 J.L. Sánchez et al. / Atmospheric Research 93 (2009) 446–456
García-Ortega, E., López, L., Sánchez, J.L., 2007. Numerical simulation andsensitivity study of a severe hailstorm in northeast Spain. Atmos. Res. 83,225–241.
George, J.J., 1960. Weather Forecasting for Aeronautics. Academic Press,pp. 407–415.
Glahn, H.R., Lowry, D.A., 1972. The use of model output statistics (MOS) inobjective weather forecasting. J. Appl. Meteor. 11, 1203–1211.
Hair, J.F., Anderson, R.E., Tatham, R.L., Black, W.C., 1998. Multivariate DataAnalysis, Fifth edition. Prentice Hall International, Upper Saddle River, NJ.768 pp.
Haklander, A.J., Van Delden, A., 2003. Thunderstorms predictors and theirforecast skill for the Netherlands. Atmos. Res. 67–68, 273–299.
Hosmer, D.W., Lemeshow, S., 1989. Applied logistic regression. John Wiley &Sons, New York. 307 pp.
Hughes, K.K., 2004. Probabilistic lightning forecast guidance for aviation.Reprints AMS 11th Conference on Aviation, Range and Aeroespace,october 2004, Hyannis, MA., 2.6.
Huntrieser, H., Schiesser, H.H., Schmid, W., Waldvogel, A., 1997. Comparisonof traditional and newly developed thunderstorm indices for Switzer-land. Weather Forecast. 12, 108–125.
Jacovides, C.P., Yonetani, T., 1990. An evaluation of stability indices forthunderstorm prediction in greater Cyprus. Weather Forecast. 5, 559–569.
Jefferson, G., 1963. A modified inestability index. Meteorol. Mag. 92, 92–96.Johns, R.H., Doswell III, C.A., 1992. Severe local storms forecasting. Weather
Forecast. 7, 588–612.Johns, R.H., Davies, J.M., Leftwich, P.W., 1990. An examination of the
relationship of the 0–2 km AGL ‘positive’ wind shear to potentialbuoyant energy in strong and violent tornado situations. Preprints. 16thConference on Severe Local Storms. American Meteorological Society,Kananaskis Park, Alberta, pp. 593–598.
Jones, R.H., 1968. A nonlinear model for estimating probabilities of K events.Mon. Weather Rev. 96, 383–384.
Katz, R.W., Murphy, A.H., 1997. Economic value of weather and climateforecasts. Cambridge University Press. 238 pp.
Kleinbaum, D.G., 1994. Logistic regression. Springer Verlag, New York. 282 pp.Lazo, J.K., 2005. Societal impacts and economic benefits of improving short-
rangeweather forecasts. International symposium on nowcasting and veryshort range forecasting (WSN05), Toulouse, France, 5–9 September 2005.
Lazo, J.K. and Chestnut, L.G., 2002: Economic value of current and improvedweather forecats in the U.S. household sector, Office of Policy andStrategic Planning, NOAA. November 2002.
Leston, D., Sutter, D.S., Lazo, J.K., 2007. Economic value of hurricane forecasts:an overview and research needs. Nat. Hazards 8, 78–86.
Litynska, Z., Parfiniewicz, J., Pinkowski, H., 1976. he prediction of air massthunderstorms and hails, Geneva. WMO 450, 128–130.
Llasat-Botija, M.C., Gibergans, J., Guilbaud, S., Rodríguez, J.Y., 1997. The use ofthe vertical thermodynamic data in the daily rain clasification. Applica-tion to the improvement of an analog technique. INM/WMO Interna-tional Symposium on Cyclones and Hazardous Weather in theMediterranean, Palma de Mallorca, pp. 395–402.
Llasat-Botija, M., Llasat-Botija, M.C., López, L., 2007. Natural hazards and thepress in the western Mediterranean region. Adv. Geosci. 12, 81–85.
López, L., Marcos, J.L., Sánchez, J.L., Castro, A., Fraile, R., 2001. CAPE values andhailstorms on North Western Spain. Atmos. Res. 56, 147–160.
López, L., Ortega, E.G., Sánchez, J.L., 2007. A short-term forecastmodel for hail.Atmos. Res. 83, 176–184.
Marinaki, A., Spiliotopoulos, M., Michalopoulou, H., 2006. Evaluation ofatmospheric inestability indices in Greece. Adv. Geosci. 7, 131–135.
McCann, D.W., 1994. WINDEX, a new index for forecasting microburstpotential. Weather Forecast. 9.
McNulty, R.P., 1995. Severe and convective weather: a Central Regionforecasting challenge. Weather Forecast. 10, 187–202.
Miller, R.C., 1975: Notes on analysis and severe storm forecasting procedures ofthe military weather warning center, Technical Report N° 200, AWS, USAF.
Mjelde, V., Hill, H.S., Griffits, J.F., 1998. A review of current evidence on climateforecasts and their economic effects in agriculture. Am. J. Agr. Econ. 80,1089–1095.
Moncrieff, M.W., Green, J.S.A., 1972. The propagation and transfer propertiesof steady convective overturning in shear. Q. J. R. Meteorol. Soc. 98,336–352.
Moncrieff, M.W., Miller, M.J., 1976. A theory of organised steady convectionand its transport properties. Q. J. R. Meteorol. Soc. 102, 373–394.
Murphy, A.H., 1977. The value of climatological, categorical and probabilisticforecasts in the cost-loss ratio situation. Mon.Weather Rev.105, 803–816.
Murphy, A.H., 1994. Assessing the economic value of weather forecasts: anoverview of methods, results and issues. Met. Applications 1, 69–73.
Nicholls, J.M., 1996. Economic and social benefits of climatological informationand services: a review of existing assessments. WMO/TD-N° 780, 38 pp.
Nicholls, N., 2001. Atmospheric and climatic hazards: improved monitoringand prediction for disaster mitigation. Nat. Hazards 23, 137–155.
Rasmussen, E.N., Blanchard, D.O., 1998. A baseline climatology of sounding-derived supercell and tornado forecast parameters. Weather Forecast. 13,1148–1164.
Reuter, G.W., Aktary, N., 1995. Convective and symmetric inestabilities andtheir effects on precipitation: seasonal variations in Central Albertaduring 1990 and 1991. Mon. Weather Rev. 123, 153–162.
Sánchez, J.L., Castro, A., Fraile, R., de la Madrid, J.L., 1991. Some characteristicsof severe storms on León and Zamora (Spain). II International Meeting onAgriculture and Weather Modification. University of León, León, Spain,pp. 1–10.
Sánchez, J.L., Fraile, R., de la Fuente, M.T., Marcos, J.L., 1998. Discriminantanalysis applied to the forecasting of thunderstorms. Met. Atm. Phys. 68,187–195.
Sánchez, J.L., Ortega, E.G., Marcos, J.L., 2001a. Construction and assessment ofa logistic regression model output applied to short-term forecasting ofthunderstorms in León (Spain). Atmos. Res. 56, 57–71.
Sánchez, J.L., Marcos, J.L., Fernández, J.T., Ortega, E.G., 2001b. Criteria forselecting meteorological variables to be used in statistical models for ashort-term forecast of thunderstorms and hailstorms. Symposium onprecipitation extremes: prediction, impacts and reponses, Albuquerque,U.S.A., 14–18 January 2001.
Sánchez, J.L., López, L., Bustos, C., Marcos, J.L., Ortega, E.G., 2007a. Short-termforecast of thunderstorms inArgentina. Atmos. Res. 88, 36–45. doi:10.1016/j.atmosres.2007.09.005.
Sánchez, J.L., Dessens, J., López, L., Berthet, C., 2007b. Characterizing preconvec-tive conditions in southern France to improve ANELFA forecasts. 4thEuropean Conf. On Severe Storms, Trieste, Italy, 10–14 September 2007.
Schmeits, M.J., Kok, K.J., Vogelezang Daan, H.P., 2005. Probabilistic forecastingof (severe) thunderstorms in Netherlands using model output statistics.Weather Forecast. 20, 134–148.
Schultz, P., 1989. Relationships of several stability indices to convectiveweather events in northeast Colorado. Weather Forecast. 4, 73–80.
Showalter, A.K., 1953. A stability index for thunderstorm forecasting. Bull.Am. Meteor. Soc. 34, 250–252.
Takashi, C., Hiroshi, N., 2005. Climatology of environmental parameters formesoscale convections in Japan. J. Met. Soc. Japan 83, 391–408.
Tsonis, A.A., Elsner, J.B., 1989. Chaos, strange atractors, and weather. Bull. Am.Meteor. Soc. 70, 14–23.
Tudurí, E., Ramis, C., 1997. The environments of significant convective eventsin the western Mediterranean. Weather Forecast. 12, 294–306.
Waldvogel, A., Federer, B., Hogl, D., 1981. On the correlation between hailpadand radar data. 19th Conf. On Radar Meteorol. AMS, pp. 493–498.
Weiher, R.F., 2007. Estimating benefits of NMHS services. WMO Conferenceon Social and Economic Benefits of Meteorological Services, Madrid,Spain 19–22 March 2007.
Weisman, M.L., Klemp, J.B., 1982. The dependence of numerically simulatedconvective storms on vertical wind shear and buoyancy. Mon. WeatherRev. 100, 504–520.
Weisman, M.L., Klemp, J.B.,1984. The structure and classification of numericallyconvective storms in directionally varying wind shears. Mon.Weather Rev.112, 2479–2498.
Wilks, D.S., 1991. Representing serial correlation ofmeteorological events andforecasts in dynamic decision-analytic models. Mon. Weather Rev. 119,1640–1662.
Wotjic, L., Ewing, C., 1983. The use of radar to estimate crop damage forhailstorms in Alberta. 21st Conf. on Radar Meteorol. Am. Meteorol. Soc.,pp. 435–441.