Assessing Marketing Performance: Reasons for Metrics Selection
26
Journal of Marketing Management, 2004, 20,475-498 Assessing Marketing Performance: Reasons for Metrics Selection Tim Ambler, London Business School 1 Flora Kokkinaki, University of Patras and Stefano Puntoni, London Business School In recent years both practitioners and academics have shown an increasing interest in the assessment of marketing -performance. This paper explores the metrics that firms select and some reasons for those choices. Our data are drawn from two UK studies. The first reports practitioner usage by the main metrics categories (consumer behaviour and intermediate, trade customer, competitor, accounting and innovativeness). The second considers which individual metrics are seen as the most important and whether that differs by sector. The role of brand equity in performance assessment and top London Business School* management orientations are key considerations. We found consistency between orientation and University of Patras^ metrics. Within these categories we identified 19 metrics that could be regarded as primary and could therefore serve as a short-list for initial selection. However, the sector importantly moderates that selection, not least because competitive benchmarking requires similar metrics to be available. Control, orientation and institutional theories appeared to influence metrics selection and the absence of agency theory is probably due to the research method of this paper. We concluded with some propositions formally to test the basis of metrics selection. Keywords: marketing metrics; performance assessment; brand equity; UK firms. Introduction Practitioners and academics have shown increasing interest in the assessment of marketing performance (Clark 1999; Marketing Week 2001; Schultz 2000; Shaw and Mazur 1997). The Marketing Science Institute has raised marketing metrics to become its leading capital research project (MSI 2002). The marketing performance literature has been criticized for its limited diagnostic power (Day and Wensley 1988), its focus on the short term (Dekimpe and Hanssens 1995, 1999), the excessive number of different measures and the related difficulty of comparison (Ambler and Kokkinaki 1997; Clark 1999); the dependence of the perceived performance on the set of indicators chosen (Murphy, Trailer and Hill 1996); and the lack of attention to shareholder value creation (Doyle 2000). "Perhaps no other concept in marketing's short history has proven as stubbornly resistant to conceptualization, definition, or application as
-
Upload
independent -
Category
Documents
-
view
1 -
download
0
Transcript of Assessing Marketing Performance: Reasons for Metrics Selection
Journal of Marketing Management, 2004, 20,475-498
Assessing Marketing Performance: Reasons for Metrics Selection
Tim Ambler, London Business School 1Flora Kokkinaki, University of Patrasand Stefano Puntoni, London Business School
In recent years both practitioners and academics have shown an increasing interest in theassessment of marketing -performance. This paper explores the metrics that firms select andsome reasons for those choices. Our data are drawn from two UK studies. The first reportspractitioner usage by the main metrics categories (consumer behaviour and intermediate, tradecustomer, competitor, accounting and innovativeness). The second considers which individualmetrics are seen as the most important and whether that differs by sector. The role of brandequity in performance assessment and top
London Business School* management orientations are key considerations. We foundconsistency between orientation and University of Patras^ metrics. Within these categories weidentified 19 metrics that could be regarded as primary and could therefore serve as a short-listfor initial selection. However, the sector importantly moderates that selection, not least becausecompetitive benchmarking requires similar metrics to be available. Control, orientation andinstitutional theories appeared to influence metrics selection and the absence of agency theoryis probably due to the research method of this paper. We concluded with some propositionsformally to test the basis of metrics selection.
Keywords: marketing metrics; performance assessment; brand equity; UK firms.
Introduction Practitioners and academics haveshown increasing interest in theassessment of marketingperformance (Clark 1999; MarketingWeek 2001; Schultz 2000; Shaw andMazur 1997). The MarketingScience Institute has raisedmarketing metrics to become itsleading capital research project(MSI 2002). The marketing performanceliterature has been criticizedfor its limited diagnostic power(Day and Wensley 1988), itsfocus on the short term (Dekimpe
and Hanssens 1995, 1999), theexcessive number of differentmeasures and the relateddifficulty of comparison (Amblerand Kokkinaki 1997; Clark 1999);the dependence of the perceivedperformance on the set ofindicators chosen (Murphy,Trailer and Hill 1996); and thelack of attention to shareholdervalue creation (Doyle 2000)."Perhaps no other concept inmarketing's short history hasproven as stubbornly resistantto conceptualization,definition, or application as

that of marketing performance"(Bonoma and Clark 1988, p. 1).1 Corresponding author: Tim Ambler, LondonBusiness School, London NWl 4SA. Email: [email protected], ph/fax: 020 7262 5050/77241145
ISSN0267-257X/2004/3-4/00475 + 23 £8.00/0 ©Westburn Publishers Ltd.
This paper explores the usage ofmarketing metrics in the UK.Marketing is broadly definedhere as what the whole companydoes to achieve customerpreference and, thereby, its owngoals (Webster 1992).Accordingly, every business hassome interest in assessingmarketing in this sense.Although the usage of marketingmetrics has been increasinglyreported (e.g. Shaw 1998, Ambler2000), this paper focuses on thecategories of marketing metricsand some reasons why metrics arechosen. The theoretic aspects ofthis research area are not, asyet, developed and this paperrepresents a step in thatdirection. First we discuss fourtheoretical perspectives:control, agency, institutionaland orientation theories. Whilethe literature is largely basedon US experience, some crossoverhas taken place (e.g. TheMarketing Leadership Council2001) and transnational, orintra-national come to that,differences seem unlikely toobscure the fundamental issuesof metrics selection. Onerelatively new factor hasemerged in the last decade,namely brand equity (Aaker 1991,1996). The emergence of thisintangible market asset from theshadows has created the need tomeasure it and seems likely tobe a factor in metricsselection. After summarizing thetheoretical background, we
2
present a framework forcategorising metrics. This isused in two empirical studies ofmetrics usage, the first forthose categories and the secondfor individual metrics. After discussion, limitationsand propositions for futureresearch, we draw some finalconclusions.
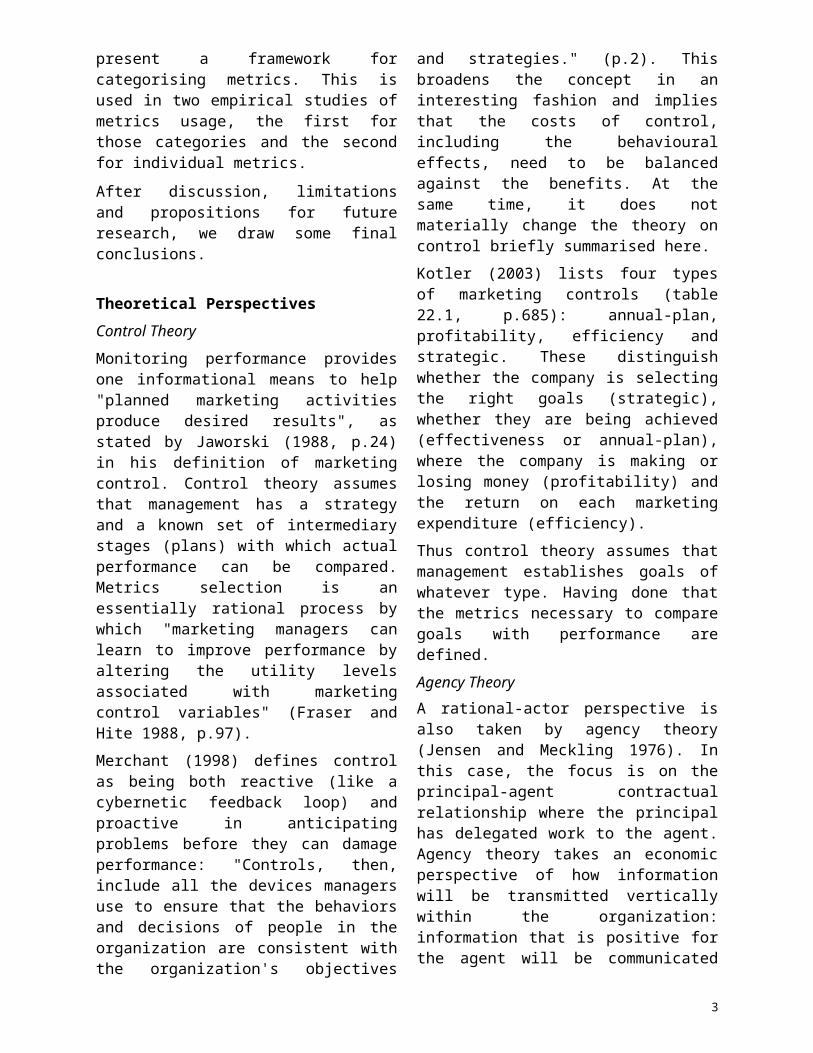
Theoretical Perspectives Control Theory Monitoring performance providesone informational means to help"planned marketing activitiesproduce desired results", asstated by Jaworski (1988, p.24)in his definition of marketingcontrol. Control theory assumesthat management has a strategyand a known set of intermediarystages (plans) with which actualperformance can be compared.Metrics selection is anessentially rational process bywhich "marketing managers canlearn to improve performance byaltering the utility levelsassociated with marketingcontrol variables" (Fraser andHite 1988, p.97). Merchant (1998) defines controlas being both reactive (like acybernetic feedback loop) andproactive in anticipatingproblems before they can damageperformance: "Controls, then,include all the devices managersuse to ensure that the behaviorsand decisions of people in theorganization are consistent withthe organization's objectives
and strategies." (p.2). Thisbroadens the concept in aninteresting fashion and impliesthat the costs of control,including the behaviouraleffects, need to be balancedagainst the benefits. At thesame time, it does notmaterially change the theory oncontrol briefly summarised here.Kotler (2003) lists four typesof marketing controls (table22.1, p.685): annual-plan,profitability, efficiency andstrategic. These distinguishwhether the company is selectingthe right goals (strategic),whether they are being achieved(effectiveness or annual-plan),where the company is making orlosing money (profitability) andthe return on each marketingexpenditure (efficiency). Thus control theory assumes thatmanagement establishes goals ofwhatever type. Having done thatthe metrics necessary to comparegoals with performance aredefined. Agency Theory A rational-actor perspective isalso taken by agency theory(Jensen and Meckling 1976). Inthis case, the focus is on theprincipal-agent contractualrelationship where the principalhas delegated work to the agent.Agency theory takes an economicperspective of how informationwill be transmitted verticallywithin the organization:information that is positive forthe agent will be communicated
3
to the principal to the extentthat the gain obtained from itsdisclosure does not exceed thecosts of obtaining anddisseminating it. This is related to controltheory in that "agency theorylooks at the relative merits ofbehavior-based contracts (...)vis-a-vis outcome-basedcontracts (...) as a means ofefficiently ensuring thefidelity of the agents"(Nilakant and Rao 1994, p.653).The greater the difficulty ofeffectively measuring marketingperformance, the greater shouldbe the efficiency of behavior-based forms of control comparedto outcome-based forms ofcontrol (Fisenhardt 1985). Thisimplies that when it is moredifficult to evaluate marketingresults, more reliance is likelyto be placed on marketingexpenditure controls. It alsoimplies that specialistmarketers are likely to proposemetrics that will justifyprospective expenditure(budgets) and past activities. Institutional Theory Institutional theory (Meyer andRowan 1977) suggests thatorganizational action is mainlydriven by both the culturalvalues and the history of thespecific company, as well as bythose of its industry sector.Accordingly, marketinginformation disclosure to topmanagement can be predicted from"perceptions of legitimatebehavior derived from cultural
values, industry tradition, firmhistory, popular managementfolklore and the like"(Fisenhardt 1988, p.492). Theset of marketing metricsselected by a company thereforeis likely to reflect theintended subjective performance(the indicators the Board isused to seeing) rather thanmeasures independent observersmight consider appropriate.Since corporate cultures evolvewith time, we can expect metricsto similarly adapt as distinctfrom being created from scratch,e.g. by a consultancy project. Success measures can beclassified broadly as eitheraccounting or non-accounting(Frazier and Howell 1982;Buckley et al. 1988). Early workon firm-level measurement ofmarketing performance focused onaccounting measures: profit,sales and cash flow (Sevin 1965,Feder 1965, Day and Fahey 1988).Many authors however highlightedthe problem with using onlyaccounting indicators indetermining marketingperformance (e.g., Bhargava,Dubelaar and Ramaswani 1994;Chakravarthy 1986; Doyle 2000;Eccles 1991). For example,Chakravarthy (1986) argues that:"accounting-measure-of-performance record only thehistory of a firm. Monitoring afirm's strategy requiresmeasures that can also captureits potential for performance inthe future" (p.444). The USInstitute of Management
4

Accountants reported the growinguse of non-financial measures(IMA 1993, 1995, 1996). Clark (1999) showed howtraditional accounting measures(profit, sales, cash flow)expanded to include of non-accounting (market share,quality, customer satisfaction,loyalty, brand equity) measures,as well as wider considerationscovering marketing audit,implementation and orientation.Clark posited that the set ofselected metrics evolvedincrementally, as suggested byinstitutional theory. In recentyears the number and variety ofmeasures available to firms hasrisen significantly (Meyer1998). A literature search infive leading marketing journalsyielded 19 different measures ofmarketing "success", the mostfrequent being sales, marketshare, profit contribution andpurchase intention (Ambler andKokkinaki 1997). Market Orientation The literature on marketorientation and corporateculture takes a similar view inthat the concept of marketingadopted within an organizationinfluences the measurementsystem implemented fordetermining performance (Moorman1995; Jaworski 1988; Webster1992). The extent to which topmanagement is interested inassessing marketing, or marketperformance, depends on theextent to which they are market-oriented (Day 1994; Jaworski and
Kohli 1993; Kohli and Jaworski1990; Narver and Slater 1990)because market-driven firms needto gather and disseminate marketintelligence within theorganization (Kohli and Jaworski1990; Morgan, Katsikeas andAppiah-Adu 1998; Slater andNarver 1995). As a consequence,one of the main features of amarket-oriented organizationalculture is the presence oforganization-wide norms formarket orientation (Homburg andPflesser 2000). These norms willshape in turn the dynamics ofinformation disclosure to thetop management as well as thecontent of such information. Institutional theory and theconcept of market orientationare related because, as arguedby Dobni and Luffman (2000),"organizations with similarmarket orientations have atendency or aptitude to engagein similar strategies when inthe same industry, and the typesof strategy chosen are relatedto the operational behaviorsmanifesting a marketorientation" (p.9O9). Brand Equity Brand equity (Aaker 1991; 1996)is a widely used term for theintangible marketing asset.Srivastava and Shocker (1991)define brand equity as "a set ofassociations and behaviors onthe part of a brand's customers,channel members and parentcorporation that permits thebrand to earn greater volume orgreater margins than it could
5

without the brand name and thatgives a strong, sustainable anddifferential advantage" (p.5). Brand equity may be measuredfinancially (cf. Egan andGuilding 1994; Simon andSullivan 1993) and/or non-financially (cf., e.g., Agarwaland Rao 1996; Keller 1993,1998). We treat financialmeasures synonymously withaccounting measures, i.e. theyare expressed in currency or asratios of currency values. Onthe other hand, we distinguishbetween brand equity (theintangible asset) and brandvaluation (the financial worthof that asset). As brands areautonomous units for marketingmeasurement purposes, multi-brand companies, if they areassessing their brand equitiesat all, would need to assesseach brand separately. For the purposes of this paper,we envisage the increasingrecognition of brand equity ascreating the need for measuresof those assets. Framework for CategorisingMetrics Control theory looks toencouraging behaviour whichleads to the achievement ofgoals and these include, but arenot limited to, the financialbottom line. The simplestframework would simply include acategory for the marketingactions and expenditures(inputs) and the profits andcash flow (outputs). Inpractice, those links are not
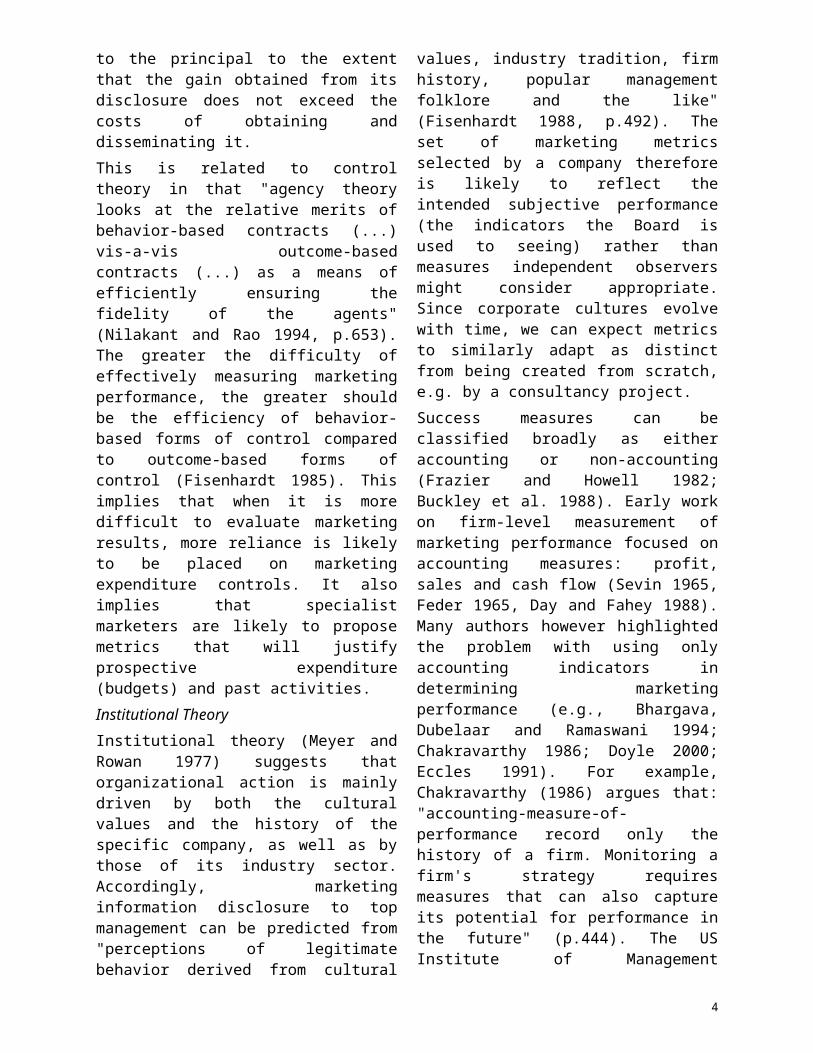
always clear and marketing planswill have two stages in between:the "intermediate" measures andconsumer behaviours, such aspurchases and loyalty.Intermediate measures are ofcustomer memories be theyattitudes, intentions, awarenessor other cognitive or affectiveor experiential brand-linkedcharacteristics. Thus controltheory works backwards: if thelinks to financial results areunclear, consider the links withbehaviours. If those are alsounclear, consider the links withintermediate measures and thenthose with behaviours and thenthose with financial results. Market-oriented companies willconsider the links in thereverse order: consumers firstand then financial results butthe categories are the sameexcept that competition will bemore carefully considered.Simmonds (1986b) pointed outthat traditional financialaccounting fails to giveattention to competitive factorsand proposes that thecompetitors be tracked oncomparable measures such assales and profits. Figure 1 shows how these fourcategories of metrics linktogether. Brand equity consistsof the elements from inputsonwards which have not yetmaterialized as sales revenue.Ambler (2000) describes brandequity as the reservoir of cashflow that has been earned bygood marketing but has yet to
6
materialise as sales or profits.Although brand equity, asdefined above, arguably lies inthe heads of customers and otherstakeholders, the difficulty ofmeasuring neural effects leadsacademics and practitioners touse proxies, such as inputs andbehaviour, to infer what liesbetween. Figure 1 shows only onegeneric "brain" but in practicebrand equity is measured foreach segment separatelyconsidered by management andtypically distinguishesimmediate trade customers fromend users. Although competition, forconceptual purposes, is shown asan input, competitive metricsarise in all categories and areusually expressed as relativemeasures, e.g. market share,share of category requirements(loyalty). Thus Figure 1 provides theframework for the categories ofmetrics considered in the firststudy: Own inputs (marketing
activities). Intermediate measures of
memory (e.g. awareness and usage satisfaction, and attitudes).
Behaviours. Competitive measures. Financial outcomes.
Figure 1. Metrics CategoriesFinally we need to considerperformance. The paper assumesthat performance, in some sense,influences the selection ofmetrics ("what you measure iswhat you get"). Swartz, Hardie,Gray son and Ambler (1996)concluded that marketingactivities broadly achievedplanned performance but thereturn on marketing investmentcould not be compared acrosscompanies because theirperformance intentions differed.In the two studies below,performance was first based onhow they were seen bycompetitors and self-rating ofsuccess relative others in theirsector. The second study alsoused self-ratings but acrossfour variables: relative toplan, to previous year's sales,to competitors and overall.These variables emerged from theempirical work. Empirical Analysis of CurrentPractice The exploration of howpractitioners viewed metricsoccupied two studies. The firstgrouped metrics into categories
7

and asked the basis forcomparison, e.g. plan (controltheory) or competition (marketorientation). Then we exploredhow widely brand equity was usedas a concept and how it wasmeasured. Finally we looked atwhether orientation would beassociated with the frequency ofuse or importance of competitoror customer metrics. The second study switched focusfrom the categories, inevitablya somewhat arbitrary grouping,to the metrics themselves. Wesought the metrics perceived asmost important and how theirselection varied by businesssector. Study 1 Method Forty-four in-depth interviewswere conducted with seniormarketing and finance managersfrom 24 UK firms in order not torestrict the perspective to themarketers (Homburg et al. 1999).The issues addressed included:the type of measures collected,the level of review of thesemeasures (e.g. marketingdepartment. Board), theassessment of the marketingasset, planning andbenchmarking, practitioners'satisfaction with theirmeasurement processes and theirviews on measurement aspectsthat call for improvement, andfirm orientation. Information onfirm characteristics, such assize and sector, was alsoobtained. Data were collected
face-to-face and each interviewwas recorded for subsequentanalysis. After the first 10interviews minor changes weremade to the interview guide forclarification and to reduceinterview length. Somerespondents took the opportunityto brief us widely about theircompanies. The pilot broadly confirmed thevalidity of the five categoriesabove although respondentspreferred to put allfinancial/accounting andcompetitive measures intoseparate categories, i.e. notjust competitive inputs andfinancial outputs. In practice,since most of the inputs werefinancial metrics, this removedthe "own inputs" category. Non-retail respondents alsodistinguished immediate (trade)customers from end-users orconsumers. They used a separatecategory to monitor innovation.Thus we were left with sixcategories: consumerintermediate and behaviour,trade customer, competitive,innovativeness and accounting(inputs and outputs). Thesechanges became obvious after thefirst 10 interviews and, aftermaking the changes, thecategories were not challengedin the subsequent 34. Thecategories may not seem strictlylogical to an outsider but wewere seeking to understand howpractitioners grouped theirmetrics. The pilot stage was also used to
8

refine the survey instrumentthat was sent to 1014 marketingand 1180 finance seniorexecutives in the UK, recruitedthrough two professional bodies(The Marketing Society and theInstitute of CharteredAccountants in England andWales). A total of 531questionnaires were returned(367 from marketers and 164 fromfinance officers, response rates36 percent and 14 percent,
respectively). Table 1 presentsa description of the sample. Toencourage response, given thesensitive nature of thisinformation, the returns wereanonymous so we were unable tocheck back for missing values.The majority of the "other"category is probably explainedby large companies operating inmore than one sector, e.g. highstreet banks are both retail andB2B.
Table 1. Respondents by Business Size and Sector (Study 1)
(# employees) Retail
Consumer goods
Consumer
services
B2Bgoods
B2Bservices Other Total
Small (<110)
8 7 14 6 44 32 111
Medium (<500)
8 13 6 7 21 12 67
Large (>50G)
51 111 38 30 38 11 345
Missing values
8
Total 67 131 58 43 103 121 531
Respondents were asked toindicate the importance attachedto the different measurementcategories by top management ona 7-point scale anchored by veryimportant / very unimportant.They were also asked to reporthow regularly data are collectedfor each measure category andthe benchmark against which eachmeasure category is compared(previous year,marketing/business plan, totalcategory data, specificcompetitors, other units in thegroup).
Respondents were then askedwhether they have a term for themain intangible asset built bythe firm's marketing efforts andwhether this asset is formallyand regularly tracked, throughfinancial valuation or othermeasures. Customer andcompetitor orientation weremeasured with eight 7pointscales drawn from Narver andSlater (1990). Separate singleindices of customer andcompetitor orientation werecomputed as the mean ofresponses to these items
9

(Cronbach's alpha .81 and .69,respectively).
10
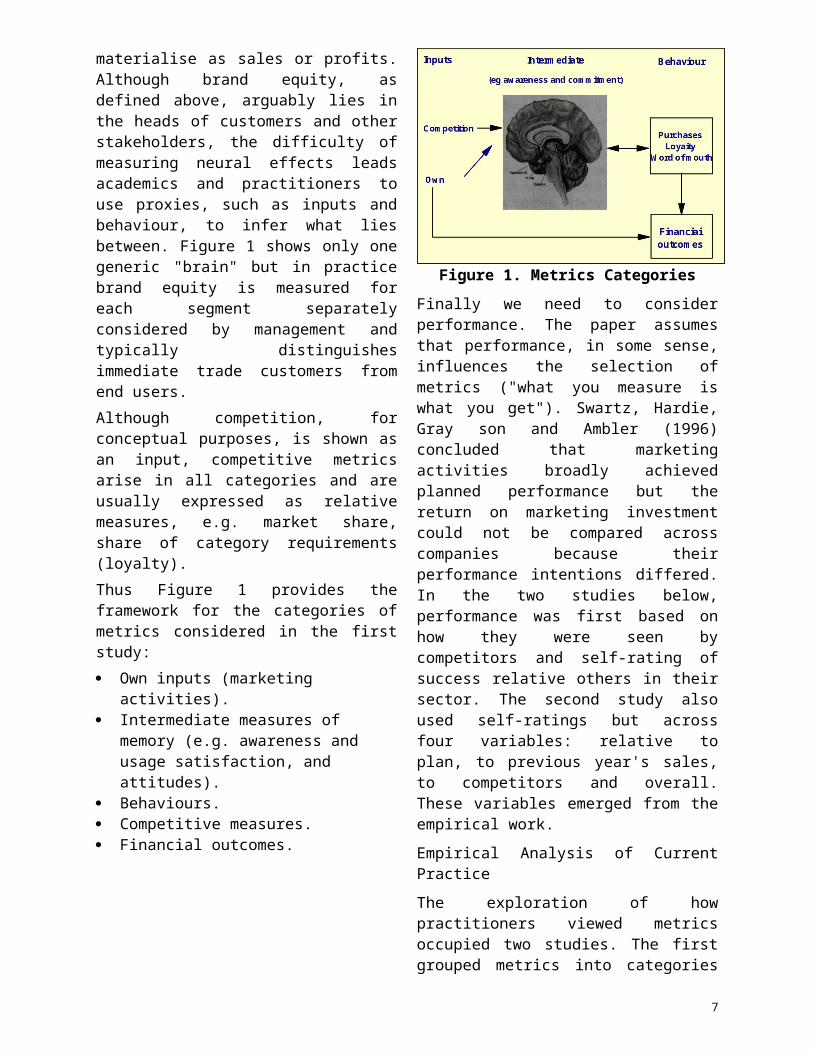
Results As shown by Table 2, accountingmeasures were reported as beingseen by top management assignificantly more importantthan all other categories. Thet-tests comparing the importanceof accounting measures withother categories were allsignificant (p< 0.001). However,the differences between customerand competitive measures weresmall.
Apart from a slightly greaterconcern with innovation bymarketers, there were nosignificant differences betweenthe importance attributed toeach metric category bymarketers and financerespondents (note that bothmarketers and financerespondents were asked to reportthe importance attached by topmanagement). Moreover, therewere no significant differencesin measurement categoryimportance between differentbusiness sectors.
Table 2. Importance of Measure Categories for Assessing Performance(Overall)
Mean t df Sig.Financial 6.51Direct customer 5.53 -
14.90
499 .000
Competitive 5.42 -16.78
523 .000
Consumer intermediate 5.42 -15.60
515 .000
Consumer behaviour 5.38 -15.60
522 .000
Innovativeness 5.04 20.13
524 .000
Note. t- tests refer to the comparisons between financial measures and each of the other categories.
Irrespective of the importanceattached to differentindicators, accounting measureswere more frequently collectedthan any other category (74.9percent of the sample reportedthat accounting measures werecollected at least on a monthlybasis). In 33.5 percent of the
cases, consumer intermediatemeasures were collected onlyrarely/ad hoc. Innovativeness,which some see as the lifebloodof marketing (e.g. Simmonds1986a), is least regularlymeasured (55 percent of firmsmeasure innovativeness rarely ornever).
11

Larger firms, as might beexpected, measure mostcategories more frequently thansmaller firms (p<0.01 forcategories exceptinnovativeness). Similarly,business sector was found tohave a significant effect on thefrequency of data collection,with the exception ofinnovativeness. Closer
inspection of mean frequency perbusiness sector, however, didnot reveal any systematicdifferences across sectors. Onaverage, irrespective of measurecategory, consumer goods andretail firms tend to collectdata more frequently than othersectors (F (5, 512) = 11.81, p< .001).
Table 3. Frequency of Benchmarks Used (valid percent) where measurecategory used)
Previousyear
MarketingBusinessPlan
Totalcategorydata
Specificcompetitor
(s)
Other unitsin theGroup
Accounting measures
80.4 85.1 17.5 23.0 22.0
Competitive 51.4 51.0 35.8 55.7 6.6Consumer behaviour
47,1 42.0 27.1 31.6 6.4
Consumer intermediate
36.7 30.3 22.0 27.7 5.1
Direct customer 40.3 37.7 17.3 22.8 7.3Innovativeness 21.3 33.7 10.9 20.7 6.6
Metrics Comparisons
Plans provided the most frequentbenchmarks of accounting andinnovativeness measures, wheresuch measures are used (Table3). Competitive measures,however, were compared withmarket research rather thanforecast in plans. Consumer anddirect customer measures weremost typically compared withprevious year results. Marketshare apart, it appears thatinternal (plan) and externalbenchmarks were routinely usedonly by the minority ofrespondent firms. The modalfrequency for each row is
highlighted in the table. Brand Equity Moving now to the marketingasset, 62.2 percent of therespondents reported the use ofsome term to describe theconcept. The most common termswere brand equity (32.5 percentof those who reported a term),reputation (19.6 percent), brandstrength (8.8 percent), brandvalue (8.2 percent) and brandhealth (6.9 percent). Twentypercent of those who used a termreported one or more of 65different terms, such as brandintegrity, customer loyalty,global image, quality, contact
12

base and trademark value. 24.9 percent of the total sampleregularly (yearly or more)valued the marketing assetfinancially, and 41 percent
regularly quantified it in otherways, e.g. throughcustomer/consumer based measures(see Table 4). Less than 15percent of the total sample didboth.
Table 4. Regularity of Tracking the Marketing Asset (valid percentof the total sample)
Never
Rarely/ Adhoc
Regularly Yearly/Quarterly
Monthly ormore
Financial valuation
51.4 23.6 16.9 8.0
Other measures
36.8 22.2 28.7 12.3
Our theoretical discussionsuggested that the marketingperformance assessment systemcan be tested against threecriteria: benchmarking againstinternal expectations (plan) andexternal (competitor)performance, adjusted by changesin brand equity. Of the 196respondents who reportedquantifying their marketingassets (either financiallyand/or in other ways), 24
percent also quantify consumer,competitive or direct customermeasures in their business plan(internal) and use market orcompetitive benchmarks. Thus, onthis survey, less than onequarter of firms could meet allthree criteria. Of course, thesedata merely indicate that theyhave the measures available forsuch comparisons, not that theynecessarily make suchcomparisons.
Table 5. Regression of Regularity of Tracking on Customer and Competitor Orientation
CustomerOrientation
CompetitorOrientation
F R R2 beta t beta tAccounting 210.40**
*.27 .07 .03 .83 .05 1.13
Competitive 39.17*** .48 .23 .03 .81 .22 5.31***
Consumer behaviour
11.14*** .28 .08 .18 3.78*** .07 1.50
Consumer intermediate
12.07*** .31 .09 .23 4.88*** .00 .16
Direct customer 8.53*** .26 .07 .16 3.29*** .00 .04Innovativeness 9.01*** .26 .07 .24 5.05*** .03 .71***p < .001
13
Market Orientation
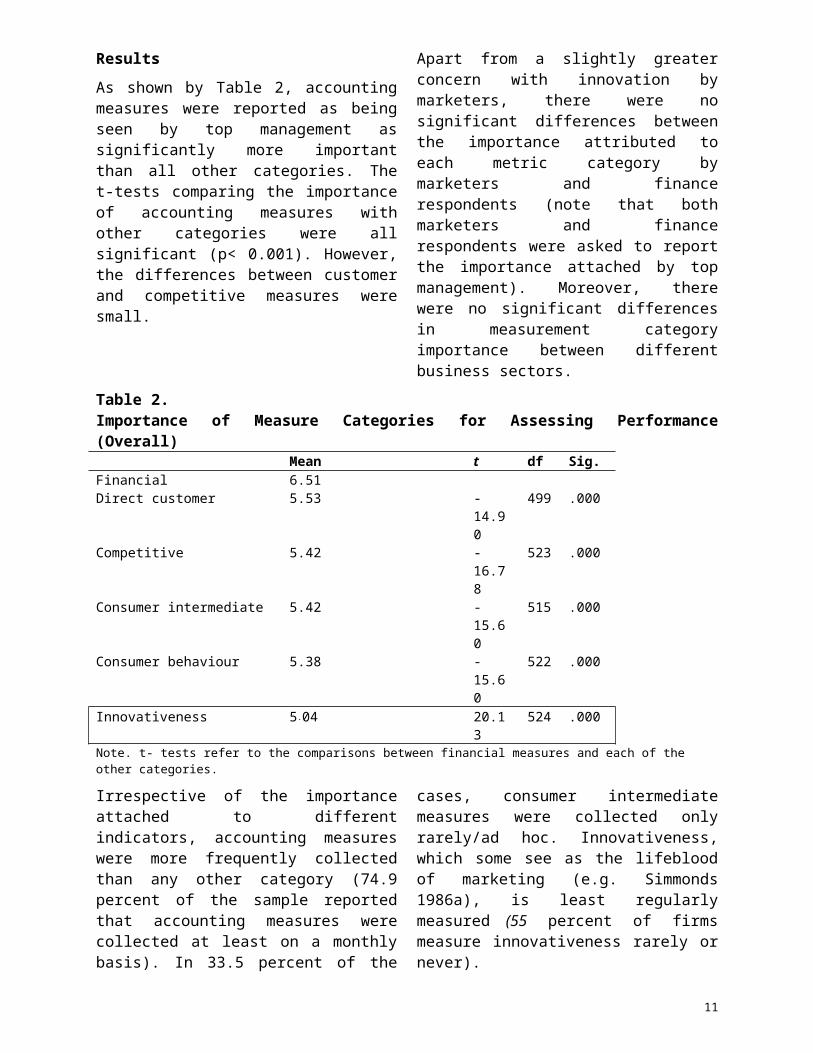
In order to examine whethercustomer and competitororientation have an effect onperformance assessmentpractices, regularity oftracking and importance attachedto different measures wereregressed simultaneously onthese constructs, afterpartialling out the effect offirm size and sector. As can beseen in Table 5, customerorientation was stronglyassociated only with the
regularity of collection ofconsumer, direct customer andinnovativeness measures. Asmight be expected, morecustomer-oriented firms tendedto collect data on such measuresmore frequently than firms lessso oriented. Customer orientationdoes not seem to be related tothe regularity of tracking ofaccounting and competitivemeasures, whereas the regularityof collection of competitormeasures was found to be relatedto the level of competitororientation.
Table 6. Regression of Measure Category Importance on Customer and Competitor Orientation
CustomerOrientation
CompetitorOrientation
F R R2 beta t beta tAccounting 4.86*** .19 .00 .10 2.19* .03 .71Competitive 27.88*** .42 .18 .05 1.30 .26 6.03***Consumer behaviour
19.05*** .36 .13 .25 5.64*** .16 3.57***
Consumer intermediate
21.45*** .38 .14 .30 6.68*** .09 2.18*
Direct customer 9.40*** .26 .07 .22 4.67*** .07 1.62Innovativeness 9.80*** .26 .07 .20 4 29*** .10 2.32*
14
The relation between orientationand measure importance is lessclear (Table 6). Customerorientation was positivelyrelated with the importanceattached to most measures exceptcompetitive measures, althoughthe correlation with accountingmeasures was relatively weak.Competitor orientation stronglycorrelated with the importanceof competitor and consumerbehaviour measures and lessrobustly with intermediate andinnovative measures. Both customer and competitororientation were significantlyassociated with assessmentpractice. No moderating effectsby sector were observed, butfirm size appeared to moderatethe importance attached tomeasures. The results indicate that customerorientation is a strongerpredictor of the importance ofcompetitive measures for largefirms, compared to small firms{beta of the interaction term= .50, t = 2.60, p < .01). However,competitor orientation was found tobe a stronger predictor ofimportance for small firms,compared to large firms {beta ofthe interaction term = -.46, t =-2.57, p < .01). We have no simpleexplanation for these results.It is possible that larger UKfirms need to be more customer-oriented in order to beeffective, perhaps because theyalready are competitor oriented.In contrast, in the case ofsmaller UK firms, competitor
orientation seems to be moreimportant, perhaps because theyalready are customer oriented. Study 2 Up to this point, we haveexplored practitioner usagebased on the metric categoriesfirst identified in theframework and revised in thepilot stage of Study 1. The nextstep was therefore to perform astudy specifically aimed atdesigning a list of mostfrequently used metrics.Providing useful indications tomanagers and stimulating furtheracademic research, suchendeavour was thought to beimportant for a completeunderstanding of currentpractice in the area ofmarketing performanceassessment. In particular, whilewe expected to find widevariation by sector and firm, weexplored the extent to whichcertain metrics stood out asmore valuable, or at least morewidely used, than others. Method An initial survey instrumentwith 54 metrics was developed,using the relevant literature,and piloted to establish anyadditional measures and toeliminate those measures thatwere not used or were redundant.No additions were made but 16were eliminated. The resulting38 measures were classified intothe six categories describedabove. A telephone survey was thenconducted with 200 UK marketing

or finance senior executivesdrawn from the lists supplied byThe Marketing Society and TheInstitute of CharteredAccountants in England andWales. In both cases, onlysenior practitioners wereselected. The acceptance levelfor the telephone interviews,i.e. response level, was 50.1percent. This excludes wrongnumbers and other technicalblockages. Since the surveyinstrument was not materiallyaltered by the pilot stage (theeliminated metrics had been leftblank) we added the responses ofthe 31 executives whoparticipated in the Study 2pilot. Respondents were asked toindicate the importance of each
measure for assessing theoverall marketing performance ofthe business on a 5-point scale.They were also asked to indicatethe highest level of routinereview of this metric within thefirm, on a scale ranging fromthe [group's] top board level(5) through junior marketing (1)to not used at all (0).Respondents were also asked toadd any relevant measures notlisted. Contextual data were alsocollected in order to determinethe impact of environmentalfactors such as firm size,business sector, organizationstructure, and age of business.Table 7 shows a broad spreadacross firm size and sector.
Table 7. Respondents by Structure and Sector (Study 2)
# EmployeesRetail
Consumergoods
ConsumerServices
B2Bgoods
B2BService
sOther
Total
One unit without marketing dept
4 4 17 4 23 9 46
One unit with marketing dept
5 7 6 11 15 6 50
Subsidiaries with one board
7 8 5 11 13 5 49
More complex 6 13 10 15 15 25 84Missing values 32 23 41 66 2 2Total 22 47 231

The great majority of the firmshad been in business for morethan five years and thereforehave reporting systems that haveevolved beyond the start-upphase and to that extent becomeestablished. As was the case inStudy 1, the principle reasonfor the companies not attributedto any sector is due to large
firms that trade in more thanone sector. Results
Table 8 ranks the top 15 (> 62percent usage) metrics byfrequency of use compared withthe frequency that it was ratedas "very important" and thefrequency that it reached thetop level of management.
Table 8. Ranking of Marketing Metrics
Metric
%claimingto usemeasure
% firmsrating as
veryimportant
% claimedto reachtop level
PearsonCorrelationbetweenLevel andImportance
1. Profit/Profitability 92 80 71 .729**2. Sales, Value and/or
Volume91 71 65 .758**
3. Gross Margin 81 66 58 .827**4. Awareness 78 28 29 .732**5. Market Share (Volume or
Value)78 37 34 .727**
6. Number of New Products 73 18 19 .859**7. Relative Price
(SOMValue/Volume)70 36 33 .735**
8. Number of Consumer Complaints (Level of dissatisfaction)
69 45 31 .802**
9. Consumer Satisfaction 68 48 37 .815**10. Distribution/
Availability66 18 11 .900**
11. Total Number of Customers
66 24 23 .812**
12. Marketing Spend 65 39 46 .849**13. Perceived
Quality/esteem64 37 32 .783**
14. Loyalty/Retention 64 47 34 .830**15. Relative perceived
quality63. 39 30 .814**
n = 231, ** p < .01 The last column of Table 8highlights the expectedcorrelation between the measurebeing seen as very important andits review by the top management
level. Business sector was foundto have a significant effect onthe usage of specific items,particularly consumerintermediate, competitive and
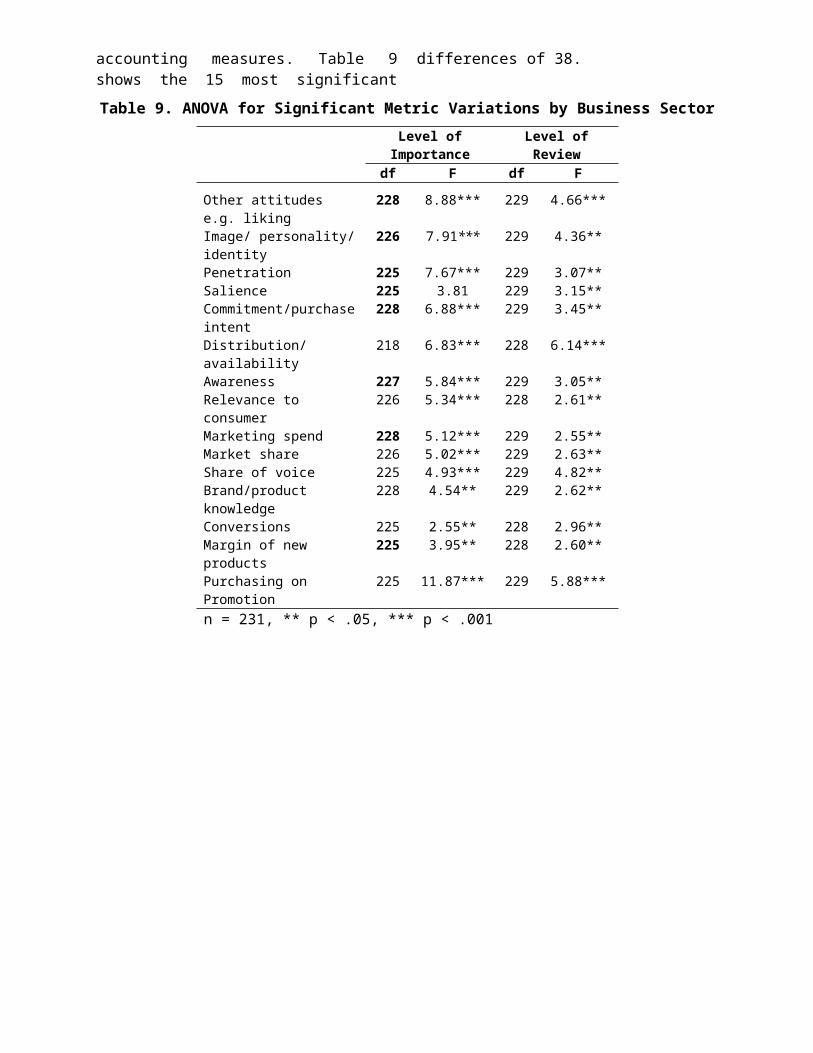
accounting measures. Table 9shows the 15 most significant
differences of 38.
Table 9. ANOVA for Significant Metric Variations by Business SectorLevel ofImportance
Level ofReview
df F df FOther attitudes e.g. liking
228 8.88*** 229 4.66***
Image/ personality/identity
226 7.91*** 229 4.36**
Penetration 225 7.67*** 229 3.07**Salience 225 3.81 229 3.15**Commitment/purchaseintent
228 6.88*** 229 3.45**
Distribution/ availability
218 6.83*** 228 6.14***
Awareness 227 5.84*** 229 3.05**Relevance to consumer
226 5.34*** 228 2.61**
Marketing spend 228 5.12*** 229 2.55**Market share 226 5.02*** 229 2.63**Share of voice 225 4.93*** 229 4.82**Brand/product knowledge
228 4.54** 229 2.62**
Conversions 225 2.55** 228 2.96**Margin of new products
225 3.95** 228 2.60**
Purchasing on Promotion
225 11.87*** 229 5.88***
n = 231, ** p < .05, *** p < .001
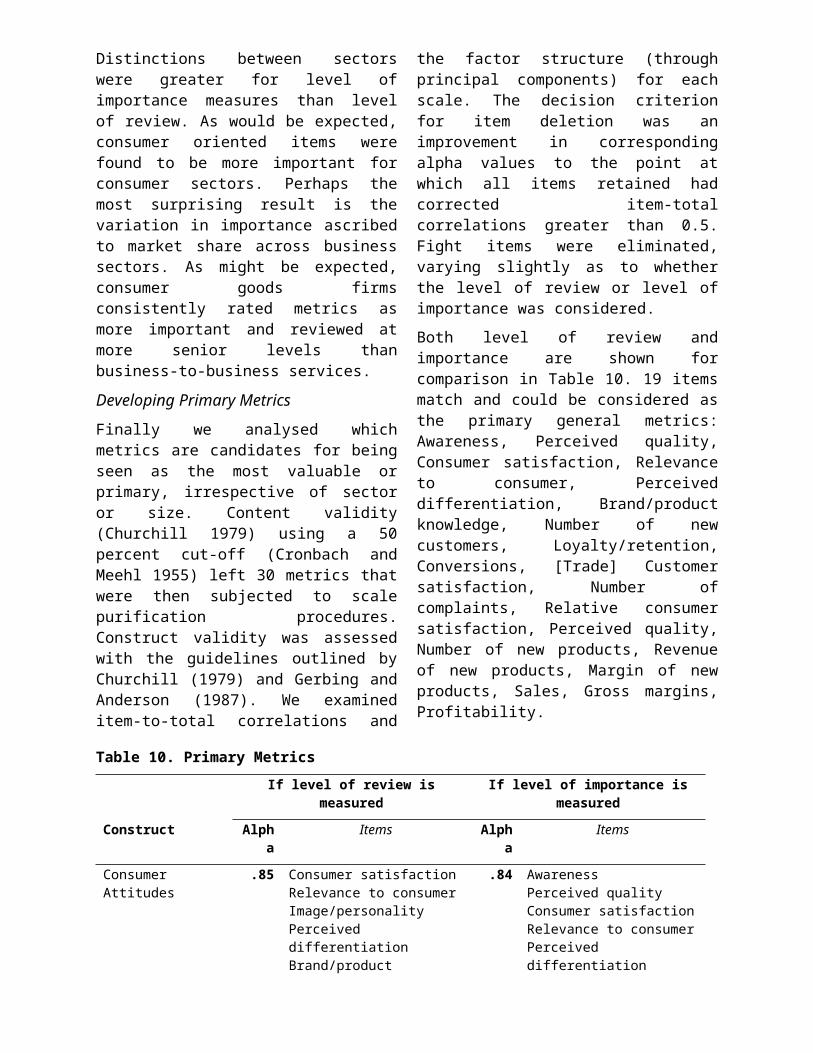
Distinctions between sectorswere greater for level ofimportance measures than levelof review. As would be expected,consumer oriented items werefound to be more important forconsumer sectors. Perhaps themost surprising result is thevariation in importance ascribedto market share across businesssectors. As might be expected,consumer goods firmsconsistently rated metrics asmore important and reviewed atmore senior levels thanbusiness-to-business services. Developing Primary Metrics Finally we analysed whichmetrics are candidates for beingseen as the most valuable orprimary, irrespective of sectoror size. Content validity(Churchill 1979) using a 50percent cut-off (Cronbach andMeehl 1955) left 30 metrics thatwere then subjected to scalepurification procedures.Construct validity was assessedwith the guidelines outlined byChurchill (1979) and Gerbing andAnderson (1987). We examineditem-to-total correlations and
the factor structure (throughprincipal components) for eachscale. The decision criterionfor item deletion was animprovement in correspondingalpha values to the point atwhich all items retained hadcorrected item-totalcorrelations greater than 0.5.Fight items were eliminated,varying slightly as to whetherthe level of review or level ofimportance was considered. Both level of review andimportance are shown forcomparison in Table 10. 19 itemsmatch and could be considered asthe primary general metrics:Awareness, Perceived quality,Consumer satisfaction, Relevanceto consumer, Perceiveddifferentiation, Brand/productknowledge, Number of newcustomers, Loyalty/retention,Conversions, [Trade] Customersatisfaction, Number ofcomplaints, Relative consumersatisfaction, Perceived quality,Number of new products, Revenueof new products, Margin of newproducts, Sales, Gross margins,Profitability.
Table 10. Primary Metrics If level of review is
measuredIf level of importance is
measuredConstruct Alph
aItems Alph
a Items
Consumer Attitudes
.85 Consumer satisfactionRelevance to consumerImage/personalityPerceived differentiationBrand/product
.84 Awareness Perceived quality Consumer satisfactionRelevance to consumerPerceived differentiation

knowledge Brand/product knowledge
Consumer Behaviour
.78 Total number of consumersNumber of new consumers Loyalty/retentionConversionsNumber of consumer complaints
.83 Number of new consumers LoyaltyLeads generatedConversions
Trade Customer .80 Customer satisfactionNumber of complaints
.79 Distribution/ availability Customer satisfactionNumber of customer complaints
Relative to Competitor
.79 Relative consumer satisfaction Perceived quality
.80 Relative consumer satisfactionPerceived quality Share of voice
Innovation .84 Number of new products Revenue of new products Margin of new products
.81 Number of new products Revenue of new productsMargin of new products
Accounting .81 Sales Gross margins Profitability
.77 Sales Gross margins Profitability
TOTAL : 22 items TOTAL: 22 items
n = 231

Discussion The primacy of accountingmetrics, both in terms ofimportance attributed by therespondents and of regularity ofassessment, is consistent withthe literature (e.g. Clark1999). We were surprised by therelatively low levels reportedfor basics such as sales andprofitability. Every board mustsee these figures as part oftheir financial accounts but therespondents here were reportingon what they perceive to bemarketing. The role of"marketing" varies widely acrossUK companies (Ambler 2000). In our analysis, brand equitycan provide the bridge betweenshort- and the long-term effectsas regarded important by Dekimpeand Hanssens (1995). Although asubstantial proportion of ourrespondents were measuring brandequity financially or non-financially, it seems likelythat a formal (control theory)process rarely meets all threemarketing performance assessmentcriteria above, i.e. internaland external benchmarkingadjusted by any change in brandequity. Less than 25 percent ofour respondents had the data todo so. Orientation was consistent withmetrics usage as shown forregularity and importance(Tables 5 and 6 respectively). Thus we found some support forcontrol, institutional (sectordifferences) and orientation
theories in the selection ofmetrics but little support foragency theory. This last wouldrequire analysis of theinteractions between the Boardand junior levels of the firm,notably in respect of budgetapprovals. From the literatureand the two studies, we canadvance some propositions abouthow metrics are adopted withsome implications for the waythey should be. P1: Strongly control oriented
top management will reviewthose metrics projected inthe marketing plan. Apartfrom accounting measures, wefound that between a thirdand one half of measures werecompared to plan but weexpect that to be moderatedby control orientation.
P2: Following institutionaltheory, metrics will evolvea-rationally in conformitywith sector norms. We do notexpect that firms can providerational explanations for themetrics they adopt.
P3: Following orientationtheory, metrics selectionwill reflect the primaryinterests of top management,e.g. customer, competitor orinternal accounting measures.
P4: Agency theory will provideexplanation of metricsselection only in the contextof budget negotiation andsubsequent inter-levelevaluation of performance.
Limitations and Future Research

Our findings are limited inseveral respects. First theresearch, as with other survey-based methods, does not capturecausality nor the dynamics ofthe development of measurement,orientation and performance. Infuture research linking metricsselection with performance, itmay be important to distinguishthe types of performance soughtby management rather than builda signal performance construct,i.e. do companies, in fact, getwhat they measure? We examined the potentialeffects of size and sector, butwe did not consider externalenvironmental effects. Marketturbulence, for example, maymoderate metrics selection andtheir value (Greenley 1995,Harris 2001). Although we used the literaturefrom elsewhere, notably the US,the empirical work was conductedin the UK. It is likely thatthere are variationsinternationally in metricsselection, not least because themetrics available from supplierswill differ in other countries.It would be more interesting toexplore what, if any,theoretical differences exist.Finally, the whole area oflinking non-financial marketmeasures to financial outcomes,such as shareholder value, hasbarely been explored. Conclusions This paper has contributed twoexploratory UK studies to the
increasing interest in theassessment of marketingperformance. Accounting remainsthe dominant metrics categoryrelative to consumer behaviourand intermediate, tradecustomer, competitor, andinnovativeness. Brand equity iswidely measured but rarelyintegrated into a formalassessment system. We foundconsistency between orientationand metrics. Within thesecategories we identified 19metrics that could be regardedas primary and could thereforeserve as a short-list forinitial selection. However, thesector importantly moderatesthat selection, not leastbecause competitive benchmarkingrequires similar metrics to beavailable. Control, orientationand institutional theoriesappeared to influence metricsselection and the absence ofagency theory is probably due tothe research method of thispaper. We concluded with somepropositions formally to testthe basis of metrics selection.
Acknowledgements
We are grateful to Debra Riley whoconducted much of the earlier research andto The Marketing Society, The MarketingCouncil, Institute for Practitioners inAdvertising, Sales Promotions ConsultantsAssociation, London Business School andMarketing Science Institute for sponsoringthis research.
References Aaker, David A. (1991), Managing Brand Equity,
New York, Free Press Aaker, David A. (1996), Building Strong Brands,

New York, Free Press Agarwal, Manoj K. and Rao, Vithala R.
(1996), "An Empirical Comparison of Consumer-Based Measures of Brand Equity", Marketing Letters, Vol.7, No.3, pp.237-247
Ambler, Tim (2000), Marketing and the Bottom Line: The New Metrics of Corporate Wealth, London, Prentice Hall/Financial Times
Ambler, Tim and Kokkinaki, Flora (1997), "Measures of Marketing Success", Journal of Marketing Management, Vol.13, pp.665-678
Bhargava, Mukesh, Dubelaar, Chris and Ramaswami, Sridhar (1994), "Reconciling Diverse Measures of Performance: A Conceptual Framework and Test of a Methodology", Journal of Business Research, Vol.31, pp.235-246
Bonoma, Thomas V. and Clark, Bruce H. (1988), Marketing Performance Assessment, Boston, Harvard Business School Press
Buckley, Ronald, Hall, Sid, Benson, Philip G. and Buckley, M. (1988), "The Impact of Rating Scale Format on Rater Accuracy: An Evaluation", Journal of Management, Vol.14, No.3, pp.415-423
Chakravarthy, Balaji S. (1986), "Measuring Strategic Performance", Strategic Management Journal, Vol.7, pp.437-458
Churchill, Gilbert A. Jr. (1979), "A Paradigm for Developing Better Measures of Marketing Constructs", Journal of Marketing Research, Vol.16, No. 1, pp.64-73.
Clark, Bruce H. (1999), "Marketing Performance Measures: History and Interrelationships", Journal of Marketing Management, Vol.15, pp.711-732
Cronbach, L.J. and Meehl, P.F. (1955), "Construct Validity in Psychological Tests", Psychological Bulletin, Vol.52, pp.281-302
Day, George S. (1994), "The Capabilities of Market Driven Organizations", Journal of Marketing, 58, No.4, pp.37-52
Day, George S. and Fahey, Liam (1988), "Valuing Market Strategies", Journal of Marketing, Vol.52 No.3, pp.45-57
Day, George S. and Wensley, Robin (1988), "Assessing Advantage: A Framework for Diagnosing Competitive Superiority", Journal of Marketing, Vol.52, No.2, pp.1-20
Dekimpe, Marruk G. and Hanssens, Dominique M. (1995), "The Persistence of MarketingEffects on Sales", Marketing Science, Vol.14, No. 1, pp.1-21
Dekimpe, Marnik G. and Hanssens, Dominique M. (1999), "Sustained Spending and Persistent Response: A New Look at Long-Term Marketing Profitability", Journal of Marketing Research, Vol.36, No.4, pp.397-412
Dobni, C. Brooke and . Luffman, George (2000), "Implementing Marketing StrategyThrough Market Orientation", Journal of Marketing Management, Vol.16, pp.895-916
Doyle, Peter (2000), Value-Based Marketing, Chichester, UK, Wiley
Eccles, Robert G. (1991), "The PerformanceMeasurement Manifesto", Harvard BusinessReview, Vol.69, No. 1, pp.131-137
Egan, Colin and Guilding, Christopher (1994), "Dimensions of Brand Performance: Challenges for Marketing Management and Managerial Accountancy", Journal of Marketing Management, Vol.10, pp.449-472
Eisenhardt, Kathleen M. (1985), "Control: Organizational and Economic Approaches",Management Science, Vol.31, No.2, pp.134-149
Eisenhardt, Kathleen M. (1988), "Agency- andInstitutional- Theory Explanations: The Case of Retail Sales Compensation", Academy of Management Journal, Vol.31, No.3,pp.488-511
Feder, Robert A. (1965), "How to Measure Marketing Performance", Harvard Business Review, Vol.43, No.3, pp.132-142
Fraser, Cynthia and Hite, Robert F. (1988), "An Adaptive Utility Approach for Improved Use of Marketing Models", Journalof Marketing, Vol.52, No.4, pp.96-103
Frazier, Gary L. and Howell, Roy D. (1982), "Intra-industry Marketing Strategy Effects on the Analysis of Firm Performance", Journal of Business Research, Vol.10, No.4, pp.431-443
Gerbing, David W. and Anderson, James (1988), "An Updated Paradigm for Scale Development Incorporating Unidimensionality and its Assessment", Journal of Marketing Research, Vol.25, No.2, pp.186-92.
Greenley, Gordon F. (1995), "Market Orientation and Company Performance: Empirical Evidence From UK Companies", British Journal of Management, Vol.6, pp.1-13
Harris, Lloyd C. (2001), "Market Orientationand Performance: Objective andSubjective Empirical Evidence From UKCompanies", Journal of Management Studies,

VoL38 No. 1, pp.17-43 Homburg, Christian, Workman, John P. Jr. and
Krohmer, Harley (1999), "Marketing'sInfluence Within the Firm", Journal ofMarketing, Vol.63, No.2, pp.1-17
Homburg, Christian and Pflesser, Christian(2000), "A Multiple-Layer model ofMarket-Oriented Organizational Culture:Measurement Issues and PerformanceOutcomes", Journal of Marketing, Vol.37,No.4, pp.449-462
IMA (1992), Cost Management Update, October 1992Vol.32, US Institute of Management Accountants, Cost Management Group
IMA (1994), Cost Management Update, March 1994 Vol.49, US Institute of Management Accountants, Cost Management Group
IMA (1996), Cost Management Update, June 1996 Vol.69, US Institute of Management Accountants, Cost Management Group

Jaworski, Bernard J. (1988), "Toward a Theory of Marketing Control: Environmental Context, Control Types, and Consequences", Journal of Marketing, Vol.52, No.3, pp.23-39
Jaworski, Bernard J. and Kohli, Ajay K. (1993), "Market Orientation: Antecedentsand Consequences", Journal of Marketing, Vol.57, No.3, pp.5370
Jensen, Michael C. and Meckling, William H. (1976), "Theory of the Firm: Managerial Behavior, Agency Costs and Ownership Structure", Journal of Financial Economics, Vol.3, pp.305-360
Keller, Kevin L. (1993), "Conceptualizing, Measuring, and Managing Customer-Based Brand Equity", Journal of Marketing, Vol.57, No. 1, pp.1-22
Keller, Kevin L. (1998), Strategic Brand Management: Building, Measuring and Managing Brand Equity, Upper Saddle River, NJ, Prentice-Hall
Kohli, Ajay K. and Jaworski, Bernard J. (1990), "Market Orientation: The Construct, Research Proposition, and Managerial Implications", Journal of Marketing, Vol.54, No.2, pp.1-18
Kotler, Philip (2003), Marketing Management, (11th edition). Upper Saddle River, NJ: Prentice Hall
Marketing Week (2001), "Assessing Marketers'Worth", February 2001 No. 1, pp. 42-43
Merchant, Kenneth A. (1998), Modern Management Control Systems, Upper Saddle River, NJ: Prentice Hall
Meyer, John W. and Rowan, Brian (1977), "Institutionalized Organizations: FormalStructure as Myth and Ceremony", American Journal of Sociology, Vol.83, pp.340-363
Meyer, Marshall W. (1998), "Finding Performance: The new discipline in management". Performance Measurement-Theory and Practice, Vol. 1, Cambridge, UK, Centre forBusiness Performance, xiv-xxi
Moorman, Christine (1995), "Organizational Market Information Processes: Cultural Antecedents and New Product Outcomes", Journal of Marketing Research, Vol.32, No.3, pp.318-335
Morgan, Robert F., Katsikeas, Constantine S.and Appiah-Adu, Kwaku (1998), "Market Orientation and Organizational Learning Capabilities", Journal of Marketing Management, Vol.14, pp.353-381
MSI (2002), 2002-2004 Research Priorities: A Guide to MSI Research Programs and Procedures,
Cambridge, MA, Marketing Science Institute
Murphy, Gregory B., Trailer, Jeff W. and Hill, Robert C. (1996), "Measuring Performance in Entrepreneurship Research", Journal of Business Research, Vol.36,pp.15-23
Narver, John C. and Slater, Stanley F. (1990), "The Effect of a Market Orientation on Business Profitability", Journal of Marketing, Vol.54, No.4, pp.20-35
Nikalant, V. and Rao, Hayagreeva (1994), "Agency Theory and Uncertainty in Organizations: An Evaluation", Organization Studies, Vol.15, No.5, pp.649-672
Sevin, Charles H. (1965), Marketing Productivity Analysis, New York, McGraw-Hill Schultz, Don E. (2000), "Understanding and Measuring Brand Equity", Marketing Management, Spring 2000, pp.8-9 Shaw, Robert (1998), Improving Marketing Effectiveness, London, The Economist ProfileBooks
Shaw, Robert and Mazur, Laura. (1997), Marketing Accountability: Improving Business Performance, London, Financial Times, Retail and Consumer Publishing
Simmonds, Kenneth (1986a), "Marketing as Innovation. The Eighth Paradigm", Journal of Management Studies, Vol.23, No.3, pp.479-500
Simmonds, Kenneth (1986b), "The Accounting Assessment of Competitive Position", European Journal of Marketing, Vol.20, No. 1, pp.16-31
Simon, Carol J. and Sullivan, Mary W. (1993), "The Measurement and Determinants of Brand Equity: A Financial Approach", Marketing Science, Vol.12, No. 1, pp.28-51
Slater, Stanley F. and Narver, J.C. (1994), "Does Competitive Environment Moderate the Market Orientation-Performance Relationship?", Journal of Marketing, Vol.58,No. 1, pp.46-55
Slater, Stanley F. and Narver, John C. (1995), "Market Orientation and the Learning Organization", Journal of Marketing,Vol.59, No.3, pp.63-74
Srivastava, Rajendra K. and Shocker, Allan D. (1991), "Brand Equity: A Perspective on its Meaning and Measurement", WorkingPaper No. 91-124, Cambridge, MA, Marketing Science Institute
Swartz, G., Hardie Bruce, Grayson, Kent and Ambler, Tim (1996), "Value for money? The relationships between marketing expenditure and business performance in the UK financial services industry", Cookham, Berkshire, UK, Chartered Institute of Marketing, April
Webster, Frederick E. Jr. (1992), "The Changing Role of Marketing in the Corporation", Journal of Marketing, Vol.56, No.4, 1-17
About the Authors
Tim Ambler is Senior Fellow at London Business School. His primary research interests concern international marketing and the measurement of marketing and advertising performance. More recently he has broadened these to include the quantification of government waste (bureaucracy and unnecessary regulation and red tape). His books include Marketing and the Bottom Line: The New Metrics of Corporate Wealth (2000), Doing Business in China (2000), The SILK Road to International Marketing (2000) and Marketing from Advertising to Zen (1996). He has published in the Journal of Marketing, Journal of Marketing Research, International Journal of Research in Marketing, Journal of
Advertising Research and International Journal of Advertising. He was previously Joint Managing Director of International Distillers and Vintners which is now part of Diageo plc.
Flora Kokkinaki is a lecturer in Social Psychology at the University of Patras. After the completion of her PhD in Psychology at University College London, shejoined London Business School as Research Fellow working on the assessment of marketing effectiveness. After appointments as lecturer at University College London andthe London School of Economics and PoliticalScience, she joined the University of Patras. Her research revolves around the areas of Social Cognition, Consumer Behaviour and Economic Psychology. Her publications include papers in the British Journal of Social Psychology, the Journal of Economic Psychology and the Journal of Marketing Management.
Stefano Puntoni is a doctoral student in marketing at London Business School. He holds a Master in Statistics from the University of Padua (Italy). Stefano has published in the areas of marketing metrics,consumer behaviour, marketing communicationsand pricing and participated to various marketing conferences and symposia. He is currently working on a research project devoted to a systematic analysis of the antecedents of advertising polysemy.