
Application of Ultrasonic Technique for Measurement ... - CORE
ARTICLE IN PRESS
1365-1609/$ - se
doi:10.1016/j.ijr
�Correspond8198.
E-mail addr
International Journal of Rock Mechanics & Mining Sciences 42 (2005) 25–34
www.elsevier.com/locate/ijrmms
Assessing in situ microcrack damage using ultrasonicvelocity tomography
I.L. Meglisa, T. Chowb, C.D. Martina,�, R.P. Youngc
aDepartment of Civil and Environmental Engineering, University of Alberta, Edmonton, Alberta, Canada T6G 2G7bDepartment of Physics, Hamilton Regional Cancer Centre, Hamilton, Canada
cDepartment of Earth Sciences, Liverpool University, Liverpool, UK
Accepted 30 June 2004
Available online 12 November 2004
Abstract
To characterize the damage induced during excavation of a test tunnel in granite, ultrasonic wave velocity and amplitude
measurements were made in situ around one quadrant of the tunnel. Sixteen 1-m deep boreholes were drilled into the tunnel wall;
these boreholes spanned the region from tensile stress-induced damage in the sidewall to compressive stress-induced damage in the
well-developed notch. Measurements were made by pulsing a source transducer at numerous points within a given borehole and on
the tunnel surface, and then capturing the transmitted ultrasonic waves at transducers located in the adjacent borehole. The travel
times of the waves between sources and receivers were used to compute the average velocities and to construct two-dimensional (2D)
tomographic images. Wave velocities and amplitudes in the tensile stress region are low and show significant anisotropy, indicating
the presence of oriented microcracks even as deep as 1m from the tunnel wall. Velocities and amplitudes are higher in the
compressive stress region and show lower anisotropy, indicating the rock is relatively undamaged away from the tunnel wall. The
velocity anisotropy indicates that the dominant orientation of microcrack planes is everywhere tangential to the tunnel wall, even
though the minimum principal stress is tangential and tensile in the sidewall. The distribution of microcracks inferred from these
results is consistent with the extensive microseismicity detected during and after excavation and suggests that both the stress history
and current stress state have impacted the current state of damage around the tunnel.
r 2004 Elsevier Ltd. All rights reserved.
1. Introduction
Studies of the physical properties of Lac du Bonnetgranite from Atomic Energy of Canada’s UndergroundResearch Laboratory (URL) show that the rockstrength is reduced by the presence of microcracks[1,2]. Sample disturbance has a substantial impact oncores recovered from highly stressed rock masses,introducing recovery-induced cracks which alter theproperties of the rock from their in situ condition.Because the velocity and amplitude of ultrasonic wavespropagating through rock contain information aboutthe density and orientation of microcracks, in situ
e front matter r 2004 Elsevier Ltd. All rights reserved.
mms.2004.06.002
ing author. Tel.: +1-780-492-2332; fax: +1-780-492-
ess: [email protected] (C.D. Martin).
measurements of these data provide a means forcharacterizing the excavation-induced damage to thematerial surrounding an underground excavation with-out introducing additional recovery-induced damage.The purpose of this study was therefore to use
detailed ultrasonic velocity measurements within a 1-mdeep shell around the Mine-By tunnel at the URL todetermine the variation in velocity in situ, and from thisto infer the relative distribution of excavation-inducedcrack damage. Ultrasonic measurements were usedbecause waves at this frequency (1MHz) are highlysensitive to cracks in the order of a few mm,approximately the grain size of the rock. Although thepossibility exists that isolated, open macroscopic frac-tures intersect the imaged area, this technique is not assensitive to such fractures as it is to a pervasive,distributed microcrack population.
ARTICLE IN PRESSI.L. Meglis et al. / International Journal of Rock Mechanics & Mining Sciences 42 (2005) 25–3426
The velocity measurements were used to construct a2D tomographic image of the spatial variation incompressional (P) wave velocity, which reflects boththe degree of microcrack damage and any preferredorientation of crack planes within the imaged region.Tomographic velocity imaging has been used with greatsuccess in both field and laboratory studies of rockproperties. This technique has the advantage common tonon-destructive testing methods, namely that sampledisturbance is minimized.
Table 1
Approximate trend, plunge, and magnitude of the principal stresses at
the 420m level of the URL[3]
Principal stress Trend (deg) Plunge (deg) Magnitude (MPa)
s1 145 11 60
s2 054 8 45
s3 290 77 11
2. Procedure
2.1. Site description
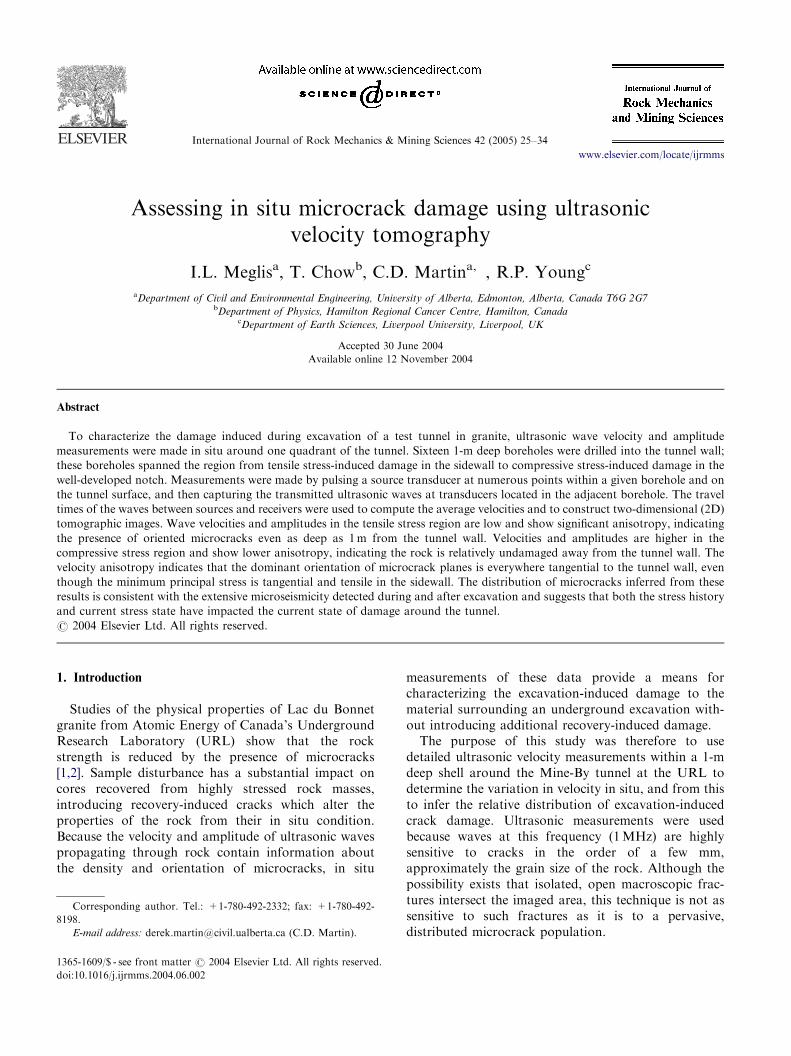
This research was carried out in the Mine-by testtunnel (Fig. 1) at 420-m depth of AECL’s URL, locatednear Pinawa, Manitoba, Canada. This tunnel formed apart of an extensive research program to quantify theextent of the excavation-disturbed zone caused solely byoverstressing the rock mass in the vicinity of the tunnelperimeter. Consequently, the alignment of the tunnelwas chosen to be parallel to the intermediate principalstress direction (approximate azimuth 2251) in order tomaximize the stress concentrations on the tunnelboundary (see Table 1). In addition, the excavation ofthe 3.5-m-diameter circular tunnel was carefully doneusing percussion drilling and reaming in approximately1-m increments, followed by mechanical rock breaking.This procedure was chosen over drill-and-blast in orderto minimize the damage to the rock mass from the
Fig. 1. Example of (a) the V-shaped notch that developed during the excav
boreholes used to investigate the velocity changes around the test tunnel.
excavation process [3]. This tunnel was extensivelyinstrumented with seismic monitoring arrays in orderto detect the microseismic activity associated with tunnelexcavation [4,5].For the velocity survey, four arrays of boreholes (each
75mm diameter and 1m deep) were drilled around onequadrant of the tunnel (Fig. 1b). Each array consisted offour parallel boreholes spaced 0.5m apart which formedthe long edges of a rectangular volume. One array wasdrilled into the sidewall at a plunge of 01 fromhorizontal. One array was drilled in the notch regionat a plunge of 801. Two arrays were spaced in between,with plunges of 301 and 601. These formed a fan-shapedregion, shown in profile view looking along the tunnelaxis in Fig. 1b.While the geology of the test tunnel is classed as
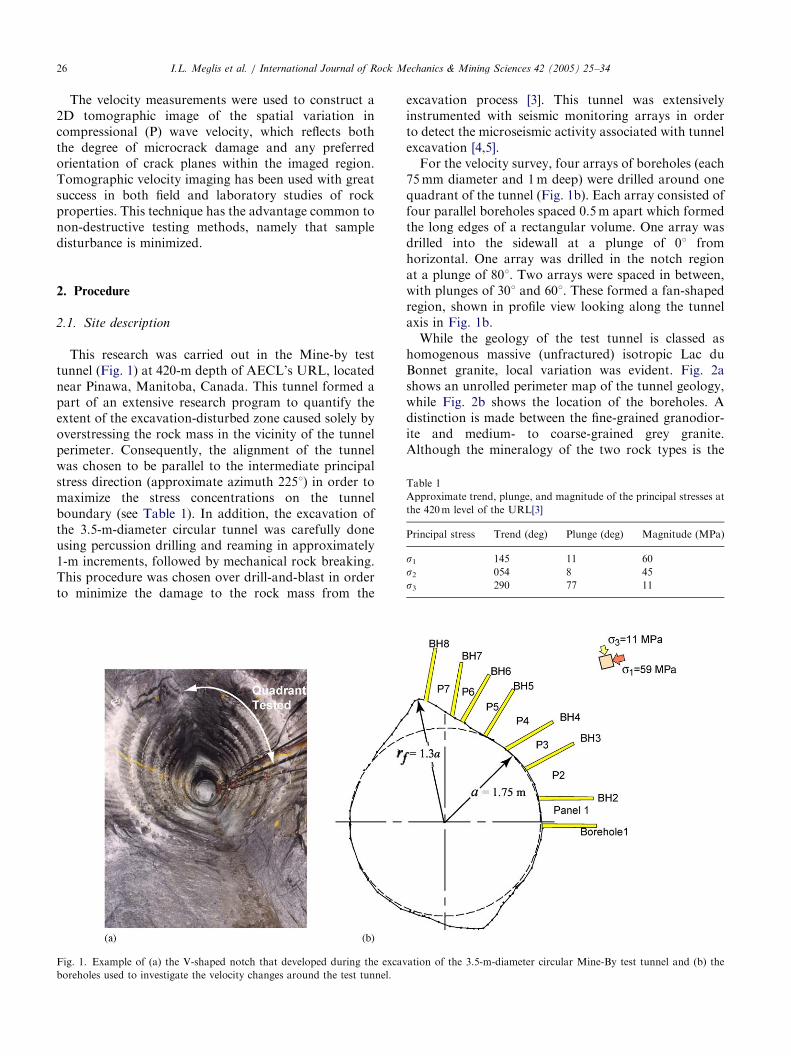
homogenous massive (unfractured) isotropic Lac duBonnet granite, local variation was evident. Fig. 2ashows an unrolled perimeter map of the tunnel geology,while Fig. 2b shows the location of the boreholes. Adistinction is made between the fine-grained granodior-ite and medium- to coarse-grained grey granite.Although the mineralogy of the two rock types is the
ation of the 3.5-m-diameter circular Mine-By test tunnel and (b) the
ARTICLE IN PRESS
Fig. 2. Geology of the Mine-By test tunnel. (a) The dark grey is fine-
grained granodiorite and the white is medium to coarse-grained grey
granite. (b) Geology along Section A-A in Fig. 2(a).
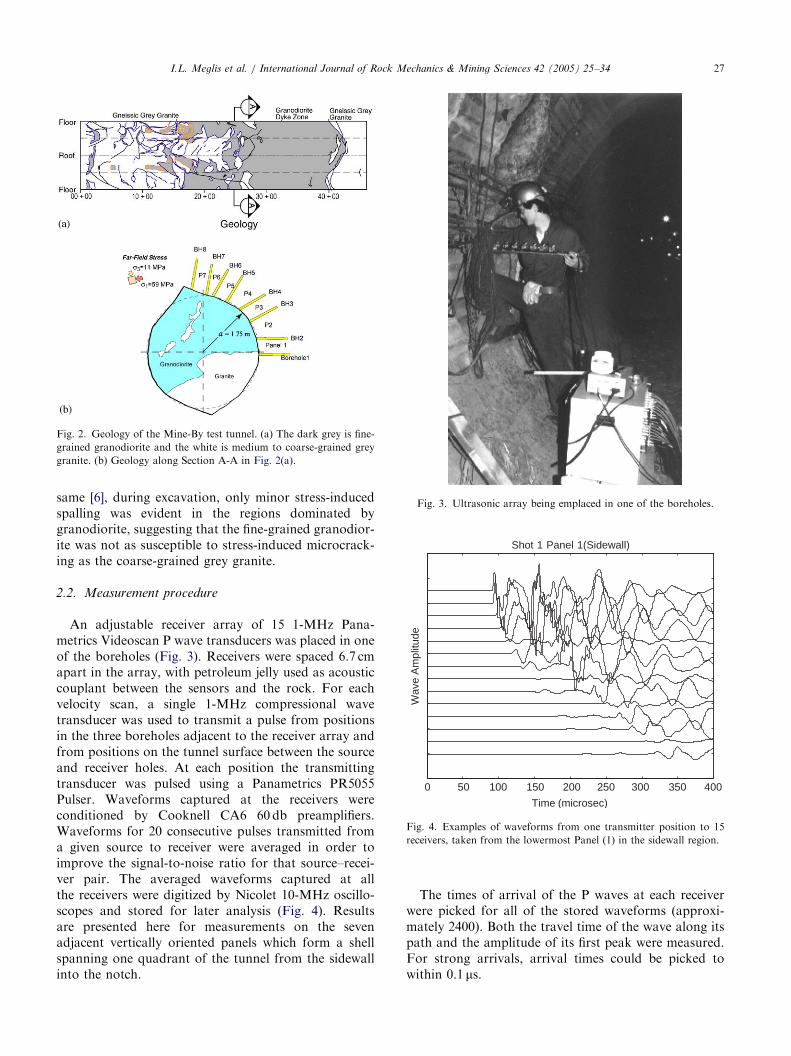
Fig. 3. Ultrasonic array being emplaced in one of the boreholes.
0 50 100 150 200 250 300 350 400
Time (microsec)
Shot 1 Panel 1(Sidewall)
Wav
e A
mpl
itude
Fig. 4. Examples of waveforms from one transmitter position to 15
receivers, taken from the lowermost Panel (1) in the sidewall region.
I.L. Meglis et al. / International Journal of Rock Mechanics & Mining Sciences 42 (2005) 25–34 27
same [6], during excavation, only minor stress-inducedspalling was evident in the regions dominated bygranodiorite, suggesting that the fine-grained granodior-ite was not as susceptible to stress-induced microcrack-ing as the coarse-grained grey granite.
2.2. Measurement procedure
An adjustable receiver array of 15 1-MHz Pana-metrics Videoscan P wave transducers was placed in oneof the boreholes (Fig. 3). Receivers were spaced 6.7 cmapart in the array, with petroleum jelly used as acousticcouplant between the sensors and the rock. For eachvelocity scan, a single 1-MHz compressional wavetransducer was used to transmit a pulse from positionsin the three boreholes adjacent to the receiver array andfrom positions on the tunnel surface between the sourceand receiver holes. At each position the transmittingtransducer was pulsed using a Panametrics PR5055Pulser. Waveforms captured at the receivers wereconditioned by Cooknell CA6 60 db preamplifiers.Waveforms for 20 consecutive pulses transmitted froma given source to receiver were averaged in order toimprove the signal-to-noise ratio for that source–recei-ver pair. The averaged waveforms captured at allthe receivers were digitized by Nicolet 10-MHz oscillo-scopes and stored for later analysis (Fig. 4). Resultsare presented here for measurements on the sevenadjacent vertically oriented panels which form a shellspanning one quadrant of the tunnel from the sidewallinto the notch.
The times of arrival of the P waves at each receiverwere picked for all of the stored waveforms (approxi-mately 2400). Both the travel time of the wave along itspath and the amplitude of its first peak were measured.For strong arrivals, arrival times could be picked towithin 0.1 ms.
ARTICLE IN PRESSI.L. Meglis et al. / International Journal of Rock Mechanics & Mining Sciences 42 (2005) 25–3428
2.3. Tomographic image processing
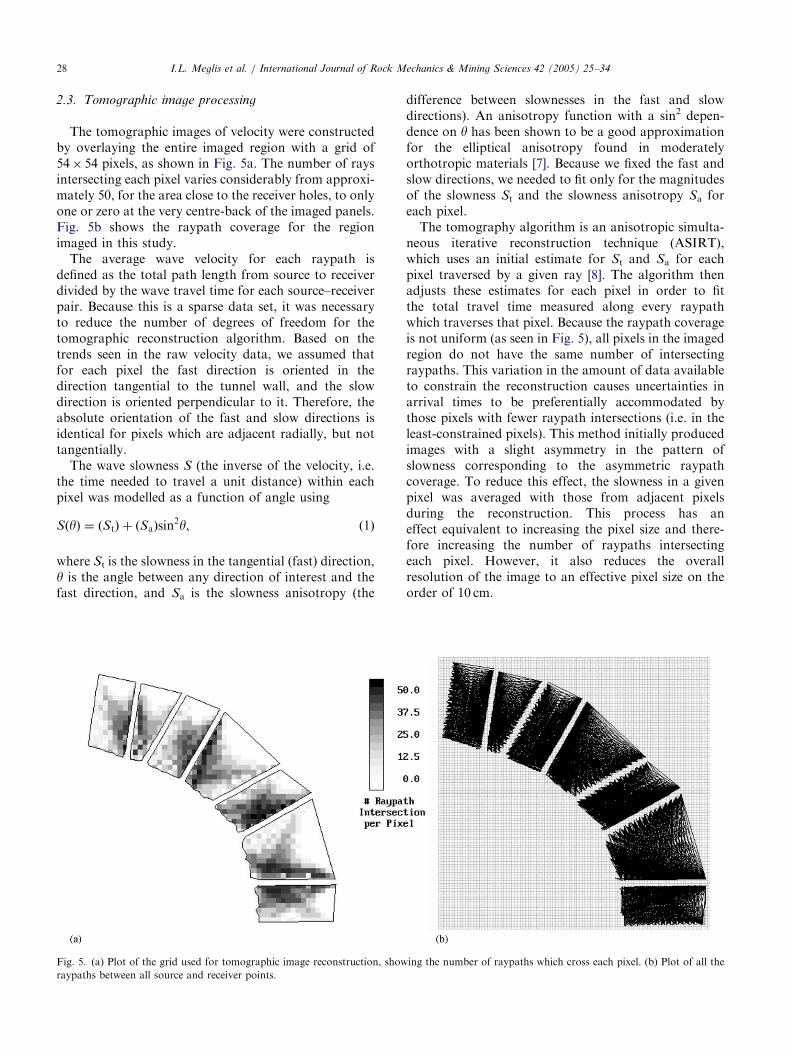
The tomographic images of velocity were constructedby overlaying the entire imaged region with a grid of54� 54 pixels, as shown in Fig. 5a. The number of raysintersecting each pixel varies considerably from approxi-mately 50, for the area close to the receiver holes, to onlyone or zero at the very centre-back of the imaged panels.Fig. 5b shows the raypath coverage for the regionimaged in this study.The average wave velocity for each raypath is
defined as the total path length from source to receiverdivided by the wave travel time for each source–receiverpair. Because this is a sparse data set, it was necessaryto reduce the number of degrees of freedom for thetomographic reconstruction algorithm. Based on thetrends seen in the raw velocity data, we assumed thatfor each pixel the fast direction is oriented in thedirection tangential to the tunnel wall, and the slowdirection is oriented perpendicular to it. Therefore, theabsolute orientation of the fast and slow directions isidentical for pixels which are adjacent radially, but nottangentially.The wave slowness S (the inverse of the velocity, i.e.
the time needed to travel a unit distance) within eachpixel was modelled as a function of angle using
SðyÞ ¼ ðStÞ þ ðSaÞsin2y; ð1Þ
where St is the slowness in the tangential (fast) direction,y is the angle between any direction of interest and thefast direction, and Sa is the slowness anisotropy (the
Fig. 5. (a) Plot of the grid used for tomographic image reconstruction, show
raypaths between all source and receiver points.
difference between slownesses in the fast and slowdirections). An anisotropy function with a sin2 depen-dence on y has been shown to be a good approximationfor the elliptical anisotropy found in moderatelyorthotropic materials [7]. Because we fixed the fast andslow directions, we needed to fit only for the magnitudesof the slowness St and the slowness anisotropy Sa foreach pixel.The tomography algorithm is an anisotropic simulta-
neous iterative reconstruction technique (ASIRT),which uses an initial estimate for St and Sa for eachpixel traversed by a given ray [8]. The algorithm thenadjusts these estimates for each pixel in order to fitthe total travel time measured along every raypathwhich traverses that pixel. Because the raypath coverageis not uniform (as seen in Fig. 5), all pixels in the imagedregion do not have the same number of intersectingraypaths. This variation in the amount of data availableto constrain the reconstruction causes uncertainties inarrival times to be preferentially accommodated bythose pixels with fewer raypath intersections (i.e. in theleast-constrained pixels). This method initially producedimages with a slight asymmetry in the pattern ofslowness corresponding to the asymmetric raypathcoverage. To reduce this effect, the slowness in a givenpixel was averaged with those from adjacent pixelsduring the reconstruction. This process has aneffect equivalent to increasing the pixel size and there-fore increasing the number of raypaths intersectingeach pixel. However, it also reduces the overallresolution of the image to an effective pixel size on theorder of 10 cm.
ing the number of raypaths which cross each pixel. (b) Plot of all the
ARTICLE IN PRESS
0
50
100
150
200
250
-180 -135 -90 -45 0 45 90
Angle from horizontal (degrees)
Am
plit
ud
e (m
V)
3.0
3.5
4.0
4.5
5.0
5.5
6.0
6.5
Vel
oci
ty (
km/s
ec)
σ1σ3
0
50
100
150
200
250
-180 -135 -90 -45 0 45 90
Angle from horizontal (degrees)
Am
plit
ud
e (m
V)
3.0
3.5
4.0
4.5
5.0
5.5
6.0
6.5
Vel
oci
ty (
km/s
ec)
σ1σ3
(a) (b)
(c) (d)
0
50
100
150
200
250
-180 -135 -90 -45 0 45 90
Angle from horizontal (degrees)
Am
plit
ud
e (m
V)
3.0
3.5
4.0
4.5
5.0
5.5
6.0
6.5V
elo
city
(km
/sec
)σ1σ3
0
50
100
150
200
250
-180 -135 -90 -45 0 45 90
Angle from horizontal (degrees)
Am
plit
ud
e (m
V)
3.0
3.5
4.0
4.5
5.0
5.5
6.0
6.5
Vel
oci
ty (
km/s
ec)
σ1σ3
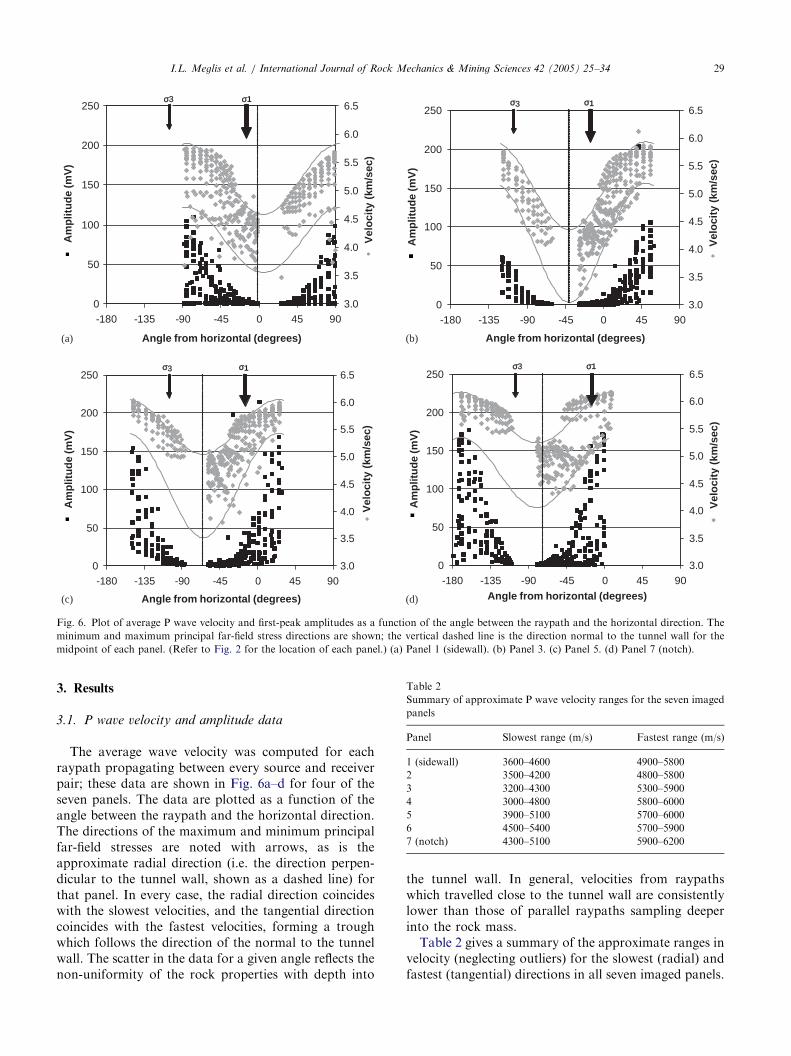
Fig. 6. Plot of average P wave velocity and first-peak amplitudes as a function of the angle between the raypath and the horizontal direction. The
minimum and maximum principal far-field stress directions are shown; the vertical dashed line is the direction normal to the tunnel wall for the
midpoint of each panel. (Refer to Fig. 2 for the location of each panel.) (a) Panel 1 (sidewall). (b) Panel 3. (c) Panel 5. (d) Panel 7 (notch).
Table 2
Summary of approximate P wave velocity ranges for the seven imaged
panels
Panel Slowest range (m/s) Fastest range (m/s)
1 (sidewall) 3600–4600 4900–5800
2 3500–4200 4800–5800
3 3200–4300 5300–5900
4 3000–4800 5800–6000
5 3900–5100 5700–6000
6 4500–5400 5700–5900
7 (notch) 4300–5100 5900–6200
I.L. Meglis et al. / International Journal of Rock Mechanics & Mining Sciences 42 (2005) 25–34 29
3. Results
3.1. P wave velocity and amplitude data
The average wave velocity was computed for eachraypath propagating between every source and receiverpair; these data are shown in Fig. 6a–d for four of theseven panels. The data are plotted as a function of theangle between the raypath and the horizontal direction.The directions of the maximum and minimum principalfar-field stresses are noted with arrows, as is theapproximate radial direction (i.e. the direction perpen-dicular to the tunnel wall, shown as a dashed line) forthat panel. In every case, the radial direction coincideswith the slowest velocities, and the tangential directioncoincides with the fastest velocities, forming a troughwhich follows the direction of the normal to the tunnelwall. The scatter in the data for a given angle reflects thenon-uniformity of the rock properties with depth into
the tunnel wall. In general, velocities from raypathswhich travelled close to the tunnel wall are consistentlylower than those of parallel raypaths sampling deeperinto the rock mass.Table 2 gives a summary of the approximate ranges in
velocity (neglecting outliers) for the slowest (radial) andfastest (tangential) directions in all seven imaged panels.
ARTICLE IN PRESS
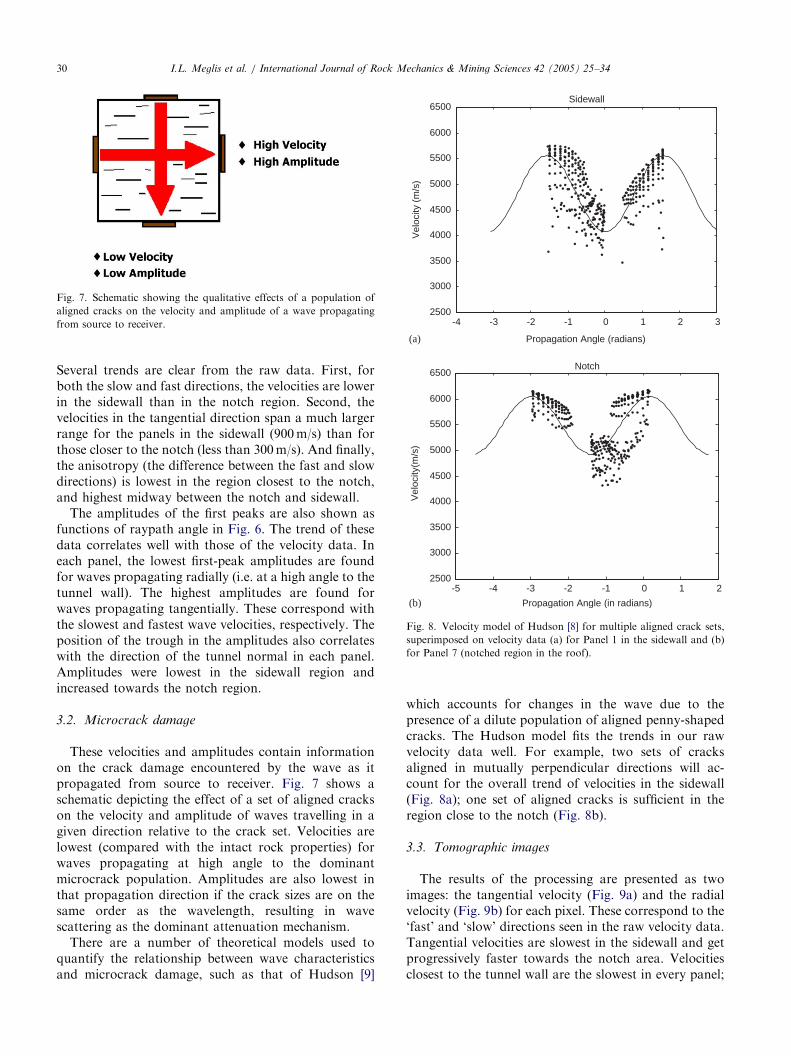
Fig. 7. Schematic showing the qualitative effects of a population of
aligned cracks on the velocity and amplitude of a wave propagating
from source to receiver.
-5 -4 -3 -2 -1 0 1 22500
3000
3500
4000
4500
5000
5500
6000
6500
Propagation Angle (in radians)
Notch
-4 -3 -2 -1 0 1 2 32500
3000
3500
4000
4500
5000
5500
6000
6500
Propagation Angle (radians)
Sidewall
(a)
(b)
Vel
ocity
(m
/s)
Vel
ocity
(m/s
)
Fig. 8. Velocity model of Hudson [8] for multiple aligned crack sets,
superimposed on velocity data (a) for Panel 1 in the sidewall and (b)
for Panel 7 (notched region in the roof).
I.L. Meglis et al. / International Journal of Rock Mechanics & Mining Sciences 42 (2005) 25–3430
Several trends are clear from the raw data. First, forboth the slow and fast directions, the velocities are lowerin the sidewall than in the notch region. Second, thevelocities in the tangential direction span a much largerrange for the panels in the sidewall (900m/s) than forthose closer to the notch (less than 300m/s). And finally,the anisotropy (the difference between the fast and slowdirections) is lowest in the region closest to the notch,and highest midway between the notch and sidewall.The amplitudes of the first peaks are also shown as
functions of raypath angle in Fig. 6. The trend of thesedata correlates well with those of the velocity data. Ineach panel, the lowest first-peak amplitudes are foundfor waves propagating radially (i.e. at a high angle to thetunnel wall). The highest amplitudes are found forwaves propagating tangentially. These correspond withthe slowest and fastest wave velocities, respectively. Theposition of the trough in the amplitudes also correlateswith the direction of the tunnel normal in each panel.Amplitudes were lowest in the sidewall region andincreased towards the notch region.
3.2. Microcrack damage
These velocities and amplitudes contain informationon the crack damage encountered by the wave as itpropagated from source to receiver. Fig. 7 shows aschematic depicting the effect of a set of aligned crackson the velocity and amplitude of waves travelling in agiven direction relative to the crack set. Velocities arelowest (compared with the intact rock properties) forwaves propagating at high angle to the dominantmicrocrack population. Amplitudes are also lowest inthat propagation direction if the crack sizes are on thesame order as the wavelength, resulting in wavescattering as the dominant attenuation mechanism.There are a number of theoretical models used to
quantify the relationship between wave characteristicsand microcrack damage, such as that of Hudson [9]
which accounts for changes in the wave due to thepresence of a dilute population of aligned penny-shapedcracks. The Hudson model fits the trends in our rawvelocity data well. For example, two sets of cracksaligned in mutually perpendicular directions will ac-count for the overall trend of velocities in the sidewall(Fig. 8a); one set of aligned cracks is sufficient in theregion close to the notch (Fig. 8b).
3.3. Tomographic images
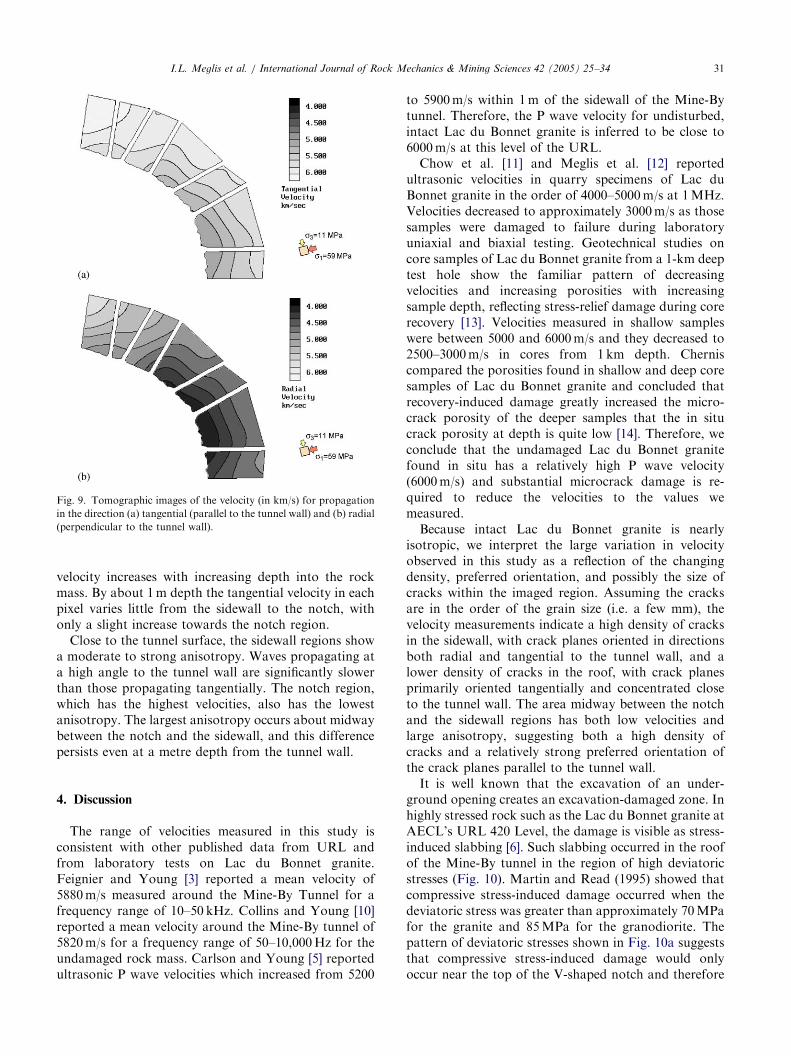
The results of the processing are presented as twoimages: the tangential velocity (Fig. 9a) and the radialvelocity (Fig. 9b) for each pixel. These correspond to the‘fast’ and ‘slow’ directions seen in the raw velocity data.Tangential velocities are slowest in the sidewall and getprogressively faster towards the notch area. Velocitiesclosest to the tunnel wall are the slowest in every panel;
ARTICLE IN PRESS
Fig. 9. Tomographic images of the velocity (in km/s) for propagation
in the direction (a) tangential (parallel to the tunnel wall) and (b) radial
(perpendicular to the tunnel wall).
I.L. Meglis et al. / International Journal of Rock Mechanics & Mining Sciences 42 (2005) 25–34 31
velocity increases with increasing depth into the rockmass. By about 1m depth the tangential velocity in eachpixel varies little from the sidewall to the notch, withonly a slight increase towards the notch region.Close to the tunnel surface, the sidewall regions show
a moderate to strong anisotropy. Waves propagating ata high angle to the tunnel wall are significantly slowerthan those propagating tangentially. The notch region,which has the highest velocities, also has the lowestanisotropy. The largest anisotropy occurs about midwaybetween the notch and the sidewall, and this differencepersists even at a metre depth from the tunnel wall.
4. Discussion
The range of velocities measured in this study isconsistent with other published data from URL andfrom laboratory tests on Lac du Bonnet granite.Feignier and Young [3] reported a mean velocity of5880m/s measured around the Mine-By Tunnel for afrequency range of 10–50 kHz. Collins and Young [10]reported a mean velocity around the Mine-By tunnel of5820m/s for a frequency range of 50–10,000Hz for theundamaged rock mass. Carlson and Young [5] reportedultrasonic P wave velocities which increased from 5200
to 5900m/s within 1m of the sidewall of the Mine-Bytunnel. Therefore, the P wave velocity for undisturbed,intact Lac du Bonnet granite is inferred to be close to6000m/s at this level of the URL.Chow et al. [11] and Meglis et al. [12] reported
ultrasonic velocities in quarry specimens of Lac duBonnet granite in the order of 4000–5000m/s at 1MHz.Velocities decreased to approximately 3000m/s as thosesamples were damaged to failure during laboratoryuniaxial and biaxial testing. Geotechnical studies oncore samples of Lac du Bonnet granite from a 1-km deeptest hole show the familiar pattern of decreasingvelocities and increasing porosities with increasingsample depth, reflecting stress-relief damage during corerecovery [13]. Velocities measured in shallow sampleswere between 5000 and 6000m/s and they decreased to2500–3000m/s in cores from 1km depth. Cherniscompared the porosities found in shallow and deep coresamples of Lac du Bonnet granite and concluded thatrecovery-induced damage greatly increased the micro-crack porosity of the deeper samples that the in situcrack porosity at depth is quite low [14]. Therefore, weconclude that the undamaged Lac du Bonnet granitefound in situ has a relatively high P wave velocity(6000m/s) and substantial microcrack damage is re-quired to reduce the velocities to the values wemeasured.Because intact Lac du Bonnet granite is nearly
isotropic, we interpret the large variation in velocityobserved in this study as a reflection of the changingdensity, preferred orientation, and possibly the size ofcracks within the imaged region. Assuming the cracksare in the order of the grain size (i.e. a few mm), thevelocity measurements indicate a high density of cracksin the sidewall, with crack planes oriented in directionsboth radial and tangential to the tunnel wall, and alower density of cracks in the roof, with crack planesprimarily oriented tangentially and concentrated closeto the tunnel wall. The area midway between the notchand the sidewall regions has both low velocities andlarge anisotropy, suggesting both a high density ofcracks and a relatively strong preferred orientation ofthe crack planes parallel to the tunnel wall.It is well known that the excavation of an under-
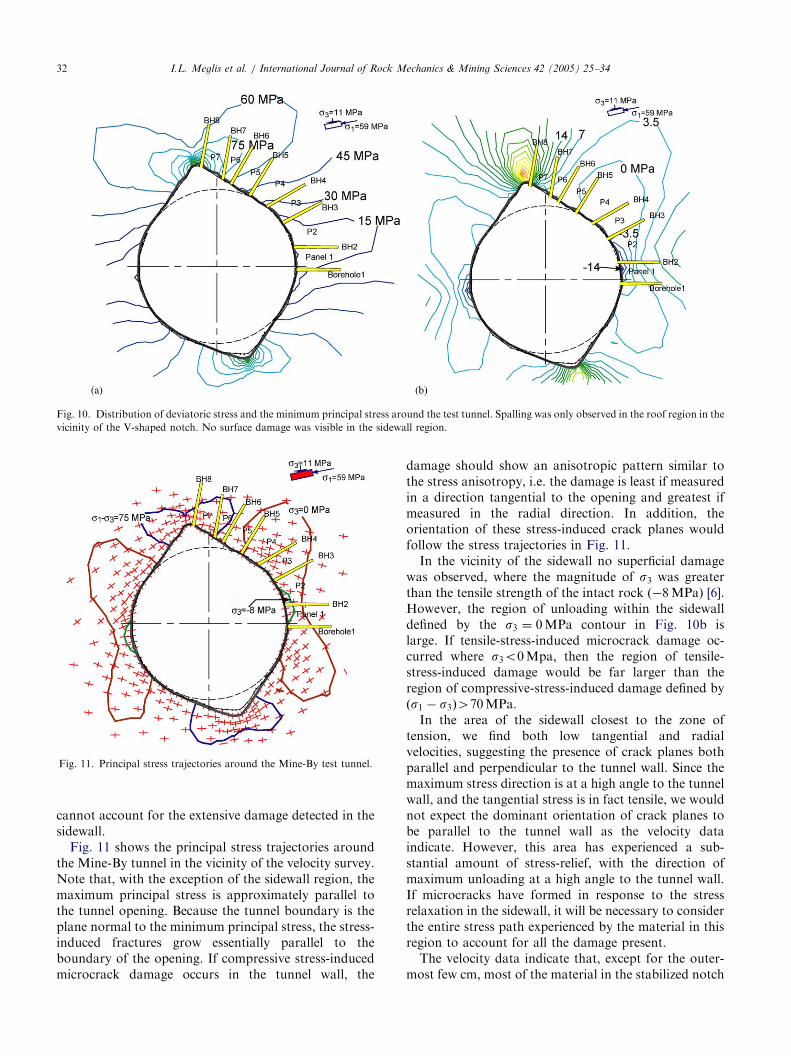
ground opening creates an excavation-damaged zone. Inhighly stressed rock such as the Lac du Bonnet granite atAECL’s URL 420 Level, the damage is visible as stress-induced slabbing [6]. Such slabbing occurred in the roofof the Mine-By tunnel in the region of high deviatoricstresses (Fig. 10). Martin and Read (1995) showed thatcompressive stress-induced damage occurred when thedeviatoric stress was greater than approximately 70MPafor the granite and 85MPa for the granodiorite. Thepattern of deviatoric stresses shown in Fig. 10a suggeststhat compressive stress-induced damage would onlyoccur near the top of the V-shaped notch and therefore
ARTICLE IN PRESS
Fig. 10. Distribution of deviatoric stress and the minimum principal stress around the test tunnel. Spalling was only observed in the roof region in the
vicinity of the V-shaped notch. No surface damage was visible in the sidewall region.
Fig. 11. Principal stress trajectories around the Mine-By test tunnel.
I.L. Meglis et al. / International Journal of Rock Mechanics & Mining Sciences 42 (2005) 25–3432
cannot account for the extensive damage detected in thesidewall.Fig. 11 shows the principal stress trajectories around
the Mine-By tunnel in the vicinity of the velocity survey.Note that, with the exception of the sidewall region, themaximum principal stress is approximately parallel tothe tunnel opening. Because the tunnel boundary is theplane normal to the minimum principal stress, the stress-induced fractures grow essentially parallel to theboundary of the opening. If compressive stress-inducedmicrocrack damage occurs in the tunnel wall, the
damage should show an anisotropic pattern similar tothe stress anisotropy, i.e. the damage is least if measuredin a direction tangential to the opening and greatest ifmeasured in the radial direction. In addition, theorientation of these stress-induced crack planes wouldfollow the stress trajectories in Fig. 11.In the vicinity of the sidewall no superficial damage
was observed, where the magnitude of s3 was greaterthan the tensile strength of the intact rock (�8MPa) [6].However, the region of unloading within the sidewalldefined by the s3 ¼ 0MPa contour in Fig. 10b islarge. If tensile-stress-induced microcrack damage oc-curred where s3o0Mpa; then the region of tensile-stress-induced damage would be far larger than theregion of compressive-stress-induced damage defined byðs1 � s3Þ470MPa:In the area of the sidewall closest to the zone of
tension, we find both low tangential and radialvelocities, suggesting the presence of crack planes bothparallel and perpendicular to the tunnel wall. Since themaximum stress direction is at a high angle to the tunnelwall, and the tangential stress is in fact tensile, we wouldnot expect the dominant orientation of crack planes tobe parallel to the tunnel wall as the velocity dataindicate. However, this area has experienced a sub-stantial amount of stress-relief, with the direction ofmaximum unloading at a high angle to the tunnel wall.If microcracks have formed in response to the stressrelaxation in the sidewall, it will be necessary to considerthe entire stress path experienced by the material in thisregion to account for all the damage present.The velocity data indicate that, except for the outer-
most few cm, most of the material in the stabilized notch
ARTICLE IN PRESS
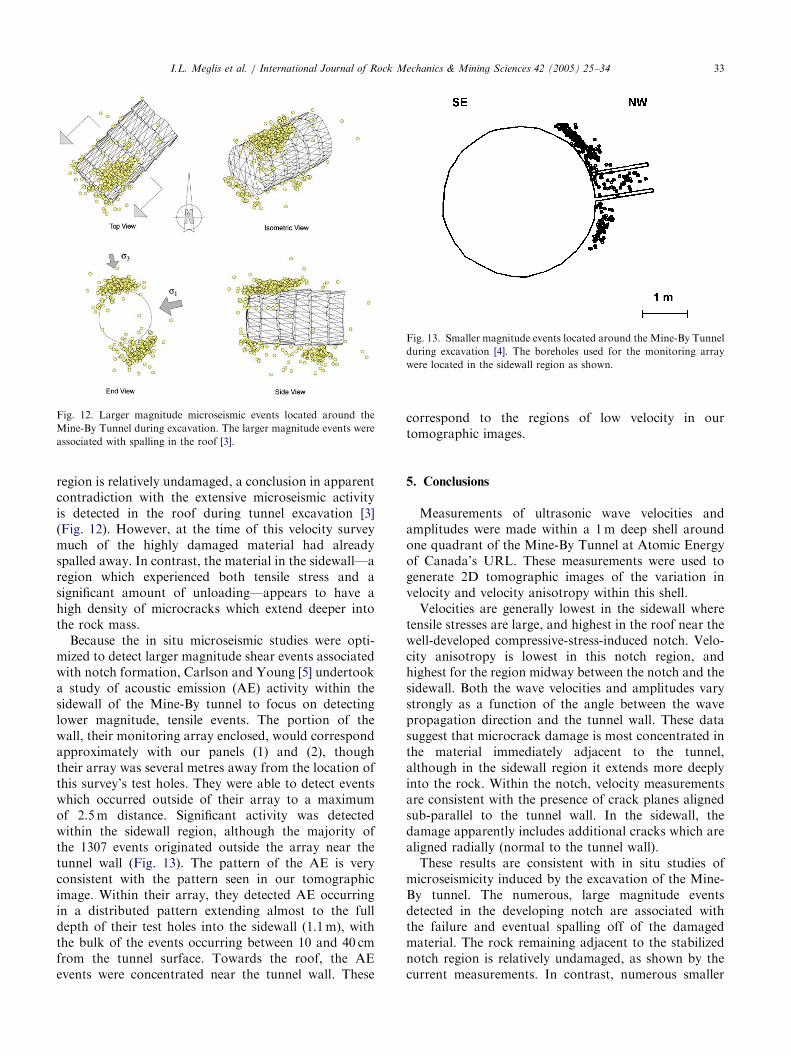
Fig. 12. Larger magnitude microseismic events located around the
Mine-By Tunnel during excavation. The larger magnitude events were
associated with spalling in the roof [3].
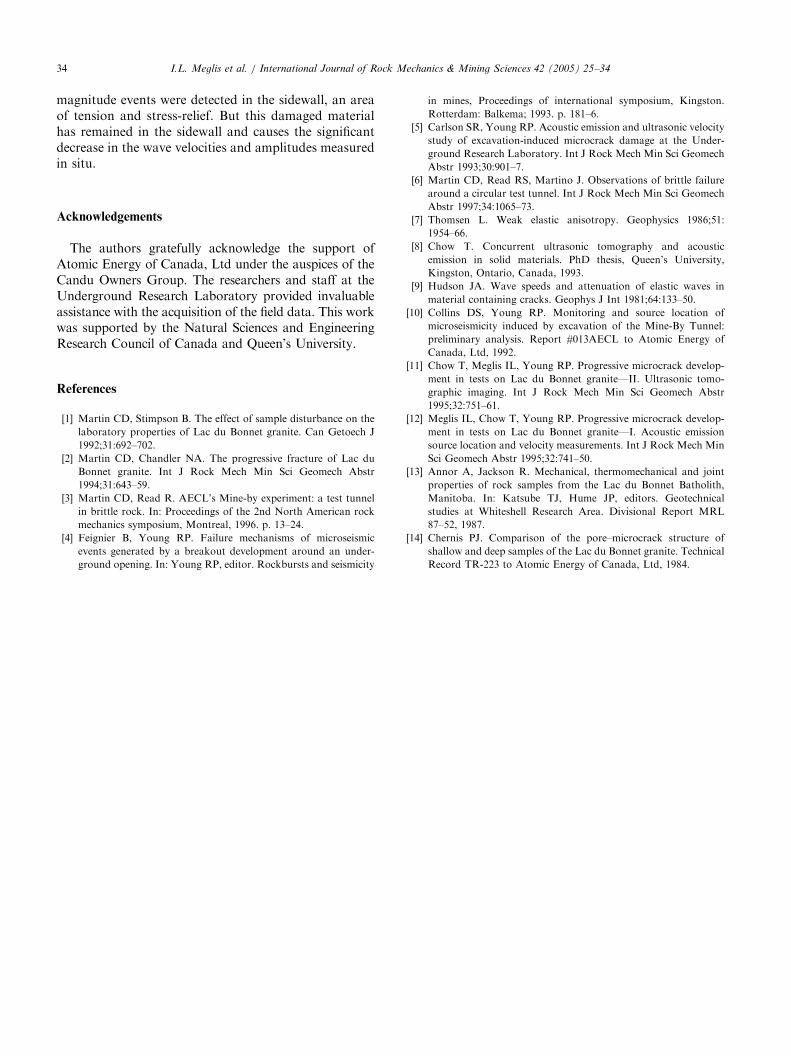
Fig. 13. Smaller magnitude events located around the Mine-By Tunnel
during excavation [4]. The boreholes used for the monitoring array
were located in the sidewall region as shown.
I.L. Meglis et al. / International Journal of Rock Mechanics & Mining Sciences 42 (2005) 25–34 33
region is relatively undamaged, a conclusion in apparentcontradiction with the extensive microseismic activityis detected in the roof during tunnel excavation [3](Fig. 12). However, at the time of this velocity surveymuch of the highly damaged material had alreadyspalled away. In contrast, the material in the sidewall—aregion which experienced both tensile stress and asignificant amount of unloading—appears to have ahigh density of microcracks which extend deeper intothe rock mass.Because the in situ microseismic studies were opti-
mized to detect larger magnitude shear events associatedwith notch formation, Carlson and Young [5] undertooka study of acoustic emission (AE) activity within thesidewall of the Mine-By tunnel to focus on detectinglower magnitude, tensile events. The portion of thewall, their monitoring array enclosed, would correspondapproximately with our panels (1) and (2), thoughtheir array was several metres away from the location ofthis survey’s test holes. They were able to detect eventswhich occurred outside of their array to a maximumof 2.5m distance. Significant activity was detectedwithin the sidewall region, although the majority ofthe 1307 events originated outside the array near thetunnel wall (Fig. 13). The pattern of the AE is veryconsistent with the pattern seen in our tomographicimage. Within their array, they detected AE occurringin a distributed pattern extending almost to the fulldepth of their test holes into the sidewall (1.1m), withthe bulk of the events occurring between 10 and 40 cmfrom the tunnel surface. Towards the roof, the AEevents were concentrated near the tunnel wall. These
correspond to the regions of low velocity in ourtomographic images.
5. Conclusions
Measurements of ultrasonic wave velocities andamplitudes were made within a 1m deep shell aroundone quadrant of the Mine-By Tunnel at Atomic Energyof Canada’s URL. These measurements were used togenerate 2D tomographic images of the variation invelocity and velocity anisotropy within this shell.Velocities are generally lowest in the sidewall where
tensile stresses are large, and highest in the roof near thewell-developed compressive-stress-induced notch. Velo-city anisotropy is lowest in this notch region, andhighest for the region midway between the notch and thesidewall. Both the wave velocities and amplitudes varystrongly as a function of the angle between the wavepropagation direction and the tunnel wall. These datasuggest that microcrack damage is most concentrated inthe material immediately adjacent to the tunnel,although in the sidewall region it extends more deeplyinto the rock. Within the notch, velocity measurementsare consistent with the presence of crack planes alignedsub-parallel to the tunnel wall. In the sidewall, thedamage apparently includes additional cracks which arealigned radially (normal to the tunnel wall).These results are consistent with in situ studies of
microseismicity induced by the excavation of the Mine-By tunnel. The numerous, large magnitude eventsdetected in the developing notch are associated withthe failure and eventual spalling off of the damagedmaterial. The rock remaining adjacent to the stabilizednotch region is relatively undamaged, as shown by thecurrent measurements. In contrast, numerous smaller
ARTICLE IN PRESSI.L. Meglis et al. / International Journal of Rock Mechanics & Mining Sciences 42 (2005) 25–3434
magnitude events were detected in the sidewall, an areaof tension and stress-relief. But this damaged materialhas remained in the sidewall and causes the significantdecrease in the wave velocities and amplitudes measuredin situ.
Acknowledgements
The authors gratefully acknowledge the support ofAtomic Energy of Canada, Ltd under the auspices of theCandu Owners Group. The researchers and staff at theUnderground Research Laboratory provided invaluableassistance with the acquisition of the field data. This workwas supported by the Natural Sciences and EngineeringResearch Council of Canada and Queen’s University.
References
[1] Martin CD, Stimpson B. The effect of sample disturbance on the
laboratory properties of Lac du Bonnet granite. Can Getoech J
1992;31:692–702.
[2] Martin CD, Chandler NA. The progressive fracture of Lac du
Bonnet granite. Int J Rock Mech Min Sci Geomech Abstr
1994;31:643–59.
[3] Martin CD, Read R. AECL’s Mine-by experiment: a test tunnel
in brittle rock. In: Proceedings of the 2nd North American rock
mechanics symposium, Montreal, 1996. p. 13–24.
[4] Feignier B, Young RP. Failure mechanisms of microseismic
events generated by a breakout development around an under-
ground opening. In: Young RP, editor. Rockbursts and seismicity
in mines, Proceedings of international symposium, Kingston.
Rotterdam: Balkema; 1993. p. 181–6.
[5] Carlson SR, Young RP. Acoustic emission and ultrasonic velocity
study of excavation-induced microcrack damage at the Under-
ground Research Laboratory. Int J Rock Mech Min Sci Geomech
Abstr 1993;30:901–7.
[6] Martin CD, Read RS, Martino J. Observations of brittle failure
around a circular test tunnel. Int J Rock Mech Min Sci Geomech
Abstr 1997;34:1065–73.
[7] Thomsen L. Weak elastic anisotropy. Geophysics 1986;51:
1954–66.
[8] Chow T. Concurrent ultrasonic tomography and acoustic
emission in solid materials. PhD thesis, Queen’s University,
Kingston, Ontario, Canada, 1993.
[9] Hudson JA. Wave speeds and attenuation of elastic waves in
material containing cracks. Geophys J Int 1981;64:133–50.
[10] Collins DS, Young RP. Monitoring and source location of
microseismicity induced by excavation of the Mine-By Tunnel:
preliminary analysis. Report #013AECL to Atomic Energy of
Canada, Ltd, 1992.
[11] Chow T, Meglis IL, Young RP. Progressive microcrack develop-
ment in tests on Lac du Bonnet granite—II. Ultrasonic tomo-
graphic imaging. Int J Rock Mech Min Sci Geomech Abstr
1995;32:751–61.
[12] Meglis IL, Chow T, Young RP. Progressive microcrack develop-
ment in tests on Lac du Bonnet granite—I. Acoustic emission
source location and velocity measurements. Int J Rock Mech Min
Sci Geomech Abstr 1995;32:741–50.
[13] Annor A, Jackson R. Mechanical, thermomechanical and joint
properties of rock samples from the Lac du Bonnet Batholith,
Manitoba. In: Katsube TJ, Hume JP, editors. Geotechnical
studies at Whiteshell Research Area. Divisional Report MRL
87–52, 1987.
[14] Chernis PJ. Comparison of the pore–microcrack structure of
shallow and deep samples of the Lac du Bonnet granite. Technical
Record TR-223 to Atomic Energy of Canada, Ltd, 1984.
Copyright © 2022 FDOKUMEN