Ashuganj 450 MW (North) Combined Cycle Power Plant ...
44
Semiannual Environmental Monitoring Report Loan No. 2769- BAN December 2018 Power System Efficiency Improvement Project ASHUGANJ 450 MW (NORTH) COMBINED CYCLE POWER PLANT PROJECT (CCPP) Ashuganj, Brahmanbaria Prepared by Ashuganj Power Station Company Limited (APSCL) for the Asian Development Bank.
-
Upload
khangminh22 -
Category
Documents
-
view
1 -
download
0
Transcript of Ashuganj 450 MW (North) Combined Cycle Power Plant ...
Semiannual Environmental Monitoring Report
Loan No. 2769- BAN December 2018
Power System Efficiency Improvement Project
ASHUGANJ 450 MW (NORTH) COMBINED CYCLE POWER PLANT PROJECT (CCPP)
Ashuganj, Brahmanbaria
Prepared by Ashuganj Power Station Company Limited (APSCL) for the Asian Development Bank.
This Semiannual Environmental Monitoring Report is a document of the borrower. The views expressed herein do not necessarily represent those of ADB's Board of Directors, Management, or staff, and may be preliminary in nature.
In preparing any country program or strategy, financing any project, or by making any designation of or reference to a particular territory or geographic area in this document, the Asian Development Bank does not intend to make any judgments as to the legal or other status of any territory or area.
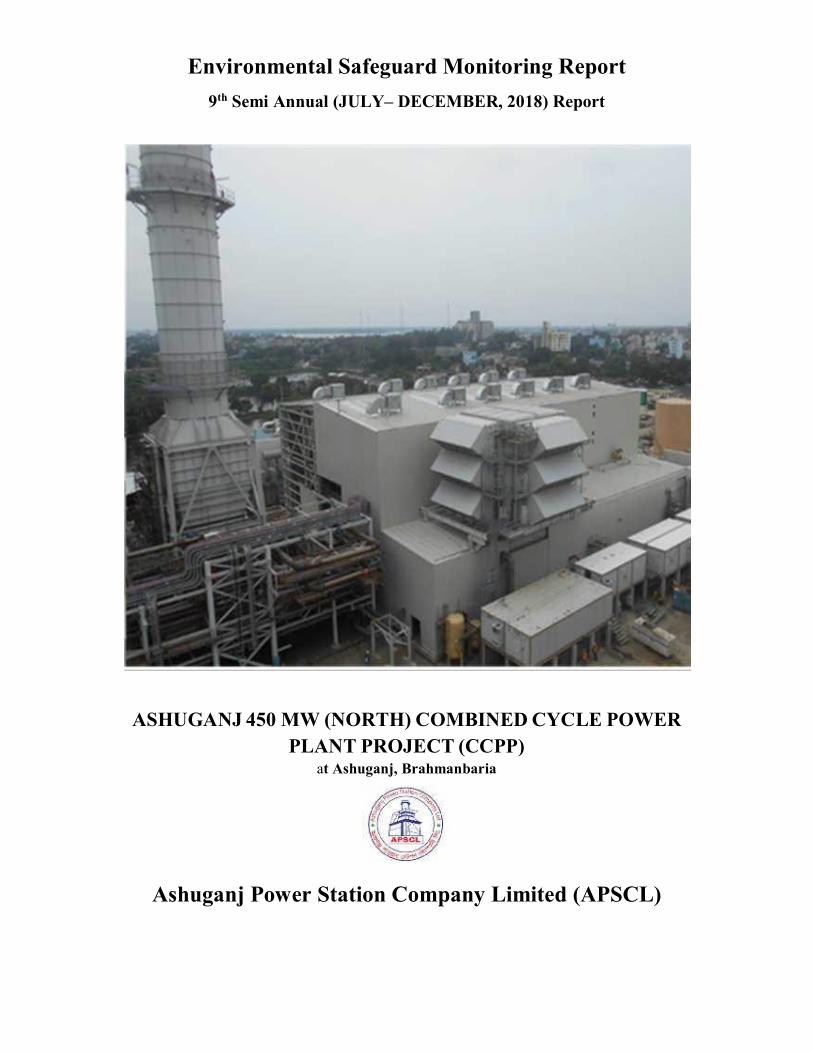
Environmental Safeguard Monitoring Report
9th Semi Annual (JULY– DECEMBER, 2018) Report
ASHUGANJ 450 MW (NORTH) COMBINED CYCLE POWER
PLANT PROJECT (CCPP) at Ashuganj, Brahmanbaria
Ashuganj Power Station Company Limited (APSCL)
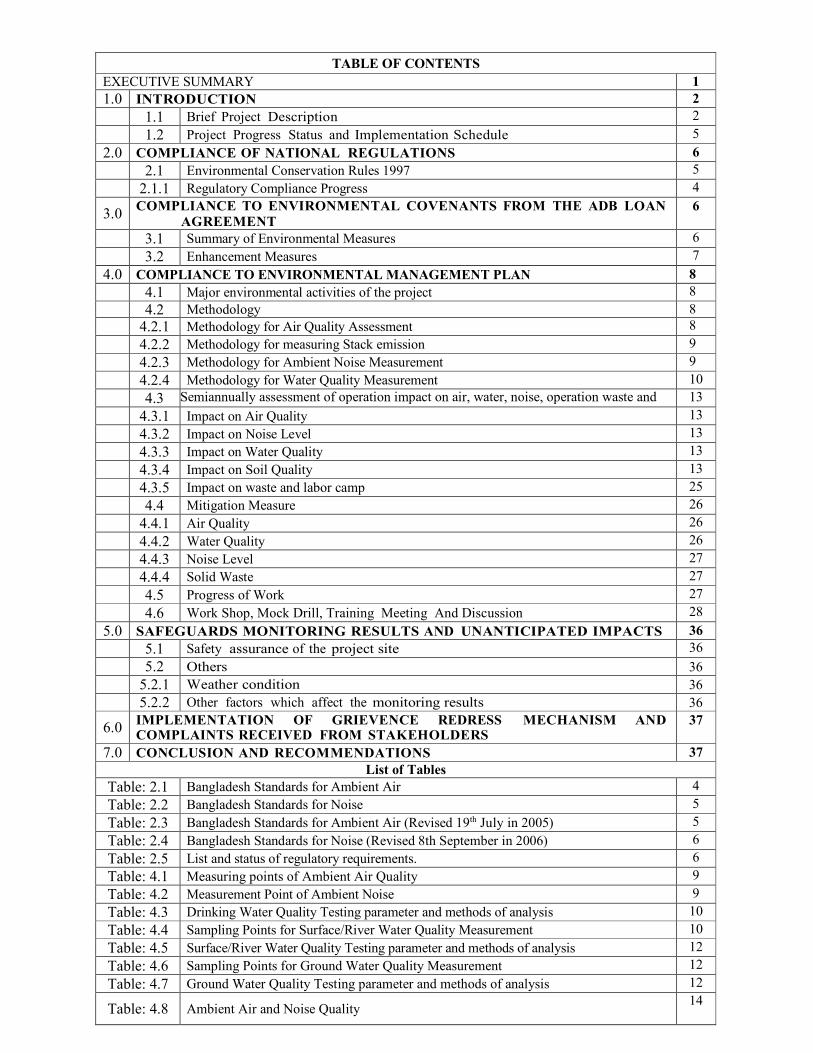
TABLE OF CONTENTS
EXECUTIVE SUMMARY 1
1.0 INTRODUCTION 2
1.1 Brief Project Description 2
1.2 Project Progress Status and Implementation Schedule 53 2.0 COMPLIANCE OF NATIONAL REGULATIONS 6
4 2.1 Environmental Conservation Rules 1997 5
2.1.1 Regulatory Compliance Progress 4
3.0 COMPLIANCE TO ENVIRONMENTAL COVENANTS FROM THE ADB LOAN
AGREEMENT 6
3.1 Summary of Environmental Measures 6
3.2 Enhancement Measures 7
4.0 COMPLIANCE TO ENVIRONMENTAL MANAGEMENT PLAN 8
4.1 Major environmental activities of the project 8
4.2 Methodology 8
4.2.1 Methodology for Air Quality Assessment 8
4.2.2 Methodology for measuring Stack emission 9
4.2.3 Methodology for Ambient Noise Measurement 9
4.2.4 Methodology for Water Quality Measurement 10
4.3 Semiannually assessment of operation impact on air, water, noise, operation waste and labor camp management
13
4.3.1 Impact on Air Quality 13
4.3.2 Impact on Noise Level 13
4.3.3 Impact on Water Quality 13
4.3.4 Impact on Soil Quality 13
4.3.5 Impact on waste and labor camp 25
4.4 Mitigation Measure 26
4.4.1 Air Quality 26
4.4.2 Water Quality 26
4.4.3 Noise Level 27
4.4.4 Solid Waste 27
4.5 Progress of Work 27
4.6 Work Shop, Mock Drill, Training Meeting And Discussion 28
5.0 SAFEGUARDS MONITORING RESULTS AND UNANTICIPATED IMPACTS 36
5.1 Safety assurance of the project site 36
5.2 Others 36
5.2.1 Weather condition 36
5.2.2 Other factors which affect the monitoring results 36
6.0 IMPLEMENTATION OF GRIEVENCE REDRESS MECHANISM AND COMPLAINTS RECEIVED FROM STAKEHOLDERS
37
7.0 CONCLUSION AND RECOMMENDATIONS 37
List of Tables
Table: 2.1 Bangladesh Standards for Ambient Air 4
Table: 2.2 Bangladesh Standards for Noise 5
Table: 2.3 Bangladesh Standards for Ambient Air (Revised 19th July in 2005) 5
Table: 2.4 Bangladesh Standards for Noise (Revised 8th September in 2006) 6
Table: 2.5 List and status of regulatory requirements. 6
Table: 4.1 Measuring points of Ambient Air Quality 9
Table: 4.2 Measurement Point of Ambient Noise 9
Table: 4.3 Drinking Water Quality Testing parameter and methods of analysis 10
Table: 4.4 Sampling Points for Surface/River Water Quality Measurement 10
Table: 4.5 Surface/River Water Quality Testing parameter and methods of analysis 12
Table: 4.6 Sampling Points for Ground Water Quality Measurement 12
Table: 4.7 Ground Water Quality Testing parameter and methods of analysis 12
Table: 4.8 Ambient Air and Noise Quality 14
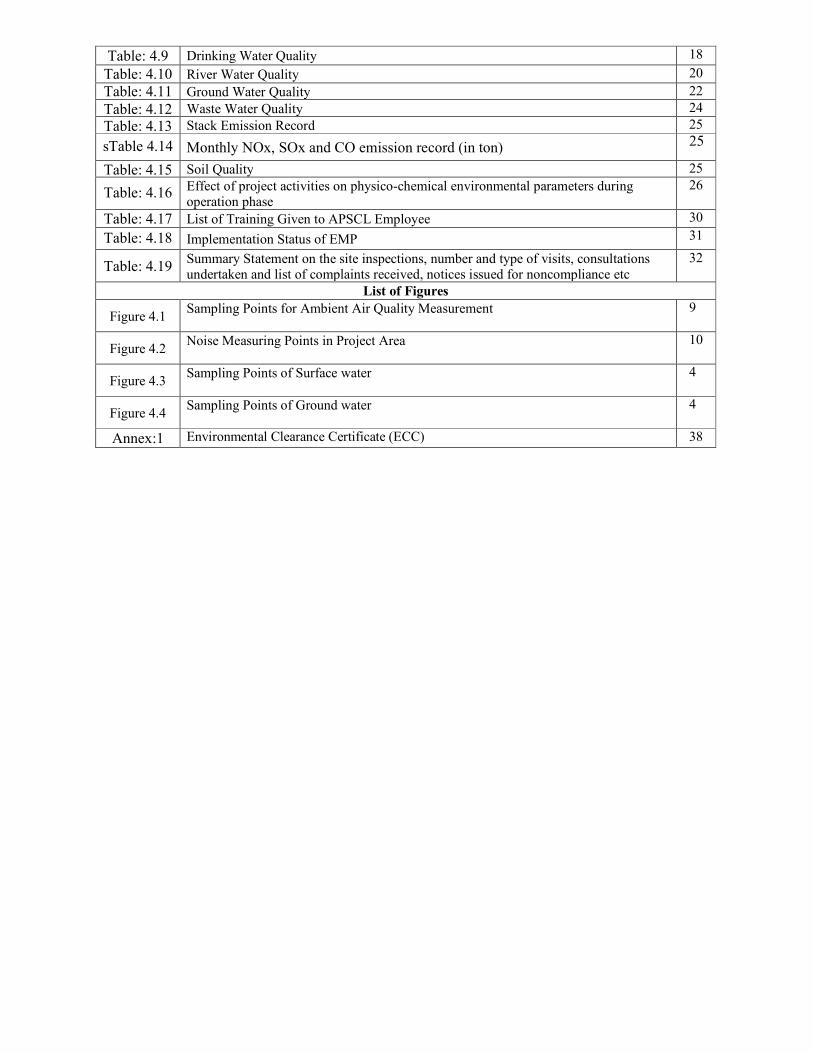
Table: 4.9 Drinking Water Quality 18
Table: 4.10 River Water Quality 20
Table: 4.11 Ground Water Quality 22
Table: 4.12 Waste Water Quality 24
Table: 4.13 Stack Emission Record 25
sTable 4.14 Monthly NOx, SOx and CO emission record (in ton) 25
Table: 4.15 Soil Quality 25
Table: 4.16 Effect of project activities on physico-chemical environmental parameters during operation phase
26
Table: 4.17 List of Training Given to APSCL Employee 30
Table: 4.18 Implementation Status of EMP 31
Table: 4.19 Summary Statement on the site inspections, number and type of visits, consultations undertaken and list of complaints received, notices issued for noncompliance etc
32
List of Figures
Figure 4.1 Sampling Points for Ambient Air Quality Measurement 9
Figure 4.2 Noise Measuring Points in Project Area 10
Figure 4.3 Sampling Points of Surface water 4
Figure 4.4 Sampling Points of Ground water 4
Annex:1 Environmental Clearance Certificate (ECC) 38
1
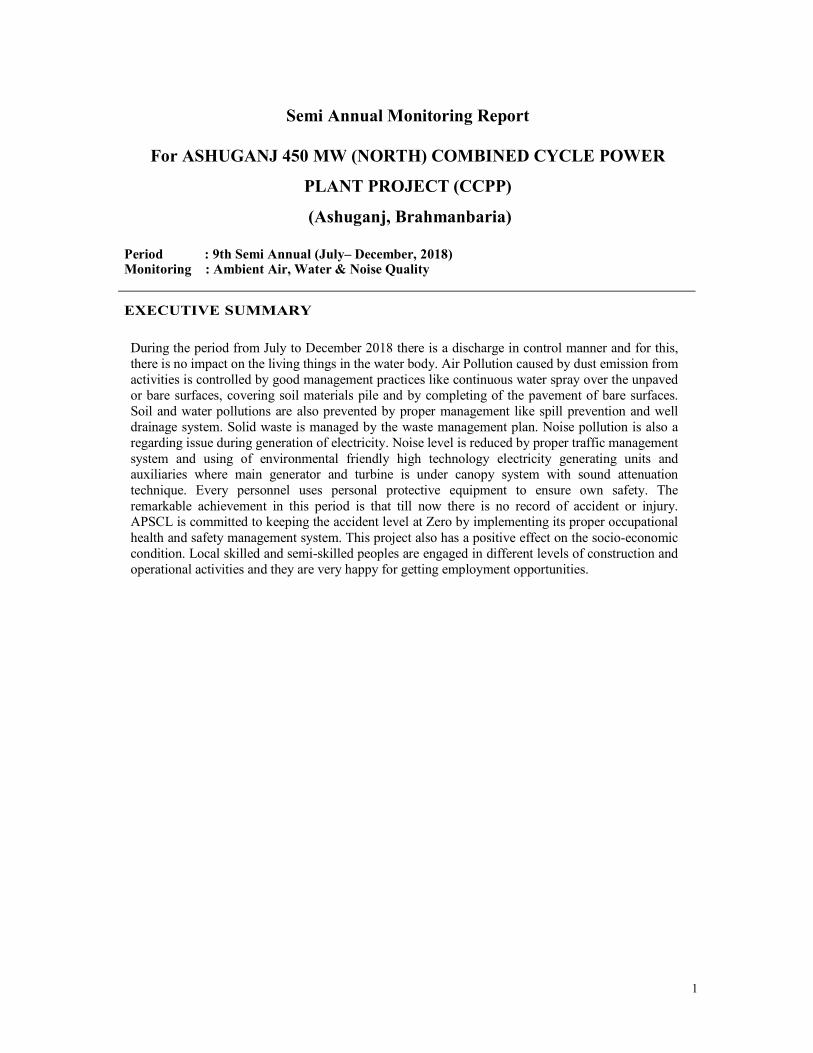
Semi Annual Monitoring Report
For ASHUGANJ 450 MW (NORTH) COMBINED CYCLE POWER
PLANT PROJECT (CCPP)
(Ashuganj, Brahmanbaria)
Period : 9th Semi Annual (July– December, 2018) Monitoring : Ambient Air, Water & Noise Quality
EXECUTIVE SUMMARY
During the period from July to December 2018 there is a discharge in control manner and for this,
there is no impact on the living things in the water body. Air Pollution caused by dust emission from
activities is controlled by good management practices like continuous water spray over the unpaved
or bare surfaces, covering soil materials pile and by completing of the pavement of bare surfaces.
Soil and water pollutions are also prevented by proper management like spill prevention and well
drainage system. Solid waste is managed by the waste management plan. Noise pollution is also a
regarding issue during generation of electricity. Noise level is reduced by proper traffic management
system and using of environmental friendly high technology electricity generating units and auxiliaries where main generator and turbine is under canopy system with sound attenuation
technique. Every personnel uses personal protective equipment to ensure own safety. The
remarkable achievement in this period is that till now there is no record of accident or injury. APSCL is committed to keeping the accident level at Zero by implementing its proper occupational
health and safety management system. This project also has a positive effect on the socio-economic
condition. Local skilled and semi-skilled peoples are engaged in different levels of construction and
operational activities and they are very happy for getting employment opportunities.
2
1.0 INTRODUCTION
The objective of the environmental s a f e g u a r d management and monitoring is to record
environmental impacts resulting from the project activities and to ensure implementation of the
“mitigation measures” identified earlier in order to reduce adverse impacts and enhance positive
impacts from specific project activities. Besides, it would also address any unexpected or
unforeseen environmental impacts that operation phases of the project.
The EMP clearly lay out: (a) the measures to be taken during both construction and operation
phases of the project to eliminate or offset adverse environmental impacts, or reduce them to
acceptable levels; (b) the actions needed to implement these measures; and (c) a monitoring plan to
assess the effectiveness of the mitigation measures employed. Environmental management and
monitoring activities for the under construction power plant project could be divided into
management and monitoring: (a) during construction phase, and (b) during operation phase.
The application of this plan involved an environmental control and monitoring of the work by a
technical team to verify compliance with all the indications, limitations or environmental restrictions
set forth in the Environmental Management Plan (EMP), EIA and the Project, with the minimize
damage caused by work on the environment.
The information obtained by the implementation of the Environmental Action Plan is required to
define preventive measures or define corrective actions.
The information generated as a result of implementing the Environmental Action Plan must be duly
forwarded to the Department of Environment (DoE).
1.1 Brief Project Description
A Combined Cycle Power Plant of Total net 450±20% MW capacity at site condition (35 ºC, 1.013
mbar, 98% R.H.) is installed by Ashuganj Power Station Company Limited inside the existing premises.
The Power Station is connected with the Ashuganj 400 KV Gas Insulated Switchgear (GIS) Grid Sub-
Station and also with Ashuganj 230 KV Gas Insulated Switchgear (GIS) Grid Sub-Station with
necessary electrical equipment. The basic concept for the Ashuganj North project is a CCGT Plant
based on one Gas Turbine Generator unit (GTG), one Unfired Heat Recovery Steam Generator and one
Steam Turbine Generator unit (STG). Water-steam cycle is of three pressure levels (HP, IP and LP) with
reheat. The Ashuganj 450 Mw (North) Combined Cycle Power Plant Project complex is located on the
Southern bank of Meghna river, just outside and to the East of Bhairab Bridge. The power plant is
located in Ashuganj under Ashuganj Upazilla. The entire p o w e r p l a n t is completely enclosed, covers
an area of about 10.17 acres and is owned by the Ashuganj Power Station Company Limited (APSCL).
3
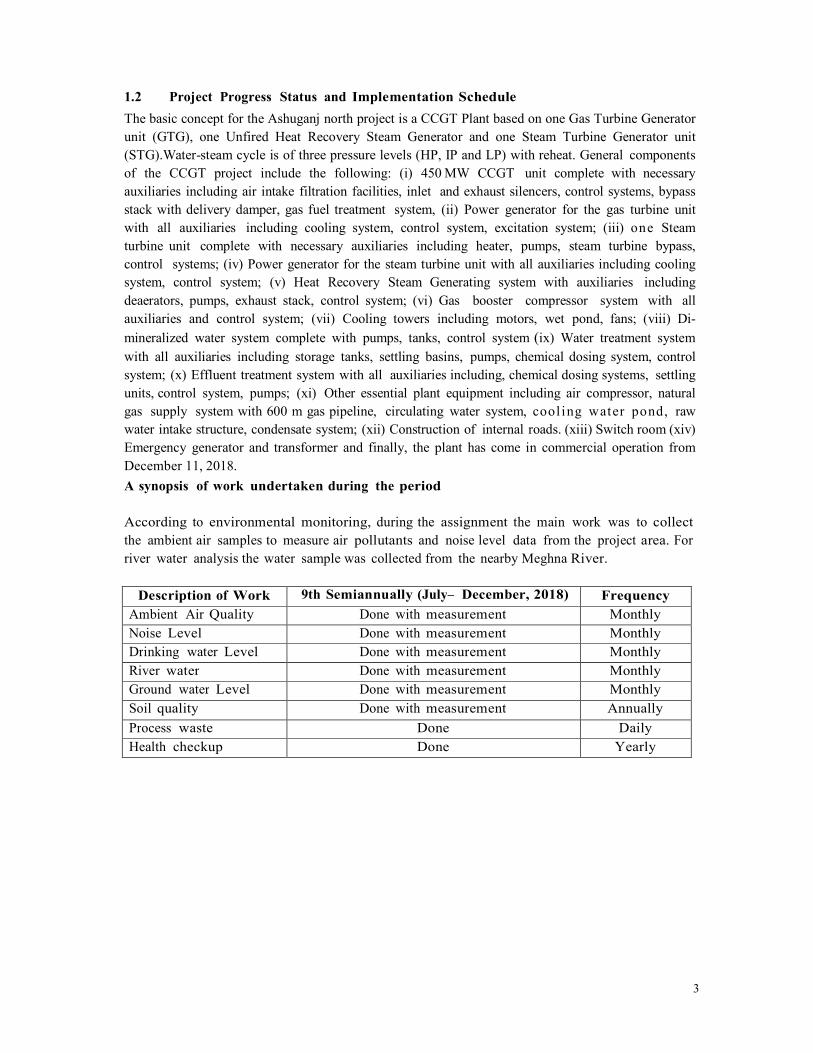
1.2 Project Progress Status and Implementation Schedule
The basic concept for the Ashuganj north project is a CCGT Plant based on one Gas Turbine Generator
unit (GTG), one Unfired Heat Recovery Steam Generator and one Steam Turbine Generator unit
(STG).Water-steam cycle is of three pressure levels (HP, IP and LP) with reheat. General components
of the CCGT project include the following: (i) 450 MW CCGT unit complete with necessary
auxiliaries including air intake filtration facilities, inlet and exhaust silencers, control systems, bypass
stack with delivery damper, gas fuel treatment system, (ii) Power generator for the gas turbine unit
with all auxiliaries including cooling system, control system, excitation system; (iii) o n e Steam
turbine unit complete with necessary auxiliaries including heater, pumps, steam turbine bypass,
control systems; (iv) Power generator for the steam turbine unit with all auxiliaries including cooling
system, control system; (v) Heat Recovery Steam Generating system with auxiliaries including
deaerators, pumps, exhaust stack, control system; (vi) Gas booster compressor system with all
auxiliaries and control system; (vii) Cooling towers including motors, wet pond, fans; (viii) Di-
mineralized water system complete with pumps, tanks, control system (ix) Water treatment system
with all auxiliaries including storage tanks, settling basins, pumps, chemical dosing system, control
system; (x) Effluent treatment system with all auxiliaries including, chemical dosing systems, settling
units, control system, pumps; (xi) Other essential plant equipment including air compressor, natural
gas supply system with 600 m gas pipeline, circulating water system, c o o l i n g w a t e r p o n d , raw
water intake structure, condensate system; (xii) Construction of internal roads. (xiii) Switch room (xiv)
Emergency generator and transformer and finally, the plant has come in commercial operation from
December 11, 2018.
A synopsis of work undertaken during the period
According to environmental monitoring, during the assignment the main work was to collect
the ambient air samples to measure air pollutants and noise level data from the project area. For
river water analysis the water sample was collected from the nearby Meghna River.
Description of Work 9th Semiannually (July– December, 2018) Frequency
Ambient Air Quality Done with measurement Monthly
Noise Level Done with measurement Monthly
Drinking water Level Done with measurement Monthly
River water Done with measurement Monthly
Ground water Level Done with measurement Monthly
Soil quality Done with measurement Annually
Process waste Done Daily
Health checkup Done Yearly
4
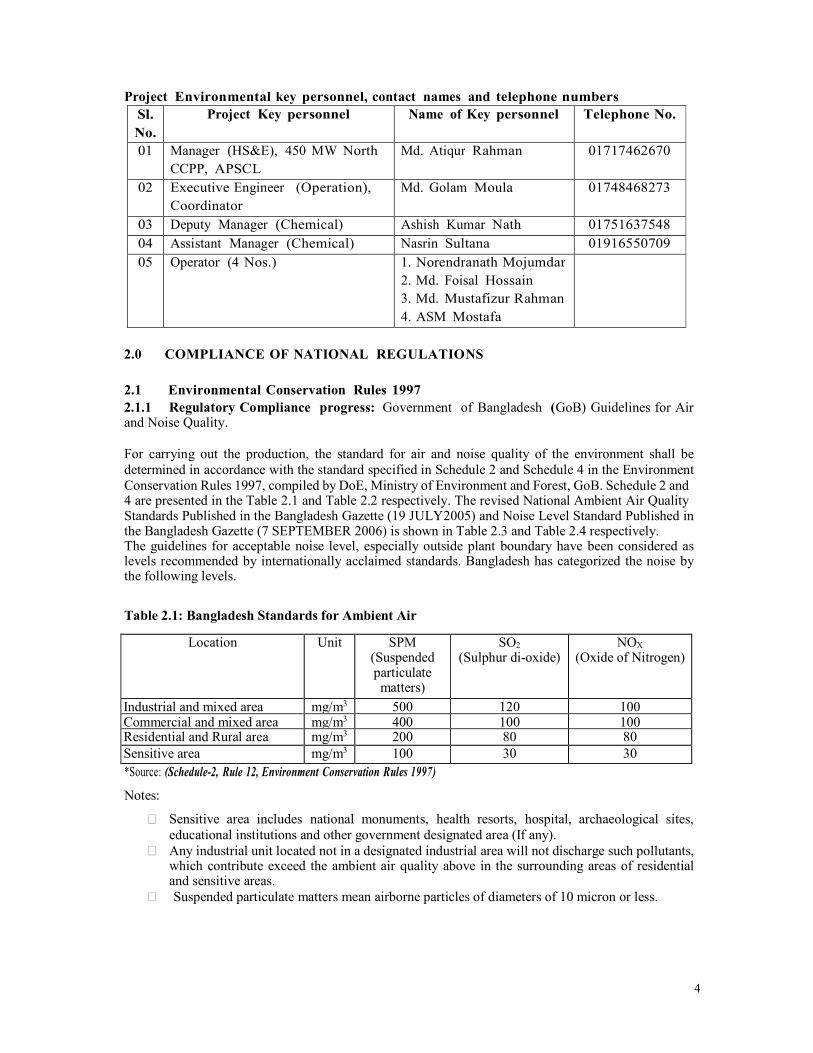
Project Environmental key personnel, contact names and telephone numbers
Sl.
No.
Project Key personnel Name of Key personnel Telephone No.
01 Manager (HS&E), 450 MW North
CCPP, APSCL
Md. Atiqur Rahman 01717462670
02 Executive Engineer (Operation),
Coordinator
Md. Golam Moula 01748468273
03 Deputy Manager (Chemical) Ashish Kumar Nath 01751637548
04 Assistant Manager (Chemical) Nasrin Sultana 01916550709
05 Operator (4 Nos.) 1. Norendranath Mojumdar
2. Md. Foisal Hossain
3. Md. Mustafizur Rahman
4. ASM Mostafa
2.0 COMPLIANCE OF NATIONAL REGULATIONS
2.1 Environmental Conservation Rules 1997
2.1.1 Regulatory Compliance progress: Government of Bangladesh (GoB) Guidelines for Air and Noise Quality.
For carrying out the production, the standard for air and noise quality of the environment shall be
determined in accordance with the standard specified in Schedule 2 and Schedule 4 in the Environment
Conservation Rules 1997, compiled by DoE, Ministry of Environment and Forest, GoB. Schedule 2 and 4 are presented in the Table 2.1 and Table 2.2 respectively. The revised National Ambient Air Quality Standards Published in the Bangladesh Gazette (19 JULY2005) and Noise Level Standard Published in the Bangladesh Gazette (7 SEPTEMBER 2006) is shown in Table 2.3 and Table 2.4 respectively. The guidelines for acceptable noise level, especially outside plant boundary have been considered as levels recommended by internationally acclaimed standards. Bangladesh has categorized the noise by the following levels.
Table 2.1: Bangladesh Standards for Ambient Air
Location Unit SPM (Suspended particulate matters)
SO2
(Sulphur di-oxide) NOX
(Oxide of Nitrogen)
Industrial and mixed area mg/m3 500 120 100
Commercial and mixed area mg/m3 400 100 100
Residential and Rural area mg/m3 200 80 80
Sensitive area mg/m3 100 30 30
*Source: (Schedule-2, Rule 12, Environment Conservation Rules 1997)
Notes:
Sensitive area includes national monuments, health resorts, hospital, archaeological sites,
educational institutions and other government designated area (If any).
Any industrial unit located not in a designated industrial area will not discharge such pollutants, which contribute exceed the ambient air quality above in the surrounding areas of residential and sensitive areas.
Suspended particulate matters mean airborne particles of diameters of 10 micron or less.
5
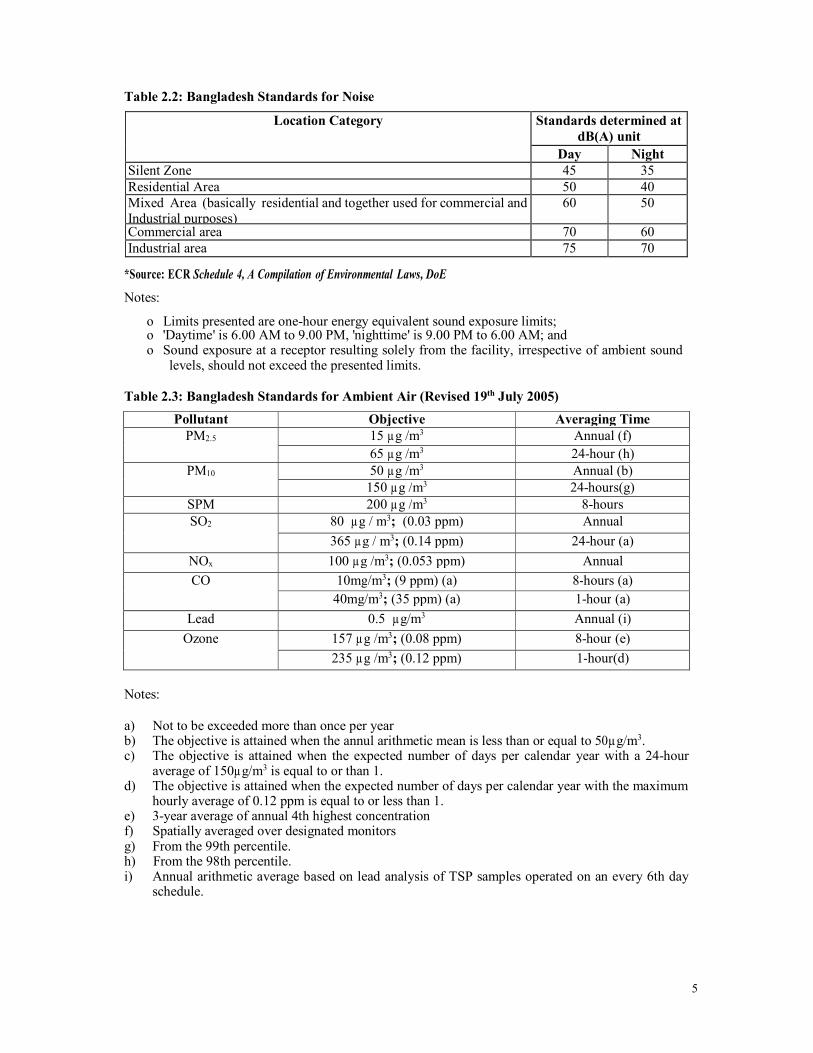
Table 2.2: Bangladesh Standards for Noise
Location Category Standards determined at
dB(A) unit
Day Night
Silent Zone 45 35
Residential Area 50 40
Mixed Area (basically residential and together used for commercial and Industrial purposes)
60 50
Commercial area 70 60
Industrial area 75 70
*Source: ECR Schedule 4, A Compilation of Environmental Laws, DoE
Notes:
o Limits presented are one-hour energy equivalent sound exposure limits; o 'Daytime' is 6.00 AM to 9.00 PM, 'nighttime' is 9.00 PM to 6.00 AM; and o Sound exposure at a receptor resulting solely from the facility, irrespective of ambient sound
levels, should not exceed the presented limits. Table 2.3: Bangladesh Standards for Ambient Air (Revised 19th July 2005)
Pollutant Objective Averaging Time
PM2.5 15 µ g /m3 Annual (f)
65 µ g /m3 24-hour (h)
PM10 50 µ g /m3 Annual (b)
150 µ g /m3 24-hours(g)
SPM 200 µ g /m3 8-hours
SO2 80 µ g / m3; (0.03 ppm) Annual
365 µ g / m3; (0.14 ppm) 24-hour (a)
NOx 100 µ g /m3; (0.053 ppm) Annual
CO 10mg/m3; (9 ppm) (a) 8-hours (a)
40mg/m3; (35 ppm) (a) 1-hour (a)
Lead 0.5 µ g/m3 Annual (i)
Ozone 157 µ g /m3; (0.08 ppm) 8-hour (e)
235 µ g /m3; (0.12 ppm) 1-hour(d)
Notes: a) Not to be exceeded more than once per year b) The objective is attained when the annul arithmetic mean is less than or equal to 50µ g/m3. c) The objective is attained when the expected number of days per calendar year with a 24-hour
average of 150µ g/m3 is equal to or than 1. d) The objective is attained when the expected number of days per calendar year with the maximum
hourly average of 0.12 ppm is equal to or less than 1. e) 3-year average of annual 4th highest concentration f) Spatially averaged over designated monitors g) From the 99th percentile. h) From the 98th percentile. i) Annual arithmetic average based on lead analysis of TSP samples operated on an every 6th day
schedule.
6
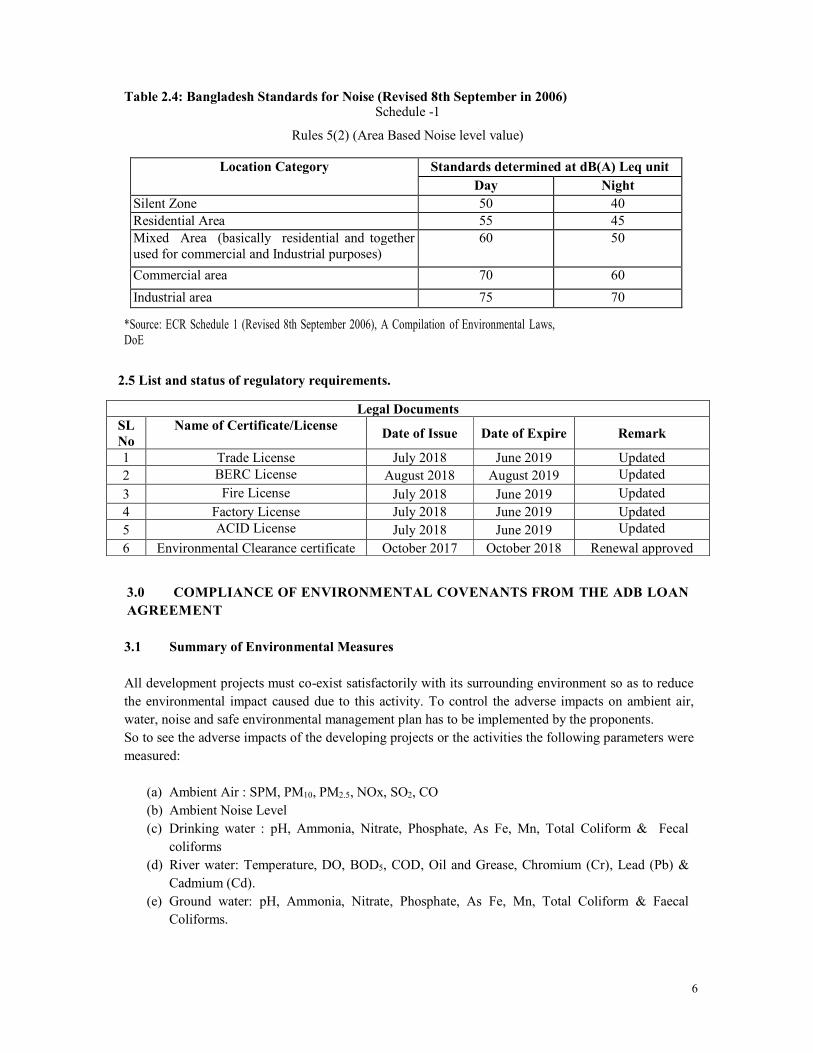
Table 2.4: Bangladesh Standards for Noise (Revised 8th September in 2006) Schedule -1
Rules 5(2) (Area Based Noise level value)
Location Category Standards determined at dB(A) Leq unit
Day Night
Silent Zone 50 40
Residential Area 55 45
Mixed Area (basically residential and together
used for commercial and Industrial purposes)
60 50
Commercial area 70 60
Industrial area 75 70
*Source: ECR Schedule 1 (Revised 8th September 2006), A Compilation of Environmental Laws, DoE
2.5 List and status of regulatory requirements.
3.0 COMPLIANCE OF ENVIRONMENTAL COVENANTS FROM THE ADB LOAN
AGREEMENT
3.1 Summary of Environmental Measures
All development projects must co-exist satisfactorily with its surrounding environment so as to reduce
the environmental impact caused due to this activity. To control the adverse impacts on ambient air,
water, noise and safe environmental management plan has to be implemented by the proponents.
So to see the adverse impacts of the developing projects or the activities the following parameters were
measured:
(a) Ambient Air : SPM, PM10, PM2.5, NOx, SO2, CO
(b) Ambient Noise Level
(c) Drinking water : pH, Ammonia, Nitrate, Phosphate, As Fe, Mn, Total Coliform & Fecal
coliforms
(d) River water: Temperature, DO, BOD5, COD, Oil and Grease, Chromium (Cr), Lead (Pb) &
Cadmium (Cd).
(e) Ground water: pH, Ammonia, Nitrate, Phosphate, As Fe, Mn, Total Coliform & Faecal
Coliforms.
Legal Documents
SL
No
Name of Certificate/License Date of Issue Date of Expire Remark
1 Trade License July 2018 June 2019 Updated
2 BERC License August 2018 August 2019 Updated
3 Fire License July 2018 June 2019 Updated
4 Factory License July 2018 June 2019 Updated
5 ACID License July 2018 June 2019 Updated
6 Environmental Clearance certificate October 2017 October 2018 Renewal approved
7
3.2 Enhancement Measurement
Distribution of designated waste bins/cans, where appropriate and segregation of waste
from the source.
Waste minimization, recycle and reuse
Proper disposal of solid waste (in designated waste bins)
Clean bill of health, a condition for employment
Regular medical monitoring of workers
Scheduling of deliveries during non-school hours and after regular working hours
Installation of proper traffic sign and warnings
Speed reduction to 10 km per hour within the plant area
Keeping vehicles under good condition, with regular checking of vehicle condition to
ensure compliance with national standards Watering unpaved/dusty roads
Sprinkling and covering stockpiles
Covering top of trucks carrying materials to the site and carrying construction debris away
from the site.
Use of noise suppressors and mufflers in heavy equipment
Avoiding, as much as possible, construction equipment producing excessive noise during
school hours and also at night.
• Updated environment friendly technology with 57.99% plant efficiency at combined cycle
mode and low noise equipment are installed.
• Acoustic enclosure of turbine compartments consist of single layer of 2 mm thick steel outer plate, 75 mm thick rock wool insulation and perforated steel inner plate.
• Acoustic enclosure of exhaust diffusers consists of single layer of 4mm thick steel outer
plate, 150 mm thick rock wool insulation and 4mm thick steel inner plate.
• Silencing on the inlet system via an 8 foot long parallel acoustic baffle.
• Silencers are used on vents and ventilators.
• Proper stack height is maintained with silencers fitted.
• Proper acoustic design for the power house building, control building and all other
structures in the plant area.
• To prevent noise generating from vibration was considered during plant design. So, very
well balanced vibration preventing structure is constructed for turbine to be operated at
high rotational speed.
• Use of all kinds of respective personal protective equipment (ear muff and ear plug for
noise) are mandatory for all in the plant site.
• Noise levels are monitored regularly within the communities where nearest potentially
affected noise sensitive receptors are identified in order to take timely corrective measures, if needed.
• Traffic noise is controlled by proper traffic management. Speed limit is restricted as 10
Km/Hr in plant site. Avoiding prolonged exposure to noise (produced by equipment) by workers.
Creating a buffer zone between the school and construction site to reduce disturbance to
normal schooling and to protect school children from health hazard.
Not using equipment such as stone crushers at site, which produce significant amount of
particulate matter.
Keeping construction equipment and generators in good operating condition
Using equipment, especially generators with high levels of emission control
Immediate use of construction spoils as filling materials.
Immediate disposal/sale of excavated materials.
Continuous watering of bare areas.
8
Hauling of construction debris away from the site and their appropriate disposal in a sanitary
landfill.
Good house keeping
Proper handling of lubricating oil and fuel
Collection, proper treatment, and disposal of spills
Rapid removal of aquatic macrophytes and water hyacinth from water intake point in CW
pump station to prevent spreading of bad odor and to prevent environmental pollution.
Local people employed in the project activities
Installation of sufficient and relevant warning signage in all places
Using low nitrogen oxide burners, as specified in the bid document.
Installation of continuous emission monitoring station (CEMS) for stack emission
monitoring
Planting of trees around the project site, especially along the northern boundary of the
school and residential areas located close to the project site Restrictions also be imposed on
installation of industries in the area that emit significant amount of particulate matter.
Provision of silencers for generators and turbines
Planting of trees around the project site
Boarding on the school boundary walls
Regular plant maintenance
Regular noise monitoring
Use of ear-muffs and ear-plugs by plant personnel working in the generator and turbine
facilities of the plant.
4.0 COMPLIANCE TO ENVIRONMENTAL MANAGEMENT PLAN
4.1 Major Environmental activities of the project
Major Environmental Activities of the project during operational period are given below:
Influx of workers
Transportation of equipment, materials and personnel; storage of materials
Power plant operational activities
4.2 Methodology
4.2.1 Methodology for Air Quality Assessment
During the o p e r a t i o n phase of this power plant project, the important sources of emissions would
include those from the operations of equipment and machineries, vehicles carrying materials to
the site and taking debris out of the site and stack emission for electricity generation.
Monitoring and measurement of Suspended Particulate Matter (SPM), Fine Particulate Matter (PM2.5) &
Repairable Particulate Matter (PM10) was accomplished by Handheld Laser Particle Counter (Model
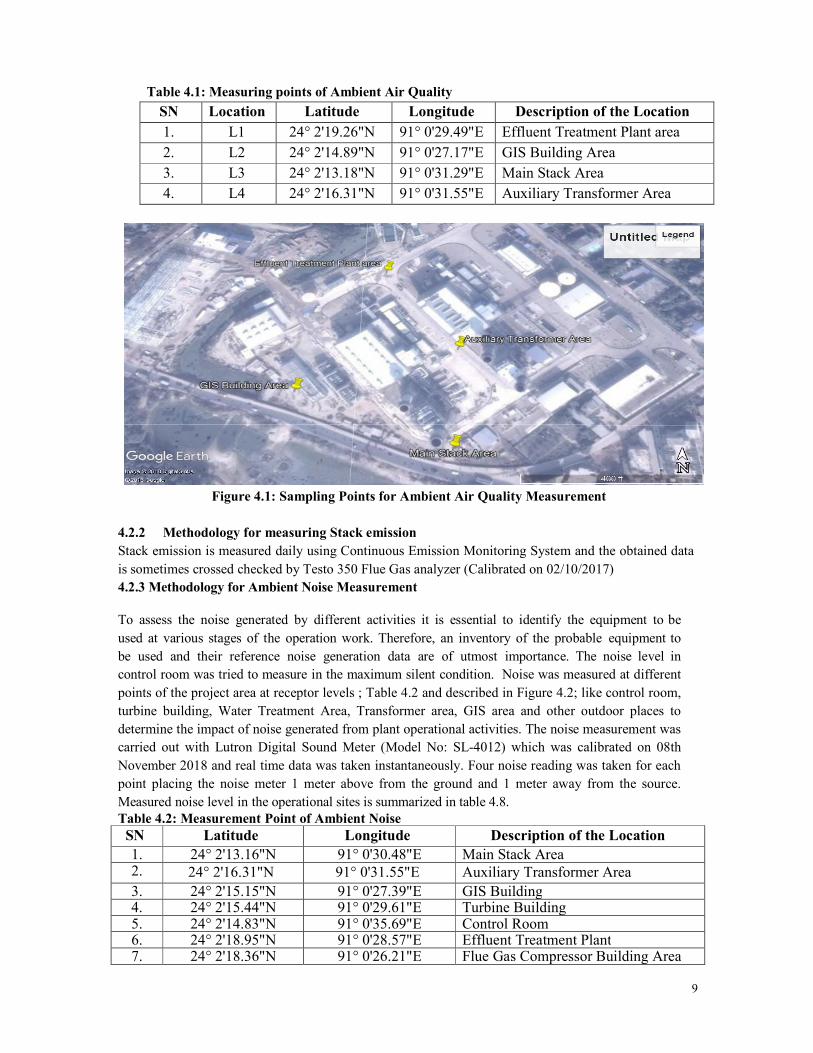
No: P611, AIRY Technology, Inc, USA) which was calibrated on 21st OCTOBER 2018. Ambient Air
Quality monitoring was done from four different places at Ashuganj 450 MW North Combined Cycle
power plant project described in Table 4.1 and illustrated in Figure 4.1 . Test Results of Ambient Air
Quality from these different places are presented in Table 4.8.
9
Table 4.1: Measuring points of Ambient Air Quality
SN Location Latitude Longitude Description of the Location
1. L1 24° 2'19.26"N 91° 0'29.49"E Effluent Treatment Plant area
2. L2 24° 2'14.89"N 91° 0'27.17"E GIS Building Area
3. L3 24° 2'13.18"N 91° 0'31.29"E Main Stack Area
4. L4 24° 2'16.31"N 91° 0'31.55"E Auxiliary Transformer Area
Figure 4.1: Sampling Points for Ambient Air Quality Measurement
4.2.2 Methodology for measuring Stack emission
Stack emission is measured daily using Continuous Emission Monitoring System and the obtained data
is sometimes crossed checked by Testo 350 Flue Gas analyzer (Calibrated on 02/10/2017)
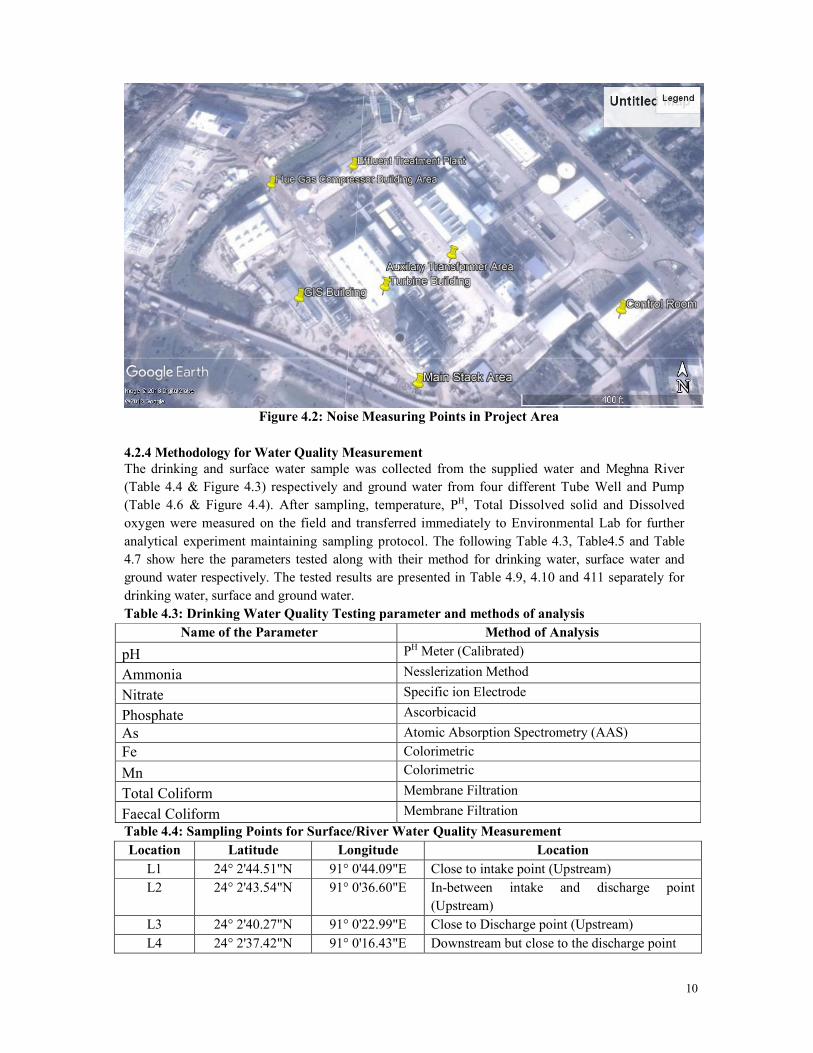
4.2.3 Methodology for Ambient Noise Measurement
To assess the noise generated by different activities it is essential to identify the equipment to be
used at various stages of the operation work. Therefore, an inventory of the probable equipment to
be used and their reference noise generation data are of utmost importance. The noise level in
control room was tried to measure in the maximum silent condition. Noise was measured at different
points of the project area at receptor levels ; Table 4.2 and described in Figure 4.2; like control room,
turbine building, Water Treatment Area, Transformer area, GIS area and other outdoor places to
determine the impact of noise generated from plant operational activities. The noise measurement was
carried out with Lutron Digital Sound Meter (Model No: SL-4012) which was calibrated on 08th
November 2018 and real time data was taken instantaneously. Four noise reading was taken for each
point placing the noise meter 1 meter above from the ground and 1 meter away from the source.
Measured noise level in the operational sites is summarized in table 4.8.
Table 4.2: Measurement Point of Ambient Noise
SN Latitude Longitude Description of the Location
1. 24° 2'13.16"N 91° 0'30.48"E Main Stack Area 2. 24° 2'16.31"N 91° 0'31.55"E Auxiliary Transformer Area
3. 24° 2'15.15"N 91° 0'27.39"E GIS Building 4. 24° 2'15.44"N 91° 0'29.61"E Turbine Building 5. 24° 2'14.83"N 91° 0'35.69"E Control Room 6. 24° 2'18.95"N 91° 0'28.57"E Effluent Treatment Plant 7. 24° 2'18.36"N 91° 0'26.21"E Flue Gas Compressor Building Area
10
Figure 4.2: Noise Measuring Points in Project Area
4.2.4 Methodology for Water Quality Measurement
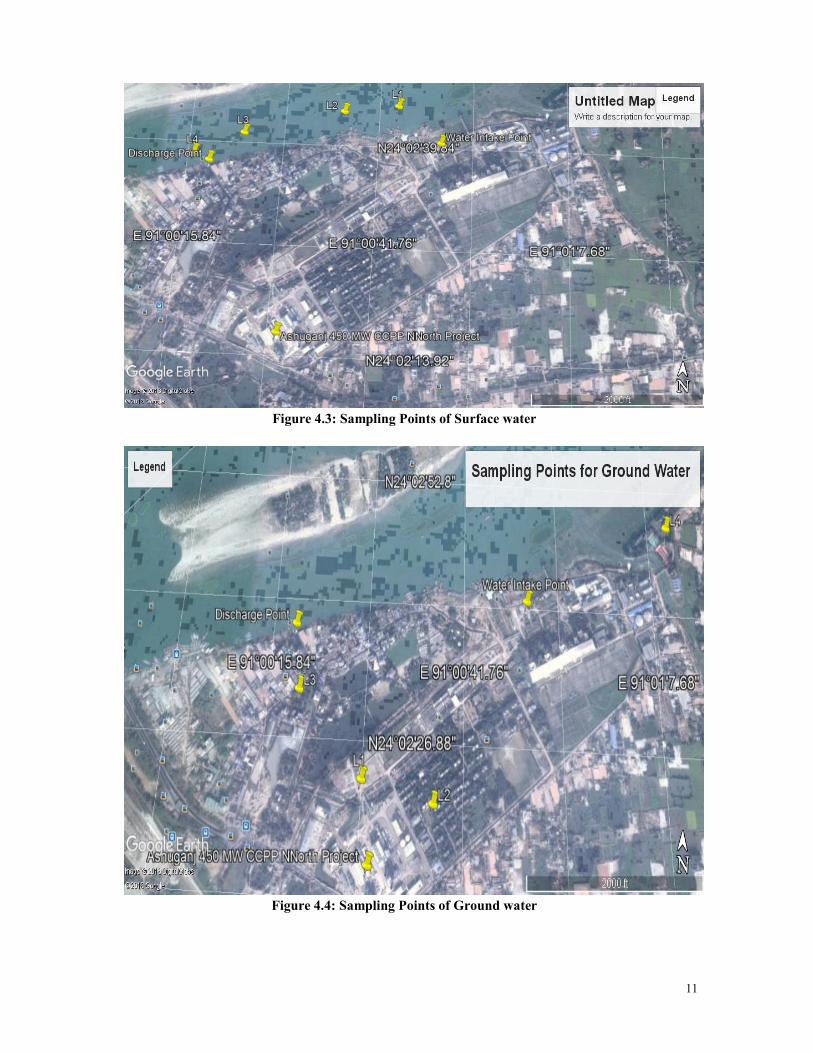
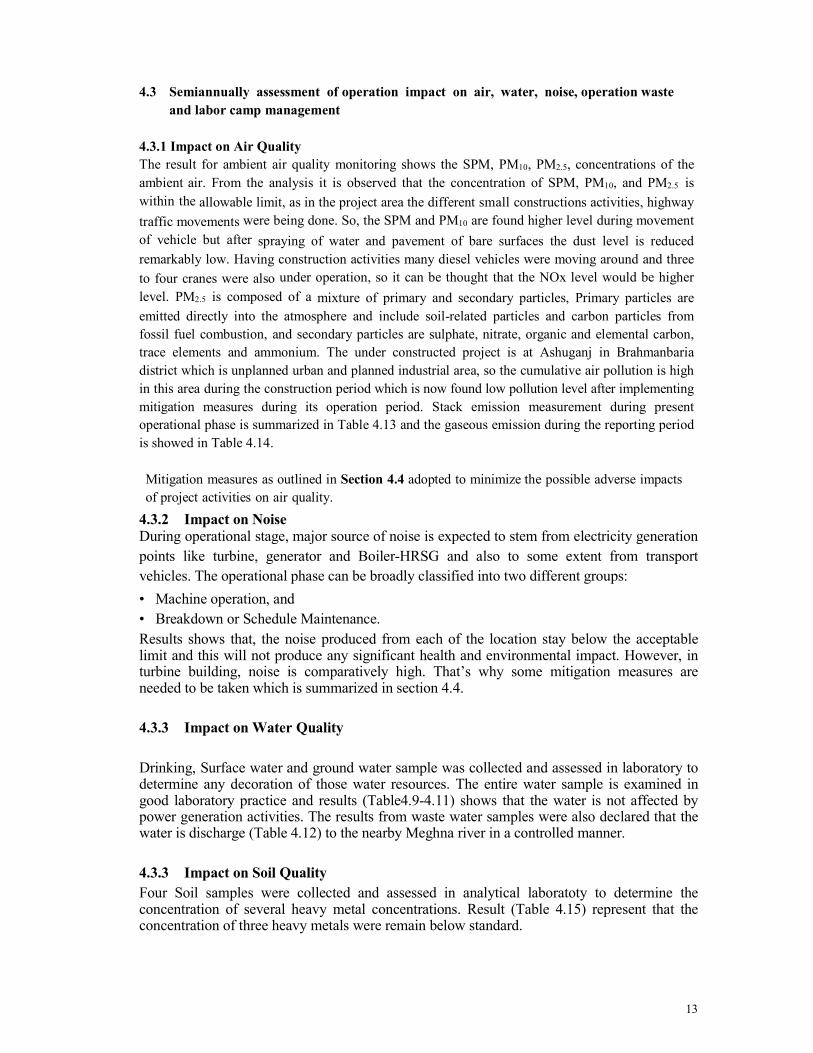
The drinking and surface water sample was collected from the supplied water and Meghna River
(Table 4.4 & Figure 4.3) respectively and ground water from four different Tube Well and Pump
(Table 4.6 & Figure 4.4). After sampling, temperature, PH, Total Dissolved solid and Dissolved
oxygen were measured on the field and transferred immediately to Environmental Lab for further
analytical experiment maintaining sampling protocol. The following Table 4.3, Table4.5 and Table
4.7 show here the parameters tested along with their method for drinking water, surface water and
ground water respectively. The tested results are presented in Table 4.9, 4.10 and 411 separately for
drinking water, surface and ground water.
Table 4.3: Drinking Water Quality Testing parameter and methods of analysis
Table 4.4: Sampling Points for Surface/River Water Quality Measurement
Location Latitude Longitude Location
L1 24° 2'44.51"N 91° 0'44.09"E Close to intake point (Upstream)
L2 24° 2'43.54"N 91° 0'36.60"E In-between intake and discharge point
(Upstream)
L3 24° 2'40.27"N 91° 0'22.99"E Close to Discharge point (Upstream)
L4 24° 2'37.42"N 91° 0'16.43"E Downstream but close to the discharge point
Name of the Parameter Method of Analysis
pH PH Meter (Calibrated)
Ammonia Nesslerization Method
Nitrate Specific ion Electrode
Phosphate Ascorbicacid
As Atomic Absorption Spectrometry (AAS)
Fe Colorimetric
Mn Colorimetric
Total Coliform Membrane Filtration
Faecal Coliform Membrane Filtration
11
Figure 4.3: Sampling Points of Surface water
Figure 4.4: Sampling Points of Ground water

12
Table 4.5: Surface/River Water Quality Testing parameter and methods of analysis
Name of the Parameter Method of Analysis
Intake Temperature Thermometer
Outfall Temperature Thermometer
Dissolved Oxygen (DO) DO meter (Calibrated)
BOD5 Dilution
COD COD Refluction
Oil & Grease Gravimetric
Chromium (Total) UV Spectrophotometry
Cadmium Atomic Absorption Spectrometry (AAS)
Lead (Pb) Atomic Absorption Spectrometry (AAS)
Table 4.6: Sampling Points for Ground Water Quality Measurement
Location Latitude Longitude
L1 24° 2'22.71"N 91° 0'28.51"E
L2 24° 2'20.94"N 91° 0'37.70"E
L3 24° 2'30.30"N 91° 0'19.72"E
L4 24° 2'47.83"N 91° 1'10.03"
Table4.7: Ground Water Quality Testing parameter and methods of analysis
Name of the Parameter Method of Analysis
pH PH Meter (Calibrated)
TDS TDS Meter (Calibrated)
Ammonia Nesslerization Method
Nitrate Specific ion Electrode
Phosphate Ascorbicacid
As Atomic Absorption Spectrometry (AAS)
Fe Colorimetric
Mn Colorimetric
Total coliform Membrane Filtration
Fecal Coliform Membrane Filtration
The Meghna River passes through from East to West direction near the project area and there are few
industries at the right bank of this river. So the water of this river is less polluted that was also found
from environmental monitoring. The DO level of this water is more than 6.5 mg/L which is within
DoE standard level. The BOD5 is also in lower level than DoE standards.
13
4.3 Semiannually assessment of operation impact on air, water, noise, operation waste
and labor camp management
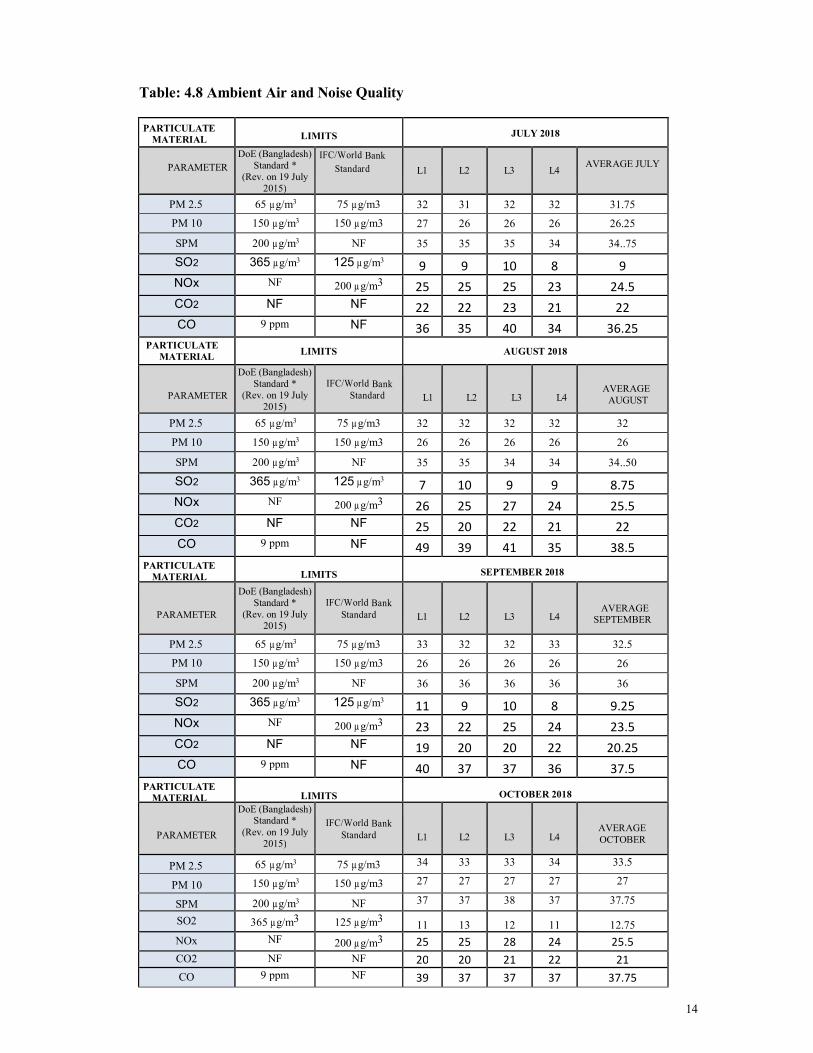
4.3.1 Impact on Air Quality
The result for ambient air quality monitoring shows the SPM, PM10, PM2.5, concentrations of the
ambient air. From the analysis it is observed that the concentration of SPM, PM10, and PM2.5 is
within the allowable limit, as in the project area the different small constructions activities, highway
traffic movements were being done. So, the SPM and PM10 are found higher level during movement
of vehicle but after spraying of water and pavement of bare surfaces the dust level is reduced
remarkably low. Having construction activities many diesel vehicles were moving around and three
to four cranes were also under operation, so it can be thought that the NOx level would be higher
level. PM2.5 is composed of a mixture of primary and secondary particles, Primary particles are
emitted directly into the atmosphere and include soil-related particles and carbon particles from
fossil fuel combustion, and secondary particles are sulphate, nitrate, organic and elemental carbon,
trace elements and ammonium. The under constructed project is at Ashuganj in Brahmanbaria
district which is unplanned urban and planned industrial area, so the cumulative air pollution is high
in this area during the construction period which is now found low pollution level after implementing
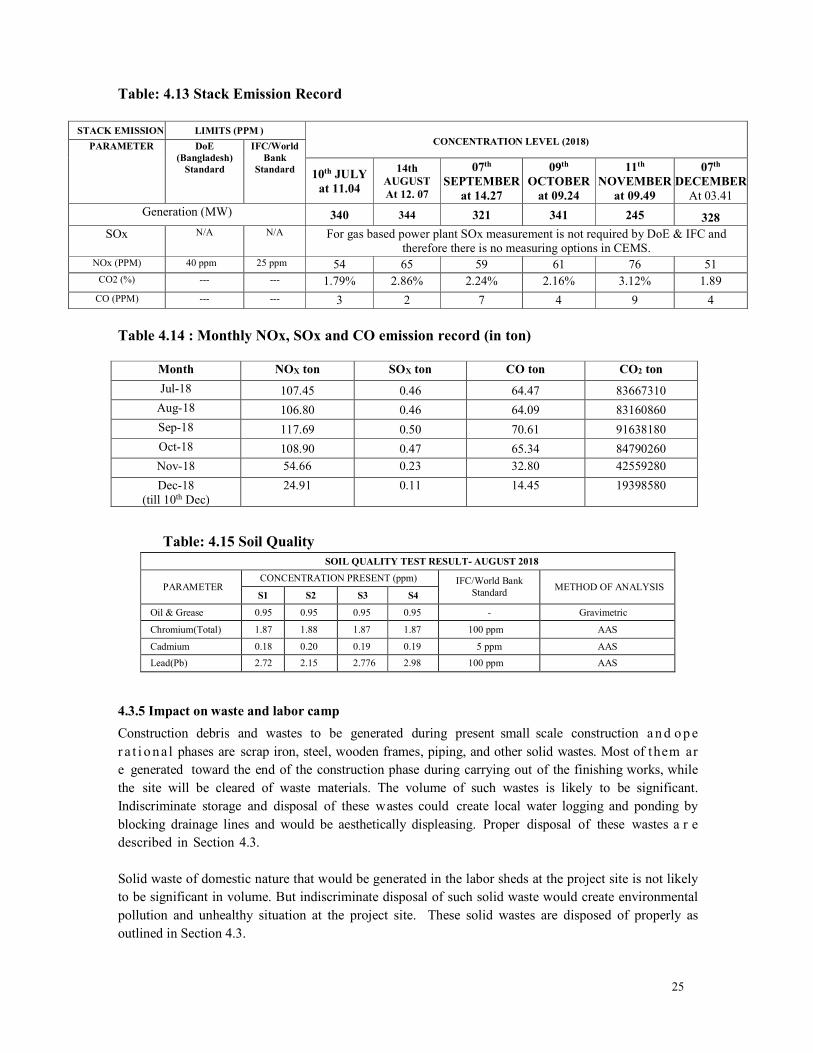
mitigation measures during its operation period. Stack emission measurement during present
operational phase is summarized in Table 4.13 and the gaseous emission during the reporting period
is showed in Table 4.14.
Mitigation measures as outlined in Section 4.4 adopted to minimize the possible adverse impacts
of project activities on air quality.
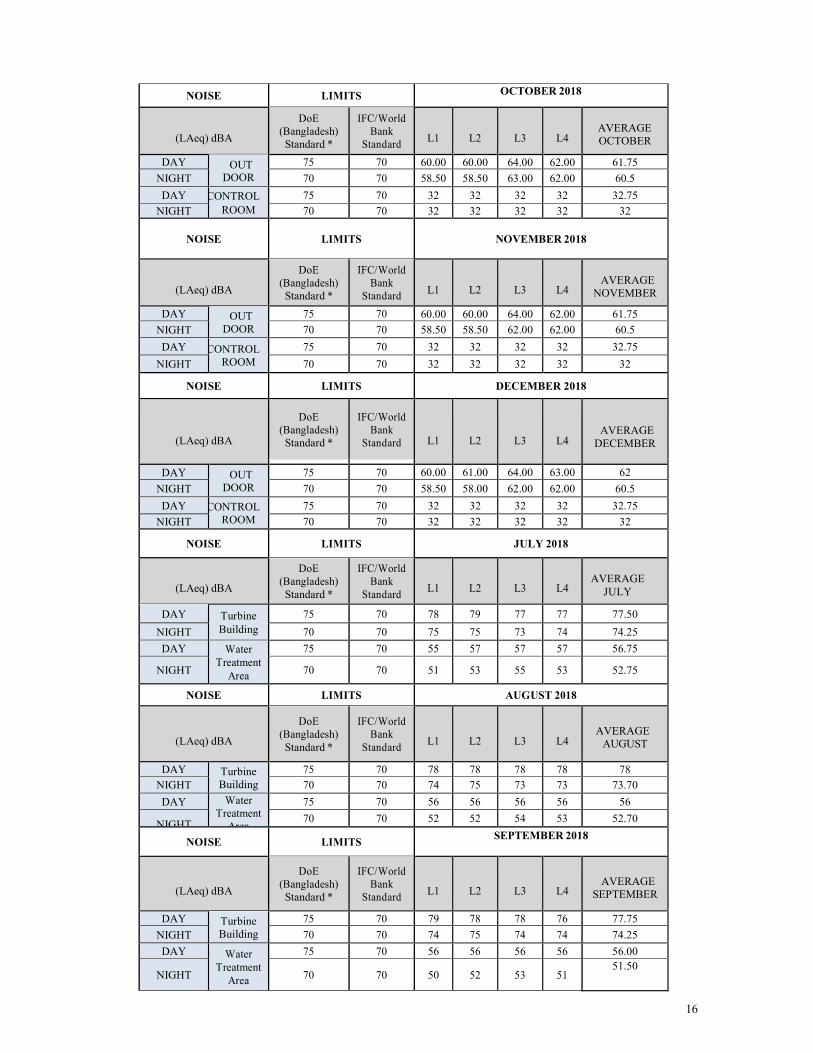
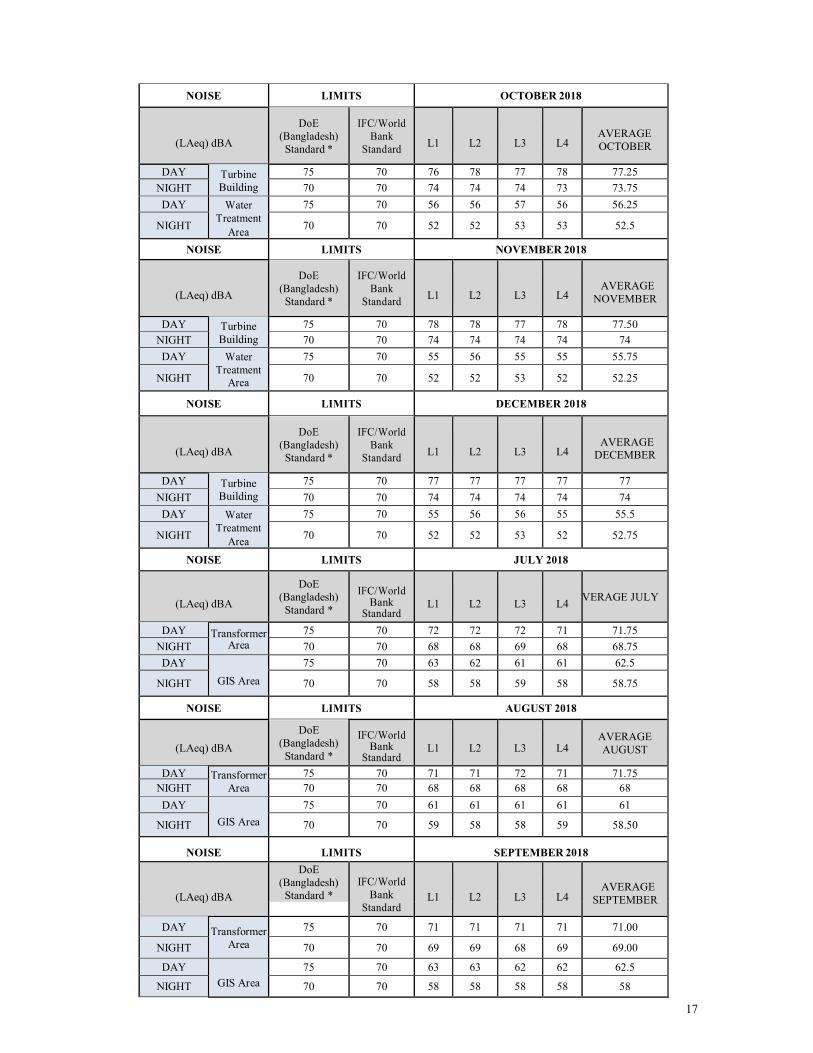
4.3.2 Impact on Noise
During operational stage, major source of noise is expected to stem from electricity generation
points like turbine, generator and Boiler-HRSG and also to some extent from transport
vehicles. The operational phase can be broadly classified into two different groups:
• Machine operation, and
• Breakdown or Schedule Maintenance.
Results shows that, the noise produced from each of the location stay below the acceptable limit and this will not produce any significant health and environmental impact. However, in turbine building, noise is comparatively high. That’s why some mitigation measures are needed to be taken which is summarized in section 4.4.
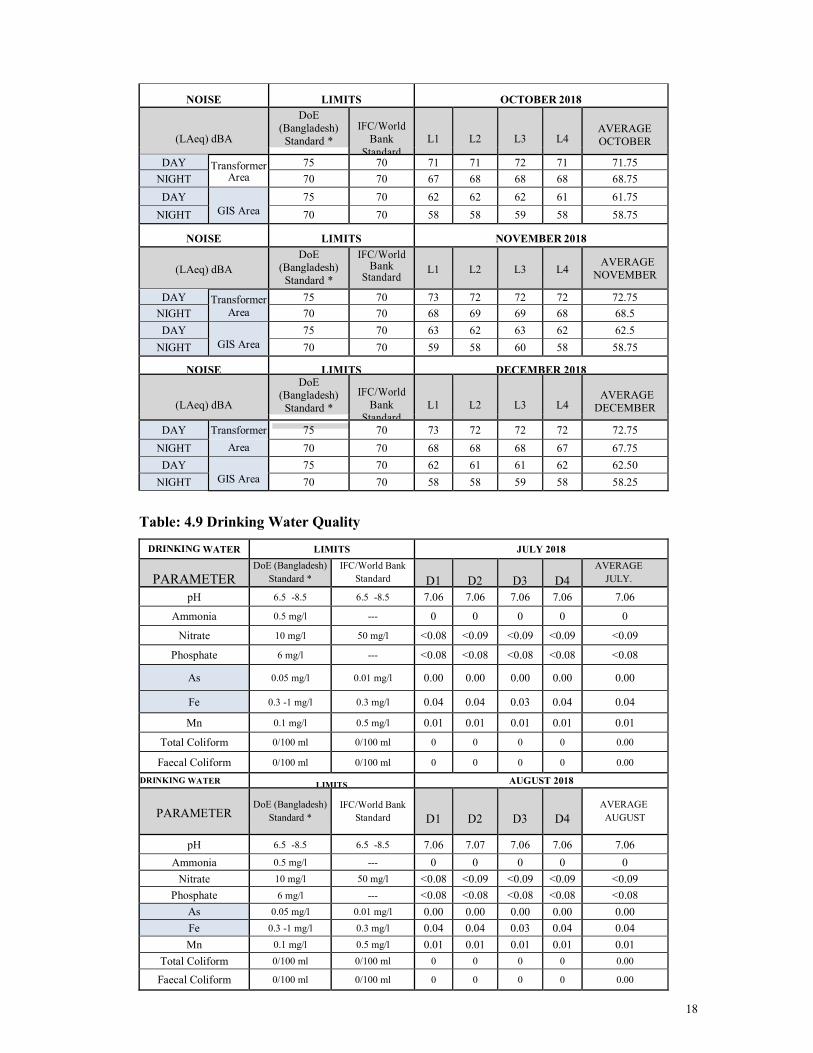
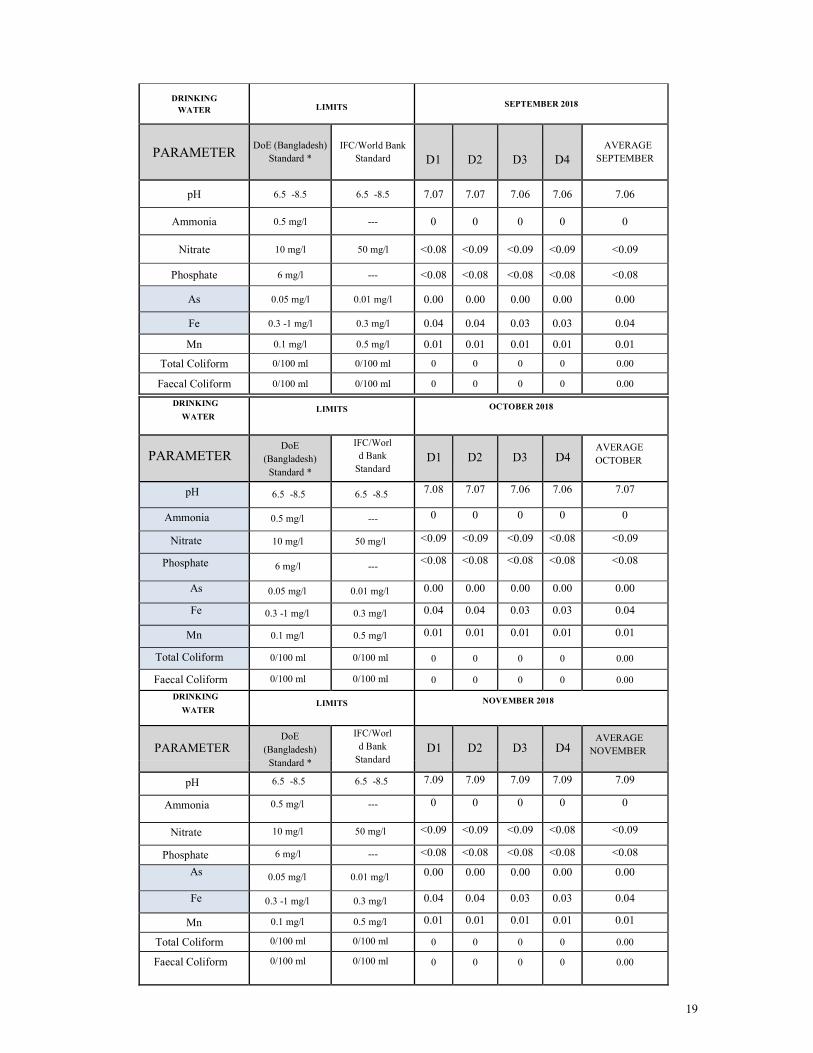
4.3.3 Impact on Water Quality
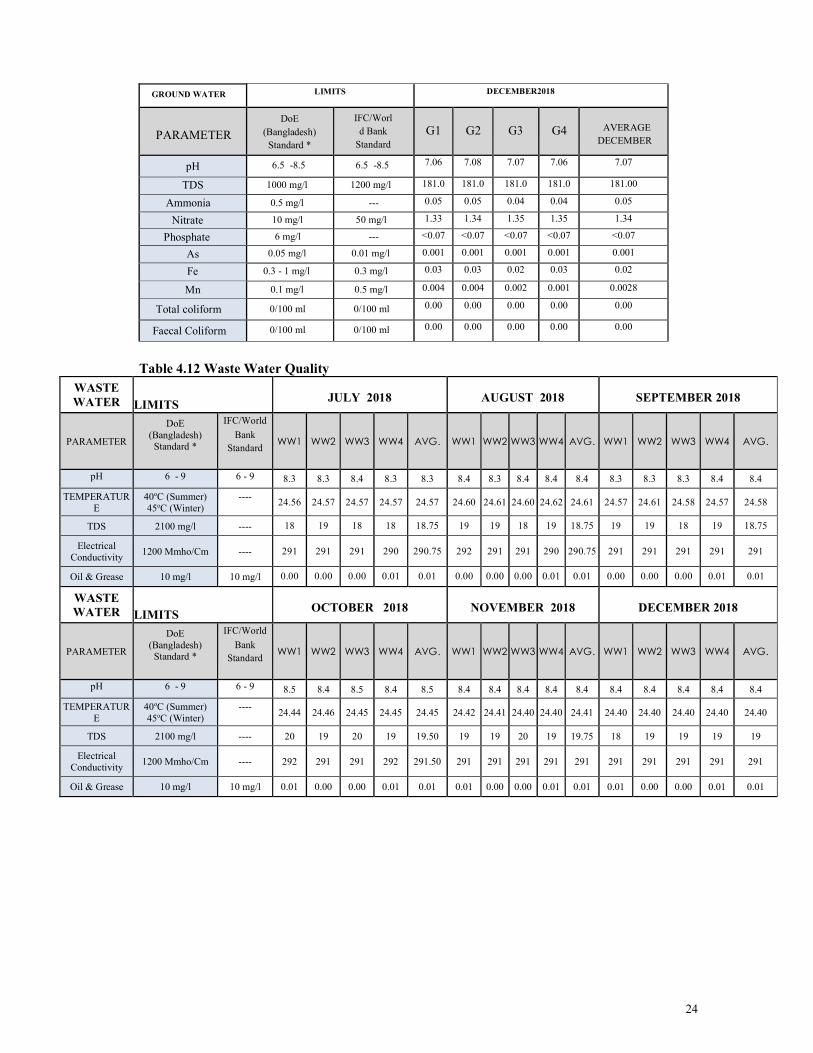
Drinking, Surface water and ground water sample was collected and assessed in laboratory to determine any decoration of those water resources. The entire water sample is examined in good laboratory practice and results (Table4.9-4.11) shows that the water is not affected by power generation activities. The results from waste water samples were also declared that the water is discharge (Table 4.12) to the nearby Meghna river in a controlled manner.
4.3.3 Impact on Soil Quality
Four Soil samples were collected and assessed in analytical laboratoty to determine the concentration of several heavy metal concentrations. Result (Table 4.15) represent that the concentration of three heavy metals were remain below standard.
14
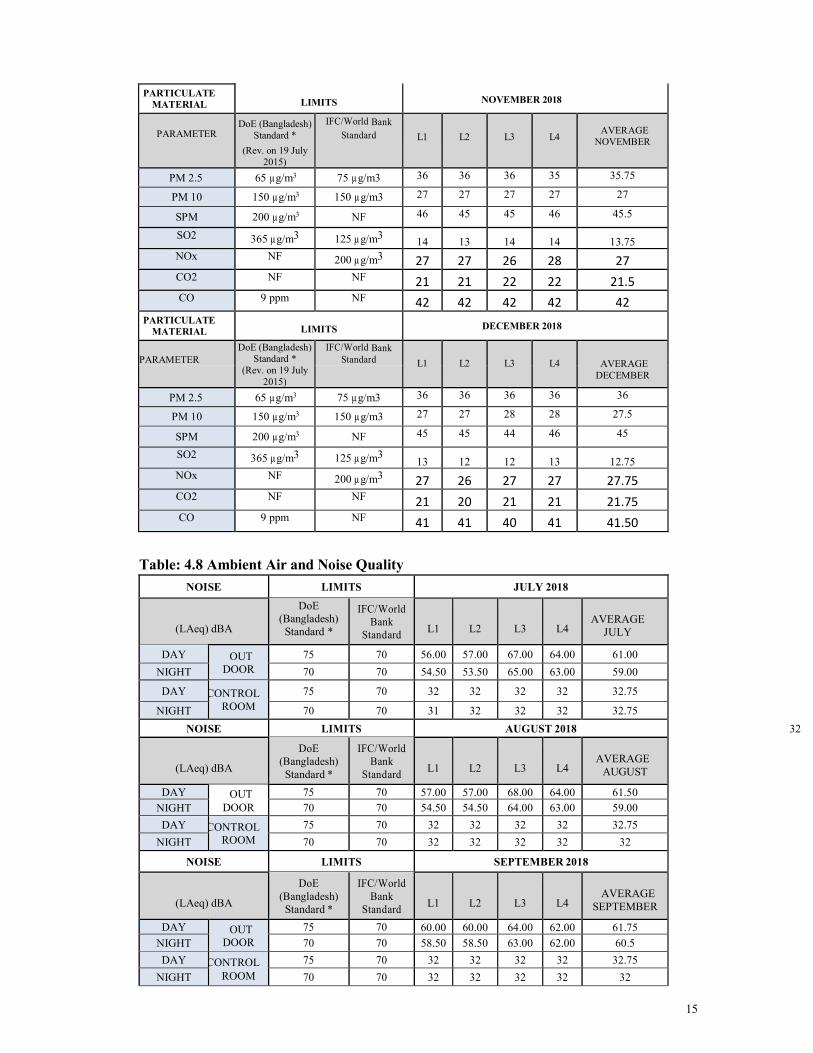
Table: 4.8 Ambient Air and Noise Quality
PARTICULATE
MATERIAL
LIMITS
JULY 2018
PARAMETER
DoE (Bangladesh)
Standard *
(Rev. on 19 July
2015)
IFC/World Bank
Standard
L1
L2
L3
L4
AVERAGE JULY
PM 2.5 65 µ g/m3 75 µ g/m3 32 31 32 32 31.75
PM 10 150 µ g/m3 150 µ g/m3 27 26 26 26 26.25
SPM 200 µ g/m3 NF 35 35 35 34 34..75
SO2 365 µ g/m3 125 µ g/m3 9 9 10 8 9
NOx NF 200 µ g/m3 25 25 25 23 24.5
CO2 NF NF 22 22 23 21 22
CO 9 ppm NF 36 35 40 34 36.25
PARTICULATE
MATERIAL LIMITS AUGUST 2018
PARAMETER
DoE (Bangladesh)
Standard *
(Rev. on 19 July
2015)
IFC/World Bank Standard
L1
L2
L3
L4
AVERAGE
AUGUST
PM 2.5 65 µ g/m3 75 µ g/m3 32 32 32 32 32
PM 10 150 µ g/m3 150 µ g/m3 26 26 26 26 26
SPM 200 µ g/m3 NF 35 35 34 34 34..50
SO2 365 µ g/m3 125 µ g/m3 7 10 9 9 8.75
NOx NF 200 µ g/m3 26 25 27 24 25.5
CO2 NF NF 25 20 22 21 22
CO 9 ppm NF 49 39 41 35 38.5
PARTICULATE
MATERIAL
LIMITS
SEPTEMBER 2018
PARAMETER
DoE (Bangladesh)
Standard *
(Rev. on 19 July
2015)
IFC/World Bank
Standard
L1
L2
L3
L4
AVERAGE
SEPTEMBER
PM 2.5 65 µ g/m3 75 µ g/m3 33 32 32 33 32.5
PM 10 150 µ g/m3 150 µ g/m3 26 26 26 26 26
SPM 200 µ g/m3 NF 36 36 36 36 36
SO2 365 µ g/m3 125 µ g/m3 11 9 10 8 9.25
NOx NF 200 µ g/m3 23 22 25 24 23.5
CO2 NF NF 19 20 20 22 20.25
CO 9 ppm NF 40 37 37 36 37.5
PARTICULATE
MATERIAL
LIMITS
OCTOBER 2018
PARAMETER
DoE (Bangladesh) Standard *
(Rev. on 19 July
2015)
IFC/World Bank
Standard
L1
L2
L3
L4
AVERAGE
OCTOBER
PM 2.5 65 µ g/m3
75 µ g/m3 34 33 33 34 33.5
PM 10 150 µ g/m3 150 µ g/m3 27 27 27 27 27
SPM 200 µ g/m3 NF 37 37 38 37 37.75
SO2 365 µ g/m3 125 µ g/m3 11 13 12 11 12.75
NOx NF 200 µ g/m3 25 25 28 24 25.5
CO2 NF NF 20 20 21 22 21
CO 9 ppm NF 39 37 37 37 37.75
15
Table: 4.8 Ambient Air and Noise Quality
NOISE LIMITS JULY 2018
(LAeq) dBA
DoE
(Bangladesh)
Standard *
IFC/World
Bank
Standard
L1
L2
L3
L4
AVERAGE
JULY
DAY OUT
DOOR
75 70 56.00 57.00 67.00 64.00 61.00
NIGHT 70 70 54.50 53.50 65.00 63.00 59.00
DAY CONTROL
ROOM
75 70 32 32 32 32 32.75
NIGHT 70 70 31 32 32 32 32.75
NOISE LIMITS AUGUST 2018 32
(LAeq) dBA
DoE
(Bangladesh)
Standard *
IFC/World
Bank
Standard
L1
L2
L3
L4
AVERAGE
AUGUST
DAY OUT
DOOR
75 70 57.00 57.00 68.00 64.00 61.50
NIGHT 70 70 54.50 54.50 64.00 63.00 59.00
DAY CONTROL
ROOM
75 70 32 32 32 32 32.75
NIGHT 70 70 32 32 32 32 32
NOISE LIMITS SEPTEMBER 2018
(LAeq) dBA
DoE
(Bangladesh)
Standard *
IFC/World
Bank
Standard
L1
L2
L3
L4
AVERAGE
SEPTEMBER
DAY OUT
DOOR
75 70 60.00 60.00 64.00 62.00 61.75
NIGHT 70 70 58.50 58.50 63.00 62.00 60.5
DAY CONTROL
ROOM
75 70 32 32 32 32 32.75
NIGHT 70 70 32 32 32 32 32
PARTICULATE
MATERIAL
LIMITS
NOVEMBER 2018
PARAMETER
DoE (Bangladesh)
Standard *
(Rev. on 19 July
2015)
IFC/World Bank
Standard
L1
L2
L3
L4
AVERAGE
NOVEMBER
PM 2.5 65 µ g/m3 75 µ g/m3 36 36 36 35 35.75
PM 10 150 µ g/m3 150 µ g/m3 27 27 27 27 27
SPM 200 µ g/m3 NF 46 45 45 46 45.5
SO2 365 µ g/m3 125 µ g/m3 14 13 14 14 13.75
NOx NF 200 µ g/m3 27 27 26 28 27
CO2 NF NF 21 21 22 22 21.5
CO 9 ppm NF 42 42 42 42 42
PARTICULATE
MATERIAL
LIMITS
DECEMBER 2018
PARAMETER
DoE (Bangladesh)
Standard *
(Rev. on 19 July
2015)
IFC/World Bank
Standard
L1
L2
L3
L4
AVERAGE
DECEMBER
PM 2.5 65 µ g/m3 75 µ g/m3 36 36 36 36 36
PM 10 150 µ g/m3 150 µ g/m3 27 27 28 28 27.5
SPM 200 µ g/m3 NF 45 45 44 46 45
SO2 365 µ g/m3 125 µ g/m3 13 12 12 13 12.75
NOx NF 200 µ g/m3 27 26 27 27 27.75
CO2 NF NF 21 20 21 21 21.75
CO 9 ppm NF 41 41 40 41 41.50
16
NOISE LIMITS OCTOBER 2018
(LAeq) dBA
DoE
(Bangladesh)
Standard *
IFC/World
Bank
Standard
L1
L2
L3
L4
AVERAGE
OCTOBER
DAY OUT DOOR
75 70 60.00 60.00 64.00 62.00 61.75
NIGHT 70 70 58.50 58.50 63.00 62.00 60.5
DAY CONTROL
ROOM
75 70 32 32 32 32 32.75
NIGHT 70 70 32 32 32 32 32
NOISE LIMITS NOVEMBER 2018
(LAeq) dBA
DoE
(Bangladesh)
Standard *
IFC/World
Bank
Standard
L1
L2
L3
L4
AVERAGE
NOVEMBER
DAY OUT
DOOR
75 70 60.00 60.00 64.00 62.00 61.75
NIGHT 70 70 58.50 58.50 62.00 62.00 60.5
DAY CONTROL
ROOM
75 70 32 32 32 32 32.75
NIGHT 70 70 32 32 32 32 32
NOISE LIMITS DECEMBER 2018
(LAeq) dBA
DoE
(Bangladesh)
Standard *
IFC/World
Bank
Standard
L1
L2
L3
L4
AVERAGE
DECEMBER
DAY OUT
DOOR
75 70 60.00 61.00 64.00 63.00 62
NIGHT 70 70 58.50 58.00 62.00 62.00 60.5
DAY CONTROL
ROOM
75 70 32 32 32 32 32.75
NIGHT 70 70 32 32 32 32 32
NOISE LIMITS JULY 2018
(LAeq) dBA
DoE
(Bangladesh)
Standard *
IFC/World
Bank
Standard
L1
L2
L3
L4
AVERAGE
JULY
DAY Turbine
Building
75 70 78 79 77 77 77.50
NIGHT 70 70 75 75 73 74 74.25
DAY Water
Treatment
Area
75 70 55 57 57 57 56.75
NIGHT 70 70 51 53 55 53 52.75
NOISE LIMITS AUGUST 2018
(LAeq) dBA
DoE
(Bangladesh)
Standard *
IFC/World
Bank
Standard
L1
L2
L3
L4
AVERAGE
AUGUST
DAY Turbine
Building
75 70 78 78 78 78 78
NIGHT 70 70 74 75 73 73 73.70
DAY Water
Treatment
Area
75 70 56 56 56 56 56
NIGHT 70 70 52 52 54 53 52.70
NOISE LIMITS SEPTEMBER 2018
(LAeq) dBA
DoE
(Bangladesh)
Standard *
IFC/World
Bank
Standard
L1
L2
L3
L4
AVERAGE
SEPTEMBER
DAY Turbine
Building
75 70 79 78 78 76 77.75
NIGHT 70 70 74 75 74 74 74.25
DAY Water
Treatment
Area
75 70 56 56 56 56 56.00
NIGHT 70 70 50 52 53 51 51.50
17
NOISE LIMITS OCTOBER 2018
(LAeq) dBA
DoE
(Bangladesh)
Standard *
IFC/World
Bank
Standard
L1
L2
L3
L4
AVERAGE
OCTOBER
DAY Turbine
Building
75 70 76 78 77 78 77.25
NIGHT 70 70 74 74 74 73 73.75
DAY Water
Treatment
Area
75 70 56 56 57 56 56.25
NIGHT 70 70 52 52 53 53 52.5
NOISE LIMITS NOVEMBER 2018
(LAeq) dBA
DoE
(Bangladesh)
Standard *
IFC/World
Bank
Standard
L1
L2
L3
L4
AVERAGE
NOVEMBER
DAY Turbine
Building
75 70 78 78 77 78 77.50
NIGHT 70 70 74 74 74 74 74
DAY Water
Treatment Area
75 70 55 56 55 55 55.75
NIGHT 70 70 52 52 53 52 52.25
NOISE LIMITS DECEMBER 2018
(LAeq) dBA
DoE
(Bangladesh)
Standard *
IFC/World
Bank
Standard
L1
L2
L3
L4
AVERAGE
DECEMBER
DAY Turbine
Building
75 70 77 77 77 77 77
NIGHT 70 70 74 74 74 74 74
DAY Water
Treatment
Area
75 70 55 56 56 55 55.5
NIGHT 70 70 52 52 53 52 52.75
NOISE LIMITS JULY 2018
(LAeq) dBA
DoE
(Bangladesh)
Standard *
IFC/World
Bank Standard
L1
L2
L3
L4 AVERAGE JULY
DAY Transformer Area
75 70 72 72 72 71 71.75
NIGHT 70 70 68 68 69 68 68.75
DAY
GIS Area
75 70 63 62 61 61 62.5
NIGHT 70 70 58 58 59 58 58.75
NOISE LIMITS AUGUST 2018
(LAeq) dBA
DoE
(Bangladesh)
Standard *
IFC/World
Bank Standard
L1
L2
L3
L4
AVERAGE
AUGUST
DAY Transformer
Area
75 70 71 71 72 71 71.75
NIGHT 70 70 68 68 68 68 68
DAY GIS Area
75 70 61 61 61 61 61
NIGHT 70 70 59 58 58 59 58.50
NOISE
LIMITS
SEPTEMBER 2018
(LAeq) dBA
DoE
(Bangladesh)
Standard *
IFC/World
Bank
Standard
L1
L2
L3
L4
AVERAGE
SEPTEMBER
DAY Transformer
Area
75 70 71 71 71 71 71.00
NIGHT 70 70 69 69 68 69 69.00
DAY GIS Area
75 70 63 63 62 62 62.5
NIGHT 70 70 58 58 58 58 58
18
NOISE
LIMITS
OCTOBER 2018
(LAeq) dBA
DoE
(Bangladesh)
Standard *
IFC/World
Bank
Standard
L1
L2
L3
L4
AVERAGE
OCTOBER
DAY Transformer
Area
75 70 71 71 72 71 71.75
NIGHT 70 70 67 68 68 68 68.75
DAY GIS Area
75 70 62 62 62 61 61.75
NIGHT 70 70 58 58 59 58 58.75
NOISE
LIMITS
NOVEMBER 2018
(LAeq) dBA
DoE
(Bangladesh)
Standard *
IFC/World Bank
Standard
L1
L2
L3
L4
AVERAGE
NOVEMBER
DAY Transformer Area
75 70 73 72 72 72 72.75
NIGHT 70 70 68 69 69 68 68.5
DAY GIS Area
75 70 63 62 63 62 62.5
NIGHT 70 70 59 58 60 58 58.75
NOISE
LIMITS
DECEMBER 2018
(LAeq) dBA
DoE (Bangladesh)
Standard *
IFC/World
Bank Standard
L1
L2
L3
L4
AVERAGE
DECEMBER
DAY Transformer 75 70 73 72 72 72 72.75
NIGHT Area 70 70 68 68 68 67 67.75
DAY GIS Area
75 70 62 61 61 62 62.50
NIGHT 70 70 58 58 59 58 58.25
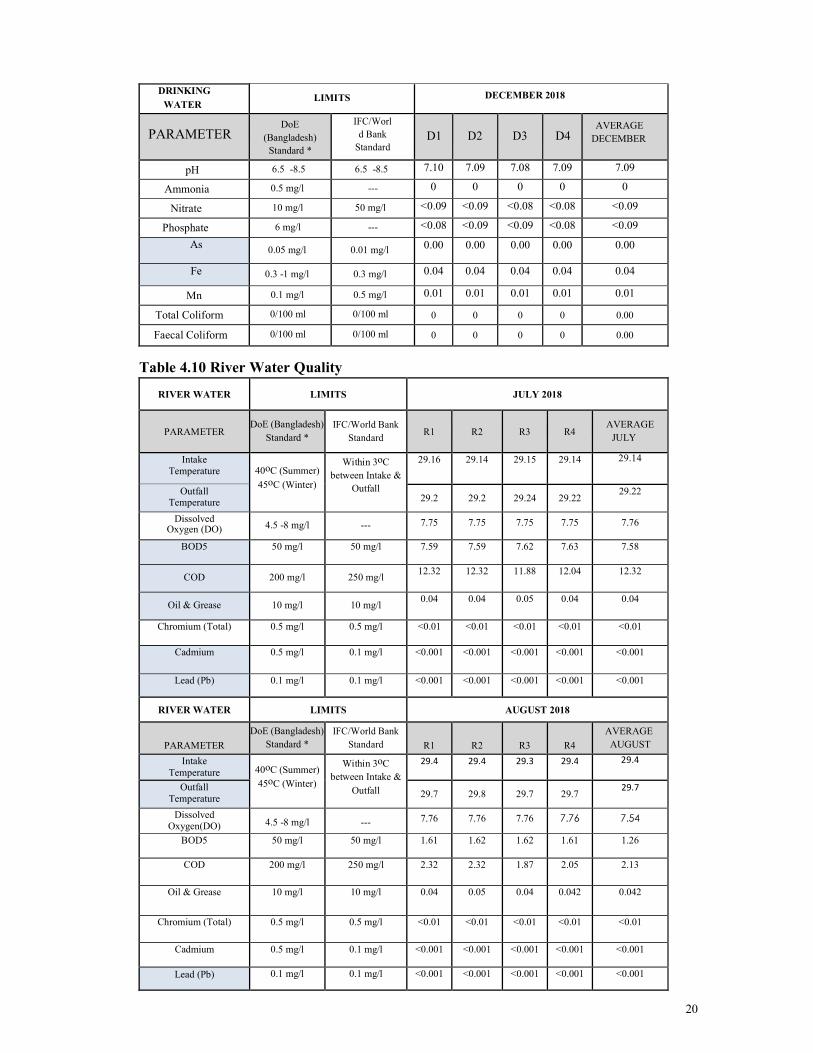
Table: 4.9 Drinking Water Quality
DRINKING WATER LIMITS JULY 2018
PARAMETER DoE (Bangladesh)
Standard *
IFC/World Bank
Standard
D1
D2
D3
D4
AVERAGE
JULY.
pH 6.5 -8.5 6.5 -8.5 7.06 7.06 7.06 7.06 7.06
Ammonia 0.5 mg/l --- 0 0 0 0 0
Nitrate 10 mg/l 50 mg/l <0.08 <0.09 <0.09 <0.09 <0.09
Phosphate 6 mg/l --- <0.08 <0.08 <0.08 <0.08 <0.08
As 0.05 mg/l 0.01 mg/l 0.00 0.00 0.00 0.00 0.00
Fe 0.3 -1 mg/l 0.3 mg/l 0.04 0.04 0.03 0.04 0.04
Mn 0.1 mg/l 0.5 mg/l 0.01 0.01 0.01 0.01 0.01
Total Coliform 0/100 ml 0/100 ml 0 0 0 0 0.00
Faecal Coliform 0/100 ml 0/100 ml 0 0 0 0 0.00
DRINKING WATER
LIMITS AUGUST 2018
PARAMETER
DoE (Bangladesh)
Standard *
IFC/World Bank
Standard
D1
D2
D3
D4
AVERAGE
AUGUST
pH 6.5 -8.5 6.5 -8.5 7.06 7.07 7.06 7.06 7.06
Ammonia 0.5 mg/l --- 0 0 0 0 0
Nitrate 10 mg/l 50 mg/l <0.08 <0.09 <0.09 <0.09 <0.09
Phosphate 6 mg/l --- <0.08 <0.08 <0.08 <0.08 <0.08
As 0.05 mg/l 0.01 mg/l 0.00 0.00 0.00 0.00 0.00
Fe 0.3 -1 mg/l 0.3 mg/l 0.04 0.04 0.03 0.04 0.04
Mn 0.1 mg/l 0.5 mg/l 0.01 0.01 0.01 0.01 0.01
Total Coliform 0/100 ml 0/100 ml 0 0 0 0 0.00
Faecal Coliform 0/100 ml 0/100 ml 0 0 0 0 0.00
19
DRINKING
WATER
LIMITS SEPTEMBER 2018
PARAMETER DoE (Bangladesh)
Standard *
IFC/World Bank
Standard
D1
D2
D3
D4
AVERAGE
SEPTEMBER
pH 6.5 -8.5 6.5 -8.5 7.07 7.07 7.06 7.06 7.06
Ammonia 0.5 mg/l --- 0 0 0 0 0
Nitrate 10 mg/l 50 mg/l <0.08 <0.09 <0.09 <0.09 <0.09
Phosphate 6 mg/l --- <0.08 <0.08 <0.08 <0.08 <0.08
As 0.05 mg/l 0.01 mg/l 0.00 0.00 0.00 0.00 0.00
Fe 0.3 -1 mg/l 0.3 mg/l 0.04 0.04 0.03 0.03 0.04
Mn 0.1 mg/l 0.5 mg/l 0.01 0.01 0.01 0.01 0.01
Total Coliform 0/100 ml 0/100 ml 0 0 0 0 0.00
Faecal Coliform 0/100 ml 0/100 ml 0 0 0 0 0.00
DRINKING
WATER LIMITS OCTOBER 2018
PARAMETER DoE
(Bangladesh)
Standard *
IFC/Worl
d Bank
Standard
D1
D2
D3
D4
AVERAGE
OCTOBER
pH 6.5 -8.5 6.5 -8.5 7.08 7.07 7.06 7.06 7.07
Ammonia 0.5 mg/l --- 0 0 0 0 0
Nitrate 10 mg/l 50 mg/l <0.09 <0.09 <0.09 <0.08 <0.09
Phosphate
6 mg/l
--- <0.08 <0.08 <0.08 <0.08 <0.08
As 0.05 mg/l 0.01 mg/l 0.00 0.00 0.00 0.00 0.00
Fe 0.3 -1 mg/l 0.3 mg/l 0.04 0.04 0.03 0.03 0.04
Mn 0.1 mg/l 0.5 mg/l 0.01 0.01 0.01 0.01 0.01
Total Coliform 0/100 ml 0/100 ml 0 0 0 0 0.00
Faecal Coliform 0/100 ml 0/100 ml 0 0 0 0 0.00
DRINKING
WATER
LIMITS NOVEMBER 2018
PARAMETER
DoE
(Bangladesh)
Standard *
IFC/Worl
d Bank
Standard
D1
D2
D3
D4
AVERAGE
NOVEMBER
pH 6.5 -8.5 6.5 -8.5 7.09 7.09 7.09 7.09 7.09
Ammonia 0.5 mg/l --- 0 0 0 0 0
Nitrate 10 mg/l 50 mg/l <0.09 <0.09 <0.09 <0.08 <0.09
Phosphate 6 mg/l --- <0.08 <0.08 <0.08 <0.08 <0.08
As 0.05 mg/l 0.01 mg/l 0.00 0.00 0.00 0.00 0.00
Fe 0.3 -1 mg/l 0.3 mg/l 0.04 0.04 0.03 0.03 0.04
Mn 0.1 mg/l 0.5 mg/l 0.01 0.01 0.01 0.01 0.01
Total Coliform 0/100 ml 0/100 ml 0 0 0 0 0.00
Faecal Coliform 0/100 ml 0/100 ml 0 0 0 0 0.00
20
DRINKING
WATER
LIMITS DECEMBER 2018
PARAMETER DoE
(Bangladesh)
Standard *
IFC/Worl
d Bank
Standard
D1
D2
D3
D4
AVERAGE
DECEMBER
pH 6.5 -8.5 6.5 -8.5 7.10 7.09 7.08 7.09 7.09
Ammonia 0.5 mg/l --- 0 0 0 0 0
Nitrate 10 mg/l 50 mg/l <0.09 <0.09 <0.08 <0.08 <0.09
Phosphate 6 mg/l --- <0.08 <0.09 <0.09 <0.08 <0.09
As 0.05 mg/l 0.01 mg/l
0.00 0.00 0.00 0.00 0.00
Fe 0.3 -1 mg/l 0.3 mg/l 0.04 0.04 0.04 0.04 0.04
Mn 0.1 mg/l 0.5 mg/l 0.01 0.01 0.01 0.01 0.01
Total Coliform 0/100 ml 0/100 ml 0 0 0 0 0.00
Faecal Coliform 0/100 ml 0/100 ml 0 0 0 0 0.00
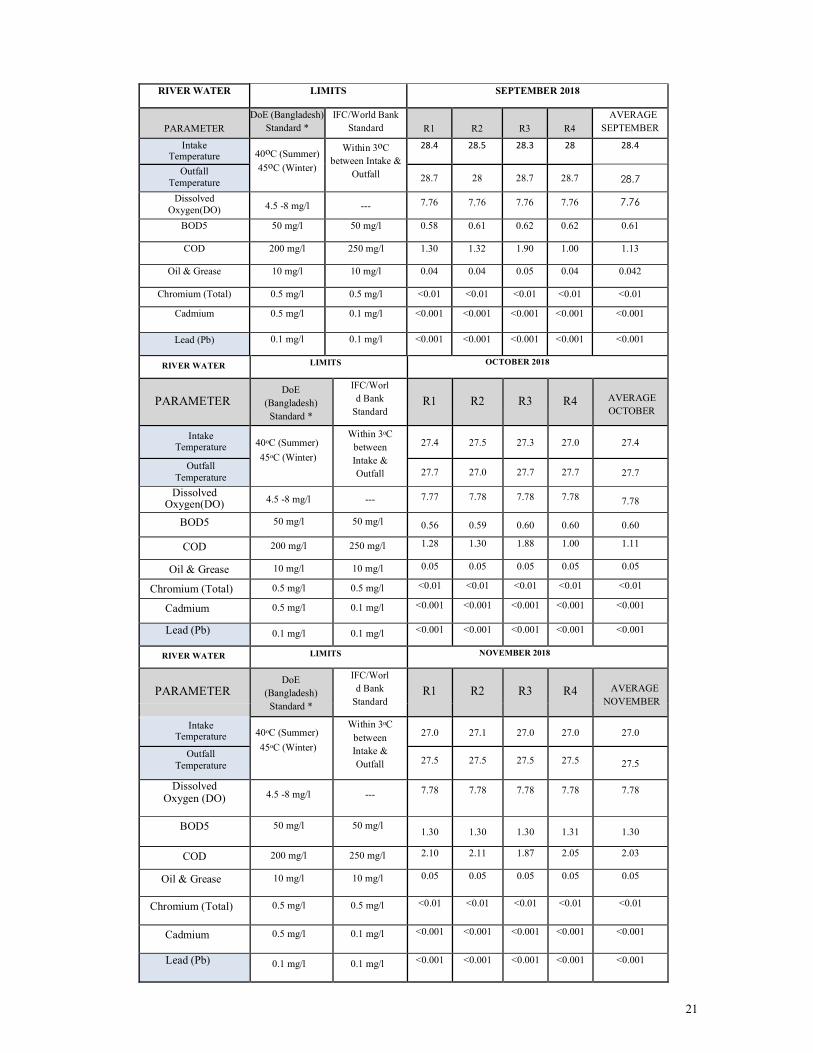
Table 4.10 River Water Quality
RIVER WATER LIMITS JULY 2018
PARAMETER DoE (Bangladesh)
Standard *
IFC/World Bank
Standard R1 R2 R3 R4
AVERAGE
JULY
Intake
Temperature
40oC (Summer)
45oC (Winter)
Within 3oC
between Intake &
Outfall
29.16 29.14 29.15 29.14 29.14
Outfall Temperature
29.2
29.2
29.24
29.22
29.22
Dissolved Oxygen (DO)
4.5 -8 mg/l
--- 7.75 7.75 7.75 7.75 7.76
BOD5 50 mg/l 50 mg/l 7.59 7.59 7.62 7.63 7.58
COD
200 mg/l
250 mg/l
12.32 12.32 11.88 12.04 12.32
Oil & Grease
10 mg/l
10 mg/l
0.04 0.04 0.05 0.04 0.04
Chromium (Total) 0.5 mg/l 0.5 mg/l <0.01 <0.01 <0.01 <0.01 <0.01
Cadmium 0.5 mg/l 0.1 mg/l <0.001 <0.001 <0.001 <0.001 <0.001
Lead (Pb) 0.1 mg/l 0.1 mg/l <0.001 <0.001 <0.001 <0.001 <0.001
RIVER WATER LIMITS AUGUST 2018
PARAMETER
DoE (Bangladesh)
Standard *
IFC/World Bank
Standard
R1
R2
R3
R4
AVERAGE
AUGUST
Intake
Temperature
40oC (Summer)
45oC (Winter)
Within 3oC
between Intake &
Outfall
29.4 29.4 29.3 29.4 29.4
Outfall
Temperature
29.7
29.8
29.7
29.7
29.7
Dissolved Oxygen(DO)
4.5 -8 mg/l
--- 7.76 7.76 7.76 7.76 7.54
BOD5 50 mg/l 50 mg/l 1.61 1.62 1.62 1.61 1.26
COD 200 mg/l 250 mg/l 2.32 2.32 1.87 2.05 2.13
Oil & Grease 10 mg/l 10 mg/l 0.04 0.05 0.04 0.042 0.042
Chromium (Total) 0.5 mg/l 0.5 mg/l <0.01 <0.01 <0.01 <0.01 <0.01
Cadmium 0.5 mg/l 0.1 mg/l <0.001 <0.001 <0.001 <0.001 <0.001
Lead (Pb) 0.1 mg/l 0.1 mg/l <0.001 <0.001 <0.001 <0.001 <0.001
21
RIVER WATER LIMITS SEPTEMBER 2018
PARAMETER
DoE (Bangladesh)
Standard *
IFC/World Bank
Standard
R1
R2
R3
R4
AVERAGE
SEPTEMBER
Intake Temperature
40oC (Summer)
45oC (Winter)
Within 3oC
between Intake &
Outfall
28.4 28.5 28.3 28 28.4
Outfall
Temperature
28.7
28
28.7
28.7
28.7
Dissolved
Oxygen(DO)
4.5 -8 mg/l
--- 7.76 7.76 7.76 7.76 7.76
BOD5 50 mg/l 50 mg/l 0.58 0.61 0.62 0.62 0.61
COD 200 mg/l 250 mg/l 1.30 1.32 1.90 1.00 1.13
Oil & Grease 10 mg/l 10 mg/l 0.04 0.04 0.05 0.04 0.042
Chromium (Total) 0.5 mg/l 0.5 mg/l <0.01 <0.01 <0.01 <0.01 <0.01
Cadmium 0.5 mg/l 0.1 mg/l <0.001 <0.001 <0.001 <0.001 <0.001
Lead (Pb) 0.1 mg/l 0.1 mg/l <0.001 <0.001 <0.001 <0.001 <0.001
RIVER WATER LIMITS OCTOBER 2018
PARAMETER
DoE
(Bangladesh)
Standard *
IFC/Worl
d Bank
Standard
R1
R2
R3
R4 AVERAGE
OCTOBER
Intake Temperature
40oC (Summer)
45oC (Winter)
Within 3oC
between
Intake &
Outfall
27.4 27.5 27.3 27.0 27.4
Outfall
Temperature
27.7
27.0
27.7
27.7 27.7
Dissolved Oxygen(DO)
4.5 -8 mg/l --- 7.77 7.78 7.78 7.78 7.78
BOD5 50 mg/l 50 mg/l 0.56 0.59 0.60 0.60 0.60
COD 200 mg/l 250 mg/l 1.28 1.30 1.88 1.00 1.11
Oil & Grease 10 mg/l 10 mg/l 0.05 0.05 0.05 0.05 0.05
Chromium (Total) 0.5 mg/l 0.5 mg/l <0.01 <0.01 <0.01 <0.01 <0.01
Cadmium 0.5 mg/l 0.1 mg/l <0.001 <0.001 <0.001 <0.001 <0.001
Lead (Pb) 0.1 mg/l 0.1 mg/l <0.001 <0.001 <0.001 <0.001 <0.001
RIVER WATER LIMITS NOVEMBER 2018
PARAMETER
DoE
(Bangladesh)
Standard *
IFC/Worl
d Bank
Standard
R1
R2
R3
R4 AVERAGE
NOVEMBER
Intake Temperature
40oC (Summer)
45oC (Winter)
Within 3oC
between
Intake &
Outfall
27.0 27.1 27.0 27.0 27.0
Outfall
Temperature
27.5
27.5
27.5
27.5 27.5
Dissolved Oxygen (DO)
4.5 -8 mg/l
--- 7.78 7.78 7.78 7.78 7.78
BOD5 50 mg/l 50 mg/l 1.30 1.30 1.30 1.31 1.30
COD 200 mg/l 250 mg/l 2.10 2.11 1.87 2.05 2.03
Oil & Grease 10 mg/l 10 mg/l 0.05 0.05 0.05 0.05 0.05
Chromium (Total) 0.5 mg/l 0.5 mg/l <0.01 <0.01 <0.01 <0.01 <0.01
Cadmium 0.5 mg/l 0.1 mg/l <0.001 <0.001 <0.001 <0.001 <0.001
Lead (Pb) 0.1 mg/l 0.1 mg/l <0.001 <0.001 <0.001 <0.001 <0.001
22
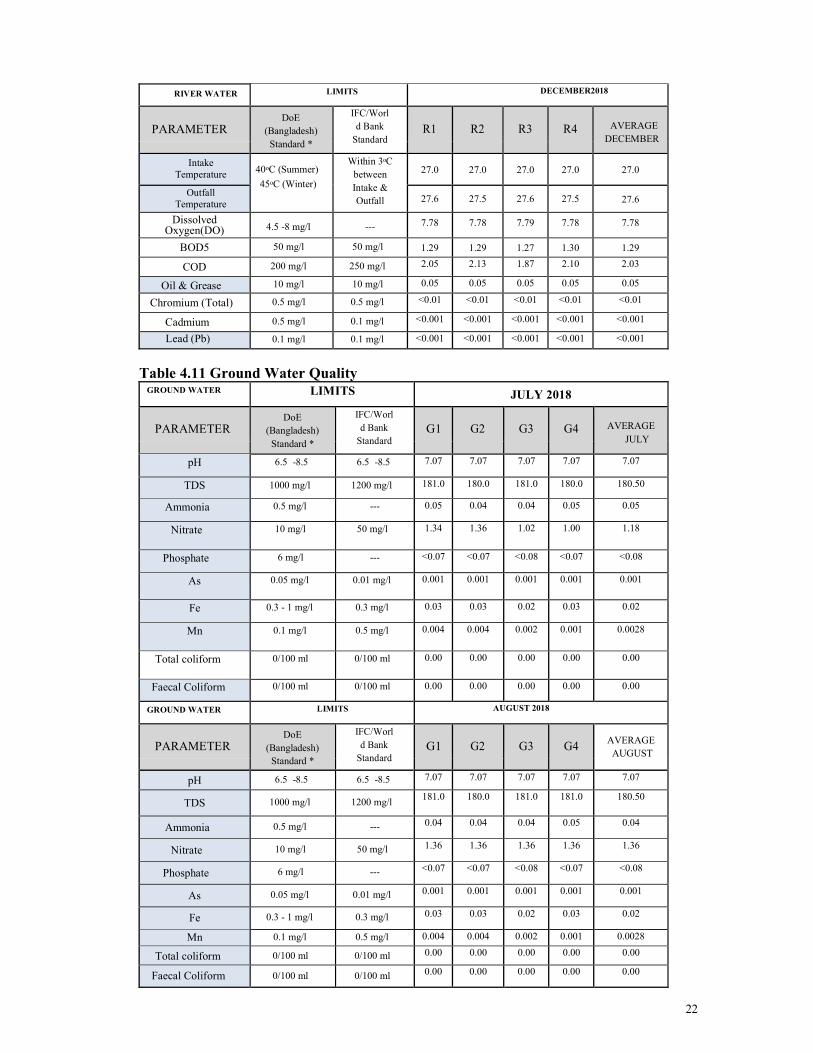
RIVER WATER LIMITS DECEMBER2018
PARAMETER
DoE
(Bangladesh)
Standard *
IFC/Worl
d Bank
Standard
R1
R2
R3
R4 AVERAGE
DECEMBER
Intake
Temperature
40oC (Summer)
45oC (Winter)
Within 3oC
between
Intake &
Outfall
27.0 27.0 27.0 27.0 27.0
Outfall
Temperature
27.6
27.5
27.6
27.5 27.6
Dissolved Oxygen(DO)
4.5 -8 mg/l
--- 7.78 7.78 7.79 7.78 7.78
BOD5 50 mg/l 50 mg/l 1.29 1.29 1.27 1.30 1.29
COD 200 mg/l 250 mg/l 2.05 2.13 1.87 2.10 2.03
Oil & Grease 10 mg/l 10 mg/l 0.05 0.05 0.05 0.05 0.05
Chromium (Total) 0.5 mg/l 0.5 mg/l <0.01 <0.01 <0.01 <0.01 <0.01
Cadmium 0.5 mg/l 0.1 mg/l <0.001 <0.001 <0.001 <0.001 <0.001
Lead (Pb) 0.1 mg/l 0.1 mg/l <0.001 <0.001 <0.001 <0.001 <0.001
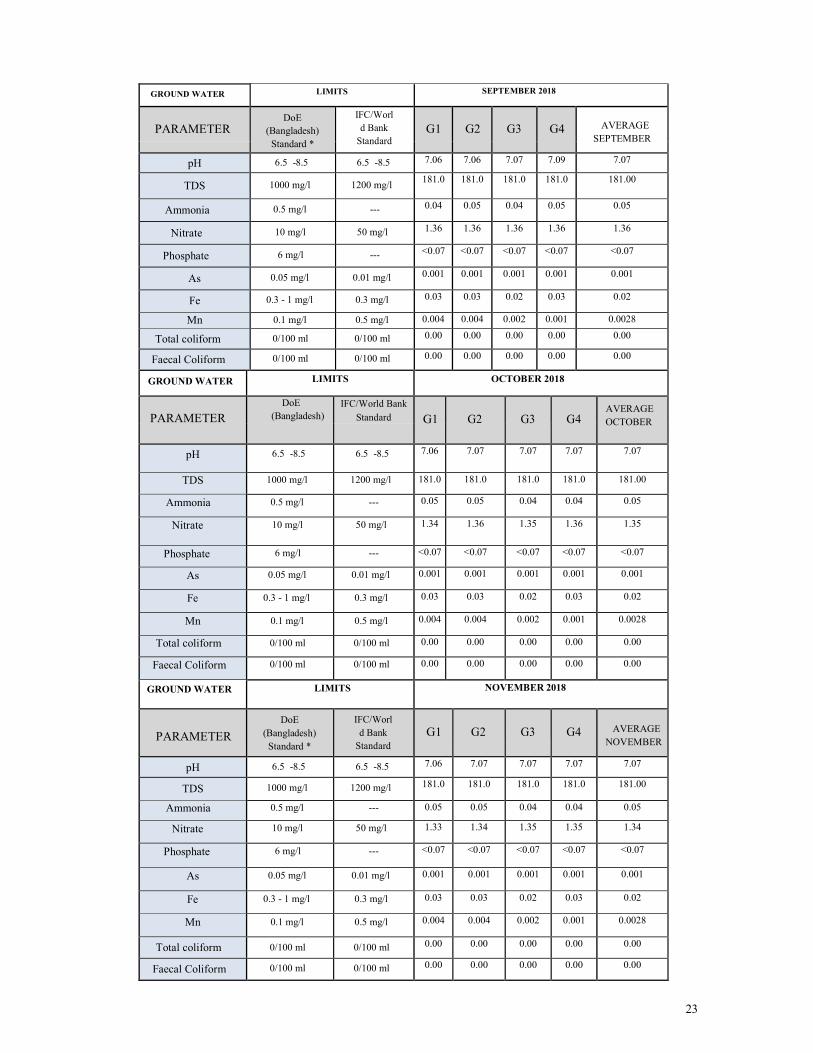
Table 4.11 Ground Water Quality GROUND WATER LIMITS JULY 2018
PARAMETER DoE
(Bangladesh)
Standard *
IFC/Worl
d Bank
Standard
G1
G2
G3
G4 AVERAGE
JULY
pH 6.5 -8.5 6.5 -8.5 7.07 7.07 7.07 7.07 7.07
TDS 1000 mg/l 1200 mg/l 181.0 180.0 181.0 180.0 180.50
Ammonia 0.5 mg/l --- 0.05 0.04 0.04 0.05 0.05
Nitrate 10 mg/l 50 mg/l 1.34 1.36 1.02 1.00 1.18
Phosphate 6 mg/l --- <0.07 <0.07 <0.08 <0.07 <0.08
As 0.05 mg/l 0.01 mg/l 0.001 0.001 0.001 0.001 0.001
Fe 0.3 - 1 mg/l 0.3 mg/l 0.03 0.03 0.02 0.03 0.02
Mn 0.1 mg/l 0.5 mg/l 0.004 0.004 0.002 0.001 0.0028
Total coliform 0/100 ml 0/100 ml 0.00 0.00 0.00 0.00 0.00
Faecal Coliform 0/100 ml 0/100 ml 0.00 0.00 0.00 0.00 0.00
GROUND WATER LIMITS AUGUST 2018
PARAMETER DoE
(Bangladesh)
Standard *
IFC/Worl
d Bank
Standard
G1
G2
G3
G4
AVERAGE
AUGUST
pH 6.5 -8.5 6.5 -8.5 7.07 7.07 7.07 7.07 7.07
TDS 1000 mg/l 1200 mg/l 181.0 180.0 181.0 181.0 180.50
Ammonia 0.5 mg/l --- 0.04 0.04 0.04 0.05 0.04
Nitrate 10 mg/l 50 mg/l 1.36 1.36 1.36 1.36 1.36
Phosphate 6 mg/l --- <0.07 <0.07 <0.08 <0.07 <0.08
As 0.05 mg/l 0.01 mg/l 0.001 0.001 0.001 0.001 0.001
Fe 0.3 - 1 mg/l 0.3 mg/l 0.03 0.03 0.02 0.03 0.02
Mn 0.1 mg/l 0.5 mg/l 0.004 0.004 0.002 0.001 0.0028
Total coliform 0/100 ml 0/100 ml 0.00 0.00 0.00 0.00 0.00
Faecal Coliform 0/100 ml 0/100 ml 0.00 0.00 0.00 0.00 0.00
23
GROUND WATER LIMITS SEPTEMBER 2018
PARAMETER
DoE
(Bangladesh)
Standard *
IFC/Worl
d Bank
Standard
G1
G2
G3
G4 AVERAGE
SEPTEMBER
pH 6.5 -8.5 6.5 -8.5 7.06 7.06 7.07 7.09 7.07
TDS 1000 mg/l 1200 mg/l 181.0 181.0 181.0 181.0 181.00
Ammonia 0.5 mg/l --- 0.04 0.05 0.04 0.05 0.05
Nitrate 10 mg/l 50 mg/l 1.36 1.36 1.36 1.36 1.36
Phosphate 6 mg/l --- <0.07 <0.07 <0.07 <0.07 <0.07
As 0.05 mg/l 0.01 mg/l 0.001 0.001 0.001 0.001 0.001
Fe 0.3 - 1 mg/l 0.3 mg/l 0.03 0.03 0.02 0.03 0.02
Mn 0.1 mg/l 0.5 mg/l 0.004 0.004 0.002 0.001 0.0028
Total coliform 0/100 ml 0/100 ml 0.00 0.00 0.00 0.00 0.00
Faecal Coliform 0/100 ml 0/100 ml 0.00 0.00 0.00 0.00 0.00
GROUND WATER LIMITS OCTOBER 2018
PARAMETER
DoE
(Bangladesh)
Standard *
IFC/World Bank
Standard
G1
G2
G3
G4
AVERAGE
OCTOBER
pH 6.5 -8.5 6.5 -8.5 7.06 7.07 7.07 7.07 7.07
TDS 1000 mg/l 1200 mg/l 181.0 181.0 181.0 181.0 181.00
Ammonia 0.5 mg/l --- 0.05 0.05 0.04 0.04 0.05
Nitrate 10 mg/l 50 mg/l 1.34 1.36 1.35 1.36 1.35
Phosphate 6 mg/l --- <0.07 <0.07 <0.07 <0.07 <0.07
As 0.05 mg/l 0.01 mg/l 0.001 0.001 0.001 0.001 0.001
Fe 0.3 - 1 mg/l 0.3 mg/l 0.03 0.03 0.02 0.03 0.02
Mn 0.1 mg/l 0.5 mg/l 0.004 0.004 0.002 0.001 0.0028
Total coliform 0/100 ml 0/100 ml 0.00 0.00 0.00 0.00 0.00
Faecal Coliform 0/100 ml 0/100 ml 0.00 0.00 0.00 0.00 0.00
GROUND WATER LIMITS NOVEMBER 2018
PARAMETER
DoE
(Bangladesh)
Standard *
IFC/Worl
d Bank
Standard
G1
G2
G3
G4 AVERAGE
NOVEMBER
pH 6.5 -8.5 6.5 -8.5 7.06 7.07 7.07 7.07 7.07
TDS 1000 mg/l 1200 mg/l 181.0 181.0 181.0 181.0 181.00
Ammonia 0.5 mg/l --- 0.05 0.05 0.04 0.04 0.05
Nitrate 10 mg/l 50 mg/l 1.33 1.34 1.35 1.35 1.34
Phosphate 6 mg/l --- <0.07 <0.07 <0.07 <0.07 <0.07
As 0.05 mg/l 0.01 mg/l 0.001 0.001 0.001 0.001 0.001
Fe 0.3 - 1 mg/l 0.3 mg/l 0.03 0.03 0.02 0.03 0.02
Mn 0.1 mg/l 0.5 mg/l 0.004 0.004 0.002 0.001 0.0028
Total coliform 0/100 ml 0/100 ml 0.00 0.00 0.00 0.00 0.00
Faecal Coliform 0/100 ml 0/100 ml 0.00 0.00 0.00 0.00 0.00
24
GROUND WATER LIMITS DECEMBER2018
PARAMETER
DoE
(Bangladesh)
Standard *
IFC/Worl
d Bank
Standard
G1
G2
G3
G4 AVERAGE
DECEMBER
pH 6.5 -8.5 6.5 -8.5 7.06 7.08 7.07 7.06 7.07
TDS 1000 mg/l 1200 mg/l 181.0 181.0 181.0 181.0 181.00
Ammonia 0.5 mg/l --- 0.05 0.05 0.04 0.04 0.05
Nitrate 10 mg/l 50 mg/l 1.33 1.34 1.35 1.35 1.34
Phosphate 6 mg/l --- <0.07 <0.07 <0.07 <0.07 <0.07
As 0.05 mg/l 0.01 mg/l 0.001 0.001 0.001 0.001 0.001
Fe 0.3 - 1 mg/l 0.3 mg/l 0.03 0.03 0.02 0.03 0.02
Mn 0.1 mg/l 0.5 mg/l 0.004 0.004 0.002 0.001 0.0028
Total coliform 0/100 ml 0/100 ml 0.00 0.00 0.00 0.00 0.00
Faecal Coliform 0/100 ml 0/100 ml 0.00 0.00 0.00 0.00 0.00
Table 4.12 Waste Water Quality
WASTE
WATER
LIMITS JULY 2018 AUGUST 2018 SEPTEMBER 2018
PARAMETER
DoE
(Bangladesh) Standard *
IFC/World
Bank
Standard WW1 WW2 WW3 WW4 AVG. WW1 WW2 WW3 WW4 AVG. WW1 WW2 WW3 WW4 AVG.
pH 6 - 9 6 - 9 8.3 8.3 8.4 8.3 8.3 8.4 8.3 8.4 8.4 8.4 8.3 8.3 8.3 8.4 8.4
TEMPERATUR
E
40oC (Summer)
45oC (Winter)
----
24.56 24.57 24.57 24.57 24.57 24.60 24.61 24.60 24.62 24.61 24.57 24.61 24.58 24.57 24.58
TDS 2100 mg/l ---- 18 19 18 18 18.75 19 19 18 19 18.75 19 19 18 19 18.75
Electrical
Conductivity 1200 Mmho/Cm ---- 291 291 291 290 290.75 292 291 291 290 290.75 291 291 291 291 291
Oil & Grease 10 mg/l 10 mg/l 0.00 0.00 0.00 0.01 0.01 0.00 0.00 0.00 0.01 0.01 0.00 0.00 0.00 0.01 0.01
WASTE
WATER
LIMITS OCTOBER 2018 NOVEMBER 2018 DECEMBER 2018
PARAMETER
DoE
(Bangladesh) Standard *
IFC/World
Bank
Standard WW1 WW2 WW3 WW4 AVG. WW1 WW2 WW3 WW4 AVG. WW1 WW2 WW3 WW4 AVG.
pH 6 - 9 6 - 9 8.5 8.4 8.5 8.4 8.5 8.4 8.4 8.4 8.4 8.4 8.4 8.4 8.4 8.4 8.4
TEMPERATUR
E
40oC (Summer)
45oC (Winter)
----
24.44 24.46 24.45 24.45 24.45 24.42 24.41 24.40 24.40 24.41 24.40 24.40 24.40 24.40 24.40
TDS 2100 mg/l ---- 20 19 20 19 19.50 19 19 20 19 19.75 18 19 19 19 19
Electrical
Conductivity 1200 Mmho/Cm ---- 292 291 291 292 291.50 291 291 291 291 291 291 291 291 291 291
Oil & Grease 10 mg/l 10 mg/l 0.01 0.00 0.00 0.01 0.01 0.01 0.00 0.00 0.01 0.01 0.01 0.00 0.00 0.01 0.01
25
Table: 4.13 Stack Emission Record
STACK EMISSION LIMITS (PPM ) CONCENTRATION LEVEL (2018)
PARAMETER DoE
(Bangladesh)
Standard
IFC/World
Bank
Standard 10th JULY
at 11.04
14th
AUGUST
At 12. 07
07th
SEPTEMBER
at 14.27
09th
OCTOBER
at 09.24
11th
NOVEMBER
at 09.49
07th
DECEMBER
At 03.41
Generation (MW) 340 344 321 341 245 328
SOx N/A N/A For gas based power plant SOx measurement is not required by DoE & IFC and
therefore there is no measuring options in CEMS. NOx (PPM) 40 ppm 25 ppm 54 65 59 61 76 51
CO2 (%) --- --- 1.79% 2.86% 2.24% 2.16% 3.12% 1.89
CO (PPM) --- --- 3 2 7 4 9 4
Table 4.14 : Monthly NOx, SOx and CO emission record (in ton)
Month NOX ton SOX ton CO ton CO2 ton
Jul-18 107.45 0.46 64.47 83667310
Aug-18 106.80 0.46 64.09 83160860
Sep-18 117.69 0.50 70.61 91638180
Oct-18 108.90 0.47 65.34 84790260
Nov-18 54.66 0.23 32.80 42559280
Dec-18
(till 10th Dec)
24.91 0.11 14.45 19398580
Table: 4.15 Soil Quality
SOIL QUALITY TEST RESULT- AUGUST 2018
PARAMETER CONCENTRATION PRESENT (ppm) IFC/World Bank
Standard
METHOD OF ANALYSIS S1 S2 S3 S4
Oil & Grease 0.95 0.95 0.95 0.95 - Gravimetric
Chromium(Total) 1.87 1.88 1.87 1.87 100 ppm AAS
Cadmium 0.18 0.20 0.19 0.19 5 ppm AAS
Lead(Pb) 2.72 2.15 2.776 2.98 100 ppm AAS
4.3.5 Impact on waste and labor camp
Construction debris and wastes to be generated during present small scale construction a n d o p e
r a t i o n a l phases are scrap iron, steel, wooden frames, piping, and other solid wastes. Most of t h e m a r
e generated toward the end of the construction phase during carrying out of the finishing works, while
the site will be cleared of waste materials. The volume of such wastes is likely to be significant.
Indiscriminate storage and disposal of these wastes could create local water logging and ponding by
blocking drainage lines and would be aesthetically displeasing. Proper disposal of these wastes a r e
described in Section 4.3.
Solid waste of domestic nature that would be generated in the labor sheds at the project site is not likely
to be significant in volume. But indiscriminate disposal of such solid waste would create environmental
pollution and unhealthy situation at the project site. These solid wastes are disposed of properly as
outlined in Section 4.3.

26
Assessment operational impact on air, water, noise, construction waste and labor camp
management
Table 4.16 summarizes the effect of project activities on physico-chemical environmental parameters
during construction and operational phase of the project. The physico-chemical environmental
parameters that could be affected by the project activities include water, air quality and noise level. As
discussed above, water quality could be affected mainly by project activities such as mobilization of
equipment, personnel (e.g., solid and liquid waste from labor sheds) and discharge of thermal water.
Effects of solid and liquid wastes generated during construction and operational phase would not be very
significant, especially if mitigation measures as outlined in Section 4.3 are adopted. The overall negative
impact of s u c h activities is likely to be “short-term (Sh)” and of “low” intensity.
Table 4.16: Effect of project activities on physico-chemical environmental parameters during
operation phase
Physico-chemical
parameters
Environmental Examination
Positive Impact No Impact Negative Impact
Low Moderate High Low Modera
te
High
Air Quality X (Sh)
Noise Level X (Sh)
Drinking Water Quality X (Sh)
River Water Quality X (Sh)
Ground Water Quality X (Sh)
Note: Sh=Short-term; Lo=Long-term
Deterioration of air quality during operational phase result from increased concentration of particulate
matter in the air from operational activities such as vehicular movement, wind-blown dust and poor
combustion of fossil fuel etc. However, these adverse impacts are greatly minimized by adopting
mitigation measures as outlined in Section 4.3.
The likely noise level to be generated for different o p e r a t i o n a l activities and its impact on the
surrounding environment were assessed using a noise meter. Results of the assessment are presented in
table 4. 8; shows that different operational activities would generate noise which is insignificant to create
adverse impacts.
4.4 Mitigation Measure
4.4.1 Air Quality
Pavement works of bare surf ace are fully complete t ha t h as significant contribution i n dust
reduction . Bared a r e a s at the site a r e properly covered, roads p r o p e r l y cleaned and water
sprayed in order to minimize concentration of dust in air when dust increases. Vehicle movement to
and from the site are properly managed to ensure that is does not significantly aggravate the traffic
problem and air pollution. Health status of a l l workers i s monitored regularly at power plant
medical center.
4.4.2 Water Quality
The human wastes f r o m t h e offices a n d labour c a m p are appropriately disposed of through
construction of sanitary latrines connected to appropriately designed septic tank system (consisting of
septic tank and soakage pit). Wastewater generated from different activities is not likely to be
significant in volume. Disposal of such wastewater are carried out by draining them in shallow pits (1
27
to 1.5 m deep) dug in the ground at appropriate locations. In all cases, the wastewater streams are
separated from the storm water stream, which is disposed of separately utilizing the existing storm
water disposal system at the Ashuganj complex. All sanitary latrines in office buildings and working
facilities of this plant are well designed and properly managed to prevent any kind of pollution.
4.4.3 Noise Level
Use “quiet” equipment (i.e., turbine, generator, auxiliaries and other equipments are designed with noise-
control elements);
Route truck traffic away from noise-sensitive areas, where feasible;
Installed sound barriers for pile driving activity, where practicable (e.g., use an acoustic curtain or
blanket around the point of impact);
Unnecessary vehicle movement are avoided 4.4.4 Solid Waste
The solid wastes of domestic nature generated mainly in the labor sheds and office areas a r e
collected and stored separately (i.e., without mixing it with construction wastes/debris) in
appropriate containers within the construction and operational sites. Aq u a t i c ma c r o p h yt e s a n d wa t
e r h ya c i n t h s a r e r a pi d l y c o l l e c t e d f r o m c w p u mp s t a t i o n a r e a t o p re ve n t b a d o d o r . The
solid wastes are disposed of away from the site (e.g., in a municipal landfill/waste dumping ground)
outside the complex, at the responsibility of the Contractor & monitored by APSCL. APSCL will also
install an Incinerator for hazardous and solid waste management.
4.5 Progress of Work Ambient air quality monitoring: Measurements of selected air quality parameters for PM2.5, PM10
and SPM has been carried out (July–December, 2018) during the o n g o i n g operational works . Ai
r s a mp l es we re c oll ec ted f or measurements of selected air quality parameters for PM2.5,
PM10 and SPM and analyzed data are summarized in Table 4.8
Drinking water monitoring: Drinking water sample was collected from supplied drinking water in
July–December, 2018 for analyzing pH, ammonia, nitrate, phosphate, As, Fe, Mn, Fecal and total
coliform. Test report also shown in Table 4.9.
River water monitoring: River water sample was collected from Meghna River in July–December,
2018 for analyzing temperature, dissolved oxygen (DO) along with BOD5, COD, Oil and Grease, and
selected heavy metals (Cr, Cd, Pb). Test report also shown in Table 4.10. Ground water monitoring: Ground water sample was collected from supply water in July–
December, 2018 for analyzing pH, TDS, ammonia, nitrate, phosphate, As, Fe, Mn, Fecal and Total
coliform. Test report also shown in Table 4.11.
Noise level monitoring: Noise level monitoring is also necessary during construction and operational
period, because use of heavy construction equipment a n d e l e c t r i c i t y g e n e r a t i o n a c t i v i t i e s . So,
Noise level data were collected from selected 4 points of every location and summarized in Table 4.8.
Storage of Hazardous Material: Storage of hazardous material like lubricating oil, transformer oil, SF6 gas cylinder, H2 gas cylinder, chemicals, Air filter and insulation materials are properly done in central store and chemical store with proper demarcation, secondary containment, safety warning signage and MSDS. Waste management and process waste monitoring: Disposal of construction debris away the site
and their appropriate disposal sanitary landfill are ongoing. Hazardous waste and non-hazardous waste
are also disposing by proper way. In fact till now no hazardous materials were generated from plant
operational activities.
28
Trees cutting: The project site has been established in bare field. So, there was no scope of tree cutting.
But tree plantation program and landscaping is going on for providing the better environment at the
project site and APSCL area that will also act as carbon sink. Others: There is no significant impact from this power plant activities on the existing road network in the project area. All slopes are protected and suitable erosion protection measures are employed following ADB Environmental Safeguard Policy Guideline 2009 and IFC/World Bank Thermal Power Plant Guidelines 2008 to reduce any impact from runoff during the monsoon rainy season and all the year round. Health and Safety: The general health and safety of workers is safeguarded with the provision of
medical and health facilities on-site, the provision of personal protective equipment (hard hats, safety
belt, full body safety harness, ear plugs, ear muff, welding shield, grinding shield, safety shoe, safety
goggle, welding apron, hand gloves, safety jacket, anti-dust masks, anti-gas masks etc. as required).
There is an emergency response system and workers and supervisors are received training on any
accident and immediate medical facility in its own round the clock medical center. There is two full time
emergency ambulances to provide immediate service if required. Safe drinking water and sanitation facilities are established and provided to all plant related employees (officer, staff and workers),
contractors and visitors at the site. Corporate Social Responsibility: APSCL has engaged skilled, semi-skilled and unskilled local people in
this power plant activities for socio-economic development and to upgrade the economic status of local
people as much as possible from its scope to provide job facilities for them. APSCL provides irrigation
water though an irrigation channel from its cooling water discharge channel to Bangladesh Agricultural
Development Corporation’s (BADC) water channels at free of cost to foster irrigation works in about
36000 acres of agricultural lands of Ashuganj and to help local farmers where expense and scarcity of
water are major problems during irrigation seasons. APSCL provides free treatment for emergency services to neighboring local peoples and any injured people from traffic accident. APSCL also provides
education facilities to local peoples in its school.
Set up of in-house monitoring system APSCL has set up of in-house monitoring system and require manpower with its own staffs. In-house
environmental monitoring system with man power is as follows.
Manpower for Environmental Management Plan.
1. Manager (Health, Safety & Environment) – 1 nos.
2. Asst. Manager (Health, Safety & Environment), for ambient air, stacks emission and noise etc.-
01 no’s
3. Deputy Manager (Chemical) For ETP, WTP, etc. -1 nos. 4. Assistant Manager (Chemical) For ETP, WTP, etc. - 1 no’s.
5. Operator – 4 Nos.
Environmental Clearance Certificate /Renewal of Environment Clearance:
After completion of construction work APSCL has achieved the Environmental Clearance Certificate
(ECC) for operation of the 450 MW CCPP (North) on 10.10.2017 from Dept. of Environment (DoE),
Bangladesh that expired on 10.10.2018. APSCL has already applied for renewal of ECC on 25.11.2018.
4.6 Work Shop, Mock Drill, Training Meeting And Discussion At present a Health, Safety & Environment (HS&E) team headed by Md. Atiqur Rahman,
Manager (Health, Safety & Environment) of APSCL is looking after and overall supervising
the monitoring of 450 MW North CCPP’s health, safety and environmental issues. The
consultant also conducted a training program on HS&E issues for APSCL personnel and EPC
contractors.
29
A training program for capacity building program of APSCL personnel was arranged on 28.04.2018
upon availability o f required manpower. Newly appointed employees were trained on Operational
and Maintenance w o r k s and on HS&E issues by HS&E Manager and other relevant internal
experts in its own Training Center and this are a continuous process for all newly appointed and
existing employees. Regular mock drill on Fire, earth quake and other emergencies are conducted
by Ashuganj Fire Service and Civil Defense Personnel in plant sites quarterly. Mock drill on
electric shock, chemical and acid spillage are regularly conducted by Health, Safety &
Environment Division in the plant sites for all employees, visitors and contractors as per set
schedule in every year. L i s t o f t r a i n i n g i s a n d w i l l b e g i v e n t o A P S C L e m p l o y e e
i s s h o w n i n t a b l e 4 . 1 7 b e l l o w . There is a safety committee as per Labor Law and also an
internal Joint Health and Safety Committee formed by officers and staffs to identify and mitigate
OHS issues in the plant. Hazard identification & risk assessment and Environmental impact and
aspect analysis is done properly for every job in all levels to prevent any kind of incident
/accident. APSCL’s management system is IMS (ISO 9001: 2015, ISO 14001: 2015 & BS
OHSAS 18001: 2007) certified. So, all the plant operational and maintenance act ivi t ies are done
properly maintaining all requirements of IMS standards and applicable legal requirements to ensure
all health, safety and environmental issues in this plant. There is environmental meeting performed in
every month and discuss the overall performance of the HS&E issues of this power plant.
30
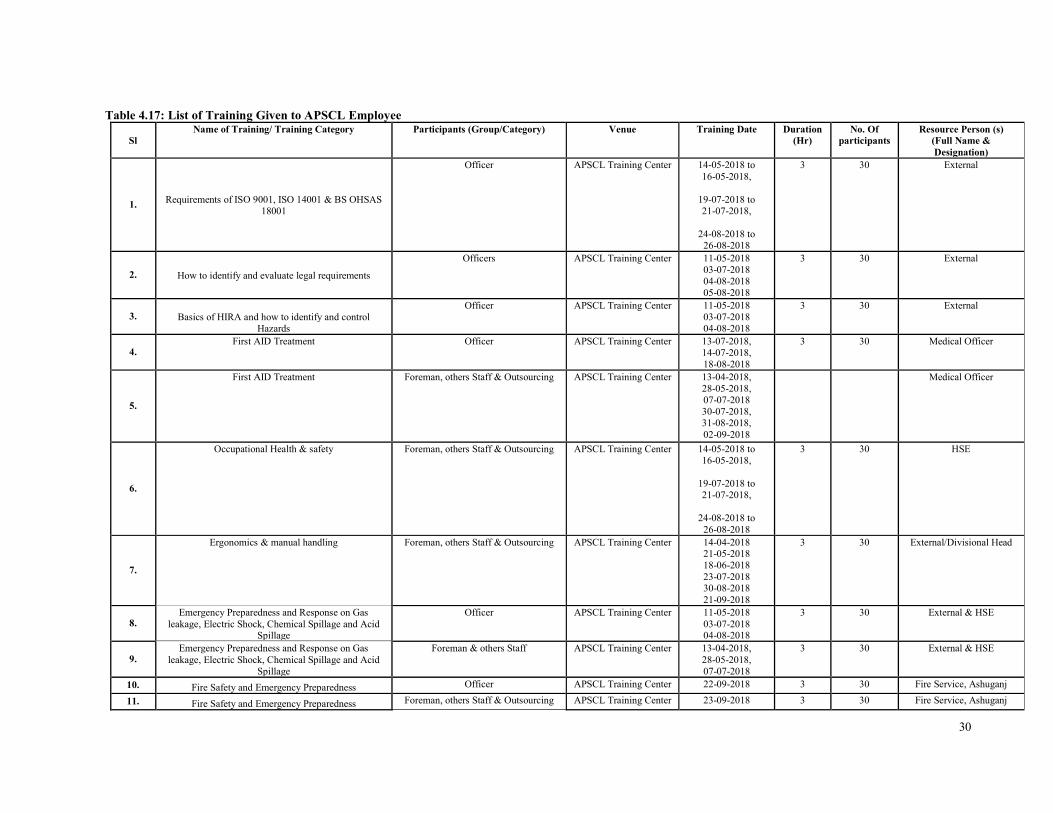
Table 4.17: List of Training Given to APSCL Employee
Sl
Name of Training/ Training Category Participants (Group/Category) Venue Training Date Duration
(Hr)
No. Of
participants
Resource Person (s)
(Full Name &
Designation)
1. Requirements of ISO 9001, ISO 14001 & BS OHSAS
18001
Officer APSCL Training Center 14-05-2018 to
16-05-2018,
19-07-2018 to
21-07-2018,
24-08-2018 to
26-08-2018
3 30 External
2. How to identify and evaluate legal requirements
Officers APSCL Training Center 11-05-2018
03-07-2018
04-08-2018
05-08-2018
3 30 External
3. Basics of HIRA and how to identify and control
Hazards
Officer APSCL Training Center 11-05-2018
03-07-2018
04-08-2018
3 30 External
4. First AID Treatment Officer APSCL Training Center 13-07-2018,
14-07-2018,
18-08-2018
3 30 Medical Officer
5.
First AID Treatment Foreman, others Staff & Outsourcing APSCL Training Center 13-04-2018,
28-05-2018,
07-07-2018
30-07-2018,
31-08-2018,
02-09-2018
Medical Officer
6.
Occupational Health & safety Foreman, others Staff & Outsourcing APSCL Training Center 14-05-2018 to
16-05-2018,
19-07-2018 to
21-07-2018,
24-08-2018 to
26-08-2018
3 30 HSE
7.
Ergonomics & manual handling Foreman, others Staff & Outsourcing APSCL Training Center 14-04-2018 21-05-2018
18-06-2018
23-07-2018 30-08-2018
21-09-2018
3 30 External/Divisional Head
8. Emergency Preparedness and Response on Gas
leakage, Electric Shock, Chemical Spillage and Acid Spillage
Officer APSCL Training Center 11-05-2018
03-07-2018 04-08-2018
3 30 External & HSE
9. Emergency Preparedness and Response on Gas
leakage, Electric Shock, Chemical Spillage and Acid
Spillage
Foreman & others Staff APSCL Training Center 13-04-2018,
28-05-2018,
07-07-2018
3 30 External & HSE
10. Fire Safety and Emergency Preparedness Officer APSCL Training Center 22-09-2018 3 30 Fire Service, Ashuganj
11. Fire Safety and Emergency Preparedness Foreman, others Staff & Outsourcing APSCL Training Center 23-09-2018 3 30 Fire Service, Ashuganj
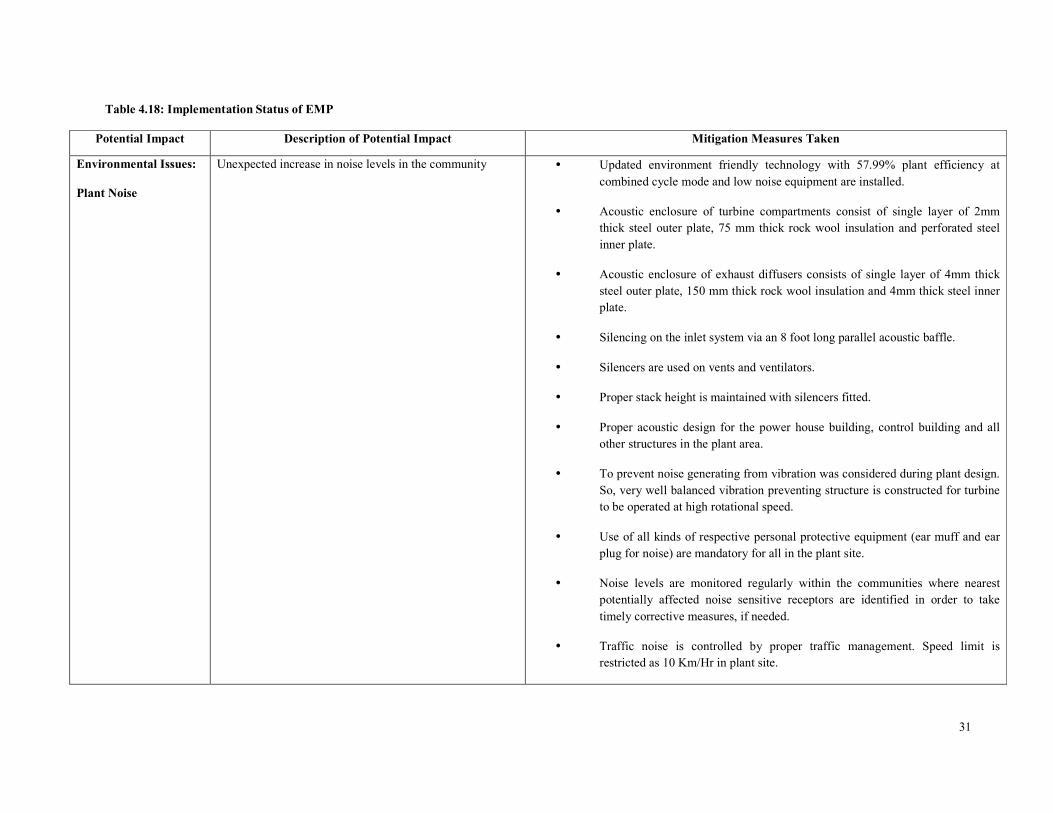
31
Table 4.18: Implementation Status of EMP
Potential Impact Description of Potential Impact Mitigation Measures Taken
Environmental Issues:
Plant Noise
Unexpected increase in noise levels in the community • Updated environment friendly technology with 57.99% plant efficiency at
combined cycle mode and low noise equipment are installed.
• Acoustic enclosure of turbine compartments consist of single layer of 2mm
thick steel outer plate, 75 mm thick rock wool insulation and perforated steel
inner plate.
• Acoustic enclosure of exhaust diffusers consists of single layer of 4mm thick
steel outer plate, 150 mm thick rock wool insulation and 4mm thick steel inner
plate.
• Silencing on the inlet system via an 8 foot long parallel acoustic baffle.
• Silencers are used on vents and ventilators.
• Proper stack height is maintained with silencers fitted.
• Proper acoustic design for the power house building, control building and all
other structures in the plant area.
• To prevent noise generating from vibration was considered during plant design.
So, very well balanced vibration preventing structure is constructed for turbine
to be operated at high rotational speed.
• Use of all kinds of respective personal protective equipment (ear muff and ear
plug for noise) are mandatory for all in the plant site.
• Noise levels are monitored regularly within the communities where nearest
potentially affected noise sensitive receptors are identified in order to take
timely corrective measures, if needed.
• Traffic noise is controlled by proper traffic management. Speed limit is
restricted as 10 Km/Hr in plant site.
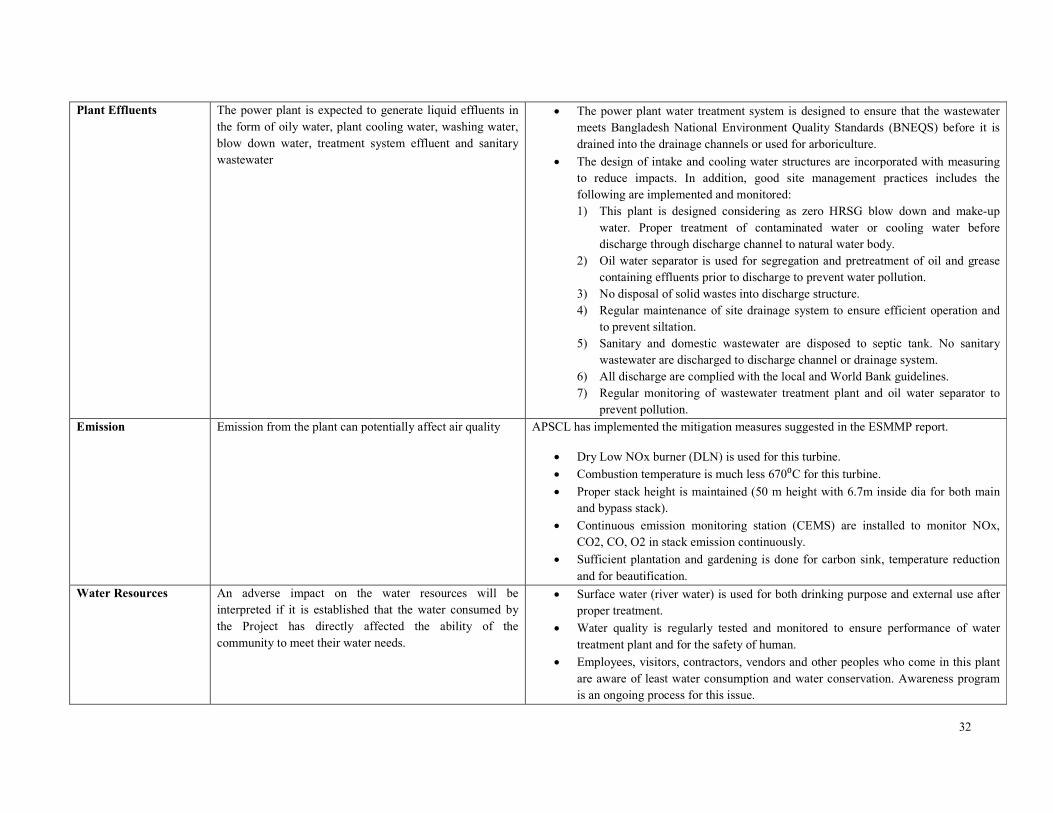
32
Plant Effluents The power plant is expected to generate liquid effluents in
the form of oily water, plant cooling water, washing water,
blow down water, treatment system effluent and sanitary
wastewater
• The power plant water treatment system is designed to ensure that the wastewater
meets Bangladesh National Environment Quality Standards (BNEQS) before it is
drained into the drainage channels or used for arboriculture.
• The design of intake and cooling water structures are incorporated with measuring
to reduce impacts. In addition, good site management practices includes the
following are implemented and monitored:
1) This plant is designed considering as zero HRSG blow down and make-up
water. Proper treatment of contaminated water or cooling water before
discharge through discharge channel to natural water body.
2) Oil water separator is used for segregation and pretreatment of oil and grease
containing effluents prior to discharge to prevent water pollution.
3) No disposal of solid wastes into discharge structure.
4) Regular maintenance of site drainage system to ensure efficient operation and
to prevent siltation.
5) Sanitary and domestic wastewater are disposed to septic tank. No sanitary
wastewater are discharged to discharge channel or drainage system.
6) All discharge are complied with the local and World Bank guidelines.
7) Regular monitoring of wastewater treatment plant and oil water separator to
prevent pollution.
Emission Emission from the plant can potentially affect air quality APSCL has implemented the mitigation measures suggested in the ESMMP report.
• Dry Low NOx burner (DLN) is used for this turbine.
• Combustion temperature is much less 670⁰C for this turbine.
• Proper stack height is maintained (50 m height with 6.7m inside dia for both main
and bypass stack).
• Continuous emission monitoring station (CEMS) are installed to monitor NOx,
CO2, CO, O2 in stack emission continuously.
• Sufficient plantation and gardening is done for carbon sink, temperature reduction
and for beautification.
Water Resources An adverse impact on the water resources will be
interpreted if it is established that the water consumed by
the Project has directly affected the ability of the
community to meet their water needs.
• Surface water (river water) is used for both drinking purpose and external use after
proper treatment.
• Water quality is regularly tested and monitored to ensure performance of water
treatment plant and for the safety of human.
• Employees, visitors, contractors, vendors and other peoples who come in this plant
are aware of least water consumption and water conservation. Awareness program
is an ongoing process for this issue.
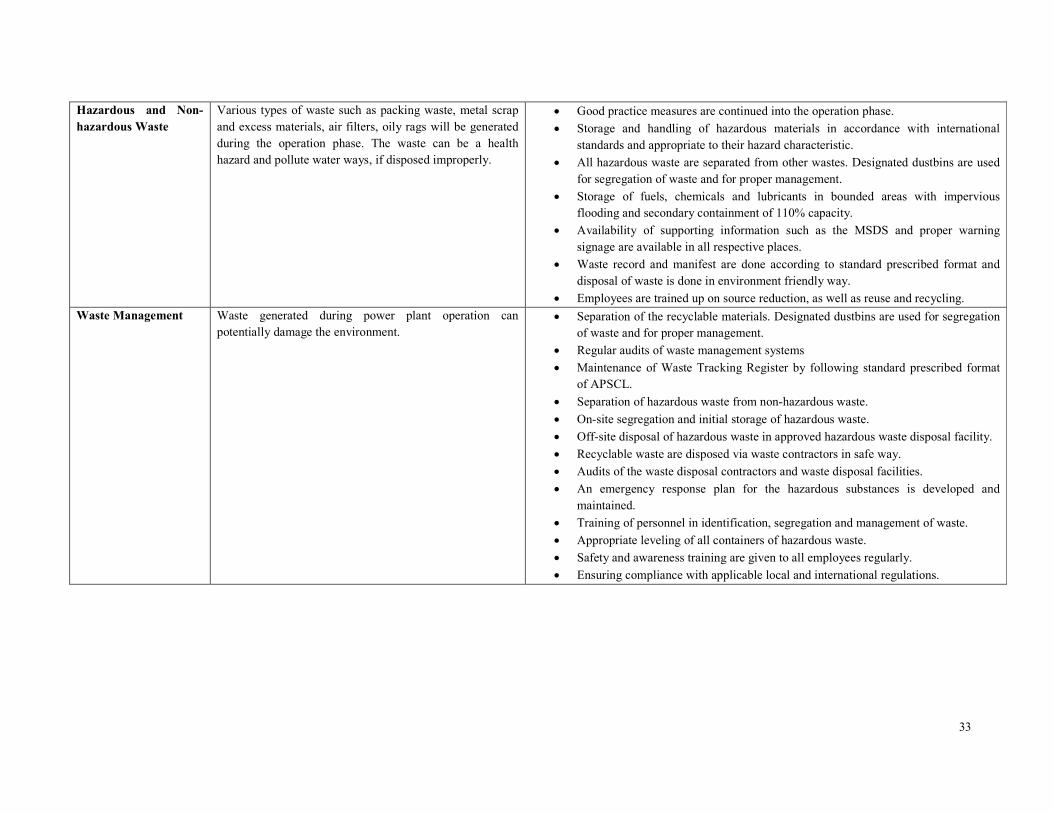
33
Hazardous and Non-
hazardous Waste
Various types of waste such as packing waste, metal scrap
and excess materials, air filters, oily rags will be generated
during the operation phase. The waste can be a health
hazard and pollute water ways, if disposed improperly.
• Good practice measures are continued into the operation phase.
• Storage and handling of hazardous materials in accordance with international
standards and appropriate to their hazard characteristic.
• All hazardous waste are separated from other wastes. Designated dustbins are used
for segregation of waste and for proper management.
• Storage of fuels, chemicals and lubricants in bounded areas with impervious
flooding and secondary containment of 110% capacity.
• Availability of supporting information such as the MSDS and proper warning
signage are available in all respective places.
• Waste record and manifest are done according to standard prescribed format and
disposal of waste is done in environment friendly way.
• Employees are trained up on source reduction, as well as reuse and recycling.
Waste Management Waste generated during power plant operation can
potentially damage the environment.
• Separation of the recyclable materials. Designated dustbins are used for segregation
of waste and for proper management.
• Regular audits of waste management systems
• Maintenance of Waste Tracking Register by following standard prescribed format
of APSCL.
• Separation of hazardous waste from non-hazardous waste.
• On-site segregation and initial storage of hazardous waste.
• Off-site disposal of hazardous waste in approved hazardous waste disposal facility.
• Recyclable waste are disposed via waste contractors in safe way.
• Audits of the waste disposal contractors and waste disposal facilities.
• An emergency response plan for the hazardous substances is developed and
maintained.
• Training of personnel in identification, segregation and management of waste.
• Appropriate leveling of all containers of hazardous waste.
• Safety and awareness training are given to all employees regularly.
• Ensuring compliance with applicable local and international regulations.
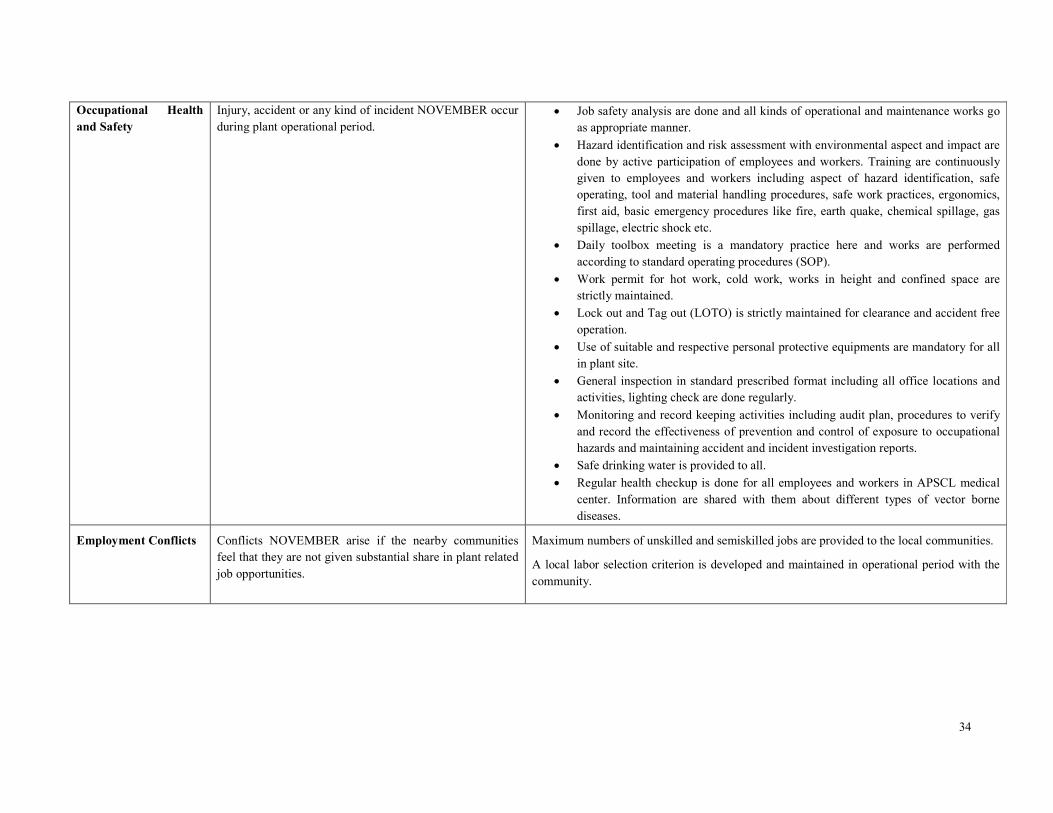
34
Occupational Health
and Safety
Injury, accident or any kind of incident NOVEMBER occur
during plant operational period.
• Job safety analysis are done and all kinds of operational and maintenance works go
as appropriate manner.
• Hazard identification and risk assessment with environmental aspect and impact are
done by active participation of employees and workers. Training are continuously
given to employees and workers including aspect of hazard identification, safe
operating, tool and material handling procedures, safe work practices, ergonomics,
first aid, basic emergency procedures like fire, earth quake, chemical spillage, gas
spillage, electric shock etc.
• Daily toolbox meeting is a mandatory practice here and works are performed
according to standard operating procedures (SOP).
• Work permit for hot work, cold work, works in height and confined space are
strictly maintained.
• Lock out and Tag out (LOTO) is strictly maintained for clearance and accident free
operation.
• Use of suitable and respective personal protective equipments are mandatory for all
in plant site.
• General inspection in standard prescribed format including all office locations and
activities, lighting check are done regularly.
• Monitoring and record keeping activities including audit plan, procedures to verify
and record the effectiveness of prevention and control of exposure to occupational
hazards and maintaining accident and incident investigation reports.
• Safe drinking water is provided to all.
• Regular health checkup is done for all employees and workers in APSCL medical
center. Information are shared with them about different types of vector borne
diseases.
Employment Conflicts Conflicts NOVEMBER arise if the nearby communities
feel that they are not given substantial share in plant related
job opportunities.
Maximum numbers of unskilled and semiskilled jobs are provided to the local communities.
A local labor selection criterion is developed and maintained in operational period with the
community.
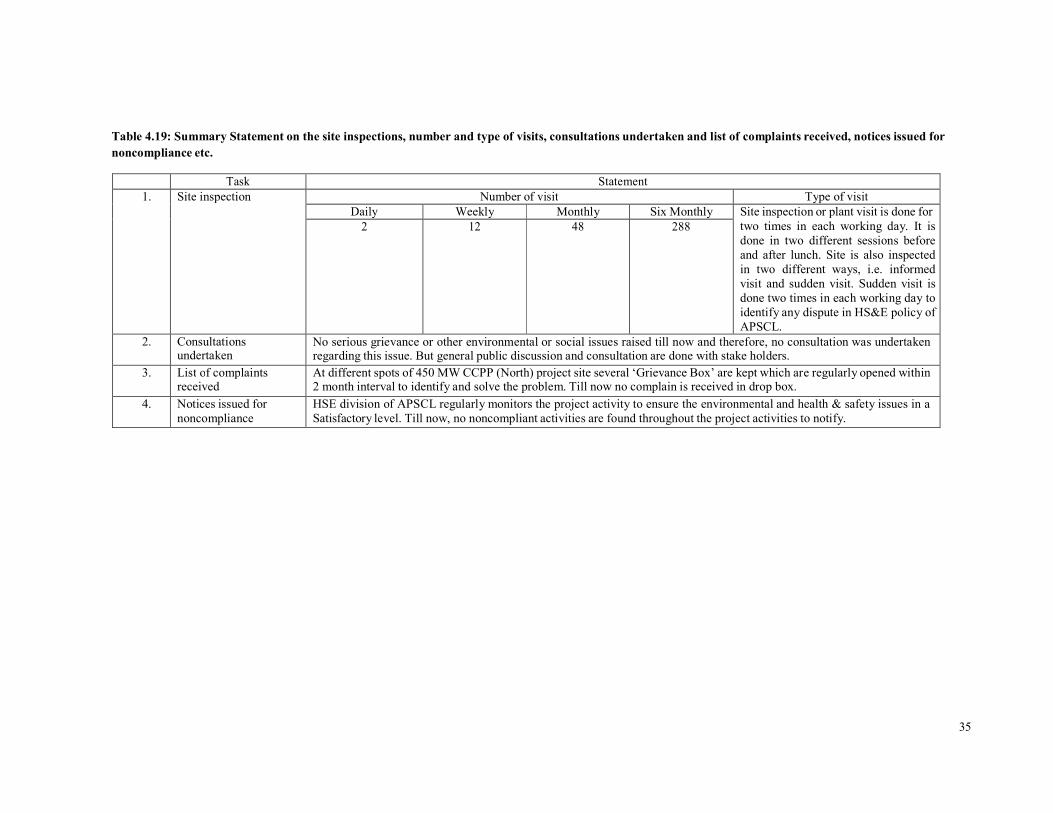
35
Table 4.19: Summary Statement on the site inspections, number and type of visits, consultations undertaken and list of complaints received, notices issued for
noncompliance etc.
Task Statement
1. Site inspection Number of visit Type of visit
Daily Weekly Monthly Six Monthly Site inspection or plant visit is done for
two times in each working day. It is
done in two different sessions before
and after lunch. Site is also inspected
in two different ways, i.e. informed
visit and sudden visit. Sudden visit is
done two times in each working day to
identify any dispute in HS&E policy of
APSCL.
2 12 48 288
2. Consultations undertaken
No serious grievance or other environmental or social issues raised till now and therefore, no consultation was undertaken regarding this issue. But general public discussion and consultation are done with stake holders.
3. List of complaints received
At different spots of 450 MW CCPP (North) project site several ‘Grievance Box’ are kept which are regularly opened within 2 month interval to identify and solve the problem. Till now no complain is received in drop box.
4. Notices issued for
noncompliance
HSE division of APSCL regularly monitors the project activity to ensure the environmental and health & safety issues in a
Satisfactory level. Till now, no noncompliant activities are found throughout the project activities to notify.
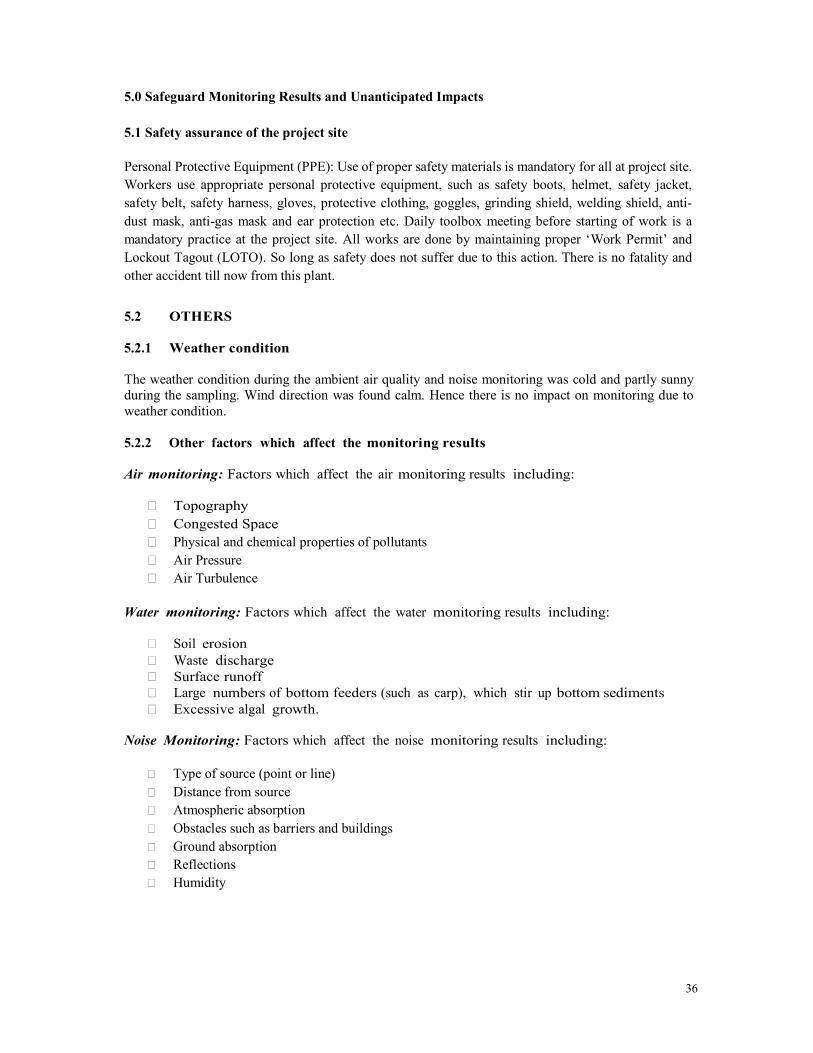
36
5.0 Safeguard Monitoring Results and Unanticipated Impacts
5.1 Safety assurance of the project site
Personal Protective Equipment (PPE): Use of proper safety materials is mandatory for all at project site.
Workers use appropriate personal protective equipment, such as safety boots, helmet, safety jacket,
safety belt, safety harness, gloves, protective clothing, goggles, grinding shield, welding shield, anti-
dust mask, anti-gas mask and ear protection etc. Daily toolbox meeting before starting of work is a
mandatory practice at the project site. All works are done by maintaining proper ‘Work Permit’ and
Lockout Tagout (LOTO). So long as safety does not suffer due to this action. There is no fatality and
other accident till now from this plant.
5.2 OTHERS 5.2.1 Weather condition
The weather condition during the ambient air quality and noise monitoring was cold and partly sunny
during the sampling. Wind direction was found calm. Hence there is no impact on monitoring due to
weather condition.
5.2.2 Other factors which affect the monitoring results
Air monitoring: Factors which affect the air monitoring results including:
Topography
Congested Space
Physical and chemical properties of pollutants
Air Pressure
Air Turbulence
Water monitoring: Factors which affect the water monitoring results including:
Soil erosion
Waste discharge
Surface runoff
Large numbers of bottom feeders (such as carp), which stir up bottom sediments
Excessive algal growth.
Noise Monitoring: Factors which affect the noise monitoring results including:
Type of source (point or line)
Distance from source
Atmospheric absorption
Obstacles such as barriers and buildings
Ground absorption
Reflections
Humidity
37
6.0 Implementation Of Grievance Redress Mechanism And Complaints Received From Stakeholders
There is a grievance redress mechanism developed in the project site. But till now there is not
received any grievance to address.
7.0 Conclusion and Recommendation
The environmental monitoring report is consist of 8th Semiannually environmental monitoring reporting
based on monthly measured ambient air, noise, drinking water, ground and river water quality
parameters. Ambient air quality parameters were determined in the site with the help of high volume
sampler and noise quality was done by noise level meter. Drinking water, ground and surface water
quality parameters were analyzed in the laboratory. All of the mitigation measures are taken
following ADB Environmental Safeguard Policy Guideline 2009, IFC/World Bank Thermal Power
plant guideline 2008 and DoE, Bangladesh guideline.
From the analysis it is found that the ambient air quality results found within DoE standards. This values
is cumulative with surrounding ambient air and noise level. SOx and CO are not a problem of the
construction period of the power plant. But SPM, PM2.5, PM10 level during construction period of power
plant are controlled by taking proper mitigation measures and spraying of water.
Noise level quality of this plant has also been measured by both APSCl. According to the measurement,
the noise level around the plant area found within the allowable limit of Industrial zone both the day
and also at night time. The noise level are controlled by using modern, environment friendly, new and
fine-tuned equipment and plant machineries.
Surface water quality parameter at Meghna River was performed to evaluate whether this plant poses
any detrimental effect on the water environment. From the analysis it has been found that the project
does not cause water pollution to the natural environment. Otherwise, any spill is not detected next to
riverbeds around the worksite (oils, concrete waste or conglomerate asphalt, any color changes of the
water, etc.). Drinking and ground water quality is also found good.
House-keeping is also in good condition at the plant site. All solid, liquid and hazardous waste are
disposed to the designated container at the plant site. Most of the solid wastes are disposed by landfill.
The usable solid wastes are handed over to proper party for recycling. Liquid hazardous waste is
conserved and properly clean of the storage area. Hazardous waste is kept at designated places by
labeling.
Finally it can be concluded that the plant has minor detrimental impact for short period on the
environment in terms of ambient air and ambient noise during the operational period. The plant
provides a good working environment for the workers.
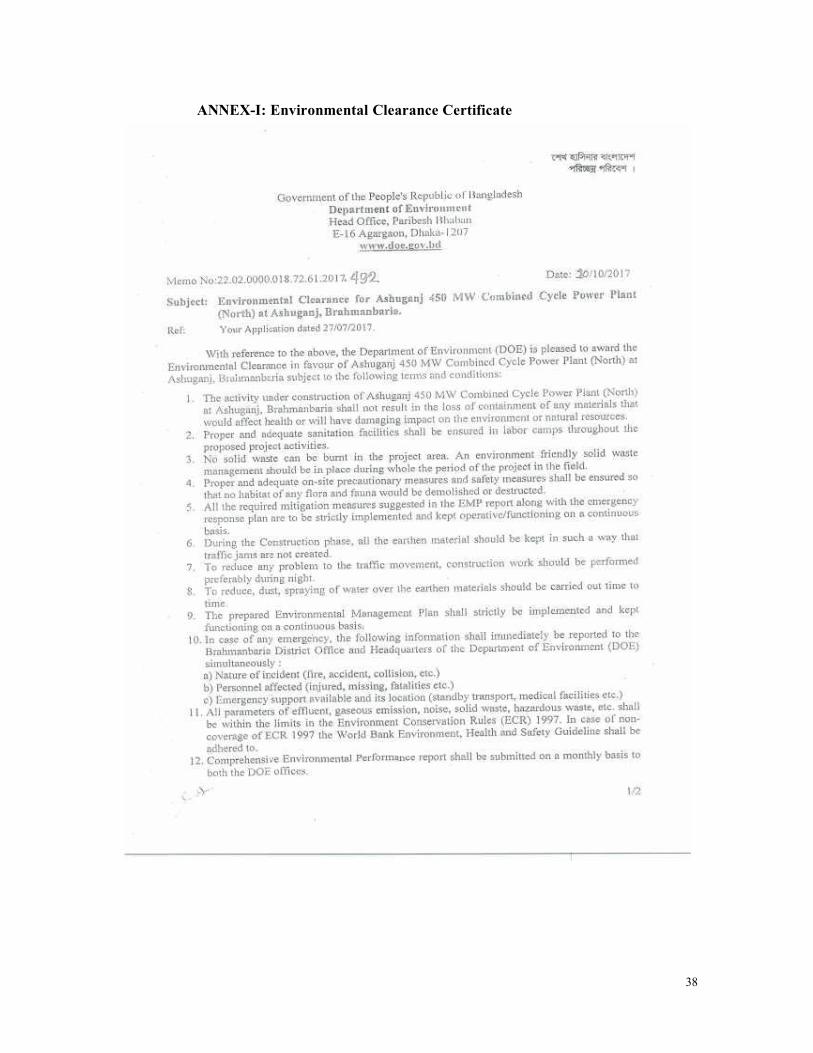
38
ANNEX-I: Environmental Clearance Certificate
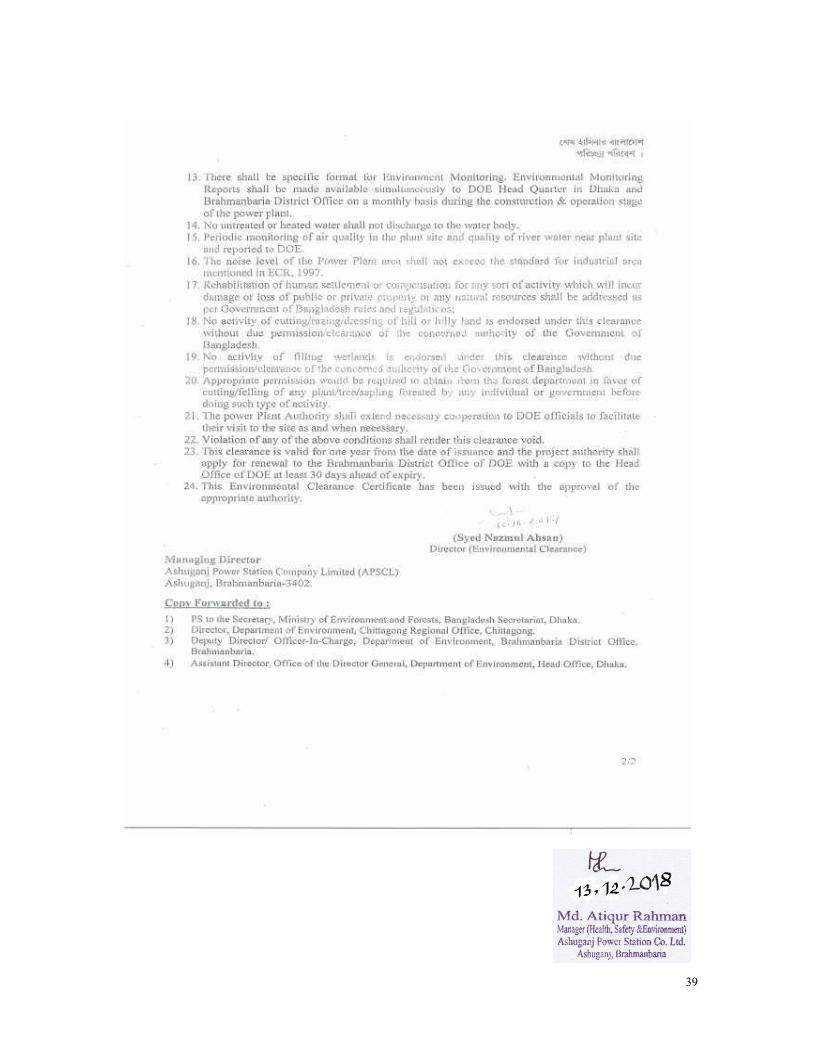
39