ASEP PROCEDURES RECOMMENDATION I: ACCURATE ASSESSMENT OF MUSCULAR STRENGTH AND POWER
21
Accurate Assessment of Muscular Strength and Power 1 JEPonline Journal of Exercise Physiologyonline Official Journal of The American Society of Exercise Physiologists (ASEP) ISSN 1097-9751 An International Electronic Journal Volume 4 Number 3 August 2001 ASEP Procedures Recommendation ASEP PROCEDURES RECOMMENDATION I: ACCURATE ASSESSMENT OF MUSCULAR STRENGTH AND POWER LEE E. BROWN 1 AND JOSEPH P. WEIR 2 1 Assistant Professor and Director of the Human Performance Laboratory, Arkansas State University, Arkansas 2 Associate Professor, Program in Physical Therapy, Des Moines University-Osteopathic Medical Center Des Moines, Iowa ABSTRACT LEE E. BROWN AND JOSEPH P. WEIR. ASEP Procedures Recommendation I: Accurate Assessment Of Muscular Strength And Power. JEPonline. 2001;4(3):1-21. The content of this manuscript is intended to assist the reader in collecting valid and reliable data for quantifying muscular strength and power. Various drawbacks and pitfalls of specific tests, as well as recommendations for the practitioner are also provided. The content is divided into sections covering isometric, isotonic, field tests, and isokinetic modes of exercise. Inherent in these modes are both concentric and eccentric muscle actions as well as both open and closed kinetic chain activities. For Isometric testing, contractions should occur over a four to five seconds duration with a one second transition period at the start of the contraction. At least one minute of rest should be provided between contractions. For each muscle tested at each position, at least three contractions should be performed although more may be performed if deemed necessary by the tester. For isotonic testing, the 1-RM test should be performed. After the general warm-up, the subject should perform a specific warm-up set of 8 repetitions at approximately 50% of the estimated 1-RM followed by another set of 3 repetitions at 70% of the estimated 1- RM. Subsequent lifts are single repetitions of progressively heavier weights until failure. Repeat until the 1-RM is determined to the desired level of precision. The rest interval between sets should be not less than one and not more than five minutes. The optimal number of single repetitions ranges from three to five. Data and guidelines of the following field tests are also provided; vertical jump, bench press, Wingate anaerobic cycle test (WAT), and the Margaria stair-run test. For isokinetic testing, details are provided for testing peak torque, work, power, endurance, and estimation of fiber type percentages. Key Tems: Resistance, Exercise, Isokinetic, Isotonic, Isometric, Contraction
Transcript of ASEP PROCEDURES RECOMMENDATION I: ACCURATE ASSESSMENT OF MUSCULAR STRENGTH AND POWER

Accurate Assessment of Muscular Strength and Power 1
JEPonlineJournal of Exercise Physiologyonline
Official Journal of The AmericanSociety of Exercise Physiologists (ASEP)
ISSN 1097-9751An International Electronic JournalVolume 4 Number 3 August 2001
ASEP Procedures Recommendation
ASEP PROCEDURES RECOMMENDATION I: ACCURATE ASSESSMENT OFMUSCULAR STRENGTH AND POWER
LEE E. BROWN1 AND JOSEPH P. WEIR2
1Assistant Professor and Director of the Human Performance Laboratory, Arkansas State University, Arkansas2Associate Professor, Program in Physical Therapy, Des Moines University-Osteopathic Medical CenterDes Moines, Iowa
ABSTRACT
LEE E. BROWN AND JOSEPH P. WEIR. ASEP Procedures Recommendation I: Accurate Assessment OfMuscular Strength And Power. JEPonline. 2001;4(3):1-21. The content of this manuscript is intended toassist the reader in collecting valid and reliable data for quantifying muscular strength and power. Variousdrawbacks and pitfalls of specific tests, as well as recommendations for the practitioner are also provided. Thecontent is divided into sections covering isometric, isotonic, field tests, and isokinetic modes of exercise.Inherent in these modes are both concentric and eccentric muscle actions as well as both open and closed kineticchain activities. For Isometric testing, contractions should occur over a four to five seconds duration with a onesecond transition period at the start of the contraction. At least one minute of rest should be provided betweencontractions. For each muscle tested at each position, at least three contractions should be performed althoughmore may be performed if deemed necessary by the tester. For isotonic testing, the 1-RM test should beperformed. After the general warm-up, the subject should perform a specific warm-up set of 8 repetitions atapproximately 50% of the estimated 1-RM followed by another set of 3 repetitions at 70% of the estimated 1-RM. Subsequent lifts are single repetitions of progressively heavier weights until failure. Repeat until the 1-RMis determined to the desired level of precision. The rest interval between sets should be not less than one and notmore than five minutes. The optimal number of single repetitions ranges from three to five. Data and guidelinesof the following field tests are also provided; vertical jump, bench press, Wingate anaerobic cycle test (WAT),and the Margaria stair-run test. For isokinetic testing, details are provided for testing peak torque, work, power,endurance, and estimation of fiber type percentages.
Key Tems: Resistance, Exercise, Isokinetic, Isotonic, Isometric, Contraction

Accurate Assessment of Muscular Strength and Power 2
INTRODUCTION
The assessment of strength and power is fundamental to athletic and human performance. Accurate knowledgeof an individual’s present level of muscular strength is important for both occupational functional capacityevaluation and appropriate athletic and rehabilitation exercise prescription. This paper is designed to assist thereader in collecting valid and reliable data pertaining to muscle strength and power. It is also designed to pointout various drawbacks and pitfalls as well as recommendations for the practitioner. To this end, this paper laysthe framework for the proper techniques of collection and interpretation of strength and power tests. It isdivided into sections covering isometric, isotonic and isokinetic modes of exercise. Inherent in these modes areboth concentric and eccentric muscle actions as well as both open and closed kinetic chain activities. While it isbeyond the scope of this paper to detail specific aspects of each of these, the reader should be aware that theguidelines stated herein apply across each variation of human strength and power expression discussed.
GENERAL CONSIDERATIONS
Certain aspects of strength and power testing are generic to isometric, isotonic, and isokinetic measures. Theseinclude planning, safety, warm-up, familiarization, and specificity. These issues will be addressed here andfactors that are unique to the specific testing modes will be addressed in the appropriate sections below.PlanningBefore undertaking any strength or power test a thorough plan should be in place regarding the type of data tobe acquired. For example, in isokinetic testing one may choose to record peak torque, peak or average power, orwork performed by the specific muscle group of interest. An examiner must determine a priori why and whatthey are testing prior to the evaluation and what specific information is of interest. As noted below, strength andpower testing is specialized and returns information based on precise anatomical configurations, muscle length-tension relationships and velocities of muscle action. The practitioner must also be aware of data reductiontechniques designed to eliminate extraneous information. If a clear understanding of the limitations of testing isestablished prior to interpretation, there will be little chance for erroneous conclusions.SafetySuitable safety measures should be in place prior to commencing any testing battery. These include, but are notlimited to, inspection of equipment for broken or frayed components, appropriate lighting and temperature ofthe environment as well as removal of all hazards near and around the testing site. Emergency procedures needto be formalized. All testing personnel need to be familiar with these procedures and be certified in basic lifesupport. Most importantly, all testing should be conducted under the diligent supervision of individualsexperienced in physiological testing and measurement (i.e. an exercise physiologist with ASEP certification -EPC). Attention to these simple safety measures will help ensure the protection of both examiner and examinee.Warm UpWhile there is little data directly supporting decreased injury risk associated with warm up activities, it isphysiologically reasonable to presume that increased muscle temperature and associated increased muscleelasticity decreases injuries associated with testing. Warm up activities should include both a general andspecific warm up. The general warm up should consist of light activities such as low resistance leg or armcycling designed to raise muscle temperature. Specific warm up activities should include static stretching of themuscle that will undergo testing. Additional warm up activities involving performing the actual test motions areaddressed in the specific test mode sections below.FamiliarizationMany of the individuals who will undergo strength and power testing may have little or no experienceperforming the strength testing maneuvers. While strength testing has generally been shown to be reliable (2),novice subjects will likely improve strength scores on subsequent testing simply due to increased familiarityand comfort with the testing (54,71). This is especially true for strength tests that require relatively higher levelsof motor skill such as isotonic testing with free weights. If possible, novice subjects should be given afamiliarization session prior to actual testing. This should involve having the subject proceed through the entire

Accurate Assessment of Muscular Strength and Power 3
test protocol while giving maximal effort. The subsequent testing session should occur at a time in whichresidual muscle soreness is over (e.g., 2 to 3 days).SpecificityIt is well established that various aspects of strength are associated with high levels of specificity. For example,many testing devices on the market today are designed to test and exercise muscles using the open kinetic chain.That is, only the isolated muscles of one joint are being examined. The information gathered from this type oftesting will lead the examiner to specific conclusions regarding that single joint. Different results andconclusions may occur with multi-joint testing. Similarly, strength data derived from one type of contractionmode may correlate poorly with data from another mode. Throughout, it should be kept in mind that testingshould be as specific as possible to the setting in which the information will be applied.
ISOMETRIC TESTING
Isometric contractions are muscle contractions in which the length of the muscle remains constant. Nomovement occurs and therefore no physical work is performed; however in a strict sense, isometric contractionsdo result in small changes in muscle fiber length and stretching of the elastic components of the muscle.Isometric testing is also called static testing. The primary advantage of isometric strength testing is that, withthe proper equipment, it is relatively quick and easy to perform which lends itself to testing of large groups ofsubjects. A variety of devices have been used to measure isometric strength. These include cable tensiometers,strain gauges, and isokinetic dynamometers (with speed set to zero). In addition, with the exception ofisokinetic devices, testing equipment is relatively inexpensive. Further, computer interfacing with isometricrecording devices allows for the calculation of additional variables besides strength, such as the rate of forcedevelopment (35). Testing at multiple joint angles allows for determination of strength throughout the range ofmotion.
The primary disadvantage of isometric testing is that the strength values recorded are specific to the point(s) inthe range of motion at which the isometric contraction occurred, and strength scores at one position may bepoorly correlated with strength scores at other positions (65,90). In addition, since most physical activities aredynamic, it has been questioned whether static strength measures provide strength data that are specific toactivities of interest, and there are conflicting results in the literature as to whether isometric testing is predictiveof dynamic performance (88). However, isometric strength testing has been shown to provide informationpredictive of occupational injuries associated with dynamic lifting tasks (22,45). Further, conflicting resultsregarding static versus dynamic relationships may be a reflection of the joint angle used during isometric testing(65).
In general, isometric strength testing has been shown to be highly reliable as assessed by reliability coefficients(correlations between 0.85 and 0.99) (2). However, there may still be systematic error. For example, Kroll (54)found high reliability (0.93) for repeated testing of the wrist flexors when analyzed with intraclass correlationcoefficients (ICC). However, significant differences in mean values were found across test days. Similarly,Reinking et al. (71) found a relatively high reliability coefficient (ICC = 0.80, standard error of the mean (SEM)= 19.4% of mean) for isometric testing of the quadriceps (60° of knee flexion) on separate days. However, themean values were significantly different, indicating that there were systematic increases in isometric forceacross test days. These results suggest that a separate practice session prior to actual testing may facilitatemaximal performance and avoid introduction of systematic bias due to learning effects.
A variety of factors need to be considered with isometric testing. These include the joint angle at which toperform the testing, the rest interval between consecutive repetitions, the number of repetitions to perform, theduration of the contraction, and the time interval over which the force or torque is calculated. To date, there areno specific guidelines for these factors and little data exists which evaluates different procedures.

Accurate Assessment of Muscular Strength and Power 4
Joint AngleIf isometric data are needed for defining strength at specific positions, then testing at joint angles associatedwith these positions is warranted (22). However, if there is no joint angle preference, then other criteria for jointangle selection may be used. Sale (73) has suggested that testing at the joint angle associated with the maximumforce output may serve to decrease error associated with minor errors in joint positioning. For example, the kneeposition associated with maximal knee extensor force is approximately midway between full extension and fullflexion at approximately 65 degrees (55). Force-angle curves have been reported for a variety of joints (55)which can be used to choose the joint angle to be tested.Duration of ContractionsSale (73) suggests that isometric contractions of five seconds duration are long enough to allow for peak forcedevelopment. Further, subjects can only maintain force at maximum for ≤ 1 second (73). Caldwell et al. (20)recommended a contraction duration of four seconds with a one second transition period from rest to maximalforce. They also suggested that a four-second exertion ensures that a three-second plateau will occur and thatthe mean force over this three-second period be recorded. Similarly, Chaffin (21) recommended contractiondurations of four to six seconds. Collectively, the available literature indicates that a contraction period with aone-second-transition period and a four to five second plateau should be sufficient to achieve a maximalisometric contraction. It should be noted however, that these recommendations are derived from experience ofthe cited authors as opposed to experimental validation.Rest IntervalsA variety of rest intervals have been proposed in the literature. Sale (73) has suggested that one minute of restbe provided between trials. Caldwell et al. (20) recommended a rest interval of two minutes. Chaffin (21)recommended two minutes of rest between trials if a large number of trials (e.g., 15) are performed but restintervals may be as short as 30 seconds if only a few trials are performed. Collectively, the available literaturesuggests that a one-minute rest period should be sufficient to allow adequate recovery between trials. It shouldbe noted however, that these recommendations are derived from testing experience as opposed to experimentalvalidation.Number of RepetitionsEdwards et al. (29) used three maximal voluntary contractions in testing the quadriceps since the firstcontraction was usually “tentative”, while the second and third maximal contractions were usually similar toone another (coefficient of variation = 2.8%). Zeh et al. (90) reported that the mean of three trials was highlycorrelated with the first score of the three and concluded that one repetition provides “a reasonably goodindicator of the subject’s strength in that position”. They also noted that use of two repetitions increased theprecision of the measurement. The advantages of using few test repetitions is decreased injury risk, especiallyfor testing that stresses the lumbar spine (90). In addition, fewer repetitions will minimize the confoundingeffects of fatigue on the strength data. However, their regression analysis did not address potential systematicbias in the use of only one or two trials. While there is no consensus in the literature, three test repetitions arelikely to be sufficient to elicit a maximal value.Averaging IntervalSimple mechanical recording devices (e.g., cable tensiometers) typically record the peak force or torque duringa contraction. However, computer interfacing of the recording devices allows for the recording of the meanforce or torque over a given time period. Chaffin (21) has recommended that forces/torques be averaged over athree second time interval which “avoids the errors induced by tremor and motion dynamics”, however there isno data directly supporting the superiority of a three second averaging interval over other time intervals.Further, Sale (73) notes that subjects can only maintain force for ≤ 1 second, which suggests that the three-second recommendation of Chaffin (21) may be too long.Standardization of InstructionsCaldwell et al. (20) reported high variability in the force-time curves of subjects tested with differentinstructions from the tester. They argued that subjects require “explicit instructions” or else they will “developtheir own strategies reflecting diverse interpretation of the task”. Chaffin (21) further recommends thatinstructions should be non-emotional and objective and that factors such as noise, spectators, etc be avoided.

Accurate Assessment of Muscular Strength and Power 5
Positioning and StabilizationBecause muscle force is affected by muscle length, and torque output is affected by muscle force and momentarm (53), changes in positioning can result in changes in isometric measurements that are independent of actualdifferences in muscle strength. This is true not only for the specific joint tested but also in adjacent joints thatare crossed by a common muscle. For example, the hamstrings cross both the hip and knee joints and changes inhip position will affect flexion force at the knee. Therefore, proper stabilization and consistent positioning arecritical for reliable and valid results.Isometric Standardized ProceduresIsometric testing should involve contractions of four to five seconds duration with a one second transitionperiod at the start of the contraction. At least one minute of rest should be provided between contractions. Foreach muscle tested at each position, at least three contractions should be performed although more may beperformed if deemed necessary by the tester (e.g., due to improved performance over trials). If possible, therecorded force/torque should be sampled by a computer and averaged over time within each contraction. Theoptimal length of the averaging interval has not been determined.
ISOTONIC TESTING
Isotonic contractions refer to contractions in which an object of a fixed mass is lifted against gravity. Most typesof weight training, either with machines or free weights, are referred to as isotonic. The derivation of the termisotonic means constant (iso-) tension (73), and is technically inaccurate since the force required to lift a weightchanges throughout the range of motion. Other terms such as isoinertial (2,53,64) and DCER (dynamic constantexternal resistance (52) have been used to avoid the inaccuracy of the term isotonic. However, as the termisotonic is so ingrained in the language of exercise physiology, we argue that its use is acceptable provided thatit is operationally defined as described above and is used consistently in that context.
Isotonic testing is typically performed on machines (e.g., Universal, Nautilus, Cybex) that incorporateadjustable weight stacks for resistance or with the use of free weights. The maximal amount of weight that canbe lifted in one repetition is called the one-repetition maximum (1-RM), and is the most common measure ofisotonic strength. Other measures such as the 3-RM, 5-RM, 10-RM, and the maximum number of repetitionsthat can be performed at a fixed resistance can also be determined. While scores on these tests are correlatedwith 1-RM, these measures are also affected by muscle fatigue and are not a measure of muscle strength per se.
The advantages of typical isotonic testing are that the necessary equipment is often readily available and, atleast for free weights, is relatively inexpensive (52). In addition, since most resistance training programsemphasize isotonic training, isotonic testing is specific to the training that is typically performed. Further,isotonic testing has generally been reported to be reliable (2).
The primary criticism of isotonic testing is that the 1-RM strength score is limited by the weakest point in therange of motion (i.e., the so-called “sticking point”) (27,73). Therefore, the muscles used are performing sub-maximally during the range of motion at positions other than the sticking point. In addition, the 1-RM scoredoes not provide information regarding the rate of force development or force output through the range ofmotion (63). Further, typical 1-RM testing provides a measure of concentric performance and no informationabout eccentric capability. Also, 1-RM lifts may not be specific to athletic events in terms of movementpatterns, contraction velocities, and accelerations (2).
Isotonic testing of 1-RM involves a trial and error procedure in which progressively heavier weights are lifteduntil the weight exceeds the subject’s ability. Subsequent attempts are performed at a lower weight until theheaviest successful lift is determined. Because of the multiple trials involved, the testing can be confounded byfatigue (23) and a variety of factors need to be considered to optimize 1-RM performance. These include choiceof starting weight, rest interval between attempts, increments in weight between attempts, use of feedback

Accurate Assessment of Muscular Strength and Power 6
regarding weight to be lifted, and criteria for an acceptable lift. To date, there are no established standards forthese decisions and little data are available to help discriminate between options. The followingrecommendations represent general procedures that have been employed in the literature (76,82,85) and whichare consistent with physiological (e.g., recovery from fatigue) and safety considerations.Isotonic Standardized ProceduresIf the subject has experience with the isotonic lift to be performed, a good starting point is to have the subjectestimate his/her maximum. From this estimate, desired percentages of the estimated 1-RM can be calculated.Similarly, if the subject knows the maximal number of repetitions that can be performed at a given weight, 1-RM can be predicted using the equations in the subsequent section entitled “Bench Press Prediction Equations.”The subject should perform a general warm-up of 3-5 minutes of light activity involving the muscle(s) to betested (e.g., upper body ergometry prior to upper body strength testing). Next, the subject should perform staticstretching exercises of the involved musculature. After the general warm-up, the subject should perform aspecific warm-up set of 8 repetitions at approximately 50% of the estimated 1-RM followed by another set of 3repetitions at 70% of the estimated 1-RM. Subsequent lifts are single repetitions of progressively heavierweights until failure. The initial increments in weight should be evenly spaced and adjusted such that at leasttwo single lift sets are performed between the three repetition warm-up set and the estimated 1-RM. At failure, aweight approximately midway between the last successful and failed lift should be attempted. Repeat until the1-RM is determined to the desired level of precision. The rest interval between sets should be not less than oneand not more than five minutes (85). The optimal number of single repetitions ranges from three to five (52).
FIELD TESTSVertical JumpThe vertical jump (VJ) test is the primary test to assess muscular power in the legs. Unfortunately, there are avariety of procedures and types of VJ reported in different studies (37). There are two primary forms of the VJtest: the squat jump (SJ) and the counter-movement jump (CMJ). In the SJ, subjects lower themselves into asquat position and after a brief pause, jump upwards as quickly and as high as possible. No down motion isallowed immediately prior to jumping upwards. In contrast, in the CMJ subjects start in a standing position,drop to a squatting position (counter-movement), and with no pause jump upwards as high as possible from thebottom of the squat. In addition, both the SJ and CMJ can be performed with or without the use of arm motions.When arm motions are employed, the subject is instructed to thrust the arms forward and upward during thejump (75). When arm motions are not allowed, the subjects may be required to place their hands on their hips(3) or hold their hands behind their back (10).
The CMJ results in jump heights and power values that are higher than the SJ (10,75). For example, Sayer et al.(75) found CMJ jump heights that were 7% higher than SJ and peak power differences of 2.6%. Similarly, useof arm thrusts has been shown to significantly increase both SJ (10 cm.) and CMJ (11 cm.) performance (36).Indeed, the effect of arm motion exceeds that of the counter-movement. Currently, there is no consensusregarding whether arm thrusting should or should not be used during VJ testing. However, Sayers et al. (75)have argued that the SJ is preferred to the use of the CMJ for the following reasons. First, CMJ technique ismore variable than SJ technique, as the extent of the counter-movement is not consistent across subjects.Second, regression equations used to predict peak power based on jump height and body mass are moreaccurate when using SJ data. Regardless of whether arm thrusts are allowed, or whether one uses the SJ or CMJ,the subjects need to be evaluated with the same procedures when tested repeatedly and the techniques usedduring the testing need to be considered when evaluating test data against published data.
When using the SJ, knee angle and foot position have been shown to affect performance. Martin and Stull (59)reported that optimal jump height occurred at knee angles of about 115° (as opposed to 90° and 65°) with thefeet separated by about 5-10 inches laterally and 5 inches in the anterior-posterior direction. However, differentstudies have employed different knee joint angle requirements and some studies have let subjects determinetheir own knee angle starting position. As with arm thrusts, use of different starting positions can affect VJ

Accurate Assessment of Muscular Strength and Power 7
performance and starting position needs to be consistent with repeated testing and should be considered whenevaluating test data against published data.
The reliability of various VJ tests have been reported to be quite high (3,4,11,31,36). For example, Ashley andWeiss (4) found an intraclass correlation coefficient for a modified CMJ (no torso lean or arm swing) of 0.87for repeated testing separated by 48 hours. Further, Arteaga et al., (3) found pooled coefficients of variation of5.4% and 6.3% for SJ and CMJ scores (no arm thrusting was allowed) recorded during six test sessions over a12 week period, suggesting that there is little variability or learning over time in these tests.
A great deal of variability exists in the literature regarding the warm-up and practice procedures employedduring vertical jump testing. In untrained female subjects, Goodwin et al. (31) used three submaximal practicejumps prior to actual testing and found an ICC of 0.96 for repeated vertical jump testing. The change in thebody center of mass was the dependent variable. These results suggest that three practice trials are sufficient togenerate reliable vertical jump scores. In addition, Harman et al. (36) reported that three to five submaximalpractice jumps were sufficient for untrained subjects to achieve peak jumping technique, although no data werepresented to support this statement.
A variety of variables can be derived from the VJ. While direct measurement of power output requires the useof a force plate, estimates of muscular power can be made using prediction equations that incorporate verticaljump height and body mass (75). The Lewis formula has commonly been used to estimate power output duringthe VJ test, however the validity of this formula has been challenged (37). Recently, Sayers et al., (75) reportedthat the following equation, based on the SJ, resulted in an accurate prediction of muscular power:
peak power (watts) = 60.7 ⋅ (jump height [cm]) + 45.3 ⋅ (body mass [kg.]) - 2055;SEE = 355 watts
For field-testing, use of the Sayers equation is straightforward and requires only the ability to record body massand VJ height. To record VJ height, two procedures are primarily used. First, subjects may simply place chalkon their fingers and mark a wall as they reach the top of the jump. The difference between the mark at theheight of the jump and a mark from the fingertips at full extension while standing is recorded as the VJ height(37). Second, commercial devices have been developed that record jump height (4). These devices have avertical pole with a series of horizontally oriented metal rods that are free to rotate about vertical when hit bythe fingers. VJ height is based on the highest pin that is moved at the top of the jump.
With respect to specific testing of the VJ, either the SJ or the CMJ may be employed, however the SJ ispreferred. Use of the equation of Sayers et al. (75) should be used to estimate muscular power from jumpheight. At least three practice trials should be employed prior to recording test performance. Jump height can bedetermined using either chalk marks on a wall or by using a commercial device. With repeated testing, it is vitalthat use or non-use of arm thrusts be held constant and that for the SJ, the knee angle at the start of the motionbe consistent.Bench Press Prediction EquationsThe one-repetition maximum (1-RM) is the standard for determining isotonic strength. However, determining1-RM values for large groups of individuals is very time consuming. For example, Chapman et al. (24) notedthat when testing 98 football players for the 1-RM bench press, three testers were required over six hours oftesting and five testing stations were employed. In addition, it has been suggested that 1-RM testing may exposethose being tested to increased injury risk (24). Therefore, the use of single set tests in which 1-RM values arepredicted based on the number of repetitions performed with a submaximal weight have been used. These typesof tests can markedly decrease the time involved in mass testing (24). In contrast to the six hours and threetesters required for the testing of the 98 football players described above, only one tester and 2.5 hours wererequired to test the same subjects using a test in which the maximal number of repetitions that were capable of

Accurate Assessment of Muscular Strength and Power 8
being performed in a single set was determined. It should be noted however, that there are no data to indicatethat these tests are safer than typical 1-RM testing.
The most common exercise to which submaximal isotonic testing has been applied is the bench press, and willbe the focus of this section. Two types of 1-RM prediction tests have been developed. In the first type, subjectsperform the most repetitions that they can at a load that is some percentage of their estimated 1-RM (relativeload test). Alternatively, all subjects can be tested at the same load (absolute load test). The most commonabsolute load test involves performing the maximum number of repetitions possible at a load of 225 pounds.Because this test is frequently used in the National Football League, it has been called the NFL-225 Test (62),however it is also used with collegiate and high school athletes.
A variety of papers have been published reporting 1-RM bench press prediction equations based on relative loadtests, and many of these have been evaluated by LeSuer et al. (57). In brief, seven prediction equations werecross-validated with a sample of 67 college students (27 females). For the bench press, the equations derivedfrom Mayhew et al., (61) (1-RM = 100 ⋅ rep mass/(52.2 + 41.9 ⋅ exp [-0.055 ⋅ reps]), r2 = 0.98, mean differencebetween predicted and actual 1-RM = 0.5±3.6 kg) and Wathen (83) (1-RM = 100 ⋅ rep mass / (48.8 + 53.8 ⋅exp[-0.075 ⋅ reps]), r2 = 0.98, mean difference between predicted and actual 1-RM = 0.5±3.5 kg) were reported tomost accurately predict the 1-RM bench press. The submaximal load used during the test of the maximalnumber of repetitions was chosen based on subject experience to be a load that would cause fatigue (failure)within 10 or fewer repetitions. Another study (47) also found that the Wathen equation resulted in predicted 1-RM values that were closest to the actual 1-RM in a variety of upper body exercises in elderly subjects. Of noteis that these equations require only the recording of the mass lifted and the number of repetitions performed.Gender appears to have little effect on the accuracy of the prediction equations (61), indicating that a commonregression equation can be used for both males and females. Similarly, adding anthropometric variables toregression equations seems to add little to the predictive ability of the equations (26).
The absolute load NFL-225 Test has also been shown to accurately predict 1-RM bench press strength (24, 62).The work of Mayhew et al. (62) resulted in a cross-validated prediction equation as follows:
1-RM (lbs) = 226.7 + 7.1 (# reps); SEE = 14.1 lbs.
To date, this equation represents the best prediction equation available for predicting 1-RM bench press from anabsolute load test. Two caveats are worth noting however. First, this test is only effective in subjects whose 1-RM bench press is at least 225 pounds, and therefore may have limited utility in testing weaker subjects.Second, the accuracy of the equation decreases as the number of repetitions increase beyond 10 (24,62), whichlimits its effectiveness in very strong subjects.
With respect to specific use of submaximal tests to predict 1-RM bench press performance, both relative loadand absolute tests can be used. If using a relative load test, the equation of Mayhew et al. (61) or Wathen (83)are recommended. If using the NFL-225 test, the equation of Mayhew et al. (62) is recommended. In addition,the NFL-225 test can only be used with subjects whose 1-RM bench press is ≥ 225 pounds.Wingate Anaerobic Cycle Test (WAT)This test is intended to measure anaerobic power of the lower body. It is an exhausting test that should be usedwith a population accustomed to strenuous vigorous exercise. The resulting data is an indirect measure theability of a subject’s lower body to produce high levels of power. Test results are divided into six equal periodsof 5-s where peak power, in Watts, is the highest average power output during any one 5-s period and meanpower is the mean of all six 5-s periods. Fatigue percentage is the difference between peak power and thepower from the lowest 5-s period. Normative values for this test have been published in the literature (41, 60).

Accurate Assessment of Muscular Strength and Power 9
Reliability and ValidityTest re-test reliability of the WAT has generally been reported to be higher than r=0.94 (38, 42). Validity of theWAT is difficult to measure since there is no universally accepted “Gold Standard” of anaerobic measurement.However, laboratory studies have been performed comparing the WAT and field tests of anaerobic power.Moderate correlations with the WAT have been demonstrated between short explosive field measures such asthe vertical jump (mean power r=0.74) (78), 50 yard run time (relative mean power r=0.69) (78), Margaria-step-test (peak power r=0.79) (5) and multiple repetition isokinetic testing (mean power r=0.78) (42). In addition, therelative percentage of fast twitch fiber type of the legs has shown moderate correlations (relative peak powerr=0.60) (9).ResistanceOne of the most difficult questions to answer when administering the WAT is what resistance setting to use.The classic resistance (in kiloponds; kp) is determined by multiplying the subject's body weight in kilograms(kg) by the constant 0.075 (8,60). While 0.075 kp/kg of body weight appears to work well for sedentary adults(5), subsequent research has demonstrated that this may not be the optimal setting for other populations (69,28).In addition, mean power and peak power require different settings for optimization (28) due to theforce/velocity and power/velocity relationships discussed later. The optimal force/velocity relationship whenpedaling has been reported to be approximately 100 rev/min (28). Therefore, it is recommended that non-athletes use a force of 0.090 kp/kg and athletes use a force of 0.100 kp/kg (41).Standardized ProceduresDuring testing, the subject is asked to pedal against a pre-selected opposing resistance at the maximum pedalrate possible for 30 s. A Monark cycle ergometer is most commonly used for testing. The ergometer should becalibrated before each test, using standard calibration weights, throughout the full range of the pendulum. Acomputerized Wingate testing system (Sports Medicine Industries, Inc., St. Cloud, MN) is available that countsergometer flywheel revolutions. Briefly, in consists of an optical sensor, attached to the ergometer frame, whichnotes the passage of reflective markers on the ergometer flywheel at 10 cm intervals. A microprocessor thenconverts these signals to rev/s.
The subject's saddle height is adjusted to produce five to ten degrees of knee flexion when the foot is at thebottom dead center position. Warm-up should include 2-3 minutes of cycling at 1 to 2 kp with several all outbursts interspersed. Resistance is set at the end of the warm-up period by asking the subject to pedal into theincreasing resistance. When the correct resistance is established the subject is instructed to stop pedaling. Thetest procedures are then reviewed with the participant. The test begins with a free wheeling start as theparticipant pedals as fast as possible with no resistance. The resistance is then either dropped instantly orramped up as quickly as possible. If a ramping protocol is used, the first two seconds of the test (when thesubject overcomes the inertia of the initial resistance) should be excluded from data analysis. This actioncoincides with the activation of the microprocessor. Pendular oscillations at the onset of the test, outside thepre-determined opposing resistance, should be minimized through manual restriction. Feedback concerningelapsed time is given at 10, 15, 20, 25 and 30-s, with 30-s followed immediately by the command "STOP".Consistent verbal encouragement is provided during the test but no visual feedback should be used. Followingthe "STOP" command, the resistance is decreased and the subject cools down at a self-paced cadence to reducevenous pooling in the legs.Margaria Stair-Run TestThis is a short-term explosive power test that requires stair climbing. Since this test requires the participant toclimb the stairs two at a time it may not lend itself to use with a young undersized population. Power on theMargaria test has displayed a moderate correlation (r=0.74) with mean power of the Wingate cycle testrepresenting adequate validity of anaerobic power (69).Standardized ProceduresThe test requires a staircase and two electronic switch mats interfaced with a digital time clock capable ofrecording to one 100th of a second. The mats are placed on the 8th and 12th steps and step height should beapproximately 6.9 inches.

Accurate Assessment of Muscular Strength and Power 10
The subject begins approximately six feet (two meters) from the first step and is instructed to run at top speedtowards the stairs. Upon reaching the staircase, the subject should negotiate the steps two at a time until passingthe second switch mat. The mats will correspond to the fourth and sixth steps taken. Power (P expressed inWatts) is then derived from the following formula:
P = (W x 9.8 x D)/Twhere W = bodyweight of the subject in kg, 9.8 = acceleration of gravity in meters per second2, D = verticalheight (in meters) traveled between switch mats one and two, and T = elapsed time (in seconds) between switchmats one and two. Increasing the approach distance (six and ten meters) has been shown to increase powersignificantly (40).
ISOKINETIC TESTING
Isokinetic exercise is by definition constant velocity and represents a match between mechanically imposedvelocity and the subject’s movement (e.g., knee extension). The reliability of isokinetic testing has beenmeasured repeatedly (13,77,80) and found to be high. However, a variety of factors need to be controlled oraccounted for in order to generate reliable and valid data. These include factors such as choice of variablemeasured (e.g., peak torque, work, or power), proper positioning and stabilization, and data reductionprocedures (e.g., windowing). The following will delineate confounding elements that may impact velocityspecific tests and focus on standardized testing procedures that should be considered when utilizing anisokinetic device.Peak Torque, Work, and PowerA wide range of performance variables are available for isokinetic data analysis. Of these, three are particularlyimportant for strength and power testing. Peak torque is defined as the product of mass, acceleration and leverarm length. It is the maximum torque produced anywhere in the ROM and is easily identified as the top of thetorque curve (i.e. graphic display of dynamic torque vs. position). As such, peak torque is analogous to theisotonic 1RM discussed earlier and exhibits an inverse relationship with velocity. While peak torque providesthe exercise professional with information regarding the greatest torque output of the limb tested, and is anexcellent indicator of the subject's maximum strength level, it does not take into account ROM.
Rotational work is defined as the product of torque and distance traveled and is most easily computed as thearea under the torque curve. Since work accounts for distance traveled it reveals a subject's ability to producetorque throughout the ROM. Like torque, work is inversely related to velocity. Power may be the mostencompassing variable as it accounts for torque, distance and time. Power is defined as the work/time quotientand demonstrates a parabolic relationship with velocity.
Strictly speaking, peak torque is a measure of an individual's maximum strength while work assesses theirability to sustain torque output across a limb’s ROM. Power, since it utilizes time in the equation, may be bestdescribed as one's ability to express explosive strength. Each variable communicates strength in a slightlydifferent manner and should be used judiciously regarding intended outcomes.Isolation and StabilizationIsolation in its simplest form is merely testing one muscle group alone with the exclusion of any other groupadding to the test outcome. This is best achieved through proper positioning and strapping (i.e. stabilization) ofthe subject in the dynamometer. Using knee extension as an example, isolation occurs through the utilization ofwaist and thigh stabilization. The purpose is to restrict motion to knee extension and flexion without extraneousjoint movement about the hip. This will insure that only the quadriceps and hamstring muscle groups areproducing torque through the dynamometer. For example, Weir and colleagues (84), measuring knee extensiontorque at 60, 180 and 300 °/s with stabilized and non-stabilized conditions, have shown that extraneousmovements may reduce torque output and change the angle of peak torque production secondary to changes inmuscle length. This same potential error is present at all joints if care is not taken to control for extraneous

Accurate Assessment of Muscular Strength and Power 11
movement. For example, shoulder internal/external rotation torque may be inflated through the addition of trunkrotation torque if proper stabilization of the torso is not achieved.Axis of motionEach dynamometer on the market consists of a lever arm attached to a dynamometer head. Resultant muscletorque is recorded at this juncture through rotation of the lever. It is critical that the axis of rotation of themachine and the joint being tested are aligned. If the lever axis and the joint axis are not in alignment, torquemeasurements will be invalid. Rothstein (72) and colleagues make a cogent argument for the use of aligned axisof rotation by stating that errors associated with misalignment may be amplified in joints where the axischanges with movement. The knee and shoulder are such joints. They further state that since the axis of themachine is stable any joint with uncontrolled movement will result in measurement error.Gravity compensationSince exercise on an isokinetic device is most often performed in a gravity environment, special considerationmust be taken to account for its effects. Using seated knee extension/flexion as an example, one can see thatperforming a knee extension movement requires an individual to lift the weight of their limb and thedynamometers lever arm against gravity. However, during seated knee flexion, gravity assists the motion bypulling down on the limb and lever. In this scenario, flexion torque may be artificially inflated due to gravitywhile the opposite is true for extension.
Without compensating for the effects of gravity the test results are subject to large errors. Winter (89) andcolleagues documented mechanical work errors ranging from 26% to over 500% during knee extension andflexion exercise at 60 and 150 d/s.Range of motionBoth physiologic and total range of motion (ROM) need to be considered when performing exercise on adynamometer. These are operationally defined as follows: physiologic ROM is the anatomical beginning andend of the movement while the total ROM is the arc traveled through the physiologic ROM. For example,shoulder motion from zero to 90 degrees and from 90 to 180 degrees of flexion both have the same total ROM(90 degrees) but very different physiologic ROM. Since the physiologic ROM affects muscle length and jointmoment arms, it follows that valid comparisons of torque production must be consistent with respect tophysiologic ROM. Similarly, errors associated with ROM measurements may be magnified when interpretingwork and power variables. Since work is the product of torque and distance (W=TxD) and power is a functionof work and time (P=W/T), distance traveled must be precise for comparative purposes. By setting hard stops ateach end of the ROM, the practitioner can insure that all between and within subject comparisons involve thesame physiologic and total ROM.Standardization of InstructionsAny instructions given to the subject should be consistent from one test to the next and from one subject toanother. Not all individuals respond to the same form of verbal encouragement. Therefore, instructions shouldbe concise and parsimonious. Furthermore, since the dynamometer is a unique piece of equipment it may not befamiliar to most subjects. This unfamiliarity may cause anxiety in some subjects and lead to misunderstandingsregarding test procedures. Therefore, verbal commands should be explicit as to every facet of the procedure.This includes, but is not limited to, where to grasp the attachment, how to breath, what to do with thecontralateral limb, how to push in both directions, how to give a maximal effort, what constitutes one fullrepetition (e.g. extension and flexion) and how many repetitions to perform.PracticeAnalogous to verbal commands for proper instruction is sufficient practice repetitions. Since the dynamometeris novel to most subjects, they may require several practice trials in order to achieve reliable torque tracings. Itis recommended that one perform as many repetitions as needed to completely understand what is requiredduring the testing or training process. This may be as few as three for experienced resistance trained individualsor as many as 15 for naive subjects.

Accurate Assessment of Muscular Strength and Power 12
RepetitionsChoosing the number of repetitions to include in a test is determined by what information is desired from thetest or what outcome from the exercise session. For strength testing there is no need to perform greater than fiverepetitions but one may choose to perform as many as 50 repetitions when endurance is of interest.
Placing a limb in a pre-activated state (i.e. neural activation prior to movement) has been shown to significantlyaffect strength variables. Neural pre-activation of muscle units in the exercising limb place that limb in a readystate which in turn leads to greater torque production. Kovaleski and colleagues (49), using knee extension at120 through 210 °/s, have documented the use of pre-load (prior neural activation) as superior to isokinetictraining and may afford individuals full ROM strength development based on a reduced acceleration range.Additionally, the first repetition (beginning from a dead stop without a prior antagonistic muscle action) hasbeen shown to result in larger areas of acceleration prior to the constant velocity phase (18). Therefore, the firstrepetition (of five) during strength testing may be discarded from data analysis as all subsequent repetitions areimmediately preceded by a pre-activation state.Velocity orderMany dynamometers on the market today have a velocity range between 0 and 500 degrees per second (°/s).The practitioner must decide which speed to use for testing or training depending on the desired result. Whentesting at multiple speeds it may be beneficial to randomize the sequence in order to control for order effects.However, there is conflicting evidence regarding whether velocity order significantly affects strength variablessuch as peak torque, work and power. Timm and Fyke (80) have shown no significant difference in torquemeasurements of knee extension at 60, 180 and 300 °/s when varying test speed sequence. However, Kovaleskiand Heitman (48,50,51) have shown velocity progression order to play a role in torque, work and powerproduction during knee extension at 30 through 210 °/s. The major difference between these seeminglyopposing views appears to be number of repetitions performed. While Timm (80) performed only fiverepetitions, Kovaleski and Heitman (48,50,51) performed 10. Therefore, fatigue may have been a factor in thelatter studies and rest intervals may need to be adjusted accordingly.Bilateral DeficitDynamometers can be modified to test both limbs simultaneously (14,15,16). When testing or training isperformed in this manner, the practitioner should be aware of the bilateral deficit phenomenon. That is, whentwo limbs are performing maximal muscle actions simultaneously the resultant torque will be less than the sumof the individual limbs tested in isolation. Brown and colleagues (14,16) have reported that females may show adecrease in the bilateral deficit with increasing velocity from 60 through 360 °/s, which may be explainedthrough decreased activation of primarily slow-twitch muscle fibers (14,16). They have also shown significanttorque improvements unilaterally following bilateral training of the knee extensors and flexors at 60 and 180 °/s(14) along with a decrease in the bilateral deficit with increasing velocity.Load RangeIt has been demonstrated many times (17,18,19,32,33,56,66,67,68) that isokinetic devices, despite their claimsof isokinetic movement, are not truly isokinetic. Exercise on an isokinetic device involves three main phases ofmovement: acceleration, constant velocity and deceleration. Inherent in these phases are unique occurrencesthat may confound test data and thereby test interpretation (1,6,12). However, the acceleration phase, which isspent "catching" or matching the isokinetic velocity, is done without resistance from the dynamometer. In otherwords, there is a portion of the available ROM during which there is no quantifiable external load. The ROMwith external load or that ROM when there is a match between isokinetic velocity and limb movement isreferred to as load range. Load range becomes increasingly smaller as velocity is increased(17,18,19,56,66,67,68). The work of Osternig and colleagues (66,67,68) first showed this inverse relationship.They detailed load range decreases from 92% to 16% at isokinetic speeds from 50 to 400 °/s.
Practically, this means that as the pre-selected velocity of an isokinetic device is increased an exercisingindividual receives external overload through an ever-decreasing portion of the full ROM. Couple this effectwith the fact that torque is inversely related to velocity and the result is short-arc low-resistance exercise at high

Accurate Assessment of Muscular Strength and Power 13
speeds with the remaining ROM as acceleration or deceleration. In other words, exercise on an isokinetic deviceat high velocities is primarily attempting to reach the pre-determined speed (accelerate and catch the lever arm)or slow down prior to contacting the end stop (decelerate). Thus, acceleration and deceleration should not beconsidered during test interpretation. However, data from these phases are often included in analysis and mayresult in erroneous conclusions.
Specific errors associated with artifacts in the non-load range portions of the repetition have been identified andwill be examined in the sections below. Taylor et al. (77) documented increased errors with increased velocityfrom 60 to 450 °/s and cautions against ascribing artifact torque to the exercising limb. Tis and Perrin (81)caution that using a data reduction technique that eliminates the first and last 10 degrees of ROM may eliminateacceleration and deceleration areas but may also eliminate the peak torque range.
Velocity Overshoot and Torque OvershootPrior to the limb receiving machine resistance it must pass through a free acceleration phase (74). Uponengagement of the resistance portion (load range) there are artifacts manifested in the torque tracings.Immediately following the acceleration phase of motion the lever arm and attached limb exhibit speed that isgreater than the pre-selected velocity by as much as 200% (70,74,81). This is followed by the dynamometer'sattempt at slowing the limb via a braking mechanism inside the power-head. Velocity overshoot occurs as afunction of the limb accelerating past the desired speed. The subsequent braking results in an obvious torquespike as it slows the limb to the pre-selected velocity. The effect of this braking is mild at slow speeds such as60 °/s but increases in magnitude with increased velocity. Velocity and torque overshoot are coincident at thebeginning of the flat load range.
This resultant torque overshoot is caused by the preceding velocity overshoot. As mentioned earlier this spikewill grow with increasing velocity as the braking mechanism of the dynamometer must account for everincreasing amounts of velocity overshoot. The torque spike may dwarf actual peak torque produced by thehuman muscle. Obviously, it is important to remove this artifact prior to test interpretation. At present nodynamometer on the market will automatically remove torque overshoot so the practitioner must recognize theartifact and not consider it during analysis. However, some dynamometer systems (e.g., Biodex) attempt tocontrol these effects by using a data reduction technique called windowing (87). During windowed analysis theacceleration and deceleration phases of the repetition are eliminated and only the load range data is preserved.This technique has been shown to increase the reliability of testing via the control of aberrant torque production(87).Lever arm oscillationAnother artifact inherent in the torque tracing is oscillation. This occurs immediately following torqueovershoot (25,74). Just after the acceleration phase there is a period of lever arm oscillation that is a function ofthe length of the lever and the braking procedure to counteract velocity overshoot. The exercising limb isattached to the dynamometer lever arm shaft distally but produces torque proximally and may therefore bethought of as analogous to a long fishing pole. If one grasps a fishing pole at one end and applies a quickwhipping motion the distal end will oscillate back and forth for a short period of time until stabilized. Greateroscillation occurs with greater lever arm length and greater velocities as the distal end attempts to "catch up"and then decelerate to the speed of the proximal end (25,74). The probability of error is increased with theinclusion of lever arm artifacts such as these as it may be impossible to determine actual torque measurementsapart from extraneous data. As with torque overshoot, windowing the data may remove some of the erroneousdata.Impact Artifact and Isometric SpikesAt the other end of the repetition from acceleration is deceleration that culminates in the stopping of the leverarm. Many of the confounding elements already mentioned during the acceleration phase occur in reverse orderduring deceleration. The dynamometer begins to slow the lever arm in anticipation of stopping at the turnaround point. This causes the lever arm to oscillate somewhat and ultimately results in a large isometric spike at

Accurate Assessment of Muscular Strength and Power 14
the end of the repetition due to the lever arm impacting the mechanical end stop (89). The spike is greater withincreasing velocity, since the limb and lever are moving much faster upon impact. These spikes can be as muchas twice as great as the torque seen during load range and should not be confused with actual muscle torqueproduction (12,72,77,87).Isokinetic Standardized ProceduresFirst position the dynamometer shaft so that it is aligned with the assumed axis of rotation of the joint beingtested. The subject is in either a seated or lying position with the back incline noted on a permanentmeasurement scale. The contralateral limb is secured with straps as is the waist and torso. Arms and legs not inuse are either secured with or grasping the straps. Range of motion mechanical stops are set at the beginningand end of the desired test ROM. The lever arm pad is positioned to place the inferior aspect immediatelysuperior to the most distal point on the limb. Warm-up on the isokinetic device consists of three submaximalreciprocal concentric extension and flexion repetitions with increasing intensity (i.e. first repetition at 25%perceived effort, second repetition at 50% perceived effort, etc.) at the slowest through the fastest speed (13,80).In addition each subject completes two maximal intensity repetitions at each speed, then rests for one minuteprior to testing. More practice repetitions may be performed if the subject is not comfortable with the test.
Strength and power testing begin from a dead stop with the subjects' limb at one end of the ROM and consist offive maximal concentric reciprocal extension and flexion gravity corrected repetitions with 30-s rest betweenvelocities (80). Each subject is encouraged to contact the mechanical end stops during both extension andflexion motions. Consistent and identical verbal encouragement is provided during the test but no visualfeedback of torque generation is provided. The first and last repetitions are discarded, using only the threemiddle reps for analysis, and all data are windowed to eliminate extraneous information as already discussed.
Repetition data is then reduced to strength variables such as peak torque (maximum value), mean torque(average across all repetitions), total work (max product of torque and distance) or average work (averageproduct of torque and distance) and expressed in foot-pounds (ft/lbs) or Newton-meters (Nm). Average power(torque/time quotient) and instantaneous power (product of torque and velocity) are expressed in Watts.Force and Power/Velocity CurvesThe interaction of velocity and human force production has been known for some time. Ever since Hill (34)established the inverse relationship between force and velocity for concentric muscle actions, human beingshave tried to alter the curve through training and muscular adaptation. Likewise, the parabolic relationshipbetween power and velocity (44) has sport specific diagnostic and predictive value. In the case of isokineticdynamometry the force is rotational and therefore properly referred to as torque.
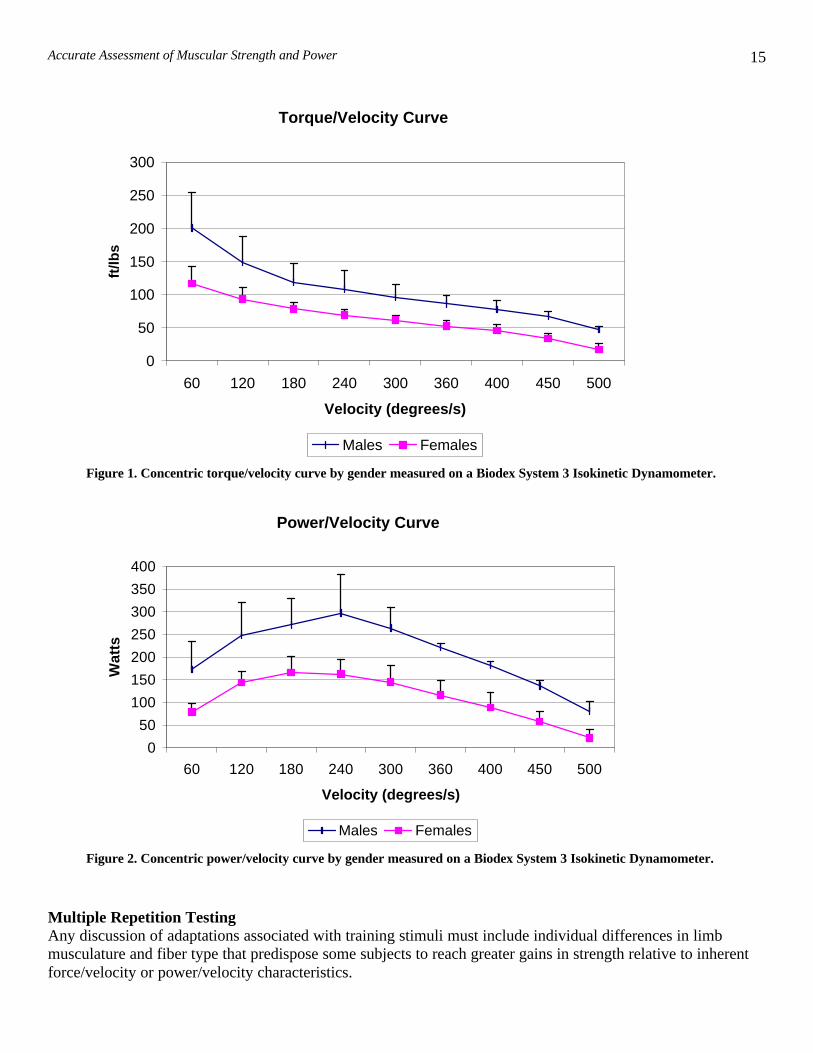
Since the overall shape of both the torque/velocity and power/velocity curves are well established, it is a simpletask to gather this information from individual subjects utilizing an isokinetic dynamometer capable ofmeasuring velocity specific torque and power. The data can then be used for comparison purposes betweenathletes or as a baseline for future testing. The procedure is to perform a maximum torque test across a velocityspectrum beginning at 60 °/s, and increasing the velocity by 60 °/s until the maximum velocity of the machine(e.g.,400-500 °/s) or the individual has been met. As previously explained, it is very important to ensure thatdata are evaluated only during the load range portion, as this will prevent the inclusion of extraneous artifacts.
Previous work (19) has shown that males and females display disparate levels of maximum attainable velocityon this apparatus. Therefore the curves should be evaluated by gender. Figures 1 and 2 represent gender specificdata from our laboratory that are representative of strength/velocity relationships in college age subjects. Notethat not only do the absolute values of males exceed females but also the shapes of the curves are different. Thetorque/velocity curve (Figure 1) of males is steeper than females and peak power (Figure 2) occurs later in thevelocity spectrum for males (240 °/s) when compared to females (180 °/s). While this may be partiallyexplained as a function of muscle mass there is evidence of underlying neural differences between genders (46)that may further explain the disparity.
Accurate Assessment of Muscular Strength and Power 15
Multiple Repetition TestingAny discussion of adaptations associated with training stimuli must include individual differences in limbmusculature and fiber type that predispose some subjects to reach greater gains in strength relative to inherentforce/velocity or power/velocity characteristics.
Torque/Velocity Curve
0
50
100
150
200
250
300
60 120 180 240 300 360 400 450 500
Velocity (degrees/s)
ft/lb
s
Males Females
Figure 1. Concentric torque/velocity curve by gender measured on a Biodex System 3 Isokinetic Dynamometer.
Power/Velocity Curve
0
50
100
150
200
250
300
350
400
60 120 180 240 300 360 400 450 500
Velocity (degrees/s)
Wat
ts
Males Females
Figure 2. Concentric power/velocity curve by gender measured on a Biodex System 3 Isokinetic Dynamometer.

Accurate Assessment of Muscular Strength and Power 16
Thorstensson (79) hypothesized that muscle quality plays a major role in strength expression. To test hishypothesis Thorstensson took muscle biopsy samples from the vastus lateralis of 25 trained male subjectsbetween the ages of 20 and 30 years and stained them for slow twitch (ST) and fast twitch (FT) fiber type. Hethen recorded maximal velocity of knee extension motions in an unloaded state and tested for peak torqueisometrically and isokinetically at 180 °/s. Strength test results were not different between individuals with lowand high percentages of FT muscle fibers when compared isometrically. However, when maximal velocity wasmeasured, significant differences became apparent. That is, subjects with a higher percentage of FT fibersexhibited greater maximum velocity and strength with a positive correlation of r=0.75 between peak torque at180 °/s and percentage FT fibers. It was concluded that a high proportion of FT muscle fibers would beadvantageous for high force output at fast motion velocities requisite for success in sport specific activities.Wickiewicz and colleagues (86) studied the relationship between muscle architecture and the force-velocitycurve in 12 subjects who performed isokinetic knee extension strength at velocities ranging from 0 to 300 °/s.Comparisons were then made with muscle samples of cadavers for linear displacement of muscle fibers andarchitectural data. The results showed that greatest torque at high velocities was related to fast twitch fibers andthe number of fibers in series. Specifically, individuals with longer sarcomeres displayed less torque reductionat fast velocities while subjects with a larger muscle cross sectional area exhibited the greatest torque outputs atslow velocities.
Houston (39) examined the relationship between muscle fiber composition and maximal acceleration and torquecapabilities of the knee extensors in 27 subjects using an unloaded apparatus that did not restrict limb motion.Muscle fiber composition was attained from the vastus lateralis of each subject using needle biopsy techniquesand compared to electromyographic and performance measures during knee extension movements. Positivecorrelations between peak velocity and acceleration (r=0.69) were found, as well as acceleration and fast twitchfiber percentage (r=0.4) with a trend toward a positive correlation between acceleration and fast twitch area.Gender comparisons demonstrated that the electromechanical delay (time lag between the onset of electricalneural activity and the beginning of acceleration) was similar for males and females. However, males producedsignificantly greater force output than females evidencing a neural bias towards males.
In an experiment in our laboratory (15), following the protocol of Thorstensson, we compared the Wingatecycle ergometry test with an bilateral isokinetic test of power and found significant correlations between the twotests for peak power (r=0.84) and mean power (r=0.54) but not fatigue percentage (r=0.37). Wingate peakpower and mean power were significantly greater (p<0.05) than isokinetic values while fatigue percentage wasnot statistically different between tests. Males exhibited significantly greater values across all variables whencompared to females with the exception of Wingate fatigue percentage. It was concluded that the bilateralisokinetic test of power revealed a significant power profile with the cycle ergometry power test.Multiple Repetition ProceduresThe above information points to the ability to estimate an individual’s fiber type from isokinetic strength andpower tests. Specifically, the procedures for the Thorstensson multiple repetition assessment will yield fatiguepercentage of the quadriceps. This can be used to estimate the relative percentage of fast twitch fibers (%FT) ofthe vastus lateralis. Subject physical set-up on the isokinetic dynamometer is identical to that discussed earlier.The velocity should be pre-set to 180 °/s and the ROM limited from 90 degrees of knee flexion to 0 degrees ofextension (horizontal). The test consists of 50 maximal knee extension repetitions with a passive return to 90degrees (no hamstring activity).
Determine the average peak torque of repetitions 1-3 and repetitions 48-50. Subtract the average of repetitions48-50 from repetitions 1-3 then divide by the average of repetitions 1-3 then multiply by 100. The answer(fatigue percentage, FP) should then be inserted into Thorstensson’s formula which will yield percent fasttwitch.
0.9 x (FP) + 5.2 = %FT (r=0.86, p<0.01)

Accurate Assessment of Muscular Strength and Power 17
SUMMARYCare must be taken to insure proper use of any strength testing equipment and interpretation of data. Thepractitioner should be aware of standardized testing procedures such as proper warm-up, safety (includingemergencies) and rest periods, isolation and stabilization of subjects and muscle groups as well as proper axialalignment of the individual and the apparatus. Instructions should be clear and identical across subjects andeach participant should be afforded the opportunity to become completely familiarized with the procedure andthe apparatus prior to data collection.
A suitable plan should be in place detailing what information is desired from the test combined with theknowledge of the specificity of strength and power results secondary to mode, procedure and apparatus. Tablesone and two identify possible choices of tests that are specific to a desired outcome.
Table 1. Recommendations for Specific Strength Tests and OutcomesDesired Outcome Specific Test
1. Lower body strength 1RM Squat2. Upper body strength 1RM bench press3. Angle specific torque Isometric4. Individual muscle torque Isokinetic five reps5. Muscle Group torque Isotonic 1RM
Table 2. Recommendations for Specific Power Tests and OutcomesDesired Outcome Specific Test
1. Lower body Vertical jump/Margaria2. Upper body endurance Bench press for reps3. Anaerobic endurance Wingate cycle4. Muscle fiber type Isokinetic multiple repetition
Address for correspondence: Lee E. Brown, EdD, EPC, CSCS,*D, FACSM, Assistant Professor and Directorof the Human Performance Laboratory, Arkansas State University, State University, ArkansasorJoseph P. Weir, PhD, FACSM, Associate Professor, Program in Physical Therapy, Des Moines University-Osteopathic Medical Center, Des Moines, Iowa
REFERENCES
1. Abernathy PJ, Jurimae J. Cross-sectional and longitudinal uses of isoinertial, isometric, and isokineticdynamometry. Med Sci Sports and Exerc 1996;28(9):1180-87.
2. Abernethy P, Wilson G, Logan P. Strength and power assessment. Issues, controversies and challenges.Sports Med 1995;19:401-17.
3. Arteaga R, Dorado C, Chavarren J, Calbet JAL. Reliability of jumping performance in active men andwomen under different stretch loading conditions. J Sports Med and Phys Fit 2000;40:26-34.
4. Ashley CD, Weiss LW. Vertical jump performance and selected physiological characteristics of women. JStrength and Cond Res 1994;8:5-11.
5. Ayalon A, Inbar O, Bar-Or O. Relationships among measurements of explosive strength and anaerobicpower. In: Nelson RC, Morehouse CA, editors. International series on sports sciences. Biomechanics IV.Baltimore: University Press, 1974:527-32.

Accurate Assessment of Muscular Strength and Power 18
6. Baltzopoulos V, Eston RG, Maclaren D. A comparison of power outputs on the Wingate test and on a testusing an isokinetic device. Ergonomics 1988;31:1693-99.
7. Baltzopoulos V, Williams JG Brodie DA. Isokinetic dynamometry: applications and limitations. Sports Med1989;8:101-16.
8. Bar-Or O. The Wingate test: An update on methodology, reliability and validity. Sports Med 1987;4:381-94.
9. Bar-Or O, Dotan, R, Inbar O, Rotstein A, Karlsson J, Tesch P. Anaerobic capacity and muscle fiber typedistribution in man. Int J Sports Med 1980;1:89-92.
10. Bobbert MF, Gerritsen KGM, Litjens MCA, Van Soest AJ. Why is countermovement jump height greaterthan squat jump height? Med Sci Sports and Exerc 1996;28:1402-12.
11. Bosco C, Viitasalo JT. Potentiation of myoelectrical activity of human muscles in vertical jumps. Electroand Clin Neurophys 1982;22:549-62.
12. Brown LE. (Editor). Isokinetics In Human Performance. Champaign, IL: Human Kinetics, 2000.13. Brown LE, Whitehurst M, Bryant JR, Buchalter DN. Reliability of the Biodex system 2 isokinetic
dynamometer concentric mode. Isok Exer Sci 1993;3(3):160-63.14. Brown LE, Whitehurst M, Buchalter DN. Bilateral isokinetic knee rehabilitation following bilateral total
knee replacement surgery. J Sport Rehab 1993;2:274-80.15. Brown LE, Whitehurst M, Buchalter DN. Comparison of bilateral isokinetic knee extension/flexion and
cycle ergometry tests of power. J Strength and Cond Res 1994;8(3):139-43.16. Brown LE, Whitehurst M, Gilbert R, Findley BW, Buchalter DN. Effect of velocity on the bilateral deficit
during dynamic knee extension and flexion exercise in females. Isok Exer Sci 1994;4(4):153–56.17. Brown LE, Whitehurst M, Findley BW, Gilbert R, Buchalter DN. Isokinetic load range during shoulder
rotation exercise in elite male junior tennis players. J Strength and Cond Res 1995;9(3):160-64.18. Brown LE, Whitehurst M, Findley BW, Gilbert PR, Groo DR, Jimenez J. The effect of repetitions and
gender on acceleration range of motion during knee extension on an isokinetic device. J Strength and CondRes 1998;12(4):222-25.
19. Brown LE, Whitehurst M, Gilbert PR, Buchalter DN. The effect of velocity and gender on load rangeduring knee extension and flexion exercise on an isokinetic device. J Ortho Sports Phys Ther1995;21(2):107-12.
20. Caldwell LS, Chaffin DB, Dukes-Dobos FN, Kroemer KHE, Laubach LL, Snook SH, Wasserman DE. Aproposed standard procedure for static muscle strength testing. Amer Industrial Hygiene Assoc J1974;35:201-06.
21. Chaffin, DB. Ergonomics guide for the assessment of human static strength. Amer Industrial HygieneAssoc J 1975;36:505-11.
22. Chaffin, DB, Herrin GD, Keyserling WM. Preemployment strength testing. An updated position. J OccupMed 1978;20:403-08.
23. Chandler J, Duncan R, Studenski S. Choosing the best strength measure in frail older persons: importance oftask specificity. Muscle and Nerve 1997;Suppl 5:S47-S51.
24. Chapman, PP, Whitehead JR, Binkert RH. The 225-lb reps-to-fatigue test as a submaximal estimate of 1-RM bench press performance in college football players. J Strength Cond Res, 1998;12:258-61.
25. Chen WL, Su FC, Chou YL. Significance of acceleration period in a dynamic strength testing study. JOrthop Sports Phys Ther 1994;19(6):324-30.
26. Cummings B, Finn KJ. Estimation of a one repetition maximum bench press for untrained women. JStrength Cond Res, 1998;12:262-65.
27. DeVries, HA, Housh TJ. Physiology of Exercise for Physical Education, Athletics, and Exercise Science(5th Ed). Dubuque, IA: Brown and Benchmark, 1994.
28. Dotan R, Bar-Or O. Load optimization for the Wingate anaerobic test. Eur J Appl Physiol 1983;51:409-1729. Edwards RHT, Young A, Hosking GP, Jones DA. Human skeletal muscle function: description of tests and
normal values. Clin Sci Molecular Med 1977;52:283-90.

Accurate Assessment of Muscular Strength and Power 19
30. Gehri DJ, Ricard MD, Kleiner DM, Kirkendall DT. A comparison of plyometric training techniques forimproving vertical jump ability and energy production. J Strength Cond Res 1998;12:85-89.
31. Goodwin PC, Koorts K, Mack R, Mai S, Morrissey MC, Hooper DM. Reliability of leg muscleelectromyography in vertical jumping. Euro J Appl Physiol 1999;79:374-78.
32. Gransberg L, Knutsson E. Determination of dynamic muscle strength in man with acceleration controlledisokinetic movements. Acta Physiol Scand 1983;119:317-20.
33. Greenblatt D, Diesel W, Noakes TD. Clinical assessment of the low-cost VariCom isokinetic knee exerciser.Med Eng Phys 1997;19(3):273-78.
34. Hill AV. The heat of shortening and the dynamic constants of muscle. Proceedings of the Royal Society1938;B128:263-74
35. Haff GG, Stone M, O’Bryant HS, Harman E, Dinan C, Johnson R, Han KH. Force-time dependentcharacteristics of dynamic and isometric muscle actions. J Strength Cond Res 1997;11:269-72.
36. Harman EA, Rosenstein MT, Frykman PN, Rosenstein RM. The effect of arms and countermovement onvertical jumping. Med Sci Sports and Exerc 1990;22:825-33.
37. Harman EA, Rosenstein MT, Frykman PN, Rosenstein RM, Kraemer WJ. Estimates of human power outputfrom vertical jump. J Appl Sport Sci Res 1991;5:116-120.
38. Hebestreit H, Mimura K, Bar-Or O. Recovery of anaerobic muscle power following 30-s supramaximalexercise: Comparing boys and men. J Appl Physiol 1993;74:2875-80.
39. Houston ME, Norman RW, Froese EA. Mechanical measures during maximal velocity knee extensionexercise and their relation to fibre composition of the human vastus lateralis muscle. Eur J Appl Physiol1988;58:1-7.
40. Husky T, Mayhew JL, Ball TE, Arnold MD. Factors affecting anaerobic power output in the Margaria-Kalamen test. Ergonomics 1989;32:959-65.
41. Inbar O, Bar-Or O, Skinner JS. The Wingate Anaerobic Test. Champaign, IL: Human Kinetics, 1996.42. Inbar O, Kaiser P, Tesch P. Relationships between leg muscle fiber type distribution and leg exercise
performance. Int J Sports Med 1981;2:154-59.43. Ives JC, Kroll WP, Bultman LL. Rapid movement kinematic and electromyographic control characteristics
in males and females. Res Quart for Ex and Sport 1993;64(3):274-83.44. Kaneko M. The relation between force, velocity and mechanical power in human muscle. Res J Phys Educ
(Japan) 1970;14:141-45.45. Keyserling WM, Herrin GD, Chaffin DB. Isometric strength testing as a means of controlling medical
incidents on strenuous jobs. J Occup Med 1980;22:332-36.46. Komi PV, Karlsson J. Skeletal muscle fiber types, enzyme activities and physical performance in young
males and females. Acta Physiol Scand 1978;103(2):210-18.47. Knutzen KM, Brilla LR, Caine D. Validity of 1-RM prediction equations for older adults. J Strength Cond
Res 1999;13:242-46.48. Kovaleski JE, Heitman RJ, Scaffidi FM, Fondren FB. Effects of isokinetic velocity spectrum exercise on
average power and total work. J Athl Train 1992;27:54-56.49. Kovaleski JE, Heitman RH, Trundle TL, Gilley WF. Isotonic preload versus isokinetic knee extension
resistance training. Med Sci Sports and Exerc 1995;27(6):895-99.50. Kovaleski JE, Heitman RJ. Interaction of velocity and progression order during isokinetic velocity spectrum
exercise. Isok Exerc Sci 1993;3:118-22.51. Kovaleski JE, Heitman RJ. Effects of isokinetic velocity spectrum exercise on torque production. Sports
Med Train Rehabil 1993;4:67-71.52. Kraemer WJ, Fry AC. Strength testing: development and evaluation of methodology. In: Maud PJ and
Foster C, editors. Physiological Testing of Human Fitness, Champaign IL: Human Kinetics, 1991.53. Kroemer KHE. Assessment of human muscle strength for engineering purposes: a review of the basics.
Ergonomics 1999;42(1):74-93.54. Kroll W. Reliability of a selected measure of human strength. Res Quart for Ex and Sport 1962;33:410-17.55. Kulig K, Andrews JG, Hay JG. Human strength curves. Exerc Sport Sci Rev 1984;12: 417-66.

Accurate Assessment of Muscular Strength and Power 20
56. Lander JE, Bates BT, Sawhill JA, Hamill JA. Comparison between free-weight and isokinetic benchpressing. Med Sci Sports Exerc 1985;17(3):344-53.
57. LeSuer DA, McCormick JH, Mayhew JL, Wasserstein RL, Arnold MD. The accuracy of predictionequations for estimating 1-RM performance in the bench press, squat, and deadlift. J Strength Cond Res1997;11:211-13.
58. Margaria R, Aghemo P, Rovelli E. Measurement of muscular power (anaerobic) in man. J Appl Physiol1966;21:1661-64.
59. Martin TP, Stull GA. Effect of various knee angle and foot spacing combinations on performance in thevertical jump. Res Quart for Ex and Sport 1969;40:324-31.
60. Maud PJ, Shultz BB. Norms for the Wingate anaerobic test with comparison to another similar test. ResQuart for Ex and Sport 1989;60:144-51.
61. Mayhew JL, Ball TE, Arnold MD, Bowen JC. Relative muscular endurance performance as a predictor ofbench press strength in college men and women. J Appl Sport Sci Res 1992;6:200-06.
62. Mayhew JL, Ware JS, Bemben MG, Wilt B, Ward TE, Farris B, Juraszek J, Slovak JP. The NFL-225 test asa measure of bench press strength in college football players. J Strength Cond Res 1999;13:130-34.
63. McArdle WD, Katch FI, Katch VL. Exercise physiology. Energy, nutrition, and human performance (4th
Ed.). Baltimore MD: Williams and Wilkins, 1996.64. Murphy AJ, Wilson GJ. The assessment of human dynamic muscular function: A comparison of isoinertial
and isokinetic tests. J Sports Med Phys Fit 1996;36:169-77.65. Murphy AJ, Wilson GJ, Pryor JF, Newton RU. Isometric assessment of muscular function: the effect of
joint angle. J Appl Biomech 1995;11:205-15.66. Osternig LR. Isokinetic dynamometry: Implications for muscle testing and rehabilitation. In: Pandolf KB,
editor. Exerc Sport Sci Rev V14,. New York: Macmillan, 1986:45-80.67. Osternig LR. Optimal isokinetic loads and velocities producing muscular power in human subjects. Arch
Phys Med Rehabil 1975;56:152-55.68. Osternig LR, Sawhill JA, Bates BT, Hamill J. Function of limb speed on torque patterns of antagonist
muscles. In: Matsui H, Kobayashi K, editors. Biomechanics VIII-A V4A, Champaign, IL: HumanKinetics, 1983:251-57.
69. Patton JF, Duggan A. An evaluation of tests of anaerobic power. Aviation Space Environ Med1987;58:237-42.
70. Perrine JJ, Edgerton VR. Muscle force-velocity and power-velocity relationships under isokinetic loading.Med Sci Sports Exerc 1978;10(3):159-66.
71. Reinking MF, Bockrath-Pugliese K, Worrell T, Kegerreis RL, Miller-Sayers K, Farr J. Assessment ofquadriceps muscle performance by hand-held, isometric, and isokinetic dynamometry in patients with kneedysfunction. J Orthop Sports Phys Ther 1996;24:154-59.
72. Rothstein JM, Lamb RL, Mayhew TP. Clinical uses of isokinetic measurements. Phys Ther1987;67(12):1840-44.
73. Sale DG. Testing strength and power. In: MacDougall JD, Wenger HA, Green HJ, editors. PhysiologicalTesting of the High Performance Athlete (2nd Ed). Champaign IL: Human Kinetics, 1991.
74. Sapega AA, Nicholas JA, Sokolow D, Saranti A. The nature of torque "overshoot" in Cybex isokineticdynamometry. Med Sci Sports and Exerc 1982;14(5):368-75.
75. Sayers SP, Harackiewicz DV, Harman EA, Frykman PN, Rosenstein MT. Cross-validation of three jumppower equations. Med Sci Sports and Exerc 1999;31:572-77.
76. Stone HS, O’Bryant HS. Weight training: a scientific approach. Minneapolis, MN: Bellwether Press, 1987.77. Taylor NAS, Sanders RH, Howick EI, Stanley SN. Static and dynamic assessment of the Biodex
dynamometer. Eur J Appl Physiol 1991;62:180-88.78. Tharp GD, Newhouse RK, Uffelman L, Thorland WG, Johnson GO. Comparison of sprint and run times
with performance on the Wingate anaerobic test. Res Quart for Ex and Sport 1985;56:73-76.79. Thorstensson A, Karlsson J. Fatiguability and fibre composition of human skeletal muscle. Acta Physiol
Scand 1976;98:318-22.

Accurate Assessment of Muscular Strength and Power 21
80. Timm KE, Fyke D. The effect of test speed sequence on the concentric isokinetic performance of the kneeextensor muscle group. Isok Exerc Sci 1993;3(2):123-28.
81. Tis LL, Perrin DH. Validity of data extraction techniques on the kinetic communicator (KinCom) isokineticdevice. Isok Exerc Sci 1993;3(2):96-100.
82. Wagner LL, Evans SA, Weir JP, Housh TJ, Johnson GO. The effect of grip width on bench pressperformance. International J Sport Biomech 1992;8:1-10.
83. Wathen D. Load Assignment. In: Baechle TR, editor. Essentials of Strength Training and Conditioning.Champaign, IL: Human Kinetics, 1994: 435-39.
84. Weir JP, Evans SA, Housh ML. The effect of extraneous movements on peak torque and constant jointangle torque-velocity curves. J Orthop Sports Phys Ther 1996;23:302-08.
85. Weir JP, Wagner LL, Housh TJ. The effect of rest interval length on repeated maximal bench presses. JStrength Cond Res 1994;8:58-60.
86. Wickiewicz TL, Roy RR, Powell PL, Perrine JJ, Edgerton VR. Muscle architecture and force-velocityrelationships in humans. J Appl Physiol 1984;57(2):435-43
87. Wilk KE, Arrigo CA, Andrews JR. Isokinetic testing of the shoulder abductors and adductors: Windowed vsnonwindowed data collection. J Ortho Sports Phys Ther 1992;15(2):107-12.
88. Wilson GJ, Murphy AJ. The use of isometric tests of muscular function in athletic assessment. Sports Med1991;22:19-37.
89. Winter DA, Wells RP, Orr GW. Errors in the use of isokinetic dynamometers. Euro J Appl Physiol1981;46:397-08.
90. Zeh J, Hansson T, Bigas S, Spengler D, Battie M, Wortley M. Isometric strength testing. Recommendationsbased on a statistical analysis of the procedure. Spine 1986;11:43-46.