Arthritis & Rheumatology
263
Editor Daniel H. Solomon, MD, MPH, Boston Deputy Editors Richard J. Bucala, MD, PhD, New Haven Mariana J. Kaplan, MD, Bethesda Peter A. Nigrovic, MD, Boston Co-Editors Karen H. Costenbader, MD, MPH, Boston David T. Felson, MD, MPH, Boston Richard F. Loeser Jr., MD, Chapel Hill Social Media Editor Paul H. Sufka, MD, St. Paul Journal Publications Committee Shervin Assassi, MD, MS, Chair, Houston Adam Berlinberg, MD, Denver Deborah Feldman, PhD, Montreal Meenakshi Jolly, MD, MS, Chicago Donnamarie Krause, PhD, OTR/L, Las Vegas Uyen-Sa Nguyen, MPH, DSc, Fort Worth Michelle Ormseth, MD, Nashville R. Hal Scofield, MD, Oklahoma City Editorial Staff Jane S. Diamond, MPH, Managing Editor, Atlanta Lesley W. Allen, Assistant Managing Editor, Atlanta Ilani S. Lorber, MA, Assistant Managing Editor, Atlanta Jessica Hamilton, Manuscript Editor, Atlanta Stefanie L. McKain, Manuscript Editor, Atlanta Sara Omer, Manuscript Editor, Atlanta Emily W. Wehby, MA, Manuscript Editor, Atlanta Christopher Reynolds, MA, Editorial Coordinator, Atlanta Brittany Swett, MPH, Assistant Editor, Boston Laura Espinet, Production Editor, Hoboken Associate Editors Marta Alarcón-Riquelme, MD, PhD, Granada Heather G. Allore, PhD, New Haven Neal Basu, MD, PhD, Glasgow Edward M. Behrens, MD, Philadelphia Bryce Binstadt, MD, PhD, Minneapolis Nunzio Bottini, MD, PhD, San Diego John Carrino, MD, MPH, New York Lisa Christopher-Stine, MD, MPH, Baltimore Andrew Cope, MD, PhD, London Nicola Dalbeth, MD, FRACP, Auckland Brian M. Feldman, MD, FRCPC, MSc, Toronto Richard A. Furie, MD, Great Neck J. Michelle Kahlenberg, MD, PhD, Ann Arbor Benjamin Leder, MD, Boston Yvonne Lee, MD, MMSc, Chicago Katherine Liao, MD, MPH, Boston Bing Lu, MD, DrPH, Boston Anne-Marie Malfait, MD, PhD, Chicago Stephen P. Messier, PhD, Winston-Salem Janet E. Pope, MD, MPH, FRCPC, London, Ontario Christopher T. Ritchlin, MD, MPH, Rochester William Robinson, MD, PhD, Stanford Georg Schett, MD, Erlangen Sakae Tanaka, MD, PhD, Tokyo Maria Trojanowska, PhD, Boston Betty P. Tsao, PhD, Charleston Fredrick M. Wigley, MD, Baltimore Arthritis & Rheumatology An Official Journal of the American College of Rheumatology www.arthritisrheum.org and wileyonlinelibrary.com Advisory Editors Abhishek Abhishek, MD, PhD, Nottingham Ayaz Aghayev, MD, Boston Tom Appleton, MD, PhD, London, Ontario Joshua F. Baker, MD, MSCE, Philadelphia Bonnie Bermas, MD, Dallas Jamie Collins, PhD, Boston Christopher Denton, PhD, FRCP, London Anisha Dua, MD, MPH, Chicago John FitzGerald, MD, Los Angeles Nigil Haroon, MD, PhD, Toronto Monique Hinchcliff, MD, MS, New Haven Hui-Chen Hsu, PhD, Birmingham Vasileios Kyttaris, MD, Boston Carl D. Langefeld, PhD, Winston-Salem Rik Lories, MD, PhD, Leuven Suresh Mahalingam, PhD, Southport, Queensland Dennis McGonagle, FRCPI, PhD, Leeds Aridaman Pandit, PhD, Utrecht Kevin Winthrop, MD, MPH, Portland Julie Zikherman, MD, San Francisco AMERICAN COLLEGE OF RHEUMATOLOGY David R. Karp, MD, PhD, Dallas, President Kenneth G. Saag, MD, MSc, Birmingham, President-Elect Douglas White, MD, PhD, La Crosse, Treasurer Deborah Desir, MD, New Haven, Secretary Steven Echard, IOM, CAE, Atlanta, Executive Vice-President © 2021 American College of Rheumatology. All rights reserved. No part of this publication may be reproduced, stored or transmitted in any form or by any means without the prior permission in writing from the copyright holder. Authorization to copy items for internal and personal use is granted by the copyright holder for libraries and other users registered with their local Reproduction Rights Organization (RRO), e.g. Copyright Clearance Center (CCC), 222 Rosewood Drive, Danvers, MA 01923, USA (www.copyright.com), provided the ap- propriate fee is paid directly to the RRO. This consent does not extend to other kinds of copying such as copying for general distribution, for advertising or promotional purposes, for creating new collective works or for resale. Special requests should be addressed to: [email protected] Access Policy: Subject to restrictions on certain backfiles, access to the online version of this issue is available to all registered Wiley Online Library users 12 months after publication. Subscribers and eligible users at subscribing institutions have immediate access in accordance with the relevant subscription type. Please go to onlinelibrary.wiley.com for details. The views and recommendations expressed in articles, letters, and other communications published in Arthritis & Rheumatology are those of the authors and do not necessar- ily reflect the opinions of the editors, publisher, or American College of Rheumatology. The publisher and the American College of Rheumatology do not investigate the informa- tion contained in the classified advertisements in this journal and assume no responsibility concerning them. Further, the publisher and the American College of Rheumatology do not guarantee, warrant, or endorse any product or service advertised in this journal. Cover design: Todd Machen This journal is printed on acid-free paper. ∞
-
Upload
khangminh22 -
Category
Documents
-
view
2 -
download
0
Transcript of Arthritis & Rheumatology

EditorDaniel H. Solomon, MD, MPH, Boston
Deputy EditorsRichard J. Bucala, MD, PhD, New HavenMariana J. Kaplan, MD, BethesdaPeter A. Nigrovic, MD, Boston
Co-EditorsKaren H. Costenbader, MD, MPH, BostonDavid T. Felson, MD, MPH, BostonRichard F. Loeser Jr., MD, Chapel Hill
Social Media EditorPaul H. Sufka, MD, St. Paul
Journal Publications CommitteeShervin Assassi, MD, MS, Chair, HoustonAdam Berlinberg, MD, DenverDeborah Feldman, PhD, MontrealMeenakshi Jolly, MD, MS, ChicagoDonnamarie Krause, PhD, OTR/L, Las VegasUyen-Sa Nguyen, MPH, DSc, Fort WorthMichelle Ormseth, MD, NashvilleR. Hal Scofield, MD, Oklahoma City
Editorial Staff Jane S. Diamond, MPH, Managing Editor, AtlantaLesley W. Allen, Assistant Managing Editor, AtlantaIlani S. Lorber, MA, Assistant Managing Editor, AtlantaJessica Hamilton, Manuscript Editor, AtlantaStefanie L. McKain, Manuscript Editor, AtlantaSara Omer, Manuscript Editor, AtlantaEmily W. Wehby, MA, Manuscript Editor, AtlantaChristopher Reynolds, MA, Editorial Coordinator, AtlantaBrittany Swett, MPH, Assistant Editor, BostonLaura Espinet, Production Editor, Hoboken
Associate EditorsMarta Alarcón-Riquelme, MD, PhD, GranadaHeather G. Allore, PhD, New HavenNeal Basu, MD, PhD, GlasgowEdward M. Behrens, MD, PhiladelphiaBryce Binstadt, MD, PhD, MinneapolisNunzio Bottini, MD, PhD, San DiegoJohn Carrino, MD, MPH, New YorkLisa Christopher-Stine, MD, MPH,
BaltimoreAndrew Cope, MD, PhD, LondonNicola Dalbeth, MD, FRACP, Auckland
Brian M. Feldman, MD, FRCPC, MSc, TorontoRichard A. Furie, MD, Great NeckJ. Michelle Kahlenberg, MD, PhD, Ann ArborBenjamin Leder, MD, BostonYvonne Lee, MD, MMSc, ChicagoKatherine Liao, MD, MPH, BostonBing Lu, MD, DrPH, BostonAnne-Marie Malfait, MD, PhD, ChicagoStephen P. Messier, PhD, Winston-Salem
Janet E. Pope, MD, MPH, FRCPC, London, OntarioChristopher T. Ritchlin, MD, MPH, RochesterWilliam Robinson, MD, PhD, StanfordGeorg Schett, MD, ErlangenSakae Tanaka, MD, PhD, TokyoMaria Trojanowska, PhD, BostonBetty P. Tsao, PhD, CharlestonFredrick M. Wigley, MD, Baltimore
Arthritis & RheumatologyAn Offi cial Journal of the American College of Rheumatology
www.arthritisrheum.org and wileyonlinelibrary.com
Advisory EditorsAbhishek Abhishek, MD, PhD,
NottinghamAyaz Aghayev, MD, BostonTom Appleton, MD, PhD, London,
OntarioJoshua F. Baker, MD, MSCE,
PhiladelphiaBonnie Bermas, MD, DallasJamie Collins, PhD, Boston
Christopher Denton, PhD, FRCP, LondonAnisha Dua, MD, MPH, ChicagoJohn FitzGerald, MD, Los AngelesNigil Haroon, MD, PhD, TorontoMonique Hinchcliff, MD, MS, New HavenHui-Chen Hsu, PhD, BirminghamVasileios Kyttaris, MD, Boston
Carl D. Langefeld, PhD, Winston-SalemRik Lories, MD, PhD, LeuvenSuresh Mahalingam, PhD, Southport, QueenslandDennis McGonagle, FRCPI, PhD, LeedsAridaman Pandit, PhD, UtrechtKevin Winthrop, MD, MPH, PortlandJulie Zikherman, MD, San Francisco
AMERICAN COLLEGE OF RHEUMATOLOGY
David R. Karp, MD, PhD, Dallas, PresidentKenneth G. Saag, MD, MSc, Birmingham, President-ElectDouglas White, MD, PhD, La Crosse, Treasurer
Deborah Desir, MD, New Haven, SecretarySteven Echard, IOM, CAE, Atlanta, Executive Vice-President
© 2021 American College of Rheumatology. All rights reserved. No part of this publication may be reproduced, stored or transmitted in any form or by any means without the prior permission in writing from the copyright holder. Authorization to copy items for internal and personal use is granted by the copyright holder for libraries and other users registered with their local Reproduction Rights Organization (RRO), e.g. Copyright Clearance Center (CCC), 222 Rosewood Drive, Danvers, MA 01923, USA (www.copyright.com), provided the ap-propriate fee is paid directly to the RRO. This consent does not extend to other kinds of copying such as copying for general distribution, for advertising or promotional purposes, for creating new collective works or for resale. Special requests should be addressed to: [email protected]
Access Policy: Subject to restrictions on certain backfi les, access to the online version of this issue is available to all registered Wiley Online Library users12 months after publication. Subscribers and eligible users at subscribing institutions have immediate access in accordance with the relevant subscriptiontype. Please go to onlinelibrary.wiley.com for details.
The views and recommendations expressed in articles, letters, and other communications published in Arthritis & Rheumatology are those of the authors and do not necessar-ily refl ect the opinions of the editors, publisher, or American College of Rheumatology. The publisher and the American College of Rheumatology do not investigate the informa-tion contained in the classifi ed advertisements in this journal and assume no responsibility concerning them. Further, the publisher and the American College of Rheumatology do not guarantee, warrant, or endorse any product or service advertised in this journal.
Cover design: Todd Machen
This journal is printed on acid-free paper.∞
ART_v73_i7_Ed-board.indd 1ART_v73_i7_Ed-board.indd 1 6/15/2021 2:55:47 PM6/15/2021 2:55:47 PM

Arthritis & RheumatologyAn Offi cial Journal of the American College of Rheumatology
www.arthritisrheum.org and wileyonlinelibrary.com
In This Issue ........................................................................................................................................................................................... A9Journal Club ......................................................................................................................................................................................... A10Clinical Connections .......................................................................................................................................................................... A11 Special Articles American College of Rheumatology Guidance for COVID-19 Vaccination in Patients With Rheumatic and Musculoskeletal Diseases: Version 1
Jeff rey R. Curtis, Sindhu R. Johnson, Donald D. Anthony, Reuben J. Arasaratnam, Lindsey R. Baden, Anne R. Bass, Cassandra Calabrese, Ellen M. Gravallese, Rafael Harpaz, Rebecca E. Sadun, Amy S. Turner, Eleanor Anderson Williams, and Ted R. Mikuls ....................................................... 1093
2021 American College of Rheumatology Guideline for the Treatment of Rheumatoid Arthritis Liana Fraenkel, Joan M. Bathon, Bryant R. England, E. William St. Clair, Thurayya Arayssi, Kristine Carandang, Kevin D. Deane, Mark Genovese, Kent Kwas Huston, Gail Kerr, Joel Kremer, Mary C. Nakamura, Linda A. Russell, Jasvinder A. Singh, Benjamin J. Smith, Jeff rey A. Sparks, Shilpa Venkatachalam, Michael E. Weinblatt, Mounir Al-Gibbawi, Joshua F. Baker, Kamil E. Barbour, Jennifer L. Barton, Laura Cappelli, Fatimah Chamseddine, Michael George, Sindhu R. Johnson, Lara Kahale, Basil S. Karam, Assem M. Khamis, Iris Navarro-Millán, Reza Mirza, Pascale Schwab, Namrata Singh, Marat Turgunbaev, Amy S. Turner, Sally Yaacoub, and Elie A. Akl .............................. 1108
Editorial: Current Treatment Strategies in Rheumatoid Arthritis After Methotrexate Are Not Enough to Maintain Sustained Remission: There Is No Holy Grail!
Janet E. Pope, Peter Nash, and Roy Fleischmann ............................................................................................................................................................................ 1124 Editorial: A Good Detective Never Misses a Clue: Why the Epidemiology of Scleritis Deserves Our Attention
Matthew A. Turk and James T. Rosenbaum ..................................................................................................................................................................................... 1127
COVID-19 Brief Report: Risk Factors for COVID-19 and Rheumatic Disease Flare in a US Cohort of Latino Patients
Alice Fike, Julia Hartman, Christopher Redmond, Sandra G. Williams, Yanira Ruiz-Perdomo, Jun Chu, Sarfaraz Hasni, Michael M. Ward, James D. Katz, and Pravitt Gourh ..................................................................................................................................................................................................... 1129
Rheumatoid Arthritis Sustained Remission in Patients With Rheumatoid Arthritis Receiving Triple Therapy Compared to Biologic Therapy: A Swedish Nationwide Register Study
Hanna Källmark, Jon T. Einarsson, Jan-Åke Nilsson, Tor Olofsson, Tore Saxne, Pierre Geborek, and Meliha C. Kapetanovic ............................................... 1135 Characterization and Function of Tumor Necrosis Factor and Interleukin-6–Induced Osteoclasts in Rheumatoid Arthritis
Kazuhiro Yokota, Kojiro Sato, Takashi Miyazaki, Yoshimi Aizaki, Shinya Tanaka, Miyoko Sekikawa, Noritsune Kozu, Yuho Kadono, Hiromi Oda, and Toshihide Mimura ................................................................................................................................................................................................. 1145
Contribution of a European-Prevalent Variant near CD83 and an East Asian–Prevalent Variant near IL17RB to Herpes Zoster Risk in Tofacitinib Treatment: Results of Genome-Wide Association Study Meta-Analyses
Nan Bing, Huanyu Zhou, Xing Chen, Tomohiro Hirose, Yuta Kochi, Yumi Tsuchida, Kazuyoshi Ishigaki, Shuji Sumitomo, Keishi Fujio, Baohong Zhang, Hernan Valdez, Michael S. Vincent, David Martin, and James D. Clark .......................................................................................................... 1155
Osteoarthritis Long-Term Safety and Effi cacy of Subcutaneous Tanezumab Versus Nonsteroidal Antiinfl ammatory Drugs for Hip or Knee Osteoarthritis: A Randomized Trial
Marc C. Hochberg, John A. Carrino, Thomas J. Schnitzer, Ali Guermazi, David A. Walsh, Alexander White, Satoru Nakajo, Robert J. Fountaine, Anne Hickman, Glenn Pixton, Lars Viktrup, Mark T. Brown, Christine R. West, and Kenneth M. Verburg ............................................. 1167
Global Deletion of Pannexin 3 Resulting in Accelerated Development of Aging-Induced Osteoarthritis in Mice P. M. Moon, Z. Y. Shao, G. Wambiekele, C. T. G. Appleton, D. W. Laird, S. Penuela, and F. Beier .............................................................................................. 1178
Spondyloarthritis Infl ammasome Activation in Ankylosing Spondylitis Is Associated With Gut Dysbiosis
Giuliana Guggino, Daniele Mauro, Aroldo Rizzo, Riccardo Alessandro, Stefania Raimondo, Anne-Sophie Bergot, M. Arifur Rahman,Jonathan J. Ellis, Simon Milling, Rik Lories, Dirk Elewaut, Matthew A. Brown, Ranjeny Thomas, and Francesco Ciccia ......................................................... 1189
Mediation of Interleukin-23 and Tumor Necrosis Factor–Driven Reactive Arthritis by Chlamydia -Infected Macrophages in SKG Mice
Xavier Romand, Xiao Liu, M. Arifur Rahman, Zaied Ahmed Bhuyan, Claire Douillard, Reena Arora Kedia, Nathan Stone, Dominique Roest, Zi Huai Chew, Amy J. Cameron, Linda M. Rehaume, Aurélie Bozon, Mohammed Habib, Charles W. Armitage, Minh Vu Chuong Nguyen, Bertrand Favier, Kenneth Beagley, Max Maurin, Philippe Gaudin, Ranjeny Thomas, Timothy J. Wells, and Athan Baillet ................................................................................................................................................................................................................................ 1200
Tumor Necrosis Factor Inhibitors Reduce Spinal Radiographic Progression in Patients With Radiographic Axial Spondyloarthritis: A Longitudinal Analysis From the Alberta Prospective Cohort
Alexandre Sepriano, Sofi a Ramiro, Stephanie Wichuk, Praveena Chiowchanwisawakit, Joel Paschke, Désirée van der Heijde, Robert Landewé, and Walter P. Maksymowych .............................................................................................................................................................................. 1211
Psoriatic Arthritis Tissue-Resident Memory CD8+ T Cells From Skin Diff erentiate Psoriatic Arthritis From Psoriasis
Emmerik F. Leijten, Tessa S. van Kempen, Michel A. Olde Nordkamp, Juliette N. Pouw, Nienke J. Kleinrensink, Nanette L. Vincken, Jorre Mertens, Deepak M. W. Balak, Fleurieke H. Verhagen, Sarita A. Hartgring, Erik Lubberts, Janneke Tekstra, Aridaman Pandit, Timothy R. Radstake, and Marianne Boes ....................................................................................................................................................................................... 1220
Vasculitis Specifi c Follicular Helper T Cell Signature in Takayasu Arteritis
A. C. Desbois, P. Régnier, V. Quiniou, A. Lejoncour, A. Maciejewski-Duval, C. Comarmond, H. Vallet, M. Rosenzwag, G. Darrasse-Jèze, N. Derian, J. Pouchot, M. Samson, B. Bienvenu, P. Fouret, F. Koskas, M. Garrido, D. Sène, P. Bruneval, P. Cacoub, D. Klatzmann, and D. Saadoun .......................................................................................................................................................................................................................................... 1233
VOLUME 73 • July 2021 • NO. 7
ART_v73_i7_Toc.indd 1ART_v73_i7_Toc.indd 1 6/21/2021 4:39:37 PM6/21/2021 4:39:37 PM

Genetic Association of a Gain-of-Function IFNGR1 Polymorphism and the Intergenic Region LNCAROD/DKK1 With Behçet’s Disease Lourdes Ortiz Fernández, Patrick Coit, Vuslat Yilmaz, Sibel P. Yentür, Fatma Alibaz-Oner, Kenan Aksu, Eren Erken, Nursen Düzgün, Gokhan Keser, Ayse Cefl e, Ayten Yazici, Andac Ergen, Erkan Alpsoy, Carlo Salvarani, Bruno Casali, Bünyamin Kısacık, Ina Kötter, Jörg Henes, Muhammet Çınar, Arne Schaefer, Rahime M. Nohutcu, Alexandra Zhernakova, Cisca Wijmenga, Fujio Takeuchi, Shinji Harihara, Toshikatsu Kaburaki, Meriam Messedi, Yeong-Wook Song, Timuçin Kaşifoğlu, F. David Carmona, Joel M. Guthridge, Judith A. James, Javier Martin, María Francisca González Escribano, Güher Saruhan-Direskeneli, Haner Direskeneli, and Amr H. Sawalha .................................................................................................................................................................................................................................. 1244
The Vasculopathy of Juvenile Dermatomyositis: Endothelial Injury, Hypercoagulability, and Increased Arterial Stiff ness Charalampia Papadopoulou, Ying Hong, Petra Krol, Muthana Al Obaidi, Clarissa Pilkington, Lucy R. Wedderburn, Paul A. Brogan, and Despina Eleftheriou ..................................................................................................................................................................................................................... 1253
Epidemiology of Scleritis in the United Kingdom From 1997 to 2018: Population-Based Analysis of 11 Million Patients and Association Between Scleritis and Infectious and Immune-Mediated Infl ammatory Disease
Tasanee Braithwaite, Nicola J. Adderley, Anuradhaa Subramanian, James Galloway, John H. Kempen, Krishna Gokhale, Andrew P. Cope, Andrew D. Dick, Krishnarajah Nirantharakumar, and Alastair K. Denniston .............................................................................................................................. 1267
Systemic Sclerosis Association of Lymphangiogenic Factors With Pulmonary Arterial Hypertension in Systemic Sclerosis
Henriette Didriksen, Øyvind Molberg, Håvard Fretheim, Einar Gude, Suzana Jordan, Cathrine Brunborg, Vyacheslav Palchevskiy, Torhild Garen, Øyvind Midtvedt, Arne K. Andreassen, Oliver Distler, John Belperio, and Anna-Maria Hoff mann-Vold ......................................................... 1277
Expression Quantitative Trait Locus Analysis in Systemic Sclerosis Identifi es New Candidate Genes Associated With Multiple Aspects of Disease Pathology
Martin Kerick, David González-Serna, Elena Carnero-Montoro, Maria Teruel, Marialbert Acosta-Herrera, Zuzanna Makowska, Anne Buttgereit, Sepideh Babaei, Guillermo Barturen, Elena López-Isac, PRECISESADS Clinical Consortium, Ralf Lesche, Lorenzo Beretta, Marta E. Alarcon-Riquelme, and Javier Martin ................................................................................................................................................................................ 1288
Tocilizumab Prevents Progression of Early Systemic Sclerosis–Associated Interstitial Lung Disease David Roofeh, Celia J. F. Lin, Jonathan Goldin, Grace Hyun Kim, Daniel E. Furst, Christopher P. Denton, Suiyuan Huang, and Dinesh Khanna, on behalf of the focuSSced Investigators ............................................................................................................................................................. 1301
Brief Report: Dysfunctional Keratinocytes Increase Dermal Infl ammation in Systemic Sclerosis: Results From Studies Using Tissue-Engineered Scleroderma Epidermis
Barbara Russo, Julia Borowczyk, Wolf-Henning Boehncke, Marie-Elise Truchetet, Ali Modarressi, Nicolò C. Brembilla, and Carlo Chizzolini ................................................................................................................................................................................................................................... 1311
Fibromyalgia Greater Somatosensory Aff erence With Acupuncture Increases Primary Somatosensory Connectivity and Alleviates Fibromyalgia Pain via Insular γ-Aminobutyric Acid: A Randomized Neuroimaging Trial
Ishtiaq Mawla, Eric Ichesco, Helge J. Zöllner, Richard A. E. Edden, Thomas Chenevert, Henry Buchtel, Meagan D. Bretz, Heather Sloan, Chelsea M. Kaplan, Steven E. Harte, George A. Mashour, Daniel J. Clauw, Vitaly Napadow, and Richard E. Harris .................................... 1318
Clinical Images Giant Iliopsoas Bursitis in Systemic Juvenile Idiopathic Arthritis
Asami Shimbo, Yuko Akutsu, Susumu Yamazaki, Masaki Shimizu, and Masaaki Mori .............................................................................................................. 1328
Pediatric Rheumatology Brief Report: Anti–Cytosolic 5′-Nucleotidase 1A Autoantibodies Are Absent in Juvenile Dermatomyositis
Anke Rietveld, Judith Wienke, Eline Visser, Wilma Vree Egberts, Wolfgang Schlumberger, Baziel van Engelen, Annet van Royen-Kerkhof, Hui Lu, Lucy Wedderburn, Christiaan Saris, Sarah Tansley, and Ger Pruijn, on behalf of the Juvenile Dermatomyositis Research Group and the Dutch Myositis Consortium ................................................................................................................................................................................................................ 1329
Brief Report: Distinct Gene Expression Signatures Characterize Strong Clinical Responders Versus Nonresponders to Canakinumab in Children With Systemic Juvenile Idiopathic Arthritis
Emely L. Verweyen, Alex Pickering, Alexei A. Grom, and Grant S. Schulert ................................................................................................................................... 1334
Letters Prophylactic Anticoagulation Therapy: Comment on the Article by Henderson et al
Barbara Faganel Kotnik, Mojca Zajc Avramovič, Lidija Kitanovski, and Tadej Avčin .................................................................................................................. 1341 Reply
Lauren A. Henderson, Kevin G. Friedman, Mary Beth F. Son, Kate F. Kernan, Scott W. Canna, Mark Gorelik, Sivia K. Lapidus, Anne Ferris, Grant S. Schulert, Philip Seo, Adriana H. Tremoulet, Rae S. M. Yeung, David R. Karp, Hamid Bassiri, Edward M. Behrens, and Jay J. Mehta .................................................................................................................................................................................................................................. 1342
Understanding the Relationships Between Type I Interferon, STAT4, and the Production of Interleukin-21 and Interferon-γ by Follicular Helper T Cells in Lupus: Comment on the Article by Dong et al
Caiqun Chen , Yan Liang, and Zaixing Yang ..................................................................................................................................................................................... 1343 Reply
Joe Craft and Jason Weinstein ........................................................................................................................................................................................................... 1344 Temporal Arteritis Revealing Antineutrophil Cytoplasmic Antibody–Associated Vasculitides: Are the Visual Outcomes Diff erent From Giant Cell Arteritis? Comment on the Article by Delaval et al
Joydeep Samanta, GSRSNK Naidu, Sakshi Mittal, Ritambhra Nada, Amanjit Bal, Ramandeep Singh, Vishali Gupta, Amod Gupta, Aman Sharma, and Benzeeta Pinto .................................................................................................................................................................................................. 1345
Biologics for Eosinophilic Granulomatosis With Polyangiitis—One Size Does Not Fit All: Comment on the Article by Canzian et al Marco Caminati, Alessandro Giollo, Gianenrico Senna, and Claudio Lunardi ............................................................................................................................ 1346
Sjögren’s Disease, Not Syndrome Alan N. Baer and Katherine M. Hammitt ......................................................................................................................................................................................... 1347
Cover image: The fi gure on the cover (from Guggino et al, pages 1189–1199) is a confocal image of a frozen ileum sample obtained from a patient with ankylosing spondylitis and stained for caspase 1 with FAM-FLICA. The use of a fl uorochrome-labeled inhibitor peptide that specifi cally binds the active site of caspase 1 demonstrated increased activation of infl ammasome in the ankylosing spondylitis gut.
ART_v73_i7_Toc.indd 2ART_v73_i7_Toc.indd 2 6/21/2021 4:39:37 PM6/21/2021 4:39:37 PM

In this IssueHighlights from this issue of A&R | By Lara C. Pullen, PhD
CD8+ T Cells from Skin Differentiate Psoriatic Arthritis from PsoriasisCD8+CCR10+ T cells tend to act as effector memory T cells based on classic nomencla-ture, even though they also have a strong transcriptional overlap with skin-derived tissue-
resident memory T cells. In this issue, Leijten et al (p. 1220) report the fi nd-
ings of their detailed investigation of the increase in CD8+CCR10+ T cells in the periph-eral blood of patients with psoriatic arthritis (PsA). The researchers found that tissue-resi-dent memory CD8+ T cells derived from the skin are enhanced in the circulation of patients with PsA compared to patients with psoriasis alone. Theirs is the broadest immunopheno-typing study to date of a Psoriasis Area and Severity Index–matched cohort of patients with PsA and patients with psoriasis who were not being treated with immunomodulatory drugs.
The investigators found that, relative to healthy controls, the peripheral blood of patients with PsA showed an increase in regulatory CD4+ T cells and interleukin-17A (IL-17A) and IL-22 coproducing CD8+
T cells. The CD8+CCR10+ T cells were enriched in PsA and differentiated PsA from psoriasis. These cells expressed high levels of DNAX accessory molecule 1. They coex-pressed skin-homing receptors CCR4 and cuta-neous lymphoid antigen and acted as effector memory cells. While the CD8+CCR10+ T cells were detected under infl ammatory and homeostatic conditions in the skin, they were not enriched in synovial fl uid.
p. 1220
Subcutaneous Tanezumab for Hip and Knee OsteoarthritisIn this issue, Hochberg et al (p. 1167) report the results of their assessment of the long-term safety and 16-week efficacy of subcutaneous tanezumab in patients with hip or knee osteoarthritis (OA). The
researchers found that, while pain and phys-ical function improved
with tanezumab and nonsteroidal antiin-flammatory drugs (NSAIDs), tanezumab administered subcutaneously to patients who had previously received a stable dose of NSAIDs resulted in more joint safety events than continued NSAIDs. These effects occurred in a dose-dependent manner
and were greater with tanezumab 5 mg than 2.5 mg over the course of the study.
The investigators performed a large (2,996 receiving ≥1 treatment dose), double-blind, double-dummy, NSAID-controlled, parallel-group study. They found that, although tane-zumab 5 mg signifi cantly improved pain and physical function, it did not signifi cantly improve Patient global assessment (PtGA) scores at week 16 compared to NSAIDs. Corresponding differences between the tane-zumab 2.5 mg and NSAID groups were not statistically signifi cant.
The investigators noted that the frequen-cies of adverse events and serious adverse
p. 1167
When gene profi ling was performed, the researchers found that CD8+CCR10+ T cells expressed GATA3, FOXP3, and the core tran-scriptional signature of tissue-resident memory T cells, such as CD103. They also found that specifi c genes, including RORC, IFNAR1, and ERAP1, were up-regulated in PsA compared to psoriasis. The authors conclude that aber-rances in cutaneous tissue homeostasis may contribute to arthritis development.
Figure 1. Examples of suppression assays are shown. Fresh peripheral blood mononuclear cells from 5 healthy controls were incubated with CellTrace Violet (CT-violet) and cocultured with different CD8+ T cell subsets.
events between the tanezumab 2.5 mg and NSAID groups were similar. Adverse events were more prevalent, however, in those treated with tanezumab 5 mg. Approximately 70% of composite joint safety events were adjudicated as rapidly progressive OA type 1, and these were signifi cantly more frequent with tane-zumab 2.5 mg and tanezumab 5 mg than with NSAIDs. The authors are unsure of the reason for the increase in joint safety events in the tanezumab groups but suggest that it might be related to neuropathic and analgesic arthrop-athy, preexisting defi cits in bone integrity, and nerve growth factor–related effects on carti-lage repair and load-induced bone formation.

This study explored the incidence and prevalence of scleritis in the UK over a 22-year period (1997–2018), risk factors for inci-dent scleritis, and association with infectious and immune-medi-ated inflammatory diseases (I-IMIDs). Scleritis is a sight-threatening condition, which frequently requires systemic immunosuppres-sion to avoid irreversible tissue damage. Prior to this study, there was a paucity of epidemiologic data, with none from the UK or Europe. Data are needed to inform health system cost modeling and resource allocation. There has been no previous systematic explora-tion of association with systemic I-IMIDs to inform cross-specialty awareness and development of patient-centered care pathways.
The authors used The Health Improvement Network (THIN) data set to conduct a retrospective cross-sectional and population cohort study, along with a case–control and cohort study. The data set included the anonymized primary health care records of 11 million NHS patients (17% of the total UK population in 2018), with 75 million years of cumulative follow-up. Using multivariable Poisson regression analysis, the team explored the incidence rate ratio of incident cases versus controls, by multiple potential risk factors for incident scleritis. Between 1995 and 2018, 3,005 patients developed incident scleritis. They were matched in a ratio of 1:4 to general population controls, based on age (within 1 year), sex, region, and
Townsend deprivation index. Multivariable logistic regression models adjusted for these variables as well as for body mass index at cohort entry, ethnicity, and smoking status, explored the stre- ngth of association between incident scleritis and a previous diag-nosis of different I-IMIDs. Multivariable Cox proportional hazards models assessed the hazard of a subsequent diagnosis of each I-IMID during cumulative follow-up following scleritis diagnosis.
Questions
1. How does the reported epidemiology of scleritis in the UK compare to the reported epidemiology of scleritis in the US (4 studies), and what factors might explain observed differences?
2. Which I-IMIDs were most frequently observed among inci-dent scleritis cases and controls, and which were most strongly associated with incident scleritis?
3. What are the potential sources of bias in this study, and how might these impact the various parameter estimates?
4. Which risk factors were associated with incident scleritis diagnosis in the UK, and how might genetic, environmental, hormonal, or metabolic mechanisms contribute to risk being higher in the identified population subgroups?
Epidemiology of Scleritis in the UK: Population-Based Analysis of 11 Million Patients and Association Between Scleritis and I-IMID
Understanding the Risk of Herpes Zoster with Tofacitinib TreatmentTofacitinib is an oral JAK inhibitor used for the treatment of rheumatoid arthritis (RA), psoriatic arthritis, and ulcerative colitis. It has also been investigated for the treat-
ment of psoriasis (PsO). Unfortunately, patients with RA or PsO who are
treated with tofacitinib are at increased risk for developing herpes zoster (HZ). In this issue, Bing et al (p. 1155) report the find-ings of their effort to identify genetic factors contributing to the occurrence of HZ related to tofacitinib treatment. The team's genetic analysis of tofacitinib-treated patients with RA or PsO identified multiple loci associated
with increased HZ risk. They conclude from this analysis that prevalent variants near the immune-relevant genes CD83 and IL17RB in European and East Asian populations, respec-tively, may contribute to the risk of HZ in tofacitinib-treated subjects.
The study included 5,246 subjects. After adjustment for age, baseline abso-lute lymphocyte count, genetically defined ethnicity, and concomitant methotrexate use, the regional analysis model showed that 4 loci were significantly associated with earlier onset of HZ in European populations. One of these was a single-nucleotide poly-morphism (SNP) near CD83, a marker of
dendritic cell maturation. This association is noteworthy because when varicella zoster virus infects mature monocyte-derived dendritic cells, it impairs their functions by down-regulating cell-surface immune mole-cules, including CD83, CD80, and CD86.
When performing a trans-ethnic, trans-population meta-analysis, investigators found that the CD83 SNP remained signifi-cantly associated with the HZ end points in European subjects. Four additional signifi-cant loci were identified in the meta-analysis. Included in these was a SNP near IL17RB that was associated with faster onset of HZ in East Asian subjects.
p. 1155
Journal Club
Braithwaite et al. Arthritis Rheumatol. 2021;90:1267–1276
A monthly feature designed to facilitate discussion on research methods in rheumatology.

Clinical ConnectionsGlobal Deletion of Pannexin 3 Accelerates Development of Aging-Induced Osteoarthritis in Mice Moon et al. Arthritis Rheumatol. 2021;90:1178–1188
CORRESPONDENCE Frank Beier, PhD: [email protected]
SUMMARY Osteoarthritis (OA) leads to destruction of joint tissues due to various biochemical and mechanical stressors. OA following injury (posttraumatic OA) is thought to develop through similar mechanisms as OA during aging but at an accelerated pace. Pannexin 3 (Panx3) is a channel-forming protein that was previously shown to drive posttraumatic OA in male mice. In this study, however, Moon et al use genetically modified mice lacking Panx3 and show accelerated OA (e.g., loss of cartilage and OA-like changes in bone and joint capsule) between 18 and 24 months of age when compared to normal mice. Loss of Panx3 was also associated with reduced lubricin levels in articular cartilage during aging, but increased lubricin levels after injury. These results highlight distinct, opposing roles for the same protein in different subtypes of OA with implications for both the future investigation and treatment of OA.
KEY POINTS • Both aging and joint injury are associated with OA in
male mice.
• Panx3 loss was previously shown to protect against posttraumatic OA in mice.
• Panx3 loss is shown here to accelerate OA in aging mice.
• These data suggest that different OA subtypes develop through different molecular mechanisms, with the same gene playing opposite roles in the subtypes.

Clinical Connections
KEY POINTS • The inflammasome is up-regulated in SpA.
• Intestinal dysbiosis is associated with inflammasome activation.
• NLRP3 inflammasome blockade prevents intestinal inflammation and delays arthritis onset.
• The inflammasome may drive type III cytokine production in the setting of SpA.
SUMMARY The inflammasome is a highly conserved pathway of innate immune response to invading microorganisms. It regulates the secretion of proinflammatory cytokines (e.g., interleukin-1β [IL-1β] and IL-18) and a specific inflammatory cell death called pyroptosis. Guggino et al demonstrated that inflammasome components Nlrp3, Nlrc4, and Aim2 were more highly expressed in the gut of rats carrying human HLA–B27, which is strongly associated with the development of spondyloarthritis (SpA). In HLA–B27–transgenic rats, inflammasome expression was linked to intestinal dysbiosis, as this effect was reversed by antibiotic treatment. The blockade of NLRP3 in the SKG mouse model of SpA prevented ileitis and delayed arthritis onset.
In the intestine of ankylosing spondylitis (AS) patients, inflammasome components were up-regulated and caspase 1 activity increased. Consistent with this, higher levels of pyroptosis and increased production of IL-1β and IL-18 were detected. The amount of adherent and invasive mucosa-associated bacteria, higher in AS patients, correlated with inflammasome components in peripheral blood, and NLRP3 expression levels were associated with disease activity and IL23A expression. In vitro, inflammasome activation in AS monocytes was paralleled by increased production of IL-1β and IL-18, and IL-1β modulated IL23A, IL17A, and IL22 expression. These data demonstrate that in AS, dysbiosis induces inflammasome activation in the gut and, in turn, may contribute to type III cytokine production.
Inflammasome Activation in Ankylosing Spondylitis Is Associated With Gut Dysbiosis Guggino et al. Arthritis Rheumatol. 2021;90:1189–1199
CORRESPONDENCE Francesco Ciccia, MD, PhD: [email protected]

1093
Arthritis & RheumatologyVol. 73, No. 7, July 2021, pp 1093–1107DOI 10.1002/art.41734© 2021, American College of Rheumatology
American College of Rheumatology Guidance for COVID- 19 Vaccination in Patients With Rheumatic and Musculoskeletal Diseases: Version 1Jeffrey R. Curtis,1 Sindhu R. Johnson,2 Donald D. Anthony,3 Reuben J. Arasaratnam,4 Lindsey R. Baden,5 Anne R. Bass,6 Cassandra Calabrese,7 Ellen M. Gravallese,5 Rafael Harpaz,8 Rebecca E. Sadun,9 Amy S. Turner,10 Eleanor Anderson Williams,11 and Ted R. Mikuls12
Objective. To provide guidance to rheumatology providers on the use of coronavirus disease 2019 (COVID- 19) vaccines for patients with rheumatic and musculoskeletal diseases (RMDs).
Methods. A task force was assembled that included 9 rheumatologists/immunologists, 2 infectious disease specialists, and 2 public health physicians. After agreeing on scoping questions, an evidence report was created that summarized the published literature and publicly available data regarding COVID- 19 vaccine efficacy and safety, as well as literature for other vaccines in RMD patients. Task force members rated their agreement with draft consensus statements on a 9- point numerical scoring system, using a modified Delphi process and the RAND/University of California Los Angeles Appropriateness Method, with refinement and iteration over 2 sessions. Consensus was determined based on the distribution of ratings.
Results. Despite a paucity of direct evidence, 74 draft guidance statements were developed by the task force and agreed upon with consensus to provide guidance for use of the COVID- 19 vaccines in RMD patients and to offer recommendations regarding the use and timing of immunomodulatory therapies around the time of vaccination.
Conclusion. These guidance statements, made in the context of limited clinical data, are intended to provide direction to rheumatology health care providers on how to best use COVID- 19 vaccines and to facilitate implementation of vaccination strategies for RMD patients.
Due to the rapidly expanding information and evolving evidence related to COVID- 19, which may lead to modification of some guidance statements over time, it is anticipated that updated versions of this article will be published, with the version number included in the title. Readers should ensure that they are consulting the most current version.
Guidance developed and/or endorsed by the American College of Rheumatology (ACR) is intended to inform particular patterns of practice and not to dictate the care of a particular patient. The ACR considers adher-ence to this guidance to be voluntary, with the ultimate determination regarding its application to be made by the physician in light of each patient’s individual circumstances. Guidance statements are intended to promote beneficial or desirable outcomes but cannot guarantee any specific outcome. Guidance developed or endorsed by the ACR is subject to periodic revision as warranted by the evolution of medical knowledge, technology, and practice.
The American College of Rheumatology is an independent, professional medical and scientific society which does not guarantee, warrant, or endorse any commercial product or service.

CURTIS ET AL 1094 |
INTRODUCTION
The global pandemic caused by the severe acute respiratory syndrome coronavirus 2 (SARS– CoV- 2) has caused untold dis-ruption to nearly all aspects of human health globally. The sub-stantial morbidity and excess mortality attributed to coronavirus disease 2019 (COVID- 19) has had a major impact on health and the delivery of health care. Given the role that rheumatology pro-viders have in serving patients with rheumatic and musculoskele-tal diseases (RMDs) (1), particularly those with autoimmune and inflammatory rheumatic diseases (AIIRDs), there is an urgent need to optimize strategies to curb the incidence of COVID- 19. In addi-tion to preventive measures such as physical distancing, mask- wearing, handwashing, and shelter- in- place orders, the newly available COVID- 19 vaccines provide a powerful tool to mitigate the burgeoning growth of adverse outcomes resulting from COVID- 19.
Given the leadership role of the American College of Rheuma-tology (ACR) in facilitating dissemination of high- quality evidence and promoting best practices for the care of RMD patients, the ACR periodically convenes task forces charged with develop-ing methodologically rigorous clinical practice guidelines and guidance documents. Previous ACR guidelines developed for the management of rheumatoid arthritis (RA) and psoriatic arthri-tis (PsA) have included some information regarding optimal use of vaccines for patients with those conditions. However, because the immunologic principles related to use of vaccines and the impact of vaccine- preventable illnesses on patients cross a broad range of RMDs, the ACR altered its approach in 2020 and convened a new guideline development group to focus exclusively on vaccination. This cross- cutting team was charged with developing encompass-ing vaccination considerations for all disease and treatment- related areas within rheumatology, rather than embedding them into narrower, disease- specific clinical practice guidelines.
The development process of ACR guidelines follows a rigorous and formal methodology, is based on a reproducible
and transparent systematic literature review, incorporates pan-elist expertise from rheumatology health care professionals and input from related medical experts in other disciplines (e.g., infectious disease, epidemiology), includes direct participation by patients that reflects their values and preferences, and is typ-ically conducted over an extended time frame (e.g., 1 year or longer). In contrast, the ACR develops “guidance” documents when the components needed to develop a formal guideline are not present, e.g., if the need to provide guidance is more urgent than a longer guideline timeline would allow, there is not enough peer- reviewed evidence available to conduct a formal literature review, or when there is very limited expertise and experience, particularly on the part of patients, to help inform the development of recommendations. In these situations, an expert task force is formed to provide the best guidance possi-ble based on the limited information available. The ACR expects that guidance documents will need to be updated with some frequency as new data become available and greater experi-ence is acquired.
Responding to the need to provide timely guidance to prac-ticing clinicians, the ACR COVID- 19 Vaccine Guidance Task Force was created as a branch of the ACR Vaccine Guideline effort, to summarize the evidence for newly available COVID- 19 vaccines and to make timely clinical recommendations to rheu-matology providers for their optimal use. It relied on a limited evi-dence base derived from clinical trials evaluating the COVID- 19 vaccines in non- RMD populations and also included indirect evi-dence regarding the immunogenicity, clinical effectiveness, and safety of other vaccines administered to RMD patients receiving various immunomodulatory therapies. Armed with this infor-mation, task force members were asked to extrapolate across diseases and integrate relevant basic science and immunologic principles to inform the use, timing, and prioritization of the COVID- 19 vaccines available in the US and apply them to the care of RMD patients.
Supported by the American College of Rheumatology. 1Jeffrey R. Curtis, MD, MS, MPH: University of Alabama at Birmingham;
2Sindhu R. Johnson, MD, PhD: Toronto Western Hospital, Mount Sinai Hospital, and University of Toronto, Toronto, Ontario, Canada; 3Donald D. Anthony, MD, PhD: Louis Stokes Cleveland VA Medical Center, MetroHealth Medical Center, and Case Western Reserve University, Cleveland, Ohio; 4Reuben J. Arasaratnam, MD: VA North Texas Health Care System and University of Texas Southwestern Medical Center, Dallas; 5Lindsey R. Baden, MD, MSc, Ellen M. Gravallese, MD: Brigham and Women’s Hospital, Boston, Massachusetts; 6Anne R. Bass, MD: Hospital for Special Surgery and Weill Cornell Medicine, New York, New York; 7Cassandra Calabrese, DO: Cleveland Clinic, Cleveland, Ohio; 8Rafael Harpaz, MD: Harpaz Herman Consultants, Atlanta, Georgia; 9Rebecca E. Sadun, MD, PhD: Duke University, Durham, North Carolina; 10Amy S. Turner: American College of Rheumatology, Atlanta, Georgia; 11Eleanor Anderson Williams, MD: The Permanente Medical Group, Union City, California; 12Ted R. Mikuls, MD, MSPH: University of Nebraska Medical Center and VA Nebraska– Western Iowa Health Care System, Omaha.
Dr. Curtis has received consulting fees, speaking fees, and/or honoraria from AbbVie, Bristol Myers Squibb, GlaxoSmithKline, Eli Lilly, and Novartis
(less than $10,000 each) and from Amgen, Janssen, Pfizer, Myriad, and Sanofi (more than $10,000 each) and research grants from Genentech, Gilead, AbbVie, Bristol Myers Squibb, GlaxoSmithKline, Eli Lilly, Amgen, Janssen, Pfizer, Myriad, and Sanofi. Dr. Johnson has received consulting fees, speaking fees, and/or honoraria from Ikarai and Boehringer Ingelheim (less than $10,000 each) and research grants from Bayer, Boehringer Ingelheim, Corbus, and GlaxoSmithKline. Dr. Baden has received salary support from the New England Journal of Medicine (less than $10,000). Dr. Calabrese has received consulting fees, speaking fees, and/or honoraria from AbbVie and Sanofi Genzyme (less than $10,000 each). Dr. Gravallese has received salary support from the New England Journal of Medicine (more than $10,000). Dr. Mikuls has received consulting fees, speaking fees, and/or honoraria from Sanofi, Horizon, Pfizer, and Gilead (less than $10,000 each) and research support from Bristol Myers Squibb and Horizon. No other disclosures relevant to this article were reported.
Address correspondence to Jeffrey R. Curtis, MD, MS, MPH, University of Alabama at Birmingham, FOT 802, 510 20th Street South, Birmingham, AL 35294. Email: [email protected].
Submitted for publication February 10, 2021; accepted in revised form March 10, 2021.

ACR GUIDANCE FOR COVID- 19 VACCINATION IN RMD PATIENTS | 1095
METHODS
Convening the ACR COVID- 19 Vaccine Guidance Task Force and defining the scope of the clinical guidance. In October 2020, the ACR began assembling the ACR COVID- 19 Vaccination Guidance Task Force. Invitations were made following a general solicitation sent to the broad ACR membership seeking interested volunteers. The task force consisted of 13 members from North America and included 9 rheumatologists, 2 infectious disease specialists, and 2 public health experts with current or for-mer employment at the US Centers for Disease Control and Pre-vention (CDC). Rheumatology task force members were chosen to represent various areas of specialty expertise within the field and to achieve diversity in geographic region, career stage, practice set-ting, sex, and race/ethnicity, while also ensuring that the majority of task force members had no conflicts of interest. The task force defined the intended scope of the guidance based on input from individual members, and external input was obtained informally from various stakeholders. The process was informed by the previ-ously published ACR Guidance for the Management of Rheumatic Disease in Adult Patients During the COVID- 19 Pandemic (2). The scope of this guidance includes clinically relevant questions that were intended to inform rheumatology patient care related to COVID- 19 vaccination and treatment considerations around the time of vacci-nation. The scoping questions were agreed upon by all panel mem-bers at an initial teleconference conducted on December 14, 2020.
Developing the evidence summary. The task force was divided into teams that worked in parallel, each charged with summarizing the published literature and other available evidence spanning 4 topics: 1) the efficacy, immunogenicity, and safety data derived from clinical trials of late- stage (i.e., phase III) COVID- 19 vaccines ongoing within the US or COVID- 19 vaccines already available under the US Food and Drug Administration (FDA) Emer-gency Use Authorization (EUA); 2) the epidemiology of COVID- 19 risk and outcomes in RMD patients; 3) the attenuation of immuno-genicity to other vaccines (e.g., influenza, pneumococcal) associ-ated with certain immunomodulatory therapies; and 4) the safety profile (e.g., disease flare, new- onset autoimmune conditions) of non– COVID- 19 vaccines in RMD populations. The scoping ques-tions were grouped into these domains and distributed to the teams, which were tasked with gathering and summarizing evi-dence that addressed the questions within their assigned domains.
The task force agreed that the intended audience for the guidance was rheumatology health care providers managing their individual patients, but they felt that some attention should be directed to a societal perspective, when relevant, around the availability of COVID- 19 vaccines and prioritization for individuals with RMDs. The task force took the perspective of developing guidance for a US audience, particularly in view of the fact that the review of COVID- 19 vaccine clinical trials was US- focused. Recognizing that RMD patients exhibit high variability with respect
to their underlying health conditions, disease severity, treatments, and degree of multimorbidity, these considerations were noted as important facets of individualizing care. Therefore, this guid-ance was not intended to supersede the judgment of rheuma-tology care providers nor override the values and perspectives of their patients. Foundational principles, guiding assumptions, and acknowledged limitations were discussed and agreed upon throughout the process (Table 1) and are discussed in this docu-ment where most relevant.
Development of the evidence review summary document. Given the accelerated time frame for guidance development, a nonsystematic evidence review was completed and included serial PubMed searches supplemented by postings from the CDC; briefings and other documents available from the FDA, such as dossiers submitted by vaccine manufacturers and transcripts of data presented at the FDA’s Vaccines and Related
Table 1. Foundational principles, assumptions, and considerations for the guidance statements*
ACR guidance statements are not intended to supersede the judgment of rheumatology care providers nor override the values and perspectives of their patients. Guidance was based on weak and/or indirect evidence and required substantial extrapolation by an expert task force. All statements, therefore, should be considered conditional or provisional. The ACR is committed to updating this guidance document as new evidence emerges.
The rheumatology community lacks important knowledge on how to best maximize vaccine- related benefits. RMD patients exhibit high variability with respect to their underlying health condition, disease severity, treatments, degree of multimorbidity, and relationship with their specialist provider. These considerations must be considered when individualizing care.
There is no direct evidence about mRNA COVID- 19 vaccine safety and efficacy in RMD patients. Regardless, there is no reason to expect vaccine harms will trump expected COVID- 19 vaccine benefits in RMD patients.
The future COVID- 19 landscape is uncertain with respect to vaccine effectiveness and safety, uptake, durability, mitigating societal behavior, and emerging viral strain variants. Clinicians nevertheless must act with their best judgment despite this highly uncertain and rapidly changing landscape.
The risk of deferring vaccination and thus failing to mitigate COVID- 19 risk should be weighed against a possible blunted response to the vaccine if given under suboptimal circumstances. As a practical matter, this tension must be resolved in the context of imperfect prediction as to whether those circumstances may be transient as well as a paucity of scientific evidence.
Both individual and societal considerations related to a limited vaccine supply should be considered in issuing vaccine guidance and making policy decisions. Given that context, simplicity should be the touchstone: to avoid confusion, improve implementation, and maintain scientific credibility.
In the future, the ability to give an additional vaccine booster (if proven necessary or beneficial) will no longer be constrained by limited supplies. Any vaccination strategy is a reasonable starting point, and decisions about implementation details reflect tradeoffs in the allocation of scarce vaccine resources.
* ACR = American College of Rheumatology; RMD = rheumatic and musculoskeletal disease; COVID- 19 = coronavirus disease 2019.

CURTIS ET AL 1096 |
Biological Products Advisory Committee meetings (3,4); and other electronic media sources. References and original articles related to vaccination were culled from the systematic literature reviews developed for ACR guidelines for the management of RA in 2012, 2015, and 2021 (5– 7), PsA in 2018 (8), and vaccination guidelines for RMD patients published by the European Alliance of Associa-tions for Rheumatology in 2019 (9– 11).
The scoping questions and the relevant evidence reviews contributed by team members were collated into a single evi-dence summary document, which was disseminated by email to the entire task force for review 2 days prior to initial ratings. Follow-ing the development of the evidence summary, regular PubMed searches were undertaken over the next 6 weeks, and new evi-dence was shared with the task force prior to follow- up webinars. As no direct evidence was anticipated to be available for use of the COVID- 19 vaccine in RMD patients, no formal assessment of evidence quality (e.g., using Grading of Recommendations Assessment, Development and Evaluation methodology [12]) was attempted, and all evidence was assumed to be indirect. For this reason, all guidance statements should be considered as provi-sional, or “conditional,” until further evidence becomes available.
Initial ratings. The standard guideline development processes currently used by the ACR (13) were deemed to be too time- intensive to be feasible, given the immediate need for the guidance document. Therefore, following distribution of the evidence review document, the scoping questions were transformed into proposed positive statements for which task force members were asked to rate their initial agreement or disagreement. These statements were grouped into 4 broad categories: 1) general medical considerations that provided foundational information for the guidance document; 2) spe-cific recommendations related to COVID- 19 vaccination in RMD patients; 3) treatment- specific considerations regarding the tim-ing of COVID- 19 vaccination; and 4) the timing of RMD treat-ments in relation to vaccine administration.
A modified Delphi approach conducted as part of the RAND/University of California at Los Angeles Appropriateness Method (14) was used for guidance development. This method has been used for some past ACR guidelines and the more recent ACR COVID- 19 guidance (15); it has been shown to be reproducible and to have content, construct, and predictive validity. Using this method, an initial round of rating was conducted anonymously by email. Task force members were asked to rate their level of agreement, and all votes were weighted equally. Voting was completed using a numer-ical rating scale of 1– 9 for all items. Ratings of 9 corresponded to “complete agreement,” 5 to “uncertain,” and 1 to “complete disa-greement.” Median ratings for each statement falling into intervals of 1– 3, 4– 6, and 7– 9 were interpreted as disagreement, uncertainty, and agreement, respectively. Agreement with each of the proposed guidance statements submitted by individual panel members was tabulated for the entire panel and used to classify consensus.
Consensus was deemed “strong” when all 13 panel members’ rat-ings fell within a single tertile (e.g., 7– 9, indicative of agreement); all other combinations were considered to reflect “moderate” consen-sus. A lack of consensus was identified when the median rating fell into the uncertain range (4– 6 interval), or more than one- quarter of the ratings fell into the opposite extreme tertile from the median (e.g., ≥4 panelists rated 1– 3 [disagree] when the overall median rating was in the 7– 9 [agree] range) (14).
Review and iteration for the ratings of the proposed guidance statements by the task force. Results from the first round of rating were reviewed and discussed in a task force webinar on January 15, 2021. Discussion was focused on state-ments for which there was no consensus. Individuals were given the opportunity to comment on all items presented in the initial rating process. Informed by voting results and the group discus-sion, the task force members refined the wording of several of the rated statements.
Revised statements were sent back to task force members and agreement was again assessed by email, using the same scor-ing approach described above. Results from the second round of voting were presented to the task force via webinar on January 22, 2021, and minor text revisions were made iteratively in real time until consensus was achieved. A draft manuscript was developed describing the results of the rating process, and all coauthors were given an opportunity to provide direct edits to the document. The ACR Guidance Subcommittee and ACR Quality of Care Commit-tee were given the document in order to provide feedback. It was subsequently sent to the ACR Board of Directors, which approved these recommendations on February 8, 2021. Public vetting of the guidance document was held via an electronic and widely pub-licized “town hall” held on February 16, 2021 that was open to ACR members and the public, with questions solicited in advance and during the town hall webinar. Finally, given the multitude of uncertainties and evidence gaps considered by the task force, the panel proposed a research agenda of high- impact topics that would advance the science and inform the optimal use of COVID- 19 vaccines in RMD patients treated with immunomod-ulatory therapies. After publication, an ACR project librarian will refresh the specified literature search on a regular basis and sub-mit new articles to the task force for review, and this document will be updated through a similar process as new evidence emerges.
RESULTS
Of the 76 guidance statements considered across the 2 rounds of ratings, 74 were rated with a median score of 7, 8, or 9 (i.e., agreement), and 2 of them were not agreed upon. Among the 74 statements achieving agreement, consensus was strong for 16 and moderate for the remainder. One guidance statement related to COVID- 19 vaccination in children age <16 years was rated with a median value of 5 (uncertain) by the task force, in

ACR GUIDANCE FOR COVID- 19 VACCINATION IN RMD PATIENTS | 1097
part reflecting the desire to obtain more feedback from pediatric rheumatology providers. Additional input was therefore sought from the ACR Pediatric Rheumatology Clinical Guidance Task Force. This task force recognized the practical considerations related to the lack of any COVID- 19 vaccine being currently avail-able in the US under an FDA EUA for children younger than age 16 years, although it recognized that ≥1 COVID vaccine clinical trial has enrolled patients as young as age 12 years (ClinicalTri-als.gov identifiers: NCT04649151 and NCT04368728) (16,17). It also acknowledged a dearth of evidence in children with RMDs regarding both the epidemiology of COVID- 19 and the resulting complications. Therefore, the Pediatric Task Force recommended to await additional evidence from clinical trials regarding the safety and effectiveness of COVID- 19 vaccination in children before pro-viding formal guidance statements, with the expectation that once such evidence becomes available, this topic will be revisited. The second statement for which the task force was unable to reach consensus relates to vaccination in the context of ongoing treat-ment with high- dose glucocorticoids, discussed in detail below.
General considerations related to vaccination against COVID- 19 in patients with RMDs. Twelve guidance statements related to general considerations of COVID- 19 vacci-nation in RMD patients achieved consensus (Table 2). Statements
were descriptively categorized into ≥1 domain to facilitate ease of reference. The panel concurred that rheumatology health care pro-viders were responsible for engaging RMD patients in discussions to assess whether they had been vaccinated against COVID- 19 and to document related details (e.g., which vaccine had been administered, timing of vaccination, whether the series had been completed). For those not vaccinated, and similar to other vacci-nation guidelines for immunocompromised patients such as those from the Infectious Disease Society of America, it was thought that the rheumatology provider should share responsibility with the patient’s primary care provider (when available) to ensure appropri-ate vaccinations are administered (18,19). Rheumatology providers should also engage patients in a shared decision- making process to discuss the following: their attitudes, intent, and concerns related to vaccination; local incidence of COVID- 19; individual circumstances (e.g., disease activity, medications, comorbidities) that may affect risk; ability to adhere to nonpharmacologic public health interventions; and vaccine efficacy and potential safety con-cerns (e.g., local or systemic reactogenicity, potential for disease worsening or flare).
The epidemiology of viral infection risk in RMD patients, and specifically, the risk for infection due to SARS– CoV- 2, was then dis-cussed. For this topic, the task force elected to narrow the scope of the patient population under consideration and define a presumably
Table 2. General considerations related to COVID- 19 vaccination in patients with RMD*
Statement domain, guidance no. Guidance statement
Level of task force consensus
Clinical practice, 1 The rheumatology health care provider is responsible for engaging the RMD patient in a discussion to assess COVID- 19 vaccination status.
Strong
Clinical practice, 2 The rheumatology health care provider is responsible for engaging the RMD patient in a shared decision- making process to discuss receiving the COVID- 19 vaccine.
Moderate
Epidemiology, 3 AIIRD patients are at higher risk for incident viral infections compared to the general population.
Moderate
Epidemiology, 4 After considering the influence of age and sex, AIIRD patients are at higher risk for hospitalized COVID- 19 compared to the general population.
Moderate
Epidemiology, 5 Acknowledging heterogeneity due to disease- and treatment- related factors, AIIRD patients have worse outcomes associated with COVID- 19 compared to the general population of similar age and sex.
Moderate
Epidemiology, 6 Across AIIRD conditions, and within any specific disease, there is substantial variability in disease- and treatment- related risk factors for COVID- 19 that may put some patients at higher risk than others.†
Moderate
Public health, 7 Based on increased risk for COVID- 19, AIIRD patients should be prioritized for vaccination before the nonprioritized general population of similar age and sex.
Moderate
Vaccine safety, 8 Beyond known allergies to vaccine components, there are no known additional contraindications to COVID- 19 vaccination for AIIRD patients.
Moderate
Vaccine effectiveness, 9 The expected response to COVID- 19 vaccination for many AIIRD patients receiving systemic immunomodulatory therapies is likely to be blunted in its magnitude and duration compared to the general population.
Moderate
Disease- related, 10 As a general principle, vaccination should optimally occur in the setting of well- controlled AIIRD.
Moderate
Disease- related, 11 A theoretical risk exists for AIIRD flare or disease worsening following COVID- 19 vaccination.
Moderate
Vaccine safety, 12 The benefit of COVID- 19 vaccination for RMD patients outweighs the potential risk for new-onset autoimmunity.
Moderate
* COVID- 19 = coronavirus disease 2019; RMD = rheumatic and musculoskeletal disease.† For examples of these autoimmune and inflammatory rheumatic disease (AIIRD) conditions, see Supplementary Table 1, on the Arthritis & Rheumatology website at http://onlin elibr ary.wiley.com/doi/10.1002/art.41734/ abstract.

CURTIS ET AL 1098 |
higher- risk subgroup of patients with RMDs. Some RMD conditions would include those managed by rheumatology providers but not generally associated with high levels of systemic inflammation (e.g., osteoarthritis, fibromyalgia, osteoporosis) and for which conven-tional, biologic, or targeted synthetic disease- modifying antirheu-matic drugs (DMARDs) or other therapies with immunosuppressive effects are typically not indicated. The patient population was thus restricted to those with AIIRDs (see Supplementary Table 1 for defi-nitions, available on the Arthritis & Rheumatology website at http://onlin elibr ary.wiley.com/doi/10.1002/art.41734/ abstract). Among these individuals, the risk for incident viral infections (e.g., herpes zoster) was rated as being higher than for the general population (20– 22). There was also agreement that AIIRD patients are likely to be at increased risk for hospitalized SARS– CoV- 2 infection (23– 27) and that age, race/ethnicity (especially for underrepresented minor-ities), and sex were important risk factors that needed to be consid-ered (28– 31) in evaluating risk at the individual patient level.
Multimorbidity was felt to likewise play an important role in the risk for developing COVID- 19. While some population- based epidemiologic studies of COVID- 19 incidence and outcomes in AIIRD patients have controlled for general multimorbidity or spe-cific comorbidities (23,24,32), the panel recognized that some comorbidities that increase infection risk were shared risk factors for development of AIIRDs (e.g., smoking and related pulmonary conditions associated with incident RA). These may represent direct manifestations such as interstitial lung disease associated with some AIIRDs, or they could be downstream sequelae causally related to the underlying inflammatory processes of AIIRDs or their treatment (e.g., premature and advanced atherosclerotic vascular disease in systemic lupus erythematosus patients; obesity, diabe-tes, and features of the metabolic syndrome in psoriatic arthritis patients or those receiving long- term glucocorticoids). For that reason, adjustment for these comorbidities might be inappropriate and would underestimate the risk of COVID- 19 infection in patients with AIIRDs. Therefore, age- and sex- adjusted risk estimates were preferred by some task force members when comparing risk and outcomes of COVID- 19 in AIIRD patients to the general population.
The few large population- based studies of COVID- 19 inci-dence and outcomes in AIIRD patients had minimal demographic diversity, and therefore race/ethnicity could not be easily evaluated as an independent risk factor. Finally, the panel acknowledged challenges in being able to disentangle the independent role of the disease activity and severity of various AIIRDs from the med-ications used to treat them (e.g., higher- dose glucocorticoids [33]), so- called confounding by severity, as risk factors for worse COVID- 19 outcomes.
Despite these important methodologic caveats and acknowl-edged limitations in the evidence base, AIIRD patients were rated as having worse outcomes (e.g., need for intensive care unit [ICU] treatment, mechanical ventilation, persistent infection, death) following COVID- 19 compared to patients of similar age and sex without such conditions (23– 27,34). In terms of the policy
implications of this reasoning, the task force agreed that in gen-eral, AIIRD patients should be prioritized to be allocated to receive vaccination before the nonprioritized general population of similar age and sex (35). The panel recognized important heterogeneity across AIIRD conditions, such that (for example) an RA patient with quiescent disease treated only with hydroxychloroquine likely has a lower risk for COVID- 19 and adverse outcomes com-pared to a vasculitis patient with very active disease treated with intravenous (IV) cyclophosphamide or rituximab (RTX) and high- dose glucocorticoids (31), although the protection conferred by COVID- 19 vaccination may also differ greatly.
Turning attention to vaccination of individual patients, the task force felt that there were no additional known contraindica-tions to receipt of the COVID- 19 vaccine other than known aller-gies to vaccine components as stipulated by guidance from the CDC (36). Extrapolating evidence derived from studies of other vaccines, the expected response to vaccination in many AIIRD patients receiving certain systemic immunomodulatory therapies was deemed likely to be blunted, albeit with uncertain diminution in either the magnitude or duration of response compared to the general population (36,37). The task force acknowledged a com-plete absence of direct evidence supporting this assertion and placed great importance on prioritizing this topic as part of a future research agenda. The timing of vaccination was considered more ideal in the setting of well- controlled disease, yet the task force noted that patients and their providers should not be dissuaded from vaccination under less- than- ideal conditions, with additional timing considerations as discussed below.
Based on data derived from the published literature, a potential risk for a flare of the patient’s underlying AIIRD follow-ing vaccination was acknowledged. For example, based on randomized controlled trial data (38), the frequency of flare was higher in RA patients randomized to have methotrexate (MTX) withheld at the time of influenza vaccination compared to those randomized to continue (10.6% versus 5.1%, respectively), with flare defined as an increase in the Disease Activity Score in 28 joints (DAS28) of >1.2, or >0.6 if the baseline DAS28 was ≥3.2 (39). A subsequent pooled analysis that included that trial and another showed that while the mean change in DAS28 did not differ between groups, the adjusted flare rate in the 2- week withhold group (MTX withhold) was 2.90- fold higher (95% con-fidence interval 0.96– 4.56; P = 0.063) compared to the group that continued MTX (MTX continue), with a difference in propor-tions experiencing flare of 10.8% (MTX withhold group) versus 5.8% (MTX continue group) (38,40– 42). This risk of flare or dis-ease worsening was catalogued as an important topic slated for the future research agenda. Finally, although some new- onset AIIRDs (e.g., RA, vasculitis) or flares of preexisting AIIRDs have been reported after COVID- 19 in published case reports (43,44), the expected benefit of vaccination for AIIRD patients was thought to outweigh any theoretical risk for the develop-ment of new- onset autoimmune conditions or other potentially

ACR GUIDANCE FOR COVID- 19 VACCINATION IN RMD PATIENTS | 1099
immune- mediated manifestations or abnormalities (e.g., Bell’s palsy, Guillain- Barré syndrome, anti- RNA antibodies in systemic lupus erythematosus patients, immune thrombocytopenic pur-pura) following vaccination.
Indications for vaccination and timing considerations. As summarized in Table 3, and consistent with guidance from the CDC for the general US population, the panel recommended
that RMD and AIIRD patients be offered and receive vaccination against SARS– CoV- 2. Discussion was held regarding the age cut-off for vaccination, and the panel agreed that guidance should be made consistent with the EUA of available vaccines (i.e., age ≥16 years as of January 2021), with the potential for that cutoff to change in the future based on future revisions to EUAs for existing vaccines, forthcoming EUAs for new vaccines, or age restrictions applicable to FDA licensure.
Table 3. Recommendations for use of the COVID- 19 vaccine in RMD patients*
Statement domain, guidance no. Guidance statementLevel of task force
consensusClinical practice, 13 RMD patients should be offered COVID- 19 vaccination,
consistent with the age restriction of the EUA and/or FDA approval.†
Strong
Clinical practice, 14 RMD patients should receive COVID- 19 vaccination, consistent with the age restriction of the EUA and/or FDA approval.†
Moderate
Clinical practice, 15 AIIRD patients should receive COVID- 19 vaccination, consistent with the age restriction of the EUA and/or FDA approval.†
Moderate
Clinical practice, 16 RMD patients without an AIIRD who are receiving immunomodulatory therapy should be vaccinated in a similar manner as described in this guidance as AIIRD patients receiving those same treatments.
Moderate
Vaccine effectiveness/safety, 17 Based on the data for the mRNA COVID- 19 vaccines available in the US, there is no preference for one COVID- 19 vaccine over another. Therefore, AIIRD patients should receive either vaccine available to them.
Moderate
Vaccine effectiveness, 18 For a multidose vaccine, AIIRD patients should receive the second dose of the same vaccine, even if there are nonserious adverse events associated with receipt of the first dose, consistent with timing described in CDC guidelines (30).
Strong
Clinical practice, 19 Health care providers should not routinely order any laboratory testing (e.g., antibody tests for IgM and/or IgG to spike or nucleocapsid proteins) to assess immunity to COVID- 19 postvaccination, nor to assess the need for vaccination in an as-yet-unvaccinated person.
Strong
Public health, 20 Following COVID- 19 vaccination, RMD patients should continue to follow all public health guidelines regarding physical distancing and other preventive measures.
Strong
Clinical practice/public health, 21 Household members and other frequent close contacts of AIIRD patients should undergo COVID- 19 vaccination when available to them to facilitate a “cocooning effect” that may help protect the AIIRD patient. No priority for early vaccination is recommended for household members.
Moderate
Vaccine effectiveness/disease- related, 22 Except for AIIRD patients with life- threatening disease (e.g., in the ICU for any reason), COVID vaccination should occur as soon as possible for those for whom it is being recommended, irrespective of disease activity and severity.
Strong
Vaccine effectiveness/disease- related, 23 In AIIRD patients with life- threatening disease (e.g., in the ICU for any reason), COVID- 19 vaccination should be deferred until their disease is better controlled.
Moderate
Vaccine effectiveness/disease- related, 24 AIIRD patients with active but non– life- threatening disease should receive COVID- 19 vaccination.
Strong
Vaccine effectiveness/disease- related, 25 AIIRD patients with stable or low disease activity AIIRDs should receive COVID- 19 vaccination.
Strong
Vaccine effectiveness/disease- related, 26 AIIRD patients not receiving immunomodulatory treatments should receive the first dose of the COVID- 19 vaccine prior to initiation of immunomodulatory therapy when feasible.
Moderate
* COVID- 19 = coronavirus disease 2019; RMD = rheumatic and musculoskeletal disease; EUA = Emergency Use Authorization; FDA = US Food and Drug Administration; AIIRD = autoimmune and inflammatory rheumatic disease; CDC = Centers for Disease Control and Prevention; ICU = intensive care unit. † Age ≥16 years as of January 2021.

CURTIS ET AL 1100 |
Recommendations on which patients should be vaccinated were extended to patients with RMDs who did not have condi-tions typically considered to be AIIRDs but for which immuno-modulatory or DMARD therapies might be used off- label. For example, patients with erosive osteoarthritis might receive MTX, or gout patients treated with pegloticase might be concomi-tantly treated with MTX to reduce pegloticase immunogenicity. These circumstances, in which MTX or another immunomodu-latory therapy is being used for a non- AIIRD condition, would be treated synonymously with the guidance for MTX offered in this document. However, within the category of patients with AIIRDs and/or those receiving immunomodulatory therapies, substantial heterogeneity of disease- and treatment- related risk factors was noted. Some AIIRD patients were expected to be at higher risk for infection and morbidity than others, and thus the impetus for COVID- 19 vaccination might be stronger for some individual patients or patient groups (e.g., patients with systemic lupus erythematosus receiving cytotoxic therapy and higher- dose glucocorticoids, or patients receiving RTX ther-apy), although the vaccine might be less effective in these same individuals.
Extensive discussion was held regarding whether consider-ation for a particular vaccine, or vaccine platform (e.g., messen-ger RNA [mRNA] versus adenoviral vector) might be preferred in general or for selected patients. However, given that the majority of the data available were for 2 mRNA vaccines, and the future evidence base and availability of alternative vaccine platforms was uncertain, the task force restricted its consideration to only the 2 mRNA vaccines available in the US at the time of deliberation. With this in mind, there was no preference for one COVID- 19 vaccine over another, and RMD patients undergoing vaccina-tion were recommended to receive whichever of the mRNA vac-cines was available to them. The task force noted that none of the SARS– CoV- 2 vaccine candidates in development would be classified as a canonical live- virus vaccine, including the adeno-viral vector– based vaccines which are replication- deficient (45). Thus, the usual prohibitions against the use of live- virus vaccines in immunosuppressed patients does not apply. High importance was placed on updating this guidance document as additional data emerge for new vaccines yet to be licensed or available in the US under an EUA.
The task force also noted the CDC guidance regarding recommendation against routine prevaccine prophylaxis with acetaminophen or nonsteroidal antiinflammatory drugs to prevent postvaccination symptoms, which states, “[R]outine prophylactic administration of these medications for the purpose of prevent-ing postvaccination symptoms is not currently recommended, because information on the impact of such use on COVID- 19 vaccine– induced antibody responses is not available at this time” (46). However, the CDC has made no prohibition against their use for patients who experience local or systematic symptoms postvaccination.
Following receipt of the first dose in a vaccine series, patients were recommended to receive the second dose of the same type of vaccine, assuming no contraindication to the second dose per CDC guidance (e.g., a severe allergic reaction, or an immedi-ate allergic reaction of any severity to the vaccine or any of its components, including polyethylene glycol) (46). Persons who develop SARS– CoV- 2 infection between the first and second dose of a 2- dose vaccine series should delay the second dose until they have recovered from the acute illness (if symptomatic) and discontinued isolation, and then they should receive the second dose without delay (46). Consistent with CDC guidance (36), SARS– CoV- 2– infected patients who received monoclonal antibodies (e.g., bamlanivimab, casirivimab, imdevimab) or con-valescent plasma as part of treatment for COVID- 19 should defer vaccination for ≥90 days following receipt of antibody therapy.
Thus far, there is no proven laboratory- based immune correlate of protection against SARS– CoV- 2 following natural infection or vaccination. Moreover, some commercially available SARS– CoV- 2 serologic assays do not detect antibody responses to spike protein generated by the currently available mRNA vac-cines, but rather measure antibodies to nucleo capsid protein. Therefore, the task force recommended that health care pro-viders not do any of the following: routinely order laboratory testing to assess the need for vaccination in an unvaccinated person, screen for asymptomatic SARS– CoV- 2 shedding, or assess SARS– CoV- 2 immunity following vaccination. The task force expressed strong interest in modifying this guidance once additional data evolve regarding the potential utility of laboratory- based testing which that might be helpful in select patients. Household members and other frequent close contacts of AIIRD patients were recommended to undergo COVID- 19 vaccina-tion when available, in order to facilitate a “cocooning effect” that may help protect at- risk AIIRD patients. However, the pri-ority for vaccination for these close contacts should not be ele-vated for this reason.
A series of statements was rated by the panel with respect to the general timing of COVID- 19 vaccination in relation to AIIRD disease activity, again acknowledging a dearth of direct evidence. Except for those with severe and life- threatening illness (e.g., a hospitalized patient receiving treatment in the ICU for any condition), vaccination was recommended irrespective of disease activity and severity. Even for ICU- treated patients for whom vaccination was recommended to be deferred for a short time, the task force felt that when the patient was well enough to be discharged from the hospital, vaccination would likely be appropriate. Acknowledging a balance between vaccinating and obtaining a blunted but still modest response, and the duty to allocate vaccine resources toward the settings in which they are likely to have the greatest benefit, the panel identified this scenario as an important evidence gap. For AIIRD patients in other settings, including those with either active but non– life- threatening disease, and certainly for patients with stable and/

ACR GUIDANCE FOR COVID- 19 VACCINATION IN RMD PATIENTS | 1101
or low disease activity, vaccination was recommended. Finally, patients naive to or not currently receiving immunomodulatory therapies were recommended to receive their first dose of vac-cine without delay. Additional considerations for medication tim-ing were subsequently discussed.
Treatment- specific timing of vaccination. Guidance regarding optimizing the timing of COVID- 19 vaccination in rela-tion to the use of various immunomodulatory therapies is provided in Table 4. There was recognition that the ability to carefully time COVID- 19 vaccination is sometimes limited in a real- world setting, and the overarching view was that COVID- 19 vaccination should be given rather than not given if timing in relation to immunomod-ulatory drugs is not under the provider’s or patient’s control.
Strong consensus was achieved regarding the statement to not delay COVID- 19 vaccination for patients receiving hydroxy-chloroquine, sulfasalazine, leflunomide, apremilast, or IV immu-noglobulin (10,47). A similar recommendation with moderate consensus was achieved for most of the remaining immunomod-ulatory therapies considered (48– 59). One exception was RTX (10,11,60– 64), for which the panel recommended to schedule vaccination such that the vaccine series would be initiated ~4 weeks prior to the next scheduled RTX dose. For example, a patient receiving RTX as a 2- dose cycle (spaced 2 weeks apart), with cycles repeating every 6 months, would be recommended to initiate vaccination ~5 months after the start of the prior RTX cycle. RTX dosing could then be resumed 2– 4 weeks after the second COVID- 19 vaccination, as discussed in the next section. Those receiving RTX cycles at 4- month intervals would initiate vaccination 3 months after the prior RTX cycle. In order to follow this recommendation, the task force invoked the assumption that a patient’s COVID- 19 risk was low or able to be mitigated by pre-ventive health measures. The rationale for this recommendation
comes from a single study demonstrating minimal response to influenza vaccination in 11 patients vaccinated 4– 8 weeks after RTX treatment, with modestly restored responses in patients vac-cinated 6– 10 months after their last RTX dose (65).
As the second statement for which consensus was not achieved, the panel was uncertain about whether to delay vac-cination if an AIIRD patient was receiving glucocorticoids at a prednisone- equivalent dose of ≥20 mg per day. Controversy stemmed as to whether vaccine response might be blunted in this circumstance, which may relate to the glucocorticoids themselves or to the presumably high disease activity and severity (66,67). Other factors discussed included the disease being treated and the medical management considerations if the patient were to manifest systemic reactogenicity (e.g., persistent high fever). Concern regarding an attenuated response to the vaccine in this circumstance would be partially mitigated if there was a possibility to later order serologies or other laboratory tests, and clinicians were able to assess vaccine- induced immunity and administer a booster or revaccinate if needed. However, such laboratory- based correlates of protection are not currently available, and the task force did not expect that the opportunity to revaccinate would be readily at hand.
Use and timing of immunomodulatory therapies in relation to COVID- 19 vaccination administration. No evi-dence was found to support concern regarding the use or tim-ing of immunomodulatory therapies in relation to vaccine safety, and guidance regarding medication timing (Table 5) was therefore given in light of the intent to optimize vaccine response. For most therapies, the task force recommended that no changes be made with respect to interrupting or otherwise optimizing the timing of immunomodulatory therapy (10,68,69). For MTX, however, the panel recommended that MTX be withheld 1 week after each
Table 4. Guidance related to the timing of COVID- 19 vaccination in relation to use of immunomodulatory therapies in RMD patients*
Medication(s)COVID- 19 vaccine administration
timing considerationsLevel of task force
consensusHydroxychloroquine; sulfasalazine; leflunomide;
apremilast; IVIGDo not delay or adjust vaccine administration
timing.Strong
Methotrexate; mycophenolate mofetil; azathioprine; cyclophosphamide (IV or oral); TNFi; IL- 6R; IL- 1Ra; IL- 17; IL- 12/IL-23; IL- 23; belimumab; JAK inhibitors; abatacept (IV or SC); oral calcineurin inhibitors; GCs (prednisone- equivalent dose <20 mg/day) †
Do not delay or adjust vaccine administration timing.
Moderate
Rituximab Assuming that a patient’s COVID- 19 risk is low or able to be mitigated by preventive health measures (e.g., self- isolation), schedule vaccination so that the vaccine series is initiated ~4 weeks prior to next scheduled rituximab cycle.
Moderate
* COVID- 19 = coronavirus disease 2019; RMD = rheumatic and musculoskeletal disease; IVIG = intravenous immunoglobulin; TNFi = tumornecrosis factor inhibitor; SC = subcutaneous. † Examples of cytokine and kinase inhibitors include the following: for interleukin- 6 receptor (IL- 6R), sarilumab and tocilizumab; for IL-1 receptor antagonist (IL-1Ra), anakinra and canakinumab; for IL- 17, ixekizumab and secukinumab; for IL- 12/IL-23, ustekinumab; for IL- 23, guselkumab and rizankizumab; for JAK inhibitors, baricitinib, tofacitinib, and upadacitinib. Consensus was not reached for patients receiving glucocorticoids (GCs) at prednisone- equivalent doses of ≥20 mg/day.

CURTIS ET AL 1102 |
vaccine dose for those with well- controlled disease, based on data from influenza vaccines (38,41,42,70,71) and pneumococcal vaccines (72,73). The recommendation to withhold MTX for only a single week, rather than the 2- week interruption tested in an RA influenza vaccine trial, was based upon practical considera-tions for the complexity of withholding MTX for 2 weeks around each of the 2 vaccine doses that are spaced 3– 4 weeks apart and the potential for flare associated with withholding MTX for this long. For that reason, interrupting MTX for only 1 week around the time of each of the vaccine doses was recommended. Similar guidance was made for JAK inhibitors based on concern related to the effects of this medication class on interferon signaling that may result in a diminished vaccine response (74,75). Given the immunologic considerations related to this concern (76), with-holding JAK inhibitor therapy was recommended regardless of the patient’s underlying disease activity.
In contrast, the panel recommended that subcutaneous abatacept (ABA) be withheld for both 1 week before and 1 week after the first dose of the vaccine (i.e., a total of 2 weeks) but not withheld for the second dose (53). This recommendation was made in light of several studies suggesting a negative effect of ABA on vaccine immunogenicity (10,70,71,77– 79). The addi-tional rationale for withholding ABA around the time of the first vaccine dose, but not the second, was that the first vaccine dose
primes naive T cells, naive T cell priming is inhibited by CTLA- 4, and ABA is a CTLA- 4Ig construct. This consideration relates to the fact that the COVID- 19 vaccine provides protection against a novel infectious agent, in contrast to most other vaccines which generally function by reactivating memory T cells. CTLA- 4 should not, however, inhibit “boosts” of already primed T cells at the time of the second vaccine dose. This principle would theoreti-cally also apply to subsequent booster doses of vaccine, should future evidence suggest that these are needed or beneficial in some patients.
Additionally, as with MTX, the practical considerations sur-rounding guidance to withhold subcutaneous ABA for a total of 2 weeks around each of the 2 vaccine doses (4 weeks total) was raised as a concern. Following similar immunologic principles, the panel recommended to time IV ABA administration (typically given every 4 weeks) so that the first vaccine dose would occur 4 weeks after ABA infusion (i.e., the entire dosing interval), and postpone the subsequent ABA infusion by 1 week (i.e., such that infusion would occur 5 weeks following the previous dose). For those not yet receiving subcutaneous or IV ABA, therapy could be initiated following the recommended 1- week delay after the first vaccine dose. No ABA adjustments were recommended for the second vaccine dose. For AIIRD patients receiving IV cyclophos-phamide, generally at 2- or 4- week intervals, the recommendation
Table 5. Guidance related to the use and timing of immunomodulatory therapies in relation to COVID- 19 vaccination administration in RMD patients*
Medication(s)Immunomodulatory therapy
timing considerationsLevel of task force
consensusHydroxychloroquine; apremilast; IVIG; GCs (prednisone-
equivalent dose <20 mg/day)No modifications. Strong
Sulfasalazine; leflunomide; mycophenolate mofetil; azathioprine; cyclophosphamide (oral); TNFi; IL- 6R; IL- 1Ra; IL- 17; IL- 12/IL-23; IL- 23; belimumab; oral calcineurin inhibitors; GCs (prednisone- equivalent dose ≥20 mg/day)†
No modifications. Moderate
Methotrexate Withhold methotrexate 1 week after each vaccine dose, for those with well- controlled disease.
Moderate
JAK inhibitors† Withhold JAK inhibitors for 1 week after each vaccine dose.
Moderate
Abatacept (SC) Withhold abatacept both 1 week prior to and 1 week after the first COVID- 19 vaccine dose only; no interruption around the second vaccine dose.
Moderate
Abatacept (IV) Time administration so that the first vaccination will occur 4 weeks after abatacept infusion (i.e., the entire dosing interval), and postpone the subsequent abatacept infusion by 1 week (i.e., a 5- week gap in total); no medication adjustments for the second vaccine dose.
Moderate
Cyclophosphamide (IV) Time cyclophosphamide administration so that it will occur ~1 week after each vaccine dose, when feasible.
Moderate
Rituximab Delay rituximab 2– 4 weeks after second vaccine dose if disease activity allows.
Moderate
* Guidance to withhold a therapy was made based on the assumption that the patient had well- enough controlled disease to allow for a temporary interruption; if not, decisions should be made on a case- by- case basis considering the circumstances involved. COVID- 19 = coronavirus disease 2019; RMD = rheumatic and musculoskeletal disease; IVIG = intravenous immunoglobulin; GCs = glucocorticoids; TNFi = tumor necrosis factor inhibitor; SC = subcutaneous. † Examples of cytokine and kinase inhibitors include the following: for interleukin- 6 receptor (IL- 6R), sarilumab and tocilizumab; for IL-1 receptor antagonist (IL-1Ra), anakinra and canakinumab; for IL- 17, ixekizumab and secukinumab; for IL- 12/IL-23, ustekinumab; for IL- 23, guselkumab and rizankizumab; for JAK inhibitors, baricitinib, tofacitinib, and upadacitinib.

ACR GUIDANCE FOR COVID- 19 VACCINATION IN RMD PATIENTS | 1103
was made to coordinate timing so that cyclophosphamide infu-sion occurs ~1 week after each vaccine dose, when feasible (48).
For RTX, the panel recommended to time RTX administra-tion (of the next/first dose, if given as part of a multidose cycle) 2– 4 weeks after the second vaccine dose, if possible, but added the condition that the patient’s disease should be under accept-able control to allow this delay, especially given the extended gap (e.g., 6 months) between RTX cycles (65,80– 82). The task force acknowledged that the evidence base supporting the recommendations related to RTX timing was largely based on studies of humoral immunity following receipt of other vaccines (60– 63,65,70,80– 83), which had uncertain generalizability to vac-cination against COVID- 19, especially since the degree to which efficacy is attributable to induction of host T cell versus B cell (antibody- based) immunity is uncertain at this time.
As an outgrowth of the evidence report, the task force assem-bled a research agenda where evidence was lacking (Table 6). Given that there was little direct evidence in any RMD population, the topics were broad and spanned domains related to clinical effectiveness, safety, flare, reactogenicity, study design, immu-nogenicity, and laboratory- based correlates of protection. With the relatively small size of the task force, no attempt was made to prioritize these topics given the expectation that they would evolve over time and as new science in non- RMD populations was forthcoming.
DISCUSSION
This ACR guidance encompasses the optimal use of COVID- 19 vaccines for patients with rheumatic and musculoskel-etal diseases. It is intended to aid in the care of individual patients but not to supplant personalized care or constrain shared decision- making with patients. The mRNA vaccine platform is novel, and considerations for vaccines developed on this platform may differ from those relevant to other vaccines. The guidance regarding the use and timing of immunomodulatory medications was based on extrapolation of the available evidence of their immunologic effects as they relate to other vaccines and vaccine platforms. As such, all of these recommendations are considered conditional. Finally, the task force advised health care providers to avoid being overly dogmatic in following these recommendations. The attempt to optimize vaccine response in relation to the use and timing of immunosuppressive medications should not compromise a willing patient’s ability to undergo vaccination in a timely manner and risk a missed vaccination opportunity.
As an overarching principle, the sparsity of information regarding COVID- 19 vaccination in RMD patients and lack of direct evidence yielded a need for extrapolation based on the literature published for other vaccines. The evidence base was, therefore, of low or very low quality and suffered from indirect-ness (12) in almost all respects. The guidance provided herein
Table 6. Research agenda for future COVID- 19 vaccine studies in RMD patients proposed by the task force*
Conduct clinical efficacy and laboratory- based immunogenicity studies in RMD patients following vaccination, especially for AIIRD patients receiving certain immunomodulatory therapies (e.g., methotrexate, abatacept, JAK inhibitors, rituximab, GCs).
Optimize vaccine response by considering timing related to intentional short- term cessation of certain immunomodulatory therapies (e.g., methotrexate, subcutaneous abatacept, JAK inhibitors) to optimize vaccine response.
Evaluate risk of disease flare, disease worsening, and systemic reactogenicity following COVID- 19 vaccination in RMD patients, by disease and in relation to background immunomodulatory therapies.
Directly compare vaccines and vaccine platforms for the above efficacy, immunogenicity, and safety outcomes: notable given the potential for some COVID- 19 vaccines to achieve the minimum threshold for the FDA’s EUA yet have seemingly lower vaccine efficacy based on large clinical trials in non- RMD patients.
Long- term follow- up for durability and magnitude of vaccine protection in relation to various immunomodulatory medications, and as new SARS– CoV- 2 strains emerge.
Assess benefits and timing of additional COVID- 19 vaccine administration (i.e., booster dose).
Generate real- world evidence (e.g., large pragmatic trial or observational studies) embedded in routine clinical practice to study the above topics, especially to promote large- scale safety surveillance.
Establish a biorepository with associated clinical data infrastructure to facilitate future COVID- 19 (and possibly other) vaccine- related research in RMD patients, considering the future potential to identify laboratory- based correlates of protection relevant for individual patients.
Identify laboratory- based serologic testing to identify patients with a suboptimal response to COVID- 19 vaccination who might be candidates for a booster dose or need to repeat the vaccination series.
Evaluate the impact of coadministration of the COVID- 19 vaccine given concurrently with other, non– live- virus vaccines (e.g., shingles, influenza, pneumococcal) on vaccine immunogenicity and tolerability.
Optimize approaches to address vaccine hesitancy for high- risk RMD patients who are reticent or unwilling to undergo vaccination, with particular attention to vulnerable populations (e.g., underrepresented racial/ethnic groups).
Identify COVID- 19 vaccine– induced immune parameters (immunogen-specific neutralizing antibody levels, total immunogen-specific antibody levels or isotypes, T cell immunity, innate immunity) or host determinants that are predictive of successful host response to vaccine, as reflected by protection from infection or mitigation of morbidity during subsequent infection.
Conduct large epidemiology studies of COVID- 19 outcomes (e.g., using large administrative databases of health plans, electronic health record data [e.g., the ACR RISE registry], or other data sources or methods) and examine the role of AIIRD disease features, treatments, and vaccination. While risk factors for incident disease may be shaped by confounding and unmeasured variability in exposure, examining outcomes conditioning on incident COVID- 19 diagnosis may be more fruitful.
* COVID- 19 = coronavirus disease 2019; RMD = rheumatic and musculoskeletal disease; AIIRD = autoimmune and inflammatory rheumatic disease; GCs = glucocorticoids; FDA = US Food and Drug Administration; EUA = Emergency Use Authorization; SARS– CoV- 2 = severe acute respiratory syndrome coronavirus 2; ACR = American College of Rheumatology; RISE = Rheumatology Informatics System for Effectiveness.

CURTIS ET AL 1104 |
represents a balance between evidence regarding efficacy, effec-tiveness, safety, feasibility (e.g., withholding a therapy with a long half- life or extended recirculation like leflunomide may be unrealis-tic), expected vaccine availability, and tradeoffs in resource utiliza-tion. For example, vigorous debate was held about whether it was preferable to vaccinate a high- risk patient in a suboptimal circum-stance (e.g., active disease, receiving high- dose glucocorticoids, receiving cytotoxic therapy), under the assumption that the vac-cine would confer at least some protection to a patient at high risk for a poor outcome if they contract COVID- 19. Or rather, might it be preferable to wait until a more optimal circumstance presented itself? However, given the uncertainty in most medical settings to predict the future course of a patient’s AIIRD or the need for additional immunomodulatory treatments, a more salutary setting to optimize vaccine response might never materialize. Thus, the task force typically favored proceeding more immediately with vaccination.
If a laboratory- based correlate of protection existed that could serve as a proxy for immunity, and if a booster dose could be administered or the vaccine series repeated at a later time, there would be greater certainty to recommend vaccinating all patients immediately, regardless of setting or underlying treatment. These societal considerations regarding vaccine allocation in light of con-strained vaccine supply and regional resource limitations to revac-cinate posed important tradeoffs for the panel. Given tradeoffs like these, the extant uncertainties posed by the scoping questions informed by imperfect evidence, and the highly dynamic environ-ment of vaccination implementation, the task force recommended as it did.
The strengths of this effort are notable given the urgent need presented by the availability of new COVID- 19 vaccines and crit-ical questions about how to best use those vaccines for RMD patients. The task force generated an evidence summary over a very compressed time frame and leveraged a well- established consensus methodology process used previously by the ACR. Of high importance, the task force’s composition included experts in rheumatology, infectious disease, and public health, representing a plurality of different stakeholder perspectives.
Regarding important limitations, our ability to generalize from the literature for other vaccines and vaccine platforms in RMD patients to the novel COVID- 19 vaccines now available in the US is limited. Vaccination against SARS– CoV- 2 raises different issues than those for other vaccine- preventable illnesses, given the potential for ongoing public health measures to partially mitigate exposure. This guidance therefore must be interpreted by clini-cians and patients in light of underlying principles rather than con-sidering them either prescriptive or proscriptive. For example, an AIIRD patient with minimal public contact who is able to strongly adhere to all preventive health measures might choose to withhold RMD treatments or briefly defer vaccination in accordance with this guidance, whereas this same decision may not be possible for a patient employed in a high- risk setting (e.g., front- line health
care, or long- term care facility). From a vaccine policy and rec-ommendation context, the task force prioritized simplicity, noting that this guidance would be expected to apply to the care of most RMD patients in most settings.
Finally, the procedures used to develop this guidance did not follow the rigorous methodology routinely used by the ACR when formal clinical practice guidelines are created, although they were adherent to the ACR standardized operating procedures for guidance documents (13). This was an expected limitation given the accelerated time frame desired by the ACR to issue practical and timely recommendations both to its membership and to the rheumatology community. Once the urgency of the pandemic has passed, the work of this task force will eventually be folded back under the aegis of the broader ACR Vaccine Guideline develop-ment group, charged with covering this and all other vaccines in the context of RMDs, and the more typical guideline development process favored by the ACR will be applied. Additional and impor-tant input from other stakeholders, including patients and patient advocates will also be sought, as the ACR has done for past clin-ical practice guidelines (6).
As new safety and efficacy evidence becomes available for both mRNA vaccines and other vaccine platforms in patients with RMDs and AIIRDs, the ACR’s guidance document will continue to be updated and expanded, consistent with the notion of a “living document.” The ACR is committed to maintaining this process throughout the pandemic to facilitate evidence- based practice and promote optimal outcomes for all patients with RMDs and AIIRDs with respect to mitigating COVID- 19 risk.
ACKNOWLEDGMENTS
The task force would like to thank Dr. Kenneth Saag (UAB) for his initial review of the draft rating statements, Kaitlin Nichols (UAB) for her assistance in manuscript development, and Regina Parker (ACR) for her role in coordinating the activities of the Task Force.
AUTHOR CONTRIBUTIONS
All authors were involved in drafting the article or revising it critically for important intellectual content, and all authors approved the final version to be published. Dr. Curtis had full access to all of the data in the study and takes responsibility for the integrity of the data and the accuracy of the data analysis.Study conception and design. Curtis, Johnson, Anthony, Arasaratnam, Baden, Bass, Calabrese, Gravallese, Harpaz, Sadun, Turner, Williams, Mikuls.Acquisition of data. Curtis, Johnson, Anthony, Arasaratnam, Baden, Bass, Calabrese, Gravallese, Harpaz, Sadun, Turner, Williams, Mikuls.Analysis and interpretation of data. Curtis, Johnson, Anthony, Arasaratnam, Baden, Bass, Calabrese, Gravallese, Harpaz, Sadun, Turner, Williams, Mikuls.
REFERENCES 1. Van der Heijde D, Daikh DI, Betteridge N, Burmester GR, Hassett
AL, Matteson EL, et al. Common language description of theterm rheumatic and musculoskeletal diseases (RMDs) for use

ACR GUIDANCE FOR COVID- 19 VACCINATION IN RMD PATIENTS | 1105
in communication with the lay public, healthcare providers, and other stakeholders endorsed by the European League Against Rheumatism (EULAR) and the American College of Rheumatology (ACR). Arthritis Rheumatol 2018;70:826– 31.
2. Mikuls TR, Johnson SR, Fraenkel L, Arasaratnam RJ, Baden LR, Bermas BL, et al. American College of Rheumatology guid-ance for the management of rheumatic disease in adult patients during the COVID- 19 pandemic: version 3. Arthritis Rheumatol 2021;73:e1– 12.
3. US Food and Drug Administration. Vaccines and Related Biological Products Advisory Committee meeting: FDA briefing document Pfizer- BioNTech COVID- 19 vaccine. December 2020. URL: https://www.fda.gov/media/ 14424 5/download.
4. US Food and Drug Administration. Vaccines and Related Biological Products Advisory Committee meeting: FDA briefing document Moderna COVID- 19 vaccine. December 2020. URL: https://www.fda.gov/media/ 14443 4/download.
5. Singh JA, Furst DE, Bharat A, Curtis JR, Kavanaugh AF, Kremer JM, et al. 2012 update of the 2008 American College of Rheumatology recommendations for the use of disease- modifying antirheumatic drugs and biologic agents in the treatment of rheumatoid arthritis. Arthritis Care Res (Hoboken) 2012;64:625– 39.
6. Singh JA, Saag KG, Bridges SL Jr, Akl EA, Bannuru RR, Sullivan MC, et al. 2015 American College of Rheumatology guideline for the treat-ment of rheumatoid arthritis. Arthritis Rheumatol 2016;68:1– 26.
7. Fraenkel L, Bathon JM, England BR, St. Clair EW, Arayssi T, Carandang K, et al. 2021 American College of Rheumatology guide-line for the treatment of rheumatoid arthritis. Arthritis Rheumatol 2021 doi: http://onlinelibrary.wiley.com/doi/10.1002/art.41752/abstract. E-pub ahead of print.
8. Singh JA, Guyatt G, Ogdie A, Gladman DD, Deal C, Deodhar A, et al. 2018 American College of Rheumatology/National Psoriasis Foundation guideline for the treatment of psoriatic arthritis. Arthritis Rheumatol 2019;71:5– 32.
9. Furer V, Rondaan C, Heijstek MW, Agmon- Levin N, van Assen S, Bijl M, et al. 2019 update of EULAR recommendations for vaccination in adult patients with autoimmune inflammatory rheumatic diseases. Ann Rheum Dis 2020;79:39– 52.
10. Rondaan C, Furer V, Heijstek MW, Agmon- Levin N, Bijl M, Breedveld FC, et al. Efficacy, immunogenicity and safety of vaccination in adult patients with autoimmune inflammatory rheumatic diseases: a sys-tematic literature review for the 2019 update of EULAR recommen-dations. RMD Open 2019;5:e001035.
11. Van Assen S, Agmon- Levin N, Elkayam O, Cervera R, Doran MF, Dougados M, et al. EULAR recommendations for vaccination in adult patients with autoimmune inflammatory rheumatic diseases. Ann Rheum Dis 2011;70:414– 22.
12. Guyatt GH, Oxman AD, Kunz R, Woodcock J, Brozek J, Helfand M, et al. GRADE guidelines: 8. Rating the quality of evidence– indirectness. J Clin Epidemiol 2011;64:1303– 10.
13. American College of Rheumatology. American College of Rheu ma - tology Guidance Subcommittee and Endorsement of Guidance Doc u -ments, 2020. URL: https://www.rheumatology.org/Portals/0/Files/ ACR-Guidance- Subcommittee-Processes-Framework.pdf.
14. Fitch K, Bernstein SJ, Aguilar MD, Burnand B, LaCalle JR, Lazaro P, et al. The RAND/UCLA appropriateness method user’s manual. Santa Monica (CA): RAND; 2001.
15. American College of Rheumatology. COVID- 19 guidance. URL: https://www.rheum atolo gy.org/Pract ice- Quali ty/Clini cal- Suppo rt/COVID - 19- Guidance.
16. ModernaTX, sponsor. A study to evaluate the safety, reactogenicity, and effectiveness of mRNA- 1273 vaccine in adolescents 12 to <18 years old to prevent COVID- 19 (TeenCove). ClinicalTrials.gov identi-fier: NCT04649151.
17. BioNTech SE and Pfizer, sponsors. Study to describe the safety, tol-erability, immunogenicity, and efficacy of RNA vaccine candidates against COVID-19 in healthy individuals. ClinicalTrials.gov identifier: NCT04368728.
18. Rubin LG, Levin MJ, Ljungman P, Davies EG, Avery R, Tomblyn M, et al. 2013 IDSA clinical practice guideline for vaccination of the immunocompromised host. Clin Infect Dis 2014;58:e44– 100.
19. Rubin LG, Levin MJ, Ljungman P, Davies EG, Avery R, Tomblyn M, et al. 2013 IDSA clinical practice guideline for vaccination of the immunocompromised host. Clin Infect Dis 2014;58:309– 18.
20. Blumentals WA, Arreglado A, Napalkov P, Toovey S. Rheumatoid arthritis and the incidence of influenza and influenza- related com-plications: a retrospective cohort study. BMC Musculoskelet Disord 2012;13:158.
21. Van Assen S, Elkayam O, Agmon- Levin N, Cervera R, Doran MF, Dougados M, et al. Vaccination in adult patients with auto- immune inflammatory rheumatic diseases: a systematic literature review for the European League Against Rheumatism evidence- based recommendations for vaccination in adult patients with auto- immune inflammatory rheumatic diseases [review]. Autoimmun Rev 2011;10:341– 52.
22. Yun H, Yang S, Chen L, Xie F, Winthrop K, Baddley JW, et al. Risk of herpes zoster in autoimmune and inflammatory diseases: implica-tions for vaccination. Arthritis Rheumatol 2016;68:2328– 37.
23. Cordtz R, Lindhardsen J, Soussi BG, Vela J, Uhrenholt L, Westermann R, et al. Incidence and severeness of COVID- 19 hospitalisation in patients with inflammatory rheumatic disease: a nationwide cohort study from Denmark. Rheumatology (Oxford) 2020. E- pub ahead of print.
24. Williamson EJ, Walker AJ, Bhaskaran K, Bacon S, Bates C, Morton CE, et al. Factors associated with COVID- 19- related death using OpenSAFELY. Nature 2020;584:430– 6.
25. D’Silva KM, Jorge A, Cohen A, McCormick N, Zhang Y, Wallace ZS, et al. COVID- 19 outcomes in patients with systemic autoim-mune rheumatic diseases compared to the general population: a US multicenter, comparative cohort study. Arthritis Rheumatol 2021;73:914– 20.
26. Topless R, Phipps- Green A, Leask M, Dalbeth N, LK S, Robinson P, et al. Gout, rheumatoid arthritis and the risk of death from COVID- 19: an analysis of the UK Biobank. medRxiv 2021. E- pub ahead of print.
27. Eder L, Croxford R, Drucker A, Mendel A, Kuriya B, Touma Z, et al. COVID- 19 hospitalizations, ICU admission, and death among Ontario residents with immune mediated inflammatory diseases. J Rheumatol 2021. E- pub ahead of print.
28. Zhou F, Yu T, Du R, Fan G, Liu Y, Liu Z, et al. Clinical course and risk factors for mortality of adult inpatients with COVID- 19 in Wuhan, China: a retrospective cohort study. Lancet 2020;395:1054– 62.
29. Wu C, Chen X, Cai Y, Xia J, Zhou X, Xu S, et al. Risk factors associ-ated with acute respiratory distress syndrome and death in patients with coronavirus disease 2019 pneumonia in Wuhan, China. JAMA Intern Med 2020;180:934– 43.
30. Gianfrancesco MA, Leykina LA, Izadi Z, Taylor T, Sparks JA, Harrison C, et al. Association of race and ethnicity with COVID- 19 outcomes in rheumatic disease: data from the COVID- 19 Global Rheumatology Alliance physician registry. Arthritis Rheumatol 2021;73:374– 80.
31. Strangfeld A, Schäfer M, Gianfrancesco MA, Lawson- Tovey S, Liew JW, Ljung L, et al. Factors associated with COVID- 19- related death in people with rheumatic diseases: results from the COVID- 19 Global Rheumatology Alliance physician- reported registry. Ann Rheum Dis 2021. E- pub ahead of print.
32. Gianfrancesco M, Hyrich KL, Al- Adely S, Carmona L, Danila MI, Gossec L, et al. Characteristics associated with hospitalisation for COVID- 19 in people with rheumatic disease: data from the

CURTIS ET AL 1106 |
COVID- 19 Global Rheumatology Alliance physician- reported regis-try. Ann Rheum Dis 2020;79:859– 66.
33. Ungaro RC, Agrawal M, Park S, Hirten R, Colombel JF, Twyman K, et al. Autoimmune and chronic inflammatory disease patients with COVID- 19. ACR Open Rheumatol 2021;3:111– 5.
34. Choi B, Choudhary MC, Regan J, Sparks JA, Padera RF, Qiu X, et al. Persistence and evolution of SARS- CoV- 2 in an immunocom-promised host [letter]. N Engl J Med 2020;383:2291– 3.
35. Centers for Disease Control and Prevention. Vaccine recommendations and guidelines of the ACIP: COVID- 19 vaccine recommendations. March 2021. URL: https://www.cdc.gov/vacci nes/hcp/acip- recs/vacc- speci fic/covid - 19.html.
36. Centers for Disease Control and Prevention. Vaccines and immu-nizations: Interim considerations— preparing for the potential management of anaphylaxis after COVID- 19. vaccination. March 2021. URL: https://www.cdc.gov/vacci nes/covid - 19/clini cal- consi derat ions/manag ing- anaph ylaxis.html?CDC_AA_refVa l=https %3A%2F%2Fwww.cdc.gov%2Fvac cines %2Fcov id- 19%2Finf o- by- produ ct%2Fpfi zer%2Fana phyla xis- manag ement.html.
37. Yun H, Xie F, Baddley JW, Winthrop K, Saag KG, Curtis JR. Longterm effectiveness of herpes zoster vaccine among patients with auto-immune and inflammatory diseases. J Rheumatol 2017;44:1083– 7.
38. Park JK, Lee YJ, Shin K, Ha YJ, Lee EY, Song YW, et al. Impact of tem-porary methotrexate discontinuation for 2 weeks on immunogenicity of seasonal influenza vaccination in patients with rheumatoid arthritis: a randomised clinical trial. Ann Rheum Dis 2018;77:898– 904.
39. Van der Maas A, Lie E, Christensen R, Choy E, de Man YA, van Riel P, et al. Construct and criterion validity of several proposed DAS28- based rheumatoid arthritis flare criteria: an OMERACT cohort valida-tion study. Ann Rheum Dis 2013;72:1800– 5.
40. Park JK, Kim MJ, Choi Y, Winthrop K, Song YW, Lee EB. Effect of short- term methotrexate discontinuation on rheumatoid arthritis disease activity: post- hoc analysis of two randomized trials. Clin Rheumatol 2020;39:375– 9.
41. Park JK, Choi Y, Winthrop KL, Song YW, Lee EB. Optimal time between the last methotrexate administration and seasonal influ-enza vaccination in rheumatoid arthritis: post hoc analysis of a randomised clinical trial [letter]. Ann Rheum Dis 2019;78:1283– 4.
42. Park JK, Lee MA, Lee EY, Song YW, Choi Y, Winthrop KL, et al. Effect of methotrexate discontinuation on efficacy of seasonal influ-enza vaccination in patients with rheumatoid arthritis: a randomised clinical trial. Ann Rheum Dis 2017;76:1559– 65.
43. Oda R, Inagaki T, Ishikane M, Hotta M, Shimomura A, Sato M, et al. Case of adult large vessel vasculitis after SARS- CoV- 2 infection [let-ter]. Ann Rheum Dis 2020. E- pub ahead of print.
44. Perrot L, Hemon M, Busnel JM, Muis- Pistor O, Picard C, Zandotti C, et al. First flare of ACPA- positive rheumatoid arthritis after SARS- CoV- 2 infection. Lancet Rheumatol 2021;3:e6– 8.
45. Baden LR, Walsh SR, Seaman MS, Tucker RP, Krause KH, Patel A, et al. First- in- human evaluation of the safety and immunogenicity of a recombinant adenovirus serotype 26 HIV- 1 Env vaccine (IPCAVD 001). J Infect Dis 2013;207:240– 7.
46. Centers for Disease Control and Prevention. Vaccines and immuni-zations: interim clinical considerations for use of mRNA COVID- 19 vaccines currently authorized in the United States. March 2021. URL: https://www.cdc.gov/vacci nes/covid - 19/info- by- produ ct/clini cal- consi derat ions.html.
47. Elkayam O, Amir S, Mendelson E, Schwaber M, Grotto I, Wollman J, et al. Efficacy and safety of vaccination against pandemic 2009 influenza A (H1N1) virus among patients with rheumatic diseases. Arthritis Care Res (Hoboken) 2011;63:1062– 7.
48. Battafarano DF, Battafarano NJ, Larsen L, Dyer PD, Older SA, Muehlbauer S, et al. Antigen- specific antibody responses in lupus patients following immunization. Arthritis Rheum 1998;41:1828– 34.
49. Mok CC, Ho LY, Fong LS, To CH. Immunogenicity and safety of a quadrivalent human papillomavirus vaccine in patients with sys-temic lupus erythematosus: a case– control study. Ann Rheum Dis 2013;72:659– 64.
50. Bingham CO III, Rizzo W, Kivitz A, Hassanali A, Upmanyu R, Klearman M. Humoral immune response to vaccines in patients with rheumatoid arthritis treated with tocilizumab: results of a randomised controlled trial (VISARA). Ann Rheum Dis 2015;74:818– 22.
51. Mori S, Ueki Y, Akeda Y, Hirakata N, Oribe M, Shiohira Y, et al. Pneumococcal polysaccharide vaccination in rheumatoid arthritis patients receiving tocilizumab therapy. Ann Rheum Dis 2013;72:1362– 6.
52. Mori S, Ueki Y, Hirakata N, Oribe M, Hidaka T, Oishi K. Impact of tocilizumab therapy on antibody response to influenza vac-cine in patients with rheumatoid arthritis. Ann Rheum Dis 2012;71:2006– 10.
53. Sahin U, Muik A, Derhovanessian E, Vogler I, Kranz LM, Vormehr M, et al. COVID- 19 vaccine BNT162b1 elicits human antibody and TH1 T cell responses. Nature 2020;586:594– 9.
54. Tsuru T, Terao K, Murakami M, Matsutani T, Suzaki M, Amamoto T, et al. Immune response to influenza vaccine and pneumococcal poly saccharide vaccine under IL- 6 signal inhibition therapy with tocilizumab. Mod Rheumatol 2014;24:511– 6.
55. Migita K, Akeda Y, Akazawa M, Tohma S, Hirano F, Ideguchi H, et al. Pneumococcal polysaccharide vaccination in rheumatoid arthritis patients receiving tacrolimus. Arthritis Res Ther 2015;17:149.
56. Doornekamp L, Goetgebuer RL, Schmitz KS, Goeijenbier M, van der Woude CJ, Fouchier R, et al. High immunogenicity to influenza vacci-nation in Crohn’s disease patients treated with ustekinumab. Vaccines (Basel) 2020;8:455.
57. Furer V, Rondaan C, Heijstek M, van Assen S, Bijl M, Agmon- Levin N, et al. Incidence and prevalence of vaccine preventable infections in adult patients with autoimmune inflammatory rheumatic diseases (AIIRD): a systemic literature review informing the 2019 update of the EULAR recommendations for vaccination in adult patients with AIIRD. RMD Open 2019;5:e001041.
58. Furer V, Zisman D, Kaufman I, Arad U, Berman M, Sarbagil- Maman H, et al. Immunogenicity and safety of vaccination against seasonal influenza vaccine in patients with psoriatic arthritis treated with secukinumab. Vaccine 2020;38:847– 51.
59. Richi P, Martín MD, de Ory F, Gutiérrez- Larraya R, Casas I, Jiménez- Díaz AM, et al. Secukinumab does not impair the immunogenic response to the influenza vaccine in patients. RMD Open 2019;5:e001018.
60. Bar- Or A, Calkwood JC, Chognot C, Evershed J, Fox EJ, Herman A, et al. Effect of ocrelizumab on vaccine responses in patients with mul-tiple sclerosis: the VELOCE study. Neurology 2020;95:e1999– 2008.
61. Nazi I, Kelton JG, Larche M, Snider DP, Heddle NM, Crowther MA, et al. The effect of rituximab on vaccine responses in patients with immune thrombocytopenia. Blood 2013;122:1946– 53.
62. Houot R, Levy R, Cartron G, Armand P. Could anti- CD20 therapy jeopardise the efficacy of a SARS- CoV- 2 vaccine? Eur J Cancer 2020;136:4– 6.
63. Baker D, Roberts CA, Pryce G, Kang AS, Marta M, Reyes S, et al. COVID- 19 vaccine- readiness for anti- CD20- depleting ther-apy in autoimmune diseases [review]. Clin Exp Immunol 2020;202: 149– 61.
64. Hua C, Barnetche T, Combe B, Morel J. Effect of methotrexate, anti– tumor necrosis factor α, and rituximab on the immune response to influenza and pneumococcal vaccines in patients with rheumatoid arthritis: a systematic review and meta- analysis. Arthritis Care Res (Hoboken) 2014;66:1016– 26.
65. Van Assen S, Holvast A, Benne CA, Posthumus MD, van Leeuwen MA, Voskuyl AE, et al. Humoral responses after influenza vaccination are severely reduced in patients with rheumatoid arthritis treated with rituximab. Arthritis Rheum 2010;62:75– 81.

ACR GUIDANCE FOR COVID- 19 VACCINATION IN RMD PATIENTS | 1107
66. Aikawa NE, Campos LM, Silva CA, Carvalho JF, Saad CG, TrudesG, et al. Glucocorticoid: major factor for reduced immunogenicityof 2009 influenza A (H1N1) vaccine in patients with juvenile auto-immune rheumatic disease. J Rheumatol 2012;39:167– 73.
67. Kim EY, Lim JE, Jung JY, Son JY, Lee KJ, Yoon YW, et al. Performance of the tuberculin skin test and interferon- γ release assay for detection of tuberculosis infection in immunocompromised patients in a BCG- vaccinated population. BMC Infect Dis 2009;9:207.
68. Nagel J, Saxne T, Geborek P, Bengtsson AA, Jacobsen S,Joergensen CS, et al. Treatment with belimumab in systemic lupuserythematosus does not impair antibody response to 13- valentpneumococcal conjugate vaccine. Lupus 2017;26:1072– 81.
69. Subesinghe S, Bechman K, Rutherford AI, Goldblatt D, GallowayJB. A systematic review and metaanalysis of antirheumatic drugsand vaccine immunogenicity in rheumatoid arthritis. J Rheumatol2018;45:733– 44.
70. Adler S, Krivine A, Weix J, Rozenberg F, Launay O, Huesler J, et al.Protective effect of A/H1N1 vaccination in immune- mediated dis-ease— a prospectively controlled vaccination study. Rheumatology(Oxford) 2011;51:695– 700.
71. Ribeiro AC, Laurindo IM, Guedes LK, Saad CG, Moraes JC, SilvaCA, et al. Abatacept and reduced immune response to pandemic2009 influenza A/H1N1 vaccination in patients with rheumatoidarthritis. Arthritis Care Res (Hoboken) 2013;65:476– 80.
72. Kapetanovic MC, Nagel J, Nordstrom I, Saxne T, Geborek P, RudinA. Methotrexate reduces vaccine- specific immunoglobulin levels butnot numbers of circulating antibody- producing B cells in rheumatoidarthritis after vaccination with a conjugate pneumococcal vaccine.Vaccine 2017;35:903– 8.
73. Kapetanovic MC, Roseman C, Jönsson G, Truedsson L, SaxneT, Geborek P. Antibody response is reduced following vacci-nation with 7- valent conjugate pneumococcal vaccine in adultmethotrexate- treated patients with established arthritis, but notthose treated with tumor necrosis factor inhibitors. Arthritis Rheum2011;63:3723– 32.
74. Winthrop KL, Silverfield J, Racewicz A, Neal J, Lee EB,Hrycaj P, et al. The effect of tofacitinib on pneumococcal and
influenza vaccine responses in rheumatoid arthritis. Ann Rheum Dis 2016;75:687– 95.
75. Winthrop KL, Bingham CO III, Komocsar WJ, Bradley J, Issa M, KlarR, et al. Evaluation of pneumococcal and tetanus vaccine responses in patients with rheumatoid arthritis receiving baricitinib: results froma long- term extension trial substudy. Arthritis Res Ther 2019;21:102.
76. Galbraith MD, Kinning KT, Sullivan KD, Baxter R, Araya P, JordanKR, et al. Seroconversion stages COVID19 into distinct pathophysi-ological states. medRxiv 2020. E- pub ahead of print.
77. Alten R, Bingham CO III, Cohen SB, Curtis JR, Kelly S, Wong D,et al. Antibody response to pneumococcal and influenza vaccina-tion in patients with rheumatoid arthritis receiving abatacept. BMCMusculoskelet Disord 2016;17:231.
78. Kapetanovic MC, Kristensen LE, Saxne T, Aktas T, Mörner A,Geborek P. Impact of anti- rheumatic treatment on immunogenicity of pandemic H1N1 influenza vaccine in patients with arthritis. ArthritisRes Ther 2014;16:R2.
79. Migita K, Akeda Y, Akazawa M, Tohma S, Hirano F, Ideguchi H, et al.Effect of abatacept on the immunogenicity of 23- valent pneumo-coccal polysaccharide vaccination (PPSV23) in rheumatoid arthritispatients. Arthritis Res Ther 2015;17:357.
80. Bingham CO III, Looney RJ, Deodhar A, Halsey N, Greenwald M,Codding C, et al. Immunization responses in rheumatoid arthritispatients treated with rituximab: results from a controlled clinical trial.Arthritis Rheum 2010;62:64– 74.
81. Westra J, van Assen S, Wilting KR, Land J, Horst G, de Haan A,et al. Rituximab impairs immunoglobulin (Ig)M and IgG (subclass)responses after influenza vaccination in rheumatoid arthritis patients. Clin Exp Immunol 2014;178:40– 7.
82. Rehnberg M, Brisslert M, Amu S, Zendjanchi K, Håwi G, BokarewaMI. Vaccination response to protein and carbohydrate antigens inpatients with rheumatoid arthritis after rituximab treatment. ArthritisRes Ther 2010;12:R111.
83. Arad U, Tzadok S, Amir S, Mandelboim M, Mendelson E, Wigler I,et al. The cellular immune response to influenza vaccination is pre-served in rheumatoid arthritis patients treated with rituximab. Vaccine2011; 29:1643– 8.

1108
Arthritis & RheumatologyVol. 73, No. 7, July 2021, pp 1108–1123DOI 10.1002/art.41752© 2021, American College of Rheumatology
2021 American College of Rheumatology Guideline for the Treatment of Rheumatoid ArthritisLiana Fraenkel,1 Joan M. Bathon,2 Bryant R. England,3 E. William St. Clair,4 Thurayya Arayssi,5 Kristine Carandang,6 Kevin D. Deane,7 Mark Genovese,8 Kent Kwas Huston,9 Gail Kerr,10 Joel Kremer,11
Mary C. Nakamura,12 Linda A. Russell,13 Jasvinder A. Singh,14 Benjamin J. Smith,15 Jeffrey A. Sparks,16 Shilpa Venkatachalam,17 Michael E. Weinblatt,16 Mounir Al- Gibbawi,18 Joshua F. Baker,19 Kamil E. Barbour,20 Jennifer L. Barton,21 Laura Cappelli,22 Fatimah Chamseddine,18 Michael George,23 Sindhu R. Johnson,24 Lara Kahale,18 Basil S. Karam,18 Assem M. Khamis,18 Iris Navarro- Millán,25 Reza Mirza,26 Pascale Schwab,21 Namrata Singh,27 Marat Turgunbaev,28 Amy S. Turner,28 Sally Yaacoub,18 and Elie A. Akl18
Objective. To develop updated guidelines for the pharmacologic management of rheumatoid arthritis.Methods. We developed clinically relevant population, intervention, comparator, and outcomes (PICO)
questions. After conducting a systematic literature review, the Grading of Recommendations Assessment, Development and Evaluation (GRADE) approach was used to rate the certainty of evidence. A voting panel comprising clinicians and patients achieved consensus on the direction (for or against) and strength (strong or conditional) of recommendations.
Results. The guideline addresses treatment with disease- modifying antirheumatic drugs (DMARDs), including conventional synthetic DMARDs, biologic DMARDs, and targeted synthetic DMARDs, use of glucocorticoids, and use of DMARDs in certain high- risk populations (i.e., those with liver disease, heart failure, lymphoproliferative disorders, previous serious infections, and nontuberculous mycobacterial lung disease). The guideline includes 44 recommendations (7 strong and 37 conditional).
Conclusion. This clinical practice guideline is intended to serve as a tool to support clinician and patient decision- making. Recommendations are not prescriptive, and individual treatment decisions should be made through a shared decision- making process based on patients’ values, goals, preferences, and comorbidities.
The findings and conclusions herein are those of the authors and do not represent the official position of the Centers for Disease Control and Prevention. This study did not involve human subjects, and therefore, approval from Human Studies Committees was not required.
This article is published simultaneously in Arthritis Care & Research.
Supported by the American College of Rheumatology.1Liana Fraenkel, MD, MPH: Berkshire Medical Center, Pittsfield, Massa -
chusetts, and Yale University School of Medicine, New Haven, Connecticut; 2Joan M. Bathon, MD: Columbia University Irving Medical Center, New York Presbyterian Hospital, New York, New York; 3Bryant R. England, MD, PhD:
Guidelines and recommendations developed and/or endorsed by the American College of Rheumatology (ACR) are intended to provide general guidance for commonly encountered clinical scenarios. The recommendations do not dictate the care for an indi-vidual patient. The ACR considers adherence to the recommendations described in this guideline to be voluntary, with the ultimate determination regarding their application to be made by the clinicians in light of each patient’s individual circumstances. Guidelines and recommendations are intended to promote beneficial or desirable outcomes but cannot guarantee any specific outcome. Guidelines and recommendations developed and endorsed by the ACR are subject to periodic revision as warranted by the evo-lution of medical knowledge, technology, and practice. ACR recommendations are not intended to dictate payment or insurance decisions, or drug formularies or other third- party analyses. Third parties that cite ACR guidelines should state that these recom-mendations are not meant for this purpose. These recommendations cannot adequately convey all uncertainties and nuances of patient care.The American College of Rheumatology is an independent, professional, medical and scientific society that does not guarantee, warrant, or endorse any commercial product or service.

ACR GUIDELINE FOR TREATMENT OF RA | 1109
INTRODUCTION
To support high- quality clinical care, the American College of Rheumatology (ACR) regularly updates clinical practice guidelines for the management of rheumatoid arthritis (RA), with the most recent update reported in 2015 (1). The current recommendations address treatment with the following: 1) conventional synthetic disease- modifying antirheumatic drugs (csDMARDs), biologic DMARDs (bDMARDs), and targeted synthetic DMARDs (tsDMARDs); 2) glu-cocorticoids; and 3) use of these medications in certain high- risk populations. The use of vaccines and nonpharmacologic treatment approaches (although initially part of this project) will be covered in future ACR treatment guideline publications. For recommendations regard-ing pretreatment screening and routine laboratory monitoring, we refer readers to the 2008, 2012, and 2015 guidelines (1– 3), with newly approved therapies following the screening process recommended for other medications in the same class. Recommendations for the perioperative management of patients undergoing elective orthopedic surgery are addressed in the 2017 guideline for perioperative manage-ment (4). For recommendations regarding reproductive health, we refer readers to the 2020 ACR Guideline for the Management of Reproduc-tive Health in Rheumatic and Musculoskeletal Diseases (5).
In keeping with the Grading of Recommendations Assess-ment, Development and Evaluation [GRADE] methodology), the
ACR panel developed recommendations for commonly encoun-tered clinical scenarios (6– 8). Both strong and conditional rec-ommendations required achieving a 70% level of agreement by the voting panel. Each recommendation is qualified as being strong or conditional. In this context, strong recommendations are those for which the panel is highly confident that the recommended option favorably balances the expected benefits and risks for the major-ity of patients in clinical practice. In contrast, conditional recom-mendations are those for which the panel is less confident that the potential benefits outweigh the risks. A recommendation can be conditional either because of low or very low certainty in the evidence supporting one option over another, or because of an expectation of substantial variations in patient preferences for the options under consideration.
METHODS
This guideline follows the ACR guideline development pro-cess and ACR policy guiding the management of conflicts of interest and disclosures (https://www.rheum atolo gy.org/Pract ice- Quali ty/Clini cal- Suppo rt/Clini cal- Pract ice- Guide lines) (6,8), which includes GRADE methodology (6,8), and abides by the AGREE Reporting Checklist to ensure the completeness and transparency of reporting in practice guidelines (9). Supplementary Appendix 1,
University of Nebraska Medical Center and VA Nebraska– Western Iowa Health Care System, Omaha, Nebraska; 4E. William St. Clair, MD: Duke University Medical Center, Durham, North Carolina; 5Thurayya Arayssi, MD: Weill Cornell Medicine– Qatar, Doha, Qatar; 6Kristine Carandang, PhD, OTR/L: University of California, San Diego; 7Kevin D. Deane, MD, PhD: University of Colorado, Aurora; 8Mark Genovese, MD: Stanford University Medical Center, Palo Alto, California; 9Kent Kwas Huston, MD: The Center for Rheumatic Disease/Allergy and Immunology, Kansas City, Missouri; 10Gail Kerr, MD, FRCP (Edin): Veterans Affairs Medical Center, Georgetown and Howard University, Washington, DC; 11Joel Kremer, MD: Albany Medical College and The Center for Rheumatology, Albany, New York; 12Mary C. Nakamura, MD: University of California, San Francisco; 13Linda A. Russell, MD: Hospital for Special Surgery, New York, New York; 14Jasvinder A. Singh, MD, MPH: University of Alabama at Birmingham and Birmingham Veterans Affairs Medical Center, Birmingham, Alabama; 15Benjamin J. Smith, DMSc, PA- C: Florida State University College of Medicine School of Physician Assistant Practice, Tallahassee; 16Jeffrey A. Sparks, MD, MMSc, Michael E. Weinblatt, MD: Brigham and Women’s Hospital and Harvard Medical School, Boston, Massachusetts; 17Shilpa Venkatachalam, PhD: Global Healthy Living Foundation, Upper Nyack, New York; 18Mounir Al- Gibbawi, MD, Fatimah Chamseddine, MD, Lara Kahale, RN, MSc, PhD, Basil S. Karam, MD, Assem M. Khamis, MD, MPH, Sally Yaacoub, RPh, MPH, Elie A. Akl, MD, MPH, PhD: American University of Beirut, Beirut, Lebanon; 19Joshua F. Baker, MD, MSCE: Corporal Michael J. Crescenz VA Medical Center and the University of Pennsylvania, Philadelphia, Pennsylvania; 20Kamil E. Barbour, PhD, MPH, MS: Centers for Disease Control and Prevention, Atlanta, Georgia; 21Jennifer L. Barton, MD, MCR, Pascale Schwab, MD: Oregon Health & Science University and VA Portland Health Care System, Portland, Oregon; 22Laura Cappelli, MD, MHS, MS: Johns Hopkins Medicine, Baltimore, Maryland; 23Michael George, MD, MSCE: University of Pennsylvania, Philadelphia; 24Sindhu R. Johnson, MD, PhD, FRCPC: Toronto Western Hospital, Mount Sinai Hospital, Institute of Health Policy, Management and Evaluation, University of Toronto, Toronto, Ontario, Canada; 25Iris Navarro- Millán, MD, MSPH: Weill Cornell Medicine, New York, New York; 26Reza Mirza, MD: University of Toronto, Toronto, Ontario, Canada; 27Namrata Singh, MD, MSCI, FACP: University of Washington, Seattle; 28Marat Turgunbaev, MD, MPH, Amy S. Turner: American College of Rheumatology, Atlanta, Georgia.
Dr. Bathon has received consulting fees, speaking fees, and/or honoraria from Gilead Biosciences (less than $10,000). Dr. St. Clair has received consulting fees, speaking fees, and/or honoraria from Bristol Myers Squibb
(less than $10,000) and royalties from UpToDate. Dr. Deane has received consulting fees, speaking fees, and/or honoraria from Bristol Myers Squibb, Inova Diagnostics, Janssen, and Microdrop (less than $10,000 each). Dr. Genovese has received consulting fees, speaking fees, and/or honoraria from AbbVie, Amgen, BeiGene, Eli Lilly and Company, GlaxoSmithKline, Pfizer, Sanofi, R- Pharm, and SetPoint Medical (less than $10,000 each) and owns stock or stock options in Gilead Sciences. Dr. Huston has received consulting fees and/or honoraria from Trio Health Advisory (less than $10,000). Dr. Kerr has received consulting fees, speaking fees, and/or honoraria from Jansen, Sanofi, and Genzyme (less than $10,000 each). Dr. Kremer has received consulting fees, speaking fees, and/or honoraria from AbbVie, Bristol Myers Squibb, Gilead, Eli Lilly and Company, and Pfizer (less than $10,000 each) and owns stock or stock options in Corrona. Dr. Singh has received consulting fees, speaking fees, and/or honoraria from MediSYS, Fidia Pharma, UBM, Trio Health, Medscape, WebMD, Clinical Care Options, Clearview Healthcare Partners, Putnam Associates, Focus Forward, Navigant Consulting, Spherix, Practice Point Communications (less than $10,000 each), and Simply Speaking (more than $10,000) and owns stock or stock options in Vaxart Pharmaceuticals. Dr. Weinblatt has received consulting fees, speaking fees, and/or honoraria from AbbVie, Amgen, Canfite, Crescendo, GlaxoSmithKline, Horizon, Johnson & Johnson, Genentech/Roche, Scipher, SetPoint, Tremeau (less than $10,000 each), Eli Lilly and Company, Bristol Myers Squibb, Gilead, and Corrona (more than $10,000 each), royalties from Elsevier, and owns stock or stock options in Canfite, Scipher, Inmedix, and Vorso. Dr. Baker has received consulting fees, speaking fees, and/or honoraria from Bristol Myers Squibb, Gilead, Burns-White, and Simply Speaking Rheumatology (less than $10,000 each). Dr. Cappelli has received consulting fees, speaking fees, and/or honoraria from AbbVie (less than $10,000) and research support from Bristol Myers Squibb. Dr. George has received honoraria from Paradigm Medical Communications (less than $10,000) and research support from Bristol Myers Squibb. Dr. Johnson has received consulting fees and/or honoraria from Boehringer Ingelheim and Ikaria (less than $10,000 each) and research support from GlaxoSmithKline, Corbus, Roche, Merck, Boehringer Ingelheim, and Bayer. No other disclosures relevant to this article were reported.
Address correspondence to Liana Fraenkel, MD, MPH, 725 North Street, Pittsfield, MA 01201. Email: [email protected].
Submitted for publication September 8, 2020; accepted in revised form March 15, 2021.

FRAENKEL ET AL 1110 |
available on the Arthritis & Rheumatology website at http://onlin e libr ary.wiley.com/doi/10.1002/art.41752/ abstract), includes a detailed description of the methods. Briefly, the core leadership team drafted clinical population, intervention, comparator, and outcomes (PICO) questions. The literature review team performed systematic literature reviews for the PICO questions, selected and evaluated individual studies and graded the quality of the body of evidence available for each outcome, and produced the evidence report that summarizes these assessments (see Supplementary Appendix 2, available on the Arthritis & Rheumatology website at http://onlin elibr ary.wiley.com/doi/10.1002/art.41752/ abstract). The core team defined the critical study outcome as disease activity for most PICO questions. Because the ACR has, in a sep-arate project, endorsed several disease activity measures for use in clinical practice, this guideline does not define levels of disease activity or the instruments a clinician should use to measure it (10). For PICO questions related to tapering, the critical outcomes were disease flare and subsequent return to the treatment target. Phys-ical function, radiographic progression, quality of life, other patient- reported outcome measures, and adverse events were defined as important outcomes. Additional clinical outcomes were defined for PICO questions pertaining to select high- risk conditions (see Sup-plementary Appendix C, available on the Arthritis & Rheumatology website at http://onlin elibr ary.wiley.com/doi/10.1002/art.41752/ abstract). When available, cost- effectiveness studies were included with the evidence reports. Cost estimates (average wholesale prices) were retrieved from Lexicomp (see Supplementary Appendix D, available on the Arthritis & Rheumatology website at http://onlin e libr ary.wiley.com/doi/10.1002/art.41752/ abstract). The panel con-sidered these estimates from a societal perspective, i.e., based on the list price, and not the copay.
An in- person panel of 10 patients with RA, moderated by the project’s principal investigator, reviewed the evidence report (along with a summary and interpretation by the moderator) and pro-vided patient perspectives for consideration by the voting panel. The voting panel (13 clinicians and 2 patients) reviewed the evi-dence reports and patient perspectives and voted on recommen-dation statements. Rosters of the core leadership, literature review team, and panel members are listed in Supplementary Appen-dix E, available on the Arthritis & Rheumatology website at http://onlin elibr ary.wiley.com/doi/10.1002/art.41752/ abstract.
Several guiding principles, definitions, and assumptions were established a priori (Table 1). Because poor prognostic factors (11) have had less impact than other factors on prior RA treatment rec-ommendations, they were not explicitly considered in formulating the PICO questions. However, poor prognostic factors were con-sidered as possible influential factors in physicians’ and patients’ decision- making when developing recommendations. In contrast to the 2015 guideline (1), recommendations were not provided for subgroups defined by early versus late RA disease duration. This change was made because current disease activity, prior therapies used, and the presence of comorbidities were felt to
be more relevant than disease duration for most treatment deci-sions. However, early diagnosis and treatment in RA is associated with improved outcomes and is thus an important overarching principle in its management (12). Recommendations are intended for the general RA patient population and assume that patients do not have contraindications to the options under consideration.
RESULTS/RECOMMENDATIONS
The recommendations are based on a set of 81 PICO ques-tions. The literature review initially identified 22,971 manuscripts (for the full set of PICO questions covering both pharmacologic and nonpharmacologic treatment). After excluding 18,333 titles
Table 1. Guiding principles*RA requires early evaluation, diagnosis, and management.Treatment decisions should follow a shared decision- making
process.Treatment decisions should be reevaluated within a minimum of
3 months based on efficacy and tolerability of the DMARD(s) chosen.
Disease activity levels refer to those calculated using RA disease activity measures endorsed by the ACR (10).
Recommendations are intended for the general RA patient population and assume that patients do not have contraindications to the options under consideration.
Recommendations are limited to DMARDs approved by the US FDA for treatment of RA.
csDMARDs: hydroxychloroquine, sulfasalazine, methotrexate, leflunomide
bDMARDs: TNF inhibitors (etanercept, adalimumab, infliximab, golimumab, certolizumab pegol), T cell costimulatory inhibitor (abatacept), IL- 6 receptor inhibitors (tocilizumab, sarilumab), anti- CD20 antibody (rituximab)†
tsDMARDs: JAK inhibitors (tofacitinib, baricitinib, upadacitinib)Triple therapy refers to hydroxychloroquine, sulfasalazine, and
either methotrexate or leflunomide.Serious infection refers to an infection requiring intravenous
antibiotics or hospitalization.Biosimilars are considered equivalent to FDA- approved originator
bDMARDs.Recommendations referring to bDMARDs exclude rituximab
unless patients have had an inadequate response to TNF inhibitors (in order to be consistent with FDA approval) or have a history of lymphoproliferative disorder for which rituximab is an approved therapy.
Treat- to- target refers to a systematic approach involving frequent monitoring of disease activity using validated instruments and modification of treatment to minimize disease activity with the goal of reaching a predefined target (low disease activity or remission).
Target refers to low disease activity or remission.Recommendations specify that patients be at target (low disease
activity or remission) for at least 6 months prior to tapering.Dose reduction refers to lowering the dose or increasing the
dosing interval of a DMARD. Gradual discontinuation of a DMARD is defined as gradually lowering the dose of a DMARD and subsequently stopping it.
* RA = rheumatoid arthritis; DMARDs = disease- modifying anti -rheumatic drugs; ACR = American College of Rheumatology; FDA = Food and Drug Administration; csDMARDs = conventional DMARDs; bDMARDs = biologic DMARDs; TNF = tumor necrosis factor; IL- 6 = interleukin- 6; tsDMARDs = targeted synthetic DMARDs. † Anakinra was not included due to infrequent use for patients with RA.

ACR GUIDELINE FOR TREATMENT OF RA | 1111
and abstracts, 4,038 full- text articles were screened, of which 1,392 were excluded and 2,646 were considered for the evidence report. After full- text screening, 133 manuscripts were mapped to ≥1 PICO questions addressing pharmacologic treatment (see Sup-plementary Appendix F, available on the Arthritis & Rheumatology website at http://onlin elibr ary.wiley.com/doi/10.1002/art.41752/ abstract). The literature review did not identify any evidence for 41% (n = 33) of the PICO questions.
Recommendations for DMARD- naive patients with moderate- to- high disease activity (Table 2)
DMARD monotherapy
Methotrexate is strongly recommended over hydroxychloroquine or sulfasalazine for DMARD- naive patients with moderate- to- high disease activity
This recommendation is strongly in favor of methotrexate despite very low- certainty evidence for hydroxychloroquine and
low- certainty evidence for sulfasalazine based on the amount of data supporting the disease- modifying properties of methotrex-ate monotherapy compared to hydroxychloroquine or sulfasalazine and concerns over the long- term tolerability of sulfasalazine (13,14).
Methotrexate is conditionally recommended over leflunomide for DMARD- naive patients with moderate- to- high disease activity
Despite low- certainty evidence of comparable efficacy, methotrex-ate is preferred over leflunomide because of the evidence supporting its value as an anchor DMARD in combination regimens. Additional advan-tages of methotrexate include its greater dosing flexibility and lower cost.
Methotrexate monotherapy is strongly recommended over bDMARD or tsDMARD monotherapy for DMARD- naive patients with moderate- to- high disease activity
There is low- certainty evidence suggesting superiority of tocilizumab monotherapy (15) over methotrexate monotherapy and moderate- certainty evidence suggesting greater efficacy
Table 2. Disease- modifying antirheumatic drugs (DMARDs) initiation*
RecommendationsCertainty of
evidence
Based on the evidence report(s) of the
following PICO(s)†
Evidence table(s), in
Supp. App. 2Initiation of treatment in DMARD- naive patients with moderate- to- high
disease activityMethotrexate monotherapy is strongly recommended over:
Hydroxychloroquine or sulfasalazine Very low/low‡ PICO 2a.C1/C2 p. 14– 5bDMARD or tsDMARD monotherapy Very low/moderate PICO 5a.C1– 4/C5§ p. 61– 78Combination of methotrexate plus a non– TNF inhibitor bDMARD or
tsDMARD¶Low/very low PICO 6a.C2– 4/C5§ p. 109, 117– 28
Methotrexate monotherapy is conditionally recommended over:Leflunomide Low PICO 2a.C3 p. 18Dual or triple csDMARD therapy¶ Moderate PICO 4a.C1– C2 p. 46– 9Combination of methotrexate plus a TNF inhibitor¶ Low PICO 6a.C1 p. 110
Initiation of a csDMARD without short- term (<3 months) glucocorticoids is conditionally recommended over initiation of a csDMARD with short- term glucocorticoids.
Very low PICO 7a p. 167
Initiation of a csDMARD without longer- term (≥3 months) glucocorticoids is strongly recommended over initiation of a csDMARD with longer- term glucocorticoids.
Moderate PICO 8a p. 170
Initiation of treatment in DMARD- naive patients with low disease activityHydroxychloroquine is conditionally recommended over other csDMARDs. Very low PICO 1a.C1– 4 p. 1– 6Sulfasalazine is conditionally recommended over methotrexate. Very low PICO 1a.C2 p. 2Methotrexate is conditionally recommended over leflunomide. Very low PICO 1a.C3 p. 5
Initiation of treatment in csDMARD- treated, but methotrexate- naive, patients with moderate- to- high disease activity#
Methotrexate monotherapy is conditionally recommended over the combination of methotrexate plus a bDMARD or tsDMARD.**
Moderate/very low PICO 6b.C1– 4/C5§ p. 136– 56
* PICO = population, intervention, comparator, and outcomes; Supp. App. 2 = Supplementary Appendix 2, available on the Arthritis & Rheumatology website at http://onlin elibr ary.wiley.com/doi/10.1002/art.41752/ abstract; bDMARD = biologic DMARD; tsDMARD = targeted synthetic DMARD; TNF = tumor necrosis factor; csDMARD = conventional synthetic DMARD. † The closest matching PICO questions to each recommendation are provided. ‡ The first certainty of evidence applies to the first listed option; the second certainty of evidence applies to the second listed option. § The original PICO included individual DMARDs as comparators. The recommendation considers bDMARDs as a group. ¶ The direction of the beneficial effect is in favor of the nonpreferred option. # Other recommendations for this patient population are the same as those for DMARD- naive patients. ** The direction of the beneficial effect is in favor of the nonpreferred option. The certainty of evidence is high for the combination of methotrexate plus a TNF inhibitor and moderate for other bDMARDs.

FRAENKEL ET AL 1112 |
of JAK inhibitor monotherapy over methotrexate monotherapy. The study by van Vollenhoven et al (16) was not considered by the voting panel as it was published after the evidence report was updated. However, methotrexate monotherapy is preferred because of its established efficacy and safety as a first- line DMARD and low cost. Moreover, tocilizumab and JAK inhibitors are not approved by the US Food and Drug Administration (FDA) for use in csDMARD- naive patients. Safety concerns released in early 2021 associated with JAK inhibitors (17,18) further support the recommendation of methotrexate monotherapy over tsD-MARDs as initial DMARD therapy at this time.
Methotrexate monotherapy is conditionally recommended over dual or triple csDMARD therapy for DMARD- naive patients with moderate- to- high disease activity
The recommendation favors methotrexate monotherapy because the higher burden of combination therapy (e.g., multi-ple medications, higher cost) outweighs the moderate- quality evidence suggesting greater improvements in disease activity associated with combination csDMARDs (19). The recommenda-tion is conditional because some patients may choose csDMARD combination therapy for an increased probability of obtaining a better response despite the added burden of taking multi-ple medications.
Methotrexate monotherapy is conditionally recommended over methotrexate plus a tumor necrosis factor (TNF) inhibitor for DMARD- naive patients with moderate- to- high disease activity
Despite low- certainty evidence supporting greater improve-ment in disease activity with methotrexate plus a TNF inhibi-tor, methotrexate monotherapy is preferred over the combination because many patients will reach their goal on methotrexate mon-otherapy and the additional risks of toxicity and higher costs asso-ciated with TNF inhibitors. The recommendation is conditional because some patients, especially those with poor prognostic factors, may prioritize more rapid onset of action and greater chance of improvement associated with combination therapy (20– 22) over the additional risks and costs associated with initial useof methotrexate in combination with a TNF inhibitor.
Methotrexate monotherapy is strongly recommended over methotrexate plus a non– TNF inhibitor bDMARD or tsDMARD for DMARD- naive patients with moderate- to- high disease activity
There is very low- certainty evidence supporting the supe-riority of methotrexate plus a non– TNF inhibitor bDMARD or tsDMARD over methotrexate monotherapy in DMARD- naive
patients; thus, methotrexate monotherapy is strongly preferred given the lack of proven benefit and additional risks and costs associated with the addition of a non– TNF inhibitor bDMARD or tsDMARD in this patient population.
Glucocorticoids
Initiation of a csDMARD without short- term (<3 months) glucocorticoids is conditionally recommended over initiation of a csDMARD with short- term glucocorticoids for DMARD- naive patients with moderate- to- high disease activity
While the voting panel agreed that glucocorticoids should not be systematically prescribed, the recommendation is conditional because all members acknowledged that short- term glucocor-ticoids are frequently necessary to alleviate symptoms prior to the onset of action of DMARDs. Treatment with glucocorticoids should be limited to the lowest effective dose for the shortest duration possible. The toxicity associated with glucocorticoids was judged to outweigh potential benefits.
Initiation of a csDMARD without longer- term (≥3 months) glucocorticoids is strongly recommended over initiation of a csDMARD with longer- term glucocorticoids for DMARD- naive patients with moderate- to- high disease activity
Although some patients may require longer- term glucocorti-coids, this strong recommendation against longer- term glucocor-ticoid therapy is made because of its significant toxicity.
Recommendations for DMARD- naive patients with low disease activity (Table 2)
Hydroxychloroquine is conditionally recommended over other csDMARDs, sulfasalazine is conditionally recommended over methotrexate, and methotrexate is conditionally recommended over leflunomide for DMARD- naive patients with low disease activity
Hydroxychloroquine is conditionally recommended over other csDMARDs because it is better tolerated and has a more favora-ble risk profile in patients with RA. Sulfasalazine is recommended over methotrexate because it is less immunosuppressive, and the patient panel felt that many patients with low disease activity would prefer to avoid the side effects associated with methotrexate. The recommendations are conditional because methotrexate may be the preferred initial therapy in patients at the higher end of the low disease activity range and in those with poor prognostic factors (11). Methotrexate is recommended over leflunomide because of its greater dosing flexibility and lower cost.

ACR GUIDELINE FOR TREATMENT OF RA | 1113
Recommendation for patients who have been treated with csDMARDs, excluding methotrexate, and who have moderate- to- high disease activity (Table 2)
Recommendations are the same as for DMARD- naive patients except for this population. The strength of the following recommendation is conditional for all bDMARDs and tsDMARDs.
Methotrexate monotherapy is conditionally recommended over the combination of methotrexate plus a bDMARD or tsDMARD
The recommendation is conditional because the voting panel thought that some patients who have already had persistent dis-ease activity despite use of ≥1 csDMARD will prefer combination treatment for a more rapid response.
Recommendations for administration of methotrexate (Table 3)
Oral methotrexate is conditionally recommended over subcutaneous methotrexate for patients initiating methotrexate
Oral administration is preferred, despite moderate evidence suggesting superior efficacy of subcutaneous injections, due to the ease of oral administration and similar bioavailability at typical starting doses (23).
Initiation/titration of methotrexate to a weekly dose of at least 15 mg within 4 to 6 weeks is conditionally recommended over initiation/titration to a weekly dose of <15 mg
The recommendation is conditional because there are few studies comparing different dosing strategies and wide variation in
physician and patient preferences regarding the tradeoff between the increased efficacy and risks of toxicity associated with higher starting doses. This recommendation refers only to the initial pre-scribing of methotrexate and is not meant to limit further dose escalation, which often provides additional efficacy (24).
A split dose of oral methotrexate over 24 hours or weekly subcutaneous injections, and/or an increased dose of folic/folinic acid, is conditionally recommended over switching to alternative DMARD(s) for patients not tolerating oral weekly methotrexate
Despite the very low- certainty of evidence supporting these strategies for alleviating side effects related to methotrexate, split dosing, changing to the subcutaneous route of administration, and increased doses of folic/folinic acid are the preferred initial strat-egies over switching to another DMARD because of the efficacy, long- term safety, and low costs associated with methotrexate. The recommendation is conditional because patient preferences play an important role in the decision whether to continue metho-trexate or switch to other DMARDs.
Switching to subcutaneous methotrexate is conditionally recommended over the addition of/switching to alternative DMARD(s) for patients taking oral methotrexate who are not at target
This recommendation is consistent with the voting panel’s overarching principle of maximizing use of methotrexate prior to switching/adding DMARDs. However, there are no data compar-ing outcomes in patients who switch to subcutaneous methotrex-ate versus another treatment strategy including other DMARDs. The recommendation is conditional because patient preferences and the magnitude of previous response to methotrexate play an important role in this decision.
Table 3. Methotrexate administration*
RecommendationsCertainty of
evidence
Based on the evidence report(s) of the
following PICO(s)
Evidence table(s), in
Supp. App. 2Oral methotrexate is conditionally recommended over subcutaneous
methotrexate for patients initiating methotrexate.Moderate PICO 9 p. 181
Initiation/titration of methotrexate to a weekly dose of at least 15 mg within 4 to 6 weeks is conditionally recommended over initiation/titration to a weekly dose of <15 mg.†
Moderate/very low‡
PICO 10.C1– C3 p. 184– 5
A split dose of oral methotrexate over 24 hours or subcutaneous injections, and/or an increased dose of folic/folinic acid, is conditionally recommended over switching to alternative DMARD(s) for patients not tolerating oral weekly methotrexate.
Very low PICO 16 and PICO 15 p. 206– 10
Switching to subcutaneous methotrexate is conditionally recommended over the addition of/switching to alternative DMARD(s) for patients taking oral methotrexate who are not at target.
Very low PICO 18 p. 235
* PICO = population, intervention, comparator, and outcomes; Supp. App. 2 = Supplementary Appendix 2, available on the Arthritis & Rheumatology website at http://onlin elibr ary.wiley.com/doi/10.1002/art.41752/ abstract; DMARD = disease- modifying antirheumatic drug. † This recommendation refers only to the initial prescribing of methotrexate and is not meant to limit further dose escalation, which often provides additional efficacy. ‡ The first certainty of evidence applies to the first listed option; the second certainty of evidence applies to the second option.

FRAENKEL ET AL 1114 |
Recommendations for treatment modification in patients treated with DMARDs who are not at target (Table 4)
Treat- to- target
A treat- to- target approach is strongly recommended over usual care for patients who have not been previously treated with bDMARDs or tsDMARDs
This recommendation applies to dose optimization of metho-trexate and to the subsequent addition of DMARDs when required. The recommendation is strong despite low- certainty evidence because of the recognized importance of systematic monitoring and adjustment of treatment to minimize inflammation to prevent joint damage, as well as other long- term sequelae including cardi-ovascular disease and osteoporosis.
A treat- to- target approach is conditionally recommended over usual care for patients who have had an inadequate response to bDMARDs or tsDMARDs
The recommendation is conditional because of the uncer-tain incremental benefits of treat- to- target over usual care in this patient population. In this context, usual care refers to commonly employed practice patterns, i.e., adjustment of treatment based on shared decision- making, albeit typically without systematic mon-itoring of disease activity using validated measures to reach a predefined target. Moreover, 1) the number of remaining availa-ble treatment options, 2) the impact of noninflammatory causes of pain, comorbidities, and/or damage on the accuracy of validated
disease activity assessments, and 3) the patient’s threshold for changing medications may have a more significant influence on the decision to follow a treat- to- target approach in this population compared to patients who are bDMARD- and tsDMARD- naive.
A minimal initial treatment goal of low disease activity is conditionally recommended over a goal of remission
An initial target of low disease activity is preferred because remission by established criteria may not be achievable for many patients (25). In addition, the patient panel emphasized that failure to reach a specified target may be disheartening and stressful for some patients. They emphasized that it would be preferable to ini-tially aim for low disease activity and subsequently consider a goal of remission. However, treatment goals should be systematically reas-sessed over time and individualized to each patient to ensure that remission is targeted when possible. The recommendation is condi-tional because remission is a reasonable initial goal for patients with early disease and minimal exposure to bDMARDs and tsDMARDs, and patient preferences play a significant role in this decision.
Modification of DMARD(s)
Addition of a bDMARD or tsDMARD is conditionally recommended over triple therapy (i.e., addition of sulfasalazine and hydroxy -chloroquine) for patients taking maximally tolerated doses of methotrexate who are not at target
The panel vigorously debated whether to recommend addition of a bDMARD or tsDMARD versus sulfasalazine and
Table 4. Treatment modification*
RecommendationsCertainty of
evidence
Based on the evidence report(s) of the
following PICO(s)
Evidence table(s), in
Supp. App. 2A TTT approach is strongly recommended over usual care for patients who have not
been previously treated with bDMARDs or tsDMARDs.Low PICO 12.a p. 191
A TTT approach is conditionally recommended over usual care for patients who have had an inadequate response to bDMARDs or tsDMARDs.
Very low PICO 12.b p. 199
A minimal initial treatment goal of low disease activity is conditionally recommended over a goal of remission.
Low PICO 13 p. 201
Addition of a bDMARD or tsDMARD is conditionally recommended over triple therapy for patients taking maximally tolerated doses of methotrexate who are not at target.
Very low PICO 19.C2– C6† p. 240– 1
Switching to a bDMARD or tsDMARD of a different class is conditionally recommended over switching to a bDMARD or tsDMARD belonging to the same class for patients taking a bDMARD or tsDMARD who are not at target.
Very low PICO 24– 27† p. 293– 338
Addition of/switching to DMARDs is conditionally recommended over continuation of glucocorticoids for patients taking glucocorticoids to remain at target.
Very low PICO 23 p. 292
Addition of/switching to DMARDs (with or without IA glucocorticoids) is conditionally recommended over the use of IA glucocorticoids alone for patients taking DMARDs who are not at target.
Very low PICO 28.C1– C2 p. 339– 40
* PICO = population, intervention, comparator, and outcomes; Supp. App. 2 = Supplementary Appendix 2, available on the Arthritis & Rheumatology website at http://onlin elibr ary.wiley.com/doi/10.1002/art.41752/ abstract; TTT = treat- to- target; bDMARDs = biologic disease- modifying anti -rheumatic drugs; tsDMARDs = targeted synthetic DMARDs; IA = intraarticular.† The original PICO included individual DMARDs as comparators. The recommendation considers bDMARDs as a group.

ACR GUIDELINE FOR TREATMENT OF RA | 1115
hydroxychloroquine (triple therapy) for patients with an inade-quate response to methotrexate monotherapy in view of very low- certainty evidence favoring bDMARDs or tsDMARDs, ran-domized controlled trials demonstrating equivalent long- term outcomes across both treatment strategies, and significantly less societal cost associated with triple therapy (26– 29). Addition of a bDMARD or tsDMARD was ultimately preferred because the patient panel strongly prioritized maximizing improvement as quickly as possible. In addition, both the patient and vot-ing panels valued the greater persistence of methotrexate plus a bDMARD or tsDMARD compared to triple therapy (defined in Table 1) (13,30). The recommendations from these studies (13,31) are conditional because triple therapy may be preferred in lower resource settings as well as in patients with specific comorbidities for whom triple therapy may be associated with significantly less risk of adverse events. This choice is highly preference sensitive, and decisions on how best to escalate care should incorporate patients’ preferences. There is no cur-rent recommendation for a bDMARD versus a tsDMARD when adjusting treatment; however, the voting panel acknowledged that safety data released in early 2021 (17,18) may require a modification of this recommendation when peer- reviewed results are published.
Switching to a bDMARD or tsDMARD of a different class is conditionally recommended over switching to a bDMARD or tsDMARD belonging to the same class for patients taking a bDMARD or tsDMARD who are not at target
The recommendation is based on very low- certainty evidence supporting greater improvement in disease activity and drug sur-vival among patients switching classes. The recommendation is conditional because patient and physician preferences are likely to vary based on prior experiences with specific DMARDs.
Use of glucocorticoids
Addition of/switching to DMARDs is conditionally recommended over continuation of glucocorticoids for patients taking glucocorticoids to remain at target
This recommendation assumes that improved disease con-trol with DMARDs should allow less use of glucocorticoids. The recommendation is conditional because the continued use of glu-cocorticoids may be required for patients who do not respond to DMARDs even after maximizing methotrexate dosage and switch-ing DMARD classes.
Addition of/switching to DMARDs (with or without intraarticular [IA] glucocorticoids) is conditionally recommended over the use of IA glucocorticoids alone for patients taking DMARDs who are not at target
This recommendation was based on the premise that DMARDs should be adjusted to reduce disease activity, irrespec-tive of treatment with IA glucocorticoids. The recommendation is conditional because patients may choose to defer adding/switch-ing DMARDs if they obtain relief from IA injection(s).
Recommendations for tapering/discontinuing DMARDs (Table 5)
Because of the moderate- to- high risk for flare and the potential for irreversible long- term damage associated with stopping all DMARDs, the following recommendations presume that patients maintain a therapeutic dose of at least 1 DMARD. In addition, the recommendations specify that patients be at target (low disease activity or remission) for at least 6 months prior to tapering. Patients in remission for <6 months should
Table 5. Tapering disease- modifying antirheumatic drugs (DMARDs)*
RecommendationsCertainty of
evidence
Based on the evidence report(s) of the
following PICO(s)
Evidence table(s), in Supp.
App. 2Continuation of all DMARDs at their current dose is conditionally
recommended over a dose reduction of a DMARD.Low PICO 54.a p. 381
Dose reduction is conditionally recommended over gradual discontinuation of a DMARD.
Low PICO 52.C2 and PICO 53.C2 p. 351– 5, 372– 6
Gradual discontinuation is conditionally recommended over abrupt discontinuation of a DMARD.
Low PICO 52.C1 and PICO 53.C1 p. 351, 372
Gradual discontinuation of sulfasalazine is conditionally recommended over gradual discontinuation of hydroxychloroquine for patients taking triple therapy who wish to discontinue a DMARD.
Very low PICO 58 p. 400
Gradual discontinuation of methotrexate is conditionally recommended over gradual discontinuation of the bDMARD or tsDMARD for patients taking methotrexate plus a bDMARD or tsDMARD who wish to discontinue a DMARD.
Very low PICO 59.C1 p. 401
* PICO = population, intervention, comparator, and outcomes; Supp. App. 2 = Supplementary Appendix 2, available on the Arthritis & Rheumatology website at http://onlin elibr ary.wiley.com/doi/10.1002/art.41752/ abstract; bDMARD = biologic DMARD; tsDMARD = targeted synthetic DMARD.

FRAENKEL ET AL 1116 |
not routinely be considered for dose reduction or withdrawal. Although the optimal time at target prior to tapering has not been established, the voting panel considered 6 months to be a reasonable minimal length of time to ensure stable dis-ease control. “Dose reduction” refers to lowering the dose or increasing the dosing interval of a DMARD. “Gradual discontin-uation” denotes gradually lowering the dose of a DMARD and subsequently stopping it.
Continuation of all DMARDs at their current dose is conditionally recommended over a dose reduction of a DMARD, dose reduction is conditionally recommended over gradual discontinuation of a DMARD, and gradual discontinuation is conditionally recommended over abrupt discontinuation of a DMARD for patients who are at target for at least 6 months
These recommendations are based on studies demonstrat-ing a higher risk of flare in patients who are 1) lowering the dose of a DMARD versus continuing DMARDs at the same dose, and 2) abruptly versus gradually discontinuing a DMARD (32– 36). The recommendations are conditional because patient and physician preferences are expected to vary.
Gradual discontinuation of sulfasalazine is conditionally recommended over gradual discontinuation of hydroxychloroquine for patients taking triple therapy who wish to discontinue a DMARD
Gradually discontinuing sulfasalazine is recommended because of its poorer treatment persistence due to adverse events (14). The recommendation is conditional because patient and physician preferences are expected to vary.
Gradual discontinuation of methotrexate is conditionally recommended over gradual discontinuation of the bDMARD or tsDMARD for patients taking methotrexate plus a bDMARD or tsDMARD who wish to discontinue a DMARD
In the absence of direct evidence, gradually discontinu-ing methotrexate is preferred because a bDMARD or tsDMARD is typically added following an inadequate response to metho-trexate. Thus, the continued use of the bDMARD or tsDMARD is more likely to maintain disease control than the continued use of methotrexate. The recommendation is conditional because gradual discontinuation of the bDMARD or tsDMARD may be favored depending on comorbidities, risk for infection, cost con-cerns, as well as patient and clinician preferences. The voting
panel cautioned that many patients treated with certain mono-clonal antibodies may require ongoing treatment with methotrex-ate to prevent the formation of antidrug antibodies (37).
Recommendations for specific patient populations (Table 6)
Subcutaneous nodules
Methotrexate is conditionally recommended over alternative DMARDs for patients with subcutaneous nodules who have moderate- to- high disease activity
Switching to a non- methotrexate DMARD is conditionally recommended over continuation of methotrexate for patients taking methotrexate with progressive subcutaneous nodules
While accelerated nodulosis has been observed in patients starting methotrexate (38), there are no studies examining comparative strategies for patients with stable or progressive subcutaneous nodules. The preceding 2 recommendations are conditional because patient and clinician preferences are expected to vary. The recommendation to switch is based on the premise that methotrexate is a contributing factor to pro-gressive nodulosis.
Pulmonary disease
Methotrexate is conditionally recommended over alternative DMARDs for the treatment of inflammatory arthritis for patients with clinically diagnosed mild and stable airway or parenchymal lung disease, or incidental disease detected on imaging, who have moderate- to- high disease activity
Studies indicate that preexisting lung disease is a risk fac-tor for methotrexate- related pneumonitis (39,40). However, the overall risk of worsening lung disease attributable to metho-trexate is uncertain, and alternative DMARDs have also been associated with lung disease (41– 45). The recommendation is in favor of methotrexate because of its important role as an anchor treatment in RA and the lack of alternatives with similar efficacy and/or superior long- term safety profiles. The recommendation is conditional because some clinicians (rheumatologists and pul-monologists) and patients will prefer an alternative option rather than accept any additional risk of lung toxicity. Patients with preexisting lung disease should be informed of their increased risk of methotrexate pneumonitis prior to initiating treatment with methotrexate.

ACR GUIDELINE FOR TREATMENT OF RA | 1117
Table 6. Specific patient populations*
RecommendationsCertainty of
evidence
Based on the evidence report(s) of the
following PICO(s)
Evidence table(s), in
Supp. App. 2Subcutaneous nodules
Methotrexate is conditionally recommended over alternative DMARDs for patients with subcutaneous nodules who have moderate- to- high disease activity.
Very low PICO 64 p. 427
Switching to a non- methotrexate DMARD is conditionally recommended over continuation of methotrexate for patients taking methotrexate with progressive subcutaneous nodules.
Very low PICO 65 p. 428
Pulmonary diseaseMethotrexate is conditionally recommended over alternative DMARDs for the
treatment of inflammatory arthritis for patients with clinically diagnosed mild and stable airway or parenchymal lung disease who have moderate- to- high disease activity.
Very low PICO 67 p. 430
Heart failureAddition of a non– TNF inhibitor bDMARD or tsDMARD is conditionally
recommended over addition of a TNF inhibitor for patients with NYHA class III or IV heart failure and an inadequate response to csDMARDs.
Very low PICO 70 p. 435
Switching to a non– TNF inhibitor bDMARD or tsDMARD is conditionally recommended over continuation of a TNF inhibitor for patients taking a TNF inhibitor who develop heart failure.
Very low PICO 71 p. 436
Lymphoproliferative disorderRituximab is conditionally recommended over other DMARDs for patients who
have a previous lymphoproliferative disorder for which rituximab is an approved treatment and who have moderate- to- high disease activity.
Very low PICO 75 and PICO 76 p. 446– 7
Hepatitis B infectionProphylactic antiviral therapy is strongly recommended over frequent monitoring
alone for patients initiating rituximab who are hepatitis B core antibody positive (regardless of hepatitis B surface antigen status).
Very low PICO 82 p. 459
Prophylactic antiviral therapy is strongly recommended over frequent monitoring alone for patients initiating any bDMARD or tsDMARD who are hepatitis B core antibody positive and hepatitis B surface antigen positive.
Very low PICO 83 p. 464
Frequent monitoring alone is conditionally recommended over prophylactic antiviral therapy for patients initiating a bDMARD other than rituximab or a tsDMARD who are hepatitis B core antibody positive and hepatitis B surface antigen negative.
Very low PICO 84 p. 471
Nonalcoholic fatty liver diseaseMethotrexate is conditionally recommended over alternative DMARDs for
DMARD- naive patients with nonalcoholic fatty liver disease, normal liver enzymes and liver function tests, and no evidence of advanced liver fibrosis who have moderate- to high disease activity.
Very low PICO 87 p. 489
Persistent hypogammaglobulinemia without infectionIn the setting of persistent hypogammaglobulinemia without infection,
continuation of rituximab therapy for patients at target is conditionally recommended over switching to a different bDMARD or tsDMARD.
Very low PICO 66 p. 429
Previous serious infectionAddition of csDMARDs is conditionally recommended over addition of a
bDMARD or tsDMARD for patients with a serious infection within the previous 12 months who have moderate- to- high disease activity despite csDMARD monotherapy.
Very low PICO 88 p. 490
Addition of/switching to DMARDs is conditionally recommended over initiation/dose escalation of glucocorticoids for patients with a serious infection within the previous 12 months who have moderate- to- high disease activity.
Very low PICO 90 and PICO 91 p. 496– 7
Nontuberculous mycobacterial lung diseaseUse of the lowest possible dose of glucocorticoids (discontinuation if possible) is
conditionally recommended over continuation of glucocorticoids for patients with nontuberculous mycobacterial lung disease.
Very low No relevant PICO
Addition of csDMARDs is conditionally recommended over addition of a bDMARD or tsDMARD for patients ’with nontuberculous mycobacterial lung disease who have moderate- to- high disease activity despite csDMARD monotherapy.
Very low PICO 92 p. 498
Abatacept is conditionally recommended over other bDMARDs and tsDMARDs for patients with nontuberculous mycobacterial lung disease who have moderate- to- high disease activity despite csDMARDs.
Very low PICO 93 p. 499
* PICO = population, intervention, comparator, and outcomes; Supp. App. 2 = Supplementary Appendix 2, available on the Arthritis & Rheumatology website at http://onlin elibr ary.wiley.com/doi/10.1002/art.41752/ abstract; DMARDs = disease- modifying antirheumatic drugs; TNF = tumor necrosis factor; bDMARD = biologic DMARD; tsDMARD = targeted synthetic DMARD; NYHA = New York Heart Association; csDMARDs = conventional synthetic DMARDs.

FRAENKEL ET AL 1118 |
Heart failure
Addition of a non– TNF inhibitor bDMARD or tsDMARD is conditionally recommended over addition of a TNF inhibitor for patients with New York Heart Association (NYHA) class III or IV heart failure and an inadequate response to csDMARDs,
Switching to a non– TNF inhibitor bDMARD or tsDMARD is conditionally recommended over continuation of a TNF inhibitor for patients taking a TNF inhibitor who develop heart failure
These recommendations are based on the risk of wors-ening heart failure observed in randomized clinical trials of TNF inhibitors in patients with NYHA class III or IV heart fail-ure without RA (46,47). Both recommendations are conditional
because of the very low- certainty evidence supporting these PICO questions.
Lymphoproliferative disorder
Rituximab is conditionally recommended over other DMARDs for patients who have a previous lymphoproliferative disorder for which rituximab is an approved treatment and who have moderate- to- high disease activity
Rituximab is preferred over other DMARDs, regardless of previous DMARD experience, because it would not be expected to increase the risk of recurrence or worsening of these lym-phoproliferative disorders. The recommendation is conditional because of the very low- certainty evidence supporting this PICO question.
Hepatitis B infection
Prophylactic antiviral therapy is strongly recommended over frequent monitoring of viral load and liver enzymes alone for patients initiating rituximab who are hepatitis B core antibody positive (regardless of hepatitis B surface antigen status)
Prophylactic antiviral therapy is strongly recommended over frequent monitoring alone for patients initiating any bDMARD or tsDMARD who are hepatitis B core antibody positive and hepatitis B surface antigen positive
Frequent monitoring alone of viral load and liver enzymes is conditionally recommended over prophylactic antiviral therapy for patients initiating a bDMARD other than rituximab or a tsDMARD who are hepatitis B core antibody positive and hepatitis B surface antigen negative
These recommendations were made based on the risk of hepatitis B reactivation due to core antibody and surface antigen status and the specific DMARD being initiated and are consistent with the updated American Association for the Study of Liver Dis-eases guidance (48). Patients at risk for hepatitis B reactivation should be comanaged with a hepatologist. The third recommen-dation is conditional because it is less certain whether the benefit of prophylactic antiviral therapy outweighs the risks and cost of this treatment in the specified patient population.
Table 7. Key clinical questions requiring further research*Methotrexate administration
At what dose and route of administration should methotrexate be started?
Does switching to non- methotrexate DMARDs improve tolerability over increasing the dose of folic acid, or using folinic acid or using split dose or subcutaneous dosing, for RA patients with side effects when taking methotrexate?
TTTWhat is the efficacy of TTT in different patient populations (early
versus late, bDMARD- or tsDMARD- exposed, elderly- onset, comorbidities)?
What is the optimal target and method of assessment of disease activity for TTT in different populations?
Comparative effectiveness/safetyWhat is the comparative effectiveness/safety between bDMARDs
and tsDMARDs?What is the comparative effectiveness/safety between adding
bDMARDs or tsDMARDs to methotrexate and switching to bDMARD or tsDMARD monotherapy?
What is the comparative effectiveness/safety between TTT by maximizing use of methotrexate (i.e., escalating dose via subcutaneous route) and adding/switching to bDMARD or tsDMARD monotherapy?
When, which, and how should DMARDs be tapered/discontinued?
Do clinical or biologic markers predict a differential response to DMARDs?
ComorbiditiesWhat is the effectiveness/safety of alternative treatment
strategies in RA patients with clinical lung disease or NAFLD?Which DMARDs can be initiated or continued after receiving
checkpoint inhibitor therapy?Which DMARDs should be used in patients with solid
malignancies, including skin cancer?Is there a time frame before which DMARDs can be started/
resumed in patients with concomitant solid malignancies?* DMARDs = biologic disease- modifying antirheumatic drugs; RA = rheumatoid arthritis; TTT = treat- to- target; bDMARD = biologic DMARD; tsDMARD = targeted synthetic DMARD; NAFLD = non alcoholic fatty liver disease.

ACR GUIDELINE FOR TREATMENT OF RA | 1119
Nonalcoholic fatty liver disease (NAFLD)
Methotrexate is conditionally recommended over alternative DMARDs for DMARD- naive patients with NAFLD, normal liver enzymes and liver function tests, and no evidence of advanced liver fibrosis who have moderate- to- high disease activity
Given the concerns about the risk of hepatotoxicity asso-ciated with methotrexate therapy in patients with NAFLD, use of methotrexate should be restricted to patients with normal liver enzymes and liver function tests and without evidence of liver dis-ease or liver fibrosis (Stage 3 or 4). Noninvasive testing to diagnose and stage liver fibrosis as well as consultation with a gastroen-terologist or hepatologist should be considered in patients prior to initiating methotrexate (49). In addition, more frequent moni-toring should be performed in this patient population (every 4 to 8 weeks). The recommendation is conditional because patients’ and clinicians’ risk tolerance varies.
Persistent hypogammaglobulinemia without infection
In the setting of persistent hypogammaglobulinemia without infection, continuation of rituximab therapy for patients at target is conditionally recommended over switching to a different bDMARD or tsDMARD
Continuing rituximab in patients who are at target is preferred because of the uncertain clinical significance of hypogammaglobulinemia in patients without infection. Although an increased risk of infection has been described in RA patients with hypogammaglobulinemia, it is not known if a switch in DMARDs in patients who are at target is more effective in lowering infection risk while maintaining disease control than continuation of rituximab. The recommendation is conditional because physi-cian and patient risk tolerance is likely to vary depending on the degree of hypogammaglobulinemia and patient- specific risk fac-tors for infection.
Previous serious infection
Addition of csDMARDs is conditionally recommended over addition of a bDMARD or tsDMARD for patients with a serious infection within the previous 12 months who have moderate- to- high disease activity despite csDMARD monotherapy
This conditional recommendation is made based on obser-vational data suggesting a lower risk of infection associated
with combination csDMARDs (dual or triple therapy) compared to bDMARDs or tsDMARDs (50). Some clinicians may prefer csDMARDs even if the serious infection occurred >12 months prior to considering a change.
Addition of/switching to DMARDs is conditionally recommended over initiation/dose escalation of glucocorticoids for patients with a serious infection within the previous 12 months who have moderate- to- high disease activity
This conditional recommendation is made based on observa-tional studies suggesting a strong association between dose and duration of glucocorticoids with the risk of serious infection (51– 53).
Nontuberculous mycobacterial (NTM) lung disease
Given the variability of NTM lung disease severity and response to treatment, patients should be closely comanaged with an infectious disease or pulmonary specialist.
Use of the lowest possible dose of glucocorticoids (discontinuation if possible) is conditionally recommended over continuation of glucocorticoids without dose modification for patients with NTM lung disease
This recommendation is based on studies suggesting an increased risk of NTM lung disease in patients receiving either inhaled or oral glucocorticoids (54,55).
Addition of csDMARDs is conditionally recommended over addition of a bDMARD or tsDMARD for patients with NTM lung disease who have moderate- to- high disease activity despite csDMARD monotherapy
This recommendation is based on the lower expected risk of NTM lung disease associated with csDMARDs compared to bDMARDs and tsDMARDs (56).
Abatacept is conditionally recommended over other bDMARDs and tsDMARDs for patients with NTM lung disease who have moderate- to- high disease activity despite csDMARDs
Abatacept is conditionally recommended over other bDMARDs and tsDMARDs based on population data extrapolated from tuberculosis (57). There is considerable uncertainty regard-ing the risk of mycobacterial infections associated with non– TNF inhibitor bDMARDs and tsDMARDs; however, TNF inhibitors are associated with increased rates of mycobacterial infections and should be avoided (58).

FRAENKEL ET AL 1120 |
The preceding 3 recommendations are conditional because of the very low- certainty evidence supporting the analysis of the dif-ferences in treatment outcomes posed by these PICO questions.
DISCUSSION
The ACR guidelines were developed to provide clinicians with recommendations for decisions frequently faced in clinical practice. Several new topics are included in this update, includ-ing recommendations for administration of methotrexate, use of methotrexate in patients with subcutaneous nodules, pulmo-nary disease, and NAFLD, use of rituximab in patients with hypog-ammaglobulinemia, and treatment of RA in patients with NTM lung disease. Areas covered in the 2015 guidelines that are not covered in this update include recommendations for patients with hepati-tis C and solid malignancies. The panel did not vote on specific recommendations for patients with hepatitis C because curative antiviral therapy is now widely available. The panel did deliberate over PICO questions related to use of DMARDs in patients with solid malignancies. However, given the changing landscape of personalized treatments for many solid malignancies, the voting panel felt that a generalized recommendation was not possible.
On February 4, 2021, the FDA released a Drug Safety Alert noting a possible increased risk of major cardiovascular events and malignancies (excluding non- melanoma skin cancer) in patients with RA (over the age of 50 years with at least 1 risk factor for cardiovascular disease) participating in a randomized controlled trial designed to compare the safety of tofacitinib to adalimumab (18). Recommendations will be reviewed once peer- reviewed results are published. Rapidly evolving comparative effectiveness and safety signals associated with JAKi highlight the need to engage in a shared decision- making process when adjusting DMARDs (16,59). In addition, although previous recom-mendations cautioned against the use of TNF inhibitors in patients with skin cancer (1), the results of more recently published studies examining specific DMARD- related risks of non- melanoma skin cancer and melanoma do not support making a definite recom-mendation for or against specific DMARDs (60,61).
The panel also considered PICO questions related to current use of checkpoint inhibitor therapy, but the variability in current practice patterns and differences in treatment for specific cancer types precluded the development of specific recommendations for patients who are candidates for, or are currently receiving, checkpoint inhibitor therapy. We anticipate that additional rec-ommendations for patients with systemic rheumatic diseases and solid malignancies will be developed as further data become available. There were vigorous discussions pertaining to recom-mendations for specific DMARDs in patients with moderate- to- high disease activity despite csDMARDs and with a history of serious infection. However, the evidence was insufficient to sup-port a recommendation. Future studies (using large registries and
network meta- analyses) are needed to support specific recom-mendations for this patient population.
The recommendation statements in this update are not directly comparable to the ACR 2015 guidelines (1) because they do not retain the early versus established RA subgroups. Nev-ertheless, there are some notable differences. First, the 2015 guidelines recommend csDMARD monotherapy, preferably with methotrexate, for patients with both low and moderate/high disease activity, whereas this update recommends an initial trial of hydroxychloroquine or sulfasalazine for those with low disease activity. Second, the 2015 guidelines recommended DMARD tapering for patients who are in remission. In this update, taper-ing recommendations are made for patients who are in low dis-ease activity or remission in the face of a paucity of data about when and how best to taper. The panel recommended that careful tapering might be considered if the patient wishes to cut back on their use of DMARDs. However, patients should be closely evaluated during any taper, and if a flare occurs, the prior regi-men should be reinstituted promptly. Last, this update includes several recommendations against the use of glucocorticoid ther-apy. These recommendations were made in recognition of the frequent difficulty tapering glucocorticoids leading to undesirable prolonged use and the increasing evidence of the negative impact of glucocorticoids on long- term patient outcomes, including risk for infection, osteoporosis, and cardiovascular disease, in RA and other rheumatic diseases (62– 65).
While consensus was easily reached on the majority of statements, 2 issues required prolonged discussion and debate. The decision on whether patients with an inadequate response to methotrexate should escalate to a bDMARD, tsDMARD, or tri-ple therapy engendered much discussion with contrasting points of view. In the end, a recommendation was made in favor of a bDMARD or tsDMARD because of the more rapid onset of benefit and concerns related to the poor tolerability and durability of tri-ple therapy in real- world practice (13,14). In particular, the patient panel highlighted the importance of a rapid onset on benefit after already having had an inadequate response to methotrexate. The conditional recommendation to initiate methotrexate therapy for patients with preexisting mild, stable lung disease was also rigor-ously debated. While minimizing the risk of toxicity is paramount, the voting panel favored a conditional recommendation to initi-ate methotrexate therapy in this clinical setting because of the vital role of this DMARD in the overall treatment of RA and lack of other comparable therapies without pulmonary risks.
Members of the voting panel agreed with the patient panel on the direction and strength of all but 2 recommendations. Patients were in favor of initial treatment with combination csD-MARDs over methotrexate monotherapy because they placed greater value on the incremental benefits associated with combi-nation therapy compared to clinicians. This preference was also stated in the 2015 guidelines (66). Patients also strongly preferred

ACR GUIDELINE FOR TREATMENT OF RA | 1121
discontinuing over a dose reduction of a DMARD whenever pos-sible, whereas most clinicians on the voting panel preferred dose reduction. This discordance reflects patient preference to mini-mize use of medications once they reach target versus physician preference to minimize flare. However, both the patient and voting panel stressed the variability in patient preferences for tapering. These differences reinforce the importance of using a shared decision- making approach in RA.
When clinically relevant, recommendations specify the level of disease activity in the patient population (Table 1). However, evidence tables include pooled data from studies that often use different measures of disease activity; thus, specific definitions of low versus moderate- to- high disease activity are not provided for specific recommendations. Despite the large body of litera-ture related to pharmacologic treatments for RA, the review team did not identify high- certainty evidence for many of the questions addressed. This discrepancy is due to the differences between clinically important PICO questions and the specific objectives of clinical trials. For example, few studies have examined how to best dose and administer methotrexate, the most effective and safe use of DMARDs in high- risk populations, and the risk– benefit tradeoffs associated with glucocorticoid use. Moreover, many trials could not be matched to specific PICO questions because of differences between the trials and the PICO questions’ spec-ified study populations and treatment comparisons. Thus, many recommendations are based largely on very low- certainty or low- certainty evidence. Incorporating medical evidence and expert input and consensus into clinical guidelines is core to the GRADE process and strengthens recommendations, particularly when there is limited evidence. In addition, while the patients’ views informed the voting panel’s deliberations, it is not possible to rep-resent all patients’ viewpoints.
In summary, this update includes recommendations related to initiation and adjustment of DMARD therapy in patients with RA. It also emphasizes the importance of minimizing use of glu-cocorticoids. It is expected that additional data may modify the direction and/or strength of specific recommendations. The ACR will update the recommendations and answer these and other questions as new data are published.
ACKNOWLEDGMENTS
We thank Stanley B. Cohen, MD, for his contributions during the scoping phase of the project. We thank Cassandra Calabrese, DO, Leonard Calabrese, DO, Joseph Lim, MD, Danielle Antin- Ozerkis, MD, Marcus R. Pereira, MD, MPH, Jason E. Stout, MD, MHS, and Kevin Winthrop, MD, MPH, for their expert input as the voting panel considered recommendations related to comorbidities. We thank Nancy Baker, ScD, MPH, OTR/I, and Daniel White, PT, ScD, MSc, for their contributions during the scoping phase of the project, as well as their input during early deliberations by the voting panel. We thank the patients who (along with authors Kristine Carandang, PhD, OTR/L, and Shilpa Venkatachalam, PhD) participated in the patient panel meeting: Susan Campbell, Rachelle Crow- Hercher, MEd, Doug Davis, Sidney Harper, Faith Powell, Zenethia Roberts, Mary Turner, and C. Whitney White, PharmD. We thank the ACR staff, including
Regina Parker for assistance in organizing the face- to- face meeting and coordinating the administrative aspects of the project, Robin Lane for assistance in manuscript preparation, and Jocelyn Givens for assistance with recruitment for the patient panel. We thank Janet Waters and Janet Joyce for their assistance in developing the literature search strategy, as well as performing the initial literature search and update searches.
AUTHOR CONTRIBUTIONS
All authors were involved in drafting the article or revising it critically for important intellectual content, and all authors approved the final version to be submitted for publication. Dr. Fraenkel had full access to all of the data in the study and takes responsibility for the integrity of the data and the accuracy of the data analysis.Study conception and design. Fraenkel, Bathon, England, St. Clair, Deane, Genovese, Kerr, Kremer, Sparks, Venkatachalam, Weinblatt, George, Johnson, Turner, Yaacoub, Akl.Acquisition of data. Fraenkel, Bathon, England, St. Clair, Carandang, Deane, Genovese, Kerr, Kremer, J. Singh, Sparks, Al- Gibbawi, Baker, Barton, Cappelli, George, Johnson, Kahale, Karam, Khamis, Navarro- Millán, Mirza, Schwab, N. Singh, Turgunbaev, Turner, Yaacoub, Akl.Analysis and interpretation of data. Fraenkel, Bathon, England, St. Clair, Arayssi, Deane, Genovese, Huston, Kerr, Kremer, Nakamura, Russell, J. Singh, Smith, Sparks, Venkatachalam, Weinblatt, Al- Gibbawi, Barbour, Barton, Chamseddine, Johnson, Kahale, Karam, Khamis, Navarro- Millán, Mirza, Schwab, N. Singh, Turgunbaev, Yaacoub, Akl.
ADDITIONAL DISCLOSURES
Author Genovese was employed by Stanford University Medical Center during development of this guideline but at the time of publication will also be employed by Gilead Sciences. Gilead Sciences had no financial or other interest in this project, had no input in the design, content, data collection, or analysis, and had no role in the writing or approval of this article.
REFERENCES 1. Singh JA, Saag KG, Bridges SL Jr, Akl EA, Bannuru RR, Sullivan
MC, et al. 2015 American College of Rheumatology guidelinefor the treatment of rheumatoid arthritis. Arthritis Rheumatol2016;68:1– 26.
2. Saag KG, Teng GG, Patkar NM, Anuntiyo J, Finney C, Curtis JR,et al. American College of Rheumatology 2008 recommendations for the use of nonbiologic and biologic disease- modifying antirheumaticdrugs in rheumatoid arthritis. Arthritis Rheum 2008;59:762– 84.
3. Singh JA, Furst DE, Bharat A, Curtis JR, Kavanaugh AF, Kremer JM,et al. 2012 update of the 2008 American College of Rheumatologyrecommendations for the use of disease- modifying antirheumaticdrugs and biologic agents in the treatment of rheumatoid arthritis.Arthritis Care Res (Hoboken) 2012;64:625– 39.
4. Goodman SM, Springer B, Guyatt G, Abdel MP, Dasa V, George M,et al. 2017 American College of Rheumatology/American Association of Hip and Knee Surgeons guideline for the perioperative manage-ment of antirheumatic medication in patients with rheumatic dis-eases undergoing elective total hip or total knee arthroplasty. Arthritis Rheumatol 2017;69:1538– 51.
5. Sammaritano LR, Bermas BL, Chakravarty EE, Chambers C, ClowseME, Lockshin MD, et al. 2020 American College of Rheumatology guide-line for the management of reproductive health in rheumatic and mus-culoskeletal diseases. Arthritis Care Res (Hoboken) 2020;72:461– 88.
6. Andrews JC, Schunemann HJ, Oxman AD, Pottie K, MeerpohlJJ, Coello PA, et al. GRADE guidelines: 15. Going from evidenceto recommendation– determinants of a recommendation’s directionand strength. J Clin Epidemiol 2013;66:726– 35.

FRAENKEL ET AL 1122 |
7. Alexander PE, Gionfriddo MR, Li SA, Bero L, Stoltzfus RJ, NeumannI, et al. A number of factors explain why WHO guideline developersmake strong recommendations inconsistent with GRADE guidance.J Clin Epidemiol 2016;70:111– 22.
8. Guyatt GH, Oxman AD, Vist GE, Kunz R, Falck- Ytter Y, Alonso- Coello P, et al. GRADE: an emerging consensus on rating quality ofevidence and strength of recommendations. BMJ 2008;336:924– 6.
9. Brouwers MC, Kho ME, Browman GP, Burgers JS, Cluzeau F, FederG, et al. AGREE II: advancing guideline development, reporting andevaluation in health care. CMAJ 2010;182:E839– 42.
10. England BR, Tiong BK, Bergman MJ, Curtis JR, Kazi S, Mikuls TR,et al. 2019 Update of the American College of Rheumatology rec-ommended rheumatoid arthritis disease activity measures. ArthritisCare Res (Hoboken) 2019;71:1540– 55.
11. Albrecht K, Zink A. Poor prognostic factors guiding treatmentdecisions in rheumatoid arthritis patients: a review of data fromrandomized clinical trials and cohort studies. Arthritis Res Ther2017;19:68.
12. Burgers LE, Raza K, van der Helm- van Mil AH. Window of opportu-nity in rheumatoid arthritis– definitions and supporting evidence: from old to new perspectives. RMD Open 2019;5:e000870.
13. Curtis JR, Palmer JL, Reed GW, Greenberg J, Pappas DA, HarroldLR, et al. Real- world outcomes associated with triple therapy ver-sus tumor necrosis factor inhibitor/methotrexate therapy. ArthritisCare Res (Hoboken) doi: http://onlin elibr ary.wiley.com/doi/10.1002/acr.24253/ abstract. E- pub ahead of print.
14. Erhardt DP, Cannon GW, Teng CC, Mikuls TR, Curtis JR, Sauer BC.Low persistence rates in patients with rheumatoid arthritis treatedwith triple therapy and adverse drug events associated with sul-fasalazine. Arthritis Care Res (Hoboken) 2019;71:1326– 35.
15. Burmester GR, Rigby WF, van Vollenhoven RF, Kay J, Rubbert- RothA, Kelman A, et al. Tocilizumab in early progressive rheumatoidarthritis: FUNCTION, a randomised controlled trial. Ann Rheum Dis2016;75:1081– 91.
16. Van Vollenhoven R, Takeuchi T, Pangan AL, Friedman A, MohamedME, Chen S, et al. Efficacy and safety of upadacitinib monotherapy in methotrexate- naive patients with moderately- to- severely active rheu-matoid arthritis (SELECT- EARLY): a multicenter, multi- country, ran-domized, double- blind, active comparator– controlled trial. ArthritisRheumatol 2020;72:1607– 20.
17. Pfizer. Pfizer shares co- primary endpoint results from post-marketing required safety study of Xeljanz (Tofacitinib) in subjectswith rheumatoid arthritis (RA). URL: https://inves tors.pfizer.com/inves tor- news/press - relea se- detai ls/2021/Pfize r- Share s- Co- Prima ry- Endpo int- Resul ts- from- Post- Marke ting- Requi red- Safet y- Study - of- XELJA NZ- tofac itini b- in- Subje cts- with- Rheum atoid - Arthr itis- RA/defau lt.aspx.
18. US Food and Drug Administration. Xeljanz, Xeljanz XR (tofacitinib):drug safety communication– initial safety trial results find increasedrisk of serious heart- related problems and cancer with arthritisand ulcerative colitis medicine. URL: https://www.fda.gov/safety/medic al- produ ct- safet y- infor matio n/xelja nz- xelja nz- xr- tofac itini b- drug- safet y- commu nicat ion- initi al- safet y- trial - resul ts- find- incre ased?utm_mediu m=email &utm_sourc e=govde livery.
19. Katchamart W, Trudeau J, Phumethum V, Bombardier C. Efficacyand toxicity of methotrexate (MTX) monotherapy versus MTX combi-nation therapy with non- biological disease- modifying antirheumaticdrugs in rheumatoid arthritis: a systematic review and meta- analysis. Ann Rheum Dis 2009;68:1105– 12.
20. Emery P, Bingham CO, Burmester GR, Bykerk VP, Furst DE, Mariette X, et al. Certolizumab pegol in combination with dose- optimisedmethotrexate in DMARD- naïve patients with early, active rheumatoidarthritis with poor prognostic factors: 1- year results from C- EARLY,
a randomised, double- blind, placebo- controlled phase III study. Ann Rheum Dis 2017;76:96– 104.
21. Detert J, Bastian H, Listing J, Weiss A, Wassenberg S, LiebhaberA, et al. Induction therapy with adalimumab plus methotrexate for24 weeks followed by methotrexate monotherapy up to week 48versus methotrexate therapy alone for DMARD- naive patients withearly rheumatoid arthritis: HIT HARD, an investigator- initiated study.Ann Rheum Dis 2013;72:844– 50.
22. Nam JL, Villeneuve E, Hensor EM, Wakefield RJ, Conaghan PG,Green MJ, et al. A randomised controlled trial of etanercept andmethotrexate to induce remission in early inflammatory arthritis: theEMPIRE trial. Ann Rheum Dis 2014;73:1027– 36.
23. Schiff MH, Jaffe JS, Freundlich B. Head- to- head, randomised,crossover study of oral versus subcutaneous methotrexate inpatients with rheumatoid arthritis: drug- exposure limitations of oralmethotrexate at doses ≥15 mg may be overcome with subcutane-ous administration. Ann Rheum Dis 2014;73:1549– 51.
24. Visser K, van der Heijde D. Optimal dosage and route of administra-tion of methotrexate in rheumatoid arthritis: a systematic review ofthe literature. Ann Rheum Dis 2009;68:1094– 9.
25. Scott IC, Ibrahim F, Panayi G, Cope AP, Garrood T, Vincent A, et al. The frequency of remission and low disease activity in patientswith rheumatoid arthritis, and their ability to identify people withlow disability and normal quality of life. Semin Arthritis Rheum2019;49:20– 6.
26. Bansback N, Phibbs CS, Sun H, O’Dell JR, Brophy M, KeystoneEC, et al. Triple therapy versus biologic therapy for active rheu-matoid arthritis: a cost- effectiveness analysis. Ann Intern Med2017;167:8– 16.
27. Moreland LW, O’Dell JR, Paulus HE, Curtis JR, Bathon JM, St. ClairEW, et al. A randomized comparative effectiveness study of oral tri-ple therapy versus etanercept plus methotrexate in early aggressiverheumatoid arthritis: the Treatment of Early Aggressive RheumatoidArthritis Trial. Arthritis Rheum 2012;64:2824– 35.
28. O’Dell JR, Mikuls TR, Taylor TH, Ahluwalia V, Brophy M, Warren SR,et al. Therapies for active rheumatoid arthritis after methotrexate fail-ure. N Engl J Med 2013;369:307– 18.
29. Van Vollenhoven RF, Geborek P, Forslind K, Albertsson K, ErnestamS, Petersson IF, et al. Conventional combination treatment versusbiological treatment in methotrexate- refractory early rheumatoidarthritis: 2 year follow- up of the randomised, non- blinded, parallel- group Swefot trial. Lancet 2012;379:1712– 20.
30. Sauer BC, Teng CC, Tang D, Leng J, Curtis JR, Mikuls TR, et al.Persistence with conventional triple therapy versus a tumor necro-sis factor inhibitor and methotrexate in US veterans with rheumatoidarthritis. Arthritis Care Res (Hoboken) 2017;69:313– 22.
31. Bergstra SA, Winchow LL, Murphy E, Chopra A, Salomon- EscotoK, Fonseca JE, et al. How to treat patients with rheumatoid arthri-tis when methotrexate has failed? The use of a multiple propensityscore to adjust for confounding by indication in observational stud-ies. Ann Rheum Dis 2019;78:25– 30.
32. Pavelka K, Akkoç N, Al- Maini M, Zerbini CA, Karateev DE,Nasonov EL, et al. Maintenance of remission with combina-tion etanercept- DMARD therapy versus DMARDs alone inactive rheumatoid arthritis: results of an international treat- to- target study conducted in regions with limited biologic access.Rheumatol Int 2017;37:1469– 79.
33. Ghiti Moghadam M, Vonkeman HE, ten Klooster PM, Tekstra J, vanSchaardenburg D, Starmans- Kool M, et al. Stopping tumor necro-sis factor inhibitor treatment in patients with established rheumatoidarthritis in remission or with stable low disease activity: a prag-matic multicenter, open- label randomized controlled trial. ArthritisRheumatol 2016;68:1810– 7.

ACR GUIDELINE FOR TREATMENT OF RA | 1123
34. Van Herwaarden N, van der Maas A, Minten MJ, van den Hoogen FH, Kievit W, van Vollenhoven RF, et al. Disease activity guided dose reduction and withdrawal of adalimumab or etanercept compared with usual care in rheumatoid arthritis: open label, randomised con-trolled, non- inferiority trial. BMJ 2015;350:h1389.
35. Van Vollenhoven RF, Østergaard M, Leirisalo- Repo M, Uhlig T, Jansson M, Larsson E, et al. Full dose, reduced dose or discon-tinuation of etanercept in rheumatoid arthritis. Ann Rheum Dis 2016;75:52– 8.
36. Weinblatt ME, Bingham CO III, Burmester GR, Bykerk VP, Furst DE, Mariette X, et al. A phase III study evaluating continuation, taper-ing, and withdrawal of certolizumab pegol after one year of ther-apy in patients with early rheumatoid arthritis. Arthritis Rheumatol 2017;69:1937– 48.
37. Strand V, Balsa A, Al- Saleh J, Barile- Fabris L, Horiuchi T, Takeuchi T, et al. Immunogenicity of biologics in chronic inflammatory diseases: a systematic review. BioDrugs 2017;31:299– 316.
38. Patatanian E, Thompson DF. A review of methotrexate- induced accelerated nodulosis. Pharmacotherapy 2002;22:1157– 62.
39. Alarcon GS, Kremer JM, Macaluso M, Weinblatt ME, Cannon GW, Palmer WR, et al. Risk factors for methotrexate- induced lung injury in patients with rheumatoid arthritis: a multicenter, case- control study. Ann Intern Med 1997;127:356– 64.
40. Bartram SA. Experience with methotrexate- associated pneumonitis in northeastern England: comment on the article by Kremer et al [let-ter]. Arthritis Rheum 1998;41:1327– 8.
41. Kawashiri SY, Kawakami A, Sakamoto N, Ishimatsu Y, Eguchi K. A fatal case of acute exacerbation of interstitial lung disease in a patient with rheumatoid arthritis during treatment with tocilizumab. Rheumatol Int 2012;32:4023– 6.
42. Ostor AJ, Crisp AJ, Somerville MF, Scott DG. Fatal exacerbation of rheumatoid arthritis associated fibrosing alveolitis in patients given infliximab. BMJ 2004;329:1266.
43. Schoe A, van der Laan- Baalbergen NE, Huizinga TW, Breedveld FC, van Laar JM. Pulmonary fibrosis in a patient with rheumatoid arthritis treated with adalimumab. Arthritis Rheum 2006;55:157– 9.
44. Taki H, Kawagishi Y, Shinoda K, Hounoki H, Ogawa R, Sugiyama E, et al. Interstitial pneumonitis associated with infliximab therapy without methotrexate treatment. Rheumatol Int 2009;30:275– 6.
45. Roubille C, Haraoui B. Interstitial lung diseases induced or exacer-bated by DMARDS and biologic agents in rheumatoid arthritis: a systematic literature review. Semin Arthritis Rheum 2014;43:613– 26.
46. Chung ES, Packer M, Lo KH, Fasanmade AA, Willerson JT. Randomized, double- blind, placebo- controlled, pilot trial of inflix-imab, a chimeric monoclonal antibody to tumor necrosis factor- alpha, in patients with moderate- to- severe heart failure: results of the anti- TNF Therapy Against Congestive Heart Failure (ATTACH) trial. Circulation 2003;107:3133– 40.
47. Mann DL, McMurray JJ, Packer M, Swedberg K, Borer JS, Colucci WS, et al. Targeted anticytokine therapy in patients with chronic heart failure: results of the Randomized Etanercept Worldwide Evaluation (RENEWAL). Circulation 2004;109:1594– 602.
48. Terrault NA, Lok ASF, McMahon BJ, Chang KM, Hwang JP, Jonas MM, et al. Update on prevention, diagnosis, and treatment of chronic hepatitis B: AASLD 2018 hepatitis B guidance. Hepatology 2018;67:1560– 99.
49. American Association for the Study of Liver Diseases. The diagnosis and management of nonalcoholic fatty liver disease: practice guid-ance from the American Association for the Study of Liver Diseases. Clin Liver Dis (Hoboken) 2018;11:81.
50. Ozen G, Pedro S, England BR, Mehta B, Wolfe F, Michaud K. Risk of serious infection in patients with rheumatoid arthritis treated with
biologic versus nonbiologic disease- modifying antirheumatic drugs. ACR Open Rheumatol 2019;1:424– 32.
51. Lacaille D, Guh DP, Abrahamowicz M, Anis AH, Esdaile JM. Use of nonbiologic disease- modifying antirheumatic drugs and risk of infection in patients with rheumatoid arthritis. Arthritis Rheum 2008;59:1074– 81.
52. Dixon WG, Abrahamowicz M, Beauchamp ME, Ray DW, Bernatsky S, Suissa S, et al. Immediate and delayed impact of oral gluco-corticoid therapy on risk of serious infection in older patients with rheumatoid arthritis: a nested case– control analysis. Ann Rheum Dis 2012;71:1128– 33.
53. George MD, Baker JF, Winthrop K, Alemao E, Chen L, Connolly S, et al. Risk of biologics and glucocorticoids in patients with rheuma-toid arthritis undergoing arthroplasty: a cohort study. Ann Intern Med 2019;170:825– 36.
54. Liu VX, Winthrop KL, Lu Y, Sharifi H, Nasiri HU, Ruoss SJ. Association between inhaled corticosteroid use and pulmonary nontuberculous mycobacterial infection. Ann Am Thorac Soc 2018;15:1169– 76.
55. Liao TL, Lin CF, Chen YM, Liu HJ, Chen DY. Risk factors and out-comes of nontuberculous mycobacterial disease among rheumatoid arthritis patients: a case- control study in a TB endemic area. Sci Rep 2016;6:29443.
56. Brode SK, Jamieson FB, Ng R, Campitelli MA, Kwong JC, Paterson JM, et al. Increased risk of mycobacterial infections associated with anti- rheumatic medications. Thorax 2015;70:677– 82.
57. Cantini F, Niccoli L, Goletti D. Tuberculosis risk in patients treated with non- anti- tumor necrosis factor- α (TNF- α) targeted biologics and recently licensed TNF- α inhibitors: data from clinical trials and national registries. J Rheumatol Suppl 2014;91:56– 64.
58. Winthrop KL, Baxter R, Liu L, Varley CD, Curtis JR, Baddley JW, et al. Mycobacterial diseases and antitumour necrosis factor therapy in USA. Ann Rheum Dis 2013;72:37– 42.
59. Rubbert- Roth A, Enejosa J, Pangan AL, Haraoui B, Rischmueller M, Khan N, et al. Trial of upadacitinib or abatacept in rheumatoid arthritis. N Engl J Med 2020;383:1511– 21.
60. Buchbinder R, Barber M, Heuzenroeder L, Wluka AE, Giles G, Hall S, et al. Incidence of melanoma and other malignancies among rheu-matoid arthritis patients treated with methotrexate. Arthritis Rheum 2008;59:794– 9.
61. Mercer LK, Askling J, Raaschou P, Dixon WG, Dreyer L, Hetland ML, et al. Risk of invasive melanoma in patients with rheuma-toid arthritis treated with biologics: results from a collabora-tive project of 11 European biologic registers. Ann Rheum Dis 2017;76:386– 91.
62. Del Rincón I, Battafarano DF, Restrepo JF, Erikson JM, Escalante A. Glucocorticoid dose thresholds associated with all- cause and cardiovascular mortality in rheumatoid arthritis. Arthritis Rheumatol 2014;66:264– 72.
63. Bijlsma JW, Buttgereit F. Adverse events of glucocorticoids during treatment of rheumatoid arthritis: lessons from cohort and registry studies. Rheumatology (Oxford) 2016;55 Suppl 2:ii3– 5.
64. Curtis JR, Westfall AO, Allison J, Bijlsma JW, Freeman A, George V, et al. Population- based assessment of adverse events associated with long- term glucocorticoid use. Arthritis Rheum 2006;55:420– 6.
65. Huscher D, Thiele K, Gromnica- Ihle E, Hein G, Demary W, Dreher R, et al. Dose- related patterns of glucocorticoid- induced side effects. Ann Rheum Dis 2009;68:1119– 24.
66. Fraenkel L, Miller AS, Clayton K, Crow- Hercher R, Hazel S, Johnson B, et al. When patients write the guidelines: patient panel recom-mendations for the treatment of rheumatoid arthritis. Arthritis Care Res (Hoboken) 2016;68:26– 35.

1124
Arthritis & RheumatologyVol. 73, No. 7, July 2021, pp 1124–1126DOI 10.1002/art.41746© 2021, American College of Rheumatology
E D I T O R I A L
Current Treatment Strategies in Rheumatoid Arthritis After Methotrexate Are Not Enough to Maintain Sustained Remission: There Is No Holy Grail!Janet E. Pope,1 Peter Nash,2 and Roy Fleischmann3
The ideal state for a patient with rheumatoid arthritis (RA) is sustained remission (1). Contemporary treatment strategies, such as early initiation of disease- modifying antirheumatic drugs (DMARDs), optimal methotrexate (MTX) dosing, and treating to a target with validated outcomes, have improved the likelihood of remission in RA (1). Remission, however defined, is not always achieved, and even less often will patients with RA maintain sustained remission over time (2,3). The European Alliance of Associations for Rheumatology (EULAR) and American College of Rheumatology (ACR) recommendations for the treatment of RA suggest that patients with poor prognostic features should be treated with advanced therapies such as biologic DMARDs (bDMARDs) or targeted synthetic DMARDs (such as JAK inhibi-tors) after an incomplete response to MTX (2,4).
In this issue of Arthritis & Rheumatology, Källmark et al report the findings of an observational study of patients with RA from the Swedish Rheumatology Quality Register comparing the effective-ness of triple therapy (MTX, hydroxychloroquine, and sulfasalazine) to that of MTX with bDMARDs, after MTX monotherapy, for achiev-ing sustained remission (5). The study spanned 12 years. Long- term sustained remission was defined as ≥24 months of a Disease Activity Score in 28 joints using the erythrocyte sedimentation rate (DAS28- ESR) of <2.6, a validated metric. A total of 1,502 patients were included, of whom one- quarter received triple therapy. Käll-mark and colleagues observed that in patients starting bDMARDs, sustained remission occurred more frequently than in patients starting triple therapy. The odds ratio (OR) for long- term sustained remission at 2 years was 1.62 (95% confidence interval [95% CI] 0.94– 2.79). Short- term sustained remission was more frequent in patients starting bDMARDs compared to triple therapy at 1 year and 2 years, with adjusted ORs of 1.79 (95% CI 1.18– 2.72) and 1.92 (95% CI 1.21– 3.06), respectively, favoring bDMARDs. For those continuing either drug regimen at any time over follow- up,
there were no between- groups differences, but that is expected, as analyses are biased toward responders. The authors conclude that, although sustained remission occurred more often for those initi-ating bDMARDs, triple therapy may be suitable for some patients who can tolerate the regimen (since those continuing treatment had an equal likelihood of sustained remission), but fewer patients receiving triple therapy continued treatment (5).
The study by Källmark et al is important, as the use of triple therapy has become less prominent in RA recommendations and guidelines, although it is mentioned in the EULAR recommenda-tions and not highly recommended in the ACR 2020 guidelines (2,4). Since the study was not randomized, it is likely that there was a bias and confounding in patients selected by the treating physi-cians to receive triple therapy, such as perceptions of less active disease, the year in which therapy was commenced, and comor-bidities, as the majority of patients (~75%) received a bDMARD (5). However, the results are consistent with a systematic review of randomized controlled trials by Fleischmann et al which demon-strated that in RA patients with an inadequate response to MTX, triple therapy was 65% less likely to achieve a response according to the ACR criteria for 70% improvement (ACR70) at 6 months compared to a tumor necrosis factor inhibitor (TNFi) added to MTX (6). Results from the meta- analysis at 1 and 2 years had large confidence intervals around the rates of ACR70 responses that were superior numerically, but not statistically, for TNFi.
Since the investigators were primarily interested in the clin-ical effectiveness of both regimens, the Swedish Register study did not consider the costs of treatment, which clearly would favor triple therapy compared to bDMARDs, even with the use of bio-similar bDMARDs (7).
There are implications of the findings of Källmark et al (5). Treatment after MTX with a bDMARD compared to adding con-ventional synthetic DMARDs as triple therapy is more likely to
1Janet E. Pope, MD, MPH, FRCPC: University of Western Ontario and St. Joseph’s Health Care, London, Ontario, Canada; 2Peter Nash, MBBS(Hons), FRACP: Griffith University, Brisbane, Queensland, Australia; 3Roy Fleischmann, MD, MACR: University of Texas Southwestern Medical Center, Dallas.
No potential conflicts of interest relevant to this article were reported.
Address correspondence to Janet E. Pope, MD, MPH, FRCPC, St. Joseph’s Health Care, Division of Rheumatology, 268 Grosvenor Street, London, Ontario N6A 4V2, Canada. Email: [email protected].
Submitted for publication February 8, 2021; accepted in revised form March 18, 2021.

EDITORIAL | 1125
result in sustained remission according to the DAS28- ESR score and be continued because of the better clinical benefit and toler-ability. However, patients who do respond to and tolerate triple therapy are just as likely to achieve and maintain sustained remis-sion according to the DAS28- ESR score; just a smaller percent of patients initially treated do so (5).
It is important to recognize that neither treatment strategy was effective for all patients, with 64% of the patients who were receiv-ing a bDMARD plus MTX versus 52% of the patients who were receiving triple therapy continuing treatment at 1 year and 43% of the patients who were receiving a bDMARD plus MTX versus 35% of the patients who were receiving triple therapy continuing treat-ment at 2 years. Unfortunately, as is true in virtually all registries, precise reasons for discontinuation, such as loss of efficacy and/or adverse events, were unavailable. Long- term sustained remission at 2 years was achieved in ~1 in 6 patients who were completers, and for those who discontinued their therapy, the odds were 1 in 10. This analysis suggests that despite advances in treatment strat-egies and therapeutic options, the likelihood of achieving sustained remission over 2 years with either strategy in rheumatology prac-tices remains low, with more than half of the patients discontinuing treatment by 2 years (5). These results do not bode well for a lifelong chronic disease. In contrast with this analysis, data were slightly better in a large incident cohort of patients with RA (the Canadian Early Arthritis Cohort [CATCH]), which used a more rigorous defini-tion of remission. In that cohort, 55% achieved remission defined as a Simplified Disease Activity Index (SDAI) of ≤3.3, 47% maintained remission at 1 year (25% of the entire cohort), and 40% maintained remission at 2 years (1 in 5 patients in sustained remission) (8). If the CATCH analysis used DAS28- ESR as the metric for remission, the percent of patients achieving remission would approximately dou-ble. A structured approach to RA therapy following best practices is more likely to achieve desirable goals for the patients, but, despite currently available therapies, not all patients respond well.
The chance of remission and drug survival is often worse for patients with RA who are not receiving background MTX (2). Approximately one- third of real- world RA patients receiv-ing bDMARDs are receiving monotherapy (9); we would expect achieving and maintaining sustained remission to be less likely with monotherapy using advanced therapies. As predictors of tolerability and response to medications are lacking, our cur-rent treatment paradigm of blindly choosing a specific treatment option after MTX failure in RA is suboptimal.
The Nordic Rheumatic Diseases Strategy Trials And Reg-istries (NORD- STAR) compared various treatment strategies in early RA patients, including conventional synthetic DMARDs ver-sus biologics (10). The primary outcome was the Clinical Disease Activity Index (CDAI) at 24 weeks. Although biologic strategies in general had a slight numerical advantage, there were no differ-ences between the strategies.
We propose that other treatment options/strategies need to be investigated in hopes of obtaining a prolonged remission
in RA. Tofacitinib, baricitinib (4 mg), and upadacitinib in combi-nation with MTX are at least as effective and in some circum-stances more effective than a TNFi (adalimumab), but there are some questions about their relative risk with respect to safety (11). All therapies need to be balanced with respect to their ben-efit and risk. Perhaps other molecules with different mechanisms of action may yield better and more sustained responses in RA, or we will have combinations of treatment that yield higher and longer responses.
We can argue that the problem is not remission in RA but our measurements of remission. Defining remission using the DAS28 using the C- reactive protein level leads to more patients achieving remission than using a more stringent metric such as the SDAI. Many remission definitions include a patient- reported out-come (PRO) such as patient global assessment, which if removed would result in more patients being classified as in remission, since the patient global assessment is often strongly related to pain, which may be driven by factors unrelated to active RA (i.e., not from clinically detected inflammation) (12). If remission was defined as no detectable disease on metrics such as the CDAI, in combination with a PRO such as the Routine Assessment of Patient Index Data 3 and no detectable inflammation on imaging, then remission would be very rare.
So, with all the money spent on advanced therapies in RA, we haven’t yet achieved remission in most patients, and sus-tained remission for ≥2 years is achieved in a minority. Perhaps biomarkers will provide more rational treatment choices and inform us when to start or stop a medication, but the search for such biomarkers has been disappointing. We may learn lessons from oncology, where pragmatic trials comparing one strategy to another are frequent with front- end loading of medications and frequent alterations to treatment if biomarkers change. We have come a long way over the last 30 years, from waiting rooms filled with RA patients with severe subluxations who required wheel-chairs and had shortened survival, but much scientific inquiry is still needed for patients with RA to achieve the holy grail of sus-tained remission for all— our ultimate goal!
AUTHOR CONTRIBUTIONS
All authors drafted the article, revised it critically for important intellectual content, and approved the final version to be published.
REFERENCES 1. Smolen JS, Aletaha D, Bijlsma JW, Breedveld FC, Boumpas D,
Burmester G, et al. Treating rheumatoid arthritis to target: rec-ommendations of an international task force. Ann Rheum Dis2010;69:631– 7.
2. Smolen JS, Landewé RB, Bijlsma JW, Burmester GR, Dougados M,Kerschbaumer A, et al. EULAR recommendations for the manage-ment of rheumatoid arthritis with synthetic and biological disease- modifying antirheumatic drugs: 2019 update. Ann Rheum Dis2020;79:685– 99.
3. Burmester GR, Pope JE. Novel treatment strategies in rheumatoidarthritis [review]. Lancet 2017;389:2338– 48.

POPE ET AL 1126 |
4. Fraenkel L. 5M018. New ACR recommendations for the manage-ment of rheumatoid arthritis. Presented at ACR Convergence 2020 American College of Rheumatology; 2020 November 5– 9.
5. Källmark H, Einarsson JT, Nilsson JA, Olofsson T, Saxne T, Geborek P, et al. Sustained remission in patients with rheumatoid arthritis receiving triple therapy compared to biologic therapy: a Swedish nationwide register study. Arthritis Rheumatol 2021;73:1135– 44.
6. Fleischmann R, Tongbram V, van Vollenhoven R, Tang DH, Chung J, Collier D, et al. Systematic review and network meta- analysis of the efficacy and safety of tumour necrosis factor inhibitor- methotrexate combination therapy versus triple therapy in rheumatoid arthritis. RMD Open 2017;3:e000371.
7. Bansback N, Phibbs CS, Sun H, O’Dell JR, Brophy M, Keystone EC, et al. Triple therapy versus biologic therapy for active rheumatoid arthritis: a cost- effectiveness analysis. Ann Intern Med 2017;167:8– 16.
8. Schieir O, Hazlewood G, Bartlett S, Valois M, Bessette L, Boire G, et al. Longitudinal patterns of remission in real- world early rheumatoid arthri-tis patients: results from the Canadian Early Arthritis Cohort (CATCH) [abstract]. Arthritis Rheumatol 2020;72 Suppl 10. URL: https://
acrab strac ts.org/abstr act/longi tudin al- patte rns- of- remis sion- in- real- world - early - rheum atoid - arthr itis- patie nts- resul ts- from- the- canad ian- early - arthr itis- cohor t- catch/.
9. Emery P, Sebba A, Huizinga TW. Biologic and oral disease- modifying antirheumatic drug monotherapy in rheumatoid arthritis. Ann Rheum Dis 2013;72:1897– 904.
10. Hetland ML, Haavardsholm EA, Rudin A, Nordstrom D, Nurmonhamed M, Gudbjornsson B, et al. A multicenter randomized study in early rheumatoid arthritis to compare active conventional therapy versus three biological treatments: 24 week efficacy results of the Nord- Star trial [abstract]. Ann Rheum Dis 2020;79 Suppl 1:13.
11. Pfizer. Pfizer shares co- primary endpoint results from post- marketing required safety study of Xeljanz® (tofacitinib) in subjects with rheuma-toid arthritis (RA). January 2021. URL: https://pfizer.com/news/press - relea se/press - relea se- detai l/pfize r- share s- co- prima ry- endpo int- resul ts- post- marke ting.
12. Pope JE, Michaud K. Is it time to banish composite measures for remission in rheumatoid arthritis? [editorial]. Arthritis Care Res (Hoboken) 2019;71:1300– 3.

1127
Arthritis & RheumatologyVol. 73, No. 7, July 2021, pp 1127–1128DOI 10.1002/art.41724© 2021, American College of Rheumatology
E D I T O R I A L
A Good Detective Never Misses a Clue: Why the Epidemiology of Scleritis Deserves Our AttentionMatthew A. Turk1 and James T. Rosenbaum2
Arthur Conan Doyle, who created the fictional detective Sherlock Holmes, was a physician. He intimately understood how detectives and physicians share a common goal: never miss a clue. But since Conan Doyle’s time, advances in technology took our collective focus away from the art of physical examination to a reliance on imaging. The rheumatologic approach to eye dis-ease often epitomizes this trend. One such example is that gazing through an ophthalmoscope on morning rounds has become a vanishing enterprise. This development is disappointing because a majority of rheumatic diseases can affect the eye. Being mind-ful of ocular signs of disease can direct a rheumatologist toward a specific diagnosis, an opportunity good detectives would never miss. In this issue of Arthritis & Rheumatology (A&R), Braith-waite and colleagues provide the most extensive epidemiologic data on scleritis published to date (1). Their observations illus-trate the association between inflammation of the eye’s tunic, the sclera, and rheumatic diseases.
The sclera is the white coating that surrounds the eye. It begins anteriorly at the limbus, the junction between the cornea and conjunctiva. The sclera extends nearly 360 degrees to abut the optic nerve at the back of the eye. Normal scleral vessels are difficult to see, but inflamed scleral vessels generally result in a red and painful eye. They serve as a telling clue to underlying sys-temic inflammation, as up to 50% of patients with scleritis have an associated rheumatic disease (2,3). In some instances, such as antineutrophil cytoplasmic antibody– associated vasculitis, scleri-tis is an early manifestation of systemic disease (4). In contrast, scleritis may occur as a late manifestation, as is often the case with rheumatoid arthritis (RA).
Despite the implications of a diagnosis of scleritis, the rela-tive rarity of scleritis has contributed to a dearth of epidemiologic studies on this topic. Braithwaite and colleagues address this void
by presenting their comprehensive investigation into the epide-miology of scleritis. They took a simple approach to monitoring inflammatory disease– associated scleritis within the population, using coding for visits to a general practitioner. They relied on The Health Improvement Network (THIN), a UK database that allowed them to interrogate the health records of ~11 million individuals from >800 family practices. Three thousand patients had new- onset scleritis. The database contains >2 decades of records that were later paired with controls on the basis of age, sex, location, and socioeconomic status. The study used univariate and mul-tivariate models to compare the incidence of immune- mediated disease in those with scleritis relative to the control group.
While the methods used by Braithwaite and colleagues do not allow for predicting the proportion of rheumatic disease patients who will develop scleritis as addressed in some reviews (5), their results highlight scleritis as an important risk factor asso-ciated with inflammatory disease in the general population. More than a quarter of patients with scleritis had a history of inflam-matory disease, and patients with scleritis were twice as likely to have inflammatory disease compared to the general population. Patients with scleritis were >5 times more likely to have a pre-vious diagnosis of granulomatosis with polyangiitis, RA, reac-tive arthritis, Behçet’s disease (BD), or Sjögren’s syndrome (SS). The authors also analyzed patients who received inflammatory disease diagnoses during their scleritis cohort follow- up. Com-pared to matched controls, those who had scleritis had a ≥2- fold increase in the likelihood of developing systemic lupus erythema-tosus, ankylosing spondylitis, Crohn’s disease, sarcoidosis, or giant cell arteritis in addition to the aforementioned conditions. The incidence of scleritis is declining; Braithwaite and colleagues suggest this might reflect the improving therapy for rheumatic diseases. Other factors such as evolving diagnostic criteria that
Supported by the EULAR Centre for Arthritis and Rheumatic Disease, Research to Prevent Blindness, the Stan and Madelle Rosenfeld Family Trust, the William H. and Mary L. Bauman Foundation, and the Grandmaison Fund for Autoimmunity Research.
1Matthew A. Turk, MSc: St. Vincent’s University Hospital and University College Dublin School of Medicine, Dublin, Ireland; 2James T. Rosenbaum, MD: Oregon Health & Science University and Legacy Devers Eye Institute, Portland.
Dr. Rosenbaum has received consulting fees from AbbVie, UCB, Kyverna, Affibody, Corvus, Horizon, and Immune Response (less than $10,000 each)
and from Novartis and Gilead (more than $10,000 each), research support from Horizon and Pfizer, and receives royalties from UpToDate. No other disclosures relevant to this article were reported.
Address correspondence to Matthew Turk, MSc, St. Vincent’s University Hospital, Elm Park, Dublin 4, D04 T6F4, Ireland. Email: [email protected].
Submitted for publication February 3, 2021; accepted in revised form March 4, 2021.

TURK AND ROSENBAUM 1128 |
allow earlier recognition of disease or better general health could certainly contribute to this trend (6). Between 1997 and 2018, the incidence of scleritis decreased by nearly half from 42 cases to 27 cases per million person- years. Peak incidence of scleritis in women occurs during their 50s, nearly 20 years before the peak incidence in men, and is likely related to sex differences seen in other inflammatory diseases. While Braithwaite et al did observe an increase in the prevalence of scleritis, they attribute it to better record keeping in the THIN database.
Although the epidemiologic data obtained by Braithwaite and colleagues are a quantum step forward, the data are not without flaws. All studies derived from a database such as this rely on the accuracy of coding, and it is widely accepted that coding is not always correct. Although the authors obtained data on >50 infec-tious or immune- mediated diseases that could be associated with scleritis, they failed to find definitive support for some rare but accepted causes of scleritis such as syphilis (7), tuberculosis (8), postoperative infection (9), or adverse response to a medica-tion such as an intravenously administered bisphosphonate (10). They found a major association between scleritis and SS, but they do not distinguish between primary SS and SS that is sec-ondary to a disease such as RA. They also observed a statisti-cally significant association between BD and scleritis. While this is widely accepted, the observation is also based on only 7 patients who had both BD and scleritis. The episclera is a thin layer of cells overlying the sclera. The distinction between episcleritis and scleritis can be difficult, and the two entities often coexist. While separating the two diagnoses might not be straightforward, the distinction has major implications since scleritis is usually painful and often associated with a rheumatic disease, while episcleritis is rarely painful and seldom associated with a systemic illness (11). This type of epidemiologic approach does not allow for robust distinction between scleritis and episcleritis.
Did Conan Doyle know the difference between episcleritis and scleritis? Did he recognize the subset of patients with RA who were most likely to develop scleritis? Certainly, he had never heard of granulomatosis associated with polyangiitis. But Conan Doyle would definitely appreciate how this report based on the THIN
database shows the importance of assessing ocular manifesta-tions in inflammatory disease. Going forward, rheumatologists should have a keen eye for scleritis to find clues that may impress even the best of detectives.
AUTHOR CONTRIBUTIONS
Drs. Turk and Rosenbaum drafted the article, revised it critically for important intellectual content, and approved the final version to be published.
REFERENCES 1. Braithwaite T, Adderley N, Subramanian A, Galloway J, Kempen J,
Gokhale K, et al. Epidemiology of scleritis in the United Kingdom from 1997 to 2018: population- based analysis of 11 million patients andassociation between scleritis and infectious and immune- mediatedinflammatory diseases. Arthritis Rheumatol 2021;73:1267–76.
2. Smith JR, Mackensen F, Rosenbaum JT. Therapy insight: scleritisand its relationship to systemic autoimmune disease [review]. NatClin Pract Rheumatol 2007;3:219– 26.
3. Akpek EK, Thorne JE, Qazi FA, Do DV, Jabs DA. Evaluation ofpatients with scleritis for systemic disease. Ophthalmology 2004;111:501– 6.
4. Hoang LT, Lim LL, Vaillant B, Choi D, Rosenbaum JT. Antineutrophilcytoplasmic antibody- associated active scleritis. Arch Ophthalmol2008;126:651– 5.
5. Turk MA, Hayworth JL, Nevskaya T, Pope JE. Ocular manifestationsin rheumatoid arthritis, connective tissue disease, and vasculitis: asystematic review and metaanalysis. J Rheumatol 2021;48:25– 34.
6. Zhang T, Pope J. Cervical spine involvement in rheumatoid arthri-tis over time: results from a meta- analysis. Arthritis Res Ther 2015;17:148.
7. Rosenbaum JT, Rifkin LM, Buch KA, Barshak MB, Hoang MP. Case8– 2019: a 58- year- old woman with vision loss, headaches, and oralulcers. N Engl J Med 2019;380:1062– 71.
8. Thompson MJ, Albert DM. Ocular tuberculosis [review]. ArchOphthalmol 2005;123:844– 9.
9. Fourman S. Scleritis after glaucoma filtering surgery with mitomycinC. Ophthalmology 1995;102:1569– 71.
10. Hemmati I, Wade J, Kelsall J. Risedronate- associated scleritis:a case report and review of the literature [review]. Clin Rheumatol2012;31:1403– 5.
11. Jabs DA, Mudun A, Dunn JP, Marsh MJ. Episcleritis and scleritis:clinical features and treatment results. Am J Ophthalmol 2000; 130:469– 76.

1129
Arthritis & RheumatologyVol. 73, No. 7, July 2021, pp 1129–1134DOI 10.1002/art.41656Published 2021. This article is a U.S.Government work and is in the public domain in the USA.
B R I E F R E P O R T
Risk Factors for COVID- 19 and Rheumatic Disease Flare in a US Cohort of Latino PatientsAlice Fike, Julia Hartman, Christopher Redmond, Sandra G. Williams, Yanira Ruiz- Perdomo, Jun Chu, Sarfaraz Hasni, Michael M. Ward, James D. Katz, and Pravitt Gourh
Objective. Latino patients are overrepresented among cases of coronavirus disease 2019 (COVID- 19) and are at an increased risk of severe disease. Prevalence of COVID- 19 in Latinos with rheumatic diseases is poorly reported. This study was undertaken to characterize COVID- 19 clinical features and outcomes in Latino patients with rheumatic diseases.
Methods. We conducted a retrospective study of Latino patients with rheumatic diseases from an existing observational cohort in the Washington, DC area. Patients seen between April 1, 2020 and October 15, 2020 were analyzed in this study. We reviewed demographic characteristics, body mass index (BMI), comorbidities, and use of immunomodulatory therapies. An exploratory classification and regression tree (CART) analysis along with logistic regression analyses were performed to identify risk factors for COVID- 19 and rheumatic disease flare.
Results. Of 178 Latino patients with rheumatic diseases, 32 (18%) were identified as having COVID- 19, and the incidence rate of infection was found to be 3- fold higher than in the general Latino population. No patients required intensive care unit– level care. A CART analysis and multivariable logistic regression analysis identified a BMI of >30.35 as a risk factor for COVID- 19 (odds ratio [OR] 3.37 [95% confidence interval (95% CI) 1.5– 7.7]; P = 0.004). COVID- 19 positivity was a risk factor for rheumatic disease flare (OR 4.57 [95% CI 1.2– 17.4]; P = 0.02).
Conclusion. Our findings indicate that Latino patients with rheumatic diseases have a higher rate of COVID- 19 compared with the general Latino population. Obesity is a risk factor for COVID- 19, and COVID- 19 is a risk factor for rheumatic disease flare. Latino patients with risk factors should be closely followed up, especially post– COVID- 19 in anticipation of disease flare.
INTRODUCTION
Severe acute respiratory syndrome coronavirus 2 (SARS– CoV- 2) is a highly contagious, novel coronavirus with high mor-bidity and mortality, and its impact has been amplified by social disparities in the US (1– 5). Risk factors for higher morbidity and mortality with coronavirus disease 2019 (COVID- 19) include age >65 years, obesity, and comorbidities such as hypertension, diabetes mellitus, and lung disease (6,7). Patients with rheu-matic diseases could especially be at risk of complications from COVID- 19 due to immune system dysfunction and concomitant use of immunomodulatory therapies. However, evidence on outcomes of COVID- 19 in patients with rheumatic diseases has
been conflicting to date. Initial reports (8) revealed no unique or outstanding risk factors, apart from what has already been noted in the general population. An Italian study indicated a possible increased incidence of COVID- 19 in patients with rheumatic diseases (9).
Studies of COVID- 19 in patients with rheumatic diseases have focused on risk factors for morbidity and mortality directly attributable to SARS– CoV- 2 infection. The potential effects of COVID- 19 on the trajectory of the underlying rheumatic disease have not been characterized. Infectious agents have been pro-posed as an environmental trigger for autoimmunity, and viral infections are a known trigger for rheumatic disease flares. There-fore, it may be anticipated that patients with a rheumatic disease
Supported by the Intramural Research Programs of the National Institute of Arthritis and Musculoskeletal and Skin Diseases and the National Institute on Minority Health and Health Disparities, NIH.
Alice Fike, MSN, Julia Hartman, BS, Christopher Redmond, MD, Sandra G. Williams, MD, PhD, Yanira Ruiz- Perdomo, MSN, Jun Chu, MSN, Sarfaraz Hasni, MD, Michael M. Ward, MD, James D. Katz, MD, Pravitt Gourh, MD: National Institute of Arthritis and Musculoskeletal and Skin Diseases, NIH, Bethesda, Maryland.
Ms. Hartman and Dr. Redmond contributed equally to this work.No potential conflicts of interest relevant to this article were
reported.Address correspondence to Pravitt Gourh, MD, 10 Center Drive, 10th
Floor Room 13 C101, Bethesda, MD 20892. Email: [email protected] for publication December 8, 2020; accepted in revised form
January 12, 2021.

FIKE ET AL 1130 |
and SARS– CoV- 2 infection would be at a higher subsequent risk of a flare of the baseline rheumatic disease.
Latinos represent the largest and fastest growing minor-ity population in the US. Latinos living in the US not only have a higher prevalence of obesity, diabetes, and kidney disease, but also have lower rates of insurance coverage than the general pop-ulation (10,11). Latinos are more likely to work in positions con-sidered to be essential, thus increasing their risk of exposure to infections (12). Such jobs often provide limited or no sick time, further perpetuating the increased risk to Latino workers (13). The combination of these factors has led to a disproportionate impact of COVID-19 on Latino patients, resulting in increased incidence, severity of disease, and mortality (1,3– 5).
At the National Institute of Arthritis and Musculoskeletal and Skin Diseases (NIAMS) rheumatology clinic, we follow up a diverse cohort of patients with rheumatic diseases, the majority of whom are Latina women, 75% of whom were born in Central America or Mexico with the remainder born in South America or the Ca rib-bean. These patients have a representative mix of autoimmune diseases typically seen in outpatient settings, with most patients receiving immunomodulatory therapy. Given the importance of understanding the risk of COVID- 19 in Latino patients with rheu-matic diseases, we investigated risk factors for SARS– CoV- 2 infection and subsequent rheumatic disease flare.
PATIENTS AND METHODS
Study cohort. All patients consented to and were partic-ipants in an institutional review board– approved natural history study at the Intramural Research Program of the NIAMS. The patients were part of an observational cohort of 307 active par-ticipants with rheumatic diseases who were referred to our clinic primarily from federally qualified health centers in the local area. All participants were contacted from April 1, 2020 to June 1, 2020 by telephone and were made aware of COVID- 19 symptoms and informed of the steps to follow in case of exposure to or infection with SARS– CoV- 2. Patients were further assessed for COVID- 19 symptoms or exposure prior to each in- person contact (i.e., lab-oratory testing or clinic visit), as well as during each virtual clinic appointment. During the study period from April 1, 2020 to Octo-ber 15, 2020, we identified 32 patients with COVID- 19, and all of them were of self- reported Latino ethnicity. No non- Latino patients (n = 81) reported COVID- 19 infection during the study period. Latino patients seen during the study period who were asymptomatic for COVID- 19 and denied having any exposure (but were not tested for COVID- 19) were selected as a comparator group (n = 146).
SARS– CoV- 2 infection. SARS– CoV- 2 infection was defined as a confirmed SARS– CoV- 2 viral RNA real- time polymerase chain reaction (PCR) test result or the presence of anti– SARS– CoV- 2 antibodies. Antibodies to SARS– CoV- 2 were detected using the Elecsys anti– SARS– CoV- 2 immunoassay (Roche Diagnostics).
Given the difficulty in obtaining real- time PCR testing to detect SARS– CoV- 2 during the early phases of the pandemic, we also included 1 patient with COVID- 19– like symptoms who was not tested but had a close household contact with COVID- 19 (Table 1).
Study design and data collection. This was a retrospec-tive study using an existing observational cohort. The following variables were recorded: demographic characteristics, rheumatic disease type, disease flare, body mass index (BMI), comorbidities (hypertension, diabetes mellitus, previous lung disease), current immunomodulatory treatment, changes to immunomodulatory treatment, glucocorticoids (mg) received before and after infec-tion, and mortality. For SARS– CoV- 2– positive patients, we also reported COVID- 19 manifestations, management, and hospital-ization course. Due to the heterogeneous nature of the cohort, rheumatic disease flare was defined as any escalation of immu-nomodulatory therapy. The COVID- 19 incidence rate for Latino residents of the local area was calculated using local health department case counts as the numerator (14) and census data (15) as the denominator, with results reported as a range of cases reported by the counties and municipalities comprising the area.
Statistical analysis. Data on continuous variables are expressed as the mean ± SD, and categorical variables are sum-marized as the number (%) of patients. Given our small cohort size and multiple variables, we adopted a complementary analytic strat-egy utilizing a traditional logistic regression approach to identify risk factors for COVID- 19, along with an exploratory classification and regression tree (CART) method. CART analysis focuses on identify-ing a subgroup of patients characterized by a set of interacting risk factors, whereas logistic regression focuses on identifying risk factors that have independent associations with the outcome. A CART anal-ysis was performed to identify COVID- 19 risk factors using age and BMI as continuous variables and sex and presence of comorbidities as categorical variables (Minitab 20.1.1). To identify risk factors for rheumatic disease flare, a CART analysis using COVID- 19 status and missed immunomodulatory treatments as covariates was per-formed. CART results were analyzed using a 2- tailed mid- P exact test. Multivariate logistic regression analyses were performed to iden-tify risk factors for COVID- 19 and rheumatic disease flare (SAS 9.4). Univariate logistic regression analyses using various immunomodula-tory treatments were performed to identify risk factors for COVID- 19.
RESULTS
Patient population. A total of 178 Latino patients with rheu-matic diseases were included in our analysis. The 32 patients who were diagnosed as having COVID- 19 were predominantly women (91%) with a mean age of 46 years. Demographic and other (non–COVID-19) clinical characteristics in this group were generally similar to those in the COVID- 19– negative group (Table 1). All of the COVID- 19 patients were either essential workers themselves

COVID- 19 RISK AND RHEUMATIC DISEASE FLARE IN US LATINO COHORT | 1131
or lived with an essential worker. The majority were uninsured (25 of 32 [78.1%]). None of the COVID- 19 patients were smokers. The mean BMI of the COVID- 19 patients was higher than that of the COVID- 19– negative patients (32.5 versus 29.7) (Table 1). Preva-lence of hypertension, diabetes mellitus, and previous lung disease was similar between the 2 groups. All but 2 patients were receiving immunomodulatory treatment at the time of COVID- 19 diagnosis. Immunomodulatory medications were paused during COVID- 19 infection in 14 of 30 patients (46.7%). The COVID- 19 incidence rate in our cohort was 17,978 per 100,000 persons, which was 3- fold higher than the 4,689– 5,809 per 100,000 persons incidence rate observed in the Latino residents and 5- to 11- fold higher than the 1,540– 3,431 per 100,000 persons for the general population, both within the local catchment areas, during the study period.
Clinical symptoms and disease management in patients with rheumatic diseases and COVID- 19. All patients who pre-sented with COVID- 19 developed symptoms, with cough and/or fever present in 66% of patients (Figure 1A). SARS– CoV- 2 infection
was confirmed by real- time PCR in 25 of 26 patients, and 5 of the remaining 6 patients were found to have antibodies to SARS– CoV- 2 (Table 1). One individual could not obtain real- time PCR testing and received a subsequent negative antibody test result 4 months later but had classic COVID- 19 symptoms and a COVID- 19– positive household contact. Most patients (81%) required only outpatient treatment for COVID- 19 (Figure 1B). Two of the 6 hospitalized patients required supplemental oxygen and have since recovered completely. No patients required admission to the intensive care unit, and no deaths were reported in this cohort.
Treatment regimens for patients with rheumatic diseases and COVID- 19. The most common rheumatic dis-ease treatment category was conventional disease- modifying antirheumatic drugs (Table 1 and Figures 1C and D). COVID- 19– positive patients had lower glucocorticoid usage (21.9%) with a higher mean daily dose (7.4 mg) (Table 1). Of the COVID- 19 patients, 75.0% were being treated with hydroxychloroquine,
Table 1. Characteristics of the patients with rheumatic diseases by COVID- 19 status*
COVID- 19– positive patients(n = 32)
COVID- 19– negative patients(n = 146)
Demographic characteristicsAge, mean ± SD years 46 ± 8.1 48.7 ± 9.9Female sex 29 (90.6) 125 (85.6)Male sex 3 (9.4) 21 (14.4)
BMI, mean ± SD kg/m2 32.5 ± 6.1 29.7 ± 5.0Comorbidities 9 (28.1) 36 (24.7)
Hypertension 7 (21.9) 32 (21.9)Diabetes mellitus 2 (6.3) 12 (8.2)Previous lung disease 3 (9.4) 5 (3.4)
Rheumatic diseaseRA 14 (43.8) 73 (50.0)SLE 8 (25.0) 44 (30.1)Overlap/MCTD 3 (9.4) 3 (2.1)Other inflammatory/autoimmune (ANCA- associated
vasculitis, PsA, primary SS, AS, SSc)7 (21.9) 24 (16.4)
Other noninflammatory (FM) 0 (0) 2 (1.4)Medications
Glucocorticoids 7 (21.9) 56 (38.4)Average daily dose, mean ± SD mg 7.4 ± 6.3 5.5 ± 2.4
cDMARDs 26 (81.3) 119 (81.5)Biologic/small- molecule inhibitor 13 (40.6) 45 (36.0)†
COVID- 19Symptoms present 32 (100) – Known COVID- 19 contact‡ 24 (82.8) – COVID- 19 real- time PCR§ 25 (96.2) – COVID- 19 serology¶ 23 (85.2) – COVID- 19 real- time PCR or serology 31 (96.9) – COVID- 19 real- time PCR or serology or known contact 32 (100) –
* Except where indicated otherwise, values are the number (%) of patients. COVID- 19 = coronavirus disease 2019;BMI = body mass index; RA = rheumatoid arthritis; SLE = systemic lupus erythematosus; MCTD = mixed connective tissue disease; ANCA = antineutrophil cytoplasmic antibody; PsA = psoriatic arthritis; SS = Sjögren’s syndrome; AS = ankylosing spondylitis; SSc = systemic sclerosis; FM = fibromyalgia; cDMARDs = conventional disease- modifying antirheumatic drugs; PCR = polymerase chain reaction. † Data were available for a total of 125 patients. ‡ Data were available for a total of 29 patients. § Data were available for a total of 26 patients. ¶ Data were available for a total of 27 patients.

FIKE ET AL 1132 |
whereas 40.6% were being treated with biologics or small- molecule inhibitors (Table 1 and Figures 1C and D).
Risk factors for COVID- 19 infection in patients with rheumatic diseases. Next, we wanted to explore risk factors for COVID- 19. CART analysis identified a BMI of >30.35 as the main COVID- 19 risk factor, observed in 62.5% of patients (P = 0.004) (Figure 2A). Among the nonobese patients, age >39.5 years was identified as the main risk factor. As an alterna-tive approach, we performed a multivariable logistic regression analysis using all the above variables (age, sex, BMI, diabetes, hypertension, and previous lung disease) and identified BMI as a risk factor for COVID- 19 (odds ratio [OR] 3.37 [95% confidence interval (95% CI) 1.5– 7.7] for a BMI of >30.35 versus <30.35; P = 0.004) (Figure 2C).
Effect of rheumatic disease treatment on risk of COVID- 19 infection. We then examined whether specific therapeutic agents played a role in increasing susceptibility to COVID- 19. Univariate logistic regression analysis of each type of immunomodulatory therapy was performed to identify risk fac-tors for COVID- 19 (Figure 2E). None of the immunomodulatory therapies demonstrated any statistically significant effect on sus-ceptibility to or protection against COVID- 19.
Follow-up of patients with COVID- 19 and rheumatic diseases. Twenty-seven patients (84%) were evaluated in clinic after COVID-19, and 8 were experiencing a rheumatic disease flare. The median oral glucocorticoid dose increased from 0 mg to 12.5 mg daily. Persistent symptoms attributable to COVID- 19 were seen in 10 patients (31.3%) (anosmia [n = 3], new gener-alized alopecia [n = 3], new or worsened headaches [n = 2], new peripheral neuropathy [n = 1], and weight loss >10% due to anorexia [n = 1]).
Risk factors for disease flare in patients with COVID- 19 and rheumatic diseases. Of the 8 patients with rheumatic dis-ease flare and COVID- 19, in 2 the rheumatic disease had been in sustained remission and they were not receiving immunomod-ulatory therapy, 2 had temporarily discontinued therapy, and the remaining 4 had no interruptions in therapy. We explored the role of COVID- 19 positivity and interruptions in immunomodulatory ther-apy in the risk of disease flares. CART analysis identified COVID- 19 positivity as a risk factor for disease flares (P = 0.0007) (Figure 2B). In COVID- 19– negative patients, interruptions in immunomodu-latory therapy were identified as a risk factor for disease flares (P = 0.00003) (Figure 2B). Multivariate logistic regression analysis also identified COVID- 19 positivity as a risk factor for disease flare (OR 4.57 [95% CI 1.2– 17.4]; P = 0.02) (Figure 2D).
Figure 1. Pie radar charts of clinical characteristics of Latino patients with rheumatic diseases. A, Presenting symptoms of coronavirus disease 2019 (COVID- 19) in patients with a rheumatic disease. B, Management of COVID- 19 in patients with a rheumatic disease. C, Baseline immunomodulatory treatment profile of COVID- 19– positive patients with a rheumatic disease. D, Baseline immunomodulatory treatment profile of COVID- 19– negative patients with a rheumatic disease. URI = upper respiratory tract infection; ER = emergency room; GCs = glucocorticoids; cDMARDs = conventional disease- modifying antirheumatic drugs; HCQ = hydroxychloroquine; JAKi = JAK inhibitor; TNFi = tumor necrosis factor inhibitor; bio- nonTNFi = non- TNFi biologic agents.

COVID- 19 RISK AND RHEUMATIC DISEASE FLARE IN US LATINO COHORT | 1133
DISCUSSION
We followed up a unique cohort of Latino patients with estab-lished rheumatic diseases who are essential workers or living with essential workers and are at the forefront of the COVID- 19 pan-demic. In our cohort, Latino patients with rheumatic diseases had a higher incidence of COVID- 19 as compared to Latino residents within the same geographic region, but none had a poor out-come. We identified obesity and increasing age as risk factors for COVID- 19. The presence of COVID- 19 along with interruptions in immunomodulatory therapy were found to be risk factors for rheumatic disease flares. None of the specific immunomodulatory therapies increased the risk of COVID- 19.
Patients in our cohort and their family members repre-sent essential and frontline workers and thus were already at an increased risk of exposure to COVID- 19. Therefore, sociodemo-graphic factors likely greatly contributed to the increased incidence of COVID- 19 in our cohort. Previously published studies suggest that Latino patients are more likely to develop severe COVID- 19 and have a worse outcome. None of the patients with COVID- 19 in the present study required mechanical ventilation or had a poor outcome, although 2 did meet criteria for severe disease. Possible
explanations for milder disease in our patient population could include younger age, a greater proportion of female patients, rela-tively mild preexisting conditions, limited pre- infection glucocorticoid exposure, and perhaps mitigating effects of existing immunomod-ulatory therapy. It is possible that asymptomatic individuals with COVID- 19 were missed because COVID- 19– negative patients were not tested by real- time PCR for SARS– CoV- 2. Conversely, this would have increased the number of COVID- 19– positive cases and increased our incidence rate even further. Given that younger individuals with COVID- 19 are more likely to be asymptomatic, the association we found between age >39.5 years and COVID- 19 may be explained by a higher prevalence of symptomatic infection in older individuals.
An interesting finding from our study was the identification of a BMI of >30.35 as a risk factor for COVID- 19 infection. A BMI of >30 is the definition of obesity, and the finding of a BMI of >30.35 by CART analysis is notable. Obesity has been doc-umented as a risk factor for severe COVID- 19 requiring hospi-talization, but its role in increased susceptibility to infection has not been evaluated. Obesity affects metabolic and immune func-tioning, leading to increased COVID- 19 risk. Another important observation was that COVID- 19 infection increases the risk of
Figure 2. Risk factors for coronavirus disease 2019 (COVID- 19) infection and rheumatic disease flare. A, Classification and regression tree (CART) analysis predicting risk variables for COVID- 19 infection. Body mass index [BMI] and age were included as continuous variables, and sex, hypertension, diabetes mellitus, and previous lung disease were included as categorical variables in the model. B, CART analysis predicting risk variables for rheumatic disease flare. COVID- 19 status and missing or stopping treatment were included in the model as categorical variables. C, Multivariate logistic regression analysis for identification of risk factors for COVID- 19. Age >39.5 years, sex, BMI >30.35, diabetes mellitus (DM), hypertension (HTN), and previous lung disease were used as covariates in the model. D, Multivariate logistic regression analysis for identification of risk factors for rheumatic disease flare. Missing or stopping treatment and COVID- 19 status were used as covariates in the model. E, Univariate logistic regression analysis of immunomodulatory treatment for identification of risk factors for COVID- 19. Non– tumor necrosis factor inhibitor biologic agents, HCQ, cDMARDs, small- molecule inhibitors (JAKi), TNFi, and GCs were included in the model. Values in C–E are the odds ratios with 95% confidence intervals. See Figure 1 for other definitions.

FIKE ET AL 1134 |
disease flares in patients with rheumatic disease. This risk attrib-uted to COVID- 19 was independent of interruptions in immu-nomodulatory treatments. Rheumatologists should closely follow up patients who report a history of COVID-19, in anticipation of a potential rheumatic disease flare in the postinfection period. Immunomodulatory treatments did not play a role in increasing COVID- 19 susceptibility, but our study sample size may have low statistical power to detect associations with individual medications. Potentially, immunomodulatory therapies may play a beneficial role in patients with rheumatic disease who contract COVID- 19.
Strengths of our study include a longitudinal, well- established Latino patient cohort, reducing referral bias. Our study allowed for self- reporting of infection, thus reducing the selection bias toward enrollment of sicker patients, as seen in previous reports of COVID- 19 in Latino patients. We captured a representative sam-ple of our cohort, with 178 of 226 Latino participants (79%) being assessed during the study period.
Despite these strengths, there are important limitations to this study. It was a retrospective, observational study from a single site, thus limiting the generalizability of the findings. Our cohort of patients and their family members represent essential and frontline workers, who are at an increased risk of exposure to SARS– CoV- 2, and this could have led to a selection bias. Surveillance bias due to increased awareness and testing of our patients because of their rheumatic diseases and immunosuppression could have led to increased identification of COVID- 19 in our cohort. An Italian study indicated a similar increase in the prevalence of COVID- 19 in patients with systemic autoimmune diseases (9). Smoking may be a confounder and was not assessed in this study. None of the COVID- 19– positive patients were smokers and thus we could not use this variable in our multivariate analysis. We did include previous lung disease as a covariate that could potentially capture some effects of smoking (both active and passive). Further, we did not assess for commu-nity exposure duration or the level of community spread specific to individual patients, and risk of exposure was likely influenced by these factors that we could not capture in our analyses.
In this study of Latino patients with rheumatic diseases, a higher prevalence of COVID- 19 was observed, with obesity iden-tified as a risk factor. COVID- 19 positivity was identified as a risk factor for rheumatic disease flare. COVID- 19 infection– related poor outcomes were not observed, but persistent COVID- 19 symptoms were reported. Future studies including marginalized populations, with larger sample sizes from different geographic locations, including younger patients, and with longer follow- up periods, are warranted to confirm these findings.
AUTHOR CONTRIBUTIONS
All authors were involved in drafting the article or revising it critically for important intellectual content, and all authors approved the final version to be published. Dr. Gourh had full access to all of the data in the study and takes responsibility for the integrity of the data and the accuracy of the data analysis.Study conception and design. Fike, Redmond, Ward, Gourh.
Acquisition of data. Fike, Hartman, Redmond, Williams, Ruiz-Perdomo, Chu, Hasni, Katz, Gourh.Analysis and interpretation of data. Fike, Hartman, Ward, Gourh.
REFERENCES 1. Stokes EK, Zambrano LD, Anderson KN, Marder EP, Raz KM,
Felix SE, et al. Coronavirus disease 2019 case surveillance: United States, January 22- May 30, 2020. MMWR Morb Mortal Wkly Rep 2020;69:759– 65.
2. Price- Haywood EG, Burton J, Fort D, Seoane L. Hospitalization and mortality among black patients and white patients with Covid- 19. N Engl J Med 2020;382:2534– 43.
3. Azar KM, Shen Z, Romanelli RJ, Lockhart SH, Smits K, Robinson S, et al. Disparities in outcomes among COVID- 19 patients in a large health care system in California. Health Aff (Millwood) 2020;39: 1253– 62.
4. Weng CH, Saal A, Butt WW, Chan PA. Characteristics and clinical outcomes of COVID- 19 in Hispanic/Latino patients in a community setting: a retrospective cohort study. J Med Virol 2021;93:115– 7.
5. Goldfarb IT, Clapp MA, Soffer MD, Shook LL, Rushfirth K, Edlow AG, et al. Prevalence and severity of coronavirus disease 2019 (COVID- 19) illness in symptomatic pregnant and postpartum women stratified by Hispanic ethnicity [letter]. Obstet Gynecol 2020; 136: 300– 2.
6. Wu Z, McGoogan JM. Characteristics of and important lessons from the coronavirus disease 2019 (COVID- 19) outbreak in China: sum-mary of a report of 72314 cases from the Chinese Center for Disease Control and Prevention. JAMA 2020;323:1239– 42.
7. Grasselli G, Zangrillo A, Zanella A, Antonelli M, Cabrini L, Castelli A, et al. Baseline characteristics and outcomes of 1591 patients infected with SARS- CoV- 2 admitted to ICUs of the Lombardy region, Italy. JAMA 2020;323:1574– 81.
8. Gianfrancesco MA, Hyrich KL, Gossec L, Strangfeld A, Carmona L, Mateus EF, et al. Rheumatic disease and COVID- 19: initial data from the COVID- 19 Global Rheumatology Alliance provider registries. Lancet Rheumatol 2020;2:e250– 3.
9. Ferri C, Giuggioli D, Raimondo V, Fallahi P, Antonelli A, on behalf of the COVID- 19 and ASD Italian Study Group. COVID- 19 in Italian patients with rheumatic autoimmune systemic diseases [letter]. Ann Rheum Dis 2020. E- pub ahead of print.
10. Centers for Disease Control and Prevention. National Center for Health Statistics. Tables of summary health statistics for the US pop-ulation: 2018 National Health Interview Survey. URL: https://www.cdc.gov/nchs/nhis/shs/tables.htm.
11. Schneiderman N, Llabre M, Cowie CC, Barnhart J, Carnethon M, Gallo LC, et al. Prevalence of diabetes among Hispanics/Latinos from diverse backgrounds: the Hispanic Community Health Study/Study of Latinos (HCHS/SOL). Diabetes Care 2014;37:2233– 9.
12. Goldman N, Pebley AR, Lee K, Andrasfay T, Pratt B. Racial and eth-nic differentials in COVID- 19- related job exposures by occupational status in the US [preprint]. medRxiv 2020. E- pub ahead of print.
13. Zhai Y, Santibanez TA, Kahn KE, Black CL, de Perio MA. Paid sick leave benefits, influenza vaccination, and taking sick days due to influenza- like illness among US workers. Vaccine 2018;36: 7316– 23.
14. District of Columbia COVID- 19 surveillance data 2020. URL: https://coron avirus.dc.gov/data.
15. Census.gov. Census.gov Quickfacts Maryland; Montgomery County, Maryland; Fairfax County, Virginia; Prince George’s County, Maryland; District of Columbia 2020. URL: https://www.census.gov/quick facts/ fact/table/ MD,montg omery count ymary land,fairf axcou ntyvi rgini a, princ egeor gesco untym aryla nd,DC/PST04 5219.

1135
Arthritis & RheumatologyVol. 73, No. 7, July 2021, pp 1135–1144DOI 10.1002/art.41720© 2021 The Authors. Arthritis & Rheumatology published by Wiley Periodicals LLC on behalf of American College of Rheumatology.This is an open access article under the terms of the Creative Commons Attribution- NonCommercial- NoDerivs License, which permits use and distribution in any medium, provided the original work is properly cited, the use is non- commercial and no modifications or adaptations are made.
Sustained Remission in Patients With Rheumatoid Arthritis Receiving Triple Therapy Compared to Biologic Therapy: A Swedish Nationwide Register StudyHanna Källmark,1 Jon T. Einarsson,1 Jan- Åke Nilsson,2 Tor Olofsson,1 Tore Saxne,1 Pierre Geborek,1 and Meliha C. Kapetanovic1
Objective. To compare the real- life effectiveness of biologic therapy (a biologic disease- modifying antirheumatic drug plus methotrexate [MTX]) versus triple therapy (MTX plus sulfasalazine plus hydroxychloroquine/chloroquine) for sustained remission of rheumatoid arthritis (RA).
Methods. RA patients who were registered in the nationwide Swedish Rheumatology Quality Register between 2000 and 2012 and were receiving biologic or triple therapy as a first treatment strategy after MTX monotherapy were included. Sustained remission was defined as a Disease Activity Score in 28 joints (DAS28) of <2.6 for ≥6 months (short- term sustained remission) or for ≥24 months (long- term sustained remission). Treatment groups were compared during treatment, at 1 year, and at 2 years for 1) all patients starting therapy and 2) patients continuing to receive therapy, using propensity score– adjusted regression analyses. In addition, survival analyses were used to compare treatment groups at any time during follow- up irrespective of therapy retention.
Results. A total of 1,502 patients were included (1,155 receiving biologic therapy and 347 receiving triple therapy). For patients starting therapy, the adjusted odds ratios (ORs) of achieving short- term and long- term remission, respectively, at 1 year after start of biologic therapy versus triple therapy were 1.79 (95% confidence interval [95% CI] 1.18– 2.71) and 1.86 (95% CI 1.00– 3.48). At 2 years, the ORs were 1.92 (95% CI 1.21– 3.06) and 1.62 (95% CI 0.94– 2.79), respectively. For patients continuing to receive therapy, corresponding results at 1 year were 1.12 (95% CI 0.72– 1.75) and 1.1 (95% CI 0.59– 2.16); at 2 years, 0.85 (95% CI 0.49– 1.47) and 0.76 (95% CI 0.41– 1.39). Hazard ratios for short- term and long- term sustained remission at any time during follow- up were 1.15 (95% CI 0.91– 1.46) and 1.09 (95% CI 0.77– 1.54), respectively.
Conclusion. Among patients starting biologic or triple therapy, biologic therapy was more effective for remaining on therapy and achieving sustained remission. However, similar probabilities were found for achieving sustained remission among patients remaining on therapy and at any time during follow- up irrespective of therapy retention. Although the likelihood of reaching sustained remission is higher with biologic therapy, for certain RA patients triple therapy may still be an alternative to biologic therapy without hampering future chances of obtaining sustained remission.
INTRODUCTION
Rheumatoid arthritis (RA) is a chronic inflammatory disease that primarily affects the joints (1,2). RA causes substantial pain and morbidity, as well as a considerable socioeconomic burden due to expensive treatments, impaired function, and decreased
work capacity (1,3– 5). Current RA management guidelines rec-ommend a treat- to- target approach with early initiation of disease- modifying antirheumatic drugs (DMARDs) (6,7). Methotrexate (MTX), currently regarded as an anchor drug in RA, is sufficient as monotherapy in 25– 40% of patients (1,8,9). For the remain-ing patients, MTX monotherapy is insufficient, and the treatment
Supported by grants from the Swedish Rheumatism Association, Lund University Faculty of Medicine, the Alfred Österlund Foun-dation, the Greta and Johan Kock Foundation, King Gustaf V’s 80- Year Foundation, Lund University Hospital, the Professor Nanna Svartz Foundation, and the Anna- Greta Crafoord Foundation for Rheumatology Research.
1Hanna Källmark, MD, Jon T. Einarsson, MD, PhD, Tor Olofsson, MD, PhD, Tore Saxne, MD, PhD, Pierre Geborek MD, PhD, Meliha C. Kapetanovic, MD,
PhD: Lund University and Skåne University Hospital, Lund, Sweden; 2Jan- Åke Nilsson, PhD: Lund University, Lund, Sweden.
Drs. Källmark and Einarsson contributed equally to this work.No potential conflicts of interest relevant to this article were reported.Address correspondence to Meliha C. Kapetanovic, MD, PhD, Kioskgatan
5, Lund SE- 221 85, Sweden. Email: [email protected] for publication April 24, 2020; accepted in revised form March
2, 2021.

KÄLLMARK ET AL 1136 |
is changed or stepped up (6,7). Alternative treatment regimens include conventional triple therapy (MTX plus sulfasalazine [SSZ] plus hydroxychloroquine [HCQ]) or the addition of a biologic DMARD (bDMARD) to MTX (6,7). In this scenario, randomized controlled trials have had somewhat conflicting results, although larger benefits of adding a bDMARD to MTX as compared to using conventional triple therapy have been reported (10– 16). Patients receiving triple therapy reported a numerically higher total num-ber of adverse events (10,11) and discontinued treatment due to adverse events more often (10– 13), whereas the risk for serious infections is higher with biologic therapies (17).
Despite the introduction of biosimilars, biologic therapy is still more expensive than triple therapy (18), and comparisons between these strategies are relevant for patients with contrain-dications to biologic therapies, as well as with regard to the allo-cation of health care resources. Sustained remission is advocated as an important treatment goal in RA (6,19). To our knowledge, no previous register studies investigating the relative effectiveness of these strategies for sustained remission in daily clinical practice have been conducted.
The objective of this nationwide register study was to com-pare the real- life effectiveness, measured as achievement of sustained remission, of biologic therapy (a bDMARD plus MTX) versus triple therapy (MTX plus SSZ plus HCQ/chloroquine [CQ]) as a first treatment strategy after an inadequate response to MTX monotherapy.
PATIENTS AND METHODS
Study design. Data were collected from the Swedish Rheu-matology Quality Register (SRQ). The SRQ is a national register for patients with rheumatic diseases, including data from 56 rheu-matology units from throughout Sweden (20). The SRQ is used for both research and daily clinical practice (20). Normally, health care providers add information about their patients’ disease activity and treatments as well as laboratory test results, e.g., erythrocyte sed-imentation rate (ESR) and C- reactive protein (CRP) level, at every follow- up visit, and patients register self- assessments (20,21). The estimated national coverage for patients with RA in the SRQ was 60% in 2009 and 83% in 2012 (22,23). No estimates of national coverage before 2009 are available.
Adult patients (ages ≥16 years) with a clinical diagnosis of RA who were registered in the SRQ from January 1, 2000 to December 31, 2012 and initiated biologic therapy (a bDMARD plus MTX) or triple therapy (MTX plus SSZ plus HCQ/CQ) as first treatment strategy after an inadequate response to MTX mon-otherapy were included. Follow- up data were available until December 31, 2014. Only patients with relatively early RA, reg-istered in the SRQ within 2 years from symptom onset, were included. Patients were not included if their disease was in remis-sion (Disease Activity Score in 28 joints [DAS28] <2.6) at the start of biologic or triple therapy. However, patients with missing
DAS28 scores at the start of biologic or triple therapy were not excluded. To enable calculations of sustained remission periods, at least 3 visits (including the therapy initiation visit) recorded in the SRQ and ≥12 months from symptom onset to the last regis-tered visit were required. A flow chart of the study population is depicted in Figure 1.
Treatment start (baseline) was defined as the first visit when a bDMARD was added to MTX or the first visit when full triple therapy (MTX plus SSZ plus HCQ/CQ) was registered. CQ was allowed as an alternative to HCQ due to the similarity of the drugs (24). To represent clinical practice, patients receiving triple therapy were allowed to discontinue either SSZ or HCQ/CQ and continue with a dual combination therapy, then start SSZ or HCQ/CQ again. However, only 2 such changes in the triple therapy regimen were allowed (i.e., discontinuing either SSZ or HCQ/CQ and restarting that drug). Patients receiving biologic therapy received a bDMARD of any available mode of action (tumor necrosis factor [TNF] inhib-itors, CD20 depleters, interleukin- 1 [IL- 1] inhibitors, IL- 6 inhibitors, or modulators of T cell costimulation) in combination with MTX. MTX discontinuation was not allowed in either group. Concurrent glucocorticoids were allowed.
Ethics approval. Patients receive information about the SRQ and provide informed consent before inclusion in the register (20). In order to use data from the SRQ for research, approvals are required from both the Ethical Review Authority and the Reg-ister Council of the Swedish Society for Rheumatology (20,25). If approved, the SRQ provides anonymized data for research (20). All results are presented on a strict group basis. Approval from the regional Ethical Review Authority at Lund University was received in 2014 (Dnr 2014/754). The SRQ council approved research on remission in RA using the SRQ in 2016.
Outcome measures. The following outcome measures were studied:
1. Frequencies and odds ratios (ORs) of achieving short- term and long- term sustained remission with biologic therapy ver-sus triple therapy at 1 and 2 years from treatment start in all patients starting biologic or triple therapy. Patients who did not remain on the initial biologic or triple therapy during this period of time were still included in the analyses but regarded as nonresponders from the date of discontinuation of the ini-tial biologic or triple therapy.
2. Frequencies and ORs of achieving short- term and long- term sustained remission with biologic therapy versus triple ther-apy at 1 and 2 years from treatment start in patients remain-ing on biologic or triple therapy. Patients who discontinued the initial biologic or triple therapy before 1 and 2 years were excluded from the analysis (i.e., completers analysis).
3. Hazard ratios (HRs) of achieving short- term and long- term sustained remission at any time during follow- up after the

SUSTAINED REMISSION IN PATIENTS WITH RA | 1137
start of biologic versus triple therapy, irrespective of therapy retention (survival analyses).
Sustained remission was defined as a DAS28 of <2.6 on at least 2 consecutive visits with a registered DAS28, where the time between the first visit at which disease was in remission and the last visit at which disease was in remission was ≥6 months (short- term sustained remission) or ≥24 months (long- term sustained remission), with no evaluation indicating non- remission in between. A maximum of 2 years between consecutive visits with known DAS28 in sustained remission periods was allowed. DAS28 was calculated using the ESR (26).
Achieving sustained remission at 1 year from treatment start was defined as experiencing a sustained remission period (while still receiving biologic or triple therapy) that included the 1- year date from the biologic or triple therapy start date. The corresponding definition was used for achieving sustained remission at 2 years from treat-ment start. Since a sustained remission period lasting ≥24 months (long- term sustained remission) can begin prior to 1 year from treat-ment start and thus include the 1- year date, patients could already be in long- term sustained remission at 1 year from treatment start.
Patients who, given their dates of visits with a registered DAS28 score, had no theoretical chance of achieving the outcome were omitted from the analyses (e.g., patients who were lost to follow- up from the register before having a chance to achieve the outcome). For further details, see Supplementary Methods, availa-ble on the Arthritis & Rheumatology website at http://onlin elibr ary.wiley.com/doi/10.1002/art.41720/ abstract. All visits with missing
DAS28 scores were omitted from these analyses, i.e., all visits where ≥1 of the disease activity items required to calculate the DAS28 were not registered were omitted.
HRs of the first sustained remission periods achieved at any time during the follow- up period after the start of biologic ther-apy versus triple therapy, irrespective of therapy retention, were calculated using survival analyses. In these outcome measures, achievement of sustained remission was studied regardless of what treatment the patient received at that time, i.e., only achieve-ment of sustained remission was studied in these outcomes. That is, we investigated whether starting biologic or triple therapy increases or reduces future chances of achieving sustained remis-sion regardless of therapy given (corresponding to intent- to- treat analyses without imputations).
Sensitivity analyses. A sensitivity analysis was performed for long- term sustained remission periods where 1 visit outside of remission (i.e., with a DAS28 of ≥2.6) was allowed during the sustained remission periods. Such sustained remission periods were compared between the strategies at 2 years from treatment start 1) among all patients starting biologic or triple therapy and 2) among patients remaining on biologic or triple therapy as well as 3) at any time during follow- up, irrespective of therapy retention.
A sensitivity analysis was also performed for sustained remis-sion at 1 year and 2 years from treatment start using an alternative approach for managing visits with missing DAS28 values. Instead of omitting all visits with missing DAS28 scores, this sensitivity analysis regarded all visits with missing DAS28 scores as non- remission visits
Figure 1. Study flow chart. Triple therapy consisted of methotrexate (MTX) plus sulfasalazine plus hydroxychloroquine/chloroquine. Biologic therapy consisted of a biologic disease- modifying antirheumatic drug plus MTX. RA = rheumatoid arthritis; SRQ = Swedish Rheumatology Quality Register; DAS28 = Disease Activity Score in 28 joints.

KÄLLMARK ET AL 1138 |
(i.e., imputing non- remission at all visits with missing DAS28 scores). In these analyses, we also included long- term sustained remission periods where 1 visit outside of remission was allowed.
Statistical analysis. Baseline characteristics are reported as the median and interquartile range for continuous variables and as the number and percentage for categorical variables. The sta-tistical significance level was set to 0.05. For the cross- sectional comparisons during biologic or triple therapy at 1 year and 2 years from treatment start, binary logistic regression analyses were per-formed. For comparisons at any time during follow- up, survival analyses using Cox regression and Kaplan- Meier were con-ducted. In the survival analyses, censoring was defined as the first visit missing a DAS28 score or the end of follow- up in the register. ORs and HRs with 95% confidence intervals (95% CIs) were cal-culated. Data management and analyses were performed in IBM SPSS Statistics 24 and 25 and R software (R Core Team 2014).
To account for nonrandom treatment selection (potential selection bias), a propensity score model was used. Variables included in the propensity score calculation were selected by clin-ical plausibility of influencing the treatment choice and availability in the SRQ. In total, 19 variables were selected, all registered at baseline if not otherwise stated: age at symptom onset, sex, rheu-matoid factor (RF) positivity, calendar year of symptom onset, time from symptom onset to MTX start, time on MTX monotherapy, calendar year of biologic or triple treatment start, previous remis-sion (DAS28 of <2.6) at any visit (yes, no), previous short- term sustained remission (yes/no), glucocorticoids (yes/no), DAS28, Health Assessment Questionnaire (HAQ), patient assessment of pain measured on a visual analog scale (VAS pain), patient global assessment of disease activity, evaluator global assessment of disease activity, swollen joint count (SJC) (of 28 joints), tender joint count (TJC) (of 28 joints), CRP, and ESR.
Since there is no clear consensus regarding sets of variables to be included in the calculation of a propensity score (27), anal-yses were also performed with more traditional/classical covari-ate adjustments, referred to as classical regression analyses. For this purpose, multicollinearity among possible confounders was investigated, and they were included as covariates if the Pearson correlation coefficient was <0.4. Covariates included in the clas-sical regression analyses were age, sex, calendar year of symp-tom onset, RF positivity, time from symptom onset to MTX start, baseline DAS28, and previous remission (DAS28 of <2.6) at any visit before the start of biologic or triple therapy. For the survival analyses, glucocorticoid use at start of biologic or triple therapy (yes/no) was also included as a covariate.
RESULTS
Baseline characteristics of the patients. In total, 1,502 patients were included, of whom 1,155 received biologic therapy and 347 received triple therapy as a first treatment
strategy after an inadequate response to MTX monotherapy. Of the 1,145 patients for whom enough data were available to determine whether they met classification criteria, 96.8%
Table 1. Baseline characteristics of the RA patients receiving biologic therapy or triple therapy*
Biologic therapy (n = 1,155)
Triple therapy (n = 347)
Age at symptom onset, years
53 (42– 61)/0 54 (43– 61)/0
Sex, no. (%) female/% missing data
843 (73)/0 247 (71)/0
Year of symptom onset 2007 (2004– 2009)/0
2004 (2003– 2006)/0
RF, no. (%) positive/% missing data
610 (53)/0 207 (60)/0
TJC (of 28 joints) 6 (3– 10)/4.8 5 (2– 8)/0.9SJC (of 28 joints) 6 (3– 10)/4.8 5 (3– 9)/0.6HAQ (scale 0– 4) 1.00
(0.63– 1.38)/11.60.88
(0.50– 1.25)/4.3DAS28 (scale 0– 9.4) 5 (4.21– 5.64)/15.1 5 (3.85– 5.39)/5.5Pain, 0– 100- mm VAS 55 (34– 71)/9.1 44 (24– 63)/4.3PtGA (scale 0– 100) 55 (37– 73)/7.4 46 (24– 65)/4.0EGA, % missing data 6.9 1.4EGA score, no. (%)
0 10 (0.90) 3 (0.9)1 121 (11.3) 80 (23.4)2 565 (52.6) 199 (58.2)3 364 (33.9) 59 (17.3)4 15 (1.4) 1 (0.3)
CRP, mg/liter 9 (4– 22)/4.2 9 (4– 19)/1.4ESR, mm/hour 21 (11– 38)/8.7 20 (12– 34)/2.3Glucocorticoid use, no.
(%)/% missing data617 (53)/0 139 (40)/0
Time to MTX start from symptom onset, months
6 (4– 10)/0 6 (4– 10)/0
Duration of MTX monotherapy, months
10 (4– 24)/0 4 (3– 8)/0
Previous remission at any visit, no. (%)/% missing data†
247 (22)/4.5 32 (9)/2.6
Previous short- term sustained remission, no. (%)/% missing data‡
70 (6)/0 5 (1)/0
SWEFOT participants, no. (%)/% missing data
119 (10.3)/0 118 (34.0)/0
* Baseline was defined as the start of biologic or triple therapy. Adult patients with early rheumatoid arthritis (RA; ≤2 years from symptom onset) who were registered in the Swedish Rheumatology Quality Register between 2000 and 2012 and were receiving biologic or triple therapy after an inadequate response to methotrexate (MTX) monotherapy were included. Biologic therapy consisted of a biologic disease- modifying antirheumatic drug plus MTX. Triple therapy con-sisted of MTX plus sulfasalazine plus hydroxychloroquine/chloroquine. Except where indicated otherwise, values are the median (interquartile range)/percent missing data. RF = rheumatoid factor; TJC = tender joint count; SJC = swollen joint count; HAQ = Health Assessment Questionnaire; VAS = visual analog scale; PtGA = patient global as-sessment of disease activity; EGA = evaluator global assessment of disease activity; CRP = C- reactive protein; ESR = erythrocyte sed-imentation rate; SWEFOT = Swedish Pharmacotherapy trial. † Prior to start of biologic or triple therapy. Remission was defined as a Disease Activity Score in 28 joints (DAS28) of <2.6. ‡ Prior to start of biologic or triple therapy. Short- term sustained remission was defined as a DAS28 of <2.6 at ≥2 consecutive visits and for ≥6 months.

SUSTAINED REMISSION IN PATIENTS WITH RA | 1139
fulfilled the American College of Rheumatology 1987 classifica-tion criteria for RA (28). Among the patients receiving biologic therapy, 94% received a TNF inhibitor plus MTX (see Supple-mentary Table 1, available on the Arthritis & Rheumatology web-site at http://onlin elibr ary.wiley.com/doi/10.1002/art.41720/ abstract, for frequencies and crude results for the bDMARDs used). Approximately 20% of the patients in our study were also participants in the randomized Swedish Pharmacotherapy (SWEFOT) trial (15).
At baseline (the start of biologic or triple therapy), patients initi-ating triple therapy had generally lower disease activity (lower TJCs, SJCs, HAQ, DAS28, VAS pain, patient global assessment of disease activity, and evaluator global assessment of disease activity) than patients receiving biologic therapy, and a lower proportion starting triple therapy were receiving glucocorticoids. A larger proportion of patients initiating triple therapy were RF positive, and the median symptom onset was chronologically earlier in the 2000s. The dura-tion of MTX monotherapy was ~6 months shorter for patients start-ing triple therapy. Further, a lower proportion of patients starting triple therapy had previously achieved remission at any visit or short- term sustained remission (i.e., while receiving MTX monotherapy). Baseline characteristics are presented in Table 1. The median time from symptom onset to start of biologic therapy or triple therapy was 19 months and 12 months, respectively.
A larger proportion of patients receiving biologic therapy con-tinued to receive therapy for >1 year and >2 years from therapy start compared to patients receiving triple therapy (64% versus 52% at 1 year and 43% versus 35% at 2 years). Further, a larger proportion of patients receiving biologic therapy were lost to fol-low- up (censored) before 1 year or 2 years while still receiving biologic therapy. Follow- up data are presented in Table 2, along with the crude proportions (unadjusted for baseline differences; not accounting for censoring) of patients in short- term sustained remission and long- term sustained remission at 1 year and 2 years from the start of biologic or triple therapy, and at any time during follow- up irrespective of therapy retention.
One or more disease activity measures required for the calcu-lation of DAS28 were missing for 6.6% of all visits (107 of 1,629) for patients receiving triple therapy and 12.7% of all visits (804 of 6,314) for patients receiving biologic therapy.
Sustained remission at 1 year and 2 years among patients starting therapy. Among all patients starting biologic or triple therapy, the propensity score– adjusted ORs for achieving sustained remission at 1 year from start of biologic therapy versus triple therapy were 1.79 for short- term sustained remission (95% CI 1.18– 2.71) and 1.86 for long- term sustained remission (95% CI 1.00– 3.48) (Figure 2). Corresponding results at 2 years from treatment start were 1.92 for short- term sustained remission (95% CI 1.21– 3.06) and 1.62 for long- term sustained remission (95% CI 0.94– 2.79) (Figure 2). Crude numbers and proportions of patients achieving these outcomes are presented in Table 2.
Table 2. Follow- up data and crude results for the RA patients receiving biologic therapy or triple therapy*
Biologic therapy Triple therapyFollow- up data
t = 0 (start of biologic or triple therapy)
Total starting therapy 1,155 (100)/1,155 347 (100)/347t = 1 year
Patients continuing to receive the initial biologic or triple therapy
742 (64)/1,155 180 (52)/347
Discontinued the initial biologic or triple therapy before 1 year
324 (28)/1,155 158 (46)/347
Lost to follow- up (censored) before 1 year (while still receiving the initial biologic or triple therapy)
89 (8)/1,155 9 (3)/347
t = 2 yearsPatients continuing to
receive the initial biologic or triple therapy
491 (43)/1,155 122 (35)/347
Discontinued the initial biologic or triple therapy before 2 years
474 (41)/1,155 207 (60)/347
Lost to follow- up (censored) before 2 years (while still receiving the initial biological/triple therapy)
190 (17)/1,155 18 (5)/347
Crude results†Nonresponder analyses‡
Short- term sustained remission at 1 year
172 (19)/891 50 (16)/310
Long- term sustained remission at 1 year
68 (10)/665 19 (8)/243
Short- term sustained remission at 2 years
147 (21)/687 37 (15)/243
Long- term sustained remission at 2 years
82 (12)/670 26 (11)/243
Completers analyses§Short- term sustained
remission at 1 year172 (27)/627 50 (30)/166
Long- term sustained remission at 1 year
68 (14)/485 19 (15)/124
Short- term sustained remission at 2 years
147 (38)/390 37 (42)/88
Long- term sustained remission at 2 years
82 (22)/381 26 (30)/88
Survival analysesShort- term sustained
remission at any time during follow- up¶
308 (27)/1,155 133 (38)/347
Long- term sustained remission at any time during follow- up¶
123 (11)/1,155 61 (18)/347
* Biologic therapy consisted of a biologic disease- modifying antirheumatic drug plus methotrexate (MTX). Triple therapy consisted of MTX plus sulfasalazine plus hydroxychloroquine/chloroquine. RA = rheumatoid arthritis; t = time. Values are the number (%)/number assessed. † Short- term sustained remission was defined as a Disease Activity Score in 28 joints (DAS28) of <2.6 at ≥2 consecutive visits and for ≥6 months; long- term sustained remission was defined as a DAS28 of <2.6 at ≥2 consecutive visits and for ≥24 months. ‡ All patients who discontinued the initial biologic or triple therapy were included and regarded as nonresponders from the point of discontinuation onward. § All patients who discontinued the initial biologic or triple therapy before 1 year and before 2 years were excluded. ¶ Censoring was not accounted for.

KÄLLMARK ET AL 1140 |
Sustained remission at 1 year and 2 years among patients continuing to receive therapy. Among the patients who continued to receive therapy for ≥1 year, the propensity score– adjusted ORs for achieving sustained remission at 1 year from start of biologic therapy versus triple therapy were 1.12 for short- term sustained remission (95% CI 0.72– 1.75) and 1.1 for long- term sustained remission (95% CI 0.59– 2.16) (Figure 3). Cor-responding results at 2 years from treatment start among patients continuing to receive therapy for ≥2 years were 0.85 for short- term sustained remission (95% CI 0.49– 1.47) and 0.76 for long- term sustained remission (95% CI 0.41– 1.39) (Figure 3). Crude
numbers and proportions of patients achieving these outcomes are presented in Table 2.
Sustained remission at any time during follow- up, irrespective of therapy retention. The Mantel- Cox P value for the Kaplan- Meier survival functions (unadjusted for baseline differences) for the proportions of patients who achieved short- term sustained remission with biologic therapy versus triple ther-apy at any time during follow- up irrespective of therapy retention was 0.937 (Figure 4). The propensity score– adjusted HR for short- term sustained remission with biologic therapy versus triple
Figure 2. Propensity score– adjusted odds ratios (ORs) and 95% confidence intervals (95% CIs) for achieving short- term and long- term sustained remission (SR) of rheumatoid arthritis at 1 year and 2 years after start of biologic therapy versus triple therapy among all patients starting biologic or triple therapy (nonresponder analysis). All patients who discontinued the initial biologic or triple therapy are included in the analyses and regarded as nonresponders from the point of discontinuation forward. Short- term sustained remission was defined as a Disease Activity Score in 28 joints (DAS28) of <2.6 at ≥2 consecutive visits and for ≥6 months. Long- term sustained remission was defined as a DAS28 of <2.6 at ≥2 consecutive visits and for ≥24 months. Classically adjusted and crude ORs (and 95% CIs) are also shown. The classically adjusted regression analyses were adjusted for age, sex, calendar year of symptom onset, rheumatoid factor positivity, time from symptom onset to start of methotrexate, baseline DAS28 score, previous occasional remission, and in analyses of remission at any time during follow- up, for glucocorticoid use at baseline.
Figure 3. Propensity score– adjusted odds ratios (ORs) and 95% confidence intervals (95% CIs) for achieving short- term and long- term sustained remission (SR) of rheumatoid arthritis at 1 year and 2 years after start of biologic therapy versus triple therapy among patients who continued to receive biologic or triple therapy (completers analysis). All patients who discontinued the initial biologic or triple therapy before 1 year or before 2 years were excluded from the analyses. Short- term sustained remission was defined as a Disease Activity Score in 28 joints (DAS28) of <2.6 at ≥2 consecutive visits and for ≥6 months. Long- term sustained remission was defined as a DAS28 of <2.6 at ≥2 consecutive visits and for ≥24 months. Classically adjusted and crude ORs (and 95% CIs) are also shown. The classically adjusted regression analyses were adjusted for age, sex, calendar year of symptom onset, rheumatoid factor positivity, time from symptom onset to start of methotrexate, baseline DAS28, previous occasional remission, and in analyses of remission at any time during follow- up, for glucocorticoid use at baseline.

SUSTAINED REMISSION IN PATIENTS WITH RA | 1141
therapy at any time during follow- up was 1.15 (95% CI 0.91– 1.46). For long- term sustained remission at any time during follow- up, the Mantel- Cox P value for the Kaplan- Meier survival functions (unadjusted for baseline differences) was 0.734 (Figure 4). The propensity score– adjusted HR for long- term sustained remission at any time during follow- up was 1.09 (95% CI 0.77– 1.54). Crude numbers and proportions of patients achieving these outcomes, not accounting for censoring, are presented in Table 2.
Sensitivity analyses for 24 months of sustained remission allowing 1 visit outside of remission. The pro-pensity score– adjusted OR for long- term sustained remission with biologic therapy versus triple therapy (allowing 1 visit outside of remission) at 2 years from treatment start among all patients starting therapy (nonresponder analyses) was 1.92 (95% CI 1.17– 3.14). The corresponding OR for patients continuing to receive therapy (completers analyses) was 0.88 (95% CI 0.50– 1.55). The propensity score– adjusted HR for achieving long- term sustained remission (allowing 1 visit outside of remission) at any time dur-ing follow- up, irrespective of therapy retention, was 1.30 (95% CI 0.96– 1.79). Crude numbers and proportions of patients achieving these outcomes are presented in Supplementary Table 2, availa-ble on the Arthritis & Rheumatology website at http://onlin elibr ary.wiley.com/doi/10.1002/art.41720/ abstract.
Sensitivity analyses for alternative management of visits with missing DAS28 values. The results of the sensi-tivity analysis of short- term and long- term sustained remission at 1 year and 2 years from treatment start when imputing “non- remission” at all visits with missing DAS28 scores were similar to the results of the main analyses, in which visits with missing DAS28 scores were omitted (Supplementary Table 3, available on
the Arthritis & Rheumatology website at http://onlin elibr ary.wiley.com/doi/10.1002/art.41720/ abstract).
DISCUSSION
In this Swedish nationwide register study, we found that among all RA patients starting biologic or triple therapy after an inadequate response to MTX monotherapy, patients initiating biologic therapy were ~2 times more likely to continue to receive therapy and experience short- term and long- term sustained remission at 1 year and 2 years from treatment start, as com-pared to patients initiating triple therapy. However, we found simi-lar effectiveness for achieving short- term and long- term sustained remission among patients who continued to receive biologic or triple therapy at 1 year and 2 years from treatment start, and at any time during follow- up among patients started on either of the strategies and irrespective of therapy retention.
Our results are consistent with the results of randomized comparisons of these strategies, suggesting somewhat larger benefits of biologic therapy, with faster responses and larger proportions of patients achieving more stringent remission and response criteria, as compared to triple therapy (10– 16). How-ever, in general, those studies did not find significant differences between the strategies over time or in other clinical and functional outcomes (10– 16), although concerns have subsequently been raised regarding insufficient statistical power. With regard to radi-ographic outcomes, the SWEFOT and Treatment of Early Aggres-sive Rheumatoid Arthritis (TEAR) trials demonstrated clinically small but statistically significant differences in favor of biologic therapy, whereas the Induction Therapy with MTX and Prednisone in Rheumatoid or Very Early Arthritic Disease (IMPROVED) and Rheumatoid Arthritis: Comparison of Active Therapies in Patients
Figure 4. Crude one minus the Kaplan- Meier estimate of the survival function for proportions of patients with rheumatoid arthritis started on biologic therapy or triple therapy after an inadequate response to methotrexate monotherapy who achieved short- term (A) and long- term (B) sustained remission at any time during follow- up, irrespective of therapy retention. In the Kaplan-Meier analysis, short-term and long- term sustained remission could first be achieved after 6 months and 24 months of treatment, respectively.

KÄLLMARK ET AL 1142 |
With Active Disease Despite Methotrexate Therapy (RACAT) stud-ies found no statistically significant differences between triple ther-apy and biologic therapy for radiographic outcomes (10– 14,16). The aforementioned randomized controlled trials (RCTs) have also demonstrated that certain RA patients respond well to triple ther-apy (10– 16), and that initiating triple therapy versus biologic ther-apy does not seem to negatively impact the likelihood of achieving good clinical outcomes over time (10,12,16). Sustained remission was not compared between the strategies in any of those studies.
A larger proportion of patients receiving triple therapy in our study discontinued treatment before 1 year and before 2 years than patients receiving biologic therapy. Treatment discontinua-tions could be due to adverse events or intolerability, insufficient treatment effect, patient preferences, or tapering of treatment after successfully achieved treatment goals. Unfortunately, data on the reasons behind treatment decisions and on adverse events were unavailable in the registry, rendering interpretations difficult. In the non- blinded SWEFOT study, no significant dif-ferences in discontinuations due to adverse events were seen between patients receiving biologic therapy and those receiving triple therapy, but a larger proportion of patients receiving triple therapy than patients receiving biologic therapy discontinued treatment due to inadequate treatment effect (18.5% versus 3.9%) (11). Further, as in our study, a larger proportion of patients receiving biologic therapy in the SWEFOT study were maintained on their initial therapeutic regimen (11). In the blinded RACAT study, a nonsignificantly higher proportion of patients receiving triple therapy discontinued treatment due to adverse events as compared to patients receiving biologic therapy (5.4% versus 2.3%), but similar proportions switched from triple therapy to biologic therapy and vice versa due to inadequate treatment effect (12).
At baseline, patients in our study who were receiving triple therapy generally had disease characteristics suggestive of milder disease than patients receiving biologic therapy. This could reflect a clinical approach in which biologic treatments are more often pre-scribed to patients with more active disease and worse prognosis, an approach currently recommended in treatment guidelines (7). A lower proportion of patients starting triple therapy in our study received glucocorticoids at treatment start, which could reflect lower disease activity. Unfortunately, we had no data on glucocorticoid doses or glucocorticoid use throughout the study, which could affect the interpretation of the findings, since reduced steroid consumption would be another valuable outcome measure. Generally, glucocorti-coid use was not thoroughly registered in the SRQ, but the likelihood of accurate registration was presumed to be maximal at the start of a treatment regimen such as triple or biologic therapy. Glucocorti-coid use at treatment start as well as the other baseline variables selected a priori and listed above were included in the propensity score calculation to account for selection bias. In the classic regres-sion analyses, glucocorticoid use at treatment start was not found to be predictive of sustained remission.
In order to account for shorter flares of disease activity, we performed sensitivity analyses allowing 1 visit outside of remis-sion (i.e., with a DAS28 of ≥2.6), with results very similar to those of our main analyses. This finding suggests that shorter fluctua-tions of DAS28 scores did not largely differ between the groups or impact our results.
The proportions of patients achieving long- term sustained remission at 1 year and 2 years among all patients starting therapy in our study (8– 12%) was slightly lower than the 12% reported by Cook et al (29), who studied patients with recent- onset inflam-matory polyarthritis and defined sustained remission as remission on ≥3 consecutive annual visits, and the 15% reported by Ellerby et al (30), who studied patients with established RA and defined sustained remission as remission on ≥2 consecutive annual visits. In addition, Sung et al found higher rates of sustained remission, with 22% of patients with RA experiencing sustained remission defined as remission on 3 consecutive annual visits (31). In our analyses, all registered patient visits with DAS28 scores recorded were included, as compared to only annual visits in the above- mentioned studies, and our study population included only patients with an inadequate response to MTX monotherapy, which may explain at least some of the diverging results (29– 31).
Limitations of this study are mostly related to the observa-tional, nonrandomized study design with the potential for selection bias. We aimed to account for selection bias by adjusting for the propensity score and using classic regression adjustments. How-ever, we lacked reliable data on variables such as smoking, soci-oeconomic status, comorbidities, HLA genotype, anti– citrullinated protein antibody status, and radiographs. Such variables rep-resent unmeasured possible confounders in our study. We also lacked data on the reasons behind treatment decisions, which could affect the interpretation of the results. Overall, we acknowl-edge the risk of residual and unmeasured confounders biasing our results. As in all observational studies, results should be inter-preted cautiously.
Another limitation of our study concerns missing DAS28 val-ues (i.e., registered visits that lacked registration of ≥1 disease activity measure required to calculate the DAS28). When the DAS28 was calculated using only 3 variables and using the CRP level instead of the ESR, the completeness of disease activity data increased only marginally. The problem with missing DAS28 values was managed by omitting all visits where DAS28 scores could not be calculated. This approach follows the reasoning that we lack disease activity data on these visits just as we lack data on all the days that the patients do not have any visits at all. However, while unlikely to have any significant impact, a limitation of this approach is an increased uncertainty in our results, as patients may have had unregistered high disease activity at these visits. For this rea-son, we performed sensitivity analyses where all visits with miss-ing DAS28 scores were regarded as visits not in remission (i.e., imputing non- remission at all visits with missing DAS28 scores). Results from our analyses using this alternative approach to

SUSTAINED REMISSION IN PATIENTS WITH RA | 1143
handle missing disease activity data were very similar to those of our main analyses (see Supplementary Methods, available on the Arthritis & Rheumatology website at http://onlin elibr ary.wiley.com/doi/10.1002/art.41720/ abstract), suggesting robustness in our comparisons between the treatment strategies, regardless of how visits with missing DAS28 scores were handled.
We restricted our study population to patients registered in the SRQ within 2 years from symptom onset, i.e., patients with relatively early RA. Since the time from symptom onset to treat-ment initiation has been shown to affect the likelihood of reduc-ing damage progression (32), this inclusion criterion increased homogeneity regarding prognoses in the study population. On the other hand, we made no restrictions for previous remission periods or different durations of MTX monotherapy, and we made no distinctions between different bDMARDs. This approach intro-duces heterogeneity in and between the groups, which compli-cates inferences since we cannot judge the impact of different disease phenotypes or different bDMARDs on our results. In the present study, the choice not to restrict the population extensively was motivated by the intent to provide real- life data reflecting daily clinical practice for the RA population in general. However, since the median time from symptom onset to the start of biologic ther-apy or triple therapy was 19 months and 12 months, respectively, our results mainly apply to patients with early RA.
Finally, propensity score methods, like all statistical methods, have both advantages and disadvantages. An advantage of pro-pensity score models in comparison to more traditional covariate adjustment models is more flexibility in adjustments for baseline differences (27). Regarding disadvantages, there is a lack of con-sensus as to what sets of variables should be included in the pro-pensity score calculation (27). Also, biased estimates toward the null have been reported from the use of the propensity score as a covariate in regression analyses (33). Yet, since our results were consistent overall with RCTs comparing these treatment strate-gies, we believe that this statistical method is adequate to adjust for nonrandom treatment selection in the present study. Moreover, results from our classic regression analyses using more traditional sets of covariates were similar to that of the propensity score– adjusted analyses, further strengthening our findings.
Regarding strengths, to our knowledge this is the first nation-wide register study comparing triple therapy to biologic therapy with regard to sustained remission. For comparisons of treatment strategies, RCTs are invaluable, yet selective (34). Patients with certain comorbidities and disease complications, frequently seen in daily clinical practice, are often not eligible for inclusion in RCTs (34). Therefore, observational studies from large patient registers are important to gain real- life data on treatment effects (34,35). Hence, the most important strength of our study is the use of real- life data from a nationwide register, used in daily clinical prac-tice and with a high coverage of patients with RA in Sweden (20), which could add important knowledge to previous findings from RCTs.
In conclusion, in this Swedish nationwide register study we found that among RA patients with an inadequate response to MTX monotherapy, biologic therapy was more effective than tri-ple therapy for continuing therapy and experiencing sustained remission at 1 year and 2 years from treatment start. However, we found similar effectiveness between the strategies for achiev-ing sustained remission among patients who continued to receive therapy at 1 year and 2 years, suggesting that a subgroup of RA patients respond well to triple therapy. We also found similar likelihoods for achieving sustained remission at any time during follow- up among patients started on either of these strategies, irrespective of therapy retention. These findings are meaningful for patients with contraindications to biologic therapy and are of eco-nomic interest with regard to cost differences between the strate-gies and hence resource allocation.
AUTHOR CONTRIBUTIONS
All authors were involved in drafting the article or revising it critically for important intellectual content, and all authors approved the final version to be published. Dr. C. Kapetanovic had full access to all of the data in the study and takes responsibility for the integrity of the data and the accuracy of the data analysis.Study conception and design. Källmark, Einarsson, C. Kapetanovic.Acquisition of data. Källmark, Einarsson, Nilsson, C. Kapetanovic.Analysis and interpretation of data. Källmark, Einarsson, Olofsson, Saxne, Geborek, C. Kapetanovic.
REFERENCES 1. Smolen JS, Aletaha D, McInnes IB. Rheumatoid arthritis [review].
Lancet 2016;388:2023– 38.
2. McInnes IB, Schett G. The pathogenesis of rheumatoid arthritis. N Engl J Med 2011;365:2205– 19.
3. Cross M, Smith E, Hoy D, Carmona L, Wolfe F, Vos T, et al. The global burden of rheumatoid arthritis: estimates from the global bur-den of disease 2010 study. Ann Rheum Dis 2014;73:1316– 22.
4. Aletaha D, Smolen JS. Diagnosis and management of rheumatoid arthritis: a review. JAMA 2018;320:1360– 72.
5. Olofsson T, Petersson IF, Eriksson JK, Englund M, Simard JF, Nilsson JÅ, et al. Predictors of work disability during the first 3 years after diagnosis in a national rheumatoid arthritis inception cohort. Ann Rheum Dis 2014;73:845– 53.
6. Smolen JS, Landewé RB, Bijlsma JW, Burmester GR, Dougados M, Kerschbaumer A, et al. EULAR recommendations for the manage-ment of rheumatoid arthritis with synthetic and biological disease- modifying antirheumatic drugs: 2019 update. Ann Rheum Dis 2020;79:685– 99.
7. Svensk Reumatologisk Förening. Riktlinjer för läkemedelsbehandling vid reumatoid artrit. URL: https://svens kreum atolo gi.se/grupp er/arbet sgrup per/riktl injer - for- lakem edels behan dling - vid- ra/.
8. Smolen JS, Landewe R, Bijlsma J, Burmester G, Chatzidionysiou K, Dougados M, et al. EULAR recommendations for the manage-ment of rheumatoid arthritis with synthetic and biological disease- modifying antirheumatic drugs: 2016 update. Ann Rheum Dis 2017;76:960– 77.
9. Brown PM, Pratt AG, Isaacs JD. Mechanism of action of methotrex-ate in rheumatoid arthritis, and the search for biomarkers [review]. Nat Rev Rheumatol 2016;12:731– 42.
10. Heimans L, Akdemir G, Boer KV, Goekoop- Ruiterman YP, Molenaar ET, van Groenendael JH, et al. Two- year results of disease activity

KÄLLMARK ET AL 1144 |
score (DAS)- remission- steered treatment strategies aiming at drug- free remission in early arthritis patients (the IMPROVED- study). Arthritis Res Ther 2016;18:23.
11. Van Vollenhoven RF, Geborek P, Forslind K, Albertsson K, Ernestam S, Petersson IF, et al. Conventional combination treatment versus biological treatment in methotrexate- refractory early rheumatoid arthritis: 2 year follow- up of the randomised, non- blinded, parallel- group Swefot trial. Lancet 2012;379:1712– 20.
12. O’Dell JR, Mikuls TR, Taylor TH, Ahluwalia V, Brophy M, Warren SR, et al. Therapies for active rheumatoid arthritis after methotrexate fail-ure. N Engl J Med 2013;369:307– 18.
13. Moreland LW, O’Dell JR, Paulus HE, Curtis JR, Bathon JM, St. Clair EW, et al. A randomized comparative effectiveness study of oral tri-ple therapy versus etanercept plus methotrexate in early aggressive rheumatoid arthritis: the Treatment of Early Aggressive Rheumatoid Arthritis trial. Arthritis Rheum 2012;64:2824– 35.
14. Heimans L, Wevers- de Boer KV, Visser K, Goekoop RJ, van Oosterhout M, Harbers JB, et al. A two- step treatment strategy trial in patients with early arthritis aimed at achieving remission: the IMPROVED study. Ann Rheum Dis 2014;73:1356– 61.
15. Van Vollenhoven RF, Ernestam S, Geborek P, Petersson IF, Coster L, Waltbrand E, et al. Addition of infliximab compared with addition of sulfasalazine and hydroxychloroquine to methotrexate in patients with early rheumatoid arthritis (Swefot trial): 1- year results of a ran-domised trial. Lancet 2009;374:459– 66.
16. Akdemir G, Heimans L, Bergstra SA, Goekoop RJ, van Oosterhout M, van Groenendael J, et al. Clinical and radiological outcomes of 5- year drug- free remission- steered treatment in patients with early arthritis: IMPROVED study. Ann Rheum Dis 2018;77:111– 8.
17. Ramiro S, Sepriano A, Chatzidionysiou K, Nam JL, Smolen JS, van der Heijde D, et al. Safety of synthetic and biological DMARDs: a systematic literature review informing the 2016 update of the EULAR recommendations for management of rheumatoid arthritis. Ann Rheum Dis 2017;76:1101– 36.
18. Bansback N, Phibbs CS, Sun H, O’Dell JR, Brophy M, Keystone EC, et al. Triple therapy versus biologic therapy for active rheu-matoid arthritis: a cost- effectiveness analysis. Ann Intern Med 2017;167:8– 16.
19. Einarsson JT, Geborek P, Saxne T, Kristensen LE, Kapetanovic MC. Sustained remission improves physical function in patients with established rheumatoid arthritis, and should be a treatment goal: a prospective observational cohort study from southern Sweden. J Rheumatol 2016;43:1017– 23.
20. Svensk Reumatologis Kvalitetsregister S. About SRQ. URL: http://srq.nu/en/about - srq/.
21. Svensk Reumatologis Kvalitetsregister S. För patienter. URL: http://srq.nu/for- patie nter/.
22. Svensk Reumatologis Kvalitetsregister. Årsrapport 2012. URL: https://srq.nu/wp- conte nt/uploa ds/2019/08/rsrap port- 2012.pdf.
23. Svensk Reumatologis Kvalitetsregister. Årsrapport 2009– 10. URL: https://srq.nu/wp- conte nt/uploa ds/2019/08/rsrap port- 2009.pdf.
24. Rainsford KD, Parke AL, Clifford- Rashotte M, Kean WF. Therapy and pharmacological properties of hydroxychloroquine and chloroquine in treatment of systemic lupus erythematosus, rheumatoid arthritis and related diseases. Inflammopharmacology 2015;23:231– 69.
25. Svensk Reumatologis Kvalitetsregister. Research. ULR: http://srq.nu/en/resea rch- 2/.
26. Anderson JK, Zimmerman L, Caplan L, Michaud K. Measures of rheu-matoid arthritis disease activity: Patient (PtGA) and Provider (PrGA) Global Assessment of Disease Activity, Disease Activity Score (DAS) and Disease Activity Score with 28- Joint Counts (DAS28), Simplified Disease Activity Index (SDAI), Clinical Disease Activity Index (CDAI), Patient Activity Score (PAS) and Patient Activity Score- II (PASII), Routine Assessment of Patient Index Data (RAPID), Rheumatoid Arthritis Disease Activity Index (RADAI) and Rheumatoid Arthritis Disease Activity Index- 5 (RADAI- 5), Chronic Arthritis Systemic Index (CASI), Patient- Based Disease Activity Score With ESR (PDAS1) and Patient- Based Disease Activity Score without ESR (PDAS2), and Mean Overall Index for Rheumatoid Arthritis (MOI- RA). Arthritis Care Res (Hoboken) 2011;63 Suppl 11:S14– 36.
27. Austin PC. An introduction to propensity score methods for reduc-ing the effects of confounding in observational studies. Multivariate Behav Res 2011;46:399– 424.
28. Arnett FC, Edworthy SM, Bloch DA, McShane DJ, Fries JF, Cooper NS, et al. The American Rheumatism Association 1987 revised cri-teria for the classification of rheumatoid arthritis. Arthritis Rheum 1988;31:315– 24.
29. Cook MJ, Diffin J, Scire CA, Lunt M, MacGregor AJ, Symmons DP, et al. Predictors and outcomes of sustained, intermittent or never achieving remission in patients with recent onset inflammatory pol-yarthritis: results from the Norfolk Arthritis Register. Rheumatology (Oxford) 2016;55:1601– 9.
30. Ellerby N, Mattey DL, Packham J, Dawes P, Hider SL. Obesity and comorbidity are independently associated with a failure to achieve remission in patients with established rheumatoid arthritis [letter]. Ann Rheum Dis 2014;73:e74.
31. Sung YK, Yoshida K, Prince FH, Frits ML, Cho SK, Choe JY, et al. Prevalence and predictors for sustained remission in rheumatoid arthritis. PLoS One 2019;14:e0214981.
32. Van Nies JA, Krabben A, Schoones JW, Huizinga TW, Kloppenburg M, van der Helm- van Mil AH. What is the evidence for the presence of a therapeutic window of opportunity in rheumatoid arthritis? A systematic literature review. Ann Rheum Dis 2014;73:861– 70.
33. Austin PC, Grootendorst P, Normand SL, Anderson GM. Conditioning on the propensity score can result in biased estimation of common measures of treatment effect: a Monte Carlo study. Stat Med 2007;26:754– 68.
34. Boyko EJ. Observational research– opportunities and limitations [review]. J Diabetes Complications 2013;27:642– 8.
35. Kilcher G, Hummel N, Didden EM, Egger M, Reichenbach S. Rheumatoid arthritis patients treated in trial and real world settings: comparison of randomized trials with registries. Rheumatology (Oxford) 2018;57:354– 69.

1145
Arthritis & RheumatologyVol. 73, No. 7, July 2021, pp 1145–1154DOI 10.1002/art.41666© 2021 The Authors. Arthritis & Rheumatology published by Wiley Periodicals LLC on behalf of American College of Rheumatology.This is an open access article under the terms of the Creative Commons Attribution- NonCommercial- NoDerivs License, which permits use and distribution in any medium, provided the original work is properly cited, the use is non- commercial and no modifications or adaptations are made.
Characterization and Function of Tumor Necrosis Factor and Interleukin- 6– Induced Osteoclasts in Rheumatoid ArthritisKazuhiro Yokota,1 Kojiro Sato,2 Takashi Miyazaki,3 Yoshimi Aizaki,1 Shinya Tanaka,4 Miyoko Sekikawa,4 Noritsune Kozu,5 Yuho Kadono,4 Hiromi Oda,4 and Toshihide Mimura1
Objective. We have previously reported that stimulation of mouse bone marrow– derived macrophages with tumor necrosis factor (TNF) and interleukin- 6 (IL- 6) induces differentiation of osteoclast- like cells. We undertook this study to clarify the characterization and function of human TNF and IL- 6– induced osteoclasts using peripheral blood collected from patients with rheumatoid arthritis (RA) and healthy donors.
Methods. Peripheral blood monocytes were cultured with a combination of TNF and IL- 6, TNF alone, IL- 6 alone, or with RANKL, and their bone resorption ability was evaluated. Expression levels of NFATc1, proinflammatory cytokines, and matrix metalloproteinase 3 were analyzed. The effects of NFAT inhibitor and JAK inhibitor were examined. Furthermore, the relationship between the number of TNF and IL- 6– induced osteoclasts or RANKL-induced osteoclasts differentiated from peripheral blood mononuclear cells (PBMCs) in patients with RA and the modified total Sharp score (mTSS) or whole- body bone mineral density (BMD) was examined.
Results. Peripheral blood monocytes stimulated with a TNF and IL- 6– induced osteoclasts were shown to demonstrate the ability to absorb bone matrix. Cell differentiation was not inhibited by the addition of osteoprotegerin. Stimulation with a combination of TNF and IL- 6 promoted NFATc1 expression, whereas the NFAT and JAK inhibitors prevented TNF and IL- 6– induced osteoclast formation. Expression levels of IL1β, TNF, IL12p40, and MMP3 weresignificantly increased in TNF and IL- 6– induced osteoclasts, but not in RANKL-induced osteoclasts. The number of TNF and IL- 6– induced osteoclasts differentiated from PBMCs in patients with RA positively correlated with the mTSS, whereas RANKL-induced osteoclast numbers negatively correlated with the whole- body BMD of the same patients.
Conclusion. Our results demonstrate that TNF and IL- 6– induced osteoclasts may contribute to the pathology of inflammatory arthritis associated with joint destruction, such as RA.
INTRODUCTION
Rheumatoid arthritis (RA) is a systemic autoimmune dis-ease characterized by polyarthritis and joint destruction. Although recent advances in treatments have enabled us to reduce dis-ease activity among RA patients, it is still difficult to “cure” the disease and halt joint destruction. Thus, preventing bone and joint destruction in RA patients who have a poor prognosis has long been a goal for rheumatologists in the treatment of RA, and new therapeutic strategies and targets need to be urgently developed.
Osteoclasts have long been considered the only cells capa-ble of absorbing bone matrix in vivo. They are differentiated from monocytes/macrophage- lineage precursor cells that are derived from bone marrow hematopoietic cells. It is believed that osteoclast differentiation is firmly dependent on the receptor acti-vator of NF- κB ligand/RANK signaling (1). The hyperactivation of osteoclasts is implicated in osteoporosis and the pathogenesis of inflammatory arthritis with bone destruction and functional disa-bility, such as RA (2). In fact, drugs targeting osteoclasts, such as bisphosphonates and anti- RANKL antibodies, are used in treating
Supported in part by grants-in-aid for Scientific Research from the Ministry of Education, Culture, Sports, Science, and Technology of Japan, grants from the Tokyo Biochemical Research Foundation, grant 19-B-1-22 from Saitama Medical University Internal Research, and grant-in-aid 01-E-1-04 for Young Researchers from Saitama Medical University Hospital.
1Kazuhiro Yokota, MD, PhD, Yoshimi Aizaki, MS, Toshihide Mimura, MD, PhD: Department of Rheumatology and Applied Immunology, Faculty of Medicine, Saitama Medical University, Saitama, Japan; 2Kojiro Sato, MD, PhD: Division of Rheumatology and Clinical Immunology, Department of Medicine, Jichi Medical University, Tochigi, Japan; 3Takashi Miyazaki, PhD: Social Medicine, Saitama Medical University, Saitama, Japan; 4Shinya Tanaka,
MD, PhD, Miyoko Sekikawa, MS, Yuho Kadono, MD, PhD, Hiromi Oda, MD, PhD: Department of Orthopaedic Surgery, Saitama Medical University, Saitama, Japan; 5Noritsune Kozu, MD: Kozu Orthopaedic Clinic, Chiba, Japan.
No potential conflicts of interest relevant to this article were reported.
Address correspondence to Toshihide Mimura, MD, PhD, Department of Rheumatology and Applied Immunology, Faculty of Medicine, Saitama Medical University, Morohongo 38, Moroyama, Iruma- gun, Saitama 350- 0495, Japan. Email: [email protected].
Submitted for publication May 6, 2020; accepted in revised form January 21, 2021.

YOKOTA ET AL 1146 |
osteoporosis worldwide. However, there is scarce evidence that bisphosphonates prevent bone destruction in RA. Furthermore, anti- RANKL antibodies are approved only in Japan for the preven-tion of joint structural damage in patients with RA. Taken together, the role of RANKL/RANK signaling– dependent osteoclast differ-entiation in RA may be overstated.
A recently emerging hypothesis is that “alternative path-ways of osteoclastogenesis” may be functioning during chronic inflammatory conditions such as RA (3). This hypothesis has been supported by many experimental findings showing that infiltrating inflammatory cells and the cytokine milieu provide multiple routes to bone destruction (4,5).
In RA, tumor necrosis factor (TNF) and interleukin- 6 (IL- 6) are the two major proinflammatory cytokines that trigger bone destruction (6). TNF and IL- 6 were shown to directly induce the activation of osteoclasts by binding to their respective surface receptors and indirectly inducing the expression of RANKL on fibroblast- like synoviocytes (7,8). Consequently, a blockade of TNF or IL- 6 impedes or arrests the progression of bone destruc-tion in RA (9), which is observed even when antiinflammatory responses are not induced (10,11).
In previous studies, we have demonstrated that a com-bination of TNF and IL- 6 induces mouse osteoclast- like cells with bone resorption activity both in vitro and in vivo (12). More recently, O’Brien and colleagues verified our findings by report-ing that the combination of TNF and IL- 6 induced the differentia-tion of osteoclasts (13). They further demonstrated that synovial tartrate- resistant acid phosphatase (TRAP)– positive multinucle-ated cells contributed to bone erosion in the arthritic joints of Rank- deficient mice with K/BxN serum- transfer arthritis. Thus, RANK- independent osteoclastogenesis occurs in inflamed joints. However, the precise characteristics and function of human TNF and IL- 6– induced osteoclasts in RA are unknown.
In this study, we investigated the characteristics and func-tion of human TNF and IL- 6– induced osteoclasts using periph-eral blood collected from patients with RA and from healthy donors. In addition, we also analyzed the differences in the novel molecular expression patterns and functions of TNF and IL- 6– induced osteoclasts as compared to those of RANKL- induced osteoclasts.
PATIENTS AND METHODS
Samples from patients with RA and healthy donors. All patients with RA fulfilled the 2010 American College of Rheu-matology (ACR)/European Alliance of Associations for Rheuma-tology criteria for RA (14) or the 1987 ACR classification criteria for RA (15). Demographic and clinical characteristics of the RA patients are provided in Supplementary Table 1, available on the Arthritis & Rheumatology website at http://onlin elibr ary.wiley.com/doi/10.1002/art.41666/ abstract. Ten healthy donors were also enrolled in the study as a control group. All patients and healthy
donors provided written informed consent prior to sample collec-tion. The study was reviewed and approved by the Saitama Medi-cal University Hospital Institutional Review Board (no. 15- 129) and Ethics Committee (no. 836).
In vitro assays for TNF and IL- 6– induced osteoclasts and osteoclast differentiation and function. Peripheral blood mononuclear cells (PBMCs) were isolated from the peripheral blood of patients with RA and healthy donors using Ficoll- Paque Plus gradient centrifugation (16). Peripheral blood monocytes were isolated from whole PBMCs using the Human Monocyte Iso-lation Kit (StemCell Technologies) according to the manufacturer’s protocol. PBMCs or peripheral blood monocytes were cultured in α- minimum essential medium (Gibco) supplemented with 10% fetal bovine serum, 50 units/ml of penicillin/streptomycin (Gibco), and 50 ng/ml of macrophage colony- stimulating factor (M- CSF) (R&D Systems). PBMCs were cultured at a cell density of 7.5 × 10⁵ cells per well in 48- well plates (17). In addition, peripheral blood monocytes were cultured at a cell density of 7.5 × 10⁴ cells per well in 96- well plates, 2.0 × 10⁵ cells per well in 24- well plates, and 5 × 10⁶ cells in 6- cm dishes for 3 days.
Following the initial 3- day culture period, PBMCs or periph-eral blood monocytes were used as monocyte- derived mac-rophages and cultured in medium supplemented with 10 ng/ml or 50 ng/ml of RANKL, TNF, IL- 6, a combination of TNF/IL- 6, or IL- 1β (all from PeproTech). The medium was replenished with fresh medium every 2 days until various assays were performed. TRAP was assayed with a TRAP Staining Kit (Cosmo Bio) accord-ing to the manufacturer’s instructions. Osteoprotegerin (OPG; R&D Systems), NFAT inhibitor tacrolimus (FK- 506; Sigma- Aldrich), the pan JAK inhibitor tofacitinib (CP690550; SelleckChem), and a rabbit anti– IL- 1β polyclonal antibody (ab9722; Abcam) were added at the same time as RANKL or proinflammatory cytokines. For the pit formation assay, monocyte- derived macrophages cul-tured on dentine slices (Wako) were cultured for 14 days in the presence of the cytokines. After removing the cells, resorption pits were examined using a S- 4800 electron microscope (Hitachi). In addition, resorption pits were visualized by toluidine blue staining, and the number of resorption pits per dentin slice was counted under a BZ- X700 microscope (Keyence).
Real- time quantitative polymerase chain reaction (qPCR). Total RNA was isolated with the RNeasy Micro Kit (Qia-gen), and complementary DNA (cDNA) was generated by reverse transcription using random hexamers and MultiScribe reverse transcriptase (ThermoFisher). Expression levels of messenger RNAs (mRNAs) were determined by TaqMan real- time PCR on an ABI Prism 7000 Sequence Detection System (Thermo Fisher). Primers for the detection of NFATc1, IL1β, TNF, IL12p40, IL10, MMP3, and CTSK were purchased from ThermoFisher. The expression level of the housekeeping gene GAPDH was used as an endogenous control. To calculate fold changes in expression,

TNF AND IL- 6– INDUCED OSTEOCLASTS IN RA | 1147
the comparative threshold cycle (Ct) method was used as previ-ously described (16).
Enzyme- linked immunosorbent assays (ELISAs) for detection of IL- 1β, TNF, and IL- 6. Levels of IL- 1β protein in the cell supernatants were detected with a DuoSet ELISA development kit (R&D Systems) according to the manufacturer’s instructions. Levels of TNF and IL- 6 proteins in the cell super na -tants were detected with a human TNF and IL- 6 standard ABTS ELISA development kit (PeproTech) according to the manufactur-er’s instructions.
Western blot analysis and immunofluorescence stain -ing. For Western blot analysis, whole cell lysates from a 60- mm polystyrene tissue culture plate were dissolved in sample buffer (62.5 mM Tris HCl buffer, 10% glycerol, 2% sodium dodecyl sul-fate [SDS], 1/20 β- mercaptoethanol, and 0.0025% bromophenol blue [BPB]) and boiled at a temperature of 95°C for 10 minutes. The samples were centrifuged for 5 minutes at 3,000 revolutions per minute, and proteins in the supernatant were separated by electrophoresis using 7.5% polyacrylamide gel. The separated proteins were transferred to a PVDF membrane using a semi- dry blot transfer system (Bio- Rad Laboratories). PVDF membranes were blocked with 5% nonfat dry milk in Tris buffered saline– Tween (TBST) (Tris HCl buffer, pH 7.9, 0.9% NaCl, 0.01% Tween 20) for 3 hours, and then incubated overnight at a temperature of 4°C with a primary mouse anti- NFATc1 monoclonal antibody (7A6) (Santa Cruz Biotechnology) in a 1:500 dilution of TBST. The membranes were washed with TBS solution 3 times and then incubated with a 1:2,000 dilution of an anti- mouse IgG peroxidase- conjugated sec-ondary antibody (Binding Site) for 1 hour (1). Chemiluminescence assay (GE Healthcare) was used for the detection of the target protein. Expression levels of the protein were analyzed using den-sitometry (Atto AE- 6920- MF). The housekeeping protein β- actin (Sigma- Aldrich) with a dilution of 1:2,000 was used as a loading control.
For immunofluorescence staining, the cultured TNF and IL- 6– induced osteoclasts, as well as RANKL-induced osteoclasts as controls, were washed twice in phosphate buffered saline (PBS) and then fixed in 4% paraformaldehyde at room temperature for 20 minutes. The fixed cells were then washed in PBS followed by 2% bovine serum albumin (BSA) in PBS with 0.1% Triton X- 100 for 10 minutes. The cells were then incubated 1 hour at a temper-ature of 37°C with a primary rabbit anti– IL- 1β polyclonal antibody (ab9722; Abcam) in a 1:100 dilution of PBS with 2% BSA; rabbit IgG served as the negative control. After washing the cells in PBS 3 times, the cells were incubated for 45 minutes at room temper-ature with a goat anti- rabbit IgG– fluorescein isothiocyanate sec-ondary antibody (sc- 2012; Santa Cruz Biotechnology) in a 1:100 dilution of PBS with 2% BSA. Nuclear staining was performed with DAPI. After washing the cells in PBS twice, the cells were observed using a BZ- X700 fluorescence microscope.
Clinical assessments. Clinical information was obtained by reviewing electronic medical records. In patients with RA, the modified total Sharp score (mTSS) was evaluated by 2 rheu-matologists (KY and NK) who have >20 years of experience and expertise in musculoskeletal radiology and who were blinded with regard to the clinical information and laboratory data of the study participants (18). In patients with RA, the whole- body bone min-eral density (BMD) was measured by dual- energy x- ray absorpti-ometry (Discovery DXA System; Hologic).
Statistical analysis. Values are presented as the mean ± SEM. Comparisons between 2 groups were performed using the Mann- Whitney U test or Wilcoxon’s signed rank test for paired data. Correlations between the number of TNF and IL- 6– induced osteoclasts or RANKL-induced osteoclasts and the mTSS or whole- body BMD was calculated using Spearman’s rank correlation test. P values less than 0.05 were considered significant.
RESULTS
Differentiation of TRAP- positive multinucleated TNF and IL- 6– induced osteoclasts produced by the combination of TNF and IL- 6 in vitro. TRAP expression and multinucleated cells are defining features of osteoclasts (19). IL- 6 has been demonstrated to trigger direct osteoclast formation and induce bone resorption and has been considered to play an indirect role in inducing RANKL on osteoblasts and stromal cells (20,21). In the present study, we differentiated RANKL-induced osteoclasts in vitro by culturing peripheral blood monocytes with M- CSF and then adding RANKL and M- CSF (Figures 1A– C). Our findings showed that IL- 6 induced a low number of TRAP- positive cells and few multinucleated cells (Figures 1B and C). When another major proinflammatory cytokine, TNF, was added to this culture system, only a few multinucleated cells were observed, although TRAP- positive cells were abundant.
It has been reported that TNF induces cell fusion in human monocyte- derived macrophages and causes them to dif-ferentiate into a few multinucleated cells (22). In the present study, we observed the effects of TNF stimulation on the morphology of the cells differed from those in cultures with IL- 6 stimulation (Figure 1C). Interestingly, however, the combination of TNF and IL- 6 induced the formation of multiple TRAP- positive multinucle-ated cells (Figures 1B and C). These cells morphologically dif-fer from those induced by RANKL as follows: 1) the number of osteoclasts induced by TNF and IL- 6 was less than that of oste-oclasts induced by RANKL, and 2) the intensity of staining for TRAP among osteoclasts induced by TNF and IL- 6 was slightly weaker than that of osteoclasts induced by RANKL.
OPG is known as a decoy receptor for RANKL and an osteo-clastogenesis inhibitory factor (23). We added OPG to the culture system to determine whether RANKL induced by TNF and IL- 6

YOKOTA ET AL 1148 |
in monocyte- derived macrophages was involved in the differen-tiation of TRAP- positive multinucleated cells. OPG inhibited oste-oclastogenesis induced by RANKL, whereas OPG did not inhibit the differentiation of TRAP- positive multinucleated cells induced by the combination of TNF and IL- 6 (Figure 1D). Moreover, in cell cultures stimulated with the combination of TNF and IL- 6, we con-firmed the functional role of TRAP- positive multinucleated cells. Stimulation of monocyte- derived macrophages with TNF or IL- 6 alone did not generate resorption pits on the dentin slices. In con-trast, stimulation with TNF plus IL- 6 strongly generated resorption pits in a manner similar to those generated by stimulation with RANKL (Figure 1E and Supplementary Figure 1, available on the Arthritis & Rheumatology website at http://onlin elibr ary.wiley.com/doi/10.1002/art.41666/ abstract). These findings suggest that TNF and IL- 6 induced the differentiation of TRAP- positive multinu-cleated cells (named here as TNF and IL- 6– induced osteoclasts) as the bone- resorbing cells in a RANKL- independent manner.
Necessary role of NFATc1 and JAK activity in the differentiation of TNF and IL- 6– induced osteoclasts. We next examined the mechanisms underlying the differentiation of TNF and IL- 6– induced osteoclasts. The master regulator tran-scription factors involved in osteoclast differentiation are thought to be c- Fos and NFATc1 (24). We have previously reported that the expression level and activity of c- Fos and NFATc1 are critical for the
differentiation of mouse osteoclast- like cells induced by TNF and IL- 6 (12). During the course of TNF and IL- 6– induced osteoclast differentiation, NFATc1 protein and mRNA levels were clearly up- regulated after stimulation with TNF and IL- 6 (Figures 2A and B). As expected, the NFAT inhibitor tacrolimus (FK- 506) inhibited the differentiation of TNF and IL- 6– induced osteoclasts (Figure 2C). Thus, we demonstrated that NFATc1 activity is necessary for the differentiation of TNF and IL– 6- induced osteoclasts.
Intracellular signals involving IL- 6 are largely transmitted via the JAK/STAT pathway (25). We have previously reported the dependence of mouse osteoclast- like cells, but not RANKL- induced osteoclasts, on JAK (12). Thus, we examined whether addition of the pan- JAK inhibitor tofacitinib inhibited the differenti-ation of TNF and IL- 6– induced osteoclasts derived from PBMCs of healthy donors. Tofacitinib has recently been shown to be effective against RA (26). Here, we showed that in vitro addition of tofacitinib inhibited the differentiation of TNF and IL- 6– induced osteoclasts in a dose- dependent manner (Figure 3A and Sup-plementary Figure 2A, available on the Arthritis & Rheumatology website at http://onlin elibr ary.wiley.com/doi/10.1002/art.41666/ abstract). In this case, TRAP positivity was not affected. Like our previous report on mouse osteoclast- like cells (12), the same con-centrations of tofacitinib did not inhibit osteoclastogenesis induced by RANKL (Figure 3A and Supplementary Figure 2B). Next, we confirmed these findings using cells from multiple independent
Figure 1. Tumor necrosis factor (TNF) and interleukin- 6 (IL- 6)– induced osteoclasts display bone resorption activity in a RANKL- independent manner. A, Schematic representation of the culture system used in the in vitro experiments. B, Quantification of the number of tartrate- resistant acid phosphatase– positive (TRAP+) multinucleated (i.e., those with ≥3 nuclei) osteoclasts per well (n = 12). C, Photomicrographs of TRAP- positive multinucleated cells (MNCs). Original magnification × 100. D, Effect of osteoprotegerin (OPG) (1 mg/ml) on RANKL- induced osteoclastogenesis and TRAP- positive MNC differentiation induced by a combination of TNF and IL- 6 (n = 3). E, Quantification of the number of resorption pits per dentin slice (n = 4). In B, D, and E, symbols represent individual samples; values are the mean ± SEM. * = P < 0.05. PCR = polymerase chain reaction; ELISA = enzyme- linked immunosorbent assay.
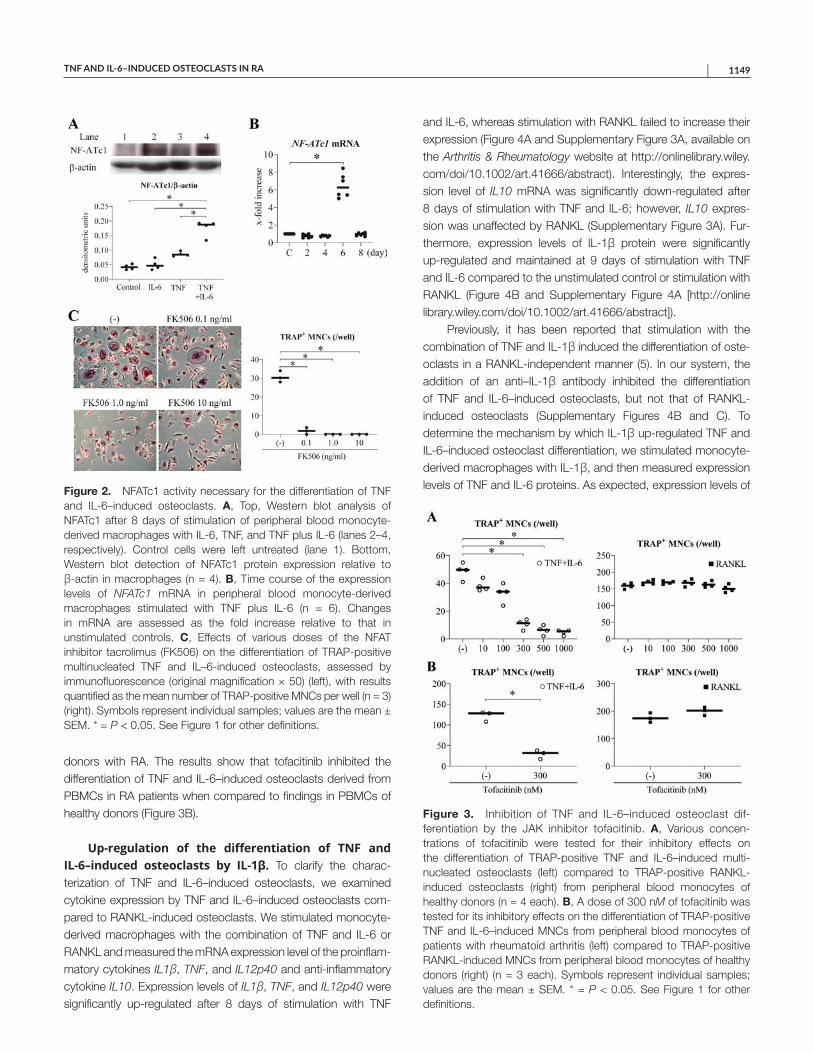
TNF AND IL- 6– INDUCED OSTEOCLASTS IN RA | 1149
donors with RA. The results show that tofacitinib inhibited the differentiation of TNF and IL- 6– induced osteoclasts derived from PBMCs in RA patients when compared to findings in PBMCs of healthy donors (Figure 3B).
Up- regulation of the differentiation of TNF and IL- 6– induced osteoclasts by IL- 1β. To clarify the charac-terization of TNF and IL- 6– induced osteoclasts, we examined cytokine expression by TNF and IL- 6– induced osteoclasts com-pared to RANKL-induced osteoclasts. We stimulated monocyte- derived macrophages with the combination of TNF and IL- 6 or RANKL and measured the mRNA expression level of the proinflam-matory cytokines IL1β, TNF, and IL12p40 and anti- inflammatory cytokine IL10. Expression levels of IL1β, TNF, and IL12p40 were significantly up- regulated after 8 days of stimulation with TNF
and IL- 6, whereas stimulation with RANKL failed to increase their expression (Figure 4A and Supplementary Figure 3A, available on the Arthritis & Rheumatology website at http://onlin elibr ary.wiley.com/doi/10.1002/art.41666/ abstract). Interestingly, the expres-sion level of IL10 mRNA was significantly down- regulated after 8 days of stimulation with TNF and IL- 6; however, IL10 expres-sion was unaffected by RANKL (Supplementary Figure 3A). Fur-thermore, expression levels of IL- 1β protein were significantly up- regulated and maintained at 9 days of stimulation with TNF and IL- 6 compared to the unstimulated control or stimulation with RANKL (Figure 4B and Supplementary Figure 4A [http://onlin e library.wiley.com/doi/10.1002/art.41666/ abstract]).
Previously, it has been reported that stimulation with the combination of TNF and IL- 1β induced the differentiation of oste-oclasts in a RANKL- independent manner (5). In our system, the addition of an anti– IL- 1β antibody inhibited the differentiation of TNF and IL- 6– induced osteoclasts, but not that of RANKL- induced osteoclasts (Supplementary Figures 4B and C). To determine the mechanism by which IL- 1β up- regulated TNF and IL- 6– induced osteoclast differentiation, we stimulated monocyte- derived macrophages with IL- 1β, and then measured expression levels of TNF and IL- 6 proteins. As expected, expression levels of Figure 2. NFATc1 activity necessary for the differentiation of TNF
and IL- 6– induced osteoclasts. A, Top, Western blot analysis of NFATc1 after 8 days of stimulation of peripheral blood monocyte- derived macrophages with IL- 6, TNF, and TNF plus IL- 6 (lanes 2– 4, respectively). Control cells were left untreated (lane 1). Bottom, Western blot detection of NFATc1 protein expression relative to β- actin in macrophages (n = 4). B, Time course of the expression levels of NFATc1 mRNA in peripheral blood monocyte- derived macrophages stimulated with TNF plus IL- 6 (n = 6). Changes in mRNA are assessed as the fold increase relative to that in unstimulated controls. C, Effects of various doses of the NFAT inhibitor tacrolimus (FK506) on the differentiation of TRAP- positive multinucleated TNF and IL– 6- induced osteoclasts, assessed by immunofluorescence (original magnification × 50) (left), with results quantified as the mean number of TRAP- positive MNCs per well (n = 3) (right). Symbols represent individual samples; values are the mean ± SEM. * = P < 0.05. See Figure 1 for other definitions.
Figure 3. Inhibition of TNF and IL- 6– induced osteoclast dif -fer entiation by the JAK inhibitor tofacitinib. A, Various con cen -trations of tofacitinib were tested for their inhibitory effects on the differentiation of TRAP- positive TNF and IL- 6– induced mult i -nucleated osteoclasts (left) compared to TRAP-positive RANKL-induced osteoclasts (right) from peripheral blood monocytes of healthy donors (n = 4 each). B, A dose of 300 nM of tofacitinib was tested for its inhibitory effects on the differentiation of TRAP- positive TNF and IL-6–induced MNCs from peripheral blood monocytes of patients with rheumatoid arthritis (left) compared to TRAP-positive RANKL-induced MNCs from peripheral blood monocytes of healthy donors (right) (n = 3 each). Symbols represent individual samples; values are the mean ± SEM. * = P < 0.05. See Figure 1 for other definitions.

YOKOTA ET AL 1150 |
these proteins were clearly up- regulated in cells stimulated with IL- 1β (Figure 4C). Whereas the lower concentration of the com-bination of TNF and IL- 6 (each 10 ng/ml) alone did not induce TRAP- positive multinucleated cells, the lower concentration of the combination of TNF, IL- 6, and IL- 1β (each 10 ng/ml) did induce this formation (Figure 4D and Supplementary Figure 4D). In addi-tion, IL- 1β increased TNF and IL- 6– induced osteoclast differentia-tion even in the presence of high doses of TNF and IL- 6 (data not shown). These results suggest that IL- 1β synergistically promotes the differentiation of TNF and IL- 6– induced osteoclasts induced by the combination of TNF and IL- 6.
Functional differences between TNF and IL- 6– induced osteoclasts and RANKL-induced osteoclasts differentiated from PBMCs in patients with RA. To under-stand the functional differences in TNF and IL- 6– induced osteo-clasts and RANKL-induced osteoclasts in patients with RA, we cultured PBMCs with a combination of TNF and IL- 6 or RANKL and assessed the number of TRAP- positive multinucleated TNF and IL- 6– induced osteoclasts and RANKL-induced osteoclasts. The number of TNF and IL- 6– induced osteoclasts and RANKL- induced derived from PBMCs in patients with RA was signifi-cantly increased compared to that derived from PBMCs in healthy donors (Figure 5A). It should be noted that even higher doses of TNF and IL- 6 (each 100 ng/ml) did not increase the differentiation of osteoclasts derived from PBMCs in healthy donors (data not shown).
To determine whether there was a correlation between the number of TNF and IL- 6– induced osteoclasts or osteoclasts induced from RA PBMCs, clinical indicators of the study partic-ipants were analyzed. There was a significant and positive corre-lation between the number of TNF and IL- 6– induced osteoclasts and serum levels of C- reactive protein (CRP) in the same patients (P = 0.027, r = 0.709), whereas there was no correlation between the number of RANKL-induced osteoclasts and serum levels of CRP (P = 0.218, r = 0.430) (data not shown). Interestingly, the number of TNF and IL- 6– induced osteoclasts also had a sig-nificant and positive correlation with mTSS values (P = 0.003, r = 0.855), whereas there was no correlation observed with mTSS values and number of RANKL-induced osteoclasts (P = 0.370, r = 0.321) (Figure 5B). In addition, the number of TNF and IL- 6– induced osteoclasts did not correlate with whole- body BMD values (P = 0.114, r = −0.539), whereas the number of RANKL- induced osteoclasts had a significant negative correlation with BMD (P = 0.031, r = −0.697) (Figure 5C).
To clarify the potential role of TNF and IL- 6– induced osteo-clasts in the progression of joint destruction and RANKL- induced osteoclasts in the development of systemic osteoporosis, we stimulated monocyte- derived macrophages with the com-bination of TNF and IL- 6 or RANKL and measured the mRNA expression of MMP3 and CTSK. As expected, the expression levels of MMP3 mRNA were significantly higher in TNF and IL- 6– induced osteoclasts induced by the combination of TNF and IL- 6 than in osteoclasts induced by RANKL and unstimulated
Figure 4. Promotion of the differentiation of TNF and IL- 6– induced osteoclasts by IL- 1β. A, Expression levels of IL- 1β mRNA in peripheral blood monocyte- derived macrophages after 8 days of stimulation with TNF plus IL- 6 (n = 6). B, Expression levels of IL- 1β protein in the supernatant from peripheral blood monocyte- derived macrophages after 9 days of stimulation with TNF plus IL- 6 (n = 6). C, Expression levels of TNF and IL- 6 proteins in the supernatant from peripheral blood monocyte- derived macrophages after 3 days of stimulation with IL- 1β (n = 8). D, Quantification of TRAP- positive MNCs in the absence versus presence of TNF, IL- 6, and IL- 1β (n = 6) at concentrations of 10 ng/ml (for all 3) and 50 ng/ml (for TNF and IL- 6). Symbols represent individual samples; values are the mean ± SEM. * = P < 0.05. See Figure 1 for other definitions.

TNF AND IL- 6– INDUCED OSTEOCLASTS IN RA | 1151
controls (Supplementary Figure 3B [http://onlin elibr ary.wiley.com/doi/10.1002/art.41666/ abstract]). Conversely, the expres-sion levels of CTSK mRNA were significantly higher in RANKL- induced osteoclasts than in unstimulated controls (Supplementary Figure 3B). Consistent with these results, the TNF and IL- 6– induced osteoclasts differentiated from PBMCs in patients with RA likely contribute to the progression of joint destruction by producing proinflammatory cytokines and matrix metallopro-teinase 3 (MMP-3), whereas RANKL-induced osteoclast activity leads to the development of systemic osteoporosis by producing cathepsin K.
DISCUSSION
In the present study, we showed that the combination of TNF and IL- 6, representative proinflammatory cytokines, in -duced the differentiation of TRAP- positive multinucleated TNF
and IL- 6– induced osteoclasts from human peripheral blood monocyte- derived macrophages, and that these TNF and IL- 6– induced osteoclasts had the ability to absorb bone matrix. The differentiation of TNF and IL- 6– induced osteoclasts depends on the activation of NFATc1 and JAK, leading to a prominent in crease in the production of proinflammatory cytokines and MMP- 3. Indeed, TNF and IL- 6 can induce the expression of IL- 1β in monocyte- derived macrophages, which promotes the differentiation of TNF and IL- 6– induced osteoclasts. Moreover, PBMCs from patients with RA showed higher TNF and IL- 6– induced osteoclast differentiation potentials compared to those from healthy donors. In addition, of importance was that the differentiation potential of TNF and IL- 6– induced osteoclasts derived from PBMCs in patients with RA was positively correlated with mTSS values, and that the osteoclast differ-entiation potential was negatively correlated with whole- body BMD.
We identified human proinflammatory cytokine– induced osteoclasts, which are similar to RANKL-induced osteoclasts
Figure 5. Functional differences between TNF and IL- 6– induced osteoclasts and RANKL-induced osteoclasts differentiated from peripheral blood mononuclear cells (PBMCs) in patients with rheumatoid arthritis (RA). A, Photomicrographs (original magnification × 100) and quantification of TRAP- positive MNCs differentiated from PBMCs from patients with RA and healthy donors (HDs) (n = 10 each). B, Correlation between the number of TNF and IL- 6– induced osteoclasts or RANKL-induced osteoclasts and modified total Sharp score (mTSS) in patients with RA (n = 10). C, Correlation between the number of TNF and IL- 6– induced osteoclasts or RANKL-induced osteoclasts and whole- body bone mineral density (BMD) in patients with RA (n = 10). Symbols represent individual samples; values are the mean ± SEM. * = P < 0.05. See Figure 1 for other definitions.

YOKOTA ET AL 1152 |
in that both are TRAP- positive multinucleated cells with bone resorption activity. However, TNF and IL- 6– induced osteoclasts differ from RANKL-induced osteoclasts as follows: 1) TNF and IL- 6– induced osteoclasts differentiate in a RANKL- independent manner and depend on activation of JAK, 2) these cells induce proinflammatory cytokines IL- 1β, TNF, and IL- 12p40 as well as MMP- 3, and 3) the differentiation potential of TNF and IL- 6– induced osteoclasts derived from PBMCs in patients with RA was positively correlated with mTSS values, but not with whole- body BMD. Thus, these findings suggest that TNF and IL- 6– induced osteoclasts could play an important role in joint destruction in patients with RA (Table 1).
Recently, Hasegawa et al described murine arthritis- associated osteoclastogenic macrophages as the osteoclast precursor– containing population in the inflamed synovium, which were distinctive from RANKL-induced osteoclast precursors (27). These arthritis- associated osteoclastogenic macrophages differ-entiated into osteoclasts in a RANKL- dependent manner, and their differentiation was promoted by TNF, but not by IL- 6. In addition, these cells were inhibited by OPG. However, the differentiation of TNF and IL- 6– induced osteoclasts was induced in a RANKL- independent manner, and both TNF and IL- 6 were required for differentiation. This suggests that arthritis- associated osteoclas-togenic macrophages and TNF and IL- 6– induced osteoclasts are different cell lineages. Furthermore, the efficacy and safety of anti– IL- 6 receptor antibodies in the treatment of patients with RA have been well- established. In addition, anti– IL- 6 receptor antibodies impede or arrest the progression of bone destruction in RA (9), thus indicating the importance of IL- 6– dependent osteoclastogen-esis. Therefore, these findings suggest that TNF and IL- 6– induced osteoclasts are also involved in the pathologic mechanisms of inflammatory arthritis associated with joint destruction in RA.
TNF and IL- 6– induced osteoclasts may play a physiologic role in the post- fracture healing process. In general, immedi-ately after bone fractures, blood vessels rupture and bleed, and immune cells accumulating at the fracture site release proin-flammatory cytokines that come into contact with hematopoietic precursor cells (28). During this process, the combination of TNF and IL- 6 could stimulate osteoclast precursors and induce the
differentiation of TNF and IL- 6– induced osteoclasts, thereby pro-moting the resorption of damaged bone tissue. In the near future, further studies could be pursued to verify this hypothesis.
We investigated the molecular mechanisms driving cell dif-ferentiation. Expression levels and activities of NFATc1 are criti-cal for the differentiation of TNF and IL- 6– induced osteoclasts, which were both elevated in response to stimulation with com-bined TNF and IL- 6. Previously, in mouse osteoclast- like cells, we demonstrated that TNF activated both the canonical and noncanonical NF- κB pathways, and TNF and IL- 6 synergisti-cally affected the activities and expression of c- Fos, a master regulator of osteoclastogenesis. Knockdown of c- Fos inhibited the expression of NFATc1 and differentiation of osteoclast- like cells. In addition, NFATc1, JAK, and ERK inhibitors blocked osteoclast- like cell differentiation, whereas conditional knockout of STAT3 did not block osteoclast- like cell differentiation. Taken together, the JAK- MEK/ERK signaling pathway likely regulates the differentiation of osteoclast- like cells (12). Based on the findings from that previous report and the results of the cur-rent study, it is likely that TNF together with IL- 6 can substitute RANKL/RANK signaling through the activation of NF- κB/c- Fos/NFATc1 and calcium signaling for human TNF and IL- 6– induced osteoclast differentiation (29).
We demonstrate that PBMCs from patients with RA had sig-nificantly higher osteoclastogenic potential than those from healthy donors, confirming the results of a previous study (17). It has been reported that the frequency of osteoclast precursors was signifi-cantly higher in patients with RA than in healthy donors. In addi-tion, an enhanced frequency of peripheral osteoclast precursors from patients with RA associated with increased osteoclastogenic potential of PBMCs has been shown in other groups (30,31). We also showed that the differentiation potential of TNF and IL- 6– induced osteoclasts derived from PBMCs in patients with RA was positively correlated with serum levels of CRP. In general, CRP levels reflect synovial inflammation, which is demonstrated by significantly increased serum levels of inflammation- associated cytokines, including IL- 6, IL- 1β, and TNF (32). In addition, the serum levels of CRP were shown to mirror those of IL- 6 and to correlate with radiographic progression (33).
Table 1. Characteristics of human TNF and IL- 6– induced osteoclasts and RANKL-induced osteoclasts*
TNF and IL- 6– induced osteoclasts
RANKL- induced osteoclasts
TRAP- positive MNCs ++ +++Bone resorption activity ++ +++Inhibitory effect of OPG on differentiation – ++Inhibitory effect of JAK inhibitor on
differentiation++ –
Expression of inflammatory cytokines and MMP- 3
++ –
* Results are shown as either ++ or +++ based on the intensity of staining for each characteristic, while – indicates the absence of the characteristic. TNF = tumor necrosis factor; IL- 6 = interleukin- 6; TRAP+ MNCs = tartrate- resistant acid phosphatase– positive multinucleated cells; OPG = osteoprotegerin; MMP- 3 = matrix metalloproteinase 3.

TNF AND IL- 6– INDUCED OSTEOCLASTS IN RA | 1153
Although we did not measure serum levels of proinflamma-tory cytokines, it has been reported that expression levels of TNF and IL- 6 in the serum and synovial fluid of patients with RA are significantly higher than those in the serum and synovial fluid of healthy donors (1). Based on these reports, we speculate that the higher levels of TNF and IL- 6 in serum and synovial fluid originating from RA synovial inflammation induced the differentiation of TNF and IL- 6– induced osteoclasts, and that these activated cells may be implicated in joint destruction by producing proinflammatory cytokines and MMP- 3. It is suggested that TNF or IL- 6 inhibi-tor may suppress bone destruction by inhibiting the differentiation of bone- resorptive TNF and IL- 6– induced osteoclasts induced by the combination of TNF and IL- 6.
Our study had several limitations. First, to identify the cell- specific molecules of human TNF and IL- 6– induced osteoclasts and RANKL-induced osteoclasts, we examined and compared the differences in gene and protein expression in cultured whole cells using transcriptome analysis. However, to identify more cell- specific molecules of human TNF and IL- 6– induced osteoclasts and RANKL-induced osteoclasts, comprehensive gene expres-sion analyses, such as a single- cell approach, may be required. Second, additional studies are needed to determine whether other osteoclast subsets contribute to bone destruction in RA patients.
In conclusion, the results of the present study demon-strate that TNF and IL- 6– induced osteoclasts can differentiate via RANKL- independent pathways, and that there are functional differences between TNF and IL- 6– induced osteoclasts and RANKL-induced osteoclasts. In particular, targeting TNF and IL- 6– induced osteoclasts as well as RANKL-induced osteoclasts is anticipated to create new therapeutic strategies such as JAK inhibitors.
ACKNOWLEDGMENTS
We are grateful to N. Murai, N. Honma, T. Kamei, and K. Yamaguchi (Saitama Medical University) for technical assistance, and we also thank H. Kajiyama and Y. Araki (Saitama Medical University) for helpful discussions.
AUTHOR CONTRIBUTIONS
All authors were involved in drafting the article or revising it critically for important intellectual content, and all authors approved the final version to be published. Dr. Yokota had full access to all the study data and takes responsibility for the integrity of the data and the accuracy of the data analysis.Study conception and design. Yokota, Miyazaki, Tanaka, Mimura.Acquisition of data. Yokota, Miyazaki, Kozu.Analysis and/or interpretation of data. Yokota, Sato, Miyazaki, Aizaki, Tanaka, Sekikawa, Kadono, Oda, Mimura.
REFERENCES 1. Sato K, Suematsu A, Nakashima T, Takemoto- Kimura S, Aoki
K, Morishita Y, et al. Regulation of osteoclast differentiation and function by the CaMK- CREB pathway [letter]. Nat Med 2006; 12:1410– 6.
2. Sato K, Takayanagi H. Osteoclasts, rheumatoid arthritis, and osteo-immunology [review]. Curr Opin Rheumatol 2006;18:419– 26.
3. Adamopoulos IE, Mellins ED. Alternative pathways of osteoclas-togenesis in inflammatory arthritis [review]. Nat Rev Rheumatol 2015;11:189– 94.
4. Zhao B, Grimes SN, Li S, Hu X, Ivashkiv LB. TNF- induced oste-oclastogenesis and inflammatory bone resorption are inhibited by transcription factor RBP- J. J Exp Med 2012;209:319– 34.
5. Kim N, Kadono Y, Takami M, Lee J, Lee SH, Okada F, et al. Osteoclast differentiation independent of the TRANCE– RANK– TRAF6 axis. J Exp Med 2005;202:589– 95.
6. Schett G, Elewaut D, McInnes IB, Dayer JM, Neurath MF. How cytokine networks fuel inflammation: toward a cytokine- based dis-ease taxonomy. Nat Med 2013;19:822– 4.
7. Lam J, Takeshita S, Barker JE, Kanagawa O, Ross FP, Teitelbaum SL. TNF- α induces osteoclastogenesis by direct stimulation of mac-rophages exposed to permissive levels of RANK ligand. J Clin Invest 2000;106:1481– 8.
8. Axmann R, Böhm C, Krönke G, Zwerina J, Smolen J, Schett G. Inhibition of interleukin- 6 receptor directly blocks osteoclast forma-tion in vitro and in vivo. Arthritis Rheum 2009;60:2747– 56.
9. Finzel S, Kraus S, Figueiredo CP, Regensburger A, Kocijan R, Rech J, et al. Comparison of the effects of tocilizumab monotherapy and adalimumab in combination with methotrexate on bone erosion repair in rheumatoid arthritis. Ann Rheum Dis 2019;78:1186– 91.
10. Smolen JS, Han C, Bala M, Maini RN, Kalden JR, van der Heijde D, et al. Evidence of radiographic benefit of treatment with infliximab plus methotrexate in rheumatoid arthritis patients who had no clinical improvement: a detailed subanalysis of data from the Anti–Tumor Necrosis Factor Trial in Rheumatoid Arthritis with Concomitant Therapy study. Arthritis Rheum 2005;52:1020– 30.
11. Smolen JS, Avila JC, Aletaha D. Tocilizumab inhibits progres-sion of joint damage in rheumatoid arthritis irrespective of its anti- inflammatory effects: disassociation of the link between inflammation and destruction. Ann Rheum Dis 2012;71:687– 93.
12. Yokota K, Sato K, Miyazaki T, Kitaura H, Kayama H, Miyoshi F, et al. Combination of tumor necrosis factor α and interleukin- 6 induces mouse osteoclast- like cells with bone resorption activity both in vitro and in vivo. Arthritis Rheumatol 2014;66:121– 9.
13. O’Brien W, Fissel BM, Maeda Y, Yan J, Ge X, Gravallese EM, et al. RANK- independent osteoclast formation and bone erosion in inflam-matory arthritis. Arthritis Rheumatol 2016;68:2889– 900.
14. Aletaha D, Neogi T, Silman AJ, Funovits J, Felson DT, Bingham CO III, et al. 2010 rheumatoid arthritis classification criteria: an American College of Rheumatology/European League Against Rheumatism collaborative initiative. Arthritis Rheum 2010;62:2569– 81.
15. Arnett FC, Edworthy SM, Bloch DA, McShane DJ, Fries JF, Cooper NS, et al. The American Rheumatism Association 1987 revised cri-teria for the classification of rheumatoid arthritis. Arthritis Rheum 1988;31:315– 24.
16. Yokota K, Miyazaki T, Hemmatazad H, Gay RE, Kolling C, Fearon U, et al. The pattern- recognition receptor nucleotide- binding oligomer-ization domain– containing protein 1 promotes production of inflam-matory mediators in rheumatoid arthritis synovial fibroblasts. Arthritis Rheum 2012;64:1329– 37.
17. Bozec A, Zaiss MM, Kagwiria R, Voll R, Rauh M, Chen Z, et al. T cell costimulation molecules CD80/86 inhibit osteoclast differentia-tion by inducing the IDO/tryptophan pathway. Sci Transl Med 2014; 6:235ra60.
18. Van der Heijde D, Simon L, Smolen J, Strand V, Sharp J, Boers M, et al. How to report radiographic data in randomized clinical tri-als in rheumatoid arthritis: guidelines from a roundtable discussion. Arthritis Rheum 2002;47:215– 8.

YOKOTA ET AL 1154 |
19. Minkin C. Bone acid phosphatase: tartrate- resistant acid phos-phatase as a marker of osteoclast function. Calcif Tissue Int 1982;34:285– 90.
20. Tamura T, Udagawa N, Takahashi N, Miyaura C, Tanaka S, YamadaY, et al. Soluble interleukin- 6 receptor triggers osteoclast formationby interleukin 6. Proc Natl Acad Sci U S A 1993;90:11924– 8.
21. Ishimi Y, Miyaura C, Jin CH, Akatsu T, Abe E, Nakamura Y, et al. IL- 6is produced by osteoblasts and induces bone resorption. J Immunol1990;145:3297– 303.
22. Yarilina A, Xu K, Chen J, Ivashkiv LB. TNF activates calcium- nuclearfactor of activated T cells (NFAT)c1 signaling pathways in humanmacrophages. Proc Natl Acad Sci U S A 2011;108:1573– 8.
23. Lacey DL, Timms E, Tan HL, Kelley MJ, Dunstan CR, Burgess T,et al. Osteoprotegerin ligand is a cytokine that regulates osteoclastdifferentiation and activation. Cell 1998;93:165– 76.
24. Takayanagi H, Kim S, Koga T, Nishina H, Isshiki M, Yoshida H, et al.Induction and activation of the transcription factor NFATc1 (NFAT2)integrate RANKL signaling in terminal differentiation of osteoclasts.Dev Cell 2002;3:889– 901.
25. Garbers C, Heink S, Korn T, Rose- John S. Interleukin- 6: designingspecific therapeutics for a complex cytokine [review]. Nat Rev DrugDiscov 2018;17:395– 412.
26. Van der Heijde D, Strand V, Tanaka Y, Keystone E, Kremer J, ZerbiniCA, et al. Tofacitinib in combination with methotrexate in patients
with rheumatoid arthritis: clinical efficacy, radiographic, and safety outcomes from a twenty- four– month, phase III study. Arthritis Rheumatol 2019;71:878– 91.
27. Hasegawa T, Kikuta J, Sudo T, Matsuura Y, Matsui T, Simmons S,et al. Identification of a novel arthritis- associated osteoclast precursor macrophage regulated by FoxM1. Nat Immunol 2019;20:1631– 43.
28. Adamopoulos IE. Inflammation in bone physiology and pathology[review]. Curr Opin Rheumatol 2018;30:59– 64.
29. Jung YK, Kang YM, Han S. Osteoclasts in the inflammatory arthri-tis: implications for pathologic osteolysis [review]. Immune Netw2019;19:e2.
30. Herman S, Müller RB, Krönke G, Zwerina J, Redlich K, Hueber AJ,et al. Induction of osteoclast- associated receptor, a key osteoclastcostimulation molecule, in rheumatoid arthritis. Arthritis Rheum2008;58:3041– 50.
31. Li P, Schwarz EM, O’Keefe RJ, Ma L, Looney RJ, Ritchlin CT, et al.Systemic tumor necrosis factor α mediates an increase in peripheralCD11bhigh osteoclast precursors in tumor necrosis factor α– trans-genic mice. Arthritis Rheum 2004;50:265– 76.
32. Gabay C, Kushner I. Acute- phase proteins and other systemicresponses to inflammation. N Eng J Med 1999;340:448– 54.
33. Lindqvist E, Eberhardt K, Bendtzen K, Heinegård D, Saxne T.Prognostic laboratory markers of joint damage in rheumatoid arthri-tis. Ann Rheum Dis 2005;64:196– 201.

1155
Arthritis & RheumatologyVol. 73, No. 7, July 2021, pp 1155–1166DOI 10.1002/art.41655© 2021 Authors or their employers. Arthritis & Rheumatology published by Wiley Periodicals LLC on behalf of American College of Rheumatology. This is an open access article under the terms of the Creative Commons Attribution- NonCommercial- NoDerivs License, which permits use and distribution in any medium, provided the original work is properly cited, the use is non- commercial and no modifications or adaptations are made.
Contribution of a European-Prevalent Variant near CD83 and an East Asian–Prevalent Variant near IL17RB to Herpes Zoster Risk in Tofacitinib Treatment: Results of Genome-Wide Association Study Meta-AnalysesNan Bing,1 Huanyu Zhou,1 Xing Chen,1 Tomohiro Hirose,2 Yuta Kochi,3 Yumi Tsuchida,4 Kazuyoshi Ishigaki,5 Shuji Sumitomo,4 Keishi Fujio,4 Baohong Zhang,1 Hernan Valdez,6 Michael S. Vincent,1 David Martin,1 and James D. Clark1
Objective. Tofacitinib is an oral JAK inhibitor for the treatment of rheumatoid arthritis (RA), psoriatic arthritis, and ulcerative colitis, and has been previously investigated for psoriasis (PsO). This meta- analysis of genome- wide association studies (GWAS) was performed to identify genetic factors associated with increased risk/faster onset of herpes zoster (HZ) in subjects with RA or PsO receiving tofacitinib treatment, and to determine potential mechanisms that could be attributed to the varying rates of HZ across ethnicities.
Methods. In an ethnicity/indication- specific, trans- ethnic, trans- population meta- analysis of GWAS in subjects with RA or PsO from phase II, phase III, and long- term extension studies of tofacitinib, 8 million genetic variants were evaluated for their potential association with time to an HZ event and incidence of an HZ event (case versus control) with tofacitinib treatment, using Cox proportional hazard and logistic regression analyses, respectively.
Results. In total, 5,246 subjects were included (3,168 with RA and 2,078 with PsO). After adjustment for age, baseline absolute lymphocyte count, genetically defined ethnicity, and concomitant methotrexate use (in RA subjects only), 4 loci were significantly associated with faster onset of HZ in European subjects (P < 5 × 10⁻⁸), including a single- nucleotide polymorphism (SNP) near CD83 (frequency of risk allele ~2% in European subjects versus ~0.1% in East Asian subjects). In the trans- ethnic, trans- population meta- analysis, the CD83 SNP remained significant. Four additional significant loci were identified in the meta- analysis, among which a SNP near IL17RB was associated with faster onset of HZ (meta- analysis hazard ratio 3.6 [95% confidence interval 2.40– 5.44], P = 7.6 × 10⁻¹⁰; frequency of risk allele ~12% in East Asian subjects versus <0.2% in European subjects).
Conclusion. Genetic analysis of tofacitinib- treated subjects with RA or PsO identified multiple loci associated with increased HZ risk. Prevalent variants near the immune- relevant genes CD83 and IL17RB in European and East Asian populations, respectively, may contribute to risk of HZ in tofacitinib- treated subjects.
INTRODUCTION
Tofacitinib is an oral JAK inhibitor for the treatment of rheu-matoid arthritis (RA), psoriatic arthritis (PsA), and ulcerative colitis (UC), and has been previously investigated for psoriasis (PsO).
Tofacitinib is an orally bioavailable small molecule whose inhibitory activity involves blockade of the ATP binding site (1). In cellular settings where the various JAKs signal in combination, tofacitinib preferentially inhibits signaling by heterodimeric receptors associ-ated with JAK1 and/or JAK3, and has functional selectivity over
Sponsored by Pfizer Inc. The studies of CD4+ T cell subsets were supported by funding from Pfizer Inc. and Takeda Pharmaceutical Co., Ltd., and by a grant from RIKEN.
1Nan Bing, PhD, Huanyu Zhou, ScD, Xing Chen, ScD, Baohong Zhang, PhD, Michael S. Vincent, MD, PhD, David Martin, MD, James D. Clark, PhD: Pfizer Inc., Cambridge, Massachusetts; 2Tomohiro Hirose, MSc: Pfizer Japan Inc., Tokyo, Japan; 3Yuta Kochi, MD, PhD: Laboratory for Autoimmune Diseases, Center for Integrative Medical Sciences, RIKEN, Yokohama, Japan, and De partment of Genomic Function and Diversity, Medical Research Institute, Tokyo Medical and Dental University, Tokyo, Japan; 4Yumi Tsuchida, MD, PhD,
Shuji Sumitomo, MD, PhD, Keishi Fujio, MD, PhD: Department of Allergy and Rheumatology, Graduate School of Medicine, University of Tokyo, Tokyo, Japan; 5Kazuyoshi Ishigaki, MD, PhD: Laboratory for Statistical Analysis, Center for Integrative Medical Sciences, RIKEN, Yokohama, Japan; 6Hernan Valdez, MD: Pfizer Inc., New York, New York.
Drs. Bing, Zhou, Zhang, and Clark were employees of Pfizer Inc. at the time of the analysis. Drs. Chen, Hirose, Valdez, Vincent, and Martin own stock or stock options in Pfizer Inc. Drs. Kochi, Tsuchida, Ishigaki, Sumitomo, and Fujio have received research funding from Chugai Pharmaceutical Co., Ltd., Pfizer Inc., and Takeda Pharmaceutical Co., Ltd.

BING ET AL 1156 |
JAK2 (1). The efficacy and safety of tofacitinib have been studied across multiple immune- mediated inflammatory diseases, includ-ing RA (2– 7) and PsO (8– 11).
The safety profile of tofacitinib in subjects with RA or PsO is generally similar to that of tumor necrosis factor inhibitors and other biologic disease- modifying antirheumatic drugs (bDMARDs), with the exception of herpes zoster (HZ) rates (12– 15). HZ risk is elevated in subjects with RA in compar-ison to the general population (16), and the risk is further increased in tofacitinib- treated subjects (17), although multi-dermatomal or disseminated HZ cases have been infrequent (8% of HZ cases) in subjects receiving tofacitinib (13). This appears to be a class- specific effect, because use of other JAK inhibitors targeting JAK1 or JAK1/JAK2 has resulted in an increased risk of HZ (18). HZ risk in tofacitinib- treated sub-jects with RA increases with age, glucocorticoid use, tofacitinib dose, and enrollment within Asia (e.g., subjects from Japan and Korea have 2– 3- fold higher rates of HZ versus those from other regions) (19). Similarly, in tofacitinib- treated subjects with PsO, HZ risk increases with age, tofacitinib dose, and Asian descent, and also prior bDMARD use (20). Subjects with UC and those with PsA receiving tofacitinib also experience higher rates of HZ when compared with subjects who have not been treated with tofacitinib (21– 23). The higher HZ rates in Asian subjects observed in the RA and PsO studies (17,20) could be attributable to multiple factors, including ascertainment bias, prevalence of a genetic clade of virus prone to reactivation, enhanced response to tofacitinib, or an interaction between JAK inhibition and a genetic polymorphism more common in Japan and Korea.
Genetic studies have identified variations in the HLA region as being associated with risk of HZ (24). We hypothesized that genetic factors may be associated with tofacitinib- related HZ, and that the genetic variation across ethnicities may contribute to the variance in HZ rates. Identifying such genetic factors could help reveal the mechanisms of, and hence the risk of, varicella zoster virus (VZV) reactivation related to tofacitinib. We therefore conducted a genome- wide trans- ancestry meta- analysis of HZ using DNA samples from RA and PsO subjects receiving treat-ment with tofacitinib in clinical studies. Furthermore, to under-stand the mechanism of an HZ- associated variant near IL17RB, we correlated the allele count and the expression of candidate genes in immune cell types via an expression quantitative trait loci (eQTL) analysis.
PATIENTS AND METHODS
Population. This analysis included subjects with RA or PsO from phase II and phase III index tofacitinib studies (ClinicalTrials.gov identifiers NCT00413660, NCT00550446, NCT00603512, NCT00687193, NCT01059864, NCT00960440, NCT00847613, NCT00814307, NCT00856544, NCT00853385, NCT01039668, NCT00678210, NCT01276639, NCT01309737, NCT01241591, NCT01186744, and NCT01519089) and the correspond-ing long- term extension (LTE) studies (ClinicalTrials.gov identifiers NCT00413699, NCT00661661, and NCT01163253) (for more details, see Supplementary Table 1 available on the Arthri-tis & Rheumatology website at http://onlin elibr ary.wiley.com/doi/10.1002/art.41655/ abstract). All subjects provided written informed consent.
Blood samples for genetic studies were genotyped, and passed sample quality control (QC). HZ events from both index and LTE studies were included in the analysis (data cutoff: April 2014).
Genotyping, imputation, and data QC. Germline DNA was extracted from peripheral blood. Single- nucleotide polymor-phism (SNP) data were generated using Illumina Human Omni-Express Plus Exome genome- wide arrays, versions 1– 4 (https://www.illum ina.com/produ cts/by- type/micro array - kits/infin ium- omni- expre ss- exome.html). The genotype calls were conducted through GenomeStudio by Illumina. SNPs were imputed using IMPUTE2 (25), using reference panels from the 1000 Genomes Project phase I integrated variant set. Subjects who failed the sex match based on self- reported sex or those who failed the het-erozygosity check or relatedness test were excluded from the downstream analysis. Furthermore, SNPs that were estimated to have poor imputation performance (quality score <0.9) were removed from the analysis.
Up to 8 million autosomal SNPs were imputed. The allelic dosage of each genetic variant, ranging from 0 to 2 and calculated from posterior genotype probabilities from IMPUTE2, was used in each statistical model. As an additional QC step, allele frequencies of variants that produced the strongest association signals were compared with those reported in the gnomAD database (https://gnomad.broad insti tute.org/).
To determine the genetic ancestry of all subjects, we per-formed a principal components analysis (PCA) using EIGENSTRAT. Prior to PCA, the study data were combined with data from the 1000 Genomes Project. Independent autosomal SNPs across the
Upon request, and subject to certain criteria, conditions, and exceptions (see https://www.pfizer.com/science/clinical trials/trial data and results for more information), Pfizer will provide access to individual deidentified participant data from Pfizer sponsored global interventional clinical studies conducted for medicines, vaccines, and medical devices 1) for indications that have been approved in the US and/or EU or 2) in programs that have been terminated (i.e., development for all indications has been discontinued). Pfizer will also consider requests for the protocol, data dictionary, and statistical analysis plan. Data may be requested from Pfizer trials 24 months
after study completion. The deidentified participant data will be made available to researchers whose proposals meet the research criteria and other conditions, and for which an exception does not apply, via a secure portal. To gain access, data requestors must enter into a data access agreement with Pfizer.
Address correspondence to Nan Bing, PhD, Cambridge, MA. Email: [email protected].
Submitted for publication November 28, 2019; accepted in revised form January 12, 2021.

GENETIC FACTORS ASSOCIATED WITH TOFACITINIB- RELATED HZ | 1157
genome were selected after pruning, and chromosomal regions known to be associated with ethnicity were also removed before running SmartPCA. Empiric ancestry groups were then deter-mined based on the distribution over the first 2 principal com-ponents in each self- reported population, using clinical data. Subjects who were more than 6 standard deviations from either of the 2 first principal components were removed in the final sta-tistical analyses.
End points and analyses of associations. Two end points were evaluated: 1) time to HZ event with tofacitinib treat-ment, defined as the interval between the first tofacitinib treatment in either the index or the LTE studies and the earliest HZ event; and 2) numbers of HZ cases versus controls, in which HZ cases were subjects with investigator- reported HZ, and controls were subjects who received tofacitinib in the index or LTE studies and did not develop HZ during the study observation period. Cox pro-portional hazard and logistic regression analyses were used for assessing associations with the time to HZ event and incidence of an HZ event (cases versus controls), respectively. R version 3.2 software was used for the statistical analyses.
Covariates. A set of baseline clinical variables that are known to, or could potentially, affect the rate of HZ were evaluated for inclusion as covariates in the analysis model. The covariates considered in RA studies included age (in years), sex, baseline weight, baseline rheumatoid factor status, baseline RA severity based on the Disease Activity Score in 28 joints (26), erythrocyte sedimentation rate, RA duration, baseline absolute lymphocyte count (ALC), baseline neutrophil count, glucocorticoid use, and concomitant methotrexate use. The covariates considered in PsO studies included age (in years), sex, baseline weight, baseline ALC, baseline neutrophil count, PsO duration, presence versus absence of PsA at baseline, and proportion of subjects achiev-ing a 75% decrease in the Psoriasis Area and Severity Index (27) at week 12 or week 16 (depending on the trial). Tofacitinib dose was not included as a covariate because of the potential for dose switching in the LTE studies.
Covariates were selected via stepwise variable selection, using a P value cutoff of 0.05. In this analysis, age, baseline ALC, genetic population stratification, and concomitant methotrexate use (in RA subjects only) were included as covariates in the asso-ciation test. Additionally, the first 3 principal components defined by genetic data within each ancestry subgroup were included in the analysis model.
Ancestry-specific and trans-ancestry genome-wideassociation study (GWAS) meta- analyses. Genetic ancestry subgroups of subjects (European, East Asian, South Asian, His-panic, and Black) were defined as those clustering in principal com-ponent space, as estimated from genome- wide genotype data in combination with self- reported ethnicities. Ancestry- specific
GWAS were performed for European, East Asian, and Hispanic subgroups. The sample sizes for the Black and South Asian pop-ulations were small; these subgroups were therefore excluded from the GWAS.
Each SNP with a minor allele frequency (MAF) of >2% in each ethnicity subgroup within either the RA or PsO populations was tested for association, under an additive model with adjustment for covariates. A meta- analysis across the ancestry subgroups and populations was conducted via a fixed effects model, with significant association defined as P values less than or equal to 5 × 10⁻⁸. The meta- analysis included any SNPs with an MAF of >2% in at least 1 ethnicity subgroup; rarer alleles were not included, as the sample size would not be expected to provide adequate power for the risk estimate. Trans- ethnicity allelic het-erogeneity was assessed with Cochran’s Q test using the meta- analysis random effects model, with a statistically significant level defined, using the conservative Bonferroni correction, as 0.005 (0.05 divided by 10). In an additional analysis, we restricted the meta- analysis to variants with an MAF of >2% in all ethnic subgroups. Significant loci were labeled according to the gene nearest to the lead SNP, unless a compelling biologic candidate was mapped nearby. The overall design of the trans- ancestry and trans- population GWAS meta- analysis is illustrated in Figure 1.
Assessment of associations between genetic vari-ants and proportions of CD4+ T cell subtypes. To identify the role of genetic variants in regulating immune phenotypes, flow cytometry was performed on freshly isolated peripheral blood mononuclear cells (PBMCs) from 82 healthy Japanese indi-viduals (see Supplementary Methods, available on the Arthritis & Rheumatology website at http://onlin elibr ary.wiley.com/doi/10. 1002/art.41655/ abstract).
Standardized human immunophenotyping was performed to classify CD4+ T cells into conventional Th1, Th2, Th17, and Treg cell types. Association of the genetic variants with the proportions of these CD4+ T cell subtypes was evaluated using an additive genetic model via linear regression analysis. In this analysis, only the association of the candidate SNP on CD4+ T cell subtypes
Figure 1. Overall design of the trans- ancestry and trans- population genome- wide association study (GWAS) meta- analysis in subjects with rheumatoid arthritis (RA) or psoriasis (PsO). *Black and South Asian subgroups were excluded from the GWAS meta- analysis due to small sample sizes.

BING ET AL 1158 |
was reported. Significance of the associations was defined as a P value cutoff of 0.05.
Tcellsubtype–specificeQTLanalysis. Blood samples were collected from 29 healthy Japanese individuals. Naive CD4+ T cells from these individuals were collected via fluorescence- activated cell sorting. These cells were cultured for 72 hours and differentiated into T cell subtypes via stimulation of CD3/CD28 (for Th0 cells), CD3/CD28 plus interferon- γ (IFNγ) (for Th1 cells), CD3/CD28 plus interleukin- 4 (IL- 4) (for Th2 cells), CD3/CD28 plus IL- 1β plus IL- 6 plus IL- 23 plus transforming growth factor β (TGFβ) (for Th17 cells), or CD3/CD28 plus IL- 2 plus TGFβ plus all- trans- retinoic acid (for Treg cells). Gene expression of each cell type was measured using RNA sequencing with Illumina HiSeq 2000. Genotyping was conducted via Infinium OmniExpressEx-ome BeadChips. Gene expression levels were quantified using Hisat2 (28) and HTSeq (29) using the GENCODE annotation (ver-sion 25), followed by normalization using probabilistic estimation of expression residuals (30,31); the residuals were further treated by quantile normalization, and each gene expression value was then rank- transformed to fit normal distribution. The association between variants and normalized expression values was analyzed using linear regression with an additive effects model. Within this analysis, only the eQTLs of the candidate SNP on the candi-date gene are reported. Significant association was defined as a P value cutoff of 0.05.
The studies involving blood samples from healthy Japanese individuals were approved by the Ethics Committees of RIKEN and the University of Tokyo. Written informed consent was obtained from each volunteer.
RESULTS
Subjects. Overall, 9,640 subjects with RA or PsO were recruited in the 17 phase II, phase III, and LTE studies (Supplemen-tary Table 1 [http://onlin elibr ary.wiley.com/doi/10.1002/art. 41655/ abstract]). DNA samples were collected from 5,605 subjects; 5,246 subjects (3,168 RA subjects and 2,078 PsO subjects) re -mained in the genetic studies following sample QC. A total of 5,027 subjects received ≥1 dose of tofacitinib in the index or LTE studies, and thus were retained in the analysis. The other 219 subjects were initially included in the placebo or comparator arms in the index stud-ies and were not switched to tofacitinib in the LTE studies.
Of the tofacitinib- treated subjects, 328 cases of HZ were reported (256 cases among RA subjects and 72 cases among PsO subjects). The numbers of subjects within each genetic ancestry subgroup were as follows: 3,787 European (75.3%), 671 Hispanic (13.3%), 383 East Asian (7.6%), 97 Black (1.9%), and 89 South Asian (1.8%) (Figure 1 and Supplementary Table 2, available on the Arthritis & Rheumatology website at http://onlin e libr ary.wiley.com/doi/10.1002/art.41655/ abstract). The HZ rates
and distribution of demographic and clinical characteristics of the subjects in this genotyped cohort were consistent with those in the overall trial populations (see details in Supplementary Tables 3 and 4, available on the Arthritis & Rheumatology website at http://onlin elibr ary.wiley.com/doi/10.1002/art.41655/ abstract).
Identification of 4 genetic loci associated withincreased HZ risk in European ancestry GWAS. Ancestry- specific GWAS were performed in European, Hispanic, and East Asian ethnicity subgroups within the RA or PsO populations (Fig-ure 1 and Supplementary Table 2 [http://onlin elibr ary.wiley.com/ doi/10.1002/art.41655/ abstract]). European ancestry– specific GWAS identified 4 loci (1 in RA subjects and 3 in PsO subjects) that were significantly associated with a faster time to an HZ event (P < 5 × 10⁻⁸) in tofacitinib- treated subjects (Table 1 and Supplementary Figure 1, available on the Arthritis & Rheumatology website at http://onlin elibr ary.wiley.com/doi/10.1002/art.41655/ abstract).
In the European RA population, the variant rs59967896, located on chromosome 20 within 6.7 kb 3′ of the prostate transmembrane protein androgen induced 1 (PMEPA1) locus, was significantly associated with time to an HZ event (hazard ratio [HR] 3.8, P = 8.3 × 10⁻¹⁰) and showed a marginal associa-tion (odds ratio [OR] 4.1, P = 2.3 × 10⁻⁷) in the HZ case versus control analysis. The variant rs59967896 had an alternative allele with a “CAA” insertion that, to our knowledge, had no reported functions (see Supplementary Figure 2A, available on the Arthri-tis & Rheumatology website at http://onlin elibr ary.wiley.com/doi/10.1002/art.41655/ abstract). The PMEPA1 locus showed no associations with the HZ end points in the European PsO popula-tion, nor were there any associations evident in the Hispanic and East Asian populations of either RA or PsO subjects.
In the European PsO population, 3 genetic loci at CD83 (rs112817503), UGDH (rs150665541), and VWF (rs200638456) were associated with faster time to HZ (Supplementary Figures 2B– D [http://onlin elibr ary.wiley.com/doi/10.1002/art.41655/ abstract]). SNP variant rs112817503 was associated with a faster time to onset of HZ (HR 5.7, P = 1.4 × 10⁻¹⁰) and increased risk of occur-rence of an HZ event (OR 7.7, P = 6.3 × 10⁻⁸). CD83 was the closest coding gene to rs112817503, which was 155 kb away. Variant rs150665541 was associated with a faster time to onset of HZ (HR 4.9, P = 2.1 × 10⁻⁸) and increased risk of occurrence of an HZ event (OR 5.5, P = 3.6 × 10⁻⁶); it was located in the sec-ond intron of UGDH. Variant rs200638456 was associated with a faster time to onset of HZ (HR 3.5, P = 2.9 × 10⁻⁸) and increased risk of occurrence of an HZ event (OR 4.0, P = 1.1 × 10⁻⁶). The rs200638456 variant was located within an intronic region of VWF, with a repeated sequence of the dinucleotide “AC.” The alternative allele of rs200638456 had an additional insertion of the dinucleotide “AC.”
In the Hispanic and East Asian ancestry subgroups of RA and PsO subjects, GWAS analysis did not reveal any significant results

GENETIC FACTORS ASSOCIATED WITH TOFACITINIB- RELATED HZ | 1159
Tab
le 1
. G
enet
ic lo
ci fo
und
to b
e as
soci
ated
with
incr
ease
d H
Z ris
k in
the
Eur
opea
n an
cest
ry G
WA
S*
Alle
leTi
me
to H
Z ev
ent†
Inci
denc
e of
HZ
(c
ase
vers
us c
ontr
ol)‡
Dis
ease
, et
hnic
ityLo
cus
Chr
Refe
renc
e SN
P ID
Posi
tion
Refe
renc
e
alle
leAl
tern
ativ
e
alle
leAl
tern
ativ
e
alle
le fr
eque
ncy
HR
(95%
CI)
PO
R (9
5% C
I)P
RAEu
rope
anPM
EPA1
20rs
5996
7896
5621
6698
TTC
AA
0.03
3.75
(2.4
6– 5.
71)
8.34
× 1
0−10
4.1
(2.5
1– 6.
69)
2.34
× 1
0−7
PsO Eu
rope
anCD
836
rs11
2817
503
1429
2820
CT
0.03
5.74
(3.3
8– 9.
77)
1.14
× 1
0−10
7.71
(4.0
2– 14
.8)
6.25
× 1
0−8
Euro
pean
UGD
H4
rs15
0665
541
3953
6523
C
T0.
034.
86 (2
.79–
8.45
)2.
10 ×
10−
85.
46 (2
.88–
10.3
)3.
57 ×
10−
6
Euro
pean
VWF
12rs
2006
3845
661
0282
6T
TAC
0.07
3.5
(2.2
5– 5.
46)
2.94
× 1
0−8
4.04
(2.4
2– 6.
75)
1.08
× 1
0−6
* G
WAS
= g
enom
e w
ide
asso
ciat
ion
stud
y; C
hr =
chr
omos
ome;
SN
P ID
= s
ingl
e nu
cleo
tide
poly
mor
phis
m c
lust
er id
entifi
catio
n; H
R =
haza
rd r
atio
; 95%
CI =
95%
con
fiden
ce in
terv
al; O
R =
odds
ratio
; RA
= rh
eum
atoi
d ar
thrit
is; P
sO =
pso
riasi
s.
† Re
sults
of t
he K
apla
n M
eier
ana
lyse
s of
tim
e to
her
pes
zost
er (H
Z) e
vent
are
pre
sent
ed in
Sup
plem
enta
ry F
igur
e 4
(ava
ilabl
e on
the
Arth
ritis
& Rh
eum
atol
ogy
web
site
at h
ttp:
//on
lin el
ibr a
ry.
wile
y.co
m/d
oi/1
0.10
02/a
rt.4
1655
/ abs
trac
t).
‡ C-
stat
istic
s fo
r th
e ca
se v
ersu
s co
ntro
l log
istic
reg
ress
ion
mod
el a
re p
rese
nted
in S
uppl
emen
tary
Tab
le 5
(ava
ilabl
e on
the
Arth
ritis
& Rh
eum
atol
ogy
web
site
at h
ttp:
//on
lin el
ibr a
ry.w
iley.
com
/doi
/10.
1002
/art
.416
55/ a
bstr
act).

BING ET AL 1160 |
Tab
le 2
. G
enet
ic lo
ci a
chie
ving
gen
ome-
wid
e si
gnifi
canc
e in
eith
er th
e tim
e to
HZ
even
t or
HZ
case
ver
sus
cont
rol t
rans
- anc
estr
y an
d tr
ans-
popu
latio
n G
WA
S m
eta-
anal
yses
*
Alle
leTi
me
to H
Z ev
ent
Inci
denc
e of
HZ
(c
ase
vers
us c
ontr
ol)
Locu
sG
enet
ic v
aria
ntCh
rPo
sitio
nRe
fere
nce
al
lele
Alte
rnat
ive
al
lele
Alle
le
freq
uenc
y†H
R (9
5% C
I)P
OR
(95%
CI)
PIL1
7RB
rs58
8616
113
5411
8714
TC
0.09
33.
6 (2
.40–
5.44
)7.
6 ×
10−10
3.8
(2.17
– 6.6
7)3.
0 ×
10−6
CD83
rs11
2817
503
614
2928
20T
C0.
022
3.6
(2.4
3– 5.
32)
1.5
× 10
−10
3.7
(2.3
5– 5.
87)
2.1
× 10
−8
GPR1
41rs
5611
4331
737
8027
31C
T0.
019
3.7
(2.3
7– 5.
73)
6.3
× 10
−93.
4 (2
.05–
5.49
)1.
5 ×
10−6
TOX3
rs79
0253
2716
5250
5167
GA
0.07
22.
9 (2
.04–
4.22
)6.
4 ×
10−9
3.8
(2.2
8– 6.
23)
2.2
× 10
−7
ACSF
3rs
1428
2000
516
8921
1411
TA
0.05
52.
3 (1
.72–
3.09
)2.
3 ×
10−8
2.5
(1.8
1– 3.
45)
2.7
× 10
−8
* Th
e th
resh
old
for
geno
me
wid
e si
gnifi
canc
e w
as d
efine
d as
P <
5 ×
10−8
. H
Z =
herp
es z
oste
r; G
WAS
= g
enom
e w
ide
asso
ciat
ion
stud
y; C
hr =
chr
omos
ome;
HR
= ha
zard
rat
io;
95%
CI =
95%
con
fiden
ce in
terv
al; O
R =
odds
ratio
. †
Alle
le fr
eque
ncy
was
cal
cula
ted
base
d on
wei
ghte
d al
lele
freq
uenc
y in
eac
h an
cest
ry g
roup
by
the
stan
dard
dev
iatio
n of
the
asso
ciat
ion
effec
ts.

GENETIC FACTORS ASSOCIATED WITH TOFACITINIB- RELATED HZ | 1161
(at the threshold of P < 5 × 10⁻⁸), likely because the sample sizes were modest. Other meta- analyses across ethnicity subgroups and populations could reveal additional loci, especially those with consistent effects across these subgroups.
Identification of 4 additional genetic loci associ-atedwithincreasedHZriskintrans-ancestryandtrans-population GWAS meta- analyses. A meta- analysis of the ancestry- and population- specific GWAS identified SNPs at 5 loci achieving genome- wide significance (combined meta- analysis P < 5 × 10⁻⁸) in the HZ case versus control analysis and/or in the time to HZ event analysis (Table 2 and Figure 2; see also Sup-plementary Figure 3, available on the Arthritis & Rheumatology website at http://onlin elibr ary.wiley.com/doi/10.1002/art.41655/ abstract). These 5 loci included IL17RB, CD83, GPR141, TOX3, and ACSF3/CDH15. The strength of the genetic association with time to an HZ event and incidence of an HZ event (case ver-sus control) for these loci and the ancestry/population- specific effects of the top variants in the loci are presented in Supplemen-tary Table 6 (available on the Arthritis & Rheumatology website at http://onlin elibr ary.wiley.com/doi/10.1002/art.41655/ abstract).
The association of CD83 was driven by the significant association observed in the European subgroup, as reported above. The frequency of the CD83 locus variant was lower in Hispanic subjects (~1%) than in European subjects (~2%), and was much rarer in East Asian subjects (~0.1%). The genetic effects in East Asian subjects could not be accurately esti-mated, due to the extremely low variant frequency. The trans- ethnic and trans- population meta- analysis did not improve the significance levels for the CD83 variant in the European PsO population. Top variant rs56114331 in the GPR141 locus had a low allele frequency (1.7– 2.1%) in Europeans, but was nevertheless higher than that in East Asian or Hispanic sub-jects (<1%). The significance of the GPR141 locus identified by meta- analysis was mainly driven by the significant associ-ation in the European population of PsO subjects, although the sample size of the European population was not large enough to show significance in the European ancestry GWAS. Top variant rs79025327 in the TOX3 locus had a higher allele frequency in East Asian subjects (7– 11%) compared with European or Hispanic subjects (~1– 2%). The significant asso-ciation of the TOX3 locus was mostly driven by the significant
Figure 2. Regional association plots assessing the association of time to herpes zoster event with 4 genetic loci, at CD83 (A), GPR141 (B), TOX3 (C), and ACSF3 (D), in subjects with rheumatoid arthritis or psoriasis.

BING ET AL 1162 |
associations observed in the East Asian population of RA sub-jects. The ACSF3/CDH15 locus variant had the highest allele frequency in Europeans (~5.6%), and the significant associ-ation was mostly driven by European subjects with RA. The validity of these results requires further investigation, as many of them are associated with low- frequency variants.
The robustness of the top associations was evaluated in several further analyses. We did not observe substantial devi-ations in allele frequencies for the top variants compared with those reported in the gnomAD database (Supplementary Table 7 [http://onlinelibrary.wiley.com/doi/10.1002/art.41655/abstract]). In addition, no significant trans- ethnic allelic heterogeneity effects were found after adjustment of the P values for multiple tests (see Supplementary Table 8, available on the Arthritis & Rheu-matology website at http://onlin elibr ary.wiley.com/doi/10.1002/art.41655/ abstract). However, when we restricted the meta- analysis to variants with an MAF of >2% in all ethnic groups (5,685,609 SNPs), only 2 loci retained genome- wide significance (CD83 and ACSF3), and 1 locus had suggestive genome- wide significance (TOX3) (see Supplementary Table 9 at http://onlin e libr ary.wiley.com/doi/10.1002/art.41655/ abstract), suggesting that the findings presented herein are sensitive to the allele frequency threshold.
Association of IL17RBwithashortertimetoHZ,sug-gesting a potential contributory role for Th2 shift. A SNP near IL17RB (rs58861611) was associated with faster time to HZ (meta- analysis HR 3.6, P = 7.6 × 10⁻¹⁰) at the genome- wide sig-nificance level, and was suggestively associated with HZ in the case versus control analysis (meta- analysis OR 3.8, P = 3.0 × 10⁻⁶) (Table 2). Results from the Kaplan- Meier analysis of time
to HZ event are presented in Supplementary Figures 4A– F, and C- statistics for the case versus control logistic regression model are presented in Supplementary Table 5 (http://onlin elibr ary.wiley.com/doi/10.1002/art.41655/ abstract).
As shown in the detailed regional plots for the genetic asso-ciation of the IL17RB locus and the ancestry/population- specific effects of this SNP on HZ end points (Figure 3 and Supplementary Table 6 [http://onlin elibr ary.wiley.com/doi/10.1002/art.41655/ abstract]), the association of IL17RB was driven by a risk allele common in East Asian subjects (~8– 17%) but rare in European subjects (<0.2%). Within the ancestry- and population- specific analyses, the most significant association with the HZ end points was seen in the East Asian subgroup of subjects with RA (HR 3.4, P = 3.2 × 10⁻⁷; OR 5.06, P = 2.4 × 10⁻⁶) (Supplementary Table 6).
Observation of altered T helper cells in rs58861611 carriers in healthy Japanese individuals. To elucidate the potential role of rs58861611 (IL17RB locus variant) in regulating immune phenotypes, flow cytometry was performed on freshly isolated PBMCs from 82 healthy Japanese individuals. Subjects were genotyped in parallel for the IL17RB rs58861611 SNP. Two subjects with the “CC” genotype were observed among these 82 healthy Japanese individuals, which is concurrent with the ~12% frequency of the “C” allele of rs58861611 in the overall Japanese population. As such, with the sample size being 82 subjects, the study had limited power to detect the variant impact on immune phenotypes.
The HZ risk allele of rs58861611 was significantly associated with lowered proportions of Th17 cells (P = 0.045) and Treg cells (P = 0.025) (Figures 4C and D). Similarly, a trend toward lowered
Figure 3. Regional association plots assessing the association of IL17RB with time to herpes zoster (HZ) event (A) and incidence of HZ (case versus control) (B) in subjects with rheumatoid arthritis or psoriasis. Each point represents a single- nucleotide polymorphism (SNP) passing quality control in the trans- ancestry meta- analysis, plotted with its P value (on a −log10 scale) as a function of genomic position. The purple diamond indicates the lead SNP. Color coding of all other SNPs indicates linkage disequilibrium with the lead SNP (estimated using r2 values from East Asian populations in the 1000 Genomes Project database): red = r2 ≥ 0.8; gold = 0.6 ≤ r2 < 0.8; green = 0.4 ≤ r2 < 0.6; cyan = 0.2 ≤ r2 < 0.4; blue = r2 < 0.2; gray = r2 unknown.

GENETIC FACTORS ASSOCIATED WITH TOFACITINIB- RELATED HZ | 1163
proportions of Th1 cells was observed in rs58861611 variant car-riers, although this was not statistically significant (Figure 4A). The effects of rs58861611 on Th2 cell proportions were also not signif-icant (Figure 4B). These results suggest that rs58861611 may be associated with alterations in the proportions of T cell populations. However, due to the small sample size in this functional assess-ment, and the limited number of subjects with the IL17RB gene variant in the present study, this observation needs to be further evaluated in a larger cohort.
Lackofassociationofrs58861611with IL17RB gene expression in T helper cell–type specific eQTL analysisin a small cohort of healthy subjects. To further address the alterations in T cell proportions by the IL17RB variant, an eQTL analysis was performed to evaluate whether the rs58861611 vari-ant impacts the gene expression of IL17RB or a nearby antisense sequence (AC012467.2) in T cell subpopulations. Th0, Th1, Th2, Th17, and Treg cells were induced from naive T cells from 29 healthy Japanese individuals. In this small cohort, there was only 1 “CC”- homozygous subject, as expected. Low expression levels of IL17RB were observed in naive T cells, and its overall expression remained low in Th0, Th1, and Th17 cells, while the expression of IL17RB was increased in Th2 and Treg cells (see Supplemen-tary Figures 5A– E, available on the Arthritis & Rheumatology web-site at http://onlin elibr ary.wiley.com/doi/10.1002/art.41655/ abstract), which has also been shown in other studies (32). Results of eQTL analysis did not reveal a significant association between the rs58861611 genotypes and IL17RB gene expression or the expression of AC012467.2, a potential antisense sequence, in any of the induced T cell subtypes. This result could be attributed to the low power of the analysis, since the sample size was small, or it is possible that rs58861611 may affect IL17RB expression in an untested cell type or through a mechanism unrelated to the mes-senger RNA expression of the IL17RB gene.
DISCUSSION
In this analysis, we sought to identify genetic factors contrib-uting to the occurrence of HZ related to tofacitinib treatment. The GWAS identified numerous loci associated with an increased risk of VZV reactivation (i.e., faster time to HZ onset), including 5 loci iden-tified in a meta- analysis of the total pool, and loci identified in both ancestry- and population- specific settings. These data indicate that 1 gene, IL17RB, may account for some of the HZ cases seen among East Asian subjects receiving tofacitinib (C- statistic in the East Asian RA population = 0.78); however, no single gene accounts for all or the majority of cases of HZ in subjects receiving tofacitinib. Rather, the incidence of HZ in these populations is likely a result of interactions between many factors, including genetics and environmental factors.
In the ancestry- and population- specific analyses, 4 genetic loci associated with faster development of HZ were identified in the European ancestry subgroup (1 in RA subjects, 3 in PsO subjects). CD83 represents a possible gene contributing to HZ risk, as a nearby variant, rs112817503, was significantly asso-ciated with HZ risk. CD83 is a marker of dendritic cell (DC) mat-uration; VZV infects mature monocyte- derived DCs and impairs their functions by down- regulating cell- surface immune mole-cules, including CD83, CD80, and CD86 (33). Similarly, human cytomegalovirus (HCMV), a member of the herpesvirus family, can infect monocyte- derived DCs. HCMV impairs the ability of the DCs to present antigens to T cells and thereby impairs the subse-quent proliferation of T cells through multiple mechanisms, some of which involve release of soluble CD83 from DC membranes (34). Tofacitinib lowers CD80 and CD86 expression in DCs in vitro (35), suggesting that JAK inhibition could interact with a variant near CD83 to decrease presentation of virus in infected cells. The precise molecular mechanisms for these tofacitinib- related effects are not known, but may be due to inhibition of IFNα. The CD83 association was driven by the data from the European subgroup, and remained significant in the trans- ethnic GWAS meta- analysis.
Figure 4. Correlation between genotype and cell fraction in peripheral blood CD4+ T cells from 82 healthy Japanese individuals. The test for significance of the data from the regression analyses of correlations between proportions of Th1 (A), Th2 (B), Th17 (C), and Treg cells (D) and genotype was performed using t- statistics. The horizontal axis indicates the rs58861611 genotype groups. Data are shown as box plots, where each box represents the 25th to 75th percentiles, lines inside the boxes represent the median, the X indicates the mean, and lines outside the boxes represent the 10th and 90th percentiles. Circles indicate outliers.

BING ET AL 1164 |
The PMEPA1 locus was associated with faster HZ develop-ment in European subjects with RA. The variant near PMEPA1 (i.e., TMEPA1) may also influence viral presentation, as HCMV reduces CD83 expression via TGFβ1 signaling (36), which is inhib-ited by PMEPA1 (37).
The VWF locus was associated with faster HZ development in European subjects with PsO. The VWF gene encodes the pro-tein von Willebrand factor (vWF), which functions as both an anti-hemophilic factor carrier and a platelet- vessel wall mediator in the blood coagulation system. The levels of vWF rise in multiple types of infections (38,39). In a candidate gene study, VWF genetic variants were associated with human herpes simplex encepha-litis, a rare complication following infection with herpes simplex virus type 1, which usually remains latent in neurons (40). Thus, the VWF gene may have roles in multiple infections; however, the mechanisms of vWF in HZ have not been directly studied. The VWF locus variant (rs200638456) is in moderate linkage disequi-librium (r2 = 0.64 in the European population) with an eQTL variant of CD9 (rs12099542) (41); thus, CD9 could also be a candidate causal gene for this association.
Within ancestry- specific GWAS, no significant associa-tions in the Hispanic and East Asian subgroups were identified, likely because the numbers of subjects in these ethnicity groups were small, and therefore this study had low power to detect differences.
It was hypothesized that combining ethnicity subgroups via meta- analysis would increase the power to detect genetic fac-tors for HZ risk; indeed, 4 additional loci were identified from the trans- ancestry and trans- population meta- analysis, including a variant near the IL17RB gene prevalent in East Asian populations.
IL17RB encodes a cytokine receptor that specifically binds to IL- 25 (IL- 17E) and IL- 17B, in which IL- 17B is thought to be an antagonist of IL- 25 binding (32). IL- 25 induces Th2- type cytokine production in IL17RB- positive cells (32), and in a case report, genetic amplification of IL- 25 led to an overactive Th2 response with a phenotype of recurrent varicella (42). In this analysis, the IL17RB locus variant was also associated with lowered propor-tions of Th17/Treg cells in healthy Japanese individuals. Some-what surprisingly, the IL17RB locus variant was not significantly associated with increased expression of IL17RB and did not show a significant effect on Th2 cell proportions, as might have been predicted from its known biologic effects. This may have been due to the small sample size and low power, or because we tested these effects in immune cells from healthy subjects and not under conditions of disease or tofacitinib exposure. These data suggest a potential mechanism by which the IL17RB variant contributes to HZ risk in Japanese individuals, as the imbalance of T cell sub-types may lead to a reduced threshold for VZV reactivation.
In addition, IL17RB is an expression marker that can be used to define invariant natural killer T (iNKT) cell heterogeneity (43). Studies have shown that iNKT cells produce Th1, Th2, or Th17
cytokines when challenged (43). The role of IL17RB and the JAK- dependent cytokine IL- 15 in the development and ratio of iNKT cells has been characterized in mice: CD4+IL17RB+ iNKT cells produce large amounts of Th2 and moderate amounts of Th17 cytokines, whereas CD4+IL17RB− iNKT cells produce the anti- viral Th1 cytokine IFNγ (43). CD4+IL17RB− iNKT cells express the IL- 15 receptor CD122, and require the presence of the JAK- dependent cytokine IL- 15 for development (43). In mice hypomorphic for IL- 15 signaling, levels of Th1- producing iNKT cells decrease, while levels of Th2- producing iNKT cells increase (43). Deficient iNKT cells are characterized by low production of IFNγ; however, the functions of normal T cells and NK cells have been linked to disseminated HZ in response to vaccination in 2 case reports, despite an other-wise intact immune system (44,45). These IL- 25 and iNKT studies and the association near the IL17RB gene suggest that the ratio of iNKT cell subsets at baseline may be important for HZ risk when combined with inhibition of IL- 15 signaling by tofacitinib.
Based on the significant loci identified in this analysis, we observed that genetic risks related to HZ are population- and ethnicity- dependent. The CD83 variant was prevalent in European subjects; overall, its association with HZ was driven by the genetic effects observed in European subjects in the PsO population. The IL17RB variant was most prevalent in East Asian subjects; overall, its association with HZ was driven by the genetic effects observed in East Asian subjects in the RA population. This implies that genetic risk variants from different ethnicities may interact with disease conditions and tofacitinib exposure, jointly contributing to VZV reactivation. The IL17RB locus variant had an allele frequency of 8– 17% in East Asian subjects, which was higher than the allele frequencies of all of the other HZ- associated variants (<7% across populations) in this analysis. The common alleles from the IL17RB variant compared with other low- frequency variants in other ethnic-ities may explain the higher HZ rate observed in tofacitinib- treated East Asian individuals. Notably, the IL17RB variant did not show association with HZ in Asian subjects with PsO. This may have been because sample sizes were small or there were differences in HZ- modifying risk factors between the PsO and RA popula-tions. The functional mechanisms of the associations between the GPR141, TOX3, and ACSF3/CDH15 loci and HZ events also war-rant further investigation.
This genetic and functional study is fundamentally limited by the relatively small sample sizes of the Hispanic and East Asian populations, as well as the assessment of multiple different sub-groups (i.e., ethnicity and disease). Furthermore, we showed that the trans- ancestry association findings are sensitive to the MAF threshold used. When we restricted the meta- analysis to vari-ants with an MAF of >2% in all ethnic groups, only 2 loci retained genome- wide significance (CD83 and ACSF3), and 1 locus had suggestive genome- wide significance (TOX3). These results high-light the importance of validating the current findings in large- scale studies. An additional limitation is that data on prior HZ vaccination,

GENETIC FACTORS ASSOCIATED WITH TOFACITINIB- RELATED HZ | 1165
which might have lowered the risk of VZV reactivation, were not collected in this study.
Overall, this analysis identified multiple genetic factors asso-ciated with HZ risk in tofacitinib- treated subjects with RA or PsO. The findings provide novel insights into the molecular mechanisms contributing to VZV reactivation during tofacitinib treatment, which can be further validated in additional JAK inhibitor clinical stud-ies or by genetic analysis of larger cohorts of East Asian subjects characterized by VZV response.
AUTHOR CONTRIBUTIONS
All authors were involved in drafting the article or revising it critically for important intellectual content, and all authors approved the final version to be published. Dr. Bing had full access to all of the data in the study and takes responsibility for the integrity of the data and the accuracy of the data analysis.Study conception and design. Bing, Hirose, Kochi, Fujio, Valdez, Vincent, Clark.Acquisition of data. Bing, Zhou, Tsuchida, Sumitomo, Zhang, Valdez.Analysis and interpretation of data. Bing, Zhou, Chen, Hirose, Kochi, Tsuchida, Ishigaki, Zhang, Valdez, Martin, Clark.
ROLEOFTHESTUDYSPONSORThis study was sponsored by Pfizer Inc. Pfizer Inc. was involved in the
study design, data collection, and data analysis. The studies of the CD4+ T cell subsets were supported by funding from Pfizer Inc. and Takeda Pharmaceutical Co., Ltd., and a grant from RIKEN. Medical writing support, under the guidance of the authors, was provided by Christina Viegelmann, PhD, and Sarah Piggott, MChem (CMC Connect, McCann Health Medical Communications) and was funded by Pfizer Inc. New York, in accordance with Good Publication Practice (GPP3) guidelines (Ann Intern Med 2015;163:461–4). All authors, including those employed by the sponsor, were involved in data interpretation, revised the manuscript critically for intellectual content, and made the decision to submit the manuscript for publication. Publication of this article was not contingent upon approval by Pfizer Inc.
REFERENCES 1. Hodge JA, Kawabata TT, Krishnaswami S, Clark JD, Telliez JB,
Dowty ME, et al. The mechanism of action of tofacitinib: an oralJanus kinase inhibitor for the treatment of rheumatoid arthritis. ClinExp Rheumatol 2016;34:318– 28.
2. Burmester GR, Blanco R, Charles- Schoeman C, Wollenhaupt J,Zerbini C, Benda B, et al. Tofacitinib (CP- 690,550) in combinationwith methotrexate in patients with active rheumatoid arthritis withan inadequate response to tumour necrosis factor inhibitors: a ran-domised phase 3 trial. Lancet 2013;381:451– 60.
3. Fleischmann R, Kremer J, Cush J, Schulze- Koops H, Connell CA,Bradley JD, et al. Placebo- controlled trial of tofacitinib monotherapyin rheumatoid arthritis. N Engl J Med 2012;367:495– 507.
4. Kremer J, Li ZG, Hall S, Fleischmann R, Genovese M, Martin- Mola E, et al. Tofacitinib in combination with nonbiologic disease- modifyingantirheumatic drugs in patients with active rheumatoid arthritis: arandomized trial. Ann Intern Med 2013;159:253– 61.
5. Van der Heijde D, Tanaka Y, Fleischmann R, Keystone E, Kremer J,Zerbini C, et al. Tofacitinib (CP- 690,550) in patients with rheumatoidarthritis receiving methotrexate: twelve- month data from a twenty- four– month phase III randomized radiographic study. Arthritis Rheum2013;65:559– 70.
6. Van Vollenhoven RF, Fleischmann R, Cohen S, Lee EB, GarcíaMeijide JA, Wagner S, et al. Tofacitinib or adalimumab versus pla-cebo in rheumatoid arthritis. N Engl J Med 2012;367:508– 19.
7. Lee EB, Fleischmann R, Hall S, Wilkinson B, Bradley J, Gruben D,et al. Tofacitinib versus methotrexate in rheumatoid arthritis. N Engl J Med 2014;370:2377– 86.
8. Bachelez H, van de Kerkhof PC, Strohal R, Kubanov A, Valenzuela F, Lee JH, et al. Tofacitinib versus etanercept or placebo in moderate- to- severe chronic plaque psoriasis: a phase 3 randomised non- inferiority trial. Lancet 2015;386:552– 61.
9. Papp KA, Menter MA, Abe M, Elewski B, Feldman SR, Gottlieb AB, et al. Tofacitinib, an oral Janus kinase inhibitor, for the treatment ofchronic plaque psoriasis: results from two, randomized, placebo- controlled, phase III trials. Br J Dermatol 2015;173:949– 61.
10. Bissonnette R, Iversen L, Sofen H, Griffiths CE, Foley P, Romiti R,et al. Tofacitinib withdrawal and retreatment in moderate- to- severechronic plaque psoriasis: a randomized controlled trial. Br J Dermatol 2015;172:1395– 406.
11. Papp KA, Krueger JG, Feldman SR, Langley RG, Thaci D, Torii H,et al. Tofacitinib, an oral Janus kinase inhibitor, for the treatment ofchronic plaque psoriasis: long- term efficacy and safety results from 2 randomized phase- III studies and 1 open- label long- term extensionstudy. J Am Acad Dermatol 2016;74:841– 50.
12. Cohen S, Radominski SC, Gomez- Reino JJ, Wang L, KrishnaswamiS, Wood SP, et al. Analysis of infections and all- cause mor-tality in phase II, phase III, and long- term extension studies of tofacitinib in patients with rheumatoid arthritis. Arthritis Rheumatol2014;66:2924– 37.
13. Cohen SB, Tanaka Y, Mariette X, Curtis JR, Lee EB, Nash P, et al.Long- term safety of tofacitinib for the treatment of rheumatoid arthri-tis up to 8.5 years: integrated analysis of data from the global clinicaltrials. Ann Rheum Dis 2017;76:1253– 62.
14. Curtis JR, Xie F, Yun H, Bernatsky S, Winthrop KL. Real- worldcomparative risks of herpes virus infections in tofacitinib andbiologic- treated patients with rheumatoid arthritis. Ann Rheum Dis2016;75:1843– 7.
15. Strober BE, Gottlieb AB, van de Kerkhof PCM, Puig L, BachelezH, Chouela E, et al. Benefit- risk profile of tofacitinib in patientswith moderate- to- severe chronic plaque psoriasis: pooled analysisacross six clinical trials. Br J Dermatol 2019;180:67– 75.
16. Smitten AL, Choi HK, Hochberg MC, Suissa S, Simon TA, Testa MA, et al. The risk of herpes zoster in patients with rheumatoid arthritis in the United States and the United Kingdom. Arthritis Rheum 2007;57:1431– 8.
17. Winthrop KL, Yamanaka H, Valdez H, Mortensen E, Chew R,Krishnaswami S, et al. Herpes zoster and tofacitinib therapy inpatients with rheumatoid arthritis. Arthritis Rheumatol 2014;66:2675– 84.
18. Winthrop KL. The emerging safety profile of JAK inhibitors in rheu-matic disease. Nat Rev Rheumatol 2017;13:320.
19. Winthrop KL, Curtis JR, Lindsey S, Tanaka Y, Yamaoka K, ValdezH, et al. Herpes zoster and tofacitinib: clinical outcomes and therisk of concomitant therapy. Arthritis Rheumatol 2017;69:1960– 8.
20. Winthrop KL, Lebwohl M, Cohen AD, Weinberg JM, Tyring SK,Rottinghaus ST, et al. Herpes zoster in psoriasis patients treated with tofacitinib. J Am Acad Dermatol 2017;77:302– 9.
21. Winthrop KL, Melmed GY, Vermeire S, Long MD, Chan G, PedersenRD, et al. Herpes zoster infection in patients with ulcerative colitisreceiving tofacitinib. Inflamm Bowel Dis 2018;24:2258– 65.
22. Mease P, Hall S, FitzGerald O, van der Heijde D, Merola JF, Avila- Zapata F, et al. Tofacitinib or adalimumab versus placebo for psori-atic arthritis. N Engl J Med 2017;377:1537– 50.
23. Gladman D, Rigby W, Azevedo VF, Behrens F, Blanco R, Kaszuba A,et al. Tofacitinib for psoriatic arthritis in patients with an inadequateresponse to TNF inhibitors. N Engl J Med 2017; 377:1525– 36.
24. Crosslin DR, Carrell DS, Burt A, Kim DS, Underwood JG, Hanna DS, et al. Genetic variation in the HLA region is associated with suscep-tibility to herpes zoster. Genes Immun 2015;16:1– 7.

BING ET AL 1166 |
25. Howie BN, Donnelly P, Marchini J. A flexible and accurate genotype imputation method for the next generation of genome- wide associa-tion studies. PLoS Genet 2009;5:e1000529.
26. Prevoo ML, van ’t Hof MA, Kuper HH, van Leeuwen MA, van de Putte LB, van Riel PL. Modified disease activity scores that include twenty- eight– joint counts: development and validation in a prospec-tive longitudinal study of patients with rheumatoid arthritis. Arthritis Rheum 1995;38:44– 8.
27. Fredriksson T, Pettersson U. Severe psoriasis— oral therapy with a new retinoid. Dermatologica 1978;157:238– 44.
28. Kim D, Langmead B, Salzberg SL. HISAT: a fast spliced aligner with low memory requirements. Nat Methods 2015;12:357– 60.
29. Anders S, Pyl PT, Huber W. HTSeq: a Python framework to work with high- throughput sequencing data. Bioinformatics 2015;31:166– 9.
30. Stegle O, Parts L, Durbin R, Winn J. A Bayesian framework to account for complex non- genetic factors in gene expression levels greatly increases power in eQTL studies. PLoS Comput Biol 2010;6:e1000770.
31. Parts L, Stegle O, Winn J, Durbin R. Joint genetic analysis of gene expression data with inferred cellular phenotypes. PLoS Genet 2011;7:e1001276.
32. Reynolds JM, Lee YH, Shi Y, Wang X, Angkasekwinai P, Nallaparaju KC, et al. Interleukin- 17B antagonizes interleukin- 25- mediated mucosal inflammation. Immunity 2015;42:692– 703.
33. Morrow G, Slobedman B, Cunningham AL, Abendroth A. Varicella- zoster virus productively infects mature dendritic cells and alters their immune function. J Virol 2003;77:4950– 9.
34. Gredmark- Russ S, Söderberg- Nauclér C. Dendritic cell biology in human cytomegalovirus infection and the clinical consequences for host immunity and pathology [review]. Virulence 2012;3:621– 34.
35. Kubo S, Yamaoka K, Kondo M, Yamagata K, Zhao J, Iwata S, et al. The JAK inhibitor, tofacitinib, reduces the T cell stimulatory capac-ity of human monocyte- derived dendritic cells. Ann Rheum Dis 2014;73:2192– 8.
36. Arrode G, Boccaccio C, Abastado JP, Davrinche C. Cross- presentation of human cytomegalovirus pp65 (UL83) to CD8+ T cells is regulated by virus- induced, soluble- mediator- dependent matura-tion of dendritic cells. J Virol 2002;76:142– 50.
37. Itoh S, Itoh F. TMEPAI family: involvement in regulation of multiple signalling pathways. J Biochem 2018;164:195– 204.
38. McElroy AK, Erickson BR, Flietstra TD, Rollin PE, Towner JS, Nichol ST, et al. Von Willebrand factor is elevated in individuals infected with Sudan virus and is associated with adverse clinical outcomes. Viral Immunol 2015;28:71– 3.
39. O’Regan N, Gegenbauer K, O’Sullivan JM, Maleki S, Brophy TM, Dalton N, et al. A novel role for von Willebrand factor in the pathogen-esis of experimental cerebral malaria. Blood 2016;127:1192– 201.
40. Abdelmagid N, Bereczky- Veress B, Atanur S, Musilová A, Zidek V, Saba L, et al. Von Willebrand factor gene variants associate with herpes simplex encephalitis. PLoS One 2016;11:e0155832.
41. Westra HJ, Peters MJ, Esko T, Yaghootkar H, Schurmann C, Kettunen J, et al. Systematic identification of trans eQTLs as putative drivers of known disease associations. Nat Genet 2013;45:1238– 43.
42. Green MR, Camilleri E, Gandhi MK, Peake J, Griffiths LR. A novel immunodeficiency disorder characterized by genetic amplification of interleukin 25. Genes Immun 2011;12:663– 6.
43. Watarai H, Sekine- Kondo E, Shigeura T, Motomura Y, Yasuda T, Satoh R, et al. Development and function of invariant natural killer T cells pro-ducing T(h)2- and T(h)17- cytokines. PLoS Biol 2012;10:e1001255.
44. Levy O, Orange JS, Hibberd P, Steinberg S, LaRussa P, Weinberg A, et al. Disseminated varicella infection due to the vaccine strain of varicella- zoster virus, in a patient with a novel deficiency in natural killer T cells. J Infect Dis 2003;188:948– 53.
45. Banovic T, Yanilla M, Simmons R, Robertson I, Schroder WA, Raffelt NC, et al. Disseminated varicella infection caused by varicella vac-cine strain in a child with low invariant natural killer T cells and dimin-ished CD1d expression. J Infect Dis 2011;204:1893– 901.

1167
Arthritis & RheumatologyVol. 73, No. 7, July 2021, pp 1167–1177DOI 10.1002/art.41674© 2021, American College of Rheumatology
Long-TermSafetyandEfficacyofSubcutaneousTanezumabVersusNonsteroidalAntiinflammatoryDrugsforHiporKneeOsteoarthritis:ARandomizedTrialMarc C. Hochberg,1 John A. Carrino,2 Thomas J. Schnitzer,3 Ali Guermazi,4 David A. Walsh,5 Alexander White,6 Satoru Nakajo,7 Robert J. Fountaine,8 Anne Hickman,8 Glenn Pixton,9 Lars Viktrup,10 Mark T. Brown,8 Christine R. West,8 and Kenneth M. Verburg8
Objective. To assess the long- term safety and 16- week efficacy of subcutaneous tanezumab in patients with hip or knee osteoarthritis (OA).
Methods. This was a phase III randomized, double-blind, active treatment–controlled (using nonsteroidal antiinflamma-tory drugs [NSAIDs] as the active treatment control) safety trial of tanezumab (56- week treatment/24- week posttreatment follow- up) in adults who were receiving stable-dose NSAID therapy at the time of screening and who had Western Ontario and McMaster Universities Osteoarthritis Index (WOMAC) pain and physical function scores of ≥5; patient global assessment (PtGA) of OA of fair, poor, or very poor; history of inadequate pain relief with standard analgesics; and no history or radiographic evidence of prespecified bone/joint conditions beyond OA. Patients received oral naproxen, celecoxib, or diclofenac twice daily (NSAID group; n = 996) or tanezumab 2.5 mg (n = 1,002) or 5 mg (n = 998) subcutaneously every 8 weeks. Coprimary efficacy end points at week 16 were changes in WOMAC pain and physical function scores and changes in PtGA. The primary joint safety end point over 80 weeks comprised adjudicated rapidly progressive OA type 1 or 2, primary osteonecrosis, subchondral insufficiency fracture, or pathologic fracture. Mean values, least squares mean values, and least squares mean differences between groups (with 95% confidence intervals [95% CIs]) were calculated.
Results. Of 3,021 randomized patients, 2,996 received ≥1 treatment dose. Adverse events (AEs) were similar between patients treated with tanezumab 2.5 mg and those treated with NSAIDs, and were more prevalent in those treated with tanezumab 5 mg. Composite joint safety events were significantly more prevalent with tanezumab 2.5 mg and tanezumab 5 mg than with NSAIDs (observation time– adjusted rate/1,000 patient- years 38.3 [95% CI 28.0, 52.5] and 71.5 [95% CI 56.7, 90.2], respectively, versus 14.8 [95% CI 8.9, 24.6]; P = 0.001 for tanezumab 2.5 mg versus NSAIDs; P < 0.001 for tanezumab 5 mg versus NSAIDs). Tanezumab 5 mg significantly improved pain and physical function but did not improve PtGA at week 16 when compared to NSAIDs; corresponding differences between the tanezumab 2.5 mg and NSAID groups were not statistically significant.
Conclusion. In patients previously receiving a stable dose of NSAIDs, tanezumab administered subcutaneously resulted in more joint safety events than continued NSAIDs, with differences being dose dependent. Pain and physical function improved with both doses of tanezumab compared to NSAIDs, reaching statistical significance with tanezumab 5 mg at 16 weeks.
ClinicalTrials.gov identifier: NCT02528188.Supported by Pfizer and Eli Lilly.1Marc C. Hochberg, MD, MPH: University of Maryland School of Medicine,
Baltimore; 2John A. Carrino, MD, MPH: Hospital for Special Surgery, New York, New York; 3Thomas J. Schnitzer, MD, PhD: Northwestern University Feinberg School of Medicine, Chicago, Illinois; 4Ali Guermazi, MD, PhD: Boston University School of Medicine, Boston, Massachusetts; 5David A. Walsh, MBBS, PhD: Arthritis Research UK Pain Centre, NIHR Nottingham Biomedical Research Centre, and University of Nottingham, Nottingham, UK; 6Alexander White, MD: Progressive Medical Research, Port Orange, Florida; 7Satoru Nakajo, MD: Nakajo Orthopaedic Clinic, Miyagi, Japan; 8Robert J. Fountaine, PharmD, Anne Hickman, DVM, PhD, Mark T. Brown, MD, Christine R. West, PhD, Kenneth M. Verburg, PhD: Pfizer Inc., Groton, Connecticut; 9Glenn Pixton, MS: Pfizer, Inc., Morrisville, North Carolina; 10Lars Viktrup, MD, PhD: Eli Lilly, Indianapolis, Indiana.
Dr. Hochberg has received consulting fees from Bone Therapeutics, Bristol Myers Squibb, Eli Lilly, EMD Serono, Novartis, Pfizer, Regenosine, Samumed LLC, Theralogix LLC, Kolon TissueGene Inc., TLC Biopharmaceuticals, and Zynerba; is a member of the Data Safety Monitoring Committee for clinical trials conducted by Covance, Galápagos, ICON plc, IQVIA, and SunPharma (less than $10,000 each); has received royalties from Elsevier (Editor, Rheumatology 7th edition and Editor-in-Chief, Seminars in Arthritis and Rheumatism) and UpToDate; and owns stock or stock options in BriOri Biotech and Theralogix. Dr. Carrino has received consulting fees from Covera Health, Image Analysis Group, Image Biopsy Lab, Pfizer, and Simplify Medical (less than $10,000 each). Dr. Schnitzer has received grants, personal fees, and nonfinancial support from AbbVie, Kolon TissueGene, Pfizer, and Regeneron; personal fees from Astellas, Calibr, Sanofi, and Vertex; grants and personal fees from Flexion; personal fees and non-financial support from Aptinyx and GlaxoSmithKline; and grants from Galapagos and Grünenthal. Dr. Guermazi has received consulting fees

HOCHBERG ET AL 1168 |
INTRODUCTION
The neurotrophin nerve growth factor (NGF) is associated with pronociceptive functions involved in the pathogenesis of chronic pain (1,2). The role of NGF- dependent mechanisms in osteoarthritis (OA) pain is supported by evidence from clinical trials that demonstrated efficacy of NGF- blocking antibodies (3– 6).
Tanezumab is an NGF monoclonal antibody that is under investigation for the treatment of OA pain in patients who have not had an adequate response to nonsteroidal antiinflammatory drugs (NSAIDs) or who are unable to take NSAIDs. In early short- term OA clinical trials, tanezumab administered intravenously (5– 10 mg) typically showed greater efficacy than NSAIDs and opi-oid analgesics, and was generally well tolerated, although some patients experienced joint safety events and abnormal periph-eral sensations (7– 9). Concerns regarding joint damage in clini-cal studies and histomorphologic neurologic changes observed in preclinical models resulted in the placement of partial clinical holds on clinical studies of NGF inhibitors by the US Food and Drug Administration in 2010 and in 2012, respectively. However, subsequent analyses of the reported joint safety events (10) and additional nonclinical neurologic studies resulted in the lifting of the tanezumab partial clinical holds in 2012 and in 2015, respectively.
Although the previous development program for tanezumab established its short- term efficacy and safety versus placebo, less evidence is available to support longer- term safety and efficacy versus other analgesics. The aim of this large, active treatment (NSAID)–controlled study was to establish the long- term risk of joint safety events and the 16- week efficacy profile of subcutaneous (SC) tanezumab versus oral NSAIDs in patients with hip or knee OA and moderate- to- severe pain despite prior stable use of NSAIDs.
PATIENTS AND METHODS
Study design and oversight. This phase III, randomized, double- blind, double- dummy, active treatment–controlled, parallel- group study (ClinicalTrials.gov identifier: NCT02528188) was con-ducted at 446 sites in the US, Europe, Latin America, and the Asia- Pacific region from July 21, 2015 (first patient visit) to February 27, 2019 (last patient visit) (11). The protocol was approved by an institutional review board or independent ethics committee at each
participating center. The study was conducted in accordance with the Declaration of Helsinki and in accordance with the Principles of Good Clinical Practice. All patients provided written informed consent.
The study comprised 3 phases: screening of ≤37 days; 56- week, double- blind treatment; and 24- week safety follow- up. Patients who completed the double- blind treatment period at week 56 entered a 24- week safety follow- up period (Supplemen-tary Figure 1, available on the Arthritis & Rheumatology website at http://onlin elibr ary.wiley.com/doi/10.1002/art.41674/ abstract). The screening phase included a washout period (≥5 half- lives or 2 days, whichever was greater) for all prohibited pain medications and an initial pain assessment period (≥3 days within 1 week of ran-domization/baseline). Five musculoskeletal radiologists at the cen-tral study location received training on the protocol and reviewed the radiographs to assess eligibility and outcomes throughout the study (12– 14); interreader variability was monitored at prespeci-fied intervals for consistency and quality assurance (12).
Study population. Patients age ≥18 years, with a body mass index of ≤39 kg/m2, were eligible to enroll if they had a clinical diag-nosis of hip/knee OA in the index joint (the most painful joint) and if they fulfilled the American College of Rheumatology classification criteria (15,16), including radiographic confirmation (Kellgren/Law-rence [K/L] grade ≥2) (17). Patients were required to have received a stable dose of an oral NSAID for ≥30 days before screening, with documented history of inadequate pain relief with acetaminophen and inadequate pain relief with, contraindication to, or intolerance of opioid analgesics or tramadol, or unwillingness to take opioid anal-gesics (Supplementary Table 1, available on the Arthritis & Rheu-matology website at http://onlin elibr ary.wiley.com/doi/10.1002/art. 41674/ abstract). Other major inclusion criteria were Western Ontario and McMaster Universities Osteoarthritis Index (WOMAC) (18) pain and physical function subscale scores of ≥5 in the index joint (11- point numeric rating scale ranging from 0 to 10; 0 = no pain/difficulty, 10 = extreme pain/difficulty) and patient global assessment (PtGA) of OA rated as “fair,” “poor,” or “very poor” at baseline (5- point Likert scale ranging from “very good” to “very poor”). Patients provided their responses to these assessments while receiving stable doses of oral NSAIDs for ≥2 weeks during screening and before rand-omization (Supplementary Figure 1, http://onlin elibr ary.wiley.com/doi/10.1002/art.41674/ abstract).
from AstraZeneca, Galápagos, Merck Serono, Pfizer, Kolon TissueGene, and Roche, and owns stock or stock options in Boston Imaging Core Lab. Dr. Walsh has received consulting fees, speaking fees, and/or honoraria from Pfizer and GlaxoSmithKline (less than $10,000 each). Drs. Fountaine, Hickman, Brown, West, and Verburg and Mr. Pixton own stock or stock options in Pfizer. Dr. Viktrup owns stock or stock options in Eli Lilly. No other disclosures relevant to this article were reported.
Upon request, and subject to certain criteria, conditions and exceptions (see https://www.pfizer.com/scien ce/clini cal- trial s/trial - data- and- results for more information), Pfizer will provide access to individual deidentified participant data from Pfizer- sponsored global interventional clinical studies conducted for medicines, vaccines and medical devices 1) for indications that have been approved in the United States and/or Europe or 2) in programs
that have been terminated (i.e., development for all indications has been discontinued). Pfizer will also consider requests for the protocol, data dictionary, and statistical analysis plan. Data may be requested from Pfizer trials 24 months after study completion. The deidentified participant data will be made available to researchers whose proposals meet the research criteria and other conditions, and for which an exception does not apply, via a secure portal. To gain access, data requestors must enter into a data access agreement with Pfizer.
Address correspondence to Marc C. Hochberg, MD, MPH, University of Maryland School of Medicine, 10 South Pine Street, MSTF 8- 34, Baltimore, MD 21201. Email: [email protected].
Submitted for publication June 25, 2020; accepted in revised form January 28, 2021.

TANEZUMAB FOR OA OF THE HIP OR KNEE | 1169
Patients were excluded from the study if there was radio-graphic evidence, in any hip, knee, or shoulder joint, of prespecified bone or joint conditions (i.e., destructive arthropathy characteristic of rapidly progressive OA [RPOA], atrophic OA, subchondral insuf-ficiency fracture, primary osteonecrosis, or pathologic fracture) or other conditions (Supplementary Table 2, http://onlin elibr ary.wiley.com/doi/10.1002/art.41674/ abstract). Other major exclusion cri-teria are summarized in Supplementary Table 2. Excluded and prohibited medications are summarized in Supplementary Table 1, http://onlin elibr ary.wiley.com/doi/10.1002/art.41674/ abstract.
Intervention. After receiving treatment with stable open- label oral NSAIDs (naproxen 500 mg twice daily, celecoxib 100 mg twice daily, or diclofenac extended release 75 mg twice daily) for at least the last 2 weeks of the screening period, patients were ran-domized 1:1:1, using an interactive response technology system, to 1 of 3 parallel groups in a double- blind, double- dummy placebo design: oral NSAIDs twice daily (the same NSAID regimen used to stabilize the patient’s OA during screening) or tanezumab 2.5 mg SC or tanezumab 5 mg SC every 8 weeks. Patients randomized to receive tanezumab at either dose also received oral placebo NSAIDs twice daily (resembling the NSAID the patient received during screening) and patients randomized to receive NSAIDs received SC placebo (resembling tanezumab) every 8 weeks. Randomization was stratified by index joint (hip/knee), by the most severe K/L grade (2, 3, or 4) in any hip/knee, and by NSAID treat-ment at study entry.
Acetaminophen was allowed as rescue therapy in patients with inadequate pain relief, except for ≤24 hours before study vis-its for efficacy assessment. Acetaminophen doses were limited to ≤3,000 mg/day for up to 3 days/week to week 16 and as needed thereafter to week 64, followed by maximum dosage as needed (or as permitted by local or national labeling) after week 64. Aspirin doses of ≤325 mg/day were permitted for cardiovascular proph-ylaxis. Use of nonassigned NSAIDs was prohibited through week 64, but analgesics were permitted occasionally for self- limiting con-ditions unrelated to OA, except for ≤48 hours or 5 half- lives (which-ever was greater) before study visits for efficacy assessment.
At week 16, patients must have had a ≥30% reduction from baseline in the WOMAC pain subscale score and a ≥15% reduc-tion from baseline in this pain subscale score at week 2, 4, or 8 to continue in the double- blind treatment period. If these pre-specified response criteria were not satisfied, the treatment was discontinued and the patient was entered into the 24- week safety follow- up period. During the follow- up period, standard- of- care treatment was administered as needed for ≥16 weeks after the last dose of randomized SC treatment.
Assessments. Adverse events. General safety/tolerability assessments during the 56- week treatment and 24- week safety follow- up periods included treatment- emergent adverse events (AEs). AEs were coded based on the Medical Dictionary for
Regulatory Activities, version 21.1. Unblinded safety data were reviewed regularly throughout the study by an independent, external safety monitoring committee.
Joint safety. Musculoskeletal examinations and monitoring of relevant AEs and pain scores were conducted by the inves-tigators throughout the study to identify increased, severe, or new persistent joint pain. Radiographs of both hips, knees, and shoulders were obtained during the screening period and at weeks 24, 56, and 80 to monitor for the occurrence of joint safety events and were evaluated by trained central readers. Magnetic resonance imaging (MRI; 1.5T or 3.0T scanner) of each hip and knee was performed at screening in all patients; follow- up MRIs of each hip and knee were obtained at weeks 24, 56, and 80 in patients with a K/L grade of ≥3 in any hip/knee and at the discre-tion of the investigators or central readers throughout the study.
Joint safety events included RPOA type 1 or 2, subchondral insufficiency fracture, primary osteonecrosis, and pathologic frac-ture. RPOA type 1 (RPOA1) was defined as a significant decline in joint space width (JSW) of ≥2 mm (predicated on optimal joint positioning) within ~1 year, without gross structural failure (19). RPOA2 was defined as abnormal bone loss or destruction, includ-ing limited or total collapse of ≥1 subchondral surface, that is not normally present in conventional end- stage OA. A blinded adjudi-cation committee (external experts in musculoskeletal radiology, orthopedic surgery, bone and joint pathology, and rheumatology), reviewed all possible or probable joint safety events and provided the final decision regarding adjudication classification. Cases requiring adjudication were identified in 3 ways: 1) investigator- reported events, 2) possible/probable joint safety events identi-fied on radiographs and MRIs by the central reader, and 3) all total joint replacements (TJRs). The primary joint safety end point was a composite that included adjudicated RPOA1 or RPOA2, subchondral insufficiency fracture, primary osteonecrosis, and pathologic fracture.
Efficacy. The 3 coprimary efficacy end points were change from baseline to week 16 in WOMAC pain and physical func-tion subscale scores and PtGA. Patients completed question-naires during clinic visits. The proportion of patients achieving ≥50% reduction in WOMAC pain subscale score at week 16 was a key secondary end point. Though the study was not optimally designed for investigating long- term efficacy, week 56 changes in primary and key secondary efficacy end points were assessed.
Statistical analysis. Enrollment of ~1,000 patients in each treatment group was planned to yield a high probability of observ-ing events with very small event rates (e.g., 90% probability of observing ≥1 event in the primary composite joint safety end point was estimated in any single treatment group if the event rate was 0.25%). The primary safety and efficacy populations comprised all randomized patients who received ≥1 dose of SC study med-ication. SAS software, version 9.4 (SAS Institute) was used for all

HOCHBERG ET AL 1170 |
statistical analyses. P values (2- sided) less than 0.05 were consid-ered significant.
AEs were summarized descriptively by treatment group. The incidence and observation time– adjusted rates/1,000 patient- years of all adjudicated joint safety outcome measures (combined as the primary composite joint safety end point and individually) over 80 weeks of observation, as well as rates of TJRs, were calculated. Differences in the rate of each adjudi-cated joint safety end point between the NSAID and tanezumab groups were compared using a Poisson model, with 95% confi-dence intervals (95% CIs).
The coprimary efficacy end points were analyzed using anal-ysis of covariance, with model terms for the baseline score of the corresponding end point, baseline diary mean pain (based on numeric rating scale, and completed by the patient at approx-imately the same time each day), the index joint (knee or hip), highest K/L grade, assigned NSAID (naproxen, celecoxib, or diclofenac), and treatment group, with the study site as a ran-dom effect. Missing data at week 16 were handled using a mul-tiple imputation strategy based on the baseline observation if the response was missing due to discontinuation because of an AE or insufficient efficacy, and based on the last observation if the response was missing for other reasons.
The key secondary efficacy end point of ≥50% improvement in the WOMAC pain subscale score at week 16 was analyzed using logistic regression, with model terms for baseline WOMAC pain subscale score, baseline diary mean pain, index joint, K/L grade, assigned NSAID, and treatment group. Similar to the
primary efficacy end point, an imputation strategy was followed for missing data in the responder analyses dependent on the rea-son for discontinuation.
The graphical approach of gatekeeping strategy was used to test the coprimary efficacy end points and key secondary efficacy end points to control the family- wise, 2- sided Type I error rate of 5% (Supplementary Figure 2, http://onlin elibr ary.wiley.com/doi/10.1002/art.41674/ abstract). Tanezumab 5 mg was first tested versus NSAIDs for the 3 coprimary efficacy end points at week 16; between- group differences for all 3 end points had to be significant at α = 0.05 for the coprimary end point to be significant. Pending the outcome of this analysis, the coprimary end points for the tanezumab 2.5 mg group and key secondary end points for both tanezumab doses were sub-sequently tested in a prespecified hierarchy. Statistical testing for adjudicated joint safety outcomes was unadjusted. Differ-ences between tanezumab doses were not tested for signifi-cance. End points at week 56 were analyzed similarly to those at week 16.
RESULTS
Patients. Of 17,730 patients screened for the study, 3,021 were randomized and 2,996 comprised the safety and efficacy analysis population (Figure 1). Demographic and baseline characteristics were similar across treatment groups; the majority of patients had ≥2 joints with radiographic evidence of OA (Table 1). Of the patients who were not randomized,
Figure 1. Patient disposition. Among randomized patients, the incidence of protocol deviations related to eligibility criteria (i.e., nonqualifying diagnosis of osteoarthritis or nonqualifying Western Ontario and McMaster Universities Osteoarthritis Index pain and physical function subscale scores or patient global assessment) was low (~≤1% for each criterion) and similar across treatment groups. a Patients screened but not randomized for reasons unrelated to specific eligibility criteria. b Patients randomized in error and withdrawn prior to receiving treatment. c Disposition after either completing or discontinuing the treatment period. NSAID = nonsteroidal antiinflammatory drug.

TANEZUMAB FOR OA OF THE HIP OR KNEE | 1171
the most common reasons for exclusion were not meeting the inclusion criterion of diagnosis of OA in the index hip or knee (19.1%), a WOMAC pain score of <5 in the index joint at screening (14.9%), or unwillingness/inability to comply with lifestyle guidelines, scheduled visits, the treatment plan, labo-ratory testings, and other study procedures through the end of the study visit (13.0%) (Supplementary Table 2, available
on the Arthritis & Rheumatology website at http://onlin elibr ary.wiley.com/doi/10.1002/art.41674/ abstract).
Overall AEs. During the treatment period, 62.8%, 67.1%, and 60.3% of patients in the tanezumab 2.5 mg group, tane-zumab 5 mg group, and NSAID group experienced AEs (includ-ing joint safety AEs), respectively (Table 2). Serious AEs (SAEs)
Table 1. Demographic and baseline characteristics across treatment groups*
CharacteristicTanezumab 2.5 mg
(n = 1,002)Tanezumab 5 mg
(n = 998)NSAIDs
(n = 996)Female 637 (63.6) 654 (65.5) 662 (66.5)Age, years
Mean ± SD 60.3 ± 9.2 61.2 ± 9.6 60.3 ± 9.5Range 28– 90 31– 87 28– 88
RaceWhite 705 (70.4) 712 (71.3) 680 (68.3)Black 166 (16.6) 162 (16.2) 186 (18.7)Asian 110 (11.0) 95 (9.5) 99 (9.9)Other 21 (2.1) 29 (2.9) 31 (3.1)
Body mass index, kg/m2
Mean ± SD 30.7 ± 4.8 30.7 ± 4.9 31.0 ± 4.7Range 16– 39 17– 39 18– 39
Time since OA diagnosis in index joint, yearsMean 8.0 7.9 8.1Range 0– 52 0– 50 0– 44
Index jointHip 151 (15.1) 148 (14.8) 144 (14.5)Knee 851 (84.9) 850 (85.2) 852 (85.5)
K/L grade of index joint0 (no OA) 0 4 (0.4) 1 (0.1)1 2 (0.2) 2 (0.2) 3 (0.3)2 298 (29.7) 303 (30.4) 291 (29.2)3 475 (47.4) 474 (47.5) 476 (47.8)4 (severe OA) 227 (22.7) 215 (21.5) 225 (22.6)
Joints per patient with K/L grade ≥20 1 (0.1) 0 01 232 (23.2) 214 (21.4) 219 (22.0)2 538 (53.7) 556 (55.7) 560 (56.2)3 134 (13.4) 138 (13.8) 124 (12.4)4 97 (9.7) 90 (9.0) 93 (9.3)
WOMAC pain score at baseline†Mean ± SD 7.0 ± 1.1 7.0 ± 1.1 7.0 ± 1.1Range 4– 10 2– 10 3– 10
WOMAC physical function score at baseline†Mean ± SD 7.1 ± 1.1 7.1 ± 1.1 7.0 ± 1.1Range 2– 10 1– 10 2– 10
PtGA score at baseline‡Mean ± SD 3.5 ± 0.6 3.5 ± 0.6 3.4 ± 0.6Very good 1 (0.1) 0 1 (0.1)Good 5 (0.5) 7 (0.7) 3 (0.3)Fair 557 (55.7) 569 (57.2) 592 (59.6)Poor 381 (38.1) 369 (37.1) 355 (35.7)Very poor 56 (5.6) 50 (5.0) 43 (4.3)
* Except where otherwise indicated, values are the number (%). NSAIDs = nonsteroidal antiinflammatory drugs; OA = osteoarthritis; K/L = Kellgren/Lawrence. † Western Ontario and McMaster Universities Osteoarthritis Index (WOMAC) pain and physical function subscale scores were assessed on 11- point numeric rating scales ranging 0– 10 (higher scores = greater pain intensity and worse physical function, respectively). ‡ Patient global assessment (PtGA) scores were assessed on a 5-point Likert scale, ranging from “very good” to “very poor” (“very good” = asymptomatic and no limitation of normal activities, “good” = mild symptoms and no limitation of normal activities, “fair” = moderate symptoms and limitation of some normal activities,” “poor” = severe symptoms and inability to carry out most normal activities, and “very poor” = very severe symptoms which are intolerable and inability to carry out all normal activities).

HOCHBERG ET AL 1172 |
occurred more frequently in patients who were treated with tanezumab 5 mg (8.0%) than in those who were treated with tanezumab 2.5 mg (5.1%) or NSAIDs (4.6%) (Table 2 and Sup-plementary Table 3, http://onlin elibr ary.wiley.com/doi/10.1002/art.41674/ abstract). Neurologic AEs of special interest, including abnormal peripheral sensation (e.g., paresthesia, hypoesthesia, carpal tunnel syndrome, and burning sensation), were reported in ≤3.2% of patients in any treatment group, but neurologic AEs of special interest were more frequent in the tanezumab groups than in the NSAID group (Table 2). The incidence of study drug discon-tinuation due to AEs was greatest in the tanezumab 5 mg group (8.8%) and similar between the NSAID group and the tanezumab 2.5 mg group (5.2% and 5.3%, respectively).
A total of 8 deaths occurred during the study: 5 during the treatment period and 3 during the 24- week safety follow- up period. Two patients died after leaving the study (Table 2 and Sup-plementary Table 4, http://onlin elibr ary.wiley.com/doi/10.1002/art. 41674/ abstract).
Joint safety events. The majority of adjudicated events were identified by the central readers during evaluation of radi-ographs and MRI. Of the 336 patients who required adjudication for joint safety events over 80 weeks, the events were adjudicated
as normal progression of OA in 172 (51.2%), and the crite-ria for the primary composite joint safety outcome were fulfilled in 125 (37.2%) (Table 3). The observation time– adjusted rate of the primary composite joint safety end point was highest in the tanezumab 5 mg group (71.5 events/1,000 patient- years [95% CI 56.7, 90.2]), followed by the tanezumab 2.5 mg group (38.3 [95% CI 28.0, 52.5]) and NSAID group (14.8 [95% CI 8.9, 24.6]) (P < 0.001, tanezumab 5 mg versus NSAIDs; P = 0.001, tane-zumab 2.5 mg versus NSAIDs). Among the 125 patients who met the primary composite joint safety end point, the knee, hip, or shoulder was the affected joint in 96 patients (76.8%), 26 patients (20.8%), and 3 patients (2.4%), respectively, with the index joint involved in 52 patients (41.6%) and a nonindex joint involved in 73 patients (58.4%). Although a nonindex joint was the affected joint in the majority of primary composite joint safety events, the designation of an index joint did not mean that other joints meet-ing the primary composite joint safety end point were unaffected by OA (Supplementary Table 5, http://onlin elibr ary.wiley.com/doi/10.1002/art.41674/ abstract). Approximately 82%, 70%, and 80% of joints affected by a primary composite joint safety event in the tanezumab 2.5 mg, tanezumab 5 mg, and NSAID groups, respectively, had a K/L grade of ≥2 at baseline. Structural evi-dence of advanced OA (K/L grade 3 or 4) was present in ~49%,
Table 2. Summary of treatment- emergent adverse events in patients in the 3 groups*
Treatment period (first dose to week 56)
Up to end of study (first dose to week 80)
Tanezumab 2.5 mg
(n = 1,002)
Tanezumab 5 mg
(n = 998)NSAIDs
(n = 996)
Tanezumab 2.5 mg
(n = 1,002)
Tanezumab 5 mg
(n = 998)NSAIDs
(n = 996)Any AE 629 (62.8) 670 (67.1) 601 (60.3) 681 (68.0) 744 (74.5) 666 (66.9)Serious AE 51 (5.1) 80 (8.0) 46 (4.6) 78 (7.8) 110 (11.0) 66 (6.6)Treatment- related AE 165 (16.5) 208 (20.8) 158 (15.9) 190 (19.0) 250 (25.1) 179 (18.0)Death 2 (0.2) 3 (0.3) 0 4 (0.4) 4 (0.4) 0Discontinued study medication due to AE† 53 (5.3) 88 (8.8) 52 (5.2) 53 (5.3) 88 (8.8) 52 (5.2)Discontinued study due to AE 23 (2.3) 20 (2.0) 7 (0.7) 23 (2.3) 22 (2.2) 8 (0.8)Most common AEs‡
Arthralgia 133 (13.3) 165 (16.5) 117 (11.7) 174 (17.4) 215 (21.5) 155 (15.6)Fall 65 (6.5) 53 (5.3) 46 (4.6) 84 (8.4) 75 (7.5) 64 (6.4)OA 39 (3.9) 54 (5.4) 23 (2.3) 57 (5.7) 99 (9.9) 33 (3.3)Nasopharyngitis 57 (5.7) 67 (6.7) 40 (4.0) 67 (6.7) 75 (7.5) 56 (5.6)Upper respiratory tract infection 57 (5.7) 45 (4.5) 59 (5.9) 64 (6.4) 51 (5.1) 70 (7.0)Back pain 34 (3.4) 55 (5.5) 35 (3.5) 42 (4.2) 69 (6.9) 46 (4.6)Rapidly progressive OA 18 (1.8) 41 (4.1) 4 (0.4) 34 (3.4) 64 (6.4) 12 (1.2)Musculoskeletal pain 43 (4.3) 41 (4.1) 37 (3.7) 58 (5.8) 63 (6.3) 46 (4.6)Headache 56 (5.6) 45 (4.5) 25 (2.5) 58 (5.8) 51 (5.1) 31 (3.1)Joint swelling 43 (4.3) 48 (4.8) 10 (1.0) 45 (4.5) 53 (5.3) 15 (1.5)Pain in extremity 31 (3.1) 37 (3.7) 28 (2.8) 37 (3.7) 48 (4.8) 39 (3.9)Peripheral edema 19 (1.9) 43 (4.3) 17 (1.7) 21 (2.1) 45 (4.5) 19 (1.9)Bronchitis 22 (2.2) 28 (2.8) 13 (1.3) 24 (2.4) 34 (3.4) 17 (1.7)Paresthesia 18 (1.8) 30 (3.0) 13 (1.3) 18 (1.8) 32 (3.2) 14 (1.4)Influenza 20 (2.0) 21 (2.1) 26 (2.6) 23 (2.3) 22 (2.2) 31 (3.1)Carpal tunnel syndrome 16 (1.6) 27 (2.7) 6 (0.6) 16 (1.6) 31 (3.1) 7 (0.7)Hypoesthesia 27 (2.7) 28 (2.8) 18 (1.8) 30 (3.0) 29 (2.9) 19 (1.9)Cough 13 (1.3) 26 (2.6) 7 (0.7) 13 (1.3) 30 (3.0) 10 (1.0)
* Values are the number (%) of patients. NSAIDs = nonsteroidal antiinflammatory drugs; AE = adverse event; OA = osteoarthritis. † Discontinued study drug, but continued in the study. ‡ Reported in ≥3% of patients in any treatment group up to end of study.

TANEZUMAB FOR OA OF THE HIP OR KNEE | 1173
34%, and 47% of the affected joints in the tanezumab 2.5 mg, tanezumab 5 mg, and NSAID groups, respectively (Supplemen-tary Table 6, http://onlin elibr ary.wiley.com/doi/10.1002/art.41674/ abstract).
Overall, 88 (70.4%) of the 125 patients who met the primary composite joint safety end point had RPOA1, and 18 (14.4%) had RPOA2. Seventeen patients (13.6%) had a subchondral insuffi-ciency fracture, 2 patients (1.6%) had primary osteonecrosis, and no patients had a pathologic fracture. One patient in the NSAID group had 2 joints with different adjudicated joint safety events (i.e., RPOA1 and subchondral insufficiency fracture); the subchondral insufficiency fracture (as the more severe outcome) was included in the primary composite joint safety end point for this patient.
The observation time– adjusted rate of RPOA1 was significantly higher in patients treated with tanezumab 2.5 mg and tanezumab 5 mg versus those treated with NSAIDs (Table 3) (P = 0.005 and P < 0.001, respectively); the rate of RPOA2 was significantly higher only with tanezumab 5 mg versus NSAIDs (P = 0.001). The observation time– adjusted rate of RPOA1 and RPOA2 combined was significantly higher in patients treated with tanezumab 2.5 mg and those treated with tanezumab 5 mg versus NSAIDs (Table 3) (P = 0.003 and P < 0.001, respectively).
Of 2,996 patients, TJRs were performed in 159 (5.3%). Ob -servation time– adjusted rates of TJR surgeries were significantly higher in patients treated with tanezumab 2.5 mg (51.8/1,000 patient- years) and those treated with tanezumab 5 mg (79.7/1,000
Table 3. Summary of adjudicated joint safety events over 80 weeks of observation*
Joint safety outcomeTanezumab 2.5 mg
(n = 1,002)Tanezumab 5 mg
(n = 998)NSAID
(n = 996)Adjudicated for joint safety† 116 (11.6) 171 (17.1) 49 (4.9)
Primary composite joint safety end point [95% CI] 39 (3.9) [2.8, 5.3] 71 (7.1) [5.6, 8.9] 15 (1.5) [0.8, 2.5]Observation time, patient- years 1,017 993 1,011Observation time– adjusted rate/1,000 patient- years [95% CI] 38.3 [28.0, 52.5] 71.5 [56.7, 90.2] 14.8 [8.9, 24.6]
Rate difference vs. NSAIDs [95% CI] 23.5 [9.3, 37.7] 56.7 [38.4, 74.9] – P 0.001 <0.001 –
RPOA1 and RPOA2 combined [95% CI] 32 (3.2) [2.2, 4.5] 63 (6.3) [4.9, 8.0] 12 (1.2) [0.6, 2.1]Observation time, patient- years 1,018 995 1,012Observation time– adjusted rate/1,000 patient- years [95% CI] 31.4 [22.2, 44.4] 63.3 [49.5, 81.1] 11.9 [6.7, 20.9]
Rate difference vs. NSAIDs [95% CI] 19.6 [6.8, 32.4] 51.5 [34.5, 68.5] – P 0.003 <0.001 –
RPOA1 [95% CI]‡ 29 (2.9) [1.9, 4.1] 49 (4.9) [3.7, 6.4] 11 (1.1) [0.6, 2.0]Observation time, patient- years 1,020 998 1,012Observation time– adjusted rate/1,000 patient- years [95% CI] 28.4 [19.8, 40.9] 49.1 [37.1, 65.0] 10.9 [6.0, 19.6]
Rate difference vs. NSAIDs [95% CI] 17.6 [5.4, 29.8] 38.2 [23.1, 53.4] – P 0.005 <0.001 –
RPOA2 [95% CI]§ 3 (0.3) [0.1, 0.9] 14 (1.4) [0.8, 2.3] 1 (0.1) [0, 0.6]Observation time, patient- years 1,027 1,010 1,016Observation time– adjusted rate/1,000 patient- years [95% CI] 2.9 [0.9, 9.1] 13.9 [8.2, 23.4] 1.0 [0.1, 7.0]
Rate difference vs. NSAIDs [95% CI] 1.9 [– 1.9, 5.8] 12.9 [5.4, 20.4] – P 0.32 <0.001 –
Subchondral insufficiency fracture [95% CI] 6 (0.6) [0.2, 1.3] 7 (0.7) [0.3, 1.4] 4 (0.4) [0.1, 1.0]Observation time, patient- years 1,027 1,012 1,014Observation time– adjusted rate/1,000 patient- years [95% CI] 5.8 [2.6, 13.0] 6.9 [3.3, 14.5] 3.9 [1.5, 10.5]
Rate difference vs. NSAIDs [95% CI] 1.9 [– 4.2, 8.0] 3.0 [– 3.4, 9.4] – P 0.54 0.36 –
Primary osteonecrosis [95% CI] 1 (0.1) [0, 0.6] 1 (0.1) [0, 0.6] 0 (0) [0, 0.4]Observation time, patient- years 1,028 1,013 1,016Observation time– adjusted rate/1,000 patient- years [95% CI] 1.0 [0.1, 6.9] 1.0 [0.1, 7.0] 0
Rate difference vs. NSAIDs [95% CI] 1.0 1.0 – P NE NE –
Adjudicated as normal progression of OA 66 (6.6) 79 (7.9) 27 (2.7)Not enough information¶ 2 (0.2) 0 0Other joint outcomes# 9 (0.9) 21 (2.1) 7 (0.7)
* Except where otherwise indicated, values are the number (%). 95% CI = 95% confidence interval; NE = not evaluable.† No pathologic fractures occurred in any treatment group during the study (observation times 1,028, 1,013, and 1,016 patient- years in the tanezumab 2.5 mg, tanezumab 5 mg, and nonsteroidal antiinflammatory drug [NSAID] groups, respectively). ‡ Defined as significant loss of joint space width ≥2 mm (predicated on optimal joint positioning) within ~1 year, without gross structural failure. One patient (NSAID group) had rapidly progressive osteoarthritis type 1 (RPOA1) and subchondral insufficiency fracture in different joints (NSAID group); both outcomes are included in these analyses. § Defined as abnormal bone loss or destruction, including limited or total collapse of ≥1 subchondral surface, that is not normally present in conventional end- stage OA. ¶ Not enough information to determine rapid versus normal progression of OA. # Across treatment groups, the majority of “other joint outcomes” were posttraumatic events (i.e., meniscal tear, fracture, injury), preexisting osteonecrosis or subchondral insufficiency fracture, posttraumatic and/or postprocedural OA, or posttraumatic and/or postsurgical RPOA1.

HOCHBERG ET AL 1174 |
patient- years) versus patients treated with NSAIDs (25.7/1,000 patient- years) (P = 0.003 and P < 0.001, respectively) (Supple-mentary Table 7, http://onlin elibr ary.wiley.com/doi/10.1002/art. 41674/ abstract). Overall, 28 (17.6%) of 159 patients who under-went TJRs met the primary composite joint safety end point, including 4 of 53 patients (7.5%), 20 of 80 patients (25.0%), and 4 of 26 patients (15.4%) in the tanezumab 2.5 mg, tanezumab 5 mg, and NSAID groups, respectively. In patients who underwent TJR, RPOA1 occurred with similar frequency across the 3 treat-ment groups; RPOA2 occurred predominantly in patients treated with tanezumab 5 mg.
Efficacy end points. At week 16, patients treated with tan-ezumab 5 mg plus oral placebo had significantly greater improve-ment from baseline in pain and physical function versus patients receiving NSAIDs plus SC placebo (least squares mean [LSM] dif-ference versus NSAIDs −0.26 [95% CI – 0.46, – 0.05], P = 0.015 for WOMAC pain scores; (−0.31 [95% CI −0.52, −0.11], P = 0.003 for WOMAC physical function scores), but no significant differ-ences in PtGA scores at week 16 were seen (LSM difference ver-sus NSAIDs −0.04 [95% CI −0.11, 0.04]) (Table 4).
Improvements in coprimary efficacy end points at week 16 were smaller in patients treated with tanezumab 2.5 mg com-pared to patients treated with tanezumab 5 mg; improvements in the tanezumab 2.5 mg group versus the NSAID group were not significantly different (LSM difference at week 16 −0.15 [95% CI −0.36, 0.06] for WOMAC pain scores; −0.19 [95% CI −0.40, 0.02] for WOMAC physical function scores; −0.02 [95% CI −0.09, 0.06] for PtGA scores) (Table 4). Changes from baseline to week 56 in
both the tanezumab group and the NSAID group were numeri-cally similar and not significantly different, although the study was not optimally designed to show efficacy at week 56 (Supplemen-tary Table 8, http://onlin elibr ary.wiley.com/doi/10.1002/art.41674/ abstract).
The proportions of patients who achieved ≥50% reduction from baseline in the WOMAC pain subscale score at week 16 were 54.9%, 56.5%, and 51.5% in the tanezumab 2.5 mg, tane-zumab 5 mg, and NSAID groups, respectively. After 56 weeks, the corresponding proportions of patients achieving ≥50% reduction in WOMAC pain scores were 44.3%, 41.5%, and 43.5%.
DISCUSSION
In this large, randomized, double- blind, double- dummy, NSAID- controlled, parallel- group study, the frequencies of AEs overall and SAEs were similar between the tanezumab 2.5 mg and NSAID groups, and these events were more prevalent with tane-zumab 5 mg. The primary composite joint safety end point and RPOA1 and RPOA2 combined were significantly more common with tanezumab 2.5 mg and 5 mg, in a dose- dependent man-ner, than with NSAIDs. Pain and physical function improved with tanezumab and NSAIDs, but only in those receiving tanezumab 5 mg was the degree of improvement significantly different from that observed with NSAIDs at 16 weeks. Improvements in pain and physical function were numerically similar across all treatment groups at 56 weeks.
Tanezumab was associated with increased rates of RPOA1 and RPOA2 in the current study. Approximately 70% of com posite
Table 4. Change from baseline to week 16 in scores on the WOMAC pain and physical function subscales, and patient global assessment of osteoarthritis (coprimary efficacy end points)*
Efficacy end pointTanezumab 2.5 mg
(n = 1,002)Tanezumab 5 mg
(n = 998)NSAIDs
(n = 996)WOMAC pain†
Mean (range) baseline score 7.01 (3.6– 10.0) 7.02 (1.6– 10.0) 6.96 (2.6– 10.0)Change from baseline, LSM difference (95% CI) −3.22 (−3.43, −3.01) −3.33 (−3.54, −3.12) −3.07 (−3.29, −2.86)Difference in LSM (95% CI) vs. NSAIDs – 0.15 (– 0.36, 0.06) – 0.26 (– 0.46, – 0.05) –
P NS 0.015 – WOMAC physical function†
Mean (range) baseline score 7.09 (1.5– 10.0) 7.08 (1.1– 10.0) 6.99 (2.4– 10.0)Change from baseline, LSM difference (95% CI) −3.27 (−3.48, −3.05) −3.39 (−3.60, −3.17) −3.08 (−3.29, −2.86)Difference in LSM (95% CI) vs. NSAIDs −0.19 (−0.40, 0.02) −0.31 (−0.52, −0.11) –
P NS 0.003 – Patient global assessment of OA‡
Mean (range) baseline score 3.49 (1– 5) 3.46 (2– 5) 3.44 (1– 5)Change from baseline, LSM difference (95% CI) −0.96 (−1.03, −0.88) −0.97 (−1.05, −0.90) −0.94 (−1.01, – 0.86)Difference in LSM (95% CI) vs. NSAIDs −0.02 (−0.09, 0.06) −0.04 (−0.11, 0.04) –
P NS NS – * Coprimary end points were tested using a gatekeeping strategy to control the family- wise Type I error rate of 5% (see Supplementary Figure 2, available on the Arthritis & Rheumatology website at http://onlin elibr ary.wiley.com/doi/10.1002/art.41674/ abstract). NSAIDs = nonsteroidal antiinflammatory drugs; LSM = least squares mean; 95% CI = 95% confidence interval; NS = not significant; OA = osteoarthritis. † Western Ontario and McMaster Universities Osteoarthritis Index (WOMAC) pain and physical function subscale scores were assessed on 11- point numeric rating scales ranging 0– 10 (higher scores = greater pain intensity and worse physical function, respectively). ‡ Patient global assessment of osteoarthritis (OA) scale ranges from 1 (“very good”) to 5 (“very poor”).

TANEZUMAB FOR OA OF THE HIP OR KNEE | 1175
joint safety events were adjudicated as RPOA1, and the ratio of patients with RPOA1 relative to patients with RPOA2 was larger than in earlier studies (6,7). Higher accrual of RPOA1 events in the current study might be attributable to the use of paired radio-graphs to assess JSW; paired radiographs were available for most patients in the current study, but were frequently unavailable in earlier studies (pre- 2015), as radiographs were not prospectively obtained as scheduled assessments. The rate of RPOA2 was sig-nificantly greater among patients treated with tanezumab 5 mg versus NSAIDs; however, the RPOA2 rate was similar between patients receiving the tanezumab 2.5 mg dose and those treated with NSAIDs. The rate of subchondral insufficiency fracture was not significantly different between the NSAID group and either of the tanezumab groups.
The reasons for the imbalance in joint safety events with tanezumab and NSAIDs remain unclear. While several mecha-nisms have been proposed that may explain the increased risk of joint safety events reported in tanezumab studies, includ-ing neuropathic and analgesic arthropathy, preexisting deficits in bone integrity, and NGF- related effects on cartilage repair and load- induced bone formation (20– 22), the mechanisms underlying RPOA remain poorly understood. Repeated admin-istration of high- dose NGF antibodies did not adversely affect healthy bone or joint tissue in studies of monkeys, rats, or mice (23), and no risk of accelerated OA progression was detected in preclinical studies of NGF antibody treatment (24,25). How-ever, no single animal model of OA can wholly replicate pro-gression and consequences of OA in humans (26). In prior phase III studies of tanezumab treatment in OA, preexisting conditions associated with bone integrity, such as subchon-dral insufficiency fracture and atrophic forms of OA and long- term concomitant NSAID use, were identified as risk factors for RPOA (10). These factors, in combination with substan-tial pain relief from tanezumab, might possibly contribute to accelerated joint damage in patients with susceptible joints. Individually, however, these factors did not appear to be suffi-cient to explain the risk of RPOA2. For example, in prior phase III studies, the frequency of prolonged, substantial analgesia was similar between patients with and those without RPOA2; thus, tanezumab- induced analgesia alone does not appear to increase RPOA risk (27).
Based on pre- 2015 OA phase III clinical data, a compre-hensive screening and surveillance program focused on joint safety has been used in subsequent clinical studies (including the current study) to complement risk mitigation and risk man-agement strategies. This multipronged approach encompassed prospective radiographic screening of hips, knees, and shoul-ders to exclude patients with at- risk joints (i.e., with evidence of or putative risk factors for RPOA); limitation of regular con-comitant NSAID use; exclusion of tanezumab doses that failed to show benefit over lower doses in the pain condition under study; and withdrawal of tanezumab in patients who did not
exhibit early therapeutic response (27). This approach was suc-cessfully implemented in the current study, but joint safety events nonetheless occurred more frequently in the tanezumab groups versus the NSAID group. The use of serial radiographs in the current study, not available in the earlier phase III program, might have increased the rate of detection of RPOA1 events, as this phenomenon is defined with a single criterion of worsening joint space narrowing evident on weight- bearing radiographs (which needs to be performed with adherence to strict technical stand-ardization for valid serial comparisons). Our finding that RPOA1 and RPOA2 are each associated with tanezumab may indicate different manifestations of a single pathologic process, or possi-bly discrete clinical entities.
Tanezumab was otherwise generally well tolerated through the 56- week treatment period and the 24- week safety follow- up period, with low rates of non– joint safety AEs, consistent with find-ings in prior tanezumab OA studies (5,6). Several AEs of abnormal peripheral sensation were reported more frequently in tanezumab- treated patients than in NSAID- treated patients. Among patients who underwent protocol- specified neurologic consultations, mon-oneuropathy and polyneuropathy were diagnosed more frequently in the tanezumab groups (1.3– 2.1% and 0.3– 0.5%, respectively) than in the NSAID group (1.0% and 0%, respectively). Radicu-lopathy was diagnosed with similar frequency in the tanezumab groups (0.4– 0.9%) and the NSAID group (0.5%). In the broader tanezumab phase III development program data set, the death rate was similar between tanezumab- treated patients and placebo- treated patients; both groups had a higher death rate than NSAID- treated patients. In the present study, the most com-mon cause of death in all groups was cardiovascular- related; an analysis of major adverse cardiovascular events did not identify a cardiovascular risk with tanezumab, although this study was not sufficiently powered to assess these events. Oral NSAIDs were already well tolerated in patients enrolled in this study, and this may have contributed to a lower- than- expected rate of both serious cardiovascular and upper gastrointestinal (GI) events in the NSAID group. This is consistent with the findings that the risk of acute myocardial infarction is greatest during the first month of NSAID use (28), although it might not explain the lower rate of serious upper GI events in the NSAID- treated group in the pres-ent study than is typically observed with NSAID use (29– 32). The overall incidence of serious upper GI AEs was ≤0.5% (Supple-mentary Table 3, http://onlin elibr ary.wiley.com/doi/10.1002/art. 41674/ abstract, and data not shown).
Patients who were randomized to receive tanezumab 5 mg plus oral placebo had significantly greater improvement in WOMAC pain and physical function scores, but had no improvement in PtGA scores, after 16 weeks of treatment versus NSAID plus SC placebo. Improvements in pain, physical function, and PtGA with tanezumab 2.5 mg at week 16 were similar to those observed in patients treated with NSAIDs. Furthermore, the proportion of patients with a ≥50% improvement in WOMAC pain score after

HOCHBERG ET AL 1176 |
16 weeks was similar across all treatment groups. Changes in WOMAC pain and physical function scores from baseline to week 16 with tanezumab SC were similar to those reported in 2 recent 16- week and 24- week placebo- controlled OA studies (5,6), and resulted in the majority of patients having a substantial improve-ment in pain (≥50%). The reasons for the more robust response in patients who received oral NSAIDs in the current study than in prior randomized, double- blind, NSAID- controlled tanezumab OA stud-ies (7,33) are unclear, especially as patients enrolled in the current study had persistent pain despite NSAID therapy. Over the course of the tanezumab development program, we have observed an increased placebo effect from phase II studies of intravenous treat-ment to phase III studies of SC treatment, a trend that was simi-larly observed in the pregabalin development program (34,35). In our study, an added “contextual or placebo- like response” (35) in patients who continued to receive NSAIDs with SC placebo injec-tions after randomization may have contributed to the reduced dif-ference between tanezumab and NSAID- treated groups.
The current study has several important strengths, e.g., inclusion of patients who had an inadequate response to previ-ous analgesic therapies, use of a risk mitigation strategy, com-prehensive prospective joint safety surveillance with centrally read images, and the 24- week safety follow- up period after 56 weeks of treatment. Moreover, to our knowledge, this is the largest and longest study evaluating the joint safety of anti- NGF therapy, which provides robust evidence for future investigations and clin-ical decision- making.
These findings raise several critical questions for future research, particularly the potential reasons for the imbalance in joint safety events and observed dose- response relationships, and how safety surveillance and risk mitigation can be further optimized for clinical practice. Nonetheless, tanezumab may have a role in the treatment of patients with hip or knee OA who have moderate- to- severe pain with inadequate relief from, intol-erance of, or other contraindications for standard treatments addressing OA pain, including NSAIDs.
ACKNOWLEDGMENTS
We thank Donna McGuire and Neel Misra (Engage Scientific Solutions) for their medical writing support (funded by Pfizer and Eli Lilly and Company). We are grateful to the following central imaging readers: Frank Roemer, MD, Luis Diaz, MD, Andrew Kompel, MD, and Michel Crema (Boston Imaging Core Lab, Boston, Massachusetts). We also thank the adjudication committee members for blinded adjudication of joint safety events: David Hungerford, MD (Johns Hopkins University), John A. Carrino, MD, MPH (Hospital for Special Surgery), Timothy McAlindon, MD, MPH (Tufts Medical Center), Eric Vignon, MD (Université Claude Bernard Lyon 1), and Edward McCarthy, MD (Johns Hopkins University). Central readers and adjudication committee members received financial compensation for these study activities.
AUTHOR CONTRIBUTIONS
All authors were involved in drafting the article or revising it critically for important intellectual content, and all authors approved the final version
to be published. Dr. Hochberg had full access to all of the data in the study and takes responsibility for the integrity of the data and the accuracy of the data analysis.Study conception and design. Pixton, Viktrup, Brown, West, Verburg.Acquisition of data. Hochberg, Carrino, Schnitzer, Guermazi, Walsh, White, Nakajo, Fountaine, Hickman, Pixton, Viktrup, Brown, West, Verburg.Analysis and interpretation of data. Hochberg, Carrino, Schnitzer, Guermazi, Walsh, White, Nakajo, Fountaine, Hickman, Pixton, Viktrup, Brown, West, Verburg.
ADDITIONAL DISCLOSURES
Author White is an employee of Progressive Medical Research.
ROLE OF THE STUDY SPONSOR
Pfizer and Eli Lilly contributed to the study design, and Pfizer contributed to the management and collection of data. In their role as authors, employees of Pfizer and Eli Lilly were involved in the interpretation of data, preparation, review and approval of the manuscript, and the decision to submit the manuscript for publication, along with their co- authors. Publication of this article was not contingent upon approval by Pfizer or Eli Lilly.
REFERENCES 1. Schmelz M, Mantyh P, Malfait AM, Farrar J, Yaksh T, Tive L, et al.
Nerve growth factor antibody for the treatment of osteoarthritis pain and chronic low- back pain: mechanism of action in the context of efficacy and safety. Pain 2019;160:2210– 20.
2. Su YW, Zhou XF, Foster BK, Grills BL, Xu J, Xian CJ. Roles of neu-rotrophins in skeletal tissue formation and healing. J Cell Physiol 2018;233:2133– 45.
3. Chen J, Li J, Li R, Wang H, Yang J, Xu J, et al. Efficacy and safety of tanezumab on osteoarthritis knee and hip pains: a meta- analysis of randomized controlled trials. Pain Med 2017;18:374– 85.
4. Schnitzer TJ, Marks JA. A systematic review of the efficacy and gen-eral safety of antibodies to NGF in the treatment of OA of the hip or knee. Osteoarthritis Cartilage 2015;23 Suppl 1:S8– 17.
5. Schnitzer TJ, Easton R, Pang S, Levinson DJ, Pixton G, Viktrup L, et al. Effect of tanezumab on joint pain, physical function, and patient global assessment of osteoarthritis among patients with osteoarthritis of the hip or knee: a randomized clinical trial. JAMA 2019;322:37– 48.
6. Berenbaum F, Blanco FJ, Guermazi A, Miki K, Yamabe T, Viktrup L, et al. Subcutaneous tanezumab for osteoarthritis of the hip or knee: efficacy and safety results from a 24- week randomised phase III study with a 24- week follow- up period. Ann Rheum Dis 2020;79:800– 10.
7. Schnitzer TJ, Ekman EF, Spierings EL, Greenberg HS, Smith MD, Brown MT, et al. Efficacy and safety of tanezumab monotherapy or combined with non- steroidal anti- inflammatory drugs in the treatment of knee or hip osteoarthritis pain. Ann Rheum Dis 2015;74:1202– 11.
8. Ekman EF, Gimbel JS, Bello AE, Smith MD, Keller DS, Annis KM, et al. Efficacy and safety of intravenous tanezumab for the symp-tomatic treatment of osteoarthritis: 2 randomized controlled trials versus naproxen. J Rheumatol 2014;41:2249– 59.
9. Spierings EL, Fidelholtz J, Wolfram G, Smith MD, Brown MT, West CR. A phase III placebo- and oxycodone- controlled study of tan-ezumab in adults with osteoarthritis pain of the hip or knee. Pain 2013;154:1603– 12.
10. Hochberg MC, Tive LA, Abramson SB, Vignon E, Verburg KM, West CR, et al. When is osteonecrosis not osteonecrosis? Adjudication of reported serious adverse joint events in the tanezumab clinical development program. Arthritis Rheumatol 2016;68:382– 91.

TANEZUMAB FOR OA OF THE HIP OR KNEE | 1177
11. Pfizer, sponsor. Long term safety and efficacy study of tanezumabin subjects with osteoarthritis of the hip or knee. ClinicalTrials.govidentifier: NCT02528188; 2015.
12. Roemer FW, Miller CG, West CR, Brown MT, Sherlock SP, KompelAJ, et al. Development of an imaging mitigation strategy for patientenrolment in the tanezumab nerve growth factor inhibitor (NGF- ab)program with a focus on eligibility assessment. Semin ArthritisRheum 2017;47:323– 30.
13. Roemer FW, Hayes CW, Miller CG, Hoover K, Guermazi A. Imagingatlas for eligibility and on- study safety of potential knee adverseevents in anti- NGF studies. Part 1. Osteoarthritis Cartilage 2015;23Suppl 1:S22– 42.
14. Roemer FW, Hayes CW, Miller CG, Hoover K, Guermazi A. Imaging atlas for eligibility and on- study safety of potential hip adverse events in anti- NGF studies. Part 2. Osteoarthritis Cartilage 2015;23 Suppl 1:S43– 58.
15. Altman R, Asch E, Bloch D, Bole G, Borenstein D, Brandt K, et al.Development of criteria for the classification and reporting of oste-oarthritis: classification of osteoarthritis of the knee. Arthritis Rheum1986;29:1039– 49.
16. Altman R, Alarcón G, Appelrouth D, Bloch D, Borenstein D, BrandtK, et al. The American College of Rheumatology criteria for the clas-sification and reporting of osteoarthritis of the hip. Arthritis Rheum1991;34:505– 14.
17. Kellgren JH, Lawrence JS. Radiological assessment of osteo-arthrosis. Ann Rheum Dis 1957;16:494– 502.
18. Theiler R, Spielberger J, Bischoff HA, Bellamy N, Huber J, KroesenS. Clinical evaluation of the WOMAC 3.0 OA Index in numericrating scale format using a computerized touch screen version.Osteoarthritis Cartilage 2002;10:479– 81.
19. Lequesne M. Rapidly progressing destructive diseases of the hip.Ann Radiol (Paris) 1993;36:62– 4. In French.
20. Chartier SR, Mitchell SA, Majuta LA, Mantyh PW. Immuno-histochemical localization of nerve growth factor, tropomyosinreceptor kinase A, and p75 in the bone and articular cartilage of themouse femur. Mol Pain 2017;13:1744806917745465.
21. Tomlinson RE, Li Z, Li Z, Minichiello L, Riddle RC, Venkatesan A,et al. NGF- TrkA signaling in sensory nerves is required for skeletaladaptation to mechanical loads in mice. Proc Natl Acad Sci U S A2017;114:E3632– 41.
22. Walsh DA, McWilliams DF, Turley MJ, Dixon MR, Franses RE, MappPI, et al. Angiogenesis and nerve growth factor at the osteochon-dral junction in rheumatoid arthritis and osteoarthritis. Rheumatology (Oxford) 2010;49:1852– 61.
23. Gropp KE, Carlson CS, Evans MG, Bagi CM, Reagan WJ, Hurst SI,et al. Effects of monoclonal antibodies against nerve growth factor
on healthy bone and joint tissues in mice, rats, and monkeys: his-topathologic, biomarker, and microcomputed tomographic assess-ments. Toxicol Pathol 2018;46:408– 20.
24. Xu L, Nwosu LN, Burston JJ, Millns PJ, Sagar DR, Mapp PI, et al.The anti- NGF antibody muMab 911 both prevents and reverses pain behaviour and subchondral osteoclast numbers in a rat model ofosteoarthritis pain. Osteoarthritis Cartilage 2016;24:1587– 95.
25. LaBranche TP, Bendele AM, Omura BC, Gropp KE, Hurst SI,Bagi CM, et al. Nerve growth factor inhibition with tanezumabinfluences weight- bearing and subsequent cartilage damagein the rat medial meniscal tear model. Ann Rheum Dis 2017;76:295– 302.
26. Serra CI, Soler C. Animal models of osteoarthritis in small mammals.Vet Clin North Am Exot Anim Pract 2019;22:211– 21.
27. Pfizer, Inc. Tanezumab Arthritis Advisory Committee briefing docu-ment. February 2012. URL: https://autho rzilla.com/ardDv/ tanez umab- arthr itis- advis ory- commi ttee- briefi ng- docum ent- fda.html.
28. Bally M, Dendukuri N, Rich B, Nadeau L, Helin- Salmivaara A, GarbeE, et al. Risk of acute myocardial infarction with NSAIDs in realworld use: Bayesian meta- analysis of individual patient data. BMJ2017;357:j1909.
29. Wolfe MM, Lichtenstein DR, Singh G. Gastrointestinal toxicity ofnonsteroidal antiinflammatory drugs [review]. N Engl J Med 1999;340:1888– 99.
30. Naprosyn (naproxen) tablets, EC- naprosyn (naproxen delayed- release tablets), Anaprox DS (naproxen sodium tablets) highlights of prescrib-ing information. Essex (UK): Atnahs Pharma; 2016. URL: https://www.acces sdata.fda.gov/drugs atfda_docs/label/ 2017/ 01758 1s113 , 01816 4s063 ,02006 7s020 lbl.pdf.
31. Diclofenac sodium topical gel prescribing information. Amneal:Piscataway (NJ); 2015. URL: http://www.amneal.com/wp- conte nt/uploa ds/2016/09/Diclo fenac Sodiu m1- pi.pdf.
32. Celebrex (celecoxib) prescribing information. Pfizer: New York (NY);2019. URL: http://label ing.pfizer.com/ShowL abeli ng.aspx?forma t= PDF&id=793.
33. Balanescu AR, Feist E, Wolfram G, Davignon I, Smith MD, BrownMT, et al. Efficacy and safety of tanezumab added on to diclofenacsustained release in patients with knee or hip osteoarthritis: adouble- blind, placebo- controlled, parallel- group, multicentre phaseIII randomised clinical trial. Ann Rheum Dis 2014;73:1665– 72.
34. Freeman R, Emir B, Parsons B. Predictors of placebo response inperipheral neuropathic pain: insights from pregabalin clinical trials.J Pain Res 2015;8:257– 68.
35. Zhang W. The powerful placebo effect in osteoarthritis. Clin ExpRheumatol 2019;37 Suppl 120:118– 23.

1178
Arthritis & RheumatologyVol. 73, No. 7, July 2021, pp 1178–1188DOI 10.1002/art.41651© 2021, American College of Rheumatology
Global Deletion of Pannexin 3 Resulting in Accelerated Development of Aging- Induced Osteoarthritis in MiceP. M. Moon, Z. Y. Shao, G. Wambiekele, C. T. G. Appleton, D. W. Laird, S. Penuela, and F. Beier
Objective. Osteoarthritis (OA) results in pathologic changes in the joint tissue. The mechanisms driving disease progression remain largely unclear, and thus disease- modifying treatments are lacking. Pannexin 3 (Panx3) was identified as a potential mediator of cartilage degeneration in OA, and our previous study in mice indicated that deletion of the Panx3 gene delayed surgically induced cartilage degeneration. This study was undertaken to examine the role of Panx3 in other OA subtypes, particularly primary OA during aging, in a mouse model of aging- induced OA.
Methods. Wild- type (WT) and Panx3−/− C57BL/6J (Black- 6) mice, ages 18– 24 months, were analyzed by micro– computed tomography to investigate bone mineral density and body composition. Joints were harvested from the mice, and histopathologic analysis of the joint tissue for OA development was conducted with a specific focus on changes in articular cartilage, subchondral bone, and synovial tissue.
Results. Global loss of Panx3 in aging mice was not associated with increased mortality or changes in body composition. Mice lacking Panx3 had shorter appendicular skeletons than WT mice, but overall the body compositions appeared quite similar. Panx3 deletion dramatically accelerated cartilage degeneration and subchondral bone thickening with aging in both 18- month- old and 24- month- old mice, while promoting synovitis in 18- month- old mice.
Conclusion. These observations in a mouse model of OA suggest that Panx3 has a protective role against the development of primary aging- associated OA. It appears that Panx3 has opposing context- specific roles in joint health following traumatic injury versus that associated with aging. These data strongly suggest that there are differences in the molecular pathways driving different subtypes of OA, and therefore a detailed understanding of these pathways could directly improve strategies for OA diagnosis, therapy, and research.
INTRODUCTION
Osteoarthritis (OA) is a progressive and disabling degenera-tive joint disease affecting 1 in 8 people over the age of 60 years in North America (1). Many risk factors, including sex, weight, and previous joint injury, significantly increase the likelihood of an indi-vidual developing OA in their lifetime, but the most significant and nonmodifiable risk factor is age (2).
Primary OA develops gradually during the adult lifespan, due to the impact of various risk factors on the health and function of the joint (3,4). OA is hallmarked by the gradual destruction of articular cartilage, synovial inflammation, and subchondral bone changes (5– 7). These pathologic changes result in joint failure, leading to significant disability and reduced quality of life for those affected (8). Unfortunately, no medical treatments have been
convincingly shown to slow or modify this process. Moreover, control of symptoms is frequently limited by the side effects or inadequate efficacy of existing medications (9).
Although all joint tissues are involved in OA, sustained carti-lage degeneration is a key step in disease progression, because of the limited regenerative potential of the articular cartilage (10). Therefore, identifying novel processes driving early OA pathogen-esis is paramount for understanding the pathobiologic processes of the disease and for effective development of novel treatments. One such process is the hypertrophic differentiation of articular chondrocytes.
Pannexin 3 (Panx3) is a channel- forming glycoprotein induced by Runx2, a transcription factor promoting chondrocyte hypertrophy, and is thought to be an important driver of chon-drocyte hypertrophy in vitro (11,12). Previously we have shown
Supported by Canadian Institutes of Health Research Operating grant MOP130530 awarded to Drs. Laird, Penuela, and Beier. Dr. Moon’s work was supported by a Canadian Institutes of Health Research MD/PhD Program Studentship. Dr. Beier’s work was supported by Canada Research Chair awards.
P. M. Moon, MD, PhD, Z. Y. Shao, BMSc, G. Wambiekele, PhD, C. T. G. Appleton, MD, PhD, D. W. Laird, PhD, S. Penuela, PhD, F. Beier, PhD: University of Western Ontario, London, Ontario, Canada.
Dr. Appleton has received consulting fees, speaking fees, and/or honoraria from Pfizer (less than $10,000). No other disclosures relevant to this article were reported.
Address correspondence to F. Beier, PhD, University of Western Ontario, Schulich School of Medicine and Dentistry, London, Ontario N6A 5C1, Canada. Email: [email protected].
Submitted for publication September 4, 2020; accepted in revised form January 7, 2021.

Panx3 DELETION AND EFFECTS ON AGING- INDUCED OA | 1179
that Panx3 was up- regulated both in a rat model of OA and in human OA cartilage. Our previous study also identified Panx3 as an important driver of surgically induced, posttraumatic knee OA in young mice (13,14).
Posttraumatic secondary OA accounts for only 12% of OA in the lower extremities, and the mechanisms driving car-tilage degeneration following a joint- destabilizing injury are not necessarily the same as those involved in primary OA linked to aging (15,16). Therefore, in order to understand the role of Panx3 in primary OA, we compared the development of OA in aging wild- type (WT) and global Panx3– knockout (KO) mice (17). Our results highlight opposing and context- dependent roles for Panx3 in OA, in which deletion of Panx3 delays the progression of OA following joint injury (13) but accelerates OA with aging.
MATERIALS AND METHODS
Animals. All animals used in this study were bred in- house, and were raised and euthanized in accordance with the ethics guidelines set forth by the Canadian Council for Animal Care. Animal use protocols were approved by the Council for Animal Care at Western University- Canada (animal use permit no. 2015- 031). Mice were housed in a conventional facility, in standard shoe box– style caging, and exposed to a 12- hour light/dark cycle. Mice had free access to chow and water and were housed with a running wheel, introduced at 12 months of age. Global Panx3– KO (Panx3−/−) mice were created in- house as described previously (13) and backcrossed onto C57BL/6J (Black- 6) mice for at least 10 generations. Age- matched WT C57BL/6J mice, congenic to the Panx3−/− mouse line, were used as controls. All animals were weighed and then eutha-nized by CO2 asphyxiation.
Genotypes of the mice were confirmed by standard polymer-ase chain reaction analysis of ear- notch biopsy tissue, as described previously (13). WT and Panx3−/− male mice were euthanized either between ages 18 and 19 months (group herein referred to as 18- month- old mice) or between ages 23 and 24 months (group herein referred to as 24- month- old mice). Panx3 immuno staining was assessed using knee joint sections obtained from WT male C57BL/6J mice at ages 3, 12, 18, and 24 months.
Micro– computed tomography (micro- CT). Whole body micro- CT scans were obtained from the mice immediately post-mortem, to examine skeletal morphology and body composition. The scans were performed at resolutions of 50 μm/voxel and 100 μm/voxel on a GE SpeCZT micro- CT machine, as described pre-viously (18,19). GE Healthcare MicroView (version 2.2) software was used to generate the 2- dimensional (2- D) maximum inten-sity projection and 3- D isosurface renderings, to assess skeletal pathology and general morphology.
Body composition analysis. Micro- CT scans with a res-olution of 100 μm/voxel were used to assess body composition immediately after the mice were euthanized. Using threshold val-ues of −275 Hounsfield units (HU) for adipose tissue, −40 HU for lean tissue, and 280 HU for skeletal tissue, we measured the adipose tissue, lean tissue, and skeletal masses. Bone mineral density (BMD) was calculated as the quotient of skeletal mass and total reconstructed volume, as described previously (18,19).
Skeletal morphometry. Three- dimensional isosurface renderings of the murine skeleton were created in MicroView using a threshold value of 280 HU. Humerus lengths were meas-ured from the midpoint of the greater tubercle to the center of the olecranon fossa. Femur lengths were measured from the proximal point of the greater trochanter to the midpoint of the lateral fem-oral condyle. Tibia lengths were measured from the midpoint of the medial plateau to the lateral malleolus. Skull length was meas-ured anteriorly, from the intersection of the premaxillae and nasal bones to the occipital bone, posteriorly. Spine length was meas-ured dorsally, from C1 to S1.
Histopathologic assessment of the knee joints. After the whole body micro- CT scans, both knee joints obtained from the euthanized mice were fixed in 4% paraformaldehyde at room temperature for 24 hours, and then decalcified in 5% EDTA for 12 days at room temperature. Knees were processed and embed-ded coronally in paraffin, and 5- μm– thick sections were cut from front to back through the width of the joint. Sections were stained with Safranin O– fast green to assess glycosaminoglycan content and articular cartilage structure, as described previously (13,20– 22). Images were obtained using a Leica DM1000 microscope with attached Leica DFC295 camera.
Ten sections spanning the width of the knee were scored by 2 blinded observers (PMM and ZYS) according to the Oste-oarthritis Research Society International (OARSI) histopathology scoring system, as described previously (23). Scores (scale 0– 6) were assigned to the medial and lateral tibial plateaus and femoral condyles of each knee, based on depth and width of the lesions. Individual scores were averaged across observers and summed for each sample. These scores were used to determine the sever-ity of cartilage damage by quadrant, compartment, whole joint, and whole animal.
Picrosirius red staining was used to visualize the collagen network in subchondral bone and articular cartilage (0.1% sirius red in saturated picric acid solution for 60 minutes, with 0.5% acetic acid washes) as described previously (20,22). The relative size and organization of the collagen fibrils were determined using polarized light microscopy. Light intensity and angle, relative to the polarizing filter and analyzer used (product nos. 11505087 and 11555045, respectively; Leica), were consistent between samples.

MOON ET AL 1180 |
Measurement of osteophyte size. To determine the size of osteophytes in WT and Panx3−/− mice, 2 sections of the knee joints, one from the anterior compartment and one from the pos-terior compartment, were selected from each animal and imaged at 200× magnification. Using Leica Application Suite software, osteophyte margins were traced and the total osteophyte area (in μm2) was determined.
Measurements of subchondral bone thickness. OsteoMetric OsteoMeasure software was used to measure subchondral bone thickness, as previously described by McNulty et al (24). Subchondral bone thickness was measured by aver-aging the vertical distance between the subchondral bone– calcified cartilage interface and the marrow cavities underlying the subchondral plate. Distances between adjacent marrow cavities were covered by straight lines perpendicular to the marrow cavity, when its margins reached a constant width. The medial and lateral tibia and femoral subchondral bone plates were measured, and the mean thicknesses of the medial and lateral tibia and femora of each joint were compared and then combined. Two sections per joint were measured, one each from the anterior and posterior compartments.
Assessment of synovitis. Safranin O– fast green– stained sections of the left and right knees of mice were scored for the severity of synovitis based on a scoring system described by Krenn et al (25). Two sections, one each from the anterior and posterior joint compartments, were assessed for stromal cellular density, infiltration of inflammatory cells, and synovial lining cell thickness. A synovitis score per category (scale 0– 3) was assigned based on the severity of the histologic findings in each compartment, and individual scores (ranging from a score of 0 to a maximum score of 9) were assigned for each of the 6 regions in each joint. Scores from the medial and lateral parapatellar regions were averaged across both joints to generate a mean, per- animal parapatellar synovitis score. Additionally, the 6 regional scores were averaged across both joints to generate a mean global synovitis score (scale 0– 9). These scores were then compared between the WT and Panx3−/− mice. Cumulative scores of 0– 1 represent no synovitis, scores of 2– 4 represent low- grade synovitis, and scores of 5– 9 represent high- grade synovitis.
Immunohistochemistry. Immunostaining was per-formed on frontal sections of the knees from mice of both genotypes. Additional immunohistochemical analyses were performed on knee joint sections obtained during our previ-ous study (13) from 28- week- old WT and Panx3−/− mice that had undergone surgical destabilization of the medial meniscus (DMM) at age 20 weeks to induce OA. Sections were dewaxed and rehydrated as described previously (13,20– 22). Antigen retrieval was performed using Triton X- 100 in a 0.1% solution at room temperature for 12 minutes. Custom- made, site- directed
anti- Panx3 (CT- 379) antibodies (13,26) as well as commercial antibodies against matrix metalloproteinase 13 (MMP- 13) (cat-alog no. 18165- 1AP; Protein Tech), type II collagen (catalog no. 10R- C135B; Fitzgerald), and lubricin (catalog no. 28484; Abcam) were used with diaminobenzidine substrate (Sigma) to reveal immunolabeling (13). Methyl green (Sigma) was used to counterstain the sections. Negative control knee joint sections were stained using the same protocol but without application of primary antigen– specific antibodies.
Statistical analysis. The body compositions of WT and Panx3−/− mice were compared using Student’s unpaired 2- tailed t- tests (age 18 months, 6 WT mice and 8 Panx3−/− mice; age 24 months, 12 WT mice and 11 Panx3−/− mice). Skeletal meas-urements of the mice at age 24 months were compared using Student’s unpaired t- tests (12 WT mice and 12 Panx3−/− mice). Semiquantitative OARSI histologic scores of the medial com-partments of the left and right knees, whole left or right knee, and combined left and right knees were compared by Student’s unpaired t- tests (age 18 months, 6 WT mice and 8 Panx3−/− mice; age 24 months, 10 WT mice and 10 Panx3−/− mice). Student’s unpaired t- tests were also used to compare the mean subchon-dral bone thickness between the groups. Mean parapatellar and mean global synovitis scores were compared separately in the groups of mice at age 18 months and mice at age 24 months. Statistical analysis was performed using two- way analysis of vari-ance (ANOVA). BMD was also compared using two- way ANOVA. All statistical analyses were performed using GraphPad Prism software (version 6.0).
RESULTS
Lack of association between global loss of Panx3 and increased mortality or changes in body composition in aging mice. Although we observed a marked incidence of mortal-ity among the mice within the 24- month trials, there were no major differences in the frequency of mortality between the genotypes. In our mouse model of aging- induced OA, of the 41 WT male mice, 24 (58.5%) survived to 24 months, while 14 (53.8%) of the 26 Panx3−/− male mice survived to 24 months. The specific causes of early mortality were not investigated in each genotype, but included spontaneous death and protocol- mandated termination of the mice due to clear deterioration in health.
Since weight loss and muscle wasting are often signs of severe systemic illnesses in both mice and humans (27– 31), we also investigated the effects of Panx3 deletion on weight and body composition. There were no significant differences in weight or body composition between WT and Panx3−/− mice at either age 18 months or age 24 months (Figure 1A; see also Supple-mentary Figure 1 and Supplementary Table 1, available on the Arthritis & Rheumatology website at http://onlin elibr ary.wiley.com/doi/10.1002/art.41651/ abstract).

Panx3 DELETION AND EFFECTS ON AGING- INDUCED OA | 1181
Micro- CT revealing shorter limb length in mice lacking Panx3 compared to WT mice. Although our initial character-ization of the Panx3- KO mouse model showed no gross differ-ences in musculoskeletal development (13), subsequent analyses using micro- CT revealed shorter diaphyseal shafts and more robust midshafts in the femora and humeri of Panx3- KO mice compared to WT mice (32). We therefore used micro- CT analysis
to examine the gross skeletal morphologic features of aging mice. Using 3- D isosurface reconstructions of the micro- CT scans (at 100 μm/voxel), the lengths of the skull, spine, humeri, tibiae, and femora were measured with GE MicroView version 2.2 software. The appendicular bones of Panx3−/− mice were modestly, but significantly, shorter than those of WT mice at age 24 months (Figure 1B). However, the axial skeletons (skull and spines)
Figure 1. Micro– computed tomography (micro- CT) imaging and skeletal measurements of 18- month- old and 24- month- old wild- type (WT) and Panx3−/− mice. A– C, The spine from C1– S1 and the lengths of the left humeri, tibiae, and femora were measured on micro- CT scans of mice using GE MicroView software. Representative images show the adipose tissue, lean tissue, and skeletal tissue of a WT mouse and Panx3−/− mouse (A). In 24- month- old Panx3−/− mice compared to WT mice (n = 12 per group), long bone lengths were significantly shorter (* = P < 0.001, P < 0.02, and P < 0.001 for the humerus, tibia, and femoral condyle, respectively) (B), but measurements of the axial skeleton (skull and spine) were not significantly different (P = 0.77 and P = 0.45, respectively) (C). D, Bone mineral density was calculated from whole body micro- CT scans of WT and Panx3−/− mice in the 2 age groups. A significant decline in bone mineral density with age was seen in WT mice (* = P = 0.022, by two- way analysis of variance), but no differences between genotypes at either age were seen (age 18 months, 6 WT and 8 Panx3−/− mice; age 24 months, 12 WT and 11 Panx3−/− mice). Symbols represent individual mice; horizontal lines with bars show the mean ± SD.

MOON ET AL 1182 |
of Panx3−/− mice were not significantly different from those of WT mice (Figure 1C).
Minimal impact of global loss of Panx3 on BMD in mice during aging. BMD, measured as mg of bone per cubic centimeter of skeletal volume (mg/cc) (18), is expected to decline during aging (33,34). The mean BMD significantly decreased in WT male mice between age 18 months and age 24 months, from 319.5 mg/cc to 309.2 mg/cc (Figure 1D). In contrast, although the BMD did decrease in Panx3−/− male mice between age 18 months and age 24 months, from 322.8 mg/cc to 314.7 mg/cc, this difference was not statistically significant. The mean BMD of Panx3−/− mice was not significantly different from that of the cor-responding WT mice at either age 18 months or age 24 months.
Accelerated cartilage degeneration with global loss of Panx3 in mice during aging. Safranin O– fast green– stained, paraffin- embedded sections from the knee joints of 18- month- old and 24- month- old WT and Panx3−/− male mice were analyzed. At age 18 months, WT male mice showed minimal signs of car-tilage degeneration. Histologically, focal loss of aggrecan staining and cartilage surface fibrillations were seen, with no full- thickness cartilage lesions (Figure 2A). In contrast, Panx3−/− male mice showed significant articular cartilage damage, most commonly in the medial compartment, with full- thickness defects and cartilage erosion spanning more than 25% of the articular surface in at least one knee in 6 of 8 mice, and with both joints showing damage in 5 of 8 mice (Figure 2B).
Similarly, the OARSI cartilage damage scores (assessed in 6 WT and 8 Panx3−/− mice) were significantly increased in Panx3−/− mice. Whole joint OARSI scores >40, suggesting more widespread cartilage damage, were seen in 11 of 16 knees iso-lated from 8 Panx3−/− mice, but in none of the knees isolated from 6 WT mice. As expected, variability within these data did exist, and not all joints harvested from Panx3−/− mice showed advanced cartilage loss (Figure 2B and Supplementary Table 2, available on the Arthritis & Rheumatology website at http://onlin elibr ary.wiley.com/doi/10.1002/art.41651/ abstract).
At age 24 months, WT mice showed increased cartilage degeneration compared to 18- month- old WT mice, with full- thickness cartilage lesions detected in 2 of 10 mice (although in 1 of these mice, the lesion was locally confined) and superficial dam-age in 5 of 10 mice (Figure 3A). Panx3−/− mice also showed more advanced signs of cartilage loss at age 24 months compared to that in Panx3−/− mice at age 18 months, as well as more severe cartilage degeneration compared to age- matched WT mice. Full- thickness cartilage lesions and erosions spanning more than 25% of the articular surface in at least one joint were observed in 8 of 10 mice, with both joints showing damage in 7 of 10 mice (Figure 3B).
OARSI scores of cartilage damage were significantly increased in Panx3−/− mice at age 24 months compared to WT mice at age
24 months. Moreover, whole joint OARSI scores >40 from his-tologic assessments were seen in 13 of 20 knees isolated from 10 Panx3−/− mice compared to 1 of 20 knees isoloated from 10 WT mice (Figure 3B and Supplementary Table 2 [http://onlin elibr ary. wiley.com/doi/10.1002/art.41651/ abstract]).
Altered immunostaining for MMP- 13 and type II collagen in cartilage from Panx3−/− mice. Immunohis-tochemical analysis of MMP- 13 localization was performed on paraffin- embedded knee joint sections from WT and Panx3−/− mice. In the cartilage of WT mice at age 18 months, pericellular localization of MMP- 13 was observed (Figure 4). In damaged cartilage from the knees of Panx3−/− mice at age 18 months, MMP- 13 staining was seen most prominently in the articular matrix, along the surface of cartilage lesions. In WT mice
Figure 2. Histopathologic analysis of the knees of 18- month- old wild- type (WT) and Panx3−/− mice. A, Safranin O– fast green– stained sections of the medial compartment and whole knee joint from a representative WT mouse at age 18 months show minimal signs of cartilage damage, whereas stained sections from an 18- month- old Panx3−/− mouse show more advanced articular cartilage destruction with diffuse proteoglycan loss (yellow arrow), and full- thickness cartilage defects (black arrows) are evident in the majority of animals. B, Semiquantitative global Osteoarthritis Research Society International (OARSI) histologic scores of cartilage damage in the medial and lateral tibial plateaus and femoral condyles of the left and right knees of 6 WT mice and 8 Panx3−/− mice were compared. Symbols represent individual mice; horizontal lines with bars show the mean ± SD. * = P = 0.002, by unpaired 2- tailed t- test.

Panx3 DELETION AND EFFECTS ON AGING- INDUCED OA | 1183
at age 24 months, pericellular MMP- 13 staining was uncommon throughout the cartilage. In both genotypes at age 24 months, pericellular MMP- 13 staining was more prevalent in the matrix around lesions (Figure 4).
Immunohistochemical staining for type II collagen showed strong matrix staining for type II collagen in 18- month- old WT male mice, whereas the staining intensity for type II colla-gen appeared to be decreased in the matrix of degenerated joints from Panx3−/− male mice at age 18 months. In WT mice at age 24 months, the staining intensity for type II collagen in the articular cartilage appeared to be decreased compared to that at age 18 months. In 24- month- old Panx3−/− mice, some type II collagen staining was still seen on the surface of denuded subchondral bone (see Supplementary Figure 2, available on the
Arthritis & Rheumatology website at http://onlin elibr ary.wiley.com/doi/10.1002/art.41651/ abstract).
Immunohistochemical staining for lubricin, a key mech-anoresponsive superficial zone proteoglycan, was performed on paraffin- embedded sections of the knee joints from mice. Lubricin staining was increased in the cartilage of Panx3−/− mice after DMM surgery, whereas it was decreased in the cartilage of Panx3−/− mice during aging. In WT mice, both at age 18 months and at age 24 months, pericellular localization of lubricin was seen in the superficial zone of the cartilage. This finding was in con-trast to that seen in the cartilage from Panx3−/− mice at either age, with immunohistochemical analyses revealing minimal staining for lubricin in the cartilage (see Supplementary Figure 3A, available on the Arthritis & Rheumatology website at http://onlin elibr ary. wiley.com/doi/10.1002/art.41651/ abstract). The opposite pat-tern was seen in the DMM- operated mice at age 28 weeks. In DMM- operated WT mice, we observed limited lubricin staining throughout the articular cartilage, whereas in the cartilage of DMM- operated Panx3−/− mice, strong lubricin staining was evi-dent (see Supplementary Figure 3B).
Age- dependent variability in Panx3 immunostaining in the joints of WT mice. Immunohistochemical analysis of Panx3 localization was performed in the knee joints of WT mice at ages 3, 12, 18, and 24 months. In the mice at age 3 months, Panx3 immunostaining was seen in all osteochondral and soft
Figure 3. Histopathologic analysis of the knees of 24- month- old WT and Panx3−/− mice. A, Safranin O– fast green– stained sections of the medial compartment and whole knee joint from a representative WT mouse at age 24 months show more advanced signs of cartilage damage, with significant proteoglycan loss (yellow arrows), full- thickness lesions, and articular surface irregularities. Stained sections from a 24- month- old Panx3−/− mouse show more severe cartilage destruction with proteoglycan loss (yellow arrows), and full- thickness cartilage defects (black arrows) in at least one leg were evident in the majority of animals. B, Semiquantitative global OARSI histologic scores of cartilage damage in the medial and lateral tibial plateaus and femoral condyles of the left and right knees of 10 WT mice and 10 Panx3−/− mice were compared. Symbols represent individual mice; horizontal lines with bars show the mean ± SD. * = P < 0.05, by unpaired 2- tailed t- test. See Figure 2 for definitions.
Figure 4. Matrix metalloproteinase 13 (MMP- 13) localization in the knees of 18- month- old and 24- month- old wild- type (WT) and Panx3−/− mice. Paraffin- embedded knee joint sections were immunostained for MMP- 13. Subchondral MMP- 13 staining (red arrows) was observed in Panx3−/− and WT mice of both age groups. MMP- 13 was seen paracellularly (green arrows) and extracellularly on the surface of damaged cartilage (black arrows). Results are representative of a total of 6 WT mice and 8 Panx3−/− mice at age 18 months, and 10 WT and 10 Panx3−/− mice at age 24 months.

MOON ET AL 1184 |
tissues throughout the joint (see Supplementary Figure 4A, available on the Arthritis & Rheumatology website at http://onlin elibr ary.wiley.com/doi/10.1002/art.41651/ abstract). By age 12 months, Panx3 appeared minimally throughout the articular cartilage of WT mice and was seen mostly in the meniscus and soft tissues (Supplementary Figure 4A). In the WT mice at ages 18 and 24 months, Panx3 staining was once again observed in the articular cartilage and around cartilage lesions (Supplemen-tary Figure 4B).
Association of global loss of Panx3 with increased osteophyte size, greater subchondral bone thickness, and altered collagen fiber organization. Osteophyte area was measured in 2 sections of the knee joints from each animal. In the 18- month- old WT mice, osteophytes were seen in 3 of 6 mice (in 5 of 12 knee joints examined), with a mean osteophyte area of 26,374 μm2. In the 24- month- old WT mice, osteophytes were seen in 5 of 10 mice (in 7 of 20 joints examined), with a mean osteophyte area of 35,778 μm2. In contrast, in Panx3−/− mice at
Figure 5. Subchondral bone changes in wild- type (WT) and Panx3−/− mice. A, Osteophyte size was measured using the Leica Application Suite on Safranin O– fast green– stained knee sections from 18- month- old and 24- month- old WT and Panx3−/− mice. In Panx3−/− mice, there were instances in which >1 osteophyte was seen in each joint, and these were significantly larger than those seen in WT mice. * = P < 0.0001, by two- way analysis of variance. B and C, Subchondral bone thickness was measured using OsteoMeasure software on the same knee joint sections from 18- month- old (B) and 24- month- old (C) WT and Panx3−/− mice. Subchondral plate thickness was assessed bilaterally in the medial and lateral compartments of the knees. Symbols represent individual mice (n = 6 WT and n = 8 Panx3−/− in B; n = 10 WT and n = 10 Panx3−/− in C); horizontal lines with bars show the mean ± SD. In B, * = P = 0.042, P = 0.0082, and P = 0.0074 for the left medial, right medial, and combined medial groups, respectively, by unpaired 2- tailed t- test. In C, * = P = 0.026, P = 0.021, and P = 0.040 for the left medial, right medial, and combined medial groups, respectively, by unpaired 2- tailed t- test. D, Knees from 18- month- old WT and Panx3−/− mice were stained with picrosirius red and imaged under circular polarized light at 200× magnification. Representative images of the subchondral bone of a WT mouse and Panx3−/− mouse are shown.

Panx3 DELETION AND EFFECTS ON AGING- INDUCED OA | 1185
age 18 months, osteophytes were seen in 8 of 8 mice (in 14 of 16 joints examined), with a mean osteophyte area of 69,648 μm2. In Panx3−/− mice at age 24 months, osteophytes were seen in 9 of 10 mice (in 15 of 20 joints examined), with a mean osteophyte area of 76,877 μm2 (Figure 5A). These differences in the size of the osteophyte area between genotypes were statistically significant (P < 0.05), which suggests that Panx3 is an important regulator of osteophyte development in aging mice.
OsteoMeasure software was used to measure subchon-dral bone thickness (24). Both in the 18- month- old and in the 24- month- old Panx3−/− mice, subchondral bone thickness in the medial compartment was increased when compared to that in WT mice of either age (Figures 5B and C, and Supplemen-tary Table 3, available on the Arthritis & Rheumatology website at http://onlin elibr ary.wiley.com/doi/10.1002/art.41651/ abstract).
Furthermore, the organization of the subchondral collagen network appeared to differ between WT and Panx3−/− mice. Green and yellow birefringence was evident throughout the subchondral collagen network of WT mouse knees, with some intermixed orange/red birefringence. In Panx3−/− mouse knees, an increase in orange/red birefringence was seen in the subchondral bone (Figure 5D), suggesting that the knees of Panx3−/− mice have a collagen network composed of thicker fibers (20,22).
Association of global loss of Panx3 with increased prevalence of low- grade synovitis in mice at age 18 months. Synovitis was assessed using a scoring system previously described by Krenn et al (25). The medial and lateral parapatellar regions appeared to be the regions with the most active disease at each time point and between genotypes. At age 18 months, 3 of 6 WT mice had a mean parapatellar synovitis score of >2, with none having a score of >4. The mean para-patellar synovitis score in WT mice was 1.8, and the mean global synovitis score was 2.1. In comparison, at age 18 months, all 6 Panx3−/− mice had a mean parapatellar synovitis score of >2, with the score being >4 in 3 of these mice. The mean parapatellar synovitis score in Panx3−/− mice was 3.7, and the mean global synovitis score was 3.0 (Figures 6A and B; see also Supplemen-tary Table 4, available on the Arthritis & Rheumatology website at http://onlin elibr ary.wiley.com/doi/10.1002/art.41651/ abstract).
At age 24 months, 5 of 10 WT mice had a mean parapatellar synovitis score of >2, and none had a score of >4. The mean para-patellar synovitis score in 24- month- old WT mice was 2.1, and the mean global synovitis score was 2.2. In 7 of 10 Panx3−/− mice at age 24 months, the mean parapatellar synovitis score was >2, with 1 having a score of >4. The mean parapatellar synovitis score in 24- month- old Panx3−/− mice was 2.5, and the mean global syn-ovitis score was 2.2 (Figures 6A and B; see also Supplementary Table 4).
There was a significant difference between genotypes with regard to the mean parapatellar synovitis scores and mean global synovitis scores, with both of these scores being significantly
higher in Panx3−/− mice compared to WT mice (P = 0.048 for comparison of mean parapatellar synovitis scores, and P = 0.044 for comparison of mean global synovitis scores). There was no significant difference in either of the mean scores between 18- month- old and 24- month- old mice. Figure 6C shows repre-sentative images of the knee joints evaluated histologically for severity of synovitis.
DISCUSSION
In our previous study using the first reported genetically mod-ified mouse line where Panx3 was ablated, our results showed that cartilage- specific and global Panx3 deletion protects mice against cartilage degeneration following DMM surgery, a model of posttraumatic OA in young mice (13). In the present study using the same mouse line, we investigated the effects of global Panx3 deletion on primary OA development and skeletal health during aging in male mice.
Figure 6. Assessment of the severity of synovitis in the knees of wild- type (WT) and Panx3−/− mice at ages 18 months and 24 months. A and B, Synovitis was scored in 6 regions of each joint according to thickness, cellularity, and inflammatory cell infiltration using the system described by Krenn et al (25). These 6 scores were averaged across both joints in each mouse to yield a single per- animal global synovitis score (B). The 2 parapatellar regions were also combined and averaged across both joints to yield a mean parapatellar synovitis score (A). Mean scores of 2– 4 represent low- grade synovitis, and mean scores of 5– 9 represent high- grade synovitis. In all Panx3−/− mice at age 18 months, the mean parapatellar scores were >2, compared to only 3 of 6 WT mice having a mean parapatellar score of >2. In mice at age 24 months, 5 of 10 WT mice and 7 of 10 Panx3−/− mice had mean global synovitis scores of >2. Mean global synovitis and parapatellar synovitis scores did not differ by age, but each were significantly different between genotypes. * = P = 0.0438 in A; P = 0.048 in B, by two- way analysis of variance. Symbols represent individual mice; horizontal lines with bars show the mean ± SD. C, Knee joints from 18- month- old WT and Panx3−/− mice were stained with Safranin O– fast green. Representative images from a WT mouse and Panx3−/− mouse show the development of synovitis in the peripatellar synovium (black arrows).

MOON ET AL 1186 |
Our previous studies indicated that there were no major effects on skeletal development associated with global Panx3 loss (13,32). Since then, contrasting evidence has emerged from different strains of Panx3−/− mice, in which investigators observed that global loss of Panx3 will affect skeletal development, resulting in smaller mice (35,36). Our current data obtained from aging mice support these findings, with subtle, but statistically significant, reductions in the lengths of the humeri, femora, and tibiae of Panx3−/− mice compared to WT mice. The differences in size and other skeletal features observed in this study were similar to those reported previously in a study by Yorgan et al (37), but were con-siderably milder than those reported in other studies (35,36,38) despite the clear evidence of Panx3 loss in these mice (13,32,39). The reasons for these differences remain unclear but most likely include differences in the genetic background of the mice used, the ages analyzed, and/or the housing conditions. The physio-logic and functional consequences of these differences remain unknown. Nevertheless, the subtle overall phenotype of our Panx3- deficient mice make the severe OA phenotype reported herein all the more remarkable.
In stark contrast to the chondroprotective effect of Panx3 loss in young mice following DMM surgery (13), we observed that global Panx3 loss accelerated cartilage degeneration with aging in the majority of mice. These gross histologic findings were accom-panied by immunohistochemical findings showing changes in the localization of MMP- 13 and type II collagen in the mouse joint tissue with aging.
In addition to these cartilage changes, we saw significant changes in the subchondral bone and synovium. The increases in medial subchondral bone thickness and osteophyte growth in Panx3−/− mice suggest that Panx3 has a critical role in the modu-lation of bone remodeling in primary OA, a process that was previ-ously suggested to accelerate in WT mice following DMM surgery (13). These effects could be related to the previously described role of Panx3 in osteoblast differentiation (11), most notably in osteophyte formation, which proceeds in a manner similar to endochondral ossification.
At age 18 months, a significantly greater proportion of knees from Panx3−/− mice displayed low- grade synovitis and higher synovitis scores in comparison to WT mice. However, at age 24 months, the incidence of low- grade synovitis was simi-lar between the genotypes. This supports the findings from the available literature indicating that aging- associated OA can be linked to various features of inflammation (40), and suggests that earlier stages of aging- associated OA (i.e., in mice at age 18 months) may involve important inflammatory mechanisms that are exaggerated in the absence of Panx3. Furthermore, the decreased histologic severity of synovitis and narrow differences observed between the genotypes of mice at age 24 months could be suggestive of a “burnout” phenotype in late- stage OA, attrib-utable to sustained synovial damage over the lifespan and a loss of positive feedback from cartilage breakdown products resulting
from the near complete loss of articular cartilage (41). The specific role of Panx3 in other joint tissues (bone and synovium) should be the focus of future studies employing tissue- specific Panx3- KO animals. Future studies should also seek to utilize female mice, to identify any phenotypic variation related to sex.
To our knowledge, our studies on the role of Panx3 in OA present the first reported evidence of a gene whose deletion leads to protection against surgically induced OA, but also whose loss has the opposite effect with aging. There have, however, been studies that have shown a protective effect of a specific gene deletion in posttraumatic OA without effects during aging in mice, such as in our investigation of Tgfa- KO mice (42). These data suggest that Panx3 has a complex, context- dependent role in the joint tissues. Interestingly, a similar effect, which is depend-ent on the inflammatory and mechanical environment of the joint, has been described with ATP release. Aberrant mechanical load-ing of cartilage increases ATP release from chondrocytes, which increases MMP- 13 production (43,44). Conversely, reduced ATP or its metabolite, adenosine, also increases MMP- 13 expression (45). In a recent study by Corciulo et al (45), it was shown that treatment of chondrocytes with interleukin- 1β reduced ATP release, decreasing extracellular adenosine production and lead-ing to a decrease in Panx1 gene expression. Additionally, global loss of the adenosine receptor A2AR in mice resulted in early development of OA at age 1 year (45). Conversely, it has been shown that ATP is a key stimulator of Prg4 expression, the gene encoding lubricin (46).
Taken together, the findings of these studies combined with our results seem to indicate that a fine balance in extracellular ATP levels exists with respect to cartilage homeostasis, and that the presence or absence of pannexins contribute to this effect. Too much ATP release results in matrix destruction, but some ATP is required to maintain cartilage health through both purinergic and adenosine receptor signaling (47,48). A similar dualism might exist for pannexins in cartilage, which could explain the differing effects observed in Panx3−/− mice following surgery versus during aging, as pannexins are thought to be the primary channel responsible for cellular ATP release (49,50). This model of a context- specific role of Panx3 and ATP is supported by the differential effects of Panx3 deficiency on lubricin expression in posttraumatic OA ver-sus that in aging- associated OA in our study.
In the broader context, our data suggest that in mice, dif-ferent OA subtypes progress through distinct molecular mech-anisms, and therefore might require different diagnostic and therapeutic strategies. This could also affect clinical trials or other large- scale studies (e.g., genome- wide association studies) that do not stratify for OA subtype, though it is unclear whether this context- dependent heterogeneity in disease pathogenesis affects humans to the same extent as in mice.
In conclusion, this study shows that loss of Panx3 acceler-ates OA during aging, a finding that is in contrast to the previ-ously described role of Panx3 in posttraumatic OA (13), further

Panx3 DELETION AND EFFECTS ON AGING- INDUCED OA | 1187
highlighting the importance of OA subtype in disease progression. These results suggest that Panx3 is required for maintaining joint homeostasis during aging but promotes OA after injury. There-fore, although Panx3 might be a promising target for the treatment of posttraumatic OA, the same cannot be said of its utility in the treatment of primary OA.
AUTHOR CONTRIBUTIONS
All authors were involved in drafting the article or revising it critically for important intellectual content, and all authors approved the final version to be published. Dr. Beier had full access to all of the data in the study and takes responsibility for the integrity of the data and the accuracy of the data analysis.Study conception and design. Moon, Penuela, Beier.Acquisition of data. Moon, Shao, Wambiekele, Appleton.Analysis and interpretation of data. Moon, Appleton, Laird, Penuela, Beier.
REFERENCES 1. Glyn- Jones S, Palmer AJ, Agricola R, Price AJ, Vincent TL, Weinans
H, et al. Osteoarthritis [review]. Lancet 2015;386:376– 87.
2. Felson DT, Lawrence RC, Dieppe PA, Hirsch R, Helmick CG, Jordan JM, et al. Osteoarthritis: new insights. Part 1: the disease and its risk factors. Ann Intern Med 2000;133:635– 46.
3. Cooper C, Snow S, McAlindon TE, Kellingray S, Stuart B, Coggon D, et al. Risk factors for the incidence and progression of radiographic knee osteoarthritis. Arthritis Rheum 2000;43:995– 1000.
4. Felson DT, Zhang Y, Hannan MT, Naimark A, Weissman B, Aliabadi P, et al. Risk factors for incident radiographic knee oste-oarthritis in the elderly: the Framingham Study. Arthritis Rheum 1997;40:728– 33.
5. Verzijl N, DeGroot J, Bank RA, Bayliss MT, Bijlsma JW, Lafeber FP, et al. Age- related accumulation of the advanced glycation end-product pentosidine in human articular cartilage aggrecan: the use of pentosidine levels as a quantitative measure of protein turnover. Matrix Biol 2001;20:409– 17.
6. Buckwalter JA, Mankin HJ, Grodzinsky AJ. Articular cartilage and osteoarthritis [review]. Instr Course Lect 2005;54:465– 80.
7. Bayliss MT, Howat S, Davidson C, Dudhia J. The organization of aggrecan in human articular cartilage: evidence for age- related changes in the rate of aggregation of newly synthesized molecules. J Biol Chem 2000;275:6321– 7.
8. Buckwalter JA, Martin JA. Osteoarthritis [review]. Adv Drug Deliv Rev 2006;58:150– 67.
9. Patel A, Pavlou G, Mújica- Mota RE, Toms AD. The epidemiology of revision total knee and hip arthroplasty in England and Wales: a com-parative analysis with projections for the United States. A study using the National Joint Registry dataset. Bone Joint J 2015;97- B:1076– 81.
10. Hunziker EB. Articular cartilage repair: problems and perspectives. Biorheology 2000;37:163– 4.
11. Bond SR, Lau A, Penuela S, Sampaio AV, Underhill TM, Laird DW, et al. Pannexin 3 is a novel target for Runx2, expressed by osteo-blasts and mature growth plate chondrocytes. J Bone Miner Res 2011;26:2911– 22.
12. Jia HL, Zhou DS. Downregulation of microRNA- 367 promotes oste-oblasts growth and proliferation of mice during fracture by activat-ing the PANX3- mediated Wnt/β- catenin pathway. J Cell Biochem 2018;120:8247– 58.
13. Moon P, Penuela S, Barr K, Khan S, Pin CL, Welch I, et al. Deletion of Panx3 prevents the development of surgically induced osteoarthritis. J Mol Med (Berl) 2015;93:845– 56.
14. Appleton CT, Pitelka V, Henry J, Beier F. Global analyses of gene expression in early experimental osteoarthritis. Arthritis Rheum 2007;56:1854– 68.
15. Brown TD, Johnston RC, Saltzman CL, Marsh JL, Buckwalter JA. Posttraumatic osteoarthritis: a first estimate of incidence, preva-lence, and burden of disease. J Orthop Trauma 2006;20:739– 44.
16. Dare D, Rodeo S. Mechanisms of post- traumatic osteoarthritis after ACL injury [review]. Curr Rheumatol Rep 2014;16:448.
17. Yamamoto K, Shishido T, Masaoka T, Imakiire A. Morphological studies on the ageing and osteoarthritis of the articular cartilage in C57 black mice. J Orthop Surg (Hong Kong) 2005;13:8– 18.
18. Beaucage KL, Pollmann SI, Sims SM, Dixon SJ, Holdsworth DW. Quantitative in vivo micro- computed tomography for assessment of age- dependent changes in murine whole- body composition. Bone Rep 2016;5:70– 80.
19. Beaucage KL, Xiao A, Pollmann SI, Grol MW, Beach RJ, Holdsworth DW, et al. Loss of P2X7 nucleotide receptor function leads to abnor-mal fat distribution in mice. Purinergic Signal 2014;10:291– 304.
20. Pest MA, Russell BA, Zhang YW, Jeong JW, Beier F. Disturbed carti-lage and joint homeostasis resulting from a loss of mitogen- inducible gene 6 in a mouse model of joint dysfunction. Arthritis Rheumatol 2014;66:2816– 27.
21. Appleton CT, Usmani SE, Mort JS, Beier F. Rho/ROCK and MEK/ERK activation by transforming growth factor- α induces articular car-tilage degradation. Lab Invest 2010;90:20– 30.
22. Ratneswaran A, LeBlanc EA, Walser E, Welch I, Mort JS, Borradaile N, et al. Peroxisome proliferator– activated receptor δ promotes the progression of posttraumatic osteoarthritis in a mouse model. Arthritis Rheumatol 2015;67:454– 64.
23. Glasson SS, Chambers MG, van den Berg WB, Little CB. The OARSI histopathology initiative: recommendations for histological assessments of osteoarthritis in the mouse. Osteoarthritis Cartilage 2010;18 Suppl 3:S17– 23.
24. McNulty MA, Loeser RF, Davey C, Callahan MF, Ferguson CM, Carlson CS. A comprehensive histological assessment of osteoar-thritis lesions in mice. Cartilage 2011;2:354– 63.
25. Krenn V, Morawietz L, Burmester GR, Kinne RW, Mueller- Ladner U, Muller B, et al. Synovitis score: discrimination between chronic low- grade and high- grade synovitis. Histopathology 2006;49:358– 64.
26. Penuela S, Bhalla R, Gong XQ, Cowan KN, Celetti SJ, Cowan BJ, et al. Pannexin 1 and pannexin 3 are glycoproteins that exhibit many distinct characteristics from the connexin family of gap junction pro-teins. J Cell Sci 2007;120:3772– 83.
27. Donahoe M. Nutritional support in advanced lung disease: the pulmo-nary cachexia syndrome [review]. Clin Chest Med 1997;18:547– 61.
28. Theologides A. Pathogenesis of cachexia in cancer: a review and a hypothesis [review]. Cancer 1972;29:484– 8.
29. Plauth M, Schutz ET. Cachexia in liver cirrhosis [review]. Int J Cardiol 2002;85:83– 7.
30. Cheung WW, Paik KH, Mak RH. Inflammation and cachexia in chronic kidney disease [review]. Pediatr Nephrol 2010;25:711– 24.
31. Mantovani G, Anker SD, Inui A, Morley JE, Fanelli RF, Scevola F, et al, editors. Cachexia and wasting: a modern approach. Berlin: Springer; 2006.
32. Caskenette D, Penuela S, Lee V, Barr K, Beier F, Laird DW, et al. Global deletion of Panx3 produces multiple phenotypic effects in mouse humeri and femora. J Anat 2016;228:746– 56.
33. Riggs BL, Wahner HW, Dunn WL, Mazess RB, Offord KP, Melton LJ III. Differential changes in bone mineral density of the appendicular and axial skeleton with aging: relationship to spinal osteoporosis. J Clin Invest 1981;67:328– 35.
34. Lexell J. Human aging, muscle mass, and fiber type composition [review]. J Gerontol A Biol Sci Med Sci 1995;50:11– 6.

MOON ET AL 1188 |
35. Oh SK, Shin JO, Baek JI, Lee J, Bae JW, Ankamerddy H, et al. Pannexin 3 is required for normal progression of skeletal develop-ment in vertebrates. FASEB J 2015;29:4473– 84.
36. Ishikawa M, Williams GL, Ikeuchi T, Sakai K, Fukumoto S, Yamada Y. Pannexin 3 and connexin 43 modulate skeletal development through their distinct functions and expression patterns. J Cell Sci 2016;129:1018– 30.
37. Yorgan TA, Peters S, Amling M, Schinke T. Osteoblast- specific expression of Panx3 is dispensable for postnatal bone remodeling. Bone 2019;127:155– 63.
38. Zhang P, Ishikawa M, Rhodes C, Doyle A, Ikeuchi T, Nakamura K, et al. Pannexin- 3 deficiency delays skin wound healing in mice due to defects in channel functionality. J Invest Dermatol 2019;139:909– 18.
39. Abitbol JM, O’Donnell BL, Wakefield CB, Jewlal E, Kelly JJ, Barr K, et al. Double deletion of Panx1 and Panx3 affects skin and bone but not hearing. J Mol Med (Berl) 2019;97:723– 36.
40. Greene MA, Loeser RF. Aging- related inflammation in osteoarthritis [review]. Osteoarthritis Cartilage 2015;23:1966– 71.
41. Davis ES, Wanderling C, Schmitt DR, Liles J, Galicia K, Hoppensteadt D, et al. Synovial fluid analysis in patients with osteoarthritis requiring total joint arthroplasty. World J Surg Surgical Res 2018;1:1025.
42. Usmani SE, Ulici V, Pest MA, Hill TL, Welch ID, Beier F. Context- specific protection of TGFα null mice from osteoarthritis. Sci Rep 2016;6:30434.
43. Leong WS, Russell RG, Caswell AM. Stimulation of cartilage resorp-tion by extracellular ATP acting at P2- purinoceptors. Biochim Biophys Acta 1994;1201:298– 304.
44. Garcia M, Knight MM. Cyclic loading opens hemichannels to release ATP as part of a chondrocyte mechanotransduction pathway. J Orthop Res 2010;28:510– 5.
45. Corciulo C, Lendhey M, Wilder T, Schoen H, Cornelissen AS, Chang G, et al. Endogenous adenosine maintains cartilage homeostasis and exogenous adenosine inhibits osteoarthritis progression. Nat Commun 2017;8:15019.
46. Ogawa H, Kozhemyakina E, Hung HH, Grodzinsky AJ, Lassar AB. Mechanical motion promotes expression of Prg4 in articular cartilage via multiple CREB- dependent, fluid flow shear stress- induced signal-ing pathways. Genes Dev 2014;28:127– 39.
47. Millward- Sadler SJ, Wright MO, Flatman PW, Salter DM. ATP in the mechanotransduction pathway of normal human chondrocytes. Biorheology 2004;41:567– 75.
48. Croucher LJ, Crawford A, Hatton PV, Russell RG, Buttle DJ. Extracellular ATP and UTP stimulate cartilage proteoglycan and col-lagen accumulation in bovine articular chondrocyte pellet cultures. Biochim Biophys Acta 2000;1502:297– 306.
49. Iwamoto T, Nakamura T, Doyle A, Ishikawa M, de Vega S, Fukumoto S, et al. Pannexin 3 regulates intracellular ATP/cAMP levels and pro-motes chondrocyte differentiation. J Biol Chem 2010;285:18948– 58.
50. Dahl G. ATP release through pannexon channels. Philos Trans R Soc Lond B Biol Sci 2015;370:20140191.

1189
Arthritis & RheumatologyVol. 73, No. 7, July 2021, pp 1189–1199DOI 10.1002/art.41644© 2021, American College of Rheumatology
Inflammasome Activation in Ankylosing Spondylitis Is Associated With Gut DysbiosisGiuliana Guggino,1 Daniele Mauro,2 Aroldo Rizzo,3 Riccardo Alessandro,1 Stefania Raimondo,1 Anne- Sophie Bergot,4 M. Arifur Rahman,4 Jonathan J. Ellis,5 Simon Milling,6 Rik Lories,7 Dirk Elewaut,8
Matthew A. Brown,5 Ranjeny Thomas,4 and Francesco Ciccia2
Objective. We undertook this study to evaluate the activation and functional relevance of inflammasome pathways in ankylosing spondylitis (AS) patients and rodent models and their relationship to dysbiosis.
Methods. An inflammasome pathway was evaluated in the gut and peripheral blood from 40 AS patients using quantitative reverse transcriptase–polymerase chain reaction (qRT-PCR), immunohistochemistry (IHC), flow cytometry, and confocal microscopy, and was compared to that of 20 healthy controls and 10 patients with Crohn’s disease. Bacteria was visualized using silver stain in human samples, and antibiotics were administered to HLA– B27– transgenic rats. The NLRP3 inhibitor MCC950 was administered to SKG mice, and ileal and joint tissues were assessed by IHC analysis and real- time qRT-PCR. The role of inflammasome in modulating the interleukin- 23 (IL- 23)/IL- 17 axis was studied ex vivo.
Results. Expression levels of Nlrp3, Nlrc4, and Aim2 were increased in the gut of HLA– B27– transgenic rats and reduced by antibiotic treatment (P < 0.05). In curdlan- treated SKG mice, NLRP3 blockade prevented ileitis and delayed arthritis onset (P < 0.05). Compared to healthy controls, AS patients demonstrated overexpression of NLRP3 (fold induction 2.33 versus 22.2; P < 0.001), NLRC4 (fold induction 1.90 versus 6.47; P < 0.001), AIM2 (fold induction 2.40 versus 20.8; P < 0.001), CASP1 (fold induction 2.53 versus 24.8; P < 0.001), IL1B (fold induction 1.07 versus 10.93; P < 0.001), and IL18 (fold induction 2.56 versus 15.67; P < 0.001) in the ileum, and caspase 1 activity was increased (P < 0.01). The score of adherent and invasive mucosa- associated bacteria was higher in AS (P < 0.01) and correlated with the expression of inflammasome components in peripheral blood mononuclear cells (P < 0.001). NLRP3 expression was associated with disease activity (the Ankylosing Spondylitis Disease Activity Score using the C- reactive protein level) (r2 = 0.28, P < 0.01) and with IL23A expression (r2 = 0.34, P < 0.001). In vitro, inflammasome activation in AS monocytes was paralleled by increased serum levels of IL- 1β and IL- 18. Induction of IL23A, IL17A, and IL22 was IL- 1β– dependent.
Conclusion. Inflammasome activation occurs in rodent models of AS and in AS patients, is associated with dysbiosis, and is involved in triggering ileitis in SKG mice. Inflammasomes drive type III cytokine production with an IL- 1β– dependent mechanism in AS patients.
INTRODUCTION
Ankylosing spondylitis (AS) is a chronic inflammatory dis-ease of unknown origin, mainly affecting the axial skeleton (1). A growing body of evidence indicates that the aberrant activation of the innate immune systems drives inflammatory processes in AS (1). Interleukin- 23 (IL- 23) and IL- 17, both regulators of innate
and adaptive immunity, have been demonstrated to be critical cytokines in AS pathogenesis (2,3), although mechanisms under-lying their overexpression in AS are not entirely understood.
Recently, inflammasome activation has been demonstrated to induce the release of IL- 23 and IL- 17 in human mononuclear cells (4). Inflammasomes are innate immune system receptors and sensors that control the inflammatory response and coordinate
Supported in part by a grant from the MIUR.1Giuliana Guggino, MD, PhD, Riccardo Alessandro, PhD, Stefania
Raimondo, PhD: University of Palermo, Palermo, Italy; 2Daniele Mauro, MD, PhD, Francesco Ciccia, MD, PhD: Università degli Studi della Campania Luigi Vanvitelli, Naples, Italy; 3Aroldo Rizzo, MD: Ospedali Riuniti Villa Sofia- Cervello, Palermo, Italy; 4Anne- Sophie Bergot, PhD, M. Arifur Rahman, PhD, Ranjeny Thomas, MD, PhD: University of Queensland Diamantina Institute and Princess Alexandra Hospital, Brisbane, Queensland, Australia; 5Jonathan J. Ellis, PhD, Matthew A. Brown, MD, PhD: NIHR Guy’s and St. Thomas’ Biomedical Research Centre, London, UK; 6Simon Milling, PhD: University of
Glasgow, Glasgow, UK; 7Rik Lories, MD, PhD: Katholieke Universiteit Leuven, Leuven, Belgium; 8Dirk Elewaut, MD, PhD: Ghent University and VIB-UGent Center for Inflammation Research, Ghent, Belgium.
Drs. Guggino and Mauro contributed equally to this work.No potential conflicts of interest relevant to this article were reported.Address correspondence to Francesco Ciccia, MD, PhD, Università degli Studi
della Campania Luigi Vanvitelli, Dipartimento di Medicina di Precisione, Section of Rheumatology, Naples, Italy. Email: [email protected].
Submitted for publication March 11, 2020; accepted in revised form January 5, 2021.

GUGGINO ET AL 1190 |
antimicrobial host defenses (5). Inflammasomes are activated by pathogen- associated molecular patterns (PAMPs) and damage- associated molecular patterns (DAMPs) following the detection of pathogenic microorganisms and danger signals in cytosol from host cells. Once activated, inflammasomes trigger inflammatory caspase 1, thus inducing proinflammatory cytokines, such as IL- 1β and IL- 18, and pyroptotic cell death.
Dysregulated inflammasome activity has been implicated in hereditary and acquired inflammatory disorders (6). Variations in genes encoding proteins that are directly or indirectly involved in regulating inflammasome activity are associated with AS, includ-ing MEFV, CARD9, CARD15, IRGM, IL1R1, and IL1R2 (reviewed in [7]). Studies on the role of inflammasomes in the pathogenesis of AS have mainly been limited to peripheral blood monocytes (8).
In this study, we aimed to investigate the expression of inflammasome components in inflamed tissues of AS patients and 2 well- documented rodent models of spondyloarthritis: HLA– B27 rats and curdlan- treated SKG mice (reviewed in [9]). Finally, we examined the effect of intestinal bacteria in modulating inflammas-omes and their role in modulating type III cytokines.
PATIENTS AND METHODS
Patients. Thirty- five HLA– B27– positive AS patients ful-filling the New York AS diagnostic criteria (10) and with active disease defined as an AS Disease Activity Score (ASDAS) (11) of ≥2 were enrolled at the University of Palermo. Baseline char-acteristics of the patients and controls are shown in Supple-mentary Table 1, on the Arthritis & Rheumatology website at http://onlin elibr ary.wiley.com/doi/10.1002/art.41644/ abstract. All patients underwent ileocolonoscopy and multiple adjacent ileal mucosal biopsies, independent of the presence of gastroin-testinal symptoms. An additional 10 patients with active Crohn’s disease (CD) were included as positive controls. Thirty sex- and age- matched healthy controls undergoing ileocolonoscopy for diagnostic purposes without evidence of intestinal disease were included as healthy controls. Paired formalin- fixed paraffin- embedded (FFPE) tissue and tissue RNA were prepared from all patients to allow cross- referencing between histologic assess-ments and quantitative reverse transcriptase–polymerase chain reaction (qRT-PCR) gene expression analysis. As previously described, ileal samples obtained from patients with AS were histologically classified into 3 phenotypes: normal gut histology, acute inflammation, and chronic inflammation (12). Histologic scoring is further detailed in Supplementary Methods.
Immunohistochemistry (IHC). After heat- induced anti-gen retrieval, IHC analysis for AIM2, NLRP3, NLRC4, IL- 1β, and IL- 18 was performed on 5- μm paraffin- embedded sections from ileal samples as previously described (13). Primary and second-ary antibodies are shown in Supplementary Table 2 (http://onlin e libr ary.wiley.com/doi/10.1002/art.41644/ abstract).
Confocal microscopy analysis of N- terminal cleavage product of gasdermin D (GSDMD- NT). The accumulation of GSDMD- NT was used as a readout for the occurrence of pyrop-tosis in tissue, as previously described (14). Double immunos-taining was performed using an antibody against GSDMD- NT and DAPI, and the images were evaluated by confocal micros-copy. The membrane localization of GSDMD- NT was assessed by counting the positively stained cells on photomicrographs obtained from 3 random high- power microscopic fields (origi-nal magnification × 400).
Transcriptomic analysis. Sixty- six patients with AS (defined by the modified New York Criteria) and 78 healthy controls with no diagnosed inflammatory disease were recruited for the transcrip-tomic analysis (Supplementary Table 3, http://onlin elibr ary.wiley.com/doi/10.1002/art.41644/ abstract). Human ethics approval was granted by the Princess Alexandra Hospital and the University of Queensland Ethics Committees (ethics nos. Metro South HREC/05/QPAH/221 and UQ 2006000102), and written informed consent was obtained from all participants prior to inclusion in the study. RNA was extracted from peripheral blood mononuclear cells (PBMCs), reverse- transcribed, and prepared for sequencing using an Illumina TruSeq Standard Total RNA Library Prep Kit. Total RNA- sequencing was performed using an Illumina HiSeq 2000, with a mean of 56 million reads per sample. Transcripts were quantified by Salmon (version 0.11.2) (15) using the Ensembl 94 transcript model. Gene level differential expression analysis was performed using DESeq2 (version 1.22.1) (16), correcting for patient sex.
RNA extraction and TaqMan qRT-PCR. Gut samples were stored in RNA- later at −80° until extraction. Total RNA was extracted using a Qiagen RNeasy Mini kit, with on- column DNase I digestion, as previously described (13). Gene expression was quantified by qRT-PCR using TaqMan probes and run on a 7900HT Fast Real- Time PCR System (Life Technologies). Gene expression was normalized against housekeeping genes, namely 18S and GAPDH.
Flow cytometry analysis of surface and intracellular antigens. PBMCs were isolated from 10 AS patients and 10 healthy controls by Ficoll- Paque density gradient centrifugation, as previously described (13). PBMCs were stored in liquid nitro-gen, then thawed, immunostained, and analyzed on a BD LSR Fortessa cytometer. The antibody panel is provided in Supple-mentary Methods (http://onlin elibr ary.wiley.com/doi/10.1002/art.41644/ abstract).
Enzyme- linked immunosorbent assay (ELISA) to assess circulating levels of IL- 1β, lipopolysaccharide (LPS), and IL- 18. IL- 1β, LPS, and IL- 18 were quantified by ELISA (ThermoFisher) in serum that was isolated immediately after col-lection, flash- frozen, and stored at −80°C until analysis. All results

ACTIVATION AND RELEVANCE OF INFLAMMASOME PATHWAYS IN AS | 1191
were analyzed using a 5- parameter logistic function for fitting standard curves obtained from recombinant protein standards.
Isolation and culture of bacteria. Bioptic specimens of the ileum were analyzed for the bacteriologic study. According to Conte et al, the samples were immediately processed to isolate and culture adherent bacteria (17); for further details, see Sup-plementary Methods (http://onlin elibr ary.wiley.com/doi/10.1002/art.41644/ abstract).
Cell cultures. Isolated monocytes from 7 AS patients and 7 controls were incubated with LPS (0.1 μg/ml). The expres-sion of inflammasome components and the cytokines IL- 23, IL- 18, and IL- 1β were quantified by qRT-PCR and the levels of IL- 1β and IL- 18 in the supernatants were measured by ELISA (ThermoFisher).
Fluorometric detection of active cellular caspase 1. A fluorescence- labeled inhibitor specific for caspase 1 (FLICA) was used according to instructions of the manufacturer (Sigma- Aldrich) to determine the caspase 1 activity in isolated lamina propria mon-onuclear cells (LPMCs), PBMCs, and peripheral monocytes. LPMCs were obtained as described by van Damme N et al (18). Further details are provided in Supplementary Methods (http://onlin elibr ary.wiley.com/doi/10.1002/art.41644/ abstract).
HLA– B27– transgenic (Tg) rats. HLA– B*2705– Tg rats of line 33- 3 (B27- Tg) on a Fischer background (F344/NTac- Tg [HLA– B*2705, β2- microglobulin]) (Taconic) were backcrossed with PVG rats (PVG/OlaHsd) (Harlan) for a minimum of 10 generations before being used in experiments. Wild- type PVG/OlaHsd rats were pur-chased from Harlan and bred in- house. Animals were screened by flow cytometry for expression of HLA– B27. Age- matched non-transgenic littermates were used as controls. All procedures were approved by the University of Glasgow Ethical Review Panel and performed under licenses from the UK Home Office under the Ani-mal (Scientific Procedures) Act 1986. Details on animal treatments are reported in Supplementary Methods (http://onlin elibr ary.wiley.com/doi/10.1002/art.41644/ abstract).
SKG mice. Female BALB/c and SKG mice (ZAP- 70w163c- mutant BALB/c mice) (n = 5 per group), originally obtained from S. Sakaguchi (University of Kyoto), were bred and housed under specific pathogen– free or germ- free conditions at the University of Queensland Translational Research Institute Animal Facility under the guidelines of University of Queensland. Mice were kept in a 12- hour light/dark cycle, with food and water provided ad libi-tum. Mice were included in experiments at 8– 12 weeks of age. Approval for all experiments was obtained from the University of Queensland animal ethics committee.
Where indicated, female SKG mice (n = 5 per group based on effect size and variance from previous experiments) were
randomized to receive inflammasome inhibitor MCC950 (0.3 mg/kg, a gift from Avril Robertson, PhD, University of Queens-land, Brisbane, Australia) or vehicle in the drinking water, start-ing 1 day before or 7 days after intraperitoneal administration of 15 mg/ml 1,3- β- glucan (curdlan) in saline. For further details, see Supplementary Methods (http://onlin elibr ary.wiley.com/doi/10. 1002/art.41644/ abstract).
Isolation of murine intestinal cells, RNA extraction, and qRT-PCR. Intraepithelial lymphocytes were isolated from the small intestines (after dissecting Peyer’s patches and fat removal) from BALB/c and SKG mice that were naive to curdlan and those that had been treated for 7 days with curdlan. For further details, see Supplementary Methods (http://onlin elibr ary.wiley.com/doi/10.1002/art.41644/ abstract). Briefly, small intestines were col-lected and cut open longitudinally after removing Peyer’s patches, washed in cold phosphate buffered saline, dissected into 1– 2- cm pieces, and then shaken in Hanks’ balanced salt solution contain-ing 5 mM EDTA for 20 minutes at 37°C. Intraepithelial mononu-clear cells were collected after passing through a 70- μm strainer. Intraepithelial lymphocyte cells were then harvested from the inter-phase of a 40% Percoll gradient after centrifugation at 20°C. Total RNA was isolated using an RNeasy mini kit (Qiagen) and comple-mentary DNA was prepared using a Tetro cDNa synthesis kit (Bio-line). Quantitative RT-PCR for Nlrp3, Nlrc4, Nlrp6, Aim2, Nlrp12, Il18, and Hprt was performed using the SYBR Green technique. Primer sequences are shown in Supplementary Methods. All data are reported as the relative fold change compared to Hprt.
Study approval. The study was conducted according to the Declaration of Helsinki. Consent was obtained from all enrolled subjects after the nature of the investigation was explained and in accordance with the approved protocol from the institutional review board at the University of Palermo, Ghent University, and the University of Queensland. The appropriate institutional review boards at the University of Glasgow and the University of Queens-land approved the animal studies.
Statistical analysis. A nonparametric Mann-Whitney test was used to calculate the statistical significance between groups. Spearman’s rank correlation was used to calculate the correlation between different variables in AS. P values less than 0.05 were considered significant.
RESULTS
Inflammasome activation in the gut of HLA– B27 rats and SKG mice. We first examined the expression of inflammasome- related genes in the gut using 2 models of AS. In the gut of HLA– B27– Tg rats, Nlrp3, Nlrc4, and Aim2 expres-sion was increased and then significantly reduced after antibi-otic treatment (Figure 1), indicating that dysbiosis up- regulates

GUGGINO ET AL 1192 |
Figure 2. Effect of inflammasome inhibition in SKG mice. A and B, Expression levels of Nlrp3 (A) and Il18 (B) in the intestinal intraepithelial (IEL) cells of BALB/c mice and SKG mice that were left untreated or treated with curdlan. C and D, Gut inflammation histologic score and weight loss (C) and visual arthritis score, ankle joint histologic score, and ear histologic score (D) in curdlan- treated SKG mice treated with the NLRP3 inhibitor MCC950 or vehicle (CTRL). E, Flow cytometry quantification of mesenteric lymph node NKp46+ innate lymphoid cells (ILCs), NKp46− ILCs, monocytes, and T cells. Symbols represent individual animals (n = 5 per group); bars show the mean ± SEM. * = P < 0.05; ** = P < 0.001. TCRβ = T cell receptor β.
Figure 1. Up- regulation of inflammasomes in the ileum of HLA– B27– transgenic rats. A, C, and E, Representative images of immunohistochemistry staining performed on wild- type (WT) rats and HLA– B27– transgenic rats that were left untreated or treated with vancomycin and meropenem (HLA–B27+ Abx) for 3 weeks to detect Nlrp3 (A), Nlrc4 (C), and Aim2 (E). Original magnification × 400. B, D, and F, Quantitative analysis of cells positive for NLRP3 (B), NLRC4 (D), and AIM2 (F). Symbols represent individual animals (n = 5 per group); bars show the mean ± SEM. * = P < 0.05.

ACTIVATION AND RELEVANCE OF INFLAMMASOME PATHWAYS IN AS | 1193
the expression of inflammasome components, namely NLRP3, NLRC4, and AIM2 in the ileum.
In the SKG model, among the tested inflammasome com-ponents (Supplementary Figure 1, http://onlin elibr ary.wiley.com/doi/10.1002/art.41644/ abstract), the up- regulation of Nlrp3 and Il18 messenger RNA (mRNA) (Figures 2A and B) was observed in the intraepithelial cells of curdlan- treated SKG mice but not curdlan- treated BALB/c mice. Interestingly, blocking NLRP3 acti-vation with the MCC950 inhibitor just before curdlan treatment in SKG mice suppressed gut disease and prevented weight loss (Figure 2C), but not after treatment (data not shown).
Conversely, in the same curdlan- treated SKG mice, the prophy-lactic blockade of NLRP3 by MCC950 delayed the onset of the articular manifestations, but the difference in arthritic score between treated and untreated groups was lost by day 26 (Figure 2D).
Interestingly, mesenteric lymph node NKp46+ innate lymphoid cells (ILCs) expanded in mice treated with MCC950, while NKp46− ILCs decreased, without any changes in monocytes or T cells (Figure 2E).
Inflammasomes in the gut of patients with AS. Next, inflammasome activation was assessed in the gut of AS patients. A significant increase in the expression of NLRP3, NLRC4, and AIM2 at both the mRNA and protein levels was observed in the inflamed gut of AS patients, especially in those with chronic gut inflammation, and CD patients, compared to healthy controls (Figure 3). NLRP3, NLRC4, and AIM2 protein expression was mainly observed among inflammatory infiltrating mononuclear cells and epithelial cells. Increased expression of other inflammasome- related genes such as NLRC3, NLRP6, and NLRP12 was also observed in AS ileal samples (Supplementary Figure 2,
Figure 3. Expression levels of NLRP3, NLRC4, and AIM2 in ileal tissue from patients with ankylosing spondylitis (AS) and healthy controls (HCs). A and B, Levels of mRNA for NLRP3 (A), and representative immunohistochemical (IHC) analyses for NLRP3, quantified as the number of NLRP3- positive cells/infiltrating cells in gut biopsy samples from AS patients and healthy controls (B). C and D, Levels of mRNA for NLRC4 (C), and representative IHC analyses for NLRC4, quantified as the number of NLRC4- positive cells/infiltrating cells in gut biopsy samples from AS patients and healthy controls (D). E and F, Levels of mRNA for AIM2 (E), and representative IHC analyses for AIM2, quantified as the number of AIM2- positive cells/infiltrating cells in gut biopsy samples from AS patients and healthy controls (F). In B, D, and F, original magnification × 400. Symbols represent individual subjects (n = 35 AS patients and 20 healthy controls); bars show the mean ± SEM. * = P < 0.05 versus healthy controls.

GUGGINO ET AL 1194 |
http://onlin elibr ary.wiley.com/doi/10.1002/art.41644/ abstract). Overexpression of inflammasome components in the gut of AS patients was associated with significantly increased expression of CASP1 mRNA (Figure 4A). Consistently, the use of a fluorochrome- labeled inhibitor peptide that binds specifically the active site of caspase 1 demonstrated increased activation of caspase 1, and in turn inflammasomes, in the frozen section of AS gut and isolated LPMCs (Figures 4B and C). Similarly, in AS- associated chronic gut inflammation, IL1B and IL18 expression was increased at both the mRNA and protein levels (Figures 4D and E).
Inflammasome- related pyroptosis in the gut of patients with AS. Activation of caspase 1 induces the cleavage of human gasdermin D to generate GSDMD- NT that causes pyrop-tosis by forming membrane pores and stimulates the release of inflammatory cytokines (14). The cellular distribution of GSDMD- NT was assessed by confocal microscopy in paraffin- embedded ileal sections using an anti– GSDMD- NT monoclonal antibody. We observed a predominant GSDMD- NT membrane localization in AS patients compared to controls, where it was mainly cytosolic (Figure 4F).
Figure 4. Inflammasome activation in intestinal tissue from patients with ankylosing spondylitis (AS). A, CASP1 relative mRNA levels were assessed by reverse transcriptase– polymerase chain reaction (RT- PCR) in ileal samples obtained from AS patients and healthy controls (HCs). B, Isolated lamina propria mononuclear cells from healthy controls (red) and AS patients (blue) were analyzed with FAM-FLICA staining and flow cytometry. Representative fluorescence histograms are shown. C, Frozen ileal samples from patients with AS were stained for caspase 1 with FAM- FLICA. A representative confocal microscopy image is shown. D, IL1B relative mRNA levels in ileal samples from AS patients and healthy controls were assessed by RT- PCR. Protein expression was assessed by immunohistochemical (IHC) analysis and was quantified as interleukin- 1β (IL- 1β)– positive cells. E, IL18 relative mRNA levels in ileal samples from AS patients and healthy controls were assessed by RT- PCR. Protein expression was assessed by IHC analysis and was quantified as IL- 18– positive cells. F, Gasdermin expression in the gut of AS patients was observed by confocal microscopy, revealing predominance of gasdermin in the gut membrane. Results were quantified as the number of cells expressing gasdermin in the membrane and cytoplasm. In C, D, E, and F, original magnification × 400. Symbols represent individual subjects (n = 35 AS patients and 20 healthy controls); bars show the mean ± SEM. * = P < 0.05; ** = P < 0.001, versus healthy controls.

ACTIVATION AND RELEVANCE OF INFLAMMASOME PATHWAYS IN AS | 1195
Inflammasome activation in AS driven by in flamma-tion. As previously demonstrated (19), AS ileal biopsies featured the presence of adherent and invading bacteria that were scored (data not shown). A significant positive correlation was observed between the intestinal bacterial score and the expression levels of NLRP3, NLRC4, and AIM2 (Supplementary Figures 3A– C, http://onlin e library.wiley.com/doi/10.1002/art.41644/ abstract). Concentrations of mucosa- associated bacteria after the fourth wash and hypotonic lysis from the ileum, caecum, and rectum biopsy specimens from patients with AS and CD were compared to those of controls. In the ileum, total aerobe counts, facultative anaerobe counts, and total gram- negative bacterial counts were significantly higher in
patients with AS, especially in those with chronic gut inflammation (Supplementary Table 3, http://onlin elibr ary.wiley.com/doi/10.1002/art.41644/ abstract). We observed that isolated bacteria from the gut of AS patients (but not controls) led to a significant increase in the expression of NLRP3 and AIM2, but not of NLRC4, in PBMCs iso-lated from healthy controls (Supplementary Figures 3D– F).
Overexpression of inflammasome components in PBMCs from AS patients and association with increased serum IL- 1β and IL- 18 levels. We have previously demon-strated an increased concentration of gut- derived bacterial prod-ucts and immune cells in the systemic circulation of AS patients
Figure 5. Systemic inflammasome activation in patients with AS. A, Concentration of lipopolysaccharide (LPS) in AS and healthy control serum was assessed by enzyme- linked immunosorbent assay (ELISA). B, Real- time quantitative polymerase chain reaction data show expression levels of NLRC4, AIM2, CASP1, NLRP3, IL1B, IL18, and IL23A, plotted as fold induction, versus the mean of healthy controls (n = 35 AS patients and 20 healthy controls). C, Caspase activity in circulating healthy control monocytes (red) and AS monocytes (blue) was assessed by FAM- FLICA staining and flow cytometry. Representative fluorescence histogram and plot of mean fluorescence intensity are shown (n = 5 per group). D, Serum IL- 1β and IL- 18 concentrations in AS patients and healthy controls were measured by ELISA. E and F, Correlation of NLRP3 expression with the AS Disease Activity Score using the C- reactive protein level (ASDAS- CRP) (E) and with expression of IL23A (F) (n = 35 AS patients and 20 healthy controls) is shown. In A– D, symbols represent individual subjects; bars show the mean ± SEM. See Figure 4 for other definitions. Color figure can be viewed in the online issue, which is available at http://onlinelibrary.wiley.com/doi/10.1002/art.41644/abstract.

GUGGINO ET AL 1196 |
as a consequence of leaky gut (19,20). In this study, we confirmed the previously described increased concentration of LPS in the serum of AS patients (Figure 5A). We hypothesized that increased LPS concentration could be responsible for an inflammasome up- regulation in PBMCs from AS patients. For this reason, we per-formed an analysis of gene expression with RNA- Seq of PBMCs obtained from 66 AS patients, demonstrating the overexpres-sion of inflammasome- related genes as highlighted by the sig-nificantly increased expression of NLRP3 (P = 6 × 10⁻⁸), CASP1 (P = 0.006), IL1B (P = 5 × 10⁻¹²), and IL18 (P = 0.00017), as well as the increased expression of NLRC4, although not statistically significant (P = 0.06) (data not shown).
Quantitative RT-PCR next confirmed inflammasome overex-pression in isolated circulating monocytes obtained from an addi-tional 30 AS patients. In isolated unstimulated monocytes, the expression levels of NLRC4, AIM2, and NLRP3 were higher in AS patients compared to controls (Figure 5B). The increased expres-sion of these genes was accompanied by the overexpression of CASP1, IL1B, IL18, and IL23p19. FLICA staining, which binds to active caspase 1, also confirmed the exaggerated inflammasome activation in AS monocytes (Figure 5C). Inflammasome activation in AS monocytes occurred independently of medications (data not shown). Analysis of serum IL- 1β and IL- 18 concentrations in AS patients demonstrated that levels were higher in patients with AS than in controls (Figure 5D).
Interestingly, a significant correlation was found between dis-ease activity as assessed by the ASDAS using the C- reactive pro-tein level (ASDAS- CRP) and NLRP3 (Figure 5E), AIM2 (r2 = 0.3466, P = 0.0018; data not shown), and NLRC4 (r2 = 0.4432, P = 0.0011; data not shown), and between NLRP3 and IL23A (Figure 5F).
We next examined the in vitro effect of LPS on monocytes isolated from AS patients and controls. In vitro, the stimulation of isolated AS monocytes with LPS induced a significant up- regulation of NLRP3, NLRC4, and AIM2, as expected. However, AS monocytes showed hyperresponsiveness to LPS compared to healthy controls (Figures 6A– C).
Inflammasome modulation of IL23, IL17, and IL22 expression through IL- 1β induction. Inflammasomes have recently been demonstrated to modulate the release of IL- 23 and IL- 17 in human monocytes (4). Considering the key role of IL- 23 and IL- 17 in the pathogenesis of AS (1,3), we evaluated the role of inflammasomes in modulating IL- 23 and IL- 17 production. The administration of LPS significantly increased IL23 expres-sion (Figure 6D). To test whether LPS- induced IL23 expression was partially mediated by inflammasome activation, KCl, which is known to block inflammasome activation, was administered. The addition of KCl suppressed IL23 expression, and inhibition was reversed by coincubation with IL- 1β (Figure 6D). Similarly, inflam-masome inhibition significantly reduced the expression of IL17
Figure 6. Role of inflammasomes in mediating IL- 23, IL- 17, and IL- 22 production in AS monocytes. A– C, Lipopolysaccharide (LPS)– induced expression levels of NLRP3 (A), AIM2 (B), and NLRC4 (C) in isolated monocytes from AS patients and healthy controls. D, Effect of inflammasome activation blocking by the addition of KCl on IL23A expression in monocytes from AS patients. E and F, Phorbol myristate acetate (PMA) and ionomycin– induced IL17A (E) and IL22 (F) expression in KCl- treated AS monocytes in the presence or absence of exogenous IL- 1β. Symbols represent individual subjects (n = 5 per group); bars show the mean ± SEM. * = P < 0.05 versus RPMI alone. See Figure 4 for other definitions.

ACTIVATION AND RELEVANCE OF INFLAMMASOME PATHWAYS IN AS | 1197
and IL22 in isolated PBMCs, which was rescued by the addition of IL- 1β (Figures 6E and F).
DISCUSSION
AS is a chronic inflammatory condition characterized by the genetic association with the major histocompatibility complex class I molecule HLA– B27 (1). This association has previously suggested a predominant adaptive immune activation in the pathogenesis of AS. Although a direct role of IL- 1β and IL- 18 in the pathogenesis of AS is still not clear, both ILR1 and IL1R2 are definitively associated with AS (21).
Clinical studies on the IL- 1 receptor antagonist anakinra in AS patients demonstrated contrasting results, suggesting that this agent may not be highly effective in AS (22,23). The pres-ent study demonstrates the following: 1) inflammasome signaling is up- regulated and activated in the inflamed gut of AS patients; 2) dysbiosis drives inflammasome activation in AS; 3) inflammas-ome activation occurs in AS monocytes and is associated with increased serum IL- 1β levels; and 4) inflammasomes modulate IL23, IL17, and IL22 expression through IL- 1β induction.
Inflammasomes are cellular multiprotein complexes mainly associated with innate immune system signaling that, through the activation of caspase 1, induce the maturation of IL- 1β and IL- 18 in their active forms (5). NLRs and AIM2, the most important inflam-masome cytosolic sensors responding to a great variety of endoge-nous and exogenous ligands (5), were overexpressed in the inflamed gut of HLA– B27– Tg rats, in the small intestinal lymphocytes after curdlan treatment in SKG mice, and in AS and CD patients.
Interestingly, the level of expression of inflammasome com-ponents was higher in the intestine of patients with AS compared to those with CD, especially in those with chronic gut inflammation where higher bacterial loads were observed. This observation may support the hypothesis of a disease- specific (possibly bacteria- dependent) inflammasome activation in AS, rather than an unspe-cific effect linked to the presence of an intestinal inflammation. AS patients and CD patients have been shown to have a differ-ent microbiome composition and this might be, at least in part, responsible for different degrees of inflammasome activation. We cannot exclude that disease- related factors might also be respon-sible for the differences observed. Beyond the overexpression of inflammasome components, inflammasome activation is known to trigger cleavage, activation, and secretion of proinflammatory IL- 1β and IL- 18, which in turn activate multiple cells aiming to increase the antimicrobial program and initiate the Th1 and Th17 responses (24).
The functional relevance of inflammasome overexpression in the gut of AS patients is supported by demonstrating the activa-tion of caspase 1 in the inflamed gut associated with the increased expression IL- 1β and IL- 18. Activation of caspase 1 also induces human gasdermin D cleavage to generate pore- forming GSD-MD- NT that triggers pyroptosis, a highly inflammatory form of
programmed cell death. Pyroptosis amplifies the inflammatory process, initiating the secretion of inflammatory cytokines and releasing the intracellular content providing a high load of DAMPs (25). Tissue analysis of GSDMD- NT, assessed by confocal micros-copy in paraffin- embedded ileal sections, showed a significant shift in GSDMD- NT from a cytosolic to a membrane localization, confirming the occurrence of pyroptosis in AS patients (14).
The findings of the present study do not clarify the causes of activation of the inflammasome pathway. It cannot be ruled out that, in an autoinflammatory manner, genetic factors predis-posing to the disease may be associated, per se, with a greater expression and activation of this pathway. On the other hand, it is plausible that genetic predisposition may significantly influence the host’s immune responses to environmental factors, particularly the capacity of pathogenic and nonpathogenic microorganisms to trigger inflammasome activation after breaching the epithelial barrier.
In this regard, intestinal dysbiosis observed in AS and rodent models (26) is relevant to modulation of innate immune responses. Although a direct pharmacologic action on innate intestinal immune mechanisms cannot be excluded, the effect of antibiotics on the expression of inflammasome compo-nents in the gut of HLA– B27– Tg rats suggests that an altered composition of the intestinal flora may be responsible for the innate immune activation present in the intestine of patients with AS.
Consistent with this idea, isolated ileal bacteria from AS ileum significantly increased the expression levels of NLRP3 and AIM2 in isolated PBMCs. Interestingly, no significant modulation of NLRC4 was observed in in vitro studies. The NLRC4 inflammasome relies on NLR family apoptosis inhibitory proteins (NAIPs) to sense bac-terial components in the cytosol (27). The difficulty in activating NLRC4 in in vitro studies has been shown in other work such as that from Karki et al (28), in which there was no significant induc-tion of Naips in vitro in response to infection. The demonstration of the strong positive correlation between the bacterial scores and the expression levels of NLRP3, AIM2, and NLRC4 further sup-ports this hypothesis, together with the finding that inflammasome expression was induced by isolated bacteria from the gut of AS patients.
Although in human AS patients and B27 rats, it is not clear whether the inflammasome activation is a consequence or a cause of the intestinal inflammation, we demonstrate that the NLRP3 inflammasome inhibitor MCC950 suppresses the onset of intestinal inflammation in SKG mice when introduced before (but not after) the administration of curdlan. These data strongly suggest that curdlan stimulates NLRP3 inflammasome activation by enhancing host– bacteria interaction (29), which is required to trigger intestinal inflammation (30). The delayed onset of arthritis further suggests its initial dependence on inflammasome activa-tion. Once triggered, intestinal inflammation is no longer suscepti-ble to inflammasome inhibition due to reliance on other mediators

GUGGINO ET AL 1198 |
such as IL- 17 (31). Interestingly, MCC950 expanded natural cyto-toxicity receptor (NCR)– positive but not NCR- negative ILC3s. In this regard, NCR- positive ILC3s have been shown to be impor-tant in controlling colonic infection with Citrobacter rodentium in the presence of T cells and are essential for cecal homeostasis in mice (32).
Their expansion by MCC950 may contribute to intestinal protection due to improved bacterial control in curdlan- treated SKG mice. Studies of dysbiosis in MCC950- treated curdlan- naive SKG mice would be of interest.
As a consequence of gut inflammation, alteration of gut– epithelial and gut– vascular barriers occurs in AS and contributes to the translocation of bacterial products such as LPS, intestinal fatty acid binding protein, and LPS binding protein into the blood-stream (19). The increased level of LPS in AS serum seems to be relevant in modulating the systemic innate immune response. In AS, the chronic circulating monocyte exposure to serum LPS induced an anergic phenotype by down- regulating the expres-sion of CD14 and reduced the expression of HLA– DR (19). LPS has been demonstrated to prime the inflammasome pathway (33). Consistent with this evidence, LPS could be one of the key determinants of inflammasome up- regulation in AS monocytes. Accordingly, inflammasome priming was observed in circulating unstimulated PBMCs from AS patients by RNA- Seq and con-firmed in isolated AS monocytes, where a significant correlation between NLRP3 expression and disease activity as assessed by ASDAS- CRP was found. The functional relevance of the increased expression of inflammasomes in AS monocytes is further sup-ported by showing caspase 1 activation in circulating monocytes in AS and increased serum levels of IL- 1β and IL- 18.
Innate immune activation has been shown to predominate in AS patients with IL- 23– dependent production of IL- 22 and IL- 17 by innate immune cells (13,34,35). Here, we have demon-strated that inflammasome activation might be responsible for the production of IL- 23 in AS monocytes and of IL- 17 and IL- 22 in PBMCs in an IL- 1β– dependent, IL- 23– independent manner. The possibility that innate immune mechanisms independent of IL- 23 operate in modulating type III immunity in AS could suggest a relatively important role for IL- 23 in maintaining the inflamma-tory process in AS. This was also indicated by murine studies in which IL- 23 was fundamental for initiation but not for mainte-nance of the disease (36). We demonstrated, via in vitro experi-ments, that blocking inflammasomes by incubating PBMCs with KCl, which is known to inhibit inflammasome activation (37), sig-nificantly reduced the expression of IL23 induced by LPS and of IL17 and IL22 induced by phorbol myristate acetate and iono-mycin. This effect seems to be specifically mediated by IL- 1β, since the addition of recombinant IL- 1β to isolated monocytes was able to restore the production despite the inflammasome blockade.
In conclusion, we have provided the first demonstration that inflammasome activation occurs in the gut of AS patients,
potentially being a critical inflammatory pathway involved in the pathogenesis of gut inflammation and proinflammatory type III cytokine production.
AUTHOR CONTRIBUTIONS
All authors were involved in drafting the article or revising it critically for important intellectual content, and all authors approved the final version to be published. Dr. Ciccia had full access to all of the data in the study and takes responsibility for the integrity of the data and the accuracy of the data analysis.Study conception and design. Guggino, Mauro, Rizzo, Alessandro, Brown, Thomas, Ciccia.Acquisition of data. Guggino, Mauro, Rizzo, Alessandro, Raimondo, Bergot, Rahman, Ellis, Milling, Elewaut, Brown, Thomas, Ciccia.Analysis and interpretation of data. Guggino, Mauro, Lories, Ciccia.
REFERENCES 1. Taurog JD, Chhabra A, Colbert RA. Ankylosing spondylitis and axial
spondyloarthritis. N Engl J Med 2016;374:2563– 74.
2. Ciccia F, Bombardieri M, Principato A, Giardina A, Tripodo C, Porcasi R, et al. Overexpression of interleukin- 23, but not interleukin- 17, asan immunologic signature of subclinical intestinal inflammation inankylosing spondylitis. Arthritis Rheum 2009;60:955– 65.
3. Sherlock JP, Joyce- Shaikh B, Turner SP, Chao CC, Sathe M,Grein J, et al. IL- 23 induces spondyloarthropathy by acting onROR- γt+ CD3+CD4−CD8− entheseal resident T cells. Nat Med2012;18:1069– 76.
4. Cowardin CA, Kuehne SA, Buonomo EL, Marie CS, Minton NP,Petri WA. Inflammasome activation contributes to interleukin- 23production in response to Clostridium difficile. mBio 2015;6:e02386.
5. Lamkanfi M, Dixit VM. Mechanisms and functions of inflammasomes [review]. Cell 2014;157:1013– 22.
6. Yang CA, Chiang BL. Inflammasomes and human autoimmunity: acomprehensive review [review]. J Autoimmun 2015;61:1– 8.
7. Li Z, Brown MA. Progress of genome- wide association studies ofankylosing spondylitis [review]. Clin Transl Immunol 2017;6:e163.
8. Kim SK, Cho YJ, Choe JY. NLRP3 inflammasomes and NLRP3inflammasome- derived pro- inflammatory cytokines in peripheralblood mononuclear cells of patients with ankylosing spondylitis. ClinChim Acta 2018;486:269– 74.
9. Rahman MA, Thomas R. The SKG model of spondyloarthritis[review]. Best Pract Res Clin Rheumatol 2017;31:895– 909.
10. Van der Linden S, Valkenburg HA, Cats A. Evaluation of diagnosticcriteria for ankylosing spondylitis: a proposal for modification of theNew York criteria. Arthritis Rheum 1984;27:361– 8.
11. Lukas C, Landewé R, Sieper J, Dougados M, Davis J, Braun J,et al. Development of an ASAS- endorsed disease activity score(ASDAS) in patients with ankylosing spondylitis. Ann Rheum Dis2009;69:18– 24.
12. De Vos M, Mielants H, Cuvelier C, Elewaut A, Veys E. Long- termevolution of gut inflammation in patients with spondyloarthropathy.Gastroenterology 1996;110:1696– 703.
13. Ciccia F, Guggino G, Rizzo A, Saieva L, Peralta S, Giardina A,et al. Type 3 innate lymphoid cells producing IL- 17 and IL- 22 areexpanded in the gut, in the peripheral blood, synovial fluid and bonemarrow of patients with ankylosing spondylitis. Ann Rheum Dis2015;74:1739– 47.
14. Liu X, Zhang Z, Ruan J, Pan Y, Magupalli VG, Wu H, et al.Inflammasome- activated gasdermin D causes pyroptosis by forming membrane pores. Nature 2016;535:153– 8.

ACTIVATION AND RELEVANCE OF INFLAMMASOME PATHWAYS IN AS | 1199
15. Patro R, Duggal G, Love MI, Irizarry RA, Kingsford C. Salmon pro-vides fast and bias- aware quantification of transcript expression. Nat Methods 2017;14:417– 9.
16. Love MI, Huber W, Anders S. Moderated estimation of fold change and dispersion for RNA- seq data with DESeq2. Genome Biol 2014;15:550.
17. Conte MP, Schippa S, Zamboni I, Penta M, Chiarini F, Seganti L, et al. Gut- associated bacterial microbiota in paediatric patients with inflammatory bowel disease. Gut 2006;55:1760– 7.
18. Van Damme N, De Vos M, Baeten D, Demetter P, Mielants H, Verbruggen G, et al. Flow cytometric analysis of gut mucosal lym-phocytes supports an impaired Th1 cytokine profile in spondyloar-thropathy. Ann Rheum Dis 2001;60:495– 9.
19. Ciccia F, Guggino G, Rizzo A, Alessandro R, Luchetti MM, Milling S, et al. Dysbiosis and zonulin upregulation alter gut epithelial and vascular barriers in patients with ankylosing spondylitis. Ann Rheum Dis 2017;76:1123– 32.
20. Guggino G, Rizzo A, Mauro D, Macaluso F, Ciccia F. Gut- derived CD8+ tissue- resident memory T cells are expanded in the peripheral blood and synovia of SpA patients [letter]. Ann Rheum Dis 2019 doi: 10.1136/annrheumdis-2019-216456. E- pub ahead of print.
21. Cortes A, Hadler J, Pointon JP, Robinson PC, Karaderi T, Leo P, et al. Identification of multiple risk variants for ankylosing spondylitis through high- density genotyping of immune- related loci. Nat Genet 2013;45:730– 8.
22. Tan AL, Marzo- Ortega H, O’Connor P, Fraser A, Emery P, McGonagle D. Efficacy of anakinra in active ankylosing spondylitis: a clinical and magnetic resonance imaging study. Ann Rheum Dis 2004;63:1041– 5.
23. Haibel H, Rudwaleit M, Listing J, Sieper J. Open label trial of anak-inra in active ankylosing spondylitis over 24 weeks. Ann Rheum Dis 2005;64:296– 8.
24. Lasigliè D, Traggiai E, Federici S, Alessio M, Buoncompagni A, Accogli A, et al. Role of IL- 1 β in the development of human TH17 cells: les-son from NLPR3 mutated patients. PLoS One 2011;6:e20014.
25. Mullen LM, Chamberlain G, Sacre S. Pattern recognition receptors as potential therapeutic targets in inflammatory rheumatic disease [review]. Arthritis Res Ther 2015;17:122.
26. Asquith MJ, Stauffer P, Davin S, Mitchell C, Lin P, Rosenbaum JT. Perturbed mucosal immunity and dysbiosis accompany clin-ical disease in a rat model of spondyloarthritis. Arthritis Rheumatol 2016;68:2151– 62.
27. Zhao Y, Shao F. The NAIP- NLRC4 inflammasome in innate immune detection of bacterial flagellin and type III secretion apparatus [review]. Immunol Rev 2015;265:85– 102.
28. Karki R, Lee E, Place D, Samir P, Mavuluri J, Sharma BR, et al. IRF8 regulates transcription of NAIPs for NLRC4 inflammasome activa-tion. Cell 2018;173:920– 33.
29. Ruutu M, Thomas G, Steck R, Degli- Esposti MA, Zinkernagel MS, Alexander K, et al. β- glucan triggers spondylarthritis and Crohn’s disease– like ileitis in SKG mice. Arthritis Rheum 2012;64:2211– 22.
30. Rehaume LM, Mondot S, Aguirre de Cárcer D, Velasco J, Benham H, Hasnain SZ, et al. ZAP- 70 genotype disrupts the relationship between microbiota and host, leading to spondyloarthritis and ileitis in SKG mice. Arthritis Rheumatol 2014;66:2780– 92.
31. Benham H, Rehaume LM, Hasnain SZ, Velasco J, Baillet AC, Ruutu M, et al. Interleukin- 23 mediates the intestinal response to microbial β- 1,3- glucan and the development of spondyloarthritis pathology in SKG mice. Arthritis Rheumatol 2014;66:1755– 67.
32. Rankin LC, Girard- Madoux MJ, Seillet C, Mielke LA, Kerdiles Y, Fenis A, et al. Complementarity and redundancy of IL- 22- producing innate lymphoid cells. Nat Immunol 2016;17:179– 86.
33. Ghonime MG, Shamaa OR, Das S, Eldomany RA, Fernandes- Alnemri T, Alnemri ES, et al. Inflammasome priming by lipopolysac-charide is dependent upon ERK signaling and proteasome function. J Immunol 2014;192:3881– 8.
34. Gracey E, Qaiyum Z, Almaghlouth I, Lawson D, Karki S, Avvaru N, et al. IL- 7 primes IL- 17 in mucosal- associated invariant T (MAIT) cells, which contribute to the Th17- axis in ankylosing spondylitis. Ann Rheum Dis 2016;75:2124– 32.
35. Kenna TJ, Davidson SI, Duan R, Bradbury LA, McFarlane J, Smith M, et al. Enrichment of circulating interleukin- 17– secreting interleu-kin- 23 receptor– positive γ/δ T cells in patients with active ankylosing spondylitis. Arthritis Rheum 2012;64:1420– 9.
36. Van Tok MN, Na S, Lao CR, Alvi M, Pots D, van de Sande MG, et al. The initiation, but not the persistence, of experimental spon-dyloarthritis is dependent on interleukin- 23 signaling. Front Immunol 2018;9:1550.
37. Muñoz- Planillo R, Kuffa P, Martínez- Colón G, Smith BL, Rajendiran TM, Núñez G. K+ efflux is the common trigger of NLRP3 inflammas-ome activation by bacterial toxins and particulate matter. Immunity 2013;38:1142– 53.

1200
Arthritis & RheumatologyVol. 73, No. 7, July 2021, pp 1200–1210DOI 10.1002/art.41653© 2021, American College of Rheumatology
Mediation of Interleukin- 23 and Tumor Necrosis Factor– Driven Reactive Arthritis by Chlamydia- Infected Macrophages in SKG MiceXavier Romand,1 Xiao Liu,2 M. Arifur Rahman,2 Zaied Ahmed Bhuyan,3 Claire Douillard,1 Reena Arora Kedia,2 Nathan Stone,2 Dominique Roest,2 Zi Huai Chew,2 Amy J. Cameron,2 Linda M. Rehaume,2 Aurélie Bozon,1 Mohammed Habib,1 Charles W. Armitage,4 Minh Vu Chuong Nguyen,1 Bertrand Favier,1 Kenneth Beagley,5 Max Maurin,1 Philippe Gaudin,1 Ranjeny Thomas,2 Timothy J. Wells,2 and Athan Baillet1
Objective. ZAP- 70W163C BALB/c (SKG) mice develop reactive arthritis (ReA) following infection with Chlamydia muridarum. Since intracellular pathogens enhance their replicative fitness in stressed host cells, we examined how myeloid cells infected with C muridarum drive arthritis.
Methods. SKG, Il17a- deficient SKG, and BALB/c female mice were infected with C muridarum or C muridarum luciferase in the genitals. C muridarum dissemination was assessed by in vivo imaging or genomic DNA amplification. Macrophages were depleted using clodronate liposomes. Anti– tumor necrosis factor (anti- TNF) and anti– interleukin- 23p19 (anti– IL- 23p19) were administered after infection or arthritis onset. Gene expression of Hspa5, Tgtp1, Il23a, Il17a, Il12b, and Tnf was compared in SKG mice and BALB/c mice.
Results. One week following infection with C muridarum, macrophages and neutrophils were observed to have infiltrated the uteri of mice and were also shown to have carried C muridarum DNA to the spleen. C muridarum load was higher in SKG mice than in BALB/c mice. Macrophage depletion was shown to reduce C muridarum load and prevent development of arthritis. Compared with BALB/c mice, expression of Il23a and Il17a was increased in the uterine and splenic neutrophils of SKG mice. The presence of anti– IL- 23p19 during infection or Il17a deficiency suppressed arthritis. Tnf was overexpressed in the joints of SKG mice within 1 week postinfection, and persisted beyond the first week. TNF inhibition during infection or at arthritis onset suppressed the development of arthritis. Levels of endoplasmic reticulum stress were constitutively increased in the joints of SKG mice but were induced, in conjunction with immunity- related GTPase, by C muridarum infection in the uterus.
Conclusion. C muridarum load is higher in SKG mice than in BALB/c mice. Whereas proinflammatory IL- 23 produced by neutrophils contributes to the initiation of C muridarum– mediated ReA, macrophage depletion reduces C muridarum dissemination to other tissues, tissue burden, and the development of arthritis. TNF inhibition was also shown to suppress arthritis development. Our data suggest that enhanced bacterial dissemination in macrophages of SKG mice drives the TNF production needed for persistent arthritis.
Supported by the National Health and Medical Research Council of Australia (grant 1071822) and by unrestricted grants from Pfizer (Passerelle grant), UCB (Sirius grant), and Chugai. Drs. Romand and Douillard’s work was supported by the Société Française de Rhumatologie. Dr. Liu’s work was supported by an Arthritis Queensland Fellowship. Dr. Rehaume’s work was supported by a University of Queensland Postdoctoral Fellowship. Dr. Thomas’s work was supported by Arthritis Queensland and by a National Health and Medical Research Council of Australia Senior Research Fellowship.
1Xavier Romand, MD, Claire Douillard, MD, Aurélie Bozon, PhD, Mohammed Habib, PhD, Minh Vu Chuong Nguyen, PhD, Bertrand Favier, PhD, Max Maurin, MD, PhD, Philippe Gaudin, MD, PhD, Athan Baillet, MD, PhD: Université Grenoble Alpes, GREPI TIMC- IMAG, UMR 5525, Grenoble, France; 2Xiao Liu, PhD, M. Arifur Rahman, PhD, Reena Arora Kedia, MSc, Nathan Stone, BSc, Dominique Roest, MSc, Zi Huai Chew, BSc, Amy J. Cameron, BBiomedSc, Linda M. Rehaume, PhD, Ranjeny Thomas, MBBS, MD,
Timothy J. Wells, PhD: University of Queensland Diamantina Institute and Princess Alexandra Hospital, Brisbane, Queensland, Australia; 3Zaied Ahmed Bhuyan, PhD: University of Queensland Diamantina Institute and Princess Alexandra Hospital, Brisbane, Queensland, Australia, and North South University, Dhaka, Bangladesh; 4Charles W. Armitage, PhD: Queensland University of Technology, Brisbane, Queensland, Australia, and King’s College London, London, UK; 5Kenneth Beagley, PhD: Queensland University of Technology, Brisbane, Queensland, Australia.
Drs. Romand and Liu contributed equally to this work. Drs. Thomas, Wells, and Baillet contributed equally to this work.
No potential conflicts of interest relevant to this article were reported.Address correspondence to Athan Baillet, MD, PhD, CHU Grenoble Alpes,
Avenue de Kimberley, Rheumatology Department, Echirolles Cedex 38434, France. Email: [email protected].
Submitted for publication April 20, 2020; accepted in revised form January 7, 2021.

CHLAMYDIA- INFECTED MACROPHAGES AND ReA IN SKG MICE | 1201
INTRODUCTION
Chlamydia- induced reactive arthritis (ReA) belongs to the spondyloarthritis (SpA) group of diseases. ReA occurs in 4– 15% of Chlamydia trachomatis infections (1). Chlamydia is the most common cause of ReA overall. Clinical features typically include enthesitis, peripheral arthritis, inflammation of the axial skeleton, conjunctivitis, and a psoriasis- like skin rash. Symptoms develop a few weeks after infection, which can be silent, partially explain-ing why ReA remains underdiagnosed. The mechanisms of ReA induction and persistence are not fully understood. However, new insights were made with the discovery that ZAP70W163C- mutant BALB/c (SKG) mice develop features of human ReA 5 weeks after Chlamydia muridarum infection, a mouse- adapted C trachomatis– related pathogen (2).
The SKG ZAP70 mutation results in attenuated T cell recep-tor signaling, promoting a state of relative immunodeficiency. The development of C muridarum– induced ReA has been found to be associated with deficient pathogen control attributable to major outer membrane protein (MOMP)– specific interferon- γ (IFNγ)– and interleukin- 17 (IL- 17)– producing CD4+ T cells and increased T cell tumor necrosis factor (TNF) production (2). The extent of arthritis development varies according to the type of infection with live pathogen and is dependent on the dose of the pathogen (2).
Macrophages and neutrophils are thought to play an important role in ReA, through the systemic dissemination of proinflammatory Chlamydia pneumoniae and C trachomatis pathogen- associated inflammatory molecules (PAMPs) (3). Chla-mydia may paralyze neutrophil pathogen control mechanisms, such as extracellular trap formation (4). Toll- like receptor (TLR)– stimulated macrophages are substantial producers of IL- 23 in SpA, whereas neutrophils produce IL- 23 in inflammatory bowel disease (5– 8). IL- 23 is a critical cytokine for the maintenance of Th17 cells and for the stimulation of other proinflammatory cytokine production in SpA (9). In HLA– B27– positive patients with SpA and HLA– B27– transgenic rats, endoplasmic reticulum (ER) stress may favor macrophage and dendritic cell (DC) production of IL- 23 in the presence of TLR ligands (6,10). Furthermore, Sal-monella enterica, an ReA- associated pathogen, was shown to exploit ER stress in HLA– B27– expressing cells to promote its own intracellular replication (11).
Autophagy, a highly conserved process that recycles defec-tive organelles and nonfunctional proteins and contributes to the control of intracellular microorganisms, was shown to contribute to intestinal IL- 23 production in ankylosing spondylitis (AS) (12). Of interest, autophagy sequesters the NF- κB regulatory protein A20, promoting proinflammatory cytokine and chemokine pro-duction (13). IFN- inducible immunity- related GTPase (IRG) pro-teins are required for control of intracellular bacterial infection (14). IRG proteins are recruited into Chlamydia inclusions and restrict
Chlamydia replication by routing inclusions to the lysosome and inducing autophagy (15,16).
Given that C muridarum burden and its immune control are critical for the development and persistence of arthritis in SKG mice, and that intracellular pathogens enhance their own replicative fitness in stressed host cells, we examined how mac-rophages and neutrophils in SKG mice infected with C muridarum contributed to development of C muridarum– induced ReA.
MATERIALS AND METHODS
Mice. Female BALB/c mice, SKG mice (ZAP- 70w163c– mutant BALB/c mice), and IL- 17−/− SKG mice were bred and maintained at the Universities of Queensland (Australia) and Grenoble- Alpes (France; agreement C3851610006). BALB/c– JRj mice were obtained from Janvier Labs. Mice ages 6– 10 weeks were main-tained under specific pathogen– free conditions (4– 6 mice per conventional cage) in an animal facility with controlled humidity of 50% (±20%) and controlled temperature of 21℃ (±2℃) on a 12- hour light/dark cycle with ad libitum access to food and water. Neither SKG mice nor IL- 17−/− SKG mice developed spontaneous disease under these conditions. Animal studies were conducted in accordance with the European Directive 2010/63/EU, and exper-imental procedures were approved by the Ethics Committees at the French Research Ministry (7781- 201611251629264v1) and the University of Queensland (UQDI/467/12/NHMRC).
Chlamydia muridarum bacteria. The same strain of C muridarum (Weiss strain) was used for all experiments, grown, and purified as previously described (2). C muridarum (Weiss strain) expressing luciferase and a green fluorescent protein plas-mid, pGFP- Luc- Cmu, was engineered as previously described (17). A plasmid- deficient strain of C muridarum (Nigg strain), gen-erated by treatment with novobiocin, was a generous gift from Dr. Catherine O’Connell (University of North Carolina at Chapel Hill) (18). Chlamydial vaginal load was determined by direct inoc-ulation of vaginal swab samples onto McCoy cell monolayers as previously described (2). C muridarum DNA was detected using the primers 5′- GGAGCAAATCCTCAAAGCTG- 3′ and 5′- ATCCCAGTCATCAGCCTCAC- 3′, with levels quantified using SYBR green fluorescence. C muridarum gene copy number per cell was calculated by dividing the C muridarum gene copy num-ber by the number of sorted cells.
Infection of SKG mice. Mice ages 6– 10 weeks were primed with a subcutaneous injection of 2.5 mg of medroxy-progesterone acetate (Pfizer) 1 week before infection and then infected with 7.10 × 10³ to 1.10 × 10⁶ inclusion- forming units (IFU) of C muridarum intravaginally, as previously described (2). Infected and noninfected mice were placed in different cages and handled separately to avoid cross- contamination.

ROMAND ET AL 1202 |
Clinical and histopathologic assessment. Paw swell-ing, the primary experimental outcome, was evaluated by the same observers (X. Romand and A. Bozon) for 12 weeks post-infection by measuring the thickness of hind paws with a digital caliper, and the paw inflammation index (paw swelling varia-tion from baseline) was calculated as described previously (2). Mouse joints were fixed in 10% formalin at week 12, embedded in paraffin, and stained with hematoxylin and eosin. Three inde-pendent readers (X. Romand, A. Bozon, and C. Douillard) who were blinded with regard to the selection of mice for each treat-ment group examined the skin and joint staining and assigned a histologic score for inflammation on a scale of 0– 5 (2).
In vivo imaging. BALB/c and SKG mice were infected intravaginally with 2.10 × 10⁵ IFU of pGFP– Luc- Cmu. Mice were imaged 1 week postinfection, as previously described (17), using a Xenogen IVIS imaging system (PerkinElmer). Intensity of bioluminescence was analyzed using Living Image software (PerkinElmer).
Anti– C muridarum MOMP antibody measurement. Anti- Chlamydia MOMP IgG and IgA antibodies were measured in serum of infected mice 12 weeks postinfection by enzyme- linked immunosorbent assay (ELISA), as previously described (2).
Macrophage depletion. Macrophages were depleted by intraperitoneal injection of liposomal clodronate (Liposoma). Upon C muridarum infection, mice received an initial clodronate dose of 2 mg per 20 gm of mouse body weight, followed by weekly injec-tions of 1 mg per 20 gm of mouse body weight, for 12 weeks (n = 7 mice analyzed). The control group was injected with phos-phate buffered saline (PBS) liposomes (n = 7 mice analyzed).
Anti- TNF, anti– IL- 23p19, and antibiotics treatment. Mice were treated with subcutaneous injections of anti- mouse TNF antibody (2 mg/kg/week of mouse- adapted certolizumab pegol antibody PEGylated Fab with 40- kd Nektar PEG (product no. CA156- 00501; UCB) (n = 18 mice), subcutaneous injec-tions of etanercept (4.5 mg/kg/3 days) (Pfizer) (n = 18 mice), or intraperitoneal injections of anti- mouse IL- 23p19 antibody (60 µg/week) (product no. LSN2479016; Eli Lilly and Company) (n = 17 mice) from week 1 (at infection) to week 12 or from week 5 (disease onset) to week 12. The control groups were injected with PBS or isotype controls (n = 8– 13 mice per exper-iment). In addition, 0.4 mg/day of rifampin (Sanofi- Aventis) and 0.3 mg/day of doxycycline (by gavage; Alphapharm) was administered in 11 mice from week 7 through week 9 postin-fection. Adverse events and experimental groups are described in Supplementary Table 1, available on the Arthritis & Rheuma-tology website at http://onlin elibr ary.wiley.com/doi/10.1002/art. 41653/ abstract.
Isolation of uterine and splenic mononuclear cells and neutrophils. Genital tracts and spleens from C muridarum– infected mice were collected 7 days postinfection for cell iso-lation (Supplementary Methods, available on the Arthritis & Rheumatology website at http://onlin elibr ary.wiley.com/doi/10. 1002/art.41653/ abstract). Cells were used in flow cytometry or for myeloid cell isolation by Histopaque gradient technique (Sigma). Macrophages (MHCII+CD11c+CX3CR1+), dendritic cells (MHCII+CD11c+CD103+), neutrophils (MHCII−CD11b+Ly- 6G+), and lymphocytes (CD3+) were sorted with a BD FACSAria Fusion Sorter (BD Biosciences) or MoFlo Astrios EQ Sorter (Beckman Coulter).
Flow cytometry analysis. Cells were treated with anti- CD16/CD32 antibodies, and then stained with Live/Dead Fixable Aqua Dead Cell Stain Kit and with the following anti-bodies: allophycocyanin (APC)– conjugated anti- mouse CD45.2 (clone 104), Pacific Blue– conjugated anti- mouse I- A/I- E (clone M5/114.15.2), PerCP– Cy5.5– conjugated anti- mouse Ly- 6G (clone 1A8), Alexa Fluor 700– conjugated anti- mouse CD11b (clone M1/70), APC/Cy7– conjugated anti- mouse CD11c (clone N418), fluorescein isothiocyanate (FITC)– conjugated anti- mouse CX3CR1 (clone SA011F11), phycoerythrin (PE)– conjugated anti- mouse CD103 (clone 2E7), and FITC- conjugated anti- mouse CD3 (clone 17A2) (all from BioLegend), adapting a method identifying intestinal myeloid populations (7). Cell numbers were enumerated using Flow- Count Fluorospheres (Beckman Coulter) as previously described (19). Data were acquired on an LSRII Fortessa X20 flow cytometer (BD Biosciences) (Supplementary Methods [http://onlin elibr ary.wiley.com/doi/10.1002/art.41653/ abstract]).
Quantitative real-time polymerase chain reaction (PCR). Uterine and splenic macrophages/DCs, neutrophils, and lymphocytes from infected SKG mice and BALB/c mice were ana-lyzed after total RNA was isolated using a RNeasy Mini kit (Qiagen) and complementary DNA (cDNA) was prepared using a Tetro cDNa synthesis kit (Bioline). RNA from genital tracts and hind paws was isolated 1 and 5 weeks postinfection, respectively, and cDNA was generated using a SuperScript III First- Strand Synthesis SuperMix Kit (Invitrogen) (Supplementary Methods). Quantitative real- time PCR (qRT- PCR) for Il12b (forward 5ʹ- GGAAGCACGGCAGCAGAA TA- 3ʹ and reverse 5ʹ- AACTTGAGGGAGAAGTAGGAATGG- 3ʹ ), Il23 (forward 5ʹ- GCTGTGCCTAGGAGTAGCAG- 3ʹ and reverse5ʹ- TGGCTGTTGTCCTTGAGTCC- 3ʹ ), Il17a (forward 5ʹ- TCT CCACCGCAATGAAGACC- 3ʹ and reverse 5ʹ- CACACCCACCAG CATCTTCT- 3ʹ ), Tnf (forward 5ʹ- CATCTTCTCAAAATTCGTGTGA CAA- 3ʹ and reverse 5ʹ- TGGGAGTAGACAAGGTACAACCC- 3ʹ )or Tnf (Mm00443258_m1; forward 5ʹ- CATCTTCTCAAAATTCG TGTGACAA- 3ʹ and reverse 5ʹ- TGGGAGTAGACAAGGTACAAC CC- 3ʹ ), Hspa5 (forward 5ʹ- ACTTGGGGACCACCTATTCCT- 3ʹand reverse 5ʹ- GTTGCCCTGATCGTTGGCTA- 3ʹ), Tgtp1 (forward

CHLAMYDIA- INFECTED MACROPHAGES AND ReA IN SKG MICE | 1203
5ʹ- TGCACAGATGGGGATGAATTTC- 3ʹ and reverse 5ʹ- TCACTG TCGAGAGACTCCTGA- 3ʹ ), Hprt (forward 5ʹ- CCCCAAAATGGT TAAGGTTGC- 3ʹ and reverse 5ʹ- AACAAAGTCTGGCCTGTAT CC- 3ʹ or forward 5ʹ- TCAGTCAACGGGGGACATAAA- 3ʹ andre verse 5ʹ- GGGGCTGTACTGCTTAACCAG- 3ʹ ), and Gapdh(Mm99999915_g1) was performed using SYBR Green or TaqMan RT- PCR technology, with all primers purchased from Ther-moFisher. All real- time RT- PCR data were normalized relative to the expression values for a housekeeping gene (Hprt or Gapdh). Results are reported as the fold change in gene expression rel-ative to Hprt, calculated using the ΔCt method, or as the fold change in gene expression compared to the values in noninfected BALB/c mice, calculated using the ΔΔCt method.
Statistical analysis. The normality of the distribution was assessed by Kolmogorov- Smirnov test. One- way nonparamet-ric analysis of variance (ANOVA) (Kruskal- Wallis test) and Mann- Whitney tests were used for non- normally distributed data and t- test or one- way and two- way ANOVA with Tukey’s post hoc test for normally distributed data. The number of animals needed to achieve statistical power was estimated from pre-viously reported experiments (2). We estimated that we would need 8 mice per group, at a significance level of α = 0.05, to achieve a statistical power of 80% to detect differences between groups. P values less than 0.05 (2- tailed) were considered signif-icant. Statistical analysis was performed using GraphPad Prism software 8.4.3.
RESULTS
Infiltration of the genital tracts of infected mice and systemic dissemination of C muridarum by macrophages and neutrophils. C muridarum genital infection induces a proin-flammatory response. Flow cytometric analysis of cellular infiltrate into the uterine horns showed that the number of macrophages and neutrophils, but not DCs, increased in both BALB/c mice and SKG mice within 1 week after C muridarum genital infec-tion (Figures 1A– C and Supplementary Figure 1, available on the Arthritis & Rheumatology website at http://onlin elibr ary.wiley.com/doi/10.1002/art.41653/ abstract). Previously, C muridarum DNA was found in CD11b+ myeloid cells in SKG mouse spleens and lymph nodes 1 week postinfection (2), indicating that myeloid cells may transport C muridarum from the site of infection to the spleen.
To identify which myeloid cells transport C muridarum to the spleen after genital tract infection, we infected SKG mice with C muridarum, and 1 week later, we isolated splenic DCs (MHCII+ CD11c+CD103+), macrophages (MHCII+CD11c+CX3CR1+), and neutrophils (MHCII−CD11b+Ly- 6G+). C muridarum DNA was detected in macrophages and neutrophils, but not in DCs, indi-cating that these cells carry and disseminate C muridarum within 1 week of infection (Figure 1D). When normalized against number of sorted cells, C muridarum DNA copy number was higher in mac-rophages than in neutrophils and also higher in infected SKG mice compared to infected BALB/c mice (Figure 1E).
Figure 1. Infiltration of the genital tracts and systemic transportation of Chlamydia muridarum (Cmu) by macrophages (Mac) and neutrophils (Neu) in infected mice. Female BALB/c mice or SKG mice (n = 2– 4 per group) were either left untreated or primed with progesterone and infected 1 week later with 1.10 × 10⁶ inclusion- forming units (IFU) of C muridarum. A– C, One week postinfection, the number of live CD45.2+ dendritic cells (DCs) (MHCII+CD11b+CD11c+CD103+) (A), macrophages (MHCII+CD11b+CD11c+CX3CR1+) (B), and neutrophils (MHCII−CD11b+Ly- 6G+) (C) was assessed by flow cytometry. D, Splenic expression of C muridarum DNA was detected by polymerase chain reaction in DCs (MHCII+CD11c+CD103+), macrophages (MHCII+CD11c+CX3CR1+), and neutrophils (MHCII−CD11b+Ly- 6G+). E, To quantify C muridarum DNA in infected mice, C muridarum copy number was normalized to the number of sorted cells. Symbols represent individual mice; bars show the mean ± SEM. * = P < 0.05; ** = P < 0.01; *** = P < 0.001 by two- way analysis of variance (ANOVA) with Tukey’s post hoc test.

ROMAND ET AL 1204 |
To track C muridarum dissemination and burden after infection of the genital tract epithelium, we used C muridarum– expressing luciferase and GFP (pGFP- Luc- Cmu). Luciferase signal ascended from the lower genital tract to the upper genital tract by 7– 11 days postinfection in SKG mice and BALB/c mice infected with pGFP- Luc- Cmu (Figure 2A). Vaginal shedding of wild- type (WT) C muridarum and pGFP- Luc- Cmu was significantly higher in SKG mice than in BALB/c mice 2 weeks postinfection (Figure 2B).
To determine the contribution of macrophages to the C muridarum burden, clodronate liposomes were administered 1 day before mice were infected with pGFP- Luc- Cmu. Consist-ent with published findings (20,21), clodronate liposomes signifi-cantly depleted CD11b+Ly- 6G− blood and peritoneal monocytes/macrophages and preserved CD11b+Ly- 6G+ neutrophils
(Figure 2C). Macrophage depletion reduced C muridarum bur-den, as the pGFP- Luc- Cmu signal was almost undetectable in the lower and upper genital tract of infected mice 6 days post-infection (Figure 2D). These data indicate that macrophages and neutrophils carry C muridarum in the inflamed lower genital tract and transport it systemically. After clodronate was administered in mice, dissemination of C muridarum to the upper genital tract was minimal, and the C muridarum load was reduced.
Necessity of macrophages for C muridarum– induced ReA. To investigate the role of macrophages in the development of WT C muridarum– induced ReA in SKG mice, macrophages were depleted with weekly injections of clodronate liposomes, starting on the day of C muridarum genital infection. SKG mice
Figure 2. Dissemination of C muridarum by infected macrophages to the upper genital tract of mice. SKG mice and BALB/c mice were infected intravaginally with 2.10 × 10⁵ IFU of plasmid GFP- Luc- Cmu (Luc Cmu) (Weiss strain). A, Infected mice and healthy control mice were imaged in vivo 7 days and 11 days postinfection (pi). B, C muridarum load was determined 3– 15 days postinfection in genital swabs from mice (n = 5 per group) that were infected with 1 × 10⁶ IFU of wild- type C muridarum (wt Cmu) (left) or plasmid GFP- Luc- Cmu (right). C, SKG mice and BALB/c mice received phosphate buffered saline (PBS) or clodronate liposomes the day before infection with 1 × 10⁶ IFU of plasmid GFP-Luc-Cmu. The proportions of macrophages/monocytes (CD11b+Ly- 6G−) and neutrophils (CD11b+Ly- 6G+) were assessed by flow cytometry in the blood and peritoneal cavity 3 days after injection with clodronate liposomes (n = 7 mice) or PBS liposomes (n = 6 mice). D, Mice were imaged in vivo 6 days after injection with clodronate or PBS liposomes. Results are representative of 2 similar experiments. Symbols represent individual mice; bars show the mean ± SEM. ** = P < 0.01; **** = P < 0.0001 by two- way ANOVA with post hoc Tukey’s test in B and Mann- Whitney test in C. ns = not significant (see Figure 1 for other definitions).

CHLAMYDIA- INFECTED MACROPHAGES AND ReA IN SKG MICE | 1205
infected with C muridarum and treated with clodronate liposomes did not develop arthritis (Figure 3A), which was consistent with the reduction of C muridarum burden in the genital tract (Figure 2D) and the relationship observed between C muridarum burden and arthritis development (2). Mean indices of paw inflammation were significantly decreased among infected SKG mice treated with clodronate liposomes compared to SKG mice treated with PBS liposomes and did not differ from uninfected SKG mice. This was confirmed with histologic analysis: cellular infiltration was present in the skin, fore paws, and hind paws of mice treated with PBS liposomes and not present in mice treated with clodronate lipos-omes, with a reduced histologic score assessed at each site in the mice treated with clodronate liposomes (Figure 3B).
Enthesitis, synovitis, and plantar fasciitis were also abrogated by macrophage depletion (Figure 3C). Anti– chlamydial MOMP anti-body titers were not affected by clodronate treatment (Figure 3D). This is consistent with evidence that CD4 T cells and neutro-phils are necessary for anti– C muridarum antibody production in
BALB/c mice (22) and that anti– C muridarum MOMP antibody titers are not reduced in SKG mice relative to BALB/c mice (2). These data indicate that C muridarum transport by macrophages is required for the development of ReA, but not C muridarum anti-body immune response, in SKG mice.
Response to C muridarum infection in SKG mice characterized by autophagy and ER stress. Intracellular pathogens may enhance their replicative fitness in stressed host cells. To compare SKG mice and BALB/c mice for the intensity of response to C muridarum infection according to the levels of IRG and ER stress, we quantified ER stress– related Hspa5 and IRG response– related Tgtp1 (also known as Irgb6) expression in the genital tracts and ankle joints of mice prior to infection as well as 1 and 5 weeks postinfection as arthritis developed. In the joints of SKG mice, expression of Tgtp1 and Hspa5 was con-stitutively increased, with expression of Tgtp1 increased 100- fold in SKG mice 1 week postinfection (Figure 4A). In the joints of BALB/c mice, expression of Hspa5 increased 5 weeks postinfec-tion (Figure 4B). In the uterine horns, Tgtp1 expression increased 10- fold in BALB/c mice 1 week postinfection and increased 100- fold in SKG mice 5 weeks postinfection (Figure 4C). Hspa5 expression was also increased in the uterine horns of SKG mice at 5 weeks postinfection (Figure 4D). Hspa5 and Tgtp1 expression levels were strongly correlated in the joints and uterine horns of infected mice (Figures 4E and F). These data indicate that while BALB/c mice experience a small early IRG response in the gen-ital tract that drives autophagy to control chlamydia replication,
Figure 3. Macrophage- driven reactive arthritis induced by C muridarum infection. SKG mice received phosphate buffered saline (PBS) (n = 7) or clodronate (Clodro) liposomes (n = 7; initial dose of 2 mg/20 gm for each mouse and then 1 mg/20 gm/week) from the day of C muridarum infection until week 12 postinfection. A, Inflammation index scores indicate ankle width variation in mice compared to baseline. B, Histologic scores of the hind paw joints and skin 12 weeks postinfection are shown. C, Representative hematoxylin and eosin– stained sections from the heels, hind paw joints, and ear skin of mice harvested 12 weeks after infection are shown. For heels and hind paw joints, bars = 500 μm (original magnification × 4); for ear skin, bars = 100 μm (original magnification × 20). Achilles tendinitis, synovitis, fasciitis, inflammatory cell infiltrate, and epidermal thickening (arrows) are shown. D, Serum anti– C muridarum major outer membrane protein (MOMP) antibody titers measured by enzyme- linked immunosorbent assay 12 weeks postinfection are shown. Symbols represent individual mice; bars show the mean ± SEM in A, B, and D. * = P < 0.05; *** = P < 0.001 by two- way ANOVA with Tukey’s post hoc test (A) and t- test (B) and one- way nonparametric ANOVA (Kruskal- Wallis test) with Dunn’s post hoc test (D). See Figure 1 for other definitions.
Figure 4. Increased endoplasmic reticulum stress and immunity- related GTPase in the joints and genital tracts of SKG mice. A– D, Gene expression of Tgtp1 (A and C) and Hspa5 (B and D) were quantified by real- time quantitative polymerase chain reaction analysis at baseline and at 1 and 5 weeks postinfection (pi) in the joints (A and B) and uterine horns (C and D) of infected SKG mice and BALB/c mice relative to noninfected BALB/c mice. Symbols represent individual mice (n = 3– 7 mice per group); bars show the mean ± SEM. E and F, Correlation between the relative gene expression of Tgtp1 and Hspa5 in the joints (E) and uterine horns (F) of infected SKG mice is shown. ** = P < 0.01; *** = P < 0.001; **** = P < 0.0001 by one- way ANOVA with Tukey’s post hoc test. See Figure 1 for other definitions.

ROMAND ET AL 1206 |
the response in SKG mice is much greater, with response first observed in the joints and then in the uterine horns. This IRG response correlates with an ER stress response in the genital tract of SKG mice after C muridarum infection. In contrast to this and unrelated to infection, ER stress and low levels of IRG are consti-tutive in the joints of naive SKG mice.
Persistent infection and inflammation required for C muridarum– induced ReA in SKG mice. Dissemination of chlamydial PAMPs systemically promotes TLR- 2– mediated TNF production. The cryptic plasmid is a virulence factor for C muridarum and C trachomatis in animal models. The plas-mid is required for TLR- 2 signaling and disease pathology (2). In BALB/c mice, a plasmid- cured strain of C muridarum retained infectivity in the genital tract and generated an effective Th1 immune response. However, it failed to induce inflammatory dis-ease of the oviduct or significant levels of TNF production in the genital tract. Furthermore, bone marrow– derived DCs infected with this strain in vitro secreted little TNF (23). Hence, we infected SKG mice with a plasmid- deficient C muridarum strain to ascer-tain the role of the plasmid in Chlamydia- mediated inflammation in ReA. While SKG mice infected with WT C muridarum developed swelling of the fore and hind paws, which gradually evolved into an asymmetric polyarthritis, no joint swelling occurred after infection of SKG mice with plasmid- deficient C muridarum over 12 weeks (Figure 5A). Rifampin and doxycycline antibiotics, which have been shown in combination treatment to eliminate C muridarum (2), were started 2 weeks after the onset of arthritis and signif-icantly suppressed arthritis severity in SKG mice infected with C muridarum (Figure 5B), indicating that long- term chlamydial infection drives ReA.
Given that neutrophils and macrophages infiltrated the genital tract of C muridarum– infected mice and transported C muridarum systemically, we sorted neutrophils (CD11b+Ly- 6G+), mac-rophages and DCs (MHCII+CD11c+), and lymphocytes (CD3+) from uterine horns and spleens at baseline and 1 week postinfec-tion and quantified the expression of Il23a, Il17a, and Il12b. In the genital tract, expression of Il23a and Il17a was significantly higher in neutrophils from SKG mice than in macrophages and DCs from SKG mice or neutrophils from BALB/c mice. In the spleens of SKG mice, neutrophils expressed higher Il23a and Il17a tran-scripts than macrophages, DCs, and T cells. Il12b was expressed by myeloid cells in the genital tract and was expressed at signif-icantly greater levels by macrophages and DCs from SKG mice than neutrophils from SKG mice or macrophages and DCs from BALB/c mice (Figures 5C and E).
To test the function of SpA- associated cytokines in arthritis development, we blocked IL- 23p19 in WT C muridarum– infected SKG mice or infected Il17a−/− SKG mice. Early inhibition of IL- 23p19 (from weeks 1– 12) prevented ReA development, whereas
Figure 5. Promotion of C muridarum– driven reactive arthritis by neutrophil- derived interleukin- 23 (IL- 23) and IL- 17. A and B, Inflammation indices of SKG mice infected with wild- type C muridarum or plasmid- deficient C muridarum over 12 weeks (A) and SKG mice infected with C muridarum and treated with rifampin (0.4 mg/day) and doxycycline (0.3 mg/day) 7– 9 weeks postinfection (pi) are shown (B). C– E, BALB/c mice and SKG mice were infected with C muridarum. One week postinfection, macrophages/DCs (MHCII+CD11c+), neutrophils (CD11b+Ly- 6G+), and lymphocytes (CD3+) were sorted from the spleens and uterine horns of mice. Expression of Il23a (C), Il17a (D), and Il12b (E) relative to Hprt was quantified by real- time quantitative polymerase chain reaction (n = 3 mice per group). F, Inflammation index scores over 12 weeks in C muridarum– infected SKG mice that received anti- mouse IL- 23p19 either from weeks 1– 12 (w1- w12; n = 9) or from weeks 5– 12 (w5- w12; n = 8) or isotype (Iso) monoclonal antibody (mAb) (n = 13) are shown. G, Histologic scores of inflammation in the hind paws of C muridarum– infected mice treated with anti- mouse IL- 23p19 or isotype mAb are shown. H, Inflammation index scores of C muridarum– infected SKG mice and Il17a−/− knockout (KO) SKG mice (n = 4– 6 per group) over 12 weeks are shown. Symbols represent individual mice; bars show the mean ± SEM. * = P < 0.05; ** = P <0.01; *** = P <0.001; **** = P < 0.0001 by two- way ANOVA in A, B, F, and H and one- way ANOVA with Tukey’s post hoc test in C, D, E, and G. See Figure 1 for other definitions.

CHLAMYDIA- INFECTED MACROPHAGES AND ReA IN SKG MICE | 1207
inhibition of IL- 23p19 during weeks 5– 12 did not prevent the devel-opment of ReA (Figures 5F and G and Supplementary Figure 2A, available on the Arthritis & Rheumatology website at http://onlin e libr ary.wiley.com/doi/10.1002/art.41653/ abstract). All mice that received early inhibition of IL- 23 had high titers of anti- MOMP antibodies (Supplementary Figure 2B). Early inhibition of IL- 23p19 had no effect on vaginal shedding of C muridarum (Supplemen-tary Figure 2C). Il17a−/− SKG mice did not develop persistent arthritis following C muridarum infection of the genitals (Figure 5H). Together, these data suggest that plasmid- mediated C muridarum PAMPs drive early expression of neutrophil and macrophage IL- 23 and IL- 17A in the genital tract of SKG mice and that the depletion of macrophages, IL- 23, IL- 17A, or the C muridarum plasmid is sufficient to block disease development.
C muridarum– driven ReA linked to increased TNF expression in SKG mice. We have previously shown that in SKG mice depleted of Foxp3+ regulatory T cells, C muridarum– induced ReA was TNF- dependent (2). In SKG mice, Tnf expres-sion increased in the joint 1 week postinfection and persisted at 5 weeks postinfection (the onset of arthritis) (Figure 6A). This increase in Tnf expression in the joint coincided with increased expression in the genital tract at 1 week postinfection in both mouse strains (Figure 6B). While Tnf transcripts were expressed by both mac-rophages and neutrophils in the uterine horns, neutrophils from
SKG mice expressed significantly greater levels than macrophages in the spleen 1 week postinfection (Figure 6C).
In SKG mice infected with WT C muridarum, inhibition of TNF with either monoclonal antibody or soluble decoy TNF receptor, whether initiated at the time of infection or at the time of disease onset 5 weeks later, decreased joint inflammation as measured by the paw inflammation indices and ankle joint histologic scores (Figures 6D and E). TNF inhibition did not alter the levels of anti- MOMP antibodies in C muridarum– infected SKG mice (Figure 6F) or vaginal shedding of C muridarum (Supplementary Figure 2D [http://onlin elibr ary.wiley.com/doi/10.1002/art.41653/ abstract]). These data suggest that infected macrophages and neutrophils drive arthritis onset via TNF production.
DISCUSSION
We show here that the load of C muridarum is higher in SKG mice than in BALB/c mice. While proinflammatory neutrophils appear to contribute to disease initiation, macrophage depletion reduces C muridarum tissue dissemination, tissue burden, and arthritis but not levels of anti- MOMP antibodies. Our data suggest that enhanced bacterial survival in macrophages from SKG mice drives production of TNF required for persistent arthritis. Mac-rophages are known to transport C muridarum to other tissues (24). In SKG mice, C muridarum DNA is transported predominantly
Figure 6. Dependence of C muridarum– driven reactive arthritis on presence of tumor necrosis factor (TNF). A and B, Tnf expression was quantified by real- time quantitative polymerase chain reaction (qPCR) analysis 1 and 5 weeks postinfection (pi) in the joints (A) and uterine horns (B) of C muridarum– infected SKG mice and BALB/c mice relative to noninfected BALB/c mice at baseline. C, One week postinfection, macrophages/DCs (MHCII+CD11c+), neutrophils (CD11b+Ly- 6G+), and lymphocytes (CD3+) were sorted from the spleens and uterine horns of mice. Expression of Tnf relative to Hprt was quantified by real- time qPCR. D, Inflammation index scores over 12 weeks in C muridarum– infected SKG mice that received mouse- adapted certolizumab pegol or etanercept with treatments pooled either from weeks 1– 12 (w1- w12; n = 18) or weeks 5– 12 (w5- w12; n = 17) or phosphate buffered saline (PBS) (n = 19) are shown. E, Hind paw (ankle) histologic scores of inflammation in mice 12 weeks after C muridarum infection that were treated with anti- TNF or PBS are shown. F, Serum anti– C muridarum major outer membrane protein (MOMP) antibody titers 12 weeks postinfection measured by enzyme- linked immunosorbent assay are shown. Symbols represent individual mice; bars show the mean ± SEM. * = P < 0.05; ** = P < 0.01; **** = P < 0.0001 by one- way ANOVA with Tukey’s post hoc test in A, B, C, and E, two- way ANOVA with Tukey’s post hoc test in D, and one- way nonparametric ANOVA (Kruskal- Wallis test) with Dunn’s post hoc test in F.

ROMAND ET AL 1208 |
by macrophages, as well as neutrophils, to the spleen after gen-ital tract infection. It has also been observed that in SKG mice, depletion of macrophages by clodronate prevents C muridarum dissemination and disease. Although arthritis fails to develop with macrophage depletion in C muridarum– infected SKG mice, anti- MOMP antibodies, which require neutrophils and B cells, are still produced (22). In contrast, in BALB/c mice, C muridarum is cleared even when macrophages are present, and these mice do not develop arthritis or a TNF response in the joint. Consistent with this, C muridarum load is higher in SKG mice than in BALB/c mice, and it has been demonstrated that controlling the growth of Chla-mydia with a combination of antibiotics controls disease activity.
Although clodronate liposomes have been shown to selec-tively deplete macrophages and not conventional DCs or neutro-phils (25), the dependence of ReA on macrophages would ideally be confirmed in Csf1r- DTR mice on the SKG genetic background. Together, our data indicate that poor clearance of Chlamydia by macrophages underpins ReA in SKG mice. The proinflamma-tory impact of macrophages and poor clearance of C muridarum in SKG mice is consistent with the production of TNF by mac-rophages and impaired production of MOMP- specific T cell IFNγ and IL- 17 (2), which are required for C muridarum control (26,27).
ER stress and proinflammatory cytokines also play an impor-tant role in C muridarum– induced ReA in SKG mice. ER stress was constitutively increased in the joints of SKG mice and induced by C muridarum infection of the genital tract, along with a delayed and excessive IRG response. We focused on Tgtp1 as a marker of autophagy because it is implicated in the initiation and coor-dination of the routing of other IRGs into early chlamydial inclu-sions independent of IFNγ stimulation and also because Tgtp1 plays a necessary role in the control of chlamydial replication (15). In SKG mice, MOMP- specific T cells produce low levels of IFNγ (2). Expression of Il23a and Il17a was increased in uterine and splenic neutrophils of SKG mice at the time that expression of Tgtp1 increased in the joint. These data suggest a relationship between infection- driven autophagy to control C muridarum transported to the joint by macrophages and infection- associated IL- 23/IL- 17 in the genital tract. IL- 23 and IL- 17 drive arthritis development, as anti– IL- 23p19 administered during infection or Il17a deficiency was shown to suppress arthritis development. Similarly, matrix metalloproteinase production by neutrophils is decreased in C muridarum– infected Il17−/− mice, along with reduced oviduct pathologic changes (28).
The interrelationship between infection, ER stress, autophagy, and IL- 23 in SpA is supported by the following: the induction of the unfolded protein response, autophagy, and thus host cell survival upon C muridarum infection; the relationship between autophagy and IL- 23 in the AS gut; the sequestration of A20 by autophagy; and the provocation of IL- 23 production by ER stress in the context of TLR stimulation (6,12,13,29). Thus, arthritis pathogenesis after C muridarum infection of SKG mice appears to be two- pronged, with neutrophils contributing to disease initiation and macrophages
bearing the pathogen burden for persistent pathogenic TNF pro-duction. It is of interest that Tgtp1 and Hspa5 increased at 5 weeks postinfection in the uterine horns of SKG mice, suggesting that Chlamydia- infected macrophages may continue to be a source of reinfection and thus perpetuation of inflammation.
Here we show that TNF inhibitors, both monoclonal antibody and soluble receptor, suppress inflammatory arthritis in SKG mice, whether TNF is blocked at the time of C muridarum infection or at arthritis onset 5 weeks later, similar to human ReA (30). Further-more, arthritis development depends on the C muridarum cryptic virulence plasmid that is required for TLR- 2– mediated TNF pro-duction upon dissemination (2). Together, our data support the concept that C muridarum– induced ReA results from host factors promoting ER stress, bacterial virulence factors promoting inflam-mation under stress, and host immune dysregulation underlying poor pathogen control.
Previous studies have identified DNA and other bacterial prod-ucts from multiple species implicated in ReA, including Salmonella typhimurium and C trachomatis, in the synovial tissue and synovial fluid of ReA patients, and found the persistent forms to be meta-bolically active (31). Dissemination of C muridarum to sites outside the genital tract, such as the spleen, implies the dissemination of PAMPs and the capacity for presentation of chlamydial anti-gen to T cells, driving a chronic inflammatory response. Indeed, Chlamydia- specific CD4+ and CD8+ T cells have been identified in the joints of patients with Chlamydia- induced ReA (31). Per-sistent Chlamydia and chlamydial antigen and TLR signals will drive macrophage and DC activation, chronic activation of T cells, and production of proinflammatory cytokines, thus inducing per-sistent inflammation (32,33).
Persistent C trachomatis and C pneumoniae are in the aberrant- body phase, which is characterized by aberrant morpho-logic changes and metabolic state (34,35). Bacteria in this per-sistent state are nonculturable by standard methods, resistant to antibiotics, and display an unusual transcription profile (36,37). C trachomatis may enter a persistent state after infection of mono-cytes, influenced by the macrophage polarization state (32). Persis-tent forms of S typhimurium are similarly induced by macrophage internalization (38), and are related to genomic toxin– antitoxin systems, which increase bacterial fitness under stress conditions after macrophage internalization, antibiotic exposure, and/or viral coinfection. While toxin– antitoxin systems remain quiescent under favorable growth conditions, toxins can be activated in response to stress, suppressing bacterial growth and promoting a stress- tolerant dormant state. The increased levels of ER stress in joints and infection- induced ER stress in the genital tract of SKG mice would thus favor the persistence of C muridarum or S typhimurium.
Autophagy plays a major role in the processing of C tra-chomatis in macrophages (16,39), with the ability to restrict the formation of infectious inclusion bodies, which would potentially impact IL- 23 production. Autophagy restricts C trachomatis growth in human macrophages via IFN- inducible IRG proteins

CHLAMYDIA- INFECTED MACROPHAGES AND ReA IN SKG MICE | 1209
(15,16). IFNγ is fundamental to the eradication of intracellular pathogens through macrophage activation, nitric oxide, reactive oxygen species and indoleamine 2,3- dioxygenase production, and tryptophan starvation (16,40,41). The impaired production of IFNγ by T cells of SKG mice in response to chlamydial antigen and impaired macrophage responsiveness to IFNγ in SpA are thus significant (2,42,43). Moreover, autophagy mediates bacterial killing in macrophages (44) and contributes to antigen presenta-tion and IL- 23 secretion (12,45,46). Various cytokines, including TNF, IFNγ, IL- 1α, and IL- 1β, have been shown to stimulate auto-phagy in macrophages (44). While autophagy activation in human AS may be the consequence of HLA– B27 misfolding in the gut (12), in SKG mice, activation of autophagy may be the conse-quence of macrophage infection by C muridarum and may help drive production of IL- 23.
IL- 23 not only supports the differentiation of Th17 cells but also is required for the secretion of IL- 17, IFNγ, and IL- 22 by Th17 cells and γδ T cells (47,48). Since IL- 23 blockade prevented arthritis only during infection, IL- 23 must drive disease patho-genesis prior to development of arthritis, whereas TNF mediates clinical manifestations of inflammation. This is supported by evi-dence that IL- 23 is only involved early in the pathogenesis of autoimmune inflammatory diseases in animal models, promot-ing the development of inflammatory pathogenic antibodies (49), and that blocking this cytokine during established AS is ineffec-tive (50). Collectively, our findings identify the pivotal role played by macrophages in the development of C muridarum– induced ReA in SKG mice.
ACKNOWLEDGMENT
We thank the SCIMI Microbiology Imaging Microscopy Facility at the TIMC- Imag University Grenoble Alpes (Grenoble, France) for technical advice and access to instruments.
AUTHOR CONTRIBUTIONS
All authors were involved in drafting the article or revising it critically for important intellectual content, and all authors approved the final version to be published. Dr. Baillet had full access to all the study data and takes responsibility for the integrity of the data and the accuracy of the data analysis.Study conception and design. Romand, Liu, Rahman, Armitage, Beagley, Thomas, Wells, Baillet.Acquisition of data. Romand, Liu, Rahman, Bhuyan, Douillard, Kedia, Stone, Roest, Chew, Cameron, Bozon, Habib, Favier, Baillet.Analysis and/or interpretation of data. Romand, Liu, Rahman, Bhuyan, Chew, Cameron, Rehaume, Nguyen, Beagley, Maurin, Gaudin, Thomas, Wells, Baillet.
REFERENCES 1. Rich E, Hook EW III, Alarcón GS, Moreland LW. Reactive arthritis
in patients attending an urban sexually transmitted diseases clinic.Arthritis Rheum 1996;39:1172– 7.
2. Baillet AC, Rehaume LM, Benham H, O’Meara CP, Armitage CW,Ruscher R, et al. High Chlamydia burden promotes tumor necrosis
factor– dependent reactive arthritis in SKG mice. Arthritis Rheumatol 2015;67:1535– 47.
3. Moazed TC, Kuo CC, Grayston JT, Campbell LA. Evidence of sys-temic dissemination of Chlamydia pneumoniae via macrophages inthe mouse. J Infect Dis 1998;177:1322– 5.
4. Rajeeve K, Das S, Prusty BK, Rudel T. Chlamydia trachomatis paral-yses neutrophils to evade the host innate immune response. NatMicrobiol 2018;3:824– 35.
5. Zeng L, Lindstrom MJ, Smith JA. Ankylosing spondylitis mac-rophage production of higher levels of interleukin- 23 in response tolipopolysaccharide without induction of a significant unfolded protein response. Arthritis Rheum 2011;63:3807– 17.
6. Goodall JC, Wu C, Zhang Y, McNeill L, Ellis L, Saudek V, et al.Endoplasmic reticulum stress- induced transcription factor, CHOP, iscrucial for dendritic cell IL- 23 expression. Proc Natl Acad Sci U S A2010;107:17698– 703.
7. Ciccia F, Guggino G, Zeng M, Thomas R, Ranganathan V, Rahman A, et al. Pro-inflammatory CX3CR1+ CD59+ tumor necrosis factor–like molecule 1A+interleukin-23+ monocytes are expanded inpatients with ankylosing spondylitis and modulate innate lymphoidcell 3 immune functions. Arthritis Rheumatol 2018;70:2003– 13.
8. Kvedaraite E, Lourda M, Idestrom M, Chen P, Olsson- Akefeldt S,Forkel M, et al. Tissue- infiltrating neutrophils represent the mainsource of IL- 23 in the colon of patients with IBD. Gut 2016;65:1632– 41.
9. Sherlock JP, Joyce- Shaikh B, Turner SP, Chao CC, Sathe M,Grein J, et al. IL- 23 induces spondyloarthropathy by acting onROR- γt+ CD3+CD4- CD8- entheseal resident T cells. Nat Med2012;18:1069– 76.
10. DeLay ML, Turner MJ, Klenk EI, Smith JA, Sowders DP, Colbert RA.HLA– B27 misfolding and the unfolded protein response augmentinterleukin- 23 production and are associated with Th17 activation intransgenic rats. Arthritis Rheum 2009;60:2633– 43.
11. Antoniou AN, Lenart I, Kriston- Vizi J, Iwawaki T, Turmaine M,McHugh K, et al. Salmonella exploits HLA- B27 and host unfoldedprotein responses to promote intracellular replication. Ann RheumDis 2019;78:74– 82.
12. Ciccia F, Accardo- Palumbo A, Rizzo A, Guggino G, Raimondo S,Giardina A, et al. Evidence that autophagy, but not the unfolded pro-tein response, regulates the expression of IL- 23 in the gut of patients with ankylosing spondylitis and subclinical gut inflammation. AnnRheum Dis 2014;73:1566– 74.
13. Kanayama M, Inoue M, Danzaki K, Hammer G, He YW, ShinoharaML. Autophagy enhances NFκB activity in specific tissue mac-rophages by sequestering A20 to boost antifungal immunity. NatCommun 2015;6:5779.
14. Shenoy AR, Kim BH, Choi HP, Matsuzawa T, Tiwari S, MacMickingJD. Emerging themes in IFN- γ- induced macrophage immu-nity by the p47 and p65 GTPase families. Immunobiology2007;212:771– 84.
15. Al- Zeer MA, Al- Younes HM, Braun PR, Zerrahn J, Meyer TF. IFN- γ- inducible Irga6 mediates host resistance against Chlamydia tra-chomatis via autophagy. PLoS One 2009;4:e4588.
16. Al- Zeer MA, Al- Younes HM, Lauster D, Lubad MA, Meyer TF.Autophagy restricts Chlamydia trachomatis growth in human mac-rophages via IFNG- inducible guanylate binding proteins. Autophagy2013;9:50– 62.
17. Campbell J, Huang Y, Liu Y, Schenken R, Arulanandam B, Zhong G.Bioluminescence imaging of Chlamydia muridarum ascending infec-tion in mice. PLoS One 2014;9:e101634.
18. O’Connell CM, Nicks KM. A plasmid- cured Chlamydia muridarumstrain displays altered plaque morphology and reduced infectivity incell culture. Microbiology (Reading) 2006;152:1601– 7.

ROMAND ET AL 1210 |
19. Steptoe RJ, Stankovic S, Lopaticki S, Jones LK, Harrison LC, Morahan G. Persistence of recipient lymphocytes in NOD mice after irradiation and bone marrow transplantation. J Autoimmun 2004;22:131– 8.
20. Biewenga J, van der Ende MB, Krist LF, Borst A, Ghufron M, van Rooijen N. Macrophage depletion in the rat after intraperitoneal admin-istration of liposome- encapsulated clodronate: depletion kinetics and accelerated repopulation of peritoneal and omental macrophages by administration of Freund’s adjuvant. Cell Tissue Res 1995;280:189– 96.
21. Claassen I, van Rooijen N, Claassen E. A new method for removal of mononuclear phagocytes from heterogeneous cell populations in vitro, using the liposome- mediated macrophage ’suicide’ technique. J Immunol Methods 1990;134:153– 61.
22. Naglak EK, Morrison SG, Morrison RP. Neutrophils are central to antibody- mediated protection against genital chlamydia. Infect Immun 2017;85:e00409– 17.
23. Porcella SF, Carlson JH, Sturdevant DE, Sturdevant GL, Kanakabandi K, Virtaneva K, et al. Transcriptional profiling of human epithelial cells infected with plasmid- bearing and plasmid- deficient Chlamydia tra-chomatis. Infect Immun 2015;83:534– 43.
24. Airenne S, Surcel HM, Alakärppä H, Laitinen K, Paavonen J, Saikku P, et al. Chlamydia pneumoniae infection in human monocytes. Infect Immun 1999;67:1445– 9.
25. Junt T, Moseman EA, Iannacone M, Massberg S, Lang PA, Boes M, et al. Subcapsular sinus macrophages in lymph nodes clear lymph- borne viruses and present them to antiviral B cells. Nature 2007;450:110– 4.
26. Scurlock AM, Frazer LC, Andrews CW Jr, O’Connell CM, Foote IP, Bailey SL, et al. Interleukin- 17 contributes to generation of Th1 immunity and neutrophil recruitment during Chlamydia muridarum genital tract infection but is not required for macrophage influx or normal resolution of infection. Infect Immun 2011;79:1349– 62.
27. Zhang Y, Wang H, Ren J, Tang X, Jing Y, Xing D, et al. IL- 17A syner-gizes with IFN- γ to upregulate iNOS and NO production and inhibit chlamydial growth. PLoS One 2012;7:e39214.
28. O’Meara CP, Armitage CW, Harvie MC, Andrew DW, Timms P, Lycke NY, et al. Immunity against a Chlamydia infection and disease may be determined by a balance of IL- 17 signaling. Immunol Cell Biol 2014;92:287– 97.
29. George Z, Omosun Y, Azenabor AA, Partin J, Joseph K, Ellerson D, et al. The roles of unfolded protein response pathways in Chlamydia pathogenesis. J Infect Dis 2017;215:456– 65.
30. Meyer A, Chatelus E, Wendling D, Berthelot JM, Dernis E, Houvenagel E, et al. Safety and efficacy of anti– tumor necrosis factor α therapy in ten patients with recent- onset refractory reactive arthritis. Arthritis Rheum 2011;63:1274– 80.
31. Gerard HC, Carter JD, Hudson AP. Chlamydia trachomatis is present and metabolically active during the remitting phase in synovial tis-sues from patients with chronic Chlamydia- induced reactive arthritis. Am J Med Sci 2013;346:22– 5.
32. Gracey E, Lin A, Akram A, Chiu B, Inman RD. Intracellular survival and persistence of Chlamydia muridarum is determined by mac-rophage polarization. PLoS One 2013;8:e69421.
33. Harvie MC, Carey AJ, Armitage CW, O’Meara CP, Peet J, Phillips ZN, et al. Chlamydia- infected macrophages are resistant to azithromycin treatment and are associated with chronic oviduct inflammation and hydrosalpinx development. Immunol Cell Biol 2019;97:865– 76.
34. Hogan RJ, Mathews SA, Mukhopadhyay S, Summersgill JT, Timms P. Chlamydial persistence: beyond the biphasic paradigm [review]. Infect Immun 2004;72:1843– 55.
35. Schumacher HR Jr, Arayssi T, Crane M, Lee J, Gerard H, Hudson AP, et al. Chlamydia trachomatis nucleic acids can be found in the synovium of some asymptomatic subjects. Arthritis Rheum 1999;42:1281– 4.
36. Gerard HC, Freise J, Wang Z, Roberts G, Rudy D, Krauss- Opatz B, et al. Chlamydia trachomatis genes whose products are related to energy metabolism are expressed differentially in active vs. persis-tent infection. Microbes Infect 2002;4:13– 22.
37. Gerard HC, Whittum- Hudson JA, Schumacher HR, Hudson AP. Synovial Chlamydia trachomatis up regulates expression of a panel of genes similar to that transcribed by Mycobacterium tuberculosis during persistent infection. Ann Rheum Dis 2006;65:321– 7.
38. Helaine S, Cheverton AM, Watson KG, Faure LM, Matthews SA, Holden DW. Internalization of Salmonella by macrophages induces formation of nonreplicating persisters. Science 2014; 343:204– 8.
39. Sun HS, Eng EW, Jeganathan S, Sin AT, Patel PC, Gracey E, et al. Chlamydia trachomatis vacuole maturation in infected macrophages. J Leukoc Biol 2012;92:815– 27.
40. Cotter TW, Ramsey KH, Miranpuri GS, Poulsen CE, Byrne GI. Dissemination of Chlamydia trachomatis chronic genital tract infection in γ interferon gene knockout mice. Infect Immun 1997;65:2145– 52.
41. Virok DP, Raffai T, Kokai D, Paroczai D, Bogdanov A, Veres G, et al. Indoleamine 2,3- dioxygenase activity in Chlamydia muridarum and Chlamydia pneumoniae infected mouse lung tissues. Front Cell Infect Microbiol 2019;9:192.
42. Fert I, Cagnard N, Glatigny S, Letourneur F, Jacques S, Smith JA, et al. Reverse interferon signature is characteristic of antigen- presenting cells in human and rat spondyloarthritis. Arthritis Rheumatol 2014;66:841– 51.
43. Smith JA, Barnes MD, Hong D, DeLay ML, Inman RD, Colbert RA. Gene expression analysis of macrophages derived from ankylos-ing spondylitis patients reveals interferon- γ dysregulation. Arthritis Rheum 2008;58:1640– 9.
44. Bah A, Vergne I. Macrophage autophagy and bacterial infections [review]. Front Immunol 2017;8:1483.
45. Peral de Castro C, Jones SA, Ní Cheallaigh C, Hearnden CA, Williams L, Winter J, et al. Autophagy regulates IL- 23 secretion and innate T cell responses through effects on IL- 1 secretion. J Immunol 2012;189:4144– 53.
46. Munz C. Antigen processing via autophagy: not only for MHC class II presentation anymore? Curr Opin Immunol 2010;22:89– 93.
47. McGeachy MJ, Chen Y, Tato CM, Laurence A, Joyce- Shaikh B, Blumenschein WM, et al. The interleukin 23 receptor is essential for the terminal differentiation of interleukin 17- producing effector T helper cells in vivo. Nat Immunol 2009;10:314– 24.
48. Sutton CE, Lalor SJ, Sweeney CM, Brereton CF, Lavelle EC, Mills KH. Interleukin- 1 and IL- 23 induce innate IL- 17 production from γδ T cells, amplifying Th17 responses and autoimmunity. Immunity 2009;31:331– 41.
49. Pfeifle R, Rothe T, Ipseiz N, Scherer HU, Culemann S, Harre U, et al. Regulation of autoantibody activity by the IL- 23- TH17 axis determines the onset of autoimmune disease. Nat Immunol 2017;18:104– 13.
50. Deodhar A, Gensler LS, Sieper J, Clark M, Calderon C, Wang Y, et al. Three multicenter, randomized, double- blind, placebo- controlled studies evaluating the efficacy and safety of ustekinumab in axial spondyloarthritis. Arthritis Rheumatol 2019;71:258– 70.

1211
Arthritis & RheumatologyVol. 73, No. 7, July 2021, pp 1211–1219DOI 10.1002/art.41667© 2021 The Authors. Arthritis & Rheumatology published by Wiley Periodicals LLC on behalf of American College of Rheumatology.This is an open access article under the terms of the Creative Commons Attribution- NonCommercial License, which permits use, distribution and reproduction in any medium, provided the original work is properly cited and is not used for commercial purposes.
Tumor Necrosis Factor Inhibitors Reduce Spinal Radiographic Progression in Patients With Radiographic Axial Spondyloarthritis: A Longitudinal Analysis From the Alberta Prospective CohortAlexandre Sepriano,1 Sofia Ramiro,2 Stephanie Wichuk,3 Praveena Chiowchanwisawakit,4 Joel Paschke,5 Désirée van der Heijde,6 Robert Landewé,7 and Walter P. Maksymowych3
Objective. To investigate whether tumor necrosis factor inhibitors (TNFi) impact spinal radiographic progression in patients with axial spondyloarthritis (SpA) and whether this is coupled to their effect on inflammation.
Methods. Patients with axial SpA fulfilling the modified New York criteria were included in a prospective cohort (the ALBERTA Follow Up Research Cohort in Ankylosing Spondylitis Treatment). Spine radiographs, performed every 2 years for up to 10 years, were scored by 2 central readers, using the modified Stoke Ankylosing Spondylitis Spine Score (mSASSS). The indirect effect of TNFi on mSASSS was evaluated with generalized estimating equations by testing the interaction between TNFi and Ankylosing Spondylitis Disease Activity Score (ASDAS) at the start of each 2- year interval (t). If significant, the association between ASDAS at t and mSASSS at the end of the interval (t+1) was assessed in 1) patients treated with TNFi at all visits, 2) patients treated with TNFi at some visits, and 3) patients who were never treated with TNFi. In addition, the association between TNFi at t and mSASSS at t+1 (adjusting for ASDAS at t) was also tested (direct effect).
Results. In total, 314 patients were included. A gradient was seen for the effect of ASDAS at t on mSASSS at t+1 (interaction P = 0.10), with a higher progression in patients never treated with TNFi (β = 0.41 [95% confidence interval (95% CI) 0.13, 0.68]) compared to those continuously treated (β = 0.16 [95% CI 0.00, 0.31]) (indirect effect). However, TNFi also directly slowed progression, as treated patients had on average an mSASSS 0.85 units lower at t+1 compared to untreated patients (β = −0.85 [95% CI −1.35, −0.35]).
Conclusion. Our findings indicate that TNFi reduce spinal radiographic progression in patients with radiographic axial SpA, which might be partially uncoupled from their effects on inflammation as measured by the ASDAS.
INTRODUCTION
Axial spondyloarthritis (SpA) is a chronic inflammatory rheu-matic disease that preferentially involves the axial skeleton. In
axial SpA, systemic inflammation is usually measured with clin-ical measures of disease activity, such as the Ankylosing Spon-dylitis Disease Activity Score (ASDAS) (1). Local inflammation (e.g., bone marrow edema in a vertebral corner) is seen with
The Follow Up Research Cohort in Ankylosing Spondylitis Treatment (FORCAST) was supported by an unrestricted grant from AbbVie. Dr. Sepriano’s work was supported by a doctoral grant from the Fundação para a Ciência e Tecnologia (grant SFRH/BD/108246/2015).
1Alexandre Sepriano, MD, PhD: Leiden University Medical Center, Leiden, The Netherlands, and Universidade Nova de Lisboa, Lisboa, Portugal; 2Sofia Ramiro, MD, PhD: Leiden University Medical Center, Leiden, The Netherlands, and Zuyderland Medical Center, Heerlen, The Netherlands; 3Stephanie Wichuk, BA, Walter P. Maksymowych, MD, PhD: University of Alberta and CARE Arthritis, Edmonton, Alberta, Canada; 4Praveena Chiowchanwisawakit, MD: Mahidol University, Bangkok, Thailand; 5Joel Paschke, BSc: CARE Arthritis, Edmonton, Alberta, Canada; 6Désirée van der Heijde, MD, PhD: Leiden University Medical Center, Leiden, The Netherlands; 7Robert Landewé, MD, PhD: Amsterdam University Medical Center, Amsterdam, and Zuyderland Medical Center, Heerlen, The Netherlands.
Dr. Sepriano has received consulting fees, speaking fees, and/or honoraria from MSD, UCB, and Novartis (less than $10,000 each). Dr. Ramiro has received consulting fees, speaking fees, and/or honoraria from AbbVie, Eli Lilly, MSD, Novartis, UCB, and Sanofi (less than $10,000 each) and a research grant from MSD. Dr. Chiowchanwisawakit has received speaking fees from
Novartis, Zuellig Pharma, Pfizer, and Janssen (less than $10,000 each) and a research grant from Pfizer. Dr. van der Heijde has received consulting fees from AbbVie, Amgen, Astellas, AstraZeneca, Bayer, Bristol Myers Squibb, Boehringer Ingelheim, Celgene, Cyxone, Daiichi, Eisai, Eli Lilly, Galápagos, Gilead, GlaxoSmithKline, Janssen, Merck, Novartis, Pfizer, Regeneron, Roche, Sanofi, Takeda, and UCB (less than $10,000 each) and is the director of Imaging Rheumatology BV. Dr. Landewé has received consulting fees from AbbVie, Bristol Myers Squibb, Celgene, Eli Lilly, Galápagos, Gilead, GlaxoSmithKline, Janssen, Merck, Novartis, Pfizer, Roche, and UCB (less than $10,000 each) and is the director of Rheumatology Consultancy BV. Dr. Maksymowych has received consulting fees from AbbVie, Boehringer, Celgene, Galápagos, Janssen, Eli Lilly, Novartis, Pfizer, and UCB (less than $10,000 each), research support from AbbVie, Novartis, and Pfizer, and is the chief medical officer of CARE Arthritis. No other disclosures relevant to this article were reported.
Address correspondence to Alexandre Sepriano, MD, PhD, Leiden University Medical Center, Department of Rheumatology, PO Box 9600, 2300 RC Leiden, The Netherlands. Email: [email protected].
Submitted for publication October 22, 2020; accepted in revised form January 26, 2021.

SEPRIANO ET AL 1212 |
imaging modalities such as magnetic resonance imaging (MRI) (2). The association between inflammation, measured either by ASDAS or MRI, and pain, impaired mobility, disability, and poor health- related quality of life (HRQoL) is well known (3). In addi-tion, evidence supporting the link between inflammation and axial damage, usually measured on spine radiographs according to the modified Stoke Ankylosing Spondylitis Spine Score (mSASSS) (4), has also been consistently reported (5– 10).
Abrogation of inflammation has been shown to improve signs and symptoms of the disease and to have a positive effect on mobil-ity, function, and HRQoL (11). Thus, drugs, such as nonsteroidal antiinflammatory drugs (NSAIDs) and tumor necrosis factor inhibi-tors (TNFi), play a central role in the management of axial SpA (12). However, and despite significant efforts, it remains to be clarified whether there is also an effect of these drugs on axial damage accrual. Conflicting evidence emerged from trials testing NSAIDs, with some studies supporting the hypothesis of a positive effect, especially among patients with elevated C- reactive protein (CRP) level (13,14), while others rejected this hypothesis (15). Randomized placebo- controlled trials testing the structural effect of TNFi are, cur-rently, unfeasible (16). Data stemming mostly from historical com-parisons and from nonrandomized experiments have attempted to fill the gap but have proved inconclusive. Some studies showed a protective effect, especially if treatment was taken for at least 4 years, while others failed to demonstrate any impact (17– 19).
Inconsistencies in the literature might be explained by differ-ences in how the methodologic challenges posed by the above- mentioned studies have been dealt with (16). The strategies to address confounding, to limit loss to follow- up, and the low sen-sitivity to change of the mSASSS are, among others, factors that are likely to interfere with the detection of treatment effects. In addition, the complex mechanisms of structural damage in axial SpA pose further challenges (20). For instance, recent obser-vational studies suggest that TNFi interfere with radiographic progression solely by reducing inflammation (21,22). However, it has been shown that inflammation that is captured either by repeated measurements of the ASDAS or by sequential MRIs only partially explains new bone formation in axial SpA (5,6). Thus, the question remains of whether TNFi have a “true” effect on damage accrual in axial SpA and, if so, whether this effect is dependent on or independent of their inhibitory effect on inflammation.
We therefore aimed to investigate whether TNFi reduce spi-nal radiographic progression in patients with axial SpA and, if so, whether this occurs indirectly through their effect on inflammation as assessed by the ASDAS, or whether a direct effect uncoupled from ASDAS inflammation can also be demonstrated.
PATIENTS AND METHODS
Patients and study design. Consecutive patients from community- based and academic rheumatology practices in North-ern Alberta, Canada with a clinical diagnosis of axial SpA according
to their treating rheumatologists were referred to the University of Alberta for inclusion in the Follow Up Research Cohort in Anky-losing Spondylitis Treatment (ALBERTA FORCAST) observational cohort study. Patients had to fulfill the modified New York classifica-tion criteria (i.e., with radiographic axial SpA) (23), and recruitment started in 2008. Clinical and imaging data were collected at base-line and every 2 years for up to 10 years of follow- up. A window of up to 12 months between imaging and clinical visits was allowed. In addition, to be included patients had to have a baseline mSASSS of <71, ≥1 postbaseline spinal radiograph available, and complete data on ASDAS and exposure to TNFi at the start of and during the 2- year interval. The database used for the current analysis was locked on September 6, 2018. The study was conducted accord-ing to Good Clinical Practice Guidelines and has been approved by the University of Alberta Health Research Ethics Committee. All patients provided written informed consent before inclusion.
Scoring procedures and definition of radiographic progression. All available lateral radiographs of the cervical and lumbar spine for each patient were independently scored by 2 trained central readers using the mSASSS. The readers were aware of the chronology of the radiographs but were blinded with regard to clinical data. Only scores for radiographs with ≤3 missing vertebral corners per segment (either cervical or lumbar) were used. Individ-ual missing vertebral corners were imputed according to a method previously described in detail (24). One adjudicator scored all films of each patient where there was a discrepancy between the 2 pri-mary readers of ≥5 units for the change in mSASSS in at least one 2- year interval. The main outcome was the total mSASSS score (range 0– 72) at each visit. In addition, the following binary defini-tions were used, considering the time between 2 consecutive vists: any change in mSASSS (Δ>0 yes/no); change in mSASSS ≥2 (yes/no); and ≥1 new syndesmophyte (yes/no).
Treatment with TNFi. Treatment with a TNFi (adalimumab, certolizumab, etanercept, golimumab, or infliximab) at each visit (yes/no; time- varying) was the main explanatory variable of inter-est. In addition, we analyzed treatment with TNFi according to the following definitions: treatment with TNFi at any time during the follow- up interval (yes/no; time- varying), duration of treatment with any TNFi during the follow- up interval (continuous variable in years; time- varying), proportion of time receiving TNFi treatment during the follow- up interval (continuous variable as a proportion of follow- up; time- varying), duration of TNFi treatment <50% versus ≥50% of the follow- up interval (yes/no; time- varying), and duration of continuous TNFi treatment (allowing for interruptions of a max-imum of 6 months) ≤4 years versus >4 years (yes/no; time- fixed).
Statistical analysis. Reliability. Reliability between read-ers was determined, at the patient level, by calculating the small-est detectable change (SDC). A two- way analysis of variance with the change in mSASSS over time as the outcome and with

TNFi REDUCE SPINAL RADIOGRAPHIC PROGRESSION IN AXIAL SpA | 1213
time and reader as independent variables was used to estimate the SEM of the change in mSASSS score, which was then used to calculate the SDC according to the following formula: 1.96 ×
�√
SEM∕√
number of readers
�
. In addition, the interreader intr-aclass correlation coefficient (ICC) for the mSASSS at baseline and for the change in mSASSS per each 2- year interval were calculated. The latter derived from a mixed model with time as independent variable and with a random- effect for patient and for reader.
Main analysis. First, we evaluated whether there was an indi-rect effect of treatment with TNFi at each visit on mSASSS over time, by testing the interaction between exposure to TNFi and ASDAS at the start of each 2- year interval on the mSASSS 2 years later. In the case of a significant interaction (P < 0.15), meaning that the association between ASDAS and mSASSS was modified by exposure to TNFi, the relationship between ASDAS and mSASSS 2 years later was assessed in the following 3 groups of patients exposed to TNFi: 1) patients who were receiving treatment at all visits (100% of visits); 2) patients who were receiving treatment at some visits (>0% and <100% of visits), and 3) patients who were never treated with TNFi (0% of visits). In addition, interactions between treatment with TNFi and 1) achieving inactive disease according to the ASDAS (ASDAS <1.3) after 1 year (yes/no); 2) NSAIDs (yes/no), 3) symptom duration, 4) smoking (yes/no), and 5) time between diagnosis and start of TNFi were also tested. Second, we tested whether there was a direct effect of receiving TNFi at the start of the interval on mSASSS 2 years later, with and without adjustment for ASDAS at the start of the interval. The indirect and direct effects were also tested with the binary definitions of progression as outcome in separate models.
Both the direct and indirect effects were tested in 2 types of multivariable longitudinal generalized estimating equation (GEE) models. In model 1, individual mSASSS scores (continu-ous and binary) per reader were used as the outcome in a mul-tilevel model adjusted for the correlation of mSASSS within each reader, an assumption- free approach we have previously proved to be robust in the analysis of long- term imaging data (25). In model 2, we used the average score, either between the 2 primary read-ers or between the adjudicator’s score and the closest score of the 2 primary readers, for the main outcome (mSASSS continu-ous); the agreement between the 2 readers, at the vertebral unit level, was used for the binary scores. For syndesmophytes, the following 2 definitions were used: 1) the new syndesmophyte was seen by both readers; 2) the new syndesmophyte was seen by at least 1 reader.
Both types of model were adjusted for the outcome (mSASSS) at the start of the interval (autoregression), which iso-lates the “within- patient” effects and thus allows for a truly lon-gitudinal interpretation of the data. Models were also adjusted for potential confounders defined a priori on clinical grounds: symptom duration (years), sex, HLA– B27, and number of TNFi
used before inclusion. In addition, treatment with conventional synthetic disease- modifying antirheumatic drugs (csDMARDs) (yes/no; time- varying), treatment with NSAIDs (yes/no; time- varying), smoking (yes/no; time- varying), number of csDMARDs and number of NSAIDs used before inclusion (both time- fixed) were tested in univariable models, and if significant (P < 0.20), were added to the multivariable model and finally selected if proved significant (P < 0.05) or to confound the association of interest.
Sensitivity analyses. We also tested 1) the direct and indirect effect of TNFi on mSASSS (continuous) using a database with a 6- month window between imaging and clinical visits; 2) the direct effect of TNFi after adjusting for a propensity score (PS), to take confounding by indication into account (details on the estimation and balancing diagnostics of the PS are provided in the Sup-plementary Methods, available on the Arthritis & Rheumatology
Table 1. Baseline characteristics of the patients with axial SpA in FORCAST who met the inclusion criteria for the present study and those who were excluded from the present study*
Included (n = 314)
Excluded (n = 113)
Age at baseline, years 41.1 ± 13 43.5 ± 13Symptom duration, years† 18 ± 12 20 ± 12Sex, no. (%) male 233 (74) 83 (73)HLA– B27 positive, no. (%)† 262 (83) 90 (83)Ever smoked, no. (%)‡ 149 (56) 15 (48)CRP, mg/liter§ 10 ± 17 13 ± 16ASDAS- CRP§ 3 ± 1 3 ± 1ASDAS- CRP category, no. (%)
Inactive disease (<1.3) 48 (16) 7 (14)Low disease activity (≥1.3 and <2.1) 66 (21) 10 (20)High disease activity (≥2.1 and ≤3.5) 101 (33) 19 (38)Very high disease activity (>3.5) 94 (30) 14 (28)
BASFI (range 0– 10)§ 4 ± 3 4 ± 3BASMI (range 0– 10)¶ 2 ± 2 4 ± 3mSASSS (range 0– 72)§# 14 ± 19 22 ± 24≥1 syndesmophyte, no. (%)§** 165 (53) 32 (67)Use of TNFi, no. (%)§ 151 (49) 24 (48)Use of csDMARDs, no. (%)§ 9 (3) 4 (8)Use of NSAIDs, no. (%)§ 165 (53) 18 (36)≥1 TNFi before inclusion, no. (%) 21 (7) 3 (3)≥1 NSAID before inclusion, no. (%) 201 (64) 71 (63)≥1 csDMARD before inclusion, no. (%) 11 (4) 10 (9)* Except where indicated otherwise, values are the mean ± SD. SpA = spondyloarthritis; FORCAST = Follow Up Research Cohort in Ankylosing Spondylitis Treatment; CRP = C- reactive protein; ASDAS- CRP = Ankylosing Spondylitis Disease Activity Score using the CRP level; BASFI = Bath Ankylosing Spondylitis Functional Index; BASMI = Bath Ankylosing Spondylitis Metrology Index; mSASSS = modified Stoke Ankylosing Spondylitis Spine Score; TNFi = tumor necrosis factor inhibitor; csDMARDs = conventional synthetic disease- modifying antirheumatic drugs; NSAIDs = nonsteroidal antiinflammatory drugs. † Data were missing for <1% of patients. ‡ n = 297.§ Data were missing for <10% of patients. ¶ n = 306. # Average of the scores of 2 readers. ** Agreement between the 2 readers on the presence of a syndesmophyte at the vertebral corner level.

SEPRIANO ET AL 1214 |
website at http://onlin elibr ary.wiley.com/doi/10.1002/art.41667/ abstract); and 3) the direct and indirect effect using alternative definitions of exposure to TNFi.
RESULTS
Baseline characteristics. Of the 427 patients with radi-ographic axial SpA included in FORCAST, 314 fulfilled the inclu-sion criteria for the present study. Baseline characteristics were typical of patients with radiographic axial SpA: 74% were men, the mean ± SD symptom duration was 18 ± 12 years, and 83% were HLA– B27 positive. The majority (63%) had high or very high disease activity according to the ASDAS and had a high level of damage according to the mSASSS (mean ± SD 14 ± 19). Com-pared to excluded patients, those included were more likely to smoke (56% versus 48%), had a lower mean Bath Ankylosing Spondylitis Metrology Index (BASMI) score (2 versus 4), had a lower mean mSASSS (14 versus 22), and were more likely to be treated with NSAIDs (53% versus 36%) at baseline (Table 1).
Main analysis. In total, 442 intervals were included in the analysis, with 223 patients contributing 1 interval, 58 patients con-tributing 2 intervals, 30 patients contributing 3 intervals, 2 patients contributing 4 intervals, and 1 patient contributing 5 intervals. The mean ± SD progression was 1.33 ± 2.68 mSASSS units per 2- year interval. The SDC was 3.6, the ICC at baseline was 0.96, and the change score ICC was 0.47.
The interaction between ASDAS and TNFi at the start of the interval was significant (model 1; P = 0.100) with mSASSS continuous as the outcome (Table 2) but not with the binary outcomes (data not shown). A gradient was seen for the effect
Table 2. Indirect effect of TNFi on mSASSS, analyzed by the longitudinal association between ASDAS at the start of the 2- year interval and mSASSS 2 years later, according to the type of exposure to TNFi (multivariable models)
Exposure to TNFi Adjusted β (95% CI)* Interaction P†Model 1 (n = 313)‡
All visits (n = 119) 0.16 (0.00, 0.31)Some visits (n = 93) 0.28 (0.12, 0.45)§ 0.100Never (n = 101) 0.41 (0.13, 0.68)§
Model 2 (n = 306)¶All visits (n = 119) 0.10 (−0.07, 0.27)Some visits (n = 89) 0.29 (0.09, 0.48)§ 0.057Never (n = 99) 0.47 (0.13, 0.82)§
* 95% CI = 95% confidence interval.† Interaction between treatment with tumor necrosis factor inhibitors (TNFi) (yes/no) and Ankylosing Spondylitis Disease Activity Score (ASDAS) at the start of the interval. Significant interaction was prespecified as P < 0.15. ‡ Multivariable multilevel longitudinal generalized estimating equation (GEE) model with individual modified Stoke Ankylosing Spondylitis Spine Score (mSASSS) per reader as the outcome, adjusted for the correlation of mSASSS within each reader, mSASSS at the start of the interval, symptom duration (years), sex, HLA– B27, and the number of TNFi used before inclusion. § Significant effect. ¶ Multivariable longitudinal GEE model with the average of the 2 readers’ mSASSS scores as the outcome, adjusted for mSASSS at the start of the interval, symptom duration (years), sex, HLA– B27, and the number of TNFi used before inclusion.
Figure 1. Longitudinal association between Ankylosing Spondylitis Disease Activity Score using the C- reactive protein level (ASDAS- CRP) at the start of the 2- year interval and modified Stoke Ankylosing Spondylitis Spine Score (mSASSS) 2 years later, according to the type of exposure to tumor necrosis factor inhibitors (TNFi). Effects were tested using a multivariable multilevel longitudinal generalized estimating equation model with individual mSASSS scores per reader as the outcome, adjusted for the correlation of mSASSS within each reader (model 1; n = 313), and for mSASSS at the start of the interval, symptom duration (years), sex, HLA– B27, and number of TNFi used before inclusion. Values are the adjusted β (aβ) (95% confidence interval).

TNFi REDUCE SPINAL RADIOGRAPHIC PROGRESSION IN AXIAL SpA | 1215
Tab
le 3
. D
irect
effe
ct o
f TN
Fi o
n m
SA
SS
S, a
naly
zed
by a
ssoc
iatio
n be
twee
n tr
eatm
ent w
ith T
NFi
(yes
/no)
at e
ach
visi
t and
radi
ogra
phic
pro
gres
sion
2 y
ears
late
r (m
ultiv
aria
ble
mod
els)
*
mSA
SSS,
ad
just
ed β
(95%
CI)†
Chan
ge in
mSA
SSS
>0,
adju
sted
OR
(95%
CI)†
Chan
ge in
mSA
SSS
≥2,
adju
sted
OR
(95%
CI)†
≥1 n
ew s
ynde
smop
hyte
, ad
just
ed O
R (9
5% C
I)‡
≥1 n
ew s
ynde
smop
hyte
(≥
1 re
ader
), ad
just
ed
OR
(95%
CI)
Mod
el 1
§N
ot a
djus
ted
for A
SDAS
(n =
313
)−0
.86
(−1.
37, −
0.35
)¶0.
62 (0
.44,
0.8
9)¶
0.59
(0.4
0, 0
.87)
¶0.
67 (0
.45,
0.9
9)¶
– Ad
just
ed fo
r ASD
AS (n
= 3
13)
−0.8
5 (−
1.35
, −0.
35)¶
0.62
(0.4
3, 0
.89)
¶0.
59 (0
.40,
0.8
7)¶
0.67
(0.4
5, 0
.99)
¶–
Mod
el 2
#N
ot a
djus
ted
for A
SDAS
(n =
306
)−0
.80
(−1.
38, −
0.22
)¶0.
60 (0
.39,
0.9
3)¶*
*0.
63 (0
.39,
1.0
1)0.
69 (0
.35,
1.3
6)0.
78 (0
.50,
1.2
3)**
Adju
sted
for A
SDAS
(n =
306
)−0
.81
(−1.
39, −
0.24
)¶0.
60 (0
.38,
0.9
3)¶*
*0.
62 (0
.39,
1.0
1)0.
69 (0
.35,
1.3
5)0.
76 (0
.48,
1.2
1)**
* 95
% C
I = 9
5% c
onfid
ence
inte
rval
; OR
= od
ds ra
tio; A
SDAS
= A
nkyl
osin
g Sp
ondy
litis
Dis
ease
Act
ivity
Sco
re.
† Ad
judi
cate
d in
mod
el 2
. ‡
For m
odel
2, b
oth
read
ers
agre
ed o
n “≥
1 ne
w s
ynde
smop
hyte
.” §
Mul
tivar
iabl
e m
ultil
evel
long
itudi
nal g
ener
aliz
ed e
stim
atin
g eq
uatio
n (G
EE) m
odel
with
indi
vidu
al m
odifi
ed S
toke
Ank
ylos
ing
Spon
dylit
is S
pine
Sco
re (m
SASS
S) p
er re
ader
as
the
outc
ome,
adju
sted
for t
he c
orre
latio
n of
mSA
SSS
with
in e
ach
read
er, m
SASS
S at
the
star
t of t
he in
terv
al, s
ympt
om d
urat
ion
(yea
rs),
sex,
HLA
– B27
, and
the
num
ber o
f tum
or n
ecro
sis
fact
or in
hibi
tors
(T
NFi
) use
d be
fore
incl
usio
n.
¶ Si
gnifi
cant
eff
ect.
# M
ultiv
aria
ble
long
itudi
nal G
EE m
odel
with
the
aver
age
of th
e 2
read
ers’
mSA
SSS
scor
es a
s th
e ou
tcom
e, a
djus
ted
for m
SASS
S at
the
star
t of t
he in
terv
al, s
ympt
om d
urat
ion
(yea
rs),
sex,
H
LA– B
27, a
nd th
e nu
mbe
r of T
NFi
use
d be
fore
incl
usio
n.
** A
lso
adju
sted
for u
se o
f non
ster
oida
l ant
iinfla
mm
ator
y dr
ugs
befo
re b
asel
ine
(P <
0.0
5).

SEPRIANO ET AL 1216 |
of ASDAS at the start of the interval on mSASSS 2 years later, which was >2 times higher in patients never treated with TNFi (β = 0.41 [95% confidence interval (95% CI) 0.13, 0.68]) com-pared to those treated with TNFi at all visits (β = 0.16 [95% CI 0.00, 0.31]) (Table 2 and Figure 1). Results were similar for model 2. No other interactions were significant.
Treatment with TNFi was also directly associated with less mSASSS progression. After 2 years, patients who were receiving a TNFi at the start of the interval had on average an mSASSS 0.85 units lower compared to those not treated with a TNFi (model 1; β = −0.85 [95% CI −1.35, −0.35]), inde-pendently of ASDAS (Table 3). Results were similar with or
without adjustment for ASDAS and with binary definitions of progression, including development of ≥1 new syndesmophyte. The same findings were seen in model 2, except for change in mSASSS ≥2 and for new syndesmophytes, which were not significant.
Sensitivity analyses. The direct effect of TNFi on mSASSS was also significant in the sensitivity analysis allowing only a 6- month window between imaging and clinical visits (Table 4). In this analysis, the interaction between ASDAS and TNFi at each visit was also significant (P = 0.062), reflecting a similar gradient of the strength of the association between ASDAS and mSASSS in those treated with TNFi at all visits (β = 0.08 [95% CI −0.09, 0.24]) and those never treated (β = 0.42 [95% CI 0.08, 0.75]) as in the main analysis. Of note, the direct effect remained signifi-cant after PS adjustment (β = −0.80 [95% CI – 1.37, – 0.22]). There was, however, no significant direct effect or indirect effect (data not shown) of TNFi on mSASSS when other definitions of expo-sure to TNFi were used (Table 4).
DISCUSSION
In the present study of patients from both academic and community- based practice, we have shown that, in patients with radiographic axial SpA followed up in daily clinical practice, treat-ment with TNFi slows spinal radiographic progression by mech-anisms both dependent on and independent of their effect on inflammation as measured by the ASDAS. TNFi suppress the negative impact of systemic inflammation on radiographic pro-gression (indirect effect), which supports a strategy of targeting ASDAS to retard structural progression. In addition, TNFi reduce progression independently of ASDAS inflammation, suggesting that either residual inflammation not captured by the ASDAS or other, unknown mechanisms also contribute to structural modi-fication by TNFi.
Both treatment effects were tested in longitudinal models adjusted for time- varying confounders. In these models, we evaluated whether TNFi treatment at the start of each interval influenced the mSASSS 2 years later during follow- up, taking into account the presence of damage at the start of the inter-val (the autoregressive factor). This type of statistical model isolates the “within- patient” effect and, as such, allows a lon-gitudinal interpretation that best translates daily clinical prac-tice and, in the absence of a proper randomized controlled trial (RCT), approximates causality when combined with PS adjustment. In addition, each model was fit using 2 types of techniques to handle the fact that the outcome (mSASSS) is reported by more than 1 reader. The individual- reader multi-level model (model 1) increases the statistical power to detect subtle associations (25). The model with between- reader agreement scores (model 2; e.g., average of 2 scores) renders results easier to interpret.
Table 4. Sensitivity analyses of the association between exposure to TNFi and radiographic progression 2 years later (multivariable models)*
mSASSS, β (95% CI)
6- month window between imaging and the clinical visit
Model 1 (adjusted for ASDAS) (n = 266) −0.76 (−1.28, −0.25)†Model 2 (adjusted for ASDAS) (n = 249) −0.88 (−1.52, −0.23)†
Main analysis after PS adjustmentModel 1 (PS population, no PS
adjustment)NA
Model 1 (PS population, PS adjusted) NAModel 2 (PS population, no PS
adjustment) (n = 301)−0.87 (−1.45, −0.28)†
Model 2 (PS population, PS adjusted) (n = 301)
−0.80 (−1.37, −0.22)†
Alternative definitions of exposure to TNFiModel 1
TNFi between visits (yes/no) (n = 300) −0.37 (−0.86, 0.11)Duration of TNFi between visits (years)
(n = 300)−0.25 (−0.52, 0.01)
Proportion of time between visits with TNFi (0– 100%) (n = 300)
Continuous variable (0– 100%) −0.51 (−1.04, 0.03)Binary variable (>50 versus ≤50%) −0.42 (−0.94, 0.11)
Long versus short continuous TNFi exposure (≥4 years versus <4 years) (n = 313)
−0.31 (−0.85, 0.22)
Model 2TNFi between visits (yes/no) (n = 293) −0.45 (−1.02, 0.11)Duration of TNFi between visits (years)
(n = 293)−0.20 (−0.52, 0.11)
Proportion of time between visits with TNFi (0– 100%) (n = 293)
−0.41 (−1.04, 0.22)
Proportion of time between visits with TNFi (>50% versus ≤50%) (n = 293)
−0.23 (−0.81, 0.35)
Continuous TNFi (≥4 years versus <4 years) (n = 306)
−0.33 (−0.89, 0.24)
* Model 1 was a multivariable multilevel longitudinal generalized estimating equation (GEE) model with individual modified Stoke Ankylosing Spondylitis Spine Score (mSASSS) per reader as the outcome, adjusted for the correlation of mSASSS within each reader. Model 2 was a multivariable longitudinal GEE model with the average of the 2 readers’ mSASSS scores as the outcome. Both models were adjusted for mSASSS at the start of the interval, Ankylosing Spondylitis Disease Activity Score (ASDAS), symptom duration (years), sex, HLA– B27, and the number of tumor necrosis factor inhibitors (TNFi) used before inclusion. 95% CI = 95% confidence interval; PS = propensity score; NA = not applicable. † Significant association.

TNFi REDUCE SPINAL RADIOGRAPHIC PROGRESSION IN AXIAL SpA | 1217
Within this analytical framework, we have found that treat-ment with TNFi over time modifies the longitudinal association between ASDAS and mSASSS as noted by the significant inter-action between TNFi and ASDAS. This finding follows a pre-vious study, performed in the same cohort (26), and another in an independent cohort (6), in which higher ASDAS was found to be longitudinally associated with an increase in mSASSS 2 years later. In the present study, the impact of ASDAS on mSASSS in patients who have been continuously treated with TNFi during the follow- up was, on average, less than half compared to the impact in those who were never treated. This finding is consistent with recent well- designed observational studies, suggesting that TNFi interferes with radiographic progression by decreasing inflamma-tion as measured by the ASDAS (21,22). Thus, even without a definite answer provided by an RCT to this highly clinically rele-vant question, enough evidence has accumulated to convincingly argue in favor of a positive effect of lowering ASDAS on spinal radiographic progression for the management of axial SpA.
In contrast to previous studies, however, we did not find that the reduction in ASDAS fully explained the beneficial effect of TNFi on structural progression (21,22). There was also a sig-nificant direct effect. On average, patients treated with a TNFi had 0.9 mSASSS units less progression at the end of the inter-val compared to those not treated, independently of ASDAS. Similarly, patients treated with TNFi were 30% less likely to develop a new syndesmophyte 2 years later compared to those not treated. Different from the effect on mSASSS, the effect of TNFi on syndesmophyte formation was only significant in the model with individual- reader data. As noted above, the higher statistical power yielded by this type of model compared to the model with agreement scores most likely explains the dis-crepancy. Of note, we did not find, in either model, a significant effect for alternative definitions of treatment with TNFi, most of which reflected the time receiving treatment. Although our data do not support the hypothesis that duration of exposure to TNFi influences its structural effects, the majority of patients had a maximum of 4 years of exposure, thus still with relatively limited follow- up.
Differences in study design, patient characteristics, and ana-lytical approaches might, at least partially, explain why, contrary to previous studies, we detected a direct effect of TNFi on mSASSS (21,22). In addition, it should be noted that the “direct effect” may also reflect the effect of TNFi on inflammation detected on MRI, which might not be picked up by the ASDAS, or even “residual” inflammation not captured by any currently available measure. Also, between- visit fluctuations in inflammation can also account for part of the unmeasured inflammatory burden. These obser-vations might, to a certain degree, explain why it has previously been found that radiographic progression still occurs in patients with inactive disease according to the ASDAS (6), and that most new bone formation in the spine occurs in sites without previous evidence of inflammatory lesions on MRI (5,8).
Keeping the above words of caution in mind, it is not unreason-able to hypothesize that at least part of the ASDAS- independent effect seen in the present study goes beyond residual confound-ing. In fact, TNFi have been shown to have a wide range of bio-logic actions (27), some of which could interfere with processes other than those driving inflammatory activity. For example, sev-eral histopathologic studies have demonstrated granulation tissue in the subchondral bone marrow of several types of affected joints in radiographic axial SpA, such as the sacroiliac, manubriosternal, and facet joints, as well as in vertebral bodies (28– 31). Cells lining the granulation tissue express typical markers of osteoblasts, and the directed invasion of the granulation tissue into the subchon-dral bone and the colocalization of aberrant bone formation with this tissue support an instrumental role of this granulation tissue in the progressive joint remodeling and ankylosis in radiographic axial SpA (32). Within this tissue, osteoclasts have been located almost exclusively at the edges of the granulation tissue at the apical border facing the subchondral bone, suggesting that they facilitate the invasion of this tissue through the subchondral bone (28). TNF- mediated osteoclast activation and bone erosion may therefore constitute a crucial early step in the development of structural damage that ultimately leads to ankylosis.
Certain animal models suggest a role for TNF in the anky-losis of SpA. Bone morphogenetic proteins (BMPs) have been shown to play a role in the development of ankylosis in the anky-losing enthesitis model of SpA (33). Evaluation of synovial tissue obtained by arthroscopy from patients with SpA has demon-strated TNF- mediated expression of BMPs in fibroblast- like syn-oviocytes (FLS) (34). However, TNF blockade with the soluble TNF receptor etanercept did not ameliorate development of ankylosis in this model (35). A more recent study demonstrated that TNF did enhance osteoblastic differentiation of FLS derived from the syn-ovial tissue of patients with SpA (36). A new animal model of SpA has been created based on selective overexpression of trans-membrane TNF in mice which leads to axial and peripheral joint pathology reminiscent of human SpA with peripheral and axial synovitis, enthesitis, and osteitis (37). These mice displayed clear features of new bone formation in the inflamed peripheral joints as well as in the sacroiliac joint and spine. SpA- like inflammation, but not osteoproliferation, was dependent on TNF receptor type I and mediated by stromal transmembrane TNF overexpression, while TNF receptor type II signaling contributed to pathologic new bone formation but was not essential for inflammation. Relative overexpression of transmembrane TNF compared to soluble TNF was also demonstrated in synovial tissue biopsy specimens from patients with active SpA versus active RA as control. These data support the premise that TNF drives distinct pathologies relevant to SpA which may be variably captured by clinical parameters of disease activity. Further research into the potential mechanisms that influence structural progression independently of inflamma-tion could pave the way to new developments in the treatment of patients with axial SpA. Head- to- head trials comparing drugs

SEPRIANO ET AL 1218 |
with different modes of action could also offer some clues in the near future.
There are two additional important points concerning the direct effect. First, treatment with NSAIDs during follow- up was not associated with the outcome, nor did it modify or confound the association between TNFi and mSASSS. The lack of a struc-tural effect of concomitant treatment with NSAIDs has been noted before, including in one study in which the effect of the amount of exposure to NSAIDs was determined (21,22). In only one study, which is currently available only in abstract form, was a positive additive effect of NSAIDs reported (38). Thus, available evidence mostly suggests that, among patients with radiographic axial SpA receiving TNFi, there is no (structural) benefit of add-ing NSAIDs. Whether or not such a benefit exists in TNFi- naive patients is yet to be clarified (13– 15). Second, the direct effect of TNFi on mSASSS was still present after adjustment for PS. With PS adjustment, we aimed to handle the absence of random treat-ment allocation and as such mitigate, to the extent possible, the possible effect of confounding by indication. A similar approach was used in a recent study that led to similar conclusions (39). Variables that precede, and influence, the decision to prescribe a TNFi and that also associate with radiographic progression were included and balanced among patients who were treated and those who were not treated at baseline. Even with imperfect bal-ancing, the decrease in the effect from 0.9 to 0.8 after PS adjust-ment suggests that confounding by indication was indeed present and that it was, at least partially, handled by the PS.
Our study is not without limitations. First, residual confound-ing cannot be completely ruled out. However, this problem is common to all observational research in which an increase in external validity comes with a decrease in internal validity. Also, we did carefully consider and address confounding with a robust analytical approach aimed at minimizing its detrimental effects. Second, most patients included in the study had either one or two intervals with radiographs available. Thus, interpretation of our findings is limited as regards possible long- term treatment effects. However, by using longitudinal data analysis we made the best use of the available data compared to the traditional completers’ analysis often undertaken when testing treatment effects. Finally, due to sample size restrictions, we could not evaluate the effect of each TNFi separately. However, there is currently no evidence to suggest that different types of TNFi might impact disease modifi-cation in a differential manner.
In summary, the present study informs the rheumatology community by addressing the question of whether or not TNFi inhibit radiographic progression in axial SpA and if this effect is mediated solely by their effects on inflammation, as measured by the ASDAS, or whether additional mechanisms may be rel-evant. Our data further stress the potential impact of treatment strategies targeting the suppression of ASDAS in the manage-ment of axial SpA. In addition, we hypothesize that our finding of a direct effect of TNFi on radiographic progression suggests that
these agents could also influence cells and pathways not directly linked to inflammation, such as osteoclasts. A better understand-ing of these mechanisms might open avenues to further treatment strategies that might finally lead to effective disease modification in axial SpA.
ACKNOWLEDGMENTS
The authors sincerely thank the staff and all patients of the ALBERTA FORCAST study.
AUTHOR CONTRIBUTIONS
All authors were involved in drafting the article or revising it critically for important intellectual content, and all authors approved the final version to be published. Dr. Sepriano had full access to all of the data in the study and takes responsibility for the integrity of the data and the accuracy of the data analysis.Study conception and design. Sepriano, Ramiro, Chiowchanwisawakit, van der Heijde, Landewé, Maksymowych.Acquisition of data. Maksymowych.Analysis and interpretation of data. Sepriano, Ramiro, Wichuk, Chiowchanwisawakit, Paschke, van der Heijde, Landewé, Maksymowych.
REFERENCES 1. Lukas C, Landewé R, Sieper J, Dougados M, Davis J, Braun J,
et al. Development of an ASAS- endorsed disease activity score(ASDAS) in patients with ankylosing spondylitis. Ann Rheum Dis2009;68:18– 24.
2. Maksymowych WP. The role of imaging in the diagnosis and man-agement of axial spondyloarthritis [review]. Nat Rev Rheumatol2019;15:657– 72.
3. Machado P, Landewé R, Braun J, Hermann KG, Baraliakos X, BakerD, et al. A stratified model for health outcomes in ankylosing spon-dylitis. Ann Rheum Dis 2011;70:1758– 64.
4. Creemers MC, Franssen MJ, van ’t Hof MA, Gribnau FW, van dePutte LB, van Riel PL. Assessment of outcome in ankylosing spon-dylitis: an extended radiographic scoring system. Ann Rheum Dis2005;64:127– 9.
5. Van der Heijde D, Machado P, Braun J, Hermann KG, BaraliakosX, Hsu B, et al. MRI inflammation at the vertebral unit only mar-ginally predicts new syndesmophyte formation: a multilevel anal-ysis in patients with ankylosing spondylitis. Ann Rheum Dis2012;71:369– 73.
6. Ramiro S, van der Heijde D, van Tubergen A, Stolwijk C, DougadosM, van den Bosch F, et al. Higher disease activity leads to morestructural damage in the spine in ankylosing spondylitis: 12-year longitudinal data from the OASIS cohort. Ann Rheum Dis2014;73:1455– 61.
7. Poddubnyy D, Protopopov M, Haibel H, Braun J, Rudwaleit M, Sieper J. High disease activity according to the Ankylosing SpondylitisDisease Activity Score is associated with accelerated radiographicspinal progression in patients with early axial spondyloarthritis:results from the GErman SPondyloarthritis Inception Cohort. AnnRheum Dis 2016;75:2114– 8.
8. Machado PM, Baraliakos X, van der Heijde D, Braun J, LandewéR. MRI vertebral corner inflammation followed by fat deposition isthe strongest contributor to the development of new bone at thesame vertebral corner: a multilevel longitudinal analysis in patients with ankylosing spondylitis. Ann Rheum Dis 2016;75:1486– 93.
9. Baraliakos X, Listing J, Rudwaleit M, Sieper J, Braun J. The relation-ship between inflammation and new bone formation in patients withankylosing spondylitis. Arthritis Res Ther 2008;10:R104.

TNFi REDUCE SPINAL RADIOGRAPHIC PROGRESSION IN AXIAL SpA | 1219
10. Haroon N, Inman RD, Learch TJ, Weisman MH, Lee M, Rahbar MH, et al. The impact of tumor necrosis factor α inhibitors on radi-ographic progression in ankylosing spondylitis. Arthritis Rheum 2013;65:2645– 54.
11. Sepriano A, Regel A, van der Heijde D, Braun J, Baraliakos X, Landewé R, et al. Efficacy and safety of biological and targeted- synthetic DMARDs: a systematic literature review informing the 2016 update of the ASAS/EULAR recommendations for the management of axial spondyloarthritis. RMD Open 2017;3:e000396.
12. Van der Heijde D, Ramiro S, Landewé R, Baraliakos X, van den Bosch F, Sepriano A, et al. 2016 update of the ASAS- EULAR man-agement recommendations for axial spondyloarthritis. Ann Rheum Dis 2017;76:978– 91.
13. Wanders A, van der Heijde D, Landewé R, Béhier JM, Calin A, Olivieri I, et al. Nonsteroidal antiinflammatory drugs reduce radiographic progression in patients with ankylosing spondylitis: a randomized clinical trial. Arthritis Rheum 2005;52:1756– 65.
14. Kroon F, Landewé R, Dougados M, van der Heijde D. Continuous NSAID use reverts the effects of inflammation on radiographic pro-gression in patients with ankylosing spondylitis. Ann Rheum Dis 2012;71:1623– 9.
15. Sieper J, Listing J, Poddubnyy D, Song IH, Hermann KG, Callhoff J, et al. Effect of continuous versus on- demand treatment of ankylosing spondylitis with diclofenac over 2 years on radiographic progression of the spine: results from a randomised multicentre trial (ENRADAS). Ann Rheum Dis 2016;75:1438– 43.
16. Van der Heijde D, Landewé R. Inhibition of spinal bone formation in AS: 10 years after comparing adalimumab to OASIS [editorial]. Arthritis Res Ther 2019;21:225.
17. Boers N, Michielsens CA, van der Heijde D, den Broeder AA, Welsing PM. The effect of tumour necrosis factor inhibitors on radiographic progression in axial spondyloarthritis: a systematic literature review. Rheumatology (Oxford) 2019;58:1907– 22.
18. Karmacharya P, Duarte- Garcia A, Dubreuil M, Murad MH, Shahukhal R, Shrestha P, et al. Effect of therapy on radiographic progression in axial spondyloarthritis: a systematic review and meta- analysis. Arthritis Rheumatol 2020;72:733– 49.
19. Baraliakos X, Gensler LS, D’Angelo S, Iannone F, Favalli EG, de Peyrecave N, et al. Biologic therapy and spinal radiographic progression in patients with axial spondyloarthritis: a struc-tured literature review. Ther Adv Musculoskelet Dis 2020;12: 1759720X20906040.
20. Dougados M, Baeten D. Spondyloarthritis. Lancet 2011;377: 2127– 37.
21. Molnar C, Scherer A, Baraliakos X, de Hooge M, Micheroli R, Exer P, et al. TNF blockers inhibit spinal radiographic progression in ankylosing spondylitis by reducing disease activity: results from the Swiss Clinical Quality Management cohort. Ann Rheum Dis 2018;77:63– 9.
22. Park JW, Kim MJ, Lee JS, Ha YJ, Park JK, Kang EH, et al. Impact of tumor necrosis factor inhibitor versus nonsteroidal antiinflamma-tory drug treatment on radiographic progression in early ankylosing spondylitis: its relationship to inflammation control during treatment. Arthritis Rheumatol 2019;71:82– 90.
23. Van der Linden S, Valkenburg HA, Cats A. Evaluation of diagnostic criteria for ankylosing spondylitis: a proposal for modification of the New York criteria. Arthritis Rheum 1984;27:361– 8.
24. Ramiro S, Stolwijk C, van Tubergen A, van der Heijde D, Dougados M, van den Bosch F, et al. Evolution of radiographic damage in
ankylosing spondylitis: a 12 year prospective follow- up of the OASIS study. Ann Rheum Dis 2015;74:52– 9.
25. Sepriano A, Ramiro S, van der Heijde D, Dougados M, Claudepierre P, Feydy A, et al. Integrated longitudinal analysis does not compro-mise precision and reduces bias in the study of imaging outcomes: a comparative 5- year analysis in the DESIR cohort. Semin Arthritis Rheum 2020;50:1394– 9.
26. Sepriano A, Ramiro S, Wichuk S, Chiowchanwisawakit P, Paschke J, van der Heijde D, et al. Disease activity is associated with spinal radiographic progression in axial spondyloarthritis independently of exposure to tumour necrosis factor inhibitors [letter]. Rheumatology (Oxford) 2020;60:461– 2.
27. Sedger LM, McDermott MF. TNF and TNF- receptors: from mediators of cell death and inflammation to therapeutic giants– past, present and future [review]. Cytokine Growth Factor Rev 2014;25:453– 72.
28. Bleil J, Maier R, Hempfing A, Schlichting U, Appel H, Sieper J, et al. Histomorphologic and histomorphometric characteristics of zygapophyseal joint remodeling in ankylosing spondylitis. Arthritis Rheumatol 2014;66:1745– 54.
29. Bollow M, Fischer T, Reisshauer H, Backhaus M, Sieper J, Hamm B, et al. Quantitative analyses of sacroiliac biopsies in spondyloar-thropathies: T cells and macrophages predominate in early and active sacroiliitis– cellularity correlates with the degree of enhance-ment detected by magnetic resonance imaging. Ann Rheum Dis 2000;59:135– 40.
30. Cruickshank B. Histopathology of diarthrodial joints in ankylosing spondylitis. Ann Rheum Dis 1951;10:393– 404.
31. Gong Y, Zheng N, Chen SB, Xiao ZY, Wu MY, Liu Y, et al. Ten years’ experience with needle biopsy in the early diagnosis of sacroiliitis. Arthritis Rheum 2012;64:1399– 406.
32. Bleil J, Maier R, Hempfing A, Sieper J, Appel H, Syrbe U. Granulation tissue eroding the subchondral bone also promotes new bone forma-tion in ankylosing spondylitis. Arthritis Rheumatol 2016;68:2456– 65.
33. Lories RJ, Derese I, Luyten FP. Modulation of bone morphogenetic protein signaling inhibits the onset and progression of ankylosing enthesitis. J Clin Invest 2005;115:1571– 9.
34. Lories RJ, Derese I, Ceuppens JL, Luyten FP. Bone morphogenetic proteins 2 and 6, expressed in arthritic synovium, are regulated by proinflammatory cytokines and differentially modulate fibroblast- like synoviocyte apoptosis. Arthritis Rheum 2003;48:2807– 18.
35. Lories RJ, Derese I, de Bari C, Luyten FP. Evidence for uncoupling of inflammation and joint remodeling in a mouse model of spondylar-thritis. Arthritis Rheum 2007;56:489– 97.
36. Van Tok MN, van Duivenvoorde LM, Kramer I, Ingold P, Pfister S, Roth L, et al. Interleukin- 17A inhibition diminishes inflammation and new bone formation in experimental spondyloarthritis. Arthritis Rheumatol 2019;71:612– 25.
37. Kaaij MH, van Tok MN, Blijdorp IC, Ambarus CA, Stock M, Pots D, et al. Transmembrane TNF drives osteoproliferative joint inflam-mation reminiscent of human spondyloarthritis. J Exp Med 2020; 217:e20200288.
38. Gensler LS, Gianfrancesco M, Weisman MH, Brown MA, Lee M, Learch T, et al. Combined effects of tumour necrosis factor inhibitors and NSAIDs on radiographic progression in ankylosing spondylitis [abstract]. Ann Rheum Dis 2018;77 Suppl 2:148.
39. Koo BS, Oh JS, Park SY, Shin JH, Ahn GY, Lee S, et al. Tumour necrosis factor inhibitors slow radiographic progression in patients with ankylosing spondylitis: 18- year real- world evidence. Ann Rheum Dis 2020;79:1327– 32.

1220
Arthritis & RheumatologyVol. 73, No. 7, July 2021, pp 1220–1232DOI 10.1002/art.41652© 2021 The Authors. Arthritis & Rheumatology published by Wiley Periodicals LLC on behalf of American College of Rheumatology.This is an open access article under the terms of the Creative Commons Attribution- NonCommercial License, which permits use, distribution and reproduction in any medium, provided the original work is properly cited and is not used for commercial purposes.
Tissue- Resident Memory CD8+ T Cells From Skin Differentiate Psoriatic Arthritis From PsoriasisEmmerik F. Leijten,1 Tessa S. van Kempen,1 Michel A. Olde Nordkamp,1 Juliette N. Pouw,1 Nienke J. Kleinrensink,1 Nanette L. Vincken,1 Jorre Mertens,1 Deepak M. W. Balak,1 Fleurieke H. Verhagen,1 Sarita A. Hartgring,1 Erik Lubberts,2 Janneke Tekstra,1 Aridaman Pandit,1 Timothy R. Radstake,1 and Marianne Boes1
Objective. To compare immune cell phenotype and function in psoriatic arthritis (PsA) versus psoriasis in order to better understand the pathogenesis of PsA.
Methods. In- depth immunophenotyping of different T cell and dendritic cell subsets was performed in patients with PsA, psoriasis, or axial spondyloarthritis and healthy controls. Subsequently, we analyzed cells from peripheral blood, synovial fluid (SF), and skin biopsy specimens using flow cytometry, along with high- throughput transcriptome analyses and functional assays on the specific cell populations that appeared to differentiate PsA from psoriasis.
Results. Compared to healthy controls, the peripheral blood of patients with PsA was characterized by an increase in regulatory CD4+ T cells and interleukin- 17A (IL- 17A) and IL- 22 coproducing CD8+ T cells. One population specifically differentiated PsA from psoriasis: i.e., CD8+CCR10+ T cells were enriched in PsA. CD8+CCR10+ T cells expressed high levels of DNAX accessory molecule 1 and were effector memory cells that coexpressed skin- homing receptors CCR4 and cutaneous lymphocyte antigen. CD8+CCR10+ T cells were detected under inflammatory and homeostatic conditions in skin, but were not enriched in SF. Gene profiling further revealed that CD8+CCR10+ T cells expressed GATA3, FOXP3, and core transcriptional signature of tissue- resident memory T cells, including CD103. Specific genes, including RORC, IFNAR1, and ERAP1, were up- regulated in PsA compared to psoriasis. CD8+CCR10+ T cells were endowed with a Tc2/22- like cytokine profile, lacked cytotoxic potential, and displayed overall regulatory function.
Conclusion. Tissue- resident memory CD8+ T cells derived from the skin are enhanced in the circulation of patients with PsA compared to patients with psoriasis alone. This may indicate that aberrances in cutaneous tissue homeostasis contribute to arthritis development.
INTRODUCTION
New critical insights into the pathogenesis of psoriasis and psoriatic arthritis (PsA) have been made in recent years, including the role of the interleukin- 23 (IL- 23)/IL- 17 axis (1,2). This finding further propelled the development of novel drugs with potential to vastly improve psoriasis, but their strength at halting arthritis is less impressive. A clearer understanding of the pathogenesis of PsA could guide the development of therapeutics capable of resolving arthritis.
The prevalence of PsA in patients with psoriasis is ~20% (2), and in its simplest form, PsA presents with arthritis in a patient with a history of psoriasis. However, the relationship between skin and joint manifestations encompasses a spectrum: patients can have severe psoriasis without musculoskeletal symptoms, while others have minimal psoriasis and severe arthritis.
This raised the question of whether these diseases are part of a single spectrum or are separate entities (3,4). More specifi-cally, it is currently unknown whether immunologic processes in the skin and the joint are directly related. One possibility is that
1Emmerik F. Leijten, MD, Tessa S. van Kempen, PhD, Michel A. Olde Nordkamp, BSc, Juliette N. Pouw, MD, Nienke J. Kleinrensink, MD, Nanette L. Vincken, MD, Jorre Mertens, MD, PhD, Deepak M. W. Balak, MD, PhD, Fleurieke H. Verhagen, MD, PhD, Sarita A. Hartgring, PhD, Janneke Tekstra, MD, PhD, Aridaman Pandit, PhD, Timothy R. Radstake, MD, PhD, Marianne Boes, PhD: University Medical Center Utrecht, Utrecht, The Netherlands; 2Erik Lubberts, PhD: Erasmus University Medical Center, Rotterdam, The Netherlands.
Drs. Radstake and Boes contributed equally to this work.
Dr. Balak has received consulting fees from Janssen (less than $10,000). Dr. Radstake has received consulting fees from Janssen (less than $10,000) and owns stock or stock options in AbbVie. No other disclosures relevant to this article were reported.
Address correspondence to Emmerik F. Leijten, MD, University Medical Center Utrecht, PO Box 85500, Utrecht 3508GA, The Netherlands. Email: [email protected].
Submitted for publication August 20, 2020; accepted in revised form January 7, 2021.

DIFFERENCES IN SKIN Trm CD8+ T CELLS IN PsA VERSUS PSORIASIS | 1221
immunologic processes in the skin and the joint occur in paral-lel, but independently from each other. Some arguments for this hypothesis are the aforementioned clinical disease heterogeneity of PsA and the finding that response to specific treatment targets varies by tissue site (2). Also, observations that local tissue dam-age (e.g., the Koebner phenomenon) can trigger local inflamma-tion (5) fit this concept.
Another possibility is that the pathophysiologic processes are directly linked and occur sequentially. Supporting this hypothesis is the fact that psoriasis itself is a strong risk factor for the develop-ment of arthritis and that psoriasis typically precedes the onset of arthritis by several years. In this scenario, immune cells, cytokines, and/or other mediators induced by skin inflammation could trigger a second hit at the joint. Indeed, soluble factors have been shown to be capable of inducing models of spondyloarthritis (SpA) (6), potentially sparking responses of resident, innate lymphocytes at musculoskeletal sites (7).
While the role of different immune cells in the skin and joints has been described (1), there have been few studies explicitly comparing immune cells between psoriasis and PsA (8– 11). In this study, we first performed in- depth immunophenotyping in patients with psoriasis and patients with PsA who had not been treated with disease- modifying antirheumatic drugs (DMARDs) and were matched with the psoriasis patients for skin disease activity as measured by Psoriasis Area and Severity Index (PASI) (12). This was followed by phenotypic, transcriptomic, and func-tional investigations to determine the specific CD8+ T cell subset that best distinguished PsA from psoriasis.
PATIENTS AND METHODS
Study cohort and samples. The study was conducted at the Department of Rheumatology and Clinical Immunology, Univer-sity Medical Centre Utrecht (UMCU), in accordance with the Dec-laration of Helsinki and with approval from the institutional review board. Written informed consent was obtained from all patients before participation. Patients with psoriasis had a dermatologist- confirmed diagnosis. All patients classified as having psoriasis alone underwent clinical evaluation to exclude concomitant PsA. Patients with PsA fulfilled the Classification of Psoriatic Arthritis (CASPAR) Study Group criteria (13). Patients with axial SpA met the Assessment of SpondyloArthritis international Society classifi-cation criteria (14) and did not have concomitant psoriasis.
In the first phase of the study, the frequency of T cells and dendritic cell (DC) subsets in peripheral blood mononuclear cells (PBMCs) from patients with PsA (n = 21) was compared to that in healthy controls (n = 20), patients with psoriasis (n = 21), and patients with axial SpA (n = 16). Patients with psoriasis and patients with PsA were matched for key clinical parameters, including PASI (Supplementary Table 1, available on the Arthritis & Rheumatology website at http://onlin elibr ary.wiley.com/doi/10.1002/art.41652/ abstract). In the second phase, we specifically investigated the
properties of CD8+CCR10+ T cells, for which additional samples were collected: PBMCs (from 32 healthy controls, 17 patients with psoriasis, and 18 patients with PsA), synovial fluid (SF) (from 8 patients with PsA), and skin biopsy samples (from 6 patients with PsA and 8 patients with psoriasis). With the exception of SF sam-ples, all samples were obtained from patients who were not being treated with DMARDs at the time of participation.
Sample collection. PBMCs were isolated by density centrifugation using Ficoll- Paque Plus (GE Healthcare) from lithium- heparinized venous blood and first stored in liquid nitro-gen. Four- millimeter punch biopsy sections from lesional psori-atic skin sites (donor- dependent lesional sites) and nonlesional skin sites (always dorsal thorax) were obtained and placed in phosphate buffered saline on ice before further processing. The skin biopsy samples were subjected to mechanical and tissue digestion according to the manufacturer’s protocol (Whole Skin Dissociation Kit, human; Miltenyi Biotec), after which flow cytom-etry was performed on the freshly digested skin biopsy samples. SF mononuclear cells were isolated by density centrifugation using a Ficoll- Paque Plus gradient procedure and first stored in liquid nitrogen.
Flow cytometry. Four different flow cytometry panels were used to identify and enumerate in thawed PBMCs the relative frequency of a broad range of T cell and DC subsets (Supple-mentary Figures 1– 4, available on the Arthritis & Rheumatology website at http://onlin elibr ary.wiley.com/doi/10.1002/art.41652/ abstract), using a standardized flow- cytometry protocol, as pre-viously described (15). Antibodies used are listed in Supplemen-tary Table 2 (http://onlin elibr ary.wiley.com/doi/10.1002/art.41652/ abstract). Fixation and permeabilization solution was used for intracellular antibody staining according to the manufacturer’s instructions (eBioscience). Fluorescence minus one was used as negative control for determining manual gating strategy. Flow cytometry data were acquired using a BD LSRFortessa Cell ana-lyzer, and flow cytometric cell sorting was performed using a BD FACSAria III cell sorter (BD Bioscience). Different subsets of CD8+ T cells were flow sorted based on expression of CCR10 and/or CCR4 (Supplementary Figure 5, http://onlin elibr ary.wiley.com/doi/10.1002/art.41652/ abstract) for proliferation suppression assays and RNA sequencing.
Functional assays. For quantification of intracellular cytokine production by flow cytometry, PBMCs were restimulated for 4 hours in culture medium (RPMI 1640 with 10% fetal calf serum), with phorbol 12- myristate 13- acetate (PMA), ionomycin calcium salt, and BD GolgiPlug (BD Biosciences) at 37°C.
Proliferation suppression assays were performed in accord-ance with established protocols for Treg cells (16). For this assay, “regulatory- type” cells and “target cells” were derived from fresh PBMCs isolated from 6 healthy controls. The “regulatory- type”

LEIJTEN ET AL 1222 |
cells were different flow- sorted CD8+ T cell subsets (Supplemen-tary Figure 5, http://onlin elibr ary.wiley.com/doi/10.1002/art.41652/ abstract). The target cells were CellTrace Violet (Thermo Fisher) labeled autologous PBMCs. The “regulatory- type” cells and target cells were resuspended in culture medium (RPMI 1640 with 10% fetal calf serum) and cocultured at a ratio of 1:2 cells, respectively,
in anti- CD3– coated plates for 4 days. The readout was the per-centage of proliferated target cells. As reference for the readout, regulatory CD4+ T cells (CD3+CD4+CD25high CD127−) and effec-tor CD4+ T cells (CD3+CD4+CD25−CD127high) were flow sorted from the same donors in each experiment, which indicated that the suppression assay worked (results not shown).
Figure 1. Phenotype and function of circulating immune cell subsets in psoriatic arthritis (PsA), and frequencies of T cell and dendritic cell subsets in peripheral blood mononuclear cells. A, Heatmap showing the top 20 flow cytometry features that best distinguished the different groups studied (healthy controls [HCs] and patients with axial spondyloarthritis [AxSpA], psoriasis [Pso], or psoriatic arthritis [PsA]), as assessed by analysis of variance. B, CCR10+ cells within CD8+CD45RO+ T cells. C, IL- 17A+IL- 22+ cells within CD8+ T cells. D, FoxP3+CD25+CD45RO+ cells within CD4+ T cells. E, CD161+CCR6+ cells within CD8+CD45RO+ T cells. F, CD303+ cells within DR+CD14−CD16−cells. Symbols represent individual subjects; bars show the median. * = P < 0.05. IL- 17A = interleukin- 17A.

DIFFERENCES IN SKIN Trm CD8+ T CELLS IN PsA VERSUS PSORIASIS | 1223
RNA sequencing. Distinct CD8+ T cell subsets were flow sorted from thawed PBMCs (8 healthy controls, 6 patients with psoriasis, and 6 patients with PsA) (Supplementary Figure 5, avail-able on the Arthritis & Rheumatology website at http://onlin elibr ary.wiley.com/doi/10.1002/art.41652/ abstract). Cells were lysed using Buffer RLT Plus in the presence of β- mercaptoethanol (final con-centration 1%), and RNA was isolated according to the manufac-turer’s protocol (Qiagen Universal Kit). In total, 57 samples were used for analysis, and all passed internal quality control checks. RNA sequencing was performed using an Illumina HiSeq 4000 sequencer (paired- end, 150 bp) at GenomeScan in Leiden, The Netherlands using standard manufacturer’s protocols. FastQC (https://www.bioin forma tics.babra ham.ac.uk/proje cts/fastq c/) was used to check the quality of the raw reads obtained from RNA- Seq. STAR aligner was used to align the reads to the human genome (GRCh38 build 79) (17,18). HTSeq was used to obtain read counts for each annotated gene (19). Differentially expressed genes (DEGs) were identified using Bioconductor/R package DESeq2 (20). Wald’s test was used to identify differential gene expressions between conditions (healthy controls, patients with psoriasis, and patients with PsA) and cell subset pairs (Supplementary Figure 5, http://onlin elibr ary.wiley.com/doi/10.1002/art.41652/ abstract). Variance stabilizing transformation was applied to the raw read count data to obtain normalized gene counts (variance- stabilized data), which were used for subsequent plotting. The heatmap, principal compo-nents analysis, and violin plots were plotted using R.
Statistical analysis. Categorical variables were com-pared using chi- square tests, and group differences were com-pared using the Mann- Whitney U test or independent- samples t- test (based on normality distribution). Group differences were compared using Wilcoxon’s signed rank test for paired samples. Spearman’s rank correlation was used to test the association between clinical parameters and flow cytometry results.
Flow cytometry data were analyzed using FlowJo software (TreeStar). Statistical analysis and visual representation of the data were performed using SPSS version 25 and GraphPad Prism soft-ware, version 7.0. The heatmap of flow cytometry results was made with MetaboAnalyst 4.0, using Ward’s clustering algorithm and autoscaling of features (21). Venn diagrams were made using Venny 2.1 (22). P values less than 0.05 were considered significant.
RESULTS
Higher frequency of circulating CD8+CD45RO+CCR10+ T cells in patients with PsA compared to patients with psoriasis. We compared the frequency of T cell and DC subsets in peripheral blood from patients with PsA versus healthy controls, patients with psoriasis, and axial SpA using our standardized immu-nophenotyping panels (Supplementary Table 1 and Supplementary Figures 1– 4, http://onlin elibr ary.wiley.com/doi/10.1002/art.41652/ abstract). The results of immunophenotyping indicate that PBMC
subsets from patients with psoriasis and PsA are generally similar (Figure 1A). The CD8+CD45RO+CCR10+ subset was the only cell population that was significantly different between patients with PsA and those with psoriasis, with higher levels found in patients with PsA (P < 0.05) (Figure 1B). Compared to healthy controls, patients with PsA had increased frequencies of CD8+CCR10+ T cells, CD8+IL- 17A+IL- 22+ T cells, and regulatory CD4+ T cells. Patients with PsA also had reduced frequencies of plasmacy-toid DCs and CD8+CD161+CCR6+ T cells (mucosal- associated invariant T– like cells) compared to healthy controls (Figures 1B– F). Considering that there are few studies that have examined CCR10 expression on CD8+ T cells (23– 25), we subsequently set out to further characterize the phenotype, origin, and function of CCR10 expression on CD8+ T cells in general and in relation to PsA.
CCR10 expression on CD8+ T cells marks a memory, DNAM- 1high phenotype. We first reexamined the phenotype of CD8+ T cells that expressed CCR10 (not using CD45RO+ T cells as a prerequisite). As expected, when directly gating on CD8+CCR10+ T cells, we found that the majority were classified as either central memory T (Tcm) cells or effector memory T (Tem) cells (Supplementary Figures 6A and B, http://onlin elibr ary.wiley.com/doi/10.1002/art.41652/ abstract). CCR10 expression was signifi-cantly elevated in both Tcm and Tem subsets in patients with PsA (Supplementary Figures 6C and D). CD8+CCR10+ T cells were also enriched for CCR6 coexpression. The expression of CD45RO, CD27, CCR6, and CXCR3 with respect to CD8+CCR10+ T cells was similar across patient groups (data not shown).
We broadly screened additional CD8 T cell markers and found that CD8+CCR10+ T cells coexpressed DNAX acces-sory molecule 1 (DNAM- 1) (Figure 2A). DNAM- 1 is an activating receptor, and T cell immunoreceptor with Ig and immunoreceptor tyrosine- based inhibition motif domains (TIGIT) is an inhibitory receptor on T cells, that compete for binding to CD155, an immunoglobulin- like adhesion molecule. Based on DNAM- 1 and TIGIT, distinct coexpression patterns were detected on CD8+ T cells (Figure 2B). Overall, CD8+CCR10+ T cells were typi-cally DNAM- 1high (Figure 2C), but had less TIGIT coexpression in patients with PsA (Figure 2D).
Enrichment of CD8+CCR10+ T cells in the skin, but not the joint. To investigate their tissue origin, we enu-merated the frequency of CD8+CCR10+ T cells in skin biopsy samples and in SF mononuclear cells (SFMCs). The frequency of CD8+CCR10+ T cells was significantly higher in the skin com-pared to paired PBMCs. In contrast, there was no enrichment of CD8+CCR10+ T cells in SFMC samples compared to non- paired PBMCs (Figure 3A and Supplementary Figure 7, http://online library.wiley.com/doi/10.1002/art.41652/ abstract). Previous stud-ies have shown that CCR10 is a chemokine receptor found on skin- tropic T cells. We confirmed that the majority of circulating CD8+CCR10+ T cells coexpressed the skin- homing markers

LEIJTEN ET AL 1224 |
CCR4 and cutaneous lymphocyte antigen (CLA) (Figures 3B and C). Conversely, CD8+CCR10+ T cells did not coexpress β7 inte-grin, a marker associated with gut- homing properties (Figure 3D).
We then analyzed whether CD8+CCR10+ T cell frequency was related to measures of disease activity. The frequency of CD8+CCR10+ T cells in PBMCs was not related to tender or swol-len joint count (data not shown). In addition, we detected a sta-ble frequency of CD8+CCR10+ T cells in PBMCs obtained from a patient with psoriasis before PsA onset and after PsA onset. The fre-quency of CD8+CCR10+ T cells was not higher in SFMCs from this patient at disease onset (Figure 3E). These results indicate that the joint compartment is an unlikely source of CD8+CCR10+ T cells.
As expected, we found that lesional skin contained a much larger absolute number of CD8+ T cells than nonlesional skin (Supplementary Figure 7, http://onlin elibr ary.wiley.com/doi/10. 1002/art.41652/ abstract). However, the fraction of CD8+ T cells expressing CCR10 was either similar or lower in lesional skin com-pared to nonlesional skin (Figures 3A and F). The frequency of CD8+CCR10+ T cells in PBMCs was not related to PASI score (data not shown). CD103 expression, a marker of tissue reten-tion, was significantly elevated in CD8+CCR10+ T cells from both PBMCs and skin (Supplementary Figure 8, http://onlin elibr ary.wiley.com/doi/10.1002/art.41652/ abstract). These results indicate that CCR10 is a marker for skin- tropic CD8+ T cells in circulation and
Figure 2. CD8+CCR10+ T cells are prototypically DNAM- 1high. A, CD8+CCR10+ T cells coexpressed high levels of DNAX accessory molecule 1 (DNAM- 1). B, Distinct populations of CD8+ T cells were distinguishable based on expression of DNAM- 1 and T cell immunoreceptor with Ig and immunoreceptor tyrosine- based inhibition motif domains (TIGIT), including DNAM- 1highTIGIT−, DNAM- 1highTIGIT+, and DNAM- 1−TIGIT+. C, The majority of CD8+CCR10+ T cells were either DNAM- 1highTIGIT− or DNAM- 1highTIGIT+. D, Within CD8+CCR10+ T cells with high expression of DNAM- 1, TIGIT coexpression was reduced in patients with psoriatic arthritis (PsA). In C and D, symbols represent individual subjects (healthy controls [HCs] [white symbols], patients with psoriasis [Pso] [gray symbols], and patients with PsA [black symbols]); bars show the median and interquartile range. * = P < 0.05. Color figure can be viewed in the online issue, which is available at http://onlinelibrary.wiley.com/doi/10.1002/art.41652/abstract.

DIFFERENCES IN SKIN Trm CD8+ T CELLS IN PsA VERSUS PSORIASIS | 1225
Figure 3. Enrichment of CD8+CCR10+ T cells in skin, but not in synovial fluid (SF). A, CD8+CCR10+ T cell frequency in paired nonlesional (NL) skin, lesional (L) skin, and peripheral blood mononuclear cells (PBMCs), and in nonpaired SF mononuclear cells (SFMCs). B– D, Expression of CCR4 (B), cutaneous lymphocyte antigen (CLA) (C), and β7 integrin (D) in CCR10+ versus CD8+CCR10− T cells. E, CD8+CCR10+ T cell frequency in PBMCs from a patient with psoriasis before psoriatic arthritis (PsA) onset and in PBMCs and SFMCs from the same patient at initial PsA onset. F, Frequency of CD8+CCR10+ T cells in paired nonlesional skin, lesional skin, and PBMCs from a patient with PsA. Symbols in A represent individual subjects (patients with psoriasis [Pso] [gray symbols] and patients with PsA (black symbols); bars in A– D show the median and interquartile range. * = P < 0.05. Color figure can be viewed in the online issue, which is available at http://onlinelibrary.wiley.com/doi/10.1002/art.41652/abstract.

LEIJTEN ET AL 1226 |
is enriched in both lesional and nonlesional psoriatic skin, but not in SF.
GATA3 and FOXP3 expression and Trm cell profile in CD8+CCR10+ T cells. We next performed transcriptome analyses of circulating CD8+ T cells from healthy controls, patients with psoriasis, and patients with PsA. Three popula-tions of viable CD8+ T cells were sorted: CCR10+, CCR4+, and
CCR10−CCR4− (Figure 4A and gating exhibited in Supplementary Figure 5, http://onlin elibr ary.wiley.com/doi/10.1002/art.41652/ abstract). We determined that the CCR10+ subset and CCR4+ subset were largely overlapping, while both were very distinct from the CCR10−CCR4− fraction (Figures 4B and C). Compared to the CCR10−CCR4− fraction, the CCR10+ subset was different with respect to numerous well- characterized genes, including the up- regulation of GATA3, CCR8, IL- 4R, and CD44 (Supplementary
Figure 4. CD8+CCR10+ T cells express GATA3 and FOXP3 and exhibit a tissue- resident memory (Trm) cell profile. A, Three different subsets of CD8+ T cells were flow sorted based on the presence/absence of CCR10 and CCR4. Detailed data regarding the full gating strategy are shown in Supplementary Figure 5 (http://onlin elibr ary.wiley.com/doi/10.1002/art.41652/ abstract). B, Principal components (PC) analysis was performed based on preselection of 5,268 genes that were differentially expressed in any of the cell subsets (nominal P < 0.05). C, Heatmap shows expression levels, on CD8+ cell subsets from healthy controls (HCs) and patients with psoriasis (Pso) or psoriatic arthritis (PsA), of genes previously reported as being critical for CD8+ T cells. D, Violin plots indicate the main transcriptional features attributed to Trm cells. Expression on the CCR10+ subset was compared to expression on the CCR10−CCR4− subset and the CCR4+ subset. VSD = variance-stabilized data; FDR = false discovery rate.

DIFFERENCES IN SKIN Trm CD8+ T CELLS IN PsA VERSUS PSORIASIS | 1227
Figure 5. CD8+CCR10+ T cells exhibit a Tc2/Tc22- like cytokine profile. Peripheral blood mononuclear cells were restimulated with phorbol 12- myristate 13- acetate and ionomycin calcium salt. The frequency of intracellular production of interferon- γ (IFNγ) (A), interleukin- 10 (IL- 10) (B), IL- 4 (C), IL- 13 (D), IL- 17 (E), and IL- 22 (F) was compared between CD8+ T cells based on positivity or negativity for CCR10. Symbols represent individual subjects (healthy controls [white symbols], patients with psoriasis [gray symbols], and patients with psoriatic arthritis [black symbols]); bars show the median. * = P < 0.05.

LEIJTEN ET AL 1228 |
Figure 9, http://onlin elibr ary.wiley.com/doi/10.1002/art.41652/ abstract). In addition, the CCR10+ subset exhibited high expres-sion of FOXP3 and lacked expression of genes associated with cytotoxic potential, e.g., GZMB and PRF1 (Figure 4C). Moreo-ver, CD8+CCR10+ T cells displayed a prototypical gene expres-sion pattern resembling Trm: high expression of ITGAE (CD103),
CD69, CCR8, and CD44, and low expression of KLRG1 and CX3CR1 (Figure 4D).
As expected, the dominant factors determining the overall transcriptomic profile were the cell subsets rather than patient/health status. Exploratory analysis on the CD8+CCR10+ sub-set in patients with PsA identified 536 DEGs unique to patients
Figure 6. CD8+CCR10+ T cells exhibit regulatory properties. A and B, In peripheral blood mononuclear cells (PBMCs), the ex vivo fraction of memory CD8+ T cells that expressed CCR10 strongly correlated with the ex vivo fraction of CD8+ T cells that were CD25+CD127− (A) and CD25+FoxP3+ (B). Circles indicate pooled data from healthy controls. Additional data are shown in Supplementary Table 1 (http://online libr ary.wiley.com/doi/10.1002/art.41652/ abstract). C, Examples of suppression assays are shown. Fresh PBMCs from 5 healthy controls were incubated with CellTrace Violet (CT- violet) and cocultured with different CD8+ T cell subsets. Data regarding the gating strategy used for flow sorting are shown in Supplementary Figure 5, http://onlin elibr ary.wiley.com/doi/10.1002/art.41652/ abstract). D and E, The suppressive effect on CD4+ (D) and CD8+ (E) T cell proliferation was determined on day 4. Symbols represent individual subjects; bars show the median. * = P < 0.05. Color figure can be viewed in the online issue, which is available at http://onlinelibrary.wiley.com/doi/10.1002/art.41652/abstract.

DIFFERENCES IN SKIN Trm CD8+ T CELLS IN PsA VERSUS PSORIASIS | 1229
with PsA compared to those with psoriasis and healthy controls (nominal P < 0.05), including up- regulation of RORC, MYD88, and IFNAR1 (Supplementary Figure 10, http://onlin elibr ary.wiley.com/doi/10.1002/art.41652/ abstract). In summary, the results indicate that CD8+CCR10+ T cells are characterized by high expression of GATA3, FOXP3, and core transcripts defining Trm cells.
CD8+CCR10+ T cells exhibit a Tc2/Tc22 cytokine profile with net regulatory function. Consistent with the transcrip-tomic profile, CD8+CCR10+ T cells produced significantly more IL- 17A and IL- 22 compared to bulk CD8+ T cells on ex vivo restim-ulation. The production of IL- 4, IL- 13, and IL- 10 was also enriched in CD8+CCR10+ T cells. In contrast, CD8+CCR10+ T cells had reduced overall capacity to produce interferon γ and lacked mark-ers (granzyme B and perforin) associated with cytotoxic capacity of CD8+ T cells (Figures 5A– F, and Supplementary Figure 11, http://onlin elibr ary.wiley.com/doi/10.1002/art.41652/ abstract).
CD8+CCR10+ T cells coexpressed FoxP3, and the frequency of CCR10+ CD8+ T cells in PBMCs was strongly correlated with the frequency of CD8+ T cells that expressed a “regulatory” phe-notype (CD25+FoxP3+ and CD25+CD127−) (Figures 6A and B and Supplementary Figure 11, http://onlin e libr ary.wiley.com/doi/10.1002/art.41652/ abstract). Considering that CD8+CCR10+ T cells exhibited a pleiotropic cytokine- producing profile (Tc2/22- like), we next determined whether these cells have an overall immunoregulatory function. To this end, we performed immuno-suppression assays using sorted CD8+ T cell subsets (selected based on the markers CCR10 and CCR4) and cocultured them with autologous, CellTrace Violet–labeled T cells (Figure 6C). Compared to coculture with bulk CD8+ T cells, the coculture with CD8+CCR10+ T cells significantly reduced the proliferation of both CD4+ T cells and CD8+ T cells (Figure 6D). Our functional assays thus confirmed the transcriptome profile data presented in Figure 4, indicating that CD8+CCR10+ T cells are Tc2/22- like cells with an overall regulatory function.
DISCUSSION
In this study, we discovered and investigated in detail an increase in CD8+CCR10+ T cells in the peripheral blood of patients with PsA compared to patients with psoriasis. CD8+CCR10+ T cells are Tem cells with Tc2/22- like cytokine profile and regulatory function. This CD8+ T cell subset was further endowed with a transcriptomic profile comparable to that observed in Trm cells, which originated in skin, but not the joint.
To our knowledge, this is the broadest immunophenotyping study thus far, as performed in a PASI- matched cohort of patients with PsA and patients with psoriasis who were not being treated with immunomodulatory drugs. Overall, the results underscore the role of memory CD8+ T cells in the pathogenesis of PsA, which is consistent with findings in previous immunophenotyping stud-ies and genetic association studies (1,11,26– 28). Specifically, we
have identified a novel role of CD8+CCR10+ T cells, which may be important in the pathogenesis of PsA.
The facts that skin- homing markers on T cells in SF/tissue have previously been described (28– 30), and that therapeutics blocking specific integrins can induce arthritis (31,32), have raised the question of whether skin- tropic T cells could be redirected into the joint. However, our results do not indicate that CD8+CCR10+ T cells are derived from SF, nor do they appear to preferen-tially migrate to this site. Instead, we discovered a typical pattern of coexpression with the skin- tropic markers CLA and CCR4, consistent with previous studies indicating that CCR10 guides trafficking of T cells towards the skin (23,33). The CD8+CCR10+ T cells are most likely found in the epidermis (34). Notably, we found that both lesional and nonlesional skin harbors CD8+CCR10+ T cells. There was a trend toward fewer regulatory CD8+CCR10+ T cells in lesional skin, which may contribute to pathology. We sus-pect that CD8+CCR10+ T cells from nonlesional skin contributes to the fraction detected in PBMCs for several reasons, including: 1) patients with psoriasis and patients with PsA had similar PASIscores, 2) there was no relationship between the frequency of these cells and PASI scores, and 3) even in healthy individuals, these cells are detected in the circulation (35). Larger studies are needed to compare the quantity of CD8+CCR10+ T cells in skin from patients with psoriasis and patients with PsA, particularly to examine whether there are subtle differences between these groups with respect to both lesional and nonlesional skin sites.
Phenotypically, CD8+CCR10+ T cells were mostly Tem cells based on classic nomenclature, but we also detected a strong tran-scriptional overlap with skin- derived Trm cells (36). In human skin, CD8+ T cells can be classified as those that pass through the tissue and those that remain in the tissue, the latter being termed Trm cells. These cells can be divided into CD69+CD103− or CD69+CD103+, the latter being more prevalent in the epidermis and exerting potent effector functions (37,38). Our transcriptomic analysis of CD8+CCR10+ T cells revealed a striking resemblance to Trm cells: high expression of IL- 7R (CD127), CD69, and ITGAE (CD103), and low expression of KLRG1 and CX3CR1 (33,37,38). Furthermore, transcriptomic analysis revealed high expression of CCR8, which has recently been linked to a skin- resident CD8+ T cell population (33). In a recent study using a murine model memory precursor CD8+ T cell clones from circulation were tracked, and it was found that high expression of CCR10 was present in CD8+ T cells com-mitted to a skin Trm fate (39). Strictly speaking, the CD8+CCR10+ T cells we characterized in PBMCs should not be termed Trm cells, since Trm cells are, by definition, noncirculating (40). However, this dichotomy may be too simplistic, at least in regard to CD4+ T cells. CLA+CD4 Trm cells can exit the skin, reenter the circulation, and occupy distant skin sites (35). Our data fit well into this recent con-cept of circulating Trm cells, and specifically adds strength to the notion that there are circulating human CD8+ Trm cells (41,42).
Regarding function, CCR10 has classically been attributed to Th2 and Th22 subsets of CD4+ T cells (43). The CD8+CCR10+

LEIJTEN ET AL 1230 |
T cells we analyzed indeed exhibited Tc2/22- like function, but are distinct from Tc17 that was recently described in PsA SF (28), including the fact that the Tc17 expressed high levels of gran-zymes. CCR10 has also been described as a common marker on regulatory CD4+ T cells (44). Loss of CCR10 in murine models results in loss of Treg cells in skin, which enhances IL- 17A and tumor necrosis factor production at the cost of IL- 10 production (25,45,46). This indicates that CCR10 is important for the regula-tory function of tissue- resident T cells in noninflamed murine skin (25,46). Overall, the transcriptomic profile and functional assays performed in our study indicate that these cells could have an important regulatory function in human skin.
There are different proposed mechanisms by which CD8+ T cells can induce a suppressive function (47). These exact mech-anisms are beyond the scope of the present study. The potential role of immune checkpoints, including the DNAM- 1/TIGIT axis, warrants further investigation, since we noted phenotypic distur-bances in the PsA group. The balance of regulation versus inflam-mation could also be secondary to environmental cues that skew cell plasticity and the cytokine profile, as shown for CD4+ T cells and innate lymphoid cells (48,49). Consistent with the latter con-cept is our finding that RORC and IFNAR1, among other genes, differentiated CD8+CCR10+ T cells from patients with PsA com-pared to patients with psoriasis and healthy controls. While RORC is critical to the pathogenic effects of innate immune cells in SpA (50), our transcriptomic analysis within the PsA group remains exploratory and requires confirmation in a larger group of patients.
We suggest that the potential novel role of CD8+ Trm cells in PsA should be viewed in the context of the more established role of CD8+ Trm cells in psoriasis (34,41,51,52). Clinically, unaf-fected skin from patients with psoriasis has perturbations in kerat-inocytes and Trm cell populations, which has been suggested to poise the skin for an excessive inflammatory response (52). Also, after psoriasis lesions have clinically resolved, there is long- term persistence of epidermal CD8+ Trm cells with IL- 17A– producing capacities (41,51). Of further interest is the fact that the effector function of CD8+ Trm cells in nonlesional skin is related to disease duration (34).
Our study has certain limitations, which includes the fact that it was cross- sectional in design and that patients with inflam-matory rheumatic diseases other than SpA (e.g., rheumatoid arthritis or gout) were not included. Although we adhered to a standardized protocol for flow cytometry (15), viability staining was only performed in the functional and transcriptomic analy-sis. Also, upon identification of CCR10 as a marker that discrimi-nated between PsA and psoriasis within CD8+CD45RO+ T cells, for further experiments we made the practical choice to exclude CD45RO as a marker in the gating, which may have resulted in the inclusion of some naive CD8+ T cells. Importantly, it will be necessary for these results to be validated in an independent cohort of patients, regardless of any subtle modifications to the flow- cytometric gating strategy used.
One question that remains unanswered is whether CD8+CCR10+ T cells play a role in the pathogenesis of PsA (e.g., contributing to the production of soluble factors affecting dis-tant musculoskeletal sites) or if these cells should instead be seen as the flag of disturbed cutaneous homeostasis that is principally driven by other cells, such as keratinocytes or other stromal cells.
Taken together, our findings show that PsA is marked by alterations in circulating, skin- derived, regulatory CD8+ Trm cells. These data support the notion that events occurring in the skin may drive the development of arthritis in patients with psoriasis.
ACKNOWLEDGMENTS
We thank the patients for their participation in the study, the clinical study team (Anne Karien Marijnissen, Anneloes van Loo, Karin Schrijvers, and Joke Nijdeken), and the flow core facility of the Center for Translational Immunology. We also thank Jonas Kuipers for his scientific input.
AUTHOR CONTRIBUTIONS
All authors were involved in drafting the article or revising it critically for important intellectual content, and all authors approved the final version to be published. Dr. Leijten had full access to all of the data in the study and takes responsibility for the integrity of the data and the accuracy of the data analysis.Study conception and design. Leijten, van Kempen, Nordkamp, Pouw, Balak, Verhagen, Hartgring, Pandit, Radstake, Boes.Acquisition of data. Leijten, van Kempen, Nordkamp, Pouw, Kleinrensink, Vincken, Mertens, Balak, Verhagen, Hartgring, Pandit, Radstake, Boes.Analysis and interpretation of data. Leijten, van Kempen, Nordkamp, Pouw, Verhagen, Hartgring, Lubberts, Tekstra, Pandit, Radstake, Boes.
REFERENCES 1. Veale DJ, Fearon U. The pathogenesis of psoriatic arthritis. Lancet
2018;391:2273– 84.
2. Ritchlin CT, Colbert RA, Gladman DD. Psoriatic arthritis. N Engl J Med 2017;376:957– 70.
3. Sakkas LI, Bogdanos DP. Are psoriasis and psoriatic arthritis the same disease? The IL- 23/IL- 17 axis data [review]. Autoimmun Rev 2017;16:10– 5.
4. Boehncke WH. Psoriasis and psoriatic arthritis: flip sides of the coin? Acta Derm Venereol 2016;96:436– 41.
5. McGonagle D, Aydin SZ, Gül A, Mahr A, Direskeneli H. ’MHC- I- opathy’- unified concept for spondyloarthritis and Behçet disease [review]. Nat Rev Rheumatol 2015;11:731– 40.
6. Sherlock JP, Joyce- Shaikh B, Turner SP, Chao CC, Sathe M, Grein J, et al. IL- 23 induces spondyloarthropathy by acting on ROR- γt+ CD3+CD4- CD8- entheseal resident T cells. Nat Med 2012;18:1069– 76.
7. Reinhardt A, Prinz I. Whodunit? The contribution of interleukin (IL)- 17/IL- 22- producing γδ T cells, αβ T cells, and innate lymphoid cells to the pathogenesis of spondyloarthritis [review]. Front Immunol 2018;9:885.
8. Abji F, Pollock RA, Liang K, Chandran V, Gladman DD. CXCL10 is a possible biomarker for the development of psori-atic arthritis among patients with psoriasis. Arthritis Rheumatol 2016;68:2911– 6.
9. Abji F, Pollock RA, Liang K, Chandran V, Gladman DD. Th17 gene expression in psoriatic arthritis synovial fluid and peripheral blood compared to osteoarthritis and cutaneous psoriasis. Clin Exp Rheumatol 36:486– 9.

DIFFERENCES IN SKIN Trm CD8+ T CELLS IN PsA VERSUS PSORIASIS | 1231
10. Pollock RA, Abji F, Liang K, Chandran V, Pellett FJ, Virtanen C,et al. Gene expression differences between psoriasis patientswith and without inflammatory arthritis [letter]. J Invest Dermatol2015;135:620– 3.
11. Benham H, Norris P, Goodall J, Wechalekar MD, Fitzgerald O,Szentpetery A, et al. Th17 and Th22 cells in psoriatic arthritis andpsoriasis. Arthritis Res Ther 2013;15:R136.
12. Fredriksson T, Pettersson U. Severe psoriasis— oral therapy with anew retinoid. Dermatologica 1978;157:238– 44.
13. Taylor W, Gladman D, Helliwell P, Marchesoni A, Mease P, MielantsH, et al. Classification criteria for psoriatic arthritis: developmentof new criteria from a large international study. Arthritis Rheum2006;54:2665– 73.
14. Rudwaleit M, van der Heijde D, Landewe R, Listing J, Akkoc N,Brandt J, et al. The development of Assessment of SpondyloArthritis international Society classification criteria for axial spondyloar-thritis (part II): validation and final selection. Ann Rheum Dis2009;68:777– 83.
15. Verhagen FH, Hiddingh S, Rijken R, Pandit A, Leijten E, NordkampMO, et al. High- dimensional profiling reveals heterogeneity of theTh17 subset and its association with systemic immunomodulatorytreatment in non- infectious uveitis. Front Immunol 2018;9:2519.
16. Wehrens EJ, Mijnheer G, Duurland CL, Klein M, Meerding J, vanLoosdregt J, et al. Functional human regulatory T cells fail to controlautoimmune inflammation due to PKB/c- akt hyperactivation in effec-tor cells. Blood 2011;118:3538– 48.
17. Cunningham F, Amode MR, Barrell D, Beal K, Billis K, Brent S, et al.Ensembl 2015. Nucleic Acids Res 2015;43:D662– 9.
18. Dobin A, Davis CA, Schlesinger F, Drenkow J, Zaleski C, Jha S,et al. STAR: ultrafast universal RNA- seq aligner. Bioinformatics2013;29:15– 21.
19. Anders S, Pyl PT, Huber W. HTSeq: a Python framework to work with high- throughput sequencing data. Bioinformatics 2015;31:166– 9.
20. Love MI, Huber W, Anders S. Moderated estimation of fold changeand dispersion for RNA- seq data with DESeq2. Genome Biol2014;15:550.
21. Xia J, Wishart DS. Using MetaboAnalyst 3.0 for comprehensivemetabolomics data analysis. Curr Protoc Bioinforma 2016;55:14.
22. Oliveros JC. Venny 2.1. URL: https://bioin fogp.cnb.csic.es/tools/venny/ index.html.
23. Sigmundsdottir H, Pan J, Debes GF, Alt C, Habtezion A, Soler D,et al. DCs metabolize sunlight- induced vitamin D3 to “program” Tcell attraction to the epidermal chemokine CCL27. Nat Immunol2007;8:285– 93.
24. Homey B, Alenius H, Müller A, Soto H, Bowman EP, Yuan W, et al.CCL27- CCR10 interactions regulate T cell- mediated skin inflamma-tion. Nat Med 2002;8:157– 65.
25. Xia M, Hu S, Fu Y, Jin W, Yi Q, Matsui Y, et al. CCR10 regulates bal-anced maintenance and function of resident regulatory and effectorT cells to promote immune homeostasis in the skin. J Allergy ClinImmunol 2014;134:634– 44.
26. Menon B, Gullick NJ, Walter GJ, Rajasekhar M, Garrood T,Evans HG, et al. Interleukin- 17+CD8+ T cells are enriched in thejoints of patients with psoriatic arthritis and correlate with dis-ease activity and joint damage progression. Arthritis Rheumatol2014;66:1272– 81.
27. Bowes J, Budu- Aggrey A, Huffmeier U, Uebe S, Steel K, Hebert HL,et al. Dense genotyping of immune- related susceptibility loci revealsnew insights into the genetics of psoriatic arthritis. Nat Commun2015;6:6046.
28. Steel KJ, Srenathan U, Ridley M, Durham LE, Wu SY, Ryan SE, et al. Polyfunctional, proinflammatory, tissue- resident memory phenotypeand function of synovial interleukin- 17A+CD8+ T cells in psoriaticarthritis. Arthritis Rheumatol 2020;72:435– 47.
29. Jones SM, Dixey J, Hall ND, McHugh NJ. Expression of the cuta-neous lymphocyte antigen and its counter- receptor E- selectin in theskin and joints of patients with psoriatic arthritis. Br J Rheumatol1997;36:748– 57.
30. Pitzalis C, Cauli A, Pipitone N, Smith C, Barker J, Marchesoni A,et al. Cutaneous lymphocyte antigen– positive T lymphocytes pref-erentially migrate to the skin but not to the joint in psoriatic arthritis.Arthritis Rheum 1996;39:137– 45.
31. Viguier M, Richette P, Aubin F, Beylot- Barry M, Lahfa M, Bedane C,et al. Onset of psoriatic arthritis in patients treated with efalizumab for moderate to severe psoriasis. Arthritis Rheum 2008;58:1796– 802.
32. Dubash S, Marianayagam T, Tinazzi I, Al- Araimi T, Pagnoux C,Weizman AV, et al. Emergence of severe spondyloarthropathy-related entheseal pathology following successful vedolizumab ther-apy for inflammatory bowel disease. Rheumatology (Oxford) 2019;58:963– 8.
33. McCully ML, Ladell K, Andrews R, Jones RE, Miners KL, Roger L,et al. CCR8 expression defines tissue- resident memory T cells inhuman skin. J Immunol 2018;200:1639– 50.
34. Vo S, Watanabe R, Koguchi- Yoshioka H, Matsumura Y, IshitsukaY, Nakamura Y, et al. CD8 resident memory T cells with interleukin17A- producing potential are accumulated in disease- naïve nonle-sional sites of psoriasis possibly in correlation with disease duration[letter]. Br J Dermatol 2019;181:410– 2.
35. Klicznik MM, Morawski PA, Höllbacher B, Varkhande SR, Motley SJ,Kuri- Cervantes L, et al. Human CD4 + CD103 + cutaneous residentmemory T cells are found in the circulation of healthy individuals. SciImmunol 2019;4:eaav8995.
36. Romero P, Zippelius A, Kurth I, Pittet MJ, Touvrey C, Iancu EM, et al.Four functionally distinct populations of human effector- memoryCD8+ T lymphocytes. J Immunol 2007;178:4112– 9.
37. Watanabe R, Gehad A, Yang C, Scott LL, Teague JE, Schlapbach C, et al. Human skin is protected by four functionally and phenotypically discrete populations of resident and recirculating memory T cells. Sci Transl Med 2015;7:279ra39.
38. Mackay LK, Rahimpour A, Ma JZ, Collins N, Stock AT, Hafon ML,et al. The developmental pathway for CD103(+)CD8+ tissue- resident memory T cells of skin. Nat Immunol 2013;14:1294– 301.
39. Kok L, Dijkgraaf FE, Urbanus J, Bresser K, Vredevoogd DW,Cardoso RF, et al. A committed tissue- resident memory T cell pre-cursor within the circulating CD8+ effector T cell pool. J Exp Med2020;217:e20191711.
40. Morris SE, Farber DL, Yates AJ. Tissue- resident memory T cellsin mice and humans: towards a quantitative ecology. J Immunol2019;203:2561– 9.
41. Cheuk S, Schlums H, Sérézal IG, Martini E, Chiang SC, Marquardt N, et al. CD49a expression defines tissue- resident CD8 + T cells poised for cytotoxic function in human skin. Immunity 2017;46:287– 300.
42. Khalil S, Bardawil T, Kurban M, Abbas O. Tissue- resident memory Tcells in the skin. Inflamm Res 2020;69:245– 54.
43. Trifari S, Kaplan CD, Tran EH, Crellin NK, Spits H. Identification ofa human helper T cell population that has abundant production ofinterleukin 22 and is distinct from T(H)- 17, T(H)1 and T(H)2 cells. NatImmunol 2009;10:864– 71.
44. Eksteen B, Miles A, Curbishley SM, Tselepis C, Grant AJ, WalkerLS, et al. Epithelial inflammation is associated with CCL28 produc-tion and the recruitment of regulatory T cells expressing CCR10. JImmunol 2006;177:593– 603.
45. Fu Y, Yang J, Xiong N. Cutting edge: skin CCR10+ CD8+ T cellssupport resident regulatory T cells through the B7.2/receptor axisto regulate local immune homeostasis and response. J Immunol2016;196:4859– 64.
46. Li C, Xu M, Coyne J, Wang WB, Devila M, Wang Y, et al. Psoriasis- associated impairment of CCL27/CCR10- derived regulation leads

LEIJTEN ET AL 1232 |
to IL- 17A/IL- 22- producing skin T cell over- activation. J Allergy Clin Immunol 2021;147:759– 63.e9.
47. Xu Z, Ho S, Chang CC, Zhang QY, Vasilescu ER, Vlad G, et al.Molecular and cellular characterization of human CD8 T suppressorcells [review]. Front Immunol 2016;7:549.
48. Bernink JH, Ohne Y, Teunissen MB, Wang J, Wu J, Krabbendam L, et al.c- Kit- positive ILC2s exhibit an ILC3- like signature that may contributeto IL- 17- mediated pathologies. Nat Immunol 2019;20:992– 1003.
49. Zielinski CE, Mele F, Aschenbrenner D, Jarrossay D, Ronchi F,Gattorno M, et al. Pathogen- induced human TH17 cells produceIFN- γ or IL- 10 and are regulated by IL- 1β. Nature 2012;484:514– 8.
50. Venken K, Jacques P, Mortier C, Labadia ME, Decruy T, CoudenysJ, et al. RORγt inhibition selectively targets IL- 17 producing iNKTand γδ- T cells enriched in Spondyloarthritis patients. Nat Commun2019;10:9.
51. Cheuk S, Wikén M, Blomqvist L, Nylén S, Talme T, Ståhle M, et al.Epidermal Th22 and Tc17 cells form a localized disease memoryin clinically healed psoriasis. J Immunol 2014;192:3111– 20.
52. Sérézal IG, Hoffer E, Ignatov B, Martini E, Zitti B, Ehrström M, et al.A skewed pool of resident T cells triggers psoriasis- associated tis-sue responses in never- lesional skin from patients with psoriasis. JAllergy Clin Immunol 2019;143:1444– 54.

1233
Arthritis & RheumatologyVol. 73, No. 7, July 2021, pp 1233–1243DOI 10.1002/art.41672© 2021, American College of Rheumatology
Specific Follicular Helper T Cell Signature in Takayasu ArteritisA. C. Desbois,1 P. Régnier,1 V. Quiniou,2 A. Lejoncour,1 A. Maciejewski- Duval,2 C. Comarmond,1 H. Vallet,2 M. Rosenzwag,2 G. Darrasse- Jèze,2 N. Derian,2 J. Pouchot,3 M. Samson,4 B. Bienvenu,5 P. Fouret,6 F. Koskas,6 M. Garrido,2 D. Sène,7 P. Bruneval,8 P. Cacoub,1 D. Klatzmann,2 and D. Saadoun1
Objective. Our aim was to compare transcriptome and phenotype profiles of CD4+ T cells and CD19+ B cells in patients with Takayasu arteritis (TAK), patients with giant cell arteritis (GCA), and healthy donors.
Methods. Gene expression analyses, flow cytometry immunophenotyping, T cell receptor (TCR) gene sequencing, and functional assessments of cells from peripheral blood and arterial lesions from TAK patients, GCA patients, and healthy donors were performed.
Results. Among the most significantly dysregulated genes in CD4+ T cells of TAK patients compared to GCA patients (n = 720 genes) and in CD4+ T cells of TAK patients compared to healthy donors (n = 1,447 genes), we identified a follicular helper T (Tfh) cell signature, which included CXCR5, CCR6, and CCL20 genes, that was transcriptionally up- regulated in TAK patients. Phenotypically, there was an increase in CD4+CXCR5+CCR6+CXCR3− Tfh17 cells in TAK patients that was associated with a significant enrichment of CD19+ B cell activation. Functionally, Tfh cells helped B cells to proliferate, differentiate into memory cells, and secrete IgG antibodies. Maturation of B cells was inhibited by JAK inhibitors. Locally, in areas of arterial inflammation, we found a higher proportion of tertiary lymphoid structures comprised CD4+, CXCR5+, programmed death 1+, and CD20+ cells in TAK patients compared to GCA patients. CD4+CXCR5+ T cells in the aortas of TAK patients had an oligoclonal α/β TCR repertoire.
Conclusion. We established the presence of a specific Tfh cell signature in both circulating and aorta- infiltrating CD4+ T cells from TAK patients. The cooperation of Tfh cells and B cells might be critical in the occurrence of vascular inflammation in patients with TAK.
INTRODUCTION
Takayasu arteritis (TAK) and giant cell arteritis (GCA) are the two most common types of large vessel vasculitis (LVV). Histor-ically, TAK and GCA have been considered as distinct diseases based on differences in age at disease onset, ethnic distribution, and clinical features including a predisposition for different arte-rial territories. All patients with TAK have disease involvement of the aorta or its primary branches. In contrast, GCA is tradition-ally considered as a disease of the cranial arteries. However, with the more frequent use of angiography by computed tomography
(CT) or 18F- fluorodeoxyglucose– positron emission tomography (FDG- PET), recent studies have estimated the presence of large vessel involvement in 30– 70% of patients with GCA (1,2). Another older study has shown vascular changes in the large arteries of <80% of GCA patients (3).
Lesions in LVV are characterized by granulomatous inflam-matory infiltrates of the media, the media–intima junction, and the adventitia, often affecting the vasa vasorum. The inner half of the aorta is more often affected than the outer half and the adventi-tia in GCA lesions (4). Intimal hyperplasia is frequently observed, whereas the adventitia is relatively spared in patients with GCA as
1A. C. Desbois, MD, PhD, P. Régnier, PhD, A. Lejoncour, MD, C. Comarmond, MD, PhD, P. Cacoub, MD, D. Saadoun, MD, PhD: Sorbonne Université, Centre National de Références Maladies Autoimmunes et Systémiques Rares et Maladies Autoinflammatoires Rares, INSERM UMR 959, Groupe Hôpital Pitié- Salpêtrière, AP- HP, Paris, France; 2V. Quiniou, PhD, A. Maciejewski- Duval, PhD, H. Vallet, MD, PhD, M. Rosenzwag, MD, PhD, G. Darrasse- Jèze, PhD, N. Derian, PhD, M. Garrido, D. Klatzmann, MD, PhD: Sorbonne Université, INSERM UMR 959, Groupe Hospitalier Pitié- Salpêtrière, AP- HP, Paris, France; 3J. Pouchot, MD, PhD: Hôpital Européen Georges- Pompidou, AP- HP, Université Paris Descartes, Paris, France; 4M. Samson, MD, PhD: Centre Hospitalier Universitaire Dijon Bourgogne, Université Bourgogne- Franche Comté, INSERM EFS Bourgogne- Franche Comté UMR1098, Dijon,
France; 5B. Bienvenu, MD, PhD: Centre Hospitalier Universitaire Caen, Caen, France; 6P. Fouret, MD, PhD, F. Koskas, MD, PhD: Groupe Hospitalier Pitié- Salpétrière, Paris, France; 7D. Sène, MD, PhD: Hôpital Lariboisière, Paris, France; 8P. Bruneval, MD, PhD: Hôpital Européen Georges Pompidou, AP- HP, Paris, France.
No potential conflicts of interest relevant to this article were reported.Drs. Régnier and Quiniou contributed equally to this work.Address correspondence to David Saadoun, MD, PhD, Hôpital Pitié-
Salpétrière, 47- 83 Boulevard de l’Hôpital, 75013 Paris, France. Email: [email protected].
Submitted for publication July 20, 2020; accepted in revised form January 28, 2021.

DESBOIS ET AL 1234 |
compared to patients with TAK. Scarring can be seen in the later phase, with dense adventitial fibrosis and great fibrous thickening of the intima.
Pathologic mechanisms in LVV are not well understood. T cells have been shown to be critical in the process, as demon-strated in an earlier study in which the secretion of inflammatory cytokines was abolished when T cells were depleted in SCID mice grafted with inflamed temporal arteries from human subjects (5). Consistently, both diseases are driven by Th1 and Th17 unbal-anced immune responses (5– 7). Associations with specific major histocompatibility complex (MHC) class II molecules (HLA– B52 in TAK and HLA– DRB1*04 in GCA) have also been observed (8,9). Increasing evidence also supports a role for B cells in the patho-genesis of LVV. Immunohistochemical analyses of aortic wall sam-ples from patients with GCA/TAK have shown the presence of B cells in inflamed arterial lesions (10,11), and some studies have pinpointed the presence of tertiary lymphoid organs (TLOs) in the aortas of LVV patients (10,11).
Altogether, these data suggest a role for T cell and B cell interaction in the pathogenesis of LVV. However, the immune acti-vation pathways specifically involved in each disease are poorly understood. Herein, we compared microarray gene analysis of purified CD4+ T cells and CD19+ B cells from TAK patients and GCA patients and healthy donors.
PATIENTS AND METHODS
Patients. The study population consisted of 54 TAK patients (median age 32.4 years [range 27.2– 53.2 years]), 52 GCA patients (median age 74.7 years [range 66.3– 83.2 years]) (Table 1), and 104 age- and sex- matched healthy donors, 38 of whom were matched to GCA patients by age (mean ± SD age 77.4 ± 11.9 years) and sex (60.5% women) and 66 of whom were matched to TAK patients by age (mean ± SD age 35.2 ± 9.3 years) and sex (62.1% women). TAK patients fulfilled the American College of Rheumatology (ACR) criteria for TAK and/or the Ishikawa criteria modified by Sharma (12,13). GCA patients fulfilled the GCA international criteria (14). Dis-ease activity was defined according to the presence of the following: 1) new ischemic vascular sign (claudication, ischemic thoracic or abdominal pain, bruit or asymmetry in pulses, pulse abolition), 2) cra-nial sign of GCA (headache, anterior ischemic optic neuropathy, jaw claudication), 3) new large vessel involvement lesion or worsening of preexisting lesions on imaging, 4) systemic clinical features (weight loss, fever), and 5) biologic activity of disease (increased erythrocyte sedimentation rate [ESR] and/or C- reactive protein [CRP] level). Disease was considered active if an individual fulfilled ≥2 of the 5 areas mentioned above (including biologic activity) and inactive in the remaining individuals. Blood samples were collected from patients prior to any treatment, except for 18.8% of GCA patients who received <10 mg/day of prednisone.
The present study was approved by our Institutional Eth-ics Review Board and was performed in accordance with the
Declaration of Helsinki. Written informed consent was provided by each patient.
Transcriptome of CD4+ T cells and CD19+ B cells. We performed a microarray gene analysis of purified CD4+ T cells from 25 patients with active TAK, 27 patients with active GCA, and 37 healthy donors (including 25 “younger” healthy donors [range 27.2–53.2 years] age- matched to TAK patients and 12 “older” healthy donors [range 55–91 years] age- matched to GCA patients). No patients received steroid doses higher than 10 mg/day or immunosuppressants. In peripheral blood mononuclear cells (PBMCs) obtained from patients with active TAK, patients with active GCA, and healthy donors, CD3+ T cells were iso-lated by negative isolation with Dynabeads using an untouched Human T Cells kit (ThermoFisher) according to the manufacturer’s instructions. CD4+ cells were then isolated by positive selection using Dynabeads CD4 Isolation kit (ThermoFisher) according to the manufacturer’s instructions. In PBMCs from 8 patients with active TAK, 6 patients with active GCA, and 17 healthy donors (including 13 younger individuals age- matched to TAK patients and 4 older individuals age- matched to GCA patients), CD19+ B cells were isolated by Dynabeads using a CD19 Positive Iso-lation kit (ThermoFisher) according to the manufacturer’s instruc-tions. Once isolated, total RNA from CD4+ cells or CD19+ cells was extracted using the NucleoSpin RNA kit (Macherey- Nagel) according to the manufacturer’s instructions. Total RNA was
Table 1. Demographic and clinical characteristics of patients with TAK and patients with GCA*
Patients with TAK
(n = 54)
Patients with GCA
(n = 52)Demographic features
Age, median (IQR) years 32.4 (27.2– 53.2) 74.7 (66.3– 83.2)Female sex 43 (79.6) 35 (67.4)Geographic origin
White 20 (36.4) 50 (96.2)African 15 (27.4) 0 (0)Northern African 15 (27.4) 2 (3.8)Other 5 (9) 0 (0)
Clinical featuresNumano classification
of TAKI 7 (14.3) NAII 8 (16.3) NAIII 5 (10.2) NAIV 1 (2) NAV 27 (55)
Stroke 12 (22.2) 7 (13.4)Aortic aneurysms 18 (33.3) 4 (7.7)Aortitis 54 (100) 14 (26.9)Optic neuritis – 5 (5.6)CRP level, mean ± SD
mg/liter21.4 ± 28 45.3 (48.3)
* Except where indicated, values are the number (%) of patients. TAK = Takayasu arteritis; GCA = giant cell arteritis; IQR = interquartile range; NA = not applicable; CRP = C- reactive protein.

FOLLICULAR HELPER T CELLS IN LVV | 1235
quantified by a NanoDrop ND- 1000 spectrophotometer. Samples with an RNA concentration of <20 ng/µl were excluded.
For quality control, RNA dilution was performed using an Agi-lent RNA 6000 Nano kit, with 1 µl of the sample run on the nano-chip using an Agilent 2100 electrophoresis bioanalyzer. The quality of total RNA was assessed by the profile of the electropherogram and by the RNA integrity number (RIN). All samples included in the study had an RIN of 7.3– 9.3. For Illumina BeadArrays, com-plementary RNA samples were prepared using an Illumina Total-Pre- 96 RNA Amp kit (LifeTechnologies) and hybridized to Illumina Human HT- 12 v4 BeadArrays. Raw data were then analyzed using the R Limma software package (Supplementary Methods, availa-ble on the Arthritis & Rheumatology website at http://onlin elibr ary.wiley.com/doi/10.1002/art.41672/ abstract). Enrichment analysis of different gene sets within samples and groups was assessed using GSVA and R Limma software packages according to the authors’ instructions (15). Gene lists and signatures used through-out this study, including significantly dysregulated genes of CD4+ T cells between TAK patients, GCA patients, and healthy donors and follicular helper T (Tfh) cell, Tfh17 cell, and B cell signatures, are listed in Supplementary Table 1 (http://onlin elibr ary.wiley.com/doi/10.1002/art.41672/ abstract).
Immunohistochemical analysis. Detection of CXCR5, programmed death 1 (PD- 1), CD20, CD38, CD27, BAFF, CXCL13, interleukin- 21 (IL- 21), and CD4 was performed on fixed paraffin- embedded samples of the inflamed aorta obtained from 7 patients with TAK and 7 patients with GCA as well as samples obtained from 3 noninflamed aortas (Supplementary Methods [http://onlinelibrary.wiley.com/doi/10.1002/art.41672/abstract]).
Cultures of B cells and T cells. CXCR5+CD4+ T cells or CXCR5−CD4+ T cells (50,000 cells each per well) from 8 patients with active TAK were cultured with 20,000 naive B cells (defined as CD27−IgD+CD19+ cells) in the presence of human SAg (CytoStim; Miltenyi Biotec) (2 µl per million cells) in RPMI 1640 complete medium supplemented with 10% heat- inactivated fetal bovine serum (FBS) in the presence or absence of the JAK inhib-itor ruxolitinib (Supplementary Methods [http://onlin elibr ary.wiley.com/doi/10.1002/art.41672/ abstract]).
T cell receptor (TCR) repertoire. Aorta samples were dissociated with a gentleMacs instrument, and magnetic enrich-ment of CD4+ T cells was performed with Dynabeads using a CD4 Positive Isolation kit. Isolated cells were further stained with the following monoclonal antibodies: Alexa Fluor 700 (AF700)– conjugated CD3, fluorescein isothiocyanate (FITC)– conjugated CD4, and phycoerythrin (PE)/Dazzle– conjugated CXCR5. Cell sorting was performed with FACSAria II on CD3+CD4+CXCR5− cells and CD3+CD4+CXCR5+ cells. RNA was subsequently extracted with the Ambion RNAqueous kit according to the man-ufacturer’s recommendations. Before RNA extraction, harvested
cells were biobanked in lysis solution at a temperature of −80°C. Then, the lysate was diluted with an ethanol solution. This solu-tion was passed through the filter pad, and the filter cartridge was washed 3 times to remove contaminants. RNA was eluted in elution buffer. Library for next- generation sequencing was made using the SMARTer Human TCR α/β Profiling kit (Takarabio). Two hundred fifty single- end base paired reads were obtained using the Illumina sequencing platform HiSeq 2500 on rapid run mode. MiXCR software was used for the alignment of raw data and the extraction of human TCR sequences.
Statistical analysis. Continuous variables are presented with the median and range or with the mean ± SEM. Categorical variables are shown as counts and proportions. Statistical com-parisons were performed using Student’s t- test or Mann- Whitney test for quantitative unpaired data and Wilcoxon’s matched pairs signed rank test for quantitative paired data. All statistical tests were 2- tailed with a significance threshold of 0.05. Statistical significance was evaluated using GraphPad Prism version 5 for Windows (GraphPad Software).
RESULTS
Specific CXCR5, CCR6, and PD- 1 CD4+ T cell gene sig-natures in TAK. A microarray gene analysis of purified CD4+ T cells from 25 patients with active TAK, 27 patients with active GCA, and 37 healthy donors (including 25 younger donors age- matched to TAK patients and 12 older donors age- matched to patients with GCA) was performed. Among the 720 genes that were the most sig-nificantly dysregulated between TAK patients and GCA patients (with an adjusted P threshold of 0.05), 364 genes were up- regulated and 356 genes were down- regulated in TAK patients compared to GCA patients, respectively. Among the 1,447 genes that were the most significantly dysregulated between TAK patients and total healthy donors, 471 genes were up- regulated and 976 genes were down- regulated, respectively, in TAK patients compared to total healthy donors. Interestingly, we identified CXCR5, CCR6, and CCL20 as among the most up- regulated genes in TAK patients as compared to either GCA patients or total healthy donors (Figure 1A). Of note, none of the genes presented in the previous heatmap were significantly dysregulated between older healthy donors and younger healthy donors (data not shown). CXCR5 and CCR6 genes were expressed by Tfh cells in the peripheral blood, particularly by Tfh17 cells.
Qiagen Ingenuity Pathway Analysis software was then used to construct a network of the most up- regulated genes in TAK patients versus GCA patients and total healthy donors (Figure 1B). CXCR5, CCL20, CCR6, and PDCD1 genes (strongly associated with Tfh cells) were tightly connected to each other in the gene interaction network. We also confirmed by quantitative polymer-ase chain reaction the overexpression of CXCR5 messenger RNA in CD4+ T cells of TAK patients as compared to that in the CD4+ T cells of GCA patients (P = 0.02) (Supplementary Figure 1, available

DESBOIS ET AL 1236 |
on the Arthritis & Rheumatology website at http://onlin elibr ary.wiley.com/doi/10.1002/art.41672/ abstract).
Next, using both the literature (16– 22) and general knowl-edge, we established and manually curated a Tfh cell– specific gene signature and computed a signature score using an R GSVA software package that estimated the enrichment of a gene signa-ture in a given patient group. We found that this Tfh cell– specific gene signature was significantly more present in CD4+ T cells of TAK patients as compared to GCA patients (even after adjust-ment of P values for age with an R Limma software package) and younger age- matched healthy donors (Figures 1C and D). Of note, this Tfh cell signature score was not significantly different between younger and older healthy donors. Furthermore, none
of the genes comprising this Tfh cell signature were significantly dysregulated between older and younger healthy donors (data not shown). As TAK patients and GCA patients are characterized by different demographic features, we confirmed that none of the transcriptomic differences at both the Tfh gene and signature lev-els were related to the age, sex, or geographic origin of the TAK patients and GCA patients or total healthy donors (Supplemen-tary Table 2 [http://onlin elibr ary.wiley.com/doi/10.1002/art.41672/ abstract]). We observed that the following cell functions and genes were the most up- regulated in GCA patients as compared to healthy donors: cell metabolism/homeostasis, cytokine/chemok-ine secretion and associated cell response, chemotaxis of T cells (TNFSF8, TNFSF9, IL2RA, CD70, IL2RB, LTA, CXCR3, CXCR1,
Figure 1. Specific CXCR5, CCR6, and PDCD1 CD4+ T cell gene signatures in patients with Takayasu arteritis (TAK). A, Purified CD4+ T cells from 25 patients with active TAK, 27 patients with giant cell arteritis (GCA), and 37 healthy donors (HDs) (who were age- matched to 25 “younger” patients with TAK and 12 “older” patients with GCA) were analyzed by microarray gene analysis. No patients included in the analysis received steroid doses higher than 10 mg/day or immunosuppressants. CD4+ T cells of TAK patients and GCA patients and age- matched healthy donors exhibited distinct mRNA signatures. CXCR5, CCR6, and CCL20 were significantly up- regulated in patients with TAK as compared to patients with GCA and age- matched healthy donors. B, Qiagen Ingenuity Pathway Analysis revealed the most dysregulated genes between TAK patients, GCA patients, and healthy donors. C and D, A follicular helper T (Tfh) cell– specific gene signature that is significantly enriched in the CD4+ T cells of TAK patients versus GCA patients and age- matched healthy donors was constructed based on profiles reported in the literature (16,17,21). E, Increased frequency of CXCR5+ cells in CD4+ T cells of patients with TAK compared to patients with GCA and healthy donors was confirmed by flow cytometry. F, Frequency of CXCR5+ cells was higher in TAK patients with active disease (aTA) (n = 13) compared to those with inactive disease (iTA) (n = 8). Symbols represent individual subjects; values are the mean ± SEM (C) or median (interquartile range) (E and F). ** = P < 0.01; **** = P < 0.0001 by Student’s t- test (Limma- moderated t- test) with Benjamini- Hochberg correction (C) and standard Mann- Whitney test with no P value correction (E and F). NS = not significant.

FOLLICULAR HELPER T CELLS IN LVV | 1237
CXCL11, and CXCL6), and innate immunity (LY96, IRAK2, and IRAK3).
We next confirmed by flow cytometry the overexpression of CXCR5 by CD4+ cells in TAK patients. The proportion of CXCR5+CD4+ cells (defined as circulating Tfh cells) among total CD4+ T cells was dramatically higher in TAK patients compared to that in total CD4+ T cells of GCA patients or younger healthy donors. In TAK patients, the median proportion of CXCR5+CD4+ T cells was 15.4% (range 10– 30.8%) whereas in GCA patients and healthy donors, the median proportion of CXCR5+CD4+ T cells was 5.3% (range 1.4– 12.2%) and 9.7% (range 5.6– 12.5%), respectively (P < 0.0001 and P = 0.0001, respectively) (Figure 1E). Levels of CXCR5+ cells were also higher in patients with active TAK as compared to patients with inactive TAK (Figure 1F). We concluded that circulating Tfh cell frequency is specifically increased in the peripheral blood of TAK patients as compared to GCA patients and healthy donors.
Circulating CD4+CXCR5+CCR6+CXCR3− Tfh17 cells significantly increased in patients with TAK. We next studied, in depth, Tfh cell differentiation in patients with LVV and healthy donors. The same procedure described earlier
(Figure 1C) was performed with a Tfh17 cell– specific gene sig-nature based on the literature (15,16,20,21). Results showed that this Tfh17 cell signature was also very significantly enriched in the CD4+ T cells of TAK patients as compared to those in GCA patients (even after adjustment of P values for age with an R Limma software package) and younger age- matched healthy donors (Figure 2A). Additionally, this Tfh17 cell signa-ture score was not significantly different between younger and older healthy donors. Moreover, the raw expression levels of the genes comprising this Tfh17 cell– specific signature were highly enriched in CD4+ T cells of TAK patients versus that in the CD4+ T cells of GCA patients and total healthy donors (Figure 2A), and, importantly, none of these genes were signifi-cantly dysregulated between older and younger healthy donors. Additionally, the Tfh17 signature score and the expression of each gene composing this signature were not correlated with age, sex, or geographic origin in TAK patients, GCA patients, and total healthy donors (Supplementary Table 2 [http://onlin e libr ary.wiley.com/doi/10.1002/art.41672/ abstract]).
Furthermore, flow cytometry analysis of PBMCs from differ-ent patient groups confirmed a higher frequency of total CXCR6+ cells in CD4+ T cells from TAK patients as compared to that in
Figure 2. Significantly increased circulating CD4+CXCR5+CCR6+CXCR3− T cells (Tfh17) in patients with TAK. A, The Tfh17- specific gene signature was shown to be highly enriched in CD4+ T cells from 25 patients with TAK compared to 27 patients with GCA and 37 age- matched healthy donors (including 25 younger healthy donors age- matched to TAK patients and 12 healthy donors old age- matched to GCA patients). B, The frequency of CXCR5+CXCR6+CXCR3− cells was also higher in CD4+ T cells from 13 patients with TAK as compared to 14 patients with GCA or 17 total healthy donors. C, The proportion of Tfh17 cells (defined as CD4+CXCR5+CCR6+CXCR3− T cells) was higher in TAK patients compared to GCA patients and younger and older healthy donors. D and E, Peripheral blood mononuclear cells (PBMCs) from 11 patients with TAK, 12 patients with GCA, and 49 total healthy donors were stimulated for 4 hours with 0.05 µg/ml phorbol 12- myristate 13- acetate (PMA) and 1 mM (1 µg/ml) ionomycin. Interleukin-17 (IL-17) (D) and IL-6 (E) levels in culture supernatants were quantified. Levels of IL- 17 were significantly higher in TAK patients compared to GCA patients and healthy donors, and levels of IL- 6 were higher in TAK patients as compared to GCA patients and younger healthy donors, although the difference between TAK and GCA patients was not significant. Symbols represent individual subjects; values are the mean ± SEM (A) or the median (interquartile range) (B– E). * = P < 0.05; ** = P < 0.01; **** = P < 0.0001 by Student’s t- test (Limma- moderated t- test) with Benjamini- Hochberg correction (A) or standard Mann- Whitney test (unadjusted P) (B– E). See Figure 1 for other definitions.

DESBOIS ET AL 1238 |
CD4+ T cells from GCA patients or healthy donors. The propor-tion of CXCR5+CCR6+ cells in CD4+ cells was increased in TAK patients (median 4.52% [range 1.07– 13.35%]) as compared to the proportion of CXCR5+CCR6+ cells in CD4+ T cells in GCA patients (median 0.69% [range 0.13– 2.16%]) and younger healthy donors (median 2.3% [range 0.3– 4.2%]) (P = 0.0001 and P = 0.02, respectively, for GCA patients and healthy donors) (Figure 2B and Supplementary Figures 2A and B [http://onlin e libr ary.wiley.com/doi/10.1002/art.41672/ abstract]). Circulating CXCR5+ T cells in patients with TAK predominantly comprised Tfh17 cells (Figure 2C). We also found that levels of IL- 17 and IL- 6 were increased in culture supernatants of patients with TAK as compared to patients with GCA and younger healthy donors (for IL- 17, mean ± SEM 134.7 ± 147.9 pg/ml in patients with TAK versus mean ± SD 9.6 ± 9.2 pg/ml in GCA patients [P = 0.02]; for IL- 6, mean ± SEM 101.4 ± 121.6 pg/ml in patients with TAK and mean ± SEM 27.6 ± 40.1 pg/ml in patients with GCA [P = 0.06]) (Figures 2D and E). We concluded that Tfh17 frequency is specifically increased in the peripheral blood of patients with TAK compared to patients with GCA and healthy donors.
Specific B cell activation profile in TAK patients. As Tfh cells are known to stimulate B cells, another microarray gene analysis of purified CD19+ B cells of 8 patients with active TAK, 6 patients with active GCA, and 17 healthy donors (including 13 younger healthy donors age- matched to patients with TAK and 4 older healthy donors age- matched to patients with GCA) was performed. We generated from the literature (23) a gene signature specific for B cell activation/proliferation and tested its enrichment in patients with TAK, patients with GCA, and healthy donors using an R GSVA software package. We found that this signature is significantly enriched in B cells from patients with TAK as com-pared to patients with GCA, even after adjustment of P values for age with an R Limma software package (Figures 3A and B). Furthermore, the expression of the genes comprising the B cell signature was not correlated with age, sex, or geographic origin in TAK patients, GCA patients, and healthy donors (Supplementary Table 2). Consistent with this, histologic analysis of aorta samples from patients with TAK showed major infiltrates of CD20+ cells with nodular organization, whereas the presence of CD20+ cells was weaker in patients with GCA and had less nodular organ-ization (Figure 3C). We also observed the expression of B cells differentiation and growth markers such as CD27, CD38, and BAFF (Supplementary Figure 3A, available on the Arthritis & Rheu-matology website at http://onlin elibr ary.wiley.com/doi/10.1002/art.41672/ abstract).
We next quantified the expression of CD20 in aorta sam-ples from TAK patients and GCA patients and found that the sur-face area of CD20+ cells was significantly higher in the aortas of TAK patients as compared to those of GCA patients (P = 0.01) (Figure 3D). The frequency and the absolute number of circu-lating CD19+ cells among lymphocytes were also increased in
patients with active and untreated TAK as compared to patients with active and untreated GCA and age- matched healthy donors (mean ± SEM 12.6 ± 4% for TAK patients versus mean ± SEM 8.1 ± 5% for GCA patients and mean ± SEM 9.8 ± 4.5% for healthy donors [P = 0.0002 and P = 0.0032, respectively, for
Figure 3. Specific B cell activation profile in patients with TAK. A, Specific gene signature for B cell activation/proliferation is highly enriched in the CD19+ B cells of 8 patients with TAK as compared to 6 patients with GCA and 17 age- matched healthy donors (including 13 younger healthy donors age- matched to TAK patients and 4 older healthy donors age- matched to GCA patients). B, Heatmap demonstrates the distinction in B cell activation/proliferation gene signatures between TAK patients and GCA patients and total healthy donors. C, Major infiltrates of CD20+ cells with nodular organization are evident in the aorta specimens from TAK patients compared to those from GCA patients. D, Results of surface area staining of CD20+ cells in aorta samples from 7 patients with TAK and 7 patients with GCA are shown. E, Frequency of CD19+ cells is increased in 23 patients with active and untreated TAK compared 13 patients with active and untreated GCA and 77 total healthy donors. Symbols represent individual subjects; values are the mean ± SEM (A) or the median (interquartile range) (D and E). * = P < 0.05; ** = P < 0.01; *** = P < 0.001 by Student’s t- test (Limma- moderated t- test) with Benjamini- Hochberg correction (A) or standard Mann- Whitney tests (unadjusted P) (D and E). See Figure 1 for definitions.

FOLLICULAR HELPER T CELLS IN LVV | 1239
GCA patients and healthy donors]) (Figure 3E and Supplemen-tary Figure 3B). Importantly, both metrics were not significantly different between older and younger healthy donors and were not significantly correlated with age, sex, or geographic origin in TAK patients, GCA patients, and total healthy donors (Sup-plementary Table 3 [http://onlin elibr ary.wiley.com/doi/10.1002/art.41672/ abstract]). Also, levels of BAFF cytokines measured by enzyme- linked immunosorbent assay in the sera of TAK patients tended to be higher compared to those observed in GCA patients (mean ± SEM 498.9 ± 141.3 pg/ml versus 424.9 ± 177.4 pg/ml; P = 0.0571] (Supplementary Figure 3C). We concluded that the peripheral blood and aortas of patients with TAK presented elevated levels of B cells with an activated/proliferating profile as compared to patients with GCA and healthy donors.
Assistance of naive B cells through the JAK/STAT pathway via circulating CD4+CXCR5+ Tfh cells from TAK patients. As we have shown a specific Tfh cell differ-entiation in patients with TAK, we next aimed to confirm their functionality. CD4+CXCR5+ or CD4+CXCR5− T cells from TAK patients were cultured with naive CD27−IgD+CD19+ B cells of the same patients in the presence of a superantigen (Cyto-Stim). CD4+CXCR5+ T cells induced a higher proliferation of B
cells on day 3 as compared to CXCR5−CD4+ T cells (Figure 4A and Supplementary Figure 4A [http://onlin e libr ary.wiley.com/doi/10.1002/art.41672/ abstract]). Consistently, the proportion of CD19+ cells on day 7 was significantly increased in cul-tures including CD4+CXCR5+ T cells as compared to those including CD4+CXCR5− T cells (mean ± SEM 33.8% ± 12% versus 24.9% ± 6%; P = 0.008) (Figure 4B). In TAK patients, CD4+CXCR5+ T cells were shown to enhance naive B cells into differentiating into CD27+ memory B cells compared to CD4+CXCR5− T cells (mean ± SEM 6.7% ± 3.4% ver-sus mean ± SEM 3.7% ± 2.1%; P = 0.008) and were also shown to help B cells secrete IgG (P = 0.04) (Figures 4C and D).
We next tested whether the JAK/STAT cellular pathway was involved in the cooperation of CD4+CXCR+ T cells, with B cells ultimately leading to B cell differentiation. Inhibition of the JAK/STAT pathway with ruxolitinib (anti- JAK1/2) led to a significant decrease in B cell maturation as measured by the frequency of CD27+ B cells on day 7 (mean ± SEM 6.7% ± 3.4% versus 1.3% ± 0.52%; P = 0.01) (Figure 4C) and a decrease of the IgG/IgM ratio (mean ± SEM 3.17% ± 0.58% versus 1.5% ± 0.05%; P < 0.0001) (Figure 4D). Finally, we found that ruxolitinib significantly inhibited secretion of IL- 6 in the B cells/CXCR5+ coculture super-natants (mean ± SEM 11.26 ± 10.26 pg/ml versus 0.63 ± 1.07
Figure 4. Assistance of naive B cells through the JAK/STAT pathway via circulating CD4+CXCR5+ Tfh cells from TAK patients. CD4+CXCR5+ or CD4+CXCR5− T cells from 8 patients with TAK were grouped by fluorescence- activated cell sorting and cultured with naive B cells (defined as CD27−IgD+CD19+ cells), followed by stimulation with a superantigen. Proliferation of B cells was assessed on day 3 by 5,6- carboxyfluorescein succinimidyl ester staining. A, Proportion of proliferative B cells was higher in the presence of CD4+CXCR5+ T cells compared to CD4+CXCR5− T cells. B, Proportion of CD19+ cells was significantly higher on day 7 in the presence of CXCR5+ T cells compared to CXCR5− T cells. C, Proportion of CD27+ memory B cells was significantly higher on day 7 in the presence of CXCR5+ T cells compared to CXCR5− T cells. Inhibition of the JAK/STAT pathway with ruxolitinib led to the suppression of differentiation into CD27+ B cells. Results from 8 patients with active TAK are shown in B and C. D, Measurement of IgG and IgM secretion was performed in supernatants (n = 9) of naive B cells cultured with CXCR5+ or CXCR5− T cells. The subsequent secretion of IgG (measured relative to IgM) was higher in B cells cultured with CXCR5+ T cells. Inhibition with ruxolitinib led to a decreased IgG/IgM ratio. E, Secretion of interleukin- 6 (IL- 6) was significantly inhibited when ruxolitinib was added to cocultures (n = 7). Symbols represent individual samples; values are the mean ± SEM (A) or median (interquartile range) (B– E). * = P < 0.05; ** = P < 0.01; *** = P < 0.001 by Student’s t- test (A) or Mann- Whitney test (for comparisons of CXCR5− and CXCR5+ T cells) orWilcoxon’s matched pairs test (for comparisons of CXCR5+ T cells in the absence or presence of ruxolitinib) (B– E). See Figure 1 for definitions.

DESBOIS ET AL 1240 |
pg/ml; P = 0.02) (Figure 4E), although no difference in secretion of IL- 6 was found between CD4+CXCR5+ and CD4+CXCR5− T cells in the absence of ruxolitinib. Moreover, we also performed the same experiments comparing fluorescence- activated cell sorted CD45RA−CXCR5+ T cells to CD45RA−CXCR5−CD4+ T cells for cocultures. Results of CD27 expression and IL- 6 secre-tion were similar to those previously presented (Supplementary Figures 4B and C [http://onlin elibr ary.wiley.com/doi/10.1002/art. 41672/ abstract]).
Additionally, we performed the same experiments by pre-treating either B cells or Tfh cells with ruxolitinib before cocul-tures. It was found that ruxolitinib also inhibited IL- 6 secretion in both conditions (i.e., only B cells treated with ruxolitinib and only CXCR5+ T cells treated with ruxolitinib). However, ruxolitinib did not inhibit B cell maturation (as defined by CD27 expression) when B cells and Tfh cells were not treated together with ruxol-itinib (i.e., ruxolitinib did not have any impact on B cell maturation when either B cells only or Tfh cells only were pretreated with the drug before cocultures) (Supplementary Figures 4B and C).
Altogether, these results showed that CD4+CXCR5+ T cells, which were known to be increased in patients with TAK, remained functional (with Tfh cell properties) and were able to help B cell proliferation and differentiation through the JAK/STAT pathway.
Increased tertiary lymphoid structures comprising CXCR5+, CD4+, PD- 1+, and CD20+ cells within inflamed aortas of TAK patients. The presence of TLOs has previously been shown in LVV (11,24). Thus, we compared the presence of TLOs in the aortic wall samples of 12 patients with TAK and 15 patients with GCA to further study the immune response within inflamed aortas. Interestingly, we confirmed that the presence of TLOs was more frequently observed in the aortas of patients with TAK as compared to patients with GCA (P < 0.05) (Supple-mentary Figures 5A– C [http://onlin elibr ary.wiley.com/doi/10.1002/art.41672/ abstract]). TLOs exhibited high expression of CXCR5 within their periphery, as shown with CD4 staining in the aortas of patients with TAK (Supplementary Figure 5B). PD- 1 and Bcl- 6 were also highly expressed in these structures, unlike aortas of patients with GCA.
TCR sequencing of CD4+CXCR5+ T cells in the aortas of patients with TAK. TCR repertoire analysis of fluorescence- activated cell sorted CD4+CXCR5+ T cells and CD4+CXCR5− T cells was performed on peripheral blood and aorta samples from 2 patients with TAK (number of CD4+ T cells in the aor-tas and peripheral blood of TAK patients was 4,686 cells and 4,655,000 cells, respectively, for patient 1 and 1,534 cells and 3,558,000 cells for patient 2) (Figure 5A). We observed a very broad repertoire of peripheral CD4+ T cells in the peripheral blood of TAK patients, whereas CD4+ T cells originating from aorta lesions of TAK patients had a more oligoclonal profile (Figure 5B and Supplementary Figure 6A [http://onlin elibr ary.
wiley.com/doi/10.1002/art.41672/ abstract]). It was shown that the TCR repertoire in aortic cells was narrower for CD4+CXCR5+ T cells than in CXCR5−CD4+ T cells. In the first patient with TAK, one clonotype represented 97.6% of the TCRα repertoire in CD4+CXCR5+ aortic T cells. In the second patient with TAK, two major clonotypes represented 96.1% of the TCRα repertoire found in CD4+CXCR5+ aortic T cells. The most frequent clono-types found in CD4+CXCR5+ aortic T cells are reported in Sup-plementary Figure 6B (http://onlin e libr ary.wiley.com/doi/10.1002/art.41672/ abstract). Of note, some patterns of the major aortic CD4+CXCR5+ sequences have been previously reported in other autoimmune/inflammatory diseases (25), as well as in vas-cular diseases (26,27) (Supplementary Figure 6B).
Figure 5. T cell receptor repertoire oligoclonal distribution in Tfh cells from the arteries of patients with TAK. A, Gating strategy used in the fluorescence- activated cell sorting of CXCR5− and CXCR5+ CD4+ T cells either from peripheral blood or aorta samples in 2 patients with TAK. B, Oligoclonal profile of CXCR5+ and CXCR5− CD4+ T cells in aorta and peripheral blood samples from 2 patients with TAK. See Figure 1 for definitions. Color figure can be viewed in the online issue, which is available at http://onlinelibrary.wiley.com/doi/10.1002/art.41672/abstract.

FOLLICULAR HELPER T CELLS IN LVV | 1241
DISCUSSION
We showed for the first time a specific gene signature of circu-lating Tfh cells that discriminates TAK patients from GCA patients and age- matched healthy donors. Circulating CD4+CXCR5+ T cells have been shown in recent studies to have functional char-acteristics similar to Tfh cells. Indeed, circulating CD4+CXCR5+ T cells promote survival, proliferation, and differentiation of B cells into plasma cells as Tfh cells are present in germinal centers (28). However, the phenotype of circulating Tfh cells differs from "con-ventional" tissue- specific Tfh cells that express high levels of PD- 1 and inducible costimulator (ICOS). In peripheral blood, only a few CD4+CXCR5+ T cells express ICOS or PD- 1 (29). Thus, PD- 1 and ICOS do not define circulating Tfh cells. Instead, these can be distinguished according to their membrane expression of CCR6 and CXCR3 (30).
In our study, we also demonstrated an increase of CD4+ CXCR5+CCR6+CXCR3− T cells in patients with TAK, corre-sponding to the Tfh17 cell population, which was consistently confirmed by transcriptomic analysis using a Tfh17- specific gene signature that was greatly enriched in TAK patients as compared to GCA patients and age- matched healthy donors (but also other healthy donors that were not age- matched to TAK or GCA patients). Importantly, we demonstrated that the up- regulation of Tfh and Tfh17 signatures observed in TAK patients were not explained by differences in age, sex, or geographic origin, as the expression of the genes comprising these signatures (along with the global signatures enrichment scores) were not correlated with these demographic characteristics. Our findings are consistent with previous cytometric data on small cohorts of TAK and GCA patients that showed a higher proportion of Tfh cells in TAK as compared to GCA patients (7).
Our transcriptomic analysis of CD19+ B cells in LVV patients revealed a significant enrichment of a gene signature associ-ated with B cell activation, proliferation, and differentiation in TAK patients as compared to GCA patients. Consistently, we identi-fied an increase in the number of B cells in the peripheral blood and arterial lesions of TAK patients as compared to GCA patients. Serum levels of BAFF tended to be higher in patients with TAK. Only few studies have described B cell profiles in patients with TAK, but one study has shown an increased absolute number and frequency of peripheral blood CD19+CD20−CD27high antibody– secreting B cells in patients with active TAK (31). The role of B cells in TAK has also been supported by the use of rituximab in case reports (31). In addition, studies have shown a decrease in the level of circulating B cells in patients with active GCA (32) that normalized rapidly with treatment.
Consistent with previous studies, we observed the pres-ence of TLOs in inflamed aortas of patients with TAK and patients with GCA (11,24,33). However, we found significant differences between the two diseases. First, the proportion of TLOs in aorta lesions was clearly increased in TAK patients as compared to
GCA patients. Moreover, their repartition was dramatically differ-ent, with a highly ordered nodular organization of the inflammatory infiltrates in TAK patients. We highlighted the marked expression of CXCR5, Bcl- 6, PD- 1, IL- 21, BAFF, and CXCL13, which are crit-ical molecules for the development and homeostasis of tertiary lymphoid structures. TLOs may be observed in tissues affected by unresolving inflammation as a result of infection, autoimmun-ity, or cancer. These highly ordered structures are composed of cells present in the lymphoid follicles typically associated with the spleen and lymph node compartments (34). The structural similarities between TLOs and B cell follicles found in secondary lymphoid organs suggest a local recruitment of naive cells via high endothelium venules, their activation, and the establishment of an immunologic humoral memory supported by Tfh cells. In the present study, TLOs were mainly detected in the adventitia aorta specimens of TAK patients. Analysis of immune adventitial cells showed a high percentage of memory- and antigen- experienced B cells and the presence of cells expressing canonical Tfh cell markers, such as CXCR5, Bcl- 6, and PD- 1. TCR sequencing of CD4+CXCR5+ T cells located within inflamed aortas of patients with TAK showed oligoclonal populations.
The restricted repertoire of CD4+CXCR5+ T cells within the aorta strongly suggests antigenic selection of Tfh cells. Inter-estingly, the TCR sequences found in our study have already been reported in diseases known to be linked to autoim-mune mechanisms and B cell abnormalities, such as Sjögren’s syndrome (35) and multiple sclerosis (25), and in coronary and cardiac injuries (26,36). Altogether, these results suggest an antigen- specific immune response based on cooperation of Tfh cells and B cells occurring in the adventitia of blood vessels in patients with TAK.
Cooperation between Tfh cells and B cells in TAK patients was further demonstrated by functional tests showing that CD4+CXCR5+ T cells helped B cells to proliferate and differ-entiate. The cooperation between Tfh cells and B cells in TAK was mediated by the JAK/STAT pathway. Zhang et al have pre-viously shown that in GCA patients, tofacitinib effectively sup-presses innate and adaptive immunity in the vessel wall, with reduced proliferation and minimal production of the effector mole-cules interferon- γ, IL- 17, and IL- 21 (37,38). Taken together, these data suggest that JAK inhibitors might be a promising therapeutic strategy in TAK (38).
In summary, we established specific Tfh cell and Tfh17 cell signatures that characterize TAK. We highlight the cooperation between Tfh cells and B cells through the JAK/STAT pathway in patients with TAK. Our results provide new therapeutic approaches toward LVV and important insight into its pathogenesis.
ACKNOWLEDGMENTS
We thank all patients and all physicians involved in the care of the patients. We also thank Fabien Pitoiset, Thomas Vazquez, Guillaume Churlaud, Michele Barbié, Nathalie Ferry, Cornelia Degbe, and Sylvain

DESBOIS ET AL 1242 |
Porrot for their input in conducting experiments. We also thank La Fondation pour la Recherche Médicale.
AUTHOR CONTRIBUTIONS
All authors were involved in drafting the article or revising it critically for important intellectual content, and all authors approved the final version to be published. Drs. Saadoun and Desbois had full access to all the study data and takes responsibility for the integrity of the data and the accuracy of the data analysis.Study conception and design. Desbois, Régnier, Garrido, Cacoub, Klatzmann, Saadoun.Acquisition of data. Desbois, Régnier, Quiniou, Lejoncour, Maciejewski- Duval, Comarmond, Vallet, Rosenzwajg, Darrasse- Jèze, Derian, Pouchot, Samson, Bienvenu, Fouret, Koskas, Garrido, Sène, Bruneval, Cacoub, Klatzmann, Saadoun.Analysis and/or interpretation of data. Desbois, Régnier, Quiniou, Maciejewski- Duval, Bienvenu, Klatzmann, Saadoun.
REFERENCES 1. Enfrein A, Espitia O, Bonnard G, Agard C. Aortitis in giant cell arteri-
tis: diagnosis, prognosis and treatment. Presse Med 2019;48:956– 67. In French.
2. Hommada M, Mekinian A, Brillet PY, Abad S, Larroche C, DhôteR, et al. Aortitis in giant cell arteritis: diagnosis with FDG PET/CTand agreement with CT angiography [review]. Autoimmun Rev2017;16:1131– 7.
3. Ostberg G. An arteritis with special reference to polymyalgia arterit-ica. Acta Pathol Microbiol Scand Suppl 1973;237 Suppl 237:1– 59.
4. Stone JR, Bruneval P, Angelini A, Bartoloni G, Basso C, Batoroeva L,et al. Consensus statement on surgical pathology of the aorta from the Society for Cardiovascular Pathology and the Association for European Cardiovascular Pathology. Part I. Inflammatory diseases [review].Cardiovasc Pathol Off J Soc Cardiovasc Pathol 2015;24:267– 78.
5. Deng J, Younge BR, Olshen RA, Goronzy JJ, Weyand CM.Th17 and Th1 T- cell responses in giant cell arteritis. Circulation2010;121:906– 15.
6. Saadoun D, Garrido M, Comarmond C, Desbois AC, DomontF, Savey L, et al. Th1 and Th17 cytokines drive Takayasu arteritisinflammation. Arthritis Rheumatol 2015;67:1353– 60.
7. Matsumoto K, Suzuki K, Yoshimoto K, Seki N, Tsujimoto H, ChibaK, et al. Significant association between clinical characteristics andchanges in peripheral immuno- phenotype in large vessel vasculitis.Arthritis Res Ther 2019;21:304.
8. Weyand CM, Hicok KC, Hunder GG, Goronzy JJ. The HLA- DRB1locus as a genetic component in giant cell arteritis: mapping of adisease- linked sequence motif to the antigen binding site of theHLA- DR molecule. J Clin Invest 1992;90:2355– 61.
9. Chen S, Luan H, Li L, Zeng X, Wang T, Li Y, et al. Relationship ofHLA- B*51 and HLA- B*52 alleles and TNF- α- 308A/G polymor-phism with susceptibility to Takayasu arteritis: a meta- analysis. ClinRheumatol 2017;36:173– 81.
10. Graver JC, Sandovici M, Diepstra A, Boots AM, Brouwer E. Arterytertiary lymphoid organs in giant cell arteritis are not exclusivelylocated in the media of temporal arteries [letter]. Ann Rheum Dis2018;77:e16.
11. Clement M, Galy A, Bruneval P, Morvan M, Hyafil F, Benali K,et al. Tertiary lymphoid organs in Takayasu arteritis. Front Immunol2016;7:158.
12. Sharma BK, Jain S, Suri S, Numano F. Diagnostic criteria forTakayasu arteritis. Int J Cardiol 1996;54 Suppl 2:S141– 7.
13. Arend WP, Michel BA, Bloch DA, Hunder GG, Calabrese LH,Edworthy SM, et al. The American College of Rheumatology 1990
criteria for the classification of Takayasu arteritis. Arthritis Rheum 1990;33:1129– 34.
14. Hunder GG, Bloch DA, Michel BA, Stevens MB, Arend WP,Calabrese LH, et al. The American College of Rheumatology 1990criteria for the classification of giant cell arteritis. Arthritis Rheum1990;33:1122– 8.
15. Hänzelmann S, Castelo R, Guinney J. GSVA: gene set variationanalysis for microarray and RNA- seq data. BMC Bioinformatics2013;14:7.
16. Crotty S. Follicular helper CD4 T cells (TFH) [review]. Annu RevImmunol 2011;29:621– 63.
17. Crotty S. T follicular helper cell differentiation, function, and roles indisease [review]. Immunity 2014;41:529– 42.
18. Tangye SG, Ma CS, Brink R, Deenick EK. The good, the bad andthe ugly: TFH cells in human health and disease [review]. Nat RevImmunol 2013;13:412– 26.
19. Wei Y, Feng J, Hou Z, Wang XM, Yu D. Flow cytometric anal-ysis of circulating follicular helper T (Tfh) and follicular regu-latory T (Tfr) populations in human blood. Methods Mol Biol2015;1291:199– 207.
20. Spolski R, Leonard WJ. IL- 21 and T follicular helper cells [review]. IntImmunol 2010;22:7– 12.
21. Akiyama M, Suzuki K, Yamaoka K, Yasuoka H, Takeshita M, KanekoY, et al. Number of circulating follicular helper 2 T cells correlateswith IgG4 and interleukin- 4 levels and plasmablast numbers in IgG4- related disease. Arthritis Rheumatol 2015;67:2476– 81.
22. Espéli M, Linterman M, editors. Preface. In: T follicular helper cells:methods and protocols. Clifton (NJ): Humana Press; 2015. p. v– vi.
23. Gaudet P, Bairoch A, Field D, Sansone SA, Taylor C, AttwoodTK, et al, on behalf of the BioDBCore Working Group. TowardsBioDBcore: a community- defined information specification for bio-logical databases. Database (Oxford) 2011;2011:baq027.
24. Ciccia F, Rizzo A, Maugeri R, Alessandro R, Croci S, Guggino G,et al. Ectopic expression of CXCL13, BAFF, APRIL and LT- β is asso-ciated with artery tertiary lymphoid organs in giant cell arteritis. AnnRheum Dis 2017;76:235– 43.
25. Vandevyver C, Mertens N, van den Elsen P, Medaer R, Raus J,Zhang J. Clonal expansion of myelin basic protein- reactive Tcells in patients with multiple sclerosis: restricted T cell recep-tor V gene rearrangements and CDR3 sequence. Eur J Immunol1995;25:958– 68.
26. Slachta CA, Jeevanandam V, Goldman B, Lin WL, PlatsoucasCD. Coronary arteries from human cardiac allografts with chronicrejection contain oligoclonal T cells: persistence of identical clonallyexpanded TCR transcripts from the early post- transplantation period (endomyocardial biopsies) to chronic rejection (coronary arteries).J Immunol 2000;165:3469– 83.
27. Winchester R, Wiesendanger M, O’Brien W, Zhang HZ, MaurerMS, Gillam LD, et al. Circulating activated and effector memoryT cells are associated with calcification and clonal expansions inbicuspid and tricuspid valves of calcific aortic stenosis. J Immunol2011;187:1006– 14.
28. Morita R, Schmitt N, Bentebibel SE, Ranganathan R, Bourdery L,Zurawski G, et al. Human blood CXCR5+CD4+ T cells are counter-parts of T follicular cells and contain specific subsets that differen-tially support antibody secretion. Immunity 2011;34:108– 21.
29. Kim CH, Rott LS, Clark- Lewis I, Campbell DJ, Wu L, Butcher EC.Subspecialization of CXCR5+ T cells: B helper activity is focused ina germinal center- localized subset of CXCR5+ T cells. J Exp Med2001;193:1373– 81.
30. Ueno H, Banchereau J, Vinuesa CG. Pathophysiology of T fol-licular helper cells in humans and mice [review]. Nat Immunol2015;16:142– 52.

FOLLICULAR HELPER T CELLS IN LVV | 1243
31. Hoyer BF, Mumtaz IM, Loddenkemper K, Bruns A, Sengler C, Hermann KG, et al. Takayasu arteritis is characterised by distur-bances of B cell homeostasis and responds to B cell depletion ther-apy with rituximab. Ann Rheum Dis 2012;71:75– 9.
32. Van der Geest KS, Abdulahad WH, Chalan P, Rutgers A, Horst G, Huitema MG, et al. Disturbed B cell homeostasis in newly diagnosed giant cell arteritis and polymyalgia rheumatica. Arthritis Rheumatol 2014;66:1927– 38.
33. Graver JC, Boots AM, Haacke EA, Diepstra A, Brouwer E, Sandovici M. Massive B- cell infiltration and organization into artery tertiary lym-phoid organs in the aorta of large vessel giant cell arteritis. Front Immunol 2019;10:83.
34. Ruddle NH. High endothelial venules and lymphatic vessels in ter-tiary lymphoid organs: characteristics, functions, and regulation [review]. Front Immunol 2016;7:491.
35. Joachims ML, Leehan KM, Lawrence C, Pelikan RC, Moore JS, Pan Z, et al. Single- cell analysis of glandular T cell receptors in Sjögren’s syndrome. JCI Insight 2016;1:e85609.
36. Winchester R, Wiesendanger M, O’Brien W, Zhang HZ, Maurer MS, Gillam LD, et al. Circulating activated and effector memory T cells are associated with calcification and clonal expansions in bicuspid and tricuspid valves of calcific aortic stenosis. J Immunol 2011;187:1006– 14.
37. Zhang H, Watanabe R, Berry GJ, Tian L, Goronzy JJ, Weyand CM. Inhibition of JAK- STAT signaling suppresses pathogenic immune responses in medium and large vessel vasculitis. Circulation 2018;137:1934– 48.
38. Régnier P, Le Joncour A, Maciejewski- Duval A, Desbois AC, Comarmond C, Rosenzwajg M, et al. Targeting JAK/STAT pathway in Takayasu’s arteritis. Ann Rheum Dis 2020;79:951– 9.

1244
Arthritis & RheumatologyVol. 73, No. 7, July 2021, pp 1244–1252DOI 10.1002/art.41637© 2021, American College of Rheumatology
Genetic Association of a Gain- of- Function IFNGR1 Polymorphism and the Intergenic Region LNCAROD/DKK1 With Behçet’s DiseaseLourdes Ortiz Fernández,1 Patrick Coit,1 Vuslat Yilmaz,2 Sibel P. Yentür,2 Fatma Alibaz- Oner,3 Kenan Aksu,4 Eren Erken,5 Nursen Düzgün,6 Gokhan Keser,4 Ayse Cefle,7 Ayten Yazici,7 Andac Ergen,8 Erkan Alpsoy,9 Carlo Salvarani,10 Bruno Casali,11 Bünyamin Kısacık,12 Ina Kötter,13 Jörg Henes,14 Muhammet Çınar,15 Arne Schaefer,16 Rahime M. Nohutcu,17 Alexandra Zhernakova,18 Cisca Wijmenga,18 Fujio Takeuchi,19 Shinji Harihara,20 Toshikatsu Kaburaki,21 Meriam Messedi,22 Yeong- Wook Song,23 Timuçin Kaşifoğlu,24 F. David Carmona,25 Joel M. Guthridge,26 Judith A. James,26 Javier Martin,27 María Francisca González Escribano,28 Güher Saruhan- Direskeneli,2 Haner Direskeneli,3 and Amr H. Sawalha1
Objective. Behçet’s disease is a complex systemic inflammatory vasculitis of incompletely understood etiology. This study was undertaken to investigate genetic associations with Behçet’s disease in a diverse multiethnic population.
Methods. A total of 9,444 patients and controls from 7 different populations were included in this study. Genotyping was performed using an Infinium ImmunoArray- 24 v.1.0 or v.2.0 BeadChip. Analysis of expression data from stimulated monocytes, and epigenetic and chromatin interaction analyses were performed.
Results. We identified 2 novel genetic susceptibility loci for Behçet’s disease, including a risk locus in IFNGR1 (rs4896243) (odds ratio [OR] 1.25; P = 2.42 × 10⁻⁹) and within the intergenic region LNCAROD/DKK1 (rs1660760) (OR 0.78; P = 2.75 × 10⁻⁸). The risk variants in IFNGR1 significantly increased IFNGR1 messenger RNA expression in lipopolysaccharide- stimulated monocytes. In addition, our results replicated the association (P < 5 × 10⁻⁸) of 6 previously identified susceptibility loci in Behçet’s disease: IL10, IL23R, IL12A- AS1, CCR3, ADO, and LACC1, reinforcing the notion that these loci are strong genetic factors in Behçet’s disease shared across ancestries. We also identified >30 genetic susceptibility loci with a suggestive level of association (P < 5 × 10⁻⁵), which will require replication. Finally, functional annotation of genetic susceptibility loci in Behçet’s disease revealed their possible regulatory roles and suggested potential causal genes and molecular mechanisms that could be further investigated.
Conclusion. We performed the largest genetic association study in Behçet’s disease to date. Our findings reveal novel putative functional variants associated with the disease and replicate and extend the genetic associations in other loci across multiple ancestries.
Supported by the National Institute of Arthritis and Musculoskeletal and Skin Diseases of the National Institutes of Health (NIH) grant number R01-AR070148 to Dr. Sawalha. Recruitment and genotyping of the European-American controls was supported by NIH grants number U54GM104938, U19AI082714, UM1AI144292, P30AR053483, and P30AR073750 to Drs. Guthridge and James. This work was supported by the use of study data downloaded from the dbGaP web site, under dbGaP accession phs000272.v1.p1.
1Lourdes Ortiz Fernández, PhD, Patrick Coit, MPH, Amr H. Sawalha, MD: University of Pittsburgh, Pittsburgh, Pennsylvania; 2Vuslat Yilmaz, PhD, Sibel P. Yentür, PhD, Güher Saruhan- Direskeneli, MD: Istanbul University, Istanbul, Turkey; 3Fatma Alibaz- Oner, MD, Haner Direskeneli, MD: Marmara University School of Medicine, Istanbul, Turkey; 4Kenan Aksu, MD, Gokhan Keser, MD: Ege University School of Medicine, Izmir, Turkey; 5Eren Erken, MD: Cukurova University School of Medicine, Adana, Turkey; 6Nursen Düzgün, MD: Ankara University School of Medicine, Ankara, Turkey; 7Ayse Cefle, MD, Ayten Yazici, MD: Kocaeli University School of Medicine, Kocaeli, Turkey; 8Andac Ergen, MD: Okmeydanı Research and Education Hospital, Istanbul, Turkey; 9Erkan Alpsoy, MD: Akdeniz University School of Medicine, Antalya, Turkey; 10Carlo Salvarani, MD: Azienda USL- IRCCS di Reggio Emilia and Università di Modena
e Reggio Emilia, Modena, Italy; 11Bruno Casali, MD: Azienda Ospedaliera Arcispedale Santa Maria Nuova- IRCCS di Reggio Emilia, Reggio Emilia, Italy; 12Bünyamin Kısacık, MD: Gaziantep University, Gaziantep, Turkey; 13Ina Kötter, MD: University Medical Center Hamburg- Eppendorf, Hamburg, Germany; 14Jörg Henes, MD: University Hospital Tuebingen, Tuebingen, Germany; 15Muhammet Çınar, MD: University of Health Sciences Turkey, Ankara, Turkey; 16Arne Schaefer, PhD: Charité University Medicine, Berlin, Germany; 17Rahime M. Nohutcu, DDS: Hacettepe University Sihhiye, Ankara, Turkey; 18Alexandra Zhernakova, MD, PhD, Cisca Wijmenga, PhD: University of Groningen and University Medical Center Groningen, Groningen, The Netherlands; 19Fujio Takeuchi, MD: Tokyo Seiei University, Tokyo, Japan; 20Shinji Harihara, PhD: University of Tokyo Graduate School of Science, Tokyo, Japan; 21Toshikatsu Kaburaki, MD, PhD: Jichi Medical University Saitama Medical Center, Saitama, Japan; 22Meriam Messedi, PhD: Research Laboratory of Molecular Bases of Human Diseases 12ES17 and University of Sfax, Sfax, Tunisia; 23Yeong- Wook Song, MD: Seoul National University College of Medicine, Seoul, Republic of Korea; 24Timuçin Kaşifoğlu, MD: Eskisehir Osmangazi University School of Medicine, Eskisehir, Turkey; 25F. David Carmona, PhD: Universidad de Granada and ibs.GRANADA Instituto de Investigación Biosanitaria, Granada, Spain; 26Joel M. Guthridge, PhD, Judith

MULTIETHNIC GENETIC ANALYSIS IN BEHÇET’S DISEASE | 1245
INTRODUCTION
Behçet’s disease is a chronic relapsing– remitting inflamma-tory disorder characterized by recurrent oral and genital ulcers. It is a systemic vasculitis that can affect the eyes, skin, blood vessels, central nervous system, and gastrointestinal tract (1). Behçet’s disease is also known as the “Silk Road disease,” since its highest prevalence coincides with this ancient route, stretch-ing from Japan to the Mediterranean region (2). However, patients worldwide have been diagnosed as having Behçet’s disease (3). Although the etiology and pathogenesis of Behçet’s disease remain incompletely understood, it is suspected that environmen-tal factors, such as infectious agents and others, might trigger the onset of the disease in genetically predisposed individuals by propagating a dysregulated immune response (4).
The genetic studies performed to date in Behçet’s disease have clearly established the HLA class I region as the most robust genetic susceptibility locus for the disease (5). Although the association with the classic HLA allele HLA– B*51 has been replicated in multiple ancestries, several additional loci within the HLA region, including a putative functional variant between HLA– B and MICA, have been reported (6– 8). Outside the HLA region, at least 16 loci have been reported to be associated with Behçet’s disease at a genome- wide level of significance (9– 16). These genetic susceptibility loci, such as IL10, IL23R- IL12RB2, STAT4, and FUT2, among others, provided impor-tant insights into the pathogenic mechanisms that could be underlying the pathophysiology and immune dysregulation in Behçet’s disease.
Despite the progress in understanding the genetic etiology of Behçet’s disease, the majority of genome- wide association studies to date in this disease have presented data predominantly derived from 1 or 2 ancestral populations. In addition, currently available studies are limited by a relatively small sample size com-pared to genetic studies in other immune- mediated diseases, which is in part due to the low prevalence of Behçet’s disease in many populations.
We performed a large genetic association study involving 9,444 individuals, including Behçet’s disease patients and con-trols, from 7 diverse populations around the world. We identified 2 novel genetic associations in Behçet’s disease, most notably including a susceptibility variant that increases the expression of the IFNGR1 gene in monocytes. In addition, we extended the association of several previously reported genetic susceptibility loci to other populations and identified >30 loci with a suggestive association that provide additional insights into the pathogenesis of Behçet’s disease.
PATIENTS AND METHODS
Study population. A total of 9,444 individuals (3,477 patients and 5,967 controls) were included in this study. All patients fulfilled the 1990 International Study Group classification criteria for Behçet’s disease (17). Our study population consisted of the fol-lowing 7 independent cohorts of diverse ancestries: Turkish (1,317 cases and 699 controls), Spanish (278 cases and 1,517 controls), Italian (144 cases and 1,270 controls), Korean (200 cases and 200 controls), Tunisian (136 cases and 186 controls), Japanese (120 cases and 218 controls), and Western European (67 cases and 599 controls). Genotyping was performed using Illumina Immu-noChip custom arrays (Infinium ImmunoArray- 24 v.1.0 or v.2.0 BeadChip) according to the manufacturer’s instructions. Additional genotyping data from 1,215 Turkish cases and 1,278 Turkish con-trols were obtained from dbGaP (accession no. phs000272.v1.p1) (9). A detailed description of the study population can be found in Supplementary Table 1, available on the Arthritis & Rheumatology website at http://onlin elibr ary.wiley.com/doi/10.1002/art.41637/ abstract. The study was approved by the institutional review boards and the ethics committees at all participating institutions, and all study participants signed a written informed consent.
Data quality assessment and measures. The same stringent quality control measures were applied separately in each population cohort, to maintain consistency across populations, using Plink v.1.9 (18). Single- nucleotide polymorphisms (SNPs) were removed if they had a genotyping call rate <98%, minor allele frequency (MAF) <1%, or deviation from Hardy- Weinberg equilibrium in either cases or controls (P < 1 × 10⁻³). SNPs on sex chromosomes were not analyzed. In addition, samples with a genotyping call rate <95% were filtered out. Relatedness was assessed, and 1 individual from each pair of duplicates and/or first- degree relatives (Pi- HAT > 0.4) was randomly excluded.
To control for possible population stratification, principal com-ponents analysis was performed using a set of linkage disequilib-rium (LD)– pruned markers, pairwise r2 < 0.20, with EigenSoft 6.1.4 software (19). Individuals >6 SD from the cluster centroids were considered outliers and were not included in the analyses. Dot plots showing the first 2 principal components were generated for each population using R 3.6 software (20) and are shown in Supplemen-tary Figure 1, available on the Arthritis & Rheumatology website at http://onlin elibr ary.wiley.com/doi/10.1002/art.41637/ abstract.
Imputation. Post– quality control genotyping data were used for the imputation of autosomal SNPs, which was conducted for each population independently with the Michigan Impu-tation Server using Minimac3 (21). The software SHAPEIT (22)
A. James, MD, PhD: Oklahoma Medical Research Foundation, Oklahoma City; 27Javier Martin, MD, PhD: Instituto de Parasitología y Biomedicina ‘López- Neyra’, Granada, Spain; 28María Francisca González Escribano, MD, PhD: Instituto de Biomedicine de Sevilla, Hospital Universitario Virgen del Rocío, CSIC, Universidad de Sevilla, Seville, Spain.
No potential conflicts of interest relevant to this article were reported.Address correspondence to Amr H. Sawalha, MD, 7123 Rangos Research
Center, 4401 Penn Avenue, Pittsburgh, PA 15224. Email: [email protected] for publication September 26, 2020; accepted in revised form
December 31, 2020.

ORTIZ FERNÁNDEZ ET AL 1246 |
was used for haplotype reconstruction with the Haplotype Ref-erence Consortium r1.1 (23) as the reference population. Only SNPs with stringent correlation values (r2 > 0.9) were maintained for further analyses. Finally, additional quality control measures were conducted, and variants with MAF <1% or Hardy- Weinberg equilibrium P < 1 × 10⁻³ were excluded.
Data analysis. Plink v.1.9 (18) was used to perform asso-ciation analyses. First, logistic regression was assessed for each population independently. The 5 first principal components were used as covariates. Genomic inflation factor (λ) was calculated per cohort using a set of ~3,000 SNPs included in the ImmunoChip, known as “null” SNPs, that have not previously been associated with immune- mediated diseases. Quantile– quantile plots for the P values are shown in Supplementary Figure 2, available on the Arthritis & Rheumatology website at http://onlin elibr ary.wiley.com/doi/10.1002/art.41637/ abstract. Then, we performed a multi-ethnic meta- analysis by means of the inverse variance method including the results of the logistic regressions for all populations. Heterogeneity of associations was tested using Cochran’s Q test P value (Q) and heterogeneity index (I2). A fixed- effects model was applied for those SNPs without evidence of heterogeneity (Q > 0.1 and I2 < 50%). Q ≤ 0.1 and I2 ≥ 50% indicate evidence of hetero-geneity, and a random- effects model was applied in that case. The commonly used genome- wide threshold of P < 5 × 10⁻⁸ was established for significant associations, and the SNP showing the lowest P value within each associated genomic region was reported as the lead SNP. In addition, a threshold of P < 5 × 10⁻⁵ was established for suggestive associations.
Next, we performed joint conditional analysis using GCTA software to determine if multiple independent associations exist within an associated genomic region (24,25). This method uses the summary statistic from the meta- analysis and corrects for LD. Genotyping data from the 7 populations were used to esti-mate the LD patterns used as reference, and the lead SNP was included as a covariate. We considered independent signals if a variant reached a conditional P value < 5 × 10⁻⁸. Both associ-ated and suggestive genomic regions are named, in figures and tables, by the bounding genes except in the cases in which the literature repeatedly involves a specific gene. Finally, the qqman R package was used to generate the Manhattan and quantile– quantile plots.
To check if the overall risk allele frequencies identified in our study were different across our study populations, we first obtained the frequencies of the associated and suggestive variants (P < 5 × 10⁻⁵) for cases and controls independently using Plink v.1.9. Only variants that were present in ≥6 of the 7 populations after quality control were considered. One- way analysis of variance (ANOVA) was performed using GraphPad Prism version 8.1.1 (GraphPad Software). Results for each group are presented as the mean ± SD. P values less than 0.05 were considered significant.
Functional annotation. To better understand the statisti-cal associations in the disease context, we evaluated the potential causalities of the identified associated variants by performing a comprehensive functional annotation. First, we explored Regu-lomeDB to annotate the SNPs with regulatory elements and get a probability score of how likely each variant plays a regulatory role (26). This score ranges from 0 to 1, with 1 being the most likely to be a regulatory variant. In addition, we queried HaploReg v4.1 for the epigenomic annotations (27) and the webtool Capture Hi- C plotter, https://www.chicp.org/chicp/, to evaluate chromatin interactions between SNPs and gene promoter regions (28). We also interrogated if our associated variants have been identified as acting as expression quantitative trait loci (eQTL) through the web tool FUMA GWAS (http://fuma.ctglab.nl) and through HaploReg v4.1.
We used expression and genotyping data from a previous study for the representation of the eQTL of IFNGR1 (29,30). Briefly, expression profiling of primary CD14+ monocytes obtained from 260 European individuals and stimulated with lipopolysaccha-ride (LPS) for 2 hours was performed with a HumanHT- 12v4 BeadChip (Illumina), and genotyping was performed using a HumanOmniExpress- 12v1.0 BeadChip (Illumina) as previously described (29,30). These data were analyzed using one- way ANOVA followed by Tukey’s multiple comparisons test.
Finally, we explored the GWAS Catalog (https://www.ebi.ac. uk/gwas) to assess the pleiotropic effect of our associated signals.
RESULTS
After filtering with stringent quality controls, we analyzed a total of 8,982 individuals (3,197 patients) from 7 different popula-tions: Turkish, Spanish, Italian, Korean, Tunisian, Japanese, and Western European. A summary of sample/variant quality control is shown in Supplementary Table 2, available on the Arthritis & Rheu-matology website at http://onlin elibr ary.wiley.com/doi/10.1002/art.41637/ abstract. Association testing was performed within each ancestry using a logistic regression model (Supplementary Figure 3, available on the Arthritis & Rheumatology website at http://onlin elibr ary.wiley.com/doi/10.1002/art.41637/ abstract), and genomic control analysis showed no evidence of population stratification for any cohort (genomic inflation factor [λ] < 1.04) (Supplementary Table 2, available on the Arthritis & Rheumatology website at http://onlin elibr ary.wiley.com/doi/10.1002/art.41637/ abstract). Next, we undertook a multiethnic meta- analysis to com-bine the results of the 7 populations (Figure 1). Consistent with our current knowledge of the disease, the strongest association was observed within the HLA region, which has been characterized previously (6,12,13).
Excluding the well- known HLA region, our results revealed 62 variants at the genome- wide significance level (P < 5 × 10⁻⁸) that mapped onto 8 different genomic regions. Detailed results

MULTIETHNIC GENETIC ANALYSIS IN BEHÇET’S DISEASE | 1247
of all these variants, including the association results for each population independently, are shown in Supplementary Table 3, available on the Arthritis & Rheumatology website at http://onlin elibr ary.wiley.com/doi/10.1002/art.41637/ abstract. We per-formed joint conditional analysis to test if >1 variant within the associated genomic regions was independently associated with Behçet’s disease. This approach did not identify any additional independent signals for any of the 8 loci; conditional P values are shown in Supplementary Table 4, available on the Arthritis & Rheu-matology website at http://onlin elibr ary.wiley.com/doi/10.1002/art.41637/ abstract. Therefore, we used the strongest associated variant within each locus as the lead SNP of the association. Results for the lead SNP of each locus are illustrated in Table 1. Two of these 8 loci (IFNGR1 and the intergenic region LNCAROD/DKK1) are novel genetic associations in Behçet’s disease, while the remaining 6 loci have been reported previously.
Of the 2 novel associated loci, the most strongly associated signal was located near IFNGR1 (lead SNP rs4896243) (odds ratio [OR] 1.25; P = 2.42 × 10⁻⁹). This genetic region also har-bored 2 additional genome- wide associated variants (rs4896242
[P = 4.62 × 10⁻⁹] and rs1327474 [P = 8.35 × 10⁻⁹]) represent-ing the same signal of association. Consistent OR directions were observed across ancestries. These polymorphisms are in high LD, which was also reflected by the results of the condi-tional analysis (Supplementary Table 4). No additional markers in LD were included in the analyses, as illustrated in the regional plots (regional plots showing the results of this region in each population are shown in Supplementary Figure 4, available on the Arthritis & Rheumatology website at http://onlin elibr ary.wiley.com/doi/10.1002/art.41637/ abstract).
In common with most genetic variants associated with immune- mediated diseases, the IFNGR1 polymorphisms identi-fied in our study reside in noncoding regions. Therefore, we carried out a comprehensive functional annotation to try to decipher the causal mechanisms of this association (Table 2 and Supplemen-tary Table 5, available on the Arthritis & Rheumatology website at http://onlin elibr ary.wiley.com/doi/10.1002/art.41637/ abstract). Epigenetic annotation revealed colocalization of the 3 associated variants with enhancer histone marks. In addition, rs1327474 colo-calizes with promoter histone marks and DNase hypersensitivity
Figure 1. Manhattan plot showing the results of a meta- analysis of Behçet’s disease cases and controls in the 7 populations included in this study (Turkish, Spanish, Italian, Korean, Tunisian, Japanese, and Western European). The −log10 P value for each genetic variant analyzed is plotted against its physical chromosomal position. The red line represents the genome- wide level of significance (P < 5 × 10⁻⁸), and the blue line represents the suggestive level of significance (P < 5 × 10⁻⁵).
Table 1. Results of the meta- analysis for the lead SNP of each genetic region associated with Behçet’s disease at a GWAS level of significance*
Locus Chromosome Position (hg19) SNP Location Minor allele P ORIL10 1 206945311 rs3024490 Intronic A 2.81 x 10⁻¹⁰ 1.26Il23R 1 67744601 rs6660226 Downstream A 1.01 x 10⁻¹⁰ 0.79IL12A- AS1 3 159637678 rs76830965 Intronic A 3.43 x 10⁻¹² 1.66CCR3 3 46208310 rs2087726 Intronic G 9.33 x 10⁻¹⁰ 0.79IFNGR1† 6 137514790 rs4896243 Downstream C 2.42 x 10⁻⁹ 1.25LNCAROD- DKK1† 10 54154620 rs1660760 Intergenic T 2.75 x 10⁻⁸ 0.78ADO 10 64561506 rs12220700 Upstream G 3.07 x 10⁻⁸ 0.80LACC1 13 44457925 rs2121034 Downstream T 9.44 x 10⁻⁹ 0.79
* The genome- wide association study (GWAS) level of significance was set at P < 5 × 10⁻⁸. SNP = single- nucleotide polymorphism; hg19 = human reference genome; OR = odds ratio. † Newly identified locus.

ORTIZ FERNÁNDEZ ET AL 1248 |
sites in multiple primary tissues and cell types, including blood cells. Finally, ChIP- Seq data revealed that rs1327474 is located within an RNA polymerase II binding site in a B cell line (GM12891). Because these data suggest a potential regulatory role of these polymorphisms in IFNGR1, we checked if these variants have been identified to act as eQTLs (Table 2 and Supplementary Table 6, available on the Arthritis & Rheumatology website at http://onlin elibr ary.wiley.com/doi/10.1002/art.41637/ abstract).
Interestingly, a previous study found that the variants rs4896243 and rs1327474 act as eQTLs for IFNGR1 expression in monocytes after a 2- hour LPS stimulation (P = 2.07 × 10⁻¹⁸ and 2.18 × 10⁻¹⁸, respectively) (29). Our analysis of these data revealed that the Behçet’s disease– associated risk alleles increased the expression level of IFNGR1 (Figure 2). Finally, physical chroma-tin interactions between these polymorphisms and other genes, such as TNFAIP3, IL22RA, and OLIG3, have been detected in different blood cell types (Supplementary Table 7 and Supplemen-tary Figure 5, available on the Arthritis & Rheumatology website at http://onlin elibr ary.wiley.com/doi/10.1002/art.41637/ abstract).
We also reported 2 genome- wide associated SNPs located in an intergenic region between LNCAROD and DKK1 (lead SNP rs1660760) (OR 0.78; P = 2.75 × 10⁻⁸), representing a newly identified signal associated with Behçet’s disease. Only genetic data for the Turkish population were maintained in this locus after quality control, and none of these variants showed high LD with any other genotyped or imputed SNPs (Supplementary Figure 4, available on the Arthritis & Rheumatology website at http://online libr ary.wiley.com/doi/10.1002/art.41637/ abstract). The lead SNP, rs1660760, has been reported to act as an eQLT in brain tissue (Table 2 and Supplementary Table 6, available on the Arthritis & Rheumatology website at http://onlin elibr ary.wiley.com/doi/10. 1002/art.41637/ abstract).
In addition to the 2 new susceptibility loci we report in this study, we replicated with a genome- wide level of significance 6
previously described loci in Behçet’s disease: IL10 (lead SNP rs -3024490) (OR 1.26; P = 2.81 × 10⁻¹⁰), IL23R (lead SNP rs6660226) (OR 0.79; P = 1.01 × 10⁻¹⁰), IL12A- AS1 (lead SNP rs76830965) (OR 1.66; P = 3.43 × 10⁻¹²), CCR3 (lead SNP rs2087726) (OR 0.79; P = 9.33 × 10⁻¹⁰), ADO (lead SNP rs12220700) (OR 0.80; P = 3.07 × 10⁻⁸), and LACC1 (lead SNP rs2121034) (OR 0.79; P = 9.44 × 10⁻⁹). Consistent OR directions were observed across ancestries for each locus. These data reinforce the strength of these associations and provide evidence of a shared genetic background across ancestries in Behçet’s disease (Supplementary Table 3, available on the Arthritis & Rheumatology website at http://onlin elibr ary.wiley.com/doi/10.1002/art.41637/ abstract).
We further evaluated the possible functional implications of the genetic variants identified in this study that are within the 6 loci previously identified with a genome- wide association study (GWAS) level of significance in Behçet’s disease. We found over-lap with epigenetic features for all 6 of these loci (Table 2 and Supplementary Table 5 and Supplementary Figure 6, available on the Arthritis & Rheumatology website at http://onlin elibr ary.wiley.com/doi/10.1002/art.41637/ abstract). Most of the polymor-phisms identified as susceptibility variants for Behçet’s disease within these loci may change regulatory motifs and potentially alter transcription factor binding, and a significant proportion of variants overlapped with promoter and/or enhancer histone marks in ≥1 tissue and/or cell type. In addition, most variants appear to act as eQTLs, thus modifying gene expression levels (Supplementary Table 6). Notably, the disease risk alleles in IL10 are associated with reduced expression of IL10 in whole blood. The Behçet’s disease– associated variants in IL23R identified in our meta- analysis are also associated with altered expression levels in whole blood for the following genes: PHKB, BATF2, CYB5R4, DRR1, and SLC35D1. Finally, Hi- C data revealed that most of the genetic variants associ-ated with Behçet’s disease with a GWAS level of significance in our study showed physical chromatin interaction with gene promoter
Table 2. Functional annotation of the 8 non- HLA loci associated with Behçet’s disease at a GWAS level of significance*
Locus SNPRegulomeDB
score
Promoter histone marks
Enhancer histone marks
DNase hyper-
sensitivityProteins bound
eQTL in blood
cells
eQTL in other tissues
IL10 rs1800872 0.609 Yes Yes No Yes IL10 IL19, IL24, FAIM3Il23R rs2019262 0.638 Yes No No IL23R MIER1, IL12RB2, C1orf141IL12A- AS1 rs76830965 0.775 Yes Yes Yes Yes – IL12A, TRIM59, BTN3A1,
STAT1, GBP1, IFI6, APOL3, IFI44L, HERC6, MX1, GBP2, SCHIP1
CCR3 rs35678191 0.614 No Yes No No CCR5, CCR3, CCR2, CCRL2, CCR9, LZTFL1, CCR1, LRRC2, CXCR6, SACM1L
CXCR6, CCR2, CCR1, SLC6A20, PRSS45, PRSS46, CCR5
IFNGR1 rs4896243 0.805 No Yes No No IFNGR1 IFNGR1LNCAROD- DKK1 rs1660760 0.184 No No No No – DKK1ADO rs224106 0.154 No No No No ADO ADO, EGR2LACC1 rs2121033 0.922 No No No No CCDC122, LACC1 CCDC122, LACC1, ENOX1
* The variant showing the highest RegulomeDB score for each region is displayed. The genome- wide association study (GWAS) level of significance was set at P < 5 × 10⁻⁸. SNP = single- nucleotide polymorphism; eQTL = expression quantitative trait locus.

MULTIETHNIC GENETIC ANALYSIS IN BEHÇET’S DISEASE | 1249
regions (Supplementary Table 7). Of special note are those inter-actions between SNPs and the promoters of the genes whose expression levels were affected in the same cell type, such as the interactions between the Behçet’s disease– associated CCR3 var-iants and the promoters of CCR1 and CXCR6 in immune cells. These analyses support the idea that additional genes might be involved in the pathology of Behçet’s disease and might represent potential targets that could be further investigated.
Our study also revealed evidence of a suggestive associa-tion (P < 5 × 10⁻⁵) in 752 additional SNPs corresponding to 39 genomic regions (including SNPs within LACC1, CCR3, and IL23R) (Supplementary Table 8, available on the Arthritis & Rheu-matology website at http://onlin elibr ary.wiley.com/doi/10.1002/art.41637/ abstract). Among these loci, it is worth highlighting our findings in genes that have previously been found to be associated with Behçet’s disease, such as IL1A- IL1B (lead SNP rs35145107; P = 1.56 × 10⁻⁶), IRF8 (lead SNP rs6540239; P = 3.61 × 10⁻⁷), and UBAC2 (lead SNP rs4771332; P = 8.38 × 10⁻⁶). Additional suggestive associations in our study include IRF5 (lead SNP rs192829776; P = 6.40 × 10⁻⁶) and LBP (lead SNP rs139169382; P = 4.36 × 10⁻⁵), among others (Supplementary Table 8). Results from our data in genetic variants previously reported to be associ-ated with Behçet’s disease with a GWAS level of significance are shown in Supplementary Table 9, available on the Arthritis & Rheu-matology website at http://onlin elibr ary.wiley.com/doi/10.1002/art.41637/ abstract.
DISCUSSION
The present study is the largest genetic association study undertaken to date in Behçet’s disease. Our results identified 2 novel genetic regions associated with Behçet’s disease, a gain- of- function IFNGR1 polymorphism and variants in the intergenic region LNCAROD/DKK1. In addition, our data replicated the association of 6 previously reported genetic susceptibility loci for this disease and extended those associations across ancestries.
We have demonstrated, for the first time, the involvement of IFNGR1 as a susceptibility locus for Behçet’s disease. IFNGR1 encodes the binding subunit, α chain, of the interferon- γ (IFNγ) receptor. The binding of IFNγ stimulates the activation of the JAK/STAT signaling pathway, which is crucial for the activation of the immune system (31). Interestingly, Tulunay and colleagues observed an increase in JAK/STAT signaling in both CD14+ mono-cytes (P = 9.55 × 10⁻³) and CD4+ lymphocytes (P = 8.13 × 10⁻⁴) in patients with Behçet’s disease compared with healthy individuals (32). Our functional annotation analysis strongly suggested a regu-latory role of the IFNGR1- associated variants. Indeed, we demon-strated that the Behçet’s disease risk alleles in this locus increase IFNGR1 expression in monocytes after 2 hours of LPS stimulation. Few studies analyzing the involvement of monocytes in Behçet’s disease have been published to date (32– 35). Considering that the knowledge of the context and cell types that determine the strength of the eQTLs may help to identify molecular mechanisms
Figure 2. Expression quantitative trait locus associations between 2 IFNGR1 variants (rs1327474 and rs4896243) and IFNGR1 transcripts in monocytes stimulated with lipopolysaccharide for 2 hours. The risk alleles (C) for both single- nucleotide polymorphisms correlated with significantly higher expression levels of IFNGR1. P values shown were determined by one- way analysis of variance. Differences between genotypes were as follows: for rs1327474, P = 4.40 × 10⁻² for CC versus CT, P = 5.98 × 10⁻⁵ for CC versus TT, and P = 2.10 × 10⁻² for CT versus TT; and for rs4896243, P = 6.15 × 10⁻³ for CC versus CT, P = 5.74 × 10⁻⁵ for CC versus TT, and P = 1.02 × 10⁻¹ for CT versus TT, by Tukey’s multiple comparisons test. Symbols represent individual samples; bars show the mean ± SD.

ORTIZ FERNÁNDEZ ET AL 1250 |
relevant to the disease (36), further research focused on elucidat-ing the role of this genetic association in monocytes and its effect on Behçet’s disease– related pathophysiology is warranted.
IFNγ has been shown to play a key role in multiple molecular processes that are essential for a normal immune response such as promoting macrophage activation, orchestrating activation of the innate immune system, regulating Th1/Th2 balance, enhanc-ing antigen presentation, and mediating antiviral and antibacterial immunity (37,38). Notably, IFNGR1 polymorphisms have been associated with susceptibility to several infectious agents, includ-ing Helicobacter pylori, Mycobacterium tuberculosis, and hepati-tis B virus (39– 41). All of this evidence supports the hypothesis that an infectious agent acts as a trigger for the onset of Behçet’s disease in individuals with predisposing genetic background, and highlight monocytes as a relevant cell type in the pathophysiology of Behçet’s disease. In addition, these data support a potential role for JAK/STAT inhibitors as therapeutic consideration for clinical tri-als in Behçet’s disease (42).
Interestingly, an intronic variant in IFNGR1, rs7749390, has recently been identified as a genetic factor for mouth ulcers, albeit with a modest effect (OR 1.08 [95% confidence interval 1.07– 1.08]) (43). This variant only passed the quality control measures in the Tunisian population in our study, which limited the statistical power to detect a genome- wide level association. However, our results showed a nominal association for this SNP with Behçet’s disease (OR 1.53 [95% confidence interval 1.05– 2.21]; P = 1.36 × 10⁻²). In addition, the IFNGR1- associated variants identified in our study and rs7749390 are in LD, suggesting that they might corre-spond with the same signal (Supplementary Table 10, available on the Arthritis & Rheumatology website at http://onlin elibr ary.wiley.com/doi/10.1002/art.41637/ abstract).
The results of our study also revealed a new genetic sig-nal within an intergenic region between LNCAROD and DKK1. LNCARDOD encodes a long intergenic non– protein- coding RNA that acts as an activating regulator of DKK1. DKK1 inhibits β- catenin– dependent Wnt signaling by binding to the co- receptor LRP6 (44). Wnt signaling has been shown to play a crucial role in several biologic processes, including cellular proliferation, angio-genesis, and development of the immune system (45,46). In addi-tion, recent evidence suggested the pathogenic involvement of DKK1 through the Wnt signaling pathway in immune- mediated diseases such as rheumatoid arthritis, psoriasis, systemic scle-rosis, systemic lupus erythematosus, and ankylosing spondylitis (45,47). Therefore, Wnt signaling has gained increasing attention as a possible therapeutic target in immune- mediated diseases (47). However, considering that these polymorphisms were iden-tified only in the Turkish cohort in our study, replication as well as functional studies are needed.
Our results replicated the association of IL10, IL23R, IL12A- AS1, CCR3, ADO, and LACC1 in Behçet’s disease. In addition, several of the associated variants in these loci have been reported to be associated with other immune- mediated disorders
and/or infectious agents, which indicates a pleiotropic effect of these genetic variants (Supplementary Table 11, available on the Arthritis & Rheumatology website at http://onlin elibr ary.wiley.com/doi/10.1002/art.41637/ abstract). However, the causal mecha-nisms of these genetic associations remain unclear. Functional annotation analysis can reveal predicted functional effects and generate testable hypotheses. For example, associated SNPs in IL10 and IL12A- AS1 loci colocalize with promoter and enhancer histone marks in a multitude of cell types. IL23R variants have been identified to modify the expression levels of 10 different genes. It is worth highlighting CCR3- associated polymorphisms which act as eQTLs for CCR1 and CXCR6 and show evidence of chroma-tin interactions with the promoters of these genes in blood cells. These predicted functional effects expand the genomic associa-tions to several target genes that could be further investigated to decipher the exact molecular mechanisms involved in the patho-physiology of Behçet’s disease.
Finally, we observed significant differences in the risk allele frequencies of the variants identified in our study (P < 5 × 10⁻⁵) across populations for both cases and controls (Supplementary Table 12, available on the Arthritis & Rheumatology website at http://onlin elibr ary.wiley.com/doi/10.1002/art.41637/ abstract). Overall, the results suggest that the frequency of genetic variants identified in this study are consistent with the prevalence data for Behçet’s disease, showing the highest mean frequencies in the Tunisian, Turkish, and Asian populations (2,3).
In conclusion, we present the results of a large, multinational collaborative effort and dense genotyping in immune- related genetic loci to understand the genetic basis of Behçet’s disease. We iden-tified novel genetic susceptibility loci for the disease, including a genetic association with a gain- of- function variant in IFNGR1 and genetic variants in the intergenic region LNCAROD/DKK1. We repli-cated a number of previously identified genetic susceptibility loci for Behçet’s disease and extended them across diverse populations and ancestries. In addition, our functional and epigenetic annotation analysis revealed potential new candidate genes involved in Behçet’s disease. Furthermore, >30 additional loci with a suggestive level of association were identified, which will require further validation.
ACKNOWLEDGMENTS
The authors would like to thank Paul Renauer, Travis Hughes, and Adam Adler for their contribution to this work.
AUTHOR CONTRIBUTIONS
All authors were involved in drafting the article or revising it critically for important intellectual content, and all authors approved the final version to be published. Dr. Sawalha had full access to all of the data in the study and takes responsibility for the integrity of the data and the accuracy of the data analysis.Study conception and design. Saruhan- Direskeneli, Direskeneli, Sawalha.Acquisition of data. Ortiz Fernández, Coit, Yilmaz, Yentür, Alibaz- Oner, Aksu, Erken, Düzgün, Keser, Cefle, Yazici, Ergen, Alpsoy, Salvarani, Casali, Kısacık, Kötter, Henes, Çınar, Schaefer, Nohutcu, Zhernakova, Wijmenga,

MULTIETHNIC GENETIC ANALYSIS IN BEHÇET’S DISEASE | 1251
Takeuchi, Harihara, Kaburaki, Messedi, Song, Kaşifoğlu, Carmona, Guthridge, James, Martin, Escribano, Saruhan- Direskeneli, Direskeneli, Sawalha.Analysis and interpretation of data. Ortiz Fernández, Sawalha.
REFERENCES 1. Bettiol A, Prisco D, Emmi G. Behçet: the syndrome. Rheumatology
(Oxford) 2020;59:iii101– 7.
2. Verity DH, Marr JE, Ohno S, Wallace GR, Stanford MR. Behçet’s disease, the Silk Road and HLA- B51: historical and geographical perspectives. Tissue Antigens 1999;54:213– 20.
3. Kilian NC, Sawalha AH. Behçet’s disease in the United States: a single center descriptive and comparative study. Eur J Rheumatol 2017;4:239– 44.
4. Mumcu G, Direskeneli H. Triggering agents and microbiome as environmental factors on Behçet’s syndrome. Intern Emerg Med 2019;14:653– 60.
5. De Menthon M, Lavalley MP, Maldini C, Guillevin L, Mahr A. HLA– B51/B5 and the risk of Behçet’s disease: a systematic review and meta- analysis of case– control genetic association studies. Arthritis Rheum 2009;61:1287– 96.
6. Hughes T, Coit P, Adler A, Yilmaz V, Aksu K, Duzgun N, et al. Identification of multiple independent susceptibility loci in the HLA region in Behçet’s disease. Nat Genet 2013;45:319– 24.
7. Ombrello MJ, Kirino Y, de Bakker PI, Gul A, Kastner DL, Remmers EF. Behçet disease- associated MHC class I residues implicate anti-gen binding and regulation of cell- mediated cytotoxicity. Proc Natl Acad Sci U S A 2014;111:8867– 72.
8. Gensterblum- Miller E, Wu W, Sawalha AH. Novel transcriptional activity and extensive allelic imbalance in the human MHC region. J Immunol 2018;200:1496– 503.
9. Remmers EF, Cosan F, Kirino Y, Ombrello MJ, Abaci N, Satorius C, et al. Genome- wide association study identifies variants in the MHC class I, IL10, and IL23R- IL12RB2 regions associated with Behçet’s disease. Nat Genet 2010;42:698– 702.
10. Takeuchi M, Mizuki N, Meguro A, Ombrello MJ, Kirino Y, Satorius C, et al. Dense genotyping of immune- related loci implicates host responses to microbial exposure in Behçet’s disease susceptibility. Nat Genet 2017;49:438– 43.
11. Mizuki N, Meguro A, Ota M, Ohno S, Shiota T, Kawagoe T, et al. Genome- wide association studies identify IL23R- IL12RB2 and IL10 as Behçet’s disease susceptibility loci [letter]. Nat Genet 2010;42:703– 6.
12. Ortiz- Fernandez L, Carmona FD, Montes- Cano MA, Garcia- Lozano JR, Conde- Jaldon M, Ortego- Centeno N, et al. Genetic analysis with the immunochip platform in Behçet disease. Identification of resi-dues associated in the HLA class I region and new susceptibility loci. PLoS One 2016;11:e0161305.
13. Kirino Y, Bertsias G, Ishigatsubo Y, Mizuki N, Tugal- Tutkun I, Seyahi E, et al. Genome- wide association analysis identifies new suscepti-bility loci for Behçet’s disease and epistasis between HLA- B*51 and ERAP1. Nat Genet 2013;45:202– 7.
14. Xavier JM, Shahram F, Sousa I, Davatchi F, Matos M, Abdollahi BS, et al. FUT2: filling the gap between genes and environment in Behçet’s disease? Ann Rheum Dis 2015;74:618– 24.
15. Hou S, Yang Z, Du L, Jiang Z, Shu Q, Chen Y, et al. Identification of a susceptibility locus in STAT4 for Behçet’s disease in Han Chinese in a genome- wide association study. Arthritis Rheum 2012;64:4104– 13.
16. Kappen JH, Medina- Gomez C, van Hagen PM, Stolk L, Estrada K, Rivadeneira F, et al. Genome- wide association study in an admixed case series reveals IL12A as a new candidate in Behçet disease. PLoS One 2015;10:e0119085.
17. International Study Group for Behçet’s Disease. Criteria for diagnosis of Behçet’s disease [review]. Lancet 1990;335:1078– 80.
18. Chang CC, Chow CC, Tellier LC, Vattikuti S, Purcell SM, Lee JJ. Second- generation PLINK: rising to the challenge of larger and richer datasets. Gigascience 2015;4:7.
19. Price AL, Patterson NJ, Plenge RM, Weinblatt ME, Shadick NA, Reich D. Principal components analysis corrects for stratification in genome- wide association studies. Nat Genet 2006;38:904– 9.
20. R Development Core Team. R: a language and environment for statistical computing. Vienna, Austria: R Foundation for Statistical Computing; 2019.
21. Das S, Forer L, Schonherr S, Sidore C, Locke AE, Kwong A, et al. Next- generation genotype imputation service and methods. Nat Genet 2016;48:1284– 7.
22. Delaneau O, Zagury JF, Marchini J. Improved whole- chromosome phasing for disease and population genetic studies [letter]. Nat Methods 2013;10:5– 6.
23. McCarthy S, Das S, Kretzschmar W, Delaneau O, Wood AR, Teumer A, et al. A reference panel of 64,976 haplotypes for genotype impu-tation. Nat Genet 2016;48:1279– 83.
24. Yang J, Ferreira T, Morris AP, Medland SE, Genetic Investigation of ANthropometric Traits Consortium, DIAbetes Genetics Replication and Meta- analysis Consortium, et al. Conditional and joint multiple- SNP analysis of GWAS summary statistics identifies additional vari-ants influencing complex traits. Nat Genet 2012;44:369– 75.
25. Yang J, Lee SH, Goddard ME, Visscher PM. GCTA: a tool for genome- wide complex trait analysis. Am J Hum Genet 2011;88:76– 82.
26. Boyle AP, Hong EL, Hariharan M, Cheng Y, Schaub MA, Kasowski M, et al. Annotation of functional variation in personal genomes using RegulomeDB. Genome Res 2012;22:1790– 7.
27. Ward LD, Kellis M. HaploReg: a resource for exploring chromatin states, conservation, and regulatory motif alterations within sets of genetically linked variants. Nucleic Acids Res 2012;40:D930– 4.
28. Schofield EC, Carver T, Achuthan P, Freire- Pritchett P, Spivakov M, Todd JA, et al. CHiCP: a web- based tool for the integrative and inter-active visualization of promoter capture Hi- C datasets. Bioinformatics 2016;32:2511– 3.
29. Fairfax BP, Humburg P, Makino S, Naranbhai V, Wong D, Lau E, et al. Innate immune activity conditions the effect of regu-latory variants upon monocyte gene expression. Science 2014;343:1246949.
30. Fairfax BP, Makino S, Radhakrishnan J, Plant K, Leslie S, Dilthey A, et al. Genetics of gene expression in primary immune cells identi-fies cell type- specific master regulators and roles of HLA alleles. Nat Genet 2012;44:502– 10.
31. Kotenko SV, Izotova LS, Pollack BP, Mariano TM, Donnelly RJ, Muthukumaran G, et al. Interaction between the components of the interferon γ receptor complex. J Biol Chem 1995;270:20915– 21.
32. Tulunay A, Dozmorov MG, Ture- Ozdemir F, Yilmaz V, Eksioglu- Demiralp E, Alibaz- Oner F, et al. Activation of the JAK/STAT pathway in Behçet’s disease. Genes Immun 2015;16:170– 5.
33. Sahin S, Lawrence R, Direskeneli H, Hamuryudan V, Yazici H, Akoglu T. Monocyte activity in Behçet’s disease. Br J Rheumatol 1996;35:424– 9.
34. Neves FS, Carrasco S, Goldenstein- Schainberg C, Goncalves CR, de Mello SB. Neutrophil hyperchemotaxis in Behçet’s disease: a possible role for monocytes orchestrating bacterial- induced innate immune responses. Clin Rheumatol 2009;28:1403– 10.
35. Tong B, Liu X, Xiao J, Su G. Immunopathogenesis of Behçet’s dis-ease [review]. Front Immunol 2019;10:665.
36. Jonkers IH, Wijmenga C. Context- specific effects of genetic vari-ants associated with autoimmune disease. Hum Mol Genet 2017; 26:R185– 92.

ORTIZ FERNÁNDEZ ET AL 1252 |
37. Van de Wetering D, de Paus RA, van Dissel JT, van de Vosse E. Functional analysis of naturally occurring amino acid substitutions in human IFN- γR1. Mol Immunol 2010;47:1023– 30.
38. Tau G, Rothman P. Biologic functions of the IFN- γ receptors. Allergy 1999;54:1233– 51.
39. Thye T, Burchard GD, Nilius M, Muller- Myhsok B, Horstmann RD. Genomewide linkage analysis identifies polymorphism in the human interferon- γ receptor affecting Helicobacter pylori infection. Am J Hum Genet 2003;72:448– 53.
40. De Albuquerque AC, Rocha LQ, de Morais Batista AH, Teixeira AB, Dos Santos DB, Nogueira NA. Association of polymorphism +874 A/T of interferon- γ and susceptibility to the development of tubercu-losis: meta- analysis. Eur J Clin Microbiol Infect Dis 2012;31:2887– 95.
41. Zhou J, Chen DQ, Poon VK, Zeng Y, Ng F, Lu L, et al. A regula-tory polymorphism in interferon- γ receptor 1 promoter is asso-ciated with the susceptibility to chronic hepatitis B virus infection. Immunogenetics 2009;61:423– 30.
42. Liu J, Hou Y, Sun L, Li C, Li L, Zhao Y, et al. A pilot study of tofacitinib for refractory Behçet’s syndrome. Ann Rheum Dis 2020;79:1517– 20.
43. Dudding T, Haworth S, Lind PA, Sathirapongsasuti JF, 23andMe Research Team, Tung JY, et al. Genome wide analysis for mouth ulcers identifies associations at immune regulatory loci. Nat Commun 2019;10:1052.
44. Ahn VE, Chu ML, Choi HJ, Tran D, Abo A, Weis WI. Structural basis of Wnt signaling inhibition by Dickkopf binding to LRP5/6. Dev Cell 2011;21:862– 73.
45. Maruotti N, Corrado A, Neve A, Cantatore FP. Systemic effects of Wnt signaling. J Cell Physiol 2013;228:1428– 32.
46. Staal FJ, Luis TC, Tiemessen MM. WNT signalling in the immune system: WNT is spreading its wings [review]. Nat Rev Immunol 2008;8:581– 93.
47. Shi J, Chi S, Xue J, Yang J, Li F, Liu X. Emerging role and therapeu-tic implication of Wnt signaling pathways in autoimmune diseases. J Immunol Res 2016;2016:9392132.

1253
Arthritis & RheumatologyVol. 73, No. 7, July 2021, pp 1253–1266DOI 10.1002/art.41639© 2021 The Authors. Arthritis & Rheumatology published by Wiley Periodicals LLC on behalf of American College of Rheumatology.This is an open access article under the terms of the Creative Commons Attribution License, which permits use, distribution and reproduction in any medium, provided the original work is properly cited.
The Vasculopathy of Juvenile Dermatomyositis: Endothelial Injury, Hypercoagulability, and Increased Arterial StiffnessCharalampia Papadopoulou,1 Ying Hong,1 Petra Krol,2 Muthana Al Obaidi,1 Clarissa Pilkington,1 Lucy R. Wedderburn,3 Paul A. Brogan,1 and Despina Eleftheriou4
Objective. Vasculopathy is considered central to the pathogenesis of juvenile dermatomyositis (DM) and is associated with severe extramuscular manifestations. We undertook this study to investigate the hypothesis that the vasculopathy of juvenile DM can be noninvasively tracked by examining biomarkers of endothelial injury, subclinical inflammation, hypercoagulability, and vascular arterial stiffness.
Methods. The study population was a UK cohort of children with juvenile DM. Circulating endothelial cells (CECs) and microparticles (MPs) were identified using immunomagnetic bead extraction and flow cytometry, respectively. Plasma thrombin generation was determined using a fluorogenic assay. Cytokine and chemokine levels were measured by electrochemiluminescence. Arterial stiffness was assessed using pulse wave velocity (PWV). Results were expressed as the median and interquartile range (IQR), and statistical significance was assessed using nonparametric analyses.
Results. Ninety patients with juvenile DM and 79 healthy control subjects were included. The median age of the patients was 10.21 years (IQR 6.68– 13.40), and the median disease duration was 1.63 years (IQR 0.28– 4.66). CEC counts were higher in all patients with juvenile DM compared to controls (median 96 cells/ml [IQR (40– 192] and 12 cells/ml [IQR 8– 24], respectively; P < 0.0001). Circulating MP numbers were also significantly higher in patients with active juvenile DM compared to controls (median 204.7 × 10³/ml [IQR 87.9– 412.6] and 44.3 × 10³/ml [IQR 15.0– 249.1], respectively; P < 0.0001). MPs were predominantly of platelet and endothelial origin. Enhanced plasma thrombin generation was demonstrated in patients with active juvenile DM compared to those with inactive disease (P = 0.0003) and controls (P < 0.0001). Carotid- radial PWV adjusted for age was increased in patients with juvenile DM compared to controls (P = 0.003).
Conclusion. We observed increased endothelial injury and increased levels of proinflammatory cytokines in patients with active juvenile DM. MP profiles reflected distinct disease activity status in juvenile DM and are markers of vascular pathology, platelet activation, and thrombotic propensity. Ongoing long- term vascular injury may result in increased arterial stiffness in patients with juvenile DM.
The views expressed herein are those of the authors and not necessarily those of the NHS, the NIHR, or the Department of Health.
The UK Juvenile Dermatomyositis Cohort Biomarker Study and Respository is supported by Myositis UK, the Cure JM Foundation, Great Ormond Street Hospital Children’s Charity (grant V1268), Versus Arthritis (grants 20164 and 21593), and the NIHR. All research at Great Ormond Street Hospital NHS Foundation Trust and University College London Great Ormond Street Institute of Child Health is made possible by the NIHR Great Ormond Street Hospital Biomedical Research Centre. Dr. Papadopoulou’s work was supported in part by the ReMission Foundation. Drs. Hong, Wedderburn, and Eleftheriou’s work was supported by Versus Arthritis (grants 20164, 21593, and 21791). Dr. Brogan’s work was supported in part by the Great Ormond Street Hospital Children’s Charity.
1Charalampia Papadopoulou, PhD, Ying Hong, PhD, Muthana Al Obaidi, MD, Clarissa Pilkington, MD, Paul A. Brogan, PhD: University College London Great Ormond Street Institute of Child Health and Great Ormond Street Hospital NHS Foundation Trust, London, UK; 2Petra Krol, PhD: University College London Great Ormond Street Institute of Child Health and Great Ormond Street Hospital NHS Foundation Trust, London, UK, and Skåne University Hospital, Lund, Sweden; 3Lucy R. Wedderburn, PhD: University College London Great Ormond Street Institute of Child Health, Great Ormond
Street Hospital NHS Foundation Trust, NIHR Great Ormond Street Hospital Biomedical Research Centre, and Centre for Adolescent Rheumatology Versus Arthritis, London, UK; 4Despina Eleftheriou, PhD: University College London Great Ormond Street Institute of Child Health, Great Ormond Street Hospital NHS Foundation Trust, and Centre for Adolescent Rheumatology Versus Arthritis, London, UK.
Drs. Brogan and Eleftheriou contributed equally to this work.Dr. Papadopoulou has received consulting fees from Sobi (less than
$10,000). Dr. Brogan has received consulting fees from Roche, Novartis, Sobi, and UCB (less than $10,000 each) and research grants paid to his institution from Roche, Sobi, Novartis, Chemocentryx, and NovImmune. Dr. Eleftheriou has received consulting fees from Roche, Lilly, and Sobi (less than $10,000 each) and research grants paid to her institution from Lilly, Pfizer, and Roche. No other disclosures relevant to this article were reported.
Study data are available from the corresponding author upon reasonable request.
Address correspondence to Charalampia Papadopoulou, PhD, University College London Great Ormond Street Institute of Child Health, 30 Guilford Street, London WC1N 1EH, UK. Email: [email protected].
Submitted for publication July 9, 2020; accepted in revised form December 31, 2020.

PAPADOPOULOU ET AL 1254 |
INTRODUCTION
Vasculopathy is considered central to the pathogenesis of juvenile dermatomyositis (DM) and is associated with severe extra-muscular manifestations (1– 5). The nature of this vasculopathy is complex, with evidence of both a true inflammatory small vessel vasculitis during active phases of the disease (2,6) and a nonin-flammatory occlusive vasculopathy with capillary dropout later in the disease process (4,7). Notably, previous studies have indicated that the presence of severe vascular changes on muscle biopsy was predictive of a chronic disease course (8,9), suggesting that persistent vasculopathy is a poor prognostic factor and determinant of adverse outcome in juvenile DM (5). Moreover, in the longer term there may also be a systemic vasculopathy affecting larger arteries, potentially leading to accelerated atherosclerosis and premature cardiovascular morbidity later in adulthood (10,11).
A major hurdle to the study of the vasculopathy of juvenile DM has been a lack of noninvasively measurable biomarkers that reliably capture the full spectrum of the proposed patho-genesis (12,13). Therefore, defining disease activity trajectories related to persistent endothelial injury in juvenile DM historically has been challenging. We and others have previously described 2 methods for detecting endothelial cell components in blood that allow noninvasive assessment of vascular injury in systemic vasculitides: circulating endothelial cells (CECs) and endothelial- derived microparticles (EMPs) (14– 22). We hypothesized that these noninvasively measured biomarkers of endothelial injury could be used to detect chronic vasculopathic injury and a puta-tive prothrombotic state in juvenile DM. The present study was undertaken to examine biomarkers of endothelial injury, subclin-ical inflammation, hypercoagulability, and arterial stiffness in a UK cohort of patients with juvenile DM compared to age- similar healthy controls.
PATIENTS AND METHODS
Study design, subjects, and data collection. This was an observational comparative study, with ethical approval (MREC 1/3/022). The legal guardians of all subjects (or the subjects them-selves if of legal age) provided written informed consent.
Patients with juvenile DM. For study inclusion, patients had to be age 2– 19 years and have a diagnosis of juvenile DM (23). Patients were excluded from enrollment if they had any significant acute or chronic comorbidity that could cause acute endothelial injury, including intercurrent infection. Patients with juvenile DM were recruited from Great Ormond Street Hospi-tal NHS Foundation Trust through the Juvenile Dermatomyositis Cohort and Biomarker Study (3,24) between September 2015 and January 2018 and were studied cross- sectionally. A sub-group of the patients studied cross- sectionally were also evalu-ated prospectively.
Definition of inactive juvenile DM. Patients were classified as having clinically inactive juvenile DM based on a modification of the Paediatric Rheumatology International Trials Organisa-tion (PRINTO) criteria (25), as follows: absence of skin disease at the time of assessment, and at least 3 of the following 4 criteria: 1) creatine kinase (CK) ≤150 units/liter, 2) Childhood Myositis Assessment Scale (CMAS) score (26,27) ≥48/52, 3) Manual Muscle Testing 8 (MMT- 8) score (28) ≥78/80, and 4) physician global assessment ≤0.2 (of a possible 10). Juvenile DM disease activity was ascertained by independent scrutiny of patients’ medical records by 2 senior clinicians (MAO and DE); any discrepant cases were discussed to achieve consen-sus. All clinical and laboratory assessments were performed by one of the authors (CP), with blinding with regard to study group (healthy control or juvenile DM case), and juvenile DM disease status (active or inactive).
Healthy controls. Age- similar and sex- matched children who had no acute or chronic illnesses at the time of recruitment and were not regularly taking any medication at time of sam-pling were recruited as controls, with ethical approval (REC 11/LO/0330). These children were either healthy unaffected siblings of patients with Kawasaki disease recruited for another major study our group has undertaken in the past (29) or were recruited through the Versus Arthritis Centre for adolescent rheumatology young scientist days, where healthy adolescents were invited to spend a day in the laboratory and donate blood with written informed consent.
Demographic, clinical, and laboratory data. Data collected included: age, sex, age at disease onset, disease duration, clinical features at initial presentation, routine echocardiogra-phy results, histopathologic severity scores on muscle biopsy, presence and typing of myositis- specific antibodies (MSAs) (30), and treatments (past and current). Validated clinical tools and indices were used to capture the full extent of disease activity in a systematic manner, i.e., the CMAS, MMT- 8, physician global assessment of disease activity using a 10- cm visual analog scale (VAS) (31), functional ability according to the Childhood Health Assessment Questionnaire (32), parent global assessment of the patient’s overall well- being on a 10- cm VAS, and parent global assessment of the patient’s pain on a 10- cm VAS. The following laboratory test results were also collected: complete blood cell count, erythrocyte sedimentation rate (ESR), C- reactive protein (CRP), CK, alanine aminotransferase, and lactate dehydroge-nase (LDH) levels, and antinuclear antibody status (33). Nailfold capillaroscopy was performed at the bedside with the use of a light, a 10× magnifying glass (otoscope), and a water- soluble gel (34) placed on the nailfold bed (of each of 8 fingers, excluding thumbs) to increase resolution; the result was considered abnor-mal in the presence of capillary loss with irregular capillary distri-bution, enlargement of capillary loops, changes in the capillary shape, or areas of hemorrhage (35).

THE VASCULOPATHY OF JUVENILE DM | 1255
Conventional cardiovascular risk factors. Age, height, weight, body mass index, and smoking status were recorded before vas-cular studies were performed. Echocardiography was performed in patients with juvenile DM as part of routine clinical practice at the time of recruitment. Resting (minimum 15 minutes) blood pressure and heart rate were measured at the brachial artery using an oscillometric manual sphygmomanometer (Greenlight 300; Accoson). Nonfasting total cholesterol and triglycerides were also measured.
Assessment of inflammation indices. High- sensitivity CRP (hsCRP), serum amyloid A (SAA), angiopoietin 1 and 2, sol-uble E- selectin, soluble intercellular adhesion molecules 1 and 3, soluble vascular cell adhesion molecule 1, soluble P- selectin, thrombomodulin, tumor necrosis factor (TNF), interleukin- 1β (IL- 1β), IL- 6, IL- 8, IL- 10, monocyte chemotactic protein 1 (MCP- 1), interferon- α (IFNα), IFNβ, IFNγ, IFN1, IFNγ- inducible 10- kd pro-tein (IP- 10), and TNF receptor II were assessed using a multiarray detection system based on electrochemiluminescence technology (Sector Imager 2400; Meso Scale Discovery) (29). Galectin- 9 was assessed with a solid- phase enzyme- linked immunosorbent assay (R&D Systems) (36).
Assessment of endothelial injury. Circulating endothe-lial cells and microparticles. CECs were identified using CD146- immunomagnetic bead extraction as previously described (37). Circulating MPs were identified by flow cytometry (BD LSRII). The MP population was defined as particles that were <1.1 µm in size and bound to annexin V (AnxV). Platelet- derived MPs (PMPs) were defined as AnxV+CD42a+ particles. The AnxV+CD42a− MP population was then used to further characterize EMPs (AnxV+ CD62E+CD42a−), B cell– derived MPs (CD19+AnxV+CD42a– ), T cell– derived MPs (CD3+AnxV+ CD42a– ), and tissue factor (TF)– positive monocyte- derived MPs (TF+CD14+AnxV+CD42a−). MPs were stained with BV421 (BioLegend)– conjugated AnxV for binding with phosphatidylserine that is present in all MPs, phycoerythrin- conjugated mouse anti- human CD62E (clone 68- 5H11; BioLegend) for defining endothelial- derived MPs,
BV711- conjugated mouse anti- human CD19 (clone HIB19; BD OptiBuild) for identifying B cell– derived MPs, BV605- conjugated mouse anti- human CD14 (clone M5E2; BioLegend) for identifying monocyte- derived MPs, and allophycocyanin- conjugated mouse anti- human CD3 (clone UCHT1; BioLegend) for identifying T cell– derived MPs. Additional labeling with PerCP- conjugated mouse anti- human CD42a (BD PharMingen) was done to exclude MPs of platelet origin. To assess TF expression on monocyte- derived MPs, samples were stained with fluores-cein isothiocyanate– conjugated mouse anti- human TF (clone VD8; American Diagnostica). All samples were analyzed on an LSR II flow cytometer with FACSDiva software (BD Biosciences).
Plasma thrombin generation assay. To assess the prothrom-botic tendency of plasma, a thrombin generation assay was performed in recalcified citrated platelet- poor plasma (PPP), as previously described (16,38). PPP (40 µl) was incubated with 50 µl fluorogenic substrate (0.5 mM Z- G- G- R- AMC/7.5 mM Ca2+) and the reaction monitored by excitation/emission (360/460 nm) at 1- minute intervals for 90 minutes with an Optima Fluorescence plate reader (BMG Labtech). Lag time, peak thrombin (nM), peak time, velocity index, and endogenous thrombin potential (ETP) were quantified using a Technothrombin kit according to the pro-tocol recommended by the manufacturer (DiaPharma).
Assessment of arterial stiffness. Carotid- femoral pulse wave velocity (PWV) and carotid- radial PWV were used as mark-ers of arterial stiffness, measured by oscillometry using a Vicorder device (Skidmore Medical) in accordance with American Heart Association recommendations (39).
Statistical analysis. Descriptive statistics were reported as the median and interquartile range (IQR) for continuous varia-bles and as the absolute frequency and percentage for categorical variables. The significance of the differences between groups was assessed by Mann- Whitney U test (for 2 groups) or Kruskal- Wallis test (for multiple groups), and correlations between variables were assessed using Spearman’s rank correlation coefficient. Categorical data were compared by chi- square test, or by Fisher’s exact test in
Table 1. Characteristics of the patients with juvenile dermatomyositis (DM) and the healthy controls*
Juvenile DM patients
Healthy controls
Female, no. (%) 57 (63.3) 48 (58.5)Smoking, no. (%) 0 (0.0) 0 (0.0)Body mass index, kg/m2 19.5 (15.7– 22.7) 20.5 (17.0– 23.2)Systolic blood pressure in relation to age slope, mm Hg/year,
y-intercept when x = 0.090.80– 104.5 88.88– 110.9
r2 0.15 0.10Diastolic blood pressure in relation to age slope, mm Hg/year
y-intercept when x = 0.049.93– 58.79 49.19– 64.16
r2 0.11 0.10Triglycerides, mmoles/liter 0.96 (0.67– 1.20) 0.77 (0.58– 1.06)Cholesterol, mmoles/liter 3.7 (3.4– 4.2)† 4.4 (3.7– 4.8)
* Except where indicated otherwise, values are the median (interquartile range). † P = 0.003 versus healthy controls, by Mann- Whitney U test.

PAPADOPOULOU ET AL 1256 |
Table 2. Demographic characteristics, laboratory parameters, and juvenile DM disease activity measures in the 90 patients*
All patients (n = 90)
Patients with active juvenile DM (n = 64)
Patients with inactive juvenile DM (n = 26)
Difference or OR (95% CI) [P]†
Female, no. (%) 57 (63.3) 48 (75.0) 9 (34.6) 5.667 (2.182, 15.00) [0.0003]
Disease duration, years 1.63 (0.28– 4.66) 0.87 (0.02– 3.99) 4.14 (1.80– 7.03) 3.265 (1.080, 3.400) [0.0005]
Age at study recruitment, years 10.21 (6.68– 13.40) 10.21 (6.00– 14.04) 10.56 (6.94– 12.14) 0.3530 (−2.230, 2.070) [0.9894]
Age at disease onset, years 5.48 (3.4– 9.25) 5.72 (3.80– 9.99) 4.44 (2.72– 6.76) −1.28 (−3.34, −0.08) [0.0339]
Vascular domain score on initial diagnostic muscle biopsy
1.0 (0.0– 2.0) 1.0 (0.0– 2.0) 0.00 (0.0– 0.5) 1.0 (0.0, 1.0) [0.0491]
Hemoglobin, gm/liter 124 (116– 131) 121 (113– 127) 127 (120– 137) 5.0 (3.0, 13.0) [0.0025]
Leukocytes, ×109/liter 6.47 (5.30– 7.90) 6.56 (5.21– 8.43) 6.40 (5.51– 7.21) −0.165 (−1.02, 0.83) [0.8353]
Neutrophils, ×109/liter 3.51 (2.58– 4.46) 3.61 (2.59– 4.54) 3.47 (2.52– 4.16) −0.14 (−0.82, 0.52) [0.6743]
Lymphocytes, ×109/liter 1.94 (1.32– 2.55) 1.85 (1.30– 2.59) 2.31 (1.61– 2.55) 0.46 (−0.16, 0.69) [0.1729]
Platelets, ×109/liter 310 (247– 356) 307 (245– 355) 321 (255– 373) 14.0 (−28.0, 44.0) [0.7535]
ESR, mm/hour (normal <10) 9 (418) 10 (5– 20) 4 (3– 14) −6.0 (8.0, 0.0) [0.0330]
CRP, mg/liter (normal <20) 5 (5– 5) 5 (5– 5) 5 (5– 6) 0.0 (0.0, 0.0) [0.6314]
CK, units/liter (normal 6– 330) 89 (69– 138) 84 (66– 220) 93 (78– 122) 9.0 (−26.0, 22.0) [0.7821]
LDH, units/liter (normal 450– 770) 651 (560– 809) 694 (583– 829) 581 (540– 653) −113.5 (−214.0, −52.0) [0.0008]
ALT, units/liter (normal 10– 35) 26 (15– 42) 29 (17– 54) 23 (11– 30) −6.0 (−18.0, 0.0) [0.0550]
Cholesterol, mmoles/liter 4.0 (3.4– 4.3) 3.8 (3.4– 4.1) 4.2 (3.55– 4.45) 0.4 (−0.2, 0.7) [0.204]
Triglycerides, mmoles/liter 1.0 (0.6– 1.5) 0.97 (0.60– 1.47) 1.14 (0.60– 1.71) 0.17 (−0.32, 0.50) [0.698]
Systolic blood pressure in relation to age slope, mm Hg/year, y-intercept
97.13 96.84 97.28 – [0.8321]
r2 1.25 0.29 0.61 – [– ]BMI, kg/m2 17.4 (15.5– 21.4) 17.4 (15.4– 21.7) 17.4 (16.2– 20.7) −0.014
(−1.958, 1.568) [>0.99]MMT- 8 78 (67– 80) 74 (59– 80) 80 (78– 80) 6.0
(1.0, 12.0) [0.0001]CMAS 50 (44– 52) 48 (37– 52) 52 (50– 52) 4.0
(1.0, 7.0) [0.0005]C- HAQ 0.125
(0.000– 0.625)0.25 (0.000– 1.000) 0.000 (0.000– 0.125) −0.25
(−0.375, 0.000) [0.0027]Physician global assessment 1.1 (0.2– 2.7) 2.0 (0.70– 3.10) 0.2 (0.0– 0.2) −1.8
(−2.5, −1.1) [<0.0001]Parent/patient global assessment 0.7 (0.0– 4.0) 1.9 (0.0– 5.0) 0.0 (0.0– 0.60) −1.9
(−2.0, 0.0) [0.0009]Pain global assessment 0.2 (0.0– 1.8) 0.9 (0.0– 3.0) 0.0 (0.0– 0.2) −0.95
(−1.00, 0.00) [0.006]ANA positive, no. (%) 57 (63.3) 43 (67.2) 14 (53.8) 1.755
(0.6915, 4.363) [0.2339]MSA positive, no. (%)‡ 33 (67.3) 27 (64.3) 6 (85.7) 0.300
(0.025, 2.319) [0.2630]Anti- SRP 4 (12.1) 4 (14.8) 0 (0.0) – [– ]Anti– NXP- 2 10 (30.3) 7 (25.9) 3 (50.0) – [– ]Anti- TIF1γ 8 (24.2) 8 (29.6) 0 (0.0) – [– ]Anti– MDA- 5 4 (12.1) 3 (11.1) 1 (16.7) – [– ]
Treatment at time of recruitment, no. (%)§ 56 (62.2) 40 (62.5) 16 (61.5) 1.042 (0.4116, 2.542) [0.93]
Prednisolone 28 (31.1) 24 (37.5) 4 (15.4) 1.042 (1.029, 9.616) [0.04]
(Continued)

THE VASCULOPATHY OF JUVENILE DM | 1257
All patients (n = 90)
Patients with active juvenile DM (n = 64)
Patients with inactive juvenile DM (n = 26)
Difference or OR (95% CI) [P]†
Methotrexate 41 (45.6) 28 (43.7) 13 (50.0) 0.7778 (0.3203, 1.883) [0.59]
IV immunoglobulin 4 (4.4) 3 (4.7) 1 (3.8) – [1.00]
Cyclophosphamide 1 (1.1) 1 (1.6) 0 (0.0) – [– ]Rituximab 1 (1.1) 1 (1.6) 0 (0.0) – [– ]TNF inhibitor 10 (11.1) 6 (9.4) 4 (15.4) 0.5690
(0.1623, 1.935) [0.47]Other 5 (5.6) 4 (6.2) 1 (3.8) – [– ]
* For some parameters, data were not available for all 90 patients, as follows: for vascular domain score on initial diagnostic muscle biopsy, n = 46 (37 and 9, patients with active juvenile dermatomysitis [DM] and patients with inactive juvenile DM, respectively); for erythrocyte sedimentation rate (ESR), C- reactive protein (CRP) and creatine kinase (CK) levels, Childhood Myositis Assessment Score (CMAS), and physician global assessment, n = 89 (63 and 26, respectively); for lactate dehydrogenase (LDH) levels, n = 87 (63 and 24, respectively); for alanine aminotransferase (ALT) levels, n = 88 (64 and 24, respectively); for cholesterol and triglyceride levels, n = 44 (27 and 17, respectively); for Manual Muscle Testing 8 (MMT- 8) score, n = 88 (62 and 26, respectively); for Childhood Health Assessment Questionnaire (C- HAQ), n = 79 (53 and 26, respectively); for parent/patient global assessment, n = 81 (56 and 25, respectively); for pain global assessment, n = 79 (54 and 25, respectively); for myositis- specific antibodies (MSAs), n = 49 (42 and 7, respectively). Except where indicated otherwise, values are the median (interquartile range). 95% CI = 95% confidence interval; BMI = body mass index; anti- SRP = anti– signal recognition particle; anti– NXP- 2 = anti– nuclear matrix protein 2; anti- TIF1γ= anti– transcription intermediary factor 1γ; anti– MDA- 5 = anti– melanoma differentiation– associated gene 5; TNF = tumor necrosis factor. † Odds ratios (ORs) are shown for categorical values, i.e., number (%) female, antinuclear antibody (ANA) positive, MSA positive, and treatment at the time of recruitment. P values were determined by chi- square test, Fisher’s exact text, or Mann- Whitney U test. ‡ Other MSAs, found in smaller numbers of patients, were as follows: anti– PL- 7 (2 patients), anti– PL- 12 (2 patients), anti–small ubiquitin-like modifier activating enzyme (1 patient), and anti– Mi- 2 (1 patient). § Doses were as follows: prednisolone 1–2 mg/kg/day tapered over 6–9 months, subcutaneous (SC) methotrexate 15 mg/m2/week, intravenous (IV) immunoglobulin 2 gm/kg over 48 hours every 4 weeks, IV cyclophosphamide 350–500 mg/m2 for 5–6 monthly doses, IV rituximab 750 mg/m2 for 2 doses 14 days apart, IV infliximab 6 mg/kg every 4–8 weeks, and SC adalimumab 20 mg every 2 weeks if body weight <30 kg and 40 mg every 2 weeks if body weight ≥30 kg. Other treatments were azathioprine 1–2 mg/kg/day and mycophenolate mofetil 600 mg/m2 twice daily.
Table 2. (Cont’d)
Figure 1. Circulating endothelial cells (CECs) in patients with juvenile dermatomyositis (JDM). A, CEC numbers were higher among the 90 patients with juvenile DM compared to 79 healthy controls. CEC numbers also differed significantly between patients with active juvenile DM (n = 64) and those with inactive juvenile DM (n = 26). B, Patients with juvenile DM with abnormal nailfold capillaries (n = 52) had higher CEC numbers compared to patients with normal nailfold capillaries (n = 38). C, Patients with juvenile DM with transcription intermediary factor 1γ (TIF1γ) antibodies (n = 8) had higher CEC numbers compared to patients with nuclear matrix protein 2 (NXP- 2) antibodies (n = 10). Data are not shown for 1 patient with small ubiquitin-like modifier activating enzyme, 2 patients with PL- 7, 2 patients with PL- 12, and 1 patient with Mi- 2 antibodies, due to low numbers. Red symbols represent juvenile DM patients with active disease. Horizontal and vertical bars in A– C show the median and interquartile range. D, CEC levels were assessed prospectively in 25 patients with juvenile DM. Red symbols represent active disease at the time of the assessment. E and F, There was a significant decrease in CEC levels in the 6 patients who had active juvenile DM at the time of recruitment and inactive disease at the last follow- up (E), while CEC levels increased in the 3 patients who had inactive juvenile DM at the time of recruitment and active disease at the last follow- up (F). * = P < 0.05; *** = P < 0.001. SRP = signal recognition particle; MDA- 5 = melanoma differentiation– associated gene 5.

PAPADOPOULOU ET AL 1258 |Ta
ble
3.
Cyt
okin
es/c
hem
okin
es a
nd o
ther
infla
mm
ator
y m
olec
ules
in th
e pa
tient
s w
ith ju
veni
le D
M a
nd th
e he
alth
y co
ntro
ls*
All p
atie
nts
with
ju
veni
le D
MH
ealth
y co
ntro
lsD
iffer
ence
(9
5% C
I) [P
]†Pa
tient
s w
ith
activ
e ju
veni
le D
MPa
tient
s w
ith
inac
tive
juve
nile
DM
Diff
eren
ce
(95%
CI)
[P]†
hsCR
P, m
g/lit
er0.
6 (0
.2– 2
.8) [
82]
0.5
(0.2
– 1.3
) [38
]−0
.1
(−0.
4, 0
.1)
[0.4
598]
0.8
(0.3
– 3.5
) [56
]0.
3 (0
.1– 1
.3) [
26]
−0.6
(−
0.8,
0.0
3)
[0.0
803]
SAA,
pg/
ml
981,
099
(513
,087
– 3,
754,
459)
[82]
1,185
,209
(5
67,9
91–
2,55
7,86
5) [3
8]
204,
110
(−39
5,97
9, 5
55,8
45)
[0.8
474]
1,69
3,73
8
(473
,854
– 6,4
15,9
52) [
56]
707,
571
(5
10,5
06– 1
,649
,307
) [26
]−9
86,16
7
(−1,
400,
334,
99,
169)
[0
.1559
]An
g- 1,
pg/
ml
56,11
9 (4
0,95
6– 68
,409
) [8
2]
43,8
56
(34,
874–
51,7
98)
[79]
−12,
262
(−17
,605
, −7,
625)
[<
0.00
01]
50,6
76
(38,
522–
67,0
04) [
56]
62,3
35
(52,
997–
69,5
94) [
26]
11,6
59
(−66
3, 1
8,15
2)
[0.0
719]
Ang-
2, p
g/m
l5,
332
(3
,228
– 7,6
58) [
82]
2,88
0 (2
,128–
4,06
3)
[79]
−2,3
43
(−2,
812,
−1,
330)
[<
0.00
01]
5,52
5
(3,18
7– 8 ,
071)
[56]
4,77
7
(3,3
16– 6
,101)
[26]
−748
.2
(−2,
264,
509
.9)
[0.2
952]
E- se
lect
in, p
g/m
l15
.53
(1
1.15
– 19.
38) [
40]
13.0
0
(10.
43– 1
8.95
) [68
]−2
.532
(−
3.82
6, 1
.288
) [0
.303
4]
16.9
4
(12.
15– 2
0.37
) [29
]13
.39
(8
.037
– 16.
57) [
11]
−3.5
55
(−7.
659,
1.1
49)
[0.11
80]
P- se
lect
in, p
g/m
l13
2.6
(1
11.3
– 169
.8) [
40]
75.8
6
(59.
41– 1
09.7
) [68
]−5
6.78
(−
71.4
4, −
39.6
3) [<
0.00
01]
130.
6
(111
.2– 1
67.6
) [29
]13
9.5
(1
10.7
– 183
.8) [
11]
8.84
(−
28.0
0, 3
4.20
) [0
.742
7]sI
CAM
- 1, p
g/m
l46
6,27
2 (3
00,9
22–
850,
713)
[82]
258,
000
(2
23,0
15– 3
27,9
02)
[79]
−208
,272
(−
278,
348,
−12
4,98
8)
[<0.
0001
]
460,
709
(3
24,0
64– 8
02,16
1) [5
6]49
3,33
9
(237
,039
– 982
,812
) [26
]32
,630
(−
151,
430,
140
,617
) [0
.747
6]sI
CAM
- 3, p
g/m
l0.
4868
(0
.334
7– 0.
7612
) [4
0]
0.41
00
(0.3
610–
0.54
958)
[3
7]
−0.0
7685
(−
0.18
52, 0
.012
46) [
0.10
25]
0.54
95
(0.3
143–
0.78
12) [
29]
0.45
70
(0.3
249–
0.62
69) [
11]
−0.0
9256
(−
0.26
03, 0
.1145
) [0
.681
4]sV
CAM
- 1, p
g/m
l70
0,17
4 (4
34,16
2–
1,114
,190)
[82]
409,
113
(3
58,6
98– 5
32,0
00)
[79]
−29,
1061
(−
398,
169,
−17
7,23
6)
[<0.
0001
]
729,
902
(4
58,8
52– 1
,122,
167)
[56]
694,
383
(4
02,4
96– 1
,053
,256
) [26
]−3
5,51
9
(−21
8,01
7, 1
56,5
61)
[0.7
178]
TM, p
g/m
l4.
978
(3
.985
– 6.0
65) [
40]
3,80
0
(3,2
61– 5
,084
) [68
]−1
.178
(−
1.43
4, −
0.34
85)
[0.0
012]
4.99
8
(3.8
05– 6
.233
) [29
]4.
798
(4
.032
– 5.8
67) [
11]
−0.19
95
(−0.
8694
, 0.9
446)
[0
.976
2]TN
FRII,
pg/
ml
6,25
8
(4,0
55– 9
,433
) [84
]5,
048
(3
,748
– 6,3
54) [
73]
−1,2
10
(−2,
228,
−36
0.4)
[0
.004
]
6,27
2
(4,2
46– 1
1,28
3) [5
8]4,
803
(3
,626
– 6,8
40) [
26]
−1,4
69
(−2,
833,
138
.5)
[0.0
760]
Gal
ectin
- 9, n
g/m
l76
.3
(52.
4– 13
4.0)
[86]
38.4
(2
7.1– 5
0.8)
[72]
−37.
93
(−53
.56,
−29
.49)
[<
0.00
01]
81.5
3
(59.
24– 1
66.2
) [60
]51
.09
(3
1.55
– 69.
66) [
26]
−30.
44
(−73
.45,
−13
.67)
[0
.001
9]IL-
10, p
g/m
l0.
5 (0
.3– 0
.9) [
90]
0.3
(0.2
– 0.5
) [54
]−0
.239
5
(−0.
345,
−0.
117)
[<
0.00
01]
0.59
57
(0.3
662-
0.95
98) [
64]
0.29
80
(0.2
111–
0.66
43) [
26]
−0.2
977
(−
0.39
18, −
0.06
151)
[0
.005
7]IL-
1β, p
g/m
l0.
09
(0.0
5– 0.
13) [
90]
0.06
(0
.02–
0.08
) [54
]−0
.032
14
(−0.
048,
−0.
009)
[0
.003
]
0.09
074
(0
.054
44– 0
.142
7) [6
4]0.
9462
(0
.049
30– 0
.1263
) [26
]0.
0038
83
(−0.
0264
6, 0
.026
43)
[0.9
947]
IL- 6,
pg/
ml
0.8
(0.3
– 1.6
) [90
]0.
3 (0
.2– 0
.6) [
54]
−0.4
763
(−
0.63
6, −
0.18
3)
[<0.
0001
]
0.87
23
(0.3
760–
1.64
4) [6
0]0.
2919
(0
.1903
– 0.7
435)
[25]
−0.5
804
(−
0.71
28, −
0.12
82)
[0.0
016]
IL- 8,
pg/
ml
12.0
(7
.1– 2
1.6)
[90]
5.7
(4.3
– 11.
0) [5
4]−6
.366
(−
7.84
0, −
2.63
1)
[<0.
0001
]
11.8
8
(7.2
19– 2
2.75
) [64
]11
.17
(6.9
68– 1
6.37
) [26
]−0
.704
7
(−5.
191,
2.5
35)
[0.6
109]
(Con
tinue
d)

THE VASCULOPATHY OF JUVENILE DM | 1259
All p
atie
nts
with
ju
veni
le D
MH
ealth
y co
ntro
lsD
iffer
ence
(9
5% C
I) [P
]†Pa
tient
s w
ith
activ
e ju
veni
le D
MPa
tient
s w
ith
inac
tive
juve
nile
DM
Diff
eren
ce
(95%
CI)
[P]†
TNF,
pg/m
l2.
4 (1
.8– 4
.3) [
90]
1.7
(1.3
– 2.1
) [54
]−0
.738
3 (−
1.36
, −0.
500)
[<
0.00
01]
2.55
0
(1.7
19– 4
.873
) [64
]2.
115
(1
.549
– 3.17
1) [2
6]−0
.435
5 (−
1.32
6, 0
.165
6)
[0.17
78]
IP- 1
0, p
g/m
l15
2.6
(6
6.8–
449.
7) [9
0]10
0
(62.
12– 1
69.6
) [54
]−5
2.58
(−
116.
4, −
12.7
9)
[0.0
07]
278.
8
(140
.2– 1
,223
) [64
]63
.3
(42.
7– 12
9.1)
[26]
−215
.5
(−34
5.5,
−10
8.2)
[<
0.00
01]
MCP
- 1, p
g/m
l36
5.7
(2
26.3
– 571
.5) [
90]
210.
1
(163
.2– 3
06.9
) [54
]−1
55.7
(−
204.
8, −
73.3
6)
[<0.
0001
]
422.
3
(236
.4– 7
63.9
) [64
]29
7.7
(2
16.9
– 432
.8) [
26]
−124
.6
(−23
3.1,
−0.
6691
) [0
.044
2]IF
Nγ,
pg/m
l4.
6 (2
.4– 8
.8) [
88]
2.3
(1.1
– 4.9
) [54
]−2
.310
(−
3.10
0, −
0.78
46)
[0.0
01]
4.85
7
(2.0
62– 9
.686
) [62
]3.
810
(2
.415
– 7.0
55) [
26]
−1.0
47
(−2.
452,
1.11
8)
[0.5
529]
IFNα,
pg/
ml
0.82
(0
.73–
0.99
) [90
]0.
40
(0.0
0– 0.
74) [
40]
−0.4
260
(−
0.64
49, −
0.30
47)
[<0.
0001
]
0.82
(0
.73–
1.03
) [64
]0.
84
(0.7
2– 0.
98) [
26]
0.01
648
(−
0.12
05, 0
.072
03)
[0.5
576]
IFNβ,
pg/
ml
5.2
(4.2
– 6.7
) [88
]5.
3 (3
.8– 6
.7) [
37]
0.13
21
(−0.
8971
, 1.11
3)
[0.8
685]
5.3
(4.4
– 7.7
) [65
]4.
8
(2.7
– 6.5
) [23
]−0
.473
1
(−2.
243,
0.3
097)
[0
.1764
]IF
Nλ1
, pg/
mln
3.8
(2
.9– 5
.0) [
90]
2.5
(0.7
– 3.8
) [34
]−1
.346
(−
2.41
6, −
0.54
38)
[0.0
004]
4.0
(3.5
– 5.0
) [64
]2.
3 (1
.3– 5
.2) [
26]
−1.6
86
(−2.
499,
−0.
7997
) [0
.003
3]*
Valu
es a
re th
e m
edia
n (in
terq
uart
ile ra
nge)
[num
ber t
este
d]. D
M =
der
mat
omyo
sitis
; 95%
CI =
95%
con
fiden
ce in
terv
al; h
sCRP
= h
igh-
sens
itivi
ty C
- rea
ctiv
e pr
otei
n; S
AA =
ser
um a
myl
oid
A; A
ng- 1
= a
ngio
poie
tin 1
; sIC
AM- 1
= s
olub
le in
terc
ellu
lar a
dhes
ion
mol
ecul
e 1;
sVC
AM- 1
= s
olub
le v
ascu
lar c
ell a
dhes
ion
mol
ecul
e 1;
TM
= th
rom
bom
odul
in; T
NFR
II =
tum
or n
ecro
sis
fact
or
rece
ptor
II; I
L- 10
= in
terle
ukin
- 10;
IP- 1
0 =
inte
rfer
on- γ
(IFN
γ)– i
nduc
ible
10-
kd p
rote
in; M
CP- 1
= m
onoc
yte
chem
otac
tic p
rote
in 1
. †
P va
lues
wer
e de
term
ined
by
Krus
kal- W
allis
test
follo
wed
by
Man
n- W
hitn
ey U
test
.
Tab
le 3
. (C
ont’d
)

PAPADOPOULOU ET AL 1260 |
the case of expected frequencies of <5. Differences between medi-ans with 95% confidence intervals (95% CIs) of the differences were calculated. The Wilcoxon matched pairs signed rank test was used to compare variables at initial presentation and at latest follow- up for patients who were studied prospectively. Analysis of covariance was used to compare the slope of blood pressure versus age and PWV versus age between groups, using linear regression. P val-ues less than 0.05 were considered significant (2- sided for CEC analyses; analysis of all the other indices was considered explora-tory, and therefore no adjustments were made for multiple compar-isons). Tibco Statistica, release 13.3 (StatSoft) and GraphPad Prism version 4.0 were used for data analyses.
RESULTS
Demographic characteristics of the study subjects. Ninety- patients with juvenile DM (median age 10.21 years [IQR 6.68– 13.40]) were studied cross- sectionally. Fifty- seven (63.3%) were female. Seventy- nine healthy control children and adolescents were included in the final analysis; 3 additional control subjects had been enrolled but were subsequently excluded (due to severe eczema, upper respiratory tract infection, and ongoing medica-tion treatment, respectively). The median age of the healthy con-trols was 16.7 years (IQR 10.7– 17.4). There was no significant difference between the juvenile DM and healthy control groups in demographic characteristics, body mass index, or blood pressure (Table 1). In addition to the cross- sectional study, 25 children with juvenile DM (median age 11.22 years [IQR 8.16– 14.05]) were stud-ied prospectively, with data collected at baseline and during at least 1 follow- up visit (median follow- up time 0.86 years [IQR 0.42– 1.53]).
Clinical features, juvenile DM disease activity meas-ures, and routine laboratory parameters. Presenting clin-ical features, laboratory results, and disease activity according to various juvenile DM scoring tools are summarized in Table 2. The median age at disease onset in the 90 patients was 5.48 years (IQR 3.40– 9.25), with a median time from disease onset to diagnosis of 0.34 years (IQR 0.17– 0.69). At the time of recruit-ment, the median duration of disease was 1.63 years (IQR 0.28– 4.66). Sixty- four of the 90 patients had clinically active juvenile DM according to the modified PRINTO criteria at the time of recruit-ment, and 12 had calcinosis.
Of the 49 patients tested, 33 (67.3%) were positive for MSAs, with nuclear matrix protein 2 (NXP- 2) being the predominant type (n = 10). Most of the children with active disease were female (P = 0.0003 versus those with inactive disease), and the group with active disease was older at disease onset (P = 0.0339) and had a shorter disease duration (P = 0.0005) compared to children with inactive disease. They also had higher ESR (P = 0.0330) and LDH levels (P = 0.0008) compared to the group with inactive dis-ease, whereas CK and CRP levels did not differ. Echocardiogra-phy was performed in 66 of the patients with juvenile DM. Results
were normal in 58 patients, and a small pericardial effusion was detected in 3. The remaining 5 patients had tricuspid regurgita-tion, aortic regurgitation, mild concentric left ventricular hypertro-phy, mildly reduced right ventricular systolic function, and patent foramen ovale (1 patient each).
Of the 25 patients with juvenile DM studied prospectively, 17 had active disease at the time of recruitment, and 8 had inactive disease. Three of the patients initially classified as having inactive disease had a disease flare (mainly affecting the skin) at the last follow- up visit.
Endothelial injury. CECs. CEC numbers were higher in patients with juvenile DM (median 96 cells/ml [IQR 40– 192]) com-pared to healthy controls (median 12 [IQR 8– 24]) (difference −84 [95% CI −100.0, −56.00]; P < 0.0001) (Figure 1A). Patients with active juvenile DM had higher numbers of CECs than those with inactive juvenile DM (difference −82 [95% CI −40.00, −128.00]; P < 0.0001). Previous studies have suggested that vasculopa-thy may play a role in the pathogenesis of calcinosis in juvenile DM (1,5), and we noted higher numbers of CECs in juvenile DM patients with calcinosis compared to healthy controls (difference −54 [95% CI −100.00, −28.00]; P < 0.0001) (Figure 1A), but no significant difference between the patients with and those without calcinosis (P = 0.5). We also observed that 10 of the 12 patients with calcinosis had active juvenile DM. Further analysis of spe-cific disease features pertinent to the vasculopathy of juvenile DM showed that CEC numbers were higher among patients who had nailfold capillary changes (median 128 cells/ml [IQR 72– 248]) compared to patients with normal nailfold capillaries (median 48 cells/ml [IQR 32– 119]) (difference −80 [95% CI −104.0, −24.00]; P = 0.0006) (Figure 1B). As noted above, 49 patients had been tested for MSAs. Among the 8 patients who were positive for tran-scription intermediary factor 1γ antibodies, CEC numbers were higher compared to the 10 patients with NXP- 2 antibodies (median 200 cells/ml [IQR 128– 452] versus 36 cells/ml [IQR 15– 56]) (differ-ence 164 [95% CI 88.00, 472.0]; P < 0.0001) (Figure 1C).
Among the 25 patients studied prospectively, there was no significant difference between the number of CECs at the time of recruitment (median 88 cells/ml [IQR 36– 128]) and at the time of the last follow- up (median 80 cells/ml [48- 280]) (P = 0.25) (Figure 1D). Seventeen of these patients (68%) had active juvenile DM at the time of recruitment and 14 (56%) had active juvenile DM at the last follow- up. There was a decrease in CEC numbers among patients whose disease status changed from active at baseline to inactive at the last follow- up (n = 6) (median differ-ence −32 [95% CI −504, −12]; P = 0.03) and an increase among patients who had inactive disease at baseline and active disease at the last follow- up (n = 3) (median difference 280 [95% CI 60, 360]; P = 0.25) (Figures 1E and F).
Circulating levels of inflammation markers. Overall, there was a significant difference in circulating levels of inflammation mark-ers between patients with juvenile DM and controls, and between patients with active juvenile DM and those with inactive juvenile DM

THE VASCULOPATHY OF JUVENILE DM | 1261
Tab
le 4
. C
ircul
atin
g m
icro
part
icle
pro
file
and
thro
mbi
n ge
nera
tion
para
met
ers
in th
e pa
tient
s w
ith ju
veni
le D
M a
nd th
e he
alth
y co
ntro
ls*
Juve
nile
DM
pa
tient
s
(n =
90)
Hea
lthy
cont
rols
(n
= 5
6)D
iffer
ence
(9
5% C
I) [P
]†
Juve
nile
DM
pa
tient
s w
ith
activ
e di
seas
e
(n =
64)
Diff
eren
ce
(95%
CI)
[P],
pa
tient
s w
ith
activ
e ju
veni
le
DM
vs.
con
trol
s†
Juve
nile
DM
pa
tient
s w
ith
inac
tive
dise
ase
(n
= 2
6)
Diff
eren
ce
(95%
CI)
[P],
pa
tient
s w
ith
inac
tive
juve
nile
D
M v
s. c
ontr
ols†
Diff
eren
ce
(95%
CI)
[P],
pa
tient
s w
ith
activ
e ju
veni
le
DM
vs.
pat
ient
s w
ith in
activ
e ju
veni
le D
M†
Tota
l Anx
V+ M
Ps20
4.7
(8
7.9–
412.
6)44
.3
(15.
0– 24
9.1)
179.
6 (7
1.2,
191
.9)
[<0.
0001
]30
0.1
(1
86.3
– 584
.6)
−256
.7 (−
281.
5,
−153
.8)
[<0.
0001
]
81.3
(3
3.8–
190.
5)−3
6.9
(−55
.1, 1
4.1)
[0
.24]
219.
7 (−
276.
5,
−130
.9)
[<0.
0001
]EM
Ps
(Anx
V+CD
62E+
CD42
a−),
×103 /m
l
4.7
(1
.3– 1
3.8)
2.3
(0
.5– 5
.1)
2.3
(0.3
, 3.8
) [0
.007
5]6.
1
(20.
3– 2.
5)−3
.8 (−
6.2,
−1.
4)
[0.0
001]
1.8
(0.3
– 6.8
)0.
6 (−
0.9,
1.3
) [0
.79]
−4.4
(−6.
8, −
1.2)
[0
.000
4]
PMPs
(Anx
V+CD
42a+
), ×1
03 /ml
82.4
(2
6.5–
173.
6)18
.1
(6.3
– 98.
3)64
.3 (1
3.1,
67.
0)
[0.0
006]
123.
1
(50.
2– 19
8.3)
−104
.9 (−
102.
9,
−38.
7)
[0.0
001]
28.3
(8
.0– 4
7.7)
−10.
2 (−
15.9
, −10
.1)
[0.8
8]−9
4.7
(−10
7.9,
−4
3.7)
[<
0.00
01]
TF+C
D14
+Anx
V+CD
42a−
, ×1
03 /ml
0.4
(0
.0– 2
.9)
0.08
(0
.0– 0
.6)
0.3
(0.0
, 0.5
) [0
.001
]0.
6
(0.1
– 4.3
)−0
.5 (−
0.8,
−0.
1)
[0.0
002]
0.2
(0
.0– 1
.5)
−0.0
9 (−
0.2,
0.0
) [0
.16]
−0.4
(−0.
7, 0
.0)
[0.0
6]CD
19+A
nxV+
CD42
a−,
×103 /m
l3.
6
(1.2
– 15.
4)1.
8
(0.5
– 6.3
)1.
7 (0
.3, 2
.9)
[0.0
08]
5.2
(1
.7– 2
4.6)
3.4
(−5.
0, −
1.0)
[0
.000
2]1.
3
(0.6
– 5.4
)0.
5 (−
0.9,
1.0
) [0
.99]
−3.9
(−5.
3, −
0.9)
[0
.001
4]CD
3+An
xV+C
d42a
−,
×103 /m
l1.
2
(0.2
– 3.9
)0.
5
(0.1
– 1.9
)0.
7 (0
.0, 0
.8)
[0.0
6]1.
5
(0.4
– 5.2
)−0
.9 (−
1.3,
−0.
1)
[0.0
06]
0.6
(0
.0– 1
.5)
−0.1
(−0.
3, 0
.3)
[0.9
8]−0
.9 (−
1.6,
−0.
05)
[0.0
2]Pe
ak th
rom
bin,
nM
151.
5
(111
.4– 2
28.2
)44
.8
(22.
8– 78
.6)
106.
7 (8
7.3,
124
.8)
[<0.
0001
]18
2.1
(1
26.7
– 270
.6)
−137
.3 (−
157.
7,
−104
.7)
[<0.
0001
]
128.
2
(90.
4– 16
6.8)
−83.
4, (−
94.4
, −5
5.3)
[<
0.00
01]
−53.
8 (−
89.7
, −28
.6)
[<0.
0001
]
ETP,
nM
/min
ute
3,28
6
(2,5
93– 3
,924
)1,
000
(3
87– 1
,945
)2,
286
(1,7
37, 2
,391
) [<
0.00
01]
3,54
0
(2,8
62– 4
,154)
−2,5
39 (−
2,67
6,
−1,9
63)
[<0.
0001
]
2,90
4
(2,17
5– 3,
480)
−1,9
03 (−
2,03
4,
−1,2
70)
[<0.
0001
]
−636
(−1,
026,
−32
1)
[0.0
003]
Lag
time,
min
utes
21.0
(1
5.2–
30.5
)35
.0
(24.
9– 51
.0)
−14.
0 (−
17.0
, −9.
0)
[<0.
0001
]20
.0
(15.
1– 28
.1)
15.0
(10.
0, 1
8.5)
[<
0.00
01]
26.0
(1
5.5–
32.7
)9.
0 (5
.0, 1
6.5)
[<
0.00
01]
6.0
(−0.
5, 7
.5)
[0.0
7]Ve
loci
ty in
dex,
nM
/min
ute
18.7
(1
0.7–
35.5
)2.
8
(0.6
– 7.2
)15
.9 (1
0.7,
17.
9)
[<0.
0001
]23
.6
(12.
6– 37
.7)
20.8
(−23
.9, −
13.3
) [<
0.00
01]
13.9
(9
.1– 2
2.7)
−11.
1 (−
12.8
, −7.
3)
[<0.
0001
]−9
.7 (−
14.6
, −2.
9)
[0.0
02]
* Va
lues
are
the
med
ian
(inte
rqua
rtile
rang
e). D
M =
der
mat
omyo
sitis
; 95%
CI =
95%
con
fiden
ce in
terv
al; A
nxV
= an
nexi
n V;
MPs
; = m
icro
part
icle
s; E
MPs
= e
ndot
helia
l- der
ived
MPs
; PM
Ps =
pl
atel
et- d
eriv
ed M
Ps; T
F =
tissu
e fa
ctor
; ETP
= e
ndog
enou
s th
rom
bin
pote
ntia
l (co
rres
pond
ing
to th
e ar
ea u
nder
the
curv
e fo
r thr
ombi
n ge
nera
tion
assa
y cu
rves
). †
P va
lues
wer
e de
term
ined
by
Krus
kal- W
allis
test
follo
wed
by
Man
n- W
hitn
ey U
test
.

PAPADOPOULOU ET AL 1262 |
(Table 3). Patients with active disease had higher levels of IL- 10, IL- 6, IFNλ1, MCP- 1, IP- 10, and galectin- 9 compared to patients with inactive disease or healthy controls. As endothelial cells are the main source of galectin- 9 (40), we then examined the corre-lation between levels of galectin- 9 and CECs; a strong correlation was identified (r = 0.48, P < 0.0001). Patients with juvenile DM with abnormal nailfold capillaries had higher levels of galectin- 9 (median 105.1 ng/ml [IQR 54.8– 196.7]) compared to patients with normal nailfold capillaries (median 57.6 ng/ml [IQR 35.1– 67.1]) (difference −47.5 [95% CI −81.1, −22.3]; P = 0.0004).
Circulating MPs and plasma thrombin generation. Total AnxV+ MP numbers were significantly increased among patients with juvenile DM compared to patients with inactive juve-nile DM and healthy controls (both P < 0.0001) (Table 4). MPs were mainly of platelet and endothelial origin. B cell– derived MPs were the third most common MP population. Total AnxV+ MP numbers correlated with CEC numbers (r = 0.42, P < 0.0001) and with galectin- 9 levels (r = 031, P = 0.01). (Figures 2A and B). CD62E+ MP counts also correlated strongly with CEC counts (r = 0.20, P = 0.027) (Figure 2C).
Enhanced plasma- mediated thrombin generation, ETP, lag time, and velocity index were demonstrated in patients with active juvenile DM compared to patients with inactive juvenile DM and controls (Table 4). TF+CD14+ MP counts were strongly associated with ETP, a single summative parameter of thrombin generation (41) (r = 0.21, P = 0.02) (Figure 2D). ETP was also correlated with total AnxV+ MP numbers (r = 023, P = 0.02) and with numbers
of EMPs (r = 0.23, P = 0.01) and CD19+Anx V+ MPs (r = 0.23, P = 0.01). No significant correlation between ETP and numbers of CD3+AnxV+ MPs or PMPs was observed (r = 0.18, P = 0.06 and r = 0.17, P = 0.069, respectively).
Arterial stiffness. We confirmed a strong positive associa-tion between age and carotid- femoral and carotid- radial PWV (both P < 0.0001) (Figures 3A and B). The slope for carotid- radial PWV in relation to age among patients with juvenile DM (0.44 m/sec-ond/year, y- intercept 3.414) differed significantly from that among healthy controls slope (0.12 m/second/year, y- intercept 5.903) (P = 0.003) (Figure 3C), indicating significantly increased arterial stiff-ness among patients with juvenile DM. No significant difference in carotid- femoral PWV was observed (P = 0.12) (Figure 3D).
DISCUSSION
We conducted a large cross- sectional study of patients with juvenile DM and explored biomarkers to monitor the vascu-lopathy of this disease. Our data provide evidence of increased endothelial injury in children with active juvenile DM, associated with proinflammatory cytokines, high levels of circulating MPs with a propensity to drive thrombin generation and potentially increase occlusive vasculopathy, and increased arterial stiffness in patients with juvenile DM compared to controls. These nonin-vasively measured vascular indices provide unique insight into the pathogenesis of vascular injury in this disease and could be used for clinical monitoring of the vasculopathy of juvenile DM.
Figure 2. Correlation of circulating microparticle (MP) levels with other indices of endothelial injury and thrombin generation in patients with juvenile DM. A and B, Total annexin V (AnV)– positive MP counts correlated with CEC counts (A) and galectin- 9 levels (B). C, Endothelial MP (EMP) counts correlated with CEC counts. D, Circulating tissue factor (TF)– positive MP counts correlated with plasma endogenous thrombin potential (ETP) values. Correlations were assessed with Spearman’s rank correlation coefficient. See Figure 1 for other definitions.

THE VASCULOPATHY OF JUVENILE DM | 1263
CECs are mature cells that have detached from the vessel wall in response to endothelial injury (17,22,42,43). We demon-strated increased levels of CECs in juvenile DM, in accordance with another recent study that also demonstrated increased CEC counts in juvenile DM, despite the use of a different method (flow cytometry) for cell enumeration (44). CEC numbers also strongly correlated with other biomarkers of endothelial injury such as galectin- 9 levels and EMP counts, thus supporting the robust-ness of these endothelial injury indices. CEC counts were also found to be elevated in patients with juvenile DM whose disease was considered to be clinically inactive. This raises the possibility that in some patients with juvenile DM there is ongoing subclini-cal endothelial injury and disease activity that is not captured by laboratory parameters and disease activity measures that are cur-rently routinely used. In addition, the demonstration of elevated CEC counts in patients with abnormal nailfold capillaries supports the notion that this finding is indeed a clinical sign of active juvenile DM vasculopathy.
We did not demonstrate any differences in traditional markers of systemic inflammation as assessed by hsCRP or SAA or any differences in routine cardiovascular risk factors (45) to account for the elevated CEC or MP counts we observed (Tables 1 and 3). We did, however, detect consistently higher levels of endothe-lial activation– related cell adhesion molecules, cytokines, and chemokines in patients with juvenile DM compared to healthy controls. This observation likely indicates a chronic disturbance in endothelial cell homoeostasis in patients with juvenile DM, includ-ing in some patients with apparently quiescent clinical disease
activity as assessed using routine clinical tools. Juvenile DM is considered an interferonopathy, and therefore, not surprisingly, we detected high levels of IFN- driven cytokines/chemokines (IFNα, IFNλ1, MCP- 1, IP- 10) (46,47) in all patients with juvenile DM compared to controls, especially in patients with active disease, though we do note that other cytokines also correlated with active disease.
Additionally, we detected elevated levels of circulating endothelial, platelet, monocyte, and B cell– derived MPs that are highly prothrombotic (48) in patients with juvenile DM. We have previously demonstrated enhanced MP- mediated thrombin gen-eration in children with active vasculitis (16), potentially explaining some of the excess thrombotic risk associated with vasculitis. Similarly, we detected elevated levels of MPs, including highly pro-thrombotic TF+ MPs, and enhanced plasma thrombin generation in patients with active juvenile DM. This increased prothrombotic propensity, mediated by MPs among other prothrombotic fac-tors, might contribute to occlusive vasculopathy and organ injury in juvenile DM. The exact mechanism by which different types of MPs may promote endothelial dysfunction and thrombogenicity in juvenile DM remain to be established.
We also showed that children with juvenile DM have enhanced carotid- radial PWV, consistent with increased arte-rial stiffness compared to healthy children. This increased PWV may suggest a generalized secondary systemic vas-culopathy, ultimately leading to accelerated atherosclerosis. Other factors such as sedentary lifestyle, long- term treatment with glucocorticoids, and ongoing systemic inflammation may
Figure 3. Carotid- radial and carotid- femoral pulse wave velocity (PWV) in patients with juvenile dermatomyositis (JDM) and healthy controls. A and B, Both carotid- radial PWV (A) and carotid- femoral PWV (B) correlated with age in the group of all subjects combined (patients with juvenile DM and controls). C and D, The slope for carotid- radial PWV in relation to age in patients with juvenile DM differed significantly from the slope in healthy controls (C), whereas a difference was not observed for carotid- femoral PWV (D), by analysis of covariance.

PAPADOPOULOU ET AL 1264 |
also contribute to this finding. It is not yet known whether pre-mature cardiovascular morbidity occurs later in adulthood in patients with juvenile DM, but our data strongly suggest that this could be a future concern, and indeed has been observed in adults with juvenile DM (49,50). Prospective studies to eval-uate changes of PWV over time in patients with juvenile DM are needed.
No differences in carotid- femoral PWV between patients with juvenile DM and controls were demonstrated in this study. Carotid- radial PWV mainly reflects the peripheral arterial stiffness of upper limb muscular arteries (branchial and radial arteries), while carotid- femoral PWV is a marker of central arterial (aortic, i.e., elastic artery) stiffness (51,52). Previous studies have suggested that the variation in elastin– collagen smooth muscle proportions within dif-ferent arterial segments determines the observed arterial stiffness in response to various cardiovascular risk factors (53). It is there-fore perhaps not surprising that inflammatory processes such as juvenile DM may also have a different effect on the arterial stiffness of separate parts of the arterial tree. In addition, other studies have suggested that carotid- radial PWV mainly reflects microvascular endothelial dysfunction (54,55), and therefore it could be the case that juvenile DM induces such microvascular changes rather than larger structural arterial changes.
The present findings have multiple potential implications with regard to therapy. In patients with ongoing vasculitic endothelial injury, prolonged immunosuppressive treatment and/or consid-eration of novel directed therapeutic strategies may be needed to target the vasculopathy of juvenile DM. We observed an up- regulation of several proinflammatory cytokines/chemokines that could potentially provide a therapeutic target. Of particular inter-est is the up- regulation of IFN- driven cytokines/chemokines that could be contributing to driving endothelial injury. Notably, several recent transcriptomic studies (56,57) have shown up- regulation of IFN- stimulated genes within the capillaries of the muscle and disruption of vascular network organization upon exposure of endothelial cells to IFN, highlighting the involvement of this path-way in the vasculopathy of myositis (58). Based on these obser-vations, targeting IFN-related endothelial injury with JAK inhibition has therefore emerged as a novel therapeutic strategy for myosi-tis (59,60). In that context, we have reported the use of CECs to monitor the rapid response of endothelial injury to JAK inhibi-tion in a patient with juvenile DM (60). MP profiling and thrombin generation assays could provide a novel means of assessing pro-thrombotic risk in patients with juvenile DM, allowing improved risk stratification and potential targeting of primary thrombosis preven-tion (61). Finally, if larger prospective studies confirm increased arterial stiffness in children with juvenile DM, formal therapeutic lifestyle interventions may be considered, in order to reduce this risk of accelerated cardiovascular morbidity.
Our study has several limitations. It was a single- center study of a heterogeneous cohort of patients with juvenile DM. At the time of recruitment, patients were receiving a variety of treatments,
although they were treated in accordance with published clinical guidelines (62). MSA testing to better understand the potential rel-evance of these antibodies to vascular phenotype and influence on circulating IFN and galectin- 9 levels was not available in all patients. Our control population was age similar, but not exactly age matched, due to of lack of availability of control samples from very young healthy children.
In conclusion, we have demonstrated dynamic changes in biomarkers of endothelial injury (MPs and CECs) in children with juvenile DM. Future studies could also explore these indices in the context of clinical trials, to better understand the use of more tar-geted therapeutic strategies on vascular phenotype in juvenile DM.
ACKNOWLEDGMENTS
We are grateful to the patients and families who agreed to take part in the study.
AUTHOR CONTRIBUTIONS
All authors were involved in drafting the article or revising it critically for important intellectual content, and all authors approved the final version to be published. Dr. Papadopoulou had full access to all of the data in the study and takes responsibility for the integrity of the data and the accuracy of the data analysis.Study conception and design. Papadopoulou, Hong, Brogan, Eleftheriou.Acquisition of data. Papadopoulou, Hong, Krol, Al Obaidi, Pilkington, Wedderburn, Brogan, Eleftheriou.Analysis and interpretation of data. Papadopoulou, Hong, Brogan, Eleftheriou.
REFERENCES 1. Papadopoulou C, McCann LJ. The vasculopathy of juvenile dermat-
omyositis [review]. Front Pediatr 2018;6:284.
2. Whitaker JN, Engel WK. Vascular deposits of immunoglobulin and complement in idiopathic inflammatory myopathy. N Engl J Med 1972;286:333– 8.
3. McCann LJ, Juggins AD, Maillard SM, Wedderburn LR, Davidson JE, Murray KJ, et al. The Juvenile Dermatomyositis National Registry and Repository (UK and Ireland): clinical characteristics of children recruited within the first 5 yr. Rheumatology (Oxford) 2006;45:1255– 60.
4. Crowe WE, Bove KE, Levinson JE, Hilton PK. Clinical and pathoge-netic implications of histopathology in childhood polydermatomyosi-tis. Arthritis Rheum 1982;25:126– 39.
5. Gitiaux C, De Antonio M, Aouizerate J, Gherardi RK, Guilbert T, Barnerias C, et al. Vasculopathy- related clinical and pathologi-cal features are associated with severe juvenile dermatomyositis. Rheumatology (Oxford) 2016;55:470– 9.
6. Baechler EC, Bauer JW, Slattery CA, Ortmann WA, Espe KJ, Novitzke J, et al. An interferon signature in the peripheral blood of dermatomyositis patients is associated with disease activity. Mol Med 2007;13:59– 68.
7. Emslie- Smith AM, Engel AG. Microvascular changes in early and advanced dermatomyositis: a quantitative study. Ann Neurol 1990;27:343– 56.
8. Mamyrova G, Kleiner DE, James- Newton L, Shaham B, Miller FW, Rider LG. Late- onset gastrointestinal pain in juvenile dermatomyosi-tis as a manifestation of ischemic ulceration from chronic endarter-opathy. Arthritis Rheum 2007;57:881– 4.

THE VASCULOPATHY OF JUVENILE DM | 1265
9. Pachman LM, Hayford JR, Chung A, Daugherty CA, Pallansch MA,Fink CW, et al. Juvenile dermatomyositis at diagnosis: clinical char-acteristics of 79 children. J Rheumatol 1998;25:1198– 204.
10. Tisseverasinghe A, Bernatsky S, Pineau CA. Arterial events inpersons with dermatomyositis and polymyositis. J Rheumatol2009;36:1943– 6.
11. Zaller B, Li X, Sundquist J, Sundquist K. Risk of subsequent cor-onary heart disease in patients hospitalized for immune- mediateddiseases: a nationwide follow- up study from Sweden. PLoS One2012;7:e33442.
12. Brogan PA, Davies R, Gordon I, Dillon MJ. Renal angiography in chil-dren with polyarteritis nodosa. Pediatr Nephrol 2002;17:277– 83.
13. Brogan P, Eleftheriou D, Dillon M. Small vessel vasculitis. PediatrNephrol 2010;25:1025– 35.
14. Clarke LA, Shah V, Arrigoni F, Eleftheriou D, Hong Y, Halcox J, et al.Quantitative detection of circulating endothelial cells in vasculitis:comparison of flow cytometry and immunomagnetic bead extrac-tion. J Thromb Haemost 2008;6:1025– 32.
15. Clarke LA, Hong Y, Eleftheriou D, Shah V, Arrigoni F, Klein NJ, et al.Endothelial injury and repair in systemic vasculitis of the young.Arthritis Rheum 2010;62:1770– 80.
16. Eleftheriou D, Hong Y, Klein NJ, Brogan PA. Thromboembolic dis-ease in systemic vasculitis is associated with enhanced microparticle- mediated thrombin generation [letter]. J Thromb Haemost 2011;9:1864– 7.
17. Eleftheriou D, Ganesan V, Hong Y, Klein NJ, Brogan PA. Endothelialinjury in childhood stroke with cerebral arteriopathy: a cross- sectional study. Neurology 2012;79:2089– 96.
18. Koga H, Sugiyama S, Kugiyama K, Watanabe K, Fukushima H,Tanaka T, et al. Elevated levels of VE- cadherin- positive endothelialmicroparticles in patients with type 2 diabetes mellitus and coronaryartery disease. J Am Coll Cardiol 2005;45:1622– 30.
19. Pericleous C, Clarke LA, Brogan PA, Latchman DS, Isenberg DA,Ioannou Y, et al. Endothelial microparticle release is stimulated invitro by purified IgG from patients with the antiphospholipid syn-drome. Thromb Haemost 2013;109:72– 8.
20. Clancy RM. Circulating endothelial cells and vascular injury in sys-temic lupus erythematosus. Curr Rheumatol Rep 2000;2:39– 43.
21. Haubitz M, Woywodt A. Circulating endothelial cells and vasculitis.Intern Med 2004;43:660– 7.
22. Woywodt A, Streiber F, de Groot K, Regelsberger H, Haller H, Haubitz M. Circulating endothelial cells as markers for ANCA- associatedsmall- vessel vasculitis. Lancet 2003;361:206– 10.
23. Bohan A, Peter JB. Polymyositis and dermatomyositis: part 1[review]. N Engl J Med 1975;292:344– 7.
24. Martin N, Krol P, Smith S, Murray K, Pilkington CA, Davidson JE,et al. A national registry for juvenile dermatomyositis and otherpaediatric idiopathic inflammatory myopathies: 10 years’ expe-rience; the Juvenile Dermatomyositis National (UK and Ireland)Cohort Biomarker Study and Repository for Idiopathic InflammatoryMyopathies. Rheumatology (Oxford) 2011;50:137– 45.
25. Lazarevic D, Pistorio A, Palmisani E, Miettunen P, Ravelli A, Pilkington C, et al. The PRINTO criteria for clinically inactive disease in juveniledermatomyositis. Ann Rheum Dis 2013;72:686– 93.
26. Lovell DJ, Lindsley CB, Rennebohm RM, Ballinger SH, Bowyer SL,Giannini EH, et al, in cooperation with The Juvenile DermatomyositisDisease Activity Collaborative Study Group. Development of vali-dated disease activity and damage indices for the juvenile idiopathicinflammatory myopathies. II. The Childhood Myositis AssessmentScale (CMAS): a quantitative tool for the evaluation of muscle func-tion. Arthritis Rheum 1999;42:2213– 9.
27. Huber AM, Feldman BM, Rennebohm RM, Hicks JE, Lindsley CB,Perez MD, et al. Validation and clinical significance of the Childhood
Myositis Assessment Scale for assessment of muscle function in the juvenile idiopathic inflammatory myopathies. Arthritis Rheum 2004;50:1595– 603.
28. Rider LG, Koziol D, Giannini EH, Jain MS, Smith MR, Whitney- Mahoney K, et al. Validation of manual muscle testing and a subsetof eight muscles for adult and juvenile idiopathic inflammatory myo-pathies. Arthritis Care Res (Hoboken) 2010;62:465– 72.
29. Shah V, Christov G, Mukasa T, Brogan KS, Wade A, Eleftheriou D,et al. Cardiovascular status after Kawasaki disease in the UK. Heart2015;101:1646– 55.
30. Tansley SL, Simou S, Shaddick G, Betteridge ZE, Almeida B,Gunawardena H, et al. Autoantibodies in juvenile- onset myositis:their diagnostic value and associated clinical phenotype in a largeUK cohort. J Autoimmun 2017;84:55– 64.
31. Rider LG, Feldman BM, Perez MD, Rennebohm RM, Lindsley CB,Zemel LS, et al, in cooperation with the Juvenile DermatomyositisDisease Activity Collaborative Study Group. Development of vali-dated disease activity and damage indices for the juvenile idiopathicinflammatory myopathies. I. Physician, parent, and patient globalassessments. Arthritis Rheum 1997;40:1976– 83.
32. Singh G, Athreya BH, Fries JF, Goldsmith DP. Measurement of health status in children with juvenile rheumatoid arthritis. Arthritis Rheum1994;37:1761– 9.
33. Guzman J, Petty RE, Malleson PN. Monitoring disease activity injuvenile dermatomyositis: the role of von Willebrand factor and mus-cle enzymes. J Rheumatol 1994;21:739– 43.
34. Feldman BM, Rider LG, Reed AM, Pachman LM. Juvenile dermato-myositis and other idiopathic inflammatory myopathies of childhood.Lancet 2008;371:2201– 12.
35. Hasegawa M. Dermoscopy findings of nail fold capillaries in connec-tive tissue diseases. J Dermatol 2011;38:66– 70.
36. Chihara M, Kurita M, Yoshihara Y, Asahina A, Yanaba K. Clinical sig-nificance of serum galectin- 9 and soluble CD155 levels in patientswith systemic sclerosis. J Immunol Res 2018;2018:9473243.
37. Woywodt A, Blann AD, Kirsch T, Erdbruegger U, Banzet N, HaubitzM, et al. Isolation and enumeration of circulating endothelial cells byimmunomagnetic isolation: proposal of a definition and a consensusprotocol. J Thromb Haemost 2006;4:671– 7.
38. Bidot L, Jy W, Bidot C Jr, Jimenez JJ, Fontana V, Horstman LL,et al. Microparticle- mediated thrombin generation assay: increasedactivity in patients with recurrent thrombosis. J Thromb Haemost2008;6:913– 9.
39. Urbina EM, Williams RV, Alpert BS, Collins RT, Daniels SR, HaymanL, et al. Noninvasive assessment of subclinical atherosclerosis inchildren and adolescents: recommendations for standard assess-ment for clinical research: a scientific statement from the AmericanHeart Association. Hypertension 2009;54:919– 50.
40. O’Brien MJ, Shu Q, Stinson WA, Tsou PS, Ruth JH, Isozaki T, et al. A unique role for galectin- 9 in angiogenesis and inflammatory arthritis.Arthritis Res Ther 2018;20:31.
41. Tripodi A. Thrombin generation assay and its application in the clini-cal laboratory. Clin Chem 2016;62:699– 707.
42. Kluz J, Kopec W, Jakobsche U, Prajs I, Adamiec R. Vasculitis in sys-temic lupus erythematosus (SLE)– assessment of peripheral bloodmononuclear cell activation and the degree of endothelial dysfunc-tion: initial report. Postepy Hig Med Dosw (Online) 2007;61:725– 35.
43. Kutlay S, Calayoglu R, Boyvat A, Turkcapar N, Sengul S, KevenK, et al. Circulating endothelial cells: a disease activity marker inBehcet’s vasculitis? Rheumatol Int 2008;29:159– 62.
44. Kishi T, Chipman J, Evereklian M, Nghiem K, Stetler- Stevenson M,Rick ME, et al. Endothelial activation markers as disease activityand damage measures in juvenile dermatomyositis. J Rheumatol2020;47:1011– 8.

PAPADOPOULOU ET AL 1266 |
45. Wahezi DM, Liebling EJ, Choi J, Dionizovik- Dimanovski M, Gao Q, Parekh J. Assessment of traditional and non- traditional risk factors for premature atherosclerosis in children with juvenile der-matomyositis and pediatric controls. Pediatr Rheumatol Online J 2020;18:25.
46. Bilgic H, Ytterberg SR, Amin S, McNallan KT, Wilson JC, Koeuth T, et al. Interleukin- 6 and type I interferon– regulated genes and chemokines mark disease activity in dermatomyositis. Arthritis Rheum 2009;60:3436– 46.
47. Reed AM, Peterson E, Bilgic H, Ytterberg SR, Amin S, Hein MS, et al. Changes in novel biomarkers of disease activity in juvenile and adult dermatomyositis are sensitive biomarkers of disease course. Arthritis Rheum 2012;64:4078– 86.
48. Falati S, Liu Q, Gross P, Merrill- Skoloff G, Chou J, Vandendries E, et al. Accumulation of tissue factor into developing thrombi in vivo is dependent upon microparticle P- selectin glycoprotein ligand 1 and platelet P- selectin. J Exp Med 2003;197:1585– 98.
49. Eimer MJ, Brickman WJ, Seshadri R, Ramsey- Goldman R, McPherson DD, Smulevitz B, et al. Clinical status and cardiovascu-lar risk profile of adults with a history of juvenile dermatomyositis. J Pediatr 2011;159:795– 801.
50. Silverberg JI, Kwa L, Kwa MC, Laumann AE, Ardalan K. Cardiovascular and cerebrovascular comorbidities of juvenile der-matomyositis in US children: an analysis of the National Inpatient Sample. Rheumatology (Oxford) 2018;57:694– 702.
51. Liu J, Zhang Y, Cao TS, Duan YY, Yuan LJ, Yang YL, et al. Preferential macrovasculopathy in systemic sclerosis detected by regional pulse wave velocity from wave intensity analysis: comparisons of local and regional arterial stiffness parameters in cases and controls. Arthritis Care Res (Hoboken) 2011;63:579– 87.
52. Niiranen TJ, Kalesan B, Larson MG, Hamburg NM, Benjamin EJ, Mitchell GF, et al. Aortic- brachial arterial stiffness gradient and car-diovascular risk in the community: the Framingham Heart Study. Hypertension 2017;69:1022– 8.
53. Van der Heijden- Spek JJ, Staessen JA, Fagard RH, Hoeks AP, Boudier HA, van Bortel LM. Effect of age on brachial artery wall properties differs from the aorta and is gender dependent: a popula-tion study. Hypertension 2000;35:637– 42.
54. McCall DO, McGartland CP, Woodside JV, Sharpe P, McCance DR, Young IS. The relationship between microvascular endothelial function and carotid- radial pulse wave velocity in patients with mild hypertension. Clin Exp Hypertens 2010;32:474– 9.
55. Badhwar S, Chandran DS, Jaryal AK, Narang R, Deepak KK. Regional arterial stiffness in central and peripheral arteries is dif-ferentially related to endothelial dysfunction assessed by brachial flow- mediated dilation in metabolic syndrome. Diab Vasc Dis Res 2018;15:106– 13.
56. Greenberg SA, Pinkus JL, Pinkus GS, Burleson T, Sanoudou D, Tawil R, et al. Interferon- α/β- mediated innate immune mechanisms in dermatomyositis. Ann Neurol 2005;57:664– 78.
57. Suarez- Calvet X, Gallardo E, Nogales- Gadea G, Querol L, Navas M, Diaz- Manera J, et al. Altered RIG- I/DDX58- mediated innate immu-nity in dermatomyositis. J Pathol 2014;233:258– 68.
58. Ladislau L, Suarez- Calvet X, Toquet S, Landon- Cardinal O, Amelin D, Depp M, et al. JAK inhibitor improves type I interferon induced damage: proof of concept in dermatomyositis. Brain 2018;141:1609– 21.
59. Aeschlimann FA, Fremond ML, Duffy D, Rice GI, Charuel JL, Bondet V, et al. A child with severe juvenile dermatomyositis treated with ruxolitinib. Brain 2018;141:e80.
60. Papadopoulou C, Hong Y, Omoyinmi E, Brogan PA, Eleftheriou D. Janus kinase 1/2 inhibition with baricitinib in the treatment of juvenile dermatomyositis. Brain 2019;142:e8.
61. Lee CJ, Ansell JE. Direct thrombin inhibitors. Br J Clin Pharmacol 2011;72:581– 92.
62. Enders FB, Bader- Meunier B, Baildam E, Constantin T, Dolezalova P, Feldman BM, et al. Consensus- based recommendations for the man-agement of juvenile dermatomyositis. Ann Rheum Dis 2017;76:329– 40.

1267
Arthritis & RheumatologyVol. 73, No. 7, July 2021, pp 1267–1276DOI 10.1002/art.41709© 2021 The Authors. Arthritis & Rheumatology published by Wiley Periodicals LLC on behalf of American College of Rheumatology.This is an open access article under the terms of the Creative Commons Attribution- NonCommercial License, which permits use, distribution and reproduction in any medium, provided the original work is properly cited and is not used for commercial purposes.
Epidemiology of Scleritis in the United Kingdom From 1997 to 2018: Population- Based Analysis of 11 Million Patients and Association Between Scleritis and Infectious and Immune-MediatedInflammatoryDiseaseTasanee Braithwaite,1 Nicola J. Adderley,2 Anuradhaa Subramanian,2 James Galloway,3
John H. Kempen,4 Krishna Gokhale,2 Andrew P. Cope,5 Andrew D. Dick,6 Krishnarajah Nirantharakumar,7 and Alastair K. Denniston8
Objective. To estimate 22- year trends in the prevalence and incidence of scleritis, and the associations of scleritis with infectious and immune- mediated inflammatory diseases (I- IMIDs) in the UK.
Methods. The retrospective cross- sectional and population cohort study (1997– 2018) included 10,939,823 patients (2,946 incident scleritis cases) in The Health Improvement Network, a nationally representative primary care records database. The case–control and matched cohort study (1995– 2019) included 3,005 incident scleritis cases and 12,020 control patients matched by age, sex, region, and Townsend deprivation index. Data were analyzed using multivariable Poisson regression, multivariable logistic regression, and Cox proportional hazards multivariable models adjusted for age, sex, Townsend deprivation index, race/ethnicity, smoking status, nation within the UK, and body mass index. Incidence rate ratios (IRRs) and 95% confidence intervals (95% CIs) were calculated.
Results. Scleritis incidence rates per 100,000 person- years declined from 4.23 (95% CI 2.16– 6.31) to 2.79 (95% CI 2.19– 3.39) between 1997 and 2018. The prevalence of scleritis per 100,000 person- years was 93.62 (95% CI 90.17– 97.07) in 2018 (61,650 UK patients). Among 2,946 patients with incident scleritis, 1,831 (62.2%) were female, the mean ± SD age was 44.9 ± 17.6 years (range 1– 93), and 1,257 (88.8%) were White. Higher risk of incident scleritis was associated with female sex (adjusted IRR 1.53 [95% CI 1.43– 1.66], P < 0.001), Black race/ethnicity (adjusted IRR 1.52 [95% CI 1.14– 2.01], P = 0.004 compared to White race/ethnicity), or South Asian race/ethnicity (adjusted IRR 1.50 [95% CI 1.19– 1.90], P < 0.001 compared to White race/ethnicity), and older age (peak adjusted IRR 4.95 [95% CI 3.99– 6.14], P < 0.001 for patients ages 51– 60 years versus those ages ≤10 years). Compared to controls, scleritis patients had a 2- fold increased risk of a prior I- IMID diagnosis (17 I- IMIDs, P < 0.001) and significantly increased risk of subsequent diagnosis (13 I- IMIDs). The I- IMIDs most strongly associated with scleritis included granulomatosis with polyangiitis, Behçet’s disease, and Sjögren’s syndrome.
Conclusion. From 1997 through 2018, the UK incidence of scleritis declined from 4.23 to 2.79/100,000 person- years. Incident scleritis was associated with 19 I- IMIDs, providing data for rational investigation and cross- specialty engagement.
The views expressed in this article are those of the authors and not necessarily those of the NHS, the NIHR, or the UK Department of Health.
Dr. Braithwaite’s work was supported by Olivia’s Vision. Dr. Galloway and Professor Cope’s work was supported by the NIHR Biomedical Research Centre at Guy’s and St Thomas’ NHS Foundation Trust and King’s College London. Professor Kempen’s work was supported by Massachusetts Eye and Ear/Schepens Eye Research Institute and Sight for Souls. Professors Dick and Denniston’s work was supported by the NIHR Biomedical Research Centre at Moorfields Eye Hospital NHS Foundation Trust and Institute of Ophthalmology, University of London. Professor Nirantharakumar’s work was supported by grants from the NIHR, MRC, Diabetes UK, the British Heart Foundation, and AAMD. Professor Denniston and Professor Nirantharakumar were also supported by Health Data Research UK, an initiative funded by UK Research and Innovation, Department of Health and Social Care (England) and the devolved administrations, and leading medical research charities.
1Tasanee Braithwaite, DM: Centre for Rheumatic Diseases and School of Life Course Sciences, King’s College London, The Medical Eye Unit, Guy’s and St Thomas’ Hospital NHS Foundation Trust, London, UK, and the Institute of Applied Health Research, University of Birmingham, Birmingham, UK; 2Nicola J. Adderley, PhD, Anuradhaa Subramanian, MSc, Krishna Gokhale, MSc: Institute of Applied Health Research, University of Birmingham, Bir mingham, UK; 3James Galloway, PhD: Centre for Rheumatic Diseases, School of Immunology and Microbial Sciences, King’s College London, UK; 4John H. Kempen, PhD: Massachusetts Eye and Ear and Harvard Medical School, Boston, Massachusetts, and MyungSung Christian Medical Center General Hospital and MyungSung Medical College, Addis Ababa, Ethiopia; 5Andrew P. Cope, PhD: Centre for Rheumatic Diseases, King’s College London, UK, and St Thomas’ Hospital NHS Foundation Trust, London, UK; 6Andrew D. Dick, MD: Institute of Ophthalmology, University College London, London, UK, and University of Bristol, Bristol, UK; 7Krishnarajah Nirantharakumar, MD:

BRAITHWAITE ET AL 1268 |
INTRODUCTION
Scleritis is a sight- threatening condition, which may be asso-ciated with systemic infectious and immune- mediated inflamma-tory disease (I- IMID). I- IMIDs are the result of aberrant immune responses to inciting infectious and noninfectious (autoimmune and autoinflammatory) pathologies, and frequently require sys-temic immunosuppression to avoid irreversible tissue damage (1). It has been long recognized that scleritis, especially if necrotiz-ing, may portend a worse survival prognosis in patients with certain I- IMIDs, including rheumatoid arthritis (RA) (2,3). A key challenge to advancing evidence- based management of scleritis is the pau-city of population- based epidemiologic data on incidence inter-nationally, and absence of data on the strength of associations of systemic I- IMIDs with scleritis and with other sight- threatening ocular inflammatory phenotypes (e.g., uveitis and optic neuritis) with which these I- IMIDs may be associated (1,4). Robust epide-miologic data would facilitate increased awareness of scleritis as a cause of ocular symptoms in patients with I- IMIDs, more tailored investigation and risk stratification, health system cost modeling, and allocation of appropriate resources (medicines, infrastructure, equipment, and staff) to meet current and future demand.
Knowledge of the epidemiology of scleritis is currently informed by few studies. Three US database studies showed scleritis inci-dence rates of 3.4 per 100,000 person- years (Northern California Epidemiology of Uveitis Study [1998– 1999], 731,895 patients in a Health Maintenance Organization) (5), 4.1 per 100,000 person- years (Pacific Ocular Inflammation Study [2006– 2007], 217,061 Kaiser Permanente enrollees) (6,7), and 1.6 per 100,000 person- years (infectious scleritis only) (Optum private insurance database [2007– 2015], 21.5 million insured patients) (8). Similarly, the Roch-ester Epidemiology Project (2006– 2015, 144,248 population) showed an incidence rate of 5.5 per 100,000 person- years (9). Large retrospective cohort studies from subspecialty practices over the past 4 decades (n values of ≥100 to 825) (Supplemen-tary Table 1, available on the Arthritis & Rheumatology website at http://onlin elibr ary.wiley.com/doi/10.1002/art.41709/ abstract), indicate that scleritis is associated with I- IMIDs in 31.3– 47.8% of cases, preceding IMID diagnosis in 6.6– 38.7% of cases (10,11). Rheumatologic diagnoses are most frequent.
The UK has an aging population, but significant advances in therapeutic options for I- IMIDs, including biologic therapies, may have impacted the population burden of scleritis (12). An NHS pri-mary care electronic patient record database, The Health Improve-ment Network (THIN) (13,14), provides a promising opportunity to
analyze scleritis epidemiology more robustly than has been pos-sible in prior studies. In this study, we estimated the UK incidence rate and prevalence of scleritis between 1997 and 2018 and eval-uated associations with systemic I- IMIDs (1).
PATIENTS AND METHODS
Patient and public involvement. This study was per-formed in direct response to the 2013 Sight Loss and Vision Pri-ority Setting Partnership in the UK, overseen by the James Lind Alliance, an authoritative and independent nonprofit initiative man-aged by the National Institute for Health Research (NIHR) (15). This initiative brought patients, caregivers, and health profes-sionals together to identify and prioritize unanswered questions for research. Within ocular inflammatory disease, “What causes scleritis?” was identified as a priority research question.
Data source, data access, and ethics approvals. We analyzed data from THIN from January 1, 1995 to January 9, 2019. THIN contains longitudinal information on a cohort of 15 million patients from 808 primary care general practices, including patient demographics, diagnoses, drug prescriptions, and laboratory test results. The study was conducted in accordance with the Declara-tion of Helsinki. Use of IQVIA Medical Research Data was approved by the UK Research Ethics Committee (reference no. 18/LO/0441). In accordance with this approval, the study protocol was reviewed and approved by an independent scientific review committee (refer-ence no. 19THIN086). IQVIA Medical Research Data incorporates data from THIN, a Cegedim database. Reference made to THIN is intended to be descriptive of the data asset licensed by IQVIA. This work used de- identified data provided by patients as a part of their routine primary care; individual consent was not obtained.
Study design. We estimated annual scleritis prevalence to be inclusive by performing sequential cross- sectional stud-ies on data collected annually on January 1 of each year from 1997 through 2018. We estimated annual scleritis incidence rates through a series of yearly cohort studies covering the full year of 1997 through the full year of 2018, with the exception that data from 1995, 1996, and 2019 were excluded as incom-plete. Risk factors for scleritis were explored in a cohort analysis (1997– 2018). In addition, we performed a matched case– control and retrospective cohort study using all data collected (January 1, 1995– September 1, 2019) to explore odds ratios (ORs) and
Institute of Applied Health Research, University of Birmingham, Birmingham, UK, and Health Data Research UK, London, UK; 8Alastair K. Denniston, PhD: University Hospitals Birmingham NHS Foundation Trust, Institute of Inflam mation and Ageing University of Birmingham, Birmingham, UK, and NIHR Biomedical Research Centre, Moorfields Eye Hospital NHS Foundation Trust, Institute of Ophthalmology, University College London, and Health Data Research UK, London, UK.
Professors Nirantharakumar and Denniston contributed equally to this work.
Dr. Nirantharakumar has received consulting fees, speaking fees, and/or honoraria from Sanofi, Boehringer Ingelheim, and MSD (less than $10,000 each) and research grants from AstraZeneca, Vifor, and Boehringer Ingelheim. No other disclosures relevant to this article were reported.
Address correspondence to Tasanee Braithwaite, DM, Guy’s and St Thomas’ NHS Foundation Trust, Westminster Bridge Road, London SE1 9RT, UK. Email: [email protected].
Submitted for publication September 24, 2020; accepted in revised form February 24, 2021.

SCLERITIS EPIDEMIOLOGY IN THE UK | 1269
hazard ratios (HRs) for 58 I- IMIDs in patients with scleritis com-pared to controls. We did not explore the strength of associations of scleritis with medications or with scleral injury/foreign body. This study followed the Strengthening the Reporting of Observational Studies in Epidemiology reporting guideline.
Study population. General practices were eligible for inclu-sion 1 year following the start of electronic medical record use and demonstration of acceptable mortality rates (a data quality indica-tor). We included patients age ≥1 year who were registered with a participating general practice for at least 1 year before cohort entry to ensure documentation of important baseline covariates.
In the UK, scleritis and I- IMID are diagnosed by hospital specialists. Diagnoses are communicated to general practition-ers, who enter the clinical Read codes into the electronic medical record. We diagnosed patients as having scleritis (Supplemen-tary Table 2, available on the Arthritis & Rheumatology website at http://onlin elibr ary.wiley.com/doi/10.1002/art.41709/ abstract), and 58 individual I- IMIDs (1), using relevant Read codes.
For the matched case– control and cohort studies, we matched each patient with scleritis (newly diagnosed during study period) with 4 controls, randomly selected from a pool of age- , sex- , region- , and Townsend deprivation index– matched patients without scleritis. The Townsend deprivation index is a measure of material deprivation in the population of a given area, and includes the unemployment rate as well as household noncar ownership, nonhome ownership, and overcrowding (16). Where the Townsend deprivation index was missing, we matched cases with a control in whom the Townsend deprivation index was also missing. We used an established method for randomly select-ing matched controls (17). Matched controls were assigned the same index date (±1 year) as the index (diagnosis) date of patients with scleritis to avoid immortal time bias (18). Patients with scleritis and controls were followed up from the index date until the earliest out- of- outcome event (diagnosis of incident I- IMID, defined using Read codes for each disease), death, patient leaving the general practice, end of database contributions by the general practice, or the end of study.
Statistical analysis. All variables were recorded at cohort entry and were summarized using appropriate descriptive statis-tics, including the mean or median (interquartile range [IQR]) for continuous variables, and frequency (number [%]) for categorical variables. P values less than 0.05 were considered significant. All statistical analyses were performed using Stata IC, version 15.0.
To determine point prevalence (1997– 2018), we calculated the proportion of eligible patients in the data set on January 1 each year who had at any time prior to that date been diagnosed as having scleritis. We estimated crude annual scleritis incidence rates by dividing the number of patients with a new scleritis diag-nosis by the total person- years at risk. Across the entire study period, we estimated overall incidence rates stratified by age, sex, race/ethnicity, body mass index (BMI), smoking status, Townsend deprivation index, and nation within the UK.
To explore scleritis risk factors, we performed univariable and multivariable Poisson regression analyses to estimate crude and adjusted incidence rate ratios (IRRs), accounting for person- years of follow- up. The adjustment variables we considered included age, sex, race/ethnicity, smoking status, BMI at first registration, nation within the UK, and Townsend deprivation index, all as recorded at the index date (14,15). A separate category for missing data was created to avoid censoring when covariate values were missing. We included variables in multivariable models if they showed a trend toward significance, defined as P < 0.10 in univariable analyses.
In patients with incident scleritis occurring between 1995 and 2019, we performed a case– control and matched cohort study to evaluate associations with I- IMIDs. For patients with scleritis compared to matched controls, we calculated the odds of prior diagnosis and hazard of incident diagnosis of each I- IMID inde-pendently. Patients found to have a prior diagnosis of the I- IMID were excluded from the analysis for subsequent incident diagno-sis. We performed logistic regression analysis to obtain crude and adjusted ORs and their corresponding 95% confidence intervals (95% CIs) for each IMID at/prior to baseline, and for all I- IMIDs combined, comparing patients with and those without scleritis. We estimated adjusted hazard ratios (HRs) using Cox propor-tional hazards regression models for incidence of each I- IMID
Figure 1. A, Twenty- two– year trend in incidence of scleritis in the UK. B, Age group– and sex- specific cumulative incidence of scleritis from 1997 to 2018. Detailed data are shown in Supplementary Tables 3 and 4 (http://onlin elibr ary.wiley.com/doi/10.1002/art.41709/ abstract). Incidence rates are shown with the 95% confidence interval (95% CI).

BRAITHWAITE ET AL 1270 |
after scleritis diagnosis. The adjustment variables were the same as those selected for the multivariable Poisson model. We con-firmed model assumptions using log- log plots and the Schoenfeld residuals test. We used the Nelson- Aalen estimator to plot cumu-lative hazard of these outcomes.
RESULTS
The cross- sectional and retrospective cohort studies (January 1, 1997– December 31, 2018) included 10,939,823 patients with 75.2 million person- years of follow- up, of whom 2,946 (0.0039 per
100,000 person- years) (95% CI 0.0037– 0.0041) developed inci-dent scleritis.
Scleritis incidence rates declined from 4.23 per 100,000 person- years (95% CI 2.16– 6.31) to 2.79 per 100,000 person- years (95% CI 2.19– 3.39) between 1997 and 2018 (Figure 1A and Supplementary Table 3, available on the Arthri-tis & Rheumatology website at http://onlin elibr ary.wiley.com/doi/10.1002/art.41709/ abstract). In contrast to the scleritis incidence rate, scleritis prevalence increased from 20.72 per 100,000 person- years (95% CI 14.13– 27.31) in 1997 to 93.62 per 100,000 person- years (95% CI 90.17– 97.07) in 2018
Table 1. Comparison of the UK population with incident scleritis (n = 2,946) and those without incident scleritis (n = 10,936,877)*
Characteristic at baseline
No scleritis, no. (%)
Scleritis, no. (%)
Single variable IRR (95% CI) P
Adjusted IRR (95% CI) P
Male 5,365,369 (49.1) 1,115 (37.9) 1 (referent) – 1 (referent) – Female 5,571,508 (50.9) 1,831 (62.2) 1.63 (1.52– 1.76) <0.001 1.53 (1.42– 1.66) <0.001Age group at cohort
entry1– 10 years 2,070,295 (18.9) 126 (4.3) 1 (referent) – 1 (referent) – 11– 20 years 1,081,516 (9.9) 115 (3.9) 1.77 (1.38– 2.29) <0.001 1.62 (1.25– 2.09) <0.00121– 30 years 1,985,113 (18.2) 332 (11.3) 3.53 (2.88– 4.34) <0.001 2.56 (2.04– 3.20) <0.00131– 40 years 1,815,638 (16.6) 614 (20.8) 5.17 (4.27– 6.26) <0.001 3.73 (3.01– 4.61) <0.00141– 50 years 1,325,429 (12.1) 607 (20.6) 5.96 (4.92– 7.22) <0.001 4.34 (3.50– 5.37) <0.00151– 60 years 1,045,415 (9.6) 579 (19.7) 6.91 (5.70– 8.38) <0.001 4.95 (3.99– 6.14) <0.00161– 70 years 765, 070 (7.0) 350 (11.9) 5.95 (4.85– 7.29) <0.001 4.17 (3.33– 5.23) <0.00171– 80 years 526,347 (4.8) 183 (6.21) 5.47 (4.36– 6.86) <0.001 3.82 (2.98– 4.88) <0.00181– 90 years 270,652 (2.5) 36 (1.2) 3.48 (2.40– 5.04) <0.001 2.44 (1.67– 3.57) <0.00191– 100 years 50,658 (0.5) 4 (0.14) 3.73 (1.38– 10.10) 0.010 2.68 (0.99– 7.29) 0.053100+ years 744 (0.01) 0 – – – –
NationEngland 7,792,462 (71.3) 2,098 (71.2) 1 (referent) – 1 (referent) – Scotland 1,538,768 (14.1) 352 (12.0) 0.88 (0.78– 0.98) – 0.85 (0.76– 0.95) 0.005Wales 1,203,070 (11.0) 365 (12.4) 1.09 (0.97– 1.21) – 1.14 (1.02– 1.28) 0.026Northern Ireland 402,577 (3.7) 131 (4.5) 0.89 (0.74– 1.06) – 1.02 (0.85– 1.22) 0.854
TDI1 (least deprived) 1,985,030 (18.2) 624 (21.2) 1 (referent) – 1 (referent) – 2 1,807,692 (16.5) 534 (18.1) 0.99 (0.88– 1.11) 0.876 1.00 (0.89– 1.12) 0.9503 1,910,916 (17.5) 549 (18.6) 1.04 (0.93– 1.16) 0.528 1.08 (0.96– 1.21) 0.2194 1,783,513 (16.3) 499 (16.9) 1.08 (0.96– 1.22) 0.184 1.15 (1.02– 1.30) 0.0195 (most deprived) 1,314,506 (12.0) 307 (10.4) 0.93 (0.81– 1.07) 0.307 1.03 (0.90– 1.19) 0.644Missing 2,135,220 (19.5) 433 (14.7) 0.92 (0.81– 1.03) 0.158 0.93 (0.82– 1.05) 0.258
Race/ethnicityWhite 4,263,911 (39.0) 1,257 (24.7) 1 (referent) – 1 (referent) – Black 177,868 (1.6) 51 (1.7) 1.39 (1.05– 1.84) 0.020 1.52 (1.14– 2.01) 0.004Mixed 131,309 (1.2) 25 (0.9) 1.15 (0.77– 1.71) 0.494 1.20 (0.81– 1.79) 0.360Other 70,389 (0.6) 4 (0.1) 0.31 (0.11– 0.82) 0.018 0.43 (0.16– 1.14) 0.088South Asian 262,288 (2.4) 78 (2.7) 1.32 (1.05– 1.66) 0.018 1.50 (1.19– 1.90) <0.001Missing 6,031,112 (55.1) 1,531 (52.0) 0.82 (0.77– 0.89) <0.001 0.91 (0.84– 0.98) 0.014
BMI, kg/m2
Underweight (<18.5) 182,197 (1.7) 46 (1.6) 0.93 (0.69– 1.25) 0.634 1.02 (0.76– 1.38) 0.875Normal (18.5– 24.9) 2,796,771 (25.6) 931 (31.6) 1 (referent) – 1 (referent) – Overweight (25– 29.9) 1,918,346 (17.5) 733 (24.9) 1.06 (0.96– 1.17) 0.244 1.04 (0.94– 1.15) 0.436Obese (>30) 1,089,299 (10.0) 476 (16.2) 1.26 (1.13– 1.41) <0.001 1.16 (1.04– 1.30) 0.008Missing 4,950,264 (45.3) 760 (25.8) 0.43 (0.39– 0.48) <0.001 0.81 (0.71– 0.91) <0.001
Smoking statusNever smoker 4,230,414 (38.7) 1,436 (48.7) 1 (referent) – 1 (referent) – Ex- smoker 1,159,235 (10.6) 386 (13.1) 1.03 (0.92– 1.16) 0.576 1.00 (0.89– 1.12) 0.938Current smoker 1,853,047 (16.9) 598 (20.3) 0.95 (0.86– 1.04) 0.266 0.98 (0.89– 1.08) 0.663Missing 3,694,181 (33.8) 526 (17.9) 0.37 (0.34– 0.41) < 0.001 0.86 (0.75– 0.99) 0.036
* IRR = incidence rate ratio; 95% CI = 95% confidence interval; TDI = Townsend deprivation index; BMI = body mass index.

SCLERITIS EPIDEMIOLOGY IN THE UK | 1271
(Supplementary Figure 1 and Supplementary Table 3, http://onlin elibr ary.wiley.com/doi/10.1002/art.41709/ abstract). This reflects evolving THIN database maturity over time, with the database more closely approaching a steady state of patients being added compared to patients being removed in more recent years. There were an estimated 61,650 patients with scleritis (95% CI 59,380– 63,919) in the UK in 2018.
Characteristics of the 2,946 incident scleritis cases and 10.9 million patients in the THIN population without scleritis are compared in Table 1. Briefly, among patients with incident scleritis, 1,831 (62.2%) were female, with a mean ± SD age at cohort entry of 44.9 ± 17.6 years (range 1– 93), and 2,098 (71.2%) resided in Eng-land. Excluding patients with missing data for each variable, 1,257 patients in the THIN population (88.8%) were White, the median BMI was 25.6 kg/m2 (IQR 17.3– 44.6), 984 (40.7%) were smokers or ex- smokers, and 624 (24.8%) were from Townsend deprivation
index category 1 (least deprived). From 1997 through 2018, more women than men developed incident scleritis, with peak onset occurring at age 50– 59 years in women, compared to age 70– 79 years in men (Figure 1B). Incidence rates for other variable sub-groups are presented in Table 2, and the data for women and men separately by age group are shown in Supplementary Table 4 (http://onlin e libr ary.wiley.com/doi/10.1002/art.41709/ abstract).
In a multivariable Poisson regression model, significant pre-dictors of incident scleritis included female sex (adjusted IRR 1.53 [95% CI 1.42– 1.66], P < 0.001), Black race/ethnicity (adjusted IRR 1.52 [95% CI 1.14– 2.01], P = 0.004 compared to White race/ethnicity), or South Asian race/ethnicity (adjusted IRR 1.50 [95% CI 1.19– 1.90], P < 0.001 compared to White race/ethnicity), and obesity (BMI >30.0 kg/m2) (adjusted IRR 1.16 [95% CI 1.04– 1.30], P = 0.008 compared to normal weight [BMI 18.4– 24.9 kg/m2]). The adjusted IRR for incident scleritis also increased with age, peaking at an adjusted IRR of 4.95 ([95% CI 3.99– 6.14], P < 0.001) in those ages 51– 60 years compared to those ages 1– 10 years. Compared to English residents, Scottish residents were at significantly lower risk of incident scleritis (adjusted IRR 0.85 [95% CI 0.76– 0.95], P = 0.005), whereas Welsh residents were at higher risk (adjusted IRR 1.14 [1.02– 1.28], P = 0.026). There were no significant associ-ations with Townsend deprivation index or smoking status.
Between January 1, 1995 and January 9, 2019, 3,005 patients with incident scleritis and 12,020 randomly matched controls without scleritis were included for the matched cohort studies. For 12 I- IMIDs, there were no data; these were therefore excluded from the analysis.
Patients with scleritis were 2 times more likely than controls to have a prior diagnosis of any I- IMID (853 of 3,005 [28.4%] versus 1,923 of 12,020 [16.0%]) (adjusted OR 2.01 [95% CI 1.83– 2.22], P < 0.001). In a series of univariable analyses followed by adjusted logistic regression analyses, we identified significantly greater odds of a prior diagnosis of 17 individual I- IMIDs in patients with scleritis compared to controls (Table 3 and Figure 2): granulomatosis with polyangiitis (GPA) (OR 50.7, P < 0.001), Behçet’s disease (BD) (OR 9.1, P = 0.014), Sjögren’s syndrome (SS) (OR 7.1, P < 0.001), reactive arthritis (OR 7.0, P = 0.002), RA (OR 5.7, P < 0.001), other vasculitis (OR 5.4, P < 0.001), giant cell arteritis (GCA) (OR 3.8, P = 0.001), Crohn’s disease (OR 3.6, P < 0.001), systemic lupus erythematosus (SLE) (OR 3.5, P < 0.001), ankylosing spon-dylitis (AS) (OR 3.4, P < 0.001), sarcoidosis (OR 2.6, P < 0.001), polymyalgia rheumatica (OR 2.3, P < 0.001), ulcerative colitis (OR 2.2, P < 0.001), herpesvirus infections (simplex and zoster) (OR 1.6, P < 0.001), Epstein-Barr virus (EBV) infection (OR 1.5, P = 0.014), measles (OR 1.5, P = 0.047), and psoriasis (OR 1.3, P = 0.004). Patients with scleritis were also significantly more likely than controls to have previously had uveitis (OR 17.3, P < 0.001) or optic neuritis (OR 2.7, P = 0.023).
After exclusion of those with prevalent I- IMID at baseline, the proportion of patients with scleritis who developed incident I- IMIDs was 8.8% (190 of 2,152, over a median follow- up of 5.8 years
Table 2. Cumulative incidence rate of scleritis, stratified by key variables*
Characteristic at baseline
Incidence rate per 100,000 person- years
(95% CI)Male 2.98 (2.80– 3.15)Female 4.85 (4.64– 5.08)Age group at cohort entry
1– 18 years 0.88 (0.74– 1.04)18+ years 4.63 (4.47– 4.81)
NationEngland 3.97 (3.80– 4.14)Scotland 3.48 (3.14– 3.87)Wales 4.30 (3.88– 4.77)Northern Ireland 3.52 (2.97– 4.18)
TDI1 (least deprived) 3.93 (3.63– 4.25)2 3.89 (3.58– 4.24)3 4.08 (3.75– 4.43)4 4.26 (3.90– 4.65)5 (most deprived) 3.66 (3.27– 4.09)Missing 3.60 (3.27– 3.95)
Race/ethnicityBlack 6.01 (4.57– 7.91)White 4.31 (4.08– 4.56)Mixed 4.95 (3.34– 7.33)Other 1.32 (0.50– 3.52)South Asian 5.69 (4.56– 7.10)Missing 3.56 (3.38– 3.74)
BMI, kg/m2
Underweight (<18.5) 5.36 (4.98– 5.76)Normal (18.5– 24.9) 5.06 (4.74– 5.39)Overweight (25– 29.9) 5.36 (4.98– 5.76)Obese (30– 34.9) 6.36 (5.71– 7.10)Morbidly obese (>35) 6.46 (5.51– 7.57)Missing 2.19 (2.04– 2.35)
Smoking statusNever smoker 5.13 (4.86– 5.39)Ex- smoker 5.29 (4.79– 5.84)Current smoker 4.85 (4.48– 5.26)Missing 1.91 (1.75– 2.08)
* 95% CI = 95% confidence interval; TDI = Townsend deprivation index; BMI = body mass index.

BRAITHWAITE ET AL 1272 |
Table 3. Comparison of 3,005 patients with scleritis and 12,020 matched controls, exploring association with 58 infectious or noninfectious IMIDs, highlighting the adjusted odds of baseline (prior) diagnosis of an IMID and adjusted hazard of incident diagnosis of an IMID during follow- up, with the latter excluding baseline diagnoses of the outcome*
Case– control analysis Retrospective matched cohort analysis§
Diagnosed comorbidities at baseline/during follow- up†
Cases, no. (%)
Controls, no. (%)
Adjusted OR (95% CI)‡ P
Cases, no. (%)
Controls, no. (%)
Adjusted IRR (95% CI)‡ P
Clinical phenotypeOptic neuritis 9 (0.30) 14 (0.12) 2.71 (1.15– 6.38) 0.023 5 (0.17) 0 Not estimable – Uveitis 294 (9.78) 73 (0.61) 17.3 (13.29– 22.60) <0.001 92 (3.39) 32 (0.27) 20.08 (14.02– 28.76) <0.001
IMID associations, noninfectiousAnkylosing spondylitis 18 (0.60) 22 (0.18) 3.39 (1.78– 6.42) <0.001 4 (0.13) 2 (0.02) 3.44 (1.21– 9.76) 0.020Behçet’s disease 4 (0.13) 2 (0.02) 9.09 (1.57– 52.53) 0.014 3 (0.10) 0 17.45 (1.94– 156.74) 0.011Celiac disease 16 (0.53) 36 (0.30) 1.62 (0.89– 2.95) 0.118 4 (0.13) 14 (0.12) 1.07 (0.43– 2.69) 0.883Cogan’s syndrome 1 (0.03) 0 Not estimable – 0 0 Not estimable – CREST syndrome 1 (0.03) 0 Not estimable – 0 1 (0.01) Not estimable – Crohn’s disease 38 (1.26) 43 (0.36) 3.60 (2.28– 5.67) <0.001 7 (0.24) 10 (0.08) 4.16 (2.90– 7.58) <0.001Dermatomyositis or polymyositis 2 (0.07) 1 (0.01) 5.44 (0.43– 68.09) 0.189 0 1 (0.01) 5.38 (0.33– 88.57) 0.239Giant cell arteritis 14 (0.47) 13 (0.11) 3.83 (1.74– 8.44) 0.001 7 (0.23) 14 (0.12) 2.36 (1.03– 5.44) 0.043Gout 95 (3.16) 300 (2.50) 1.20 (0.94– 1.54) 0.152 52 (1.79) 181 (1.54) 0.96 (0.73– 1.24) 0.737Granulomatosis with polyangiitis 28 (0.93) 2 (0.02) 50.66 (11.94– 214.93) <0.001 17 (0.57) 0 96.36 (12.99– 715.00) <0.001IgA nephropathy 2 (0.07) 0 Not estimable – 4 (0.13) 0 Not estimable – Juvenile idiopathic arthritis 5 (0.17) 0 Not estimable – 0 0 Not estimable – Lymphoma 8 (0.27) 13 (0.11) 2.40 (0.97– 5.97) 0.059 4 (0.13) 0 Not estimable – Multiple sclerosis 11 (0.37) 34 (0.28) 1.29 (0.64– 2.58) 0.473 0 13 (0.11) 1.12 (0.41– 3.08) 0.825Polyarteritis nodosa 3 (0.10) 0 Not estimable – 1 (0.03) 0 Not estimable – Polymyalgia rheumatica 45 (1.50) 78 (0.65) 2.31 (1.57– 3.40) <0.001 15 (0.51) 72 (0.60) 1.11 (0.70– 1.75) 0.670Porphyria 0 2 (0.02) Not estimable – 0 1 (0.01) Not estimable – Psoriasis 147 (4.89) 420 (3.49) 1.34 (1.10– 1.63) 0.004 39 (1.36) 116 (1.00) 1.22 (0.92– 1.60) 0.163Reactive arthritis 7 (0.23) 4 (0.03) 6.96 (1.99– 24.36) 0.002 0 0 Not estimable – Relapsing polychondritis 5 (0.17) 0 Not estimable – 2 (0.07) 0 Not estimable – Rheumatoid arthritis 150 (4.99) 114 (0.95) 5.70 (4.40– 7.39) <0.001 40 (1.40) 67 (0.56) 4.22 (3.32– 5.39) <0.001Sarcoidosis 25 (0.83) 35 (0.29) 2.61 (1.53– 4.46) <0.001 3 (0.10) 7 (0.06) 3.09 (1.15– 8.27) 0.025Sjögren’s syndrome 22 (0.73) 13 (0.11) 7.14 (3.50– 14.57) <0.001 9 (0.30) 7 (0.06) 8.53 (3.35– 21.67) <0.001Systemic lupus erythematosus 20 (0.67) 26 (0.22) 3.47 (1.90– 6.33) <0.001 10 (0.34) 5 (0.04) 8.49 (3.35– 21.74) <0.001Stevens- Johnson syndrome 0 2 (0.02) Not estimable – 0 0 Not estimable – Sweet syndrome 1 (0.03) 2 (0.02) 1.36 (0.12– 15.50) 0.803 0 0 Not estimable – Systemic sclerosis 0 1 (0.01) Not estimable – 0 0 Not estimable – Thyroid disease, autoimmune 14 (0.47) 42 (0.35) 1.11 (0.60– 2.06) 0.783 4 (0.13) 18 (0.15) 1.16 (0.45– 2.94) 0.761Ulcerative colitis 43 (1.43) 68 (0.57) 2.20 (1.49– 3.27) <0.001 1 (0.03) 25 (0.21) 1.77 (0.99– 3.16) 0.054Vasculitis, other 26 (0.87) 17 (0.14) 5.37 (2.87– 10.05) <0.001 14 (0.47) 12 (0.10) 6.68 (3.22– 13.86) <0.001Vitiligo 12 (0.40) 44 (0.37) 1.04 (0.54– 2.00) 0.901 6 (0.20) 16 (0.13) 1.33 (0.55– 3.22) 0.524Vogt- Harada syndrome 0 0 Not estimable – 1 (0.03) 0 Not estimable – Waldenstrom’s macroglobulinemia 0 2 (0.02) Not estimable – 1 (0.03) 4 (0.03) 0.69 (0.08– 6.35) 0.747
IMID associations, infectiousAspergillosis 2 (0.07) 3 (0.02) 2.56 (0.37– 17.62) 0.340 1 (0.03) 3 (0.02) 1.72 (0.17– 17.46) 0.648Brucellosis 1 (0.03) 0 Not estimable – 0 0 Not estimable – Cytomegalovirus infection 1 (0.03) 0 Not estimable – 0 1 (0.01) Not estimable – Epstein- Barr virus 53 (1.76) 144 (1.20) 1.50 (1.09– 2.08) 0.014 1 (0.03) 4 (0.03) 0.72 (0.08– 6.68) 0.772Herpes simplex or zoster virus 171 (5.69) 417 (3.47) 1.61 (1.34– 1.94) <0.001 49 (1.73) 158 (1.36) 1.53 (1.16– 2.02) 0.003HIV 0 8 (0.07) Not estimable – 0 1 (0.01) Not estimable – Lyme disease 2 (0.07) 2 (0.02) 4.12 (0.56– 30.33) 0.164 4 (0.13) 2 (0.02) 8.41 (1.43– 49.39) 0.018Measles 33 (1.10) 95 (0.79) 1.51 (1.00– 2.27) 0.047 0 0 Not estimable – Mumps 0 0 Not estimable – 3 (0.10) 2 (0.02) 11.11 (1.05– 117.16) 0.045Syphilis 2 (0.07) 12 (0.10) 0.63 (0.14– 2.88) 0.551 0 0 Not estimable – Tuberculosis 24 (0.80) 67 (0.56) 1.35 (0.83– 2.19) 0.223 4 (0.13) 4 (0.03) 3.37 (0.82– 13.78) 0.091Toxocariasis 0 1 (0.01) Not estimable – 0 0 Not estimable – Toxoplasmosis 2 (0.07) 2 (0.02) 3.76 (0.45– 31.49) 0.223 0 0 Not estimable –
* IMIDs = immune mediated inflammatory diseases; OR = odds ratio; 95% CI = 95% confidence interval; IRR = incidence rate ratio; CREST syndrome = calcinosis, Raynaud’s phenomenon, esophageal dysmotility, sclerodactyly, telangiectasias. † Diseases for which Read codes were available in The Health Improvement Network (THIN) but no data were available for patients with scleritis or controls (and thus were excluded from analysis) were as follows: Churg Strauss syndrome, acanthamoeba, chikungunya virus, dengue, familial Mediterranean fever, graft versus host disease, Kawasaki disease, microscopic polyangiitis, Takayasu arteritis, West Nile virus, Yaws, and Zika virus. Diseases for which no Read codes were recorded in the THIN data set were as follows: Blau syndrome, Bartonella or cat scratch disease, human herpes 6 virus, and human coronavirus. There was also no specific Read code for classic or perinuclear antineutrophil cytoplasmic antibody positivity, but these were likely captured under a combination of Read codes, grouped here as “vasculitis, other.” ‡ All models were adjusted for sex, age category, race/ethnicity, body mass index, smoking status, nation within the UK, and Townsend deprivation index. § Data were missing for some parameters.

SCLERITIS EPIDEMIOLOGY IN THE UK | 1273
[IQR 2.6– 9.8]), compared to 6.1% of controls (619 of 10,097, over a median follow- up of 5.5 years [IQR 2.4– 9.6]). We compared the hazard of diagnosis of each individual I- IMID in scleritis cases and matched controls in a series of adjusted Cox proportional haz-ard regression analyses (Table 3, Figures 2 and 3, and Supplemen-tary Figure 2, available on the Arthritis & Rheumatology website at http://onlin elibr ary.wiley.com/doi/10.1002/art.41709/ abstract). Patients with scleritis were significantly more likely to develop any of 13 incident I- IMIDs: GPA (HR 96.4, P < 0.001), BD (HR 17.5, P = 0.011), mumps (HR 11.1, P = 0.045), SS (HR 8.5, P < 0.001), SLE (HR 8.5, P < 0.001), Lyme disease (HR 8.4, P = 0.018), other vasculitis (OR 6.7, P < 0.001), RA (HR 4.2, P < 0.001), Crohn’s disease (HR 4.2, P < 0.001), AS (HR 3.4, P = 0.020), sarcoidosis (HR 3.1, P = 0.025), GCA (HR 2.4, P = 0.043), and herpesvi-rus infection (HR 1.5, P = 0.003). Patients with scleritis were also 20 times more likely than controls to develop incident uveitis (HR 20.1, P < 0.001).
DISCUSSION
This large, population- representative national study of the epidemiology of scleritis in the UK provides needed prevalence and incidence estimates, and offers insights into the presence and strength of associations with systemic I- IMIDs. The UK incidence of new cases appears to have decreased by approximately one- third over the past 22 years to 2.8 per 100,000 person- years. This trend likely reflects improvements in the management of systemic I- IMIDs. Over this period, there has been increasing availability of antimicrobial therapies and immunosuppressive therapies, including biologics (19). While more variable, the UK incidence of
RA also decreased between 1997 and 2014 from 45.4 to 38.1 per 100,000 person- years (20). Our study findings were consist-ent with incidence rate estimates from US database studies in Northern California (1998– 1999, 3.4 per 100,000 person- years) (5) and Hawaii (2006– 2007, 4.1 per 100,000 person- years) (6). In the present study, the estimated incidence rates in those years were 4.7 per 100,000 person- years and 4.2 per 100,000 person- years, respectively. The apparent rise in prevalence of ever hav-ing had a diagnosis of scleritis likely reflects increasing maturity of the THIN database as explained below. A similar pattern for optic neuritis has been observed in this database (4), and the latest prevalence estimate of 93.6 per 100,000 in 2018 reflects the most reliable data.
Common to previous scleritis epidemiology studies in the US (5– 8), we observed higher risk of incident scleritis among women. Factors contributing to well- established sex differences in immune- mediated diseases are complex and multiple, with genetic, hormonal, and environmental contributions (21,22). We observed peak scleritis onset in women ages 50– 59 years and men ages 70– 79 years. This broadly aligns with other scleritis database studies (6) and with other autoimmune conditions, and in particular, those associated with chronic, fibrotic Th2- mediated pathology (22). Black and South Asian people in the UK were 1.5 times more likely to develop incident scleritis than White people. Black race/ethnicity has previously been identified as a significant risk factor for both incident scleritis (6) and other I- IMIDs, including sarcoidosis (23) and SLE (24). Obesity at cohort entry (BMI >30 kg/m2) was also significantly associated with higher scleritis inci-dence (adjusted IRR 1.2, P = 0.008). A growing body of evidence links obesity, with its chronic state of low- grade inflammation and
Figure 2. Forest plots showing the adjusted odds ratio of a prevalent diagnosis of an infectious or noninfectious immune- mediated inflammatory disease (I- IMID) at baseline and the adjusted hazard ratio of an incident diagnosis of an I- IMID during follow- up, comparing 3,005 patients with scleritis and 12,020 controls. Detailed data are shown in Table 3. 95% CI = 95% confidence interval.

BRAITHWAITE ET AL 1274 |
the pleiotropic effects of adipokines on the immune system, to risk and severity of rheumatic conditions (25). The regional variation observed across the UK, with significantly higher risk in Wales and significantly lower risk in Scotland, was interesting, but challenging to explain. It perhaps relates to as- yet unidentified environmental differences.
To our knowledge, this is the first population- representative study to systematically explore the strength of associations between scleritis and I- IMIDs of potential relevance (1). While the present results do not imply direct causation, we found that 28.4% of patients with scleritis had an associated I- IMID prior to scleritis diagnosis, and 8.8% developed an I- IMID during subse-quent follow- up. These proportions were only slightly lower than those indicated in scleritis cohort studies (see Supplementary Table 1, available on the Arthritis & Rheumatology website at http://onlin elibr ary.wiley.com/doi/10.1002/art.41709/ abstract). A likely explanation is that patients with milder scleritis, who may be well captured in this primary care records database, are less likely to have associated systemic disease or to be referred to tertiary centers for management.
We found autoimmune and autoinflammatory disease to be more frequently associated with scleritis than infectious disease in the UK. We identified significant infectious disease associations preceding or subsequent to a scleritis diagnosis, including herpesvirus infection (OR 1.6, P < 0.001; HR 1.5, P = 0.003), EBV infection (OR 1.5, P = 0.014), and Lyme disease (HR 8.4, P = 0.018), with mumps (HR 11.1, P = 0.045) and mea-sles (OR 1.5, P = 0.047) also just reaching significance. We iden-tified significant associations with 19 I- IMIDs, with the strongest associations observed with both preexisting and subsequent diagnoses of GPA (OR 50.7 and HR 96.4, P < 0.001 for both), BD (OR 9.1, P = 0.014; HR 17.5, P = 0.011), SS (OR 7.1 and HR 8.5, P < 0.001 for both), RA (OR 5.7 and HR 4.2, P < 0.001 for both), other vasculitis (OR 5.4 and HR 6.7, P < 0.001 for both), Crohn’s disease (OR 3.6 and HR 4.2, P < 0.001 for both), SLE (OR 3.5 and HR 8.5, P < 0.001 for both), GCA (OR 3.8, P = 0.001; HR 2.4, P = 0.043), AS (OR 3.4, P < 0.001; HR 3.4, P = 0.020), and sarcoidosis (OR 2.6, P < 0.001; HR 3.1, P = 0.025). Epidemiologic research in different world regions reveals different patterns (Supplementary Table 1, available on
Figure 3. Nelson- Aalen cumulative hazard function comparing scleritis cases and matched controls during the 15- year cumulative follow- up of patients with granulomatosis with polyangiitis (A), Behçet’s disease (B), Sjögren’s syndrome (C), or rheumatoid arthritis (D). Using rheumatoid arthritis as an example, the data presented in the figure show that at 5 years of follow- up, an estimated 3.86% of patients with scleritis had been diagnosed as having rheumatoid arthritis (116 of 3,005), compared to 0.79% of those without scleritis (95 of 12,020). Note the variable scales on the y-axes. 95% CI = 95% confidence interval.

SCLERITIS EPIDEMIOLOGY IN THE UK | 1275
the Arthritis & Rheumatology website at http://onlin elibr ary.wiley. com/doi/10.1002/art.41709/ abstract), with more infectious causes in India, for example (26). The systemic associations highlight the potential value of cross- specialty multidisciplinary care to detect preclinical or early disease and optimize management (27).
There are currently no licensed biologic therapies for scleri-tis in the UK, despite off- label use of numerous agents reported to be effective in I- IMID– associated scleritis, including infliximab (12). More widespread use of licensed treatments for I- IMIDs— including RA, inflammatory bowel disease, AS, GPA, and psoriasis— with anti– tumor necrosis factor agents and rituximab (anti- CD20) has likely contributed to declining incidence of scleri-tis in the UK. Future benefit may be observed with increasing use of anti– interleukin- 6 (anti– IL- 6) and anti– IL- 1 agents, small- molecule JAK inhibitors, and as-yet undeveloped new treatments. This study confirms that the rarity of scleritis offers challenges for randomized controlled trials, and for identification of scleritis as a secondary outcome measure in rheumatic disease clinical trials. A more pragmatic, resource- efficient Bayesian adaptive clinical trial design, embedded within routine healthcare, may offer a solu-tion and has been recently explored in juvenile idiopathic arthritis– associated uveitis (28).
Strengths of this study include its very large sample size, per-mitting the evaluation of associations between scleritis and uncom-mon I- IMIDs, and time trends over a 22- year period. In addition, THIN is reliably generalizable to the UK population (13,14).
The limitations of this study include insufficient power to iden-tify associations between scleritis and rare I- IMIDs (e.g., relapsing polychondritis), and the possibility that some weakly statistically significant associations were spurious. Read codes did not per-mit accurate differentiation of scleritis subtypes (Supplementary Table 1, http://onlin elibr ary.wiley.com/doi/10.1002/art.41709/ abstract), which include anterior or posterior scleritis, and diffuse, nodular, or necrotizing scleritis (including scleromalacia perforans). We included “F4K0.00 scleritis and episcleritis” (164 patients), but excluded “F4K0z00 scleritis or episcleritis not otherwise specified” to limit the risk of including patients with isolated episcleritis. Nev-ertheless, this may have led to an overestimate of the prevalence of scleritis and an underestimate of the association of scleritis with I- IMIDs, given that episcleritis is least strongly associated with sys-temic diseases. Read codes also did not permit the differentiation of all subtypes of the associated I- IMIDs of interest (e.g., primary versus secondary SS). In addition, within the prevalent cases, we were unable to differentiate patients who had a single episode of scleritis (versus relapsing and remitting), compared to patients with chronically active scleritis. Furthermore, individual cases or controls may have had >1 I- IMID or infection of interest, and this study did not explore these associations or temporal relationships.
A final limitation is that retrospective estimates from this data-base of routinely collected data have potential risks of bias. There is a risk of diagnostic error in the hospital or incorrect coding resulting in misclassification bias, and a risk of data entry error or missing data
arising from incomplete investigation or data entry omissions. We were unable to review medical records to validate the assigned Read codes. However, the close accordance between the scleritis inci-dence rate we observed and the rates observed in other large data-bases and epidemiologic surveys in the US was reassuring (5– 9).
The trend toward declining incidence of scleritis, with rising prevalence, indicates evolving database maturity. Reasons for this include more adults newly making an appointment to be seen by a general practitioner at onset or recurrence of scleritis, or patients newly volunteering their medical history of previous scleritis. Over time, electronic data capture is improving as systems become more familiar, easier, and faster to use. As more patients are added at birth and followed up during their life span, with resulting stabiliza-tion of the database age structure, increasing confidence can be placed in the estimates of prevalence and age at onset. With higher scleritis incidence in older age groups, we anticipate some increase in prevalence over time, if population aging continues.
Future research is needed to establish the population- based incidence of scleritis in relation to temporal trends in incidence of different I- IMIDs (29), and to identify effective treatments. We rec-ommend that scleritis and episcleritis not be combined in future epidemiologic studies, given the important differences between them (30). Compared to episcleritis, scleritis can be rapidly and directly sight- threatening, is usually more painful, has greater need for treatment with systemic therapy, takes longer to resolve, and is associated with developing severe ocular sequelae (11,31).
This study highlights how the use of routinely collected, large- scale data offers unprecedented opportunity to advance understanding of the epidemiology of rare conditions and their associations. We identified declining scleritis burden in the UK over 22 years, and multiple significant associations with I- IMIDs which precede or follow a scleritis diagnosis, providing guidance for health policy and clinical management. Most strongly associ-ated were GPA, BD, SS, RA, SLE, Crohn’s disease, and sarcoido-sis. The interplay between ophthalmologically managed scleritis and I- IMIDs managed by rheumatologists and other specialists highlights the need for multispecialty care pathways for patients with this disease that can potentially result in blindness.
AUTHOR CONTRIBUTIONS
All authors were involved in drafting the article or revising it critically for important intellectual content, and all authors approved the final version to be published. Dr. Braithwaite had full access to all of the data in the study and takes responsibility for the integrity of the data and the accuracy of the data analysis.Study conception and design. Braithwaite, Adderley, Galloway, Kempen, Gokhale, Nirantharakumar, Denniston.Acquisition of data. Braithwaite, Subramanian, Nirantharakumar.Analysis and interpretation of data. Braithwaite, Adderley, Subramanian, Galloway, Kempen, Cope, Dick, Nirantharakumar, Denniston.
REFERENCES 1. Pavesio CE, Meier FM. Systemic disorders associated with episcleri-
tis and scleritis [review]. Curr Opin Ophthalmol 2001;12:471– 8.

BRAITHWAITE ET AL 1276 |
2. Erhardt CC, Mumford PA, Venables PJ, Maini RN. Factors predicting a poor life prognosis in rheumatoid arthritis: an eight year prospec-tive study. Ann Rheum Dis 1989;48:7– 13.
3. Foster CS, Forstot SL, Wilson LA. Mortality rate in rheumatoid arthri-tis patients developing necrotizing scleritis or peripheral ulcerativekeratitis: effects of systemic immunosuppression. Ophthalmology1984;91:1253– 63.
4. Braithwaite TS, Petzold A, Galloway J, Adderley N, MollanS, Plant G, et al. Epidemiology of optic neuritis in the UnitedKingdom. JAMA Neurol 2020;77:1514– 23. doi:10.1001/jaman-eurol. 2020.3502.
5. Honik G, Wong IG, Gritz DC. Incidence and prevalence of episcleritis and scleritis in Northern California. Cornea 2013;32:1562– 6.
6. Homayounfar G, Nardone N, Borkar DS, Tham VM, Porco TC,Enanoria WT, et al. Incidence of scleritis and episcleritis: resultsfrom the Pacific Ocular Inflammation Study. Am J Ophthalmol2013;156:752– 8.
7. Homayounfar G, Borkar DS, Tham VM, Nardone N, Acharya NR.Clinical characteristics of scleritis and episcleritis: results from thepacific ocular inflammation study [letter]. Ocul Immunol Inflamm2014;22:403– 4.
8. Zhang Y, Amin S, Lung KI, Seabury S, Rao N, Toy BC. Incidence,prevalence, and risk factors of infectious uveitis and scleri-tis in the United States: a claims- based analysis. PloS One2020;15:e0237995.
9. Xu TT, Reynolds MM, Hodge DO, Smith WM. Epidemiology andclinical characteristics of episcleritis and scleritis in Olmsted County,Minnesota. Am J Ophthalmol 2020;217:317– 24.
10. Abd El Latif E, Seleet MM, El Hennawi H, Rashed MA, ElbarbaryH, Sabry K, et al. Pattern of scleritis in an Egyptian cohort. OculImmunol Inflamm 2019;27:890– 6.
11. Sainz de la Maza M, Molina N, Gonzalez- Gonzalez LA, DoctorPP, Tauber J, Foster CS. Clinical characteristics of a large cohortof patients with scleritis and episcleritis. Ophthalmology 2012;119:43– 50.
12. Beardsley RM, Suhler EB, Rosenbaum JT, Lin P. Pharmacotherapyof scleritis: current paradigms and future directions [review]. ExpertOpin Pharmacother 2013;14:411– 24.
13. Hall GC. Validation of death and suicide recording on the THIN UK pri-mary care database. Pharmacoepidemiol Drug Saf 2009;18:120– 31.
14. Seminara NM, Abuabara K, Shin DB, Langan SM, Kimmel SE,Margolis D, et al. Validity of The Health Improvement Network (THIN)for the study of psoriasis. Br J Dermatol 2011;164:602– 9.
15. The College of Optometrists. Sight loss and vision priority setting part-nership: setting priorities for eye research– final report. October 2013.URL: https://www.colle ge- optom etris ts.org/uploa ds/asset s/ d1cf4 b7d- 8131- 47fa- a820b 173ff a42de 8/Sight - Loss- and- Visio n- Prior ity- Setti ng- Partn ershi p- Full- Report.pdf
16. ReStore National Centre for Research Methods. Townsend depri-vation index. URL: http://www.resto re.ac.uk/geo- refer/ 36229 dtuks 00y19 810000.php
17. Adderley NJ, Subramanian A, Nirantharakumar K, Yiangou A,Gokhale KM, Mollan SP, et al. Association between idiopathic intrac-ranial hypertension and risk of cardiovascular diseases in women inthe United Kingdom. JAMA Neurol 2019;76:1088– 98.
18. Levesque LE, Hanley JA, Kezouh A, Suissa S. Problem of immortaltime bias in cohort studies: example using statins for preventing pro-gression of diabetes. BMJ 2010;340:b5087.
19. Nikiphorou E, Carpenter L, Morris S, MacGregor AJ, Dixey J, KielyP, et al. Hand and foot surgery rates in rheumatoid arthritis havedeclined from 1986 to 2011, but large- joint replacement ratesremain unchanged: results from two UK inception cohorts. ArthritisRheumatol 2014;66:1081– 9.
20. Abhishek A, Doherty M, Kuo CF, Mallen CD, Zhang W, GraingeMJ. Rheumatoid arthritis is getting less frequent- results of a nation-wide population- based cohort study. Rheumatology (Oxford)2017;56:736– 44.
21. Oliver JE, Silman AJ. Why are women predisposed to autoimmunerheumatic diseases? [review]. Arthritis Res Ther 2009;11:252.
22. Fairweather D, Frisancho- Kiss S, Rose NR. Sex differences in auto-immune disease from a pathological perspective [review]. Am JPathol 2008;173:600– 9.
23. Rybicki BA, Major M, Popovich J Jr, Maliarik MJ, Iannuzzi MC. Racial differences in sarcoidosis incidence: a 5- year study in a health main-tenance organization. Am J Epidemiol 1997;145:234– 41.
24. Chakravarty EF, Bush TM, Manzi S, Clarke AE, Ward MM.Prevalence of adult systemic lupus erythematosus in California andPennsylvania in 2000: estimates obtained using hospitalization data.Arthritis Rheum 2007;56:2092– 4.
25. Gremese E, Tolusso B, Gigante MR, Ferraccioli G. Obesity as arisk and severity factor in rheumatic diseases (autoimmune chronicinflammatory diseases) [review]. Front Immunol 2014;5:576.
26. Lane J, Nyugen E, Morrison J, Lim L, Stawell R, Hodgson L,et al. Clinical features of scleritis across the Asia- Pacific region. OculImmunol Inflamm 2019;27:920– 6.
27. Kempen JH, Pistilli M, Begum H, Fitzgerald T, Liesegang TL, PayalA, et al. Remission of non- infectious anterior scleritis: incidence andpredictive factors. Am J Ophthalmol 2021;223:377–95.
28. Ramanan AV, Dick AD, Guly C, McKay A, Jones AP, Hardwick B,et al. Tocilizumab in patients with anti- TNF refractory juvenile idio-pathic arthritis- associated uveitis (APTITUDE): a multicentre, single- arm, phase 2 trial. Lancet Rheumatol 2020;2:e135– 41.
29. Turk MA, Hayworth JL, Nevskaya T, Pope JE. Ocular manifes-tations in rheumatoid arthritis, connective tissue disease andvasculitis: a systematic review and meta- analysis. J Rheumatol2021;48:25– 34.
30. Jabs DA, Mudun A, Dunn JP, Marsh MJ. Episcleritis and scleritis:clinical features and treatment results. Am J Ophthalmol 2000;130:469– 76.
31. Heinz C, Bograd N, Koch J, Heiligenhaus A. Ocular hypertensionand glaucoma incidence in patients with scleritis. Graefes Arch ClinExp Ophthalmol 2013;251:139– 42.

1277
Arthritis & RheumatologyVol. 73, No. 7, July 2021, pp 1277–1287DOI 10.1002/art.41665© 2021 The Authors. Arthritis & Rheumatology published by Wiley Periodicals LLC on behalf of American College of Rheumatology.This is an open access article under the terms of the Creative Commons Attribution- NonCommercial License, which permits use, distribution and reproduction in any medium, provided the original work is properly cited and is not used for commercial purposes.
Association of Lymphangiogenic Factors With Pulmonary Arterial Hypertension in Systemic SclerosisHenriette Didriksen,1 Øyvind Molberg,2 Håvard Fretheim,1 Einar Gude,1 Suzana Jordan,3 Cathrine Brunborg,1 Vyacheslav Palchevskiy,4 Torhild Garen,1 Øyvind Midtvedt,1 Arne K. Andreassen,1 Oliver Distler,3 John Belperio,4 and Anna- Maria Hoffmann- Vold1
Objective. Pulmonary arterial hypertension (PAH) is a major complication in systemic sclerosis (SSc), a disease marked by vascular and lymphatic vessel abnormalities. This study was undertaken to assess the role of the lymphangiogenic factors vascular endothelial growth factor C (VEGF- C) and angiopoietin 2 (Ang- 2) and the soluble forms of their respective cognate receptors, soluble VEGF receptor 3 (sVEGFR- 3) and soluble TIE- 2, in patients with SSc, and to evaluate their predictive ability as markers for PAH development in SSc.
Methods. In this cohort study, we used multiplex bead assays to assess serum levels of lymphangiogenic factors in 2 well- characterized SSc cohorts: an unselected identification cohort of SSc patients from Oslo University Hospital (n = 371), and a PAH- enriched validation cohort of SSc patients from Zurich University Hospital and Oslo University Hospital (n = 149). As controls for the identification and validation cohorts, we obtained serum samples from 100 healthy individuals and 68 healthy individuals, respectively. Patients in whom SSc- related PAH was identified by right- sided heart catheterization (RHC) in both cohorts were studied in prediction analyses. PAH was defined according to the European Society of Cardiology/European Respiratory Society 2015 guidelines for the diagnosis and treatment of PAH. Associations of serum levels of lymphangiogenic factors with the risk of PAH development were assessed in logistic regression and Cox regression analyses. Associations in Cox regression analyses were expressed as the hazard ratio (HR) with 95% confidence interval (95% CI).
Results. In the identification cohort, SSc patients had lower mean serum levels of VEGF- C and higher mean serum levels of Ang- 2 compared to healthy controls (for VEGF- C, mean ± SD 2.1 ± 0.5 ng/ml in patients versus 2.5 ± 0.4 ng/ml in controls; for Ang- 2, mean ± SD 6.1 ± 7.6 ng/ml in patients versus 2.8 ± 1.8 ng/ml in controls; each P < 0.001); these same trends were observed in SSc patients with PAH compared to those without PAH. The association of serum VEGF- C levels with SSc- PAH was confirmed in the PAH- enriched RHC validation cohort. For prediction analyses, we assembled all 251 cases of SSc- PAH identified by RHC from the identification and validation cohorts. In multivariable Cox regression analyses adjusted for age and sex, the mean serum levels of VEGF- C and sVEGFR- 3 were predictive of PAH development in patients with SSc (for VEGF- C, HR 0.53 [95% CI 0.29– 0.97], P = 0.04; for sVEGFR- 3, HR 1.21 [95% CI 1.01– 1.45], P = 0.042).
Conclusion. These findings support the notion that lymphangiogenesis is deregulated during PAH development in SSc, and indicate that VEGF- C could be a promising marker for early PAH detection in patients with SSc.
Supported by a grant from Helse Sør- Øst (project 2016001).1Henriette Didriksen, MS, Håvard Fretheim, MD, Einar Gude, PhD,
Cathrine Brunborg, MS, Torhild Garen, MS, Øyvind Midtvedt, MD, Arne K. Andreassen, PhD, Anna- Maria Hoffmann- Vold, PhD: Oslo University Hospital, Rikshospitalet, Oslo, Norway; 2Øyvind Molberg, PhD: Oslo University Hospital, Rikshospitalet, and Institute of Clinical Medicine, University of Oslo, Oslo, Norway; 3Suzana Jordan, PhD, Oliver Distler, PhD: University Hospital Zurich, Zurich, Switzerland; 4Vyacheslav Palchevskiy, PhD, John Belperio, MD: University of California, Los Angeles.
Dr. Didriksen has received consulting fees, speaking fees, and/or honoraria from Actelion (less than $10,000). Dr. Fretheim has received consulting fees, speaking fees, and/or honoraria from Bayer and Actelion (less than $10,000 each). Dr. Andreassen has received consulting fees, speaking fees, and/or honoraria from Actelion, Bayer, MSD, Orion, and Nordic Infucare (less than $10,000 each). Dr. Distler has received consulting fees, speaking fees, and/
or honoraria from Actelion, Kymera, Mitsubishi Tanabe Pharma, AbbVie, Acceleron, Alexion, Amgen, AnaMar, Arxx Therapeutics, Beacon Discovery, Blade Therapeutics, Corbus, Competitive Drug Development International, CSL Behring, Galápagos, Glenmark, GlaxoSmithKline, Horizon, Inventiva, IQVIA, Lilly, Novartis, Pfizer, TOPADUR, and UCB (less than $10,000 each) and from Boehringer Ingelheim and Bayer (more than $10,000 each). Dr. Hoffmann- Vold has received consulting fees, speaking fees, and/or honoraria from Actelion, Roche, Bayer, Merck Sharp & Dohme, Lilly, Arxx Therapeutics, and Medscape (less than $10,000 each) and from Boehringer Ingelheim (more than $10,000). No other disclosures relevant to this article were reported.
Address correspondence to Anna- Maria Hoffmann- Vold, MD, PhD, Oslo University Hospital, Rikshospitalet, Pb 4950 Nydalen, 0424 Oslo, Norway. Email: [email protected].
Submitted for publication September 29, 2020; accepted in revised form January 21, 2021.

DIDRIKSEN ET AL 1278 |
INTRODUCTION
Systemic sclerosis (SSc) is a rare multiorgan disease charac-terized by fibrosis, autoimmune features, and progressive vascular abnormalities (1). Pulmonary arterial hypertension (PAH) is a major vascular complication in SSc, and a leading cause of disease- related mortality (2). PAH in SSc is still often diagnosed at late stages of the disease, after marked vascular damage has already occurred, and thus opportunities for early treatment are missed, emphasizing the need for novel markers to aid earlier diagnosis (3,4).
Recently, we reported that the chemokine CCL21 is a prom-ising predictive marker for PAH in SSc (5). We speculated that CCL21 is a marker for deregulated immune pathways, driving lung vascular damage leading to PAH. As CCL21 modulates lymphatic endothelial cells (LECs), and because SSc is marked by abnor-mal lymphatic vessels, we have focused our investigations on lymphangiogenic pathways (6,7). Interestingly, other studies have demonstrated that CCL21 appears to often mediate its effects on LECs through vascular endothelial growth factor C (VEGF- C) (8,9).
The findings from human genetic studies have revealed that VEGF- C and its cognate receptor, VEGF receptor 3 (VEGFR- 3), are critical for normal lymphatic vessel development (10,11). Inter-estingly, the VEGF- C/VEGFR- 3 axis also appears to play a critical role in genetically determined human PAH (12,13). The process of lymphangiogensis is strictly regulated, with one of the major
regulators being the growth factor angiopoetin 2 (Ang- 2), which acts through the TIE- 2 receptor (14,15). Previous studies have indicated that Ang- 2 is critical for VEGFR- 3– related lymphangio-genesis (16– 18).
Based on these observations linking lymphatic pathways to SSc and PAH, we undertook the present study to assess lym-phangiogenic factors associated with risk of PAH development in patients with SSc. Specifically, we aimed to assess whether VEGF- C, soluble VEGFR- 3 (sVEGFR- 3), Ang- 2, and soluble TIE- 2 (sTIE- 2) are associated with and predictive of PAH development in SSc.
PATIENTS AND METHODS
SSc identification and validation cohorts. Identifica-tion cohort. The identification cohort comprised 371 SSc patients derived from an unselected, prospective cohort of SSc patients from Oslo University Hospital (OUH) (Figure 1). We included patients whose diagnosis met the American College of Rheuma-tology/European Alliance of Associations for Rheumatology 2013 classification criteria for SSc (19) and who had registered clinical data on pulmonary hypertension (PH) (details described below) and serum samples available for analysis. As controls, we included 100 consecutive and random blood bank donors from OUH (nei-ther age- matched nor sex- matched to the patients) (5).
Figure 1. Schematic overview of the systemic sclerosis (SSc) patients from Oslo University Hospital (OUH) and Zurich University Hospital (USZ) included in this study. The identification cohort included 371 unselected SSc patients, of whom 102 had data on right- sided heart catheterization (RHC) available for analysis. The validation cohort included 66 SSc patients from USZ and 83 patients from OUH who had undergone at least 1 RHC. The assembled RHC cohort included all 251 cohort patients who had RHC data available. For the comparative analyses, we focused on the patient groups defined by RHC as having pulmonary arterial hypertension (PAH) compared to those with no pulmonary hypertension (PH) (indicated on the right). We excluded patients with a borderline mean pulmonary artery pressure (mPAP), those with PH- related interstitial lung disease (PH- ILD), and those with postcapillary PH. Color figure can be viewed in the online issue, which is available at http://onlinelibrary.wiley.com/doi/10.1002/art.41665/abstract.

LYMPHANGIOGENIC FACTORS IN SSc- RELATED PAH | 1279
Validation cohort. The validation cohort comprised 149 SSc patients who had undergone at least 1 right- sided heart catheterization (RHC) examination based on clinical indications and had serum samples available for analysis. We included SSc patients from the prospective Zurich University Hospital (USZ) SSc cohort (n = 66) and patients from the OUH SSc cohort who were not included in the identification cohort (n = 83). As controls, we obtained samples from 68 healthy individuals who were matched to the SSc patients by age and sex (Figure 1).
Assembled RHC cohort. For association and prediction analyses, we set up an assembled RHC cohort in which all included cases were SSc patients who had undergone an RHC (n = 251), including 1) 102 patients with RHC- verified SSc from the identi-fication cohort, and 2) all 149 patients from the validation cohort (Figure 1). In this RHC cohort, serum samples were collected from 94 of 251 patients at 2 different time points (>12 months apart) for additional serial serum sample analyses (Figure 1).
The study complies with the principles of the Declaration of Helsinki and was approved by the Data Protection Authority in Norway (approval no. 2006/119) and the Business Administration System for Ethics Committees in Zurich (BASEC KEK- ZH approval no. 2018- 01873 and BASEC approval no. PB_2016- 02014). Informed consent was obtained from all included subjects.
Clinical parameters. Data on SSc subsets, autoantibod-ies, clinical characteristics, and vital status were available from the OUH and USZ SSc databases (5,20,21). Disease onset was defined from the time of onset of the first non- Raynaud’s phe-nomenon symptom, and disease duration was defined as the time from disease onset until study end (February 2019) or time of death. Extent of lung fibrosis was expressed as the percentage of total volume determined on high- resolution computed tomog-raphy (HRCT) lung images. Pulmonary function tests (PFTs) were carried out according to the American Thoracic Society/European Respiratory Society (ERS) guidelines (22– 25). Recorded immuno-suppressive treatments included cyclophosphamide, mycophe-nolate mofetil, azathioprine, glucocorticoids at a dose of >10 mg, rituximab, tocilizumab, and methotrexate.
PH surveillance and diagnosis. Annual PH surveillance in the OUH and USZ SSc cohorts included a complete clinical examination, per- protocol echocardiography, PFTs, 6- minute walk distance (6MWD) test, measurement of N- terminal pro– brain natriuretic peptide (NT- proBNP) levels, and evaluation of PAH using the DETECT screening algorithm (22,23,26). The thresh-old for referring a patient to the RHC procedure was low, and indicated by clinical suspicion of PH due to increasing dyspnea, increasing NT pro- BNP levels, decline in the diffusing capacity for carbon monoxide percent predicted (DLco%), systolic pres-sure of >40 mm Hg on echocardiography, and/or a DETECT score of >35 (20,27). We recorded use of PAH monotherapies,
combination therapies, or triple therapies with phosphodiesterase 5 inhibitors, endothelin receptor antagonists, and prostacyclins.
We diagnosed PH according to the European Society of Car-diology (ESC)/ERS 2015 guidelines (28,29), and we differentiated SSc- related PAH from PH- related interstitial lung disease (ILD) in a manner as previously described (27). Briefly, SSc- PAH was defined as 1) evidence of precapillary PH on RHC examination, with a mean pulmonary artery pressure (mPAP) of ≥25 mm Hg and pulmonary capillary wedge pressure (PCWP) of <15 mm Hg, and 2) absence of significant lung fibrosis as determined by HRCT (extent of lung fibrosis <10% by quantification in patients at OUH, and <20% by visual scoring in patients at USZ) (30). We excluded patients who had an mPAP of 20– 25 mm Hg (borderline mPAP). Patients with a PCWP of ≥15 mm Hg (indicative of postcapillary PH) and other causes of precapillary PH were excluded from the PAH group analyses, but were included in the total PH group anal-yses (31). Patients with PH underwent a follow- up RHC if clinically indicated. Additionally, we regrouped the assembled RHC cohort according to the recently proposed 6th World Symposium PH criteria (32), and assessed the impact of lymphatic markers on PAH based on these criteria (see Supplementary Materials and Methods, available on the Arthritis & Rheumatology website at http://onlin elibr ary.wiley.com/doi/10.1002/art.41665/ abstract).
Stepwise procedure for identification and validation of lymphangiogenic factors. We first assessed VEGF- C and Ang- 2 by multiplex bead assay in the identification cohort (371 unselected SSc cases and 100 healthy controls). We then per-formed multiplex bead analysis of receptor/ligand pairs (VEGF- C/sVEGFR- 3 and Ang- 2/sTIE- 2) in the validation cohort of 149 SSc patients assessed by RHC (Figure 1).
For multiplex bead assay, we obtained blood samples from SSc patients and healthy controls at OUH and USZ using the same standardized procedure for processing within 30 minutes after collection. The samples were stored at −70°C until analysis, following the European Scleroderma Trials and Research Group guidelines on biobanking (33). At OUH, samples were stored in the Norwegian Systemic Connective Tissue Disease and Vasculi-tis Registry biobank.
For analysis of the identification cohort, we applied the Milliplex Human Angiogenesis/Growth Factor Magnetic Bead Panel I (HAGP1MAG- 12K; Merck Millipore) containing Ang- 2 and VEGF- C. For analysis of the validation cohort, we applied the same panel for Ang- 2 and VEGF- C, and the Milliplex Human Angiogenesis Magnetic Bead Panel II (HANG2MAG- 12K; Merck Millipore) for sTIE- 2 and sVEGRF- 3.
Statistical analysis. All statistical analyses were conducted using IBM SPSS version 26 and STATA version 14. Pearson’s chi- square test, Fisher’s exact test, independent samples t- test, and one- way analysis of variance were used as appropriate. Our out-come measures were assessed for their association with PAH, for

DIDRIKSEN ET AL 1280 |
their predictive ability as markers of PAH development, and for their association with mortality risk.
For analysis of risk factor associations with PAH, we applied logistic regression analyses, with results expressed as the odds ratio (OR) with 95% confidence interval (95% CI). We included all patients with SSc- PAH from the assembled RHC cohorts whose clinical data and serum samples were collected from 1 year before to 5 years after PAH diagnosis. For analysis of the predictive ability of the outcome measures in predicting the development of PAH, we applied Cox regression analysis, with results expressed as the hazard ratio (HR) with 95% CI. We included patients whose clinical data and serum samples were collected >6 months prior to PAH diagnosis.
Variables for the logistic and Cox regression analyses were chosen by experts, based on those previously reported in the established literature (34). A change in level of 1 ng/ml for any of the variables of interest increases the probability of developing PAH by 1%. Models were checked by assessing the area under the curve (AUC) for logistic regression analysis, and using the Har-rell’s C- index for Cox regression analysis, in which C- index values >0.7 are considered acceptable. Parameters included in the mul-tivariable analysis were checked for correlation. We determined cutoff values for “high” and “low” serum levels using receiver operating characteristic (ROC) curves. A stable VEGF- C level was defined as low variation (±1 SD) between serial serum samples. For correlation analysis, we applied Spearman’s rho correlation
Table 1. Key demographic and clinical characteristics of the SSc patients from the identification and validation cohorts*
Validation cohort
Identification cohort (OUH)
(n = 371)OUH
(n = 83)USZ
(n = 66)Age at disease onset, years 51.8 ± 15.5 51.8 ± 13.4 49.3 ± 15.5Male, no. (%) 59 (15.9) 17 (20.5) 12 (18.2)Diffuse cutaneous SSc, no. (%) 92 (24.8) 19 (22.9) 9 (13.6)ACA positive, no. (%) 191 (51.5) 41 (49.4) 30 (45.5)NYHA functional class, no. (%)
All classes 365 (98.4) 76 (91.6) 65 (98.5)Class I and II 294 (79.2) 59 (77.6) 47 (72.3)Class III and IV 71 (19.5) 17 (22.4) 18 (27.7)
NT- proBNP, pg/ml 84.3 ± 347.9 120 ± 489.6 515.6 ± 842.1DLco, % predicted 67.9 ± 20.2 63.7 ± 17.1 56.5 ± 16.5Examined by Echo, no. (%) 367 (98.9) 75 (90.4) 57 (86.4)sPAP, mm Hg 27.0 ± 18.6 32.8 ± 23.7 28.1 ± 12.7Examined by RHC, no. (%) 102 (27.5) 83 (100) 66 (100)mPAP, mm Hg 25.8 ± 12.2 28.0 ± 11.3 28.9 ± 8.8mPCWP, mm Hg 9.6 ± 5.7 10.1 ± 7.6 10.8 ± 3.4PVR, WU 3.6 ± 3.6 2.8 ± 2.6 2.5 ± 1.9PAH, no. (%) 25 (6.7) 30 (36.1) 17 (25.8)Time from disease onset to PH, years 7.6 ± 8.5 6.6 ± 8.3 10.0 ± 12.6Time from serum sampling to PH, years −1.3 ± 3.1 −1.8 ± 3.1 −0.2 ± 2.1Treatments, no. (%)
Immunosuppressive treatment 117 (31.5) 28 (33.7) 19 (28.8)PAH treatment 120 (32.3) 43 (51.8) 20 (30.3)
Monotherapy† 61 (50.8) 14 (32.6) 13 (65.0)Dual therapy‡ 50 (41.7) 25 (58.1) 5 (25.0)Triple therapy§ 9 (7.5) 4 (9.3) 2 (10.0)
Calcium channel blockers 113 (30.5) 25 (30.1) 30 (45.5)ACE inhibitors 42 (11.3) 12 (13.3) 9 (13.6)
Deceased, no. (%) 91 (24.5) 21 (25.2) 9 (13.6)* The clinical and demographic characteristics of the systemic sclerosis (SSc) patients did not differ significantly between the Oslo University Hospital (OUH) and Zurich University Hospital (USZ) cohorts, except for the percentage of deceased patients. Except where indicated otherwise, values are the mean ± SD. ACA = anticentromere antibody; NYHA = New York Heart Association; NT- proBNP = N- terminal pro– brain natriuretic peptide; DLco = diffusing capacity for carbon monoxide; Echo = echocardiography; sPAP = systolic pulmonary artery pressure; RHC = right- sided heart catheterization; mPAP = mean pulmonary artery pressure; mPCWP = mean pulmonary capillary wedge pressure; PVR = pulmonary vascular resistance; WU = Wood units; PAH = pulmonary arterial hypertension; PH = pulmonary hypertension; ACE = angiotensin- converting enzyme. † Monotherapy involved either phosphodiesterase 5 inhibitors (PD5Is) or endothelin receptor antagonists (ERAs). ‡ Dual therapy involved both PD5Is and ERAs. § Triple therapy involved PD5Is, ERAs, and prostacyclins.

LYMPHANGIOGENIC FACTORS IN SSc- RELATED PAH | 1281
coefficients, and calculated the ratio between the serum levels of VEGF- C and serum levels of sVEGRF- 3.
RESULTS
Lymphangiogenesis factors in different cohorts. We first assessed the serum levels of VEGF- C and Ang- 2 in 371 SSc patients from the unselected OUH SSc cohort. In this identifica-tion cohort, 102 patients (27.5%) had undergone RHC, with 25 (24.5%) diagnosed as having PAH (Table 1).
In the identification cohort, we found that the mean serum levels of VEGF- C were significantly lower in SSc patients than in healthy controls (mean ± SD 2.1 ± 0.5 ng/ml versus 2.5 ± 0.4 ng/ml; P < 0.001). SSc patients with PAH had significantly lower mean serum VEGF- C levels (mean ± SD 1.8 ± 0.4 ng/ml) compared to the total SSc cohort (P = 0.003) (Figure 2A, panel i).
Regarding Ang- 2, the mean serum levels of Ang- 2 were significantly higher in SSc patients compared to healthy controls (mean ± SD 6.1 ± 7.6 ng/ml versus 2.8 ± 1.8 ng/ml; P < 0.001), and the mean serum levels of Ang- 2 were higher in the PAH sub-set (mean ± SD 7.7 ± 7.4 ng/ml; P = 0.201) (Figure 2A, panel ii). VEGF- C levels in PAH patients were also significantly lower in the subset of patients in whom no PH was revealed by RHC (n = 34) (i.e., those with a normal- range mPAP on RHC performed for clinical indications) compared to those with RHC- identified PH (mean ± SD 1.8 ± 0.4 ng/ml versus 2.4 ± 0.5 ng/ml; P < 0.001) (Figure 3A, panel i). Serum Ang- 2 levels were higher in SSc patients with PAH compared to those with no PH (mean ± SD 7.7 ± 7.4 ng/ml versus 5.8 ± 5.6 ng/ml; P = 0.21) (Figure 3A, panel ii).
Aiming to validate and extend these preliminary findings on VEGF- C and Ang- 2 levels in the identification cohort, we performed testing of these 2 molecules and the soluble forms of their cognate receptors (sVEGRF- 3 and sTIE- 2) in a valida-tion cohort of 149 patients in Oslo and Zurich, all of whom were assessed by RHC. We found no differences in the demographic and clinical characteristics between the identification cohort and the validation cohorts, except in the number of deceased patients (Table 1).
Similar to the findings in the identification cohort, SSc patients in the validation cohort had significantly lower mean serum levels of VEGF- C compared to healthy controls (mean ± SD 2.0 ± 0.8 ng/ml versus 2.9 ± 0.9 ng/ml; P < 0.001). The serum levels of VEGF- C were also significantly lower in SSc patients with PAH (mean ± SD 1.7 ± 0.8 ng/ml; P = 0.002) (Figure 2B, panel i).
Regarding Ang- 2 in the validation cohort, we found signifi-cantly higher mean serum levels of Ang- 2 in SSc patients com-pared to healthy controls (mean ± SD 7.3 ± 6.6 ng/ml versus 4.7 ± 2.3 ng/ml; P < 0.001), and levels of Ang- 2 were higher in the PAH subset (mean ± SD 8.1 ± 6.6 ng/ml) compared to the total SSc cohort (P = 0.061) (Figure 2B, panel ii).
The mean levels of sVEGFR- 3 were widely distributed, but were significantly higher in the serum of SSc patients compared to
healthy controls (mean ± SD 1.3 ± 2.6 ng/ml versus 0.5 ± 0.5 ng/ml; P = 0.011). The serum levels of sVEGFR- 3 were numeri-cally highest in the subset of SSc patients with PAH (mean ± SD 1.9 ± 3.8 ng/ml; P = 0.056) (Figure 2B, panel iii). The mean serum levels of sTIE- 2 did not significantly differ between SSc patients and healthy controls (mean ± SD 7.9 ± 4.6 ng/ml ver-sus 6.9 ± 3.5 ng/ml; P = 0.075), nor did they differ between SSc patients with PAH (mean ± SD 7.4 ± 3.9 ng/ml) and the total SSc cohort (P = 0.765) (Figure 2B, panel iv).
Figure 2. Serum levels of lymphangiogenic factors in patients with systemic sclerosis (SSc). A, Mean circulating levels of vascular endothelial growth factor C (VEGF- C) (panel i) and angiopoietin 2 (Ang- 2) (panel ii) were determined in healthy controls, SSc patients, and SSc patients with pulmonary arterial hypertension (PAH) verified by right- sided heart catheterization (RHC) in the identification cohort. B, Mean circulating levels of VEGF- C (panel i), Ang- 2 (panel ii), soluble VEGF receptor 3 (sVEGFR- 3) (panel iii), and sTIE- 2 (panel iv) were determined in healthy controls, SSc patients, and SSc patients with RHC- verified PAH in the validation cohort. Bars show the mean ± SD. * = P < 0.05; ** = P < 0.001.

DIDRIKSEN ET AL 1282 |
Since demographic and clinical characteristics did not dif-fer between the identification and validation cohorts (Table 1), we found it appropriate to assemble all patients with RHC data from the identification and validation cohorts in a combined RHC cohort (n = 251). In this cohort, there were 72 patients (48.3%) with PAH, while 69 did not have PH (Figure 1). Levels of VEGF- C were lower in patients with PAH than in those with no PH (mean ± SD 1.7 ± 0.8 ng/ml versus 2.1 ± 0.8 ng/ml; P = 0.006) (Figure 3B, panel i).
The levels of sVEGRF3 in the RHC cohort were higher in patients with PAH than in those with no PH (mean ± SD 1.9 ± 3.7 ng/ml versus 1.1 ± 1.4 ng/ml; P = 0.049) (Figure 3B, panel ii). The levels of Ang- 2 were also higher in those with PAH compared to the no PH group (mean ± SD 8.1 ± 6.5 ng/ml versus 5.7 ± 4.9 ng/ml; P = 0.019), while the levels of sTIE- 2 did not differ between these 2 groups (mean ± SD 7.4 ± 3.9 ng/ml versus 7.6 ± 5.6 ng/ml; P = 0.633) (Figure 3B, panels iii and iv). Serum levels of these markers in other forms of PH, including postcapillary PH and PH associated with ILD, are shown in Supplementary Figures 1A– D (available on the Arthritis & Rheumatology website at http://onlin elibr ary.wiley.com/doi/10.1002/art.41665/ abstract).
Outcome measures. We assessed 2 outcome meas-ures, the association of lymphaniogenic markers with PAH and the association of lymphaniogenic markers with prediction of PAH development. For both sets of analyses, we applied a no PH control group (n = 98), which included 2 subsets of patients from the study cohort: 1) patients with no PH by RHC (n = 37) and 2) patients who had not undergone RHC, but had a systolic PAP (sPAP) of <30 mm Hg and no clinical signs of PH (n = 61). First, we assessed the association of circulating lymphaniogenic mark-ers with PAH in the assembled RHC cohort. For this association analysis, we included 56 (77.8%) of the 72 SSc- PAH patients with serum samples from 1 year before to 5 years after PAH diagnosis. The serum samples were obtained a mean 0.8 years after PAH diagnosis. We performed univariable logistic regression analyses both for the PAH group and for the total PH group (which con-sisted of all SSc patients with pre- or postcapillary PH by RHC) (characteristics of the patients are shown in Supplementary Table 1, available on the Arthritis & Rheumatology website at http://onlin e libr ary.wiley.com/doi/10.1002/art.41665/ abstract). Overall, the major-ity of variables that were significantly associated with PAH also showed a significant association in the total PH group.
We then tested the associations with PAH in 2 multivariable logistic regression models (Table 2). The variables that were signif-icantly associated with PAH in univariable analysis, including New York Heart Association (NYHA) cardiovascular functional class III or class IV, 6MWD, DLco, Ang- 2 levels, VEGF- C levels based on the defined cutoff, and Ang- 2 levels based on the defined cutoff, were not significantly associated with PAH in multivariable analy-sis, and therefore are not included in these models.
In model 1, which included all lymphangiogenesis factors and known risk factors for PAH, we found that the serum levels of VEGF- C were independently associated with PAH, whereas the serum levels of VEGFR- 3, Ang- 2, and sTIE- 2 were not (Table 2).
In model 2, we tested the association between PAH devel-opment and low VEGF- C levels, defined by ROC analysis based on a cutoff level of 2.4 ng/ml (AUC 0.8, P < 0.001) as shown in Supplementary Figure 2 (available on the Arthritis & Rheu-matology website at http://onlin elibr ary.wiley.com/doi/10.1002/art.41665/ abstract). Using this cutoff, 87.7% of the PAH patients
Figure 3. Serum levels of lymphangiogenic factors in SSc patients with RHC- verified PAH (n = 72) compared to SSc patients with no pulmonary hypertension (PH) (n = 68). A, Mean serum levels of VEGF- C (panel i) and Ang- 2 (panel ii) were compared between groups in the identification cohort. B, Mean serum levels of VEGF- C (panel i), sVEGRF- 3 (panel ii), Ang- 2 (panel iii), and sTIE- 2 (panel iv) were compared between groups in the validation cohort. Bars show the mean ± SD. * = P < 0.05; ** = P < 0.001. See Figure 2 for other definitions. Color figure can be viewed in the online issue, which is available at http://onlinelibrary.wiley.com/doi/10.1002/art.41665/abstract.

LYMPHANGIOGENIC FACTORS IN SSc- RELATED PAH | 1283
had low levels of VEGF- C, while 12.3% had high levels of VEGF- C. Since ROC analysis for the sensitivity and specificity of sVEGFR- 3, Ang- 2, and sTIE- 2 levels showed an AUC of <0.7, no cutoff values were determined for these factors, and they were not included in the model. Model 2 showed that low VEGF- C lev-els were an independent risk factor associated with PAH devel-opment (Table 2).
Since PAH can be regarded as a vasculature- related out-come in SSc, we performed association analysis with 2 other key vascular SSc outcomes, digital ulcers (DUs) and scleroderma renal crisis (SRC), using ever present DU or SRC as outcome var-iables. We did not find any association between the serum levels of VEGF- C or VEGFR- 3 and presence of DUs or SRC. However, the Ang- 2 cutoff level was associated with SRC (OR 4.78, 95% CI 1.59– 14.33; P = 0.005), while the TIE- 2 level was associated with DUs (OR 1.72, 95% CI 1.21– 2.44; P = 0.002).
The second outcome measure that was assessed was the predictive ability of circulating levels of lymphangiogenic fac-tors as markers for the development of PAH in SSc. For these analyses, we included the 33 patients with SSc- PAH (45.8%) from the assembled RHC cohort with serum samples availa-ble from >6 months before PAH diagnosis. These 33 patients developed PAH a mean 3.1 years after the time of serum sam-ple collection.
Results of univariable analyses in this subset of 33 patients with SSc- PAH and in the total PH group are shown in Supplemen-tary Table 2 (available on the Arthritis & Rheumatology website at http://onlin elibr ary.wiley.com/doi/10.1002/art.41665/ abstract). Mostly, the same variables were significant in both groups.
In multivariable analyses adjusted for age and sex, we iden-tified serum levels of VEGF- C and sVEGFR- 3 as predictors for
PAH development, in addition to traditional risk factors, including the sPAP determined on echocardiography, NYHA cardiovascular functional class III and class IV, and DLco% (Table 3). Serum levels of Ang- 2 and sTIE- 2 were not predictive of PAH in this cohort, and neither were the levels of anticentromere antibodies, levels of NT- proBNP, and the 6MWD.
We also assessed the difference in VEGF- C levels between the NYHA cardiovascular functional classes. The mean serum VEGF- C levels in patients in NYHA class I and class II differed significantly from the levels in patients in NYHA class III and class IV (mean ± SD 2.01 ± 0.82 ng/ml versus 1.77 ± 0.68 ng/ml; P = 0.004). The post hoc analysis showed a significant difference in the mean VEGF- C levels between patients in NYHA class I and patients in NYHA class III (mean ± SD −0.29 ± 0.11 ng/ml; P = 0.047).
We also performed a subgroup analysis of patients whose serum was collected >1– 2 years before PAH diagnosis. The results did not differ substantially from the data in patients whose serum was collected >6 months prior to PAH diagnosis (data not shown).
Lastly, we assessed the predictive ability of VEGF- C levels for predicting the risk of mortality in PAH patients. For these analyses, we used multivariable Cox regression analysis with the same var-iables as listed in Table 3 and with death as the outcome. NYHA cardiovascular functional class III and class IV and sPAP were significantly predictive of mortality, while VEGF- C levels, VEG-FR- 3 levels, and DLco% were not predictive of mortality, when the models were adjusted for age and sex (results in Supplemen-tary Table 3, available on the Arthritis & Rheumatology website at http://onlin elibr ary.wiley.com/doi/10.1002/art.41665/ abstract).
Correlation between VEGF- C levels and sVEGFR- 3 levels. In the assembled RHC cohort, serum levels of VEGF- C and serum levels of sVEGFR- 3 had a weak correlation in SSc patients (r = 0.061, P = 0.46) and no correlation in healthy con-trols (r = 0.258, P = 0.04), with no significant difference between the correlation coefficients (P = 0.074). Likewise, no correlation between VEGF- C and sVEGFR- 3 levels was seen in SSc patients with PAH (r = −0.178, P = 0.329) or in those with no PH (r = 0.082, P = 0.683), nor were there any differences between the correla-tion coefficients (P = 0.092). However, in patients with a borderline increased mPAP (n = 38), the correlation between VEGF- C and sVEGFR- 3 levels was strong (r = −0.850, P = 0.004), with a signifi-cant difference in the correlation coefficients between patients with a borderline increased mPAP and patients with PAH (P < 0.001), and between patients with a borderline increased mPAP and patients with no PH (P < 0.001).
Correlation analyses were also performed to assess correla-tions between the serum levels of VEGF- C and VEGFR- 3 and the severity of PAH (defined according to the mPAP, cardiac output [CO], and cardiac index [CI]). VEGF- C levels correlated weakly with the CO (r = 282, P = 0.041) and the CI (r = 329, P = 0.016) but showed no correlation with the mPAP. VEGFR- 3 levels did not correlate with any of the variables.
Table 2. Factors showing association with PAH development in multivariable logistic regression analyses in SSc patients having undergone RHC*
Model, variable OR (95% CI) PModel 1 (AUC 0.85)
Male 1.57 (0.49– 4.97) 0.446Age (years) at onset 0.99 (0.96– 1.01) 0.380VEGF- C levels, per 1SD change† 0.48 (0.28– 0.82) 0.007NYHA functional class III or IV 2.32 (0.73– 7.35) 0.152sPAP (mm Hg), per 1SD change 3.48 (1.77– 6.86) <0.001ACA positive 2.41 (0.92– 6.31) 0.074
Model 2 (AUC 0.86)Male 1.45 (0.46– 4.60) 0.525Age (years) at onset 0.99 (0.96– 1.01) 0.307Low VEGF- C, based on cutoff‡ 0.26 (0.08– 0.81) 0.020NYHA functional class III or IV 2.45 (0.78– 7.74) 0.127sPAP (mm Hg), per 1SD change 3.44 (1.72– 6.87) <0.001ACA positive 2.47 (0.96– 6.40) 0.062
* OR = odds ratio; 95% CI = 95% confidence interval; AUC = area under the receiver operating characteristic curve (see Table 1 for other definitions). † Model 1 assessed associations with the per 1SD unit change in se-rum levels of vascular endothelial growth factor C (VEGF- C) (in ng/ml). ‡ Model 2 assessed associations with low serum levels of VEGF- C (in ng/ml), with “low” defined according to a cutoff of 2.4 ng/ml.

DIDRIKSEN ET AL 1284 |
Longitudinal VEGF- C data in patients with SSc- PAH. In the assembled RHC cohort, 94 (37.5%) of 251 patients had serial serum samples available. The clinical characteristics of these patients did not differ significantly from those of patients without serial serum samples. We defined VEGF- C levels as sta-ble between 2 time points of serum collection if they varied by less than ±0.8 ng/ml (±1SD). We found that 13 patients (13.8%) displayed decreasing VEGF- C levels over a mean ± SD 2.0 ± 1.5 years, 44 (46.8%) had stable VEGF- C levels over a mean ± SD 2.7 ± 2.5 years, and 37 (39.4%) had an increase in VEGF- C levels over a mean ± SD 2.8 ± 2.5 years. Of the 94 patients with SSc, 23 (24.5%) were diagnosed as having PAH after a mean ± SD 11.6 ± 14.9 years. Among these patients with PAH, an increase in serum VEGF-C levels was seen in 12 patients (52.2%) between the sample collected at the time of PAH diagnosis and the sample collected after diagnosis (mean ± SD increase 1.04 ± 0.99 ng/ml) (see Supplementary Figure 3, available on the Arthritis & Rheu-matology website at http://onlin elibr ary.wiley.com/doi/10.1002/art.41665/ abstract). All of these patients were receiving specific PAH treatment, but we did not observe any apparent correlation between the clinical effect parameters and increase in VEGF- C levels (data not shown).
Outcomes based on new PH criteria. We repeated all analyses in the assembled RHC cohort by applying the recently proposed 6th World Symposium PH criteria for PAH diagnosis. With these criteria, the number of patients diagnosed as having PAH and those with no PAH differed slightly from the numbers
obtained by applying the ESC/ERS 2015 guidelines, but this had only a minor impact on the results (see Supplementary Figure 4 and Supplementary Tables 4– 6, available on the Arthritis & Rheu-matology website at http://onlin elibr ary.wiley.com/doi/10.1002/art.41665/ abstract).
DISCUSSION
It appears that early diagnosis and up- front medical treat-ment is crucial to improve outcomes in SSc- PAH. Thus, there is an unmet need for early and specific PAH markers in SSc to identify patients prone to early PAH development. In this study, we found that circulating VEGF- C levels were associated with the develop-ment of PAH in patients with SSc, and VEGF- C and sVEGFR- 3 levels were predictive of the development of PAH. These findings indicate that VEGF- C is a promising marker for SSc- PAH, and draw attention to the potential roles of lymphatic markers in the pathogenesis of SSc- PAH.
Major strengths of this study include the size and composi-tion of the study cohorts assessed. First, we identified interest-ing associations between lymphangiogenesis markers and PAH in a large, unselected SSc cohort. We then performed validation analyses in an independent cohort enriched for PAH cases, con-sisting of exclusively SSc patients who had undergone at least 1 RHC examination that was performed due to clinical suspicion of PH. In both cohorts, we had comprehensive clinical and demo-graphic longitudinal data available for all patients. This allowed us to conclude that the 2 cohorts had comparable characteristics,
Table 3. Predictors of PAH development in SSc patients having undergone RHC*
Model, variable HR (95% CI) PHarrell’s C- index†
Model 1VEGF- C levels (ng/ml), per 1SD change 0.53 (0.29– 0.97) 0.040 0.62Male 1.77 (0.65– 4.79) 0.263Age (years) at onset 1.00 (0.98– 1.03) 0.729
Model 2sVEGFR- 3 levels (ng/ml), per 1SD change 1.21 (1.01– 1.45) 0.042 0.69Male 2.93 (0.74– 11.63) 0.126Age (years) at onset 0.98 (0.95– 1.02) 0.273
Model 3sPAP (mm Hg), per 1SD change 2.26 (1.81– 2.81) <0.001 0.79Male 2.63 (1.02– 6.77) 0.044Age (years) at onset 0.99 (0.97– 1.02) 0.701
Model 4NYHA functional class III or IV 9.19 (4.13– 20.46) <0.001 0.78Male 1.31 (0.51– 3.35) 0.578Age (years) at onset 0.99 (0.97– 1.03) 0.887
Model 5DLco (% predicted), per 1SD change 0.41 (0.26– 0.63) <0.001 0.76Male 1.62 (0.56– 4.70) 0.373Age (years) at onset 1.01 (0.99– 1.03) 0.361
* Results were determined in multivariable Cox regression analyses adjusted for age and sexin 33 SSc patents with serum samples available from >6 months prior to PAH diagnosis for measurement of lymphangiogenic factors. HR = hazard ratio; 95% CI = 95% confidence interval (see Table 1 for other definitions). † The Harrell’s C- index indicates the strength (sensitivity and specificity) of the predictive model.

LYMPHANGIOGENIC FACTORS IN SSc- RELATED PAH | 1285
and therefore it was possible to assemble this RHC cohort for increasing power in the final, multivariable analyses. The only clin-ical data that differed substantially between the OUS and USZ cohorts were the NT- pro BNP levels, without any obvious reason. The results and units have been controlled, and we did not identify any systematic error.
The study also has some limitations. Since this was an obser-vational cohort study, the serum samples were not matched to time of PAH diagnosis in all patients. Moreover, the number of serial serum samples was low, and there were variations in the length of patient observation and disease duration. Another limi-tation is the low number of RHC- verified PAH cases, despite the large number of included patients (n = 520), mirroring the chal-lenge with rare diseases.
The interaction between VEGF- C and VEGFR- 3 is critical for proper development of lymphatic vessels (35), while deregulation of the VEGF- C/sVEGFR- 3 axis appears to play a role in disease pathogenesis, including the development of PAH involving lym-phatic vessels (12,36,37). Previous studies showed high expres-sion levels of VEGFR- 3 and increased lymphangiogenesis in the lung tissue from mice with PAH, and recent work implicated the axis in genetically determined human PAH (38). The data on poten-tial roles of VEGF- C in SSc are limited. An early study showed associations between serum VEGF- C levels and SSc, but did not include analyses of PAH (39). Very recently, in vitro work showed that serum from SSc patients displayed down- regulated VEG-FR- 3 in microvascular endothelial cells, indicating that inhibition of SSc- related lymphangiogenesis occurs (40). Taken together, the findings from these studies implicate VEGF- C and sVEGFR- 3 in SSc and PAH development.
We focused the analyses on patients developing PAH com-pared to those with no PH. Since PAH patients had lower serum levels of VEGF- C when compared to patients with no PH, we determined a cutoff value for “low” VEGF- C and “high” VEGF- C. With this approach, we were able to show that a low VEGF- C level was associated with PAH and was predictive of the devel-opment of PAH in multivariable regression analysis, in the same range as other known clinical variables. This finding indicates that a decrease in the levels of VEGF- C may occur prior to the devel-opment of clinical PAH, and provides rationale for studies on the role of lymphatic structure in PAH development.
Interestingly, we observed a strong negative correlation between VEGF- C and sVEGRF- 3 in patients with border-line increased mPAP, indicating that there are time- dependent changes in the interactions between VEGF- C and sVEGFR- 3 during development of PAH. We speculate that the strong cor-relation in early- phase (borderline) PAH reflects physiologic neg-ative feedback mechanisms that are lost as PAH manifestations become more advanced.
DLco has previously been shown to be significantly associ-ated with PAH (41). In our analysis, the DLco% value was sig-nificantly associated with PAH, in combination with the VEGF- C
serum level, but, somewhat surprisingly, no association was observed when other clinical parameters, such as dyspnea and echocardiographic findings, were added.
New criteria sets for PH diagnosis were proposed at the 6th World Symposium on PH (32), but since these criteria are not yet validated, we chose to primarily apply the established ESC/ERS 2015 criteria (28). We did however perform parallel analyses using the new criteria, and found no difference in the results com-pared to that using the 2015 criteria (Supplementary Tables 4– 6 [http://onlin elibr ary.wiley.com/doi/10.1002/art.41665/ abstract]).
In the patients for whom we had access to serial serum samples from before and after PAH diagnosis, we saw that VEGF- C levels often increased after PAH diagnosis. We specu-late that this increase is related to the initiation of PAH treatment, but found no correlation between changes in the VEGF- C level and effects of therapy, possibly due to low sample size. How-ever, the time between measurements was not standardized, due to the observational nature of the study potentially influenc-ing these results.
In conclusion, VEGF- C appears promising as a circulat-ing marker for PAH development in SSc, but we need prospective studies to fully determine its potential. We believe that molecu-lar work elucidating lymphangiogenesis in SSc- PAH is of impor-tance and high interest, as this could identify novel targets for PAH treatment.
ACKNOWLEDGMENTS
We are grateful to the Immunology Laboratory at OUS for their guidance and for providing the equipment for multiplex bead analysis.
AUTHOR CONTRIBUTIONS
All authors were involved in drafting the article or revising it critically for important intellectual content, and all authors approved the final version to be published. Dr. Hoffmann- Vold had full access to all of the data in the study and takes responsibility for the integrity of the data and the accuracy of the data analysis.Study conception and design. Didriksen, Molberg, Hoffmann- Vold.Acquisition of data. Didriksen, Molberg, Fretheim, Gude, Jordan, Brunborg, Palchevskiy, Garen, Midtvedt, Andreassen, Distler, Belperio, Hoffmann- Vold.Analysis and interpretation of data. Didriksen, Molberg, Brunborg, Belperio, Hoffmann- Vold.
REFERENCES 1. Salazar G, Mayes MD. Genetics, epigenetics, and genomics of sys-
temic sclerosis. Rheum Dis Clin North Am 2015;41:345– 66.
2. Hao Y, Thakkar V, Stevens W, Morrisroe K, Prior D, Rabusa C, et al. A comparison of the predictive accuracy of three screening models for pulmonary arterial hypertension in systemic sclerosis. Arthritis Res Ther 2015;17:7.
3. Le Pavec J, Humbert M, Mouthon L, Hassoun PM. Systemic sclerosis- associated pulmonary arterial hypertension [review]. Am J Respir Crit Care Med 2010;181:1285– 93.
4. Corrado A, Correale M, Mansueto N, Monaco I, Carriero A, Mele A, et al. Nailfold capillaroscopic changes in patients with idiopathic

DIDRIKSEN ET AL 1286 |
pulmonary arterial hypertension and systemic sclerosis- related pul-monary arterial hypertension. Microvasc Res 2017;114:46– 51.
5. Hoffmann- Vold AM, Hesselstrand R, Fretheim H, Ueland T, Andreassen AK, Brunborg C, et al. CCL21 as a potential serum biomarker for pulmonary arterial hypertension in systemic sclerosis. Arthritis Rheumatol 2018;70:1644– 53.
6. Rossi A, Sozio F, Sestini P, Renzoni EA, Khan K, Denton CP, et al. Lymphatic and blood vessels in scleroderma skin, a morphometric analysis. Hum Pathol 2010;41:366– 74.
7. Manetti M, Milia AF, Guiducci S, Romano E, Matucci- Cerinic M, Ibba- Manneschi L. Progressive loss of lymphatic vessels in skin of patients with systemic sclerosis. J Rheumatol 2011;38:297– 301.
8. Tutunea- Fatan E, Majumder M, Xin X, Lala PK. The role of CCL21/CCR7 chemokine axis in breast cancer- induced lymphangiogenesis. Mol Cancer 2015;14:35.
9. Zhao T, Zhao W, Meng W, Liu C, Chen Y, Sun Y. Vascular endothelial growth factor- C: its unrevealed role in fibrogenesis. Am J Physiol Heart Circ Physiol 2014;306:H789– 96.
10. Nurmi H, Saharinen P, Zarkada G, Zheng W, Robciuc MR, Alitalo K. VEGF- C is required for intestinal lymphatic vessel maintenance and lipid absorption. EMBO Mol Med 2015;7:1418– 25.
11. Karkkainen MJ, Haiko P, Sainio K, Partanen J, Taipale J, Petrova TV, et al. Vascular endothelial growth factor C is required for sprouting of the first lymphatic vessels from embryonic veins. Nat Immunol 2004;5:74– 80.
12. Hwangbo C, Lee HW, Kang H, Ju H, Wiley DS, Papangeli I, et al. Modulation of endothelial bone morphogenetic protein receptor type 2 activity by vascular endothelial growth factor receptor 3 in pulmo-nary arterial hypertension. Circulation 2017;135:2288– 98.
13. Hamid R, Cogan JD, Hedges LK, Austin E, Phillips JA III, Newman JH, et al. Penetrance of pulmonary arterial hypertension is mod-ulated by the expression of normal BMPR2 allele. Hum Mutat 2009;30:649– 54.
14. Thurston G, Daly C. The complex role of angiopoietin- 2 in the angiopoietin- tie signaling pathway. Cold Spring Harb Perspect Med 2012;2:a006550.
15. Moritz F, Schniering J, Distler JH, Gay RE, Gay S, Distler O, et al. Tie2 as a novel key factor of microangiopathy in systemic sclerosis. Arthritis Res Ther 2017;19:105.
16. Gale NW, Thurston G, Hackett SF, Renard R, Wang Q, McClain J, et al. Angiopoietin- 2 is required for postnatal angiogenesis and lym-phatic patterning, and only the latter role is rescued by angiopoie-tin- 1. Dev Cell 2002;3:411– 23.
17. Wu X, Liu N. The role of ang/tie signaling in lymphangiogenesis [review]. Lymphology 2010;43:59– 72.
18. Li C, Fan J, Song X, Zhang B, Chen Y, Li C, et al. Expression of angiopoietin- 2 and vascular endothelial growth factor recep-tor- 3 correlates with lymphangiogenesis and angiogenesis and affects survival of oral squamous cell carcinoma. PLoS One 2013;8:e75388.
19. Hoffmann- Vold AM, Gunnarsson R, Garen T, Midtvedt Ø, Molberg Ø. Performance of the 2013 American College of Rheumatology/European League Against Rheumatism classification criteria for sys-temic sclerosis (SSc) in large, well- defined cohorts of SSc and mixed connective tissue disease. J Rheumatol 2015;42:60– 3.
20. Hoffmann- Vold AM, Fretheim H, Midtvedt O, Kilian K, Angelshaug M, Chaudhary A, et al. Frequencies of borderline pulmonary hyper-tension before and after the DETECT algorithm: results from a prospective systemic sclerosis cohort. Rheumatology (Oxford) 2018;57:480– 7.
21. Jordan S, Maurer B, Toniolo M, Michel B, Distler O. Performance of the new ACR/EULAR classification criteria for systemic sclerosis in clinical practice. Rheumatology (Oxford) 2015;54:1454– 8.
22. Hoffmann- Vold AM, Aaløkken TM, Lund MB, Garen T, Midtvedt O, Brunborg C, et al. Predictive value of serial high- resolution computed tomography analyses and concurrent lung function tests in systemic sclerosis. Arthritis Rheumatol 2015;67:2205– 12.
23. Hoffmann- Vold AM, Tennoe AH, Garen T, Midtvedt O, Abraityte A, Aaløkken TM, et al. High level of chemokine CCL18 is asso-ciated with pulmonary function deterioration, lung fibrosis pro-gression, and reduced survival in systemic sclerosis. Chest 2016;150:299– 306.
24. Hansell DM, Bankier AA, MacMahon H, McLoud TC, Muller NL, Remy J. Fleischner Society: glossary of terms for thoracic imaging. Radiology 2008;246:697– 722.
25. Quanjer PH, Tammeling GJ, Cotes JE, Pedersen OF, Peslin R, Yernault JC. Lung volumes and forced ventilatory flows. Eur Respir J Suppl 1993;16:5– 40.
26. Coghlan JG, Wolf M, Distler O, Denton CP, Doelberg M, Harutyunova S, et al. Incidence of pulmonary hypertension and determining factors in patients with systemic sclerosis. Eur Respir J 2018;51:1701197.
27. Coghlan JG, Denton CP, Grünig E, Bonderman D, Distler O, Khanna D, et al. Evidence- based detection of pulmonary arterial hypertension in systemic sclerosis: the DETECT study. Ann Rheum Dis 2014;73:1340– 9.
28. Galie N, Humbert M, Vachiery JL, Gibbs S, Lang I, Torbicki A, et al. 2015 ESC/ERS guidelines for the diagnosis and treatment of pul-monary hypertension: the Joint Task Force for the Diagnosis and Treatment of Pulmonary Hypertension of the European Society of Cardiology (ESC) and the European Respiratory Society (ERS): endorsed by: Association for European Paediatric and Congenital Cardiology (AEPC), International Society for Heart and Lung Transplantation (ISHLT). Eur Heart J 2016;37:67– 119.
29. Gude E, Simonsen S, Geiran OR, Fiane AE, Gullestad L, Arora S, et al. Pulmonary hypertension in heart transplantation: discrepant prognos-tic impact of pre- operative compared with 1- year post- operative right heart hemodynamics. J Heart Lung Transplant 2010;29:216– 23.
30. Goh NS, Desai SR, Veeraraghavan S, Hansell DM, Copley SJ, Maher TM, et al. Interstitial lung disease in systemic sclerosis. Am J Respir Crit Care Med 2008;177:1248– 54.
31. Hoeper MM, Bogaard HJ, Condliffe R, Frantz R, Khanna D, Kurzyna M, et al. Definitions and diagnosis of pulmonary hypertension. J Am Coll Cardiol 2013;62 Suppl:D42– 50.
32. Galiè N, McLaughlin VV, Rubin LJ, Simonneau G. An overview of the 6th World Symposium on Pulmonary Hypertension. Eur Respir J 2019;53:1802148.
33. Beyer C, Distler JH, Allanore Y, Aringer M, Avouac J, Czirjak L, et al. EUSTAR biobanking: recommendations for the collection, storage and distribution of biospecimens in scleroderma research. Ann Rheum Dis 2011;70:1178– 82.
34. Hoffmann- Vold AM, Allanore Y, Alves M, Brunborg C, Airó P, Ananieva LP, et al. Progressive interstitial lung disease in patients with systemic sclerosis- associated interstitial lung disease in the EUSTAR database. Ann Rheum Dis 2021;80:219– 27.
35. Rauniyar K, Jha SK, Jeltsch M. Biology of vascular endothelial growth factor C in the morphogenesis of lymphatic vessels [review]. Front Bioeng Biotechnol 2018;6:7.
36. Karaman S, Leppänen VM, Alitalo K. Vascular endothelial growth fac-tor signaling in development and disease. Development 2018;145: dev151019.
37. Hagura A, Asai J, Maruyama K, Takenaka H, Kinoshita S, Katoh N. The VEGF- C/VEGFR3 signaling pathway contributes to resolving chronic skin inflammation by activating lymphatic vessel function. J Dermatol Sci 2014;73:135– 41.
38. Zhang P, Tian AW, Tu AB, Jiang X, Nicolls MR. Increased lym-phangiogenesis in animal models of pulmonary arterial hypertension [abstract]. Am J Respir Crit Care Med 2020;201:A3759.

LYMPHANGIOGENIC FACTORS IN SSc- RELATED PAH | 1287
39. Chitale S, Al- Mowallad AF, Wang Q, Kumar S, Herrick A. High cir-culating levels of VEGF- C suggest abnormal lymphangiogenesis insystemic sclerosis [letter]. Rheumatology (Oxford) 2008;47:1727– 8.
40. Manetti M, Romano E, Rosa I, Fioretto BS, Guiducci S, Bellando- Randone S, et al. Systemic sclerosis serum significantly impairs the
multi- step lymphangiogenic process: in vitro evidence. Int J Mol Sci 2019;20:6189.
41. Steen V, Medsger TA Jr. Predictors of isolated pulmonary hyper-tension in patients with systemic sclerosis and limited cutaneousinvolvement. Arthritis Rheum 2003;48:516– 22.
1288
Arthritis & RheumatologyVol. 73, No. 7, July 2021, pp 1288–1300DOI 10.1002/art.41657© 2021, American College of Rheumatology
Expression Quantitative Trait Locus Analysis in Systemic Sclerosis Identifies New Candidate Genes Associated With Multiple Aspects of Disease PathologyMartin Kerick,1 David González- Serna,1 Elena Carnero- Montoro,2 Maria Teruel,2 Marialbert Acosta- Herrera,1 Zuzanna Makowska,3 Anne Buttgereit,3 Sepideh Babaei,3 Guillermo Barturen,2 Elena López- Isac,1 PRECISESADS Clinical Consortium, Ralf Lesche,3 Lorenzo Beretta,4 Marta E. Alarcon- Riquelme,2 and Javier Martin1
Objective. To identify the genetic variants that affect gene expression (expression quantitative trait loci [eQTLs]) in systemic sclerosis (SSc) and to investigate their role in the pathogenesis of the disease.
Methods. We performed an eQTL analysis using whole- blood sequencing data from 333 SSc patients and 524 controls and integrated them with SSc genome- wide association study (GWAS) data. We integrated our findings from expression modeling, differential expression analysis, and transcription factor binding site enrichment with key clinical features of SSc.
Results. We detected 49,123 validated cis- eQTLs from 4,539 SSc- associated single- nucleotide polymorphisms (SNPs) (PGWAS < 10−5). A total of 1,436 genes were within 1 Mb of the 4,539 SSc-associated SNPs. Of those 1,436 genes, 565 were detected as having ≥1 eQTL with an SSc-associated SNP. We developed a strategy to prioritize disease- associated genes based on their expression variance explained by SSc eQTLs (r2 > 0.05). As a result, 233 candidates were identified, 134 (58%) of them associated with hallmarks of SSc and 105 (45%) of them differentially expressed in the blood cells, skin, or lung tissue of SSc patients. Transcription factor binding site analysis revealed enriched motifs of 24 transcription factors (5%) among SSc eQTLs, 5 of which were found to be differentially regulated in the blood cells (ELF1 and MGA), skin (KLF4 and ID4), and lungs (TBX4) of SSc patients. Ten candidate genes (4%) can be targeted by approved medications for immune- mediated diseases, of which only 3 have been tested in clinical trials in patients with SSc.
Conclusion. The findings of the present study indicate a new layer to the molecular complexity of SSc, contributing to a better understanding of the pathogenesis of the disease.
INTRODUCTION
Systemic sclerosis (SSc) is a chronic rheumatic autoimmune disease with a high degree of clinical heterogeneity that affects the
connective tissue (1), and with one of the highest mortality rates among rheumatic diseases (2). The pathogenesis of SSc is often characterized by a triad of hallmarks: immune dysfunction, fibro-sis, and vasculopathy. Immune dysfunction involves autoimmune
Presented by Mr. González- Serna in partial fulfillment of the requirements for a PhD degree, Institute of Parasitology and Biomedicine López- Neyra, CSIC, Granada, Spain.
Supported by the Innovative Medicines Initiative Joint Undertaking PRECISE Systemic Autoimmune Diseases Project (grant 115565), the Span-ish Ministry of Science and Innovation (grants RTI2018101332- B- 100 and SAF2015- 66761- P), and the Red de Investigación en Inflamación y Enfermedades Reumáticas through the Instituto de Salud Carlos III (grant RD16/0012/0013). The Genotype- Tissue Expression Project was supported by the National Cancer Institute, National Human Genome Research Institute, National Heart, Lung, and Blood Institute, National Institute on Drug Abuse, National Institute of Mental Health, and National Institute of Neurological Disorders and Stroke, NIH and by the NIH Common Fund. Mr. González- Serna’s work was supported by the Spanish Ministry of Economy and Competitiveness FPI Program (grant SAF2015- 66761- P). Dr. Acosta- Herrera’s work was supported by the Spanish Ministry of Science and Innovation Juan de la Cierva Incorporación Program (grant IJC2018- 035131- I).
1Martin Kerick, PhD, David González- Serna, MSc, Marialbert Acosta- Herrera, PhD, Elena López- Isac, PhD, Javier Martin, MD, PhD: Institute of
Parasitology and Biomedicine López- Neyra, CSIC, Granada, Spain; 2Elena Carnero- Montoro, PhD, Maria Teruel, PhD, Guillermo Barturen, PhD, Marta E. Alarcon- Riquelme, MD, PhD: Pfizer– University of Granada– Junta de Andalucía Centre for Genomics and Oncological Research, Granada, Spain; 3Zuzanna Makowska, PhD, Anne Buttgereit, PhD, Sepideh Babaei, PhD, Ralf Lesche, PhD: Bayer, Berlin, Germany; 4Lorenzo Beretta, MD: Referral Center for Systemic Autoimmune Diseases, Fondazione IRCCS Ca’ Granda Ospedale Maggiore Policlinico di Milano, Milan, Italy.
Dr. Kerick and Mr. González- Serna contributed equally to this work. Drs. Alarcon- Riquelme and Martin contributed equally to this work.
Drs. Makowska, Buttgereit, Babaei, and Lesche own stock or stock options in Bayer. No other disclosures relevant to this article were reported.
Address correspondence to Javier Martin, MD, PhD, Bases genéticas de las enfermedades autoinmunes, Instituto de Parasitología y Biomedicina, Parque Tecnológico de Ciencias de la Salud, Avenida del Conocimiento s/n 18016, Granada, Spain. Email: [email protected].
Submitted for publication June 19, 2020; accepted in revised form January 12, 2021.

EXPRESSION QUANTITATIVE TRAIT LOCUS ANALYSIS IN SSc | 1289
processes and inflammation as a result of an imbalance in T cell, B cell, and macrophage activation (1). Fibrosis occurs as a result of the activation of fibroblasts, epithelial– mesenchymal transition, and excessive extracellular matrix deposition (3). Vasculopathy typically consists of a loss of small vessels followed by impaired compensatory vasculogenesis and angiogenesis (4). The relation-ship between immune dysfunction, vascular damage, and fibrosis remains fairly unknown.
Like most autoimmune diseases, SSc has a complex etiol-ogy and a poorly understood genetic component. In this regard, substantial efforts have been made to identify genetic features that contribute to disease susceptibility. To date, large- scale genetic studies have identified up to 27 loci associated with SSc at the genome- wide level of significance (P < 5.0 × 10⁻⁸) (5– 7), including the HLA region (8). Those studies provide invaluable information on disease etiopathogenesis, contributing to drug discovery and repurposing (9,10). Nevertheless, most of the single- nucleotide polymorphisms (SNPs) associated with SSc map to noncoding regions of the genome.
A number of SSc- associated loci could be involved in the regulation of gene expression, acting as expression quantita-tive trait loci (eQTLs), which have a widespread presence in the genome (11). Analysis of eQTLs can provide a mechanical link between a variant and its effect on gene expression, and mul-tiple eQTLs can be used to explain or model gene expression variance. In this regard, eQTL analyses have been successfully conducted in other autoimmune diseases such as systemic lupus erythematosus (SLE) and rheumatoid arthritis (RA), among oth-ers (12,13). Interestingly, variants mapped to noncoding enhancer regions across 6 autoimmune diseases led to the development of a multiple- enhancer variant hypothesis. According to this theory, the contribution of several SNPs in linkage disequilibrium at the same loci can influence multiple enhancers and be assigned to common pathways (12). Furthermore, eQTLs have been identi-fied in specific cell subsets (14) and have been applied to autoim-mune disease prognostics (15), which illustrates the relevance of these analyses in understanding the pathogenesis of the autoim-mune process. In this study, we aimed to explore the cis- genetic effects of SSc- associated risk loci on expression and performed an eQTL analysis using whole- blood RNA sequencing data from 857 samples.
PATIENTS AND METHODS
Patients and controls. For additional details regarding all methods, see the Supplementary Methods, available on the Arthritis & Rheumatology website at http://onlin elibr ary.wiley.com/doi/10.1002/art.41657/ abstract. This study included 333 patients of European descent who were diagnosed as hav-ing SSc according to the American College of Rheumatology (ACR)/European Alliance of Associations for Rheumatology (EULAR) 2013 criteria (16) and were participants in the PRECISE
Systemic Autoimmune Diseases (PRECISEADS) project (https://clini caltr ials.gov/ct2/show/NCT02 890134). See Appendix A for members of the PRECISESADS Clinical Consortium. A total of 524 age- and sex- matched controls without known autoimmune disease were selected. Patients and controls were randomly grouped into equal size discovery and validation sets, matched for age, sex, and medication use. Supplementary Table 1, availa-ble on the Arthritis & Rheumatology website at http://onlin elibr ary.wiley.com/doi/10.1002/art.41657/ abstract, describes the charac-teristics of the 2 patient sets. All patients and controls gave written informed consent, which was approved by local ethics committees. For additional details on ethics approvals, see the Supplementary Methods, available on the Arthritis & Rheumatology website at http://onlin elibr ary.wiley.com/doi/10.1002/art.41657/ abstract.
RNA sequencing and genotyping. RNA sequencing data were obtained and processed as described by Beretta et al (17). Genetic data were obtained using the Illumina SNP chip genome- wide association study (GWAS) platforms HumanCore- 12- v1, Infinium CoreExome- 24v1- 2, and Infinium CoreExome- 24v1- 3. Only SNPs typed on all 3 platforms were used for imputation and analysis. Samples were subjected to strict quality filtering ana-lyzed for ancestry and identity. Imputation was performed on the Michigan Imputation Server and filtered for quality, minor allele fre-quency (MAF) > 0.05, and Hardy- Weinberg equilibrium. Raw data are the property of the PRECISESADS Consortium. Metadata and aggregated data are available upon request from the correspond-ing author.
Detection of eQTLs. RNA- Seq and genetic data were checked to exclude mismatched samples using sex prediction and genotype mismatches using an in- house pipeline. Our anal-ysis was limited to 4,539 candidate SNPs that showed at least a suggestive level of association with SSc (PGWAS < 1 × 10⁻⁵ in the study by López- Isac et al [5]). SNPs with high linkage disequilib-rium (≥0.8) were added to the candidate SNPs, totaling 13,253 SNPs. We used the Matrix eQTL R package (18) and fit a lin-ear regression model that tests the influence of the number of risk alleles on gene expression residuals obtained by correcting for potential confounders (i.e., population substructure) using the strategy described by Westra et al (12) based on principal com-ponents. For SNPs with a MAF of <0.1, we additionally calculated a dominant model to keep in check excessive influence of low numbers of homozygotes of the minor allele. The eQTLs of SNPs with a MAF of <0.1 were discarded if they were not significant at a false discovery rate (FDR) of <0.05 in both the linear and dom-inant models.
Our analyses were focused on cis- eQTLs in a window of 1 mil-lion bp around the transcription start site of a gene, which implies 1,436 genes, given the 13,253 candidate SNPs. The eQTLs were identified for the SSc and control groups separately to avoid inter-action effects, and we split the groups equally into discovery and

KERICK ET AL 1290 |
replication sets. An FDR of <0.05 defined significant genetic effects on gene expression. The eQTLs were considered validated if they were found in 2 sets, using a stringent cutoff (FDR <0.05) in one set and a nominal P value cutoff (P < 0.05) in the other. To expand on sensitivity and to aid finding SSc- specific eQTLs we created a “val-idated across groups” set of eQTLs, using the strategy described above, but this time validating eQTLs obtained from all SSc sam-ples with eQTLs obtained from all control samples and vice versa. In the first run, eQTLs and genes whose expression was associ-ated with ≥1 eQTL (eGenes) were detected for SNPs associated with SSc. In the second run, we detected eQTLs for all SNPs within a distance of 1 Mb of an eGene detected in the first run, including SNPs unrelated to SSc.
SSc eQTLs were identified as “SSc- specific” if the eQTL was validated using the 2 SSc subsets and was not found in any of the control data sets or the validated- across- groups data set at a nominal cutoff level of 0.1. Candidate SSc- specific eQTLs were compared to public databases of blood eQTLs from healthy sub-jects (Genotype- Tissue Expression [GTEx] Project V7) (11,12); 27% of these eQTLs had proxy SNPs, which were found with their respective gene in one of these databases and were no longer considered SSc- specific. We repeated eQTL detection for the subset of SSc patients who had received no known medication, following the discovery and replication strategy described above to find additional SSc- specific eQTLs.
Stepwise linear regression (forward selection). Inde-pendent eQTL signals that influence the expression of a gene were determined following a stepwise linear regression procedure. Forward selection was repeated until no additional signal was detected at a nominal P level of P < 0.05. This was done for SNP– eGene combinations obtained from the analysis described above.
Differential expression analysis. The edgeR package in R was used to calculate differential expression in the 7 most abundant cell types using cellular composition of whole blood as a covariate, as estimated from expression profiles using CIBER-SORT (19). Additional covariates were disease, sex, age, medica-tion, and age– cell, medication– cell, disease– sex, and disease– age interactions. For additional details, see the Supplementary Meth-ods, available on the Arthritis & Rheumatology website at http://onlin elibr ary.wiley.com/doi/10.1002/art.41657/ abstract. Differen-tial expression data for skin and lung tissues were obtained either from published tables (20,21) or by using the default analysis in GEO (GEO2R) with the GSE58095 data set comparing all cases against all controls.
Transcription factor binding site analysis. Only the SSc- associated SNPs (PGWAS < 10−5) that were part of the best expression models obtained by stepwise linear regression analy-sis (forward selection) were analyzed. Using the R package TFB-STools (22), we obtained all potential transcription factor binding
sites and scored the effect of each SNP on transcription factor binding. If enrichment was significant (FDR <0.1) for ≥3 scores, the overall enrichment of the particular transcription factor bind-ing site was considered significant. To calculate enrichment, Fish-er’s exact test was performed with a random selection of 50,000 eQTLs from the GTEx database V7 (matched for MAF and dis-tance to transcription start site) as background.
Drug target analysis. We retrieved 2,384 different drugs and their 1,138 target genes from the Open Targets database in October 2019. Medications used for rheumatic and skin- related diseases were extracted from the same database, yielding 542 drugs currently used to treat these diseases.
Tissue enrichment analysis. A baseline enrichment of blood eQTLs was calculated in all tissues using the GTEx data-base V7. Using a z- test, we investigated whether the enrichment of blood eQTLs obtained in this study was even higher than the baseline enrichment of all tissues.
RESULTS
Study design, gene and eQTL numbers, and com parison to external data sets. We aimed to explore the cis- genetic effects of SSc- associated risk loci on expression in SSc and control data sets to detect potential disease- specific eQTLs and to model gene expression variation for gene prioritization. Pri-oritized genes were analyzed for SSc hallmarks and drug repur-posing, and selected eQTLs were analyzed for transcription factor binding site and tissue enrichment. Supplementary Figure 1, avail-able on the Arthritis & Rheumatology website at http://onlin e library.wiley.com/doi/10.1002/art.41657/ abstract, gives an over-view of all analyses performed.
A total of 18,507 and 38,600 replicated cis- eQTLs were identified in SSc patients and controls, respectively, affect-ing the expression of 137 and 200 genes (eGenes), respec-tively. After validating across groups of eQTLs found in all SSc patients with eQTLs found in controls, and vice versa, a total of 49,123 eQTLs were identified, influencing 236 eGenes with a median of 73 eQTLs per gene. The maximum number of eGenes detected in any of the data sets at a nominal level (P < 0.01) was 565, among them 64 long noncoding RNAs like XXbac- BPG181B23.7 (lnc- HLA– B- 2:3), TAPSAR1, or HCG11 (see Supplementary Table 2, available on the Arthri-tis & Rheumatology website at http:// onlin e libr ary.wiley.com/doi/10.1002/art.41657/ abstract).
The eQTLs (a) of the 2 discovery sets, (b) validated across groups, and (c) at the intersection of validated control and vali-dated SSc eQTLs were compared against the GTEx database, and 66%, 15%, and 8% unknown eQTLs, respectively, were found, which depicts the different levels of stringency of our setup. Of interest, 95% of the eQTLs in our whole- blood data set that

EXPRESSION QUANTITATIVE TRAIT LOCUS ANALYSIS IN SSc | 1291
overlapped with the GTEx database were found in multiple tissues according to GTEx.
SSc- specific eQTLs. The eQTLs replicated in SSc whole blood were compared to eQTLs observed in control data sets with low stringency (nominal P < 0.1). We found 59 eQTLs from 16 genes potentially specific to SSc. Repeating our analysis in a subset of patients who did not receive immunomodulating drugs revealed 28 additional eQTLs and 6 additional genes. In- depth comparison to known blood eQTLs from heathy controls (GTEx V7) (11,12) and their proxies (r2 > 0.8) excluded 24 eQTLs
(27%) from being SSc- specific. Careful examination suggested eQTLs from HLA– B, NCR3, RAF1, NEU1, HLA– DQA1, HLA– DOB, HID1, and IER3 to be the best candidates for SSc- specific eQTLs (Figure 1 and Supplementary Figure 2, available on the Arthritis & Rheumatology website at http://onlin elibr ary.wiley.com/doi/10.1002/art.41657/ abstract).
Enrichment of blood eQTLs in tissues affected by disease. We explored whether the validated blood eQTLs from SSc patients could be interpreted in other contexts beyond immunity. The GTEx database provides a comprehensive overview of eQTL
Figure 1. Expression quantitative trait loci found in patients with systemic sclerosis (SSc) (blue) but not in controls (gray). Residual expression levels, determined using principal components analysis, of the genes HLA– B (A), NCR3 (B), IER3 (C), and RAF1 (D) are shown for the indicated genotypes in controls and SSc patients. The number of minor alleles, the risk genotype, and single- nucleotide polymorphisms are indicated on the x- axis. Data are shown as box plots. Each box represents the 25th to 75th percentiles. Lines inside the boxes represent the median. Lines outside the boxes represent the 10th and 90th percentiles. Circles represent individual subjects.

KERICK ET AL 1292 |
sharing among 49 different tissues. Using a meta- analysis pub-lished by GTEx V7, we found that only 6% of eQTLs are tissue- specific, 81% have been detected in ≥5 tissues, and 15% are present in >90% of tissues. This clearly shows that eQTLs detected in blood can be interpreted functionally in other tissues. Indeed, 95% of the GTEx- known eQTLs detected in this study are found in ≥10 different tissues apart from blood. We investigated whether the eQTLs identified in our study were enriched in the GTEx eQTLs of non- blood tissues to test our assumptions on interpretability beyond the context of whole blood. A significant enrichment was found in 19 tissues (Figure 2), the majority of which can readily be interpreted in the context of SSc, as the disease affects many tissues, such as the lungs, heart, and esophagus.
Expression variance explained (EVE) can be used to prioritize SSc eQTLs and SSc eGenes. While many eGenes with an SSc- specific eQTL can probably explain the pathogenesis of SSc at least partially (Supplementary Table 2, available on the Arthritis &
Rheumatology website at http://onlin elibr ary.wiley.com/doi/10.1002/art.41657/ abstract), we decided to focus on the candidate eGenes that are most affected by SSc genetics.
To measure the influence of genetics on gene expression, we used a stepwise modeling procedure to obtain independent eQTLs per gene and calculate the EVE. Comparing the EVE using only SSc- specific eQTLs (EVESSc) against the EVE using all eQTLs (EVEall; including eQTLs unrelated to SSc) we obtained a meas-ure (ratio) of how much EVE can be attributed to SSc genetics. Figure 3A depicts a comparison of the 2 calculated EVE values. For 104 eGenes (18%), the EVE differed by <30%. One hundred thirty eGenes (23%) showed stronger differences in EVE, but still had an EVESSc of >0.05 (r2 > 0.05). The remaining 331 eGenes had a low EVESSc (< 0.05), and the EVE differed by >30%. This comparison distinguished 3 groups with high, intermediate, and low influence of SSc genetics.
Three groups of eGenes were identified based on the impact that SSc genetics had on their expression. We analyzed these
Figure 2. Enrichment of blood expression quantitative trait loci in disease- relevant tissues in patients with systemic sclerosis. Asterisks inside the bars indicate the level of significance adjusted for multiple testing (false discovery rate), corresponding to the values shown on the right. GTEx = Genotype- Tissue Expression.

EXPRESSION QUANTITATIVE TRAIT LOCUS ANALYSIS IN SSc | 1293
groups for enriched pathways (FDR < 0.05) (Supplementary Tables 3 and 4, available on the Arthritis & Rheumatology website at http://onlin elibr ary.wiley.com/doi/10.1002/art.41657/ abstract), and bio-logic processes from gene ontology, and found that 52% of eGenes in the high- or intermediate- impact group (122 of 233) were located in immune- related pathways, as compared to only 17% of eGenes in the low- impact group (Supplementary Table 2). An in- depth review of the literature and gene ontologies helped us assign 66 and 31 eGenes to SSc- related biologic processes linked to fibrosis and vas-culopathy, respectively. Many of these eGenes belong to the high- or intermediate- impact group (Figures 3B– D). The eGenes for which SSc genetics have an intermediate or high impact on expression are most likely to shed light on the complex pathology of this disease.
SSc eGenes grouped by the hallmarks of SSc pathogenesis. Three features of SSc pathogenesis can be attributed to 134 of the 233 eGenes (58%) for which SSc genetics had an intermediate- to- high impact on expression, namely: alter-ation of immune response, fibrosis, and vasculopathy (Table 1 and Supplementary Table 2). The genes implicated in innate and adap-tive immune cell processes represent the largest subgroup, with 122 eGenes. Interestingly, 27 HLA eGenes and 8 eGenes related to interferon (IFN) pathways were identified, including important SSc- associated susceptibility loci dysregulated in SSc (9,23,24). Furthermore, there were 27 SSc eGenes associated with biologic processes related to fibrosis, and 16 eGenes related to vascu-lopathy or angiogenesis. These pathways are considered to be
Figure 3. Gene expression variance explained by expression quantitative trait loci (eQTLs) can distinguish levels of influence of systemic sclerosis (SSc) genetics on expression and prioritize genes affected by eQTLs. The expression variance explained (r2) by eQTLs associated with SSc in a recent genome- wide association study (using single- nucleotide polymorphisms [SNPs] with association P < 10−5) (5) was plotted against the expression variance explained by all eQTLs found within 1 Mb of a gene, whether or not they were associated with SSc. A, Groups of eGenes showing strong (red), intermediate (yellow), or weak (blue) influence of SSc genetics. B– D, Same eGenes as shown in A. Highlighted are eGenes related to B, fibrosis (yellow), C, vascular processes (red), and D, immunity (blue). The eGenes not related to any of these hallmarks are depicted in black.

KERICK ET AL 1294 |
Table 1. Differentially expressed eGenes associated with hallmarks of SSc*
Gene
Impact of SSc genetics on expression
SSc hallmarkDifferential expression
(log2 fold change)†
Immunity Fibrosis Vascular Blood Skin LungsAGER High + − + −5.31 – – BLK High + − − – 0.1 – C2 High + − − – 0.45 – C4A High + − − −19.33 – – C4B High + − − −19.57 – – CCHCR1 High + − − −4.58 – – CFB High + − − – 0.4 – DDAH2 High + − + −4.28 – – HLA– B High + − − −4.49 – – HLA– DPA1 High + − − – 0.34 1.07HLA– DQA1 High + − − – – 1.04HLA– DQB1 High + + − – 0.48 – HLA– DRA High + − − – 0.29 1.09HLA– DRB5 High + − − – – 1.25HLA– DRB6 High + − − – 0.29 – HSPA1B High + − − −7.14 – – LST1 High + − − −5.72 0.23 – LTB High + + − −7.68 0.64 – LY6G5C High + − − −9.78 0.11 – MICA High + − − −6.29 – – MICB High + − − – 0.21 – NCR3 High + − − −9.71 – – NEU1 High + − − – 0.15 – NOTCH4 High + + + – 0.23 – RAB2A High + − − – −0.21 – RNF5 High + − − −4.84 – – TAP1 High + − − – – 1.23TNXB High + + − −7.01 – – AIF1 Intermediate + − − −5.32 – – CCDC104 Intermediate + − − −3.71 – – CD151 Intermediate + − − −6.94 0.3 – CD247 Intermediate + − − −4.27 – – CD40 Intermediate + + + – 0.19 – CTSB Intermediate + + − – 0.4 1.14ELMO1 Intermediate + − − 5.56 – – ERAP1 Intermediate + − + 5.11 – – FLNB Intermediate + + − 3.43 0.13 – GTF2H4 Intermediate + − − – 0.19 – HLA– A Intermediate + − − – 0.25 1.06HLA– DMA Intermediate + − − – 0.36 1.05HLA– DMB Intermediate + − − – 0.32 1.05HLA– DOA Intermediate + − − 5.42 0.2 – HLA– F Intermediate + − − −4.63 – – HLA– H Intermediate + − − – 0.23 0.99HSPA1L Intermediate + − − −4.42 −0.14 – IDUA Intermediate + + − – 0.26 – IER3 Intermediate + − + – – 1.15IFI30 Intermediate + + − −3.78 – – MPI Intermediate + − − −2.73 – – MSRA Intermediate + − − – 0.15 – PSMB8 Intermediate + + + −4.49 – – PSMB9 Intermediate + − − – 0.29 – PXK Intermediate + − − 2.91 – – RXRB Intermediate + − − – 0.15 – SUMO2 Intermediate + − − – −0.21 – TAPBP Intermediate + − − – 0.24 – TNPO3 Intermediate + − − 5.64 – – TUBB Intermediate + − − – 0.16 – UBE2L3 Intermediate + − − −2.25 – –
(Continued)

EXPRESSION QUANTITATIVE TRAIT LOCUS ANALYSIS IN SSc | 1295
potential targets of future disease- modifying therapies for SSc (25). Of interest, we also found 25 eGenes related to apoptotic processes, which support the hypothesis of a relevant role of apoptosis in SSc (26).
Differential expression of SSc eGenes in disease- affected tissues. Given that the SSc- specific eQTLs detected in whole blood were observed to be enriched in other tissues affected by the disease, we decided to analyze the expression of the prioritized 233 SSc eGenes in the skin, lungs, and 7 blood cell types using public data sets (20,21) (GSE58095) and our whole- blood data set, with deconvolution of blood cell compo-sitions. The data are presented in Table 1 and Supplementary Table 2.
One hundred five SSc eGenes (45%) were found to be dif-ferentially regulated in one of the tissues investigated. A total of 57 SSc eGenes (24%) were down- regulated in 1 of the 3 tissues investigated, whereas 55 SSc eGenes (24%) were up- regulated. In addition, 40 SSc eGenes (17%) were differentially expressed in the skin of SSc patients. A total of 11 eGenes (5%) were found to be differentially regulated in the lung samples and lung fibroblast cultures from SSc patients. Differential expression analysis of 7 blood cell types in SSc revealed 72 SSc eGenes (31%), most of which (99%) showed a consistent direction of regulation (up or down) in ≥5 cell types.
Results of transcription factor binding site analysis. We investigated transcription factor binding site enrichment in SSc eQTLs. Only the independent eQTLs included in the models that best predicted eGene expression, as determined by stepwise linear regression, were included. Then, transcription factor bind-ing site enrichment was estimated, as compared to genome- wide eQTLs from the GTEx database, to control for the fact that all transcription factor binding site motifs are highly enriched in eQTL sites in general.
Of the 537 transcription factor binding site profiles assessed (JASPAR database 2018), 24 (5%) were stably enriched (see Patients and Methods) in best- model SSc eQTLs (Supplementary
Table 5, available on the Arthritis & Rheumatology website at http://onlin elibr ary.wiley.com/doi/10.1002/art.41657/ abstract). The transcription factors were of different classes, with 5 home-odomain transcription factors, 4 transcription factors of the T- box type, 4 C2H2 transcription factors, and 2 GATA transcription fac-tors, to name only those with multiple members of the same class. Of the 24 transcription factors, we found 10 and 16 transcription factors expressed in whole blood and skin, respectively, of which 5 transcription factors were differentially regulated (FDR < 0.1) in the skin, lungs, or blood cells from SSc patients (Table 2). KLF4 and ID4 were down- regulated in the skin, TBX4 was up- regulated in the lungs, and ELF and MGA were up- regulated in almost all of the 7 blood cell types assessed (Figure 4 and Supplementary Table 5 and Supplementary Figure 3, available on the Arthritis & Rheu-matology website at http://onlin elibr ary.wiley.com/doi/10.1002/art.41657/ abstract).
Drug repurposing. We explored whether any of the 233 eGenes prioritized in the present study encode target proteins of drugs being tested in ongoing clinical trials, as reported on the Open Targets platform (27). We observed that 15 of the 233 eGenes (6.4%) overlapped with pharmacologic targets of which TNF, BLK, and TUBB have been tested in clinical trials in SSc patients.
Gene
Impact of SSc genetics on expression
SSc hallmarkDifferential expression
(log2 fold change)†
Immunity Fibrosis Vascular Blood Skin LungsUNC119B Intermediate + + − 2.33 – – CLIC1 Intermediate − + − −2.9 – – FLOT1 Intermediate − + − −4.9 0.28 – PHF1 Intermediate − + − −3.38 – – RPS18 Intermediate − + − −9.34 – – SYNGAP1 Intermediate − + − 3.5 – – UQCC2 Intermediate − + − −5.03 – –
* eGenes = genes whose expression was associated with ≥1 expression quantitative trait loci; SSc = systemicsclerosis. † Adjusted P < 0.1 for all values shown.
Table 1. (Cont’d)
Table 2. Differentially expressed transcription factors with enriched binding sites in SSc- associated eQTLs in expression models*
Differential expression (log2 fold change)†
Gene Transcription factor class Blood Skin LungELF1 Ets 4.68 – – MGA T- box 4.3 – – KLF4 C2H2 ZF – −0.36 – ID4 basic helix- loop- helix NE −0.23 – TBX4 T- box NE – 0.74
* SSc = systemic sclerosis; eQTLs = expression quantitative trait loci;NE = not expressed (source: European Bioinformatics Institute Gene Expression Atlas). † Adjusted P < 0.1 for all values shown.

KERICK ET AL 1296 |
Next, we tested whether medications used for other immune- mediated diseases (105 antibody- targeted, 48 kinase inhibitor– targeted, and 195 receptor- targeted drugs; see Patients and Methods) addressed the proteins coded by the SSc eGenes, and we found 5 additional SSc eGenes: LTA, LTB, IL12A, CD40, and RXRB. Further investigation identified ERAP1 and ERAP2, which can be addressed by aminopeptidase inhibitors.
Expression analysis in whole blood, skin, and lung tissues revealed that 6 of the 10 drug- target SSc- specific eGenes are dif-ferentially regulated in the blood cells and/or skin of SSc patients (Supplementary Table 6 and Supplementary Figure 4, available on the Arthritis & Rheumatology website at http://onlin elibr ary.wiley.com/doi/10.1002/art.41657/ abstract). In the blood cells of SSc patients, ERAP1 was up- regulated, whereas LTB was
down- regulated. LTB, CD40, RXRB, BLK, and TUBB were up- regulated in the skin of SSc patients. In summary, 7 genes that have been considered for the treatment of conditions similar to SSc are potential candidates for study in clinical trials for SSc.
DISCUSSION
In this study, the integrated analysis of expression and genetic data in a large SSc cohort identified novel eQTLs in the whole blood of SSc patients, which are enriched in disease- relevant tissues. We found 64 eQTLs potentially specific to SSc, which were not found in either our cohort of healthy controls or any of the public blood eQTL databases (GTEx V7) (11,12). This find-ing suggests that additional mechanisms exist that render these
Figure 4. Differential expression of the transcription factors ELF1, MGA, KLF4, and ID4 in patients with systemic sclerosis (SSc) compared to controls. A and B, Residual expression of ELF1 in neutrophils (A) and MGA in monocytes (B) from controls and SSc patients. Values on the x- axis are the percentage of cells investigated per patient as obtained from the Cell- type Identification by Estimating Relative Subsets of Known RNA Transcripts (CIBERSORT) algorithm. ELF1 and MGA were up- regulated in SSc patient tissues. C and D, Log2 expression of KLF4 (C) and ID4 (D) in skin from controls and SSc patients. KLF4 and ID4 were down- regulated in SSc patient tissues. Data are shown as box plots. Each box represents the 25th to 75th percentiles. Lines inside the boxes represent the median. Lines outside the boxes represent the 10th and 90th percentiles. Circles represent individual subjects.

EXPRESSION QUANTITATIVE TRAIT LOCUS ANALYSIS IN SSc | 1297
eQTLs active in disease and neutral in healthy subjects. The most likely explanation is the differential expression of transcription fac-tors associated with a disease, as has been suggested previously (28,29). Indeed, we showed that of 24 transcription factors asso-ciated with SSc by our analysis of transcription factor binding site enrichment, ≥5 were differentially expressed in disease- relevant tissues. The eQTL analysis of the most likely associated SSc risk loci, prioritizing genes (eGenes) where SSc eQTLs explain >5% of expression variance, led to a strong enrichment of immunity- related genes, vasculopathy, and fibrosis. Finally, the findings were integrated with current knowledge of SSc pathology, thereby identifying useful candidates for drug repurposing.
One of the main findings of the present study is that we could assign more than half of the eGenes (n = 134) to hallmarks of SSc pathogenesis. Interesting candidates were related to immune system processes, fibrosis, and vascular pathologies. Immune system processes highlighted eGenes like CD247 or BLK, both of them previously associated with SSc and several autoimmune diseases such as RA or SLE (7,30,31). Regarding IFN- associated eGenes, we identified IRF5 and the 2 IL12 receptors, IL12RA and IL12RB, which are well- established SSc risk loci, and are also associated with other autoimmune diseases such as RA, SLE, and myositis (6,32,33). With regard to fibrosis, TNXB is implicated in the regulation of the production and assembly of certain types of collagen (34). TNXB is also the main causative gene in Ehlers- Danlos syndrome, which is characterized by altered skin elastic-ity, among other symptoms (35). The eGenes associated with vasculopathy or angiogenesis included NOTCH4, a non- classic HLA gene in the class II region that regulates NOTCH1 and has previously been associated with SSc (36,37), and CD151, which is linked to vascular stability and neo- angiogenesis (38). Finally, regarding inflammatory processes, C4A and C4B are part of the complement system affected by active disease in a number of autoimmune diseases (39). Interestingly, a recent study demon-strated the relevance of the copy number and resulting expression levels of C4A and C4B, as well as their contribution to sex- biased vulnerability in autoimmunity (40). In this regard, the eQTLs described in our study could be acting either as a proxy to C4A- C4B copy numbers or as an additional mechanism regulating the complex variation of complement genes.
Interestingly, we found 25 eGenes related to apoptosis pro-cesses. Previous genetic studies have indicated that apoptosis is an important mechanism of the disease, revealing the association of some genes, such as DNASE1L3 or TNFAIP3, with a higher risk of SSc (6,41). We confirm here DNASE1L3, which plays an important role in DNA fragmentation during apoptosis (42), as an interesting candidate. Another eGene observed with a particu-lar role in apoptosis was BAK1, which encodes for Bcl- 2 antag-onist or killer (BAK), one of the principal proapoptotic proteins of the mitochondrial pathway (43). Interestingly, a recent study showed that dermal fibroblasts derived from patients with SSc become particularly susceptible to apoptosis induced by mimetic
drugs of proapoptotic protein Bcl- 2 homology 3, a direct activator of BAK, reducing the fibrotic process (44). Thus, even though the specific pathogenic process of apoptosis in SSc is still unknown, our results support its role in SSc, which could be key to revers-ing fibrosis as part of the tissue regeneration process.
It is noteworthy that 50% of the SSc eGenes associated with SSc hallmarks overlap with >1 group (Supplementary Table 2). This is not surprising, given that, for example, fibrosis, angiogen-esis, and inflammation are closely linked, which demonstrates the complexity of the pathogenesis of SSc. Alternatively, there was significant enrichment of eQTLs in 19 tissues, most of them inter-pretable in the context of SSc, which affects tissues such as the lungs, cardiac tissue, and esophagus (1).
A total of 24 transcription factor binding sites were stably enriched in best- model SSc- specific eQTLs. In this regard, the tran-scription factor ELF1 (E74- like ETS transcription factor 1) deserves special mention, as it was also found to be differentially up- regulated in almost all 7 blood cell types assessed. ELF1 belongs to the ETS family of transcription factors that regulate the expression of a wide range of genes and play an important role in immune cell devel-opment and function and in angiogenesis (45,46). This transcrip-tion factor activates the expression of several T cell genes. One of them is the gene encoding the ζ chain of the T cell receptor (TCR), a molecule with a primary function in the transduction of intracellular signals that influence positive and negative selection of T cells upon TCR ligation (47). On the other hand, ELF1 also plays an important role in B cells by cooperating with members of the activator protein 1 family of transcription factors to activate the 3′ immunoglobulin heavy- chain enhancer upon IgM stimulation, which could contrib-ute to class- switch recombination (48). Of note, our enrichment analysis of transcription factor binding sites has to be interpreted with caution as the independence assumption of Fisher’s exact test might not be fully met, since stepwise modeling does not nec-essarily generate independent loci for enrichment analysis.
Candidate eGenes identified here overlap with eQTL anal-yses performed in other autoimmune diseases, further support-ing our results and manifesting the shared genetic component of autoimmune diseases. Some eGenes, such as BLK, GSDMB, and ORMDL3 which have been described to be involved in RA (49), KRT8P46, GSDMB, and ORMDL3 in multiple sclerosis (MS) (50), ANO9 and BLK in SLE (51), and GSMDA, GSDMB, and ORMDL3 in type 1 diabetes mellitus (52), were also significantly associated in our study.
Given the surprisingly high amount of candidate genes that warrant further studies, it is important to address the limits of this study. First, this study focused on bulk RNA- Seq and identified eQTLs present in the most abundant blood cell types. Although tools like CIBERSORT can successfully estimate the abundance of various cell types present, the number of samples needed to identify cell- specific eQTLs even in the most abundant cell types using bulk RNA- Seq are still prohibitive (12). Second, although we highlight genes for which interpretation in the context of the

KERICK ET AL 1298 |
disease is best understood in tissues other than blood, single- cell studies in SSc- affected tissues are needed to confirm and expand our findings. Last, we did not distinguish between the most com-mon forms of SSc (limited cutaneous and diffuse cutaneous), nor did we analyze data on autoantibodies, as data were only avail-able for a subset of the samples and would have severely dimin-ished the sensitivity of our analysis.
The validation of the eQTLs identified from peripheral blood mononuclear cells (PBMCs) in other tissues as presented in the GTEx database opens the way to cautiously use blood eQTLs as a proxy to detect eQTLs that most likely exert their main effect in tissues other than blood. Interestingly, Beretta et al recently observed a strong enrichment of several IFN- related pathways in the first whole- blood transcriptome profiling performed in a large cohort of SSc patients (17). Furthermore, a recent analysis of whole transcriptome expression in the skin of patients with early diffuse SSc revealed a high prevalence of both innate and adap-tive immune cell activity (53). These results are concordant with the clear enrichment of immunity- related eGenes observed in our study and represent a support of the use of PBMC expression data as surrogate markers of organ disease.
To sum up, this is the first eQTL analysis performed in PBMCs of SSc patients, revealing that more than half of the eGenes detected were associated with the most important SSc hallmarks and highlighting the apoptotic process. Furthermore, we identi-fied enriched motifs for transcription factors in SSc eQTLs that are differentially regulated in blood, skin, or the lungs. Our results highlight the role of the clinical features and tissues involved in SSc, adding a new layer of complexity and contributing to a better understanding of SSc pathogenesis.
ACKNOWLEDGMENTS
We greatly acknowledge the expert technical assistance of Gemma Robledo Pérez (Institute of Parasitology and Biomedicine López- Neyra [IPBLN]– CSIC), Sofía Vargas Roldán (IPBLN- CSIC), Sonia Molinero García (IPBLN- CSIC), Belén Martínez García (Pfizer– University of Granada– Junta de Andalucía Centre for Genomics and Oncological Research [GENYO]), the staff of the genomics unit (GENYO), and Martina Runge (Bayer).
AUTHOR CONTRIBUTIONS
All authors were involved in drafting the article or revising it critically for important intellectual content, and all authors approved the final version to be published. Dr. Martin had full access to all of the data in the study and takes responsibility for the integrity of the data and the accuracy of the data analysis.Study conception and design. Kerick, González- Serna, Acosta- Herrera, López- Isac, Alarcon- Riquelme, Martin.Acquisition of data. Makowska, Buttgereit, Babaei, Lesche, Alarcon- Riquelme, Martin.Analysis and interpretation of data. Kerick, González- Serna, Carnero- Montoro, Teruel, Barturen, Beretta, Alarcon- Riquelme, Martin.
ADDITIONAL DISCLOSURES
Authors Makowska, Buttgereit, Babaei, and Lesche are employees of Bayer.
REFERENCES 1. Denton CP, Khanna D. Systemic sclerosis. Lancet 2017;390:1685– 99.
2. Barnes J, Mayes MD. Epidemiology of systemic sclerosis: incidence, prevalence, survival, risk factors, malignancy, and environmental trig-gers. Curr Opin Rheumatol 2012;24:165– 70.
3. Bhattacharyya S, Wei J, Varga J. Understanding fibrosis in systemicsclerosis: shifting paradigms, emerging opportunities [review]. NatRev Rheumatol 2012;8:42– 54.
4. Allanore Y, Distler O, Matucci- Cerinic M, Denton CP. Defining aunified vascular phenotype in systemic sclerosis [review]. ArthritisRheumatol 2018;70:162– 70.
5. López- Isac E, Acosta- Herrera M, Kerick M, Assassi S, Satpathy AT,Granja J, et al. GWAS for systemic sclerosis identifies multiple riskloci and highlights fibrotic and vasculopathy pathways. Nat Commun 2019;10:1– 14.
6. Mayes MD, Bossini- Castillo L, Gorlova O, Martin JE, Zhou X, ChenWV, et al. Immunochip analysis identifies multiple susceptibility locifor systemic sclerosis. Am J Hum Genet 2014;94:47– 61.
7. Radstake TR, Gorlova O, Rueda B, Martin JE, Alizadeh BZ,Palomino- Morales R, et al. Genome- wide association study of sys-temic sclerosis identifies CD247 as a new susceptibility locus [letter]. Nat Genet 2010;42:426– 9.
8. Gourh P, Safran SA, Alexander T, Boyden SE, Morgan ND, Shah AA, et al. HLA and autoantibodies define scleroderma subtypes and riskin African and European Americans and suggest a role for molecularmimicry. Proc Natl Acad Sci U S A 2020;117:552– 62.
9. Acosta- Herrera M, López- Isac E, Martín J. Towards a better classi-fication and novel therapies based on the genetics of systemic scle-rosis [review]. Curr Rheumatol Rep 2019;21:1– 7.
10. Casares- Marfil D, Martín J, Acosta- Herrera M. Genomic opportu-nities for drug repositioning in systemic seropositive rheumatic dis-eases [review]. Expert Rev Clin Immunol 2020;16:343– 6.
11. Lappalainen T, Sammeth M, Friedländer MR, ’T Hoen PA, MonlongJ, Rivas MA, et al. Transcriptome and genome sequencing uncovers functional variation in humans. Nature 2013;501:506– 11.
12. Westra HJ, Peters MJ, Esko T, Yaghootkar H, Schurmann C,Kettunen J, et al. Systematic identification of trans eQTLs asputative drivers of known disease associations. Nat Genet 2013;45:1238– 43.
13. Odhams CA, Graham DS, Vyse TJ. Profiling RNA- Seq at multipleresolutions markedly increases the number of causal eQTLs in auto-immune disease. PLoS Genetics 2017;17:1– 31.
14. Schmiedel BJ, Singh D, Madrigal A, Valdovino- Gonzalez AG,White BM, Zapardiel- Gonzalo J, et al. Impact of genetic poly-morphisms on human immune cell gene expression. Cell 2018;175:1701– 15.
15. Lee JC, Espéli M, Anderson CA, Linterman MA, Pocock JM,Williams NJ, et al. Human SNP links differential outcomes in inflam-matory and infectious disease to a FOXO3- regulated pathway. Cell2013;155:57– 69.
16. Van den Hoogen F, Khanna D, Fransen J, Johnson SR, Baron M,Tyndall A, et al. 2013 classification criteria for systemic sclerosis: anAmerican College of Rheumatology/European League Against Rheu -matism collaborative initiative. Arthritis Rheum 2013;65:2737– 47.
17. Beretta L, Barturen G, Vigone B, Bellocchi C, Hunzelmann N, DeLanghe E, et al. Genome- wide whole- blood transcriptome profiling ina large European cohort of systemic sclerosis patients. Ann Rheum Dis2020;79:1218– 26.
18. Shabalin AA. Matrix eQTL: ultra fast eQTL analysis via large matrixoperations. Bioinformatics 2012;28:1353– 8.
19. Newman AM, Liu CL, Green MR, Gentles AJ, Feng W, Xu Y, et al.Robust enumeration of cell subsets from tissue expression profiles.Nat Methods 2015;12:453– 7.

EXPRESSION QUANTITATIVE TRAIT LOCUS ANALYSIS IN SSc | 1299
20. Hsu E, Shi H, Jordan RM, Lyons- Weiler J, Pilewski JM, Feghali- Bostwick CA. Lung tissues in patients with systemic sclerosis havegene expression patterns unique to pulmonary fibrosis and pulmo-nary hypertension. Arthritis Rheum 2011;63:783– 94.
21. Assassi S, Swindell WR, Wu M, Tan FD, Khanna D, Furst DE, et al.Dissecting the heterogeneity of skin gene expression patterns in sys-temic sclerosis. Arthritis Rheumatol 2015;67:3016– 26.
22. Tan G, Lenhard B. TFBSTools: an R/bioconductor package fortranscription factor binding site analysis. Bioinformatics 2016;32:1555– 6.
23. Mahoney JM, Taroni J, Martyanov V, Wood TA, Greene CS, Pioli PA,et al. Systems level analysis of systemic sclerosis shows a networkof immune and profibrotic pathways connected with genetic poly-morphisms. PLoS Comput Biol 2015;11:e1004005.
24. Skaug B, Assassi S. Type I interferon dysregulation in systemic scle-rosis. Cytokine 2019;132:154635.
25. Volkmann ER, Varga J. Emerging targets of disease- modifyingtherapy for systemic sclerosis [review]. Nat Rev Rheumatol 2019;15:208– 24.
26. Hinz B, Lagares D. Evasion of apoptosis by myofibroblasts: a hallmark of fibrotic diseases [review]. Nat Rev Rheumatol 2020;16:11– 31.
27. Carvalho- Silva D, Pierleoni A, Pignatelli M, Ong CK, Fumis L,Karamanis N, et al. Open Targets Platform: new developmentsand updates two years on. Nucleic Acids Res 2019;47:D1056– 65.
28. Zhernakova DV, Deelen P, Vermaat M, van Iterson M, van GalenM, Arindrarto W, et al. Identification of context- dependentexpression quantitative trait loci in whole blood. Nat Genet2017;49:139– 45.
29. Jonkers IH, Wijmenga C. Context- specific effects of genetic vari-ants associated with autoimmune disease. Hum Mol Genet 2017;26:R185– 92.
30. Gourh P, Agarwal SK, Martin E, Divecha D, Rueda B, Bunting H,et al. Association of the C8orf13- BLK region with systemic scle-rosis in North- American and European populations. J Autoimmun2010;34:155– 62.
31. Bossini- Castillo L, López- Isac E, Martín J. Immunogenetics of sys-temic sclerosis: defining heritability, functional variants and shared- autoimmunity pathways. J Autoimmun 2015;64:53– 65.
32. Sharif R, Mayes MD, Tan FK, Gorlova OY, Hummers LK, Shah AA,et al. IRF5 polymorphism predicts prognosis in patients with sys-temic sclerosis. Ann Rheum Dis 2012;71:1197– 202.
33. López- Isac E, Bossini- Castillo L, Guerra SG, Denton C,Fonseca C, Assassi S, et al. Identification of IL12RB1 as anovel systemic sclerosis susceptibility locus. Arthritis Rheumatol2014;66:3521– 3.
34. Zweers MC, Hakim AJ, Grahame R, Schalkwijk J. Joint hypermobil-ity syndromes: the pathophysiologic role of tenascin- X gene defects[review]. Arthritis Rheum 2004;50:2742– 9.
35. Malfait F, Francomano C, Byers P, Belmont J, Berglund B,Black J, et al. The 2017 international classification of the Ehlers- Danlos syndromes. Am J Med Genet Part C Semin Med Genet2017;175:8– 26.
36. Gorlova O, Martin JE, Rueda B, Koeleman BP, Ying J, Teruel M, et al. Identification of novel genetic markers associated with clinical phe-notypes of systemic sclerosis through a genome- wide associationstrategy. PLoS Genet 2011;7:e1002178.
37. Zhou X, Li H, Guo S, Wang J, Shi C, Espitia M, et al. Associationsof multiple NOTCH4 exonic variants with systemic sclerosis.J Rheumatol 2019;46:184– 9.
38. Zhang F, Michaelson JE, Moshiach S. Tetraspanin CD151 main-tains vascular stability by balancing the forces of cell adhesion andcytoskeletal tension. Blood 2014;123:3843.
39. Chen M, Daha MR, Kallenberg CG. The complement system in sys-temic autoimmune disease. J Autoimmun 2010;34:276– 86.
40. Kamitaki N, Sekar A, Handsaker RE, de Rivera H, Tooley K, MorrisDL, et al. Complement genes contribute sex- biased vulnerability indiverse disorders. Nature 2020;582:577– 81.
41. Catrysse L, Vereecke L, Beyaert R, van Loo G. A20 in inflammationand autoimmunity. Trends Immunol 2014;35:22– 31.
42. Shi G, Abbott KN, Wu W, Salter RD, Keyel PA. Dnase1L3 regu-lates inflammasome- dependent cytokine secretion. Front Immunol2017;8:1– 16.
43. Peña- Blanco A, García- Sáez AJ. Bax, Bak and beyond: mitochon-drial performance in apoptosis. FEBS J 2018;285:416– 31.
44. Lagares D, Santos A, Grasberger PE, Liu F, Probst CK, Rahimi RA.Targeted apoptosis of myofibroblasts with the BH3 mimetic ABT- 263 reverses established fibrosis. Sci Trans Med 2017;9:eeal3765.
45. Gallant S, Gilkeson G. ETS transcription factors and regulation ofimmunity. Arch Immunol Ther Exp 2006;54:149– 63.
46. Wang CY, Petryniak B, Thompson CB, Kaelin WG, Leiden JM.Regulation of the Ets- related transcription factor Elf- 1 by binding tothe retinoblastoma protein. Science 1993;260:1330– 5.
47. Shores EW, Love PE. TCR ζ chain in T cell development and selec-tion. Curr Opin Immunol 1997;9:380– 9.
48. Grant PA, Thompson CB, Pettersson S. IgM receptor- mediatedtransactivation of the IgH 3′ enhancer couples a novel Elf- 1- AP- 1protein complex to the developmental control of enhancer function.EMBO J 1995;14:4501– 13.
49. Thalayasingam N, Nair N, Skelton AJ, Massey J, Anderson AE, Clark AD, et al. CD4+ and B lymphocyte expression quantitative traits atrheumatoid arthritis risk loci in patients with untreated early arthri-tis: implications for causal gene identification. Arthritis Rheumatol2018;70:361– 70.
50. James T, Lindén M, Morikawa H, Fernandes SJ, Ruhrmann S, HussM, et al. Impact of genetic risk loci for multiple sclerosis on expres-sion of proximal genes in patients. Hum Mol Genet 2018;27:912– 28.
51. Odhams CA, Cortini A, Chen L, Roberts AL, Viñuela A, Buil A, et al.Mapping eQTLs with RNA- seq reveals novel susceptibility genes,non- coding RNAs and alternative- splicing events in systemic lupuserythematosus. Hum Mol Genet 2017;26:1003– 17.
52. Newman JR, Conesa A, Mika M, New FN, Onengut- Gumuscu S,Atkinson MA, et al. Disease- specific biases in alternative splicingand tissue- specific dysregulation revealed by multitissue profilingof lymphocyte gene expression in type 1 diabetes. Genome Res2017;27:1807– 15.
53. Skaug B, Khanna D, Swindell WR, Hinchcliff ME, Frech TM, SteenVD, et al. Global skin gene expression analysis of early diffuse cuta-neous systemic sclerosis shows a prominent innate and adaptiveinflammatory profile. Ann Rheum Dis 2020;79:379– 86.
APPENDIX A: THE PRECISESADS Clinical Consortium
Members of the PRECISESADS Clinical Consortium are as follows: Lorenzo Beretta, Barbara Vigone (Referral Center for Systemic Autoimmune Diseases, Fondazione IRCCS Ca’ Granda Ospedale Maggiore Policlinico di Milano, Italy); Jacques- Olivier Pers, Alain Saraux, Valérie Devauchelle- Pensec, Divi Cornec, Sandrine Jousse- Joulin (Cen-tre Hospitalier Universitaire de Brest, Hospital de la Cavale Blanche, Brest, France); Bernard Lauwerys, Julie Ducreux, Anne- Lise Maudoux (Pôle de pathologies rhumatismales systémiques et inflammatoires, Institut de Recherche Expérimentale et Clinique, Université catholique de Louvain, Brussels, Belgium); Carlos Vasconcelos, Ana Tavares, Esmeralda Neves, Raquel Faria, Mariana Brandão, Ana Campar, António Marinho, Fátima Farinha, Isabel Almeida (Centro Hospitalar do Porto, Portugal); Miguel Angel Gonzalez- Gay Mantecón, Ricardo Blanco Alonso, Alfonso Corrales Martínez (Servicio Cantabro de Salud, Hospital Universitario Marqués de Valdecilla, Santander, Spain); Ricard Cervera, Ignasi Rodríguez- Pintó, Gerard Espinosa (Hospital Clinic I Provicia, Institut d’Investigacions

KERICK ET AL 1300 |
Biomèdiques August Pi i Sunyer, Barcelona, Spain); Rik Lories, Ellen De Langhe (Katholieke Universiteit Leuven, Belgium); Nicolas Hunzelmann, Doreen Belz (Klinikum der Universitaet zu Koeln, Cologne, Germany); Torsten Witte, Niklas Baerlecken (Medizinische Hochschule Hannover, Germany); Georg Stummvoll, Michael Zauner, Michaela Lehner (Medical University Vienna, Vienna, Austria); Eduardo Collantes, Rafaela Ortega- Castro, Mª Angeles Aguirre- Zamorano, Alejandro Escudero- Contreras, Mª Carmen Castro- Villegas (Servicio Andaluz de Salud, Hospital Uni-versitario Reina Sofía Córdoba, Spain); Norberto Ortego, María Con-cepción Fernández Roldán (Servicio Andaluz de Salud, Complejo hos-pitalario Universitario de Granada [Hospital Universitario San Cecilio], Spain); Enrique Raya, Inmaculada Jiménez Moleón (Servicio Andaluz de
Salud, Complejo hospitalario Universitario de Granada [Hospital Virgen de las Nieves], Spain); Enrique de Ramon, Isabel Díaz Quintero (Servicio Andaluz de Salud, Hospital Regional Universitario de Málaga, Spain); Pier Luigi Meroni, Maria Gerosa, Tommaso Schioppo, Carolina Artusi (Università degli studi di Milano, Milan, Italy); Carlo Chizzolini, Aleksandra Zuber, Donatienne Wynar (Hospitaux Universitaires de Genève, Swit-zerland); Laszló Kovács, Attila Balog, Magdolna Deák, Márta Bocskai, Sonja Dulic, Gabriella Kádár (University of Szeged, Szeged, Hungary); Falk Hiepe, Velia Gerl, Silvia Thiel (Charite, Berlin, Germany); Manuel Rodriguez Maresca, Antonio López- Berrio, Rocío Aguilar- Quesada, and Héctor Navarro- Linares (Andalusian Public Health System Biobank, Gra-nada, Spain).

1301
Arthritis & RheumatologyVol. 73, No. 7, July 2021, pp 1301–1310DOI 10.1002/art.41668© 2021, American College of Rheumatology
Tocilizumab Prevents Progression of Early Systemic Sclerosis– Associated Interstitial Lung DiseaseDavid Roofeh,1 Celia J. F. Lin,2 Jonathan Goldin,3 Grace Hyun Kim,3 Daniel E. Furst,4 Christopher P. Denton,5
Suiyuan Huang,1 and Dinesh Khanna,1 on behalf of the focuSSced Investigators
Objective. Tocilizumab (TCZ) has demonstrated lung function preservation in 2 randomized controlled trials in early systemic sclerosis (SSc). This effect has yet to be characterized in terms of radiographically evident quantitative lung involvement. We undertook this study to assess the impact of TCZ on lung function preservation in a post hoc analysis, stratifying treatment arms according to the degree of lung involvement.
Methods. The focuSSced trial was a phase III randomized placebo- controlled trial of TCZ in patients with SSc and progressive skin disease. Participants underwent baseline and serial spirometry along with high- resolution chest computed tomography at baseline and at week 48. Quantitative interstitial lung disease (QILD) and fibrosis scores were assessed by computer software. We classified QILD into the following categories of lung involvement: mild (>5– 10%), moderate (>10– 20%), and severe (>20%).
Results. Of 210 participants recruited for the trial, 136 patients (65%) had ILD. The majority of these patients (77%) had moderate- to- severe involvement (defined as >10% lung involvement). The TCZ arm demonstrated preservation of forced vital capacity percent predicted (FVC%) over 48 weeks (least squares mean change in FVC% = −0.1) compared to placebo (−6.3%). For mild, moderate, and severe QILD, the mean ± SD change in FVC% in the TCZ arm at 48 weeks were −4.1 ± 2.5% (n = 11), 0.7 ± 1.9% (n =19), and 2.1 ± 1.6% (n = 26), respectively, and in the placebo group were −10.0 ± 2.6% (n = 11), −5.7 ± 1.6% (n = 26), and −6.7 ± 2.0% (n = 16), respectively. Similar treatment- related preservation findings were seen independent of fibrosis severity.
Conclusion. TCZ in early SSc– associated ILD with progressive skin disease stabilized FVC% over 48 weeks, independent of the extent of radiographically evident QILD.
INTRODUCTION
The majority of systemic sclerosis (SSc) patients will develop interstitial lung disease (ILD) (1,2). The disease process of SSc- associated ILD (SSc- ILD) usually proceeds through dif-ferent phases. The initial phase is associated with findings from
high- resolution computed tomography (HRCT) of the chest that predominantly show ground- glass opacity with minimal fibrotic changes (considered by some to be immunoinflammatory), fol-lowed by more dense fibrotic changes with a nonspecific interstitial pneumonia pattern on HRCT scans; however, some patients may present with findings of usual interstitial pneumonitis (3). Those
ClinicalTrials.gov identifier: NCT02453256.Dr. Roofeh’s work was supported by the National Institute of Arthritis
and Musculoskeletal and Skin Diseases, NIH (grant T32- AR- 007080). Dr. Khanna’s work was supported by the Immune Tolerance Network and the National Institute of Arthritis and Musculoskeletal and Skin Diseases, NIH (grants K24- AR- 063129 and 1R01- AR- 070470- 01A1).
1David Roofeh, MD, Suiyuan Huang, MPH, Dinesh Khanna, MD, MS: University of Michigan, Ann Arbor; 2Celia J. F. Lin, MD: Genentech, South San Francisco, California; 3Jonathan Goldin, MD, Grace Hyun Kim, PhD: University of California, Los Angeles; 4Daniel E. Furst, MD: University of California, Los Angeles, University of Washington, Seattle, and University of Florence, Florence, Italy; 5Christopher P. Denton, FRCP: University College London, London, UK.
Dr. Lin has received consulting fees, speaking fees, and/or honoraria from Genentech (less than $10,000) and owns stock or stock options in Roche. Dr. Goldin has received consulting fees, speaking fees, and/or honoraria from MedQIA (less than $10,000). Dr. Kim has received consulting fees, speaking fees, and/or honoraria from MedQIA (less than $10,000) and has a patent application pending related to interstitial lung disease. Dr. Furst has received consulting fees, speaking fees, and/or honoraria from Corbus, CSL Behring, Galápagos, Gilead,
Pfizer, Talaris, AbbVie, Amgen, Novartis, Roche/Genentech, and Boehringer Ingelheim (less than $10,000 each) and research grants from Corbus, CSL Behring, Galápagos, GlaxoSmithKline, Kadmon, PCORI, Pfizer, and Talaris. Dr. Denton has received consulting fees, speaking fees, and/or honoraria from Acceleron, Actelion, GlaxoSmithKline, Horizon, Sanofi, Inventiva, Boehringer Ingelheim, Roche, CSL Behring, and Corbus (less than $10,000 each) and research grants from GlaxoSmithKline, Inventiva, and CSL Behring. Dr. Khanna has received consulting fees, speaking fees, and/or honoraria from Bristol Myers Squibb, Bayer, Acceleron, Actelion, Amgen, Blade Therapeutics, Boehringer Ingelheim, CSL Behring, Corbus, Cytori, Galápogos, Genentech/Roche, GlaxoSmithKline, Horizon, Merck, Mitsubishi Tanabe, Regeneron, Sanofi- Aventis, United Therapeutics, and Impact PH (less than $10,000 each), research grants from Bristol Myers Squibb, Horizon, and Pfizer, and is the Chief Medical Officer of Eicos Sciences. No other disclosures relevant to this article were reported.
Address correspondence to Dinesh Khanna, MD, MS, University of Michigan, Division of Rheumatology, Department of Internal Medicine, 300 North Ingalls Street, Ann Arbor, MI 48109. Email: [email protected].
Submitted for publication October 7, 2020; accepted in revised form January 26, 2021.

ROOFEH ET AL 1302 |
at risk of progressive disease have an archetype: early, diffuse cutaneous systemic sclerosis (dcSSc), with elevated acute- phase reactants such as C- reactive protein (CRP) level and topoisomer-ase I (topo I) antibody positivity (4– 7). Patients with these high- risk features, especially those with disease in the initial phase of devel-opment, represent an important target for early intervention, as ILD is largely irreversible in SSc (4,8).
Tocilizumab (TCZ) is an anti– interleukin- 6 (anti– IL- 6) agent (IgG1 humanized anti– IL- 6 receptor monoclonal antibody), approved for use in rheumatoid arthritis, giant cell arteritis, juve-nile idiopathic arthritis, Castleman’s disease, and other immune- mediated diseases. Two well- designed randomized controlled trials of TCZ in early dcSSc demonstrated a significant lung pres-ervation effect in the treatment arm compared to placebo (9,10). This effect has yet to be characterized in terms of radiographically evident quantitative lung involvement.
In this post hoc analysis, we comprehensively character-ized the ILD participants in the focuSSced trial (10), assessed the relationship between degree of total lung involvement and fibrosis (using well- established quantitative HRCT measurements) and lung physiology, and evaluated the treatment effect of TCZ compared to placebo on forced vital capacity percent predicted (FVC%) and quantitative HRCT. Investigating the treatment effects in terms of radiographic changes in this cohort at high risk for progression of ILD provides important insight into disease patho-physiology and potential mechanisms of therapeutic benefit.
PATIENTS AND METHODS
Study design. This phase III trial (ClinicalTrials.gov identi-fier: NCT02453256) was a multicenter, randomized, double- blind placebo- controlled trial with 1:1 randomization to active treatment (1 subcutaneous injection of 162 mg TCZ per week) or placebo for 48 weeks (10). Background immunosuppressive therapy was not allowed in the trial, but escape therapy was allowed for prespecified skin and lung function progression and SSc- related complications.
Participants. All patients met the 2013 American College of Rheumatology/European Alliance of Associations for Rheuma-tology classification criteria (11), with disease onset <60 months from the onset of their first non– Raynaud’s phenomenon sign or symptom, and had a modified Rodnan skin thickness score (MRSS) (12) between 10 and 35. All patients had early progressive skin disease with diffuse cutaneous distribution, because the main goal of the trial was to evaluate beneficial impact of TCZ on MRSS score. Participants also had elevated acute- phase reactants (≥1 of the following: CRP level >6 mg/liter, erythrocyte sedimentation rate >28 mm/hour, or platelet count >330 × 109/liter), and active disease was defined as having >1 of the following at screening: disease duration ≤18 months, MRSS increase of ≥3, involvement of 1 new body area and MRSS increase of ≥2, or involvement of 2 new body areas (each within the previous 6 months), or ≥1
tendon friction rub. The presence of lung disease was not required for enrollment. The study was approved by the institutional review boards of all participating sites, written informed consent was obtained from all participants, and the study was conducted in compliance with the Declaration of Helsinki.
Outcome measures. Serial spirometry plus diffusing ca -pacity for carbon monoxide corrected for hemoglobin (DLco) was conducted at weeks 8, 16, 24, 36, and 48, based on the American Thoracic Society/European Respiratory Society Consensus State-ment recommendations (13). Patients performed 3– 8 exhalations into a spirometer, and the highest value was recorded. Patients received HRCT scans at baseline and week 48, completed at maximal inspiration. Images were acquired from 30 multidetec-tor CT scanner models from 4 manufacturers, using a standard-ized procedure and following strict quality control protocols. HRCT quantification was performed on all scans based on previous publications (14– 16).
The quantitative ILD (QILD) score refers to the summation of ground- glass opacities, honeycombing, and fibrotic reticulation, while the quantitative lung fibrosis (QLF) score refers to quantita-tive fibrosis (fibrotic reticulation) alone. Both scores range from 0% to 100% involvement of the whole lung (17). All scans had QILD and QLF measurements; ILD was identified visually by a thoracic radiologist (JG) based on the presence of ground- glass opacifica-tion and/or fibrosis with a basal predominance. Participants who had minimal interstitial changes without defined ILD were charac-terized as having no ILD; these cases were screened for factors other than SSc- ILD and were excluded (factors included body hab-itus, atelectasis, bronchitis, aspiration, and bronchiectasis). QILD cutoff points were set as minimal (≤5%), mild (>5– 10%), moderate (>10– 20%), or severe (>20%), based on the following: 1) classifica-tion by a chest radiologist (JG), and 2) findings from Goh et al that demonstrate total lung involvement of >20% was associated with higher mortality in a longitudinal cohort (18). Cutoff points for QLF were organized in tertiles according to the range (0.1– 18.5%) of involvement.
Statistical analysis. Continuous and categorical variables were summarized using the mean ± SD and percentages, respec-tively. We used t- tests to compare baseline FVC% according to baseline QILD and QLF cutoffs. Spearman’s correlation coeffi-cients were calculated for scatterplots of baseline FVC% accord-ing to numerical baseline QILD and QLF scores, separately. To assess how the baseline QILD or QLF score affects the change in FVC% over time, we fitted linear mixed- effect models, with change in FVC% as the outcome. Covariates included the follow-ing: 1) baseline FVC%, 2) treatment arm, 3) study time points, 4) baseline QILD/QLF group, 5) interaction of baseline FVC% and study time point, 6) interaction of treatment arm and study time point, 7) interaction of baseline QILD/QLF group and treatment arm, 8) interaction of baseline QILD/QLF group and study time

TCZ STABILIZES FVC IN EARLY SSc- ILD | 1303
point, and 9) 3- way interaction of treatment arm, study time point, and baseline QILD/QLF group. We obtained least squares means (LSMs) from the models and plotted the LSM to show the FVC% change trend. Ninety- five percent confidence intervals (95% CIs) were calculated. No data were imputed. All analyses were done using SAS software (version 9.4).
RESULTS
Baseline characteristics of patients with ILD. The distribution of patients according to treatment arm and base-line radiographic assessments are shown in Supplementary Figure 1 (available on the Arthritis & Rheumatology website at http://onlinelibrary.wiley.com/doi/10.1002/art.41668/abstract). Two hundred ten participants were randomized and received treatment (placebo arm [n = 106], TCZ arm [n = 104]). Of these patients, 136 were confirmed by a thoracic radiologist to have ILD based on HRCT imaging performed at baseline. Table 1 shows the baseline characteristics of the overall pop-ulation (n = 210) compared to the subset of patients with ILD (n = 136), which was further divided by treatment arm. Three participants were confirmed as having ILD based on baseline visual assessment of HRCT scans, but the quan-titative measurements (including QILD and QLF scores)
were missing. Compared to those without ILD, the remaining 133 patients with ILD had numerically lower FVC% and DLco percent predicted (DLco%), a higher CRP level, and a greater proportion of anti– topo I antibody positivity. ILD patients had a mean ± SD FVC% of 79.6 ± 14.5% and a mean ± SD QILD of 18.7 ± 11.1%; most of the QILD score was made up of ground- glass opacities (mean ± SD 14.9 ± 8.3%), with a mean ± SD QLF of 3.0 ± 3.6%. There were no significant differences between the TCZ and placebo arms in the ILD groups at baseline (Table 1).
Moderate- to- severe whole- lung involvement with limited fibrosis in majority of ILD patients. Baseline QILD scores of 133 patients were stratified into 4 groups corresponding to minimal (≤5%), mild (>5– 10%), moderate (>10– 20%), and severe (>20%) lung involvement. The majority of patients with ILD (n = 102; 77%) had moderate or severe lung involvement, as defined by a QILD of >10% (range 10.2– 52.6) (Table 2). Higher degrees of QILD scores were associated with increasing MRSS scores, percentages of anti– topo I antibody positivity, lower baseline FVC% and DLco%, and higher QLF scores. Table 2 also shows ILD patients stratified according to QLF tertiles (0.1– 1.0%, 1.1– 2.7%, or 2.8– 18.5%), with approximately two- thirds of patients (n = 89; 67%) having <2.8% fibrosis. Similar to QILD, increasing QLF scores were associated with
Table 1. Baseline characteristics of the overall focuSSced population and those with ILD detected on HRCT scans*
Total patients (n = 210)
ILD patients (n = 136)
TCZ group with ILD (n = 68)
Placebo group with ILD (n = 68)
DemographicsFemale, % 81.4 79.4 77.9 80.9Age, years 48.2 ± 12.4 48.1 ± 12.9 47.6 ± 12.5 48.7 ± 13.3SSc duration, months 22.6 ± 16.5 22.8 ± 16.8 23.0 ± 17.2 22.6 ± 16.6
Disease features†Total MRSS 20.3 ± 6.8 20.8 ± 7.0 20.7 ± 6.8 20.9 ± 7.2CRP, mg/liter 7.9 ± 13.1 9.6 ± 15.4 11.2 ± 17.4 8.0 ± 13.1ANA positive, no. (%) 183 (92.4) 124 (96.9) 65 (98.5) 59 (95.2)Anti– topo I positive, no. (%) 103 (51.0) 90 (68.7) 46 (68.7) 44 (68.8)Anti- RNAP positive, no. (%) 35 (17.3) 19 (14.5) 13 (19.4) 6 (9.4)ACA positive, no. (%) 17 (8.4) 2 (1.5) 1 (1.5) 1 (1.6)
PFTsFVC, ml 2,996.7 ± 836.8 2,885.4 ± 835.8 2,826.8 ± 873.7 2,944.1 ± 798.3FVC% 82.1 ± 14.8 79.6 ± 14.5 77.7 ± 13.9 81.5 ± 14.9DLco%‡ 75.6 ± 18.9 70.4 ± 16.9 68.7 ± 16.8 72.1 ± 17.0
QILD measurements, whole lung %§HRCT total QILD 15.9 ± 11.4 18.7 ± 11.1 20.5 ± 12.8 16.8 ± 8.8
Ground- glass opacity 13.0 ± 8.8 14.9 ± 8.3 16.2 ± 9.5 13.6 ± 6.7QLF 2.3 ± 3.3 3.0 ± 3.6 3.5 ± 4.2 2.5 ± 3.0Honeycombing 0.4 ± 1.2 0.4 ± 1.3 0.5 ± 1.5 0.3 ± 1.2
* Except where indicated otherwise, values are the mean ± SD. None of the differences between the tocilizumab (TCZ) and placebo groups were significant. SSc = systemic sclerosis; MRSS = modified Rodnan skin thickness score; CRP = C- reactive protein; PFTs = pulmonary function tests; FVC% = forced vital capacity percent predicted; DLco% = diffusing capacity for carbon monoxide corrected for hemoglobin percent predicted. † Data were not available for all patients, as follows: for antinuclear antibody (ANA) positivity (total patients, n = 198; interstitial lung disease [ILD] patients, n = 128; TCZ arm, n = 66; placebo arm, n = 62); for anti– topoisomerase I (anti– topo I), anti– RNA polymerase (anti- RNAP), and anticentromere antibody (ACA) positivity (total patients, n = 202; ILD patients, n = 131; TCZ arm, n = 67; placebo arm, n = 64). ‡ Data were not available for all patients, as follows: total patients, n = 208; ILD patients, n = 135; TCZ arm, n = 68; placebo arm, n = 67. § Three patients were confirmed to have ILD based on baseline visual assessment of high- resolution computed tomography (HRCT), but data on quantitative measurements (including quantitative ILD [QILD] and quantitative lung fibrosis [QLF] scores) were missing. For these parameters, data were not available for all patients, as follows: total patients, n = 202; ILD patients, n = 133; TCZ arm, n = 67; placebo arm, n = 66.

ROOFEH ET AL 1304 |
Tab
le 2
. B
asel
ine
char
acte
ristic
s of
ILD
pat
ient
s st
ratifi
ed b
y Q
ILD
and
QLF
invo
lvin
g th
e w
hole
lung
*
Tota
l ILD
(n
= 1
33)†
QIL
D s
ever
ityQ
LF s
ever
ity
Min
imal
,
≤5%
(n
= 6
)
Mild
, >5
– 10%
(n
= 2
5)
Mod
erat
e,
>10–
20%
(n
= 5
4)
Seve
re,
>2
0%
(n =
48)
Firs
t ter
tile,
0.
1– 1.
0%
(n =
45)
Seco
nd te
rtile
, 1.
1– 2.
7%
(n =
44)
Third
tert
ile,
2.8–
18.5
%
(n =
44)
Dem
ogra
phic
sFe
mal
e, %
79.0
66.7
76.0
83.3
77.1
77.8
81.8
77.3
Age,
yea
rs48
.0 ±
13.
045
.2 ±
16.
645
.5 ±
11.
345
.9 ±
13.
352
.1 ±
12.
343
.2 ±
12.
748
.5 ±
12.
452
.5 ±
12.
3SS
c du
ratio
n,
mon
ths
22.9
± 1
6.9
24.4
± 1
3.5
22.3
± 1
6.6
27.0
± 1
7.2
18.5
± 1
6.5
22.3
± 1
3.5
26.5
± 1
9.6
19.9
± 1
6.9
Dis
ease
feat
ures
†To
tal M
RSS
20.8
± 7
.116
.6 ±
7.3
18.8
± 5
.820
.9 ±
7.6
22.3
± 6
.719
.7 ±
6.9
20.9
± 7
.421
.9 ±
6.8
CRP,
mg/
liter
9.8
± 15
.531
.0 ±
39.
65.
4 ±
8.3
11.4
± 1
6.8
7.5
± 9.
010
.9 ±
18.
711
.5 ±
17.
06.
8 ±
9.1
ANA
posi
tive,
no.
(%)
121
(96.
8)6
(100
)24
(100
)48
(96.
0)43
(95.
6)42
(97.
7)40
(97.
6)39
(95.
1)An
ti– to
po I
posi
tive,
no
. (%
)88
(68.
8)4
(66.
7)15
(62.
5)33
(66.
0)36
(75.
0)28
(65.
1)26
(63.
4)34
(77.
3)
Anti-
RNAP
pos
itive
, no
. (%
)19
(14.
8)1
(16.
7)3
(12.
5)5
(10.
0)10
(20.
8)4
(9.3
)9
(22.
0)6
(13.
6)
ACA
posi
tive,
no.
(%)
2 (1
.6)
01
(4.2
)1
(2.0
)0
1 (2
.3)
1 (2
.4)
0PF
Ts FVC,
ml
2,88
1.4
± 83
3.6
3,48
3.3
± 1,
079.
03,
268.
8 ±
1,03
1.4
2,94
5.7
± 67
2.4
2,53
2.1
± 72
0.8
3,21
6.4
± 90
8.1
2,81
7.5
± 65
6.4
2,60
2.7
± 81
0.8
FVC%
79.5
± 1
4.5
88.4
± 1
8.3
85.4
± 1
3.1
81.1
± 1
4.4
73.6
± 1
2.9
84.8
± 1
4.6
79.6
± 1
3.9
74.0
± 1
3.1
DL c
o%
‡70
.4 ±
17.1
88.5
± 1
9.7
85.3
± 1
7.2
67.3
± 1
2.9
63.6
± 1
4.9
75.9
± 1
7.4
70.9
± 1
7.0
64.0
± 1
4.9
QIL
D m
easu
rem
ents
, w
hole
lung
%§
HRC
T to
tal Q
ILD
18.7
± 1
1.1
4.0
± 0.
97.
8 ±
1.4
14.5
± 2
.830
.8 ±
8.6
9.8
± 4.
216
.4 ±
5.6
30.1
± 1
0.3
Gro
und-
glas
s op
acity
14.9
± 8
.33.
7 ±
0.8
6.9
± 1.
212
.3 ±
2.7
23.5
± 7
.28.
9 ±
3.9
14.0
± 5
.422
.0 ±
8.8
QLF
3.0
± 3.
60.
3 ±
0.1
0.8
± 0.
61.
5 ±
1.0
6.1
± 4.
50.
6 ±
0.3
1.7
± 0.
46.
8 ±
4.3
Hon
eyco
mbi
ng0.
43 ±
1.3
00
0.3
± 0.
90.
8 ±
2.0
0.1
± 0.
50.
3 ±
0.9
0.9
± 2.
0*
Exce
pt w
here
indi
cate
d ot
herw
ise,
val
ues
are
the
mea
n ±
SD. S
ee T
able
1 fo
r defi
nitio
ns.
† D
ata
wer
e no
t ava
ilabl
e fo
r al
l pat
ient
s, a
s fo
llow
s: fo
r AN
A po
sitiv
ity (t
otal
ILD
pat
ient
s, n
= 1
25; m
ild Q
ILD
, n =
24;
mod
erat
e Q
ILD
, n =
50;
sev
ere
QIL
D, n
= 4
5; fi
rst t
ertil
e Q
LF, n
= 4
3;
seco
nd te
rtile
QLF
, n =
41;
third
tert
ile Q
LF, n
= 4
1); f
or a
nti–
topo
I, a
nti- R
NAP
, and
ACA
pos
itivi
ty (t
otal
ILD
pat
ient
s, n
= 1
28; m
ild Q
ILD
, n =
24;
mod
erat
e Q
ILD
, n =
50;
sev
ere
QIL
D, n
= 4
8;
first
tert
ile Q
LF, n
= 4
3; s
econ
d te
rtile
QLF
, n =
41)
. ‡
Dat
a w
ere
not a
vaila
ble
for a
ll pa
tient
s, a
s fo
llow
s: to
tal I
LD p
atie
nts,
n =
132
; sev
ere
QIL
D, n
= 4
7; th
ird te
rtile
QLF
, n =
43.
§
Thre
e pa
tient
s w
ere
confi
rmed
to h
ave
ILD
bas
ed o
n ba
selin
e vi
sual
ass
essm
ent o
f HRC
T, b
ut d
ata
on q
uant
itativ
e m
easu
rem
ents
(inc
ludi
ng Q
ILD
and
QLF
sco
res)
wer
e m
issi
ng.

TCZ STABILIZES FVC IN EARLY SSc- ILD | 1305
higher percentages of anti– topo I antibody positivity and QILD, and lower baseline FVC% and DLco%.
Inverse correlation of QILD and QLF with FVC%. Figure 1 demonstrates an inverse relationship between baseline FVC% and degree of QILD; baseline FVC% significantly declined with each escalating QILD cutoff point. The mean baseline FVC% in patients with severe QILD was significantly lower (mean ± SD 73.6 ± 12.9%) compared to those with minimal QILD (mean ± SD 88.4 ± 18.3%; P = 0.01), mild QILD (mean ± SD 85.4 ± 13.1%;
P = 0.00), and moderate QILD (mean ± SD 81.1 ± 14.4%; P = 0.01). There is an inverse correlation between baseline FVC% and QILD, with a correlation coefficient of −0.36 (P = 0.00). Figure 1 also demonstrates a similar inverse relationship between baseline FVC% and QLF, with the mean baseline FVC% significantly higher in the first tertile compared to the third tertile (P = 0.00). The correlation coefficient was also −0.36 (P = 0.00).
Stabilization by TCZ of FVC% over 48 weeks for mild- to- severe baseline QILD and all ranges of baseline QLF scores. The TCZ arm demonstrated preserved FVC% over 48 weeks: the LSM of FVC% change was −0.1% for TCZ and −6.3% for placebo (Figure 2). The difference between treatment groups was 6.2% (P < 0.0001). Figure 2 shows the mean trend over 48 weeks of FVC% change, accounting for the covariates listed in Methods; the results are separated by treatment arm and stratified according to the extent of QILD. As there were only 2 and 4 evaluable patients with ≤5% QILD in the placebo and TCZ groups, respectively, they were excluded from what is depicted in Figure 2. Specifically, those with >5% QILD in the TCZ group showed FVC% stabilization over 48 weeks; this preservation was not influenced by the escalating degree of QILD involvement. For mild, moderate, and severe QILD, the mean ± SD change in FVC% in the TCZ arm at 48 weeks were −4.1 ± 2.5% (n = 11), 0.7 ± 1.9% (n =19), and 2.1 ± 1.6% (n = 26), respectively, and in the placebo group were −10.0 ± 2.6% (n = 11), −5.7 ± 1.6% (n = 26), and −6.7 ± 2.0% (n = 16), respectively. A pairwise com-parison at week 48 in the TCZ arm showed no significant dif-ferences between the mild, moderate, and severe QILD strata. Those with >5% QILD in the placebo arm showed worsening
Figure 1. Relationship of forced vital capacity percent predicted (FVC%) with increasing severity of baseline quantitative interstitial lung disease (QILD) (A) and with increasing severity of baseline quantitative lung fibrosis (QLF) (B). Data are shown as box plots. Each box represents the upper and lower interquartile range. Lines inside the boxes represent the median. Whiskers represent the minimum and maximum values. Each symbol represents an individual subject.
Figure 2. Mean trend over time of change in forced vital capacity percent predicted (FVC%) in the interstitial lung disease (ILD) patients, according to treatment group and quantitative ILD (QILD) score of the whole lung. The QILD severity category of ≤5% was removed from this model, as there were only 2 evaluable patients in the placebo (PBO) group and 4 evaluable patients in the tocilizumab (TCZ) treatment group with ≤5% QILD over 48 weeks. LSM = least squares mean.

ROOFEH ET AL 1306 |
FVC% decline, also with no significant pairwise differences in the trajectory of decline based on QILD severity.
Figure 3 shows a similar preservation effect in the TCZ arm, which was not present in the placebo arm when stratified accord-ing to QLF severity. The mean trend over time of FVC% change, accounting for the covariates listed in Methods, did not differ based on the extent of QLF for either the TCZ or placebo arm.
Stabilization by TCZ of QILD and QLF over 48 weeks, for all ranges of baseline QILD and QLF scores. Table 3 shows QILD and QLF scores at baseline and at 48 weeks, sep-arated by treatment arm and stratified according to baseline QILD and QLF cutoff points. As expected, higher baseline QILD and QLF scores reflected higher QILD and QLF scores at 48 weeks. At 48 weeks, the overall QILD scores for the TCZ arm showed significant improvement (mean −1.8% [95% CI −3.8, 0.09]; P = 0.02). This benefit appears to be largely driven by high degrees of QILD at baseline; patients with >20% QILD showed the largest improvement of any of the subsets (mean −4.9 [95% CI −8.5, −1.2]; P = 0.01). In terms of fibrosis, there was a significant increase in QLF scores at 48 weeks in the placebo arm (mean 0.7 [95% CI 0.3, 1.2]; P = 0.00) that was not seen in the TCZ arm (mean −0.5 [95% CI −1.3, 0.3]; P = 0.12). This decline in the placebo arm appears to be driven by worsening of QLF scores in the first and second tertiles.
DISCUSSION
In an earlier phase II trial, TCZ showed preservation of FVC% compared to the placebo group in a population of patients with early dcSSc; fewer patients in the TCZ arm showed a decline in FVC% (10% in the TCZ group versus 23% in the placebo group had ≥10% absolute decrease in FVC%) (9). Based on these
preliminary findings, the focuSSced trial was designed showing that, in patients with early dcSSc, the effect of lung function pres-ervation was replicated over 48 weeks (mean decline in the TCZ group −0.6% versus −4.0% in the placebo group; P = 0.002) (10). In the present study, we performed a post hoc analysis using indi-vidual patient data from the focuSSced trial and demonstrated that ~65% of patients with early dcSSc had HRCT- defined ILD, with 77% of participants having >10% total lung involvement (as assessed by QILD). The preservation of FVC in the TCZ arm did not vary according to baseline QILD or QLF score, emphasiz-ing the importance of early intervention to retard progression for those with even mild lung involvement. In addition, the placebo arm showed worsening lung fibrosis on HRCT scans at 48 weeks, whereas the TCZ arm showed attenuation of development of pro-gressive fibrosis.
Our population in the focuSSced trial included an at- risk group for progressive ILD: early dcSSc patients with progres-sive skin disease and elevated acute- phase reactants. This cohort may represent an immunoinflammatory phase, rather than advanced- stage fibrotic ILD studied in previous SSc- ILD trials. Four large prior studies (e.g., the Scleroderma Lung Study I [SLS I] [19] and SLS II [20], the FAST trial [21], and the SENSCIS trial [22]) included patients with both limited cutaneous SSc and dcSSc, with a median disease duration of ≤7 years, and included patients who were categorized as having clinical ILD based on respiratory symptoms (grade ≥2 exertional dyspnea according to baseline Mahler Dyspnea Index [23] in SLS I and SLS II) and fibrosis (≥10% of the lungs in the SENSCIS trial) (4,24,25). Par-ticipants in these trials had moderate- to- severe fibrotic disease: subjects in SLS II had a mean ± SD QLF score of 8.6 ± 6.9%, and subjects in the SENSCIS trial had a mean ± SD visual fibro-sis score of 36.8 ± 21.8 in the treatment arm and of 35.2 ± 20.7
Figure 3. Mean trend over time of FVC% in the ILD patients, according to treatment group and quantitative lung fibrosis score of the whole lung. See Figure 2 for other definitions.

TCZ STABILIZES FVC IN EARLY SSc- ILD | 1307
Tab
le 3
. P
atie
nt Q
ILD
and
QLF
sco
res
at b
asel
ine
and
at w
eek
48*
Base
line,
m
ean
(95%
CI)
[n]
Wee
k 48
, m
ean
(95%
CI)
[n]
Chan
ge fr
om b
asel
ine,
m
ean
(95%
CI)
[n]
TCZ
grou
pPl
aceb
o gr
oup
TCZ
grou
pPl
aceb
o gr
oup
TCZ
grou
pPl
aceb
o gr
oup
Who
le- lu
ng Q
ILD
Ove
rall
(n =
103
)21
.1 (1
7.6,
24.
5) [5
5]16
.0 (1
3.8,
18.
1) [4
8]19
.2 (1
6.2,
22.
3) [5
5]17
.4 (1
4.9,
19.
9) [4
8]−1
.8 (−
3.8,
0.0
9) [5
5]†
1.5
(−0.
3, 3
.3) [
48]
≤5%
(n =
4)
3.9
(1.5
, 6.3
) [3]
4.3
(NA)
[1]
3.6
(−1.
2, 8
.4) [
3]5.
9 (N
A) [1
]−0
.3 (−
3.8,
3.2
) [3]
1.6
(NA)
[1]
>5– 1
0% (n
= 1
9)7.
2 (6
.0, 8
.4) [
9]8.
0 (7
.0, 9
.0) [
10]
7.8
(5.0
, 10.
6) [9
]11
.6 (6
.6, 1
6.7)
[10]
0.6
(−1.
6, 2
.7) [
9]3.
6 (−
0.9,
8.1
) [10
]>1
0– 20
% (n
= 4
3)15
.1 (1
3.8,
16.
4) [1
9]14
.4 (1
3.2,
15.
6) [2
4]15
.7 (1
2.6,
18.
7) [1
9]16
.8 (1
4.9,
19.
9) [2
4]0.
6 (−
2.3,
3.4
) [19
]2.
4 (0
.06,
4.7
) [24
]>2
0% (n
= 3
7)33
.2 (2
9.5,
36.
8) [2
4]25
.8 (2
2.6,
29.
0) [1
3]28
.3 (2
4.5,
32.
1) [2
4]24
.0 (1
8.2,
29.
7) [1
3]−4
.9 (−
8.5,
−1.
2) [2
4]‡
−1.9
(−6.
0, 2
.3) [
13]
Who
le- lu
ng Q
LFO
vera
ll (n
= 1
04)
3.7
(2.6
, 4.9
) [55
]2.
3 (1
.4, 3
.2) [
49]
3.3
(2.3
, 4.2
) [55
]3.
0 (2
.0, 4
.1) [
49]
−0.5
(−1.
3, 0
.3) [
55]
0.7
(0.3
, 1.2
) [49
]§Fi
rst t
ertil
e (n
= 3
5)0.
6 (0
.4, 0
.7) [
15]
0.6
(0.5
, 0.8
) [20
]0.
7 (0
.3, 1
.0) [
15]
1.1
(0.7
, 1.5
) [20
]0.
09 (−
0.2,
0.4
) [15
]0.
5 (0
.06,
0.8
) [20
]§Se
cond
tert
ile (n
= 3
6)1.
7 (1
.5, 1
.9) [
18]
1.7
(1.4
, 1.9
) [18
]1.
7 (1
.1, 2
.3) [
18]
3.1
(2.0
, 4.1
) [18
]0.
01 (−
0.7,
0.7
) [18
]1.
4 (0
.5, 2
.3) [
18]§
Third
tert
ile (n
= 3
3)7.
6 (5
.4, 9
.7) [
22]
6.3
(3.2
, 9.3
) [22
]6.
3 (4
.6, 8
.0) [
22]
6.4
(2.4
, 10.
4) [1
1]−1
.3 (−
3.3,
0.7
) [22
]0.
1 (−
1.3,
1.6
) [11
]*
Neg
ativ
e sc
ore
deno
tes
impr
ovem
ent.
QIL
D d
ata
are
mis
sing
for 3
3 pa
tient
s: 1
9 pa
tient
s dr
oppe
d ou
t bet
wee
n w
eeks
0 a
nd 4
8 (7
in th
e TC
Z ar
m a
nd 1
2 in
the
plac
ebo
arm
), an
d 14
wer
e ac
tive
thro
ugh
wee
k 48
but
had
mis
sing
dat
a at
wee
k 48
(6 in
the
TCZ
arm
and
8 in
the
plac
ebo
arm
). Q
LF d
ata
are
mis
sing
for 3
2 pa
tient
s: 1
9 dr
oppe
d ou
t bet
wee
n w
eeks
0 a
nd 4
8 (7
in
the
TCZ
arm
and
12
in th
e pl
aceb
o ar
m),
and
13 w
ere
activ
e th
roug
h w
eek
48 b
ut h
ad m
issi
ng d
ata
at w
eek
48 (6
in th
e TC
Z ar
m a
nd 7
in th
e pl
aceb
o ar
m).
NA
= no
t app
licab
le (i
.e.,
the
95%
co
nfide
nce
inte
rval
[95%
CI]
coul
d no
t be
calc
ulat
ed, a
s n
= 1)
(see
Tab
le 1
for o
ther
defi
nitio
ns).
† P
= 0.
02 v
ersu
s ba
selin
e, b
y W
ilcox
on’s
sign
ed ra
nk te
st.
‡ P
= 0.
01 v
ersu
s ba
selin
e, b
y W
ilcox
on’s
sign
ed ra
nk te
st.
§ P
= 0.
00 v
ersu
s ba
selin
e, b
y W
ilcox
on’s
sign
ed ra
nk te
st.

ROOFEH ET AL 1308 |
in the placebo arm (24,26). With the exception of the FAST trial (FVC% 80.1% and 81.0% in the treatment and placebo arms, respectively), participants in these studies demonstrated FVC% impairment: 68.1% in SLS I, 66.5% in SLS II, and 72% in SENSCIS (19,20,22).
Placebo- controlled trials and observational cohort studies inform our understanding of the natural progression of SSc- ILD; these data play an important role in illuminating the pathogene-sis of SSc- ILD progression in our group with additional clinical ILD patients (26– 30). The resulting mean ± SD rate of decline of FVC in the focuSSced placebo group was 228.2 ± 394.2 ml over 48 weeks, or an FVC% of ~6.5%, which was considerably higher than those previously reported. For instance, the FAST trial demonstrated a mean decline of 3.0% (21), which was similar to that of the SLS I trial (2.6%) (19), and the SENSCIS cohort showed a decline of 2.6%, or mean ± SD 93.3 ± 13.5 ml, over 52 weeks (22). As such, our current analysis may influence trial design by providing a template to target early ILD, in which the participants have no or minimal respiratory symptoms, and include more patients with progressive fibrotic ILD, where treatment impact may be easier to detect (31).
Considerable variability in screening for SSc- ILD with HRCT still exists (32). There is increasing consensus that all patients with SSc should receive screening with HRCT (33). Our data demon-strate the value of obtaining HRCT scans at the time of diagno-sis: pulmonary function tests (PFTs) are not sensitive enough to accurately assess the presence of ILD, and delays in treatment initiation may lead to irreversible disease (25,34). Recently, the Fleischner Society published a consensus statement on intersti-tial lung abnormalities (35). They acknowledged that abnormalities identified during screening for ILD in high- risk groups (e.g., those with SSc) are not considered to be interstitial lung abnormalities because they are not incidental (35). Data analysis shows that QILD involvement of >5% (with a majority of patients having involvement in their lower body areas) was associated with a large decline in FVC% in the placebo group over 48 weeks, which was mirrored in those with >10% QILD in the placebo group, highlighting the need for universal screening with HRCT in early dcSSc.
A unified treatment algorithm does not yet exist for SSc- ILD. Recent published work has established evidence- based consensus statements on medical management of SSc- ILD; however, these do not address the varying subsets of SSc- ILD severity that impact clinical treatment decisions in practice (4,24,25). Our treatment algorithm classified patients as having either subclinical ILD (those with minimal ILD and preserved lung function) or clinical ILD (those with moderate- to- severe ILD and/or decline in PFTs). Based on the current data, we propose to treat those with subclinical ILD with at- risk features (4,24,25). As evidence accumulates for treatment effects in subsets of SSc- ILD, practice guidelines may favor targeted immunomod-ulatory therapies in early disease versus antifibrotic therapy in later disease.
Strengths of our analysis include well- characterized data from a clinical trial and utilization of a well- established quantita-tive lung disease program to provide finer granularity for under-standing the lung preservation effect of TCZ. This study serves as an example of the use of quantitative HRCT measurements in understanding SSc- ILD pathophysiology and its response to treatment (14,36).
This analysis is not without limitations. First, the analysis is post hoc and should be considered as hypothesis- generating. Second, while the reduction in FVC reflects fewer functional alve-olar units (37), it is an indirect measurement of the flow- resistive properties of the lung (38), and other factors in early SSc may confound the results (e.g., hide- bound chest thickness can cause thoracic restriction, poor patient effort, an inability to form a tight seal around the mouthpiece). This was addressed by standardiz-ing spirometry in the clinical trial. Finally, the minimal (≤5%) QILD group had too few patients to establish any meaningful assump-tions. Nevertheless, as the field of quantitative radiomics advances its ability to reliably identify interstitial disease changes this small, even this low percentage of lung involvement may prove to have clinical implications.
In conclusion, early dcSSc is associated with high prev-alence of ILD, with 77% having moderate- to- severe ILD. TCZ was effective in preserving the lung function, irrespective of the degree of QILD and QLF at baseline. This likely represents tar-geting of the immunoinflammatory, early fibrotic phase of the disease (39) and may be a window of therapeutic opportunity to preserve lung function in early dcSSc. We also highlight the natural history of early ILD that may serve as a template for other fibrotic diseases.
ACKNOWLEDGMENTS
We thank the sites and the patients who participated in the trial. We also thank the following focuSSced investigators from around the world: Eleonora Lucero, Bernardo Pons- Estel, Mariano Rivero, and Guillermo Tate (Argentina); Vanessa Smith, Ellen De Langhe (Belgium); Rasho Rashkov, Anastas Batalov, Ivan Goranov, and Rumen Stoilov (Bulgaria); James Dunne, Sindhu R. Johnson, and Janet E. Pope (Canada); Dušanka Martinović Kaliterna (Croatia); Mette Mogensen and Anne Braae Olesen (Denmark); Yannick Allanore (France); Joerg Christoph Henes, Ulf Müller- Ladner, Gabriela Riemekasten, and Alla Skapenko (Germany); Panayiotis Vlachoyiannopoulos (Greece); Emese Kiss and Tünde Minier (Hungary); Lorenzo Beretta, Elisa Gremese, Marco Matucci- Cerinic, and Gabriele Valentini (Italy); Yoshihide Asano, Tatsuya Atsumi, Hironobu Ihn, Tomonori Ishii, Osamu Ishikawa, Masataka Kuwana, Yoshihito Shima, Hiroki Takahashi, Kazuhiko Takehara, Yoshiya Tanaka, and Yoshioki Yamasaki (Japan); Loreta Bukauskiene and Irena Butrimiene (Lithuania); Gabriel Medrano Ramirez, Cesar Ramos- Remus, and Tatiana Sofia Rodriguez Reyna (Mexico); Jeska de Vries- Bouwstra and Jacob M. van Laar (The Netherlands); Bogdan Batko, Slawomir Jeka, Eugeniusz Kucharz, Maria Majdan, Marzena Olesinska, and Zaneta Smolenska (Poland); Jose Alves and Maria Santos (Portugal); Carmen Marina Mihai and Simona Rednic (Romania); Ivan Castellvi Barranco, Francisco Javier Lopez Longo, Carmen Simeon Aznar, and Patricia Carreira (Spain); Oliver Distler and Ulrich A. Walker (Switzerland); Emma Derrett- Smith, Bridget Griffiths, and Neil McKay (UK); Jacob Aelion, Michael Borofsky, Roy Fleischmann, Joseph Z. Forstot, Suzanne Kafaja, M. Faisal Khan, Michael D. Kohen,

TCZ STABILIZES FVC IN EARLY SSc- ILD | 1309
Richard W. Martin, Fabian Mendoza- Ballesteros, Alireza Nami, Shirley Pang, Grissel Rios, Robert Simms, Keith Michael Sullivan, and Virginia D. Steen (US).
AUTHOR CONTRIBUTIONS
All authors were involved in drafting the article or revising it critically for important intellectual content, and all authors approved the final version to be published. Dr. Khanna had full access to all of the data in the study and takes responsibility for the integrity of the data and the accuracy of the data analysis.Study conception and design. Roofeh, Lin, Goldin, Kim, Furst, Denton, Huang, Khanna.Acquisition of data. Roofeh, Lin, Goldin, Kim, Furst, Denton, Khanna.Analysis and interpretation of data. Roofeh, Lin, Goldin, Kim, Furst, Denton, Huang, Khanna.
ADDITIONAL DISCLOSURES
Author Lin is an employee of Genentech.
REFERENCES 1. Denton CP, Khanna D. Systemic sclerosis [review]. Lancet 2017;
390:1685– 99.
2. Allanore Y, Simms R, Distler O, Trojanowska M, Pope J, Denton CP, et al. Systemic sclerosis [review]. Nat Rev Dis Prim 2015;1:1– 21.
3. De Lauretis A, Veeraraghavan S, Renzoni E. Connective tissue disease- associated interstitial lung disease: how does it differ from IPF? How should the clinical approach differ? Chron Respir Dis 2011;8:53– 82.
4. Roofeh D, Distler O, Allanore Y, Denton CP, Khanna D. Treatment of systemic sclerosis– associated interstitial lung disease: lessons from clinical trials. J Scleroderma Relat Disord 2020;5:61– 71.
5. Nihtyanova SI, Schreiber BE, Ong VH, Rosenberg D, Moinzadeh P, Coghlan JG, et al. Prediction of pulmonary complications and long- term survival in systemic sclerosis. Arthritis Rheumatol 2014;66:1625– 35.
6. Liu X, Mayes MD, Pedroza C, Draeger HT, Gonzalez EB, Harper BE, et al. Does C- reactive protein predict the long- term pro-gression of interstitial lung disease and survival in patients with early systemic sclerosis? Arthritis Care Res (Hoboken) 2013;65:1375– 80.
7. Assassi S, Leyva AL, Mayes MD, Sharif R, Nair DK, Fischbach M, et al. Predictors of interstitial lung disease in early systemic sclero-sis: a prospective longitudinal study of the GENISOS cohort. Arthritis Res Ther 2010;12:R166.
8. Distler O, Volkmann ER, Hoffmann- Vold AM, Maher TM. Current and future perspectives on management of systemic sclerosis- associated interstitial lung disease [review]. Expert Rev Clin Immunol 2019;15:1009– 17.
9. Khanna D, Denton CP, Jahreis A, van Laar JM, Frech TM, Anderson ME, et al. Safety and efficacy of subcutaneous tocilizumab in adults with systemic sclerosis (faSScinate): a phase 2, randomised, con-trolled trial. Lancet 2016;387:2630– 40.
10. Khanna D, Lin CJ, Furst DE, Goldin J, Kim G, Kuwana M, et al. Tocilizumab in systemic sclerosis: a randomised, double- blind, placebo- controlled, phase 3 trial. Lancet Respir Med 2020;8:963– 74.
11. Van den Hoogen F, Khanna D, Fransen J, Johnson SR, Baron M, Tyndall A, et al. 2013 classification criteria for systemic sclerosis: an American College of Rheumatology/European League Against Rheumatism collaborative initiative. Arthritis Rheum 2013;65:2737– 47.
12. Clements PJ, Lachenbruch PA, Ng SC, Simmons M, Sterz M, Furst DE. Skin score: a semiquantitative measure of cutaneous
involvement that improves prediction of prognosis in systemic scle-rosis. Arthritis Rheum 1990;33:1256– 63.
13. Graham BL, Steenbruggen I, Miller MR, Barjaktarevic IZ, Cooper BG, Hall GL, et al. Standardization of spirometry 2019 update. An official American Thoracic Society and European Respiratory Society technical statement. Am J Respir Crit Care Med 2019;200: e70– 88.
14. Kim GH, Tashkin DP, Lo P, Brown MS, Volkmann ER, Gjertson DW, et al. Using transitional changes on high- resolution computed tomography to monitor the impact of cyclophosphamide or myco-phenolate mofetil on systemic sclerosis– related interstitial lung dis-ease. Arthritis Rheumatol 2020;72:316– 25.
15. Goldin JG, Kim GH, Tseng CH, Volkmann E, Furst D, Clements P, et al. Longitudinal changes in quantitative interstitial lung disease on computed tomography after immunosuppression in the Scleroderma Lung Study II. Ann Am Thorac Soc 2018;15:1286– 95.
16. Volkmann ER, Tashkin DP, Sim M, Li N, Khanna D, Roth MD, et al. Cyclophosphamide for systemic sclerosis- related interstitial lung dis-ease: a comparison of Scleroderma Lung Study I and II. J Rheumatol 2019;46:1316– 25.
17. Kim HJ, Tashkin DP, Clements P, Li G, Brown MS, Elashoff R, et al. A computer- aided diagnosis system for quantitative scoring of extent of lung fibrosis in scleroderma patients. Clin Exp Rheumatol 2010;28 Suppl 62:S26– 35.
18. Goh NS, Desai SR, Veeraraghavan S, Hansell DM, Copley SJ, Maher TM, et al. Interstitial lung disease in systemic sclerosis: a simple staging system. Am J Respir Crit Care Med 2008;177:1248– 54.
19. Tashkin DP, Elashoff R, Clements PJ, Goldin J, Roth MD, Furst DE, et al. Cyclophosphamide versus placebo in scleroderma lung dis-ease. N Engl J Med 2006;354:2655– 66.
20. Tashkin DP, Roth MD, Clements PJ, Furst DE, Khanna D, Kleerup EC, et al. Mycophenolate mofetil versus oral cyclophosphamide in scleroderma- related interstitial lung disease (SLS II): a randomised controlled, double- blind, parallel group trial. Lancet Respir Med 2016;4:708– 19.
21. Hoyles RK, Ellis RW, Wellsbury J, Lees B, Newlands P, Goh NS, et al. A multicenter, prospective, randomized, double- blind, placebo- controlled trial of corticosteroids and intravenous cyclophosphamide followed by oral azathioprine for the treatment of pulmonary fibrosis in scleroderma. Arthritis Rheum 2006;54:3962– 70.
22. Distler O, Highland KB, Gahlemann M, Azuma A, Fischer A, Mayes MD, et al. Nintedanib for systemic sclerosis- associated interstitial lung disease. N Engl J Med 2019;380:2518– 28.
23. Mahler DA, Weinberg DH, Wells CK, Feinstein AR. The measure-ment of dyspnea: contents, interobserver agreement, and physio-logic correlates of two new clinical indexes. Chest 1984;85:751– 8.
24. Roofeh D, Khanna D. Management of systemic sclerosis: the first five years [review]. Curr Opin Rheumatol 2020;32:228– 37.
25. Roofeh D, Jaafar S, Vummidi D, Khanna D. Management of sys-temic sclerosis- associated interstitial lung disease [review]. Curr Opin Rheumatol 2019;31:241– 9.
26. Khanna D, Tashkin DP, Denton CP, Renzoni EA, Desai SR, Varga J. Aetiology, risk factors, and biomarkers in systemic sclero-sis with interstitial lung disease. Am J Respir Crit Care Med 2020;201:650– 60.
27. Khanna D, Nagaraja V, Tseng CH, Abtin F, Suh R, Kim G, et al. Predictors of lung function decline in scleroderma- related intersti-tial lung disease based on high- resolution computed tomography: implications for cohort enrichment in systemic sclerosis- associated interstitial lung disease trials. Arthritis Res Ther 2015;17:1– 10.
28. Steen VD, Conte C, Owens GR, Medsger TA Jr. Severe restrictive lung disease in systemic sclerosis. Arthritis Rheum 1994;37:1283– 9.
29. Steen V. Predictors of end stage lung disease in systemic sclerosis. Ann Rheum Dis 2003;62:97– 9.

ROOFEH ET AL 1310 |
30. Winstone TA, Assayag D, Wilcox PG, Dunne JV, Hague CJ, LeipsicJ, et al. Predictors of mortality and progression in scleroderma- associated interstitial lung disease: a systematic review. Chest2014;146:422– 36.
31. Silver RM. Systemic sclerosis: choosing patients wisely whentreating interstitial lung disease [review]. Nat Rev Rheumatol2017;13:455– 6.
32. Bernstein EJ, Khanna D, Lederer DJ. Screening high- resolutioncomputed tomography of the chest to detect interstitial lung disease in systemic sclerosis: a global survey of rheumatologists. ArthritisRheumatol 2018;70:971– 2.
33. Hoffmann- Vold AM, Maher TM, Philpot EE, Ashrafzadeh A, BarakeR, Barsotti S, et al. The identification and management of interstitiallung disease in systemic sclerosis: evidence- based European con-sensus statements. Lancet Rheumatol 2020;2:E71– 83.
34. Suliman YA, Dobrota R, Huscher D, Nguyen- Kim TD, Maurer B,Jordan S, et al. Pulmonary function tests: high rate of false- negativeresults in the early detection and screening of scleroderma- relatedinterstitial lung disease. Arthritis Rheumatol 2015;67:3256– 61.
35. Hatabu H, Hunninghake GM, Richeldi L, Brown KK, Wells AU, Remy- Jardin M, et al. Interstitial lung abnormalities detected inci-dentally on CT: a Position Paper from the Fleischner Society. LancetRespir Med 2020;8:726– 37.
36. Montesi SB, Caravan P. Novel imaging approaches in systemicsclerosis- associated interstitial lung disease [review]. Curr Rheumatol Rep 2019;21:25.
37. O’Donnell D. Physiology of interstitial lung disease. In: Schwartz M,King T, editors. Interstitial lung disease. Hamilton: Marcel Dekker;1998. p. 51– 70.
38. Grippi MA, Tino G. Pulmonary function testing. In: Grippi MA, EliasJA, Fishman JA, Kotloff RM, Pack AI, Senior RM, Siegel MD, editors. Fishman’s pulmonary diseases and disorders, 5th ed. New York;McGraw- Hill: 2015. p. 1–75.
39. Denton CP, Ong VH, Xu S, Chen- Harris H, Modrusan Z, LafyatisR, et al. Therapeutic interleukin- 6 blockade reverses transforminggrowth factor- β pathway activation in dermal fibroblasts: insightsfrom the faSScinate clinical trial in systemic sclerosis. Ann RheumDis 2018;77:1362– 71.

1311
Arthritis & RheumatologyVol. 73, No. 7, July 2021, pp 1311–1317DOI 10.1002/art.41659© 2021, American College of Rheumatology
B R I E F R E P O R T
Dysfunctional Keratinocytes Increase Dermal Inflammation in Systemic Sclerosis: Results From Studies Using Tissue- Engineered Scleroderma EpidermisBarbara Russo,1 Julia Borowczyk,1 Wolf- Henning Boehncke,1 Marie- Elise Truchetet,2 Ali Modarressi,1 Nicolò C. Brembilla,1 and Carlo Chizzolini1
Objective. Evidence suggests that keratinocyte– fibroblast interactions are abnormal in systemic sclerosis (SSc). The present study was undertaken to investigate potential epidermal dysfunction in SSc and its effects on dermal homeostasis.
Methods. Epidermal equivalents (EEs) were generated using keratinocytes from 6 healthy donors and 4 individuals with SSc. Skin and EE expression of markers of proliferation, differentiation, and activation was evaluated by immunohistochemistry. The transcriptomic profile of SSc EEs and healthy donor EEs was identified by RNA sequencing. EE conditioned medium (CM) was used to stimulate fibroblasts, and their production of interleukin- 6 (IL- 6), IL- 8, matrix metalloproteinase 1 (MMP- 1), type I collagen, and fibronectin was assessed by enzyme- linked immunosorbent assay.
Results. Compared to healthy donor EEs, SSc EEs exhibited aberrant differentiation, enhanced expression of activation markers, and a lower rate of basal keratinocyte mitosis, reproducing most of the abnormalities observed in SSc epidermis. RNA sequencing analysis revealed that, compared to healthy donor EEs, SSc EEs were characterized by lower expression of homeobox gene family members and by enhanced metabolic and oxidative stress molecular pathways. EE CM enhanced fibroblast production of IL- 6, IL- 8, MMP- 1, type I collagen, and fibronectin (P < 0.05). Except for type I collagen and fibronectin, this effect was 2- fold higher in the presence of CM generated form SSc EEs. IL- 1 was responsible, at least in part, for keratinocyte- dependent fibroblast activation.
Conclusion. SSc EEs recapitulate the in vivo characteristics of SSc epidermis, demonstrating that SSc keratinocytes have an intrinsically altered differentiation program, possibly due to the dysregulation of genes from the homeobox family. The increased metabolic and oxidative stress associated with SSc epidermis may contribute to chronic inflammation and fibrosis of the dermis.
INTRODUCTION
Skin fibrosis is the hallmark of systemic sclerosis (SSc) and results from an as- yet- imperfectly- understood interplay between uncontrolled reparative processes, inflammatory responses, and vascular abnormalities leading to excessive accumulation of
extracellular matrix (ECM). Recent evidence suggests a potential role of keratinocytes and epidermis in SSc pathogenesis (for review, see ref. 1). Disorganized differentiation, abnormal activation, and enhanced interleukin- 1 (IL- 1) production in SSc epidermis have been reported, with keratinocytes enhancing α- smooth muscle actin expression by fibroblasts (2– 5). Additionally, transcriptome
Supported in part by the Swiss National Science Foundation (grant 310030- 175470 to Dr. Boehncke and grant 310030- 159999 to Dr. Chizzolini). Dr. Russo’s work was supported by the Ernst and Lucie Schmidheiny Foundation. Dr. Chizzolini’s work was supported by the Swiss Scleroderma Patient Organization.
1Barbara Russo, MD, PhD, Julia Borowczyk, PhD, Wolf- Henning Boehncke, MD, PhD, Ali Modarressi, MD, PhD, Nicolò C. Brembilla, PhD, Carlo Chizzolini, MD: University of Geneva and Geneva University Hospitals, Geneva, Switzerland; 2Marie- Elise Truchetet, MD, PhD: University Hospital, Bordeaux, France.
Dr. Boehncke has received consulting fees, speaking fees, and/or honoraria from AbbVie, Almirall, Bristol Myers Squibb, Celgene, Leo, Lilly,
Novartis, and UCB (less than $10,000 each). Dr. Chizzolini has received consulting fees, speaking fees, and/or honoraria from GlaxoSmithKline, Roche, and Boehringer Ingelheim (less than $10,000 each). No other disclosures relevant to this article were reported.
The RNAseq data can be found in the GEO repository under accession number GSE15 6173, with a 1- year embargo.
Address correspondence to Carlo Chizzolini, MD, Department of Pa-thology and Immunology, Centre Médical Universitaire, Rue Michel- Servet 1, Geneva 1206, Switzerland. Email: [email protected].
Submitted for publication August 13, 2020; accepted in revised form January 14, 2021.

RUSSO ET AL 1312 |
studies have identified a keratin signature in SSc skin, and stud-ies applying a systems biology approach to SSc transcriptom-ics revealed that keratinocytes share nodes with inflammatory networks (6).
It is challenging to culture primary SSc keratinocytes in vitro, and when cultured in monolayers they may lack functions asso-ciated with a fully stratified epidermis. In this study we used epi-dermal equivalents (EEs) engineered using SSc keratinocytes to investigate the characteristics of epidermis in SSc and their effect on dermal homeostasis.
PATIENTS AND METHODS
Ethics approval. This study was approved by the local ethical committee (06- 063, Commission cantonale d’éthique de la recherche, Geneva, Switzerland) and was conducted accord-ing to the Declaration of Helsinki. Written informed consent was obtained from all study subjects.
Human samples. All SSc patients fulfilled the 2013 Amer-ican College of Rheumatology/European Alliance of Associations for Rheumatology classification criteria (7). Their clinical charac-teristics are reported in Supplementary Table 1 (on the Arthri-tis & Rheumatology website at http://onlin elibr ary.wiley.com/doi/10.1002/art.41659/ abstract). Punch biopsy samples were obtained from SSc- affected arm skin. Surgical biopsy specimens were obtained from age- and sex- matched healthy donors under-going abdominoplasty at the Department of Plastic, Reconstruc-tive, and Aesthetic Surgery, Geneva University Hospital. None of the healthy donors had dermatologic disorders.
Epidermal equivalent engineering. Primary human der -mal fibroblasts and keratinocytes were isolated from healthy donor and SSc skin as previously described (8). Of note, 2 of the patients with SSc were not receiving any treatment, and 1 was being treated only with low- dose prednisone, at the time keratinocytes were obtained. For 3- dimensional generation of EEs, we used a modified version of a method previously described (9). Briefly, pri-mary keratinocytes (5 × 10⁵) from 6 healthy donors and 4 patients with SSc were plated onto ThinCert cell culture inserts (Greiner Bio- One) and grown to confluence in CnT- Prime medium. After 3 days, the medium was switched to CnT- Prime 3D Barrier medium (Cellntec) and the cells cultured at the air– liquid interface for 11 days. The medium was changed every other day. On the last day of culture, conditioned medium (CM) was collected and immedi-ately frozen until use. EEs were harvested and used for RNA isola-tion or prepared for microscopy.
RNA sequencing analysis. RNA was isolated from 6 inde-pendent healthy donor EEs and 3 independent SSc EEs. The transcriptome metrics were evaluated with the Picard tool, version 1.141. Mapping to each gene feature in the University of California,
Santa Cruz human hg38 reference was prepared with HTSeq, version 0.9.1. Differential expression analysis was performed using R/Bioconductor package edgeR, version 3.18.1. Genes were filtered on expression levels, and unpaired t- tests were used to assess the significance of differential expression. P values were corrected for multiple testing errors with a 5% false discovery rate (FDR), using the Benjamini- Hochberg method. Gene Set Enrich-ment Analysis (GSEA), desktop version 3.0 was used to analyze the pattern of differential gene expression between SSc and healthy donor EEs. The Hallmark gene set from the Molecular Sig-natures Database was used. Additionally, a gene set associated with the SSc skin gene signature was created using a list of genes that are differentially expressed in SSc compared to healthy donor skin, overlapping in 2 large, publicly available transcriptomic data sets (GSE58095, EGAO00000000316). Results of GSEA analysis were plotted using R- package ggplot2. Differentially expressed genes with an FDR of ≤0.1 were uploaded for the protein– protein interaction network using the String, version 11 database, and interactions with at least medium confidence (interaction score >0.4) were set by default. The Markov cluster algorithm was used to identify clusters. The String database was used to perform enrichment analysis for Gene Ontology (GO) annotation.
Additional methods. Additional methods are described in detail in Supplementary Methods (on the Arthritis & Rheumatology website at http://onlin elibr ary.wiley.com/doi/10.1002/art.41659/ abstract).
RESULTS
SSc epidermal equivalents reproduce the altered phe notype of SSc epidermis. Epidermis homeostasis de -pends on a tightly controlled balance between keratinocyte pro-liferation and differentiation, following a precise topography that reflects the unique functions of distinct epidermal layers (Sup-plementary Figure 1, on the Arthritis & Rheumatology website at http://onlin elibr ary.wiley.com/doi/10.1002/art.41659/ abstract). After 14 days of in vitro culture, fully differentiated keratino-cytes in our EEs formed a polarized human epidermis with physiologic suprabasal localization of keratin 10 (Supplementary Figure 2, http://onlin elibr ary.wiley.com/doi/10.1002/art.41659/ abstract). The number of Ki- 67+ cells/mm in the basal layer was substantially lower in SSc EEs compared to healthy donor EEs (P < 0.0001) (Figures 1A and C), similar to the findings in SSc and healthy donor skin (P = 0.001) (Figures 1B and C). Com-pared to healthy donor EEs, the expression of involucrin, filaggrin, and loricrin in SSc EE was deeper and wider. When quantified, the mean area occupied by these markers over the total epider-mis area was >2- fold greater in SSc EEs than in healthy donor EEs (P ≤ 0.05) (Figures 1A and C). Notably, similar differences were observed in histologic preparations of healthy donor and SSc skin (Figures 1B and C).

EPIDERMAL DYSFUNCTION IN SSc | 1313
Keratin 6 and keratin 16, considered to be markers of keratinocyte activation, are expressed in the epidermis only under certain circumstances, such as damage or inflamma-tion. Accordingly, keratin 6 was almost absent in healthy donor skin but highly expressed with a patchy distribution in SSc skin, where the number of keratin 6– positive cells (relative to the total number of cells) was higher than in healthy donor skin (mean ± SEM 9.8 ± 4.4% versus 0.3 ± 0.5%; P = 0.002). Simi-larly, keratin 16 staining was absent in healthy donor skin kerat-inocytes and discretely positive in SSc. However, keratin 6 and keratin 16 were expressed in both healthy donor EEs and SSc EEs, with a tendency for more intense staining in SSc EEs (Sup-plementary Figure 3, http://onlin elibr ary.wiley.com/doi/10.1002/art.41659/ abstract).
Taken together, our data indicate that SSc keratinocytes have a distinctive distribution pattern of late differentiation and activa-tion markers concomitant with low mitotic activity. Importantly, the SSc EEs displayed most of the histologic abnormalities observed in SSc epidermis.
Altered oxidative stress– and cell differentiation– associated pathways in SSc EEs, demonstrated by tran-scriptomic profile analysis. To explore the characteristics of genes expressed in SSc EEs compared to healthy donor EEs as detected by RNA sequencing, we performed a threshold- free GSEA. The 50 most highly differentially expressed genes are shown in Figure 2A. Of interest, pathways that were significantly enriched in SSc EEs were particularly involved in oxidative stress (oxidative phosphorylation, E2F targets, mechanistic target of rapamycin signaling) and metabolism (protein secretion, Myc tar-gets V1, fatty acid metabolism, DNA repair) (Figure 2B).
To further explore the genes that were differentially expressed in SSc EEs versus healthy donor EEs, we compared the expres-sion levels of these genes. We identified 12 genes that were dif-ferentially expressed with an FDR of ≤0.1 and a ≥2- fold increase or decrease in expression; expression was decreased in 9 of these genes and increased in 3. Network analysis of these genes revealed 2 clusters of functionally associated genes: one com-posed of transcription factors from the homeobox gene family and
Figure 1. Altered differentiation and reduced mitotic rate in systemic sclerosis (SSc) epidermal equivalents (EEs) reproduce SSc skin characteristics. A and B, Immunostaining of healthy donor (HD)– and SSc patient– derived EEs (A) and skin (B) for Ki- 67 and selected epidermis differentiation markers. Representative results from 4– 6 healthy donor EE samples, 4 SSc EE samples, 3– 4 healthy donor skin samples, and 3– 4 SSc skin samples are shown. Arrows denote Ki- 67– positive cells; star denotes melanin deposits in SSc keratinocytes. Positive staining for involucrin, filaggrin, and loricrin appears in red- brown. Original magnification × 20. C, Box plots depicting the immunostained area as a percentage of the total epidermis area. Each box represents the 25th to 75th percentiles. Lines inside the boxes represent the median. Lines outside the boxes represent the minimum and maximum values. * = P ≤ 0.05; *** = P ≤ 0.001, by unpaired t- test.

RUSSO ET AL 1314 |
the other of proteins from the late cornified envelope family, both of which exhibited decreased expression (Figure 2C). These 2 clus-ters were significantly enriched for GO terms and pathways related to epithelial differentiation and proliferation (Figure 2C), consistent with the data we obtained in immunohistologic experiments.
We next investigated whether the genes we found to be dif-ferentially coexpressed in SSc EEs were also identified in publicly available transcriptomic data when SSc skin was compared to healthy donor skin by GSEA. We used a list of 619 genes that were concordantly identified in 2 microarray gene expression data sets (GSE58095 and EGAO00000000316). Interestingly, we
found that 45% of the genes were shared between our present data and the publicly available data (Figure 2D and Supplementary Table 2, on the Arthritis & Rheumatology website at http://onlin e libr ary.wiley.com/doi/10.1002/art.41659/ abstract), suggesting that SSc EEs mimic the gene signature identified in SSc skin when compared to healthy donor skin.
SSc EEs promote strong IL- 6 and IL- 8 production by dermal fibroblasts and enhance ECM turnover via IL- 1. To investigate whether dysregulation of the epidermis in SSc may affect dermal production of cytokines and deposition
Figure 2. The systemic sclerosis (SSc) epidermal equivalent (EE) transcriptomic profile reveals altered pathways associated with oxidative stress and cell differentiation. A, Heatmap of the top 25 genes with increased expression and the top 25 with decreased expression in SSc EEs compared to healthy donor (HD) EEs, ranked by Gene Set Enrichment Analysis (GSEA). B, Dot plot of enriched pathways determined using the Hallmark gene set from the Molecular Signatures Database. Each dot demonstrates an enriched pathway in SSc. The size of the dot represents the gene count, and the color represents the false discovery rate (FDR). C, String network analysis of the differentially expressed genes with an FDR of ≤0.1 and a fold change (FC) (increase or decrease: blue and red nodes, respectively) of ≥2. The network displays the prediction of protein interaction and association with experimentally determined interactions. The network was enlarged for the prediction of protein interaction with other genes with lower expression in SSc EEs compared to healthy donor EEs, but not satisfying the FDR threshold (gray nodes), according to the Markov cluster algorithm. The bar plot (lower panel) shows Gene Ontology (GO) biologic processes enriched in the 2 clusters identified by String network analysis. D, Plot showing the frequency of genes found by GSEA to be differentially coexpressed in SSc EEs that were also identified in publicly available transcriptomic data. NES = normalized enrichment score. Color figure can be viewed in the online issue, which is available at http://onlinelibrary.wiley.com/doi/10.1002/art.41659/abstract.

EPIDERMAL DYSFUNCTION IN SSc | 1315
of ECM components, we studied the responses of healthy donor dermal fibroblasts to CM generated from SSc EEs and healthy donor EEs. SSc EE CM enhanced the production of IL- 6 and IL- 8 by healthy donor dermal fibroblasts more potently than was observed with healthy donor EE CM. Fibroblast production of IL- 6 and IL- 8 was 4- fold and 2- fold higher, respectively, when induced by SSc EE CM compared to healthy donor EE CM (Figure 3). Simultaneously, SSc EE CM and healthy donor EE CM enhanced the production of fibronectin, type I collagen, and MMP- 1 by healthy donor dermal fibroblasts. SSc EEs stimulated 1.5- fold higher levels of MMP- 1, and similar levels of type I collagen and fibronectin, when compared to healthy donor EEs (Figure 3). IL- 1α is known to be a critical mediator in keratinocyte– fibroblast interactions (3). When we added IL- 1 receptor antagonist (IL- 1Ra) to our cultures, we observed that healthy donor EE– and SSc EE– driven production of IL- 6, IL- 8, and MMP- 1 by healthy donor dermal fibroblasts was drastically reduced, almost to the levels of their spontaneous production (Supplementary Figure 4, http://onlin e libr ary.wiley.com/doi/10.1002/art.41659/ abstract). The pro-duction of type I collagen, but not of fibronectin, was also reduced in the presence of IL- 1Ra (Supplementary Figure 4). These find-ings are consistent with enhanced ECM turnover and increased inflammatory cytokine production in the presence of SSc EEs, possibly reflecting abnormal skin homeostasis in SSc, in which IL- 1 plays a significant role.
DISCUSSION
To interrogate the role of SSc epidermis in dermal inflam-mation, we used SSc keratinocytes to generate EEs. Of major interest, SSc EEs recapitulated the phenotype of SSc epider-mis, mainly characterized by aberrant differentiation and kerat-inocyte activation, which strongly supports the notion that SSc keratinocytes have cell- intrinsic abnormalities. EEs were grown in
the absence of other cell types present in the skin, particularly dermal fibroblasts and endothelial cells, as well as independently from matrix components, which may impact keratinocyte prolif-eration and differentiation. Whether SSc keratinocyte– intrinsic abnormalities are primary, i.e., linked with initial events leading to SSc, or are acquired secondary to alterations in cells of mesen-chymal or hematopoietic origin remains to be established.
Our findings regarding the SSc EE phenotype are consistent with and extend previous work showing keratinocyte activation and altered differentiation in SSc skin (2– 4). Of interest, increased and disorganized differentiation has also been described in other fibrotic skin disorders, such as keloid or postirradiation scars. This highlights the possibility that aberrant epidermal differentiation characterizes skin fibrosis and that dysregulation of the epider-mis may play a role in promoting or maintaining fibrosis.
In contrast to an increased mitotic rate in SSc epidermis described by others (4), we observed a reduced mitotic rate as assessed by Ki- 67 nuclear staining in the basal layer in both SSc skin and SSc EEs. Clinical characteristics, such as shorter disease duration and lower modified Rodnan skin score (10), and sub-tle differences in the normalization of Ki- 67 positivity may explain these discrepancies. The unexpected presence of involucrin in the basal layer of EEs (much fainter in healthy donor EEs compared to SSc EEs) could be due to the high calcium concentration needed to enhance keratinocyte differentiation in vitro, as well as to the lack of dermal fibroblasts and their influence in EEs. Consistent with previous reports (3), we found enhanced expression of ker-atin 16 in SSc skin reproduced in SSc EEs, which may reflect a state of keratinocyte activation, possibly linked to inflammation.
When comparing the transcriptional profiles of SSc EEs and healthy donor EEs, we observed that a cluster of transcription fac-tors from the homeobox family exhibited lower expression in SSc EEs. Since homeobox genes are involved in cell proliferation, differ-entiation, and epidermal development, it is tempting to speculate
Figure 3. Enhanced dermal fibroblast responses induced by systemic sclerosis (SSc) epidermal equivalents (EEs). Levels of interleukin- 6 (IL- 6), IL- 8, matrix metalloproteinase 1 (MMP- 1), type I collagen, and fibronectin in the supernatant of human dermal fibroblasts cultured in the presence of 12.5% conditioned medium (CM) generated from SSc EEs and healthy donor (HD) EEs were assessed by enzyme- linked immunosorbent assay. Tumor necrosis factor (TNF; 1 ng/ml) or transforming growth factor β (TGFβ; 10 ng/ml) was used as a positive control. Each circle represents the effect of distinct EE CM on human dermal fibroblasts cultured in triplicate. Horizontal bars show the median. Boxes and vertical bars show the mean ± SEM. Median levels of IL- 6, IL- 8, MMP- 1, type I collagen, and fibronectin, respectively, in control cultures were as follows: 0.016 ng/ml (range 0.015– 0.029), 0.8 ng/ml (range 0.2– 1.3), 14 ng/ml (range 14– 14.2),13.8 ng/ml (range 11.3– 16.2), and 240.9 ng/ml (range 201.8– 280.0). § = P ≤ 0.05 versus baseline; ** = P ≤ 0.01, by Mann- Whitney test.

RUSSO ET AL 1316 |
that their low expression has a role in altered SSc epidermis. For instance, among them we found HOXB4, which has been shown to regulate keratinocyte proliferation, being hyperexpressed in fetal and psoriatic skin, both characterized by hyperproliferation (11). Similarly, HOXA5 (see Figure 2C) has been demonstrated to inhibit stratification when transfected in the HaCaT keratinocyte cell line (12), and HOXA7 (see Figure 2C) to negatively regulate keratinocyte differentiation (13). Homeobox gene dysregulation has been previously demonstrated in studies investigating the transcriptomic profile of SSc endothelial progenitors and keloid skin (14). Further investigations are needed in order to elucidate the connection between homeobox family transcription factors, epidermal dysregulation, and skin fibrosis in SSc and to verify their expression at the protein level in SSc and healthy donor EEs.
Analysis of our SSc EE RNA sequencing data by GSEA revealed enhanced expression of molecular pathways that potentially contribute to oxidative stress. This is consistent with the major role attributed to radical oxygen species (ROS) in the pathogenesis of SSc and the detection, by a proteomic approach, of enzymes involved in oxidative responses in SSc skin (2). Fur-ther, ROS may also affect epidermal differentiation. In addition, our RNA sequencing data provide evidence of altered fatty acid metabolism, which is a recently recognized characteristic of SSc linked with immune response and fibrosis (15). We speculate that increased oxidative stress and altered metabolism in SSc epi-dermis could contribute to both fibrosis and inflammation, particu-larly in the underlying dermis.
We have shown that SSc EEs establish a pathologic inter-action with fibroblasts, increasing their production of inflam-mation mediators, in which IL- 1 plays a significant role. This is in accordance with previous reports highlighting the enhanced capacity of SSc keratinocytes to produce IL- 1α (3) and consist-ent with the enhanced production of IL- 8 and IL- 6 by SSc der-mal fibroblasts (8). Of interest, IL- 1 blockade in our system model resulted in reduced levels of type I collagen and MMP- 1, with no differences in findings between SSc EE CM and healthy donor EE CM. This supports previously published data indicating that the epidermis participates in regulating ECM turnover by affecting the production of both type I collagen and MMP- 1. The fine- tuning is, however, different in patients with SSc compared to healthy sub-jects. Indeed, SSc fibroblasts respond to healthy donor keratino-cyte supernatants with significantly enhanced production of type I collagen compared to MMP- 1 (8). In contrast to findings reported by others (3,5), we did not observe any differential effect of SSc EEs on matrix component production by fibroblasts. Substantial differences in the experimental settings, such as the composition of the medium in which keratinocytes were grown, their polarization and time of fibroblast culture, as well as differences in key parame-ters chosen for assessment may explain these discrepancies.
The present study has several strengths and limitations. It benefited from the use of automated software to analyze and quantify the immunostaining of skin biopsy specimens and EEs.
Furthermore, the immunostaining results from SSc skin and healthy donor EEs were consistent with previous reported findings (2,4,9). However, this study included only a small number of SSc patients, and future larger studies are needed to determine whether simi-lar changes occur across the range of SSc disease subsets and whether the site of biopsy impacts on findings. In addition, stud-ies of larger cohorts will enable investigation of whether SSc epi-dermis phenotype may predict disease evolution or response to treatment, thus representing a possible biomarker. An additional limitation is that we studied EE generated in the absence of der-mal components, in particular fibroblasts, which may participate in shaping the EE characteristics. Studies using healthy dermal fibroblasts as well as fibroblasts from patients with early versus late SSc and limited versus diffuse SSc, to generate the dermal equivalent, should provide empirical data on the role of this cell type in shaping keratinocyte proliferation and differentiation.
In conclusion, our results highlight the relevance of epidermal abnormalities in SSc skin and their role in participating as a modifier of the dermal cytokine milieu and ECM turnover (schematic model is shown in Supplementary Figure 5, on the Arthritis & Rheu-matology website at http://onlin elibr ary.wiley.com/doi/10.1002/art.41659/ abstract). Engineering SSc epidermis using primary keratinocytes is feasible and reliable for the study of keratinocyte dysfunction in this disease. Additionally, this technique could be integrated into sophisticated full- thickness skin models to test potential antifibrotic interventions (16,17).
ACKNOWLEDGMENTS
The authors thank Natacha Civic and Mylène Docquier (Genomics Platform, University of Geneva) for assistance in RNA sequencing, Nicolas Laudet (Bioimaging Core Facility, University of Geneva) for programming the algorithm for the automatic quantification of immunohistologic results, and François Prodon and Olivier Brun (Bioimaging Core Facility, University of Geneva) for microscopy imaging.
AUTHOR CONTRIBUTIONS
All authors were involved in drafting the article or revising it critically for important intellectual content, and all authors approved the final version to be published. Dr. Chizzolini had full access to all of the data in the study and takes responsibility for the integrity of the data and the accuracy of the data analysis.Study conception and design. Russo, Chizzolini.Acquisition of data. Russo, Borowczyk, Truchetet, Modarressi.Analysis and interpretation of data. Russo, Borowczyk, Boehncke, Brembilla, Chizzolini.
REFERENCES 1. Russo B, Brembilla NC, Chizzolini C. Interplay between keratino-
cytes and fibroblasts: a systematic review providing a new angle for understanding skin fibrotic disorders. Front Immunol 2020;11:648.
2. Aden N, Shiwen X, Aden D, Black C, Nuttall A, Denton CP, et al. Proteomic analysis of scleroderma lesional skin reveals activated wound healing phenotype of epidermal cell layer. Rheumatology (Oxford) 2008;47:1754– 60.
3. Aden N, Nuttall A, Shiwen X, de Winter P, Leask A, Black CM, et al. Epithelial cells promote fibroblast activation via IL- 1α in systemic sclerosis. J Invest Dermatol 2010;130:2191– 200.

EPIDERMAL DYSFUNCTION IN SSc | 1317
4. Nikitorowicz- Buniak J, Shiwen X, Denton CP, Abraham D, StrattonR. Abnormally differentiating keratinocytes in the epidermis of sys-temic sclerosis patients show enhanced secretion of CCN2 andS100A9. J Invest Dermatol 2014;134:2693– 702.
5. McCoy SS, Reed TJ, Berthier CC, Tsou PS, Liu J, Gudjonsson JE,et al. Scleroderma keratinocytes promote fibroblast activation inde-pendent of transforming growth factor β. Rheumatology (Oxford)2017;56:1970– 81.
6. Assassi S, Swindell WR, Wu M, Tan FD, Khanna D, Furst DE, et al.Dissecting the heterogeneity of skin gene expression patterns in sys-temic sclerosis. Arthritis Rheumatol 2015;67:3016– 26.
7. Van den Hoogen F, Khanna D, Fransen J, Johnson SR, BaronM, Tyndall A, et al. 2013 classification criteria for systemic scle-rosis: an American College of Rheumatology/European LeagueAgainst Rheumatism collaborative initiative. Arthritis Rheum 2013;65:2737– 47.
8. Dufour AM, Borowczyk- Michalowska J, Alvarez M, Truchetet ME,Modarressi A, Brembilla NC, et al. IL- 17A dissociates inflamma-tion from fibrogenesis in systemic sclerosis (scleroderma). J InvestDermatol 2020;140:103– 12.
9. Borowczyk J, Buerger C, Tadjrischi N, Drukala J, Wolnicki M,Wnuk D, et al. IL- 17E (IL- 25) and IL- 17A differentially affect thefunctions of human keratinocytes. J Invest Dermatol 2020;140:1379– 89.
10. Clements PJ, Lachenbruch PA, Ng SC, Simmons M, Sterz M,Furst DE. Skin score: a semiquantitative measure of cutaneous
involvement that improves prediction of prognosis in systemic scle-rosis. Arthritis Rheum 1990;33:1256– 63.
11. Komuves LG, Michael E, Arbeit JM, Ma XK, Kwong A, Stelnicki E,et al. HOXB4 homeodomain protein is expressed in developing epi-dermis and skin disorders and modulates keratinocyte proliferation.Dev Dyn 2002;224:58– 68.
12. Liang Y, Xia L, Du Z, Sheng L, Chen H, Chen G, et al. HOXA5 inhibits keratinocytes growth and epidermal formation in organotypic cul-tures in vitro and in vivo. J Dermatol Sci 2012;66:197– 206.
13. La Celle PT, Polakowska RR. Human homeobox HOXA7 regulateskeratinocyte transglutaminase type 1 and inhibits differentiation.J Biol Chem 2001;276:32844– 53.
14. Avouac J, Cagnard N, Distler JH, Schoindre Y, Ruiz B, Couraud PO,et al. Insights into the pathogenesis of systemic sclerosis based onthe gene expression profile of progenitor- derived endothelial cells.Arthritis Rheum 2011;63:3552– 62.
15. Zhu H, Chen W, Liu D, Luo H. The role of metabolism in the patho-genesis of systemic sclerosis [review]. Metabolism 2019;93:44– 51.
16. Matei AE, Chen CW, Kiesewetter L, Gyorfi AH, Li YN, Trinh- Minh T,et al. Vascularised human skin equivalents as a novel in vitro modelof skin fibrosis and platform for testing of antifibrotic drugs. AnnRheum Dis 2019;78:1686– 92.
17. Huang M, Cai G, Baugh LM, Liu Z, Smith A, Watson M, et al. Systemic sclerosis dermal fibroblasts induce cutaneous fibrosis through lysyloxidase– like 4: new evidence from three- dimensional skin- like tis-sues. Arthritis Rheumatol 2020;72:791– 801.

1318
Arthritis & RheumatologyVol. 73, No. 7, July 2021, pp 1318–1328DOI 10.1002/art.41620© 2020, American College of Rheumatology
Greater Somatosensory Afference With Acupuncture Increases Primary Somatosensory Connectivity and Alleviates Fibromyalgia Pain via Insular γ-Aminobutyric Acid: A Randomized Neuroimaging TrialIshtiaq Mawla,1 Eric Ichesco,1 Helge J. Zöllner,2 Richard A. E. Edden,2 Thomas Chenevert,1 Henry Buchtel,1 Meagan D. Bretz,1 Heather Sloan,1 Chelsea M. Kaplan,1 Steven E. Harte,1 George A. Mashour,1 Daniel J. Clauw,1 Vitaly Napadow,3 and Richard E. Harris1
Objective. Acupuncture is a complex multicomponent treatment that has shown promise in the treatment of fibromyalgia (FM). However, clinical trials have shown mixed results, possibly due to heterogeneous methodology and lack of understanding of the underlying mechanism of action. The present study was undertaken to understand the specific contribution of somatosensory afference to improvements in clinical pain, and the specific brain circuits involved.
Methods. Seventy- six patients with FM were randomized to receive either electroacupuncture (EA), with somatosensory afference, or mock laser acupuncture (ML), with no somatosensory afference, twice a week over 8 treatments. Patients with FM in each treatment group were assessed for pain severity levels, measured using Brief Pain Inventory (BPI) scores, and for levels of functional brain network connectivity, assessed using resting state functional magnetic resonance imaging (MRI) and proton magnetic resonance spectroscopy in the right anterior insula, before and after treatment.
Results. Fibromyalgia patients who received EA therapy experienced a greater reduction in pain severity, as measured by the BPI, compared to patients who received ML therapy (mean difference in BPI from pre- to posttreatment was −1.14 in the EA group versus −0.46 in the ML group; P for group × time interaction = 0.036). Participants receiving EA treatment, as compared to ML treatment, also exhibited resting functional connectivity between the primary somatosensory cortical representation of the leg (S1leg; i.e. primary somatosensory subregion activated by EA) and the anterior insula. Increased S1leg– anterior insula connectivity was associated with both reduced levels of pain severity as measured by the BPI (r = −0.44, P = 0.01) and increased levels of γ- aminobutyric acid (GABA+) in the anterior insula (r = 0.48, P = 0.046) following EA therapy. Moreover, increased levels of GABA+ in the anterior insula were associated with reduced levels of pain severity as measured by the BPI (r = −0.59, P = 0.01). Finally, post– EA treatment changes in levels of GABA+ in the anterior insula mediated the relationship between changes in S1leg– anterior insula connectivity and pain severity on the BPI (bootstrap confidence interval −0.533, −0.037).
Conclusion. The somatosensory component of acupuncture modulates primary somatosensory functional connectivity associated with insular neurochemistry to reduce pain severity in FM.
Supported by the National Institute of Diabetes and Digestive and Kidney Diseases, NIH (grant F99- DK- 126121 awarded to Mr. Mawla) and the National Center for Complementary and Integrative Health, NIH (grant R01- AT- 007550 awarded to Drs. Napadow and Harris). The present study applied tools developed by the NIH (grants R01- EB- 016089 and P41- EB- 015909).
1Ishtiaq Mawla, MS, Eric Ichesco, BS, Thomas Chenevert, PhD, Henry Buchtel, RAc, Meagan D. Bretz, RAc, Heather Sloan, RAc, Chelsea M. Kaplan, PhD, Steven E. Harte, PhD, George A. Mashour, MD, PhD, Daniel J. Clauw, MD, Richard E. Harris, PhD: University of Michigan, Ann Arbor; 2Helge J. Zöllner, PhD, Richard A. E. Edden, PhD: Johns Hopkins University School of Medicine
and Kennedy Krieger Institute, Baltimore, Maryland; 3Vitaly Napadow, PhD: Massachusetts General Hospital, Harvard Medical School, and Brigham and Women’s Hospital, Boston, Massachusetts.
Drs. Napadow and Harris contributed equally to this work.No potential conflicts of interest relevant to this article were reported.Address correspondence to Richard E. Harris, PhD, 24 Frank Lloyd Wright
Drive, Lobby M, Suite 3100, Ann Arbor, MI 48106- 5737. Email: [email protected].
Submitted for publication August 7, 2020; accepted in revised form December 8, 2020.

BRAIN MECHANISMS OF ACUPUNCTURE ANALGESIA | 1319
INTRODUCTION
Fibromyalgia (FM) is a common chronic pain condition affect-ing 2– 8% of the population and is characterized by widespread somatic pain, fatigue, poor sleep, negative mood, and cognitive disturbances (1). While peripheral factors, such as small fiber neu-ropathy (2) and the immune system (3), may play some role in FM, the disorder is thought to be associated primarily with aberrant physiologic processes in the central nervous system (CNS) which amplifies the perception of pain (also known as “centralized” or “nociplastic” pain [4]). Notably, neuroimaging research has shown that FM patients exhibit increased levels of the excitatory neuro-transmitter glutamate (5), decreased levels of the inhibitory neu-rotransmitter γ- aminobutyric acid (GABA) (6), and up- regulated GABA type A (GABA)A receptor concentration (7) within the insula. Moreover, increased functional brain network connectivity to pronociceptive areas of the brain and decreased connectivity to antinociceptive areas of the brain have been found in FM (8– 10). These results suggest that the CNS is a prime target for therapeu-tic interventions for FM.
Due to the ongoing opioid public health crisis (11), nonphar-macologic interventions for FM, such as acupuncture, have been gaining attention. However, meta- analyses of acupuncture trials have shown mixed results, with some showing that verum (active) acupuncture is no more effective than sham controls (12,13), whereas other studies have shown that acupuncture is superior to both sham and no- acupuncture controls in reducing pain (14). One reason for the mixed meta- analysis results may be the inclu-sion of heterogenous treatment paradigms and sham controls across different trials. Acupuncture is a complex procedure that consists of multiple methodologic components (e.g., needling sensation, location, depth, among others) and contextual com-ponents (e.g., expectancy, patient– practitioner rapport, treatment ritual) (15). Importantly, sham controls used in previous acupunc-ture trials may not have properly accounted for all of these different components of acupuncture.
In the present study, we specifically evaluated CNS mech-anisms of action underlying the somatosensory afferent compo-nent of acupuncture, and how such mechanisms may prompt an analgesic response in FM. Since verum acupuncture produces somatosensory sensation through needling and palpation, we designed a comparator sham control procedure to lack all aspects of tactile sensation. Many previous trials on acupuncture therapy used sham controls with acupoint palpation and tactile stimula-tion, mimicking real needle insertion and manipulation, thus con-founding verum and sham acupuncture in terms of somatosensory afference (12– 14). We randomized FM patients into 2 separate acupuncture therapy groups: electroacupuncture (EA), which has somatosensation, and mock laser acupuncture (ML), which has no somatosensation. EA therapy has been demonstrated to be clinically effective at reducing pain in FM (13). We hypothesized
that EA therapy would specifically recruit somatosensory path-ways in the CNS in order to produce greater analgesia compared to ML therapy.
PATIENTS AND METHODS
Study protocol. The present study was designed as a sin-gle center, blinded, sham- controlled, randomized non- crossover longitudinal neuroimaging trial, was preregistered with the NIH (ClinicalTrials.gov identifier: NCT02064296), and was carried out at the University of Michigan (Ann Arbor) from December 2014 to November 2019. Study protocols were approved by the Univer-sity of Michigan Institutional Review Board (IRB) and conducted in accordance with the Declaration of Helsinki. All study participants provided written informed consent.
Study participants and timeline. Individuals with FM were recruited for the study. Full details of inclusion and exclusion criteria are provided in the Supplementary Methods, available on the Arthritis & Rheumatology website at http://onlin elibr ary.wiley.com/doi/10.1002/art.41620/ abstract. Following screening, par-ticipants were invited to complete a baseline behavioral assess-ment (day 0) and baseline magnetic resonance imaging (MRI) assessment (occurring sometime between day 1 and day 3), and eligible subjects were randomly assigned to 1 of 2 parallel study arms (Figure 1A) via computer- generated permuted block rand-omization (blocks of 4, 6, or 8). An acupuncturist was informed of the group allocation of each participant through a sealed enve-lope, which was not accessible by the principal investigators, study staff, or data analysts. The 2 intervention arms were 1) EA therapy, with somatosensory afference, and 2) ML therapy, with-out somatosensory afference. After treatment, a second behavio-ral assessment (performed sometime between days 33 and 40 of the study) and a second MRI assessment (performed sometime between days 34 and 43) were collected. Patient- reported out-comes were collected before and after therapy during the behav-ioral session. Whole- brain resting state functional MRI (fMRI) and right anterior insula proton magnetic resonance spectroscopy (1H- MRS) scans were collected during MRI sessions before and after therapy.
Acupuncture treatment. Study participants with FM received 8 treatments with EA or ML twice a week over 4 weeks. During all treatment sessions, participants were positioned supine on an examination table and blindfolded. Blindfolding ensured masking of the treatments in order to avoid any visual afference, as visual afference can also influence acupuncture- induced analgesia (16). All treatments were performed by 3 trained acupuncturists (HB, MDB, and HS) who had board certification from the National Certification Commission for Acupuncture and Oriental Medicine.

MAWLA ET AL 1320 |
The EA group received low- frequency EA at 3 pairs of acu-points: right LI- 11 to LI- 4 (large intestine 11 to large intestine 4), left GB- 34 (gall bladder 34) to SP- 6 (spleen 6), and bilat-eral ST- 36 (stomach 36). Needles were also inserted in Du- 20 (Governor meridian), right ear Shen Men, and left LV- 3 (liver 3) (Figure 1B), but no electrical current was delivered to these sites. EA needles were stimulated with low intensity and frequency using a constant- current electroacupuncture device (AS Super 4 Digi-tal Needle Stimulator), which allowed for flexible setting of pulse width (1 msec), frequency (2 Hz), and shape (biphasic rectangular) parameters. The current intensity was set at each session for each patient individually at the midpoint between sensory and pain thresholds that are based on typical cutoff values used in clinical practice and our previous EA study on patients with chronic pain (17), with stimulation lasting 25 minutes per session. The duration and frequency of treatment are based on common clinical prac-tice and are within the bounds of previous acupuncture trials (18). The selection of acupuncture sites was based on predominant FM symptoms including multisite pain, headache, gastrointestinal pain and dysfunction, disrupted sleep, and chronic fatigue.
For the ML acupuncture therapy group, a laser acupunc-ture device (VitaLaser 650; Lhasa OMS) was manually positioned approximately 1– 2 cm over all of the same acupoints used in the EA treatment group. There was no palpation prior to positioning the device, and there was no physical contact between the device and skin. The laser light was demonstrated to the participants at the first visit to enhance credibility of the intervention; however, the laser was turned off during the actual treatment, thus removing any potential optically induced or thermal sensation, while maintaining
all treatment rituals, as previously described (19,20) (Figure 1B). ML treatments also lasted 25 minutes.
Participants were not informed about a sham or placebo at consent, so all participants were led to believe that both EA and ML are viable treatments for FM. These blinded procedures were preauthorized by the IRB at the start of the study, and all partici-pants were fully debriefed after the final MRI visit.
The verbal instructions used by acupuncturists were stand-ardized across all treatments (Supplementary Methods). After each treatment, the Massachusetts General Hospital Acupuncture Sensation Scale (MASS) (21) was used to evaluate “De Qi” and perceived somatosensory afference. The 13- item questionnaire included sensations such as soreness, aching, deep pressure, and tingling, among others, on a 0– 10 scale, with 0 indicating “none” and 10 indicating “unbearable,” and weighted summation of these sensations constituted the MASS Index. This assessment served as a fidelity check to assess whether FM patients consistently reported increased levels of sensation in response to EA therapy compared to ML therapy. In addition, after the first treatment and the last treatment, a Credibility Questionnaire (Supplementary Meth-ods) was administered which assessed the perception of the validity and credibility of the treatments. This ensured that any differences in clinical or neuroimaging outcomes were not due to differences in the perception of credibility among the study participants.
Clinical outcome measures. Short- Form Brief Pain Inventory (BPI) severity subscale. The severity subscale of the Short- Form BPI was the primary clinical outcome measure. The BPI severity subscale assesses worst pain in 24 hours,
Figure 1. Study overview of non- crossover randomized controlled neuroimaging trial of fibromyalgia (FM) patients with acupuncture intervention. A, Behavioral session, resting state functional magnetic resonance imaging (rs- fMRI), and proton magnetic resonance spectroscopy (1H- MRS) images were collected at baseline (Pre- tx) and posttherapy (Post- tx). B, Acupuncture locations for EA and ML treatment. All subjects were blindfolded and placed in a supine position. In the EA group, stimulation was administered to the large intestine 4 (LI- 4) acupoint of the dorsal surface of the right (R) hand and to the LI- 11 acupoint of the crease of the right elbow. Bolt symbols indicate where needles received current through the EA device. For ML treatment, a deactivated laser was hovered over the same acupuncture points as in the EA group for the same duration of time. Du- 20 = Governor meridian; ST- 36 = stomach 36; SP- 6 = spleen 6; GB- 34 = gall bladder 34; LV- 3 = liver 3.

BRAIN MECHANISMS OF ACUPUNCTURE ANALGESIA | 1321
least pain in 24 hours, pain on average, and pain right now. Pain severity as measured by the BPI was assessed before and after therapy. As a secondary clinical outcome measure, the severity of anxiety and depression was scored using the Patient- Reported Outcomes Measurement Information System (PROMIS) (https://www.healt hmeas ures.net/explo re- measu re men t- syste ms/promis). The anxiety and depression scores were also used to assess whether neuroimaging outcomes were influ-enced by these factors. Furthermore, we collected a series of exploratory outcome measures, which included pain interfer-ence as measured by the BPI, the American College of Rheu-matology 2010 modified criteria for FM (22), pain catastrophizing scores measured using the Pain Catastrophizing Scale (23), and PROMIS scores of physical function, fatigue, and sleep. Descriptive statistics for each exploratory outcome measure are available in the Supplementary Results, available on the Arthri-tis & Rheumatology website at http://onlin elibr ary.wiley.com/doi/10.1002/art.41620/ abstract.
Resting state functional connectivity scans of the primary somatosensory cortex (mechanistic outcome measure). Rest-ing state fMRI scans (performed in study participants while in an eyes- open resting state) and anatomic T1- weighted MRI scans were acquired with a 15- channel head coil in a 3.0T MRI system (Philips Ingenia). Minimal preprocessing of resting state fMRI and T1 images were performed using fMRIPrep version 1.1.8 (24). Full details of the MRI acquisition parameters and preprocessing steps are provided in the Supplementary Methods.
Since somatosensory afferent input is encoded in the primary somatosensory cortex (S1), we chose the S1 cortical representa-tion of the legs as the seed region to examine somatosensory cir-cuits (i.e., communication between S1leg and other brain regions). S1leg was the chosen seed as most EA needles were placed on the leg (Figure 1B), and our group has previously localized this S1leg region in FM patients (centroid Montreal Neurological Insti-tute [MNI] x,y,z coordinates of ±8,−38, 68) (25). Bilateral spherical seeds (4- mm radius) were used to extract fMRI time series, and seed- to- voxel correlation analysis was used to evaluate whole- brain connectivity maps for S1leg. Time series from the S1leg seed (fslmeants) were used as a generalized linear model regressor (fsl_glm) to obtain whole- brain parameter estimates and associated variances for each participant. These parameter estimates and variances were then passed on to group level analysis, conducted on an FMRIB (Oxford Centre for Functional Magnetic Resonance Imaging of the Brain) Local Analysis of Mixed Effects (FLAME 1+2) algorithm (26) to improve mixed- effects variance estimation. S1leg connectivity was then contrasted between pretreatment and post-treatment periods using paired sample t- tests for EA and ML ther-apies separately. Interactive effects between EA and ML therapy were evaluated using an independent samples t- test of the paired posttreatment– pretreatment difference images. As age influences neuroimaging outcomes, it was included as a regressor of no inter-est in all analyses. Multiple comparisons familywise error correction
was conducted using a Gaussian random- field cluster threshold of Z > 2.3, and corrected P values less than or equal to 0.05 were considered significant.
1H- MRS measurement of Glx and GABA+ in the right ante-rior insula (mechanistic outcome measure). 1H- MRS spectra were acquired from automated voxel placement covering the right anterior insula, as our previous study showed differences between FM and pain- free controls in this region (6). The 1H- MRS voxel dimensions were based on our previous study (6). Single- voxel point- resolved spectroscopy (PRESS) was used to meas-ure Glx. A separate GABA+– edited Mescher- Garwood– PRESS (MEGA- PRESS), which co- edits signals from macromolecules and homocarnosine, was conducted to estimate GABA+ levels (27). Conventional PRESS spectroscopy data were analyzed with LCModel (28). MEGA- PRESS spectra were processed in Gannet version 3.1.5 (29), a MatLab- based toolbox specifically developed for edited MRS. Full details of PRESS and MEGA- PRESS acquisi-tion parameters, preprocessing, and analysis details are provided in the Supplementary Methods. The final GABA+ estimates are expressed in institutional units (IU), which approximates millimolar concentrations of GABA+, and are also expressed as an integral ratio with respect to the creatine signal (GABA+/Cr). Treatment- related change in Glx and GABA+ was computed as the difference between pretherapy and posttherapy values.
Statistical analysis. Besides the aforementioned image- based statistics, statistical analyses were performed in SPSS software version 26 (IBM). For comparison of changes in the pri-mary clinical outcome measure (pain severity measured by the BPI) and secondary outcome measures (data in the Supplemen-tary Results), an analysis of variance (ANOVA) with 2 × 2 mixed design (assessing groups [EA or ML] by time [pretreatment or posttreatment] interaction) was conducted. An ANOVA with a 2 × 8 mixed design (assessing group [EA or ML] by time [pretreatment or posttreatment] interaction) was used for comparisons of the MASS Index. Geisser- Greenhouse correction was used to adjust for sphericity assumptions in the repeated- measures ANOVA. Mean credibility scores were assessed for group differences using an independent samples t- test. Associations between changes in extracted values for S1leg connectivity, GABA levels, and pain severity as measured by the BPI were conducted using Pearson’s correlation adjusted for age.
To determine whether relationships assessed with Pear-son’s correlation coefficient were directionally different for the EA group compared to the ML group, the single- tailed Fisher’s z cocor algorithm was used (30). For mediation analyses, bias- corrected bootstrapped (×10,000) mediation was conducted using the Process Macro with SPSS software (31), and esti-mates of indirect effects were computed at the 95% confidence level (adjusted for age).
All charts were created on GraphPad PRISM version 8.2.1 software. Scientific images were created using BioRender.com.

MAWLA ET AL 1322 |
RESULTS
Clinical characteristics and demographics. The flow of study participants in the protocol is described in the Supplementary Results. Full demographic and clinical characteristics and medica-tion usage for each participant are also listed in the Supplementary Results.
Greater posttherapy reduction in pain severity in the EA treatment group compared to the ML treatment group. For pain severity, as measured by the BPI, results from two- way group × time mixed- design ANOVA demonstrated a significant main effect of time (degrees of freedom [F] [1, 70] = 25.09, P < 0.001) and no main effect of group (F [1, 70] = 0.03, P = 0.861). However, there was a significant group × time interaction (F [1, 70] = 4.56, P = 0.036), showing that EA treatment reduced pain severity, as measured by the BPI, to a greater extent compared to ML treat-ment (Figure 2A). There was no baseline difference in pain severity between the EA and ML treatment groups (t [70] = 0.85, P = 0.396). Changes in pain severity were not related to changes in depression (r [33] = 0.24, P = 0.165 for the EA group and r [35] = −0.08, P = 0.65 for the ML group) or anxiety (r [33] = 0.07, P = 0.71 for the EA group; r [35] = 0.17, P = 0.31 for the ML group).
Greater somatosensory afference with EA therapy compared to ML therapy. For MASS Index scores, the 2 × 8 (group × time) mixed- design ANOVA demonstrated a significant main effect of time (F [4.0, 224.9] = 2.85, P = 0.025), a significant main effect of group (F [1, 56] = 31.01, P < 0.001), but no group × time interaction effect (F [4.0, 224.9] = 0.35, P = 0.84) (Figure 2B). Treatment credibility was equal across both groups (Supplementary Results).
Increased S1leg connectivity posttherapy in the EA treatment group versus the ML treatment group. A whole- brain seed connectivity analysis of S1leg region showed significant posttherapy increases in connectivity for the EA group, notably to the bilateral anterior insula, posterior insular, and right non- leg S1 subregions. Conversely, the ML group showed reductions in S1leg connectivity to the left anterior/mid insula. The whole- brain group × time interaction effect showed that the magnitude of increase in S1leg connectivity for EA treatment was greater than that of ML treatment, notably showing increased connectivity in regions such as the bilateral anterior insula, posterior insula, and right non- leg S1. Relevant contrast images are shown in Figure 3A, and full details of the clusters are available in the Supplementary Results. We also confirmed that resting state fMRI results were not con-founded by head motion (Supplementary Results).
Association between increased S1leg connectivity and improvements in pain severity scores in the EA treatment group. In the EA treatment group, there was a significant relationship between change in S1leg– anterior insula
connectivity and change in pain severity as measured by the BPI (r [30] = −0.44, P = 0.01), such that the greater the increase in S1leg– anterior insula connectivity, the greater the reduction in pain severity, as measured by the BPI, posttherapy (Figure 3B). Change in S1leg– anterior insula connectivity was not related to change in BPI severity in the ML group (r [35] = −0.02, P = 0.91). The correlation between change in S1leg– anterior insula connec-tivity and change in pain severity scores was significantly stronger in the EA treatment group than in the ML treatment group (Fish-er’s z = −1.78, P = 0.04). Changes in S1leg– anterior insula con-nectivity were not related to posttherapy changes in depression (r [30] = 0.02, P = 0.93 in the EA group; r [35] = −0.14, P = 0.41 in the ML group) or anxiety (r [30] = −0.12, P = 0.51 in the EA group; r [35] = 0.11, P = 0.50 in the ML group).
Similarly, we found that in the EA treatment group, there was a significant relationship between change in S1leg– posterior insula connectivity and change in pain severity measured by the
Figure 2. Pain severity on the Brief Pain Inventory (BPI) and Massachusetts General Hospital Acupuncture Sensation Scale (MASS) Index response to acupuncture therapy. A, Compared to those who received mock laser acupuncture (ML), fibromyalgia patients who received electroacupuncture (EA) experienced a sig-nificantly greater posttherapy (Post- tx) reduction in pain severity as measured by the BPI (P for group × time interaction = 0.036). B, Patients receiving EA therapy reported significantly higher somatosensory afference (MASS Index) compared to those receiv-ing ML therapy (P < 0.001 for main effect of group). Bars show the mean ± SEM.

BRAIN MECHANISMS OF ACUPUNCTURE ANALGESIA | 1323
BPI (r [30] = −0.43, P = 0.01), such that the greater the increase in S1leg– posterior insula connectivity, the greater the reduction in pain severity posttherapy (Figure 3B). Change in S1leg– posterior insula connectivity was not related to change in pain severity in the ML treatment group (r [30] = −0.04, P = 0.84). The correla-tion between S1leg– posterior insula connectivity and pain severity in the EA treatment group was significantly stronger than that in ML treatment group (Fisher’s z = −1.70, P = 0.04). Changes in S1leg– posterior insula connectivity were not related to posttherapy
changes in depression (r [30] = −0.19, P = 0.29 in the EA group; r [35] = 0.18, P = 0.29 in the ML group) or anxiety (r [30] = −0.24, P = 0.18 in the EA group; r [35] = 0.13, P = 0.45 in the ML group).
Association between changes in anterior insula GABA+ levels and changes in S1leg– anterior insula con-nectivity in EA treatment. The average MEGA- PRESS spec-trum across all subjects is shown in Figure 4A. We found that the right anterior insula cluster from the posttreatment– pretreatment
Figure 3. S1leg connectivity (conn.) response to acupuncture stimulation, comparing pretherapy (Pre- tx) and posttherapy (Post- tx) levels of connectivity. A, In the electroacupuncture (EA) treatment group, S1leg connectivity to the right anterior insula (R aINS), right posterior insula (R pINS), and non- leg S1 subregion increased with stimulation. In the mock laser acupuncture (ML) treatment group, S1leg connectivity to the anterior insula/mid insula (a/mINS) decreased with stimulation. The EA > ML contrast showed that the magnitude of S1leg connectivity increase was higher in the EA group compared to the ML group. Bars show the mean ± SEM. B, Within the EA treatment group, as S1leg– anterior insula and S1leg– posterior insula connectivity increased, pain severity as measured by the Brief Pain Inventory (BPI) decreased posttherapy. Values have been adjusted for age.
Figure 4. Anterior insula (aINS) γ-aminobutyric acid (GABA) response to electroacupuncture (EA) therapy. A, Average spectrum across all subjects of the proton magnetic resonance spectroscopy (1H- MRS) voxel of the right (R) anterior insula transformed to Montreal Neurological Institute space and the corresponding spectrum frequency in parts per million (ppm) assessed using Mescher- Garwood- single- voxel point- resolved spectroscopy. B, Intersection of voxels encompassing both the anterior insula GABA voxel and the anterior insula cluster from the S1leg connectivity (conn.) map. C, Greater increase in S1leg– anterior insula connectivity was associated with greater increase in anterior insula GABA+ concentration (measured in institutional units [IU]) posttherapy (Post) relative to pretherapy (Pre). D, Greater increase in anterior insula GABA+ was associated with greater reduction in clinical pain, measured using the Brief Pain Inventory (BPI), posttherapy in patients with fibromyalgia. Values have been adjusted for age.

MAWLA ET AL 1324 |
S1leg connectivity group map of the EA therapy group overlapped with the MNI- transformed anterior insula 1H- MRS voxel place-ment (Figure 4B). There was no main effect of EA or ML treat-ment on levels of GABA+ (Supplementary Results). However, we found that greater increases in S1leg– anterior insula connectivity were associated with greater increases in GABA+ levels (in IU) in the anterior insula posttherapy (for GABA+ levels, r [16] = 0.48, P = 0.046 [shown in Figure 4C]; for GABA+/Cr, r [16] = 0.46, P for trend = 0.052). This relationship between S1leg– anterior insula connectivity and anterior insula GABA+ levels was not observed in the ML treatment group (for GABA+ levels [in IU], r [23] = −0.17, P = 0.43; for GABA+/Cr, r [23] = −0.15, P = 0.47), and the correla-tion between S1leg– anterior insula connectivity and anterior insula GABA+ levels was significantly stronger in the EA group than in the ML group (for GABA+ levels [in IU], Fisher’s z = 2.08, P = 0.02; for GABA+/Cr, Fisher’s z = 1.94, P = 0.03). Furthermore, we con-firmed that this relationship was specific to inhibitory, and not excitatory, neurotransmitter changes (Supplementary Results).
Association between changes in anterior insula GABA+ levels and improvements in pain severity as meas-ured by the BPI in the EA treatment group. We found that greater increases in anterior insula GABA+ levels were associated with a greater reduction in BPI pain severity scores (for GABA+ levels [in IU], r [16] = −0.59, P = 0.01 [Figure 4D]; for GABA+/Cr, r [16] = −0.65, P = 0.004). This relationship was not observed in the ML treatment group (for GABA+ levels [in IU], r [16] = −0.16, P = 0.44; for GABA+/Cr, r [23] = −0.13, P = 0.53), and the cor-relation between increased GABA+ levels in the anterior insula
and reduced pain severity was stronger in the EA group than in the ML group (for GABA+ levels [in IU], Fisher’s z = −1.54, P for trend = 0.06; for GABA+/Cr, Fisher’s z = −1.92, P = 0.03). Changes in anterior insula GABA+ levels in the EA and ML treatment groups were not related to posttherapy changes in depression (for GABA+ levels [IU], r [16] = 0.12, P = 0.63 in the EA treatment group and r [23] = 0.07, P = 0.74 in the ML treatment group; for GABA+/Cr, r [16] = 0.23, P = 0.36 in the EA treatment group and r [23] = 0.03, P = 0.89 in the ML treatment group) or anxiety (for GABA+ levels [in IU], r [16] = −0.21, P = 0.40 in the EA treatment group and r [23] = 0.10, P = 0.65 in the ML treatment group; for GABA+/Cr, r [16] = −0.06, P = 0.82 in the EA treatment group and r [23] = 0.08, P = 0.72 in the ML treatment group). Furthermore, we confirmed that this relationship was specific to inhibitory, and not excitatory, neurotransmitter changes (Supplementary Results).
Mediation of the effect of S1leg– anterior insula con-nectivity on pain severity by anterior insula GABA+ in the EA treatment group. Finally, we conducted a mediation analysis to link S1leg– anterior insula connectivity (X), pain sever-ity as measured by the BPI (Y), and anterior insula GABA+ lev-els (in IU) (mediator) in one statistical model. Results showed that a greater increase in S1leg– anterior insula connectivity was associated with greater reduction in pain severity posttherapy indirectly through a greater increase in anterior insula GABA+ lev-els (in IU) (β = −0.187, bootstrapped SE = 0.130, bootstrapped lower limit of the confidence interval = −0.533, bootstrapped upper limit of the confidence interval = −0.037) (Figure 5A). The direct effect of an increase in S1leg– anterior insula connectivity
Figure 5. Mediation analysis and proposed mechanistic model. A, Increases in levels of γ-aminobutyric acid (GABA)+ (measured in institutional units [IU]) in the right anterior insula (R aINS) mediating the relationship between increased S1leg– anterior insula connectivity (conn.) and decreased pain severity, measured using the Brief Pain Inventory (BPI), posttherapy. B, Longitudinally informed mechanistic model proposing that somatosensory afference increases communication between the S1leg subregion and the anterior insula, producing an effect of increased GABAergic inhibition in the anterior insula, leading to reduced clinical pain in patients with fibromyalgia. BootSE = bootstrap SE; BootCI = bootstrap confidence interval.

BRAIN MECHANISMS OF ACUPUNCTURE ANALGESIA | 1325
on the reduction in pain severity posttherapy was not signifi-cant (effect = −0.184, SE = 0.186, lower limit of the confidence interval = −0.581, upper limit of the confidence interval = 0.212), suggesting that the effect of S1leg– anterior insula connectivity on pain severity is transmitted through anterior insula GABA+ levels (in IU). The R2 value for BPI pain severity in this model was 0.39. This effect was also present when GABA+/Cr estimates were used as the mediator (Supplementary Results, available on the Arthritis & Rheumatology website at http://onlin elibr ary.wiley.com/doi/10.1002/art.41620/ abstract).
DISCUSSION
Our randomized neuroimaging trial evaluated the role of somatosensory afference in acupuncture in the reduction of clini-cal pain in FM. We found that EA treatment (designed to generate sustained somatosensory afferent activity) was more effective than ML acupuncture (designed to generate no somatosensory affer-ence) in reducing clinical pain. As the EA intervention was heavily directed toward the patient’s legs, we examined brain connectivity with the primary somatosensory cortical representation of the leg (S1leg). We found that following EA therapy, increased communi-cation of this S1leg region with the anterior and posterior insula in FM patients was demonstrated, as well as non- leg S1 subregions. Greater posttherapy increases in S1leg– anterior insula and S1leg– posterior insula connectivity were associated with greater reduc-tion in clinical pain. Moreover, we measured the concentration of the inhibitory neurotransmitter GABA in the insula and found that a greater posttherapy increase in S1leg– anterior insula connectivity was associated with a greater increase in anterior insula GABA+, suggesting that S1leg signaling may increase GABAergic inhibition in the anterior insula. Furthermore, we found that greater increases in anterior insula GABA+ were associated with a greater reduction in clinical pain. Finally, increased anterior insula GABA+ medi-ated the effect of increased S1leg– anterior insula connectivity on reduced clinical pain in EA treatment. Cumulatively, these results allow us to establish a mechanistic model for the role of somatic sensation in acupuncture therapy: somatosensory afference leads to increased S1leg– anterior insula signaling, resulting in increased GABAergic inhibition in the anterior insula, ultimately reducing clin-ical pain (Figure 5B).
Our research extends previous work demonstrating somato-topically specific involvement of the S1 subregion in acupuncture. Early research in this field of study showed that EA applied to the ST- 36 acupoint produced stimulus- evoked blood oxygenation level– dependent (BOLD) activation in the contralateral S1leg region (32). Later work examined somatotopic specificity of S1 morphology and functional involvement in clinical populations, linking S1 met-rics with therapeutic outcomes. Specifically, in carpal tunnel syn-drome, longitudinal EA therapy targeting the median nerve at the wrist increased the S1 separation distance between median nerve innervated digits 2 and 3, and this increase in S1 digit separation
predicted long- term clinical improvements (17). Another recent study that investigated the use of manual acupuncture in treating chronic low back pain showed increases in gray matter volume and white matter integrity in the back- specific S1 subregion (20). However, these studies were limited to local changes within the S1 region and did not explore cross- network signaling.
There is some evidence of increased cross- network com-munication in response to acute EA stimulation. In healthy indi-viduals, acute EA stimulation produced increased connectivity of the “Default Mode” and sensorimotor network to the anterior cingulate (a key node of the salience network) (33). In the present study, we found evidence for increased connectivity between the S1leg subregion and right anterior insula, and the degree of this connectivity increase was linked to improvements in clinical pain. This result may seem counterintuitive as chronic nociplastic pain is often characterized by heightened resting functional connectivity of S1 and the anterior insula relative to pain- free controls (34,35). However, those studies assessed pathologic- specific S1 subre-gions (e.g., S1back for lower back pain). In our study, we evaluated connectivity of S1 subregions specifically targeted by EA therapy (i.e., S1leg). Furthermore, recent work has causally shown that GABAergic inhibition is recruited in the anterior insula to reduce nocifensive behavior (36). Therefore, our results suggest that S1leg may be signaling the anterior insula to reduce clinical pain via GABAergic inhibition. Alternately, acupuncture may temporarily up- regulate pronociceptive signaling between the S1leg subregion and the anterior insula, which may trigger endogenous descend-ing inhibitory systems to counteract through GABAergic inhibition of the anterior insula (i.e., healing processes initiated by tempo-rary injury) (37). These frameworks need further validation through reverse translational studies.
In patients with FM, reduced levels of GABA in the anterior insula (6), and a compensatory up- regulation of GABA type A receptors, have been reported (7). Pharmacologic interventions that enhance GABAergic neurotransmission have been found efficacious for FM, as observed in a phase III randomized trial of sodium oxybate (a GABA agonist) that showed improvements in FM symptoms (38). Based on these observations, reverse trans-lational research has shown a causal link between anterior insula GABA levels and nocifensive behaviors in rats, with decreasing endogenous levels of GABA in the agranular insula (rat homolog of the anterior insula) and increased thermal and mechanical sensitivity (39). Our study extends this literature by showing that increases in anterior insula GABA+ were associated with improve-ments in clinical pain following EA treatment, suggesting that somatosensory afference may modulate GABAergic inhibition to produce analgesia. The anterior insula is a hyperreactive locus in FM patients (40), and patients who have a posttherapy increase in anterior insula GABA+ levels may experience a reduction in hyperreactivity or hyperactivity in the anterior insula, resulting in analgesia. Interestingly, although GABA is a molecular product of glutamate, our study did not show any association between

MAWLA ET AL 1326 |
clinical outcomes and Glx, suggesting that specific GABAergic pathways may be involved in somatosensation- enhanced acu-puncture analgesia.
Another notable link established in our study was that increased long- range cortico– cortico communication postther-apy may lead to increased GABAergic inhibition. Although GABAe-rgic neurons contribute significantly to local energy consumption (41), the relationship between BOLD activity and GABA derived from 1H- MRS is complex. Some studies in healthy individuals have shown that greater levels of GABA are related to greater task- based negative BOLD responses (42,43) whereas other research across multiple cortical regions has shown no such relationships (44). With regard to BOLD functional connectivity, both positive and negative correlations with GABA have been noted, with greater within- primary motor (M1) connectivity having been shown to be negatively correlated with M1 GABA (45), and whereas dorsal anterior cingulate GABA was not related to salience net-work GABA (46). One recent study in healthy individuals meas-ured GABA in two nodes of traditionally anti- correlated networks, the medial prefrontal cortex (mPFC) and the dorsolateral prefrontal cortex (dlPFC), and showed that mPFC– dlPFC functional connec-tivity at rest was positively correlated with dlPFC GABA levels and negatively correlated with mPFC GABA levels (47), suggesting that intrinsic functional connectivity architecture may be associ-ated with varying GABAergic tone across the cortex.
Few studies have noted treatment- related changes in GABA and functional connectivity. It was found in one study that admin-istration of Gamma- hydroxybutyrate (a GABA agonist) increased right anterior insula functional connectivity (48). Due to the com-plex relationship between GABA and BOLD functional connec-tivity demonstrated across previous studies, our results need further validation. Nevertheless, our longitudinally informed model (Figure 5B) proposes that increased S1leg– anterior insula connec-tivity influenced GABA+ in the anterior insula to reduce clinical pain. The downstream effects of this S1leg– anterior insula path-way need further investigation. One possibility is that S1 taps into anterior insula regulation of sympathetic outflow, as the anterior insula is part of the central autonomic network (49). In fact, our previous study has shown that during experimental pressure pain in FM patients, S1leg– anterior insula connectivity was associated with reduced cardiovagal modulation (25). Additionally, GABA is not the only neurotransmitter regulating anterior insula function. In a subsample of FM participants from this study, we found that elevated levels of choline (often involved in neuroinflammation) in FM was related to pain interference via anterior insula– putamen functional connectivity (50). Future studies should more explicitly examine the role of the autonomic nervous system and/or other neurotransmitters involved in somatosensation- induced acupunc-ture analgesia.
While our study demonstrates mechanistic links of acupunc-ture treatment via S1leg– anterior insula connectivity and anterior insula GABA levels, the clinical translation of these brain markers
warrants further evaluation. For instance, a possible hypothesis is that anterior insula GABA levels and S1leg– anterior insula connec-tivity at baseline is predictive of the therapeutic trajectory of acu-puncture, which would increase its clinical utility. Future studies should be focused on using neuroimaging markers at baseline to predict acupuncture treatment outcomes.
Our study was designed to specifically examine somatosen-sory afference, but other contextual factors (patient– clinician rapport, expectations, among others) may have contributed to analgesia as well, particularly in the ML comparator group. Thus, our results highlight the importance of carefully designed controls in acupuncture trials, as various specific and nonspecific compo-nents contribute toward treatment outcomes. Researchers need a thorough understanding of the various factors that might be contributing to analgesia while designing an acupuncture trial.
Our study had some limitations. Despite a strong relationship between changes in anterior insula GABA+ levels and changes in clinical pain/S1leg– anterior insula connectivity, we did not observe a main effect of posttherapy GABA+ increase. We reason that the anterior insula may be downstream of our proposed pathway (Figure 5B) and 4 weeks of treatment may not be sufficient to increase GABA+ levels in the anterior insula. Future studies should be designed with a longer treatment schedule, including a post-therapy assessment period to examine long- term effects.
In summary, our study found that the somatosensory component of acupuncture specifically modulated functional com -munication and inhibitory neurochemistry in the somatosensory– insular circuit in order to reduce clinical pain in FM patients. With future rigorous mechanistic studies of acupuncture, we may be able to discover novel CNS pathways involved in nonphar-macologically induced analgesia and design new treatments that modulate CNS pathways in the pathologic processes lead-ing to chronic pain.
AUTHOR CONTRIBUTIONS
All authors were involved in drafting the article or revising it critically for important intellectual content, and all authors approved the final version to be published. Mr. Mawla had full access to all the study data and takes responsibility for the integrity of the data and the accuracy of the data analysis.Study conception and design. Mawla, Ichesco, Chenevert, Harte, Mashour, Clauw, Napadow, Harris.Acquisition of data. Ichesco, Chenevert, Buchtel, Bretz, Sloan.Analysis and/or interpretation of data. Mawla, Ichesco, Zöllner, Edden, Kaplan, Harte, Mashour, Clauw, Napadow, Harris.
REFERENCES 1. Clauw DJ. Fibromyalgia: a clinical review. JAMA 2014;311:1547– 55.
2. Harte SE, Clauw DJ, Hayes JM, Feldman EL, St. Charles IC, Watson CJ. Reduced intraepidermal nerve fiber density after a sustainedincrease in insular glutamate: a proof- of- concept study examiningthe pathogenesis of small fiber pathology in fibromyalgia. Pain Rep2017;2:e590.
3. Kaplan CM, Schrepf A, Ichesco E, Larkin T, Harte SE, Harris RE, et al. Association of inflammation with pronociceptive brain connections in

BRAIN MECHANISMS OF ACUPUNCTURE ANALGESIA | 1327
rheumatoid arthritis patients with concomitant fibromyalgia. Arthritis Rheumatol 2020;72:41– 6.
4. Kosek E, Cohen M, Baron R, Gebhart GF, Mico JA, Rice AS, et al.Do we need a third mechanistic descriptor for chronic pain states?Pain 2016;157:1382– 6.
5. Harris RE, Sundgren PC, Craig AD, Kirshenbaum E, Sen A, Napadow V, et al. Elevated insular glutamate in fibromyalgia is associated withexperimental pain. Arthritis Rheum 2009;60:3146– 52.
6. Foerster BR, Petrou M, Edden RA, Sundgren PC, Schmidt- Wilcke T,Lowe SE, et al. Reduced insular γ- aminobutyric acid in fibromyalgia.Arthritis Rheum 2012;64:579– 83.
7. Pomares FB, Roy S, Funck T, Feier NA, Thiel A, Fitzcharles MA, et al. Upregulation of cortical GABAA receptor concentration in fibromyal-gia. Pain 2020;161:74– 82.
8. Napadow V, LaCount L, Park K, As- Sanie S, Clauw DJ, Harris RE.Intrinsic brain connectivity in fibromyalgia is associated with chronicpain intensity. Arthritis Rheum 2010;62:2545– 55.
9. Ichesco E, Schmidt- Wilcke T, Bhavsar R, Clauw DJ, Peltier SJ, KimJ, et al. Altered resting state connectivity of the insular cortex in indi-viduals with fibromyalgia. J Pain 2014;15:815– 26.
10. Harper DE, Ichesco E, Schrepf A, Hampson JP, Clauw DJ, Schmidt- Wilcke T, et al. Resting functional connectivity of the periaqueductalgray is associated with normal inhibition and pathological facilitationin conditioned pain modulation. J Pain 2018;19:635.
11. Rummans TA, Burton MC, Dawson NL. How good intentionscontributed to bad outcomes: the opioid crisis. Mayo Clin Proc2018;93:344– 50.
12. Madsen MV, Gotzsche PC, Hrobjartsson A. Acupuncture treatmentfor pain: systematic review of randomised clinical trials with acu-puncture, placebo acupuncture, and no acupuncture groups. BMJ2009;338:a3115.
13. Langhorst J, Klose P, Musial F, Irnich D, Hauser W. Efficacy ofacupuncture in fibromyalgia syndrome: a systematic review witha meta- analysis of controlled clinical trials. Rheumatology (Oxford)2010;49:778– 88.
14. Vickers AJ, Cronin AM, Maschino AC, Lewith G, MacPherson H,Foster NE, et al. Acupuncture for chronic pain: individual patient data meta- analysis [review]. Arch Intern Med 2012;172:1444– 53.
15. Langevin HM, Wayne PM, Macpherson H, Schnyer R, Milley RM,Napadow V, et al. Paradoxes in acupuncture research: strate-gies for moving forward. Evid Based Complement Alternat Med2011;2011:180805.
16. Makary MM, Lee J, Lee E, Eun S, Kim J, Jahng GH, et al. Phantomacupuncture induces placebo credibility and vicarious sensations: aparallel fMRI study of low back pain patients. Sci Rep 2018;8:930.
17. Maeda Y, Kim H, Kettner N, Kim J, Cina S, Malatesta C, et al.Rewiring the primary somatosensory cortex in carpal tunnel syn-drome with acupuncture. Brain 2017;140:914– 27.
18. MacPherson H, Maschino AC, Lewith G, Foster NE, Witt CM,Vickers AJ, et al. Characteristics of acupuncture treatment associ-ated with outcome: an individual patient meta- analysis of 17,922patients with chronic pain in randomised controlled trials. PLoS One2013;8:e77438.
19. Irnich D, Salih N, Offenbacher M, Fleckenstein J. Is sham laser a valid control for acupuncture trials? Evid Based Complement AlternatMed 2011;2011:485945.
20. Kim H, Mawla I, Lee J, Gerber J, Walker K, Kim J, et al. Reducedtactile acuity in chronic low back pain is linked with structural neu-roplasticity in primary somatosensory cortex and is modulated byacupuncture therapy. Neuroimage 2020;217:116899.
21. Kong J, Gollub R, Huang T, Polich G, Napadow V, Hui K, et al.Acupuncture de qi, from qualitative history to quantitative measure-ment. J Altern Complement Med 2007;13:1059– 70.
22. Wolfe F, Clauw DJ, Fitzcharles MA, Goldenberg DL, Häuser W, KatzRS, et al. Fibromyalgia criteria and severity scales for clinical and epi-demiological studies: a modification of the ACR Preliminary Diagnostic Criteria for Fibromyalgia. J Rheumatol 2011;38:1113– 22.
23. Sullivan MJ, Bishop SR, Pivik J. The Pain Catastrophizing Scale:development and validation. Psychol Assess 1995;7:524– 32.
24. Esteban O, Markiewicz CJ, Blair RW, Moodie CA, Isik AI, ErramuzpeA, et al. fMRIPrep: a robust preprocessing pipeline for functionalMRI. Nat Methods 2019;16:111– 6.
25. Kim J, Loggia ML, Cahalan CM, Harris RE, Beissner F, Garcia RG,et al. The somatosensory link in fibromyalgia: functional connec-tivity of the primary somatosensory cortex is altered by sustainedpain and is associated with clinical/autonomic dysfunction. ArthritisRheumatol 2015;67:1395– 405.
26. Woolrich MW, Behrens TE, Beckmann CF, Jenkinson M, Smith SM.Multilevel linear modelling for FMRI group analysis using Bayesianinference. Neuroimage 2004;21:1732– 47.
27. Mescher M, Merkle H, Kirsch J, Garwood M, Gruetter R.Simultaneous in vivo spectral editing and water suppression. NMRBiomed 1998;11:266– 72.
28. Provencher SW. Automatic quantitation of localized in vivo 1H spec-tra with LCModel. NMR Biomed 2001;14:260– 4.
29. Edden RA, Puts NA, Harris AD, Barker PB, Evans CJ. Gannet: a batch- processing tool for the quantitative analysis of γ- aminobutyric acid- edited MR spectroscopy spectra. J Magn Reson Imaging 2014;40:1445– 52.
30. Diedenhofen B, Musch J. Cocor: a comprehensive solution for thestatistical comparison of correlations. PLoS One 2015;10:e0121945.
31. Hayes AF. Introduction to mediation, moderation, and conditionalprocess analysis: a regression- based approach. 2nd ed. New York:Guilford; 2017.
32. Napadow V, Makris N, Liu J, Kettner NW, Kwong KK, Hui KK. Effects of electroacupuncture versus manual acupuncture on the humanbrain as measured by fMRI. Hum Brain Mapp 2005;24:193– 205.
33. Dhond RP, Yeh C, Park K, Kettner N, Napadow V. Acupuncturemodulates resting state connectivity in default and sensorimotorbrain networks. Pain 2008;136:407– 18.
34. Kutch JJ, Ichesco E, Hampson JP, Labus JS, Farmer MA, MartucciKT, et al. Brain signature and functional impact of centralized pain: amultidisciplinary approach to the study of chronic pelvic pain (MAPP) network study. Pain 2017;158:1979– 91.
35. Kim J, Mawla I, Kong J, Lee J, Gerber J, Ortiz A, et al. Somatotopically specific primary somatosensory connectivity to salience and defaultmode networks encodes clinical pain. Pain 2019;160:1594– 605.
36. Gamal- Eltrabily M, de Los Monteros- Zuniga AE, Manzano- GarciaA, Martinez- Lorenzana G, Condes- Lara M, Gonzalez- Hernandez A.The rostral agranular insular cortex, a new site of oxytocin to induceantinociception. J Neurosci 2020;40:5669– 80.
37. Zhu H. Acupoints initiate the healing process. Med Acupunct2014;26:264– 70.
38. Russell IJ, Holman AJ, Swick TJ, Alvarez- Horine S, Wang YG, GuintaD, et al. Sodium oxybate reduces pain, fatigue, and sleep disturbanceand improves functionality in fibromyalgia: results from a 14- week, rand-omized, double- blind, placebo- controlled study. Pain 2011;152:1007– 17.
39. Watson CJ. Insular balance of glutamatergic and GABAergic signal-ing modulates pain processing. Pain 2016;157:2194– 207.
40. Harte SE, Ichesco E, Hampson JP, Peltier SJ, Schmidt- Wilcke T,Clauw DJ, et al. Pharmacologic attenuation of cross- modal sensoryaugmentation within the chronic pain insula. Pain 2016;157:1933– 45.
41. Buzsaki G, Kaila K, Raichle M. Inhibition and brain work. Neuron2007;56:771– 83.
42. Northoff G, Walter M, Schulte RF, Beck J, Dydak U, Henning A, et al. GABA concentrations in the human anterior cingulate cortex predictnegative BOLD responses in fMRI. Nat Neurosci 2007;10:1515– 7.

MAWLA ET AL 1328 |
43. Muthukumaraswamy SD, Edden RA, Jones DK, Swettenham JB,Singh KD. Resting GABA concentration predicts peak γ frequencyand fMRI amplitude in response to visual stimulation in humans. Proc Natl Acad Sci U S A 2009;106:8356– 61.
44. Harris AD, Puts NA, Anderson BA, Yantis S, Pekar JJ, Barker PB,et al. Multi- regional investigation of the relationship between func-tional MRI blood oxygenation level dependent (BOLD) activation andGABA concentration. PLoS One 2015;10:e0117531.
45. Stagg CJ, Bachtiar V, Amadi U, Gudberg CA, Ilie AS, Sampaio- Baptista C, et al. Local GABA concentration is related to network- level resting functional connectivity. Elife 2014;3:e01465.
46. Levar N, van Doesum TJ, Denys D, Van Wingen GA. Anterior cin-gulate GABA and glutamate concentrations are associated withresting- state network connectivity. Sci Rep 2019;9:2116.
47. Chen X, Fan X, Hu Y, Zuo C, Whitfield- Gabrieli W, HoltD, et al. Regional GABA concentrations modulate inter-network resting- state functional connectivity. Cereb Cortex2019;29:1607– 18.
48. Bosch OG, Esposito F, Dornbierer D, von Rotz R, Kraehenmann R,Staempfli P, et al. Prohedonic properties of γ- hydroxybutyrate are associated with changes in limbic resting- state functional connectiv-ity. Hum Psychopharmacol 2018;33:e2679.
49. Beissner F, Meissner K, Bar KJ, Napadow V. The autonomic brain:an activation likelihood estimation meta- analysis for central process-ing of autonomic function. J Neurosci 2013;33:10503– 11.
50. Jung C, Ichesco E, Ratai EM, Gonzalez RG, Burdo T, Loggia ML,et al. Magnetic resonance imaging of neuroinflammation in chronicpain: a role for astrogliosis? Pain 2020;161:1555– 64.
DOI 10.1002/art.41692
Clinical images: Giant iliopsoas bursitis in systemic juvenile idiopathic arthritis
The patient, a 4- year- old boy with systemic juvenile idiopathic arthritis (JIA), experienced a relapse while being treated with tacrolimus and tocilizumab (TCZ), and presented with right groin pain and claudication. Physical examination demonstrated mild tenderness and restricted range of motion in the right hip joint with no palpable mass. Laboratory testing revealed a highly elevated serum matrix metalloproteinase 3 (MMP- 3) level (551 ng/dl); however, leukocytosis and C- reactive protein (CRP) elevation (8,700/µl and 0.02 mg/dl, respectively) were not observed. Unexpectedly, magnetic resonance imaging demonstrated a giant cyst anterior to the right hip joint and posterior to the iliopsoas muscle (arrows in A and B). The cyst appeared to be connected to the right hip joint (arrow in C). Percutaneous cyst aspiration yielded yellow turbid fluid with leukocytes (58,200/µl), predominantly with neutrophils. No bacterial organisms were detected on culture. Iliopsoas (or iliopectineal) bursitis associated with the relapse of systemic JIA was diagnosed. After treatment was switched from TCZ to canakinumab, the patient’s symptoms rapidly improved and one month later serum MMP- 3 level had returned to normal. Iliopsoas bursitis is a rare condition that has been reported to occur in the setting of various hip diseases including rheumatoid arthritis and traumatic or degenerative conditions, and post– hip replacement (1). Communication between iliopsoas bursa and the hip joint is present in ~14% of the general population and can result from chronic inflammation of the hip joint (2,3). In our patient, it was considered that active synovitis caused a marked increase of the fluid in the hip joint, decompressed into the bursa, and resulted in giant iliopsoas bursitis. TCZ can mask the signs of inflammation, such as fever, pain, local warmth, and CRP elevation. Although iliopsoas bursa is rare, it should be considered in children with systemic JIA presenting with groin pain, particularly those being treated with TCZ even with mild symptoms.
Asami Shimbo, MDYuko Akutsu, MDSusumu Yamazaki, MD, PhDMasaki Shimizu, MD, PhDMasaaki Mori, MD, PhDTokyo Medical and Dental University Tokyo, Japan
1. Iwata T, Nozawa S, Ohashi M, Sakai H, Shimizu K. Giant iliopectinealbursitis presenting as neuropathy and severe edema of the lowerlimb: case illustration and review of the literature. Clin Rheumatol2013;32:721– 5.
2. Chandler SB. The iliopsoas bursa in man. Anat Rec 1934;58:235– 40.
3. Sartoris DJ, Danzig L, Gilula L, Greenway G, Resnick D. Synovialcysts of the hip joint and iliopsoas bursitis: a spectrum of imagingabnormalities. Skeletal Radiol 1985;14:85– 94.

1329
Arthritis & RheumatologyVol. 73, No. 7, July 2021, pp 1329–1333DOI 10.1002/art.41660© 2021 The Authors. Arthritis & Rheumatology published by Wiley Periodicals LLC on behalf of American College of Rheumatology.This is an open access article under the terms of the Creative Commons Attribution- NonCommercial- NoDerivs License, which permits use and distribution in any medium, provided the original work is properly cited, the use is non- commercial and no modifications or adaptations are made.
B R I E F R E P O R T
Anti–Cytosolic5′-Nucleotidase1AAutoantibodiesAreAbsentinJuvenileDermatomyositisAnke Rietveld,1 Judith Wienke,2 Eline Visser,3 Wilma Vree Egberts,3 Wolfgang Schlumberger,4 Baziel van Engelen,1 Annet van Royen- Kerkhof,5 Hui Lu,6 Lucy Wedderburn,7 Christiaan Saris,1 Sarah Tansley,6 and Ger Pruijn,3 on behalf of the Juvenile Dermatomyositis Research Group and the Dutch Myositis Consortium
Objective. To assess anti– cytosolic 5′- nucleotidase 1A (anti– cN- 1A) autoantibodies in children with juvenile dermatomyositis (DM) and healthy controls, using 3 different methods of antibody detection, as well as verification of the results in an independent cohort.
Methods. Anti– cN- 1A reactivity was assessed in 34 Dutch juvenile DM patients and 20 healthy juvenile controls using the following methods: a commercially available full- length cN- 1A enzyme- linked immunosorbent assay (ELISA), a synthetic peptide ELISA, and immunoblotting with a lysate from cN- 1A–expressing HEK 293 cells. Sera from juvenile DM patients with active disease and those with disease in remission were analyzed. An independent British cohort of 110 juvenile DM patients and 43 healthy juvenile controls was assessed using an in- house full- length cN- 1A ELISA.
Results. Anti– cN- 1A reactivity was not present in sera from juvenile DM patients or healthy controls when tested with the commercially available full- length cN- 1A ELISA or by immunoblotting, in either active disease or disease in remission. Additionally, in the British juvenile DM cohort, anti– cN- 1A reactivity was not detected. Three Dutch juvenile DM patients had weakly positive results for 1 of 3 synthetic cN- 1A peptides measured by ELISA.
Conclusion. Juvenile DM patients and young healthy individuals did not show anti– cN- 1A reactivity as assessed by different antibody detection techniques.
INTRODUCTION
Autoantibodies detected in idiopathic inflammatory myopa-thies can be divided into myositis- specific autoantibodies (MSAs) and myositis- associated autoantibodies. MSAs have a high dis-ease specificity, which can be used to confirm a subtype of myosi-tis, are frequently related to a specific clinical phenotype and, in some cases, are associated with disease activity or severity (1– 3).
Anti– cytosolic 5′- nucleotidase 1A (anti– cN- 1A) autoantibodies are present in a large subset of inclusion body myositis (IBM) patients but not in adults with other forms of myositis. Although anti– cN- 1A was initially classified as an MSA (4,5), the relatively frequent sero-positivity in adults with Sjögren’s syndrome and systemic lupus erythematosus has raised questions about the specificity of anti– cN- 1A autoantibodies (6). A recent study showed anti– cN- 1A autoreactivity in 27% of patients with juvenile dermatomyositis
Supported by the French Muscular Dystrophy Association (grant 20301), Cure JM Foundation, De Bas Stichting Foundation, Zorgverzekeraars Innova -tion Fund, Myositis UK, Princess Beatrix Spierfonds, and The Myositis Association. Dr. van Engelen’s work was supported by a grant from Princess Beatrix Spierfonds, grants from the European Union’s Horizon 2020 Research and Innovation Programme MURAB, the Netherlands Organization for Scientific Research, a ZonMW grant from The Netherlands Organization for Health Research and Development, Spieren voor Spieren, and the Dutch FSHD Foundation. Dr. Wedderburn’s work was supported by the NIHR, Versus Arthritis (grant 21593), Myositis UK, and Great Ormond Street Hospital Children’s Charity.
1Anke Rietveld, MD (current address: Centre Hospitalier Intercommunal Toulon, Toulon, France), Baziel van Engelen, MD, PhD, Christiaan Saris, MD, PhD: Donders Institute for Brain, Cognition, and Behaviour, Radboud University Medical Center, Nijmegen, The Netherlands; 2Judith Wienke, MD, PhD: University Medical Center Utrecht and Utrecht University, Utrecht, The Netherlands; 3Eline Visser, MSc, Wilma Vree Egberts, Ger Pruijn, PhD: Radboud Institute for Molecular Life Sciences, Institute for Molecules and Materials,
Radboud University, Nijmegen, The Netherlands; 4Wolfgang Schlumberger, MD: Institute for Experimental Immunology, Euroimmun, Lübeck, Germany; 5Annet van Royen- Kerkhof, MD, PhD: Wilhelmina Children’s Hospital, University Medical Center Utrecht, and Utrecht University, Utrecht, The Netherlands; 6Hui Lu, MD, PhD, Sarah Tansley, MD, PhD: University of Bath, Bath, UK; 7Lucy Wedderburn, MD, PhD: NIHR Great Ormond Street Hospital Biomedical Research Centre, Centre for Adolescent Rheumatology Versus Arthritis, University College London Great Ormond Street Institute of Child Health, London, UK.
Drs. van Engelen and Pruijn are coinventors on a patent licensed to Euroimmun. Dr. van Engelen has received consulting fees, speaking fees, and/or honoraria from Fulcrum and Facio (less than $10,000 each). Dr. Pruijn has received research support from Euroimmun. No other disclosures relevant to this article were reported.
Address correspondence to Anke Rietveld, MD, PO Box 6101 (935), 6500 HB Nijmegen, The Netherlands. Email: [email protected].
Submitted for publication June 19, 2020; accepted in revised form January 14, 2021.

RIETVELD ET AL 1330 |
(DM) (7). The use of different methods of detection in various cohorts hampers direct comparisons of sensitivity and specific-ity of anti– cN- 1A autoantibody reactivity. In order to assess the presence of anti– cN- 1A autoantibodies in juvenile DM and healthy controls, we used 3 different methods of antibody detection and substantiated the results in an independent juvenile DM cohort.
PATIENTS AND METHODS
Patients. Anti– cN- 1A autoreactivity was tested in 34 Dutch patients with juvenile DM (22 with active disease and 12 with disease in remission, randomly selected from the Dutch juvenile DM biomarker study [8]) and in 20 healthy controls. Nine of the 22 juvenile DM patients with active disease were retested when their disease was in remission. Two juvenile DM patients who were initially tested during active disease were retested during a flare. Juvenile DM diagnosis was based on the Bohan and Peter criteria for definite or probable juvenile DM (9,10). Inactive disease was defined according to the updated Paediatric Rheumatology International Trials Organisation cri-teria (11,12). Demographic and disease- related parameters from the moment of serum sampling are presented in Table 1. Samples were stored for up to 9 years at −80°C, anonymized, and the results of enzyme- linked immunosorbent assay (ELISA) and immunoblotting were assessed by researchers who were blinded with regard to sample identification.
An independent British cohort was used to validate the data, consisting of 110 juvenile DM patients and 43 healthy subjects ages ≤16 years (randomly selected from the national registry and described elsewhere [3]); parameters are summarized in Table 1. Serum samples were stored for up to 19 years at −80°C. Ethical approval was obtained (regional METC no. 15- 191, 11- 499/C and MREC 1/3/22).
Full- length cN- 1A ELISA. The anti– cN- 1A ELISA based on recombinant full- length cN- 1A antigen was performed using a commercially available kit (EA 1675- 4801G) according to instruc-tions of the manufacturer (Euroimmun Medizinische Labordiag-nostika AG). The development and validation of this ELISA has been described elsewhere (13). Results were evaluated sem-iquantitatively as a ratio (optical density [OD] at 450 nm of the sample/OD450 of the calibrator [cutoff]); a ratio of ≥1 was deemed positive.
Anti– cN- 1A reactivity was determined in the independent British cohort using an in- house ELISA at the University of Bath, using 0.4 μg/ml recombinant cN- 1A protein (TP32461, cytosolic 1A [NT5C1A] expressed in HEK 293; OriGene) per well, serum samples diluted 1:250, with goat anti- human IgG (Sigma; dilution 1:30,000) as a secondary antibody. Each plate contained positive and negative controls. A cutoff of 5 SD above the mean of nega-tive controls was deemed positive.
Peptide ELISA. Details on the development and test char-acteristics of the cN- 1A peptide ELISA have been published elsewhere (4,14). Briefly, 3 synthetic peptides of 23 amino acids derived from the sequence of cN- 1A were used as target antigens in this ELISA, referred to as peptides 1, 2, and 3. We used rab-bit anti- human IgA, IgG, IgM, kappa, and lambda (Dako P0212; 1:2,000 dilution) as a secondary antibody. Each plate contained a positive control (serum from an IBM patient with anti– cN- 1A autoantibodies) and, for each serum sample, background reac-tivity was determined without a coated peptide. The serum back-ground value was subtracted from the peptide values. Sera were considered to be positive for anti– cN- 1A when OD450 values were 3 SD above the mean of negative controls.
Preparation of cell lysates and Western blotting. A stably transfected cN- 1A– expressing Flp- In T- REx HEK 293 cell line was cultured in Dulbecco’s modified Eagle’s medium (DMEM; Gibco) with 10% fetal calf serum (FCS), 15 µg/ml blasticidin, and 300 µg/ml hygromycin. Expression of cN- 1A was induced by add-ing 1 µg/ml doxycycline to the medium. A Flp- In T- REx HEK 293 control cell line was cultured in DMEM with 10% FCS, 15 µg/ml blasticidin, and 100 µg/ml zeocin. Cells were harvested 24 hours after induction, and lysates were prepared in sodium dodecyl sulfate– polyacrylamide gel electrophoresis (SDS- PAGE) sample buffer by sonication for 10 minutes, with 30 second intervals. After heating for 5 minutes, proteins were separated in 12% SDS- PAGE gels (lysate from 1 T75 flask loaded per 10- cm gel).
After electrophoresis, the separated proteins were blotted on a Protran nitrocellulose blotting membrane (GE Healthcare Life Science), stained with ponceau S (0.1% ponceau S in 5% acetic acid), and cut into 3- mm strips. The blot strips were blocked in blocking buffer (5% nonfat dry milk, 5% sheep serum in phosphate buffered saline– Tween [PBST]) for 1 hour at room temperature and incubated with sera (from juvenile DM patients and healthy controls) diluted 1:100 in blocking buffer (1 hour at room temperature). Serum from an anti– cN- 1A- positive IBM patient and a commercial rabbit anti- NT5C1A antibody (Atlas HPA050283) were used as positive controls (both diluted 1:5,000). Blots were washed 3 times with blocking buffer and incubated for 1 hour with the secondary antibody (IRDye 800CW goat anti- human IgG or IRDye 800CW goat anti- rabbit IgG), diluted 1:5,000 in blocking buffer. Blots were washed twice with PBST and once in PBS before visualization of bound antibodies using a Li- Cor Odyssey imager.
Anti– cN- 1A reactivity was analyzed in sera by the incubation of 2 blots in parallel, 1 containing lysate from cN- 1A– expressing cells and another containing lysate from the control cells lacking detect-able levels of cN- 1A, in order to account for possible background staining or staining of other proteins. Sera were considered positive for anti– cN- 1A when a band appeared at the proper position on the blot strip containing cN- 1A but was absent on the control blot.

ANTI– cN- 1A AUTOANTIBODIES NOT PRESENT IN JUVENILE DM | 1331
Statistical analysis. We used descriptive statistics with IBM SPSS Statistics 25 and GraphPad Prism for visualization.
Patient and public involvement statement. Patients were not involved in the design of this study, but participants in the Dutch juvenile DM biomarker study and the British juvenile DM cohort and biomarker study were informed about results of the study by regular updates via the national patient organizations.
RESULTS
Anti– cN- 1A autoantibodies were not detected in juvenile DM patients or healthy controls by the full- length cN- 1A ELISA (Figure 1) or the full- length cN- 1A– containing cell lysate immunoblotting assay (data not shown) (see Supplementary Figure 1 for a representa-tive example, available on the Arthritis & Rheumatology website at http://onlin elibr ary.wiley.com/doi/10.1002/art.41660/ abstract). The
Table 1. Demographic and disease- related parameters at the time of serum sampling*
Dutch cohort British cohort
Active juvenile DM (n = 22)
Inactive juvenile DM (n = 12)
Healthy controls (n = 20)
Juvenile DM (n = 110)
Healthy controls (n = 43)
Baseline dataAge at diagnosis, median (IQR)
years4.8 (3.7– 9.0) 6.4 (4.2– 8.3) – 7.4 (4.2– 10.6) –
Age at serum sampling, median (IQR) years
5.4 (3.8– 11.7) 12.7 (9.4– 15.2) 11.0 (7.3 – 16.0) 9.4 (5.7– 13.8) 13.4 (10.9– 14.8)
Female sex 13 (59.1) 7 (58.3) 14 (70) 71 (64.5) 25 (58)Time from disease onset to
sampling, median (IQR) months
0 (0– 2.5)
75.3 (39.9– 106.5)
– 46.9 (11.3– 132.1) –
Autoimmune comorbidity 0 0 – 1 – Other autoantibodies†
ANA positive 11 (52.4) 4 (36.4) – – – ENA positive 1 (5) 2 (20) – – – MSA positive 4 (19) 2 (40) – 52 (47) – Anti– NXP- 2 positive 1 (5) 1 (8.3) – 22 (20) – Anti-TIF1γpositive 2 (9) 0 – 14 (13) – Anti– PL- 12 positive 1 (5) 0 – 0 – Anti– Jo- 1 positive 0 1 (8.3) – 1 (1) – Anti– MDA- 5 positive 0 0 – 7 (6) – Anti- HMGCR positive 0 0 – 3 (3) – Anti– Mi- 2 positive 0 0 – 2 (2) – Anti– PL- 7 positive 0 0 – 1 (1) – Anti- SAE positive 0 0 – 1 (1) – Anti- SRP positive 0 0 – 1 (1) –
Disease activity‡ CMAS, median (IQR) (range
0– 52)28 (12.3– 44.5) 52 (51.3– 52.0) – 45 (31.5– 52.0) –
PhGA, median (IQR) (range 0– 10)
6 (2.6– 7.0) 0 (0) – 2.15 (0.7– 5.1) –
CK, median (IQR) IU/liter§ 374 (112.5– 3,222.8) 118 (97.5– 142.3) – 110.5 (64.0– 824.5) – Medication
Steroids only – – – 4 (4) – Steroids + other
immunomodulatory drug(s)6 (27) – – 36 (33) –
Other immunomodulatory drug(s) only
1 (5) 4 (33) – 11 (10) –
None 15 (68) 8 (67) – 14 (13) – * Except where indicated otherwise, values are the number (%). IQR = interquartile range; anti- TIF1γ = anti– transcriptional intermediary factor 1γ;anti- SAE = anti– small ubiquitin- like modifier- 1 activating enzyme; anti- SRP = anti– signal recognition particle. † In the Dutch cohort, there were missing data on the following: antinuclear antibody (ANA) testing in 1 juvenile dermatomyositis (DM) patient with active disease and 1 with inactive disease, extractable nuclear antigen (ENA) testing in 2 juvenile DM patients with active disease and 2 with inactive disease, myositis- specific antibody (MSA) testing in 1 juvenile DM patient with active disease and 7 with inactive disease. No data were available on ANA and ENA testing in the British cohort. In the Dutch cohort, MSA (Euroimmun DL 1530- 6401- 4 G) and ENA (Euroimmun DL1590- 6401- 3 G) were tested by line blot assay. ANA was tested by immunofluorescence on HEp- 2 cells. In the British cohort, MSA was tested by immunoprecipitation with confirmation by enzyme- linked immunosorbent assay for anti– melanoma differentiation– associated protein 5 (anti– MDA- 5), anti– nuclear matrix protein 2 (anti– NXP- 2), and anti– hydroxymethylglutaryl- coenzyme A reductase (anti- HMGCR). ‡ In the Dutch cohort, there were missing data on the Childhood Myositis Assessment Scale (CMAS) in 6 juvenile DM patients with active disease and on the physician global assessment (PhGA) in 3 juvenile DM patients with active disease. § Reference value for serum creatine kinase (CK) level <170 IU/liter.

RIETVELD ET AL 1332 |
peptide ELISA showed no anti– cN- 1A reactivity in healthy con-trols, whereas weak, borderline reactivity against synthetic cN- 1A peptides was detected in 3 juvenile DM patients with active dis-ease (1 patient showed reactivity against peptide 1, and 2 patients showed reactivity against peptide 3) (Figure 1). In the independent validation cohort, we did not detect anti– cN- 1A autoantibodies in the juvenile DM patients or healthy controls.
Comparison of repeated sampling in patients with active disease followed by disease in remission showed no anti– cN- 1A reactivity in any of the 3 detection methods, either in active or inactive juvenile DM in 8 of 9 patients. The remission sample from 1 patient showed weak anti– cN- 1A reactivity in the peptide ELISA (peptide 2), while the active disease sample was negative. Two juvenile DM patients who were initially tested during active disease were retested during a flare, and they were negative for anti– cN- 1A autoantibody reactivity according to all 3 methods of detection at both moments. The low number of juvenile DM patients with weak anti– cN- 1A reactivity made it impossible to make a reliable
comparison of clinical features between patients who were posi-tive for anti– cN- 1A and those who were negative.
DISCUSSION
Anti– cN- 1A autoantibodies were not detected by full- length cN- 1A ELISA or immunoblotting in juvenile DM patients or healthy juvenile controls, a finding that was substantiated in a large inde-pendent cohort. The absence of anti– cN- 1A autoantibodies in juvenile DM was observed both in samples from patients with active disease and in those with disease in remission. In 3 of 34 Dutch juvenile DM patients (8.8%), weak anti– cN- 1A reactivity was found using the peptide ELISA. Very low level anti– cN- 1A reactivity has previously been detected in up to 5% of disease control groups using the same cN- 1A peptide ELISA (13).
Our conclusions contrast with those of a recent study by Yeker et al (7), in which a large juvenile DM cohort was assessed by immunoblotting with lysates of transfected HEK 293 cells expressing cN- 1A. Anti– cN- 1A reactivity was found in 83 of 307 juvenile DM patients (27%), 11 of 92 healthy controls (12%), 11% of polymyositis patients, 35% of patients with overlap syndromes, and 27% of juvenile idiopathic arthritis patients. The presence of anti– cN- 1A autoantibodies was related to more severe disease in juvenile DM. However, our results are consistent with the findings of a study that used an addressable laser bead immunoassay with a full- length human recombinant protein in a cohort of 40 juvenile DM patients (15), showing anti– cN- 1A reactivity in none of these patients. An intermediate percentage (2 of 12 patients; 17%) of anti– cN- 1A reactivity was observed in an Asian cohort of juvenile DM patients using a full- length recombinant ELISA, with confirma-tion by immunoprecipitation (16).
It remains to be established whether the differences observed between juvenile DM cohorts reflect heterogeneity of anti– cN- 1A production among cohorts or are due to the different assays applied. Generally, studies using immunoblotting to detect anti– cN- 1A antibodies have higher sensitivity and lower specificity than those that use the full- length cN- 1A ELISA. The full- length cN- 1A ELISA might miss linear epitopes, reducing sensitivity. However, specificity is higher than with the peptide ELISA, as the second-ary antibody targets the IgG isotype only. The large differences in sensitivity and specificity of anti– cN- 1A autoantibody detection between the various methods are summarized by Amlani et al (15). A head- to- head comparison of the different methods of anti– cN- 1A antibody detection in a large international cohort should be performed to establish a well- validated gold standard. In clin-ical practice, high specificity of anti– cN- 1A autoantibodies in the context of idiopathic inflammatory myopathies is more important than high sensitivity, as the presence of anti– cN- 1A autoantibod-ies can provide additional evidence for a diagnosis of IBM instead of another idiopathic inflammatory myopathy that would require immunosuppressive therapy.
Figure 1. Results of full- length and peptide cytosolic 5′- nucleotidase 1A (cN- 1A) enzyme- linked immunosorbent assays (ELISAs). Dotted lines show cutoff values. The cutoff value for the synthetic peptide ELISA was calculated based on the data for healthy adult control samples (mean + 3SD). Positivity for cN- 1A was defined as a value of >0.80 for peptide 1, >0.13 for peptide 2, and >0.19 for peptide 3. Each each plate contained a positive control (inclusion body myositis [IBM] patient). Symbols represent individual subjects (healthy controls [HCs; n = 20]; IBM patient [n = 1]; juvenile DM patients with active disease [JDM A; n = 22]; juvenile DM patients with disease in remission [JDM R; n = 12]). OD450 = optical density of 450 nm.

ANTI– cN- 1A AUTOANTIBODIES NOT PRESENT IN JUVENILE DM | 1333
In conclusion, using a combination of detection methods, anti– cN- 1A autoreactivity was not detected in juvenile DM patients or healthy subjects. An international gold standard for anti– cN- 1A antibody testing should be established, as the large variation in specificity of anti– cN- 1A autoantibody detection hampers its use in clinical practice.
ACKNOWLEDGMENTS
We thank the Dutch Juvenile Myositis Consortium, with Sylvia Kamphuis, Esther Hoppenreijs, Ellen Schatorjé, Wineke Armbrust, Merlijn van den Berg, Petra Hissink Muller and Annette van Dijk-Hummelman, for their help and support with patient inclusion and sample and data collection.
AUTHOR CONTRIBUTIONS
All authors were involved in drafting the article or revising it critically for important intellectual content, and all authors approved the final version to be published. Dr. Rietveld had full access to all of the data in the study and takes responsibility for the integrity of the data and the accuracy of the data analysis.Study conception and design. Rietveld, Wienke, van Engelen, van Royen- Kerkhof, Saris, Tansley, Pruijn.Acquisition of data. Rietveld, Wienke, Visser, Vree Egberts, Schlumberger, van Engelen, van Royen- Kerkhof, Lu, Wedderburn, Saris, Tansley, Pruijn.Analysis and interpretation of data. Rietveld, Wienke, Visser, Schlumberger, van Engelen, van Royen- Kerkhof, Lu, Wedderburn, Saris, Tansley, Pruijn.
REFERENCES 1. Benveniste O, Drouot L, Jouen F, Charuel JL, Bloch- Queyrat C,
Behin A, et al. Correlation of anti– signal recognition particle autoan-tibody levels with creatine kinase activity in patients with necrotizing myopathy. Arthritis Rheum 2011;63:1961– 71.
2. Sato S, Kuwana M, Fujita T, Suzuki Y. Anti- CADM- 140/MDA5 autoantibody titer correlates with disease activity and predicts dis-ease outcome in patients with dermatomyositis and rapidly progres-sive interstitial lung disease. Mod Rheumatol 2013;23:496– 502.
3. Tansley SL, Simou S, Shaddick G, Betteridge ZE, Almeida B, Gunawardena H, et al. Autoantibodies in juvenile- onset myositis: their diagnostic value and associated clinical phenotype in a large UK cohort. J Autoimmun 2017;84:55– 64.
4. Pluk H, van Hoeve BJ, van Dooren SH, Stammen- Vogelzangs J, van der Heijden A, Schelhaas HJ, et al. Autoantibodies to cytosolic 5’- nucleotidase 1A in inclusion body myositis. Ann Neurol 2013; 73:397– 407.
5. Larman HB, Salajegheh M, Nazareno R, Lam T, Sauld J, Steen H, et al. Cytosolic 5’- nucleotidase 1A autoimmunity in sporadic inclu-sion body myositis. Ann Neurol 2013;73:408– 18.
6. Rietveld A, van den Hoogen LL, Bizzaro N, Blokland SL, Dahnrich C, Gottenberg JE, et al. Autoantibodies to cytosolic 5’- nucleotidase 1a in primary Sjogren’s syndrome and systemic lupus erythematosus. Front Immunol 2018;9:1200.
7. Yeker RM, Pinal- Fernandez I, Kishi T, Pak K, Targoff IN, Miller FW, et al. Anti- NT5C1A autoantibodies are associated with more severe disease in patients with juvenile myositis. Ann Rheum Dis 2018;77:714– 9.
8. Wienke J, Bellutti Enders F, Lim J, Mertens JS, van den Hoogen LL, Wijngaarde CA, et al. Galectin-9 and CXCL10 as biomarkers for dis-ease activity in juvenile dermatomyositis: a longitudinal cohort study and multicohort validation. Arthritis Rheumatol 2019;71:1377– 90.
9. Bohan A, Peter JB. Polymyositis and dermatomyositis: part 1 [review]. N Engl J Med 1975;292:344– 7.
10. Bohan A, Peter JB. Polymyositis and dermatomyositis: part 2 [review]. N Engl J Med 1975;292:403– 7.
11. Almeida B, Campanilho- Marques R, Arnold K, Pilkington CA, Wedderburn LR, Nistala K, et al. Analysis of published criteria for clinically inactive disease in a large juvenile dermatomyositis cohort shows that skin disease is underestimated. Arthritis Rheumatol 2015; 67:2495– 502.
12. Lazarevic D, Pistorio A, Palmisani E, Miettunen P, Ravelli A, Pilkington C, et al. The PRINTO criteria for clinically inactive disease in juvenile dermatomyositis. Ann Rheum Dis 2013;72:686– 93.
13. Kramp SL, Karayev D, Shen G, Metzger AL, Morris RI, Karayev E, et al. Development and evaluation of a standardized ELISA for the determination of autoantibodies against cN- 1A (Mup44, NT5C1A) in sporadic inclusion body myositis. Auto Immun Highlights 2016;7:16.
14. Herbert MK, Stammen- Vogelzangs J, Verbeek MM, Rietveld A, Lundberg IE, Chinoy H, et al. Disease specificity of autoantibodies to cytosolic 5’- nucleotidase 1A in sporadic inclusion body myositis versus known autoimmune diseases. Ann Rheum Dis 2016;75:696– 701.
15. Amlani A, Choi MY, Tarnopolsky M, Brady L, Clarke AE, Garcia- De La Torre I, et al. Anti- NT5c1A autoantibodies as biomarkers in inclu-sion body myositis. Front Immunol 2019;10:745.
16. Muro Y, Nakanishi H, Katsuno M, Kono M, Akiyama M. Prevalence of anti- NT5C1A antibodies in Japanese patients with autoimmune rheumatic diseases in comparison with other patient cohorts. Clin Chim Acta 2017;472:1– 4.

1334
Arthritis & RheumatologyVol. 73, No. 7, July 2021, pp 1334–1340DOI 10.1002/art.41640© 2021, American College of Rheumatology
B R I E F R E P O R T
Distinct Gene Expression Signatures Characterize Strong Clinical Responders Versus Nonresponders to Canakinumab in Children With Systemic Juvenile Idiopathic ArthritisEmely L. Verweyen,1 Alex Pickering,2 Alexei A. Grom,3 and Grant S. Schulert3
Objective. Canakinumab is a human anti– interleukin- 1β (anti– IL- 1β) blocking agent that effectively neutralizes IL- 1β– mediated signaling for treatment of systemic juvenile idiopathic arthritis (JIA). While many patients have dramatic clinical response to IL- 1 blockade, approximately one- third fail to respond, but there are currently no validated clinical or immunologic predictors of response. We undertook this study to characterize distinct gene signatures for treatment response and nonresponse to canakinumab in systemic JIA patients.
Methods. We performed a secondary analysis of whole- blood gene expression microarrays using blood samples obtained from healthy controls and systemic JIA patients at baseline and on day 3 after canakinumab treatment (GEO accession no. GSE80060). Patients were considered strong clinical responders if they met the ACR90 response (exhibited ≥90% improvement in the American College of Rheumatology [ACR] JIA response criteria; nonresponders were those who met ACR30 [exhibiting ≤30% improvement in the ACR JIA response criteria]). A random- effects model with patient identity as the random variable was used for differential expression analysis.
Results. We identified a distinct gene expression signature in patients with a strong clinical response to canakinumab treatment as compared to nonresponders, mediated by up- regulation of neutrophil- and IL- 1– associated genes and characterized by increasing divergence from control transcriptomes with increasing clinical response. We also identified a signature including up- regulated CD163 expression that was associated with canakinumab nonresponse. Intriguingly, canakinumab treatment induced either up- or down- regulation of type I interferon (IFN) genes, independent of clinical response.
Conclusion. Here, we identify a gene signature in systemic JIA patients prior to receiving treatment that distin-guishes strong responders to canakinumab from nonresponders. Further prospective studies are needed to assess the utility of these insights for treatment decisions in systemic JIA and to track the association of up- regulated type I IFN signatures with systemic JIA complications.
INTRODUCTION
Systemic juvenile idiopathic arthritis (JIA) is a chronic inflam-matory arthropathy characterized by quotidian fevers, rash, arthri-tis, and hepatosplenomegaly (1). Gene expression studies of the immune response in systemic JIA have revealed key features of this disorder, including the prominence of autoinflammation (2– 4).
While some findings diverge, there is consensus about the up- regulation of innate immune system processes, including interleu-kin- 1 (IL- 1) signaling (2), Toll- like receptor (TLR) signaling (2,3), IL- 6 signaling (4), inflammasome- related genes (2,3), and neutrophil activation (2,3,5,6).
Systemic JIA can be accompanied by severe complications, including a life- threatening cytokine storm syndrome, macrophage
Supported by the Systemic JIA Foundation. Dr. Verweyen’s work was supported by the DFG (project 448863690). Dr. Schulert’s work was supported by the National Institute of Arthritis and Musculoskeletal and Skin Diseases, NIH (grant K08- AR- 072075).
1Emely L. Verweyen, PhD: Cincinnati Children’s Hospital Medical Center, Cincinnati, Ohio; 2Alex Pickering, PhD: Harvard Medical School, Boston, Massachusetts; 3Alexei A. Grom, MD, Grant S. Schulert, MD, PhD: Cincinnati Children’s Hospital Medical Center and University of Cincinnati College of Medicine, Cincinnati, Ohio.
Dr. Grom has received consulting fees from Juno and Novartis (less than $10,000 each) and research support from NovImmune and AB2 Bio. Dr. Schulert has received consulting fees from Novartis and Sobi (less than $10,000 each). No other disclosures relevant to this article were reported.
Drs. Verweyen and Pickering contributed equally to this work.Address correspondence to Grant Schulert, MD, PhD, or Emely Verweyen, PhD,
Cincinnati Children’s Hospital Medical Center, 3333 Burnet Avenue, Cincinnati, OH 45229. Email: [email protected] or [email protected].
Submitted for publication October 29, 2020; accepted in revised form January 4, 2021.

GENE SIGNATURES ASSOCIATED WITH RESPONSE TO CANAKINUMAB IN SYSTEMIC JIA PATIENTS | 1335
activation syndrome (MAS), which can lead to multiorgan dysfunc-tion and death. This complication is pathogenically driven by up- regulated type II interferon- γ (IFNγ) and IL- 18, and recent evidence also points to a role of type I IFNs as drivers of IL- 18 expression in systemic JIA– associated MAS (7,8). Children with systemic JIA are also at risk for chronic lung disease (systemic JIA– associated LD), which has only emerged over the last few years and is temporally associated with the introduction of biologic treatments (9,10).
Based on the role of IL- 1 and IL- 6 in systemic JIA, biologic drugs that target these up- regulated proinflammatory cytokines have been tested and validated, with beneficial outcomes in the majority of patients (11,12). First- line therapy for systemic JIA includes anakinra (a recombinant human IL- 1 receptor antagonist) and canakinumab (a selective monoclonal antibody that binds to IL- 1β), which effectively neutralize downstream IL- 1β signal-ing pathways (13). However, some patients fail to respond to IL- 1 blockade but instead respond to IL- 6 blockade, and, given the emerging evidence for a “window of opportunity” in the treatment of systemic JIA, tools such as gene expression profiling to predict response (or nonresponse) is of crucial importance.
The previously published clinical trial of canakinumab pro-vides a unique opportunity to define gene expression signatures in a large cohort of patients with a range of clinical responses (14). Previous analysis of these gene expression microarrays by Bra-chat and colleagues highlighted a strong up- regulation of innate immune system genes at baseline, with more severely dysregu-lated profiles that rapidly declined in some canakinumab respond-ers, while nonresponders in general had more muted dysregulation not affected by treatment (15). However, this was not a consistent finding and was not further characterized. Here, we reanalyzed the gene expression data examining extreme phenotypes of canaki-numab nonresponse (≤30% improvement in the American College of Rheumatology [ACR] JIA response criteria [ACR30] on day 15 posttreatment [16]) compared to strong clinical response (≥90% improvement in the ACR JIA response criteria [ACR90]).
Based on this, we were able to characterize a baseline gene signature specific for strong clinical response that was consist-ent with proinflammatory and neutrophil dysregulation. We also defined a signature specific for canakinumab nonresponse, which included CD163, a marker of regulatory monocytes and mac-rophages. Finally, we identified a bimodal IFN response gene signature that was activated in a subset of patients treated with canakinumab. Taken together, findings about these signatures provide key clues to molecular predictors of treatment response in systemic JIA patients.
PATIENTS AND METHODS
Patients and study design. This study is a secondary analysis of gene expression profiles from patients with systemic JIA from 2 phase III trials evaluating canakinumab treatment (Clini-calTrials.gov identifiers: NCT00886769 [trial 1] and NCT00889863
[trial 2]), conducted by the members of the Pediatric Rheumatol-ogy International Trials Organization and the Pediatric Rheumatol-ogy Collaborative Study Group. Study design, including eligibility criteria and ethics approval, has previously been described (14,15). Blood samples from 86 systemic JIA patients and 22 healthy con-trols were collected at baseline and on day 3 after treatment for RNA isolation. Neutrophil counts from whole blood were collected at baseline and on day 15, and serum IL- 18 levels were measured at baseline and on day 29.
Gene transcription profiles and multidimensional scaling (MDS) plots. Raw CEL files were downloaded from the Gene Expression Omnibus (accession no. GSE80060) and were preprocessed and annotated using the crossmeta Bioconductor package (17). Mixed- effects differential expression analyses were performed using the duplicate correlation function from the limma Bioconductor package with subject as a random effect (18,19). Differentially expressed probes were identified as those with a false discovery rate (FDR) of ≤0.05. Overrepresented gene ontol-ogies were identified using the goana function from limma (unad-justed P value <10−5) and further summarized with REVIGO (20). For limma MDS plots, the remef R package was used to remove the subject effect from limma preprocessed log- expression value (21).
Transcriptional response to canakinumab. The early transcriptional response to canakinumab was evaluated by comparing gene expression values in patients with systemic JIA on day 3 after treatment with the values measured at base-line. Patient response was previously measured using the ACR pediatric criteria response on day 15 after treatment (15). Patients with a strong clinical response were defined as meeting ACR90, with ≥90% improvement in ≥3 of 6 core criteria, >30% worsening in ≤1 core criterion, and no intermittent fever during the last 7 days. Patients with a nonresponse to treatment were defined as those meeting ACR30, with ≤30% improvement in ≥3 of 6 core criteria and >30% worsening in ≤1 core criterion (16). In total, 86 patients were analyzed, of which 26 were categorized as having a strong clinical response, 34 as having an intermediate response, and 26 as having a nonresponse.
RESULTS
Canakinumab responders characterized by a dis tinct gene expression signature. Children with systemic JIA and a strong clinical response to canakinumab (i.e., those meeting ACR90) had a baseline gene signature distinct from nonrespond-ers (i.e., those meeting ACR30), which highlights molecular differ-ences in these 2 groups before and after treatment. As previously suggested (15), strong clinical responders had a more dysregu-lated transcriptional profile prior to treatment compared to healthy controls (9,629 differentially expressed genes [DEGs] with an FDR of ≤0.05). On the other hand, systemic JIA patients who did

VERWEYEN ET AL 1336 |
not respond well to canakinumab had only 6,017 DEGs prior to treatment.
At baseline, the gene expression signature of strong canaki-numab responders compared to nonresponders was defined by significant up- regulation of transcripts related to neutrophil acti-vation (such as CD177 and CXCL1), IL- 1 signaling (IL1B, IL1R1, IL1RAP, IL1RN) and TNFA, TLR signaling (TLR5, LRG1, TLR8, TLR9), and the inflammasome (NLRC4, AIM2, CASP5). The top 100 significantly up- regulated genes are shown in Supplemen-tary Table 1 (available on the Arthritis & Rheumatology website at http://onlin elibr ary.wiley.com/doi/10.1002/art.41640/ abstract). These proinflammatory immune genes are also reflected in the top overrepresented Gene Ontology (GO) terms, which include mye-loid leukocyte activation (GO:0002274), inflammatory response (GO:0006954), and cytokine production (GO:0001816) (Figure 1).
After treatment, strong clinical responders demonstrated a significant decrease in the expression of the gene signature composed of genes related to IL- 1, TLRs, and inflammasome and neutrophil activation. Three days after canakinumab treat-ment, the gene profile in systemic JIA patients was reduced to
a level similar to that in healthy controls (Figure 2A). The strongly overrepresented neutrophil activation pathways observed on day 1 (Supplementary Table 2, http://onlin elibr ary.wiley.com/doi/10.1002/art.41640/ abstract) were no longer among the top up- regulated GO pathways on day 3 (data not shown). Non-responders presented with a much more modest change in gene expression, which was barely affected by canakinumab treatment. Moderate responders (ACR50– 70), correspondingly, showed an intermediate displacement of their gene expression profile upon treatment that was more similar to that of healthy controls (Figure 2A).
Substantially increased neutrophil counts and serum IL- 18 levels in patients with a strong clinical response. Strong clinical responders had significantly higher numbers of absolute neutrophils at baseline compared to non-responders, which were substantially decreased by day 15 after canakinumab treatment (Figure 2B). Neutrophil counts varied linearly with ACR response criteria score both at base-line and after treatment.
Figure 1. REVIGO gene ontology treemap highlights up- regulated pathways in systemic juvenile idiopathic arthritis patients with a strong clinical response to canakinumab compared to nonresponders. Colors show superclusters, and box sizes indicate the strength of the P value, with larger sizes reflecting higher statistical significance (19).

GENE SIGNATURES ASSOCIATED WITH RESPONSE TO CANAKINUMAB IN SYSTEMIC JIA PATIENTS | 1337
As noted above, neutrophil activity was also highly rep-resented within the top 15 GO pathways observed in strong clinical re sponders at baseline, compared to nonresponders (Supplemen tary Table 2, http://onlin elibr ary.wiley.com/doi/10. 1002/art.41640/ abstract). Consistent with previous findings (15), IL- 18, thought to be a key driver of systemic JIA– associated MAS and systemic JIA– associated LD, was also significantly increased in the serum of responders (though IL18 gene expression was unchanged; data not shown) compared to nonresponders on day 3 and remained significantly elevated even after 29 days of treatment (Figure 2C).
Sustained up- regulation of CD163 gene expression in nonresponders compared to strong clinical responders. Next, we defined the transcriptional signature associated with canakinumab nonresponse by identifying genes differentially expressed in the same direction in nonresponders versus strong responders at baseline and on day 3 (i.e., those genes whose expression did not change with canakinumab treatment). This approach identified 14 probes, corresponding to 3 genes that were consistently down- regulated in nonresponders and 8 genes that were consistently up- regulated in nonresponders compared
to strong clinical responders (Supplementary Table 3, http://online libr ary.wiley.com/doi/10.1002/art.41640/ abstract). The most notable of these was CD163 (Figure 2D), which is expressed on regula-tory monocytes after induction by IL- 10 and is also a key marker for hemophagocytic macrophage differentiation present in sys-temic JIA– associated MAS (22). In addition, and in marked con-trast to the neutrophil signature discussed above, expression of CD163 did not significantly change after canakinumab treatment. Taken together, this supports the notion of detection of myeloid phenotypes present in systemic JIA that can distinguish canaki-numab nonresponse from strong response.
Up- or down- regulation of a type I IFN gene signature in canakinumab- treated patients with sys-temic JIA. Finally, we examined changes in the IFN response signature upon canakinumab treatment, using a previously established module representing type I IFN genes (23). Previ-ous studies have suggested a link between IL- 1 blockade and up- regulation of type I IFN genes (2,24). Here, when all patients were assessed and compared to untreated healthy controls, IL- 1β blockade did not significantly up- regulate IFN response genes (data not shown). However, when we examined this more
Figure 2. Canakinumab responders demonstrate a strong shift in their gene signature toward those of healthy controls. A, Multidimensional scaling (MDS) plots of gene signatures among patients with an American College of Rheumatology juvenile idiopathic arthritis improvement response score between 0 and 30 (ACR0 and 30) (yellow, n = 26 subjects), ACR50 and 70 (red, n = 34 subjects), or ACR90 and 100 (blue, n = 26 subjects), compared to healthy controls (gray, n = 22 subjects). Arrows indicate the change in MDS coordinates after treatment. B, Absolute neutrophil (ABSNEU) counts measured at baseline and on day 15 after treatment, according to ACR response criteria score (from 0 [yellow] to 100 [blue]). C, Serum interleukin- 18 (IL- 18) levels measured on days 3 and 29 after treatment, according to ACR response criteria score (from 0 [yellow] to 100 [blue]). D, CD163 gene expression measured by microarray in healthy controls and in canakinumab- treated patients at baseline and on day 3, according to ACR response criteria score (from 0 [yellow] to 100 [blue]).

VERWEYEN ET AL 1338 |
granularly, we found that irrespective of treatment response, indi-vidual patient responses diverged, with a subset demonstrating an up- regulation of the IFN signature (clusters A and C) and others demonstrating down- regulation of the IFN signature (clusters B and D) (Figure 3). While both up- regulation and down- regulation were observed in canakinumab nonresponders and patients with a strong clinical response, the effect was more robust in both directions in patients with a strong clinical response (Figure 3). The persistence of this up- regulation, and any association with disease complications, is unknown.
DISCUSSION
Use of patient gene expression profiling can be a powerful tool in identifying molecular mechanisms associated with disease. Moreover, comparison of expression profiles in patients before and after treatment with a cytokine inhibitor such as canakinumab allows for unique insight into the molecular effects of such drugs and the potential to identify predictive signatures of strong clinical response or failure. Here, we reanalyzed previously collected gene expression data from 2 phase III trials evaluating canakinumab in systemic JIA patients in order to characterize the signature associ-ated with extreme phenotypes of clinical response: strong response (meeting ACR90) and nonresponse (meeting ACR30) (15).
As previously noted by Brachat and others, we observed that the baseline (pretreatment) blood transcriptional profile in sys-temic JIA patients is strongly enriched for the IL- 1 pathway, vari-ous TLRs, and inflammasome and neutrophil activation pathways (15). However, this gene expression profile was significantly more
dysregulated pretreatment in those with a strong response to canakinumab than in nonresponders. In contrast to the find-ings of Brachat et al, the transcriptional effects we observed in patients with a strong clinical response (meeting ACR90) are con-sistent and significant. Patients with a strong clinical response also showed striking movement of this gene signature toward the levels in healthy controls, while expression levels of this gene signature in nonresponders barely shifted upon canakinumab treatment. These observations highlight that IL- 1 blockade quickly normalizes gene expression in systemic JIA patients who have the most severely dysregulated IL- 1– and neutrophil- predominant blood gene expression profile at baseline.
In contrast to the IL- 1– driven signature characterizing strong clinical response, we found 11 genes that characterized nonre-sponse, which had not been identified by Brachat and colleagues (15). These genes were significantly differentially expressed in the nonresponders compared to the patients with a strong clini-cal response and did not change expression after canakinumab treatment. Most genes we found to be functionally unrevealing; however, we identified CD163 as being significantly more highly expressed at baseline in the nonresponders compared to both patients with a strong clinical response and healthy controls. CD163 is up- regulated in systemic JIA and is a known marker for IL- 10– polarized regulatory macrophages as well as hemophago-cytic macrophages associated with systemic JIA– associated MAS (22). The up- regulation of CD163 in these systemic JIA patients suggests that IL- 1– independent pathways induce CD163, includ-ing the presence of a resolution monocyte phenotype and poten-tially contributing to hemophagocyte differentiation as a defining feature of systemic JIA– associated MAS (25). In fact, previous findings have shown that CD163 messenger RNA levels nega-tively correlate with IL- 1 levels (26). Taken together, these findings support a hypothesis that patients defined by this alternative gene signature may instead benefit from other biologic treatments that target alternative pathways, such as tocilizumab (anti– IL- 6R) or JAK/STAT inhibitors (27).
Neutrophils and neutrophil gene signatures are known to be elevated in systemic JIA patients (2,3,5), and elevated neutro-phil counts have previously been suggested to predict treatment response to anti– IL- 1 therapy with anakinra (6). Our cohort also demonstrated that higher blood neutrophil counts were associated with stronger clinical response to canakinumab. Consistent with previous findings in anakinra- treated systemic JIA patients (28), responders had significantly increased up- regulated neutrophil genes (particularly CD177) compared to nonresponders. However, it is unlikely that increased cell numbers are solely responsible for driving the whole- blood transcriptional profile in systemic JIA, as we and others have shown that purified neutrophils demonstrate a TLR- driven proinflammatory gene expression signature (3).
We next investigated IL- 18, which is strongly expressed in neutrophils and monocytes from systemic JIA patients, with corresponding increased serum IL- 18 levels (29). Interestingly,
Figure 3. Canakinumab- treated systemic juvenile idiopathic arthritis (JIA) patients demonstrate either up- or down- regulation of a type I interferon (IFN) gene signature. Heatmap shows the fold change (+3 to −3) in expression of type I IFN genes from day 0 to day 3 after treatment in nonresponders (American College of Rheumatology [ACR] JIA improvement response score 0–30) and strong clinical responders (ACR JIA improvement response score 90–100). Most patients, regardless of response, showed either up- or down- regulation of this signature.

GENE SIGNATURES ASSOCIATED WITH RESPONSE TO CANAKINUMAB IN SYSTEMIC JIA PATIENTS | 1339
serum IL- 18 levels were up- regulated in responders compared to nonresponders on both day 3 and day 29 after treatment. However, this was not reflected by increased IL18 gene expres-sion in either the responders or nonresponders compared to healthy controls, suggesting that here, IL- 18 may be produced primarily by nonhematopoietic cells. Strong elevation of serum IL- 18 levels particularly distinguishes the severe complications systemic JIA– associated MAS and systemic JIA– associated LD (8,10). To date, it remains unclear which pathways drive the overproduction of IL- 18 in systemic JIA, though recent evidence points to type I IFNs regulating IL- 18 expression (7).
When we investigated a type I IFN signature composed of 24 genes (23), we found that patients could be divided evenly into 2 clusters: regardless of clinical response, canakinumab treatment induced either up- or down- regulation of this IFN sig-nature. However, strong clinical responders showed a much stronger reaction, in either direction, upon treatment compared to nonresponders, which was consistent with the low over-all movement observed in nonresponders. We did not observe differences between healthy controls and systemic JIA patients at baseline (data not shown).
There is significant cross- talk between IL- 1β and type I IFNs, and IL- 1β has been shown to potently antagonize type I IFN transcription and translation (30). Thus, it is conceivable that IL- 1 blockade, which is commonly used to treat systemic JIA, enables increased signaling of type I IFN pathways which further increases IL- 18 and IFNγ reactivity in some patients.
In fact, previous studies have observed increased type I IFN gene expression in patients treated with IL- 1 blockade (2,24). Similar to our findings, Rice and colleagues reported that only 6 of 10 systemic JIA patients treated with IL- 1 block-ade showed an up- regulated type I IFN signature. Further eval-uation is necessary to explore why we and others found that only some patients reacted with an increased IFN response. As recent evidence associates the development of systemic JIA– associated LD with the use of biologic treatment and increased IFN- related gene expression in the lungs (10,31), understanding why some patients react to canakinumab by demonstrating an up- regulation of the type I IFN signature, and whether this primes them to develop systemic JIA compli-cations, will need to be evaluated in future studies.
Taken together, our findings highlight a role for severe dys-regulation of proinflammatory genes and immune pathways that present a target for canakinumab in canakinumab responders. However, our findings are limited by the lack of a suitable inde-pendent validation cohort, and thus further studies are required to validate and define this profile for prospective utility in a clinical setting. Further studies will also be needed to shed light on the association of type I IFN up- regulation upon canakinumab treat-ment and the onset of systemic JIA– associated MAS and sys-temic JIA– associated LD.
AUTHOR CONTRIBUTIONS
All authors were involved in drafting the article or revising it critically for important intellectual content, and all authors approved the final version to be published. Dr. Verweyen had full access to all of the data in the study and takes responsibility for the integrity of the data and the accuracy of the data analysis.Study conception and design. Grom, Schulert.Acquisition of data. Verweyen, Pickering.Analysis and interpretation of data. Verweyen, Pickering.
REFERENCES 1. Mellins ED, Macaubas C, Grom AA. Pathogenesis of systemic juve-
nile idiopathic arthritis: some answers, more questions [review]. Nat Rev Rheumatol 2011;7:416– 26.
2. Quartier P, Allantaz F, Cimaz R, Pillet P, Messiaen C, Bardin C, et al. A multicentre, randomised, double- blind, placebo- controlled trial with the interleukin- 1 receptor antagonist anakinra in patients with systemic- onset juvenile idiopathic arthritis (ANAJIS trial). Ann Rheum Dis 2011;70:747– 54.
3. Brown RA, Henderlight M, Do T, Yasin S, Grom AA, DeLay M, et al. Neutrophils from children with systemic juvenile idiopathic arthritis exhibit persistent proinflammatory activation despite long- standing clinically inactive disease. Front Immunol 2018;9:1– 14.
4. Ogilvie EM, Khan A, Hubank M, Kellam P, Woo P. Specific gene expression profiles in systemic juvenile idiopathic arthritis. Arthritis Rheum 2007;56:1954– 65.
5. Allantaz F, Chaussabel D, Stichweh D, Bennett L, Allman W, Mejias A, et al. Blood leukocyte microarrays to diagnose systemic onset juvenile idiopathic arthritis and follow the response to IL- 1 blockade. J Exp Med 2007;204:2131– 44.
6. Ter Haar NM, van Dijkhuizen EH, Swart JF, van Royen- Kerkhof A, el Idrissi A, Leek AP, et al. Treatment to target using recombinant interleukin- 1 receptor antagonist as first- line monotherapy in new- onset systemic juvenile idiopathic arthritis: results from a five- year follow- up study. Arthritis Rheumatol 2019;71:1163– 73.
7. Verweyen E, Holzinger D, Weinhage T, Hinze C, Wittkowski H, Pickkers P, et al. Synergistic signaling of TLR and IFNα/β facilitates escape of IL- 18 expression from endotoxin tolerance. Am J Respir Crit Care Med 2020;201:526– 39.
8. Weiss ES, Girard- Guyonvarc’h C, Holzinger D, de Jesus AA, Tariq Z, Picarsic J, et al. Interleukin- 18 diagnostically distinguishes and pathogenically promotes human and murine macrophage activation syndrome. Blood 2018;131:1442– 55.
9. Kimura Y, Weiss JE, Haroldson KL, Lee T, Punaro M, Oliveira S, et al. Pulmonary hypertension and other potentially fatal pulmonary com-plications in systemic juvenile idiopathic arthritis. Arthritis Care Res (Hoboken) 2013;65:745– 52.
10. Schulert GS, Yasin S, Carey B, Chalk C, Do T, Schapiro AH, et al. Systemic juvenile idiopathic arthritis– associated lung dis-ease: characterization and risk factors. Arthritis Rheumatol 2019;71:1943– 54.
11. De Benedetti F, Brunner HI, Ruperto N, Kenwright A, Wright S, Calvo I, et al. Randomized trial of tocilizumab in systemic juvenile idiopathic arthritis. N Engl J Med 2012;367:2385– 95.
12. Pascual V, Allantaz F, Arce E, Punaro M, Banchereau J. Role of inter-leukin- 1 (IL- 1) in the pathogenesis of systemic onset juvenile idio-pathic arthritis and clinical response to IL- 1 blockade. J Exp Med 2005;201:1479– 86.
13. Lachmann HJ, Kone- Paut I, Kuemmerle- Deschner JB, Leslie KS, Hachulla E, Quartier P, et al. Use of canakinumab in the cryopyrin- associated periodic syndrome. N Engl J Med 2009;360:2416– 25.

VERWEYEN ET AL 1340 |
14. Ruperto N, Brunner HI, Quartier P, Constantin T, Wulffraat N, Horneff G, et al. Two randomized trials of canakinumab in systemic juvenileidiopathic arthritis. N Engl J Med 2012;367:2396– 406.
15. Brachat AH, Grom AA, Wulffraat N, Brunner HI, Quartier P, Brik R,et al. Early changes in gene expression and inflammatory proteins insystemic juvenile idiopathic arthritis patients on canakinumab ther-apy. Arthritis Res Ther 2017;19:1– 10.
16. Wallace CA, Giannini EH, Huang B, Itert L, Ruperto N, for theChildhood Arthritis and Rheumatology Research Alliance(CARRA), the Pediatric Rheumatology Collaborative Study Group(PRCSG), and the Paediatric Rheumatology International TrialsOrganisation (PRINTO). American College of Rheumatology pro-visional criteria for defining clinical inactive disease in select cate-gories of juvenile idiopathic arthritis. Arthritis Care Res (Hoboken)2011;63: 929– 36.
17. Pickering A. crossmeta: Cross platform meta- analysis of microarraydata. URL: https://www.bioco nduct or.org/packa ges/relea se/bioc/html/cross meta.html. Bioconductor. 2020.
18. Ritchie ME, Phipson B, Wu D, Hu Y, Law CW, Shi W, et al. Limmapowers differential expression analyses for RNA- sequencing andmicroarray studies. Nucleic Acids Res 2015;43:e47.
19. Smyth GK, Michaud J, Scott HS. Use of within- array replicate spotsfor assessing differential expression in microarray experiments.Bioinformatics 2005;21:2067– 75.
20. Supek F, Bošnjak M, Škunca N, Šmuc T. Revigo summarizesand visualizes long lists of gene ontology terms. PLoS One2011;6:e21800.
21. Hohenstein S, Kliegl R. remef: Remove partial effects. URL: https://github.com/hohen stein/ remef/. GitHub. January 2020.
22. Thornton S, Tan R, Sproles A, Do T, Schick J, Grom AA, et al. A mul-tiparameter flow cytometry analysis panel to assess CD163 mRNA
and protein in monocyte and macrophage populations in hyperin-flammatory diseases. J Immunol 2019;202:1635– 43.
23. Chaussabel D, Quinn C, Shen J, Patel P, Glaser C, Baldwin N,et al. A modular analysis framework for blood genomics studies:application to systemic lupus erythematosus. Immunity 2008; 29:150– 64.
24. Rice GI, Melki I, Frémond ML, Briggs TA, Rodero MP, Kitabayashi N,et al. Assessment of type I interferon signaling in pediatric inflamma-tory disease. J Clin Immunol 2017;37:123– 32.
25. Sakumura N, Shimizu M, Mizuta M, Inoue N, Nakagishi Y, Yachie A.Soluble CD163, a unique biomarker to evaluate the disease activity,exhibits macrophage activation in systemic juvenile idiopathic arthri-tis. Cytokine 2018;110:459– 65.
26. Liu B, Hu B, Shao S, Wu W, Fan L, Bai G, et al. CD163/ hemoglobinoxygenase- 1 pathway regulates inflammation in hematoma surround-ing tissues after intracerebral hemorrhage. J Stroke CerebrovascDis 2015;24:2800– 9.
27. Hausmann JS. Targeting cytokines to treat autoinflammatory dis-eases. Clin Immunol 2019;206:23– 32.
28. Gattorno M, Piccini A, Lasigliè D, Tassi S, Brisca G, Carta S, et al.The pattern of response to anti– interleukin- 1 treatment distinguishestwo subsets of patients with systemic- onset juvenile idiopathicarthritis. Arthritis Rheum 2008;58:1505– 15.
29. Yasin S, Schulert GS. Systemic juvenile idiopathic arthritis and mac-rophage activation syndrome. Curr Opin Rheumatol 2018;30:1.
30. Tian Z, Shen X, Feng H, Gao B. IL- 1β attenuates IFN- αβ- induced antiviral activity and STAT1 activation in the liver: involvement ofproteasome- dependent pathway. J Immunol 2000;165: 3959– 65.
31. Saper VE, Chen G, Deutsch GH, Guillerman PR, Birgmeier J,Jagadeesh K, et al. Emergent high fatality lung disease in systemicjuvenile arthritis. Ann Rheum Dis 2019;78:1722– 31.

1341
Arthritis & RheumatologyVol. 73, No. 7, July 2021, pp 1341–1348© 2021, American College of Rheumatology
L E T T E R S
DOI 10.1002/art.41690
Prophylactic anticoagulation therapy: comment on the article by Henderson et al
To the Editor:In the American College of Rheumatology (ACR) guidance
for the management of multisystem inflammatory syndrome in children (MIS- C) in pediatric patients with severe acute respiratory syndrome coronavirus 2, the multidisciplinary Task Force provides a very rational approach to the management of this condition (1). There is, however, one area in which we are in disagreement.
The guidance states that anticoagulation therapy is advised only in patients with a coronary artery aneurysm (z- score >10.0) and should be considered in patients with moderate or severe left ventricular dysfunction (ejection fraction <35%) (1). This statement is based on experience with analogous pediatric con-ditions, such as Kawasaki disease (KD) and myocarditis, and does not take into account significant abnormalities in the coag-ulation cascade observed in patients with MIS- C (2,3). Moreover, the guidance does not provide any advice regarding the use of prophylactic anticoagulation with low molecular weight heparin (LMWH).
The rate of symptomatic venous thromboembolism among patients ages 13– 20 years included in the national registry of children and adolescents with MIS- C in the US was 7%, and anticoagulation therapy was prescribed in 47% of all patients (87 of 186) (3). In comparison with KD and myocarditis, wide-spread endothelial injury, increased platelet– vessel wall inter-action, and activation of coagulation with increased fibrinogen, d- dimer, factor VIII, and thrombin generation may contribute to the procoagulant state in MIS- C (3– 5). In addition to hemostatic derangements, the presence of systemic inflammatory disease, immobility, and central catheterization may further increase the risk of thromboembolic events in MIS- C.
In our cohort of 21 patients with MIS- C followed up at the Uni-versity Children’s Hospital Ljubljana, all patients (21 of 21 [100%]) had elevated levels of d- dimer upon admission (median 2,297 µg/liter [range 1,289– 14,382]). The median highest recorded d- dimer level was 3,537 µg/liter (range 1,532– 33,422), and it was reached in a mean time of 6.0 days (range 2– 14 days) since the start of the disease. Prophylactic anticoagulation treatment was initiated in all patients with clinical risk factors for venous thromboembo-lism or markedly elevated plasma d- dimer levels in the absence of contraindications according to the International Society on Thrombosis and Haemostasis recommendations (6). In total, 16 of 21 patients (76.2%) received prophylactic anticoagulation
therapy, and the d- dimer level normalized in a mean time of 7.8 days (range 1– 25 days) after initiation of treatment. The prophylac-tic anticoagulation treatment was safe, and there were no notable complications.
Since heparin plays not only an anticoagulant role but also antiinflammatory (7) and immunomodulatory roles and has a possible protective effect on vascular endothelial cell injury, in our opinion, prophylactic anticoagulation with LMWH might play an important role in diminishing endothelial damage and activating coagulation and should be seriously considered in all patients with MIS- C.
We believe that the statement on anticoagulation therapy in the ACR guidance for MIS- C should be revised and that a hema-tologist should be included as a member of the Task Force. Based on the published data and our clinical experience, we propose the use of prophylactic anticoagulation therapy with LMWH (tar-get anti– factor Xa level 0.2– 0.3 IU/ml) in all children with MIS- C in the absence of contraindications until recovery. In patients with extremely elevated d- dimer levels or in cases of rising levels of d- dimer, prophylactic anticoagulation therapy should be intensified at a target anti– factor Xa level of 0.4– 0.5 IU/ml.
Barbara Faganel Kotnik, MD, PhDMojca Zajc Avramovič, MD, PhDLidija Kitanovski, MD, PhDUniversity Children’s Hospital LjubljanaTadej Avčin, MD, PhDUniversity Children’s Hospital Ljubljana
and University of LjubljanaLjubljana, Slovenia
1. Henderson LA, Canna SW, Friedman KG, Gorelik M, Lapidus SK,Bassiri H, et al. American College of Rheumatology clinical guidance for multisystem inflammatory syndrome in children associated with SARS– CoV- 2 and hyperinflammation in pediatric COVID- 19: version 2. Arthritis Rheumatol 2021;73:13– 29. URL: https://onlin elibr ary. wiley.com/doi/epdf/10.1002/art.41616.
2. Dufort EM, Koumans EH, Chow EJ, Rosenthal EM, Muse A, Rowlands J, et al. Multisystem inflammatory syndrome in children in New YorkState. N Engl J Med 2020;383:347– 58.
3. Feldstein LR, Rose EB, Horwitz SM, Collins JP, Newhams MM, SonMB, et al. Multisystem inflammatory syndrome in U.S. children andadolescents. N Engl J Med 2020;383:334– 46.
4. Iba T, Levy JH, Levi M, Connors JM, Thachil J. Coagulopathy of coro-navirus disease 2019 [review]. Crit Care Med 2020;48:1358– 64.
5. Del Borello G, Giraudo I, Bondone C, Denina M, Garazzino S, Linari C, et al. SARS- COV- 2- associated coagulopathy and thromboembolismprophylaxis in children: a single- center observational study. J ThrombHaemost 2021;19:522– 30.
6. Goldenberg NA, Sochet A, Albisetti M, Biss T, Bonduel M, Jaffray J, et al. Consensus- based clinical recommendations and research priorities

LETTERS 1342 |
DOI 10.1002/art.41689
Reply
To the Editor:We thank Dr. Kotnik and colleagues for their comments on
the American College of Rheumatology’s clinical guidance for pediatric patients with MIS- C. The use of anticoagulation therapy in this population remains an intensely debated topic with little clinical evidence to guide treatment decisions. For this reason, the Task Force was only able to achieve consensus in recom-mending anticoagulation therapy in patients with larger coronary artery aneurysms (z- score >10) and significant cardiac dysfunc-tion (ejection fraction <35%) based on the well- established risk of thrombosis in patients with these clinical features (1,2).
Panelists reported significant variability in strategies for anticoagulation therapy in MIS- C, with some centers adopting approaches similar to those recommended by Kotnik et al and others avoiding anticoagulation therapy in most cases. Indeed, results from a recent survey from the International Kawasaki Dis-ease Registry highlighted wide interinstitutional variation in use of anticoagulation therapy for MIS- C (3).
In part, this heterogeneity stems from the lack of evidence on the risk of thrombosis in MIS- C. Complement activation and fea-tures of thrombotic microangiopathy have been documented in MIS- C; however, children with mild symptoms from severe acute respiratory syndrome coronavirus 2 infection display these same abnormalities. It is unclear if this endothelial dysfunction translates into increased rates of macrothrombosis requiring prophylactic or therapeutic anticoagulation (4). While in one study 7% of adoles-cents with MIS- C were reported to have developed deep venous thrombosis or pulmonary embolism, other large cohorts have demonstrated rates closer to 0– 2% (5– 7). This rate of thrombotic events is similar to that observed in children without MIS- C who have central venous lines, and many children with MIS- C require intensive care measures and central venous access (8). d- dimer levels are frequently elevated in MIS- C patients, but it is unclear if this laboratory parameter is directly reflective of hypercoagulability risk. There is some evidence to suggest that d- dimer levels may be elevated in inflammatory conditions without thrombosis (9,10). Further, the lack of data on d- dimer levels in children with profound inflammation makes it difficult to confidently use this parameter to guide anticoagulation therapy. Currently, there are no studies on the efficacy and safety of anticoagulation therapy in MIS- C. Thus, given the limited evidence and significant practice variability, the panel was not able to achieve consensus and provide further rec-ommendations on anticoagulation therapy in MIS- C. The degree
for anticoagulant thromboprophylaxis in children hospitalized for COVID- 19- related illness [review]. J Thromb Haemost 2020;18:3099– 105.
7. Young E. The anti- inflammatory effects of heparin and relatedcompounds [review]. Thromb Res 2008;122:743– 52.
of uncertainty in this area indicates the need for future compara-tive research to provide clarity. As Kotnik and colleagues suggest, expert opinion from a hematologist will be helpful in addressing these questions, and we plan to secure such expertise through a consultant role in subsequent versions of the guidance.
The spectrum of MIS- C is broader than originally believed, with some patients presenting with mild symptoms, such as fever, rash, and elevated levels of inflammation markers. The risks of anticoagulation therapy may outweigh the benefits in patients with mild disease and no other risk factors for thrombo-sis. Until further high- quality evidence is available, the approach to anticoagulation therapy in MIS- C should be tailored to the individual patient, with critical disease, immobility, adolescent age, history of predisposing conditions, and indwelling central lines all increasing the risk of a thrombotic event and therefore emphasizing the likely benefit of anticoagulation therapy.
Supported by the American College of Rheumatology. Dr. Henderson has received consulting fees from Sobi and Pfizer (less than $10,000) and research support from the Childhood Arthritis and Rheumatology Research Alliance. Dr. Canna has received research support from AB2 Bio and IMMvention Therapeutix. Dr. Bassiri owns stock or stock options in CSL Behring. Dr. Schulert has received consulting fees from Novartis and Sobi (less than $10,000 each). Drs. Son and Mehta have received salary support from the Childhood Arthritis and Rheumatology Research Alliance. Dr. Yeung has received consulting fees from Novartis and Eli Lilly. No other disclosures relevant to this letter were reported.
Lauren A. Henderson, MD, MMScKevin G. Friedman, MDMary Beth F. Son, MDBoston Children’s Hospital
and Harvard Medical SchoolBoston, MAKate F. Kernan, MDScott W. Canna, MDUPMC Children’s Hospital of Pittsburgh
and University of Pittsburgh School of MedicinePittsburgh, PAMark Gorelik, MDMorgan Stanley Children’s Hospital
and Columbia UniversityNew York, NYSivia K. Lapidus, MDJoseph M. Sanzari Children’s Hospital at
Hackensack University Medical Center and Hackensack Meridian School of Medicine
Hackensack, NJAnne Ferris, MBBSColumbia University Irving Medical CenterNew York, NYGrant S. Schulert, MDCincinnati Children’s Hospital Medical Center
and University of Cincinnati College of MedicineCincinnati, OHPhilip Seo, MD, MHSJohns Hopkins University School of MedicineBaltimore, MDAdriana H. Tremoulet, MD, MASRady Children’s Hospital
and University of California San DiegoRae S. M. Yeung, MD, PhD

LETTERS | 1343
tolerance and by the production of multiple autoantibodies. Although the mechanism of SLE has remained elusive, accumu-lating evidence indicates that altered follicular helper T (Tfh) cell differentiation, function, and regulation may play important roles in SLE pathogenesis (1– 3). Tfh cells are a subset of CD4+ T cells, the main function of which is to regulate the clonal selection of germinal center B cells and to promote immunoglobulin produc-tion, isotype switching, and somatic hypermutations in B cells (4). Some studies have found that Tfh cells secrete some soluble cytokines, including interleukin- 21 (IL- 21) and interferon- γ (IFNγ), which contribute to autoantibody production and play a patho-genic role in lupus (5– 7). However, how IL- 21 and IFNγ are regu-lated in Tfh cells in lupus remains to be clarified.
We read with great interest the article by Dong et al on the role of STAT4 activation in Tfh cell production of IL- 21 and IFNγ in lupus (8). The authors present exhaustive data demonstrating that type I IFN can maintain STAT4 activation in Tfh cells and Tfh cell production of IL- 21 and IFNγ as the disease in lupus- prone mice progresses. However, we would like to state that Dong and colleagues’ conclusion regarding type I IFN– activated STAT4 regulation of Tfh cell– dependent cytokine and immunoglobulin production in lupus may be exaggerated.
First, in the study by Dong et al (8), we did not see any evidence indicating that immunoglobulin production is dependent on type I IFN– activated STAT4 regulation of Tfh cells in lupus, although it has been accepted that Tfh cells are required for autoantibody produc-tion (4). Instead, their data showed that blockade of type I IFN sign-aling by anti– IFNα receptor 1 (anti– IFNAR- 1) decreases percentages and numbers of Tfh cells but increases production of immunoglob-ulin and autoantibodies in lupus- prone mice. These results seem to be contradictory with the title and conclusion of this article.
Second, Dong and colleagues found that IFNβ can pro-mote more significant phosphorylation of STAT4 in splenic Tfh cells and Th1 cells at a later stage of disease compared to the predisease stage (8). However, we wonder why the authors did not further investigate the role of IFNβ in regulating IL- 21 and IFNγ production by splenic Tfh cells and Th1 cells by direct stimulation with IFNβ. Instead, they used anti– IFNAR- 1 to indirectly reflect the effect of type I IFN signaling on Tfh cell production of IL- 21 and IFNγ. Furthermore, their data indicated that chromatin accessibility at the IL21 and IFng loci is not influenced by the blockade of type I IFN signaling. This suggests that down- regulation of IL- 21 and IFNγ in Tfh cells by anti– IFNAR- 1 may be mainly due to reduced numbers of Tfh cells, but not due to altered STAT activation by type I IFN signaling. In addition, Dong et al did not determine if STAT4 activation is required for Tfh cell production of IL- 21 and IFNγ by direct inhibition of STAT4 in lupus, although it has been reported that STAT4 and T- bet can regulate Tfh cell production of these 2 cytokines in viral infections (9). However, as we know, STAT3 is also a major signaling molecule for IL- 21 (2). As such, it is unclear whether IL- 21 and IFNγ production are dependent on type I IFN– activated STAT4 regulation of Tfh cells in lupus.
The Hospital for Sick Children and University of Toronto
Toronto, Ontario, CanadaDavid R. Karp, MD, PhDUniversity of Texas Southwestern Medical CenterDallas, TXHamid Bassiri, MD, PhDEdward M. Behrens, MDJay J. Mehta, MDChildren’s Hospital of Philadelphia
and University of PennsylvaniaPerelman School of Medicine
1. Friedman KG, Gauvreau K, Hamaoka- Okamoto A, Tang A, BerryE, Tremoulet AH, et al. Coronary artery aneurysms in Kawasakidisease: risk factors for progressive disease and adverse cardiacevents in the US population. J Am Heart Assoc 2016;5:e003289.
2. Giglia TM, Massicotte MP, Tweddell JS, Barst RJ, Bauman M,Erickson CC, et al. Prevention and treatment of thrombosis in pedi-atric and congenital heart disease: a scientific statement from theAmerican Heart Association. Circulation 2013;128:2622– 703.
3. Elias MD, McCrindle BW, Larios G, Choueiter NF, Dahdah N,Harahsheh AS, et al. Management of multisystem inflammatorysyndrome in children associated with COVID- 19: a survey from theInternational Kawasaki Disease Registry. CJC Open 2020;2:632– 40.
4. Diorio C, McNerney KO, Lambert M, Paessler M, Anderson EM,Henrickson SE, et al. Evidence of thrombotic microangiopathy inchildren with SARS- CoV- 2 across the spectrum of clinical presenta-tions. Blood Adv 2020;4:6051– 63.
5. Feldstein LR, Rose EB, Horwitz SM, Collins JP, Newhams MM, SonMB, et al. Multisystem inflammatory syndrome in U.S. children andadolescents. N Engl J Med 2020;383:334– 46.
6. Dufort EM, Koumans EH, Chow EJ, Rosenthal EM, Muse A,Rowlands J, et al. Multisystem inflammatory syndrome in children inNew York State. N Engl J Med 2020;383:347– 58.
7. Valverde I, Singh Y, Sanchez- de- Toledo J, Theocharis P, Chikermane A, Di Filippo S, et al. Acute cardiovascular manifestations in 286children with multisystem inflammatory syndrome associated withCOVID- 19 infection in Europe. Circulation 2021;143:21– 32.
8. DiPietro LM, Gaies M, Banerjee M, Donohue JE, Zhang W, DeSenaHC, et al. Central venous catheter utilization and complications inthe pediatric cardiac ICU: a report from the Pediatric Cardiac CriticalCare Consortium (PC4). Pediatr Crit Care Med 2020;21:729– 37.
9. Minoia F, Davì S, Horne A, Demirkaya E, Bovis F, Li C, et al. Clinicalfeatures, treatment, and outcome of macrophage activation syndromecomplicating systemic juvenile idiopathic arthritis: a multinational, mul-ticenter study of 362 patients. Arthritis Rheumatol 2014;66:3160– 9.
10. Borowiec A, Dąbrowski R, Kowalik I, Rusinowicz T, Hadzik- Błaszczyk M, Krupa R, et al. Elevated levels of d- dimer are associated withinflammation and disease activity rather than risk of venous throm-boembolism in patients with granulomatosis with polyangiitis in longterm observation. Adv Med Sci 2020;65:97– 101.
DOI 10.1002/art.41715
Understanding the relationships between type I interferon, STAT4, and the production of interleukin 21 and interferon-γbyfollicularhelperTcellsinlupus:commenton the article by Dong et al
To the Editor:Systemic lupus erythematosus (SLE) is the prototype of
systemic autoimmune diseases, characterized by loss of self

LETTERS 1344 |
DOI 10.1002/art.41717
Reply
To the Editor:We write in response to Ms Chen and colleagues. We would
first like to address their argument that our conclusions “may
Taken together, from Dong and colleagues’ results (8), we see that type I IFN can promote STAT4 phosphorylation in Tfh cells and IFNAR blockade can decrease percentages and numbers of Tfh cells, as well as IL- 21 and IFNγ production in lupus- prone mice. Nev-ertheless, their conclusion that Tfh cell production of IL- 21, IFNγ, and immunoglobulin is dependent on type I IFN– activated STAT4 regula-tion of Tfh cells may be exaggerated and possibly even misleading.
Caiqun Chen Huangyan Hospital of
Wenzhou Medical University Wenzhou, China
and Taizhou First People’s Hospital Zhejiang, China
Yan Liang, MDChangzheng Hospital
Second Military Medical UniversityShanghai, ChinaZaixing Yang, MDHuangyan Hospital of
Wenzhou Medical University Wenzhou, China
and Taizhou First People’s Hospital Zhejiang, China
1. Gensous N, Schmitt N, Richez C, Ueno H, Blanco P. T follicular helper cells, interleukin- 21 and systemic lupus erythematosus [review].Rheumatology (Oxford) 2017;56:516– 23.
2. Sawaf M, Dumortier H, Monneaux F. Follicular helper T cells in systemic lupus erythematosus: why should they be considered as interestingtherapeutic targets? [review]. J Immunol Res 2016;2016:5767106.
3. Seth A, Craft J. Spatial and functional heterogeneity of follicular helper T cells in autoimmunity [review]. Curr Opin Immunol 2019; 61:1– 9.
4. Crotty S. T follicular helper cell biology: a decade of discovery anddiseases [review]. Immunity 2019;50:1132– 48.
5. Peng SL, Moslehi J, Craft J. Roles of interferon- γ and interleukin- 4 inmurine lupus. J Clin Invest 1997;99:1936– 46.
6. Miyake K, Nakashima H, Akahoshi M, Inoue Y, Nagano S, Tanaka Y, et al.Genetically determined interferon- γ production influences the histologicalphenotype of lupus nephritis. Rheumatology (Oxford) 2002;41:518– 24.
7. Herber D, Brown TP, Liang S, Young DA, Collins M, Dunussi-Joannopoulos K. IL- 21 has a pathogenic role in a lupus- prone mousemodel and its blockade with IL- 21R.Fc reduces disease progression.J Immunol 2007;178:3822– 30.
8. Dong X, Antao OQ, Song W, Sanchez GM, Zembrzuski K,Koumpouras F, et al. Type 1 interferon– activated STAT4 regulation offollicular helper T cell- dependent cytokine and immunoglobulin pro-duction in lupus. Arthritis Rheumatol 2021;73:478– 89.
9. Weinstein JS, Laidlaw BJ, Lu Y, Wang JK, Schulz VP, Li N, et al.STAT4 and T- bet control follicular helper T cell development in viralinfections. J Exp Med 2018;215:337– 55.
be exaggerated and possibly even misleading.” We argue that the conclusions in our work are scientifically justified by our data and previous publications. We have demonstrated that STAT4 is required by Tfh cells for the production of IL- 21 and IFNγ during a viral infection (1). Ironically, Chen et al “petar” (2) one of their central arguments by citing one of our articles (1). Expanding on our previously published work, we demonstrated in our current study (3) that type I IFN activates STAT4 in Tfh cells, suggest-ing its role in promoting IL- 21 and IFNγ secretion via STAT4 in lupus. We found that although coproduction of IL- 21 and IFNγ is maintained in Tfh cells in lupus despite progressive loss of Bcl6 and T- bet expression, phosphorylation of STAT4 continued to increase upon type I IFN stimulation (3). Furthermore, as dis-ease progressed, transcriptional analysis revealed that Tfh cells up- regulated type I IFN– driven gene transcription and acquired an enhanced STAT4 gene signature (3). STAT4 binds and pro-motes the regulation of IL21 and Ifng during CD4 T cell differ-entiation (4). We went on to demonstrate, using an assay for transposase- accessible chromatin with sequencing analysis of Tfh cells after in vivo blockade of type I IFN in lupus- prone mice, that the IL21 and Ifng loci remain accessible in the absence of type I IFN signaling, yet IL- 21 and IFNγ production was reduced (3). This suggested that in the absence of type I IFN, STAT4 could not be activated and bind to these open loci to maintain Tfh cell cytokine production. Taken together, these findings indicate that type I IFN signaling through STAT4 in Tfh cells maintains IL- 21 and IFNγ production in lupus.
Chen and colleagues also noted that in our study (3), they did not find any evidence “indicating that immunoglobulin production is dependent on type I IFN– activated STAT4 regulation of Tfh cells in lupus”. Tfh cells provide cytokines to B cells, among them IL- 21 and IFNγ, the latter of which drives isotype switching to IgG2a(c). Yet, in situations where T helper cell IFNγ is limited, IgG1 is produced (1,5,6). This concept was recapitulated when we used an anti– IFNAR-1 antibody to inhibit type I IFN signaling in lupus- prone mice, leading to altered IL- 21 and IFNγ production by Tfh cells and, not surprisingly, in turn, altered isotype switching from IgG2c to IgG1 (3). Anti– IFNAR- 1 blockade reduced Tfh cell percentages and num-bers, but they were not ablated (3). Despite the reduced numbers of Tfh cells and altered cytokine profiles, the persistence of germi-nal centers (GCs) and IgG1 isotype autoantibodies after treatment substantiates the idea that these cells still function in the ongoing GC response (3) characteristic of lupus. While IgG2c autoantibodies were still produced, these were likely generated by existing plasma cells or those reliant on Tfh cells that retained their IFNγ produc-tion after treatment. Thus, the immunoglobulin and Tfh cell cytokine response is regulated by type I IFN signaling.
We believe our previous and current work provide strong evidence to support our conclusion that type I IFN continues to activate STAT4 in Tfh cells maintaining IL- 21 and IFNγ pro-duction, thus regulating autoantibody production throughout the lupus disease course.

LETTERS | 1345
Joe Craft, MDYale University School of MedicineNew Haven, CTJason Weinstein, PhDRutgers New Jersey Medical SchoolNewark, NJ
1. Weinstein JS, Laidlaw BJ, Lu Y, Wang JK, Schulz VP, Li N, et al.STAT4 and T- bet control follicular helper T cell development in viralinfections. J Exp Med 2018;215:337– 55.
2. Shakespeare W. Hamlet, prince of Denmark: act III, scene iv. In:Jaggard I, Blount E, editors. Mr. William Shakespeare’s comedies,histories, & tragedies: published according to the true originall copies. London; 1623.
3. Dong X, Antao OQ, Song W, Sanchez GM, Zembrzuski K,Koumpouras F, et al. Type 1 interferon– activated STAT4 regulation offollicular helper T cell- dependent cytokine and immunoglobulin pro-duction in lupus. Arthritis Rheumatol 2021;73:478– 89.
4. Nakayamada S, Kanno Y, Takahashi H, Jankovic D, Lu KT, JohnsonTA, et al. Early Th1 cell differentiation is marked by a Tfh cell- like tran-sition. Immunity 2011;35:919– 31.
5. Finkelman FD, Katona IM, Mosmann TR, Coffman RL. IFN- gammaregulates the isotypes of Ig secreted during in vivo humoral immuneresponses. J Immunol 1988;140:1022– 7.
6. Peng SL, Szabo SJ, Glimcher LH. T- bet regulates IgG class switching and pathogenic autoantibody production. Proc Natl Acad Sci U S A2002;99:5545– 50.
DOI 10.1002/art.41698
Temporal arteritis revealing antineutrophil cytoplasmic antibody– associated vasculitides: are the visual out comes different from giant cell arteritis? Comment on the article by Delaval et al
To the Editor:The article by Delaval et al clearly highlights the differences in
clinical manifestations and temporal artery biopsy (TAB) findings
between patients with temporal arteritis revealing antineutro-phil cytoplasmic antibody– associated vasculitides (TA- AAV) and patients with giant cell arteritis (GCA) (1). However, the differences in visual outcomes, if any, are not reported. Since visual outcomes in GCA are generally poor and can progress despite treatment, it would be interesting to know the visual outcomes in these patients (2,3). Two of our patients with early TA- AAV had good visual outcomes with treatment.
One patient, a 55- year- old woman, presented with fever, frontotemporal headache, jaw claudication, and sequential painless vision loss in both eyes over 1.5 months. She had no perception of light in the left eye and was able to perceive hand movements close to the face in the right eye. Left-side TAB showed evidence of arteritis without the presence of giant cells (Figure 1). Extracephalic manifestations included nasal crusting, sensorineural hearing loss, pauci- immune crescentic glomerulo-nephritis, and peripheral neuropathy. Titers of myeloperoxidase– antineutrophil cytoplasmic antibodies (ANCAs) were high, and the erythrocyte sedimentation rate was elevated. Granuloma-tosis with polyangiitis (GPA) with TA was diagnosed, and the patient received steroids and intravenous (IV) cyclophosphamide (CYC). Visual acuity in the right eye improved immediately and was recorded to be 6/9 at 3 months, but vision loss in the left eye persisted. The patient did not experience a relapse of ocular symptoms but developed diabetes mellitus with diabetic kidney disease and died 8 years later due to complications related to chronic kidney disease.
Another patient, a 62- year- old woman, presented with a 1- month history of jaw claudication, 1- week history of left foot drop, and 2- day history of painless vision loss in the right eye. She was able to perceive hand movements close to the face and had a relative afferent pupillary defect and central retinal arterial occlusion on the right side. TAB could not be obtained, but biopsy
Figure 1. A, Temporal artery biopsy (TAB) specimen showing fibrointimal proliferation, with minimal inflammation and fibrin in the adventitia (arrow) and absence of granulomatous inflammation/giant cells with overall features suggestive of arteritis (hematoxylin and eosin stained; original magnification × 20). B, TAB specimen showing a break in the internal elastic lamina (arrow) (elastic–van Gieson stained; original magnification × 20).

LETTERS 1346 |
of the left sural nerve showed the presence of vasculitis. The patient tested positive for ANCAs against proteinase 3. She was diagnosed as having GPA with TA. Symptoms were treated with steroids and IV CYC, her vision recovered to 6/9, and she has not experienced a relapse in 2 years.
Both of our patients were classified as having early TA- AAV, and, as highlighted by Delaval and colleagues, the presence of extracephalic features and ANCA positivity in both patients helped in making an accurate diagnosis and initiating appropri-ate therapy. It is important to note that both patients had good visual outcomes with therapy. It would be interesting to know the visual outcomes in TA- AAV patients in the study by Delaval et al, since it might also be a factor that helps to differentiate TA- AAV from GCA.
Joydeep Samanta, MDGSRSNK Naidu, DMSakshi Mittal, DMRitambhra Nada, MDAmanjit Bal, MDRamandeep Singh, MSVishali Gupta, MSAmod Gupta, MSAman Sharma, MD, FRCPPost Graduate Institute of Medical Education
and ResearchChandigarh, IndiaBenzeeta Pinto, MDSt. John’s Medical CollegeBengaluru, India
1. Delaval L, Samson M, Schein F, Agard C, Tréfond L, Deroux A,et al. Temporal arteritis revealing antineutrophil cytoplasmic antibody– associated vasculitides: a case– control study. Arthritis Rheumatol2021;73: 286– 94.
2. Foroozan R, Deramo VA, Buono LM, Jayamanne DG, Sergott RC,Danesh- Meyer H, et al. Recovery of visual function in patients withbiopsy- proven giant cell arteritis [review]. Ophthalmology 2003;110:539– 42.
3. Danesh- Meyer H, Savino PJ, Gamble GG. Poor prognosis of visualoutcome after visual loss from giant cell arteritis. Ophthalmology2005;112:1098– 103.
DOI 10.1002/art.41695
Biologics for eosinophilic granulomatosis with polyangiitis— one size does not fit all: comment on the article by Canzian et al
To the Editor:We read with great interest the article by Canzian et al on
the use of biologics for the treatment of eosinophilic granuloma-tosis with polyangiitis (EGPA) (1). This study represents the larg-est contribution to date on biologic drug treatment of EGPA in
a community setting. Despite increasing evidence on the topic, obtained both from clinical trials and from other studies of community- based patient populations (2,3), identifying the most appropriate biologic treatment for EGPA remains a challenge. The response to biologics in different patients is quite heterogene-ous (1– 3), and probably depends on organ involvement at EGPA onset, general EGPA disease characteristics (e.g., antineutrophil cytoplasmic antibody status) and comorbidities, dosage and timing of biologic treatment initiation in relation to EGPA phase, and many other potential determinants.
In the report by Canzian et al, the authors do not mention the clinical rationale for prescription of rituximab (RTX) instead of omalizumab (OMA), or for prescription of mepolizumab (MEPO) at 2 different dosages. The patients’ clinical profiles at the time of biologic treatment initiation suggest that RTX was considered in the setting of more severe systemic involvement, while patients with predominantly respiratory manifestations were treated with OMA or MEPO. If this was the case, the choice would be sup-ported by these treatments’ different mechanisms of action: RTX addresses the autoimmunity- mediated inflammation that sustains the systemic vasculitis pattern, whereas MEPO and, to a lesser extent, OMA, target the eosinophil- driven inflammation typically underlying the respiratory tract manifestations. Responses to treatment seemed to reflect each biologic agent’s mechanism of action. In fact, the authors report persistent severe asthma and/or rhinosinusitis in patients treated with RTX, whereas MEPO pre-vented vasculitis flares and demonstrated a higher steroid- sparing effect; however, the patients treated with MEPO were mostly affected by asthmatic symptoms without much extrarespiratory involvement.
In light of the complex pathogenesis of EGPA, involv-ing numerous factors beyond eosinophils and including more than one potential therapeutic target, it is difficult to define in advance the most appropriate treatment and dosage for each patient. A careful evaluation of both the patient’s clinical and laboratory features and the specific mechanism of action of the different biologic agents used in EGPA could help in achieving the goal.
We recently reported that treatment with MEPO at an “asthma- tailored” dosage of 100 mg every 4 weeks, pre-scribed based on the above approach, prevented vasculitis relapse, maintained asthma control, and exerted a steroid/immunosuppressive- sparing effect in patients with EGPA in remission and persistent, severe, steroid- dependent asthma (4). Our results need to be confirmed, but we believe that future research should be conducted to validate a patient- tailored approach, or at least a clinical pattern– tailored approach, beyond simply demonstrating a general efficacy of biologic drugs in the treatment of EGPA.

LETTERS | 1347
Marco Caminati, MDAlessandro Giollo, MDGianenrico Senna, MDClaudio Lunardi, MDUniversity of Verona
and Verona University HospitalVerona, Italy
1. Canzian A, Venhoff N, Urban ML, Sartorelli S, Ruppert AM,Groh M, et al. Use of biologics to treat relapsing and/or refrac-tory eosinophilic granulomatosis with polyangiitis: data froma European collaborative study. Arthritis Rheumatol 2021;73:498– 503.
2. Olivieri B, Tinazzi E, Caminati M, Lunardi C. Biologics for the treatment of allergic conditions: eosinophil disorders. Immunol Allergy Clin North Am 2020;40:649– 65.
3. Wechsler ME, Akuthota P, Jayne D, Khoury P, Klion A, Langford CA,et al. Mepolizumab or placebo for eosinophilic granulomatosis withpolyangiitis. N Engl J Med 2017;376:1921– 32.
4. Caminati M, Crisafulli E, Lunardi C, Micheletto C, Festi G, MauleM, et al. Mepolizumab 100 mg in severe asthmatic patientswith EGPA in remission phase. J Allergy Clin Immunol Pract2021;9:1386– 8.
DOI 10.1002/art.41676
Sjögren’s disease, not syndrome
To the Editor:Sjögren’s syndrome should henceforth be known as Sjögren’s
disease. Our call for this change is based on the precedent for such name changes in rheumatology, as well as important differ-ences between syndrome and disease. In addition, the struggle faced by Sjögren’s patients to gain recognition for this serious autoimmune disease is difficult when some describe it as a collec-tion of nuisance symptoms.
Sjögren’s is a multisystemic disease that is characterized by its targeting of the salivary and lacrimal glands, leading to impaired secretion of saliva and tears and occasional salivary gland enlargement or recurrent sialadenitis. In 1933, the Swed-ish ophthalmologist Henrik Sjögren published an analysis of 19 patients with a dry eye disease that he termed “keratoconjunc-tivitis sicca” (1). The disease had been recognized earlier, but the eponym was earned based on Sjögren’s comprehensive description and continued study of the disease throughout his lifetime.
Sjögren’s is a distinct autoimmune disease with charac-teristic autoantibodies, glandular histopathology, and a pattern of systemic involvement. Akin to other systemic rheumatic dis-eases, it has defined genetic susceptibility traits and pathogenetic
pathways. Accurate diagnosis using protocol- driven labial sali-vary gland biopsy and interpretation, as well as measures of dry eye and salivary hypofunction, is essential in differentiating this disease from dryness symptoms present in individuals who do not have an underlying autoimmune disease. Accurate diagnosis is also a prerequisite for the development of targeted disease- modifying therapies.
It is against this background that we call for the abandon-ment of “Sjögren’s syndrome” in favor of “Sjögren’s disease,” or simply “Sjögren’s.” Are the differences between “syndrome” and “disease” sufficient to warrant this name change? We believe that they are. A syndrome denotes an aggregate of symptoms and signs that are associated with a morbid pro-cess, independent of pathogenesis (2,3). “Flu- like syndrome” is a good example. Mikulicz disease (4) and sicca syndromes (5) have been used synonymously with Sjögren’s in the past, but each is now recognized as having a broad differential diag-nosis. As the understanding of the etiology and/or pathogen-esis of a particular condition improves, the term “syndrome” is replaced by “disease.” In rheumatology, an example is Kawa-saki syndrome, which is now properly known as Kawasaki dis-ease (KD) (2).
We appreciate the counterargument that rheumatic diseases are often heterogeneous and specific etiologies may be identified in the future for some subsets. This has been exemplified by the recent identification of monogenic causes for variants of polyar-teritis nodosa (6) and relapsing polychondritis (7), as well as the recognition of coronavirus disease 2019 as a potential proximate cause of KD (8).
However, the adoption of “Sjögren’s disease” in lieu of “Sjögren’s syndrome” would solidify the concept that it is a dis-ease for which targeted therapies are being actively developed. For those affected, it also emphasizes that this is a distinct entity deserving of accurate diagnosis, careful study, and comprehen-sive management.
Dr. Baer’s work was supported by the Jerome L. Greene Foundation.
Alan N. Baer, MDJohns Hopkins University School of Medicine Baltimore, MDKatherine M. Hammitt, MASjögren’s FoundationReston, VA
1. Sjögren H. Zur kenntnis der Keratoconjunctivitis sicca (keratitis fili-formis bei hypofunktion der tränendrüsen). Acta Ophthalmol (Copenh) 1933;11 Suppl 2:1– 151.
2. Calvo F, Karras BT, Phillips R, Kimball AM, Wolf F. Diagnoses, syn-dromes, and diseases: a knowledge representation problem. AMIAAnnu Symp Proc 2003;2003:802.

LETTERS 1348 |
3. Lenka A, Louis ED. Do we belittle essential tremor by calling it a syn-drome rather than a disease? Yes. Front Neurol 2020;11: 522687.
4. Morgan WS. The probable systemic nature of Mikulicz’s diseaseand its relation to Sjögren’s syndrome. N Engl J Med 1954;251:5– 10.
5. Moutsopoulos HM, Chused TM, Mann DL, Klippel JH, Fauci AS, Frank MM, et al. Sjögren’s syndrome (Sicca syndrome): current issues. AnnIntern Med 1980;92:212– 26.
6. Navon Elkan P, Pierce SB, Segel R, Walsh T, Barash J, Padeh S, et al.Mutant adenosine deaminase 2 in a polyarteritis nodosa vasculopa-thy. N Engl J Med 2014;370:921– 31.
7. Beck DB, Ferrada MA, Sikora KA, Ombrello AK, Collins JC, Pei W,et al. Somatic mutations in UBA1 and severe adult- onset autoin-flammatory disease. N Engl J Med 2020;383:2628– 38.
8. Ravelli A, Martini A. Kawasaki disease or Kawasaki syndrome? [edito-rial]. Ann Rheum Dis 2020;79:993– 5.