Artefacts in the sampling of nitrate studied in the “INTERCOMP” campaigns of EUROTRAC-AEROSOL
10
Atmospheric Environment 38 (2004) 6487–6496 Artefacts in the sampling of nitrate studied in the ‘‘INTERCOMP’’ campaigns of EUROTRAC-AEROSOL M. Schaap a, , G. Spindler b , M. Schulz c , K. Acker d , W. Maenhaut e , A. Berner f , W. Wieprecht d , N. Streit g , K. Mu¨ller b , E. Bru¨ggemann b , X. Chi e , J.-P. Putaud h , R. Hitzenberger f , H. Puxbaum i , U. Baltensperger g , H. ten Brink j a Institute of Marine and Atmospheric Science (IMAU), University of Utrecht, P.O.Box 80005, Princetonpluin 5, 3508 TA Utrecht, The Netherlands, b Leibnitz Institut fu¨r Tropospha¨renforschung e. V. (IFT), Leipzig, Germany c Laboratoire des Sciences du Climat et de l’Environment, Gif-sur-Yvette, France d Brandenburg Technical University (BTU) Cottbus, Berlin, Germany e Institute for Nuclear Sciences, Ghent University (UGent), Gent, Belgium f Institute for Experimental Physics, University of Vienna (UniV), Vienna, Austria g Paul Scherrer Institute (PSI), Villigen, Switzerland h Joint Research Centre (JRC), Ispra, Italy i Institute for Chemical Technologies and Analytics, Vienna University of Technology (TUV), Vienna, Austria j Energy Research Centre of the Netherlands (ECN), Petten, The Netherlands Abstract Sampling of aerosol-nitrate can be problematic because of evaporative loss of the semi-volatile ammonium nitrate or adsorption of nitric acid gas. Such artefacts, which depend on filter type and ambient conditions, are not well documented for the filters in use in Europe and this was the reason to study these in a series of intercomparison trials. The trials were performed within the ‘‘INTERCOMP’’ programme of the AEROSOL subproject of EUROTRAC-2. The major effort was a 2-week field campaign at the rural site of Melpitz, a village near Leipzig in eastern Germany (INTERCOMP2000). Samplers were used containing the most common filter types in use in Europe, i.e. quartz, Teflon, (mixed) cellulose ester and cellulose. The concentration of nitrate in PM2.5, mainly present as ammonium nitrate, was on average 3.3 mgm 3 . The variability in the concentrations stemming from the samplers appeared to be rather constant: 7 0.5 mgm 3 from the average of all samplers. The reason for the constant (but random) variability remains unexplained. Thus, the concentrations stemming from the samplers agreed very well at the average level with relative differences of 15% and less for higher concentrations. This is evidence that the influence of the mentioned artefacts was negligible. The absence is explained by extrapolation of results of tests on the artefacts in a laboratory setting (INTERCOMP99). It was found there that the loss of ammonium nitrate from Teflon and quartz filters is only substantial when temperatures are much higher than those during the field campaign. Cellulose and cellulose-acetate filters quantitatively collected both ammonium nitrate and nitric acid in the laboratory study, but in Melpitz measured nitric acid concentrations were too low to identify its adsorption. Possible artefacts due to adsorption of nitrous acid were negligible. We also used the laboratory information to evaluate the results of a further intercomparison (INTERCOMP98) in the Po-Valley, performed at much higher temperatures than at Melpitz. We found evidence of ARTICLE IN PRESS www.elsevier.com/locate/atmosenv 1352-2310/$ - see front matter r 2004 Elsevier Ltd. All rights reserved. doi:10.1016/j.atmosenv.2004.08.026 Corresponding author. +31-30-253-2212; fax: +31-30-254-3163. E-mail address: [email protected] (M. Schaap).
-
Upload
independent -
Category
Documents
-
view
7 -
download
0
Transcript of Artefacts in the sampling of nitrate studied in the “INTERCOMP” campaigns of EUROTRAC-AEROSOL

ARTICLE IN PRESS
1352-2310/$ - se
doi:10.1016/j.at
�Correspond
E-mail addr
Atmospheric Environment 38 (2004) 6487–6496
www.elsevier.com/locate/atmosenv
Artefacts in the sampling of nitrate studied in the‘‘INTERCOMP’’ campaigns of EUROTRAC-AEROSOL
M. Schaapa,�, G. Spindlerb, M. Schulzc, K. Ackerd, W. Maenhaute, A. Bernerf,W. Wieprechtd, N. Streitg, K. Mullerb, E. Bruggemannb, X. Chie, J.-P. Putaudh,
R. Hitzenbergerf, H. Puxbaumi, U. Baltenspergerg, H. ten Brinkj
aInstitute of Marine and Atmospheric Science (IMAU), University of Utrecht, P.O.Box 80005, Princetonpluin 5, 3508 TA Utrecht,
The Netherlands,bLeibnitz Institut fur Tropospharenforschung e. V. (IFT), Leipzig, Germany
cLaboratoire des Sciences du Climat et de l’Environment, Gif-sur-Yvette, FrancedBrandenburg Technical University (BTU) Cottbus, Berlin, Germany
eInstitute for Nuclear Sciences, Ghent University (UGent), Gent, BelgiumfInstitute for Experimental Physics, University of Vienna (UniV), Vienna, Austria
gPaul Scherrer Institute (PSI), Villigen, SwitzerlandhJoint Research Centre (JRC), Ispra, Italy
iInstitute for Chemical Technologies and Analytics, Vienna University of Technology (TUV), Vienna, AustriajEnergy Research Centre of the Netherlands (ECN), Petten, The Netherlands
Abstract
Sampling of aerosol-nitrate can be problematic because of evaporative loss of the semi-volatile ammonium nitrate or
adsorption of nitric acid gas. Such artefacts, which depend on filter type and ambient conditions, are not well
documented for the filters in use in Europe and this was the reason to study these in a series of intercomparison trials.
The trials were performed within the ‘‘INTERCOMP’’ programme of the AEROSOL subproject of EUROTRAC-2.
The major effort was a 2-week field campaign at the rural site of Melpitz, a village near Leipzig in eastern Germany
(INTERCOMP2000). Samplers were used containing the most common filter types in use in Europe, i.e. quartz, Teflon,
(mixed) cellulose ester and cellulose. The concentration of nitrate in PM2.5, mainly present as ammonium nitrate, was
on average 3.3mg m�3. The variability in the concentrations stemming from the samplers appeared to be rather
constant: 7 0.5mg m�3 from the average of all samplers. The reason for the constant (but random) variability remains
unexplained. Thus, the concentrations stemming from the samplers agreed very well at the average level with relative
differences of 15% and less for higher concentrations. This is evidence that the influence of the mentioned artefacts was
negligible. The absence is explained by extrapolation of results of tests on the artefacts in a laboratory setting
(INTERCOMP99). It was found there that the loss of ammonium nitrate from Teflon and quartz filters is only
substantial when temperatures are much higher than those during the field campaign. Cellulose and cellulose-acetate
filters quantitatively collected both ammonium nitrate and nitric acid in the laboratory study, but in Melpitz measured
nitric acid concentrations were too low to identify its adsorption. Possible artefacts due to adsorption of nitrous acid
were negligible. We also used the laboratory information to evaluate the results of a further intercomparison
(INTERCOMP98) in the Po-Valley, performed at much higher temperatures than at Melpitz. We found evidence of
e front matter r 2004 Elsevier Ltd. All rights reserved.
mosenv.2004.08.026
ing author. +31-30-253-2212; fax: +31-30-254-3163.
ess: [email protected] (M. Schaap).

ARTICLE IN PRESSM. Schaap et al. / Atmospheric Environment 38 (2004) 6487–64966488
adsorption of nitric acid by cellulose filters and evaporational loss of aerosol-nitrate from quartz filters. For the
conditions encountered during the campaign we parameterised the evaporational loss in a general way as a function of
temperature, as follows. There is complete evaporation at temperatures exceeding 25 1C and full retention at
temperatures less than 20 1C. At temperatures between 20 and 25 1C the retention is on average 50%, but with high
variability.
A main conclusion from this study is that under central European conditions quartz is a suitable filter material for
sampling nitrate as long as the temperature does not exceed 20 1C during sampling. Cellulose-type filters quantitatively
collect aerosol nitrate and nitric acid, but negligible amounts of nitrous acid. Teflon filters were more vulnerable for
evaporation losses than quartz. Indications for losses from Teflon below 10 1C (at Melpitz) were not obtained.
r 2004 Elsevier Ltd. All rights reserved.
Keywords: Nitrate; Evaporation; Adsorption; Filter type; Temperature dependence
1. Introduction
Nitrate is a dominant component of fine particulate
mass in western and central Europe (Schaap et al.,
2002). In summer, nitrate concentrations are consis-
tently lower than in winter. This may be a real
phenomenon but it can also be due to evaporation
during sampling of the semi-volatile ammonium nitrate,
the most dominant form in which nitrate is present in
this part of Europe (Ten Brink et al., 1997; Schaap et al.,
2002). The volatilisation artefact depends on the filter
material and ambient meteorological conditions like
temperature and relative humidity (Chow, 1995; Hering
and Cass, 1999). There is a higher evaporative loss in
summer, and the reason is that the evaporative tendency
of ammonium nitrate strongly increases with tempera-
ture and is also higher in drier air. The evaporation
artefact leads to serious underestimation of the true
values, as illustrated in measurements in the Po-valley
(Putaud et al., 2002), which will be further evaluated
below.
Despite of the evaporation artefact the actual nitrate
concentration can also be overestimated depending on
the filter type. Cellulose type aerosol filters, in common
use in Europe, may adsorb nitric acid and possibly
nitrous acid gas which are thus assigned to aerosol
nitrate (Spicer and Schumacher, 1979; Savoie and
Prospero, 1982).
In the past, several studies were performed to
investigate sampling artefacts by the use of different
filter types and samplers (Appel et al., 1979; Eatough et
al., 1988; Dasch et al., 1989; Harrison and Kitto, 1990;
Hering and Cass, 1999; and others). Most of these
studies have been performed in the US, where other
filters are in use than in Europe. Those performed in
northern Europe (Pakkanen et al., 1999) are of less
relevance because the nitrate found there is mainly
present in the form of stable compounds, like NaNO3
(Pakkanen et al., 1999).
In the study reported here we investigated the
mentioned artefacts occurring during sampling of
aerosol nitrate. In the framework of the extensive
INTERCOMP2000 campaign for comparison of aerosol
sampling and establishing proper sampling tools a field
intercomparison took place in Melpitz, near Leipzig.
Melpitz is of particular interest because the station has a
long record of nitrate data. The series shows a rapidly
increasing importance of nitrate relative to sulphate
concentrations in the course of the last decade (Spindler
et al., 1999). Quartz filters are in use at the site. The
campaign provided an opportunity to compare the data
as obtained within the long-term record with those
measured by the participants. Full details of the
INTERCOMP2000 set-up and meteorology can be
found elsewhere in this volume (Muller et al., 2004).
We will only discuss the experimental set-up relevant for
the nitrate sampling.
As a preparation for the field campaign a wind-tunnel
study was performed in 1999 (Ten Brink et al., 2001).
Here conditions like temperature, relative humidity and
concentration of aerosol nitrate and related gases could
be set. We present additional data and a full analysis of
the results of the laboratory study. Furthermore, we
make a full analysis of results of the Po-Valley study of
which set-up and data are provided in Putaud et al.
(2002). All of the campaigns were organised in
the framework of the EUROTRAC-2 AEROSOL
programme.
2. Experimental
2.1. INTERCOMP2000
2.1.1. Site description
In the period of 4–13 April 2000 a field experiment
was conducted at the Melpitz research station (latitude
511320N, longitude 121540E, altitude 87 m), located in
the downstream plume of the Leipzig conurbation. A
detailed description of the site and the meteorological
situation during the campaign can be found in Muller
et al. (2004) and Spindler et al. (2002). Conditions

ARTICLE IN PRESSM. Schaap et al. / Atmospheric Environment 38 (2004) 6487–6496 6489
during the campaign were quite cool and humid for the
time of the year. The maximum temperature did not
exceed 15 1C. Average daily temperatures were below
10 1C and the average relative humidity ranged between
67 and 88%.
2.1.2. Sampling methods
During the campaign four institutes used nine
different samplers to collect aerosol samples for nitrate
analysis or directly measured the nitrate content of the
aerosol. The samplers, their acronyms and main features
of the sampling methods are listed in Table 1 and
described in detail below. As indicated, most of these
were filter samplers with a PM2.5 or a PM10 pre-
selector. In addition, three ‘‘stacked’’ filter-units (SFUs)
and two low-pressure Berner impactors were operated.
The filters used were Teflon, quartz fibre, polycarbonate,
cellulose and mixed cellulose ester filters. A steam jet
aerosol collector (SJAC) (Slanina et al., 2001) was used
to measure nitrate with an 1-h time resolution. The
filters and impactors were operated with a 12 or 24-h
time resolution, starting at 8:00 a.m. for 24-h sampling
and additionally at 8:00 p.m. for 12-h sampling. All
available data were aggregated to 24-h values.
The IFT_HV_1 is a High Volume Digitel (DHA80)
sampler. The second high-volume sampler operated by
IFT (IFT_HV_2) is a modified Sierra Anderssen-PM10
sampler, which has been used for monitoring purposes
since 1992 (Spindler et al., 1999). Both systems were
equipped with quartz fibre filters (Type MK 360,
Munktell Filter, Sweden). The low-volume sampler
Table 1
Overview of samplers used in Melpitz
Size NR Sampler Filter/foil type Flow
PM10 1 IFT_LV_2 Teflon 16.7
2 IFT_HV_2 Quartz 1000
3 UGent_1b Polycarbonate 16.7
4 UGent_2b Polycarbonate 16.7
5 UGent_3b Polycarbonate 16.7
6 IFT_SJAC —
PM2.5 7 BTU_HV Quartz 500
8 IFT_LV_1 Teflon 16.7
9 IFT_HV_1 Quartz 500
3 UGent_1a Teflon 16.7
4 UGent_2b Mix. Cell. ester 16.7
5 UGent_3c Whatman 41 16.7
PM1 10 IFT_LV Teflon 16.7
Impactor 11 TUV_I Aluminium 30
12 IFT_I TEDLAR 75
aPM2.0.bCoarse filter, for PM10 the concentration derived from the fine ancWith additional W41 backup filter during the latter half of the cadNaHCO3/Na2CO3 buffer.eValue is representative for a 24-h sampling period.
(IFT_LV) is the Partisol 2000 Air Sampler (Rupprecht
and Patashnik Co. Inc., USA) (Spindler et al., 2002).
Daily samples of PM10, PM2.5 and PM1 were collected
on Teflon filters (Millipore, Eschborn, Germany, Type
4700, 3 mm pore size). A 5-stage Berner low-pressure
cascade impactor (IFT_I) was also operated (Berner et
al., 1979). A SJAC (Slanina et al., 2001), operated
offline, was used to measure nitrate with a 1-h time
resolution. The aerosol nitrate content was determined
using a quarter of the filters from the IFT_HV samplers
or a half of the filters from the IFT_LV samplers by
standard ion chromatography procedure (Bruggemann
et al., 2000).
The BTU_HV sampler and sample analysis was
identical to IFT_HV_1 (Wieprecht et al., 2001).
The TUV_I instrument is an eight-stage low-pressure
cascade impactor, type LPI 30 (Berner et al., 1979). The
experimental and analysis procedures are described in
Berner et al. (1998).
The three samplers used by UGent were Ghent PM10
SFU samplers (Maenhaut et al., 1994; Hopke et al.,
1997). They were equipped with a Ghent PM10 inlet
(Hopke et al., 1997), the aerosol was separated into two
size fractions (PM2.0 and PM2-10) by sequential
filtration through two 47mm diameter filters. The coarse
filter was for all three samplers an 8 mm pore size,
Apiezon-coated, Nuclepore polycarbonate filter. The
fine filter was a Gelman Teflon filter (2 mm pore size)
in UGent_1; a Millipore mixed cellulose ester filter
(acetate+nitrate), type SSWP04700 (3 mm pore size), in
UGent_2; and a Whatman 41 cellulose filter in
(l min�1) Extraction Analysis Blanke (mg m�3)
Water IC 0.06
IC eluentd IC o0.02
Water IC 0.002
Water IC 0.002
Water IC 0.002
— IC —
Water IC o0.02
Water IC 0.06
IC eluentb IC o0.02
Water IC 0.002
Water IC 0.2
Water IC 0.013
Water IC 0.06
Water IC o0.002
Water IC o0.002
d coarse filter have to be added up.
mpaign.

ARTICLE IN PRESS
Table 2
Experiment matrix and results of the wind-tunnel testsa
Design Measured NO3 concentration (mg m�3)
Remarks Denud W41 CellAc Qu Teflon SJAC
1 KNO3 10 mg m�3 9.2 6.8 12.2 11.8 9.2 9.2
Dupl. 2 KNO3 10 mg m�3 8.7 7.9 8.7 8.5 8.5
3 NH4NO3+HNO3 12.1 23.5 24.9 22.2 12.3 7.0
Dupl. 4 NH4NO3+HNO3 11.7 22.6 21.3 11.6 6.6
5 overnight aerosol-free �0.3 0.1 0.1 0.1 �0.0 o0.1
6 HNO3 2.3 13.5 12.2 11.6 2.0 o0.1
Dupl. 7 HNO3 2.7 16.1 14.4 2.8 o0.1
8 HNO2 0.4 0.8 0.5 0.6 0.0 o0.1
Dupl. 9 HNO2 0.5 1.3 0.5 �0.0 o0.1
10 NH4NO3 20mg m�3 21.0 16.6 20.1 21.2 15.1 16.6
Dupl. 11 NH4NO3 20mg m�3 20.4 17.0 20.9 14.4 16.4
12 NH4NO3 5mg m�3 1.4 4.9 5.8 5.4 0.3 3.4
13 NH4NO3 7mg m�3 (351C) 12.9 14.3 16.0 1.9 0.1 8.9
14 NH4NO3 20mg m�3 (351C) 32.3 34.5 35.8 10.5 1.2 26.2
Dupl. 15 NH4NO3 20mg m�3 (351C) 30.9 33.9 33.0 1.0 25.7
15+night 16 NH4NO3 20mg m�3 (351C) 36.6 40.7 40.8 0.7 0.1 o0.1
17 KNO3 20 mg m�3 32.3 33.9 34.9 35.0 32.3 27.4
Dupl. 18 KNO3 20 mg m�3 34.7 34.2 36.9 34.7 28.1
aThe three standard filters used are denoted by: ‘‘W41’’: Whatman-41 cellulose, ‘‘Qu’’: quartz fiber, ‘‘Cell Ac’’: cellulose acetate
membrane. Sampling time was 2 h for each experiment. The detection limit for the various samplers is reflected in blank run 5. In runs
3,4,6–9 the measured nitric acid or nitrous acid gas concentration were very similar to the design value of 10 mg m�3. Experiments were
performed at 21 1C and 50–60% RH unless stated otherwise. Dupl. indicates a duplicate run.
M. Schaap et al. / Atmospheric Environment 38 (2004) 6487–64966490
UGent_3. From 7 April on, an additional Whatman
41 filter was used in the latter. Besides the actual
samples, also 6 field blanks were collected with each of
the three UGent samplers. Air was drawn through
the field blanks for about 30 s. All samples were analysed
for nitrate by ion chromatography (IC) (Maenhaut
et al., 2002).
For all samplers the inlets and tubing (if any) were
made from (passivated) aluminium or polyethylene. For
a detailed description of the inlets we refer to the
references given above. The residence time from inlet to
filter was 1–3 s for all samplers. The chemical analyses
were mostly performed in the laboratories of the
participating institutes using very similar equipment
and procedures. For an IC analysis done by one
laboratory using the same equipment, procedure and
staff the uncertainty was estimated to be about 10%
(Bruggemann and Rolle, 1998). Annually, the labora-
tories involved take part in national and/or international
intercomparison studies for qualifying their analytical
data.
2.2. Laboratory study
In a laboratory setting tests were performed in a wind
tunnel behind a large holding chamber in which both the
aerosol and the gases were generated. The sampling
efficiency of potassium nitrate, as a conservative tracer,
pure ammonium nitrate and a combination of ammo-
nium nitrate and nitric acid gas were tested at various
concentrations and temperatures (see Table 2). In
addition, the adsorption of gaseous nitric and nitrous
acid (HONO) was investigated. Filters of the same type
as in INTERCOMP2000 were used. Ten Brink et al.
(2001) describe the methods used to generate and sample
the aerosol in detail. In this paper we report important
(additional) data for Teflon filters (not presented earlier
and of specific importance because of the use of this type
of filter in INTERCOMP2000). The Teflon filter was the
front filter in a filter pack (Behlen, 1996). The filter pack
further consisted of a nylon back-up filter. The HONO
test was specifically performed to test the assumed
uptake of HONO by this material. Analysis of the filters
for nitrate was performed by standard IC procedures
(Behlen, 1996).
2.3. Po-Valley
The experimental set-up of INTERCOMP98
analysis procedures and site description are extensively
described by Putaud et al. (2002) and Baltensperger et al.
(2002).
ARTICLE IN PRESSM. Schaap et al. / Atmospheric Environment 38 (2004) 6487–6496 6491
3. Results and discussion
3.1. INTERCOMP2000
In the analysis of the (nitrate) data from INTER-
COMP2000 sulphate was considered to be the most
conservative species. For comparison purposes the same
procedure was followed for sulphate as for nitrate. In
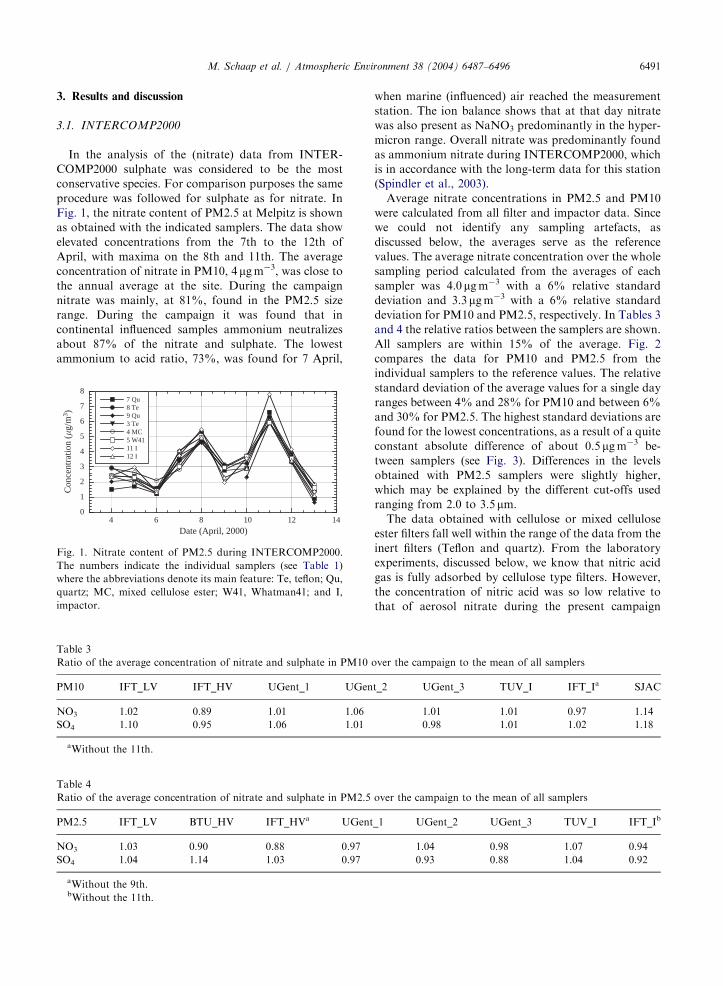
Fig. 1, the nitrate content of PM2.5 at Melpitz is shown
as obtained with the indicated samplers. The data show
elevated concentrations from the 7th to the 12th of
April, with maxima on the 8th and 11th. The average
concentration of nitrate in PM10, 4 mg m�3, was close to
the annual average at the site. During the campaign
nitrate was mainly, at 81%, found in the PM2.5 size
range. During the campaign it was found that in
continental influenced samples ammonium neutralizes
about 87% of the nitrate and sulphate. The lowest
ammonium to acid ratio, 73%, was found for 7 April,
04 6 8 10 12 14
1
2
3
4
5
6
7
87 Qu8 Te9 Qu3 Te4 MC5 W4111 I12 I
Con
cent
ratio
n (�
g/m
3 )
Date (April, 2000)
Fig. 1. Nitrate content of PM2.5 during INTERCOMP2000.
The numbers indicate the individual samplers (see Table 1)
where the abbreviations denote its main feature: Te, teflon; Qu,
quartz; MC, mixed cellulose ester; W41, Whatman41; and I,
impactor.
Table 3
Ratio of the average concentration of nitrate and sulphate in PM10
PM10 IFT_LV IFT_HV UGent_1 UGen
NO3 1.02 0.89 1.01 1.06
SO4 1.10 0.95 1.06 1.01
aWithout the 11th.
Table 4
Ratio of the average concentration of nitrate and sulphate in PM2.5
PM2.5 IFT_LV BTU_HV IFT_HVa UGent
NO3 1.03 0.90 0.88 0.97
SO4 1.04 1.14 1.03 0.97
aWithout the 9th.bWithout the 11th.
when marine (influenced) air reached the measurement
station. The ion balance shows that at that day nitrate
was also present as NaNO3 predominantly in the hyper-
micron range. Overall nitrate was predominantly found
as ammonium nitrate during INTERCOMP2000, which
is in accordance with the long-term data for this station
(Spindler et al., 2003).
Average nitrate concentrations in PM2.5 and PM10
were calculated from all filter and impactor data. Since
we could not identify any sampling artefacts, as
discussed below, the averages serve as the reference
values. The average nitrate concentration over the whole
sampling period calculated from the averages of each
sampler was 4.0mg m�3 with a 6% relative standard
deviation and 3.3mg m�3 with a 6% relative standard
deviation for PM10 and PM2.5, respectively. In Tables 3
and 4 the relative ratios between the samplers are shown.
All samplers are within 15% of the average. Fig. 2
compares the data for PM10 and PM2.5 from the
individual samplers to the reference values. The relative
standard deviation of the average values for a single day
ranges between 4% and 28% for PM10 and between 6%
and 30% for PM2.5. The highest standard deviations are
found for the lowest concentrations, as a result of a quite
constant absolute difference of about 0.5 mg m�3 be-
tween samplers (see Fig. 3). Differences in the levels
obtained with PM2.5 samplers were slightly higher,
which may be explained by the different cut-offs used
ranging from 2.0 to 3.5mm.
The data obtained with cellulose or mixed cellulose
ester filters fall well within the range of the data from the
inert filters (Teflon and quartz). From the laboratory
experiments, discussed below, we know that nitric acid
gas is fully adsorbed by cellulose type filters. However,
the concentration of nitric acid was so low relative to
that of aerosol nitrate during the present campaign
over the campaign to the mean of all samplers
t_2 UGent_3 TUV_I IFT_Ia SJAC
1.01 1.01 0.97 1.14
0.98 1.01 1.02 1.18
over the campaign to the mean of all samplers
_1 UGent_2 UGent_3 TUV_I IFT_Ib
1.04 0.98 1.07 0.94
0.93 0.88 1.04 0.92

ARTICLE IN PRESS
00 2 4 6 8
0 2 4 6 8 10
2
4
6
87 Qu8 Te9 Qu3 Te4 MC5 W4111 I12 I
Nitr
ate
conc
entr
atio
n fo
r ea
chsa
mpl
er (�g
/m3 )
Average nitrate concentration in PM2.5 (�g/m3)
0
2
4
6
8
101 Te2 Qu3 Te4 MC5 W4111 I12 I6 SJ
Nitr
ate
conc
entr
atio
n fo
r ea
chsa
mpl
er (�g
/m3 )
Average nitrate concentration in PM10 (�g/m3)
Fig. 2. Comparison between the nitrate concentrations ob-
tained from the individual samplers and the average nitrate
concentration in PM2.5 (upper panel) and PM10 (lower panel).
The numbers indicate the individual samplers (see Table 1)
where the abbreviations denote its main feature: Te, teflon; Qu,
quartz; MC, mixed cellulose ester; W41, Whatman41; I,
impactor and SJ, SJAC.
00 2 4 6 8 10
0.05
0.1
0.15
0.2
0.25
0.3
0.35
PM10PM2.5
Rel
ativ
e st
anda
rd d
evia
tion
betw
een
sam
pler
s
Average nitrate concentration (�g/m3)
Fig. 3. Relative standard deviation in the average of all
samplers for PM2.5 and PM10 per day.
M. Schaap et al. / Atmospheric Environment 38 (2004) 6487–64966492
(Acker et al., 2004, this issue) that its interference is
small. Therefore, nitric acid does not give rise to
significantly different values from those obtained with
the inert filters on which nitric acid does not adsorb. The
same conclusion is valid in case inlets or tubing have
acted as a denuder (by stripping the nitric acid from
the air).
On average, the SJAC data for PM10 seem to be
slightly higher than the other data. Because the non-
volatile sulphate shows the same feature (see Table 3),
we conclude that this finding cannot be interpreted as a
loss of nitrate by evaporation from the filters. Addi-
tionally, an absence of volatilization is in good agree-
ment with the comparability of the data from the inert
and cellulose filters. The laboratory intercomparison
showed that no volatilization occurred from the latter,
and we conclude that evaporation from the inert filters
was not significant. In the absence of a systematic
difference between samplers, artefacts can almost
certainly be excluded as the reason for the rather
constant differences between the concentrations deter-
mined with the different samplers. Also, the blank values
for nitrate (Table 1) were much lower than the observed
variability. In addition, the variability between samplers
with different cut-off’s or sampling volumes and
between filter samplers and impactors appears to be
random. Therefore, the explanation for the observed
constant variability remains unclear.
Ferm et al. (1988) compared different total nitrate
samplers. For daily average total nitrate concentrations
relative standard deviations lower than 15% were
found for different laboratories using the same sampling
technique. At the low end of the concentration
range (o2mg m�3) standard deviations were signifi-
cantly higher. When each laboratory used their
own technique very similar results were found. These
findings are in good agreement with the data in our
study. The same applies for a study by Harrison and
Kitto (1990).

ARTICLE IN PRESS
00 5 10 15 20
5
10
15
20
25
y= 2.2 + 0.86xR2= 0.94
WE
DD
AC
Whatman 41 corrected for nitric acid
Fig. 4. Concentration of nitrate (mg m�3) as sampled on a
Whatman 41 filter (corrected for HNO3) compared to the
WEDDAC.
M. Schaap et al. / Atmospheric Environment 38 (2004) 6487–6496 6493
3.2. Laboratory study
Below we present additional data and a full analysis
of the laboratory study. The first step was to test the
collection efficiency of the filters for submicron aerosol
with stable potassium nitrate. It was found that even the
Whatman 41 filter sampled close to 100%. With the
semi-volatile ammonium nitrate, sampled at an air
temperature of 21 1C, the quartz filter sampled as much
as the reference sampler. However, only 75% of the
nitrate was collected on the front Teflon filter of the filter
pack. At an elevated air temperature of 35 1C, less than
30% of the nitrate was sampled on the quartz and
almost none on the Teflon filter. These differences are
due to evaporation of ammonium nitrate after collec-
tion. The reason is that the aerosol sampled on the filters
is not in equilibrium with the associated gases because
the time between generation and arrival at the filters is
too short to establish this equilibrium (under equili-
brium conditions at 35 1C, 46 mg m�3 of ammonium
nitrate will be present in the gas phase as ammonia and
nitric acid (Seinfeld and Pandis, 1998). The presence of
this disequilibrium is indicated by the measured low
concentrations of nitric acid, which were less than 10%
of the equilibrium value. In contrast to the quartz and
Teflon filters the cellulose-type filters quantitatively
retained the nitrate.
In the interference test with nitric acid gas, the nitrate
concentrations found on the cellulose-type filters were
similar to the nitric acid concentration measured with
the gas-denuders. This shows that these filter types
quantitatively collect nitric acid. The retention appeared
to be in the form of ammonium nitrate. This is probably
due to neutralization of the nitrate on the filter by NH3,
which was present at a continuous background level.
Additional tests at a later date showed that nitric acid is
also retained on cellulose filters in the absence of
ammonia. A marginal amount of nitrate was found on
the Teflon filter. In contrast, the other inert material,
quartz, quantitatively collected the nitric acid, in the
form of ammonium nitrate. This ammonium nitrate was
apparently formed on the filter in a reaction of the nitric
acid and the mentioned free ammonia in the system. In
the runs with both ammonium nitrate and nitric acid the
Teflon filters only collected ammonium nitrate, whereas
the quartz sampled also nitric acid, showing the very
complex behaviour of quartz towards nitrate. HONO
gave an almost negligible interference, also on the nylon
back-up filter in the filter-pack.
A crucial test was that to measure the retention of
ammonium nitrate in loaded filters when aerosol-free air
of 35 1C was passed through the filters for an extended
period. No evaporation was observed from the cellulose-
type filters. The nitrate was retained as ammonium
nitrate. The quartz and Teflon filters showed virtually
complete evaporation, see Table 2.
3.3. Po-Valley
During the late spring of 1998 an intercomparison of
three samplers took place in the Po-Valley within a larger
field campaign (PIPAPO). Some results of this campaign
have already been reported (Putaud et al., 2002; Balten-
sperger et al., 2002). We provide a full evaluation of the
differences observed for the nitrate concentrations as
obtained with the quartz filters, the Whatman 41 cellulose
filters and the artefact free on-line method. Fig. 4 compares
the results of the cellulose filter measurements (Putaud
et al., 2002) with those obtained by the WEDD/AC system
(Baltensperger et al., 2002). For this purpose, the
measurements from the WEDD/AC system (20 min
resolution) were integrated for comparison with the longer
sampling time of filters (4–7 h resolution), correcting the
filter data for the HNO3 artefact (by subtracting the HNO3
data as measured with the WEDD/AC form the filter
data). Both methods show good agreement with respect to
the nitrate concentration and exhibit a correlation
coefficient R2=0.94, with 6% more nitrate determined
on the filters. This confirms the ability of cellulose filters to
quantitatively sample ammonium nitrate even at elevated
temperature (temperatures ranged between 18 and 30 1C).
At low concentration ranges there seems to be a small
offset between the samplers with slightly more nitrate
found on the WEDDAC. Although the reason is unclear
to us, we speculate that at low loadings the W41 may not
fully capture all PM. In addition, the uncertainty of a
single measurement and therefore that of the correction for
nitric acid are highest at low concentration ranges
contributing to the variability in the comparison.

ARTICLE IN PRESSM. Schaap et al. / Atmospheric Environment 38 (2004) 6487–64966494
Using this information, we analysed the evaporation
artefact of quartz filters as a function of (average)
temperature during the sampling period, by classifying
the temperature into three regimes. We corrected the
Whatman 41 data for the contribution of nitric acid to
obtain the actual aerosol nitrate concentration using
measured concentrations of nitric acid (Baltensperger et
al., 2002). In Fig. 5 the nitrate concentrations obtained
with the quartz filters are compared with those obtained
with the cellulose filters. It can be clearly observed that
the differences between the two samplers were highest
for the highest temperatures. The average concentration
ratios between the samplers are given in Table 5 for
three temperature intervals (we excluded one obvious
outlier). It was found that at temperatures higher than
20 1C substantial or complete loss of ammonium nitrate
occurs from the quartz filters.
3.4. General discussion and implications for monitoring
3.4.1. Cellulose-type filters and adsorption artefact
In Europe cellulose filters are in use in the EMEP
network. From the present study we conclude that these
Table 5
Po-Valley: ratio of nitrate on Quartz to Whatman41 filters, with
and without correction for nitric acid absorption by W41
Temperature (1C) Raw data HNO3 corrected
o 20 0.58 0.93
20–25 0.29 0.41
4 25 0.07 0.08
0
2
4
6
8
10
1050 15 20
< 2020 - 25> 251:1 line
Qua
rtz
Whatman 41 corrected for nitric acid
Fig. 5. Concentration of nitrate (mg m�3) as sampled on a
quartz filter compared to that on a Whatman 41 filter (corrected
for HNO3).
filters are samplers of total nitrate. This conclusion, viz.,
that cellulose-based filters quantitatively collect nitric
acid, is substantiated by earlier studies by Appel et al.
(1979), Spicer and Schumacher (1979) and Mehlmann
(1986), who showed that the capacity of retaining nitric
acid on cellulose filters is limited. However, the loads
measured in the laboratory and in the field experiments
reported here are (much) lower than the saturation limit.
3.4.2. Evaporation artefact
Underestimation of the nitrate concentration with
Teflon filters is a well-documented phenomenon (Appel
et al., 1979; Chow, 1995; Hering and Cass, 1999), but
less so with quartz for which few data exist on the
temperature dependence of the evaporation artefact. In
Fig. 5 we summarize the information on the evaporation
artefact with quartz filters obtained in this study. In
INTERCOMP2000 we did not find a measurable
evaporation artefact. Its absence was explained by the
relatively low temperature and high relative humidity
encountered during the campaign. These conditions
should be associated with very low concentrations of the
gases associated with the semi-volatile ammonium
nitrate. Indeed, the measured nitric acid concentrations
were low (Acker et al., 2004, this issue). At temperatures
exceeding 25 1C during the Po-Valley campaign and in
the wind tunnel complete loss of nitrate was observed
from quartz filters, whereas a partial loss was observed
between 20 and 25 1C. These results are in agreement
with those of Eatough et al. (1988), who also observed
considerable losses in the afternoon with temperatures
exceeding 20 1C. Below 20 1C no significant evaporation
was observed. It is suggested that losses during a 24 h
sampling period is not only a function of ambient
conditions and sampling apparatus, but also of the
sampling strategy. When filters are changed in the
morning, losses may have occurred at the higher
temperatures in the afternoon of the previous day
whereas at night nitrate is sampled quantitatively. When
filters are changed in the afternoon or evening, nitrate
sampled during the night might be lost when tempera-
tures rise during the day. Such seemingly minor details,
together with the type of filter material used and length
of sampling lining in which nitric acid may be lost,
should in reality be spelled out when nitrate measure-
ments are being reported.
4. Conclusions
In this study we report on the comparability of nitrate
measurements as studied in three intercomparison
campaigns. During the campaign in Melpitz the nitrate
concentrations obtained from the different samplers
compared well. Evaporation artefacts were not identi-
fied, which was attributed to the stability of ammonium

ARTICLE IN PRESSM. Schaap et al. / Atmospheric Environment 38 (2004) 6487–6496 6495
nitrate at the low ambient temperatures and high
relative humidity. Adsorption of nitric acid to cellulose
filters could not be identified, although it was found in
the wind tunnel intercomparison experiment. There it
was established that cellulose-type filters sample the sum
of particulate nitrate and nitric acid. Artefacts in the
sampling of ammonium nitrate with quartz filters were
complex. Evaporation only occurred at the higher
temperature of 35 1C. Teflon filters were more vulnerable
for evaporation losses than quartz. Using this labora-
tory knowledge the data from a third intercomparison
campaign in the Po-Valley, in 1998, were evaluated. We
found clear evidence of adsorption of nitric acid by
cellulose filters and evaporational loss of aerosol-nitrate
from the quartz filters used. For the conditions
encountered during the campaigns we could parameter-
ize the latter loss as a function of temperature, as
follows. There is complete evaporation at temperatures
exceeding 25 1C and full retention at temperatures
less than 20 1C. At temperatures between 20 and 25 1C
the retention is on average 50%, but with high
variability.
A main conclusion from this study is that under
central European conditions quartz is a suitable filter
material for sampling nitrate as long as the temperature
does not exceed 20 1C during sampling. Cellulose-type
filters quantitatively collect nitric acid and particulate
ammonium nitrate, but negligible amounts of nitrous
acid. A final remark is that seemingly minor details like
the time of filter change, type of filter material and
length of the sampling line, should in reality be spelled
out and tested with respect to effect on the sampling
before nitrate measurements are being made and
reported.
Acknowledgements
Martijn Schaap and Harry ten Brink gratefully
acknowledge the financial support from the Dutch
ministry of Economical Affairs. The UGent group
is indebted to the Belgian Federal Office for Scientific,
Technical and Cultural Affairs and to the ‘‘Fonds
voor Wetenschappelijk Onderzoek—Vlaanderen’’ for
research support. The UniV group gratefully acknowl-
edges the financial support of the Hochschuljubilaum-
stiftung der Stadt Wien (grant H180/99).
References
Acker, K., Spindler, G., Bruggemann, E., 2004. Nitrous and
nitric acid measurements during the INTERCOMP2000
campaign in melpitz. Atmospheric Environment, this issue,
doi:10.1016/j.atmosenv.2004.08.030.
Appel, B.R., Wall, S.M., Tokiwa, Y., Haik, M., 1979.
Interference effects in sampling particulate nitrate in
ambient air. Atmospheric Environment 13, 319–325.
Baltensperger, U., Streit, N., Weingartner, E., Nyeki, S.,
Prevot, A.S.H., van Dingenen, R., Virkkula, A., Putaud,
J.-P., Even, A., ten Brink, H., Blatter, A., Neftel, A.,
Gaggeler, H.W. Urban and rural aerosol characterization of
summer smog events during the PIPAPO field campaign in
Milan, Italy. Journal of Geophysical Research, 107,
10.1029/2001JD001292.
Berner, A., Lurzer, C., Pohl, F., Preining, O., Wagner, P., 1979.
The size distribution of the urban atmospheric aerosol in
Vienna. The Science of the Total Environment 13, 245–261.
Berner, A., Dusek, U., Galambos, Z., Kruisz, C., 1998.
Sampling of fog droplets by cascade impactors. Contribu-
tions to Atmospheric Physics 71, 101–114.
Behlen, A. (1996), Reactive Stickstoffverbindungen in der
Atmosphare—Konzentrationsbestimmung und trockene
Deposition auf Natursteine. Schriftenreihe Angewandte
Analytik, vol 29, Institut fur Anorganische und Ange-
wandte Chemie der Universitat Hamburg.
Bruggemann, E., Frank, U., Gnauk, Th, Herrmann,H., Muller,
K., NeusuX, Ch., Plewka, A., Spindler, G., Stark, H.-J.,
Wennrich, R. (2000) KorngroXendifferenzierte Identifika-
tion der Anteile verschiedener Quellgruppen an der Fein-
staubbelastung. AbschluXbericht zum FE-Vorhaben
Sachsisches Landesamt fur Umwelt und Geologie (SLUG)
13-8802.3521/46.
Bruggemann, E., Rolle, W., 1998. Changes of some compo-
nents of precipitation in East Germany after unification.
Water air and Soil Pollution 107, 1–23.
Chow, J.C., 1995. Measurement methods to determine com-
pliance with ambient air quality standards for suspended
particles. Journal of Air and Waste Management Associa-
tion 45, 320–382.
Dasch, J.M., Cadle, S.H., Kennedy, K.G., Mulawa, P.A., 1989.
Comparison of annular denuders and filter packs for
atmospheric sampling. Atmospheric Environment 23,
2775–2782.
Eatough, N.L., McGregor, S., Lewis, E.A., Eatough, D.J.,
Huang, A.A., Ellis, E.C., 1988. Comparison of sic denuder
methods and a filter pack for the collection of ambient
HNO3 (g), HNO2 (g) and SO2 (g) in the 1985 NSMC study.
Atmospheric Environment 22, 1601–1618.
Ferm, M., Areskoug, H., Hanssen, J.-E., Hilbert, G., Lattila,
H., 1988. Field intercomparison of measurement techniques
for total NH4+ and total NO3
� in ambient air. Atmospheric
Environment 22, 2275–2281.
Harrison, R.M., Kitto, A.M.N., 1990. Field intercomparison of
filter pack and denuder sampling methods for reactive
gaseous and particulate pollutants. Atmospheric Environ-
ment 24A, 2633–2640.
Hering, S., Cass, G., 1999. The magnitude of bias in the
measurement of PM2.5 arising from volatilisation of
particulate nitrate from Teflon filters. Journal of Air and
Waste Management Association 49, 725–733.
Hopke, P.K., Xie, Y., Raunemaa, T., Biegalski, S., Land-
sberger, S., Maenhaut, W., Artaxo, P., Cohen, D.,
1997. Characterization of the Gent stacked filter unit
PM10 sampler. Aerosol Science and Technology 27,
726–735.

ARTICLE IN PRESSM. Schaap et al. / Atmospheric Environment 38 (2004) 6487–64966496
Maenhaut, W., Francois, F., Cafmeyer, J., 1994. The ‘‘Gent’’
stacked filter unit (SFU) sampler for the collection of
aerosols in two size fractions: description and instructions
for installation and use. In: Applied Research on Air
Pollution using Nuclear-Related Analytical Techniques,
Report on the First Research Co-ordination Meeting,
Vienna, Austria, 30 March–2 April 1993. NAHRES-19,
IAEA, Vienna, pp. 249–263.
Maenhaut, W., Schwarz, J., Cafmeyer, J., Chi, X., 2002.
Aerosol chemical mass closure during the EUROTRAC-2
AEROSOL Intercomparison 2000. Nuclear Instruments
and Methods in Physics Research B 189, 233–237.
Mehlmann, A., 1986. Grossenverteilung des Aerosolnitrats und
seine Beziehung zur gasformigen Salpetersaure. Ph.D.
Thesis, Johannes Gutenberg University, Mainz.
Muller, K., Spindler, G., Maenhaut, W., Hitzenberger, R.,
Wieprecht, W., Baltensperger, U., ten Brink, H.M., 2004.
INTERCOMP 2000, a campaign to assess the compar-
ability of methods in use in Europe for measuring aerosol
composition. Atmospheric Environment this issue,
doi:10.1016/j.atmosenv.2004.08.031.
Pakkanen, T.A., Hillamo, R.E., Aurela, M., Andersen, H.V.,
Grundahl, L., Ferm, M., Persson, K., Karlsson, V., Reissell,
A., Royset, O., Floisand, I., Oyola, P., Ganko, T., 1999.
Nordic intercomparison for measurement of major atmo-
spheric nitrogen species. Journal of Aerosol Science 30,
247–263.
Putaud, J.P., Van Dingenen, R., Raes, F., 2002. Submicron
aerosol mass balance at urban and semirural sites in the
Milan area (Italy). Journal of Geophysical Reseacrh 107
(D22) 10.1029/2000JD000111.
Schaap, M., Mueller, K., Ten Brink, H.M., 2002. Constructing
the European aerosol nitrate concentration field from
quality analysed data. Atmospheric Environment 36 (8),
1323–1335.
Savoie, D.L., Prospero, J.M., 1982. Particle size distribution of
nitrate and sulphate in the marine atmosphere. Geophysical.
Research Letters 9, 1207–1210.
Seinfeld, J.H., Pandis, S.N., 1998. Atmospheric Chemistry and
Physics: from air pollution to climate change. Wiley, New
York, USA.
Slanina, J., Ten Brink, H.M., Otjes, R.P., Even, A., Jongejan,
P., Khlystov, A., Waijers-Ijpelaan, A., Hu, M., Lu, Y.,
2001. Continuous analysis of nitrate and ammonium in
aerosols by the Steam Jet Aerosol Collector (SJAC).
Atmospheric Environment 35, 2319–2330.
Spicer, C.W., Schumacher, P.M., 1979. Particulate nitrate:
laboratory and field studies of major sampling interferences.
Atmospheric Environment 13, 543–552.
Spindler, G., Muller, K., Herrmann, H., 1999. Main particulate
matter components in Saxony (Germany); Trends and
sampling aspects. Environmental Science and Pollution
Research 6, 89–94.
Spindler, G., Muller, K., Bruggemann, E., Herrmann, H., 2002.
Integration of the field experiment INTERCOMP2000 in
the long-term particle concentration observation at the
Melpitz site. In: Midgley, P.M., Reuther, M. (Eds.),
Proceedings of the EUROTRAC-2 Symposium 2002.
Margraf Verlag, Weikersheim.
Spindler, G., Muller, K., Bruggemann, E., Gnauck, T.,
Herrmann, H., 2003. Long-term size-segregated character-
ization of PM10, PM2.5 and PM1 at the IfT research station
Melpitz downwind of Leipzig, Germany. Atmospheric
Environment submitted.
Ten Brink, H.M., Kruisz, C., Kos, G.P.A., Berner, A., 1997.
Composition/size of the light-scattering aerosol in the
Netherlands. Atmospheric Environment 31, 3955–3962.
Ten Brink, Schulz, M., Putaud, J.-P., Jongejan, P., Plate, E.,
2001. Comparison of the collection of ammonium nitrate by
various sampling methods. In: Midgley, P.M., Reuther, M.,
Williams, M. (Eds.), Proceedings of the EUROTRAC
Symposium 2000. Springer, Berlin.
Wieprecht, W., Acker, K., Auel, R., Muller, K., 2001.
INTERCOMP2000 Melpitz: Intercomparison of PM2.5
high volume sampler. Journal of Aerosol Science 32,
S1019–S1020.