Arsenic enrichment in waters and sediments of the Rio Loa (Second Region, Chile
18
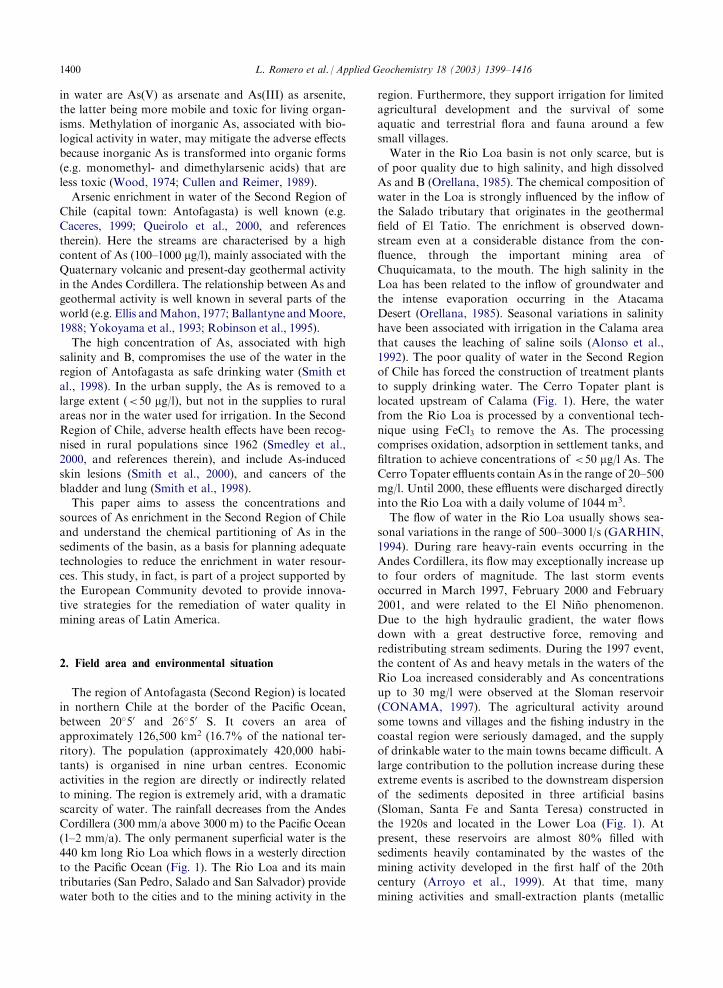
Arsenic enrichment in waters and sediments of the Rio Loa (Second Region, Chile) L. Romero a , H. Alonso a , P. Campano a , L. Fanfani b , R. Cidu b, *, C. Dadea b , T. Keegan c , I. Thornton c , M. Farago c a Universidad Cato ´lica del Norte, Av. Angamos 0610, box 1280, Antofagasta, Chile b Universita ` di Cagliari, Dipartimento Scienze della Terra, Via Trentino 51, 09127 Cagliari, Italy c Imperial College of Science, Technology and Medicine, London SW7 2BP, UK Abstract The Second Region of Chile (126,500 km 2 ) is extremely arid, with a dramatic scarcity of water. The only water resource for the population (about 420,000 habitants) and the mining industry (the most important economic activity in the region) is the 440 km long Rio Loa. Moreover, this is highly enriched in As. In order to assess As concentrations and sources, and to evaluate the impact of mining activity on the water quality in the Rio Loa basin, water and sedi- ment samples were taken at strategic points along the river and its major tributaries. The water in the whole basin is quite saline (total dissolved solids up to 11 g/l) and heavily enriched in As (average: 1400 mg/l) and B (average: 21,000 mg/l). These values are up to 300 and 100 times higher than the respective guidelines suggested by the WHO for drinking water. The quality of water is extremely poor along the tributary Salado, mainly fed by the El Tatio geo- thermal waters that are very rich in As (up to 27,000 mg/l) and other components. Sediments from the Rio Loa and its tributaries have As contents in the range of 26–2000 mg/kg (mean value of 60 samples: 320 mg/kg), and reach 11,000 mg/kg at El Tatio. Sequential extraction analyses show the As to be mainly associated with Fe–Mn oxy-hydroxides and residual phases, but part of the As (about 20%) is readily available being extracted from the exchangeable and car- bonate phases. This result is in agreement with the correlation observed between As content in sediments and As con- centration in waters in the area. The extreme arid conditions, high evaporation, and the lack of low-As tributaries contribute to maintain high concentrations of As and other components in the Rio Loa water to the mouth. Due to the oxidising conditions, neutral to alkaline pH, high salinity and high As concentrations, adsorption of As-species is not favoured. The main As source in the Rio Loa basin is considered to be natural, i.e. linked to the lithologies in the area. Smelter emissions and mining wastes, as well as the As-rich effluents from the water treatment plants, possibly repre- sent additional sources. # 2003 Elsevier Science Ltd. All rights reserved. 1. Introduction The adverse effects of As exposure on human health are well known, though not all populations or indivi- duals have the same response to As (Hopenhayn-Rich et al., 1996). The consumption of water with high concentrations of As over a prolonged period of time causes serious diseases, including arsenical dermatosis, hyperkeratosis and arsenicosis (Bhattacharya et al., 1998), especially in rural and semi-urban areas, where drinking water is often used without treatment. Therefore, the occurrence, origin and mobility of As in natural waters have received significant attention in recent years. Arsenic concentrations above maximum permissible national limits for potable water have been reported in groundwater in several parts of the world including the USA (Robertson, 1989; Fuji and Swain, 1995; Welch and Lico, 1998), Mexico (Del Razo et al., 1990), Argentina (Nicolli et al., 1989), Chile (Caceres et al., 1992), Taiwan (Kuo, 1968), Mongolia (Smedley et al., 2001), India (Acharyya et al., 2000) and Bangladesh (Bhattacharya et al., 1997). The most common As-species 0883-2927/03/$ - see front matter # 2003 Elsevier Science Ltd. All rights reserved. doi:10.1016/S0883-2927(03)00059-3 Applied Geochemistry 18 (2003) 1399–1416 www.elsevier.com/locate/apgeochem * Corresponding author. Tel.: +39-070-67-57-724; fax: +39-070-282-236. E-mail address: [email protected] (R. Cidu).
-
Upload
independent -
Category
Documents
-
view
2 -
download
0
Transcript of Arsenic enrichment in waters and sediments of the Rio Loa (Second Region, Chile
Arsenic enrichment in waters and sediments of the Rio Loa(Second Region, Chile)
L. Romeroa, H. Alonsoa, P. Campanoa, L. Fanfanib, R. Cidub,*, C. Dadeab,T. Keeganc, I. Thorntonc, M. Faragoc
aUniversidad Catolica del Norte, Av. Angamos 0610, box 1280, Antofagasta, ChilebUniversita di Cagliari, Dipartimento Scienze della Terra, Via Trentino 51, 09127 Cagliari, Italy
cImperial College of Science, Technology and Medicine, London SW7 2BP, UK
Abstract
The Second Region of Chile (126,500 km2) is extremely arid, with a dramatic scarcity of water. The only waterresource for the population (about 420,000 habitants) and the mining industry (the most important economic activityin the region) is the 440 km long Rio Loa. Moreover, this is highly enriched in As. In order to assess As concentrations
and sources, and to evaluate the impact of mining activity on the water quality in the Rio Loa basin, water and sedi-ment samples were taken at strategic points along the river and its major tributaries. The water in the whole basin isquite saline (total dissolved solids up to 11 g/l) and heavily enriched in As (average: 1400 mg/l) and B (average: 21,000
mg/l). These values are up to 300 and 100 times higher than the respective guidelines suggested by the WHO fordrinking water. The quality of water is extremely poor along the tributary Salado, mainly fed by the El Tatio geo-thermal waters that are very rich in As (up to 27,000 mg/l) and other components. Sediments from the Rio Loa and itstributaries have As contents in the range of 26–2000 mg/kg (mean value of 60 samples: 320 mg/kg), and reach 11,000
mg/kg at El Tatio. Sequential extraction analyses show the As to be mainly associated with Fe–Mn oxy-hydroxides andresidual phases, but part of the As (about 20%) is readily available being extracted from the exchangeable and car-bonate phases. This result is in agreement with the correlation observed between As content in sediments and As con-
centration in waters in the area. The extreme arid conditions, high evaporation, and the lack of low-As tributariescontribute to maintain high concentrations of As and other components in the Rio Loa water to the mouth. Due to theoxidising conditions, neutral to alkaline pH, high salinity and high As concentrations, adsorption of As-species is not
favoured. The main As source in the Rio Loa basin is considered to be natural, i.e. linked to the lithologies in the area.Smelter emissions and mining wastes, as well as the As-rich effluents from the water treatment plants, possibly repre-sent additional sources.# 2003 Elsevier Science Ltd. All rights reserved.
1. Introduction
The adverse effects of As exposure on human health
are well known, though not all populations or indivi-duals have the same response to As (Hopenhayn-Richet al., 1996). The consumption of water with high
concentrations of As over a prolonged period of timecauses serious diseases, including arsenical dermatosis,hyperkeratosis and arsenicosis (Bhattacharya et al.,
1998), especially in rural and semi-urban areas, wheredrinking water is often used without treatment.Therefore, the occurrence, origin and mobility of As
in natural waters have received significant attention inrecent years. Arsenic concentrations above maximumpermissible national limits for potable water have been
reported in groundwater in several parts of the worldincluding the USA (Robertson, 1989; Fuji and Swain,1995; Welch and Lico, 1998), Mexico (Del Razo et al.,1990), Argentina (Nicolli et al., 1989), Chile (Caceres et
al., 1992), Taiwan (Kuo, 1968), Mongolia (Smedley et al.,2001), India (Acharyya et al., 2000) and Bangladesh(Bhattacharya et al., 1997). The most commonAs-species
0883-2927/03/$ - see front matter # 2003 Elsevier Science Ltd. All rights reserved.
doi:10.1016/S0883-2927(03)00059-3
Applied Geochemistry 18 (2003) 1399–1416
www.elsevier.com/locate/apgeochem
* Corresponding author. Tel.: +39-070-67-57-724; fax:
+39-070-282-236.
E-mail address: [email protected] (R. Cidu).
in water are As(V) as arsenate and As(III) as arsenite,the latter being more mobile and toxic for living organ-isms. Methylation of inorganic As, associated with bio-logical activity in water, may mitigate the adverse effects
because inorganic As is transformed into organic forms(e.g. monomethyl- and dimethylarsenic acids) that areless toxic (Wood, 1974; Cullen and Reimer, 1989).
Arsenic enrichment in water of the Second Region ofChile (capital town: Antofagasta) is well known (e.g.Caceres, 1999; Queirolo et al., 2000, and references
therein). Here the streams are characterised by a highcontent of As (100–1000 mg/l), mainly associated with theQuaternary volcanic and present-day geothermal activity
in the Andes Cordillera. The relationship between As andgeothermal activity is well known in several parts of theworld (e.g. Ellis andMahon, 1977; Ballantyne andMoore,1988; Yokoyama et al., 1993; Robinson et al., 1995).
The high concentration of As, associated with highsalinity and B, compromises the use of the water in theregion of Antofagasta as safe drinking water (Smith et
al., 1998). In the urban supply, the As is removed to alarge extent (<50 mg/l), but not in the supplies to ruralareas nor in the water used for irrigation. In the Second
Region of Chile, adverse health effects have been recog-nised in rural populations since 1962 (Smedley et al.,2000, and references therein), and include As-induced
skin lesions (Smith et al., 2000), and cancers of thebladder and lung (Smith et al., 1998).This paper aims to assess the concentrations and
sources of As enrichment in the Second Region of Chile
and understand the chemical partitioning of As in thesediments of the basin, as a basis for planning adequatetechnologies to reduce the enrichment in water resour-
ces. This study, in fact, is part of a project supported bythe European Community devoted to provide innova-tive strategies for the remediation of water quality in
mining areas of Latin America.
2. Field area and environmental situation
The region of Antofagasta (Second Region) is locatedin northern Chile at the border of the Pacific Ocean,
between 20�50 and 26�50 S. It covers an area ofapproximately 126,500 km2 (16.7% of the national ter-ritory). The population (approximately 420,000 habi-
tants) is organised in nine urban centres. Economicactivities in the region are directly or indirectly relatedto mining. The region is extremely arid, with a dramatic
scarcity of water. The rainfall decreases from the AndesCordillera (300 mm/a above 3000 m) to the Pacific Ocean(1–2 mm/a). The only permanent superficial water is the440 km long Rio Loa which flows in a westerly direction
to the Pacific Ocean (Fig. 1). The Rio Loa and its maintributaries (San Pedro, Salado and San Salvador) providewater both to the cities and to the mining activity in the
region. Furthermore, they support irrigation for limitedagricultural development and the survival of someaquatic and terrestrial flora and fauna around a fewsmall villages.
Water in the Rio Loa basin is not only scarce, but isof poor quality due to high salinity, and high dissolvedAs and B (Orellana, 1985). The chemical composition of
water in the Loa is strongly influenced by the inflow ofthe Salado tributary that originates in the geothermalfield of El Tatio. The enrichment is observed down-
stream even at a considerable distance from the con-fluence, through the important mining area ofChuquicamata, to the mouth. The high salinity in the
Loa has been related to the inflow of groundwater andthe intense evaporation occurring in the AtacamaDesert (Orellana, 1985). Seasonal variations in salinityhave been associated with irrigation in the Calama area
that causes the leaching of saline soils (Alonso et al.,1992). The poor quality of water in the Second Regionof Chile has forced the construction of treatment plants
to supply drinking water. The Cerro Topater plant islocated upstream of Calama (Fig. 1). Here, the waterfrom the Rio Loa is processed by a conventional tech-
nique using FeCl3 to remove the As. The processingcomprises oxidation, adsorption in settlement tanks, andfiltration to achieve concentrations of <50 mg/l As. The
Cerro Topater effluents contain As in the range of 20–500mg/l. Until 2000, these effluents were discharged directlyinto the Rio Loa with a daily volume of 1044 m3.The flow of water in the Rio Loa usually shows sea-
sonal variations in the range of 500–3000 l/s (GARHIN,1994). During rare heavy-rain events occurring in theAndes Cordillera, its flow may exceptionally increase up
to four orders of magnitude. The last storm eventsoccurred in March 1997, February 2000 and February2001, and were related to the El Nino phenomenon.
Due to the high hydraulic gradient, the water flowsdown with a great destructive force, removing andredistributing stream sediments. During the 1997 event,the content of As and heavy metals in the waters of the
Rio Loa increased considerably and As concentrationsup to 30 mg/l were observed at the Sloman reservoir(CONAMA, 1997). The agricultural activity around
some towns and villages and the fishing industry in thecoastal region were seriously damaged, and the supplyof drinkable water to the main towns became difficult. A
large contribution to the pollution increase during theseextreme events is ascribed to the downstream dispersionof the sediments deposited in three artificial basins
(Sloman, Santa Fe and Santa Teresa) constructed inthe 1920s and located in the Lower Loa (Fig. 1). Atpresent, these reservoirs are almost 80% filled withsediments heavily contaminated by the wastes of the
mining activity developed in the first half of the 20thcentury (Arroyo et al., 1999). At that time, manymining activities and small-extraction plants (metallic
1400 L. Romero et al. / Applied Geochemistry 18 (2003) 1399–1416
and non-metallic) operated near the Rio Loa con-taminating the river water. Only in 1994 was the dis-posal of mining wastes covered by environmental law.
3. Morphology and geology of the Loa basin
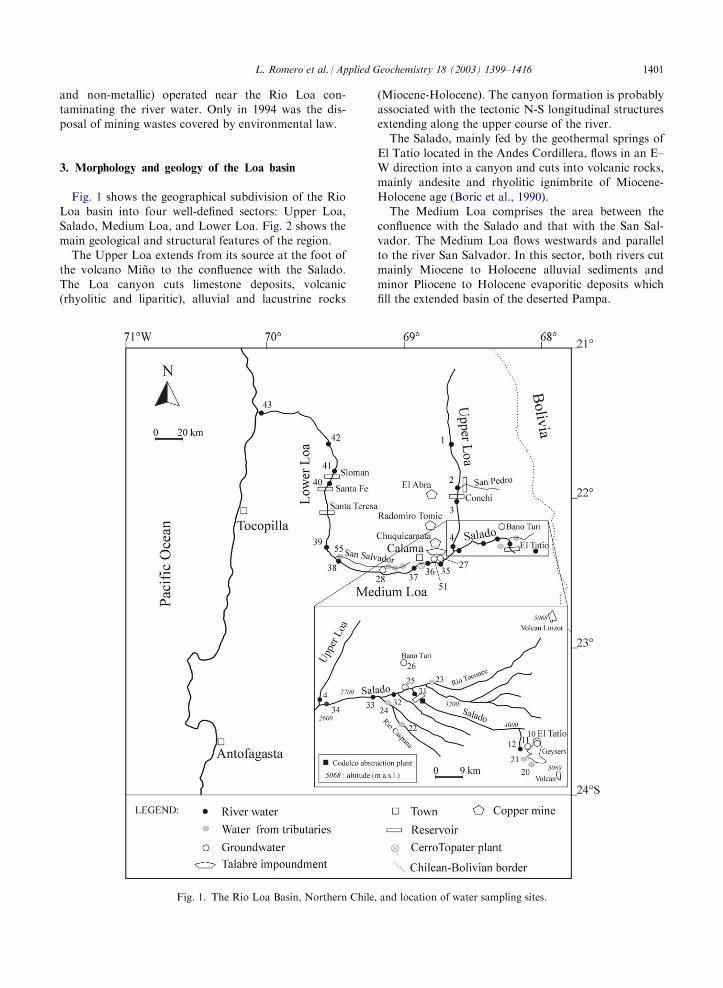
Fig. 1 shows the geographical subdivision of the RioLoa basin into four well-defined sectors: Upper Loa,Salado, Medium Loa, and Lower Loa. Fig. 2 shows the
main geological and structural features of the region.The Upper Loa extends from its source at the foot of
the volcano Mino to the confluence with the Salado.
The Loa canyon cuts limestone deposits, volcanic(rhyolitic and liparitic), alluvial and lacustrine rocks
(Miocene-Holocene). The canyon formation is probablyassociated with the tectonic N-S longitudinal structuresextending along the upper course of the river.The Salado, mainly fed by the geothermal springs of
El Tatio located in the Andes Cordillera, flows in an E–W direction into a canyon and cuts into volcanic rocks,mainly andesite and rhyolitic ignimbrite of Miocene-
Holocene age (Boric et al., 1990).The Medium Loa comprises the area between the
confluence with the Salado and that with the San Sal-
vador. The Medium Loa flows westwards and parallelto the river San Salvador. In this sector, both rivers cutmainly Miocene to Holocene alluvial sediments and
minor Pliocene to Holocene evaporitic deposits whichfill the extended basin of the deserted Pampa.
Fig. 1. The Rio Loa Basin, Northern Chile, and location of water sampling sites.
L. Romero et al. / Applied Geochemistry 18 (2003) 1399–1416 1401
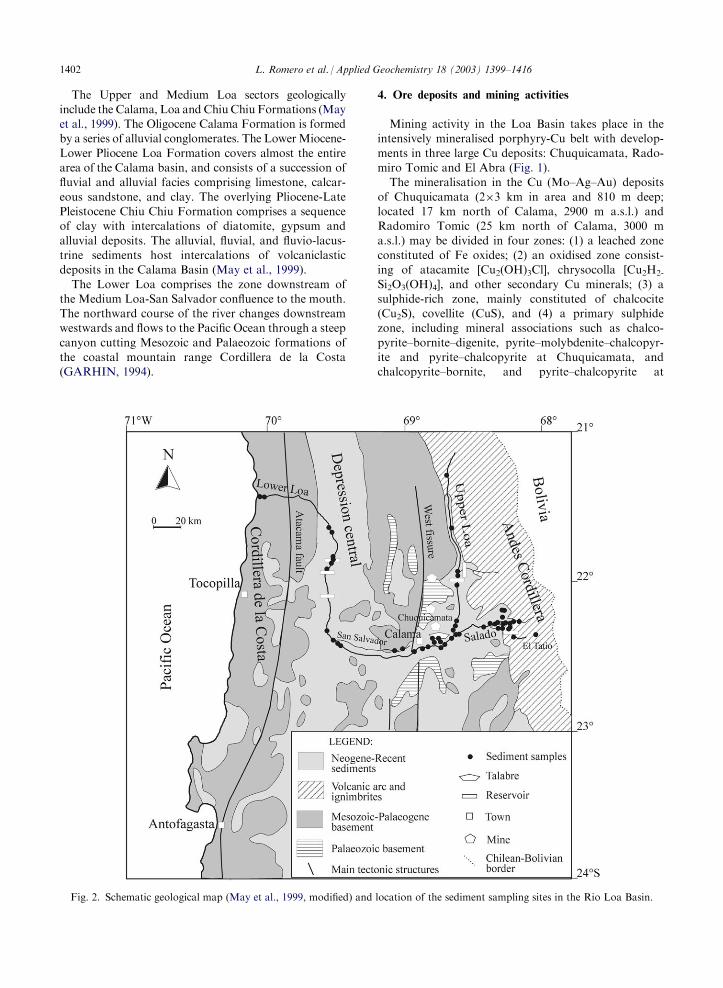
The Upper and Medium Loa sectors geologicallyinclude the Calama, Loa and ChiuChiu Formations (Mayet al., 1999). The Oligocene Calama Formation is formedby a series of alluvial conglomerates. The LowerMiocene-
Lower Pliocene Loa Formation covers almost the entirearea of the Calama basin, and consists of a succession offluvial and alluvial facies comprising limestone, calcar-
eous sandstone, and clay. The overlying Pliocene-LatePleistocene Chiu Chiu Formation comprises a sequenceof clay with intercalations of diatomite, gypsum and
alluvial deposits. The alluvial, fluvial, and fluvio-lacus-trine sediments host intercalations of volcaniclasticdeposits in the Calama Basin (May et al., 1999).
The Lower Loa comprises the zone downstream ofthe Medium Loa-San Salvador confluence to the mouth.The northward course of the river changes downstreamwestwards and flows to the Pacific Ocean through a steep
canyon cutting Mesozoic and Palaeozoic formations ofthe coastal mountain range Cordillera de la Costa(GARHIN, 1994).
4. Ore deposits and mining activities
Mining activity in the Loa Basin takes place in theintensively mineralised porphyry-Cu belt with develop-
ments in three large Cu deposits: Chuquicamata, Rado-miro Tomic and El Abra (Fig. 1).The mineralisation in the Cu (Mo–Ag–Au) deposits
of Chuquicamata (2�3 km in area and 810 m deep;located 17 km north of Calama, 2900 m a.s.l.) andRadomiro Tomic (25 km north of Calama, 3000 m
a.s.l.) may be divided in four zones: (1) a leached zoneconstituted of Fe oxides; (2) an oxidised zone consist-ing of atacamite [Cu2(OH)3Cl], chrysocolla [Cu2H2-
Si2O3(OH)4], and other secondary Cu minerals; (3) asulphide-rich zone, mainly constituted of chalcocite(Cu2S), covellite (CuS), and (4) a primary sulphidezone, including mineral associations such as chalco-
pyrite–bornite–digenite, pyrite–molybdenite–chalcopyr-ite and pyrite–chalcopyrite at Chuquicamata, andchalcopyrite–bornite, and pyrite–chalcopyrite at
Fig. 2. Schematic geological map (May et al., 1999, modified) and location of the sediment sampling sites in the Rio Loa Basin.
1402 L. Romero et al. / Applied Geochemistry 18 (2003) 1399–1416
Radomiro Tomic. The migration of Cu-rich solutionsoriginated the Exotica deposit (2 km south of Chu-quicamata), mainly constituted of chrysocolla andatacamite.
The Cu(Mo) mineralization of the El Abra deposit(42 km north of Chuquicamata at 4000 m a.s.l) com-prises two zones: (1) an oxide zone mainly constituted of
chrysocolla; and (2) a mixed zone constituted ofchrysocolla, cuprite, native copper and chalcocite.Open pit exploitation of the Chuquicamata-Exotica
deposit started in 1920. In 1995, the Codelco ChileDivision Chuquicamata processed about 150,000 tonsper day (t/day) of Cu sulphide, 28,000 t/day of Cu
oxide, and 100,000 t/day of ancient wastes, resulting inan annual production of 600,000 tons of Cu (about 30%of the Chilean national production). The ratio of eco-nomic ore to waste materials is approximately 1:2.7.
One third of the reserves with an average content of1.6% Cu had been exploited by the year 2000, and onethird more (about 1.7 billion tons) with an average
content of 0.84% Cu are planned to be exploited by2025.Water used in the mining activity at Chuquicamata is
extracted from the Loa Basin (the Codelco abstractionplant is shown in the inset map of Fig. 1). In 1980, thewater consumption at Chuquicamata was 1760 l/ton of
mineral processed. In 1995, water consumption wasreduced to 910 l/ton, water abstracted totalled 1960 l/sand the recycled water was 7200 l/s. Tailings from themineral processing are discharged in the Talabre
impoundment (Fig. 1) located in the Salar of Talabre at12 km NE of Calama. This impoundment with an areaof approximately 40 km2 is located in a depression ori-
ginated by fluvial erosion cutting the limestone of theLoa Formation and partially exposing a level of slimeand clay. An impermeable argillaceous parapet isolates
the limestone and prevents the infiltration and drainingof water. In 1999, the water recycled from Talabre toChuquicamata was 690 l/s.
5. Sampling and analytical methods
Sampling of water and river sediments was performedin May 1999, September 2000 and September 2001.Because of the large extent of the area and the difficulty
of access to some remote sites, sampling was undertakenat specific points located at the Upper Loa, Salado,Medium Loa, Lower Loa, and the main tributaries. The
location of water and sediment sampling sites is shownin Figs. 1 and 2, respectively. Waters at sites No. 4, 34,36, 38, 41, 42 and 55 were sampled both in 1999 and2000. Sediment samples were taken at 5 cm depth. The
35 waters and 60 stream sediment samples are con-sidered representative of the environmental situationalong the entire basin.
5.1. Analytical methods for water
The pH, Eh, conductivity, alkalinity, and temperaturewere measured in situ. The Eh was measured by Pt
electrode and values were corrected against ZoBell’ssolution (Nordstrom, 1977). Water samples were filteredin situ at 0.4 mm and acidified with HNO3 (1% v/v,
suprapure grade) for metal analyses. Major, minor andtrace elements in solution were analysed by ion chro-matography (IC, Dionex DX-120), inductively coupled
plasma atomic emission spectrometry (ICP-AES, ARL-3520), and inductively coupled plasma mass spectro-metry (ICP-MS, Perkin Elmer Elan-5000). An aliquot
filtered and acidified to 0.5% v/v HCl was used for thedetermination of As by ICP-AES and flow injectionhydride generation ICP-MS (Cidu, 1996). Data qualitycontrol comprised field blank solutions, analysis of cer-
tified reference solution (NIST-1643d), and comparisonof results derived from different techniques. Accuracyand precision were estimated at �7% and �12%, or
better, at the mg/l and mg/l concentrations, respectively.Charge balancing computed by the PHREEQC com-puter program (Parkhurst, 2001) was 45%. This pro-
gram was also used for speciation and equilibriacalculation.
5.2. Analytical and sequential extraction methods forstream sediments
Samples were dried at room temperature, dis-
aggregated with acetone-washed pestle and mortar, thensieved using a nylon 80 mesh (<170 mm). Only the<170 mm fraction was used for the bulk analysis and
sequential extraction procedure. A portion of eachsample was further ground in an agate mortar and usedfor mineralogical analysis by X-ray powder diffraction
(XRD, Philips PW1710). Bulk analysis (Li, Na, K, Be,Mg, Ca, Sr, Ba, Al, La, Ti, Cr, Mo, Ni, Cu, Ag, Zn, Cd,Pb, and P) was performed by HNO3/HClO4 attack (4:1ml) on a 0.25 g sample. The solutions were heated in an
Al block and analysed by ICP-AES.For the determination of As and Sb, the sieved sam-
ples (0.25 g) were attacked using 1 M Mg(NO3)2 solu-
tion, HCl and KI with a volumetric ratio of 1:5:5,respectively. The solutions were heated in a furnace for6 h at 450 �C and analysed by ICP-AES.
A further characterisation of the samples was under-taken on 1 g of material using the multi-step sequentialextraction scheme by Li et al. (1995). With this method
it is possible to distinguish 5 operationally determinedchemical fractions:
� Exchangeable fraction: extraction with 8 ml of
0.5 M MgCl2 at pH 7, at room temperature;� Fraction bound to carbonates and specifically
adsorbed: leaching with 8 ml of 1 M sodium
L. Romero et al. / Applied Geochemistry 18 (2003) 1399–1416 1403
acetate (NaOAc) at pH 5, at room temperature;� Fraction bound to Fe–Mn oxides: extraction
with 20 ml of 0.04 M hydroxylamine hydro-chloride (NH2OHHCl) in 25% of acetic acid
(HOAc) at 96 �C;� Fraction bound to organic matter and sulphides:
addition of 3 ml of 0.02 M HNO3 and 5 ml of
30% H2O2 at pH 2, at 85 �C; then addition of asecond 3 ml aliquot of 30% H2O2 at pH 2, andfinally 5 ml of 3.2 M ammonium acetate
(NH4Oac) in 20% HNO3;� Residual fraction: digestion with 4 ml of 70%
HNO3, 3 ml of 60% HClO4 and 15 ml of 40%
HF. Samples are taken to dryness by heating at90 �C (6 h), 120 �C (10 h) and 190 �C (6 h).
After the attack and extraction procedures the result-ing fractions were analysed by ICP-AES. In bulk ana-lyses and sequential extractions, trace element accuracy
evaluated by international standard material (NBS-2709and NBS-2710) was �20%; precision evaluated by dupli-cate analysis was usually <10%. In sequential extrac-
tions, the accuracy of As determined at the 100 mg/kglevel was �8%, but at the 10 mg/kg level it was �20%.
6. Results and discussion
6.1. Chemistry of the water
Table 1 reports the physico-chemical parameters andthe most significant major and minor inorganic compo-
nents in the waters of the Rio Loa basin. Overall, sur-face waters show near-neutral to alkaline pH, oxidisingredox conditions, a wide range of total dissolved solids
(TDS: 0.3–10 g/l), and a dominant Na–Cl composition.The water samples collected during different campaignsshow small variations in their chemical composition.The water in the Upper Loa has a relatively low TDS
(1–2 g/l) with a prevalent Na–Cl character and a rela-tively low content (180–250 mg/l) of dissolved SO4. TheAs (120–300 mg/l) and B (6–9 mg/l) concentrations are
the lowest ones in the Rio Loa course, but they greatlyexceed the As limit (50 mg/l) required by the Chileanlaw, and the guidelines (10 mg/l As, and 500 mg/l B)
proposed by the World Health Organisation for drink-ing water (WHO, 1993).Thermal waters in the El Tatio geothermal field
(samples No. 10 and 11) have emergent temperaturesclose to 90 �C, variable TDS (2.6–9.6 g/l) but prevalentNa–Cl character, very low SO4 (37–57 mg/l), high SiO2
(up to 210 mg/l), and extremely high As (27 mg/l), B
(130 mg/l) and Li (27 mg/l). High concentrations of Cs(11 mg/l), Rb (2.4 mg/l) and Sb (1.4 mg/l) are alsoobserved. Ellis and Mahon (1977) reported similar
characteristics and concentration ranges in thermalsprings at El Tatio (Table 2). The thermal waters flowinto the Rio El Tatio and after mixing with surfacewater from the Andes (e.g. samples No. 20, 21) are the
source of the Salado (see inset map in Fig. 1). The geo-thermal input to the Salado is attenuated only at theCodelco abstraction plant (about 30 km from El Tatio,
sample No. 31) and the chemical composition of theSalado remains similar to that of the thermal water aftermoderate dilution as far as the confluence with the
Upper Loa (about 70 km downstream of El Tatio,sample No. 34).In the Medium Loa basin, the dilution effect observed
downstream of the Upper Loa -Salado confluence per-sists over a short distance only. In fact, TDS graduallystarts to rise downstream of Calama, and the As con-centration reaches 2.9 mg/l, B 42 mg/l, and Li 10 mg/l in
the Lower Loa.The general features of the water chemistry in the Loa
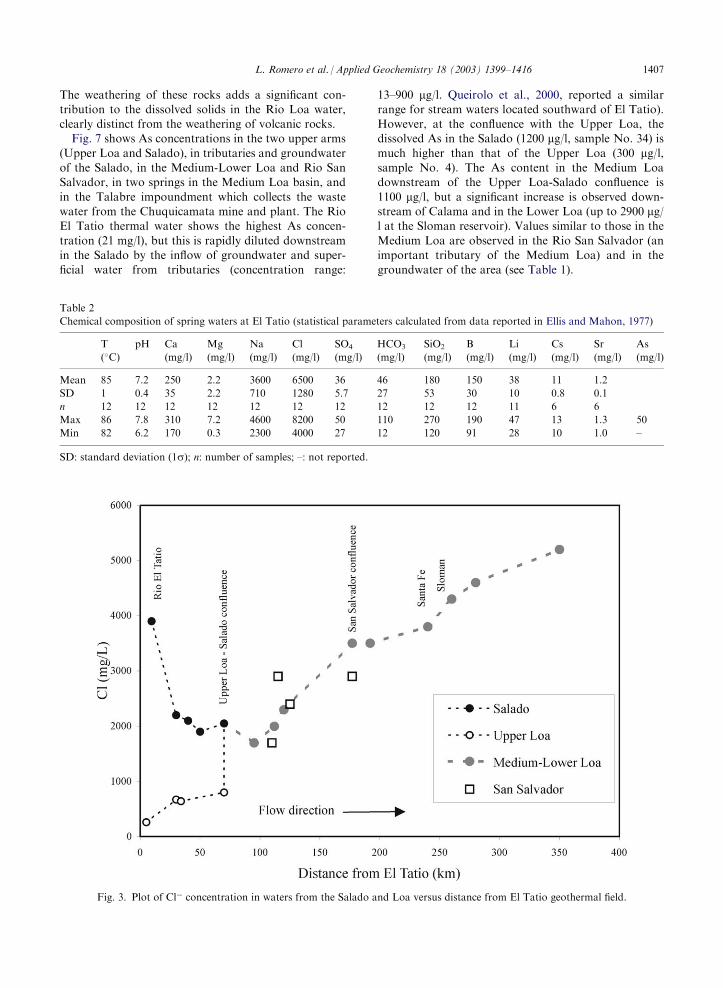
basin are summarised in Figs. 3–6. Both upper arms are
sketched in the figures since the confluence site isapproximately equally distant from both sources. Fig. 3shows the variation of Cl in the Salado-Loa basin: the
thermal water from El Tatio is an important source ofCl, but additional sources occur in the Medium andLower Loa. Fig. 4 shows the SO4/Cl ratio and Sr con-
centration. Sulphate and Sr concentrations, low at ElTatio, significantly increase in the downstream part ofthe Medium Loa and in the Lower Loa. Fig. 5 showsthe water to be oversaturated with respect to calcite and
strontianite along the entire course but at El Tatio, andundersaturated with respect to gypsum and celestite.The dissolution of SO4 solid phases explains the uncon-
trolled increase of dissolved SO4, and the moderateincrease of Ca, as well as Mg and Sr (see Table 1); thesein turn are further controlled by the equilibrium with
solid carbonate phases. Fig. 6 represents the behaviourof SiO2, B, and Li, whose concentrations in the Loawaters seem to derive from the El Tatio geothermalfield. The tributaries flowing into the Salado and the
Upper Loa water cause a marked dilution of the geo-thermal components. However, while SiO2 continues todecrease until the mouth, B and Li reach a minimum
value downstream of the Upper Loa-Salado confluenceand then increase again.When looking at the modifications in the water
chemistry in the entire Rio Loa it is apparent that theyreflect the interaction with different rocks in the basin.The interaction of water with young volcanic rocks,
distinguished by the high SiO2, Li, and B contents, isvery strong in the water circulating at depth in the ElTatio geothermal field, and is important in the Mediumand Lower Loa basin too. On the other hand, the increa-
ses of SO4/Cl and Sr, as well as B and Li, in the Medium-Lower Loa are related to the predominance of sedimen-tary formations (see Fig. 2) hosting evaporitic minerals.
1404 L. Romero et al. / Applied Geochemistry 18 (2003) 1399–1416
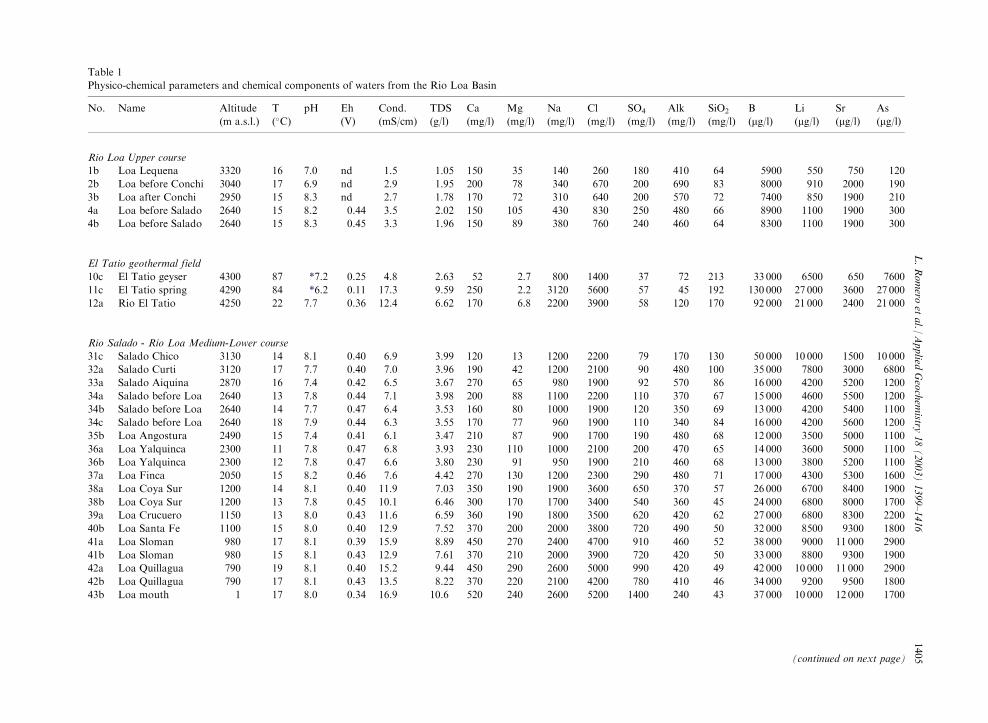
Table 1
Physico-chemical parameters and chemical components of waters from the Rio Loa Basin
No. Name Altitude
(m a.s.l.)
T
(�C)
pH Eh
(V)
Cond.
(mS/cm)
TDS
(g/l)
Ca
(mg/l)
Mg
(mg/l)
Na
(mg/l)
Cl
(mg/l)
SO4
(mg/l)
A
(
SiO2
(mg/l)
B
(mg/l)Li
(mg/l)Sr
(mg/l)As
(mg/l)
Rio Loa Upper course
1b Loa Lequena 3320 16 7.0 nd 1.5 1.05 150 35 140 260 180 64 5900 550 750 120
2b Loa before Conchi 3040 17 6.9 nd 2.9 1.95 200 78 340 670 200 83 8000 910 2000 190
3b Loa after Conchi 2950 15 8.3 nd 2.7 1.78 170 72 310 640 200 72 7400 850 1900 210
4a Loa before Salado 2640 15 8.2 0.44 3.5 2.02 150 105 430 830 250 66 8900 1100 1900 300
4b Loa before Salado 2640 15 8.3 0.45 3.3 1.96 150 89 380 760 240 64 8300 1100 1900 300
El Tatio geothermal field
10c El Tatio geyser 4300 87 *7.2 0.25 4.8 2.63 52 2.7 800 1400 37 213 33 000 6500 650 7600
11c El Tatio spring 4290 84 *6.2 0.11 17.3 9.59 250 2.2 3120 5600 57 192 130 000 27 000 3600 27 000
12a Rio El Tatio 4250 22 7.7 0.36 12.4 6.62 170 6.8 2200 3900 58 170 92 000 21 000 2400 21 000
Rio Salado - Rio Loa Medium-Lower course
31c Salado Chico 3130 14 8.1 0.40 6.9 3.99 120 13 1200 2200 79 130 50 000 10 000 1500 10 000
32a Salado Curti 3120 17 7.7 0.40 7.0 3.96 190 42 1200 2100 90 100 35 000 7800 3000 6800
33a Salado Aiquina 2870 16 7.4 0.42 6.5 3.67 270 65 980 1900 92 86 16 000 4200 5200 1200
34a Salado before Loa 2640 13 7.8 0.44 7.1 3.98 200 88 1100 2200 110 67 15 000 4600 5500 1200
34b Salado before Loa 2640 14 7.7 0.47 6.4 3.53 160 80 1000 1900 120 69 13 000 4200 5400 1100
34c Salado before Loa 2640 18 7.9 0.44 6.3 3.55 170 77 960 1900 110 84 16 000 4200 5600 1200
35b Loa Angostura 2490 15 7.4 0.41 6.1 3.47 210 87 900 1700 190 68 12 000 3500 5000 1100
36a Loa Yalquinca 2300 11 7.8 0.47 6.8 3.93 230 110 1000 2100 200 65 14 000 3600 5000 1100
36b Loa Yalquinca 2300 12 7.8 0.47 6.6 3.80 230 91 950 1900 210 68 13 000 3800 5200 1100
37a Loa Finca 2050 15 8.2 0.46 7.6 4.42 270 130 1200 2300 290 71 17 000 4300 5300 1600
38a Loa Coya Sur 1200 14 8.1 0.40 11.9 7.03 350 190 1900 3600 650 57 26 000 6700 8400 1900
38b Loa Coya Sur 1200 13 7.8 0.45 10.1 6.46 300 170 1700 3400 540 45 24 000 6800 8000 1700
39a Loa Crucuero 1150 13 8.0 0.43 11.6 6.59 360 190 1800 3500 620 62 27 000 6800 8300 2200
40b Loa Santa Fe 1100 15 8.0 0.40 12.9 7.52 370 200 2000 3800 720 50 32 000 8500 9300 1800
41a Loa Sloman 980 17 8.1 0.39 15.9 8.89 450 270 2400 4700 910 52 38 000 9000 11 000 2900
41b Loa Sloman 980 15 8.1 0.43 12.9 7.61 370 210 2000 3900 720 50 33 000 8800 9300 1900
42a Loa Quillagua 790 19 8.1 0.40 15.2 9.44 450 290 2600 5000 990 49 42 000 10 000 11 000 2900
42b Loa Quillagua 790 17 8.1 0.43 13.5 8.22 370 220 2100 4200 780 46 34 000 9200 9500 1800
43b Loa mouth 1 17 8.0 0.34 16.9 10.6 520 240 2600 5200 1400 43 37 000 10 000 12 000 1700
(continued on next page)
L.Romero
etal./Applied
Geochemistry
18(2003)1399–1416
1405
lk
mg/l)
410
690
570
480
460
72
45
120
170
480
570
370
350
340
480
470
460
480
370
360
420
490
460
420
420
410
240
1406
Table 1 (continued)No. Name Altitude
(m a.s.l.)
T
(�C)
pH Eh
(V)
Cond.
(mS/cm)
TDS
(g/l)
Ca
(mg/l)
Mg
(mg/l)
Na
(mg/l)
Cl
(mg/l)
SO4
(mg/l)
A
(
SiO2
(mg/l)
B
(mg/l)Li
(mg/l)Sr
(mg/l)As
(mg/l)
Tributaries to Rio Salado
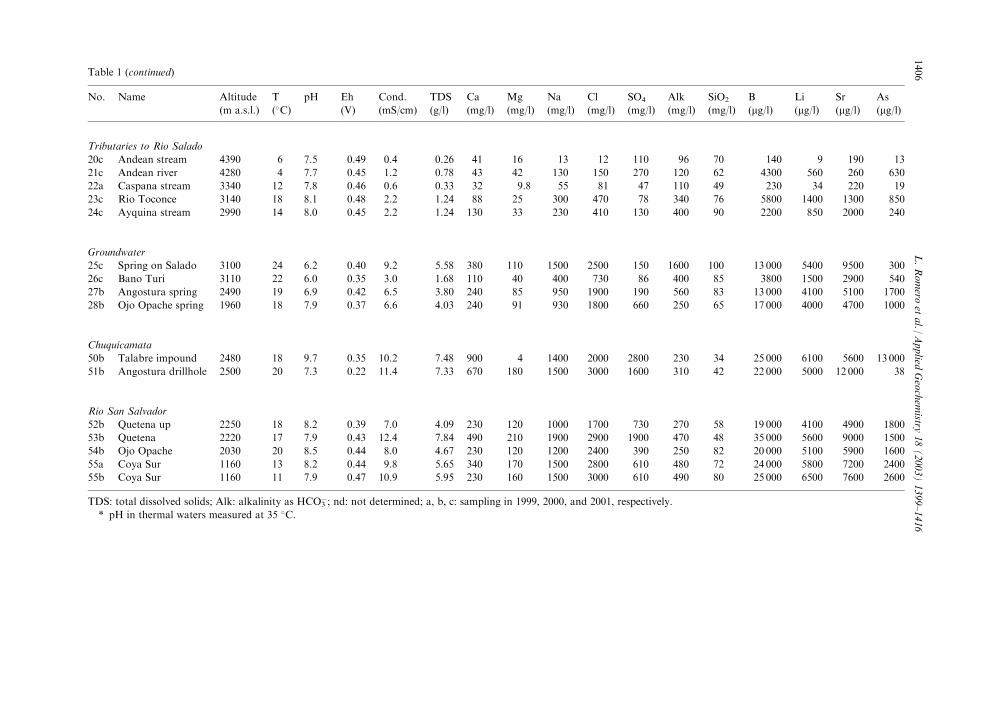
20c Andean stream 4390 6 7.5 0.49 0.4 0.26 41 16 13 12 110 70 140 9 190 13
21c Andean river 4280 4 7.7 0.45 1.2 0.78 43 42 130 150 270 62 4300 560 260 630
22a Caspana stream 3340 12 7.8 0.46 0.6 0.33 32 9.8 55 81 47 49 230 34 220 19
23c Rio Toconce 3140 18 8.1 0.48 2.2 1.24 88 25 300 470 78 76 5800 1400 1300 850
24c Ayquina stream 2990 14 8.0 0.45 2.2 1.24 130 33 230 410 130 90 2200 850 2000 240
Groundwater
25c Spring on Salado 3100 24 6.2 0.40 9.2 5.58 380 110 1500 2500 150 1 100 13 000 5400 9500 300
26c Bano Turi 3110 22 6.0 0.35 3.0 1.68 110 40 400 730 86 85 3800 1500 2900 540
27b Angostura spring 2490 19 6.9 0.42 6.5 3.80 240 85 950 1900 190 83 13 000 4100 5100 1700
28b Ojo Opache spring 1960 18 7.9 0.37 6.6 4.03 240 91 930 1800 660 65 17 000 4000 4700 1000
Chuquicamata
50b Talabre impound 2480 18 9.7 0.35 10.2 7.48 900 4 1400 2000 2800 34 25 000 6100 5600 13 000
51b Angostura drillhole 2500 20 7.3 0.22 11.4 7.33 670 180 1500 3000 1600 42 22 000 5000 12 000 38
Rio San Salvador
52b Quetena up 2250 18 8.2 0.39 7.0 4.09 230 120 1000 1700 730 58 19 000 4100 4900 1800
53b Quetena 2220 17 7.9 0.43 12.4 7.84 490 210 1900 2900 1900 48 35 000 5600 9000 1500
54b Ojo Opache 2030 20 8.5 0.44 8.0 4.67 230 120 1200 2400 390 82 20 000 5100 5900 1600
55a Coya Sur 1160 13 8.2 0.44 9.8 5.65 340 170 1500 2800 610 72 24 000 5800 7200 2400
55b Coya Sur 1160 11 7.9 0.47 10.9 5.95 230 160 1500 3000 610 80 25 000 6500 7600 2600
TDS: total dissolved solids; Alk: alkalinity as HCO3�; nd: not determined; a, b, c: sampling in 1999, 2000, and 2001, respectively
* pH in thermal waters measured at 35 �C.
L.Romero
etal./Applied
Geochemistry
18(2003)1399–1416
lk
mg/l)
96
120
110
340
400
600
400
560
250
230
310
270
470
250
480
490
.
The weathering of these rocks adds a significant con-tribution to the dissolved solids in the Rio Loa water,clearly distinct from the weathering of volcanic rocks.Fig. 7 shows As concentrations in the two upper arms
(Upper Loa and Salado), in tributaries and groundwaterof the Salado, in the Medium-Lower Loa and Rio SanSalvador, in two springs in the Medium Loa basin, and
in the Talabre impoundment which collects the wastewater from the Chuquicamata mine and plant. The RioEl Tatio thermal water shows the highest As concen-
tration (21 mg/l), but this is rapidly diluted downstreamin the Salado by the inflow of groundwater and super-ficial water from tributaries (concentration range:
13–900 mg/l. Queirolo et al., 2000, reported a similarrange for stream waters located southward of El Tatio).However, at the confluence with the Upper Loa, thedissolved As in the Salado (1200 mg/l, sample No. 34) is
much higher than that of the Upper Loa (300 mg/l,sample No. 4). The As content in the Medium Loadownstream of the Upper Loa-Salado confluence is
1100 mg/l, but a significant increase is observed down-stream of Calama and in the Lower Loa (up to 2900 mg/l at the Sloman reservoir). Values similar to those in the
Medium Loa are observed in the Rio San Salvador (animportant tributary of the Medium Loa) and in thegroundwater of the area (see Table 1).
Fig. 3. Plot of Cl� concentration in waters from the Salado and Loa versus distance from El Tatio geothermal field.
Table 2
Chemical composition of spring waters at El Tatio (statistical parameters calculated from data reported in Ellis and Mahon, 1977)
T
(�C)
pH
Ca(mg/l)
Mg
(mg/l)
Na
(mg/l)
Cl
(mg/l)
SO4
(mg/l)
HCO3
(mg/l)
SiO2
(mg/l)
B
(mg/l)
Li
(mg/l)
Cs
(mg/l)
Sr
(mg/l)
As
(mg/l)
Mean
85 7.2 250 2.2 3600 6500 36 46 180 150 38 11 1.2SD
1 0.4 35 2.2 710 1280 5.7 27 53 30 10 0.8 0.1n
12 12 12 12 12 12 12 12 12 12 11 6 6Max
86 7.8 310 7.2 4600 8200 50 110 270 190 47 13 1.3 50Min
82 6.2 170 0.3 2300 4000 27 12 120 91 28 10 1.0 –SD: standard deviation (1s); n: number of samples; –: not reported.
L. Romero et al. / Applied Geochemistry 18 (2003) 1399–1416 1407
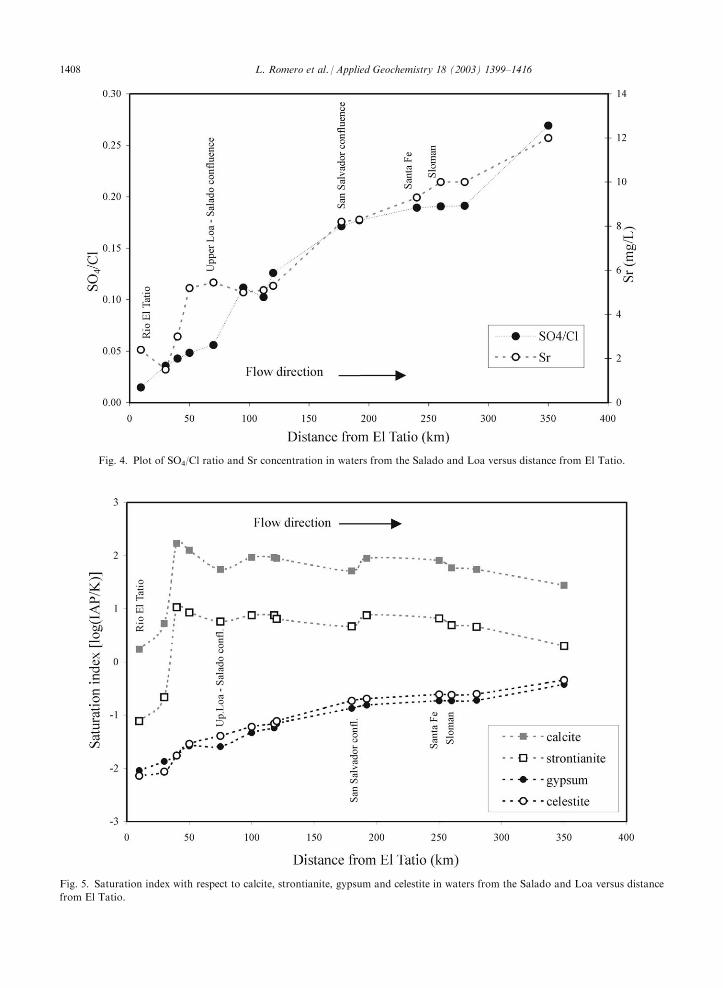
Fig. 4. Plot of SO4/Cl ratio and Sr concentration in waters from the Salado and Loa versus distance from El Tatio.
Fig. 5. Saturation index with respect to calcite, strontianite, gypsum and celestite in waters from the Salado and Loa versus distance
from El Tatio.
1408 L. Romero et al. / Applied Geochemistry 18 (2003) 1399–1416
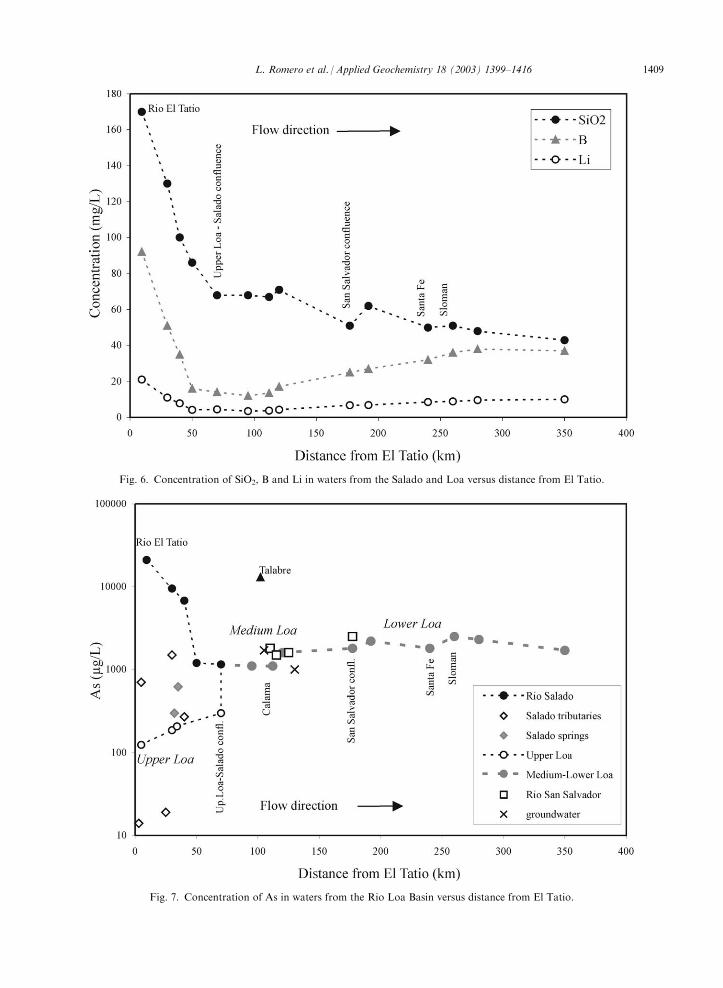
Fig. 6. Concentration of SiO2, B and Li in waters from the Salado and Loa versus distance from El Tatio.
Fig. 7. Concentration of As in waters from the Rio Loa Basin versus distance from El Tatio.
L. Romero et al. / Applied Geochemistry 18 (2003) 1399–1416 1409
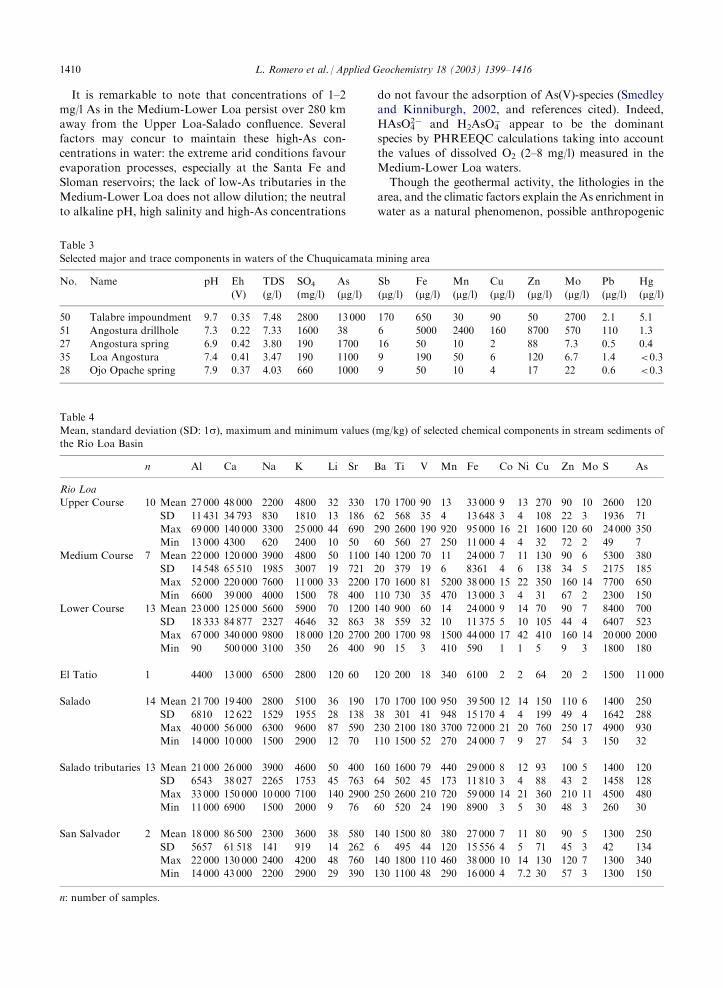
It is remarkable to note that concentrations of 1–2mg/l As in the Medium-Lower Loa persist over 280 kmaway from the Upper Loa-Salado confluence. Severalfactors may concur to maintain these high-As con-
centrations in water: the extreme arid conditions favourevaporation processes, especially at the Santa Fe andSloman reservoirs; the lack of low-As tributaries in the
Medium-Lower Loa does not allow dilution; the neutralto alkaline pH, high salinity and high-As concentrations
do not favour the adsorption of As(V)-species (Smedleyand Kinniburgh, 2002, and references cited). Indeed,HAsO4
2� and H2AsO4� appear to be the dominant
species by PHREEQC calculations taking into account
the values of dissolved O2 (2–8 mg/l) measured in theMedium-Lower Loa waters.Though the geothermal activity, the lithologies in the
area, and the climatic factors explain the As enrichment inwater as a natural phenomenon, possible anthropogenic
Table 4
Mean, standard deviation (SD: 1s), maximum and minimum values (mg/kg) of selected chemical components in stream sediments of
the Rio Loa Basin
n
Al Ca Na K Li Sr Ba Ti V Mn Fe Co Ni Cu Zn Mo S AsRio Loa
Upper Course
10 Mean 27 000 48 000 2200 4800 32 330 170 1700 90 13 33 000 9 13 270 90 10 2600 120SD
11 431 34 793 830 1810 13 186 62 568 35 4 13 648 3 4 108 22 3 1936 71Max
69 000 140 000 3300 25 000 44 690 290 2600 190 920 95 000 16 21 1600 120 60 24 000 350Min
13 000 4300 620 2400 10 50 60 560 27 250 11 000 4 4 32 72 2 49 7Medium Course
7 Mean 22 000 120 000 3900 4800 50 1100 140 1200 70 11 24 000 7 11 130 90 6 5300 380SD
14 548 65 510 1985 3007 19 721 20 379 19 6 8361 4 6 138 34 5 2175 185Max
52 000 220 000 7600 11 000 33 2200 170 1600 81 5200 38 000 15 22 350 160 14 7700 650Min
6600 39 000 4000 1500 78 400 110 730 35 470 13 000 3 4 31 67 2 2300 150Lower Course
13 Mean 23 000 125 000 5600 5900 70 1200 140 900 60 14 24 000 9 14 70 90 7 8400 700SD
18 333 84 877 2327 4646 32 863 38 559 32 10 11 375 5 10 105 44 4 6407 523Max
67 000 340 000 9800 18 000 120 2700 200 1700 98 1500 44 000 17 42 410 160 14 20 000 2000Min
90 500 000 3100 350 26 400 90 15 3 410 590 1 1 5 9 3 1800 180El Tatio
1 4400 13 000 6500 2800 120 60 120 200 18 340 6100 2 2 64 20 2 1500 11 000Salado
14 Mean 21 700 19 400 2800 5100 36 190 170 1700 100 950 39 500 12 14 150 110 6 1400 250SD
6810 12 622 1529 1955 28 138 38 301 41 948 15 170 4 4 199 49 4 1642 288Max
40 000 56 000 6300 9600 87 590 230 2100 180 3700 72 000 21 20 760 250 17 4900 930Min
14 000 10 000 1500 2900 12 70 110 1500 52 270 24 000 7 9 27 54 3 150 32Salado tributaries
13 Mean 21 000 26 000 3900 4600 50 400 160 1600 79 440 29 000 8 12 93 100 5 1400 120SD
6543 38 027 2265 1753 45 763 64 502 45 173 11 810 3 4 88 43 2 1458 128Max
33 000 150 000 10 000 7100 140 2900 250 2600 210 720 59 000 14 21 360 210 11 4500 480Min
11 000 6900 1500 2000 9 76 60 520 24 190 8900 3 5 30 48 3 260 30San Salvador
2 Mean 18 000 86 500 2300 3600 38 580 140 1500 80 380 27 000 7 11 80 90 5 1300 250SD
5657 61 518 141 919 14 262 6 495 44 120 15 556 4 5 71 45 3 42 134Max
22 000 130 000 2400 4200 48 760 140 1800 110 460 38 000 10 14 130 120 7 1300 340Min
14 000 43 000 2200 2900 29 390 130 1100 48 290 16 000 4 7.2 30 57 3 1300 150n: number of samples.
Table 3
Selected major and trace components in waters of the Chuquicamata mining area
No.
Name pH Eh(V)
TDS
(g/l)
SO4
(mg/l)
As
(mg/l)
Sb(mg/l)
Fe(mg/l)
Mn(mg/l)
Cu(mg/l)
Zn(mg/l)
Mo(mg/l)
Pb(mg/l)
Hg(mg/l)
50
Talabre impoundment 9.7 0.35 7.48 2800 13 000 170 650 30 90 50 2700 2.1 5.151
Angostura drillhole 7.3 0.22 7.33 1600 38 6 5000 2400 160 8700 570 110 1.327
Angostura spring 6.9 0.42 3.80 190 1700 16 50 10 2 88 7.3 0.5 0.435
Loa Angostura 7.4 0.41 3.47 190 1100 9 190 50 6 120 6.7 1.4 <0.328
Ojo Opache spring 7.9 0.37 4.03 660 1000 9 50 10 4 17 22 0.6 <0.31410 L. Romero et al. / Applied Geochemistry 18 (2003) 1399–1416
sources must be considered too. They include emissionsfrom the Cu smelting plant (Codelco Chile DivisionChuquicamata), the mine wastes deposited in the pastalong and near the bed of the river, and inadequate
treatment of the effluents from mining activities, as wellas the As-rich effluents from the water treatment plantin Cerro Topater near Calama.
Since one of the aims of this study was to evaluate theimpact of the present-day mining activity, as manywater samples as possible were collected in the area of
Chuquicamata. Table 3 reports the 4 water samplesclosest to Chuquicamata (see Fig. 1), plus the OjoOpache spring in the Rio San Salvador basin reported
for comparison. This table only lists the chemical com-ponents which could be derived from the weathering ofore deposit minerals (major components are reported inTable 1). The Talabre impoundment (sample No. 50),
which collects the waste water from Chuquicamata,exhibits high pH (9.7), due to the use of alkalisingmaterial in the mineral processing, and high concentra-
tions of SO4, As, Mo, Sb and Hg. Data from the drill-hole (sample No. 51, water table 45 m below thesurface) show concentrations of Fe, Mn, Zn, Pb and Cu
much higher than in Talabre. The lower Eh and/or near-neutral pH in the drillhole as compared with Eh - pH
conditions in Talabre, may increase the mobilisation ofFe, Mn, Zn, Pb and Cu (Stumm and Morgan, 1996).The very low content of As in the drillhole may berelated to sorption processes involving Mn- and Fe-
bearing solid phases (e.g. Wilkie and Hering, 1996).Both sets of data from Talabre and the drillhole areconsistent with a circulation in mine wastes or miner-
alised rocks; specifically, the relatively high contents ofSO4, Mo, Cu, Zn, Pb and Hg might testify an impact ofthe mining plants around Chuquicamata. On the other
hand, the values of these components in the Angosturaspring and in the Rio Loa at Angostura, are much lowerthan those from Talabre, and are fairly similar to the
concentrations observed in the Ojo Opache spring(about 50 km from Chuquicamata). Therefore, anydirect impact of the mining activity on the surroundingenvironment should be of limited extent. It may be
argued that the lack of rain in the area does not allowmobilisation and transport of contaminants from thesolid phases into the Loa river.
6.2. Chemistry of stream sediments
The XRD analysis on 12 stream sediment samplesfrom the Loa basin reveals the most abundant minerals
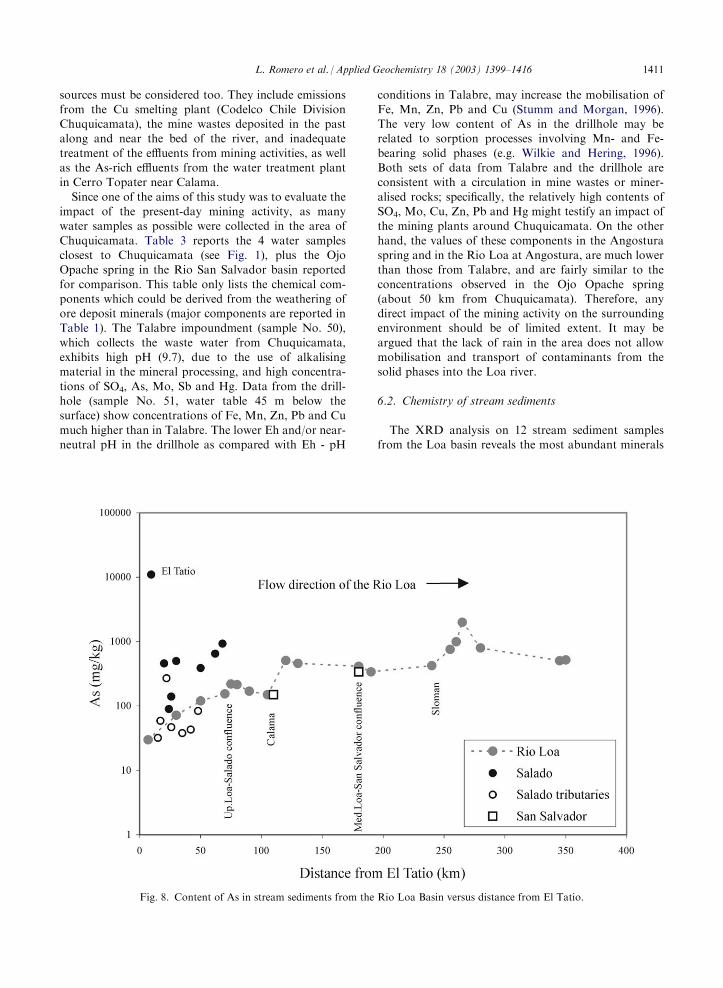
Fig. 8. Content of As in stream sediments from the Rio Loa Basin versus distance from El Tatio.
L. Romero et al. / Applied Geochemistry 18 (2003) 1399–1416 1411
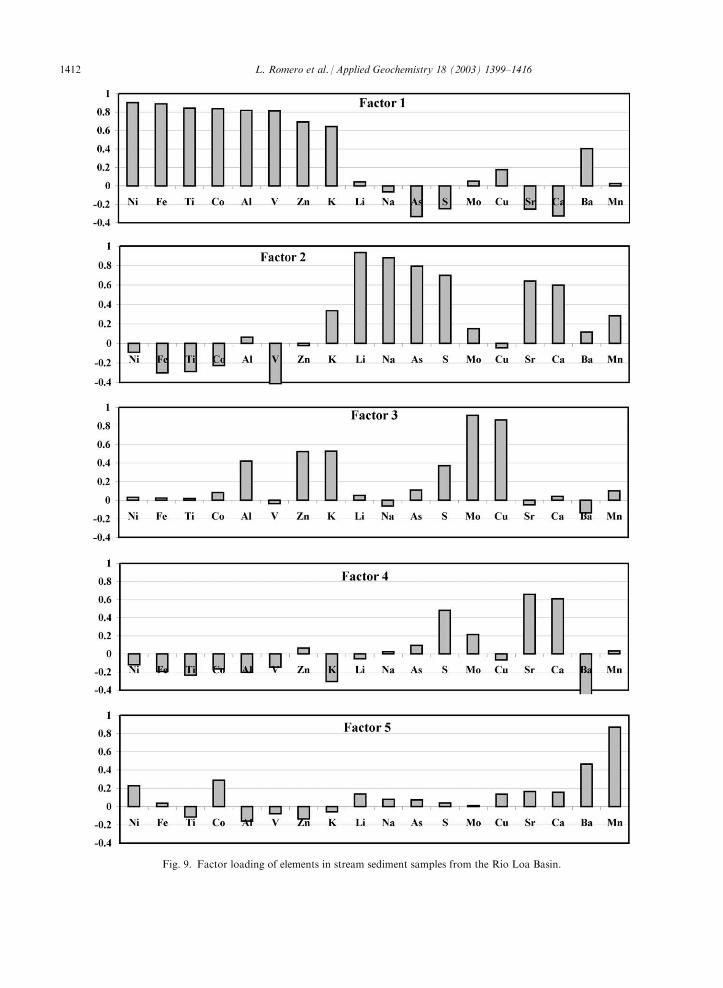
Fig. 9. Factor loading of elements in stream sediment samples from the Rio Loa Basin.
1412 L. Romero et al. / Applied Geochemistry 18 (2003) 1399–1416
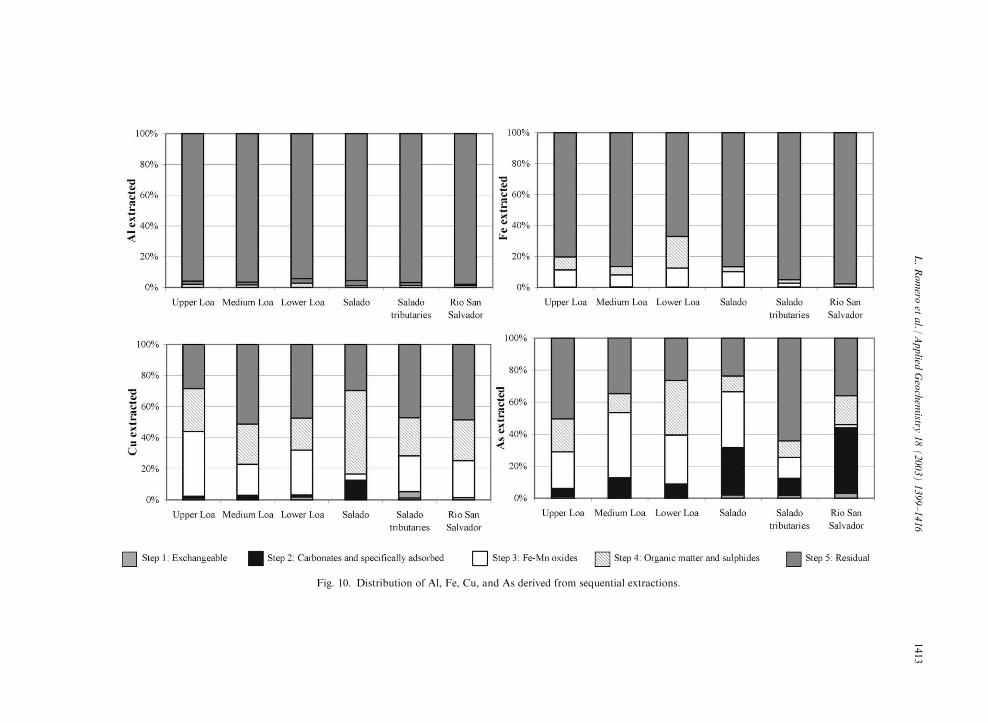
Fig. 10. Distribution of Al, Fe, Cu, and As derived from sequential extraction
L.Romero
etal./Applied
Geochemistry
18(2003)1399–1416
1413
s.
to be plagioclase, muscovite and quartz, with minoramounts of brushite (Ca–phosphate), and gypsum. Atotal of 60 samples were analysed for 18 elements; theresults are summarised in Table 4 as average values and
relative statistical parameters in the different areas ofthe basin.Average values of Fe, Al, Ca and Cu range from
24,000–40,000, 17,000–25,000, 9000–95,000, and 50–220mg/kg, respectively. The average Fe and Al amountsappear negatively correlated to Ca amounts. Assuming
that Fe and Al are mainly bound to alumo–silicate spe-cies, and Ca to sulphate–carbonate species, it is sug-gested that sediments from volcanic origin clearly
prevail in the Upper Loa and Salado, while Ca-richsedimentary formations contribute largely to the sedi-ment chemistry in the Medium and Lower Loa and SanSalvador. This is in agreement with the lithologic fea-
tures of the region where the extent of sedimentary for-mations increases downstream (see Fig. 2). On a similarbasis it could be argued that the high Cu amounts in
sediments derive from the porphyry Cu deposits in theregion. This is generally true when it is considered that,excluding the outliers, the mean Cu content in the
stream sediments of the Rio Loa basin is 130 mg/kg,compared with world-wide average values of 80, 60, and25 mg/kg Cu in basalt, andesite, and soil, respectively
(Wedepohl, 1974). However, a precise association ofhigh Cu contents with the localisation of the maindeposits (e.g. Chuquicamata in the Medium Loa basin)is not observed. Indeed, the wide spread of mineralised
bodies in the area and the dissemination of mine wastesmay be responsible for the relatively constant high valueof Cu observed everywhere.
The average content of As in stream sediments fromdifferent regions of the Loa Basin ranges from 120 to700 mg/kg; the extremely high value (11,000 mg/kg)
observed at El Tatio reflects a direct As supply from thegeothermal area. Fig. 8 shows the As content in streamsediments versus the relative distance of samples fromEl Tatio. In the upper part of the basin, the sediments
along the Salado are richer in As than those of theUpper Loa. Downstream of the Upper Loa-Saladoconfluence, the As content in sediments increases show-
ing two sharp steps downstream of Calama in the Med-ium Loa (510 mg/kg), and downstream of the Slomanreservoir in the Lower Loa (up to 2000 mg/kg). Then,
As concentrations in sediments do not change sig-nificantly until the mouth. This behaviour indicates thepresence of an initial As source (El Tatio geothermal
field), as well as additional sources in the entire LoaBasin with two specific inputs.In order to identify the element associations, and
possibly distinguish the potential As sources, factor
analysis using the software SPSS 6.0 (Norusis, 1996)was performed. Five main factors which explain the86% of the variance expressed by the data matrix have
been defined. Fig. 9 shows the graphical representationof these factors. Factor 1 which explains 43% of thevariance, includes the following components: Ni, Fe, Ti,Co, Al, V, Zn, and K, and probably represents the
mineralogical alumo–silicate component in the sedi-ment. Factor 2 (23% of the variance) groups Li, Na, Asand S and may reflect the impact of geothermal activity
on the sediments in the area. Factor 3 (10% of the var-iance) associates Cu, Mo, Zn and S, is strictly related tothe porphyry Cu mineralisation, with K and Al prob-
ably derived from its alteration. Factor 4 (5% of thevariance) includes Ca, Sr and S and seems to reflect thechemical component in the sediments linked to evaporitic
minerals. Factor 5 (5% of the variance) is essentially dueto Mn and Ba and may reflect the presence of Mn-oxideswhere Ba can be an important constituent (Wedepohl,1978; Baturin and Chelishchev, 1998).
Results of the sequential extractions performed on 38samples are shown as mean values of Al, Fe, Cu and Asin Fig. 10. More than 90% of Al and approximately 80–
90% of Fe are present in the residual phase, thus con-firming that both elements mainly belong to alumo–sili-cate clastic phases. Part of the Fe (approximately 10%)
is bound to sulphide phases and to crystalline oxides.The plot for Cu shows its predominant distribution insulphides and residual phases (from 56 to 84%); a sig-
nificant amount is associated with crystalline oxidephases.Though mainly extracted from residual phases (aver-
age 39%), sulphides (average 18%), and oxides (average
23%), As is extracted from the carbonate (average 18%)and exchangeable (average 2%) fractions too, indicatingthat part of the As is readily available. This result is in
agreement with the correlation observed between Ascontent in sediments and As concentration in waters inthe Rio Loa study area (R2=0.70; n=18, both sediment
and water samples being collected at the same site). Thesignificant percentages of As extracted in the first threesteps of the sequential extraction procedure from theSalado samples, directly influenced by the El Tatio geo-
thermal field, may be related to the presence of crystal-line and amorphous secondary Fe–Mn oxides, observedin the mineralogical study, with a strong capacity to co-
precipitate or sorb elements (Bowell, 1994; Kavanagh etal. 1997).
7. Conclusions
Water and sediments in the basin of the 440 km long RioLoa are enriched in many elements besides As. Arsenic hasbeen discussed in more detail because it represents the mainchemical source of risk in the whole basin.
The high concentration of As (mean value 1400 mg/l)in the Rio Loa water is generally associated with highconcentrations of B and Li. This apparently indicates a
1414 L. Romero et al. / Applied Geochemistry 18 (2003) 1399–1416
common source of these elements. This common sourcehas been identified in the El Tatio geothermal fieldlocated in the Andes Cordillera, with a relevant impactin the Salado tributary. The extremely high As (up to
27,000 mg/l) in the El Tatio water decreases down to1200 mg/l As about 70 km downstream (at the UpperLoa-Salado confluence). However, the As concentra-
tions significantly increase in the Medium and LowerLoa water and persist to the mouth in the Pacific Ocean.Hence, a direct supply of contaminants from El Tatio
cannot be the only factor governing the river chemistry.The very dry climate and strong evaporation in the area,and the lack of any dilution from unaffected streams,
may only partially explain this fact. Indeed, groundwaters interacting with volcanic rocks, with compositionanalogous to those in the geothermal field, also showrelatively high As, Li and B, and their inflow into the
Medium and Lower Loa may contribute to keep highconcentrations of these components in the riverwater.
High As contents are observed in stream sedimentsamples collected at several sites in the whole Loa basin.The average As in these sediments is 320 mg/kg, i.e. at
least 10 times higher than world-wide average values (5–10 mg/kg As) reported for similar sediments and rocks(Smedley and Kinniburgh, 2002, and references cited).
Results from sequential extractions show that the As inthe Loa sediments is mainly associated with Fe–Mnoxides and residual phases. However, a significantamount of As is also extracted in the first steps of the
procedure indicating that part of the As is readilyavailable.Emissions from the Cu smelting plant at Chuquica-
mata, the mine wastes deposited in the past in the bedand on the banks of the river, inadequate treatment ofthe effluents from mining activities, as well as the As-
rich effluents from the water treatment plant at Calama,represent other potential sources of As. However, thepoor quality (high TDS, As and B) of the water cannotbe directly ascribed to the intense mining activity. The
very dry climate may explain the low mobilisation ofcontaminants from these sites even when contaminatedmaterials are piled up in the environment without spe-
cific devices. More detailed studies in the area aroundChuquicamata and in the Lower Loa would be neces-sary for a better evaluation of effects derived from these
anthropogenic sources.Presently, the remobilization of contaminants at very
high levels in connection with heavy-rain events on the
Andes Cordillera, as was observed in 1997, 2000 and2001, is the major environmental hazard. During theseevents, the reworking of contaminated sediments andmining wastes abandoned in huge amounts along and
nearby the river course represents a very dangerousadditional source of contamination in the Loa Basin.Then, the continuous use of untreated or not adequately
treated water for drinking and irrigation, as observed inrural areas and small villages during the field campaigns,is a serious risk for the health of the population in theregion.
Acknowledgements
The authors thank the European Community forsupporting the research (WAQUAMINAR Project, EC
Contract no. ERBIC 18CT980284). Two anonymousreferees are gratefully acknowledged for their usefulsuggestions. Thanks to Laura Rundeddu for help with
the illustrations.
References
Acharyya, S.K., Lahiri, S., Raymahashay, B.C., Bhowmik, A.,
2000. Arsenic toxicity of groundwater in parts of the Bengal
Basin in India and Bangladesh: the role of Quaternary stra-
tigraphy and Holocene sea-level fluctuation. Environ. Geol.
39, 1127–1137.
Alonso, H., Diaz, J., Valdes, V., 1992. Deterioro de un rio
aguas- abajo del area regada en un ambiente salino. II Con-
greso Ciencias de la Tierra. IGM, Santiago, Chile.
Arroyo, A., Alonso, H., Vera, L., Ortega, P., 1999. Analisis de
los eventos ocurridos en Rio Loa marzo de 1997. XIII Con-
greso de Ingenieria Sanitaria y Ambiental. AIDIS, Antofa-
gasta, Chile.
Ballantyne, J.M., Moore, J.N., 1988. Arsenic geochemistry in
geothermal systems. Geochim. Cosmochim. Acta 52, 475–
483.
Baturin, G.N., Chelishchev, N.F., 1998. Minerals of the sea-
floor: manganese nodules, crusts and phosphorites. In: Mar-
funin, A.S. (Ed.), Advanced Mineralogy, vol. 3, Chapter
3.2.1. Springer, Berlin.
Bhattacharya, P., Chatterjee, D., Jacks, G., 1997. Occurrence
of arsenic-contaminated groundwater in alluvial aquifers
from Delta Plain, Eastern India: options for a safe drinking
water supply. Water Res. Develop. 13, 79–92.
Bhattacharya, P., Larsson, M., Leiss, A., Jacks, G., Sracek, A.,
Chatterjee, D., 1998. Genesis of arseniferous groundwater in
the alluvial aquifers of Bengal Delta Plains and strategies for
low-cost remediation. Internat. Conf. Arsenic Pollution of
Groundwater in Bangladesh: Causes, Effects, and Remedia-
tion. Dhaka 8–12 February 1998.
Boric, R., Diaz, F., Maksaev, V., 1990. Geologia y yacimientos
metaliferos de la region de Antofagasta. Servicio Nacional de
Geologia y Mineria. Boletin n. 40.
Bowell, R.J., 1994. Sorption of arsenic by iron oxides and oxy-
hydroxides in soils. Appl. Geochem. 9, 279–286.
Caceres, A., 1999. Arsenico, Normativas y Efectos en la Salud.
XIII Congreso de Ingenierıa Sanitaria y Ambiental AIDIS,
Octubre 1999, Antofagasta, Chile.
Caceres, L., Gruttner, V.E., Contreras, R., 1992. Water recy-
cling in arid regions: Chilean case. Ambio 21, 138–144.
Cidu, R., 1996. Comparison of ICP-MS and ICP-OES in the
determination of trace elements in water. Atom. Spectros. 17
(4), 155–162.
L. Romero et al. / Applied Geochemistry 18 (2003) 1399–1416 1415
CONAMA, 1997. Informe Multisectorial: Episodio de Con-
taminacion Rio Loa, Marzo 1997, Antofagasta, Chile.
Cullen, W.R., Reimer, K.J., 1989. Arsenic speciation in the
environment. Chem. Rev. 89, 713–764.
Del Razo, L.M., Arellano, M.A., Cebrian, M.E., 1990. The
oxidation states of arsenic in well-water from a chronic
arsenicism area of northern Mexico. Environ. Pollut. 64,
143–153.
Ellis, A.J., Mahon, W.A.J., 1977. Chemistry and geothermal
systems. Academic Press, New York.
Fuji, R., Swain, W.C., 1995. Arial distribution of selected trace
elements, salinity, and major ions in shallow ground water,
Tulare Basin, southern San Joaquin Valley, California.
USGS Water Resour. Investig. Rep. 95-4048, 67.
GARHIN (Programa Gestion Ambiental de Recursos
Hıdricos en Zonas Aridas y su Litoral), 1994. Evaluacion
de Recursos Hıdricos de la II Region. Departamento de
Quımica, Facultad de Ciencias, Universidad Catolica del
Norte, Antofagasta, Chile.
Hopenhayn-Rich, C., Biggs, M.L., Fuchs, A., Bergoglio, R.,
Tello, E.E., Nicolli, H., Smith, A.H., 1996. Bladder cancer
mortality associated with arsenic in drinking water in
Argentina. Epidemiol. 7, 117–124.
Kavanagh, P.J., Farago, M.E., Thornton, I., Braman, S.R.,
1997. Bioavailability of arsenic in soil and mine wastes of the
Tamar valley, SW England. Chem. Spec. Bioavail. 9, 77–81.
Kuo, T.L., 1968. Arsenic content of artesian well water in
endemic area of chronic arsenic poisoning. Report Institute
Pathology National Taiwan University 20, 7–13.
Li, X., Coles, B.J., Ramsey, M.H., Thornton, I., 1995.
Sequential extraction of soils for multielement analysis by
ICP-AES. Chem. Geol. 124, 109–123.
May, G., Hartley, A.J., Stuart, F.M., Chong, G., 1999. Tectonic
signatures in arid continental basins: an example from theUpper
Miocene-Pleistocene, Calama Basin, Andean forearc, northern
Chile. Palaeogeog., Palaeoclim., Palaeoecol. 151, 55–77.
Nicolli, H.B., Suriano, J.M., Gomez Peral, M.A., Ferpozzi, L.H.,
Baleani, O.A., 1989. Groundwater contamination with arsenic
and other trace elements in an area of the Pampa, Province of
Cordoba, Argentina. Environ. Geol. Water Sci. 14, 3–16.
Nordstrom, D.K., 1977. Thermochemical redox equilibria of
ZoBell’s solution. Geochim. Cosmochim. Acta 41, 1835–1841.
Norusis, M.J., 1996. SPSS for Windows professional statistics -
release 6.0. SPSS Inc, Chicago.
Orellana, S., 1985. Hidrogeoquimica del Rio Loa: un prototipo
para el estudio de hoyas hidrograficas en el Norte de Chile.
IV Congreso Geologico Chileno. Antofagasta, Chile.
Parkhurst, D., 2001. PHREEQC (Version 2) A computer pro-
gram for speciation, batch-reaction, one-dimensional trans-
port, and inverse geochemical calculations. USGS.
Queirolo, F., Stegen, S., Mondaca, J., Cortes, R., Rojas, R.,
Contreras, C., Munoz, L., Schwuger, M., Ostapczuk, P.,
2000. Total arsenic, lead, cadmium, copper, and zinc in some
salt rivers in northern Andes of Antofagasta, Chile. Sci.
Total Environ. 255, 85–95.
Robertson, F.N., 1989. Arsenic in ground-water under oxidis-
ing conditions, south-west United States. Environ. Geochem.
Health 11, 171–185.
Robinson, B., Outred, H., Brooks, R., Kirkman, J., 1995. The
distribution and fate of arsenic in the Waikato River System,
North Island, New Zealand. Chem. Spec. Bioavail 7, 89–96.
Smedley, P.L., Kinniburgh, D.G., 2002. A review of the source,
behaviour and distribution of arsenic in natural waters.
Appl. Geochem. 17, 517–568.
Smedley, P.L., Nicolli, H.B., Luo, Z.D., 2000. Arsenic in
groundwaters from major aquifers: sources, effects and
potential mitigation. Brit. Geol. Surv. Tech. Rep. WC/99/38.
Smedley, P.L., Zhang, M., Zhang, G., Luo, Z., 2001. Arsenic
and other redox-sensitive elements in groundwater from the
Huhhot Basin, Inner Mongolia. In: Cidu, R. (Ed.), Proc.
WRI-10. Swets & Zeitlinger, Lisse, pp. 581–584.
Smith, A.H., Arroyo, A.P., Mazumder, D.N.G., Kosnett, M.J.,
Hernandez, A.L., Smith, M.M., Moore, L.E., 2000. Arsenic-
induced skin lesions among Atacamero people in northern
Chile despite good nutrition and centuries of exposure.
Environ. Health Perspect. 108, 617–620.
Smith, A.H., Goycolea, M., Haque, R., Biggs, M.L., 1998.
Marked increase in bladder and lung cancer mortality in a
region of northern Chile due to arsenic in drinking water.
Am. J. Epidemiol. 147, 660–669.
Stumm, W., Morgan, J.J., 1996. Aquatic chemistry, third ed..
John Wiley & Sons, New York.
Wedepohl, K.H., 1974. Copper. In: Wedepohl, K.H. (Ed.),
Handbook of Geochemistry, 29E-G. Springer-Verlag, Berlin.
Wedepohl, K.H., 1978. Manganese. In: Handbook of Geo-
chemistry, 25-D-17. Springer-Verlag, Berlin.
Welch, A.H., Lico, M.S., 1998. Factors controlling As and U in
shallow ground water, southern Carson Desert, Nevada.
Appl. Geochem. 13, 521–539.
WHO, 1993. Guidelines for drinking water quality. World
Health Organisation, Geneva.
Wilkie, J.A., Hering, J.G., 1996. Adsorption of arsenic onto
ferric oxide: effects of adsorbate/adsorbent ratios and co-
occurring solutes. Colloids Surfaces Physicochem. Engineer.
Aspects 107, 97–110.
Wood, J.M., 1974. Biological cycles for toxic elements in the
environment. Science 183, 1049–1052.
Yokoyama, T., Takahashi, Y., Tarutani, T., 1993. Simulta-
neous determination of arsenic and arsenious acids in geo-
thermal water. Chem. Geol. 103, 103–111.
1416 L. Romero et al. / Applied Geochemistry 18 (2003) 1399–1416