Navy Application for Rulemaking and LOA Under the MMPA ...
236
-
Upload
khangminh22 -
Category
Documents
-
view
4 -
download
0
Transcript of Navy Application for Rulemaking and LOA Under the MMPA ...


LOA and Rulemaking Application Under the MMPA for Use of SURTASS LFA Sonar
ii Table of Contents
TABLE OF CONTENTS
1 DESCRIPTION OF THE PROPOSED ACTIVITY ............................................................................... 1-1
1.1 INTRODUCTION ............................................................................................................................................. 1-1
1.2 PROPOSED ACTIVITY ..................................................................................................................................... 1-2
1.3 BACKGROUND............................................................................................................................................... 1-3
1.4 PURPOSE AND NEED FOR SURTASS LFA SONAR ........................................................................................... 1-4
1.5 SURTASS LFA SONAR TECHNOLOGY ............................................................................................................ 1-4
1.5.1 Active Acoustic System ......................................................................................................... 1-6
1.5.2 Passive Acoustic System ....................................................................................................... 1-7
2 DURATION AND LOCATION OF SURTASS LFA SONAR USE .......................................................... 2-1
2.1 DURATION .................................................................................................................................................... 2-1
2.2 POTENTIAL SURTASS LFA SONAR AREAS ..................................................................................................... 2-1
2.2.1 Geographic Restrictions—Coastal Standoff Range .............................................................. 2-3
2.2.2 Geographic Restrictions—Offshore Biologically Important Areas (OBIAs) for Marine
Mammals ............................................................................................................................ 2-3
2.2.2.1 OBIA Selection Criteria ..................................................................................................... 2-3
2.2.2.2 Existing Marine Mammal OBIAs for SURTASS LFA Sonar ................................................. 2-5
2.2.2.3 Potential Marine Mammal OBIAs for SURTASS LFA Sonar ............................................... 2-5
2.2.3 Representative Model Areas ................................................................................................ 2-5
3 MARINE MAMMALS ................................................................................................................. 3-1
3.1 MARINE MAMMAL SPECIES OCCURRENCE ..................................................................................................... 3-1
3.2 MARINE MAMMAL ABUNDANCE AND DENSITY ESTIMATES ............................................................................. 3-1
4 STATUS AND DISTRIBUTION OF POTENTIALLY AFFECTED MARINE MAMMAL SPECIES AND
STOCKS ................................................................................................................................... 4-1
4.1 MYSTICETES .................................................................................................................................................. 4-1
4.1.1 Antarctic Minke Whale (Balaenoptera bonaerensis) ........................................................... 4-2
4.1.2 Blue Whale (Balaenoptera musculus) and Pygmy Blue Whale (Balaenoptera
musculus brevicauda) .......................................................................................................... 4-2
4.1.3 Bryde’s Whale (Balaenoptera edeni) .................................................................................... 4-4
4.1.4 Common Minke Whale (Balaenoptera acutorostrata) ........................................................ 4-5
4.1.5 Fin Whale (Balaenoptera physalus) ..................................................................................... 4-7
4.1.6 Gray Whale (Eschrichtius robustus) ..................................................................................... 4-8
4.1.7 Humpback Whale (Megaptera novaeangliae) ..................................................................... 4-9
4.1.8 North Pacific Right Whale (Eubalaena japonica) ............................................................... 4-13
4.1.9 Omura’s Whale (Balaenoptera omurai) ............................................................................. 4-14
4.1.10 Sei Whale (Balaenoptera borealis) ..................................................................................... 4-15
4.2 ODONTOCETES ........................................................................................................................................... 4-16
4.2.1 Baird’s Beaked Whale (Berardius bairdii) ........................................................................... 4-16
4.2.2 Common Bottlenose Dolphin (Tursiops truncatus)............................................................. 4-17

LOA and Rulemaking Application Under the MMPA for Use of SURTASS LFA Sonar
iii Table of Contents
4.2.3 Common Dolphin (Delphinus delphis delphis) and Indo-Pacific Common Dolphin
(Delphinus delphis tropicalis) ............................................................................................ 4-18
4.2.4 Cuvier’s Beaked Whale (Ziphius cavirostris) ....................................................................... 4-19
4.2.5 Dall’s Porpoise (Phocoenoides dalli) ................................................................................... 4-20
4.2.6 Dwarf Sperm Whale (Kogia sima) and Pygmy Sperm Whale (Kogia breviceps) ................ 4-21
4.2.7 False Killer Whale (Pseudorca crassidens) ......................................................................... 4-21
4.2.8 Fraser’s Dolphin (Lagenodelphis hosei) .............................................................................. 4-23
4.2.9 Harbor Porpoise (Phocoena phocoena) .............................................................................. 4-24
4.2.10 Indo-Pacific Bottlenose Dolphin (Tursiops aduncus) .......................................................... 4-25
4.2.11 Killer Whale (Orcinus orca) ................................................................................................. 4-25
4.2.12 Longman’s Beaked Whale (Indopacetus pacificus) ............................................................ 4-27
4.2.13 Melon-headed Whale (Peponocephala electra) ................................................................. 4-27
4.2.14 Mesoplodon Species ........................................................................................................... 4-28
4.2.15 Northern Right Whale Dolphin (Lissodelphis borealis) ....................................................... 4-29
4.2.16 Pacific White-sided Dolphin (Lagenorhynchus obliquidens) .............................................. 4-30
4.2.17 Pantropical Spotted Dolphin (Stenella attenuata) ............................................................. 4-30
4.2.18 Pygmy Killer Whale (Feresa attenuata).............................................................................. 4-31
4.2.19 Risso’s Dolphin (Grampus griseus) ..................................................................................... 4-32
4.2.20 Rough-toothed Dolphin (Steno bredanensis) ..................................................................... 4-33
4.2.21 Short-finned Pilot Whale (Globicephala macrorhynchus) .................................................. 4-34
4.2.22 Southern Bottlenose Whale (Hyperoodon planifrons) ....................................................... 4-35
4.2.23 Sperm Whale (Physeter macrocephalus) ........................................................................... 4-36
4.2.24 Spinner Dolphin (Stenella longirostris) ............................................................................... 4-37
4.2.25 Striped Dolphin (Stenella coeruleoalba) ............................................................................. 4-38
4.3 PINNIPEDS .................................................................................................................................................. 4-38
4.3.1 Otariids ............................................................................................................................... 4-39
4.3.1.1 Northern Fur Seal (Callorhinus ursinus) .......................................................................... 4-39
4.3.1.2 Western Steller Sea Lion (Eumetopias jubatus jubatus) ................................................ 4-40
4.3.2 Phocids ............................................................................................................................... 4-41
4.3.2.1 Hawaiian Monk Seal (Monachus schauinslandi) ............................................................ 4-41
4.3.2.2 Ribbon Seal (Phoca fasciata) .......................................................................................... 4-42
4.3.2.3 Spotted Seal (Phoca largha) ........................................................................................... 4-43
5 TYPE OF INCIDENTAL TAKE AUTHORIZATION REQUESTED .......................................................... 5-1
6 INCIDENTAL TAKES ................................................................................................................... 6-1
6.1 NON-AUDITORY IMPACTS .............................................................................................................................. 6-2
6.2 AUDITORY IMPACTS ...................................................................................................................................... 6-3
6.3 BEHAVIORAL CHANGE ................................................................................................................................... 6-4
6.4 MASKING ................................................................................................................................................... 6-10
6.5 PHYSIOLOGICAL STRESS ............................................................................................................................... 6-11
6.6 QUANTITATIVE IMPACT ANALYSIS FOR MARINE MAMMALS .......................................................................... 6-12
7 IMPACTS TO MARINE MAMMAL SPECIES OR STOCKS ................................................................ 7-1

LOA and Rulemaking Application Under the MMPA for Use of SURTASS LFA Sonar
iv Table of Contents
8 IMPACT ON SUBSISTENCE USE .................................................................................................. 8-1
9 IMPACT TO MARINE MAMMAL HABITAT .................................................................................. 9-1
9.1 PHYSICAL HABITAT ........................................................................................................................................ 9-1
9.2 SOUND IN THE ENVIRONMENT ....................................................................................................................... 9-1
9.2.1 Oceanic Noise Levels ............................................................................................................ 9-1
9.2.2 SURTASS LFA Sonar Combined with Other Human-Generated Sources of Oceanic
Noise .................................................................................................................................... 9-3
9.3 PROTECTED MARINE HABITATS ..................................................................................................................... 9-4
9.3.1 ESA Critical Habitat .............................................................................................................. 9-4
9.3.2 Marine Protected Areas ....................................................................................................... 9-8
9.3.2.1 U.S. Marine Protected Areas ............................................................................................ 9-8
9.3.2.2 International Marine Protected Areas............................................................................ 9-10
9.3.2.3 Impacts of Sonar on Marine Protected Areas ................................................................ 9-10
10 IMPACTS TO MARINE MAMMALS FROM HABITAT LOSS OR MODIFICATION ............................. 10-1
11 MEANS OF EFFECTING LEAST PRACTICABLE ADVERSE IMPACTS—MITIGATION MEASURES ....... 11-1
11.1 RE-EVALUATION OF MITIGATION BASIS ........................................................................................................ 11-1
11.2 MITIGATION MEASURES .............................................................................................................................. 11-3
11.2.1 Operational Parameters ..................................................................................................... 11-3
11.2.2 Mitigation Zone .................................................................................................................. 11-3
11.2.3 Buffer Zone ......................................................................................................................... 11-3
11.2.4 Ramp-up of High Frequency Marine Mammal Monitoring (HF/M3) Sonar ....................... 11-4
11.2.5 LFA Sonar Suspension/Delay .............................................................................................. 11-4
11.2.6 Geographic Sound Field Operational Constraints .............................................................. 11-4
11.2.6.1 Coastal Standoff Distance ........................................................................................... 11-5
11.2.6.2 Offshore Biologically Important Areas (OBIAs) ........................................................... 11-5
11.2.7 Sound Field Modeling ......................................................................................................... 11-5
11.3 MONITORING TO PREVENT INJURY TO MARINE MAMMALS .......................................................................... 11-5
11.3.1 Visual Monitoring ............................................................................................................... 11-6
11.3.2 Passive Acoustic Monitoring .............................................................................................. 11-7
11.3.3 Active Acoustic Monitoring ................................................................................................ 11-7
11.4 OTHER MITIGATION MEASURES CONSIDERED .............................................................................................. 11-8
11.4.1 Longer Suspension/Delay Period ........................................................................................ 11-8
11.4.2 Restrict Transmissions to Daylight Hours ........................................................................... 11-9
11.4.3 Reduce Training and Testing Activities............................................................................... 11-9
11.4.4 Increased Coastal Standoff Range ..................................................................................... 11-9
11.4.5 Expanded Geographic Sound Field Operational Constraints............................................ 11-10
11.5 SUMMARY OF MITIGATION MEASURES FOR SURTASS LFA SONAR USE ..................................................... 11-10
12 MINIMIZATION OF ADVERSE EFFECTS ON SUBSISTENCE USES .................................................. 12-1
13 MONITORING AND REPORTING .............................................................................................. 13-1
13.1 MONITORING TO INCREASE KNOWLEDGE OF AFFECTED MARINE MAMMAL SPECIES ...................................... 13-1

LOA and Rulemaking Application Under the MMPA for Use of SURTASS LFA Sonar
v Table of Contents
13.1.1 Ambient Noise Data Monitoring ........................................................................................ 13-1
13.1.2 Marine Mammal Monitoring (M3) Program ...................................................................... 13-1
13.2 REPORTING ................................................................................................................................................. 13-2
13.2.1 Incident Monitoring ............................................................................................................ 13-2
13.2.2 Annual and Comprehensive Reports .................................................................................. 13-2
13.3 ADAPTIVE MANAGEMENT ........................................................................................................................... 13-3
14 RESEARCH .............................................................................................................................. 14-1
14.1 SURTASS LFA SONAR’S MARINE MAMMAL MONITORING (M3) PROGRAM ............................................... 14-2
15 LITERATURE CITED .................................................................................................................. 15-1

LOA and Rulemaking Application Under the MMPA for Use of SURTASS LFA Sonar
vi Table of Contents
LIST OF TABLES
Table 2-1. Existing 29 Offshore Biologically Important Areas (OBIAs) for SURTASS LFA Sonar,
the Relevant Marine Mammal Species, and the Effective Seasonal Period for each
OBIA. ....................................................................................................................................... 2-6
Table 2-2 Locations of the 15 Representative Model Areas for SURTASS LFA Sonar Training and
Testing Activities with the Nominal Center of each Area. ......................................................... 2-12
Table 3-1. Marine Mammal Species Evaluated in this Application for Potential Effects
Associated with Exposure to SURTASS LFA Sonar and their Status Under the ESA and
MMPA. Taxonomy Follows that of the Society for Marine Mammalogy (2017), with
Species Shown in Alphabetical Order within each Family. .................................................... 3-2
Table 3-2. Marine Mammal Species, Stocks (DPSs), Abundance Estimates, and Density
Estimates by Season as well as the Associated References for the 15 Representative
SURTASS LFA Sonar Model Areas in the Central and Western North Pacific Ocean
and Eastern Indian Ocean (References Shown at End of Table). ........................................... 3-6
Table 6-1. PTS and TTS Acoustic Threshold Levels for Marine Mammals Exposed to Non-
impulsive Sounds (NMFS, 2018b). .......................................................................................... 6-6
Table 6-2. Activities and Maximum Transmission Hours Per Year Expected in each of the 15
Representative Model Areas. ............................................................................................... 6-17
Table 6-3. Maximum Total Annual MMPA Level B Harassment Requested for Years 1 to 4 by
SURTASS LFA Sonar (Species and Stocks Listed Alphabetically). .......................................... 6-18
Table 6-4. Maximum Total Annual MMPA Level B Harassment Requested for Years 5 to 7 by
SURTASS LFA Sonar (Species and Stocks Listed Alphabetically). .......................................... 6-25
Table 7-1. Maximum MMPA Level B Harassment by SURTASS LFA Sonar for Years 1 to 4 and
Years 5 to 7 (Annual Totals) and Total Overall for 7-Year Period (Species and Stocks
Listed Alphabetically). ............................................................................................................ 7-3
Table 11-1. Summary of Mitigation Measures for Use of SURTASS LFA Sonar. .................................... 11-10
LIST OF FIGURES
Figure 1-1. SURTASS LFA Sonar Systems Showing the Active (Source Array) and Passive (Receive
Array) Components ................................................................................................................ 1-5
Figure 2-1. Study Area in the Western and Central North Pacific and Eastern Indian Oceans
Including Nominal Modeling Sites .......................................................................................... 2-2
Figure 2-2. Locations of the 29 Existing Marine Mammal Offshore Biologically Important Areas
(OBIAs) for SURTASS LFA Sonar (the Names of OBIAs by Number Follows). ......................... 2-9
Figure 2-3. Locations of the Four OBIAs (16, 20, 26, and 27) in the SURTASS LFA Sonar Study
Area ...................................................................................................................................... 2-11
LOA and Rulemaking Application Under the MMPA for Use of SURTASS LFA Sonar
vii Table of Contents
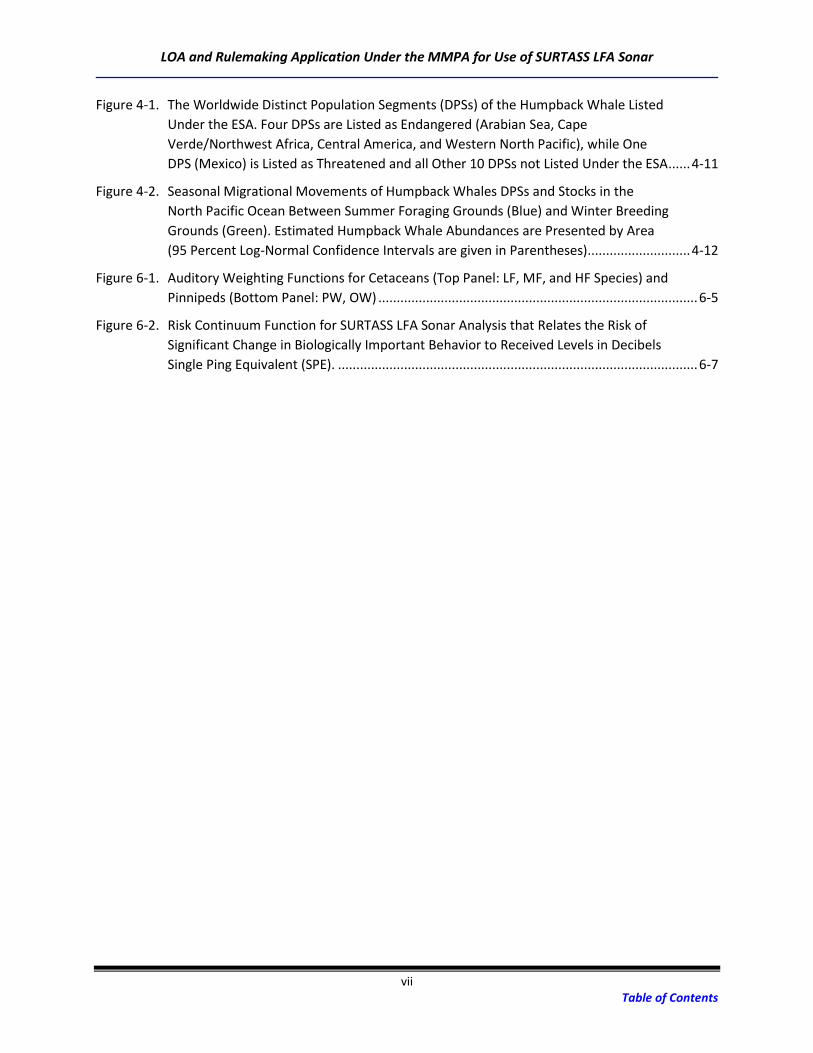
Figure 4-1. The Worldwide Distinct Population Segments (DPSs) of the Humpback Whale Listed
Under the ESA. Four DPSs are Listed as Endangered (Arabian Sea, Cape
Verde/Northwest Africa, Central America, and Western North Pacific), while One
DPS (Mexico) is Listed as Threatened and all Other 10 DPSs not Listed Under the ESA ...... 4-11
Figure 4-2. Seasonal Migrational Movements of Humpback Whales DPSs and Stocks in the
North Pacific Ocean Between Summer Foraging Grounds (Blue) and Winter Breeding
Grounds (Green). Estimated Humpback Whale Abundances are Presented by Area
(95 Percent Log-Normal Confidence Intervals are given in Parentheses) ............................ 4-12
Figure 6-1. Auditory Weighting Functions for Cetaceans (Top Panel: LF, MF, and HF Species) and
Pinnipeds (Bottom Panel: PW, OW) ....................................................................................... 6-5
Figure 6-2. Risk Continuum Function for SURTASS LFA Sonar Analysis that Relates the Risk of
Significant Change in Biologically Important Behavior to Received Levels in Decibels
Single Ping Equivalent (SPE). .................................................................................................. 6-7
LOA and Rulemaking Application Under the MMPA for Use of SURTASS LFA Sonar
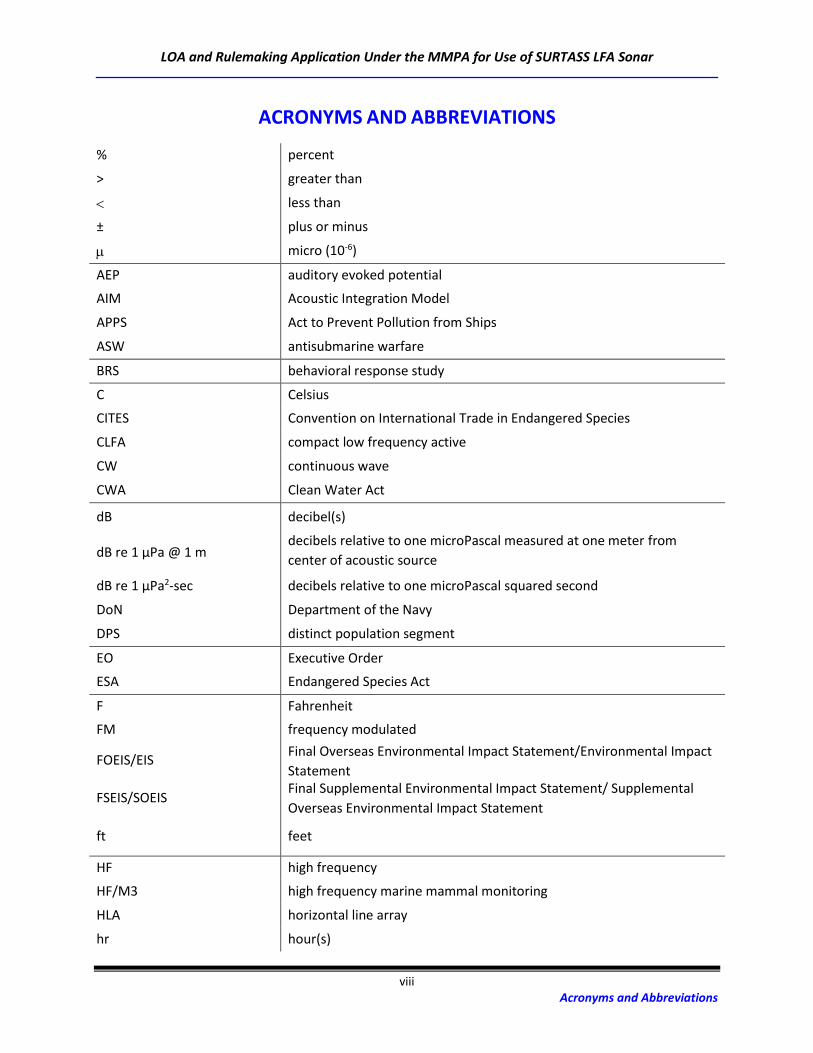
viii Acronyms and Abbreviations
ACRONYMS AND ABBREVIATIONS
% percent
> greater than
less than
± plus or minus
micro (10-6)
AEP auditory evoked potential
AIM Acoustic Integration Model
APPS Act to Prevent Pollution from Ships
ASW antisubmarine warfare
BRS behavioral response study
C Celsius
CITES Convention on International Trade in Endangered Species
CLFA compact low frequency active
CW continuous wave
CWA Clean Water Act
dB decibel(s)
dB re 1 µPa @ 1 m decibels relative to one microPascal measured at one meter from
center of acoustic source
dB re 1 µPa2-sec decibels relative to one microPascal squared second
DoN Department of the Navy
DPS distinct population segment
EO Executive Order
ESA Endangered Species Act
F Fahrenheit
FM frequency modulated
FOEIS/EIS Final Overseas Environmental Impact Statement/Environmental Impact
Statement
FSEIS/SOEIS Final Supplemental Environmental Impact Statement/ Supplemental
Overseas Environmental Impact Statement
ft feet
HF high frequency
HF/M3 high frequency marine mammal monitoring
HLA horizontal line array
hr hour(s)

LOA and Rulemaking Application Under the MMPA for Use of SURTASS LFA Sonar
ix Acronyms and Abbreviations
Hz hertz
IUCN International Union of Conservation of Nature
IWC International Whaling Commission
kg kilogram(s)
km kilometer(s)
kHz kiloHertz
kph kilometers per hour
kt knot(s)
lb pound(s)
LF low frequency
LFA Low Frequency Active
LFS low frequency sound
LMR Living Marine Resources
LOA Letter of Authorization
m meter(s)
M3 marine mammal monitoring
MF mid-frequency
MILCREW military crew
min minute(s)
MMC Marine Mammal Commission
MMPA Marine Mammal Protection Act
MPA Marine Protected Area
NDAA National Defense Authorization Act
NDE National Defense Exemption
NEPA National Environmental Policy Act
NMFS National Marine Fisheries Service
nmi nautical mile(s)
NMPAC National Marine Protected Areas Center
NMS national marine sanctuary
NRC National Research Council
OBIA(s) offshore biologically important area(s)
OEIS/EIS Overseas Environmental Impact Statement and Environmental Impact
Statement
OPAREA operating area
OW otariid underwater
Pa Pascal
LOA and Rulemaking Application Under the MMPA for Use of SURTASS LFA Sonar
x Acronyms and Abbreviations
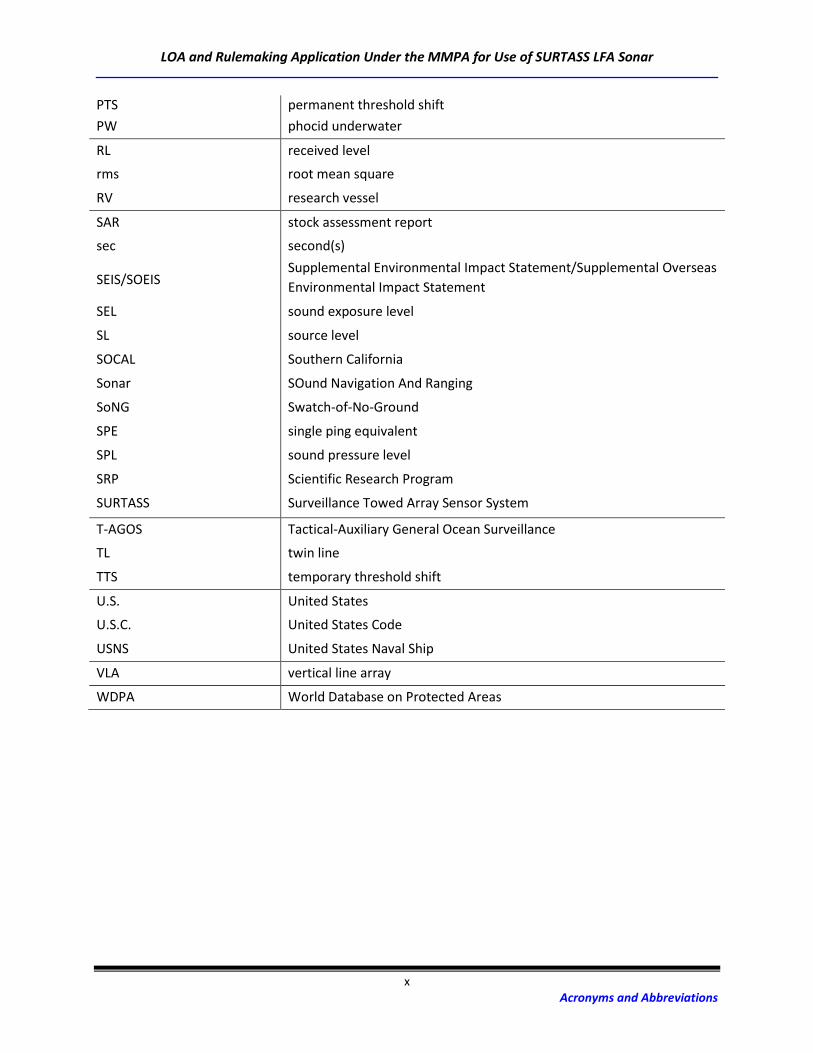
PTS permanent threshold shift
PW phocid underwater
RL received level
rms root mean square
RV research vessel
SAR stock assessment report
sec second(s)
SEIS/SOEIS Supplemental Environmental Impact Statement/Supplemental Overseas
Environmental Impact Statement
SEL sound exposure level
SL source level
SOCAL Southern California
Sonar SOund Navigation And Ranging
SoNG Swatch-of-No-Ground
SPE single ping equivalent
SPL sound pressure level
SRP Scientific Research Program
SURTASS Surveillance Towed Array Sensor System
T-AGOS Tactical-Auxiliary General Ocean Surveillance
TL twin line
TTS temporary threshold shift
U.S. United States
U.S.C. United States Code
USNS United States Naval Ship
VLA vertical line array
WDPA World Database on Protected Areas

LOA and Rulemaking Application Under the MMPA for Use of SURTASS LFA Sonar
1-1 Description of the Proposed Activity
1 DESCRIPTION OF THE PROPOSED ACTIVITY
1.1 Introduction
Pursuant to Section 101 (a)(5)(A) of the Marine Mammal Protection Act of 1972, as amended (MMPA;
16 United States Code [U.S.C.] 1371), the Department of the Navy (DoN; hereafter, the Navy) is applying
for rulemaking and a Letter of Authorization (LOA) to incidentally take marine mammals due to the
continued use of Surveillance Towed Array Sensor System (SURTASS) Low Frequency Active (LFA) sonar
systems onboard Navy surveillance ships for training and testing activities conducted under the
authority of the Secretary of the Navy in the western and central North Pacific and eastern Indian
oceans. The MMPA directs the Secretary of Commerce (Secretary) to allow, upon request, the
incidental, but not intentional taking of marine mammals by United States (U.S.) citizens who engage in
a specified activity (other than commercial fishing). The incidental take issuance occurs when the
Secretary, after notice has been published in the Federal Register and opportunity for comment has
been provided, finds that such takes would have a negligible impact on the species and stocks of marine
mammals and would not have an unmitigable adverse impact on their availability for subsistence uses.
Marine mammals have the potential to be incidentally harassed due to the underwater sound generated
by the use of SURTASS LFA sonar. As a result, the Navy is requesting rulemaking and a LOA under the
MMPA for taking of marine mammals by Level B harassment incidental to the use of SURTASS LFA sonar
systems for training and testing activities within the western and central North Pacific and eastern
Indian oceans for the time period of August 13, 2019 through August 12, 2026.
This application for rulemaking and LOA is the fifth such application the Navy has submitted to the
National Marine Fisheries Service (NMFS) for the use of SURTASS LFA sonar. In 2002, NMFS issued
regulations and the initial LOA under the MMPA Final Rule (50 CFR §216 Subpart Q) (NOAA, 2002) for
the operation of SURTASS LFA sonar on the research vessel (RV) Cory Chouest. The Navy requested and
was issued annual LOA renewals in accordance with 50 CFR §216.189 for the remaining four years of the
2002 Final Rule for the RV Cory Chouest and U.S. Naval Ship (USNS) IMPECCABLE. In 2006, the Navy
submitted its application for the second five-year Rule under the MMPA (DoN, 2006) for the taking of
marine mammals incidental to the deployment of up to four SURTASS LFA sonar systems for military
readiness activities from 16 August 2007 to 15 August 2012. NMFS published the second MMPA Final
Rule in August 2007 (NOAA, 2007) for the employment of SURTASS LFA sonar, and subsequently issued
annual LOAs for sonar use on the RV Cory Chouest, USNS VICTORIOUS, USNS ABLE, USNS EFFECTIVE and
USNS IMPECCABLE. In 2011, the Navy submitted its application for the third five-year Rule under the
MMPA (DoN, 2011) for the taking of marine mammals incidental to the deployment of up to four
SURTASS LFA sonar systems from 15 August 2012 to 15 August 2017. NMFS published the third MMPA
Final Rule in August 2012 (NOAA, 2012a) for the employment of SURTASS LFA sonar, and subsequently
issued annual LOAs for sonar use on the USNS VICTORIOUS, USNS ABLE, USNS EFFECTIVE and USNS
IMPECCABLE.
On July 15, 2016, the U.S. Court of Appeals for the Ninth Circuit issued a decision in Natural Resources
Defense Council (NRDC), et al. versus Pritzker, et al., which was an appeal of a challenge to NMFS's 2012
Final Rule for SURTASS LFA sonar. Both the Navy and NMFS carefully and fully considered the Ninth
Requirement 1: A detailed description of the specific activity or class of activities that can be expected
to result in the incidental taking of marine mammals.
LOA and Rulemaking Application Under the MMPA for Use of SURTASS LFA Sonar
1-2 Description of the Proposed Activity
Circuit’s decision and have addressed it herein, as appropriate. The court ultimately dismissed the case
later in 2017 as a result of a settlement agreement.
In 2016, the Navy submitted its application for the fourth five-year Rule under the MMPA (DoN, 2016)
for the taking of marine mammals incidental to the deployment of up to four SURTASS LFA sonar
systems from 15 August 2017 to 14 August 2022. On August 10, 2017, in consultation with the Secretary
of Commerce and pursuant to Title 16, Section 1371(f) U.S.C., the Secretary of Defense determined that
it was necessary for national defense to exempt all military readiness activities that use SURTASS LFA
sonar from compliance with the requirements of the MMPA for two years from August 13, 2017 through
August 12, 2019, or until such time when NMFS issues the required regulations and a LOA under Title 16,
Section 1371, whichever is earlier. During the exemption period, all military readiness activities that
involve the use of SURTASS LFA sonar are required to comply with all mitigation, monitoring, and
reporting measures set forth in the 2017 National Defense Exemption (NDE) for SURTASS LFA sonar.
This application document has been prepared in accordance with applicable regulations and the MMPA,
as amended by the National Defense Authorization Act (NDAA) for Fiscal Year 2004 (Public Law 108-
136). The NDAA modified the MMPA by removing the ‘‘small numbers’’ and ‘‘specified geographical
region’’ limitations and amended the definition of ‘‘harassment’’ as it applies to a ‘‘military readiness
activity.” The NDAA for Fiscal Year 2019 (Public Law 115-232) extended the periods of permitted
incidental taking under the MMPA from five years to seven years for military readiness activities. This
application for incidental taking of marine mammals by SURTASS LFA sonar training and testing activities
reflects this extension.
The basis of this fifth application for rulemaking and LOA are: (1) the analysis of spatial and temporal
distributions of protected marine mammals in areas in which SURTASS LFA sonar would be used, (2) a
review of activities that have the potential to affect marine mammals, and (3) a scientific risk
assessment to determine the likelihood of impacts from the use of LFA sonar in the western and central
North Pacific and eastern Indian oceans. The Navy has scoped this application to reflect those areas of
the world’s oceans (the western and central North Pacific and eastern Indian oceans) where the Navy
anticipates conducting SURTASS LFA sonar training and testing activities1 ( see Section 2.2). The Navy has
provided greater detail on the types of SURTASS LFA sonar training and testing activities (see Section
2.1). The geographic scope would allow the Navy to more accurately assess and describe those impacts
associated with SURTASSS LFA sonar training and testing activities in ocean areas where the Navy
expects to conduct these activities.
1.2 Proposed Activity
The Navy proposes to continue utilizing SURTASS LFA sonar systems onboard USNS surveillance ships for
training and testing conducted under the authority of the Secretary of the Navy in the western and
central North Pacific and eastern Indian oceans. The Navy currently has four surveillance ships that are
equipped with SURTASS LFA sonar systems: USNS VICTORIOUS (Tactical-Auxiliary General Ocean
Surveillance [T-AGOS] 19); USNS ABLE (T-AGOS 20); USNS EFFECTIVE (T-AGOS 21); and USNS
IMPECCABLE (T-AGOS 23). The Navy may develop and field additional SURTASS LFA sonar equipped
vessels, either to replace or complement the Navy’s current SURTASS LFA sonar capable fleet. The Navy
1 Throughout this document, the terms “training and testing activities” or “SURTASS LFA sonar activities” will be used to describe the
proposed action of training and testing conducted under the authority of the Secretary of the Navy.
LOA and Rulemaking Application Under the MMPA for Use of SURTASS LFA Sonar
1-3 Description of the Proposed Activity
proposes to use SURTASS LFA sonar systems onboard these vessels for training and testing activities
within the study area, which includes the western and central North Pacific and eastern Indian oceans.
The Navy is currently approved under the NDE to transmit 255 hours of LFA sonar transmission hours
per vessel per year or a total of 1,020 transmission hours per year. Under the proposed activity, the
Navy would transmit 496 LFA sonar transmission hours per year pooled across all SURTASS LFA sonar
equipped vessels in the first four years of the authorization, with an increase in usage to 592 LFA sonar
transmission hours in authorization year five and continuing into the foreseeable future, regardless of
the number of vessels.
The Navy proposes to implement procedural and geographic mitigation measures in association with the
use of SURTASS LFA sonar for training and testing activities. Specifically, the Navy would not conduct
SURTASS LFA sonar training and testing activities within the territorial seas of foreign nations and would
ensure that LFA sonar received levels (RLs) are below 180 decibels relative to one microPascal (root
mean squared) (dB re 1 µPa [rms]) within 12 nautical miles (nmi) (22 kilometers [km]) of any emergent
land and at the boundary of any designated offshore biologically important areas (OBIAs) during their
effective periods of biological activity. There are 29 designated OBIAs as described in the NDE, of which
four are found in the proposed study area for SURTASS LFA sonar. Mitigation monitoring includes visual,
passive acoustic, and active acoustic (high frequency marine mammal monitoring [HF/M3] sonar)
monitoring to minimize, to the greatest extent practicable, adverse impacts to marine animals when
SURTASS LFA sonar is transmitting by providing the means to detect marine mammals in the LFA
mitigation zone for SURTASS LFA sonar and then suspending or delaying LFA sonar transmissions.
For this application, the Navy has determined that the only aspect of the proposed action with the
potential to incidentally harass marine mammals is the transmission of acoustic signals during the use of
SURTASS LFA sonar. Through the history of the SURTASS LFA sonar program, no vessel strikes of marine
mammals, physical injury to any marine mammals, or marine mammal strandings have ever been
observed, reported, or associated with the employment of SURTASS LFA sonar. Therefore, the
remainder of this application focuses on the details associated with the Navy’s employment of SURTASS
LFA sonar for training and testing activities and its potential non-injurious impacts on marine mammal
species and stocks.
1.3 Background
In 2004, the NDAA included amendments to the MMPA that apply where a “military readiness activity”
is concerned. The term “military readiness activity” is defined in Public Law 107-314 (16 U.S.C. §703
note) to include all training and operations of the Armed Forces that relate to combat; and the adequate
and realistic testing of military equipment, vehicles, weapons and sensors for proper operation and
suitability for combat use. The NMFS and Navy have established that the Navy’s training and testing
activities for SURTASS LFA sonar constitute military readiness activities as defined by public law and
constitute “adequate and realistic testing of military equipment, vehicles, weapons and sensors for
proper operation and suitability for combat use” (NOAA, 2002).
During use of the SURTASS LFA sonar system, acoustic signals are introduced into the ocean that could
potentially affect the marine environment. As a result, the Navy conducted analyses relevant to the
potential environmental impacts of using the SURTASS LFA sonar system. The Navy has scoped the
geographic extent in this application to reflect those areas of the world’s oceans (the western and
central North Pacific and eastern Indian oceans) where Navy anticipates conducting SURTASS LFA sonar

LOA and Rulemaking Application Under the MMPA for Use of SURTASS LFA Sonar
1-4 Description of the Proposed Activity
training and testing activities in the foreseeable future. The Navy has provided greater detail on the
types of SURTASS LFA sonar training and testing activities in Chapter 2. The revised geographic scope
would allow the Navy to more accurately assess and describe those impacts associated with SURTASSS
LFA sonar training and testing activities in areas where the Navy expects to conduct these activities.
Concurrent with the development of this MMPA application, the Navy has developed a Draft
Supplemental EIS/Supplemental OEIS (DSEIS/SOEIS) (DoN, 2018a). The Navy is the lead agency and
NMFS is the cooperating agency on the DSEIS/SOEIS, which has been prepared in accordance with the
requirements of the National Environmental Policy Act of 1969 (NEPA; 42 U.S.C. 4321 et seq.) and
Executive Order (EO) 12114, Environmental Effects Abroad for Major Federal Actions.
1.4 Purpose and Need for SURTASS LFA Sonar
The Navy’s statutory mission is to train and equip naval forces that are combat-ready and capable of
accomplishing America’s strategic objectives, deterring maritime aggression, and maintaining freedom
of navigation in ocean areas (10 U.S.C. Section 5062). By law, the Secretary of the Navy is responsible for
functions such as training, supplying, equipping, and maintaining naval forces that are ready to achieve
national security objectives as directed by the National Command Authority. Preparing and maintaining
forces skilled in anti-submarine warfare (ASW) is a critical part of the Navy’s mission. To meet the need
for improved capability to detect quieter and harder-to-find foreign submarines at long range, before
these vessels can get within their effective weapons range to launch missiles or torpedoes against U.S.
ships or land targets, the Navy developed and uses SURTASS LFA sonar. SURTASS LFA sonar can be used
day and night in a variety of weather conditions. The active acoustic component in the SURTASS LFA
sonar system is an important augmentation to passive and tactical systems, as its long-range detection
capabilities can effectively counter the threat to the U.S. Navy and national security posed by quiet
submarines.
The purpose of the Navy’s Proposed Activity is to ensure that the Navy remains proficient in the use of
SURTASS LFA sonar in support of the Navy’s mission. The need for the Proposed Activity is to maintain a
system capable of detecting at long ranges the increasingly technologically advanced foreign submarine
presence that threatens our national security.
1.5 SURTASS LFA Sonar Technology
SURTASS LFA sonar systems are long-range sensors that transmit in the low frequency (LF) band (i.e.,
below 1,000 Hertz [Hz]) and include both active and passive acoustic components (Figure 1-1). The
active component is the LFA sonar source array while the passive component is the SURTASS receive
array. SONAR is an acronym for SOund NAvigation and Ranging, and its definition includes any system
that uses underwater sound, or acoustics, for observations and communications. Sonar systems are
used for many purposes, ranging from commercial off-the-shelf “fish finders” to military ASW systems
for detection and classification of submarines.
The two basic types of sonar used in the SURTASS LFA sonar system are passive and active sonar:
• Passive sonar detects sound created by a source. This is a one-way transmission of sound waves
through water from the source to the receiver. Passive sonar is similar to people hearing sounds
that are transmitted through the air to the human ear. Very simply, passive sonar “listens”
without transmitting any sound signals.

LOA and Rulemaking Application Under the MMPA for Use of SURTASS LFA Sonar
1-5 Description of the Proposed Activity
• Active sonar detects objects by creating a sound pulse or “ping” that is transmitted from the
sonar through the water, reflects off a target object, and returns in the form of an echo to be
detected by a receiver. Active sonar is a two-way transmission of sound waves through water
(sound source to reflector to receiver). Some marine mammals use a type of active biosonar
called echolocation to locate underwater objects such as prey or the seafloor for navigation.
LFA sonar systems were initially installed on two SURTASS ocean surveillance ships, RV Cory Chouest,
which was retired in 2008, and USNS IMPECCABLE (T-AGOS 23). As future undersea warfare
requirements continue to transition to littoral ocean regions, a compact active system deployable on
SURTASS ships was needed. This sonar system upgrade is known as Compact LFA, or CLFA. CLFA sonar
consists of smaller, lighter-weight source elements than the LFA sonar system and is compact enough to
be installed on the VICTORIOUS Class ships (such as T-AGOS 19, 20, and 21). CLFA improvements
include:
• Transmission frequency, within the 100 to 500 Hz range, matched to shallow water
environments with little loss of detection performance in deep water environments,
• Improved reliability and ease of deployment, and
• Lighter-weight design.
The operational characteristics of the CLFA sonar system are comparable to the LFA sonar system as
presented in Subchapter 2.1 of the FOEIS/EIS (DoN, 2001) and FSEIS/SOEISs (DoN, 2007, 2012, 2017a).
Therefore, the potential impacts from CLFA sonar are expected to be similar to, and not greater than,
the impacts from the LFA sonar system. For this reason, the term LFA sonar is used to refer to both the
LFA and/or the CLFA sonar systems, unless otherwise specified.
Figure 1-1. SURTASS LFA Sonar Systems Showing the Active (Source Array) and Passive (Receive Array) Components.
LOA and Rulemaking Application Under the MMPA for Use of SURTASS LFA Sonar
1-6 Description of the Proposed Activity
1.5.1 Active Acoustic System
The active component of the SURTASS LFA sonar system, LFA sonar, is an adjunct to the SURTASS
passive capability and is used when active sound signals are needed to detect and track underwater
targets. The characteristics and operating features of the active component of LFA sonar are:
• The sonar source is a vertical line array (VLA) of up to 18 source projectors suspended beneath
the vessel. LFA’s transmitted sonar beam is omnidirectional (360 degrees) in the horizontal, with
a narrow vertical beamwidth that can be steered above or below the horizontal.
• The source frequency is between 100 and 500 Hz.
• The source level (SL) of an individual source projector of the SURTASS LFA sonar array is
approximately 215 decibels relative to one microPascal measured at 1 m (dB re 1 µPa @ 1 m)
sound pressure level (SPL) or less. As measured by SPL, the sound field of the array can never be
higher than the SL of an individual source projector.
• The typical LFA sonar signal is not a constant tone, but a transmission of waveforms that vary in
frequency and duration. A complete sequence of sound transmissions is referred to as a
wavetrain (also known as a “ping”). These wavetrains last between 6 and 100 seconds (sec) with
an average length of 60 sec. Within each wavetrain, a variety of signal types can be used,
including continuous wave (CW) and frequency-modulated (FM) signals. The duration of each
continuous frequency sound transmission is no longer than 10 sec.
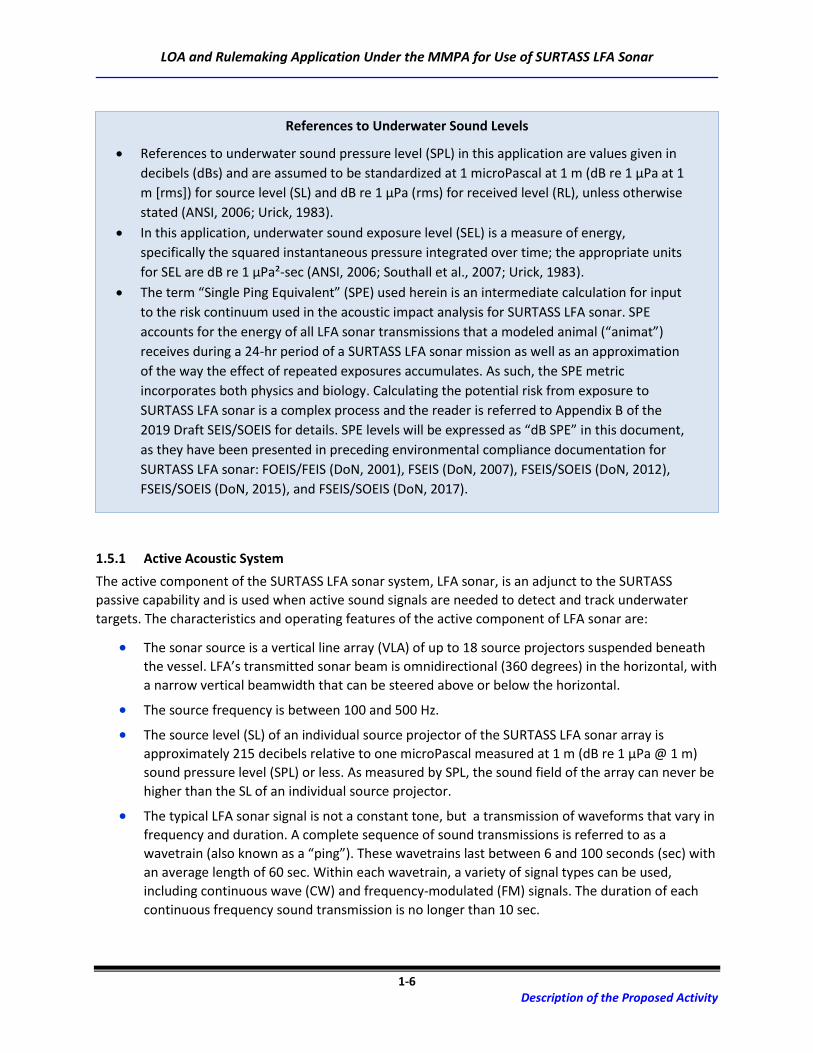
References to Underwater Sound Levels
• References to underwater sound pressure level (SPL) in this application are values given in
decibels (dBs) and are assumed to be standardized at 1 microPascal at 1 m (dB re 1 µPa at 1
m [rms]) for source level (SL) and dB re 1 µPa (rms) for received level (RL), unless otherwise
stated (ANSI, 2006; Urick, 1983).
• In this application, underwater sound exposure level (SEL) is a measure of energy,
specifically the squared instantaneous pressure integrated over time; the appropriate units
for SEL are dB re 1 µPa²-sec (ANSI, 2006; Southall et al., 2007; Urick, 1983).
• The term “Single Ping Equivalent” (SPE) used herein is an intermediate calculation for input
to the risk continuum used in the acoustic impact analysis for SURTASS LFA sonar. SPE
accounts for the energy of all LFA sonar transmissions that a modeled animal (“animat”)
receives during a 24-hr period of a SURTASS LFA sonar mission as well as an approximation
of the way the effect of repeated exposures accumulates. As such, the SPE metric
incorporates both physics and biology. Calculating the potential risk from exposure to
SURTASS LFA sonar is a complex process and the reader is referred to Appendix B of the
2019 Draft SEIS/SOEIS for details. SPE levels will be expressed as “dB SPE” in this document,
as they have been presented in preceding environmental compliance documentation for
SURTASS LFA sonar: FOEIS/FEIS (DoN, 2001), FSEIS (DoN, 2007), FSEIS/SOEIS (DoN, 2012),
FSEIS/SOEIS (DoN, 2015), and FSEIS/SOEIS (DoN, 2017).
LOA and Rulemaking Application Under the MMPA for Use of SURTASS LFA Sonar
1-7 Description of the Proposed Activity
• The maximum duty cycle (ratio of sound “on” time to total time) is 20 percent. The typical duty
cycle, based on historical LFA sonar use (2003 to 2018), is 7.5 to 10 percent.
• The time between wavetrain transmissions is typically from 6 to 15 minutes (min).
LFA sonar complements SURTASS passive activities by actively acquiring and tracking submarines when
they are in quiet operating modes, measuring accurate target range, and re-acquiring lost contacts.
1.5.2 Passive Acoustic System
SURTASS is the passive, or listening, component of the system that detects returning echoes from
submerged objects, such as threat submarines, through the use of hydrophones. Hydrophones
transform mechanical energy (received acoustic sound waves) to an electrical signal that can be
analyzed by the processing system of the sonar. SURTASS consists of a twin-line (TL-29A) horizontal line
array (HLA), which is a “Y” shaped array with two apertures that is approximately 1,000 feet (ft) (305
meters [m]) long. The TL-29A can be towed in shallow, littoral environments; provides significant
directional noise rejection; and resolves bearing ambiguities without having to change the vessel’s
course.
To tow the HLA, a SURTASS LFA sonar vessel typically maintains a speed of at least 3 knots (kt) (5.6
kilometers per hour [kph]). The return (received) signals, which are usually below background or
ambient noise level, are processed and evaluated to identify and classify potential underwater threats.
LOA and Rulemaking Application Under the MMPA for Use of SURTASS LFA Sonar
2-1 Duration and Location
2 DURATION AND LOCATION OF SURTASS LFA SONAR USE
2.1 Duration
The annual LFA sonar transmission hours would be 496 hours total per year pooled across all SURTASS
LFA sonar equipped vessels in the first four years of the authorization, with the number of transmit
hours increasing to 592 hours across all vessels during year 5 and continuing into the foreseeable future,
regardless of the number of vessels. The SURTASS LFA sonar vessels typically operate independently but
may operate in conjunction with other naval air, surface, or submarine assets. The vessels generally
travel in straight lines or racetrack patterns depending on the activity scenario.
In years 5 through 7 of this authorization, the Navy is planning to add new vessels to its ocean
surveillance fleet. As new vessels are developed, the onboard LFA and HF/M3 sonar systems also need
to be updated, modified, or even re-designed. As the new vessels and sonar system components are
developed and constructed, at-sea testing would eventually be necessary. The Navy anticipates that
new vessels or new or updated sonar system components would be ready for at-sea testing beginning in
the fifth year of the time period covered by this application. Thus, the Navy’s activity analysis included
consideration of the sonar hours associated with future testing of new or updated LFA sonar system
components and new ocean surveillance vessels. This consideration resulted in two scenarios of annual
sonar transmit hours: Years 1 to 4 would entail 496 hours total per year across all SURTASS LFA sonar
vessels, while Years 5 to 7 would include an increase in LFA sonar transmit hours to 592 hours across all
vessels to accommodate future testing of new ocean surveillance vessels and new or updated sonar
system components.
The SURTASS LFA sonar transmission hours represent a distribution across six activities that include:
• Contractor crew proficiency training (80 hours per year)
• Military crew (MILCREW) proficiency training (96 hours per year)
• Participation in or support of naval exercises (96 hours per year)
• Vessel and equipment maintenance (64 hours per year)
• Acoustic research testing (160 hours per year)
• New SURTASS LFA sonar system testing (96 hours per year; would occur in years 5 to 7)
Each of these activities utilizes the SURTASS LFA sonar system within the operating profile described
above, therefore the number of hours estimated for each activity is merely for planning purposes.
2.2 Potential SURTASS LFA Sonar Areas
The geographic scope of the previous MMPA documents for SURTASS LFA sonar routine training, testing,
and military operations was the non-polar areas of the Atlantic, Pacific, and Indian oceans and the
Mediterranean Sea. The geographic scope of this application is the western and central North Pacific
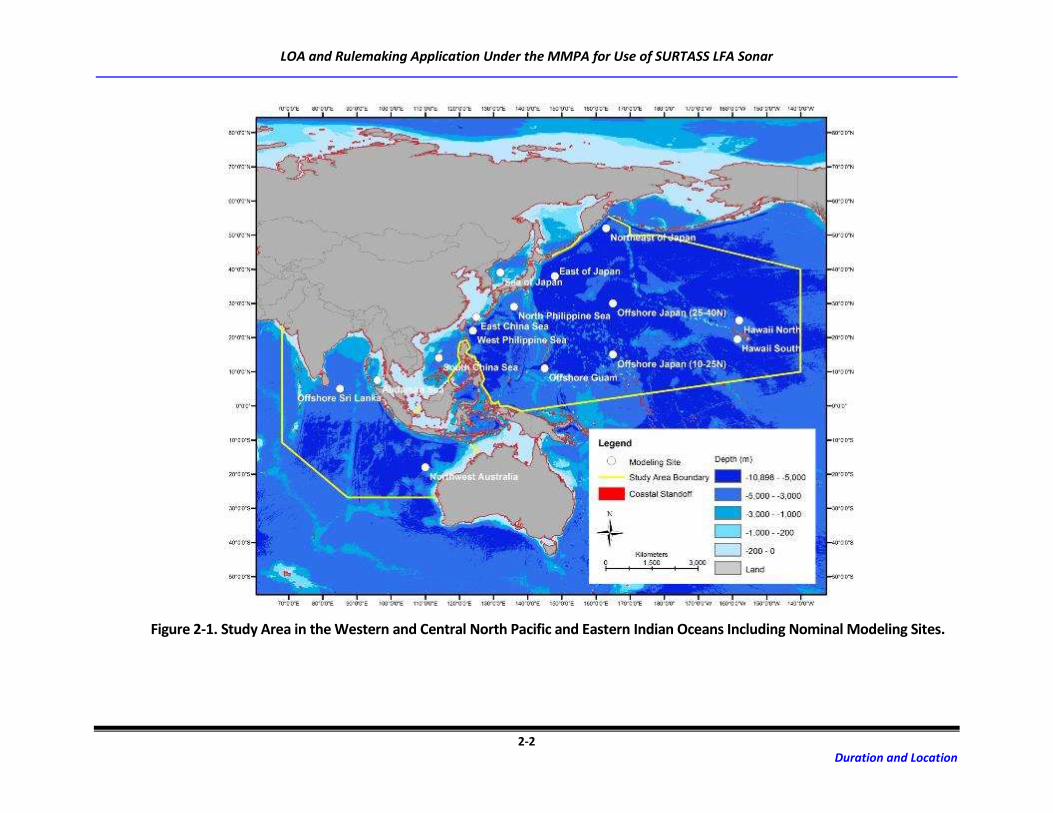
and eastern Indian oceans, outside of the territorial seas of foreign nations (Figure 2-1).
Requirement 2: Date(s) and duration of such activity and the specific geographic region where it will
occur.
LOA and Rulemaking Application Under the MMPA for Use of SURTASS LFA Sonar
2-2 Duration and Location
Figure 2-1. Study Area in the Western and Central North Pacific and Eastern Indian Oceans Including Nominal Modeling Sites.
LOA and Rulemaking Application Under the MMPA for Use of SURTASS LFA Sonar
2-3 Duration and Location
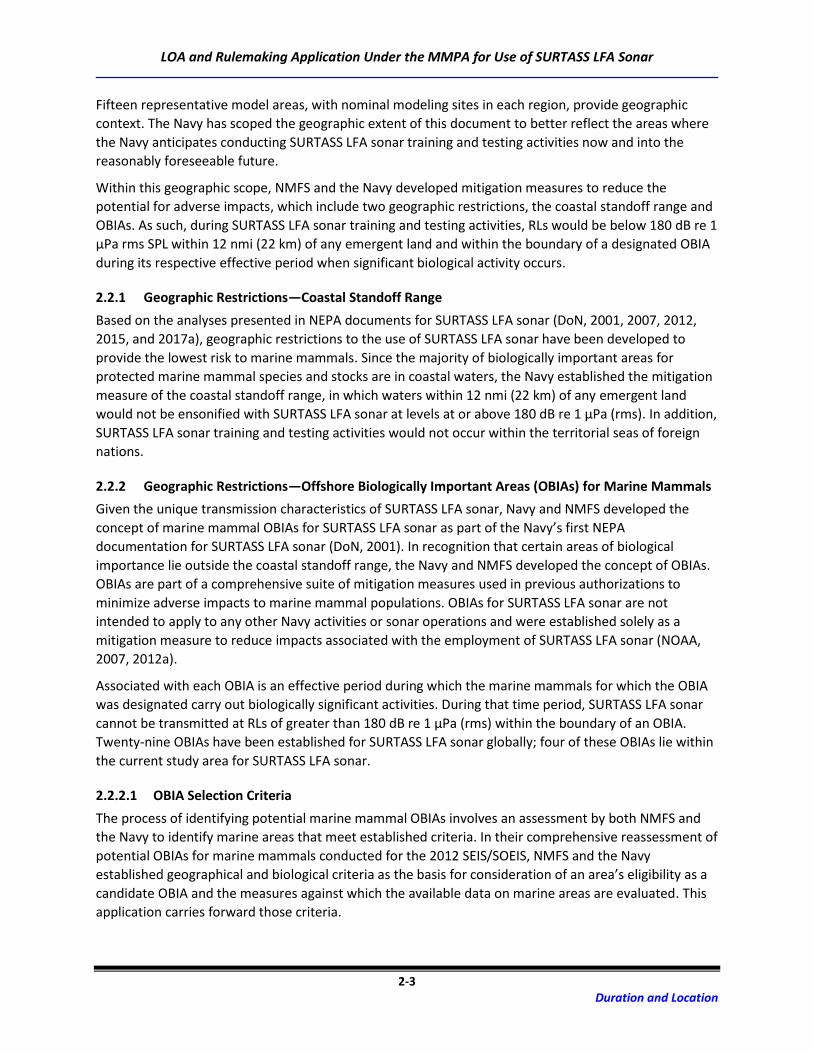
Fifteen representative model areas, with nominal modeling sites in each region, provide geographic
context. The Navy has scoped the geographic extent of this document to better reflect the areas where
the Navy anticipates conducting SURTASS LFA sonar training and testing activities now and into the
reasonably foreseeable future.
Within this geographic scope, NMFS and the Navy developed mitigation measures to reduce the
potential for adverse impacts, which include two geographic restrictions, the coastal standoff range and
OBIAs. As such, during SURTASS LFA sonar training and testing activities, RLs would be below 180 dB re 1
µPa rms SPL within 12 nmi (22 km) of any emergent land and within the boundary of a designated OBIA
during its respective effective period when significant biological activity occurs.
2.2.1 Geographic Restrictions—Coastal Standoff Range
Based on the analyses presented in NEPA documents for SURTASS LFA sonar (DoN, 2001, 2007, 2012,
2015, and 2017a), geographic restrictions to the use of SURTASS LFA sonar have been developed to
provide the lowest risk to marine mammals. Since the majority of biologically important areas for
protected marine mammal species and stocks are in coastal waters, the Navy established the mitigation
measure of the coastal standoff range, in which waters within 12 nmi (22 km) of any emergent land
would not be ensonified with SURTASS LFA sonar at levels at or above 180 dB re 1 µPa (rms). In addition,
SURTASS LFA sonar training and testing activities would not occur within the territorial seas of foreign
nations.
2.2.2 Geographic Restrictions—Offshore Biologically Important Areas (OBIAs) for Marine Mammals
Given the unique transmission characteristics of SURTASS LFA sonar, Navy and NMFS developed the
concept of marine mammal OBIAs for SURTASS LFA sonar as part of the Navy’s first NEPA
documentation for SURTASS LFA sonar (DoN, 2001). In recognition that certain areas of biological
importance lie outside the coastal standoff range, the Navy and NMFS developed the concept of OBIAs.
OBIAs are part of a comprehensive suite of mitigation measures used in previous authorizations to
minimize adverse impacts to marine mammal populations. OBIAs for SURTASS LFA sonar are not
intended to apply to any other Navy activities or sonar operations and were established solely as a
mitigation measure to reduce impacts associated with the employment of SURTASS LFA sonar (NOAA,
2007, 2012a).
Associated with each OBIA is an effective period during which the marine mammals for which the OBIA
was designated carry out biologically significant activities. During that time period, SURTASS LFA sonar
cannot be transmitted at RLs of greater than 180 dB re 1 µPa (rms) within the boundary of an OBIA.
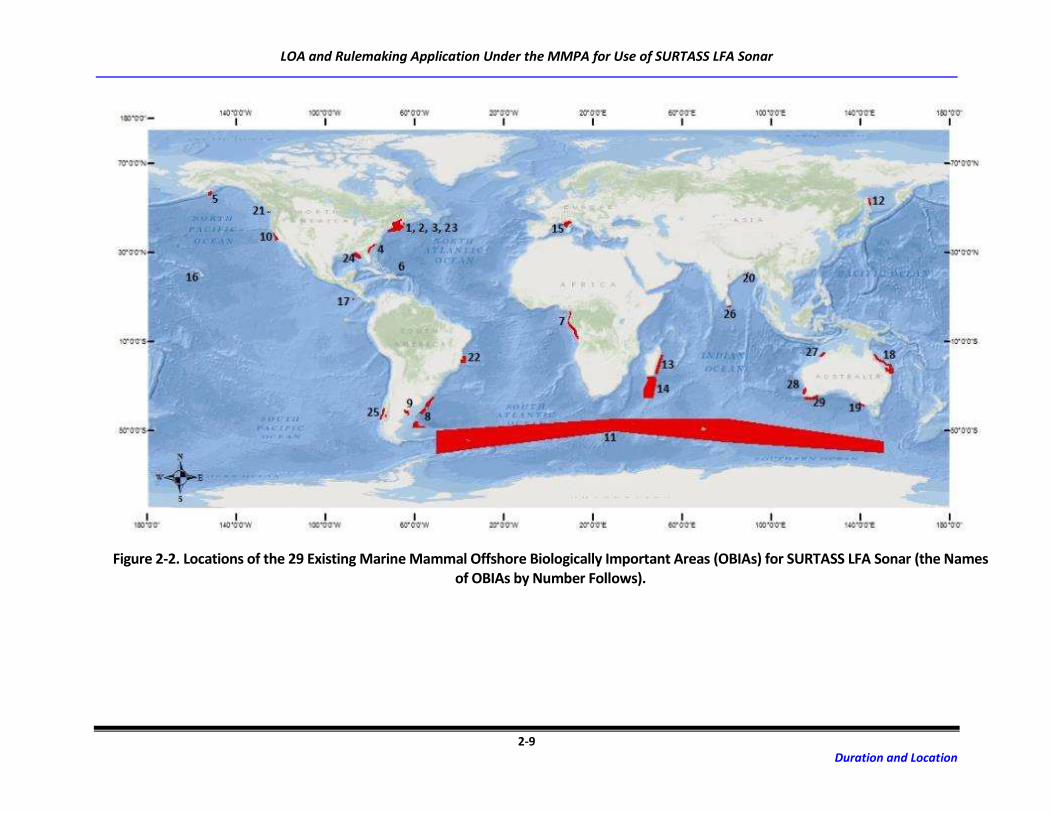
Twenty-nine OBIAs have been established for SURTASS LFA sonar globally; four of these OBIAs lie within
the current study area for SURTASS LFA sonar.
2.2.2.1 OBIA Selection Criteria
The process of identifying potential marine mammal OBIAs involves an assessment by both NMFS and
the Navy to identify marine areas that meet established criteria. In their comprehensive reassessment of
potential OBIAs for marine mammals conducted for the 2012 SEIS/SOEIS, NMFS and the Navy
established geographical and biological criteria as the basis for consideration of an area’s eligibility as a
candidate OBIA and the measures against which the available data on marine areas are evaluated. This
application carries forward those criteria.
LOA and Rulemaking Application Under the MMPA for Use of SURTASS LFA Sonar
2-4 Duration and Location
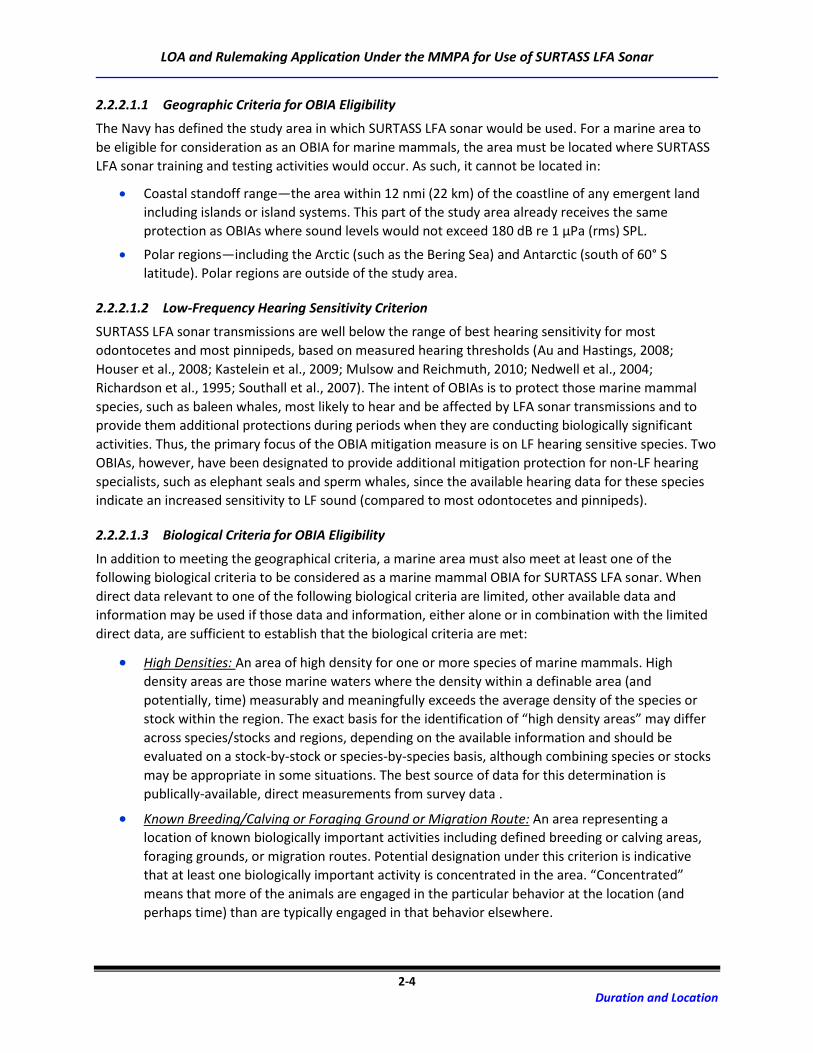
2.2.2.1.1 Geographic Criteria for OBIA Eligibility
The Navy has defined the study area in which SURTASS LFA sonar would be used. For a marine area to
be eligible for consideration as an OBIA for marine mammals, the area must be located where SURTASS
LFA sonar training and testing activities would occur. As such, it cannot be located in:
• Coastal standoff range—the area within 12 nmi (22 km) of the coastline of any emergent land
including islands or island systems. This part of the study area already receives the same
protection as OBIAs where sound levels would not exceed 180 dB re 1 µPa (rms) SPL.
• Polar regions—including the Arctic (such as the Bering Sea) and Antarctic (south of 60° S
latitude). Polar regions are outside of the study area.
2.2.2.1.2 Low-Frequency Hearing Sensitivity Criterion
SURTASS LFA sonar transmissions are well below the range of best hearing sensitivity for most
odontocetes and most pinnipeds, based on measured hearing thresholds (Au and Hastings, 2008;
Houser et al., 2008; Kastelein et al., 2009; Mulsow and Reichmuth, 2010; Nedwell et al., 2004;
Richardson et al., 1995; Southall et al., 2007). The intent of OBIAs is to protect those marine mammal
species, such as baleen whales, most likely to hear and be affected by LFA sonar transmissions and to
provide them additional protections during periods when they are conducting biologically significant
activities. Thus, the primary focus of the OBIA mitigation measure is on LF hearing sensitive species. Two
OBIAs, however, have been designated to provide additional mitigation protection for non-LF hearing
specialists, such as elephant seals and sperm whales, since the available hearing data for these species
indicate an increased sensitivity to LF sound (compared to most odontocetes and pinnipeds).
2.2.2.1.3 Biological Criteria for OBIA Eligibility
In addition to meeting the geographical criteria, a marine area must also meet at least one of the
following biological criteria to be considered as a marine mammal OBIA for SURTASS LFA sonar. When
direct data relevant to one of the following biological criteria are limited, other available data and
information may be used if those data and information, either alone or in combination with the limited
direct data, are sufficient to establish that the biological criteria are met:
• High Densities: An area of high density for one or more species of marine mammals. High
density areas are those marine waters where the density within a definable area (and
potentially, time) measurably and meaningfully exceeds the average density of the species or
stock within the region. The exact basis for the identification of “high density areas” may differ
across species/stocks and regions, depending on the available information and should be
evaluated on a stock-by-stock or species-by-species basis, although combining species or stocks
may be appropriate in some situations. The best source of data for this determination is
publically-available, direct measurements from survey data .
• Known Breeding/Calving or Foraging Ground or Migration Route: An area representing a
location of known biologically important activities including defined breeding or calving areas,
foraging grounds, or migration routes. Potential designation under this criterion is indicative
that at least one biologically important activity is concentrated in the area. “Concentrated”
means that more of the animals are engaged in the particular behavior at the location (and
perhaps time) than are typically engaged in that behavior elsewhere.

LOA and Rulemaking Application Under the MMPA for Use of SURTASS LFA Sonar
2-5 Duration and Location
• Small, Distinct Populations of Marine Mammals with Limited Distributions: Geographic areas in
which small, distinct populations of marine mammals occur and whose distributional range are
limited.
• U.S. ESA-designated Critical Habitat for an ESA-listed Marine Mammal Species or Stock: Areas
designated as critical habitat under the Endangered Species Act (ESA) for listed marine mammal
species. Effective seasonal periods are consistent with that designated for the critical habitat
area. As with the other biological criteria, critical habitat is considered as one of the possible
factors in the OBIA process.
2.2.2.1.4 Navy Practicability Criterion
Once an area has been assessed to meet the OBIA criteria, it is considered a candidate OBIA for SURTASS
LFA sonar. The Navy then conducts a practicability review of the candidate OBIAs to assess personnel
safety, practicality of implementation, and impacts on the effectiveness on military readiness activities.
If no issues are found during the Navy’s practicability review, then an area meets all criteria for
designation as a SURTASS LFA sonar OBIA for marine mammals. If the Navy determines that it is not
practicable to designate the area as an OBIA, the Navy would identify the concerns that lead to this
conclusion and discuss with NMFS whether modifications could be made to the proposed OBIA to
alleviate the Navy’s practicability concerns.
2.2.2.2 Existing Marine Mammal OBIAs for SURTASS LFA Sonar
Under the NDE, 29 areas were observed as marine mammal OBIAs for SURTASS LFA sonar (Table 2-1;
Figure 2-2; DoD, 2017). Some of these areas, such as the Antarctic Convergence Zone, had been
previously designated as OBIAs by the Navy and NMFS for SURTASS LFA sonar. The season or period in
which the biological activity occurs annually is specified for each designated OBIA. Of these 29 OBIAs,
four occur in the proposed study area (Figure 2-3), including OBIA#16 (Penguin Bank, Hawaiian Island
Humpback Whale NMFS), OBIA#20 (Northern Bay of Bengal and Head of Swatch-of-No-Ground [SoNG]),
OBIA#26 (Offshore Sri Lanka), and OBIA#27 (Camden Sound/Kimberly Region).
2.2.2.3 Potential Marine Mammal OBIAs for SURTASS LFA Sonar
Since the 2017 SEIS/SOEIS and MMPA NDE for SURTASS LFA sonar, consideration and assessment of
marine areas as potential OBIAs has continued. The Navy and NMFS monitor scientific literature, data,
and information that may support the potential marine areas or provide additional candidates for
consideration as OBIAs for SURTASS LFA sonar. As a continuation of the Navy and NMFS’ ongoing effort
to assess areas as potential OBIAs for SURTASS LFA sonar, the Navy and NMFS are conducting a
comprehensive assessment of potential marine areas as part of the analysis and development of
geographic mitigation.
2.2.3 Representative Model Areas
Fifteen representative model areas in the western and central North Pacific and eastern Indian oceans
were analyzed to represent the acoustic regimes and marine mammal species that may be encountered
during SURTASS LFA sonar training and testing activities (Table 2-2). Acoustic impact modeling was
conducted in each season for each model area. Seasons were defined according to the following
monthly breakdown:
• Winter: December, January, and February

LOA and Rulemaking Application Under the MMPA for Use of SURTASS LFA Sonar
2-6 Duration and Location
Table 2-1. Existing 29 Offshore Biologically Important Areas (OBIAs) for SURTASS LFA Sonar, the Relevant Marine Mammal Species, and the Effective Seasonal Period for each OBIA.
OBIA
Number Name of OBIA
Location/Water
Body
Relevant Low-
Frequency Marine
Mammal Species
Effectiveness Seasonal
Period
1 Georges Bank Northwest Atlantic
Ocean
North Atlantic right
whale Year-round
2 Roseway Basin Right
Whale Conservation Area
Northwest Atlantic
Ocean
North Atlantic right
whale
June through December,
annually
3
Great South Channel, U.S.
Gulf of Maine, and
Stellwagen Bank National
Marine Sanctuary (NMS)
Northwest Atlantic
Ocean/ Gulf of
Maine
North Atlantic right
whale
January 1 to November 14,
annually; year-round for
Stellwagen Bank NMS
4 Southeastern U.S. Right
Whale Critical Habitat
Northwest Atlantic
Ocean
North Atlantic right
whale
November 15 to April 15,
annually
5 Gulf of Alaska Gulf of Alaska North Pacific right
whale
March through September,
annually
6 Navidad Bank
Caribbean
Sea/Northwest
Atlantic Ocean
Humpback whale December through April,
annually
7 Coastal Western Africa
(Cameron to Angola)
Southeastern
Atlantic Ocean
Humpback whale
and Blue whale
June through October,
annually
8 Patagonian Shelf Break Southwestern
Atlantic Ocean
Southern elephant
seal Year-round
9 Southern Right Whale
Seasonal Habitat
Southwestern
Atlantic Ocean
Southern right
whale
May through December,
annually
10 Central California Northeastern Pacific
Ocean
Blue whale and
Humpback whale
June through November,
annually
11 Antarctic Convergence
Zone Southern Ocean
Blue whale, Fin
whale, Sei whale,
Minke whale,
Humpback whale,
and Southern right
whale
October through March,
annually
12 Offshore Piltun and
Chayvo Sea of Okhotsk
Western Pacific gray
whale
June through November,
annually
13 Eastern Madagascar
Coastal Waters
Western Indian
Ocean
Humpback whale
and Blue whale
July through September,
annually for humpback
whale breeding,
November through
December for migrating
blue whales

LOA and Rulemaking Application Under the MMPA for Use of SURTASS LFA Sonar
2-7 Duration and Location
Table 2-1. Existing 29 Offshore Biologically Important Areas (OBIAs) for SURTASS LFA Sonar, the Relevant Marine Mammal Species, and the Effective Seasonal Period for each OBIA.
OBIA
Number Name of OBIA
Location/Water
Body
Relevant Low-
Frequency Marine
Mammal Species
Effectiveness Seasonal
Period
14
Southern Madagascar
(Madagascar Plateau,
Madagascar Ridge, and
Walters Shoal
Western Indian
Ocean
Pygmy blue whale,
Humpback whale,
and Bryde’s whale
November through
December, annually
15
Ligurian-Corsican-
Provençal Basin
and Western
Pelagos Sanctuary
Northern
Mediterranean Sea Fin whale July to August, annually
16
Penguin Bank, Hawaiian
Islands Humpback
Whale NMS
North-Central Pacific
Ocean Humpback whale
November through April,
annually
17 Costa Rica Dome Eastern Tropical
Pacific Ocean Blue whale and
Humpback whale Year-round
18 Great Barrier Reef
Coral
Sea/Southwestern
Pacific Ocean
Humpback whale
and Dwarf minke
whale
May through September,
annually
19 Bonney Upwelling Southern Ocean
Blue whale, Pygmy
blue whale, and
Southern right
Whale
December through May,
annually
20
Northern Bay of Bengal
and Head of Swatch-of-No-
Ground (SoNG)
Bay of
Bengal/Northern
Indian Ocean
Bryde’s whale Year-round
21
Olympic Coast NMS and
The Prairie, Barkley
Canyon, and Nitinat
Canyon
Northeastern Pacific
Ocean Humpback whale
Olympic NMS: December,
January, March, and May,
annually;
The Prairie, Barkley Canyon,
and Nitinat Canyon: June
through September,
annually
22 Abrolhos Bank Southwest Atlantic
Ocean Humpback whale
August through November,
annually
23 Grand Manan North
Atlantic Right Whale
Critical Habitat
Bay of Fundy North Atlantic right
whale
June through December,
annually
24 Eastern Gulf of Mexico Gulf of Mexico Bryde’s whale Year-round
25 Southern Coastal Chile Gulf of Corcovado,
Southeast Pacific
Ocean
Blue whale February to April, annually
26 Offshore Sri Lanka North-Central Indian
Ocean Blue whale
December through April,
annually

LOA and Rulemaking Application Under the MMPA for Use of SURTASS LFA Sonar
2-8 Duration and Location
Table 2-1. Existing 29 Offshore Biologically Important Areas (OBIAs) for SURTASS LFA Sonar, the Relevant Marine Mammal Species, and the Effective Seasonal Period for each OBIA.
OBIA
Number Name of OBIA
Location/Water
Body
Relevant Low-
Frequency Marine
Mammal Species
Effectiveness Seasonal
Period
27 Camden Sound/Kimberly
Region
Southeast Indian
Ocean; northwestern
Australia
Humpback whale June through September,
annually
28 Perth Canyon
Southeast Indian
Ocean; southwestern
Australia
Pygmy blue
whale/Blue whale;
Sperm whale
January through May,
annually
29 Southwest Australia
Canyons
Southern Ocean;
southwestern
Australia
Sperm whale Year-round
• Spring: March, April, and May
• Summer: June, July, and August
• Fall: September, October, and November.
For consistency, the seasonality for marine mammals in all model areas is presented according to this
monthly arrangement, even for the one model area located in the southern hemisphere. Winter
(December, January, and February) in the southern hemisphere is austral summer, when for instance,
most baleen whales would be expected to be foraging in Antarctic waters.
LOA and Rulemaking Application Under the MMPA for Use of SURTASS LFA Sonar
2-9 Duration and Location
Figure 2-2. Locations of the 29 Existing Marine Mammal Offshore Biologically Important Areas (OBIAs) for SURTASS LFA Sonar (the Names of OBIAs by Number Follows).
LOA and Rulemaking Application Under the MMPA for Use of SURTASS LFA Sonar
2-10 Duration and Location
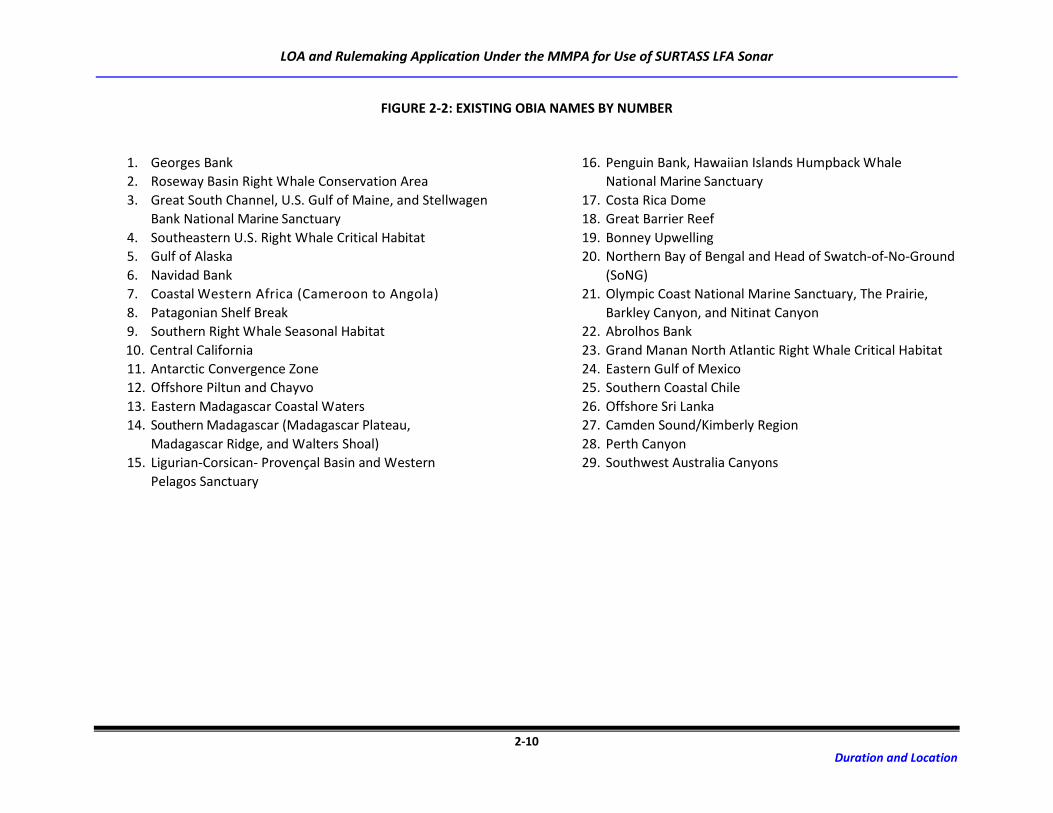
FIGURE 2-2: EXISTING OBIA NAMES BY NUMBER
1. Georges Bank
2. Roseway Basin Right Whale Conservation Area
3. Great South Channel, U.S. Gulf of Maine, and Stellwagen
Bank National Marine Sanctuary
4. Southeastern U.S. Right Whale Critical Habitat
5. Gulf of Alaska
6. Navidad Bank
7. Coastal Western Africa (Cameroon to Angola)
8. Patagonian Shelf Break
9. Southern Right Whale Seasonal Habitat
10. Central California
11. Antarctic Convergence Zone
12. Offshore Piltun and Chayvo
13. Eastern Madagascar Coastal Waters
14. Southern Madagascar (Madagascar Plateau,
Madagascar Ridge, and Walters Shoal)
15. Ligurian-Corsican- Provençal Basin and Western
Pelagos Sanctuary
16. Penguin Bank, Hawaiian Islands Humpback Whale
National Marine Sanctuary
17. Costa Rica Dome
18. Great Barrier Reef
19. Bonney Upwelling
20. Northern Bay of Bengal and Head of Swatch-of-No-Ground
(SoNG)
21. Olympic Coast National Marine Sanctuary, The Prairie,
Barkley Canyon, and Nitinat Canyon
22. Abrolhos Bank
23. Grand Manan North Atlantic Right Whale Critical Habitat
24. Eastern Gulf of Mexico
25. Southern Coastal Chile
26. Offshore Sri Lanka
27. Camden Sound/Kimberly Region
28. Perth Canyon
29. Southwest Australia Canyons

LOA and Rulemaking Application Under the MMPA for Use of SURTASS LFA Sonar
2-11 Duration and Location
Figure 2-3. Locations of the Four OBIAs (16, 20, 26, and 27) in the SURTASS LFA Sonar Study Area.

LOA and Rulemaking Application Under the MMPA for Use of SURTASS LFA Sonar
2-12 Duration and Location
Table 2-2. Locations of the 15 Representative Model Areas for SURTASS LFA Sonar Training and Testing Activities with the Nominal Center of each Area.
Model Area Model Area Name Location of Model Area
Center Notes
1 East of Japan 38°N, 148°E
2 North Philippine Sea 29°N, 136°E
3 West Philippine Sea 22°N/124°E
4 Offshore Guam 11°N, 145°E Navy Mariana Islands Testing
and Training Area
5 Sea of Japan 39°N, 132°E
6 East China Sea 26°N, 125°E
7 South China Sea 14°N, 114°E
8 Offshore Japan 25° to 40°N 30°N, 165°E
9 Offshore Japan 10° to 25°N 15°N, 165°E
10 Hawaii North 25°N, 158°W Navy Hawaii-Southern California
Training and Testing Area
11 Hawaii South 19.5°N, 158.5°W Navy Hawaii-Southern
California Training and Testing Area
12 Offshore Sri Lanka 5°N, 85°E
13 Andaman Sea 7.5°N, 96°E
14 Northwest of Australia 18S, 110E
15 Northeast of Japan 52N, 163E
LOA and Rulemaking Application Under the MMPA for Use of SURTASS LFA Sonar
3-1 Marine Mammals
3 MARINE MAMMALS
To establish the marine mammal species or stocks potentially affected by SURTASS LFA sonar activities,
two essential screening criteria were applied: the species or stocks had to occur at least seasonally in a
representative model area and had to possess sensory organs or tissues that allow the marine mammals
to perceive the LF sounds produced by the sonar. Only those species of marine mammals meeting these
criteria are considered further in this application.
In cases where direct evidence of acoustic sensitivity to LF or any other frequency range is lacking for a
species, reasonable indirect evidence was used to support the evaluation (e.g., there is no direct
evidence that a species hears LF sound but good evidence exists that the species produces LF sound). In
cases where important biological information was not available or was insufficient for one species but
data were available for a related species, the comparable data were used. Additional attention was
given to species with either special protected stock status or limited potential for reproductive
replacement in the event of mortality.
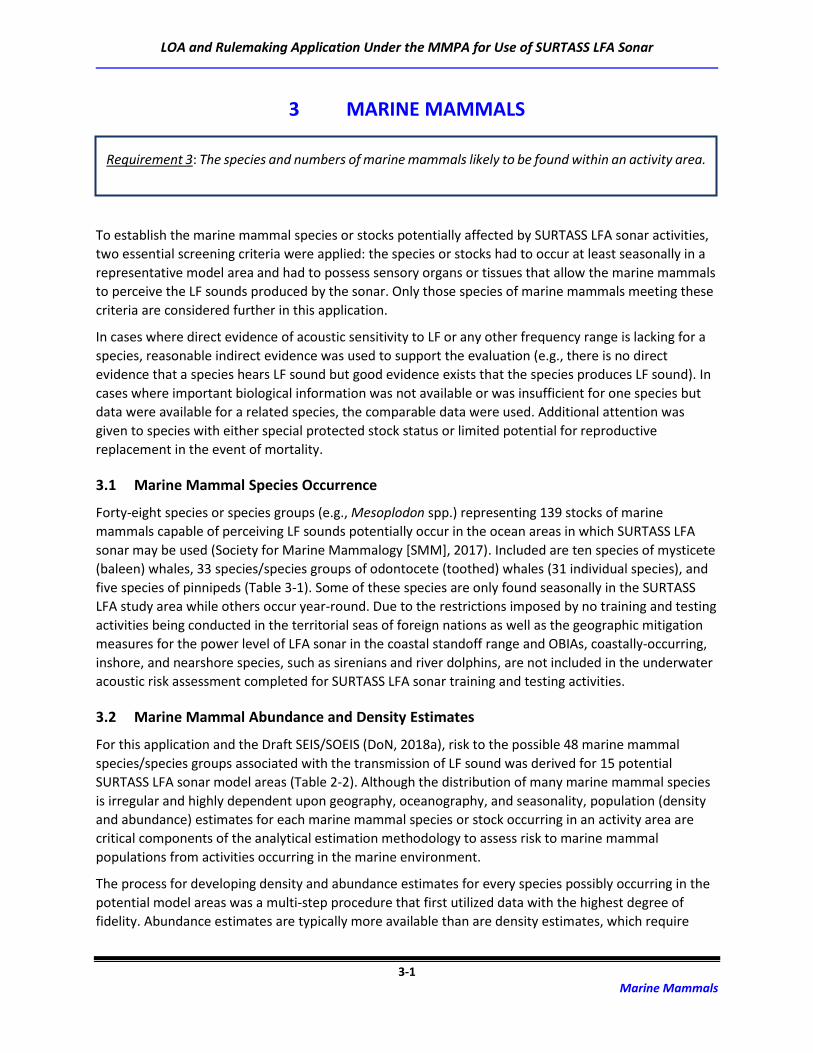
3.1 Marine Mammal Species Occurrence
Forty-eight species or species groups (e.g., Mesoplodon spp.) representing 139 stocks of marine
mammals capable of perceiving LF sounds potentially occur in the ocean areas in which SURTASS LFA
sonar may be used (Society for Marine Mammalogy [SMM], 2017). Included are ten species of mysticete
(baleen) whales, 33 species/species groups of odontocete (toothed) whales (31 individual species), and
five species of pinnipeds (Table 3-1). Some of these species are only found seasonally in the SURTASS
LFA study area while others occur year-round. Due to the restrictions imposed by no training and testing
activities being conducted in the territorial seas of foreign nations as well as the geographic mitigation
measures for the power level of LFA sonar in the coastal standoff range and OBIAs, coastally-occurring,
inshore, and nearshore species, such as sirenians and river dolphins, are not included in the underwater
acoustic risk assessment completed for SURTASS LFA sonar training and testing activities.
3.2 Marine Mammal Abundance and Density Estimates
For this application and the Draft SEIS/SOEIS (DoN, 2018a), risk to the possible 48 marine mammal
species/species groups associated with the transmission of LF sound was derived for 15 potential
SURTASS LFA sonar model areas (Table 2-2). Although the distribution of many marine mammal species
is irregular and highly dependent upon geography, oceanography, and seasonality, population (density
and abundance) estimates for each marine mammal species or stock occurring in an activity area are
critical components of the analytical estimation methodology to assess risk to marine mammal
populations from activities occurring in the marine environment.
The process for developing density and abundance estimates for every species possibly occurring in the
potential model areas was a multi-step procedure that first utilized data with the highest degree of
fidelity. Abundance estimates are typically more available than are density estimates, which require
Requirement 3: The species and numbers of marine mammals likely to be found within an activity area.
LOA and Rulemaking Application Under the MMPA for Use of SURTASS LFA Sonar
3-2 Marine Mammals
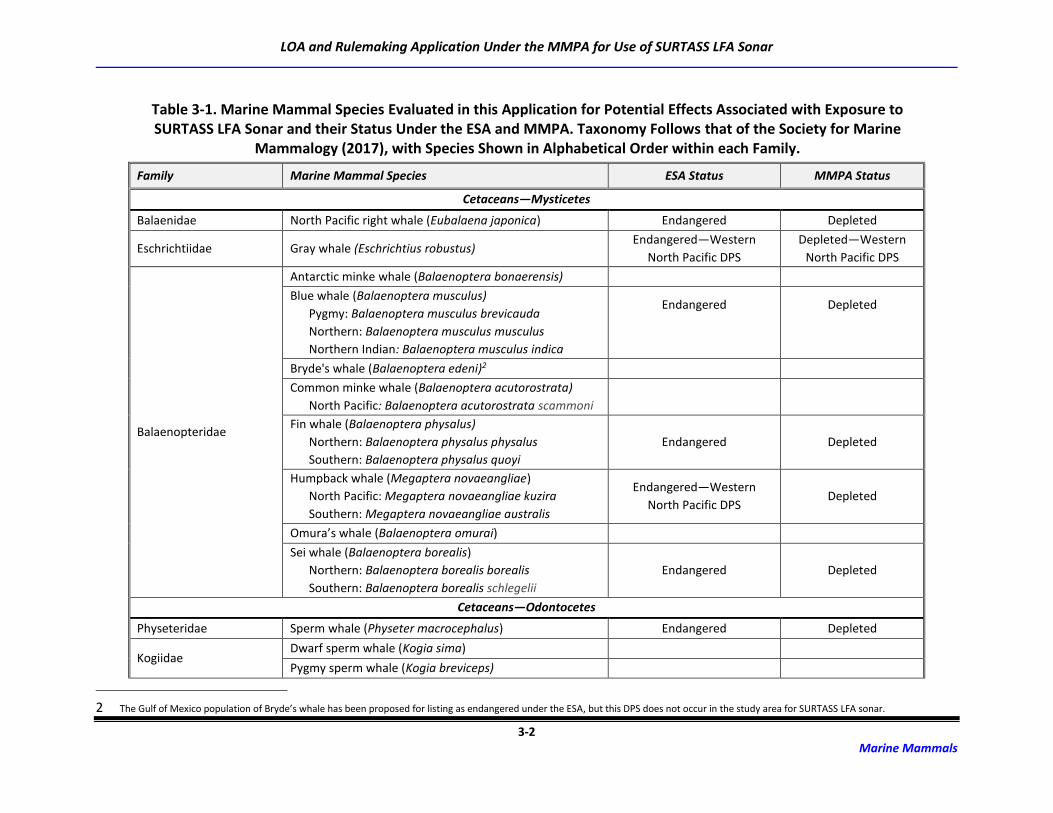
Table 3-1. Marine Mammal Species Evaluated in this Application for Potential Effects Associated with Exposure to SURTASS LFA Sonar and their Status Under the ESA and MMPA. Taxonomy Follows that of the Society for Marine
Mammalogy (2017), with Species Shown in Alphabetical Order within each Family.
Family Marine Mammal Species ESA Status MMPA Status
Cetaceans—Mysticetes
Balaenidae North Pacific right whale (Eubalaena japonica) Endangered Depleted
Eschrichtiidae Gray whale (Eschrichtius robustus) Endangered—Western
North Pacific DPS
Depleted—Western
North Pacific DPS
Balaenopteridae
Antarctic minke whale (Balaenoptera bonaerensis)
Blue whale (Balaenoptera musculus)
Pygmy: Balaenoptera musculus brevicauda
Northern: Balaenoptera musculus musculus
Northern Indian: Balaenoptera musculus indica
Endangered
Depleted
Bryde's whale (Balaenoptera edeni)2
Common minke whale (Balaenoptera acutorostrata)
North Pacific: Balaenoptera acutorostrata scammoni
Fin whale (Balaenoptera physalus)
Northern: Balaenoptera physalus physalus
Southern: Balaenoptera physalus quoyi
Endangered Depleted
Humpback whale (Megaptera novaeangliae)
North Pacific: Megaptera novaeangliae kuzira
Southern: Megaptera novaeangliae australis
Endangered—Western
North Pacific DPS Depleted
Omura’s whale (Balaenoptera omurai)
Sei whale (Balaenoptera borealis)
Northern: Balaenoptera borealis borealis
Southern: Balaenoptera borealis schlegelii
Endangered Depleted
Cetaceans—Odontocetes
Physeteridae Sperm whale (Physeter macrocephalus) Endangered Depleted
Kogiidae Dwarf sperm whale (Kogia sima)
Pygmy sperm whale (Kogia breviceps)
2 The Gulf of Mexico population of Bryde’s whale has been proposed for listing as endangered under the ESA, but this DPS does not occur in the study area for SURTASS LFA sonar.
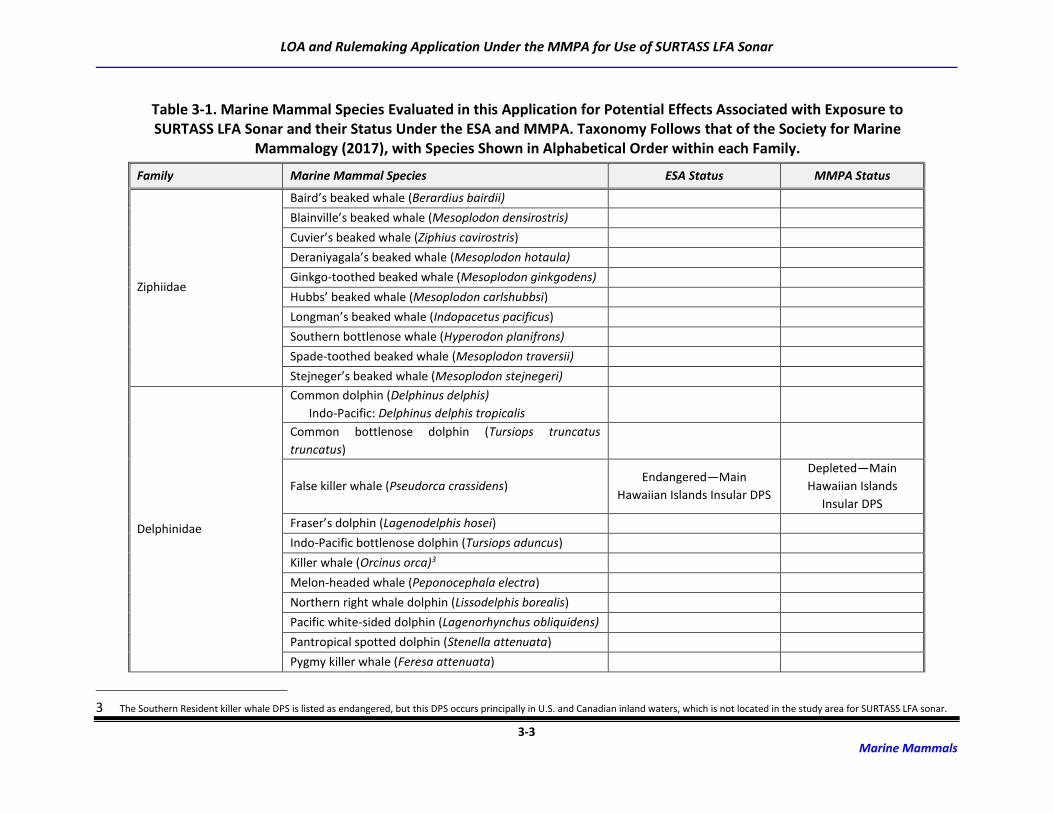
LOA and Rulemaking Application Under the MMPA for Use of SURTASS LFA Sonar
3-3 Marine Mammals
Table 3-1. Marine Mammal Species Evaluated in this Application for Potential Effects Associated with Exposure to SURTASS LFA Sonar and their Status Under the ESA and MMPA. Taxonomy Follows that of the Society for Marine
Mammalogy (2017), with Species Shown in Alphabetical Order within each Family.
Family Marine Mammal Species ESA Status MMPA Status
Ziphiidae
Baird’s beaked whale (Berardius bairdii)
Blainville’s beaked whale (Mesoplodon densirostris)
Cuvier’s beaked whale (Ziphius cavirostris)
Deraniyagala’s beaked whale (Mesoplodon hotaula)
Ginkgo-toothed beaked whale (Mesoplodon ginkgodens)
Hubbs’ beaked whale (Mesoplodon carlshubbsi)
Longman’s beaked whale (Indopacetus pacificus)
Southern bottlenose whale (Hyperodon planifrons)
Spade-toothed beaked whale (Mesoplodon traversii)
Stejneger’s beaked whale (Mesoplodon stejnegeri)
Delphinidae
Common dolphin (Delphinus delphis)
Indo-Pacific: Delphinus delphis tropicalis
Common bottlenose dolphin (Tursiops truncatus
truncatus)
False killer whale (Pseudorca crassidens) Endangered—Main
Hawaiian Islands Insular DPS
Depleted—Main
Hawaiian Islands
Insular DPS
Fraser’s dolphin (Lagenodelphis hosei)
Indo-Pacific bottlenose dolphin (Tursiops aduncus)
Killer whale (Orcinus orca)3
Melon-headed whale (Peponocephala electra)
Northern right whale dolphin (Lissodelphis borealis)
Pacific white-sided dolphin (Lagenorhynchus obliquidens)
Pantropical spotted dolphin (Stenella attenuata)
Pygmy killer whale (Feresa attenuata)
3 The Southern Resident killer whale DPS is listed as endangered, but this DPS occurs principally in U.S. and Canadian inland waters, which is not located in the study area for SURTASS LFA sonar.
LOA and Rulemaking Application Under the MMPA for Use of SURTASS LFA Sonar
3-4 Marine Mammals
Table 3-1. Marine Mammal Species Evaluated in this Application for Potential Effects Associated with Exposure to SURTASS LFA Sonar and their Status Under the ESA and MMPA. Taxonomy Follows that of the Society for Marine
Mammalogy (2017), with Species Shown in Alphabetical Order within each Family.
Family Marine Mammal Species ESA Status MMPA Status
Delphinidae (Continued)
Risso’s dolphin (Grampus griseus)
Rough-toothed dolphin (Steno bredanensis)
Short-finned pilot whale (Globicephala macrorhynchus)
Spinner dolphin (Stenella longirostris)
Striped dolphin (Stenella coeruleoalba)
Phocoenidae
Dall’s porpoise (Phocoenoides dalli)
dalli-type: Phocoenoides dalli dalli
truei-type: Phocoenoides dalli truei
Harbor porpoise (Phocoena phocoena)
Pinnipeds
Otariidae
Northern fur seal (Callorhinus ursinus)
Western Steller sea lion (Eumetopias jubatus jubatus) Endangered—Western
DPS/stock Depleted
Phocidae
Hawaiian monk seal (Neomonachus schauinslandi) Endangered Depleted
Ribbon seal (Histriophoca fasciata)
Spotted seal (Phoca largha) Threatened—Southern DPS Depleted—Southern
DPS
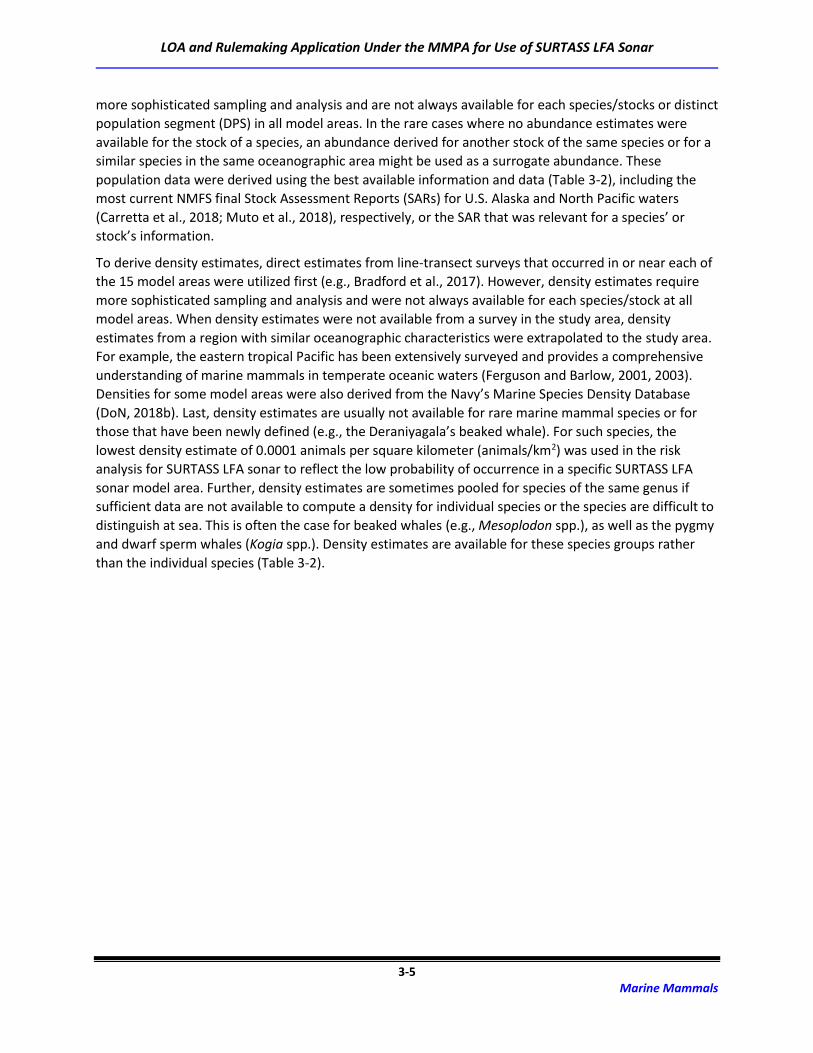
LOA and Rulemaking Application Under the MMPA for Use of SURTASS LFA Sonar
3-5 Marine Mammals
more sophisticated sampling and analysis and are not always available for each species/stocks or distinct
population segment (DPS) in all model areas. In the rare cases where no abundance estimates were
available for the stock of a species, an abundance derived for another stock of the same species or for a
similar species in the same oceanographic area might be used as a surrogate abundance. These
population data were derived using the best available information and data (Table 3-2), including the
most current NMFS final Stock Assessment Reports (SARs) for U.S. Alaska and North Pacific waters
(Carretta et al., 2018; Muto et al., 2018), respectively, or the SAR that was relevant for a species’ or
stock’s information.
To derive density estimates, direct estimates from line-transect surveys that occurred in or near each of
the 15 model areas were utilized first (e.g., Bradford et al., 2017). However, density estimates require
more sophisticated sampling and analysis and were not always available for each species/stock at all
model areas. When density estimates were not available from a survey in the study area, density
estimates from a region with similar oceanographic characteristics were extrapolated to the study area.
For example, the eastern tropical Pacific has been extensively surveyed and provides a comprehensive
understanding of marine mammals in temperate oceanic waters (Ferguson and Barlow, 2001, 2003).
Densities for some model areas were also derived from the Navy’s Marine Species Density Database
(DoN, 2018b). Last, density estimates are usually not available for rare marine mammal species or for
those that have been newly defined (e.g., the Deraniyagala’s beaked whale). For such species, the
lowest density estimate of 0.0001 animals per square kilometer (animals/km2) was used in the risk
analysis for SURTASS LFA sonar to reflect the low probability of occurrence in a specific SURTASS LFA
sonar model area. Further, density estimates are sometimes pooled for species of the same genus if
sufficient data are not available to compute a density for individual species or the species are difficult to
distinguish at sea. This is often the case for beaked whales (e.g., Mesoplodon spp.), as well as the pygmy
and dwarf sperm whales (Kogia spp.). Density estimates are available for these species groups rather
than the individual species (Table 3-2).
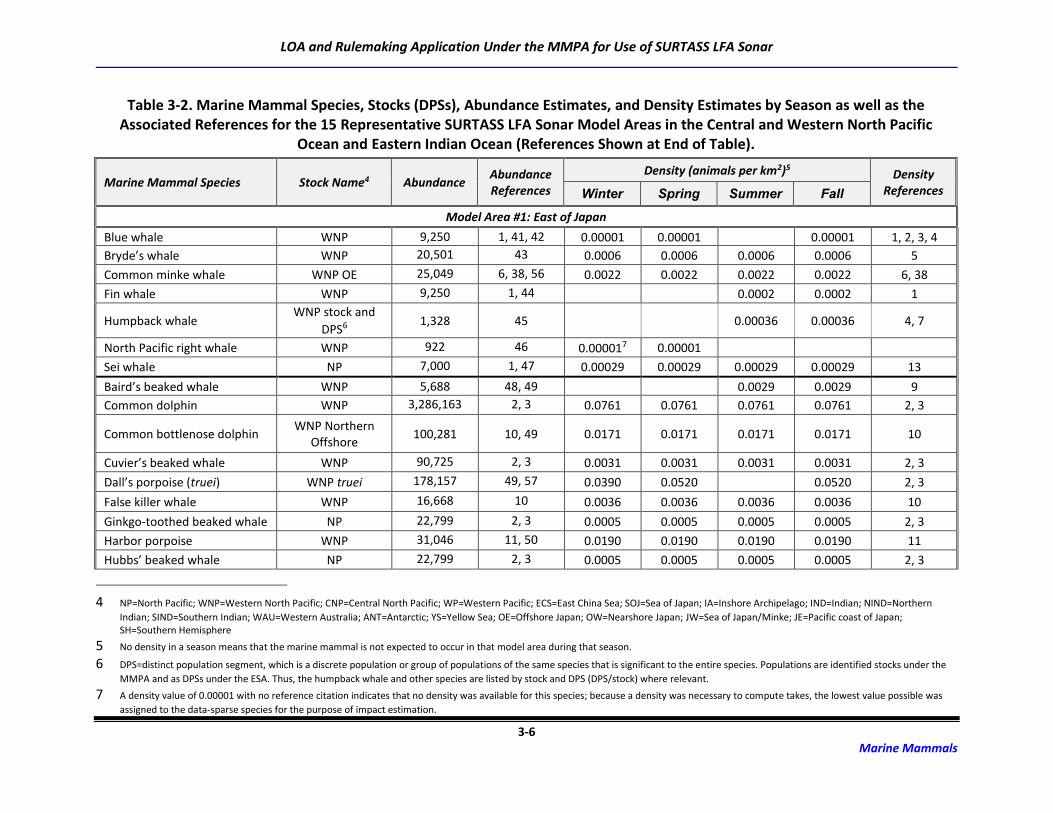
LOA and Rulemaking Application Under the MMPA for Use of SURTASS LFA Sonar
3-6 Marine Mammals
Table 3-2. Marine Mammal Species, Stocks (DPSs), Abundance Estimates, and Density Estimates by Season as well as the Associated References for the 15 Representative SURTASS LFA Sonar Model Areas in the Central and Western North Pacific
Ocean and Eastern Indian Ocean (References Shown at End of Table).
Marine Mammal Species Stock Name4 Abundance Abundance References
Density (animals per km2)5 Density References Winter Spring Summer Fall
Model Area #1: East of Japan
Blue whale WNP 9,250 1, 41, 42 0.00001 0.00001 0.00001 1, 2, 3, 4
Bryde’s whale WNP 20,501 43 0.0006 0.0006 0.0006 0.0006 5
Common minke whale WNP OE 25,049 6, 38, 56 0.0022 0.0022 0.0022 0.0022 6, 38
Fin whale WNP 9,250 1, 44 0.0002 0.0002 1
Humpback whale WNP stock and
DPS6 1,328 45 0.00036 0.00036 4, 7
North Pacific right whale WNP 922 46 0.000017 0.00001
Sei whale NP 7,000 1, 47 0.00029 0.00029 0.00029 0.00029 13
Baird’s beaked whale WNP 5,688 48, 49 0.0029 0.0029 9
Common dolphin WNP 3,286,163 2, 3 0.0761 0.0761 0.0761 0.0761 2, 3
Common bottlenose dolphin WNP Northern
Offshore 100,281 10, 49 0.0171 0.0171 0.0171 0.0171 10
Cuvier’s beaked whale WNP 90,725 2, 3 0.0031 0.0031 0.0031 0.0031 2, 3
Dall’s porpoise (truei) WNP truei 178,157 49, 57 0.0390 0.0520 0.0520 2, 3
False killer whale WNP 16,668 10 0.0036 0.0036 0.0036 0.0036 10
Ginkgo-toothed beaked whale NP 22,799 2, 3 0.0005 0.0005 0.0005 0.0005 2, 3
Harbor porpoise WNP 31,046 11, 50 0.0190 0.0190 0.0190 0.0190 11
Hubbs’ beaked whale NP 22,799 2, 3 0.0005 0.0005 0.0005 0.0005 2, 3
4 NP=North Pacific; WNP=Western North Pacific; CNP=Central North Pacific; WP=Western Pacific; ECS=East China Sea; SOJ=Sea of Japan; IA=Inshore Archipelago; IND=Indian; NIND=Northern
Indian; SIND=Southern Indian; WAU=Western Australia; ANT=Antarctic; YS=Yellow Sea; OE=Offshore Japan; OW=Nearshore Japan; JW=Sea of Japan/Minke; JE=Pacific coast of Japan; SH=Southern Hemisphere
5 No density in a season means that the marine mammal is not expected to occur in that model area during that season.
6 DPS=distinct population segment, which is a discrete population or group of populations of the same species that is significant to the entire species. Populations are identified stocks under the
MMPA and as DPSs under the ESA. Thus, the humpback whale and other species are listed by stock and DPS (DPS/stock) where relevant.
7 A density value of 0.00001 with no reference citation indicates that no density was available for this species; because a density was necessary to compute takes, the lowest value possible was
assigned to the data-sparse species for the purpose of impact estimation.

LOA and Rulemaking Application Under the MMPA for Use of SURTASS LFA Sonar
3-7 Marine Mammals
Table 3-2. Marine Mammal Species, Stocks (DPSs), Abundance Estimates, and Density Estimates by Season as well as the Associated References for the 15 Representative SURTASS LFA Sonar Model Areas in the Central and Western North Pacific
Ocean and Eastern Indian Ocean (References Shown at End of Table).
Marine Mammal Species Stock Name4 Abundance Abundance References
Density (animals per km2)5 Density References Winter Spring Summer Fall
Killer whale WNP 12,256 2, 3 0.0001 0.0001 0.0001 0.0001 12
Kogia spp. WNP 350,553 2, 3 0.0031 0.0031 0.0031 0.0031 2, 3
Pacific white-sided dolphin NP 931,000 20 0.0082 0.0082 0.0082 0.0082 2, 3
Pantropical spotted dolphin WNP 130,002 51 0.0259 0.0259 10
Pygmy killer whale WNP 30,214 2, 3 0.0021 0.0021 0.0021 0.0021 2, 3
Risso’s dolphin WNP 143,374 51 0.0097 0.0097 0.0097 0.0097 10
Rough-toothed dolphin WNP 5,002 51 0.00224 0.00224 0.00224 0.00224 21
Short-finned pilot whale WNP Northern 20,884 10 0.0128 0.0128 0.0128 0.0128 10
Sperm whale NP 102,112 52, 53 0.00123 0.00123 0.00123 0.00123 13
Spinner dolphin WNP 1,015,059 2, 3 0.00083 0.00083 14
Stejneger’s beaked whale WNP 8,000 9 0.0005 0.0005 0.0005 0.0005 2, 3
Striped dolphin WNP Northern
Offshore 497,725 10, 49 0.0111 0.0111 0.0111 0.0111 10
Northern fur seal WP 503,609 54, 55 0.368 0.158 37
Model Area #2: North Philippine Sea
Blue whale WNP 9,250 1, 41, 42 0.00001 0.00001 0.00001 1, 2, 3, 4
Bryde’s whale WNP 20,501 43 0.0006 0.0006 0.0006 0.0006 5
Common minke whale WNP OE 25,049 6, 38, 56 0.0044 0.0044 0.0044 0.0044 6, 38
Fin whale WNP 9,250 1, 44 0.0002 0.0002 1
Humpback whale WNP stock and
DPS 1,328 45 0.00089 0.00089 0.00089 4, 7
North Pacific right whale WNP 922 46 0.00001 0.00001
Omura’s whale WNP 1,800 58 0.00004 0.00004 0.00004 0.00004 15
Blainville’s beaked whale WNP 8,032 2, 3 0.0005 0.0005 0.0005 0.0005 2, 3
Common dolphin WNP 3,286,163 2, 3 0.0562 0.0562 0.0562 0.0562 2, 3
Common bottlenose dolphin Japanese Coastal 3,516 51 0.0146 0.0146 0.0146 0.0146 10

LOA and Rulemaking Application Under the MMPA for Use of SURTASS LFA Sonar
3-8 Marine Mammals
Table 3-2. Marine Mammal Species, Stocks (DPSs), Abundance Estimates, and Density Estimates by Season as well as the Associated References for the 15 Representative SURTASS LFA Sonar Model Areas in the Central and Western North Pacific
Ocean and Eastern Indian Ocean (References Shown at End of Table).
Marine Mammal Species Stock Name4 Abundance Abundance References
Density (animals per km2)5 Density References Winter Spring Summer Fall
Cuvier’s beaked whale WNP 90,725 2, 3 0.0054 0.0054 0.0054 0.0054 2, 3
False killer whale WNP 16,668 10 0.0029 0.0029 0.0029 0.0029 10
Fraser’s dolphin WNP 220,789 2, 3 0.0069 0.0069 0.0069 0.0069 16
Ginkgo-toothed beaked whale NP 22,799 2, 3 0.0005 0.0005 0.0005 0.0005 2, 3
Killer whale WNP 12,256 2, 3 0.00009 0.00009 0.00009 0.00009 12
Kogia spp. WNP 350,553 2, 3 0.0031 0.0031 0.0031 0.0031 2, 3
Longman’s beaked whale WNP 7,619 19 0.00025 0.00025 0.00025 0.00025 12
Melon-headed whale WNP 56,213 51 0.00428 0.00428 0.00428 0.00428 13
Pacific white-sided dolphin NP 931,000 20 0.0119 0.0119 2, 3
Pantropical spotted dolphin WNP 130,002 51 0.0137 0.0137 0.0137 0.0137 10
Pygmy killer whale WNP 30,214 2, 3 0.0021 0.0021 0.0021 0.0021 2, 3
Risso’s dolphin WNP 143,374 51 0.0106 0.0106 0.0106 0.0106 10
Rough-toothed dolphin WNP 5,002 51 0.00224 0.00224 0.00224 0.00224 21
Short-finned pilot whale WNP Southern 31,396 51 0.0153 0.0153 0.0153 0.0153 10
Sperm whale NP 102,112 52, 53 0.00123 0.00123 0.00123 0.00123 13
Spinner dolphin WNP 1,015,059 2, 3 0.00083 0.00083 0.00083 0.00083 14
Striped dolphin Japanese Coastal 19,631 10, 49 0.0329 0.0329 0.0329 0.0329 10
Model Area #3: West Philippine Sea
Blue whale WNP 9,250 1, 41, 42 0.00001 0.00001 0.00001 1, 2, 3, 4
Bryde’s whale WNP 20,501 43 0.0006 0.0006 0.0006 0.0006 5
Common minke whale WNP OE 25,049 6, 38, 56 0.0033 0.0033 0.0033 0.0033 6, 38
Fin whale WNP 9,250 1, 44 0.0002 0.0002 1
Humpback whale WNP stock and
DPS 1,328 45 0.00089 0.00089 0.00089 4, 18
Omura’s whale WNP 1,800 58 0.00004 0.00004 0.00004 0.00004 15
Blainville’s beaked whale WNP 8,032 2, 3 0.0005 0.0005 0.0005 0.0005 2, 3
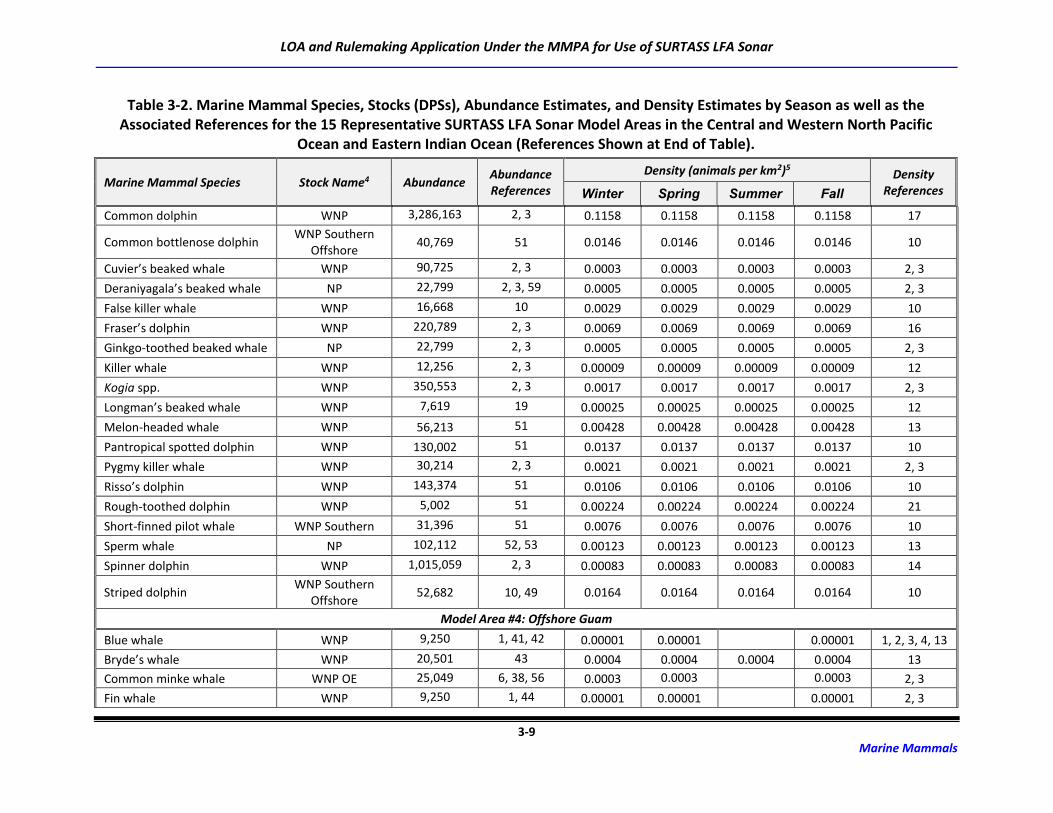
LOA and Rulemaking Application Under the MMPA for Use of SURTASS LFA Sonar
3-9 Marine Mammals
Table 3-2. Marine Mammal Species, Stocks (DPSs), Abundance Estimates, and Density Estimates by Season as well as the Associated References for the 15 Representative SURTASS LFA Sonar Model Areas in the Central and Western North Pacific
Ocean and Eastern Indian Ocean (References Shown at End of Table).
Marine Mammal Species Stock Name4 Abundance Abundance References
Density (animals per km2)5 Density References Winter Spring Summer Fall
Common dolphin WNP 3,286,163 2, 3 0.1158 0.1158 0.1158 0.1158 17
Common bottlenose dolphin WNP Southern
Offshore 40,769 51 0.0146 0.0146 0.0146 0.0146 10
Cuvier’s beaked whale WNP 90,725 2, 3 0.0003 0.0003 0.0003 0.0003 2, 3
Deraniyagala’s beaked whale NP 22,799 2, 3, 59 0.0005 0.0005 0.0005 0.0005 2, 3
False killer whale WNP 16,668 10 0.0029 0.0029 0.0029 0.0029 10
Fraser’s dolphin WNP 220,789 2, 3 0.0069 0.0069 0.0069 0.0069 16
Ginkgo-toothed beaked whale NP 22,799 2, 3 0.0005 0.0005 0.0005 0.0005 2, 3
Killer whale WNP 12,256 2, 3 0.00009 0.00009 0.00009 0.00009 12
Kogia spp. WNP 350,553 2, 3 0.0017 0.0017 0.0017 0.0017 2, 3
Longman’s beaked whale WNP 7,619 19 0.00025 0.00025 0.00025 0.00025 12
Melon-headed whale WNP 56,213 51 0.00428 0.00428 0.00428 0.00428 13
Pantropical spotted dolphin WNP 130,002 51 0.0137 0.0137 0.0137 0.0137 10
Pygmy killer whale WNP 30,214 2, 3 0.0021 0.0021 0.0021 0.0021 2, 3
Risso’s dolphin WNP 143,374 51 0.0106 0.0106 0.0106 0.0106 10
Rough-toothed dolphin WNP 5,002 51 0.00224 0.00224 0.00224 0.00224 21
Short-finned pilot whale WNP Southern 31,396 51 0.0076 0.0076 0.0076 0.0076 10
Sperm whale NP 102,112 52, 53 0.00123 0.00123 0.00123 0.00123 13
Spinner dolphin WNP 1,015,059 2, 3 0.00083 0.00083 0.00083 0.00083 14
Striped dolphin WNP Southern
Offshore 52,682 10, 49 0.0164 0.0164 0.0164 0.0164 10
Model Area #4: Offshore Guam
Blue whale WNP 9,250 1, 41, 42 0.00001 0.00001 0.00001 1, 2, 3, 4, 13
Bryde’s whale WNP 20,501 43 0.0004 0.0004 0.0004 0.0004 13
Common minke whale WNP OE 25,049 6, 38, 56 0.0003 0.0003 0.0003 2, 3
Fin whale WNP 9,250 1, 44 0.00001 0.00001 0.00001 2, 3
LOA and Rulemaking Application Under the MMPA for Use of SURTASS LFA Sonar
3-10 Marine Mammals
Table 3-2. Marine Mammal Species, Stocks (DPSs), Abundance Estimates, and Density Estimates by Season as well as the Associated References for the 15 Representative SURTASS LFA Sonar Model Areas in the Central and Western North Pacific
Ocean and Eastern Indian Ocean (References Shown at End of Table).
Marine Mammal Species Stock Name4 Abundance Abundance References
Density (animals per km2)5 Density References Winter Spring Summer Fall
Humpback whale WNP stock and
DPS 1,328 45 0.00089 0.00089 0.00089 4, 18
Omura’s whale WNP 1,800 15, 58 0.00004 0.00004 0.00004 0.00004 15
Sei whale NP 7,000 1, 47 0.00029 0.00029 0.00029 13
Blainville’s beaked whale WNP 8,032 2, 3 0.00086 0.00086 0.00086 0.00086 19
Common bottlenose dolphin WNP Southern
Offshore 40,769 51 0.00899 0.00899 0.00899 0.00899 19
Cuvier’s beaked whale WNP 90,725 2, 3 0.0003 0.0003 0.0003 0.0003 19
Deraniyagala’s beaked whale NP 22,799 2, 3 0.00093 0.00093 0.00093 0.00093 2, 3
Dwarf sperm whale WNP 350,553 2, 3 0.00714 0.00714 0.00714 0.00714 14
False killer whale WNP 16,668 10 0.00111 0.00111 0.00111 0.00111 13
Fraser’s dolphin CNP 16,992 16 0.02104 0.02104 0.02104 0.02104 19
Ginkgo-toothed beaked whale NP 22,799 2, 3 0.00093 0.00093 0.00093 0.00093 2, 3
Killer whale WNP 12,256 2, 3 0.00006 0.00006 0.00006 0.00006 19
Longman’s beaked whale WNP 7,619 19 0.00311 0.00311 0.00311 0.00311 19
Melon-headed whale WNP 56,213 51 0.00428 0.00428 0.00428 0.00428 13
Pantropical spotted dolphin WNP 130,002 51 0.0226 0.0226 0.0226 0.0226 13
Pygmy killer whale WNP 30,214 2, 3 0.00014 0.00014 0.00014 0.00014 13
Pygmy sperm whale WNP 350,553 2, 3 0.00291 0.00291 0.00291 0.00291 14
Risso’s dolphin WNP 143,374 51 0.00474 0.00474 0.00474 0.00474 19
Rough-toothed dolphin WNP 5,002 51 0.00185 0.00185 0.00185 0.00185 12
Short-finned pilot whale WNP Southern 31,396 51 0.00797 0.00797 0.00797 0.00797 19
Sperm whale NP 102,112 52, 53 0.00123 0.00123 0.00123 0.00123 13
Spinner dolphin WNP 1,015,059 2, 3 0.00083 0.00083 0.00083 0.00083 14
Striped dolphin WNP Southern
Offshore 52,682 10, 49 0.00616 0.00616 0.00616 0.00616 13

LOA and Rulemaking Application Under the MMPA for Use of SURTASS LFA Sonar
3-11 Marine Mammals
Table 3-2. Marine Mammal Species, Stocks (DPSs), Abundance Estimates, and Density Estimates by Season as well as the Associated References for the 15 Representative SURTASS LFA Sonar Model Areas in the Central and Western North Pacific
Ocean and Eastern Indian Ocean (References Shown at End of Table).
Marine Mammal Species Stock Name4 Abundance Abundance References
Density (animals per km2)5 Density References Winter Spring Summer Fall
Model Area #5: Sea of Japan
Bryde’s whale WNP 20,501 43 0.0001 0.0001 0.0001 0.0001 2, 3
Common minke whale WNP JW 2,611 38 0.00016 0.00016 0.00016 0.00016 2, 3
Fin whale WNP 9,250 1, 44 0.0009 0.0009 0.0009 2, 3
North Pacific right whale WNP 922 46 0.00001 0.00001
Omura’s whale WNP 1,800 15, 58 0.00004 0.00004 0.00004 0.00004 15
Western North Pacific gray whale
WNP stock and Western DPS
140 41, 60 0.00001 0.00001 0.00001 0.00001
Baird’s beaked whale WNP 5,688 48, 49 0.0003 0.0003 0.0003 9
Common dolphin WNP 279,182 17 0.1158 0.1158 0.1158 0.1158 17
Common bottlenose dolphin IA 105,138 10, 48 0.00077 0.00077 0.00077 0.00077 12
Cuvier’s beaked whale WNP 90,725 2, 3 0.0031 0.0031 0.0031 0.0031 2, 3
Dall’s porpoise (dalli) SOJ dalli 173,638 61 0.0520 0.0520 0.0520 2, 3
False killer whale IA 9,777 10, 48 0.0027 0.0027 0.0027 0.0027 2, 3
Harbor porpoise WNP 31,046 11, 50 0.0190 0.0190 0.0190 11
Killer whale WNP 12,256 2, 3 0.00009 0.00009 0.00009 0.00009 12
Kogia spp. WNP 350,553 2, 3 0.0017 0.0017 0.0017 0.0017 2, 3
Pacific white-sided dolphin NP 931,000 10, 20 0.0030 0.0030 3
Risso’s dolphin IA 143,374 51 0.0073 0.0073 0.0073 0.0073 10
Rough-toothed dolphin WNP 5,002 51 0.00224 0.00224 0.00224 0.00224 21
Sperm whale NP 102,112 52, 53 0.00123 0.00123 0.00123 0.00123 13
Spinner dolphin WNP 1,015,059 2, 3 0.00083 0.00083 14
Stejneger’s beaked whale WNP 8,000 9 0.0005 0.0005 0.0005 0.0005 2, 3
Northern fur seal WP 503,609 54, 55 0.368 0.158 37
Spotted seal Southern stock
and DPS 3,500 62, 63, 64 0.00001 0.00001 0.00001 0.00001

LOA and Rulemaking Application Under the MMPA for Use of SURTASS LFA Sonar
3-12 Marine Mammals
Table 3-2. Marine Mammal Species, Stocks (DPSs), Abundance Estimates, and Density Estimates by Season as well as the Associated References for the 15 Representative SURTASS LFA Sonar Model Areas in the Central and Western North Pacific
Ocean and Eastern Indian Ocean (References Shown at End of Table).
Marine Mammal Species Stock Name4 Abundance Abundance References
Density (animals per km2)5 Density References Winter Spring Summer Fall
Model Area #6: East China Sea
Bryde’s whale ECS 137 65 0.0003 0.0003 0.0003 0.0003 12
Common minke whale YS 4,492 38, 66 0.0018 0.0018 0.0018 0.0018 6
Fin whale ECS 500 1, 44, 67 0.0002 0.0002 0.0002 0.0002 1
North Pacific right whale WNP 922 46 0.00001 0.00001
Omura’s whale WNP 1,800 15, 58 0.00004 0.00004 0.00004 0.00004 15
Western North Pacific gray whale
WNP stock and Western DPS
140 41 0.00001 0.00001 0.00001
Blainville’s beaked whale WNP 8,032 2, 3 0.0005 0.0005 0.0005 0.0005 2, 3
Common dolphin WNP 279,182 17 0.1158 0.1158 0.1158 0.1158 17
Common bottlenose dolphin IA 105,138 10, 48 0.00077 0.00077 0.00077 0.00077 12
Cuvier’s beaked whale WNP 90,725 2, 3 0.0003 0.0003 0.0003 0.0003 2, 3
False killer whale IA 9,777 10, 48 0.00111 0.00111 0.00111 0.00111 13
Fraser’s dolphin WNP 220,789 2, 3 0.00694 0.00694 0.00694 0.00694 16
Ginkgo-toothed beaked whale NP 22,799 2, 3 0.0005 0.0005 0.0005 0.0005 2, 3
Killer whale WNP 12,256 2, 3 0.00009 0.00009 0.00009 0.00009 12
Kogia spp. WNP 350,553 2, 3 0.0017 0.0017 0.0017 0.0017 2, 3
Longman’s beaked whale WNP 7,619 19 0.00025 0.00025 0.00025 0.00025 12
Melon-headed whale WNP 56,213 51 0.00428 0.00428 0.00428 0.00428 13
Pacific white-sided dolphin NP 931,000 10, 20 0.0028 0.0028 2, 3
Pantropical spotted dolphin WNP 130,002 51 0.01374 0.01374 0.01374 0.01374 10
Pygmy killer whale WNP 30,214 2, 3 0.00014 0.00014 0.00014 0.00014 13
Risso’s dolphin IA 143,374 51 0.0106 0.0106 0.0106 0.0106 10
Rough-toothed dolphin WNP 5,002 51 0.00224 0.00224 0.00224 0.00224 21
Sperm whale NP 102,112 52, 53 0.00123 0.00123 0.00123 0.00123 13
Spinner dolphin WNP 1,015,059 2, 3 0.00083 0.00083 0.00083 0.00083 14

LOA and Rulemaking Application Under the MMPA for Use of SURTASS LFA Sonar
3-13 Marine Mammals
Table 3-2. Marine Mammal Species, Stocks (DPSs), Abundance Estimates, and Density Estimates by Season as well as the Associated References for the 15 Representative SURTASS LFA Sonar Model Areas in the Central and Western North Pacific
Ocean and Eastern Indian Ocean (References Shown at End of Table).
Marine Mammal Species Stock Name4 Abundance Abundance References
Density (animals per km2)5 Density References Winter Spring Summer Fall
Spotted seal Southern stock
and DPS 1,000 62 0.00001 0.00001 0.00001 0.00001
Model Area #7: South China Sea
Bryde’s whale WNP 20,501 43 0.0006 0.0006 0.0006 0.0006 5
Common minke whale YS 4,492 38, 66 0.0018 0.0018 0.0018 0.0018 6
Fin whale WNP 9,250 1, 44 0.0002 0.0002 0.0002 1
Humpback whale WNP stock and
DPS 1,328 45 0.00036 0.00036 0.00036 4, 18
North Pacific right whale WNP 922 46 0.00001 0.00001
Omura’s whale WNP 1,800 15, 58 0.00004 0.00004 0.00004 0.00004 15
Western North Pacific gray whale
WNP stock and Western DPS
140 41 0.00001 0.00001 0.00001
Blainville’s beaked whale WNP 8,032 2, 3 0.0005 0.0005 0.0005 0.0005 2, 3
Common dolphin WNP 279,182 17 0.1158 0.1158 0.1158 0.1158 17
Common bottlenose dolphin IA 105,138 48 0.00077 0.00077 0.00077 0.00077 12
Cuvier’s beaked whale WNP 90,725 2, 3 0.0003 0.0003 0.0003 0.0003 2, 3
Deraniyagala’s beaked whale NP 22,799 2, 3, 68 0.0005 0.0005 0.0005 0.0005 2, 3
False killer whale IA 9,777 48 0.00111 0.00111 0.00111 0.00111 13
Fraser’s dolphin WNP 220,789 2, 3 0.00694 0.00694 0.00694 0.00694 16
Ginkgo-toothed beaked whale NP 22,799 2, 3 0.0005 0.0005 0.0005 0.0005 2, 3
Killer whale WNP 12,256 2, 3 0.00009 0.00009 0.00009 0.00009 12
Kogia spp. WNP 350,553 2, 3 0.0017 0.0017 0.0017 0.0017 2, 3
Longman’s beaked whale WNP 7,619 19 0.00025 0.00025 0.00025 0.00025 12
Melon-headed whale WNP 56,213 51 0.00428 0.00428 0.00428 0.00428 13
Pantropical spotted dolphin WNP 130,002 51 0.01374 0.01374 0.01374 0.01374 10
Pygmy killer whale WNP 30,214 2, 3 0.00014 0.00014 0.00014 0.00014 13

LOA and Rulemaking Application Under the MMPA for Use of SURTASS LFA Sonar
3-14 Marine Mammals
Table 3-2. Marine Mammal Species, Stocks (DPSs), Abundance Estimates, and Density Estimates by Season as well as the Associated References for the 15 Representative SURTASS LFA Sonar Model Areas in the Central and Western North Pacific
Ocean and Eastern Indian Ocean (References Shown at End of Table).
Marine Mammal Species Stock Name4 Abundance Abundance References
Density (animals per km2)5 Density References Winter Spring Summer Fall
Risso’s dolphin IA 143,374 51 0.0106 0.0106 0.0106 0.0106 10
Rough-toothed dolphin WNP 5,002 51 0.00224 0.00224 0.00224 0.00224 21
Short-finned pilot whale WNP Southern 31,396 51 0.00159 0.00159 0.00159 0.00159 13
Sperm whale NP 102,112 52, 53 0.0012 0.0012 0.0012 0.0012 13
Spinner dolphin WNP 1,015,059 2, 3 0.00083 0.00083 0.00083 0.00083 14
Striped dolphin WNP Southern
Offshore 52,682
10, 49 0.00584 0.00584 0.00584 0.00584 12
Model Area #8: Offshore Japan/Pacific (25° to 40° N)
Blue whale WNP 9,250 1, 41, 42 0.00001 0.00001 0.00001 1, 2, 3, 4
Bryde’s whale WNP 20,501 43 0.0003 0.0003 0.0003 0.0003 12
Common minke whale WNP OE 25,049 6, 38, 56 0.0003 0.0003 0.0003 0.0003 6
Fin whale WNP 9,250 1, 44 0.0001 0.0001 1
Humpback whale WNP stock and
DPS 1,328 45 0.00036 0.00036 4, 7
Sei whale NP 7,000 1, 47 0.00029 0.00029 0.00029 13
Baird’s beaked whale WNP 5,688 48, 49 0.0001 0.0001 0.0001 0.0001 9
Blainville’s beaked whale WNP 8,032 12, 17 0.0007 0.0007 0.0007 0.0007 12
Common dolphin WNP 3,286,163 2, 3 0.0863 0.0863 0.0863 0.0863 2, 3
Common bottlenose dolphin WNP Northern
Offshore 100,281 10, 49 0.00077 0.00077 0.00077 0.00077 12
Cuvier’s beaked whale WNP 90,725 2, 3 0.00374 0.00374 0.00374 0.00374 12
Dall’s porpoise WNP dalli 162,000 49, 69 0.0390 0.0520 0.0520 2, 3
Dwarf sperm whale WNP 350,553 2, 3, 17 0.0043 0.0043 0.0043 0.0043 12
False killer whale WNP 16,668 10 0.0036 0.0036 0.0036 0.0036 10
Hubbs’ beaked whale NP 22,799 2, 3 0.0005 0.0005 0.0005 0.0005 2, 3
Killer whale WNP 12,256 2, 3 0.00009 0.00009 0.00009 0.00009 12

LOA and Rulemaking Application Under the MMPA for Use of SURTASS LFA Sonar
3-15 Marine Mammals
Table 3-2. Marine Mammal Species, Stocks (DPSs), Abundance Estimates, and Density Estimates by Season as well as the Associated References for the 15 Representative SURTASS LFA Sonar Model Areas in the Central and Western North Pacific
Ocean and Eastern Indian Ocean (References Shown at End of Table).
Marine Mammal Species Stock Name4 Abundance Abundance References
Density (animals per km2)5 Density References Winter Spring Summer Fall
Longman’s beaked whale WNP 7,619 19 0.00025 0.00025 0.00025 0.00025 12
Melon-headed whale WNP 56,213 51 0.0027 0.0027 0.0027 0.0027 12
Mesoplodon spp. WNP 22,799 2, 3, 17 0.0005 0.0005 0.0005 0.0005 2, 3
Northern right whale dolphin NP 68,000 20 0.00001 0.00001 0.00001
Pacific white-sided dolphin NP 931,000 20 0.0048 0.0048 0.0048 0.0048 2, 3
Pantropical spotted dolphin WNP 130,002 51 0.0113 0.0113 0.0113 0.0113 12
Pygmy killer whale WNP 30,214 2, 3 0.0001 0.0001 0.0001 0.0001 12
Pygmy sperm whale WNP 350,553 2, 3, 17 0.0018 0.0018 0.0018 0.0018 12
Risso’s dolphin WNP 143,374 51 0.0005 0.0005 0.0005 0.0005 12
Rough-toothed dolphin WNP 5,002 51 0.0019 0.0019 0.0019 0.0019 12
Short-finned pilot whale WNP Northern 20,884 10 0.0021 0.0021 0.0021 0.0021 12
Sperm whale NP 102,112 52, 53 0.0022 0.0022 0.0022 0.0022 12
Spinner dolphin WNP 1,015,059 2, 3 0.0019 0.0019 0.0019 0.0019 12
Stejneger’s beaked whale WNP 8,000 9 0.0005 0.0005 0.0005 0.0005 2, 3
Striped dolphin WNP Northern
Offshore 497,725
10, 49 0.0058 0.0058 0.0058 0.0058 12
Hawaiian monk seal Hawaii 1,427 35 0.00001 0.00001 0.00001 0.00001
Northern fur seal Western Pacific 503,609 54, 55 0.0123 20
Model Area #9: Offshore Japan/Pacific (10° to 25° N)
Blue whale WNP 9,250 1, 41, 42 0.00001 0.00001 0.00001 1, 2, 3, 4
Bryde’s whale WNP 20,501 43 0.0003 0.0003 0.0003 0.0003 12
Fin whale WNP 9,250 1, 44 0.00001 0.00001 2, 3
Humpback whale WNP stock and
DPS 1,328 45 0.00036 0.00036 0.00036 4, 18
Omura’s whale WNP 1,800 15, 58 0.00004 0.00004 0.00004 0.00004 15
Sei whale NP 7,000 1, 47 0.00029 0.00029 13
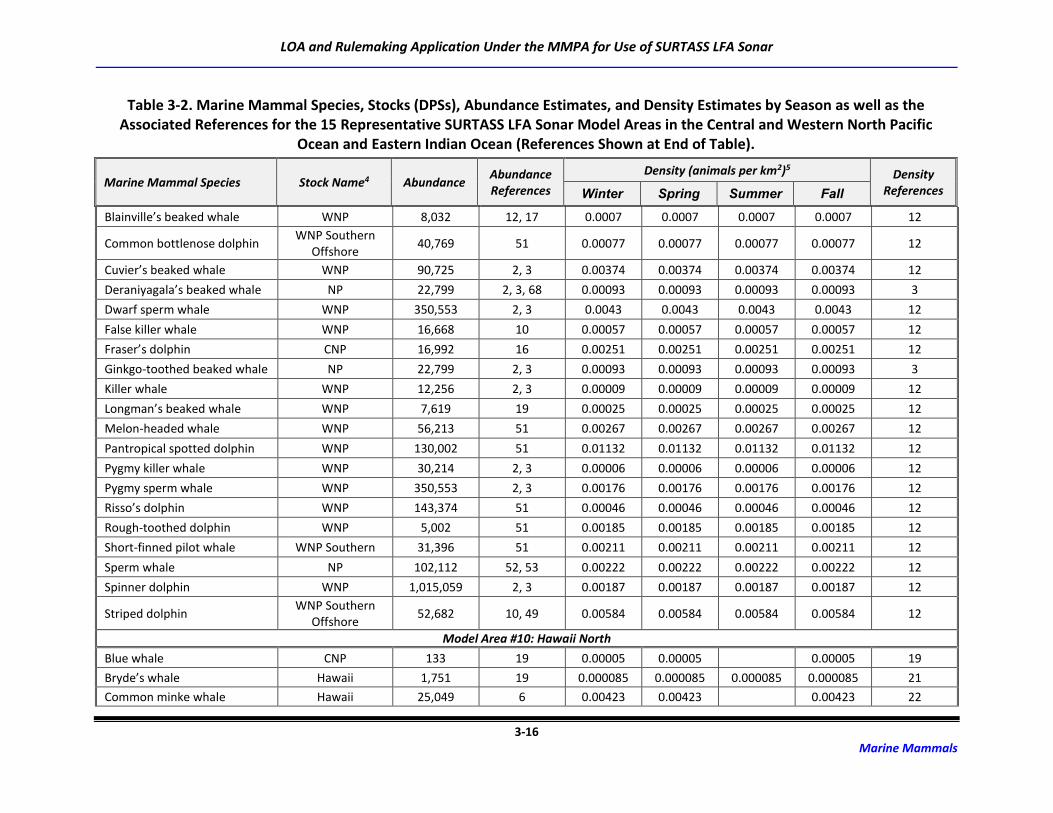
LOA and Rulemaking Application Under the MMPA for Use of SURTASS LFA Sonar
3-16 Marine Mammals
Table 3-2. Marine Mammal Species, Stocks (DPSs), Abundance Estimates, and Density Estimates by Season as well as the Associated References for the 15 Representative SURTASS LFA Sonar Model Areas in the Central and Western North Pacific
Ocean and Eastern Indian Ocean (References Shown at End of Table).
Marine Mammal Species Stock Name4 Abundance Abundance References
Density (animals per km2)5 Density References Winter Spring Summer Fall
Blainville’s beaked whale WNP 8,032 12, 17 0.0007 0.0007 0.0007 0.0007 12
Common bottlenose dolphin WNP Southern
Offshore 40,769 51 0.00077 0.00077 0.00077 0.00077 12
Cuvier’s beaked whale WNP 90,725 2, 3 0.00374 0.00374 0.00374 0.00374 12
Deraniyagala’s beaked whale NP 22,799 2, 3, 68 0.00093 0.00093 0.00093 0.00093 3
Dwarf sperm whale WNP 350,553 2, 3 0.0043 0.0043 0.0043 0.0043 12
False killer whale WNP 16,668 10 0.00057 0.00057 0.00057 0.00057 12
Fraser’s dolphin CNP 16,992 16 0.00251 0.00251 0.00251 0.00251 12
Ginkgo-toothed beaked whale NP 22,799 2, 3 0.00093 0.00093 0.00093 0.00093 3
Killer whale WNP 12,256 2, 3 0.00009 0.00009 0.00009 0.00009 12
Longman’s beaked whale WNP 7,619 19 0.00025 0.00025 0.00025 0.00025 12
Melon-headed whale WNP 56,213 51 0.00267 0.00267 0.00267 0.00267 12
Pantropical spotted dolphin WNP 130,002 51 0.01132 0.01132 0.01132 0.01132 12
Pygmy killer whale WNP 30,214 2, 3 0.00006 0.00006 0.00006 0.00006 12
Pygmy sperm whale WNP 350,553 2, 3 0.00176 0.00176 0.00176 0.00176 12
Risso’s dolphin WNP 143,374 51 0.00046 0.00046 0.00046 0.00046 12
Rough-toothed dolphin WNP 5,002 51 0.00185 0.00185 0.00185 0.00185 12
Short-finned pilot whale WNP Southern 31,396 51 0.00211 0.00211 0.00211 0.00211 12
Sperm whale NP 102,112 52, 53 0.00222 0.00222 0.00222 0.00222 12
Spinner dolphin WNP 1,015,059 2, 3 0.00187 0.00187 0.00187 0.00187 12
Striped dolphin WNP Southern
Offshore 52,682 10, 49 0.00584 0.00584 0.00584 0.00584 12
Model Area #10: Hawaii North
Blue whale CNP 133 19 0.00005 0.00005 0.00005 19
Bryde’s whale Hawaii 1,751 19 0.000085 0.000085 0.000085 0.000085 21
Common minke whale Hawaii 25,049 6 0.00423 0.00423 0.00423 22
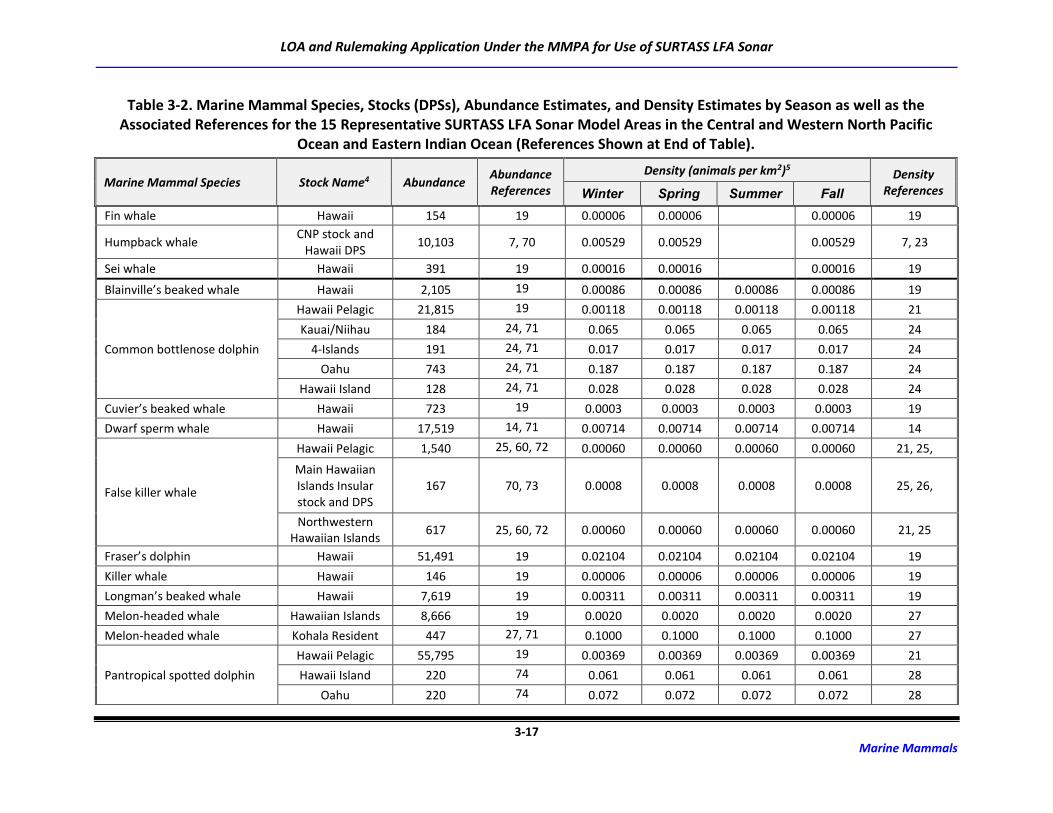
LOA and Rulemaking Application Under the MMPA for Use of SURTASS LFA Sonar
3-17 Marine Mammals
Table 3-2. Marine Mammal Species, Stocks (DPSs), Abundance Estimates, and Density Estimates by Season as well as the Associated References for the 15 Representative SURTASS LFA Sonar Model Areas in the Central and Western North Pacific
Ocean and Eastern Indian Ocean (References Shown at End of Table).
Marine Mammal Species Stock Name4 Abundance Abundance References
Density (animals per km2)5 Density References Winter Spring Summer Fall
Fin whale Hawaii 154 19 0.00006 0.00006 0.00006 19
Humpback whale CNP stock and
Hawaii DPS 10,103 7, 70 0.00529 0.00529 0.00529 7, 23
Sei whale Hawaii 391 19 0.00016 0.00016 0.00016 19
Blainville’s beaked whale Hawaii 2,105 19 0.00086 0.00086 0.00086 0.00086 19
Common bottlenose dolphin
Hawaii Pelagic 21,815 19 0.00118 0.00118 0.00118 0.00118 21
Kauai/Niihau 184 24, 71 0.065 0.065 0.065 0.065 24
4-Islands 191 24, 71 0.017 0.017 0.017 0.017 24
Oahu 743 24, 71 0.187 0.187 0.187 0.187 24
Hawaii Island 128 24, 71 0.028 0.028 0.028 0.028 24
Cuvier’s beaked whale Hawaii 723 19 0.0003 0.0003 0.0003 0.0003 19
Dwarf sperm whale Hawaii 17,519 14, 71 0.00714 0.00714 0.00714 0.00714 14
False killer whale
Hawaii Pelagic 1,540 25, 60, 72 0.00060 0.00060 0.00060 0.00060 21, 25,
Main Hawaiian Islands Insular stock and DPS
167 70, 73 0.0008 0.0008 0.0008 0.0008 25, 26,
Northwestern Hawaiian Islands
617 25, 60, 72 0.00060 0.00060 0.00060 0.00060 21, 25
Fraser’s dolphin Hawaii 51,491 19 0.02104 0.02104 0.02104 0.02104 19
Killer whale Hawaii 146 19 0.00006 0.00006 0.00006 0.00006 19
Longman’s beaked whale Hawaii 7,619 19 0.00311 0.00311 0.00311 0.00311 19
Melon-headed whale Hawaiian Islands 8,666 19 0.0020 0.0020 0.0020 0.0020 27
Melon-headed whale Kohala Resident 447 27, 71 0.1000 0.1000 0.1000 0.1000 27
Pantropical spotted dolphin
Hawaii Pelagic 55,795 19 0.00369 0.00369 0.00369 0.00369 21
Hawaii Island 220 74 0.061 0.061 0.061 0.061 28
Oahu 220 74 0.072 0.072 0.072 0.072 28

LOA and Rulemaking Application Under the MMPA for Use of SURTASS LFA Sonar
3-18 Marine Mammals
Table 3-2. Marine Mammal Species, Stocks (DPSs), Abundance Estimates, and Density Estimates by Season as well as the Associated References for the 15 Representative SURTASS LFA Sonar Model Areas in the Central and Western North Pacific
Ocean and Eastern Indian Ocean (References Shown at End of Table).
Marine Mammal Species Stock Name4 Abundance Abundance References
Density (animals per km2)5 Density References Winter Spring Summer Fall
Pantropical spotted dolphin (Continued)
4-Islands 220 74
0.061 0.061 0.061 0.061 28
Pygmy killer whale Hawaii 10,640 19 0.00435 0.00435 0.00435 0.00435 19
Pygmy sperm whale Hawaii 7,138 14, 71 0.0029 0.0029 0.0029 0.0029 14
Risso’s dolphin Hawaii 11,613 19 0.00474 0.00474 0.00474 0.00474 19
Rough-toothed dolphin Hawaii 72,528 19 0.00224 0.00224 0.00224 0.00224 21
Short-finned pilot whale Hawaii 19,503 19 0.00459 0.00459 0.00459 0.00459 21
Sperm whale Hawaii 4,559 19 0.00158 0.00158 0.00158 0.00158 21
Spinner dolphin
Hawaii Pelagic 3,351 14 0.00159 0.00159 0.00159 0.00159 21
Kauai/Niihau 601 71 0.097 0.097 0.097 0.097 29
Hawaii Island 631 71 0.066 0.066 0.066 0.066 30
Oahu/ 4-Islands
355 71 0.023 0.023 0.023 0.023 29
Kure/Midway Atoll
260 71 0.0070 0.0070 0.0070 0.0070 14
Pearl and Hermes Reefs
300 75, 76 0.0070 0.0070 0.0070 0.0070 14
Striped dolphin Hawaii 61,201 19 0.00385 0.00385 0.00385 0.00385 21
Hawaiian monk seal Hawaii 1,427 35 0.00004 0.00004 0.00004 0.00004 35, 36
Model Area #11: Hawaii South
Blue whale CNP 133 19 0.00005 0.00005 0.00005 19
Bryde’s whale Hawaii 798 16 0.00012 0.00012 0.00012 0.00012 21
Common minke whale Hawaii 25,049 6 0.00423 0.00423 0.00423 22
Fin whale Hawaii 154 19, 70 0.00006 0.00006 0.00006 19
Humpback whale CNP stock and
Hawaii DPS 10,103 7, 70 0.00631 0.00631 0.00631 7, 23
Sei whale Hawaii 391 19 0.00016 0.00016 0.00016 19

LOA and Rulemaking Application Under the MMPA for Use of SURTASS LFA Sonar
3-19 Marine Mammals
Table 3-2. Marine Mammal Species, Stocks (DPSs), Abundance Estimates, and Density Estimates by Season as well as the Associated References for the 15 Representative SURTASS LFA Sonar Model Areas in the Central and Western North Pacific
Ocean and Eastern Indian Ocean (References Shown at End of Table).
Marine Mammal Species Stock Name4 Abundance Abundance References
Density (animals per km2)5 Density References Winter Spring Summer Fall
Blainville’s beaked whale Hawaii 2,105 19 0.00086 0.00086 0.00086 0.00086 19
Common bottlenose dolphin
Hawaii Pelagic 21,815 19 0.00126 0.00126 0.00126 0.00126 21
Oahu 743 24, 71 0.187 0.187 0.187 0.187 24
4-Islands 191 24, 71 0.017 0.017 0.017 0.017 24
Hawaii Island 128 24, 71 0.028 0.028 0.028 0.028 24
Kauai/Niihau 184 24, 71 0.065 0.065 0.065 0.065 24
Cuvier’s beaked whale Hawaii 723 19 0.0003 0.0003 0.0003 0.0003 19
Deraniyagala beaked whale NP 22,799 2, 3, 68 0.00093 0.00093 0.00093 0.00093 2, 3
Dwarf sperm whale Hawaii 17,519 14, 71 0.00714 0.00714 0.00714 0.00714 14
False killer whale
Hawaii Pelagic 1,540 25, 60, 72 0.00086 0.00086 0.00086 0.00086 21, 25
Main Hawaiian Islands Insular stock and DPS
167 70, 73 0.0008 0.0008 0.0008 0.0008 25, 26
Fraser’s dolphin Hawaii 51,491 19 0.02104 0.02104 0.02104 0.02104 19
Killer whale Hawaii 146 19 0.00006 0.00006 0.00006 0.00006 19
Longman’s beaked whale Hawaii 7,619 19 0.00311 0.00311 0.00311 0.00311 19
Melon-headed whale Hawaiian Islands 8,666 19 0.0020 0.0020 0.0020 0.0020 27
Kohala Resident 447 27, 71 0.1000 0.1000 0.1000 0.1000 27
Pantropical spotted dolphin
Hawaii Pelagic 55,795 19 0.00541 0.00541 0.00541 0.00541 21
Hawaii Island 220 74 0.061 0.061 0.061 0.061 28
Oahu 220 74 0.072 0.072 0.072 0.072 28
4-Islands 220 74 0.061 0.061 0.061 0.061 28
Pygmy killer whale Hawaii 10,640 19 0.00435 0.00435 0.00435 0.00435 19
Pygmy sperm whale Hawaii 7,138 14, 71 0.0029 0.0029 0.0029 0.0029 14
Risso’s dolphin Hawaii 11,613 19 0.00474 0.00474 0.00474 0.00474 19
Rough-toothed dolphin Hawaii 72,528 19 0.00257 0.00257 0.00257 0.00257 21

LOA and Rulemaking Application Under the MMPA for Use of SURTASS LFA Sonar
3-20 Marine Mammals
Table 3-2. Marine Mammal Species, Stocks (DPSs), Abundance Estimates, and Density Estimates by Season as well as the Associated References for the 15 Representative SURTASS LFA Sonar Model Areas in the Central and Western North Pacific
Ocean and Eastern Indian Ocean (References Shown at End of Table).
Marine Mammal Species Stock Name4 Abundance Abundance References
Density (animals per km2)5 Density References Winter Spring Summer Fall
Short-finned pilot whale Hawaii 19,503 19 0.00549 0.00549 0.00549 0.00549 21
Sperm whale Hawaii 4,559 19 0.00131 0.00131 0.00131 0.00131 21
Spinner dolphin
Hawaii Pelagic 3,351 14 0.00348 0.00348 0.00348 0.00348 21
Oahu/4-Islands 601 71 0.023 0.023 0.023 0.023 29
Hawaii Island 631 71 0.066 0.066 0.066 0.066 30
Kauai/Niihau 355 71 0.097 0.097 0.097 0.097 29
Striped dolphin Hawaii 61,201 19 0.00475 0.00475 0.00475 0.00475 21
Hawaiian monk seal Hawaii 1,427 35 0.00004 0.00004 0.00004 0.00004 35, 36
Model Area #12: Offshore Sri Lanka
Blue whale NIND 3,691 77 0.00004 0.00004 0.00004 0.00004 40
Bryde’s whale NIND 9,176 77, 78 0.00041 0.00041 0.00041 0.00041 40
Common minke whale IND 257,000 77 0.00001 0.00001 0.00625 0.00001 40
Fin whale IND 1,846 77 0.00001 0.00001 0.00001 0.00001 40
Omura’s whale NIND 9,176 77, 78 0.00041 0.00041 0.00041 0.00041 40
Sei whale NIND 9,176 77, 78 0.00141 0.00045 0.00045 0.00095 40
Blainville’s beaked whale IND 16,867 78 0.00105 0.00105 0.00105 0.00105 40
Common dolphins IND 1,819,882 78 0.00513 0.00516 0.00541 0.00538 40
Common bottlenose dolphin NIND 785,585 78 0.04839 0.04829 0.04725 0.04740 40
Cuvier’s beaked whale NIND 27,272 78 0.00506 0.00508 0.00505 0.00505 40
Deraniyagala beaked whale IND 16,867 78 0.00513 0.00516 0.00541 0.00538 40
Dwarf sperm whale IND 10,541 78 0.00005 0.00005 0.00005 0.00005 40
False killer whale IND 144,188 78 0.00024 0.00024 0.00024 0.00024 40
Fraser's dolphin IND 151,554 78 0.00207 0.00207 0.00207 0.00207 40
Indo-Pacific bottlenose dolphin
IND 7,850 78 0.00048 0.00048 0.00047 0.00047 40
Killer whale IND 12,593 78 0.00697 0.00155 0.00693 0.00694 40
Longman's beaked whale IND 16,867 78 0.00513 0.00516 0.00541 0.00538 40
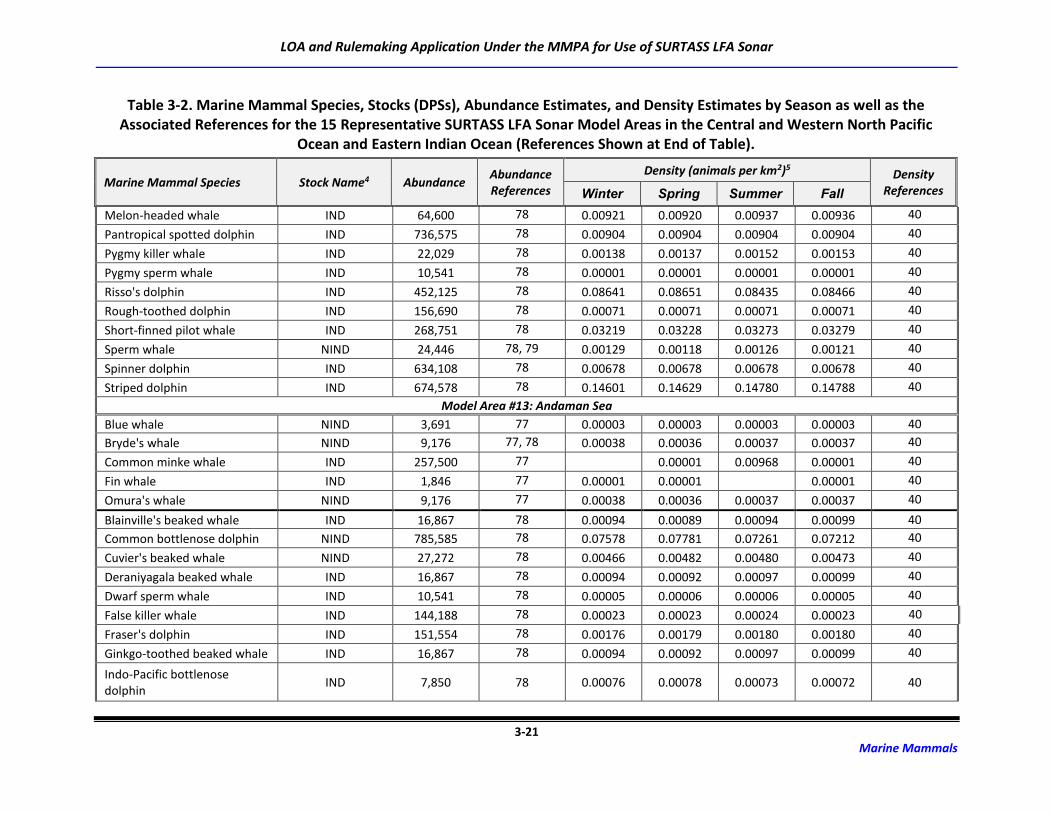
LOA and Rulemaking Application Under the MMPA for Use of SURTASS LFA Sonar
3-21 Marine Mammals
Table 3-2. Marine Mammal Species, Stocks (DPSs), Abundance Estimates, and Density Estimates by Season as well as the Associated References for the 15 Representative SURTASS LFA Sonar Model Areas in the Central and Western North Pacific
Ocean and Eastern Indian Ocean (References Shown at End of Table).
Marine Mammal Species Stock Name4 Abundance Abundance References
Density (animals per km2)5 Density References Winter Spring Summer Fall
Melon-headed whale IND 64,600 78 0.00921 0.00920 0.00937 0.00936 40
Pantropical spotted dolphin IND 736,575 78 0.00904 0.00904 0.00904 0.00904 40
Pygmy killer whale IND 22,029 78 0.00138 0.00137 0.00152 0.00153 40
Pygmy sperm whale IND 10,541 78 0.00001 0.00001 0.00001 0.00001 40
Risso's dolphin IND 452,125 78 0.08641 0.08651 0.08435 0.08466 40
Rough-toothed dolphin IND 156,690 78 0.00071 0.00071 0.00071 0.00071 40
Short-finned pilot whale IND 268,751 78 0.03219 0.03228 0.03273 0.03279 40
Sperm whale NIND 24,446 78, 79 0.00129 0.00118 0.00126 0.00121 40
Spinner dolphin IND 634,108 78 0.00678 0.00678 0.00678 0.00678 40
Striped dolphin IND 674,578 78 0.14601 0.14629 0.14780 0.14788 40
Model Area #13: Andaman Sea
Blue whale NIND 3,691 77 0.00003 0.00003 0.00003 0.00003 40
Bryde's whale NIND 9,176 77, 78 0.00038 0.00036 0.00037 0.00037 40
Common minke whale IND 257,500 77 0.00001 0.00968 0.00001 40
Fin whale IND 1,846 77 0.00001 0.00001 0.00001 40
Omura's whale NIND 9,176 77 0.00038 0.00036 0.00037 0.00037 40
Blainville's beaked whale IND 16,867 78 0.00094 0.00089 0.00094 0.00099 40
Common bottlenose dolphin NIND 785,585 78 0.07578 0.07781 0.07261 0.07212 40
Cuvier's beaked whale NIND 27,272 78 0.00466 0.00482 0.00480 0.00473 40
Deraniyagala beaked whale IND 16,867 78 0.00094 0.00092 0.00097 0.00099 40
Dwarf sperm whale IND 10,541 78 0.00005 0.00006 0.00006 0.00005 40
False killer whale IND 144,188 78 0.00023 0.00023 0.00024 0.00023 40
Fraser's dolphin IND 151,554 78 0.00176 0.00179 0.00180 0.00180 40
Ginkgo-toothed beaked whale IND 16,867 78 0.00094 0.00092 0.00097 0.00099 40
Indo-Pacific bottlenose dolphin
IND 7,850 78 0.00076 0.00078 0.00073 0.00072 40

LOA and Rulemaking Application Under the MMPA for Use of SURTASS LFA Sonar
3-22 Marine Mammals
Table 3-2. Marine Mammal Species, Stocks (DPSs), Abundance Estimates, and Density Estimates by Season as well as the Associated References for the 15 Representative SURTASS LFA Sonar Model Areas in the Central and Western North Pacific
Ocean and Eastern Indian Ocean (References Shown at End of Table).
Marine Mammal Species Stock Name4 Abundance Abundance References
Density (animals per km2)5 Density References Winter Spring Summer Fall
Killer whale IND 12,593 78 0.00744 0.00178 0.00730 0.00734 40
Longman's beaked whale IND 16,867 78 0.00444 0.00429 0.00459 0.00440 40
Melon-headed whale IND 64,600 78 0.00884 0.00848 0.00878 0.00846 40
Pantropical spotted dolphin IND 736,575 78 0.00868 0.00841 0.00829 0.00873 40
Pygmy killer whale IND 22,029 78 0.00121 0.00113 0.00125 0.00131 40
Pygmy sperm whale IND 10,541 78 0.00001 0.00001 0.00001 0.00001 40
Risso's dolphin IND 452,125 78 0.09197 0.09215 0.09173 0.09366 40
Rough-toothed dolphin IND 156,690 78 0.00077 0.00078 0.00077 0.00074 40
Short-finned pilot whale IND 268,751 78 0.03354 0.03364 0.03543 0.03504 40
Sperm whale NIND 24,446 78, 79 0.00109 0.00099 0.00107 0.00105 40
Spinner dolphin IND 634,108
78 0.00736 0.00711 0.00701 0.00726 40
Striped dolphin IND 674,578 78 0.14413 0.14174 0.14123 0.14402 40
Model Area #14: Northwest of Australia8
Antarctic minke whale ANT 90,000 80 0.00001 0.00001 0.00001 40
Blue whale/Pygmy Blue Whale SIND 1,657 81, 82 0.00003 0.00003 0.00003 40
Bryde's whale SIND 13,854 83 0.00032 0.00032 0.00032 0.00032 40
Common minke whale IND 257,500 77 0.01227 0.01929 0.01947 40
Fin whale SIND 38,185 84, 85 0.00001 0.00099 0.00128 0.00121 40
Humpback whale WAU stock and
DPS 13,640 86 0.00007 0.00007 0.00007 40
Omura's whale SIND 13,854 83 0.00032 0.00032 0.00032 0.00032 40
Sei whale SIND 13,854 83 0.00001 0.00001 0.00001 0.00001 40
Blainville's beaked whale IND 16,867 78 0.00083 0.00083 0.00082 0.00083 40
8 Seasons are presented following Northern Hemisphere monthly breakdowns for consistency. That is, winter for this model area would be austral summer in the Southern Hemisphere where this
mission area is located.
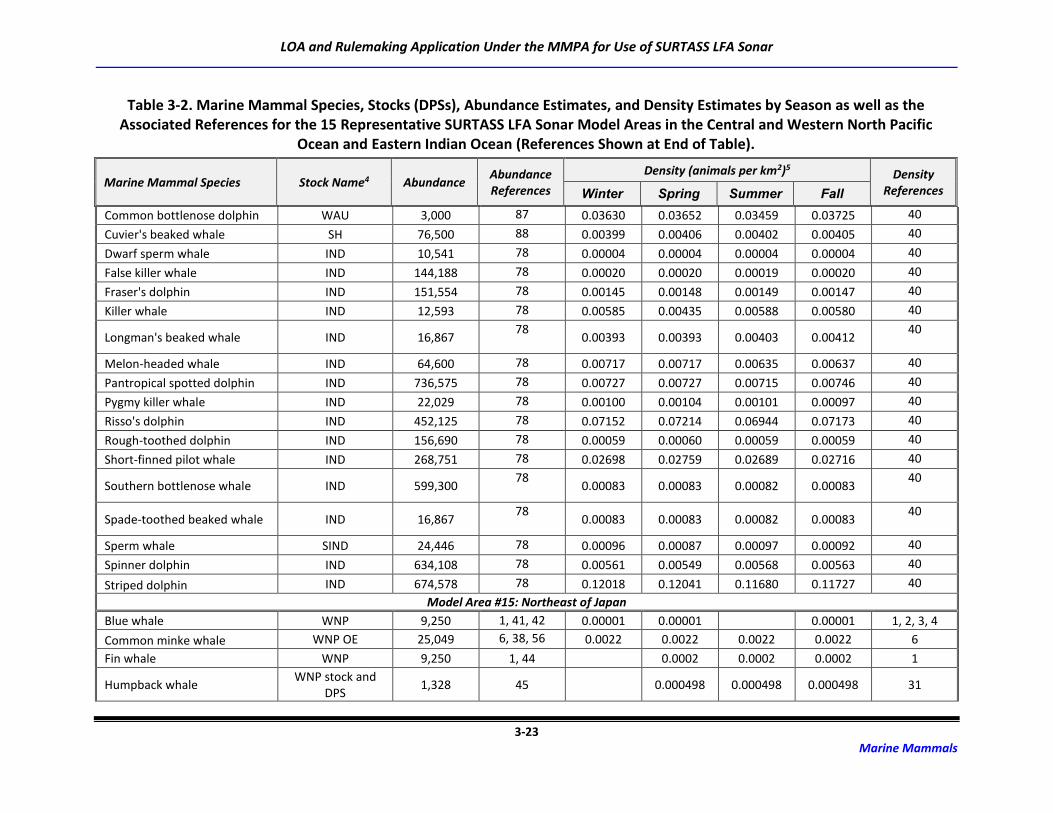
LOA and Rulemaking Application Under the MMPA for Use of SURTASS LFA Sonar
3-23 Marine Mammals
Table 3-2. Marine Mammal Species, Stocks (DPSs), Abundance Estimates, and Density Estimates by Season as well as the Associated References for the 15 Representative SURTASS LFA Sonar Model Areas in the Central and Western North Pacific
Ocean and Eastern Indian Ocean (References Shown at End of Table).
Marine Mammal Species Stock Name4 Abundance Abundance References
Density (animals per km2)5 Density References Winter Spring Summer Fall
Common bottlenose dolphin WAU 3,000 87 0.03630 0.03652 0.03459 0.03725 40
Cuvier's beaked whale SH 76,500 88 0.00399 0.00406 0.00402 0.00405 40
Dwarf sperm whale IND 10,541 78 0.00004 0.00004 0.00004 0.00004 40
False killer whale IND 144,188 78 0.00020 0.00020 0.00019 0.00020 40
Fraser's dolphin IND 151,554 78 0.00145 0.00148 0.00149 0.00147 40
Killer whale IND 12,593 78 0.00585 0.00435 0.00588 0.00580 40
Longman's beaked whale IND 16,867 78
0.00393 0.00393 0.00403 0.00412 40
Melon-headed whale IND 64,600 78 0.00717 0.00717 0.00635 0.00637 40
Pantropical spotted dolphin IND 736,575 78 0.00727 0.00727 0.00715 0.00746 40
Pygmy killer whale IND 22,029 78 0.00100 0.00104 0.00101 0.00097 40
Risso's dolphin IND 452,125 78 0.07152 0.07214 0.06944 0.07173 40
Rough-toothed dolphin IND 156,690 78 0.00059 0.00060 0.00059 0.00059 40
Short-finned pilot whale IND 268,751 78 0.02698 0.02759 0.02689 0.02716 40
Southern bottlenose whale IND 599,300 78
0.00083 0.00083 0.00082 0.00083 40
Spade-toothed beaked whale IND 16,867 78
0.00083 0.00083 0.00082 0.00083 40
Sperm whale SIND 24,446 78 0.00096 0.00087 0.00097 0.00092 40
Spinner dolphin IND 634,108 78 0.00561 0.00549 0.00568 0.00563 40
Striped dolphin IND 674,578 78 0.12018 0.12041 0.11680 0.11727 40
Model Area #15: Northeast of Japan
Blue whale WNP 9,250 1, 41, 42 0.00001 0.00001 0.00001 1, 2, 3, 4
Common minke whale WNP OE 25,049 6, 38, 56 0.0022 0.0022 0.0022 0.0022 6
Fin whale WNP 9,250 1, 44 0.0002 0.0002 0.0002 1
Humpback whale WNP stock and
DPS 1,328 45 0.000498 0.000498 0.000498 31

LOA and Rulemaking Application Under the MMPA for Use of SURTASS LFA Sonar
3-24 Marine Mammals
Table 3-2. Marine Mammal Species, Stocks (DPSs), Abundance Estimates, and Density Estimates by Season as well as the Associated References for the 15 Representative SURTASS LFA Sonar Model Areas in the Central and Western North Pacific
Ocean and Eastern Indian Ocean (References Shown at End of Table).
Marine Mammal Species Stock Name4 Abundance Abundance References
Density (animals per km2)5 Density References Winter Spring Summer Fall
North Pacific right whale WNP 922 89 0.00001 0.00001
Sei whale NP 7,000 1, 47 0.00029 0.00029 13, 32
Western North Pacific gray whale
WNP stock and Western DPS
140 41 0.00001 0.00001
Baird's beaked whale WNP 5,688 48, 49 0.0015 0.0029 0.0029 9
Common dolphin WNP 3,286,163 2, 3 0.0863 0.0863 0.0863 0.0863 2, 3
Cuvier's beaked whale WNP 90,725 2, 3 0.0054 0.0054 0.0054 0.0054 2, 3
Dall's porpoise WNP dalli 162,000 49, 69 0.0390 0.0520 0.0650 0.0520 2, 3
Killer whale WNP 12,256 2, 3 0.0036 0.0036 0.0036 0.0036 34
Pacific white-sided dolphin NP 931,000 20, 90 0.0048 0.0048 0.0048 0.0048 2, 3
Sperm whale NP 102,112 52, 53 0.0017 0.0022 0.0022 0.0022 12
Stejneger's beaked whale WNP 8,000 9 0.0005 0.0005 0.0005 0.0005 2, 3
Northern fur seal Western Pacific 503,609 54, 55 0.00689 0.01378 0.01378 0.01378 20
Ribbon seal NP 365,000 91 0.0904 0.0904 0.0452 0.0452 34
Spotted seal Alaska stock and
Bering DPS 461,625 70, 93 0.2770 0.1385 34
Steller sea lion Western/Asian
stocks and Western DPS
71,221 70, 92 0.00001 0.00001 0.00001 0.00001
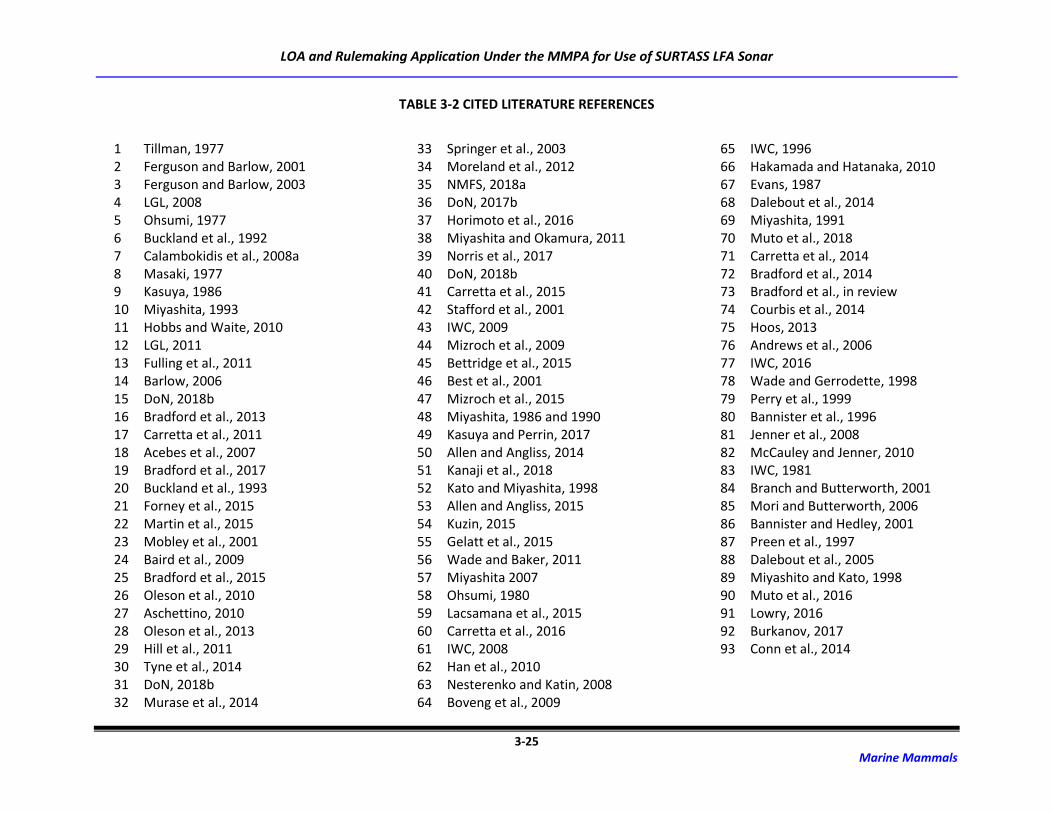
LOA and Rulemaking Application Under the MMPA for Use of SURTASS LFA Sonar
3-25 Marine Mammals
TABLE 3-2 CITED LITERATURE REFERENCES
1 Tillman, 1977 2 Ferguson and Barlow, 2001 3 Ferguson and Barlow, 2003 4 LGL, 2008 5 Ohsumi, 1977 6 Buckland et al., 1992 7 Calambokidis et al., 2008a 8 Masaki, 1977 9 Kasuya, 1986 10 Miyashita, 1993 11 Hobbs and Waite, 2010 12 LGL, 2011 13 Fulling et al., 2011 14 Barlow, 2006 15 DoN, 2018b 16 Bradford et al., 2013 17 Carretta et al., 2011 18 Acebes et al., 2007 19 Bradford et al., 2017 20 Buckland et al., 1993 21 Forney et al., 2015 22 Martin et al., 2015 23 Mobley et al., 2001 24 Baird et al., 2009 25 Bradford et al., 2015 26 Oleson et al., 2010 27 Aschettino, 2010 28 Oleson et al., 2013 29 Hill et al., 2011 30 Tyne et al., 2014 31 DoN, 2018b 32 Murase et al., 2014
33 Springer et al., 2003 34 Moreland et al., 2012 35 NMFS, 2018a 36 DoN, 2017b 37 Horimoto et al., 2016 38 Miyashita and Okamura, 2011 39 Norris et al., 2017 40 DoN, 2018b 41 Carretta et al., 2015 42 Stafford et al., 2001 43 IWC, 2009 44 Mizroch et al., 2009 45 Bettridge et al., 2015 46 Best et al., 2001 47 Mizroch et al., 2015 48 Miyashita, 1986 and 1990 49 Kasuya and Perrin, 2017 50 Allen and Angliss, 2014 51 Kanaji et al., 2018 52 Kato and Miyashita, 1998 53 Allen and Angliss, 2015 54 Kuzin, 2015 55 Gelatt et al., 2015 56 Wade and Baker, 2011 57 Miyashita 2007 58 Ohsumi, 1980 59 Lacsamana et al., 2015 60 Carretta et al., 2016 61 IWC, 2008 62 Han et al., 2010 63 Nesterenko and Katin, 2008 64 Boveng et al., 2009
65 IWC, 1996 66 Hakamada and Hatanaka, 2010 67 Evans, 1987 68 Dalebout et al., 2014 69 Miyashita, 1991 70 Muto et al., 2018 71 Carretta et al., 2014 72 Bradford et al., 2014 73 Bradford et al., in review 74 Courbis et al., 2014 75 Hoos, 2013 76 Andrews et al., 2006 77 IWC, 2016 78 Wade and Gerrodette, 1998 79 Perry et al., 1999 80 Bannister et al., 1996 81 Jenner et al., 2008 82 McCauley and Jenner, 2010 83 IWC, 1981 84 Branch and Butterworth, 2001 85 Mori and Butterworth, 2006 86 Bannister and Hedley, 2001 87 Preen et al., 1997 88 Dalebout et al., 2005 89 Miyashito and Kato, 1998 90 Muto et al., 2016 91 Lowry, 2016 92 Burkanov, 2017 93 Conn et al., 2014

LOA and Rulemaking Application Under the MMPA for Use of SURTASS LFA Sonar
4-1 Status and Distribution
4 STATUS AND DISTRIBUTION OF POTENTIALLY AFFECTED MARINE
MAMMAL SPECIES AND STOCKS
The status, distribution, stocks, abundance, diving behavior, life history, and hearing/vocalization for
each of the marine mammal species potentially found in the study area are the focus of this chapter.
The status of marine mammal populations is impacted by their biological characteristics, natural
phenomenon, and interaction with anthropogenic activity. Many cetacean and pinniped populations
have been reduced due to the exploitation of commercial whaling and harvesting, incidental fisheries
bycatch, harmful algal blooms, and habitat destruction over the last centuries. The reduction in some
marine mammal populations has led to the risk of extinction. The ESA, along with the international
organizations such as the International Union of Conservation of Nature (IUCN), designate a protected
status when species are at risk of extinction, generally based on natural or manmade factors affecting
the continued existence of species. In addition, under the MMPA, species or stocks that are not at the
optimal sustainable population level may be listed as depleted.
The distribution of marine mammals is difficult to predict as these highly mobile animals are capable of
traveling long distances. Many species of marine mammals move extensive distances between feeding
grounds at high latitudes during warmer seasons and calving/breeding grounds in the lower latitudes
during colder seasons. Some baleen whales, such as the humpback whale, make extensive annual
migrations to low-latitude mating and calving grounds in the winter and to high-latitude feeding grounds
in the spring and summer, traveling over 5,292 nmi (9,800 km) one way, which is the longest known
migration of any mammal (Stevick et al., 2011). Despite this mobility, however, the distribution of
marine mammals is not typically random or homogeneous but is often characterized by irregular
clusters (patches) of occurrence that frequently correlate with locations of high prey abundance. Marine
mammals are often associated with features such as oceanographic fronts or regions of persistent
upwelling because these areas of increased primary productivity attract marine mammal prey, such as
squid and fishes.
4.1 Mysticetes
Mysticetes potentially affected by SURTASS LFA sonar include 10 species in three families (Table 3-1).
Mysticetes are characterized by paired blowholes and the large baleen plates used to capture
zooplankton and small fishes. Due to decades of whaling, many mysticete species and populations are
imperiled throughout their worldwide ranges.
All mysticetes produce LF sounds, although no direct measurements of auditory (hearing) thresholds
have been made for any mysticete species as most tests for auditory measurements are impractical in
such large animals (Clark, 1990; Richardson et al., 1995; Edds-Walton, 1997; Tyack, 2000; Evans and
Raga, 2001). A few species’ vocalizations are known to be communication signals but the function of
other mysticete LF sounds are not fully understood although likely are used for functions such as
orientation, navigation, or detection of predators and prey. Several mysticete species, including the
Requirement 4: Description of the status, distribution, and seasonal distribution of the affected species
or stocks of marine mammals likely to be affected by such activities.

LOA and Rulemaking Application Under the MMPA for Use of SURTASS LFA Sonar
4-2 Status and Distribution
humpback, fin, and blue whales, sing or emit repetitious patterned signals or vocalizations (Frankel,
2009). Based on a study of the morphology of cetacean auditory mechanisms, Ketten (1994)
hypothesized that mysticete hearing is in the low to infrasonic frequency range. It is generally believed
that baleen whales have frequencies of best hearing where their calls have the greatest energy—below
5,000 Hz (Ketten, 2000).
4.1.1 Antarctic Minke Whale (Balaenoptera bonaerensis)
The Antarctic minke whale is listed by the IUCN Red List of Threatened Species as data deficient (Reilly et
al., 2008b). Reilly et al. (2008b) suggested a corrected population estimate of 339,000 individuals
(CV=0.079), while the International Whaling Commission (IWC) more recently estimated the entire
population as 515,000 (IWC, 2013; Perrin et al. 2018). The population of Antarctic minke whales
occurring off Western Australia has been estimated as 90,000 whales (Bannister et al., 1996).
Antarctic minke whales range from the waters of the Southern Ocean in Antarctica south of 60° S to the
ice edge during austral summer to waters of the Pacific, Atlantic, and Indian oceans from about 10° to
30° S during austral winter, when they have been observed as far north as Brazil and Peru, with some
whales having been reported to overwinter in Antarctic waters (Perrin et al. 2018; Reilly et al. 2008b).
Antarctic minke whales are primarily oceanic, occurring in waters beyond the continental shelf break
(Perrin et al., 2018).
Leatherwood et al. (1981) observed that Antarctic minke whales off Ross Island, Antarctica dove for
durations between 9.7 to 10.8 min, and that after making a series of shallow dives, the whales dove up
to 14 min. Diving behavior has been recorded from foraging individuals, with three dive types identified:
short and shallow, under ice, and long and deep (Friedlaender et al., 2014). The mean dive depth for
short, shallow dives was 33 ft (10 m), 98 ft (30 m) for under ice dives, and 187 ft (57 m) for long, deep
dives (Friedlaender et al., 2014). Dive times ranged from 1 to 6 min (Friedlaender et al., 2014). Risch et
al. (2014) noted that Antarctic minke whales made shallow dives to <131 ft (40 m) at night and deeper
dives to over 328 ft (100 m) during the day. The Antarctic minke whale can swim at speeds of up to 10.8
kt (20 kph).
Hearing sensitivity of Antarctic minke whales has not been measured (Ketten, 2000; Thewissen, 2002).
However, models of minke whale middle ears predict their best hearing overlaps with their vocalization
frequency range (Tubelli et al., 2012). Antarctic minke whales produce a variety of sounds, including
whistles, clicks, screeches, grunts, downsweeps, calls that sound like clanging bell, and a sound called
“bio-duck” (Leatherwood et al., 1981; Risch et al., 2014). Downsweeps are intense, LF calls that sweep
down from about 130 Hz to about 60 Hz, with a peak frequency of 83 Hz, and an average SL of about
147 dB re 1 µPa @ 1 m (Schevill and Watkins, 1972). The “bio-duck” sound was first described in the
1960s and resembles the quack of a duck. Bioduck signals consist of a series of pulse trains of short
downswept signals with a peak frequency of 154 Hz, SL of 140 dB re 1 µPa @ 1 m, and sometimes
include harmonics up to 1 kHz (Risch et al., 2014). The bio-duck sound appears to be produced when
whales are at the sea surface before foraging dives.
4.1.2 Blue Whale (Balaenoptera musculus) and Pygmy Blue Whale (Balaenoptera musculus
brevicauda)
Multiple subspecies and stocks exist worldwide but only the pygmy blue whale is typically differentiated
as a species at-sea. The information available for the pygmy blue whale in the part of the study area in
which it may occur is detailed herein; otherwise, information is presented on the blue whale as a
LOA and Rulemaking Application Under the MMPA for Use of SURTASS LFA Sonar
4-3 Status and Distribution
species. The blue whale is currently listed as endangered under the ESA; depleted under the MMPA;
protected under the Convention on International Trade in Endangered Species (CITES); and as
endangered (blue), data deficient (pygmy blue), and as critically endangered (Antarctic blue) by the
IUCN Red List of Threatened Species (Reilly et al., 2008c). The global population of blue whales is
estimated between 10,000 to 25,000 individuals (Reilly et al., 2008c). In the central North Pacific (CNP)
stock of blue whales, 133 individuals (CV=1.09) are estimated to occur (Bradford et al., 2017), while
9,250 blue whales are estimated for the WNP stock (Tillman, 1977). The Northern Indian Ocean stock of
blue whales has been estimated to include 3,432 whales (IWC, 2016), while 1,657 blue whales are
estimated to occur in the Southern Indian Ocean stock (inclusive of both pygmy blue and blue whales)
(Jenner et al., 2008; McCauley and Jenner, 2010).
Blue whales are distributed in oceanic subpolar to tropical waters of the world’s oceans and some
continental seas except the Mediterranean Sea and Gulf of Mexico (Jefferson et al., 2015). Occurring
primarily in open ocean waters, they also may occur in neritic waters when foraging and possibly when
breeding. Blue whales occur in lower numbers in the central and western North Pacific than in the
eastern North Pacific Ocean, but blue whales are reported from Hawaiian waters and from Kamchatka
and the Kuril Islands to offshore Japan (Sears and Perrin, 2018). Blue whales occur throughout the Indian
Ocean, with at least some blue whales off Sri Lanka remaining at low-latitudes throughout the year,
presumably, because oceanographic upwelling supports sufficient productivity and prey (de Vos et al.,
2014). The pygmy blue whale occurs in the Southern Hemisphere, particularly in the Indian Ocean off
the west coast of Australia and move between ~42S and the Molucca Sea near the equator (Double et
al., 2014). Not all blue whales are migratory, as some remain resident and do not seasonall move from
lower latitude calving and breeding grounds and higher latitude foraging grounds (Jefferson et al., 2015;
Sears and Perrin, 2018).
The swimming and diving behavior of blue whales has been relatively well characterized. General blue
whale dive durations and dive depths range from 5 to 15 min and 591 to 656 ft (180 to 200 m),
respectively (Croll et al., 1998, 2001a). Dives of 20 to 30 min are not unusual and the longest dive
recorded was 36 min long (Jefferson et al., 2015; Sears and Perrin, 2018). Calambokidis et al. (2008b)
reported a maximum dive depth of 961 ft (293 m). Foraging blue whales appear to dive more shallowly,
with average foraging dives reaching only 223 ft (67.6 m) (Croll et al., 2001a). A migrating pygmy blue
whale was observed consistently diving to 43 ft (13 m) (Owen et al., 2016). Dive descent swim rates of
2.4 kt (4.5 kph) have been recorded (Williams et al., 2000). The common surface swim speed for blue
whales is 1.6 to 3.2 kt (3 to 6 kph), but travel speeds of 3.8 to 10.8 kt (7 to 20 kph) are not uncommon,
and the maximum swim speed reported for a blue whale 18.9 kt (35 kph) (Sears and Perrin, 2018).
No hearing sensitivity has been measured for blue whales (Ketten, 2000; Nummela, 2009). Blue whales
produce a variety of LF vocalizations ranging from 10 to 200 Hz throughout the year but with peaks in
midsummer and winter (Alling and Payne, 1990; Clark and Fristrup, 1997; Edds, 1982; Rivers, 1997;
Stafford et al., 1998, 1999a, 1999b, and 2001; Thompson and Friedl, 1982; Sears and Perrin, 2018). The
majority of blue whale vocalizations are infrasonic sounds from 17 to 20 Hz with a SL of 188 dB re 1 µPa
@ 1 m (Sears and Perrin, 2018), which makes their vocalizations amongst the loudest made by any
animal (Aroyan et al., 2000; Cummings and Thompson, 1971). However, calls produced during foraging
have been measured at lower SLs, ranging from 158 to 169 dB re 1 Pa @ 1 m (Akamatsu et al., 2014).
Short sequences of rapid frequency modulated (FM) calls below 90 Hz are associated with animals in
social groups (Mellinger and Clark, 2003; Moore et al., 1999). Off Australia, at least five types of pygmy
blue whale calls were detected that consisted of amplitude and frequency modulated components with

LOA and Rulemaking Application Under the MMPA for Use of SURTASS LFA Sonar
4-4 Status and Distribution
frequencies ranging from 20 to 750 Hz, and durations between 0.9 and 4.4 sec (Recalde-Salas et al.,
2014). Calls produced by foraging blue whales off Iceland were FM downsweeps with a frequency range
of 105 to 48 Hz and durations of 1 to 2 seconds (Akamatsu et al., 2014). Blue whales also produce a
variety of transient sound (i.e., they do not occur in predictable patterns or have much interdependence
of probability) in the 30 to 100 Hz band (sometimes referred to as “D” calls). These usually sweep down
in frequency or are inflected (up-over-down), occur throughout the year, and are assumed to be
associated with socializing when animals are in close proximity (Mellinger and Clark, 2003). Blue whales
also produce long, patterned hierarchically organized sequences that are characterized as songs. Blue
whales produce songs throughout most of the year with a peak period of singing overlapping with the
general period of functional breeding.
The call characteristics of blue whales vary geographically and seasonally (Stafford et al., 2001). It has
been suggested that song characteristics could indicate population structure (McDonald et al., 2006). In
temperate waters, intense bouts of long, patterned sounds are common from fall through spring, but
these also occur to a lesser extent during the summer in high-latitude feeding areas. Call rates during
foraging may be very low. A recent study recorded four calls during ~22 hours (Akamatsu et al., 2014).
4.1.3 Bryde’s Whale (Balaenoptera edeni)
The taxonomy of the Bryde’s whale has not been completely resolved (SMM, 2017). Nevertheless, two
forms of the Bryde’s whale have been provisionally recognized: the larger, oceanic Bryde’s whale (B.
edeni brydei) and the smaller, coastal Eden’s whale (B. edeni edeni) (Kato and Perrin, 2018; Kershaw et
al., 2013; Luksenberg et al., 2015; SMM, 2017). The offshore Bryde’s whale occurs globally in pelagic
waters, while the Eden’s whale typically occurs in nearshore waters of the Pacific and Indian oceans
(SMM, 2017). The examination of genetics samples from the Pacific and Indian oceans by Kershaw et al.
(2013) clarified the existence of two forms of Bryde’s whales, and the additional osteological and genetic
analyses by Luksenberg et al. (2015) confirmed the conclusion of two Bryde’s whale subspecies (Kato
and Perrin, 2018). In the study area for SURTASS LFA sonar, both forms of Bryde’s whales occur (de Boer
et al., 2003; Martenstyn, 2016; Reilly et al., 2008d). However, due to the lack of resolution regarding the
taxonomy and specific information about the Eden’s whale in most areas, information is presented
herein on the Bryde’s whale at the species level.
The Bryde’s whale is currently protected under CITES and is classified as a data deficient as a species by
the IUCN Red List of Threatened Species (Reilly et al., 2008d). In December 2016, NMFS proposed listing
the Gulf of Mexico (GOMx) Bryde’s whale as endangered under the ESA (NOAA, 2016h). The GOMx
Bryde’s whale population includes those Bryde’s whales that breed and feed solely in the GOMx. NMFS
made the determination that the GOMx Bryde’s whale is a unique evolutionary lineage, taxonomically
distinct from other subspecies, and is thus classified as an unnamed subspecies rather than a DPS
(NOAA, 2016h). The IWC recognizes four stocks of Bryde’s whales in the North Pacific Ocean: Western
North Pacific (WNP), Eastern Tropical Pacific (ETP), East China Sea, and Gulf of California (IWC, 1996) and
the following stocks for the Southern Hemisphere: Western and Eastern South Pacific, Northern and
Southern Indian Ocean, South African Inshore, and South Atlantic (IWC, 1980). NMFS additionally has
identified a Hawaii stock of Bryde’s whales in the central North Pacific Ocean. No global population
estimates of Bryde’s whales exist. In the western North Pacific Ocean, the population of Bryde’s whales
is estimated by the IWC as 20,501 whales (IWC, 2009). In the East China Sea, the stock of Bryde’s whale
is estimated as 137 individuals (IWC, 1996), and in Hawaiian waters, 1,751 Bryde’s whales (CV=0.29)
have been estimated (Bradford et al., 2017). In the Northern Indian Ocean, 9,176 Bryde’s whales have

LOA and Rulemaking Application Under the MMPA for Use of SURTASS LFA Sonar
4-5 Status and Distribution
been estimated (IWC, 2016; Wade and Gerrodette, 1993), while 13,854 Bryde’s whales have been
estimated for the Southern Indian Ocean (IWC, 1981).
Bryde’s whales occur roughly between 40°N and 40°S throughout tropical and warm temperate (>61.3°F
[16.3°C]) waters of the Atlantic, Pacific, and Indian oceans year round (Kato and Perrin, 2018; Omura,
1959). Bryde’s whales occur in some semi-enclosed waters such as the Gulf of California, Gulf of Mexico,
and East China Sea (Kato and Perrin, 2018). Recent sightings indicate that the range of Bryde’s whales is
expanding poleward (Kerosky et al., 2012). Bryde’s whales are distributed in the subarctic-subtropical
transition area of the western North Pacific Ocean (frontal boundary where subarctic waters intersect
the warmer waters of the Kuroshio Current) throughout summer, which is thought to be a feeding area
(Watanabe et al., 2012), although the foraging distribution in the western North Pacific is highly linked
to the distribution of their prey (Sasaki et al., 2013). Most Bryde’s whales are thought to migrate
seasonally toward the lower latitudes near the equator in winter and to high latitudes in summer (Kato
and Perrin, 2018). However, Bryde’s whales remain resident in areas off South Africa, California, and the
Gulf of Mexico throughout the year, migrating only short distances (Best, 1960; Tershy, 1992; Rosel et
al., 2016). Foraging grounds are not well known for this species, although there is evidence that they
feed on a wide range of food in both pelagic and nearshore areas (Niño-Torres et al., 2014). Murase et
al. (2016) noted that two satellite-taggeed Bryde’s whales in the offshore waters of the western North
Pacific Ocean did not remain in the northen, subarctic-tropical transition feeding area throughout the
summer, but instead traveled southward to tropical waters between 20° and 30°N.
Bryde’s whales can dive to a water depth of about 984 ft (300 m) (Kato and Perrin, 2018). The maximum
dive time reported for two Bryde’s whales off Madiera Island was 9.4 min, with routine dives lasting 5
min, and mean dive durations of 0.4 to 6 min (Alves et al., 2010). Dive durations of Bryde’s whales off
Venezuela were from 3 to 11 min {Notarbartolo di Sciara, 1983). Alves et al. (2010) also reported routine
dives by Bryde’s whales to water depths from 131 to 656 ft (40 to 200 m) and a dive to a maximum
depth of 958 ft (292 m). Bryde’s whales are relatively fast swimming whales. The maximum swim speed
reached by a Bryde’s whale was recorded at 10.8 to 13.5 kt (20 to 25 kph), with average swim speeds
reported between 1.1 and 3.8 kt (2 and 7 kph) (Kato and Perrin, 2018; Murase et al., 2016). Bryde’s
whales tracked off Kauai, HI swam at speeds that ranged from 0.8 to 8.6 kt (0.15 to 16 kph), with an
overall mean swim speed of 3.2 kt (6 kph) (Helble et al., 2016).
No direct measurements of Bryde’s whales hearing sensitivity have been conducted (Ketten, 2000).
Bryde’s whales are known to produce a variety of LF sounds ranging from 20 to 900 Hz, with the higher
frequencies being produced between cow-calf pairs (Cummings, 1985; Edds et al., 1993). Oleson et al.
(2003) reported call types with fundamental frequencies below 240 Hz. These lower frequency call types
have been recorded from Bryde’s whales in the Caribbean, ETP, and off the coast of New Zealand.
Additional call types have been recorded in the Gulf of Mexico (Širović et al., 2014). Calves produce
discrete pulses at 700 to 900 Hz (Edds et al., 1993). SLs range between 152 and 174 dB re 1 µPa @ 1 m
(Frankel, 2018). Pulsive, FM and AM calls with a frequency range of 50 to 900 Hz and 0.4 to 4.5 second
duration were recorded off Brazil (Figueiredo, 2014).
4.1.4 Common Minke Whale (Balaenoptera acutorostrata)
The taxonomy of the minke whale has been complex to unravel and is not yet fully resolved. The SMM
(2017) has subdivided the common minke whale into three subspecies, with two subspecies
representing the standard minke whales that are now known to occur only in the North Pacific (B.
acutorostrata scammoni) and Atlantic B. acutorostrata acutorostrata) oceans, and a third unnamed

LOA and Rulemaking Application Under the MMPA for Use of SURTASS LFA Sonar
4-6 Status and Distribution
subspecies representing the dwarf form that principally occurs in the waters of the Southern
Hemisphere. Separation of the information and data about the standard and dwarf forms of the
common minke whale is further complicated by a non-distinct boundary between the forms, with the
dwarf form sometimes moving into waters of the Northern Hemisphere, and the two forms only being
distinguishable at sea by subtle coloration differences (Jefferson et al., 2015). Little to no population-
level data is available on the dwarf minke whale, so for purposes of this SEIS/SOEIS, information is
presented on the common minke whale as a species, inclusive of the dwarf minke whale.
The minke whale is protected under CITES as well as the MMPA and is classified by the IUCN Red List of
Threatened Species as species of least concern (Reilly et al., 2008e). The IWC has recently re-evaluated
the stock structure of common minke whales in the western North Pacific Ocean, and although not fully
resolved given a lack of data for minke whales during winter on their reputed breeding grounds, the IWC
has concluded that most likely five stocks of common minke whales occur in the western North Pacific
Ocean (Wade and Baker, 2011). The IWC proposes the following stocks of common minke whales in the
western North Pacific Ocean: Yellow Sea stock (Y stock), Sea of Japan stock (JW stock), Pacific-coast of
Japan stock (JE stock), Pacific nearshore (<10 nmi [18.5 km] from coast) stock (OW stock), and Pacific
offshore stock (OE stock) (Wade and Baker, 2011). These stock definitions are based on unique genetic
characteristics (i.e., mitochondrial DNA and microsatellite DNA) and dates of conception of the common
minke whales in each of the proposed stock areas. For example, common minke whales in the Y stock
(Yellow Sea) all conceive in the autumn while common minke whales in the OW and OE stocks (Pacific
nearshore and offshore) conceive only in winter (Wade and Baker, 2011). The Navy considers these
stock definitions to be the best available science to characterize the populations and stocks of common
minke whales that occur in the western North Pacific Ocean region of the study area for SURTASS LFA
sonar. Further, the SMM (2017) has differentiated a North Pacific subspecies of common minke whales.
Thus, it is the North Pacific subspecies of the common minke whale (Table 3-1) that occurs in the
western and central North Pacific Ocean region of the study area.
The IWC reported a 1992 to 2004 population estimate of minke whales in the Southern Hemisphere as
515,000 (IWC, 2016), while the population of common minke whales in the Northern Hemisphere has
been estimated to include at least 180,000 individuals (Jefferson et al., 2015). The population of the
WNP OE stock of common minke whales has been estimated as 25,049 individuals (Buckland et al.,
1992; Miyashita and Okamura 2011), while the Y stock is estimated to include 4,492 whales (Hakamada
and Hatanaka, 2010; Miyashita and Okamura, 2011), and the JW stock is estimated to include a
population of 2,611 whales (Miyashita and Okamura, 2011). The Hawaii stock of common minke whales
occurring in the central North Pacific Ocean has been estimated to include 25,049 individuals (Buckland
et al., 1992). A single stock of common minke whales has been identified for the Indian Ocean, with an
estimated abundance of 257,500 whales (IWC, 2016).
Minke whales occur most often in tropical to polar coastal/neritic and inshore waters of the Atlantic,
Pacific, and Indian oceans but more infrequently also occur in pelagic waters. Common minke whales
are considered rare in the northern Indian Ocean (Salm et al., 1993; Sathasivam, 2002), Gulf of Mexico,
and Mediterranean Sea (Jefferson et al., 2015). Common minke whales are thought to be migratory, at
least in some areas, but migratory pathways are not well known and populations in some area remain
resident year-round (Reilly et al., 2008e). Likely, these whales migrate seasonally to higher latitudes to
feed and move to lower latitudes to breed and calve (Víkingsson and Heide-Jørgensen, 2015).
Minke whales in the St. Lawrence River performed dives characterized as short and long dives, with
short dives lasting between 2 and 3 min, while long dives ranged from 4 to 6 min (Christiansen et al.,
LOA and Rulemaking Application Under the MMPA for Use of SURTASS LFA Sonar
4-7 Status and Distribution
2015). Stockin et al. (2001) observed dives of common minke whales averaing 1 to 1.4 min in length,
while Stern (1992) noted dives of 4.4 min durations, and Joyce et al. (1989) measured dive durations off
Norway of 1 to 6 min (Joyce et al., 1989). Kvadsheim et al. (2017) reported that the dives of four tagged
minke whales could be characterized as long, deep; intermediate; and short, shallow dives, accounting
for 14 percent, 29 percent, and 57 percent of all baseline dives, respectively. Tagged minke whales dove
to a maximum depth of 492 ft (150 m), and rarely dove deeper than 394 ft (120 m) (Kvadsheim et al.,
2017). The mean swim speed for minke whales in Monterey Bay was 4.5 kt (8.3 kph) (Stern, 1992), while
Blix and Folkow (1995) reported a “cruising” speed of minkes as 6.3 kt (11.7 kph). Ford et al. (2005)
reported that common minke whales being pursued by killer whales swim at speeds ranging from 8.1 to
16.2 kt (15 to 30 kph).
Hearing sensitivity of minke whales has not been directly meaured (Ketten, 2000; Thewissen, 2002).
However, models of minke whale middle ears predict their best hearing overlaps with their vocalization
frequency range (Tubelli et al., 2012). Sounds produced by common minke whales encompass a wide
frequency range and variety of call types (Frankel, 2018). Minke whales produce a variety of sounds,
primarily moans, clicks, downsweeps, ratchets, thump trains, grunts, and “boings” in the 80 Hz to 20 kHz
range (Edds-Walton, 2000; Frankel, 2009; Mellinger et al., 2000; Risch et al., 2014a; Thompson et al.,
1979; Winn and Perkins, 1976). The signal features of their vocalizations consistently include LF, short-
duration downsweeps from 250 to 50 Hz. The energy in thump trains is concentrated in the 100 to 400
Hz band (Winn and Perkins, 1976; Mellinger et al., 2000). Complex vocalizations recorded from
Australian minke whales involved pulses ranging between 50 Hz and 9.4 kHz, followed by pulsed tones
at 1.8 kHz and tonal calls shifting between 80 and 140 Hz (Gedamke et al., 2001). The minke whale was
been identified as the elusive source of the North Pacific “boing” sound (Rankin and Barlow, 2005; Risch
et al., 2014a). Boings begin with a brief pulse and then a longer AM and FM signal lasting 2 to 10 sec
over frequencies from 1 to 5 kHz (Rankin and Barlow, 2005; Risch et al., 2014a). SLs of common minke
whale calls ranged from 164 to 168 dB re 1Pa @ 1 m (Risch et al., 2014b). Both geographical and
seasonal differences have been found among the sounds recorded from minke whales (Risch et al.,
2013).
4.1.5 Fin Whale (Balaenoptera physalus)
The fin whale is listed as endangered under the ESA, depleted under the MMPA, protected under CITES,
and as endangered by the IUCN Red List of Threatened Species (Reilly et al., 2013). The SMM (2017) has
differentiated Northern and Southern subspecies of fin whales (Table 3-1). Since these subspecies are
not differentiated at sea or in available population data and information, hereafter all information about
the fin whale is only referenced as a single species. The global population is estimated as <100,000
whales (Reilly et al., 2013). The population of fin whales in the Hawaii stock is estimated as 154 fin
whales (CV=1.05) (Bradford et al., 2017), while fin whales in the East China Sea stock are estimated to
include 500 individuals (Mizroch et al., 2009; Tillman, 1977; Evans, 1987), and the abundance of the
WNP stock has been estimated as 9,250 individuals (Mizroch et al., 2009; Tillman, 1977). The northern
Indian Ocean population of fin whales has been estimated to include 1,716 individuals (IWC, 2016),
while the Southern Indian Ocean stock of fin whales off western Australia is estimated as 38,185 whales
(Branch and Butterworth, 2001; Mori and Butterworth, 2006).
Fin whales are widely distributed in all oceans of the world, from tropical to polar oceanic waters, but
appear to be absent from equatorial waters (Aguilar and García-Vernet, 2018). Fin whales are
sometimes observed in nertic waters, but typically when deep water approaches near to land (Jefferson
et al., 2015). Although fin whales have traditionally been thought of as migratory, acoustic data suggests
LOA and Rulemaking Application Under the MMPA for Use of SURTASS LFA Sonar
4-8 Status and Distribution
no seasonality in the annual distribution of fin whales (Watkins, et al., 2000). Although fin whale calls
have been reported from the central Pacific waters of Hawaii in all months except June and July,
sightings of fin whales in these waters are rare (Muto et al., 2018). Specific breeding areas are unknown.
Fin whales dive for a mean duration of 4.2 min at depths averaging 197 ft (60 m) (Croll et al., 2001a;
Panigada et al., 2004). The deepest dive recorded for a fin whale was to a depth of 1,542 ft (470 m) but
dives to <328 ft (100 m) are more routine (Panigada et al., 1999). Fin whales forage at depths between
328 to 656 ft (100 and 200 m), with foraging dives lasting from 3 to 10 min (Aguilar, 2009; Witteveen et
al., 2015). When traveling, fin whales have been recorded diving only to an average of 194 ft (59 m)
(Croll et al., 2001). Swimming speeds average between 5 to 8 kt (9.2 and 14.8 kph) (Aguilar and García-
Vernet, 2018). The average speed of descent during dives in the Mediterranean has been measured as
6.2 kt (11.5 kph), while the swim speed of ascending dives was recorded as 4.1 kt (7.6 kph) (Panigada et
al., 1999). Watkins (1981) reported bursts of speed in fin whales up to 10.8 kt (20 kph). Singing fin
whales swam at average speeds of 2.9 to 4.8 kt (5.3 to 8.8 kph) (Varga et al., 2018).
There is no direct measurement of fin whale hearing sensitivity (Ketten, 2000; Thewissen, 2002). Fin
whales produce a variety of LF sounds that range from 10 to 200 Hz (Edds, 1988; Watkins, 1981; Watkins
et al., 1987a). Short sequences of rapid FM calls from 20 to 70 Hz are associated with animals in social
groups (Edds, 1988; McDonald et al., 1995; Watkins, 1981). The most common fin whale vocalization is
what is referred to as the “20-Hz signal or call”, which is a LF (18 to 35 Hz) loud and long (0.5 to 1.5 sec)
patterned sequence signal centered at 20 Hz (Clark et al., 2002; Patterson and Hamilton, 1964; Watkins
et al., 1987a). The pulse patterns of the 20-Hz signal vary only slightly geographically and with season
(McDonald et al., 1995, Oleson et al., 2014; Širovic´ et al., 2007, 2013; Varga et al., 2018). The 20-Hz
signal is common from fall through spring in most regions but also occurs to a lesser extent during the
summer in high-latitude feeding areas (Clark and Charif, 1998; Clark et al., 2002). In the Atlantic, 20-Hz
signals are produced regularly throughout the year, and Atlantic fin whales also produce higher
frequency downsweeps ranging from 100 to 30 Hz (Frankel, 2009). Fin whales produce the 20-Hz call in
two forms: songs and call-counter calls (Buccowich, 2014; McDonald and Fox, 1999; McDonald et al.,
1995; Oleson et al., 2014; Širovic´ et al., 2013; Varga et al., 2018; Watkins et al., 1987a). 20-Hz songs are
simply regular patterns of 20-Hz calls that are associated with reproductive behavior, and are only
produced by males (Croll et al., 2002; Delarue et al., 2013; Širovic et al., 2013 and 2017; Thompson et al.,
1992). 20-Hz call-counter calls are irregular patterns of 20-Hz signals that likely have a general
communication function and are produced by single or multiple fin whales in an area (McDonald and
Fox, 1999; McDonald et al., 1995; Širovic et al., 2013). Estimated SLs of the 20-Hz signal are as high as
180 to 190 dB re 1 µPa @ 1 m (Charif et al., 2002; Clark et al., 2002; Croll et al., 2002; Patterson and
Hamilton, 1964; Thompson et al., 1992; Watkins et al., 1987a; Weirathmueller et al., 2013); Varga et al.
(2018) reported the SLs of the 20-Hz songs off Southern California as 194.8 dB re 1 µPa @ 1 m (peak to
peak) and 180.9 dB re 1 µPa @ 1 m (rms). Fin whales also produce 40 Hz downsweeps (Širović et al.,
2012; Watkins, 1981).
4.1.6 Gray Whale (Eschrichtius robustus)
Two genetically distinct stocks and DPSs, the WNP and Eastern North Pacific (ENP), of gray whales exist
in the North Pacific Ocean (LeDuc et al., 2002). The ENP stock and DPS of gray whales was delisted from
the ESA, but WNP DPS of gray whales is extremely small and remains listed as endangered under the
ESA, depleted under the MMPA, and is considered critically endangered under the IUCN Red List of
Threatened Species (Reilly et al., 2008a). The WNP stock/DPS was thought to be extinct, but a small
group of 140 gray whales still remain (Carretta et al., 2015).
LOA and Rulemaking Application Under the MMPA for Use of SURTASS LFA Sonar
4-9 Status and Distribution
Gray whales occur in shallow (16 to 49 ft [5 to 15 m]) coastal waters of the North Pacific Ocean and
adjacent seas, occurring as far south as southern China in the western North Pacific and Mexico in the
eastern North Pacific Ocean (Jefferson et al., 2015). Gray whales annually migrate north-south from high
latitude feeding grounds to low latitude breeding grounds. Information about the WNP gray whale
stock/DPS is not nearly as complete as is information about the eastern stock, but WNP gray whales
summer in the Sea of Okhotsk, primarily near Sakhalin Island, and in Pacific waters off Kamchatka and
eastern Japan and migrate southward via the Sea of Japan, East China, and South China seas (Meier et
al., 2007; Weller et al., 2002). Reilly et al. (2018a) note that recent sightings in Pacific waters off Japan
during the migrational period may suggest that WNP gray whales are using those waters as an additional
or new migrational route. The breeding and calving grounds for the WNP gray whale are unknown, but
Hainan Island in the South China Sea has been suggested as a possible location (Brownell and Chun,
1977). WNP gray whales have been satellite tracked traveling from Russia to America and sighted off
North America (Mate et al., 2015; Weller et al., 2012), which may suggest genetic interchange between
the two populations of North Pacific gray whales and that at least some members of both populations
may share a common winter ground (Swartz, 2018).
Gray whales generally are not deep or long-duration divers. Swartz (2018) noted the maximum dive
depth known for gray whales as 557 ft (170 m), and Stewart et al. (2001) reported a maximum duration
of 13.25 min for gray whales, although Swartz (2018) reported a longer maximum dive duration of 26
min. Typical dives are to water depths of < 98 ft (30 m), with dives to <33 ft (10 m) most common
andmean dive durations of 2.24 min (Stelle et al., 2008; Stewart et al., 2001). Würsig et al. (1986) noted
that during summer, foraging gray whales have dive times as long as 7 min, with a mean dive duration of
4 min. Swim speeds during migration average 2.4 to 4.9 kt (4.5 to 9 kph), and when pursued may reach
8.64 kt (16 kph) (Jones and Swartz, 2009). Gray whales migrating in Canadian waters swum at mean
speeds of 2.5 to 3.2 kt (4.7 to 5.9 kph) (Ford et al., 2013)
Sparse data exist on the hearing sensitivity of gray whales. Ridgway and Carder (2001) attempted to
measure hearing thresholds in a stranded gray whale but were not successful. Dahlheim and Ljungblad
(1990) suggest that free-ranging gray whales are most sensitive to tones between 800 and 1,500 Hz.
Migrating gray whales showed avoidance responses at ranges of several hundred meters to LF playback
SLs of 170 to 178 dB when the source was placed within their migration path at about 1.1 nmi (2 km)
from shore, but this response ceased when the source was moved out of their migration path even
though the received levels remained similar to the earlier condition (Clark et al., 1999). Gray whales
detected and responded to 21 kHz sonar signals, indicating that their hearing range extends at least that
high in frequency (Frankel, 2005).
Gray whales produce a variety of sounds from about 100 Hz to 4 kHz (Swartz, 2018). The most common
sounds recorded during foraging and breeding are knocks and pulses with frequencies from <100 Hz to 2
kHz, with most energy concentrated at 327 to 825 Hz (Richardson et al., 1995). Tonal moans are
produced during migration in frequencies ranging between 100 and 200 Hz (Jones and Swartz, 2009). A
combination of clicks and grunts has also been recorded from migrating gray whales in frequencies
ranging below 100 Hz to above 10 kHz (Frankel, 2018). The SLs for sounds produced by gray whales
range between 167 and 188 dB (Frankel, 2018).
4.1.7 Humpback Whale (Megaptera novaeangliae)
The humpback whale is protected under CITES and is considered least concern as a species by the IUCN
Red List of Threatened Species (Childerhouse et al., 2008; Minton et al., 2008; Reilly et al., 2008f). The
LOA and Rulemaking Application Under the MMPA for Use of SURTASS LFA Sonar
4-10 Status and Distribution
worldwide ESA status of the humpback whale has been revised, with 14 worldwide DPSs identified
(Figure 4-1). Of the 14 DPSs, only five are now listed under the ESA as threatened or endangered: the
Arabian Sea, Cape Verde/Northwest Africa, WNP, and Central America DPSs are listed as endangered
while the Mexico DPS is listed as threatened (NOAA, 2016a). Only one ESA-listed DPS, the WNP, occurs
within the study area for SURTASS LFA sonar (Table 3-1). NMFS has determined that the remaining nine
global DPSs do not currently warrant listing under the ESA and that the protections of the ESA no longer
apply to these nine DPSs (NOAA, 2016a). No critical habitat has been established for the humpback
whale. Further, the SMM (2017) has differentiated Northern and Southern subspecies of humpback
whales (Table 3-1). However, since these subspecies are not differentiated at sea or in available
population data and information, all information about the humpback whale that follows is referenced
at the species rather than subspecies level.
The humpback whale DPSs are based, among other factors, on the locations of humpback whale
breeding grounds (Figure 4-1). In the North Pacific Ocean, four breeding grounds have been identified:
Central America (Costa Rica, Panama, Guatemala, El Salvador, Honduras and Nicaragua), Mexico
(mainland Mexico and Revillagigedos Islands), Hawaii, and the Western North Pacific (Okinawa,
Phliippines, and a third unknown breeding location in the western North Pacific) (Bettridge et al., 2015;
NOAA, 2015b and 2016a). Three breeding areas have been identified in the Indian Ocean: Arabian Sea
(where the population is non-migratory), southeast Africa/Madagascar (including the Seychelles
Islands), and west Australia (NOAA, 2015b and 2016a). Contrastingly, stocks of humpback whales are
identified by geographic areas that include discrete or multiple feeding areas. For instance, in the North
Pacific Ocean, stocks of humpbacks include the California-Oregon-Washington (humpbacks that feed in
the California-Oregon and Washington-British Columbia feeding areas), Central North Pacific (CNP) (with
feeding areas from southeast Alaska to the Alaskan Peninsula), Western North Pacific (feeding areas in
the Aleutian Islands, the Bering Sea, and Russia), and America Samoa (which feeds in the Southern
Ocean along the Antarctic Peninsula) (Carretta et al., 2016). Humpback whales from one DPS may
migrate to feed in more than one feeding areas in varying numbers, meaning that animals from one DPS
may occur in more than one stock. In the North Pacific Ocean, for example, whales in the Hawaii DPS
and CNP stock forage in varying percentages of the DPS or stock in three feeding areas of Alaska during
the summer (Figure 4-2).
The most current estimate of the humpback whale’s global population is based on summing regional
abundances, for an estimated total of 136,582 humpback whales worldwide (IWC, 2016). The population
of humpback whales in the entire North Pacific Ocean is estimated as 21,808 (CV=0.04) whales (Barlow
et al., 2011; Bettridge et al., 2015). In the western and central North Pacific Ocean portion of the study
area for SURTASS LFA sonar, the population of the WNP DPS and stock of humpback whales is estimated
to include 1,328 individuals (Bettridge et al., 2015), while the abundance of the CNP stock and Hawaii
DPS is estimated as 10,103 whales (Calambokidis et al., 2008a; Muto et al., 2018). In the eastern Indian
Ocean, the Western Australia DPS and stock is estimated to include 13,640 individuals (Bannister and
Hedley, 2001).
Humpback whales are distributed throughout the world’s oceans and are only absent from high Arctic
and some equatorial waters, although they occur only rarely in some parts of their former Pacific range,
such as the coastal waters of Korea, and have shown no signs of a recovery in those locations (Gregr,
2000; Gregr et al., 2000). Humpbacks occur both in neritic and pelagic waters, with neritic occurrences
particularly during summer on foraging grounds and during winter when they may be found in waters
close to islands and reef systems (Clapham, 2018). Humpback whales are a highly migratory species that

LOA and Rulemaking Application Under the MMPA for Use of SURTASS LFA Sonar
4-11 Status and Distribution
Figure 4-1. The Worldwide Distinct Population Segments (DPSs) of the Humpback Whale Listed Under the ESA. Four DPSs are Listed as Endangered (Arabian Sea, Cape Verde/Northwest Africa, Central America, and Western North Pacific), while One DPS (Mexico) is
Listed as Threatened and all Other 10 DPSs not Listed Under the ESA. Image Courtesy of NMFS (2016c).
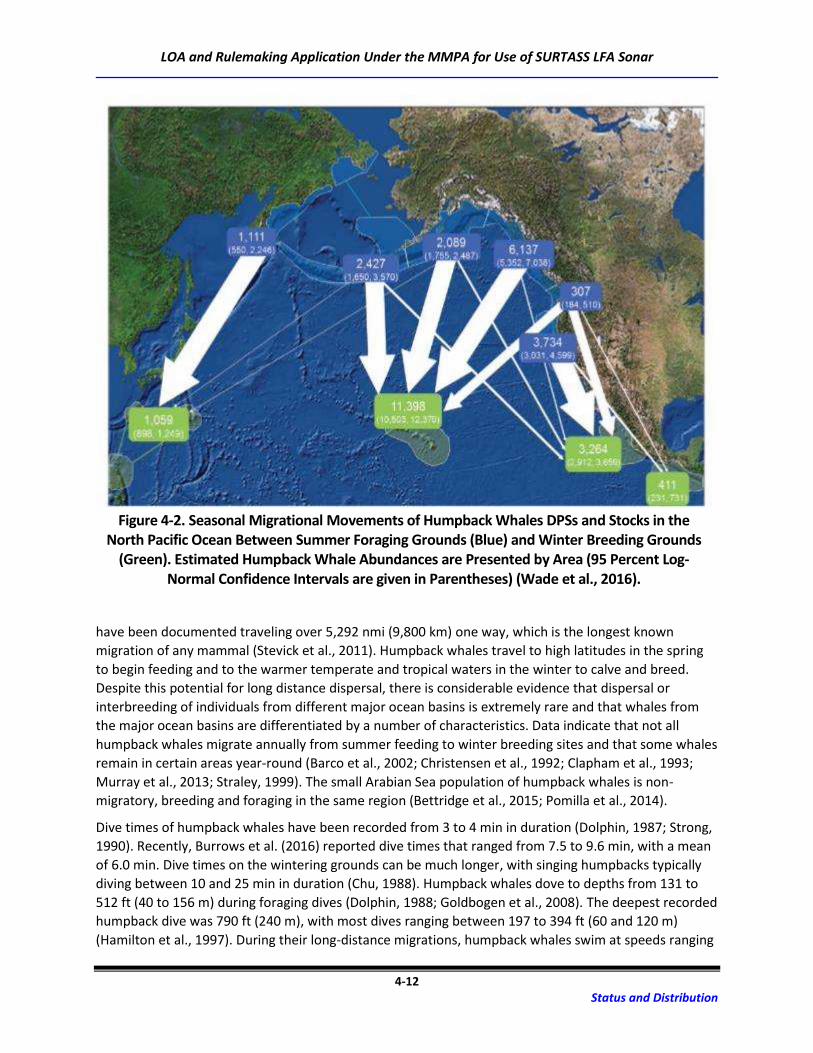
LOA and Rulemaking Application Under the MMPA for Use of SURTASS LFA Sonar
4-12 Status and Distribution
have been documented traveling over 5,292 nmi (9,800 km) one way, which is the longest known
migration of any mammal (Stevick et al., 2011). Humpback whales travel to high latitudes in the spring
to begin feeding and to the warmer temperate and tropical waters in the winter to calve and breed.
Despite this potential for long distance dispersal, there is considerable evidence that dispersal or
interbreeding of individuals from different major ocean basins is extremely rare and that whales from
the major ocean basins are differentiated by a number of characteristics. Data indicate that not all
humpback whales migrate annually from summer feeding to winter breeding sites and that some whales
remain in certain areas year-round (Barco et al., 2002; Christensen et al., 1992; Clapham et al., 1993;
Murray et al., 2013; Straley, 1999). The small Arabian Sea population of humpback whales is non-
migratory, breeding and foraging in the same region (Bettridge et al., 2015; Pomilla et al., 2014).
Dive times of humpback whales have been recorded from 3 to 4 min in duration (Dolphin, 1987; Strong,
1990). Recently, Burrows et al. (2016) reported dive times that ranged from 7.5 to 9.6 min, with a mean
of 6.0 min. Dive times on the wintering grounds can be much longer, with singing humpbacks typically
diving between 10 and 25 min in duration (Chu, 1988). Humpback whales dove to depths from 131 to
512 ft (40 to 156 m) during foraging dives (Dolphin, 1988; Goldbogen et al., 2008). The deepest recorded
humpback dive was 790 ft (240 m), with most dives ranging between 197 to 394 ft (60 and 120 m)
(Hamilton et al., 1997). During their long-distance migrations, humpback whales swim at speeds ranging
Figure 4-2. Seasonal Migrational Movements of Humpback Whales DPSs and Stocks in the North Pacific Ocean Between Summer Foraging Grounds (Blue) and Winter Breeding Grounds
(Green). Estimated Humpback Whale Abundances are Presented by Area (95 Percent Log-Normal Confidence Intervals are given in Parentheses) (Wade et al., 2016).

LOA and Rulemaking Application Under the MMPA for Use of SURTASS LFA Sonar
4-13 Status and Distribution
from 0.7 to 7.7 kt (1.3 to 14.2 kph) (Cerchio et al., 2016; Chaudry, 2006; Chittleborough, 1953; Gabriele
et al., 1996; Guzman and Félix, 2017; Horton et al., 2011; Kennedy et al., 2014). Swim speeds of
humpbacks during dive descent range from 2.4 to 3.9 kt (4.5 to 7.2 kph) while speeds on ascending dives
were 2.9 to 4.9 kt (5.4 to 9 kph) (Dolphin, 1987).
No direct measurements of humpback whale hearing sensitivity exist (Ketten, 2000; Thewissen, 2002).
Due to this lack of auditory sensitivity information, Houser et al. (2001) developed a mathematical
function to describe the frequency sensitivity of humpbacks by integrating the humpback basilar
membrane position with known mammalian data. The results predicted the typical U-shaped audiogram
with sensitivity to frequencies from 700 Hz to 10 kHz with maximum sensitivity between 2 to 6 kHz
(Houser et al., 2001).
Humpbacks produce a great variety of sounds that fall into three main groups: 1) sounds associated with
feeding; 2) social sounds; and 3) songs associated with reproduction. These vocalizations range in
frequency from 20 to 10,000 Hz. Feeding groups produce stereotyped feeding calls ranging from 20 to
2,000 Hz, with dominant frequencies near 500 Hz (Frankel, 2009; Thompson et al., 1986). Feeding calls
were found to have SLs in excess of 175 dB re 1 Pa @ 1 m (Richardson et al., 1995’ Thompson, et al.,
1986). Humpback whales in the Northwest Atlantic Ocean produce “megapclicks”, which are click trains
and buzzes with most of their energy below 2 kHz, with relatively low SLs of 143 to 154 dB re 1 Pa @ 1
m (peak-peak) (Stimpert et al., 2007). “Whup” calls are composed of a short AM growl followed by a
rapid upsweep from 56 to 187 Hz (Wild and Gabriele, 2014). Additional social sounds have been
described that range from 70 Hz to 3.5 kHz, with a mean duration ranging from 0.8 to 16.7 sec (Fournet
et al., 2015; Stimpert et al., 2011). Social sounds in the winter breeding areas are produced by males and
range from 50 Hz to more than 10,000 Hz with most energy below 3,000 Hz (Silber, 1986). Calves
produce short, LF sounds (Zoidis et al., 2008). Dunlop et al. (2007) reported 34 types of calls from
migrating humpbacks ranging from 30 Hz to 2.4 kHz and between 0.2 and 2.5 sec in duration, with 21 of
these call types being incorporated into songs; the median source level of these social sounds is 158 dB
re 1 µPa (Dunlop et al., 2013).
During the breeding season, males sing long, complex songs with frequencies between 25 Hz and 5 kHz,
with mean SLs of ~165 dB re 1 Pa @ 1 m (broadband) (Au et al., 2006; Frankel et al., 1995; Payne and
McVay, 1971). The songs vary geographically among humpback populations and appear to have an
effective range of approximately 5.4 to 10.8 nmi (10 to 20 km) (Au et al., 2000). Singing males are
typically solitary and maintain spacing of 2.7 to 3.2 nmi (5 to 6 km) from one another (Frankel et al.,
1995; Tyack, 1981). Songs have been recorded on the wintering ground, along migration routes, and less
often on feeding grounds (Clapham and Mattila, 1990; Clark and Clapham, 2004; Gabriele and Frankel,
2002; Magnúsdóttir et al., 2014; Stanistreet et al., 2013; Van Opzeeland et al., 2013; Vu et al., 2012).
Gabriele and Frankel (2002) reported that humpback whales sing more frequently in the late summer
and early fall than previously observed.
4.1.8 North Pacific Right Whale (Eubalaena japonica)
The North Pacific right whale is listed as endangered under the ESA, depleted under the MMPA,
protected under CITES, and as a species, is classified as endangered under the IUCN Red List of
Threatened Species, although the ENP stock is classified as critically endangered (Reilly et al., 2008i).
Two stocks or populations of North Pacific right whales have been identified, with the ENP stock
encompassing right whales found in the Gulf of Alaska and the Bering Sea while the WNP stock consists
of right whales occurring in the Commander Islands, off the coast of Kamchatka, the Kuril Islands, and in
LOA and Rulemaking Application Under the MMPA for Use of SURTASS LFA Sonar
4-14 Status and Distribution
the Sea of Okhotsk (Brownell et al., 2001; LeDuc et al., 2012). No overall population estimate for North
Pacific right whales is available, but likely, less than 1,000 North Pacific right whales are currently living,
as the population of ENP right whales is very small, with only 31 whales estimated (Wade et al, 2011;
Muto et al., 2018). The WNP stock occurs within the study area for SURTASS LFA sonar and is estimated
to include 922 individuals (Best et al., 2001).
Since so few North Pacific right whales exist, little information generally about the species is available.
North Pacific right whales regularly occur only in the Sea of Okhotsk and the southeastern Bering Sea
with very rare occurrences documented in the Gulf of Alaska, Sea of Japan (off South Korea), and North
Pacific waters around the Ogasawara and Kuril islands; Hokkaido, Japan; and offshore Kamchatka
(Jefferson et al., 2015; NMFS, 2018c; Sekiguchi et al., 2014). Since 2013, two North Pacific right whales
have been reported off Hokkaido (one entangled) and one right whale was documented off South Korea,
which was the first observation of this species in the Sea of Japan in 41 years (NMFS, 2018c). Thode et
al. (2017) estimated that the source depth of North Pacific right whale vocalizations ranged from near
the surface to as deep as 82 ft (25 m), water depths consistent with dive patterns of North Atlantic right
whales. Dive durations ranged from 41 to 726 sec {Crance, 2017). No swim speed information is
available for the North Pacific right whale except that they are known to be slow swimmers.
There is no direct measurement of the hearing sensitivity of right whales (Ketten, 2000; Thewissen,
2002). However, thickness measurements of the basilar membrane of North Atlantic right whale
suggests a hearing range from 10 Hz to 22 kHz, based on established marine mammal models (Parks et
al., 2007); this same range can be used as a proxy for North Pacific right whales. McDonald and Moore
(2002) studied the vocalizations of North Pacific right whales in the eastern Bering Sea using
autonomous seafloor-moored recorders and described five vocalization categories: up-calls, down-up
calls, down calls, constant calls, and unclassified vocalizations. The up-call was the predominant type of
vocalization and typically swept from 90 to 150 Hz, while the down-up call swept down in frequency for
10 to 20 Hz before it became a typical up call, and the down and constant calls were typically
interspersed with up calls (McDonald and Moore, 2002). Constant calls were also subdivided into two
categories: single frequency tonal or a frequency waver of up and down, which varied by approximately
10 Hz; the down and constant calls were lower in frequency than the up calls, averaging 118 Hz for the
down call and 94 Hz for the constant call (McDonald and Moore, 2002). Munger et al. (2011) reported
the SL of North Pacific right whale upcalls to be averaged from 176 to 178 dB re 1Pa @ 1 m, with a
frequency range of 90 to 170 Hz. Crance (2017) reported a sixth type of North Pacific right whale
vocalization termed gunshots, which is an impulsive signal ranging from 50 Hz to 5.5 kHz with an
average duration of 0.3 sec.
4.1.9 Omura’s Whale (Balaenoptera omurai)
Omura’s whales have only recently been described and were previously known as a small form of
Bryde’s whale (Wada et al., 2003). The Omura’s whale is considered data deficient by the IUCN Red List
of Threatened Species (Reilly et al., 2008g). The IWC recognizes the Omura’s whale but has not yet
defined stocks or estimated its population, and no global abundance of Omura’s whales exists. The only
abundance estimate that relates to Omura’s whale is that derived by Ohsumi (1980) for what he
characterized at the time as unusually small Bryde’s whales in the Solomon Islands. At least part of the
whales Ohsumi (1980) identified as small Bryde’s whales in the Solomon Islands have now been shown
through genetic analysis to have been Omura’s whales (Sasaki et al., 2006; Wada et al., 2003). Thus,
while not ideal, given the paucity of data currently available for this species, Ohsumi’s (1980) estimate of
1,800 individuals is the only and best available estimate of Omura’s whales in the WNP stock. The

LOA and Rulemaking Application Under the MMPA for Use of SURTASS LFA Sonar
4-15 Status and Distribution
Northern Indian Ocean stock of Omura’s whales that occurs in the Andaman Sea area has been
estimated to include 9,176 individuals (IWC, 2016; Wade and Gerrodette, 1993), while the Southern
Indian Ocean is estimated to number 13,854 individuals (IWC, 1981).
Omura’s whales have a very limited Indo-Pacific distribution in tropical and subtropical neritic and
oceanic waters, primarily occurring only in the western North Pacific Ocean from the Sea of Japan
southward to eastern Australia, and in the Indian Ocean, primarily off Western Australia but with
confirmed sightings off Sri Lanka and Madagascar (Aragones et al., 2010; Cerchio and Yamada, 2018;
Cerchio et al., 2015; Reilly et al., 2008g; Wada et al., 2003), although the geographic range is not well
established. No information is available on the migratory behavior of Omura’s whales. The presence of
mothers and calfs in northwestern Madagascar waters suggested to Cerchio et al. (2015) that the area
was a breeding and calving area. Swim speeds and dive behavior characteristics have not yet been
documented for the Omura’s whale.
Hearing has not been measured in the Omura’s whale, but Omura’s whales are classified as LF hearing
specialists, presumably capable of hearing sound within the range of 7 Hz to 22 kHz (Southall et al.,
2007). Omura’s whales have been recorded producing long (mean duration = 9.2 sec), broadband, AM
calls with energy concentrated in the 15 to 50 Hz band, with a rhythmic sequence with 2-3 min intervals
between utterances (Cerchio et al., 2015). Cerchio and Yamada (2018) reported that the Omura’s calls
to be rhythmically repeated at 130 to 180 sec intervals, suggestive of a song display, with singing
documented to last up to 12 hr without pause, and five to six singers being audible on single
hydrophones.
4.1.10 Sei Whale (Balaenoptera borealis)
The sei whale is listed as endangered under the ESA, depleted under the MMPA, protected under CITES,
and as endangered by the IUCN Red List of Threatened Species (Reilly et al., 2008h). The SMM (2017)
has differentiated Northern and Southern subspecies of sei whales (Table 3-1). While the Navy
recognizes this taxonomy, the subspecies are not differentiated at sea or in the available population
data and information. Accordingly, all subsequent information presented herein about the sei whale is
referenced only to the species level. The global population for the sei whale has been estimated by the
IUCN to include 31,600 individuals (Reilly et al., 2008h) while Jefferson et al. (2015) reported a
population as large as 80,000 whales. The population of the Hawaii stock of sei whales is estimated as
391 whales (CV=0.9) (Bradford et al., 2017), while the the North Pacific stock is estimated to include
7,000 whales (Mizroch et al., 2015; Tillman, 1977). The Indian Ocean stock of sei whales is estimated as
13,854 whales (IWC, 1981).
Sei whales occur in temperate, oceanic waters of all world oceans, occurring very uncommonly in neritic
waters, the Mediterranean Sea, and in equatorial waters (Horwood, 2018; Jefferson et al., 2015). The sei
whale is migratory, seasonally traveling between low latitude calving grounds to high latitude foraging
grounds, although these migrations may not be as extensive as that of other mysticetes (Jefferson et al.,
2015). Specific breeding grounds are not known for this species, although the waters off northwest
Africa have been suggested for North Atlantic sei whales (Prieto et al., 2014).
Ishii et al. (2017) documented U- and V-shaped dives of foraging sei whales and noted that they dove no
deeper than 187 ft (57 m) during the day and to no more than 40 ft (12.2 m) at night, with maximum
durations of 12 min. Dive times of sei whales range from 0.75 to 15 min, with a mean duration of 1.5
min (Schilling et al., 1992). When foraging, sei whales make shallow dives of 65 to 100 ft (20 to 30 m),
followed by a deep dive up to 15 min in duration (Gambell, 1985). Sei whales are fast swimmers,
LOA and Rulemaking Application Under the MMPA for Use of SURTASS LFA Sonar
4-16 Status and Distribution
surpassed only by blue whales (Sears and Perrin, 2009). Swim speeds have been recorded at 2.5 kt (4.6
kph), with a maximum speed of 14.8 kt (27.4 kph) (Brown, 1977; Olsen et al.; 2009). Prieto et al. (2014)
reported that the mean swim speeds of satellite-tagged sei whales during migration were 3.3 to 4 kt (6.2
to 7.4 kph) and an “off-migration” speed was measured as 3.2 kt (6 kph). Ishii et al. (2017) measured
mean swimming speeds of 1.9 to 2.7 kt (3.6 to 5 kph) for two sei whales.
No direct measurements of sei whale hearing sensitivity exist (Ketten, 2000; Thewissen, 2002). Sei whale
vocalizations are the least studied of all the rorquals. Rankin and Barlow (2007) recorded sei whale
vocalizations in Hawai‘i and reported that all vocalizations were downsweeps, ranging from on average
from 100.3 to 446 Hz for “high frequency” calls and from 39.4 to 21.0 Hz for “low frequency” calls. In
another study, McDonald et al., (2005) recorded sei whales in Antarctica with an average call frequency
of 433 Hz. A series of sei whales FM calls have been recorded south of New Zealand with a frequency
range of 34 to 87 Hz and a duration of 0.4 to 1.7 sec (Calderan et al., 2014).
4.2 Odontocetes
Five families containing 33 species/species groups (31 species, 2 species groups) of odontocete
cetaceans have been assessed for potential impacts due to the use of SURTASS LFA sonar. Odontocetes
can be distinguished from mysticetes by the presence of functional teeth and a single blowhole.
Odontocetes have a broad acoustic range, with mid-frequency cetaceans hearing between 150 Hz and
160 kHz and high-frequency cetaceans hearing between 260 Hz and 160 kHz (NMFS, 2016). Many
odontocetes produce a variety of click and tonal sounds for communication and echolocation purposes
(Au, 1993). Odontocetes communicate mainly above 1,000 Hz and produce echolocation signals as high
as 160 kHz (Würsig and Richardson, 2009).
4.2.1 Baird’s Beaked Whale (Berardius bairdii)
The Baird’s beaked whales is currently classified as data deficient under the IUCN Red List of Threatened
Species (Taylor et al., 2008a). The abundance of the global population size is unknown. The abundance
of Baird’s beaked whale in the WNP stock has been estimated as 5,688 individuals (Kasuya and Perrin,
2017; Miyashita, 1986 and 1990).
Baird’s beaked whales occur in the North Pacific, including the Bering and Okhotsk seas (Kasuya, 1986;
Kasuya, 2009) and off California (Yack et al., 2013) and inhabit deep water and appear to be most
abundant at areas of steep topographic relief such as shelf breaks and seamounts (Dohl et al., 1983;
Kasuya, 1986; Leatherwood et al., 1988). Baird’s beaked whales were documented as having an inshore-
offshore movement off California beginning in July and ending in September to October (Dohl et al.,
1983). Ohizumi et al. (2003) reported that Baird’s beaked whales migrate to the coastal waters of the
western North Pacific and the southern Sea of Okhotsk in the summer.
Baird’s beaked whales were recorded diving between 15 and 20 min, with a maximum dive duration of
67 min (Barlow, 1999; Kasuya, 2009). In a recent study, a Baird’s beaked whale in the western North
Pacific had a maximum dive time of 64.4 min and a maximum depth of 5,830 ft (1,777 m). It was also
found that one deep dive (>3,280 ft [>1,000 m]) was followed by several intermediate dives (328 to
3,280 ft [100 to 1,000 m]) (Minamikawa et al., 2007). Few swim speed data are available for any beaked
whale species.
Direct measurements of Baird’s beaked whale hearing sensitivity have not been measured (Ketten,
2000; Thewissen, 2002). Baird’s beaked whales have been recorded producing HF sounds between 12

LOA and Rulemaking Application Under the MMPA for Use of SURTASS LFA Sonar
4-17 Status and Distribution
and 134 kHz with dominant frequencies between 23 to 24.6 kHz and 35 to 45 kHz (Dawson et al., 1998).
This species produces a variety of sounds, mainly burst-pulse clicks and FM whistles. The functions of
these signal types are unknown. Clicks and click trains were heard sporadically throughout the recorded
data, which may suggest that these beaked whales possess echolocation abilities. There is no available
data regarding seasonal or geographical variation in the sound production of these species and no
estimated SLs are documented.
4.2.2 Common Bottlenose Dolphin (Tursiops truncatus)
Overall, the common bottlenose dolphin is classified as least concern (lower risk) by the IUCN. The
global population for the bottlenose dolphin is unknown. The abundance of common bottlenose dolpins
in the WNP Northern Offshore stock, which includes bottlenose dolphins in the area of the WNP
bounded by 30° N, 145°E to 180°E, is estimated as 100,281 dolphins (Kasuya and Perrin, 2017;
Miyashita, 1993). The population of the WNP Southern Offshore stock of bottlenose dolphins, found in
the area between 23° to 30° N, 127°to 180° E, has been estimated to include 40,769 dolphins (Kanaji et
al., 2018). Common bottlenose dolphins occurring in Pacific coastal waters of Japan are part of the
Japanese Coastal stock, which is estimated to include 3,516 dolphins (Kanaji et al., 2018). The Inshore
Archipelago stock of common bottlenose dolphins that occurs in the Asian continental seas includes
105,138 dolphins (Miyashita, 1986 and 1993). The Hawaii population of pelagic common bottlenose
dolphins includes 21,815 individuals (CV=0.57) (Bradford et al., 2017); while the insular Hawaiian stocks
of common bottlenose dolphins include an estimated 184 dolphins in the Kaua‘i/Ni‘ihau stock, 743
individuals in the O‘ahu stock, 191 dolphins in the 4-Island stock, and 128 individuals in the Hawaii Island
stock (Baird et al., 2009; Carretta et al., 2014). The population of common bottlenose dolphins in the
North Indian Ocean stock is estimated as 785,585 dolphins (Wade and Gerrodette, 1993), while 3,000
common bottlenose dolphins may occur in the waters of Western Australia (Preen et al., 1997).
The bottlenose dolphin is distributed worldwide in temperate to tropical waters. In North America, they
inhabit waters with temperatures ranging from 50 to 89°F (10 to 32C) (Wells and Scott, 2009). Common
bottlenose dolphins are primarily found in coastal waters, but they also occur in diverse habitats ranging
from rivers and protected bays to oceanic islands and the open ocean, over the continental shelf, and
along the shelf break (Scott and Chivers, 1990; Sudara and Mahakunayanakul, 1998; Wells and Scott,
2009). Seasonal movements vary between inshore and offshore locations and year-round home ranges
(Croll et al., 1999; Wells and Scott, 2009). Calving season is generally year-round with peaks occurring
from early spring to early fall (Scott and Chivers, 1990). There are no known breeding grounds.
Dive times for bottlenose dolphins range from 38 sec to 1.2 min, with dives having been recorded to last
as long as 10 min (Croll et al., 1999; Mate et al., 1995). The dive depth of a bottlenose dolphin in Tampa
Bay, Florida, was measured at 322 ft (98 m) (Mate et al., 1995). Wild offshore bottlenose dolphins were
reported to dive to depths greater than 1,476 ft (450 m) (Klatsky et al., 2007). The deepest dive
recorded for a bottlenose dolphin is 1,755 ft (535 m) by a trained individual (Ridgway, 1986). Sustained
swim speeds for bottlenose dolphins range between 2.2 and 10.8 kt (4 and 20 kph) and may reach
speeds as high as 29 kt (54 kph) (Lockyer and Morris, 1987).
Bottlenose dolphins hear underwater sounds in the range of 150 Hz to 135 kHz (Johnson, 1967;
Ljungblad et al., 1982). Their best underwater hearing occurs between 15 to 110 kHz, where the
threshold level range is 42 to 52 dB RL (Au, 1993). The range of highest sensitivity occurs between 25
and 70 kHz, with peaks in sensitivity at 25 and 50 kHz (Nachtigall et al., 2000). Bottlenose dolphins also
have good sound location abilities and are most sensitive when sounds arrive directly towards the head
LOA and Rulemaking Application Under the MMPA for Use of SURTASS LFA Sonar
4-18 Status and Distribution
(Richardson et al., 1995). Bottlenose dolphins are able to voluntarily reduce their hearing sensitivity to
loud sounds (Nachtigall and Supin, 2015).
Bottlenose dolphins produce sounds as low as 50 Hz and as high as 150 kHz with dominant frequencies
at 0.3 to 14.5 kHz, 25 to 30 kHz, and 95 to 130 kHz (Croll et al., 1999; dos Santos et al., 1990; Johnson,
1967; McCowan and Reiss, 1995; Oswald et al., 2003; Popper, 1980; Schultz et al., 1995). The maximum
SL reported is 228 dB (Croll et al., 1999). Bottlenose dolphins produce a variety of whistles, echolocation
clicks, low-frequency narrow, “bray” and burst-pulse sounds. Echolocation clicks with peak frequencies
from 40 to 130 kHz are hypothesized to be used in navigation, foraging, and predator detection (Au,
1993; Houser et al., 1999; Jones and Sayigh, 2002). According to Au (1993), sonar clicks are broadband,
ranging in frequency from a few kilohertz to more than 150 kHz, with a 3 dB bandwidth of 30 to 60 kHz
(Croll et al., 1999). The echolocation signals usually have a 50 to 100 msec duration with peak
frequencies ranging from 30 to 100 kHz and fractional bandwidths between 10 and 90 percent of the
peak frequency (Houser et al., 1999). Burst-pulses, or squawks, are commonly produced during social
interactions. These sounds are broadband vocalizations that consist of rapid sequences of clicks. Inter-
click intervals (ICIs) vary to form different types of click patterns such as 1) low-frequency clicks that
have no regular repeating interval; 2) train clicks (ICI = 35-143 msec); 3) Packed clicks (ICI = 2-6 msec);
and 4) Burst, with an ICI of 1.7 to 4.9 msec, with more clicks than a packed click train (Buscaino et al.,
2015). Burst-pulse sounds are typically used during escalations of aggression (Croll et al., 1999). Whistles
range in frequency from 1.5 to 23 kHz and have durations up to 4 seconds (Díaz López, 2011; Gridley et
al., 2015). Each individual bottlenose dolphin has a fixed, unique FM pattern, or contour whistle called a
signature whistle. These signal types have been well studied and are used for recognition, but may have
other social contexts (Janik et al., 2013; Jones and Sayigh, 2002; Kuczaj et al., 2015). Signature whistles
have a narrow-band sound with the frequency commonly between 4 and 20 kHz, duration between 0.1
and 3.6 seconds, and an SL of 125 to 140 dB (Croll et al., 1999).
4.2.3 Common Dolphin (Delphinus delphis delphis) and Indo-Pacific Common Dolphin (D. d.
tropicalis)
SMM (2017) has recently resolved and revised the complex taxonomy of the common dolphin, which it
had formerly divided into multiple subspecies. Although the Indo-Pacific common dolphin is retained as
a subspecies, the SMM no longer recognizes the long-beaked and short-beaked subspecies of common
dolphins—these species are now simply the common dolphin. Thus, in this SEIS/SOEIS, we include two
species of common dolphins: the common dolphin and the Indo-Pacific common dolphin. The Indo-
Pacific common dolphin is essentially a long-beaked variant that occurs in the Indian Ocean (SMM,
2017). However, the characterizations that define the two species are difficult to assess at sea, and until
recently, at-sea observations only reported “common” dolphins generically. Since little information is
known to the species level, information that follows refers to both subspecies of common dolphins.
The common dolphin is classified as a least concern (lower risk) species by the IUCN. The global
population for all common dolphin species is unknown. In the WNP stock, 3,286,163 common dolphins
are estimated (Ferguson and Barlow, 2001 and 2003), while 1,819,882 common and Indo-Pacific
common dolphins are estimated to occur in the Indian Ocean (Wade and Gerrodette, 1993).
Common dolphins are widely distributed worldwide in temperate, tropical, and subtropical oceans,
primarily in neritic waters of the continental shelf and steep bank regions where upwelling occurs
(Jefferson et al. 2015; Perrin, 2009b). These dolphins seem to be most common in the coastal waters of
the Pacific Ocean, often occurring within 97.2 nmi (180 km) of land (Jefferson et al., 2015

LOA and Rulemaking Application Under the MMPA for Use of SURTASS LFA Sonar
4-19 Status and Distribution
Dive depths range between 30 and 656 ft (9 and 200 m), with a majority of dives 30 to 164 ft (9 to 50 m)
(Evans, 1994). The deepest dive recorded for these species was 850 ft (260 m) (Evans, 1971). The
maximum dive duration has been documented at 5 min (Heyning and Perrin, 1994). Swim speeds for
Delphinus spp. have been measured at 3.1 kt (5.8 kph) with maximum speeds of 8.7 kt (16.2 kph); but in
other studies, common dolphins have been recorded swimming up to 20 kt (37.1 kph) (Croll et al., 1999;
Hui, 1987). Off California, common dolphins averaged speeds of 29 kt (9 kph) (Wiggins, 2013).
Very little is known about hearing in common dolphins. Popov and Klishin (1998) measured the hearing
threshold of a common dolphin by auditory brainstem response and discovered an U-shaped audiogram
with a steeper high-frequency branch and an auditory range from 10 to 150 kHz, with greatest
sensitivity between 60 and 70 kHz; it should be noted that the dolphin was ill, died while in captivity,
and testing appears to have been conducted on the dead animal. Aroyan (2001) modeled three-
dimensional hearing in the common dolphin to elucidate the hearing processes and reported tissue-
borne sound reception channels in the head of the common dolphin with the suggestion that the lower
jaw exhibits strongly directional reception. Common dolphins produce sounds as low as 0.2 kHz and as
high as 150 kHz, with dominant frequencies at 0.5 to 18 kHz and 30 to 60 kHz (Au, 1993; Moore and
Ridgway, 1995; Popper, 1980]; Watkins, 1967). Signal types consist of clicks, squeals, whistles, and
creaks (Evans, 1994). Whistles of short-beaked common dolphins range between 3.5 and 23.5 kHz
(Ansmann et al., 2007), while the whistles of long-beaked common dolphins ranges from 7.7 to 15.5 kHz
(Oswald et al., 2003). Most of the energy of echolocation clicks is concentrated between 15 and 100 kHz
(Croll et al., 1999). The maximum peak-to-peak SL of common dolphins is 180 dB. In the North Atlantic,
the mean SL was approximately 143 dB with a maximum of 154 (Croll et al., 1999). There are no
available data regarding seasonal or geographical variation in the sound production of common
dolphins.
4.2.4 Cuvier’s Beaked Whale (Ziphius cavirostris)
Cuvier’s beaked whale is currently classified as a least concern (lower risk) species by the IUCN Red List
of Threatened Specie (Taylor et al., 2008b). No global population estimate for this species is known.
Abundances of Cuvier’s beaked whales are estimated as 90,725 whales in the WNP stock (Ferguson and
Barlow, 2001 and 2003) and as 723 individuals (CV=0.69) for the Hawaii stock (Bradford et al., 2017). The
population of Cuvier’s beaked whales in the Southern Hemisphere is estimated as 76,500 individuals
(Dalebout et al., 2005), of which27,222 individuals are estimated to occur in the northern Indian Ocean
(Wade and Gerrodette, 1993).
The Cuvier’s beaked whale is the most cosmopolitan of all beaked whale species. Except for the high
Arctic and Antarctic waters, Cuvier’s beaked whales are widely distributed in tropical to polar oceanic
waters of all oceans and major seas, including the Gulf of Mexico, Gulf of California, Caribbean Sea,
Mediterranean Sea, Sea of Japan, and Sea of Okhotsk (Heyning and Mead, 2009; Jefferson et al., 2008;
Omura et al., 1955). No data on breeding and calving grounds are available.
Dive durations range between 20 and 87 min with an average dive time near 30 min (Baird et al., 2004;
Heyning, 1989; Jefferson et al., 1993). This species is a deep diving species) (Heyning and Mead, 2009).
Schorr et al. (2014) reported a maximum dive depth of 9,816 ft (2,992 m) that lasted 137.5 min. In the
Caribbean Sea, Cuvier’s beaked whales performed dives to a mean depth of 3,868 ft (1,179 m) and mean
dive duration of 65.4 min, with non-foraging dives as deep as ~ 1,640 ft (500 m) over 40 min, and
foraging dives ranging between 2,297 to 6,234 ft (700 and 1900 m) over 3- to 100 min (Joyce et al.,
2017). Joyce et al. (2017) also reported that Cuvier’s beaked whales exhibited long recovery times (or

LOA and Rulemaking Application Under the MMPA for Use of SURTASS LFA Sonar
4-20 Status and Distribution
inter-dive intervals) with a median of 68 min at the surface between dive bouts (Joyce et al. 2017).
Shallow and deep dive times for Cuvier’s beaked whales in the waters of southern California waters
were reported to have durations of ~ 20 min and ~ 60 min, respectively (Falcone et al., 2017). Swim
speeds of Cuvier’s beaked whale have been recorded between 2.7 and 3.3 kt (5 and 6 kph) (Houston,
1991).
Hearing sensitivity of Cuvier’s beaked whales has not been measured (Ketten, 2000; Thewissen, 2002).
Cuvier’s beaked whales were recorded producing HF clicks between 13 and 17 kHz; since these sounds
were recorded during diving activity, the clicks were assumed to be associated with echolocation
(Frantzis et al., 2002). Johnson et al. (2004) recorded frequencies of Cuvier’s clicks ranging from about
12 to 40 kHz with associated SLs of 200 to 220 dB re 1 µPa @ 1 m (peak-to-peak). Johnson et al. (2004)
also found that Cuvier’s beaked whales do not vocalize when within 656 ft (200 m) of the surface and
only started clicking at an average depth of 1,558 ft (475 m) and stopped clicking on the ascent at an
average depth of 2,789 ft (850 m) with click intervals of approximately 0.4 sec. Zimmer et al. (2005a)
also studied the echolocation clicks of Cuvier’s beaked whales and recorded a SL of 214 dB re 1 µPa @ 1
m (peak-to-peak). There are no available data regarding seasonal or geographical variation in the sound
production of Cuvier’s beaked whales.
4.2.5 Dall’s Porpoise (Phocoenoides dalli)
Dall's porpoises are separated taxonomically into two subspecies: the truei-type and the dalli-type, with
both subspecies occurring in the study area for SURTASS LFA sonar. Dall’s porpoise is considered least
concern under the IUCN. The total population of Dall’s porpoise is estimated at 1.2 million (Jefferson et
al., 2015). The population of the WNP truei subspecies of the Dall’s porpoise is estimated as 178,157
individuals (Kasuya and Perrin, 2017; Miyashita, 2007), while the Sea of Japan and WNP dalli populations
are estimated to include 173,638 porpoises (IWC, 2008) and 162,000 porpoises (Kasuya and Perrin,
2017; Miyashita, 2007), respectively.
The Dall’s porpoise is found exclusively in the North Pacific Ocean and adjacent seas (Bering Sea,
Okhotsk Sea, and Sea of Japan) from about Baja California to Japan in the south and Bering Sea to the
north (Jefferson et al., 2015). Although this oceanic species is primarily found in deep oceanic waters
from 30°N to 62°N or in areas where deepwater occurs close to shore, it has been observed in the
inshore waters of Washington, British Columbia, and Alaska (Jefferson et al., 2015). Distribution in most
areas is very poorly defined (Jefferson, 2009a).
Dall’s porpoises are relatively deep divers, diving to 900 ft (275 m) for as long as 8 min (Hanson et al.,
1998; Ridgway, 1986). Thought to be one of the fastest swimming of the small cetaceans (Croll et al.,
1999; Jefferson, 2009b), Dall’s porpoise’s average swim speeds between 1.3 and 11.7 kt (2.4 and 21.6
kph). Swim speeds are dependent on the type of swimming behavior (slow rolling, fast rolling, or
rooster-tailing) (Croll et al., 1999), but Dall’s porpoises may reach speeds of 29.7 kt (55 kph) for quick
bursts (Leatherwood and Reeves, 1983).
There is no direct measurement of the hearing sensitivity of Dall’s porpoises (Ketten, 2000; Thewissen,
2002). It has been estimated that the reaction threshold of Dall’s porpoise for pulses at 20 to 100 kHz is
about 116 to 130 dB RL, but higher for pulses shorter than one millisecond or for pulses higher than 100
kHz (Hatakeyama et al., 1994).
Dall’s porpoises produce sounds as low as 40 Hz and as high as 160 kHz (Awbrey et al., 1979; Evans and
Awbrey, 1984; Evans and Maderson, 1973; Hatakeyama et al., 1994; Hatakeyama and Soeda, 1990;
LOA and Rulemaking Application Under the MMPA for Use of SURTASS LFA Sonar
4-21 Status and Distribution
Ridgway, 1966) and can emit LF clicks in the range of 40 Hz to 12 kHz (Awbrey et al., 1979; Evans, 1973).
Narrow band high frequency clicks are also produced with energy concentrated around 120 to 141 kHz
with a duration of 35 to 251 sec (Au, 1993; Kyhn et al., 2013). Their maximum peak-to-peak SL is 175
dB (Evans, 1973; Evans and Awbrey, 1984). Dall’s porpoise do not whistle very often.
4.2.6 Dwarf Sperm Whale (Kogia sima) and Pygmy Sperm Whale (Kogia breviceps)
Both the pygmy sperm whale and dwarf sperm whale are listed as data deficient under the IUCN Red
List of Threatened Species (Taylor et al., 2012 and 2013). Abundance estimates of the global population
sizes for these species are unknown. Population estimation by species is difficult as due to difficulty in
distinguishing these species at sea, data for both species are typically combined. Where possible,
population data by species are presented herein. The population of both species (Kogia spp.) combined
and individually in the WNP stocks has been estimated as 350,553 whales (Ferguson and Barlow, 2001
and 2003). The Hawaii stocks of the dwarf sperm whale and pygmy sperm whale are estimated as
17,519 individuals and 7,138 individuals, respectively (Barlow, 2006; Carretta et al., 2014). The Indian
Ocean stocks of pygmy and dwarf sperm whales are estimated to number 10,541 individuals (Wade and
Gerrodette, 1993).
Pygmy and dwarf sperm whales are distributed worldwide, primarily in temperate to tropical deep
waters, and are especially common in waters along continental shelf breaks (Evans, 1987; Jefferson et
al., 2008). Dwarf sperm whales seem to prefer warmer water than the pygmy sperm whale (Caldwell
and Caldwell, 1989). Little evidence exists for seasonal movements in either species (McAlpine, 2009).
In the Gulf of California, Kogia spp. have been recorded with an average dive time of 8.6 min, whereas
dwarf sperm whales in the Gulf of California exhibited a maximum dive time of 43 min (Breese and
Tershy, 1993). Swim speeds vary and were found to reach up to 5.9 kt (11 kph) (Scott et al., 2001).
Sparse data exist on the hearing sensitivity of pygmy sperm whales and no data on the hearing
sensitivity of the dwarf sperm whale have been measured. An auditory brainstem response study on a
rehabilitating pygmy sperm whale indicated an underwater hearing range with greatest sensitive
between 90 and 150 kHz (Carder et al., 1995; Ridgway and Carder, 2001).
Recordings of captive pygmy sperm whales show they produce sounds between 60 and 200 kHz with
peak frequencies at 120 to 130 kHz (Carder et al., 1995; Ridgway and Carder, 2001; Santoro et al., 1989).
Echolocation pulses of pygmy sperm whales were documented with peak frequencies at 125 to 130 kHz
(Ridgway and Carder, 2001). Thomas et al. (1990a) recorded an LF swept signal between 1.3 to 1.5 kHz
from a captive pygmy sperm whale in Hawaii. Jérémie et al. (2006) reported frequencies ranging from 13
to 33 kHz for dwarf sperm whale clicks with durations of 0.3 to 0.5 sec. Merkens et al. (2018) recently
reported that the sounds produced by captive and free-ranging dwarf sperm whales were very similar to
those of pygmy sperm whales, and were characterized as narrow-band, HF clicks with mean frequencies
from 127 to 129 kHz and inter-click intervals of 110 to 164 msec.
4.2.7 False Killer Whale (Pseudorca crassidens)
False killer whales are classified as least concern (lower risk) by the IUCN. Three populations of false
killer whales have been identified in Hawaiian waters, but only the Main Hawaiian Island Insular DPS of
false killer whales is listed under the ESA as endangered and depleted under the MMPA (NOAA, 2012b).
The populations of false killer whales occurring in the insular waters of the Hawaiian Islands have been
shown to be genetically and behaviorally distinct from false killer whales found in oceanic or offshore
waters (Chivers et al., 2010; Martien et al., 2011; NOAA, 2012b). The boundaries between the Hawaiian

LOA and Rulemaking Application Under the MMPA for Use of SURTASS LFA Sonar
4-22 Status and Distribution
Island populations of false killer whales are complex and overlapping. The areal extent of the Main
Hawaiian Island Insular DPS of false killer whales is a 39-nmi (72-km) radius around the Main Hawaiian
Islands, with the offshore extent of the DPS’ outer boundary connected on the leeward sides of Hawaii
Island and Niihau to encompass the offshore movements of Main Hawaiian Islands Insular DPS false
killer whales within that region (Carretta et al., 2015). In comparison to other populations of false killer
whales, the Main Hawaiian Islands Insular DPS is characterized by a very low abundance and very high
density, suggesting that either the nearshore habitat used by these whales is highly productive or these
whales employ an unique habitat-use strategy that supports a high density of false killer whales (Oleson
et al., 2010; Wearmouth and Sims, 2008).
Critical habitat has been designated for the Main Hawaiian Island Insular DPS of the false killer whale
(NOAA, 2018). The critical habitat for the Main Hawaiian Islands DPS of false killer whales includes
waters from the 148- to 10,499-ft (45-to 3,200-m) depth contours around the Main Hawaiian Islands
from Niihau east to Hawaii; some Navy and other federal agency areas, such as the Pacific Missile Range
Facility offshore ranges, are excluded from the critical habitat designation (NOAA, 2018).
The global population for the false killer whale is unknown. Estimates of 16,668 whales have been
documented in the northwestern Pacific (Miyashita, 1993) and 9,777 whales have been estimated in the
Inshore Archipelago stock of the Asian continental seas (Miyashita, 1986). In Hawaiian waters, false killer
whale populations have been estimated as 1,540 whales (CV=0.66) in the Hawaii pelagic population, 617
whales (CV=1.11) in the Northwestern Hawaiian Islands DPS, and 167 whales in the Main Hawaiian
Islands Insular DPS (Bradford et al., in review; Muto et al., 2018). The population of false killer whales in
the Indian Ocean has been estimated as 144,188 whales (Wade and Gerrodette, 1993).
False killer whales are found worldwide in tropical to warm temperate zones in deep (> 3,300 ft (1,000
m) waters (Baird, 2009a; Odell and McClune, 1999; Stacey et al., 1994). Although typically a pelagic
species, they approach close to the shores of oceanic islands and regularly mass strand (Baird, 2009a). In
the North Pacific Ocean, false killer whales are well documented in the waters of southern Japan,
Hawaii, ETP, and off the U.S. West Coast. Off the Hawaiian Archipelago, false killer whales occur in
nearshore (Baird et al. 2008, 2013) and pelagic waters, including waters surrounding Palmyra and
Johnston Atolls (Barlow et al., 2008, Bradford and Forney, 2013). False killer whales have a poorly known
ecology. Breeding grounds and seasonality in breeding are unknown; however, one population does
have a breeding peak in late winter (Jefferson et al., 2015). These whales do not have specific feeding
grounds but feed opportunistically (Jefferson et al., 2015).
False killer whales tagged in the western North Pacific performed both shallow and deep dives. Shallow
dives had a mean duration of 103 sec and a mean maximum depth of 56 ft (17 m). Deep Dives had a
mean duration of 269 sec (SD = 189) and a mean maximum depth of 424 ft (129 m) (SD = 185)
(Minamikawa et al., 2013). The longest dives lasted 15 min and the deepest went to 2,133 ft (650 m).
Dives were deeper during the day, suggesting that the whales are feeding on the deep scattering layer
during the day (Minamikawa et al., 2013). False killer whales have an approximate swim speed of 1.6 kt
(3 kph), although a maximum swim speed has been documented at 14.5 kt (26.9 kph) (Brown et al.,
1966; Rohr et al., 2002).
False killer whales hear underwater sounds in the range of less than 1 to 115 kHz (Au, 1993; Johnson,
1967). Their best underwater hearing occurs at 17 kHz, where the threshold level ranges between 39 to
49 dB RL. In a study by Yuen et al. (2005), false killer whales’ hearing was measured using both
behavioral and auditory evoked potential (AEP) audiograms. The behavioral data show that this species
LOA and Rulemaking Application Under the MMPA for Use of SURTASS LFA Sonar
4-23 Status and Distribution
is most sensitive between 16 and 24 kHz, with peak sensitivity at 20 kHz. The AEP data show that this
species best hearing sensitivity is from 16 to 22.5 kHz, with peak sensitivity at 22.5 kHz. Au et al. (1997)
studied the effects of the Acoustic Thermometry of Ocean Climate (ATOC) program on false killer
whales. The ATOC source transmitted 75-Hz, 195 dB SL signals. The hearing thresholds for false killer
whales were 140.7 dB RL 1.2 dB for the 75-Hz pure tone and 139.0 dB RL ±1.1 dB for the ATOC signal.
False killer whales have the ability to reduce their hearing sensitivity in response to loud sounds
(Nachtigall and Supin, 2013).
False killer whales produce a wide variety of sounds from 4 to 130 kHz, with dominant frequencies
between 25 to 30 kHz and 95 to 130 kHz (Busnel and Dziedzic, 1968; Kamminga and Van Velden, 1987;
Murray et al., 1998; Thomas and Turl, 1990). Most signal types vary among whistles, burst-pulse sounds
and click trains (Murray et al. 1998). Whistles generally range between 4.7 and 6.1 kHz. Echolocation
clicks of false killer whales are highly directional and range between 20 and 60 kHz and 100 and 130 kHz
(Kamminga and van Velden, 1987; Madsen et al., 2004a; Thomas and Turl, 1990). There are no available
data regarding seasonal or geographical variation in the sound production of false killer whales.
Estimated peak-to-peak SL of captive animal clicks is near 228 dB re 1 Pa @ 1 m (Madsen et al., 2004a;
Thomas and Turl, 1990).
4.2.8 Fraser’s Dolphin (Lagenodelphis hosei)
Fraser’s dolphin is classified as a data deficient species by the IUCN. The global population for this
species is unknown. Abundances or densities of Fraser’s dolphins only exist for a limited number of
regions. In the WNP stock, 220,789 Fraser’s dolphins are estimated; while in the Central North Pacific
stock, which includes Hawaii, 51,491 dolphins (CV=0.66) have been estimated (Bradford et al., 2017).
The Indian Ocean population is estimated to include 151,554 dolphins (Wade and Gerrodette, 1993).
Fraser’s dolphins occur primarily in tropical and subtropical waters of the Atlantic, Pacific, and Indian
Oceans (Croll et al., 1999; Dolar, 2009). This oceanic species is most commonly found in deep waters
(4,921 to 6,562 ft [1,500 to 2,000 m ]) usually 8.1 to 11 nmi (15 to 20 km) from shore or where
deepwater approaches the shore, such as in the Philippines, Taiwan, some Caribbean islands, and the
Indonesian-Malay archipelago (Jefferson et al., 2015). Breeding areas and seasonal movements of this
species have not been confirmed. However, in Japan, calving appears to peak in the spring and fall.
There is some evidence that calving occurs in the summer in South Africa (Dolar, 2009).
Little information on the diving ability of the Fraser’s dolpin is available. Based on prey composition, it is
believed that Fraser’s dolphins feed at two depth horizons in the ETP: the shallowest depth in this region
is no less than 820 ft (250 m) and the deepest is no less than 1,640 ft (500 m). In the Sulu Sea, these
dolphins appear to feed from near the surface to at least 1,968 ft (600 m). Off South Africa and in the
Caribbean Sea, Fraser’s dolphins were observed feeding near the surface (Dolar et al., 2003). According
to Watkins et al. (1994), Fraser’s dolphins herd when they feed, swimming rapidly to an area, diving for
15 sec or more, surfacing and splashing in a coordinated effort to surround the school of fish. Swim
speeds of Fraser’s dolphin have been recorded between 2.2 and 3.8 kt (4 and 7 kph) with swim speeds
up to 15 kt (28 kph) when escaping predators (Croll et al., 1999).
Hearing sensitivity of Fraser’s dolphins has not been measured (Ketten, 2000; Thewissen, 2002). Fraser’s
dolphins produce sounds ranging from 4.3 to over 40 kHz (Leatherwood et al., 1993; Watkins et al.,
1994). Echolocation clicks are described as short broadband sounds without emphasis at frequencies
below 40 kHz, while whistles were frequency-modulated tones concentrated between 4.3 and 24 kHz.
Whistles have been suggested as communicative signals during social activity (Watkins et al., 1994).
LOA and Rulemaking Application Under the MMPA for Use of SURTASS LFA Sonar
4-24 Status and Distribution
There are no available data regarding seasonal or geographical variation in the sound production of
Fraser’s dolphins. Source levels were not available.
4.2.9 Harbor Porpoise (Phocoena phocoena)
Harbor porpoises are classified overall as least concern under IUCN. Three major residential isolated
populations exist: 1) the North Pacific; 2) North Atlantic; and 3) the Black Sea (Bjorge and Tolley, 2009;
Jefferson et al., 2008). However, morphological and genetic data indicate different populations exist
within these three regions (Jefferson et al., 2015). The global population for the harbor porpoise
estimated to be at least 675,000 (Jefferson et al., 2015). The WNP population of harbor porpoises
consists of an estimated 31,046 individuals (Allen and Angliss, 2014; Hobbs and Waite, 2010).
Harbor porpoises are found in cold temperate and sub-arctic neritic waters of the Northern hemisphere
(Bjørge and Tolley, 2009; Gaskin, 1992; Jefferson, 1993). They are typically found in waters of about 41
to 61° F (5 to 16° C) with only a small percentage appearing in more polar waters (32° to 39° F [0° to 4°
C]) (Gaskin, 1992). Harbor porpoises are most frequently found in coastal waters, but do occur in
adjacent offshore shallows and, at times, in deep water (Croll et al., 1999; Gaskin, 1992). Harbor
porpoises show seasonal movement in northwestern Europe waters that may be related to
oceanographic changes seasonally (Gaskin, 1992; Heimlich-Boarn et al., 1998; Read and Westgate,
1997). Although migration patterns have been inferred for the harbor porpoise, data suggest that
seasonal movements of individuals are discrete and not temporally coordinated migrations (Gaskin,
1992; Read and Westgate, 1997).
Dive times of harbor porpoises range between 0.7 and 1.7 min with a maximum dive duration of 9 min
(Westgate et al., 1995). Recently, van Beest et al. (2018) reported mean dive durations of tagged harbor
porpoises of 53 sec and mean dive depths of 50.9 ft (15.5 m). The majority of dives range in depth from
65.6 to 426.5 ft (20 to 130 m), although the maximum dive depth recorded is 741.5 ft (226 m) (Westgate
et al., 1995). Three tagged porpoises in shallow Danish waters had an average dive rate of 45 dives per
hour, with maximum dive depth of 82 ft (25 m) (Linnenschmidt et al., 2013). Maximum swim speeds for
harbor porpoises range from 9.0 to 12.0 kt (16.6 and 22.2 kph) (Gaskin et al., 1974). A mean
horizontal/surface swim speed of 1.26 kt (2.3 kph) was reported for free-ranging harbor porpoises (van
Beest et al., 2018).
Harbor porpoises can hear frequencies in the range of 100 Hz to 140 kHz (Kastelein et al., 2002;
Kastelein et al., 2015; Villadsgaard et al., 2007). Kastelein et al. (2002) determined the best range of
hearing for a two-year-old male was 16 to 140 kHz; this harbor porpoise also demonstrated the highest
upper frequency hearing of all odontocetes presently known (Kastelein et al., 2002). In a series of
experiments designed to investigate harbor porpoise hearing with respect to naval sonar, the hearing
threshold for 1 to 2 kHz FM signals was 75 dB, without the presence of harmonics. When harmonics
were present, the threshold dropped to 59 dB (Kastelein et al., 2011). The thresholds for LF sonars were
higher than for MF sonars; the measured threshold for 6-7 kHz signals was 67 dB.
Harbor porpoises produce click and whistle vocalizations that cover a wide frequency range, from 40 Hz
to at least 150 kHz (Verboom and Kastelein, 1995). The click vocalizations consist of four major
frequency components: lower frequency component (1.4 to 2.5 kHz) of high amplitude that are may be
used for long-range detection; two middle frequency components consisting of a low amplitude (30 to
60 kHz) and a broadband component (10 to 100 kHz); and a higher frequency component (110 to 150
kHz) that is used for bearing and classification of objects (Verboom and Kastelein, 1995). Vocalization
peak frequencies are similar for wild and captive harbor porpoises, with the peak frequencies reported

LOA and Rulemaking Application Under the MMPA for Use of SURTASS LFA Sonar
4-25 Status and Distribution
to range from 129 to 145 kHz and 128 to 135 kHz, respectively (Villadsgaard et al., 2007). Maximum SLs
vary, apparently, between captive and wild dolphins, with maximum SLs of 172 dB re 1 μPa at 1 m in
captive dolphins but range from 178 to 205 dB re 1 µPa at 1 m in wild dolphins (Villadsgaard et al.,
2007). Variations in click trains apparently represent different functions based on the frequency ranges
associated with each activity.
4.2.10 Indo-Pacific Bottlenose Dolphin (Tursiops aduncus)
Only recently has this species’ taxonomy been clearly differentiated from that of the common
bottlenose dolphin. Indo-Pacific bottlenose dolphins are considered data deficient by the IUCN. No
global abundance estimates exist for the species and even regional abundance estimates are few, even
though it is the most commonly observed marine mammal species in some coastal regions of the world.
Estimates of Indo-Pacific bottlenose dolphins include 218 animals in Japanese waters and 1,634 to 1,934
dolphins in Australian waters (Wang and Yang, 2009). The population includes more than 24 dolphins off
Taiwan and 44 dolphins in the northeast Philippines (Jefferson et al., 2015). In the Indian Ocean, the
population has been numbered at 7,850 dolphins (Wade and Gerrodette, 1993).
Indo-Pacific bottlenose dolphins occur in warm temperate to tropical waters of the Indian Ocean and
southwestern Pacific Ocean, from South Africa and the Red Sea and Persian Gulf to southern Japan,
Indonesia, Malaysia, and central Australia (Jefferson et al., 2015). Considered principally a coastal
species, the Indo-Pacific bottlenose dolphin occurs predominantly in continental shelf and insular shelf
waters, usually in shallow coastal and inshore waters (Cribb et al., 2013; Jefferson et al., 2015).
However, movements across deep, oceanic waters have been reported (Wang and Yang, 2009).
Little information is known about the diving ability of the Indo-Pacific bottlenose dolphin, but dive
depths and durations are thought be less than 656 ft (200 m) and from 5 to 10 min (Wang and Yang,
2009). Swimming speeds range from 0.8 to 2.2 kt (1.5 to 4.1 kph), but bursts of higher speeds can reach
8.6 to 10.3 kt (16 to 19 kph) (Wang and Yang, 2009).
Although much is known about hearing in the common bottlenose dolphin, specific hearing data are not
yet available for the Indo-Pacific bottlenose dolphin. These dolphins produce whistle and pulsed call
vocalizations. Whistles range in frequency from 4 to 12 kHz (Gridley et al., 2012; Morisaka et al., 2005a).
Morisaka et al. (2005a) found variations in whistles between populations of Indo-Pacific bottlenose
dolphins and determined that ambient noise levels were likely responsible for the whistle variability
(Morisaka et al., 2005b). Variability in whistle structure has been documented between both nearby and
distant groups, although a few whistle types were shared, suggesting that their repertoire is driven by
social functions such as group identity (Hawkins, 2010). Preliminary analyses suggest that Info-Pacific
bottlenose dolphins use signature whistles like the common bottlenose dolphin (Gridley et al., 2014).
Indo-Pacific bottlenose dolphin echolocation clicks have peak-to-peak source levels that range between
177-219 dB, with a duration of 8-48 sec, and peak frequencies that range from 45 to 141 kHz (de
Freitas et al., 2015; Wahlberg et al., 2011b).
4.2.11 Killer Whale (Orcinus orca)
The killer whale is classified as a data deficient species under the IUCN. In 2005, NMFS listed the
Southern Resident killer whale DPS as endangered under the ESA (NOAA, 2005c). Both the Southern
Resident and AT1 Transient stocks of killer whales are listed as depleted under the MMPA. Critical
habitat has been designated for the Southern Resident killer whales in the inland marine waters of
Washington (Puget Sound, Strait of Juan de Fuca, and Haro Strait) (NOAA, 2006).
LOA and Rulemaking Application Under the MMPA for Use of SURTASS LFA Sonar
4-26 Status and Distribution
Generally, three major ecotypes of killer whales have been identified: the coastal (fish-eating) residents,
the coastal (mammal-eating) transients, and the offshore types of killer whales. The basic social unit for
all of these ecotypes is the matrilineal group (Ford, 2009). In resident killer whales, pods are formed
from multiple matrilines, and related pods form clans. Resident killer whales in the North Pacific consist
of the southern, northern, southern Alaska (which includes southeast Alaska and Prince William Sound
whales), western Alaska, and western North Pacific groups (NOAA, 2005c).
Although no current global population estimates are available, Jefferson et al. (2015) estimated the killer
whale worldwide abundance near 50,000 individuals. An abundance of 146 killer whales (CV=0.96) are
currently estimated in the Hawaii stock (Bradford et al., 2017; Carretta et al., 2014), while 12,256 whales
are estimated to occur in the WNP stock (Ferguson and Barlow, 2001 and 2003). In the Indian Ocean,
killer whales number 12,593 individuals (Wade and Gerrodette, 1993).
The killer whale is perhaps the most cosmopolitan of all marine mammals, found in all the world’s
oceans from about 80N to 77S, especially in areas of high productivity and in high latitude coastal
areas (Ford, 2009; Leatherwood and Dalheim, 1978). However, killer whales appear to be more common
within 430 nmi (800 km) of major continents in cold-temperate to subpolar waters (Mitchell, 1975).
Individual populations are known to migrate between high and low latitude waters (Dahlheim et al.,
2008; Durban and Pitman, 2012; Matthews et al., 2011).
The diving behavior of killer whales differs between fish-eating and mammal-eating types. Baird et al.
(2005) reported that southern resident (fish-eating) killer whales in Washington State had a mean
maximum dive depth of 463 ft (141 m [SD = 62 m]), with a maximum dive depth of 807 ft (246 m). Males
dove more often and remained submerged longer than females and more dives were reported during
the day than at night. Fish-eating killer whales in Antarctica had shallow dives that ranged to about 656
ft (200 m), while deep dives approached 2,625 ft (800 m) (Reisinger et al., 2015). These killer whales also
dove significantly deeper during the day than the night. Miller et al. (2010) reported on the diving
behavior of transient (mammal-eating) killer whales in Alaska. Dives were categorized as short and
shallow, or long and deep. Short dives lasted less than one minute and had dive depths of less than 16 ft
(5 m). Deep dives ranged between 39 to 164 ft (12 and 50 m) in depth and lasted from 4 to 6 min. The
mammal-easting killer whales dove much less deeply than the fish-eating whales, reflecting the
distribution of their prey. Swimming speeds usually range between 3.2 to 5.4 kt (6 to 10 kph), but top
speeds of up to 20 kt (37 kph) in short bursts have been reported (Lang, 1966; LeDuc, 2009).
Killer whales hear underwater sounds in the range of <500 Hz to 120 kHz (Bain et al., 1993; Szymanski et
al., 1999). Their best underwater hearing occurs between 15 and 42 kHz, where the threshold level is
near 34 to 36 dB RL (Hall and Johnson, 1972; Szymanski et al., 1999). Killer whales produce sounds as
low as 80 Hz and as high as 85 kHz with dominant frequencies at 1 to 20 kHz (Awbrey, 1982; Diercks et
al., 1973; Diercks et al., 1971; Evans, 1973; Ford, 1989; Ford and Fisher, 1982; Miller and Bain, 2000;
Schevill and Watkins, 1966). An average of 12 different call types (range 7 to 17)—mostly repetitive
discrete calls—exist for some pods of killer whales (Ford, 2009). Pulsed vocalizations tend to be in the
range between 500 Hz and 10 kHz and may be used for group cohesion and identity (Ford, 2009;
Frankel, 2009). Whistles range in frequency up to at least 75 kHz (Filatova et al., 2012; Samarra et al.,
2015; Simonis et al., 2012). Echolocation clicks are also included in killer whale repertoires, but are not a
dominant signal type in comparison to pulsed calls (Miller and Bain, 2000). Erbe (2002) recorded
received broadband SPLs of killer whale’s burst-pulse calls ranging between 105 and 124 dB RL at an
estimated distance of 328 ft (100 m). Offshore killer whales tracked in the Southern California bight had
SLs for echolocation clicks of 170 to 205 dB re 1Pa @ 1 m (peak-peak) (Gassmann et al., 2013). Whistle
LOA and Rulemaking Application Under the MMPA for Use of SURTASS LFA Sonar
4-27 Status and Distribution
SLs ranged between 185 and 193 dB re 1 µPa @ 1 m. Pulse call SLs ranged between 146 and 158 dB re
1Pa @ 1 m. While the basic structure of killer whale vocalizations are similar within all populations,
geographic variation between populations does exist (Samarra et al., 2015).
All pods within a clan have similar dialects of pulsed calls and whistles. Killer whales engaged in different
activities produce different proportion of calls, suggesting that high-frequency and biphonic calls are
used for long range communication, and LF monophonic calls are used for intra-pod signaling (Filatova
et al., 2013). Intense LF pulsed calls (683 Hz, 169 to 192 dB re 1 µPa @ 1 m (peak-peak) appear to be
used to manipulate herring prey, increasing foraging efficiency (Simon et al., 2006).
4.2.12 Longman’s Beaked Whale (Indopacetus pacificus)
Longman’s beaked whale, also known as the Indo-Pacific beaked whale, is currently classified as data
deficient by IUCN. Very few population data are available for this little known beaked whale. No global
abundance estimate of this species is available, but 7,619 Longman’s beaked whales (CV=0.66) are
estimated to occur in the Hawaii and WNP stocks (Bradford et al., 2017), while 16,867 whales are
estimated to occur in the Indian Ocean stock (Wade and Gerrodette, 1993).
The distribution of this rarely occurring beaked whale is oceanic tropical waters of the Indo-Pacific
oceans (Leatherwood and Reeves, 1983; Jefferson et al., 2008; Pitman, 2018). Longman’s beaked whales
appear to be rare in the eastern Pacific and Indian oceans but occur more commonly in the western
Pacific and western Indian oceans, suggesting to Pitman (2018) that this species prefers the warmer
waters typically found in western ocean basins. Nothing is known about possible seasonal movements of
this beaked whale.
Only a small number of dive times have been recorded for the Longman’s beaked whale. Two dive
duration periods were reported by Anderson et al. (2006) for Longman’s beaked whales: short durations
lasting from 11 to 18 min and long durations ranging from 20 to 33 min, although one beaked whale
possibly was submerged as long as 45 min. No data are available on swim speeds.
No direct measurements of hearing sensitivity are available for the Longman’s beaked whales (Ketten,
2000; Thewissen, 2002). Longman’s beaked whales produce burst-pulse, echolocation click, and pulse
vocaliations. Echolocation clicks have a frequency range between 15 and 25 kHz, while pulses exhibit a
25 kHz FM upswept frequency signal, and burst-pulses are a long sequence of clicks lasting ~ 0.5 seconds
(Rankin et al., 2011).
4.2.13 Melon-headed Whale (Peponocephala electra)
Melon-headed whales are classified as a lower risk (least concern) species by the IUCN. The global
population for this species is unknown. Kanaji et al. (2018) estimated the population of the WNP to
include 56, 213 individuals. Two populations have been documented in Hawaiian waters: the Hawaiian
Islands stock with an estimated 8,666 whales (CV=1.00) (Bradford et al., 2017), and the Kohala resident
population with an estimated 447 whales (CV=0.12) (Aschettino, 2010; Carretta et al., 2014; Oleson et
al., 2013). In the Indian Ocean, the melon-headed whale population has been estimated as 64,600
whales (Wade and Gerrodette, 1993).
The melon-headed whale occurs in pelagic tropical and subtropical waters worldwide (Jefferson and
Barros, 1997). Breeding areas and seasonal movements of this species have not been confirmed.
Few data are available on diving or swim speed for the melon-headed whale. Melon-headed whales
feed on mesopelagic squid found down to 4,920 ft (1,500 m) deep, so they appear to feed deep in the
LOA and Rulemaking Application Under the MMPA for Use of SURTASS LFA Sonar
4-28 Status and Distribution
water column (Jefferson and Barros, 1997). Mooney et al. (2012) reported in preliminary research
findings that a tagged melon-headed whale in Hawaiian waters dove deeply to near the seafloor, >984 ft
(300 m), at night but stayed near the sea surface during the day, with no dives >67 ft (20 m). Melon-
headed whales in the Caribbean appeared to have two modes of foraging diving; a small percentage of
dives to depths less than 328 ft (100 m) while most dives were to water depths between 492 to 1,640 ft
(150 and 500 m) (Joyce et al., 2017). Swim speeds for this species are not available.
There is no direct measurement of hearing sensitivity for melon-headed whales (Ketten, 2000;
Thewissen, 2002). The first confirmed description of melon-headed whale vocalizations was reported by
Frankel and Yin (2010). Melon-headed whale’s clicks have frequency emphases beginning at 13 kHz and
extending to at least 100 kHz (Baumann-Pickering et al., 2015a; Frankel and Yin, 2010). Dominant
frequencies of whistles are 1 to 24 kHz, with both upsweeps and downsweeps in frequency modulation.
Burst-pulse sounds had a mean duration of 586 msec. No available data exist regarding seasonal or
geographical variation in the sound production of this species. Changes in vocalization activity patterns
suggest that melon-headed whales may forage at night and rest during the day (Baumann-Pickering et
al., 2015a).
4.2.14 Mesoplodon Species
Six species of Mesoplodon beaked whales may occur in the SURTASS LFA sonar study area. These species
include: Blainville’s, Deraniyagala’s, ginkgo-toothed, Hubbs’, spade-toothed, and Stejneger’s beaked
whales (Table 3-1). The Mesoplodon species are not well known, are difficult to identify to the species at
sea, and so little about their behavior has been documented that much of the available characterization
for beaked whales is to genus level only; for this reason, information on the Mesoplodon beaked whale
species is presented together.
Species in the genus Mesoplodon are currently classified with a data deficient status by IUCN. The
worldwide population sizes for all species of Mesoplodon spp. are unknown. The population of
Blainville’s beaked whales in the Hawaii stock was reported as 2,105 whales (CV=1.13) (Bradford et al.,
2017), while 8,032 Blainville’s beaked whales have been estimated for the WNP stock (Carretta et al.,
2011; Ferguson and Barlow, 2001 and 2003; LGL, 2011). In the North Pacific stocks, populations of
22,799 whales have been estimated for Deraniyagala, ginkgo-toothed, and Hubbs’ beaked whales
(Ferguson and Barlow, 2001 and 2003). In the Indian Ocean stock, populations each of 16,687 whales
are estimated for Blainville’s, Deraniyagala, ginkgo-toothed, and spade-toothed beaked whales (Wade
and Gerrodette, 1993). The population of Stejneger’s beaked whales was estimated to include 8,000
individuals in the WNP stock (Kasuya, 1986).
With the exception of cold, polar waters, Mesoplodon beaked whales are distributed in all of the world’s
oceans in deep (>6,562 ft [2,000 m]) pelagic waters. The distribution of ginkgo-toothed beaked whales is
restricted to the tropical and warm-temperate waters of the North Pacific and Indian oceans. In the
North Pacific Ocecan, Stejneger’s beaked whales occur in temperate to subarctic waters, while Hubbs’
beaked whale occurs only in temperate waters (Olson, 2018). Spade-toothed beaked whales have a very
restricted range in the southern Pacific Ocean and the southeastern most Indian Ocean, from Australia
and New Zealand to Chile. Blainville’s beaked whales are the most cosmopolitan of the beaked whales
and can be found in the Atlantic, Pacific, and Indian oceans in warm temperate and tropical waters
(Pitman, 2009b). The little known Deraniyagala beaked whale ranges throughout the tropical waters of
the equatorial Indo-Pacific (Dalebout et al., 2014).

LOA and Rulemaking Application Under the MMPA for Use of SURTASS LFA Sonar
4-29 Status and Distribution
Dives of Blainville’s beaked whales average 7.5 min during social interactions (Baird et al., 2004). Dives
over 45 min have been recorded for some species in this genus (Jefferson et al., 1993). Dive depths are
variable among Mesoplodon species and are not well documented. In Hawaii, a Blainville’s beaked whale
was observed to dive to a maximum water depth of 4,619 ft (1,408 m), with the dive duration ranging
from 48 to 68 min (Pitman, 2009b). Blainville’s beaked whales in the Caribbean Sea performed dives
with a mean depth of 3,704 ft (1,129 m) and mean duration of 46.1 min, with the whale’s non-foraging
dives reaching ~1,148 ft (350 m) and lasting 40 min, while foraging dives ranged between 1,969 to 6,234
ft (600 and 1,900 m) with a duration between 30 and 70 min (Joyce et al., 2017). Few swim speed data
are available for any beaked whale species. Schorr et al. (2009) reported a horizontal swim speed of 0.4
to 0.8 kt (0.8 to 1.5 kph) for a Blainville’s beaked whales in Hawaii with a maximum rate of 4.4 kt (8.1
kph).
The hearing sensitivity of a stranded Blainville’s beaked whale was measured at 5.6 and 160 kHz, with
the best hearing response ranging between 40 and 50 kHz, with AEP thresholds less than 50 dB re 1 Pa
(Pacini et al., 2011). In a study of echolocation clicks in Blainville’s beaked whales, Johnson et al. (2006)
found that the whales make various types of clicks while foraging. The whales have a distinct search click
that is in the form of an FM upsweep with a minus 10 dB bandwidth from 26 to 51 kHz (Johnson et al.,
2006). Blainville’s beaked whales also produce a buzz click during the final stage of prey capture, and
they have no FM structure with a minus 10 dB bandwidth from 25 to 80 kHz or higher (Johnson et al.,
2006).
Johnson et al. (2004) studied Blainville’s beaked whales and concluded that no vocalizations were
detected from any tagged beaked whales when they were within 656 ft (200 m) of the surface. The
Blainville’s beaked whale started clicking at an average depth of 1,312 ft (400 m), ranging from 200 to
570 m (656 to 1,870 ft), and stopped clicking when they started their ascent at an average depth of
2,362 ft (720 m), with a range of 1,640 to 2,591 ft (500 to 790 m). The intervals between regular clicks
were approximately 0.4 second. Trains of clicks often end in a buzz. The Blainville’s beaked whale has a
somewhat flat spectrum that was accurately sampled between 30 and 48 kHz, with a slight decrease in
the spectrum above 40 kHz, but the 96 kHz sampling rate was not sufficient to sample the full frequency
range of clicks from either of the species (Johnson et al., 2004).
4.2.15 Northern Right Whale Dolphin (Lissodelphis borealis)
The northern right whale dolphin is classified as a least concern (lower risk) species by the IUCN. The
global population in the North Pacific Ocean of the northern right whale dolphin is estimated as 68,000
animals (Jefferson et al., 2015).
This oceanic species is only found in temperate to subarctic regions of the North Pacific from roughly 34°
to 54° N and 118° to 145° W (Jefferson et al., 2015; Lipsky, 2009). This range extends from the Kuril
Islands (Russia) south to Japan and from the Gulf of Alaska to southern California. Northern right whale
dolphins have been most often observed in waters ranging in temperature from 46.4 to 66.2°F (8 and
19°C) (Leatherwood and Walker, 1979). Northern right whale dolphins can occur near to shore when
submarine canyons or other such topographic features cause deep water to be located close to the
coast. Seasonally the northern right whale dolphin exhibits inshore-offshore movements in some areas,
such as off southern California (Lipsky, 2009).
The maximum recorded dive duration for northern right whale dolphins is 6.25 min with a maximum
dive depth of 656 ft (200 m) (Fitch and Brownell, 1968; Leatherwood and Walker, 1979). Swim speeds
LOA and Rulemaking Application Under the MMPA for Use of SURTASS LFA Sonar
4-30 Status and Distribution
for northern right whale dolphins can reach 18.3 to 21.6 kt (34 to 40 kph) (Leatherwood and Reeves,
1983; Leatherwood and Walker, 1979).
There is no direct measurement of the hearing sensitivity of the northern right whale dolphin (Ketten,
2000; Thewissen, 2002). They produce sounds as low as 1 kHz and as high as 40 kHz or more, with
dominant frequencies at 1.8 and 3 kHz (Fish and Turl, 1976; Leatherwood and Walker, 1979).
Echolocation clicks have peak frequencies that range from 23 to 41 kHz (Rankin et al., 2007). The
maximum known peak-to-peak SL of northern right whale dolphins is 170 dB (Fish and Turl, 1976).
Northern right whale dolphins also produce burst-pulse sounds that are lower in frequency and shorter
in duration than echolocation click sequences. The peak frequencies of burst-pulses signals range from 6
to 37 kHz with durations from 1 to 178 msec (Rankin et al., 2007). Northern right whale dolphins do not
produce whistles (Oswald et al., 2008).
4.2.16 Pacific White-sided Dolphin (Lagenorhynchus obliquidens)
Pacific white-sided dolphins are listed as least concern under the IUCN. In the North Pacific Ocean, an
abundance of 931,000 Pacific white-sided dolphins has been estimated (Buckland et al., 1993; Jefferson
et al., 2015).
Pacific white-sided dolphins are mostly pelagic and have a primarily cold temperate distribution across
the North Pacific; in the western North Pacific, this species occurs from Taiwan north to the Commander
and Kuril Islands while in the eastern North Pacific, it occurs from southern Gulf of California to the
Aleutian Islands (Black, 2009; Jefferson et al., 2015). Pacific white-sided dolphins are distributed in
continental shelf and slope waters generally within 100 nmi (185 km) of shore and often move into
coastal and even inshore waters. No breeding grounds are known for this species.
From studies of the ecology of their prey, Pacific white-sided dolphins are presumed to dive from 393.7
to 656 ft (120 to 200 m), with most of their foraging dives lasting a mean of 27 sec (Black, 1994). Captive
Pacific white-sided dolphins were recorded swimming as fast as 15.0 kt (27.7 kph) for 2 sec intervals
(Fish and Hui, 1991) with a mean travel speed of 4.1 kt (7.6 kph) (Black, 1994).
Pacific white-sided dolphins hear in the frequency range of 2 to 125 kHz when the sounds are equal to
or softer than 90 dB RL (Tremel et al., 1998). This species is not sensitive to LF sounds (i.e., 100 Hz to 1
kHz) (Tremel et al., 1998). Pacific white-sided dolphins produce broad-band clicks in the frequency range
of 60 to 80 kHz and that have a SL at 180 dB re 1 µPa @ 1 m (Richardson et al., 1995). These clicks have
spectral peaks at 22.2, 26.6, 33.7, and 37.3 kHz with spectral notches at 19.0, 24.5, and 29.7 kHz. These
spectral characteristics can be used to identify the species from recordings (Soldevilla et al., 2008).
There are no available data regarding seasonal or geographical variation in the sound production of
Lagenorhynchus dolphins.
4.2.17 Pantropical Spotted Dolphin (Stenella attenuata)
The pantropical spotted dolphin is one of the most abundant dolphin species in the world. This species is
listed as a least concern (lower risk) species by the IUCN. The WNP population of pantropical spotted
dolphins is estimated to include 130,002 individuals (Kanaji et al., 2018). Pantropical dolphins in the
Central North Pacific stock, which encompasses the Hawaiian Islands, are comprised of four stocks: the
pelagic stock, estimated as 55,795 dolphins (CV=0.55) (Bradford et al., 2017), as well as the Hawaii
Island, Oahu, and 4-Islands stocks, which have each been estimated to include 220 individuals (Courbis
et al., 2014). As many as 736,575 pantropical spotted dolphins have been estimated to occur in the
Indian Ocean (Wade and Gerrodette, 1993).

LOA and Rulemaking Application Under the MMPA for Use of SURTASS LFA Sonar
4-31 Status and Distribution
Pantropical spotted dolphins occur throughout tropical and sub-tropical waters from roughly 40°N to
40°S in the Atlantic, Pacific, and Indian Oceans (Perrin, 2009c). These dolphins typically are oceanic but
are found close to shore in areas where deep water approaches the coast, as occurs in Taiwan, Hawaii,
and the western coast of Central America (Jefferson et al., 2015). Pantropical spotted dolphins also
occur in the Persian Gulf and Red Sea.
Pantropical spotted dolphins dive to at least 557.7 ft (170 m), with most of their dives to between 164
and 328 ft (50 and 100 m) for 2 to 4 min, and most foraging occurs at night (Stewart, 2009). Off Hawaii,
pantropical spotted dolphins have been recorded to dive to a maximum depth of 400 ft (122 m) during
the day and 700 ft (213 m) during the night (Baird et al., 2001). The average dive duration for the
pantropical spotted dolphins is 1.95 min to water depths as deep as 328 ft (100 m) (Scott et al., 1993).
Dives of up to 3.4 min have been recorded (Perrin, 2009c). Pantropical spotted dolphins have been
recorded swimming at speeds of 2.2 to 10.3 kt (4 to 19 kph), with bursts up to 12 kt (22 kph) (Perrin,
2009c).
Greenhow et al. (2016) studied the hearing thresholds of a pantropical spotted dolphn using AEP and
behavioral methods, and found the peak hearing sensitivity at 10 kHz, with a cutoff frequency between
14 and 20 kHz. Pantropical spotted dolphins produce whistles with a frequency range of 3.1 to 21.4 kHz
(Richardson et al., 1995). They also produce click sounds that are typically bimodal in frequency with
peaks at 40 to 60 kHz and 120 to 140 kHz with SLs up to 220 dB re 1 μPa (Schotten et al., 2004).
4.2.18 Pygmy Killer Whale (Feresa attenuata)
Pygmy killer whales are one of the least known cetacean species. They are classified as data deficient by
the IUCN. The global population for this species is unknown. Estimates of the Hawaiian population
include 10,640 whales (CV=0.53) (Bradford et al., 2017), and 30,214 whales are included in the WNP
population (Ferguson and Barlow, 2001 and 2003). An estimated 22,029 pygmy killer whales have been
estimated in the Indian Ocean (Wade and Gerrodette, 1993).
Pygmy killer whales have been recorded in oceanic tropical and subtropical waters of all oceans
(Caldwell, 1971; Donahue and Perryman, 2009). These whales are sighted relatively frequently in the
ETP, the Hawaiian archipelago, and off Japan (Donahue and Perryman, 2009; Leatherwood et al., 1988).
The population in Hawaiian waters shows high site fidelity and is considered to represent a resident
population (McSweeney et al., 2009). No data are available to confirm seasonal migration patterns for
pygmy killer whales. No data on breeding and calving grounds are available.
No dive data are available. Baird et al. (2011) reported that tagged pygmy killer whales in Hawaiian
waters swam at speeds from 1.5 to 1.7 kt (2.7 to 3.1 kph).
Little information is available on the hearing sensitivity of pygmy killer whales. Recently, AEP-derived
audiograms were obtained on two live-stranded pygmy killer whales during rehabilitation. The U-shaped
audiograms of these pygmy killer whales showed that best hearing sensitivity occurred at 40 kHz with
lowest hearing thresholds having occurred between 20 and 60 kHz (Montie et al., 2011). These stranded
animals did not hear well at higher frequencies (90 and 96 dB at 100 kHz) (Montie et al., 2011). The peak
frequencies of wild pygmy killer whale clicks ranged from 45 to 117 kHz, with peak-to-peak source levels
that ranged from 197 to 223 dB (Madsen et al., 2004b). Pryor et al. (1965) describes pygmy killer whales
producing LF “growl” sounds.
LOA and Rulemaking Application Under the MMPA for Use of SURTASS LFA Sonar
4-32 Status and Distribution
4.2.19 Risso’s Dolphin (Grampus griseus)
Risso’s dolphins are classified as a least concern (lower risk) species by the IUCN. No global population
abundance exists for the Risso’s dolphin. The WNP and Inshore Archipelago stocks of Risso’s dolphins
are each estimated to include 143,374 individuals (Kanaji et al. 2018); the Inshore Archipelago stock
occurs in the Asian continental seas. In the Hawaii stock, 11,613 Risso’s dolphins (CV=0.43) have been
estimated (Bradford et al., 2017). The population of Risso’s dolphins in the Indian Ocean is estimated to
include 452,125 individuals (Wade and Gerrodette, 1993).
Risso’s dolphin inhabits deep oceanic and continental slope waters from the tropics through the
temperate regions (Baird, 2009b; Jefferson et al., 1993; Leatherwood et al., 1980). They occur
predominantly in steep shelf-edge habitats, in waters 1,300 and 3,281 ft (400 and 1,000 m)deep and
water temperatures commonly ranging from59° to 68° F (15° and 20° C) and rarely below 50° F (10° C)
(Baird, 2009b). Seasonal migrations for Risso’s dolphins in Japanese and North Atlantic populations have
been apparent, although seasonal variation in their movement patterns elsewhere have not been
studied (Kasuya, 1971; Mitchell 1975). No data on breeding grounds are available, and Risso’s dolphins
have been known to calve year round, but peak breeding times differ by habitat. In the North Atlantic,
breeding peaks in the summer, while in Japan breeding peaks in summer-fall, and in California, breeding
peaks in fall-winter (Jefferson et al., 2015).
Dive times up to 30 min have been reported for Risso’s dolphins (Jefferson et al. 2015). Arranz et al.
(2018) reported that Risso’s dolphins spend 1 to 3 min at the surface between foraging dives; echolocate
throughout foraging dives, a behavior atypical of deep-diving odontocetes; and often continue to forage
during ascent. Out of 37 foraging dives observed from tagged Risso’s dolphins, 57 percent were to
shallow water depths (<295 ft [90 m]) while only 12 percent were to deep water depths (1,148 to 1,476
ft [350 to 450 m]) (Arranz et al., 2018). Typical Risso’s dolphin swimming speeds are 3.2 to 3.8 kt (6 to 7
kph) (Kruse et al., 1999). Risso’s dolphins studied in the Ligurian Sea also swam at speeds from 3.2 to 3.8
kt (6 to 7 kph), remained at the surface for about 7 to 15 sec between dives that lasted 5 to 7 min and
occasionally longer (Bearzi et al., 2011). Swim speeds from Risso’s dolphins were recorded at 1.1 to 6.5
kt (2 to 12 kph) off Santa Catalina Island (Shane, 1995a). Tag data from a rehabilitated and released
Risso’s dolphin in the Gulf of Mexico indicate that the Risso’s dolphin swam on average at 3.9 kt (7.19
kph) and the majority (95 percent) of the dives were within 50 m of the sea surface, with the deepest to
1,312 to 1,640 ft (400 to 500 m) (Wells et al., 2009).
Audiograms for Risso’s dolphins indicate that their hearing RLs equal to or less than approximately 125
dB in frequencies ranging from 1.6 to 110 kHz (Nachtigall et al., 1995). Philips et al. (2003) reported that
Risso’s dolphins are capable of hearing frequencies up to 80 kHz. Optimal underwater hearing occurs
between 4 and 80 kHz, with hearing threshold levels from 63.6 to 74.3 dB RL. Other audiograms
obtained on Risso’s dolphin (Au et al., 1997) confirm previous measurements and demonstrate hearing
thresholds of 140 dB RL for a 1-second 75 Hz signal (Croll et al., 1999). Au et al. (1997) estimated the
effects of the ATOC source on false killer whales and on Risso’s dolphins. The ATOC source transmitted
75-Hz, 195 dB SL acoustic signal to study ocean temperatures. The hearing sensitivity was measured for
Risso’s dolphins and their thresholds were found to be 142.2 dB RL 1.7 dB for the 75 Hz pure tone
signal and 140.8 dB RL 1.1 dB for the ATOC signal (Au et al., 1997). Another individual had best hearing
at 11 kHz, and between 40 and 80 kHz, a response threshold of about 60 dB re 1Pa (Mooney et al.,
2015). These values are comparable to those previously reported by (Nachtigall et al., 1995; Nachtigall
et al., 2005). Risso’s dolphins are able to reduce their hearing sensitivity while echolocating (Nachtigall
and Supin, 2008).

LOA and Rulemaking Application Under the MMPA for Use of SURTASS LFA Sonar
4-33 Status and Distribution
Risso’s dolphins produce sounds as low as 0.1 kHz and as high as 65 kHz. Their dominant frequencies are
between 2 to 5 kHz and at 65 kHz (Au, 1993; Corkeron and Van Parijs, 2001; Croll et al., 1999; Watkins,
1967). Risso’s dolphins produce tonal whistles, burst-pulse sounds, echolocation clicks and a hybrid
burst-pulse tonal signal (Corkeron and Van Parijs, 2001).Echolocation clicks have peak frequencies
around 50 kHz, centroid frequencies of 60-90 kHz with peak-to-peak source levels of 202-222 dB re 1
µPa at 1 m (Madsen et al., 2004a). In one experiment conducted by Phillips et al. (2003), clicks were
found to have a peak frequency of 65 kHz, with 3 dB bandwidths of 72 kHz and durations ranging from
40 to 100 msec. In a second experiment, Phillips et al. (2003) recorded clicks with peak frequencies up to
50 kHz, with a 3 dB bandwidth of 35 kHz. Click durations ranging from 35 to 75 msec. Estimated SLs of
echolocation clicks can reach up to 216 dB (Phillips et al., 2003). Bark vocalizations consisted of highly
variable burst pulses and have a frequency range of 2 to 20 kHz. Buzzes consisted of a short burst pulse
of sound around 2 seconds in duration with a frequency range of 2.1 to 22 kHz. Low frequency,
narrowband grunt vocalizations ranged from 400 to 800 Hz. Chirp vocalizations were slightly higher in
frequency than the grunt vocalizations, ranging in frequency from 2 to 4 kHz. There are no available data
regarding seasonal or geographical variation in the sound production of Risso’s dolphin.
4.2.20 Rough-toothed Dolphin (Steno bredanensis)
The rough-toothed dolphin is classified as least concern by the IUCN. Globally, few population estimates
are available. The population of rough-toothed dolphins in the WNP stock is estimated to include 5,002
dolphins (Kanaji et al., 2018), while the Hawaii stock was estimated to include 72,528 individuals
(CV=0.39) (Bradford et al., 2017). In the Indian Ocean, the population of rough-toothed dolphins was
estimated at 156,690 individuals (Wade and Gerrodette, 1993).
Rough-toothed dolphins occur in oceanic tropical and warm-temperate waters around the world and
appear to be relatively abundant in certain areas; these dolphins are also found in continental shelf
waters in some locations, such as Brazil (Jefferson, 2009b). In the Pacific, rough-toothed dolphins inhabit
waters from central Japan to northern Australia and from Baja California, Mexico, south to Peru. Rough
toothed dolphins are also found in the Indian Ocean, from the southern tip of Africa to Australia
(Jefferson et al., 2015). Seasonal movements and breeding areas for this species have not been
confirmed.
Rough-toothed dolphins can dive to 98 to 230 ft (30 to 70 m) with dive durations ranging from 0.5 to 3.5
min (Ritter, 2002; Watkins et al., 1987b). Dives up to 15 min have been recorded for groups of dolphins
(Miyazaki and Perrin, 1994). Rough-toothed dolphins are not known to be fast swimmers. They are
known to skim the surface at a moderate speed (Jefferson, 2009b). Swim speeds of this species vary
from 3.0 to 8.6 kt (5.6 to 16 kph) (Ritter, 2002; Watkins et al., 1987b).
Very little information is available on the hearing sensitivity of rough-toothed dolphins. Cook et al.
(2005) performed AEPs on five live-stranded rough-toothed dolphins and found that these dolphins
could detect sounds between 5 and 80 kHz; the authors believe that rough-toothed dolphins are likely
capable of detecting frequencies much higher than 80 kHz. Rough-toothed dolphins produce sounds
ranging from 0.1 kHz up to 200 kHz (Miyazaki and Perrin, 1994; Popper, 1980; Thomson and Richardson,
1995). Clicks have peak energy at 25 kHz, while whistles have a maximum energy between 2 to 14 kHz
(Lima et al., 2012; Norris, 1969; Norris and Evans, 1967; Oswald et al., 2007; Popper, 1980). There are no
available data regarding seasonal or geographical variation in the sound production of this species.

LOA and Rulemaking Application Under the MMPA for Use of SURTASS LFA Sonar
4-34 Status and Distribution
4.2.21 Short-finned Pilot Whale (Globicephala macrorhynchus)
Two ecotypes of short-finned pilot whales occur in the western North Pacific Ocean off Japan, the
northern (Shiho) and southern (Naisa) ecotypes, which are distinguishable by pigmentation,
morphological, genetic, acoustic, and geographical characteristics (Kanaji et al. 2018; Kasuya, 1998;
Kasuya and Perrin, 2017; Olson, 2018; Van Cise et al., 2016 and 2017a). The northern ecotype is
distinguished at sea by a saddle-patch near the dorsal fin, and the two forms are restricted to the waters
off northern and southern Japan, respectively, by the Kuroshio Front; the northern ecotype of the short-
finned pilot whale is located in the area roughly between 35° and 43° N latitude while the southern
ecotype is found from about 23° to 35° N latitude (Miyashita, 1993; Kasuya and Perrin, 2017). The short-
finned pilot whale is classified as data deficient by the IUCN. A global population estimate of short-
finned pilot whales is unknown. The population of short-finned pilot whales in the Indian Ocean has
been estimated at 268,751 individuals (Wade and Gerrodette, 1993). In the North Pacific Ocean, an
abundance of 19,503 whales (CV=0.49) is estimated for the Hawaii stock of short-finned pilot whales
(Bradford et al., 2017). In the WNP Ocean, two stocks of short-finned pilot whales are recognized, the
WNP Northern and WNP Southern, with respective abundances estimated as 20,884 and 31,396
individuals (Kanaji et al., 2018).
Short-finned pilot whales occur in nearshore to pelagic, tropical to warm-temperate waters of the
Atlantic, Pacific, and Indian oceans (Olson, 2018). Little seasonal movement has been documented in
this species but most occur in oceanic waters annually, only moving inshore to follow the movements of
their prey (Croll et al., 1999). Short-finned pilot whales are considered nomadic, although resident
populations are known to occur in California’s Channel Islands, Madiera Islands, Hawaiian Islands, and in
the Strait of Gilbraltor (Olson, 2018). Recent research on short-finned pilot whales in Hawaiian waters
indicates that genetically, the Hawaiian area pilot whales are similar to the southern ecotype found off
Japan (Van Cise et al., 2016). Additionally, two short-finned pilot whale populations are likely in
Hawaiian waters, particularly in the Main Hawaiian Islands: an insular, inshore population as well as a
pelagic, offshore population (Carretta et al. 2018; Van Cise et al., 2017b).
Both long- and short-finned pilot whales are considered deep divers, feeding primarily on fish and squid
(Croll et al., 1999). Short-finned pilot whales off Tenerife showed a bimodal dive behavior with a large
number of dives to 984 ft (300 m), very few between 984 to 1,640 ft (300 and 500 m), and many dives
with a maximum depth between 1,640 to 3,343 ft (500 and 1,019 m) (Aguilar Soto et al., 2008).
Generally, dive times increased with dive depth, to a maximum duration of 21 min. (Ridgway, 1986).
Data from Madeira Island show that dives can last as long as 20 min to as deep as 3,281 ft (1,000 m)
(Alves et al., 2013), although the majority of recorded dives were much shorter and shallower, and
almost all of these were recorded during the daytime. Two whales that had stranded were equipped
with satellite tags and were tracked for 16 and 67 days, with 93 percent of their dives to less than 328 ft
(100 m) (Wells, 2013). Short-finned pilot whales have swim speeds ranging between (3.8 and 4.6 kt (7
and 9 kph) (Norris and Prescott, 1961). Short-finned pilot whale perform underwater ‘sprints’, with
velocities ranging up to 17.5 kt (32.4 kph) that are associated with foraging attempts (Aguilar Soto et al.,
2008).
AEPs were used to measure the hearing sensitivity of two short-finned pilot whales, one captive and one
stranded (Schlundt et al., 2011). The region of best hearing sensitivity for the captive whale was
between 40 and 56 kHz (thresholds of 78 and 79 dB re 1 µPa, respectively) with the upper limit of
functional hearing between 80 and 100 kHz (Schlundt et al., 2011). The only measurable detection
threshold for the stranded pilot whale was 108 dB re 1 µPa at 10 kHz, which suggested severe hearing

LOA and Rulemaking Application Under the MMPA for Use of SURTASS LFA Sonar
4-35 Status and Distribution
loss above 10 kHz (Schlundt et al., 2011). The hearing range of the captive short-finned pilot whale was
similar to other odontocete species, particularly of larger toothed whales. Another four stranded short-
finned pilot whales were tested with AEP, and their greatest sensitivity was measured between 20 to 40
kHz for all whales, with thresholds between 70 and 80 dB re 1Pa, with higher thresholds (25 to 61 dB)
measured at 80 kHz measured for the adults than the juveniles (Greenhow et al., 2014).
Short-finned pilot whales produce sounds as low as 280 Hz and as high as 100 kHz, with dominant
frequencies between 2 to 14 kHz and 30 to 60 kHz (Caldwell and Caldwell, 1969; Fish and Turl, 1976;
Scheer et al., 1998). The mean call frequency produced by short-finned pilot whales is 7.87 kHz, much
higher than the mean call frequency produced by long-finned pilot whales (Rendell et al., 1999). The
frequency content of tonal calls extends to at least 30 kHz (Sayigh et al., 2013). Echolocation abilities
have been demonstrated during click production (Evans, 1973). Pilot whales echolocate with a precision
similar to bottlenose dolphins and vocalize with other school members (Olson, 2009). SLs of clicks have
been measured as high as 180 dB (Fish and Turl, 1976). The center frequency of their clicks is 25 kHz,
with a mean 10 dB bandwidth of 10 kHz (Baumann-Pickering et al., 2015b), and a mean click duration
was 545 milliseconds (msec). There are little available data regarding seasonal or geographical variation
in the sound production of the short-finned pilot whale, although there is evidence of group specific call
repertoires (Olson, 2009) and specific call types can be repeated (Sayigh et al., 2013).
4.2.22 Southern Bottlenose Whale (Hyperoodon planifrons)
The IUCN classifies the status of the southern bottlenose whales as least concern (lower risk). The
population of southern bottlenose whales south of the Antarctic Convergence has been estimated as
500,000 whales, which makes this species the most commonly observed beaked whale in Antarctic
waters (Jefferson et al., 2008). In the Indian Ocean, an estimated 599,300 southern bottlenose whales
occur (Kasamatsu and Joyce, 1995).
Southern bottlenose whales are found south of 20°S, with a circumpolar distribution (Leatherwood and
Reeves, 1983; Jefferson et al., 2008). Evidence of seasonal migration shows a northward movement near
South Africa in February and southward movement toward the Antarctic in October (Sekiguchi et al.,
1993). Calving and breeding grounds are unknown.
Hooker and Baird (1999) documented the closely related northern bottlenose whales regularly diving
from 394 ft (120 m) to over 2,625 ft (800 m), with a maximum recorded dive depth to 4,770 ft (1,453 m).
Martin Lopez et al. (2015) reported a mean dive depth of 5,158 ft (1,572 m) and a mean dive duration of
49 min. Dive durations for northern bottlenose whales have been recorded close to 70 min (Hooker and
Baird, 1999). Southern bottlenose whales have been observed diving from 11 to 46 min, with an average
duration of 25.3 min (Sekiguchi et al., 1993). Bottlenose whales feed primarily on squid (Gowans, 2009),
and the deeper dives of northern bottlenose whales have been associated with foraging behavior
(Hooker and Baird, 1999). General swim speeds for ziphiids average 2.7 kt (5 kph) (Kastelein and Gerrits,
1991).
There is no direct measurement of hearing sensitivity for bottlenose whales (Ketten, 2000; Thewissen,
2002). Off Nova Scotia, diving northern bottlenose whales produced regular click series (consistent inter-
click intervals) at depth with peak frequencies of 6 to 8 kHz and 16 to 20 kHz (Hooker and Whitehead,
1998). Click trains produced during social interactions at the surface ranged in peak intensity from 2 to 4
kHz and 10 to 12 kHz. Additional measurements report that the whales produce FM sweeps from 20 to
55 kHz, with RMS source levels between 175 and 202 dB re 1Pa @ 1 m (Wahlberg et al., 2011a). There

LOA and Rulemaking Application Under the MMPA for Use of SURTASS LFA Sonar
4-36 Status and Distribution
is no seasonal or geographical variation documented for the northern bottlenose whale. There are no
available data for the sound production of southern bottlenose whales.
4.2.23 Sperm Whale (Physeter macrocephalus)
The sperm whale is endangered under the ESA, depleted under the MMPA, protected under CITES, and
classified as vulnerable by the IUCN Red List of Threatened Species (Taylor et al., 2008). Jefferson et al.
(2015) reported a putative global sperm whale population estimate of 360,000 individuals. The sperm
whale stock in the North Pacific Ocean has been estimated to include 102,112 individuals (CV=0.155),
while 4,559 sperm whales (CV=0.33) have been estimated for Hawaii stock (Bradford et al., 2017; Muto
et al., 2018). The Indian Ocean stock of sperm whale is estimated as 24,446 individuals (IWC, 2016; Perry
et al., 1999; Wade and Gerrodette, 1993).
With the largest distributional range of all cetaceans except killer whales, sperm whales are primarily
found in deeper (>3,280 ft [1000 m]) polar, temperate, and tropical waters of the world’s oceans and
Mediterranean Sea (Reeves and Whitehead, 1997). Female sperm whales nearly always inhabit waters
>3,281 ft (1,000 m) in depth far from land (Whitehead, 2018). The migration patterns of sperm whales
are not well understood, as some whales show seasonal north-south migrations, and some whales show
no clear seasonal migration pattern at all, especially in equatorial waters (Whitehead, 2009). In ocean
waters between 40° N and 45° N, female sperm whales with calves often remain on breeding grounds
throughout the year, while males migrate between low-latitude breeding areas and higher-latitude
feeding grounds (Pierce et al., 2007; Rice, 1989; Whitehead, 2003). In the northern hemisphere,
“bachelor” groups (males 15 to 21 yr old) generally leave warm waters at the beginning of summer to
migrate to feeding grounds and in fall and winter, most bachelors return south, although some may
remain in the colder northern waters during most of the year (Pierce et al., 2007). Specific breeding and
foraging grounds are not well known for this species.
Sperm whales may make the longest and deepest dives of any mammal, with maximum recorded dives
to 4,921 ft (1,500 m) (Davis et al., 2007), although examination of stomach contents of sperm whales
suggests that sperm whales may dive as deep as 10,498 ft (3,200 m) (Clarke, 1976). Foraging dives to
depths of 965 to 4,701 ft (294 to 1,433 m) and non-foraging dives to a water depth of 1,640 ft (500 m)
were recently measured (Guerra et al., 2017; Joyce et al., 2017). In general, dive durations range
between 18.2 to 65.3 min (Watkins et al., 2002). Foraging dives typically last about 30 to 65 min (Joyce
et al, 2017; Papastavrou et al., 1989; Wahlberg, 2002), while non-foraging dives of about 30 min were
measured (Joyce et al., 2017). Sperm whale’s surface speeds generally average 0.7 to 2.2 kt (1.3 to 4
kph), with maximum speeds of about 5.1 kt (9.4 kph) (Jochens et al., 2008; Lockyer, 1997; Watkins et al.,
2002; Whitehead, 2009). Dive swim rates range from 2.8 to 5.5 kt (5.2 to 10.1 kph) (Lockyer, 1997).
Audiograms measured from a sperm whale calf suggest a hearing range of 2.5 to 60 kHz, with best
hearing sensitivity between 5 and 20 kHz (Ridgway and Carder, 2001). Measurements of evoked
response data from one stranded sperm whale have shown a lower limit of hearing near 100 Hz (Gordon
et al., 1996).
Sperm whales produce broadband echolocation clicks with energy from less than 100 Hz to 30 kHz
(Goold and Jones, 1995; Madsen et al., 2002a; Møhl et al., 2000; Thode et al., 2002; Watkins and
Schevill, 1977; Weilgart and Whitehead, 1997). Regular click trains and creaks have been recorded from
foraging sperm whales and may be produced as a function of echolocation (Jaquet et al., 2001; Madsen
et al., 2002b; Whitehead and Weilgart, 1991). A series of short clicks, termed “codas,” have been
associated with social interactions and are thought to play a role in communication (Pavan et al., 2000;

LOA and Rulemaking Application Under the MMPA for Use of SURTASS LFA Sonar
4-37 Status and Distribution
Watkins and Schevill, 1977; Weilgart and Whitehead, 1993). Clicks are strongly directional, with SELs
measured between 202 and 236 dB (Madsen and Møhl, 2000; Møhl et al., 2000; Møhl et al., 2003;
Thode et al., 2002). Møhl (2003) reported that the maximum SL for sperm whale clicks was 236 dB with
other calls ranging from 226 to 234 dB. Zimmer et al. (2005b) reported SL of the sperm whale’s HF sonar
component of clicks that are used to search for prey as 229 dB (peak value), while the LF component is
apparently used to conveys sound to conspecifics at large ranges and peak frequencies that are depth
dependent to over 1,640 ft (500 m). Sperm whales also produce sounds including creaks, squeals, and
trumpets as well as codas, which are series of 3 to 20 clicks that last from 0.2 to 2 sec and are social
vocalizations (Whitehead, 2003 and 2018).
4.2.24 Spinner Dolphin (Stenella longirostris)
Spinner dolphins are classified overall as a data deficient species by the IUCN. Spinner dolphins are one
of the most abundant dolphin species in the world. In the western North Pacific, 1,015,059 spinner
dolphins have been estimated (Ferguson and Barlow, 2001 and 2003), while in Hawaiian waters, the
Hawaii pelagic stock includes 3,351 dolphins (Barlow, 2006), and the island associated populations
include the Kaua‘i and Ni‘ihau stock of 601 individuals, the Hawai‘i Island stock that number 631
dolphins, the Oahu/4-Islands stock with 355 spinner dolphins, the Kure/Midway Atoll stock of 260
dolphins, and the Pearl and Hermes Reef stock of 300 spinner dolphins (Andrews et al., 2006; Carretta et
al., 2014; Hoos, 2013). The spinner dolphin population in the Indian Ocean is estimated as 634,108
individuals (Wade and Gerrodette, 1993).
Spinner dolphins are pantropical, occurring in tropical and most subtropical oceanic waters from about
40°S to 40°N, except in the Mediterranean Sea (Jefferson et al. 2015). Spinner dolphins are found in
coastal regions of Hawaii, the eastern Pacific, Indian Ocean, and off Southeast Asia, usually resting in the
shallow waters of bays of oceanic islands and atolls (Perrin, 2009d). The dwarf species occurs only in the
shallow waters of Southeast Asia and northern Australia is found in shallower waters in the Gulf of
Thailand, Timor Sea, and Arafura Sea (Jefferson et al., 2015).
Based on where their prey is located in the water column, spinner dolphins likely dive as deep as 1,969
ft (600 m) (Perrin, 2009d). Dive durations are unknown for this species. Spinner dolphins are known for
their aerial behavior, spinning up to seven times during one aerial leap from the water, reaching heights
of 9 ft (3 m) above the water surface with an airborne time of 1.25 sec (Fish et al., 2006). Hawaiian
spinner dolphins have swim speeds ranging from 1.4 to 3.2 kt (2.6 to 6 kph) (Norris et al., 1994).
Greenhow et al. (2016) measured the hearing threshold of a spinner dolphin using AEP methods, and
reported a peak sensitivity at 40 kHz and functional hearing up to 128 kHz; these sensitivities are similar
to those of other measured dolphins. Spinner dolphins produce burst pulse calls, echolocation clicks,
whistles, and screams (Bazua-Duran and Au, 2002; Norris et al., 1994). The results of a study on spotted
and spinner dolphins conducted by Lammers et al. (2003) revealed that the whistles and burst pulses of
the two species span a broader frequency range than is traditionally reported for delphinids. The
fundamental frequency contours of whistles occur in the human hearing range, but the harmonics
typically reach 50 kHz and beyond. The whistle contours of near shore spinner dolphins in Hawaii show
geographic variation between groups (Bazua-Duran and Au, 2004), correlating with the Island associated
populations. Additionally, the burst pulse signals are predominantly ultrasonic, often with little or no
energy below 20 kHz (Lammers et al., 2003). Echolocation clicks show the typical delphinid broadband
character, with center frequencies ranging from 34 to 58 kHz, peak frequencies from 27 to 41 kHz, and
durations of 140 to 620 s (Baumann-Pickering et al., 2010).
LOA and Rulemaking Application Under the MMPA for Use of SURTASS LFA Sonar
4-38 Status and Distribution
4.2.25 Striped Dolphin (Stenella coeruleoalba)
Striped dolphins are a lower risk (least concern) species classified by the IUCN. In the Hawaii stock,
61,201 striped dolphins (CV=0.38) are estimated (Bradford et al., 2017). The WNP population of striped
dolphins is divided into Northern, Southern, and Japanese Coastal stocks, with 497,725; 52,682; and
19,631 whales, respectively, estimated for each stock (Miyashita, 1993; Kasuya and Perrin, 2017). The
Indian Ocean striped dolphin population is estimated to include 674,578 individuals (Wade and
Gerrodette, 1993).
Striped dolphins are common in tropical and warm-temperate oceanic waters of the Atlantic, Pacific,
and Indian oceans and adjacent seas between roughly 50° N and 40° S (Jefferson et al., 2015). Striped
dolphins may be found in coastal waters in areas with very narrow continental shelves or where deep
waters are found close to shore. Their occurrence appears to be associated with oceanographic fronts or
circulation features in many regions, such as the ETP. Striped dolphins occur further north than other
Stenella species, although in the western North Pacific Ocean, striped dolphins only very rarely occur in
the Sea of Japan, East China Sea, Yellow Sea, or Sea of Okhotsk, even though the water temperatures
appear to be in the range the species prefers (Kasuya and Perrin, 2017). In the western North Pacific
Ocean, striped dolphins are divided into three stocks in the Pacific waters east of Japan. The oceanic
Northern and Southern stocks of striped dolphins are latitudinally separated at about 35° N, while the
Japanese Coastal stock is located west of the Northern and Southern stocks in the Pacific waters
southeast of the main Japanese Islands of Honshu, Kyushu, and Shikoku (Kasuya and Perrin, 2017).
Dive times are unknown for this species. Based on stomach contents, it is predicted that striped dolphins
may be diving down 656 to 2,297 ft (200 to 700 m) to feed (Archer, 2009). Average swim speeds of 5.9
kt (11 kph) were measured from striped dolphins in the Mediterranean (Archer and Perrin, 1999).
The behavioral audiogram developed by Kastelein et al. (2003) shows hearing capabilities from 0.5 to
160 kHz. The best underwater hearing of the species appears to be at from 29 to 123 kHz (Kastelein et
al., 2003). Striped dolphins produce whistle vocalizations lasting up to three seconds, with frequencies
ranging from 1.5 to >24 kHz, with peak frequencies ranging from 8 to 12.5 kHz (Azzolin et al., 2013;
Thomson and Richardson, 1995). An examination of whistle structure within the Mediterranean Sea
found geographic variation between different sub-populations (Azzolin et al., 2013).
4.3 Pinnipeds
Five pinnipeds species may occur in the representative model areas for SURTASS LFA sonar (Table 3-1).
Eared or otariid seals are distinguished by swimming with their foreflippers and moving on all fours on
land. In contrast, true or phocid seals swim with undulating motions of the rear flippers and have a type
of crawling motion on land. Otariids have ear flaps (pinnae) that are similar to carnivore ears. Phocid
ears have no external features and are more water-adapted. Otariids have also retained their fur coats
(Berta, 2009), whereas phocids and walruses have lost much of their fur and instead have thick layers of
blubber. Many pinniped populations today have been reduced by commercial exploitation, incidental
mortality, disease, predation, and habitat destruction (Bowen et al., 2009). Pinnipeds were hunted for
their furs, blubber, hides, and organs. Some stocks have begun to recover. However, populations of
species such as the northern fur seal and the Steller sea lion continue to decline (Gentry, 2009a).
Hearing capabilities and sound production are highly developed in all pinniped species studied to date.
Pinnipeds hear both underwater and in air. Phocids hear underwater at frequencies from 50 Hz to 86
kHz, whereas otariids hear from 60 Hz to 39 kHz (NMFS, 2016). It is assumed that pinnipeds rely heavily

LOA and Rulemaking Application Under the MMPA for Use of SURTASS LFA Sonar
4-39 Status and Distribution
on sound and hearing for breeding activities and social interactions (Berta, 2009; Frankel, 2009;
Schusterman, 1978).
4.3.1 Otariids
4.3.1.1 Northern Fur Seal (Callorhinus ursinus)
Northern fur seals are currently classified as vulnerable under IUCN Red List of Threatened Species
(Gelatt et al., 2015). The Pribilof Island/Eastern Pacific stock, which does not coincide with the study
area for SURTASS LFA sonar, is considered depleted under the MMPA. The global population of northern
fur seals in 2014 was estimated as 1.29 million seals, which represented a population decline of about
30 percent since 1976 (Gelatt et al., 2015). The Western Pacific stock of northern fur seals is estimated
to include 503,609 individuals (Gelatt et al., 2015; Kuzin, 2014).
Northern fur seals are widely distributed in pelagic waters across the North Pacific Ocean from about
35° N northward to the Bering Sea, including the Sea of Okhotsk and the Sea of Japan (Jefferson et al.,
2015). Primary breeding sites include the Commander Islands, Kuril Islands, Pribilof Islands, Robben
Island, Bogoslof Island, Tyuleny Island, Farallon Islands, and San Miguel Island (Gentry, 2009b). Northern
fur seals are one of the most pelagic pinnipeds, with adults only coming ashore for about 40 days during
the breeding season and not hauling out on land except during that period. In late autumn, northern fur
seals leave their rookeries and migrate southward for the winter to foraging areas. Northern fur seals
from the Bering Sea and Aleutian Islands rookeries migrate into the northeastern Pacific through the
Aleutian passes, while seals from Tyuleny Island, the Commander Islands, and Kuril Islands migrate
southward into the Sea of Japan and in the Pacific waters off Japan (Gentry, 2009b; Horimoto et al.,
2016 and 2017). In the Sea of Japan, adult male northern fur seals predominate and forage in waters
over the narrow continental shelf that drops steeply into 6,562 ft (2,000 m) deep waters (Horimoto et
al., 2016), while in Pacific waters of northern Japan, adult female and.juvenile northern fur seals
dominate (Horimoto et al., 2017).
Maximum recorded dive depths of breeding female northern fur seals are 680 ft (207 m) in the Bering
Sea and 755 ft (230 m) in Pacific waters off southern California (Goebel, 1998). Juvenile fur seals in the
Bering Sea had an average dive time of 1.24 min at an average depth of 57.4 ft (17.5 m) (Sterling and
Ream, 2004). Kooyman et al. (1976) measured shallow dives (to 66 ft [20 m]) of northern fur seals to last
1 min, while deeper dives (to 459 ft [140 m]) lasted from 2 to 5 min in duration, and the average interval
between dives was 17 min. Goebel et al. (1991) calculated average dive durations of 4.1 min for shallow
dives and 7.3 min for deep dives, which were similar to the measured modal durations of <2 min for
shallow dives and 3 to 5 min for deep dives that Ponganis et al. (1992) reported. Ream et al. (2005) and
Sterling et al. (2015) noted that the preponderance of deeper dives occur at night during the full moon,
likely related to the vertical migration of prey. Routine migration swim speeds are 1.54 kt (2.85 kph),
while during foraging, swim speeds averaged between 0.48 and 1.23 kt (0.89 and 2.28 kph) (Ream et al.,
2005). Lactating female northern fur seals swam 2.7 kt (5 kph) during foraging forays in the Bering Sea
(Battaile et al., 2015).
The northern fur seal can hear sounds in the range of 500 Hz to 40 kHz (Babushina et al., 1991; Moore
and Schusterman, 1987), with best hearing ranging from 2 and 12 kHz (Gentry, 2009a). Moore and
Schusterman (1987) measured the in-air hearing sensitivity of the northern fur seal as 500 Hz to 32 kHz
and the in-water hearing sensitivity from 2 to 32 kHz. Babushina et al. (1991) reported that underwater
hearing sensitivity of the northern fur seal is 15 to 20 dB better than in-air hearing sensitivity. Northern
LOA and Rulemaking Application Under the MMPA for Use of SURTASS LFA Sonar
4-40 Status and Distribution
fur seals are known to produce clicks and high-frequency bleating sounds under water (Frankel, 2009).
On land during breeding season, males make low growls and roars (Antonelis and York, 1985). Female
northern fur seals emit calls when returning from foraging trips to attract and locate their pups
(Bartholomew, 1959).
4.3.1.2 Western Steller Sea Lion (Eumetopias jubatus jubatus)
The Steller sea lion is divided taxonomically into two species that effectively represent the Western and
Eastern stocks and DPSs of Steller sea lions (SMM, 2017). The Western Steller sea lion occurs west of
Cape Suckling, Alaska (Loughlin and Gelatt, 2018). As a species, the Steller sea lion is classified as near
threatened under the IUCN Red List of Threatened Species, with the Western Steller sea lion classified as
endangered (Gelatt and Sweeney, 2016). Under the ESA, only the Western DPS of is listed as
endangered under the ESA and depleted under the MMPA. The Western stock/DPS and Asian stock of
the Western Steller sea lion occur within the study area for SURTASS LFA sonar. The worldwide
population size of Steller sea lions is estimated to be 160,867 (Gelatt and Sweeney, 2016). The Western
U.S. stock and DPS (west of Cape Suckling, Alaska) is estimated at 53,303 sea lions (Muto et al., 2018),
and the Western Asian stock (Russia to Japan) stock of Steller sea lions has been estimated to include
17,918 individuals (Burkanov, 2017; Muto et al., 2018), for a total Western Steller sea lion population of
71,221 individuals.
Steller sea lions are found in temperate to sub-polar waters and are widely distributed throughout the
North Pacific Ocean from Japan/Korea and central California to the southern Bering Sea, including the
Sea of Japan and Sea of Okhotsk (Jefferson et al., 2015). The northernmost rookery is found at Seal
Rocks in Prince William Sound, Alaska, and the southernmost rookeries are found at Año Nuevo Island in
California and Medny Island, in the Commander Islands, Kamchatka (Burkanov and Loughlin, 2007;
Loughlin, 2009). Steller sea lions typically occur in coastal to outer continental shelf waters but cross
deep oceanic waters in parts of their range (Jefferson et al., 2015; Loughlin and Gelatt, 2016). Steller sea
lions are not migratory, but often disperse widely over the North Pacific after the breeding season.
Most dives by pup and juvenile Steller sea lions are of short duration (<1 min) and to shallow water
depths (<33 ft [10 m]), although they are capable of diving to the same depths and dive durations as
adults (Pitcher et al., 2005). Juvenile and sub-adult Steller sea lions dove to the maximum depth of 1,184
ft (361 m), which was the deepest measurable depth, and for the maximum durations of 4.9 min and
13.2 min, respectively (Rehberg and Burns, 2008). Female Steller sea lions on foraging trips during the
breeding season dove to the maximum dive depth of 774 ft (236 m), while the longest dive was longer
than 16 min; the average dive depth for foraging females was 97.1 ft (29.6 m) and the average dive time
was recorded at 1.8 min (Rehberg et al., 2009). The deepest dive depth to which a Steller sea lion has
been recorded diving is 1,391 ft (424 m). Swim speed has been estimated at 1.5 kt (2.82 kph), with a
range of 0.2 to 3.3 kt (0.4 to 6.05 kph) (Raum-Suryan et al., 2004). A swim speed measured during dives
was 2.7 kt (5 kph) (Merrick et al., 1994). Hindle et al. (2010) measured three adult Steller sea lions
swimming at transit speeds from 3.5 to 4.5 kt (6.5 to 8.3 kph) and noted that these transit speeds were
associated with minimal energetic costs.
Using behavioral methods, Kastelein et al. (2005) measured the underwater audiograms of a male and a
female Steller sea lion. Maximum hearing sensitivity in the male Steller sea lion was at 1 kHz for 77 dB RL
signals, with the range of best hearing between 1 and 16 kHz, at 10 dB from the maximum sensitivity;
the average pre-stimulus responses occurred at low frequency signals (Kastelein et al., 2005). The
maximum hearing sensitivity of the female Steller sea lion was 25 kHz for a RL signal of 73 dB RL

LOA and Rulemaking Application Under the MMPA for Use of SURTASS LFA Sonar
4-41 Status and Distribution
(Kastelein et al., 2005). The reasons for the differences in hearing capability between the male and
female adult Steller sea lions was not known.
Steller sea lions produce sounds both in air and underwater. The underwater sounds produced by Steller
sea lions have been described as clicks and growls (Frankel, 2009; Poulter, 1968). The in-air sounds
produced by male Stellers, described as belches, growls, snorts, scolds, hisses, and LF roars appear to be
part of territorial demonstrations during the breeding season (Kastelein et al., 2005). Females and their
pups make in-air communication sounds that are described as bellows and bleats (Loughlin, 2009). No
available data exist on seasonal or geographical variation in the sound production of this species.
4.3.2 PHOCIDS
4.3.2.1 Hawaiian Monk Seal (Monachus schauinslandi)
Hawaiian monk seals are listed as endangered under the ESA throughout its range, as endangered under
the IUCN Red List of Threatened Species (Littnan et al., 2015), as depleted under the MMPA, and are
protected under CITES. Critical habitat for the Hawaiian monk seal has been established from the shore
to 121 ft (37 m) of water depth in 10 areas of the Northwest Hawaiian Islands (NWHI) (NOAA, 1988). In
2015, revisions to the Hawaiian monk seal’s critical habitat were established (NOAA, 2015b). The critical
habitat now includes all of Kure Atoll, Midway Islands, Pearl and Hermes Reef, Lisianski Island, Laysan
Island, Maro Reef, Gardner Pinnacles, French Frigate Shoals, Necker Island, Nihoa, Kaula Island and
Niihau and Lehua Islands to the 628-ft (200-m) isobath It also includes selected portions of the
remaining main Hawaiian Islands and all waters to the 656-ft (200-m) isobath (excluding National
Security Exclusion zones off Kauai, Oahu and Kahoolawe) (NOAA, 2015b). The Hawaii stock of Hawaiian
monk seals consists of two subpopulations: Northwest Hawaiian Islands (NWHI) and the Main Hawaiian
Islands (MHI) (NMFS, 2018a). Since the early 1990s, a small but increasing number of monk seals and an
increasing number of annual births have been documented in the MHI (NMFS, 2011b and 2018). The
two subpopulations of Hawaiian monk seals are not isolated from one another, with seals moving
between the two subpopulations and island groups (NMFS, 2018d). The subpopulation of Hawaiian
monk seals that occurs in the NWHI, which encompasses 80 percent of the overall population, is
currently considered stable and is possibly increasing while the MHI subpopulation continues to expand
(NMFS, 2018a and 2018d). Six breeding groups within the NWHI subpopulation have been identified:
Kure Atoll, Midway Islands, Pearl and Hermes Reef, Lisianski Island, Laysan Islands, and French Frigate
Shoals (Littnan et al., 2015). The best available, most current population estimate for the Hawaii stock of
Hawaiian monk seals is 1,427 individuals (95 percent confidence limit=1,542) (NMFS, 2018a).
Hawaiian monk seals only occur throughout the subtropical waters of the Hawaiian Archipelago and
Johnson Atoll (NOAA, 2011b), and may be found in water depths ranging from 3 to 984 ft (1 to 300 m) in
shelf, slope, and bank habitats. Hawaiian monk seals come ashore (haul out) daily on a variety of
substrates, including sandy beaches, rocky shores, rock ledges, and emergent reefs. Hawaiian monk
seals from Kure Atoll, the westernmost atoll in the NWHI, may forage on Hancock Banks, NW of Kure
Atoll. Although not a migratory species, Abernathy (1999) and Parrish et al. (2002) reported that
Hawaiian monk seals may travel a distance of as much as 216 nmi (400 km) to forage. Hancock Banks are
approximately 162 nmi (300 km) northwest of Kure Atoll and are characterized by a single pinnacle that
is shallower than 1,476 ft (450 m), which is within the known foraging range for foraging Hawaiian monk
seals. In this SEIS/SOEIS, Hawaiian monk seals are considered to potentially range and forage as far west
as Hancock Banks, which is located within the Offshore Japan (25 to 40° N) model area (Model Area #8)

LOA and Rulemaking Application Under the MMPA for Use of SURTASS LFA Sonar
4-42 Status and Distribution
for SURTASS LFA sonar. Hawaiian monk seals exhibit high site fidelity to their natal island (Gilmartin and
Forcada, 2009), and pupping only occurs on sandy beaches.
Hawaiian monk seals spend a greater proportion of their time at sea; Wilson et al. (2017a) noted that on
average, Hawaiian monk seals spent 49 percent of their time diving, 19 percent on the sea surface, and
32 percent of their time hauled out on land. Hawaiian monk seals appear to exhibit a single dive type,
which is a square-shaped, benthic dive pattern that indicates more than 50 percent of the dive time is
spent foraging along the seafloor in deeper more offshore waters; most dives (70 percent) occurred
during daylight hours (Wilson et al., 2017b). This species commonly dives to water depths less than 328
ft (100 m), but dives have been recorded as deep as 984 to 1,805 ft (300 to 550 m) (Parrish et al., 2002;
Stewart et al., 2006). Wilson et al. (2017a) reported that Hawaiian monk seals in the MHI dove to water
depths from 66 to 98 ft (20 to 50 m). The Hawaiian monk seal can also dive for up to 20 min and perhaps
longer (Parrish et al., 2002). Routine dives range from 3 to 6 min in primarily shallow water depths from
33 to 131 ft (10 to 40 m) are typical (Stewart, 2009; Wilson, 2015). Kiraç et al. (2002) reported mean dive
times of 6.4 min, while Wilson et al. (2017a) reported mean dive durations of 5.9 min. Swim speed data
on the Hawaiian monk seal are sparse. Hawaiian monk seals swim near the bottom almost exclusively
while at sea (Parrish et al., 2005 and 2008; Wilson, 2015). Parrish and Abernathy (2006) reported
Hawaiian monk seals swimming with a velocity of 3.9 kt (7.2 kph).
Only one audiogram has been recorded for the Hawaiian monk seal, which indicated relatively poor
hearing sensitivity, a narrow range of best hearing sensitivity (12 to 28 kHz), and a relatively low upper
frequency limit (Thomas et al., 1990b); it should be noted that this information may not be
representative, as the Hawaiian monk seal tested was an older, captive animal. Above 30 kHz, high-
frequency hearing sensitivity dropped markedly (Thomas et al., 1990b). No underwater sound
production has been reported for this species. Recorded in-air vocalizations of Hawaiian monk seals
consist of a variety of sounds, including a liquid bubble sound (100 to 400 Hz), a guttural expiration
(about 800 Hz) produced during short-distance agonistic encounters, a roar (<800 Hz) for long-distance
threats, a belch-cough made by males when patrolling (<1 kHz), and sneeze/snorts/coughs of variable
frequencies that are <4 kHz (Miller and Job, 1992).
4.3.2.2 Ribbon Seal (Phoca fasciata)
Ribbon seals are classified as least concern by the IUCN Red List of Threatened Species (Lowry, 2016).
The most recent population of ribbon seals occurring in the Sea of Okhotsk, Russia was estimated as
181,179 individuals (95 percent CI=118,392 to 316,995) (Chernook et al., 2015), while the Alaska, Bering
Sea population of ribbon seals was estimated to include 184,000 seals (95 percent CI=146,000
to230,000) (Conn et al, 2014; Muto et al., 2017). Lowry (2016) combined these Bering Sea and Sea of
Okhotsk estimates for a total North Pacific population estimate of 365,000 ribbon seals, which is close to
the approximated estimate of 500,000 seals that Boveng and Lowry (2018) recommended.
The ribbon seal is a pagophilic or ice-loving species, with a distribution limited to the northernmost
Pacific Ocean and Arctic Ocean including the Chukchi Sea, with predominant occurrence in the Bering
Sea and Sea of Okhotsk (Fedoseev, 2009; Jefferson et al., 2015). Ribbon seals are associated with the
southern edge of the pack ice from winter through early summer, where they pup and molt on the ice
that is commonly found along the continental shelf where there is high water circulation (Fedoseev,
2009). During the summer months, ribbon seals have a pelagic distribution that likely encompasses a
broader distributional range than the time of year when the seals are dependent upon sea ice (Jefferson
et al., 2015).

LOA and Rulemaking Application Under the MMPA for Use of SURTASS LFA Sonar
4-43 Status and Distribution
Few dive data and no swim speed data are known for this species. Boveng et al. (2013) noted that
ribbon seal diving patterns are tied to season, with a tendency for the dive depths to increase as the ice
edge expands south, nearer to the continental shelf break. When ribbon seals on are on the sea ice in
shallow water during spring, they dive to the sea floor, typically to depths of 233 to 328 ft (71 to 100 m),
but when not tied to sea ice, ribbon seals dive deeper, up to 1640 ft (500 m) and rarely to 1,969 ft (600
m) (Boveng et al., 2013). London et al. (2014) reported that ribbon seals often dove to water depths of
656 ft (200 m) with some dives exceeding 1,969 ft (600 m). No dive duration data are available
(Ponganis, 2015).
There is no direct measurement of auditory threshold for the hearing sensitivity of the ribbon seal
(Thewissen, 2002). Ribbon seals produce two types of underwater vocalizations with frequencies
between 100 Hz and 7.1 kHz and an estimated SEL recorded at 160 dB (Watkins and Ray, 1977). Ribbon
seals produce short, broadband puffing noises and downward-frequency swept sounds that are long and
intense, include harmonics, vary in duration, and do not waver; puffs last less than 1 sec and are below 5
kHz while sweeps are diverse and range from 100 Hz to 7.1 kHz (Watkins and Ray, 1977). Watkins and
Ray (1977) hypothesized that the sounds of ribbon seals produce are associated with social interactions
during the mating season and may be part of territorial displays. Ribbon seals also produce grunts, roars,
growls, and hisses (Jones et al., 2014; Miksis-Olds and Parks, 2011). Miksis-Olds and Parks (2011) noted
that the ribbon seal vocalizations were only recorded when ice covered was >80 percent, typically
during the winter to spring breeding season.
4.3.2.3 Spotted Seal (Phoca largha)
Spotted or largha seals are classified as a least concern by the IUCN Red List of Threatened Species
(Boveng, 2016). The Southern DPS of spotted seals, which consists of breeding concentrations in the
Yellow Sea and Peter the Great Bay in the Sea of Japan, is listed as threatened under the ESA and
depleted under the MMPA. The global population of the spotted seal is estimated to include 640,000
individuals (Boveng, 2016; Frost and Burns, 2018). Fedoseev (2000) reported that 180,000 seals occur in
the Sea of Okhotsk stock/DPS, while Mizuno et al. (2002) reported an average abundance of 10,099
seals in the southern Sea of Okhotsk off Hokkaido, Japan during March and April 2000. Conn et al. (2014)
and Muto et al. (2018) estimated 461,625 spotted seals (95 percent CI: 388,732 to 560,348) in the Alaska
stock/Bering Sea DPS. Additionally, Trukhin and Mizuno (2002) reported 1,000 spotted seals in Peter the
Great Bay and that this population had maintained this stable number of seals for at least 10 years. The
total population in the Southern DPS/stock of spotted seals is estimated as 3,500 individuals (Boveng,
2016; Han et al., 2010; Nesterenko and Katin, 2008).
Spotted seals occur in cold temperate to Arctic waters of the North Pacific and Arctic oceans, including
the Yellow Sea, East China Sea, Sea of Japan, Sea of Okhotsk, Bering Sea, and Chukchi Sea; spotted seals
occur as far east in the Arctic Ocean as the Mackenzie River Delta and as far west as about 170° E
(Boveng, 2016; Jefferson et al., 2015). Spotted seals are found either in open-ocean or in pack-ice
habitats throughout the year, including the ice over continental shelves during the winter and spring
(Burns, 2009). This species hauls out on sea ice but also comes ashore on land during the ice-free
seasons of the year (Boveng, 2016). The range of spotted seals contracts and expands in association with
ice cover, and their distribution is most concentrated during the period of maximum ice cover (Burns,
2009). When the ice cover recedes in the Bering Sea, some spotted seals migrate northward into the
Chukchi and Beaufort seas. As the ice cover increases in the northern waters of their range, spotted
seals migrate southward through the Chukchi and Bering seas to maintain association with drifting ice.
Peak haul-out time is during molting and pupping from February to May (Burns, 2009).

LOA and Rulemaking Application Under the MMPA for Use of SURTASS LFA Sonar
4-44 Status and Distribution
Dives as deep as 984 to 1,312 ft (300 to 400 m) have been reported for adult spotted seals, with pups
diving to 263 ft (80 m) (Bigg, 1981). London et al. (2014) noted that most spotted seal dives were to
depths <230 ft (70 m) but dives from 230 to 656 ft (70 to 200 m) were observed primarily during the late
winter and spring. Lowry et al. (1994) reported that spotted seals in the Chukchi Sea dove to waters
<328 ft (100 m) in depth and that no dives exceeded <10 min in duration. Swim speeds range from 0.2
to 2.8 kt (0.4 to 5.2 kph), with an average speed of 1.2 kt (2.2 kph) have been observed (Lowry et al.,
1998).
Spotted seals can hear underwater from 300 Hz to 56 kHz, with best sensitivity between 2 and 30 kHz at
a threshold of ~ 55 dB, while in air, spotted seal’s hearing sensitivity ranges from 6 Hz to 11 kHz (Sills et
al., 2014). Underwater hearing sensitivity in a spotted seal has been measured to 72.4 kHz (Reichmuth
et al., 2013). Recently, Cunningham and Reichmuth (2017) tested the ability of several pinniped species
to hear high frequency (HF) sounds underwater; the ability of a 4-year old spotted seal to hear
underwater sounds from 50 to 180 kHz was measured, with the spotted seal able to detect sounds up to
180 kHz, which was well beyond the limit of their presumed HF hearing capability. Adult spotted seals
vocalize in the air and underwater (Frost and Burns, 2018). Underwater vocalization of captive spotted
seals increased 1 to 2 weeks before mating and was higher in males than females, with the sounds
produced inicluding growls, drums, snorts, chirps, and barks that ranged in frequency from 500 Hz to 3.5
kHz (Richardson et al., 1995).
LOA and Rulemaking Application Under the MMPA for Use of SURTASS LFA Sonar
5-1 Authorization Type Requested
5 TYPE OF INCIDENTAL TAKE AUTHORIZATION REQUESTED
Pursuant to Section 101 (a)(5)(A) of the MMPA of 1972, as amended (16 USC 1371), the Navy is applying
for rulemaking and a LOA to incidentally take marine mammals due to the continued use of Surveillance
Towed Array Sensor System (SURTASS) Low Frequency Active (LFA) sonar systems onboard Navy
surveillance ships for training and testing activities conducted under the authority of the Secretary of
the Navy within the western and central North Pacific and eastern Indian oceans. The MMPA directs the
Secretary of Commerce to allow, upon request, the incidental, but not intentional taking of marine
mammals by U.S. citizens who engage in a specified activity (other than commercial fishing). The
issuance occurs when the Secretary, after notice has been published in the Federal Register and
opportunity for comment has been provided, finds that such takes would have a negligible impact on
the species and stocks of marine mammals and would not have an unmitigable adverse impact on their
availability for subsistence uses.
Marine mammals have the potential to be incidentally harassed by the underwater sound generated
during the use of SURTASS LFA sonar. As a result, the Navy is requesting rulemaking under the MMPA
and a LOA for the taking of marine mammals by Level B harassment incidental to the use of SURTASS
LFA sonar for training and testing within the western and central North Pacific and eastern Indian
oceans. No Level A incidental harassment or lethal taking is requested since the conservative mitigation
zone around the transmitting sonar and the suite of other mitigation and monitoring measures
employed during use of LFA sonar onboard all vessels, the sonar’s operational parameters, and the
geographic restrictions governing the operation of SURTASS LFA sonar preclude any reasonably
foreseeable injury or mortality to potentially occurring marine mammals. Throughout the more than
sixteen years of the Navy’s use of SURTASS LFA sonar, no injury or mortality has ever been documented
or reported to have occurred as a result of LFA sonar transmissions.
Requirement 5: Type of incidental take authorization that is being requested (i.e., takes by harassment
only; takes by harassment, injury, and/or death) and the method of incidental taking.
LOA and Rulemaking Application Under the MMPA for Use of SURTASS LFA Sonar
6-1 Incidental Takes
6 INCIDENTAL TAKES
Potential impacts to marine mammals from the use of SURTASS LFA sonar should be assessed in the
context of the basic operational characteristics of the system:
• SURTASS LFA sonar equipped vessels are U.S. Coast Guard certified for operations. In addition,
these vessels would operate in accordance with all applicable federal and U.S. Navy rules and
regulations related to environmental compliance. SURTASS LFA sonar vessel movements are not
unusual or extraordinary and are in line with routine operations of seagoing vessels. Therefore,
there should be no unregulated environmental impacts from the SURTASS LFA sonar vessels.
• At-sea activities would be temporary in nature. During training and testing activities, SURTASS
LFA sonar would transmit 496 transmission hours in years 1 to 4 and 592 transmission hours in
year 5 and continuing into the foreseeable future, regardless of the number of SURTASS LFA
sonar equipped vessels.
• The maximum duty cycle (ratio of sound “on” time to total time) of SURTASS LFA sonar is 20
percent. However, the typical duty cycle, based on historical LFA operational parameters since
2003, is nominally 7.5 to 10 percent. That is, 7.5 to 20 percent of the time, SURTASS LFA sonar
could be transmitting while 80 to 92.5 percent of the time SURTASS LFA sonar would not be
transmitting, thus adding no sound into the water.
• Wavetrains last between 6 and 100 sec with an average length of 60 sec.
• The typical LFA sonar signal is not a constant tone. The duration of each continuous frequency
sound transmission is no longer than 10 sec.
• The source frequency is between 100 and 500 Hz.
• The SL of an individual source projector of the SURTASS LFA sonar array is approximately 215 dB
re 1 µPa @ 1 m SPL or less. As measured by SPL, the sound field of the array can never be higher
than the SL of an individual source projector.
The types of potential impacts on marine mammals from SURTASS LFA sonar can be broken down into
several categories:
• Non-auditory impacts: Non-auditory impacts include direct acoustic impact on tissue, indirect
acoustic impact on tissue surrounding a structure, and acoustically mediated bubble growth
within tissues from supersaturated dissolved nitrogen gas. These types of impacts have the
potential to cause (1) resonance of the lungs/organs, (2) tissue damage, and (3) mortality. There
is very little potential for these impacts from SURTASS LFA sonar activities and no injury or
mortality is requested as part of this application.
• Auditory impacts: Auditory impacts include permanent threshold shift (PTS), which is a
condition that occurs when sound intensity is very high and/or of such long duration that the
result is a permanent loss of hearing sensitivity over the frequency band of the exposure; i.e., a
Requirement 6: Age, sex, and reproductive condition (if possible), the number of marine mammals (by
species) that may be taken by each type of taking identified in paragraph (a)(5) of this section, and the
number of times such takings by each type of taking are likely to occur.

LOA and Rulemaking Application Under the MMPA for Use of SURTASS LFA Sonar
6-2 Incidental Takes
physical injury. PTS constitutes Level A incidental “harassment” for marine mammals under the
MMPA as it is considered auditory tissue injury that causes irreparable damage (Southall et al.,
2007). Temporary threshold shift (TTS) is a lesser impact to hearing caused by underwater
sounds of sufficient loudness to cause a transient condition in which an animal's hearing
sensitivity over the frequency band of exposure is impaired for a period of time (minutes to
days). With TTS, hearing is not permanently or irrevocably damaged and no physical tissue
damage occurs, so TTS is not considered an injury (Richardson et al., 1995; Southall et al., 2007)
and constitutes Level B incidental harassment under the MMPA.
• Behavioral change: Behavioral responses to sounds in a marine animal’s environment vary from
subtle changes in surfacing and breathing patterns to cessation of vocalization or even active
avoidance or escape from regions of high sound levels (Wartzok et al., 2004). For military
readiness activities such as the use of SURTASS LFA sonar, Level B incidental “harassment” under
the MMPA is defined as any act that disturbs or is likely to disturb a marine mammal by causing
disruption of natural behavioral patterns to a point where the patterns are abandoned or
significantly altered.
• Masking: The presence of intense sounds in the environment can potentially interfere with an
animal’s ability to hear other relevant sounds. This impact, known as “auditory masking”, could
interfere with the animal's ability to detect biologically-relevant sounds, such as those produced
by predators, prey, or reproductively active mates. During auditory masking, an animal may,
thus, not be able to escape predacious attack, locate food, or find a reproductive partner.
• Physiological stress: Exposure to underwater sound may evoke a response in a physiological
mediator (e.g., glucocorticoids, cytokines, or thyroid hormones) (Atkinson et al., 2015). The
type, duration, and magnitude of the stress response may have a metabolic cost, which is
termed the allostatic load. How stress responses might be linked to individual- and population-
level consequences is an area much in need of research (National Research Council [NRC],
2005).
6.1 Non-auditory Impacts
Nowacek et al. (2007) and Southall et al. (2007) reviewed potential types of non-auditory injury to
marine mammals from active sonar transmissions. These types of injuries include direct acoustic impact
on tissue, indirect acoustic impact on tissue surrounding a structure, and acoustically mediated bubble
growth within tissues from supersaturated dissolved nitrogen gas. The detailed descriptions and
information on these types of non-auditory impacts were provided in previous documentation for
SURTASS LFA sonar (DoN, 2007, 2012, 2017a) and related conclusions are incorporated by reference
herein.
No new data have emerged to contradict any of the assumptions or conclusions in previous LFA sonar
documentation, especially the conclusion that SURTASS LFA sonar transmissions are not expected to
cause gas bubble formation or strandings, particularly those of beaked whales. No strandings have
occurred coincident to SURTASS LFA sonar transmissions in over sixteen years of its use and no studies
indicate that strong avoidance reactions to LFA sonar would occur that would increase the risk of gas
bubble formation.

LOA and Rulemaking Application Under the MMPA for Use of SURTASS LFA Sonar
6-3 Incidental Takes
6.2 Auditory Impacts
One potential impact from exposure to high-intensity sound is auditory impacts, specifically TTS; no
studies have provided direct data on PTS. Several studies by a number of investigators have been
conducted, focusing on the relationships among the amount of threshold shift and the level, duration,
and frequency of the stimulus (Finneran, 2015; NMFS, 2018b). These studies are typically conducted
such that threshold shifts of 6 dB represent the upper limit of noise exposure. None of these studies
have resulted in direct data on the potential for PTS, empirical measurements of hearing, or the impacts
of noise on hearing for mysticetes, which are believed to be most sensitive to LFA sonar. Houser (2017)
reviewed the development of auditory weighting functions for marine mammals, the primary use of
which has been to predict and prevent noise-induced hearing loss. The detailed descriptions and
information on auditory impacts provided in previous documentation for SURTASS LFA sonar (DoN,
2007, 2012, 2017a) are incorporated by reference herein.
In addition to impacts on hair cells measured as threshold shifts, studies have shown that very large
temporary threshold shifts can result in neural degeneration, resulting in auditory injury. Kujawa and
Liberman (2009) found that noise exposures that produced a TTS of 40 dB, measured 24-hr post-
exposure, resulted in loss of afferent nerve synapses and cochlear neurons in mice. Similar impacts were
demonstrated in guinea pigs, where a TTS of approximately 50 dB, measured 24 hr post-exposure,
resulted in neural degeneration (Lin et al., 2011). This observed neural degeneration is an auditory injury
that would cause loss of hearing sensitivity, though it occurs under exposure conditions that result in
high levels of TTS (40 to 50 dB measured 24 hr after exposure).
NMFS (2018b) provided guidance for assessing the impacts of anthropogenic sound on marine mammals
under their regulatory jurisdiction, which includes whales, dolphins, seals, and sea lions. The guidance
specifically defines hearing groups, develops auditory weighting functions, and identifies the RLs, or
acoustic threshold levels, above which individual marine mammals are predicted to experience changes
in their hearing sensitivity (PTS or TTS) for acute, incidental exposure to underwater sound.
Recognizing that marine mammal species do not have equal hearing capabilities, five hearing groups of
marine mammals were defined:
• Low-frequency (LF) Cetaceans—this group consists of the mysticetes with a collective
generalized hearing range of 7 Hz to 35 kHz.
• Mid-frequency (MF) Cetaceans—includes most of the dolphins, all toothed whales except for
Kogia spp., and all the beaked and bottlenose whales with a generalized hearing range of
approximately 150 Hz to 160 kHz.
• High-frequency (HF) Cetaceans—incorporates all the true porpoises, the river dolphins, plus
Kogia spp., Cephalorhynchid spp. (genus in the dolphin family Delphinidae), and two species of
Lagenorhynchus (Peale’s and hourglass dolphins) with a generalized hearing range estimated
from 275 Hz to 160 kHz.
• Phocids Underwater (PW)—consists of true seals with a generalized underwater hearing range
from 50 Hz to 86 kHz.
• Otariids Underwater (OW)—includes sea lions and fur seals with a generalized underwater
hearing range from 60 Hz to 39 kHz.

LOA and Rulemaking Application Under the MMPA for Use of SURTASS LFA Sonar
6-4 Incidental Takes
Within their generalized hearing ranges, the ability to hear sounds varies with frequency, as
demonstrated by examining audiograms of hearing sensitivity (Finneran, 2015; NMFS, 2018b). To reflect
higher noise sensitivities at particular frequencies, auditory weighting functions were developed for
each functional hearing group that reflected the best available data on hearing ability (composite
audiograms), susceptibility to noise-induced hearing loss, impacts of noise on hearing, and data on equal
latency (Figure 6-1). These weighting functions are applied to individual sound received levels to reflect
the hearing ability of each species to process received acoustic energy.
NMFS (2018b) defined acoustic threshold levels at which PTS is predicted to occur for each hearing
group for impulsive and non-impulsive signals. SURTASS LFA sonar is a non-impulsive source in that its
signals do not have the high peak pressure with rapid rise time and decay that impulsive sounds do;
instead the pressure (i.e., intensity) of the LFA sonar transmission is consistent throughout the signal.
The acoustic threshold levels for non-impulsive sounds are defined as the cumulative sound exposure
level (SEL) over a 24-hr period with the appropriate frequency weighting for each functional hearing
group (Figure 6-1; Table 6-1), which is reflected in the subscript of each threshold (e.g., the LF cetacean
threshold is identified as LE,LF,24h). The cumulative SEL metric takes into account both received level and
duration of exposure over the duration of the activity within a 24-hr period. The TTS threshold is defined
as 20 dB less than the PTS threshold. A summary of the cumulative sound exposure acoustic thresholds
for PTS and TTS are provided (Table 6-1).
6.3 Behavioral Change
The primary potential impact on marine mammals from exposure to SURTASS LFA sonar is change in a
biologically significant behavior. NRC (2005) noted that an action or activity becomes biologically
significant to an individual animal when it affects the ability of the animal to grow, survive, and
reproduce, wherein an impact on individuals can lead to population-level consequences and affect the
viability of the species. The complexities associated with such an evaluation are becoming clear as
researchers compile and evaluate data on extensively studied species as exemplar models of how short-
term changes in behavior may accumulate to indirectly impact fitness through individual survival and
reproduction (Maresh et al., 2014; New et al., 2014; Robinson et al., 2012).
An example of the amount of data needed to link a disturbance with an animal’s health and how that
may affect vital rates that would result in population-level consequences can be seen in a study of
southern elephant seals (New et al., 2014). Southern elephant seals return to the same haul-out location
twice a year after foraging trips, allowing animals to be sedated for health assessments and instruments
to be attached to the animals and recovered after a foraging trip for at-sea measurements. Having such
long-term access to the same animals is highly unusual in marine mammal research, but it is such
individualized measurements that help inform linkages among behavioral responses and population-
level consequences. In this study, an animal’s lipid mass (i.e., fat content) could be measured at the
beginning and end of a foraging trip, while the archival instruments measured dive data that could be
correlated with their foraging success while at sea. It is unlikely that such an analysis would be possible
for the majority of marine species because of the difficulties associated with collecting the necessary
information (Tougaard et al., 2015).
Several review papers have been published in recent years that summarize the research that has
occurred on potential effects of noise on wildlife. Shannon et al. (2016) conducted a systematic and
standardized review of the scientific literature published from 1990 to 2013 on the effects of
anthropogenic noise on both terrestrial and aquatic wildlife. Their review found that 37 percent of

LOA and Rulemaking Application Under the MMPA for Use of SURTASS LFA Sonar
6-5 Incidental Takes
studies focused on birds and 28 percent focused on aquatic mammals, including marine mammals. A
vast majority (81 percent) of the research has been conducted in North America or Europe, with a rapid
increase in the volume of published, peer-reviewed articles since 2010. In evaluating 242 papers, 88
percent reported a statistically measured biological response to noise exposure (i.e., statistics
determined that the response was outside what would be considered normal variation and was in fact a
differential response), but only a small number investigated impacts to population persistence (survival,
reproductive fitness), community interactions (predator-prey), and ecosystem services (pollination).
Figure 6-1. Auditory Weighting Functions for Cetaceans (Top Panel: LF, MF, and HF Species) and Pinnipeds (Bottom Panel: PW, OW) (NMFS, 2018b).
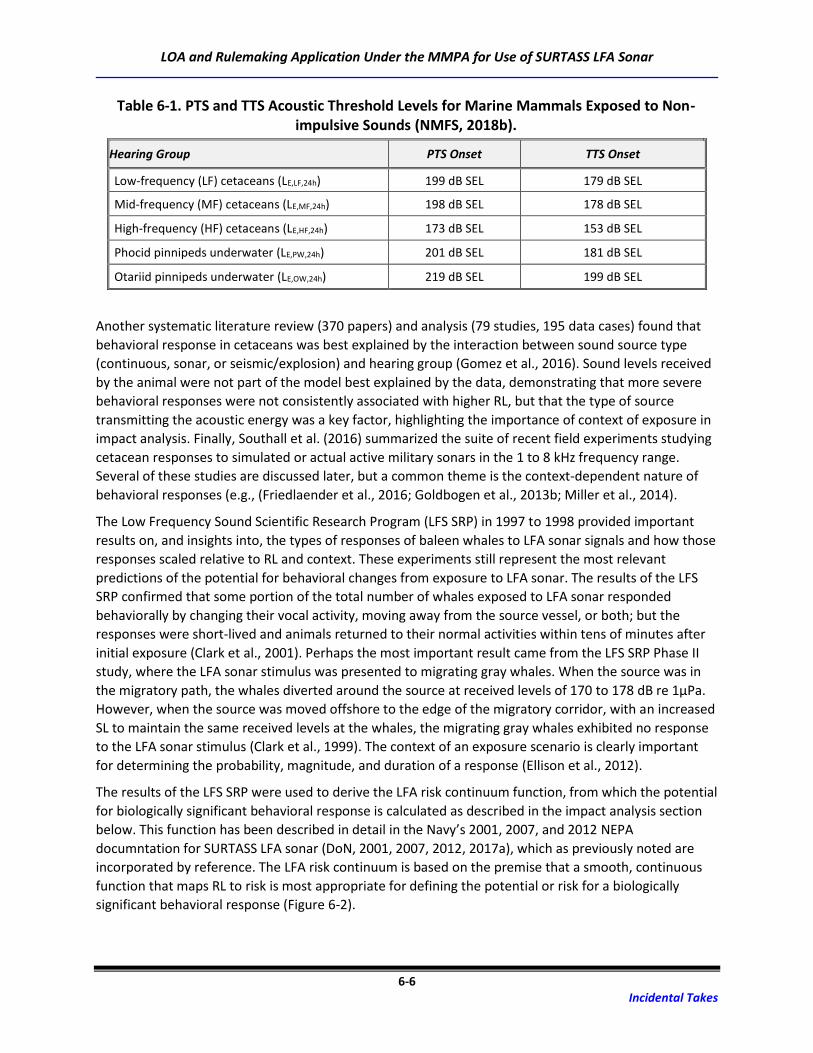
LOA and Rulemaking Application Under the MMPA for Use of SURTASS LFA Sonar
6-6 Incidental Takes
Table 6-1. PTS and TTS Acoustic Threshold Levels for Marine Mammals Exposed to Non-impulsive Sounds (NMFS, 2018b).
Hearing Group PTS Onset TTS Onset
Low-frequency (LF) cetaceans (LE,LF,24h) 199 dB SEL 179 dB SEL
Mid-frequency (MF) cetaceans (LE,MF,24h) 198 dB SEL 178 dB SEL
High-frequency (HF) cetaceans (LE,HF,24h) 173 dB SEL 153 dB SEL
Phocid pinnipeds underwater (LE,PW,24h) 201 dB SEL 181 dB SEL
Otariid pinnipeds underwater (LE,OW,24h) 219 dB SEL 199 dB SEL
Another systematic literature review (370 papers) and analysis (79 studies, 195 data cases) found that
behavioral response in cetaceans was best explained by the interaction between sound source type
(continuous, sonar, or seismic/explosion) and hearing group (Gomez et al., 2016). Sound levels received
by the animal were not part of the model best explained by the data, demonstrating that more severe
behavioral responses were not consistently associated with higher RL, but that the type of source
transmitting the acoustic energy was a key factor, highlighting the importance of context of exposure in
impact analysis. Finally, Southall et al. (2016) summarized the suite of recent field experiments studying
cetacean responses to simulated or actual active military sonars in the 1 to 8 kHz frequency range.
Several of these studies are discussed later, but a common theme is the context-dependent nature of
behavioral responses (e.g., (Friedlaender et al., 2016; Goldbogen et al., 2013b; Miller et al., 2014).
The Low Frequency Sound Scientific Research Program (LFS SRP) in 1997 to 1998 provided important
results on, and insights into, the types of responses of baleen whales to LFA sonar signals and how those
responses scaled relative to RL and context. These experiments still represent the most relevant
predictions of the potential for behavioral changes from exposure to LFA sonar. The results of the LFS
SRP confirmed that some portion of the total number of whales exposed to LFA sonar responded
behaviorally by changing their vocal activity, moving away from the source vessel, or both; but the
responses were short-lived and animals returned to their normal activities within tens of minutes after
initial exposure (Clark et al., 2001). Perhaps the most important result came from the LFS SRP Phase II
study, where the LFA sonar stimulus was presented to migrating gray whales. When the source was in
the migratory path, the whales diverted around the source at received levels of 170 to 178 dB re 1µPa.
However, when the source was moved offshore to the edge of the migratory corridor, with an increased
SL to maintain the same received levels at the whales, the migrating gray whales exhibited no response
to the LFA sonar stimulus (Clark et al., 1999). The context of an exposure scenario is clearly important
for determining the probability, magnitude, and duration of a response (Ellison et al., 2012).
The results of the LFS SRP were used to derive the LFA risk continuum function, from which the potential
for biologically significant behavioral response is calculated as described in the impact analysis section
below. This function has been described in detail in the Navy’s 2001, 2007, and 2012 NEPA
documntation for SURTASS LFA sonar (DoN, 2001, 2007, 2012, 2017a), which as previously noted are
incorporated by reference. The LFA risk continuum is based on the premise that a smooth, continuous
function that maps RL to risk is most appropriate for defining the potential or risk for a biologically
significant behavioral response (Figure 6-2).

LOA and Rulemaking Application Under the MMPA for Use of SURTASS LFA Sonar
6-7 Incidental Takes
The parameters of the risk continuum function are based on the LFS SRP results. These experiments,
which exposed baleen whales to RLs ranging from 120 to about 155 dB re 1 μPa (rms) (SPL), detected
only minor, short-term behavioral responses. Short-term behavioral responses do not necessarily
constitute significant changes in biologically important behaviors. The fact that none of the LFS SRP
observations revealed a significant change in a biologically important behavior helped determine an
upper bound for risk. However, the LFS SRP results cannot be used to prove that there is zero risk at
these levels. Accordingly, the risk continuum assumes that risk is small, but not zero, at the RLs achieved
during the LFS SRP. The basement value below which risk is negligible is 120 dB SPE. Fifty percent risk of
a behavioral response is defined at 165 dB SPE. The steepness of the curve, termed the risk transition
sharpness parameter, is defined as 10 for LFA sonar.
The risk continuum modeled a smooth increase in risk that culminates in a 95 percent level of risk of
significant change in a biologically important behavior at 180 dB SPE. In this region, the risk continuum is
unsupported by observations. Since the risk continuum function was derived from the behavioral
response data of baleen whales collected with an actual SURTASS LFA sonar source, these data are
realistic contextually and remain the best available for the response of LF-sensitive marine mammals to
the SURTASS LFA sonar source.
Additional studies of behavioral responses of marine mammals to naval sonar have occurred. None have
used a low-frequency (<1 kHz) source or been deployed from a slow moving vessel. Therefore their
applicability to determining potential responses to LFA sonar is not clear. Nevertheless, these data
represent additional information and are presented herein for awareness. Southall et al. (2016)
provided an overview of the Southern California Behavioral Response Study (SOCAL-BRS). This program
Figure 6-2. Risk Continuum Function for SURTASS LFA Sonar Analysis that Relates the Risk of Significant Change in Biologically Important Behavior to
Received Levels in Decibels Single Ping Equivalent (SPE).

LOA and Rulemaking Application Under the MMPA for Use of SURTASS LFA Sonar
6-8 Incidental Takes
uses advanced tagging efforts and visual and acoustic observations to investigate behavioral responses
to mid-frequency sonar signals. Blue whales exposed to simulated mid-frequency (MF) sonar showed
complex, though brief, avoidance responses (Goldbogen et al., 2013a). Surface feeding animals typically
showed no response to the sonar signal, while non-feeding and deep-feeding animals both aborted
deep feeding dives and made prolonged mid-water dives. Body orientation and horizontal displacement
away from the source were additional responses. The addition of information on the water column and
prey fields as explanatory variables explained approximately five times more of the variability in blue
whale behavior (Friedlaender et al., 2016). When changes in prey fields were considered, blue whales
had greater responses to pseudo-random noise, a unique stimulus in their environment, than they did to
MF sonar, to which they may be habituated.
Beaked whales appear to be remarkably sensitive to sound exposure. Moretti et al. (2014) examined
historical records of MF sonar operations and the vocal behavior of Blainville’s beaked whales and were
able to describe the probability of the beginning of a Group Vocal Period as a function of the received
level of operational MF sonars. These data were used to create a behavioral dose-response function for
Blainville’s beaked whales that has a structure similar to the LFA risk continuum, but with a 50 percent
probability of response at 150 dB re 1µPa and a shallower slope (steepness parameter). Cuvier’s beaked
whale responses to MF sonar have also been described (DeRuiter et al., 2013). One whale exposed to
low-level simulated sonar at close ranges (RL 89 to 127 dB) responded strongly, ceasing echolocation
and fluking, extended its dive duration and swam away rapidly. However, another whale incidentally
exposed to distant operational MF sonars at low levels (78 to 106 dB) did not show a response. This
variation in responses again illustrates the importance of context in interpreting these results.
Miller et al. (2015) presented a single northern bottlenose whale with a 1 to 2 kHz sonar signal. The
initial RL at the animal was 98 dB re 1 µPa, and at this level the whale approached the sound source.
When the RL reached 130 dB re 1µPa, the whale turned 180 away and began the longest and deepest
dive ever recorded for this species (94 min and 7,674 ft (2,339 m)). This one data point suggests that this
species may also show marked responses to anthropogenic sounds, as do many of the beaked whales.
This same bottlenose whale response, as well as those of minke and humpback whales, were examined
by an expert panel to assess the severity of these responses (Sivle et al., 2015). The minke whale began
avoiding the sonar signal at a RL of 146 dB re 1µPa. Eleven humpbacks were tested, and their response
levels ranged from 94 to 179 dB re 1µPa. Responses were judged using a severity score table based on
that of Southall et al. (2007) and modified by Miller et al. (2012) that included four subgroups: a) No
response (score=0), b) Responses unlikely to affect vital rates (score=1 to 3), c) Responses with the
potential to affect vital rates (score=4 to 6), and d) Responses likely to affect vital rates if repeated or of
long duration (score=7 to 9). The avoidance by the minke whale and the long duration avoidance by the
bottlenose whale both earned a severity score of 8. The scores of the humpback whale responses
ranged from 1 to 7.
Antunes et al. (2014) presented 1 to 2 and 6 to 7 kHz simulated sonar signals to pilot whales as part of
the 3S Experiment. One or more individuals within groups of long-finned pilot whales were
instrumented with suction-cup-attached archival tags (DTAGs; Johnson and Tyack, 2003)) along the
coast of northern Norway (Miller et al., 2012). After a baseline, pre-exposure period, the whales were
exposed to sonar signals. Source levels were increased as the vessel approached the tagged whales. The
two-dimensional tracks of the animals were examined to determine the changepoint in their behavior. A
dose-response curve was created, which had a 50 percent probability of behavioral change at 170 dB re
LOA and Rulemaking Application Under the MMPA for Use of SURTASS LFA Sonar
6-9 Incidental Takes
1 µPa or 173 dB SEL. While the value of the 50 percent probability of response is similar to that of the
LFA risk function, the slope of their function is much shallower than the LFA risk continuum function.
Killer whales were also presented with these 1 to 2 and 6 to 7 kHz FM sweeps (Miller et al., 2014). They
appeared to respond with changes in swim speed and direction. The response thresholds range from 94
to 164 dB re 1µPa. The authors created a dose-response function with a 50 percent probability of
avoidance value at 142 dB re 1µPa. Miller et al. (2014) attributed the remarkable variation in response
thresholds to intra-individual variability and other unidentified contextual values, such as proximity of
the source.
Sperm whales were exposed to 1 to 2 kHz simulated naval sonar as well as playback of killer whales calls
(Isojunno et al., 2016). The whales stopped foraging in response to the 1 to 2 kHz sonar signal at
received levels of 131 to 165 dB re 1µPa as well as to the playback of the killer whales signals. No change
in foraging was observed in response to the 6 to 7 kHz signals at received levels from 73 to 158 dB re
1µPa.
Curé et al. (2016) also found stronger responses by sperm whales to killer whale vocalizations and 1 to 2
kHz sonar upsweeps than the 6 to 7 kHz sonar signals. However only playbacks of killer whale
vocalizations produced grouping behavior, an indication of predator detection. Thus the actual signal
structure was shown to be an important predictor of response, more so than received sound level. This
study also demonstrated the value of referencing response strength to the response to a known
biologically important signal (i.e., killer whales).
Two minke whales were exposed to simualted naval sonar in the 1 to 4 kHz frequency range (Kvadsheim
et al., 2017). The first animal was exposed to 1.3 to 2.0 kHz upsweeps at a maximum source level of 214
dB re 1µPa at 1m. This whale began to respond at a RL of 83 dB re 1 µPa with a brief change in diving
behavior and later responded at a received level of 156 dB re 1 µPa by increasing its speed from
approximately 2.2 to 11.2 miles per hour (mph) (1 m/s to 5 m/s) and moving in a more linear direction,
directly away from the sonar source, which was classified as an ‘8’ on the Southall et al. (2007) severity
scale (Sivle et al., 2015a). The second whale was presented with a complex series of sweeps and tone
between 3.5 and 4.05 kHz with a maximum SL of 210 dB re 1µPa at 1m (Kvadsheim et al., 2017). This
whale began avoiding the source and swimming away in a more linear fashion at a RL of 149 dB re 1µPa,
but it did not increase its speed.
Vocalizing minke whales were tracked with the hydrophone array at the U.S. Navy Barking Sands
training range off Kaua‘i, HI (Martin et al., 2015). The mean number of animals within the 3,780 km2
training range was estimated as 3.64 before training, 2.81 whales during training but without MF sonar
transmissions, 0.69 whales during MF sonar transmissions, and 4.44 whales following training activities.
It is not known if the decrease was due to whales leaving the area or simply an alternation of their
acousic behavior.
Additional peer-reviewed papers have been published considering the impact of LF sound on marine
mammals. Risch et al. (2012) documented reduction in humpback whale vocalization concurrent with
transmissions of the low-frequency Ocean Acoustic Waveguide Remote Sensing (OAWRS) system, at
distances of 108 nmi (200 km) from the source. The LF pulses recorded in Stellwagen Bank NMS had a
bandwidth of approximately 50 Hz, duration of 1 sec, and mean center frequencies of 415, 734, and 949
Hz (Risch et al., 2012). The OAWRS source appears to have affected more whales, by producing a greater
response with a lower sound SL, than reported from the Phase III of the LFS SRP, even though OAWRS
had a lower RL (88 to 110 dB re 1 μPa) than the LFA sonar signal. Gong et al. (2014) assessed the effects
LOA and Rulemaking Application Under the MMPA for Use of SURTASS LFA Sonar
6-10 Incidental Takes
of the OAWRS transmissions on calling rates on Georges Bank and determined constant vocalization
rates of humpback whales, with a reduction occurring before the OAWRS system began transmitting.
Risch et al. (2014) pointed out that the results of Risch et al. (2012) and Gong et al. (2014) are not
contradictory, but rather highlight the principal point of their original paper that behavioral responses
depend on many factors, including range to source, RL above background noise level, novelty of signal,
and differences in behavioral state.
Humpback whale foraging behavior appears to be negatively affected by low-frequency vessel noise
(Blair et al., 2016). Ten foraging whales with non-invasive archival tags were studied in Stellwagen Bank
NMS in the western North Atlantic Ocean. Ship noise collected on the archival tags was assessed with
seven parameters of feeding behavior. As the received level of vessel noise increased, three parameters
of foraging behavior decreased: number of side roll feeding events, ascent rate and descent rate (Blair et
al., 2016).
A series of playback experiments using vessel noise and seismic airgun signals was conducted with
humpback whales migrating along the east coast of Australia. One analysis considered the effects of
both vessel presence and received level of airgun transmissions (Dunlop et al., 2017). While neither
stimulus produced abnormal behaviors, the presence of the vessel, with and without operating airguns,
did alter behavior, reducing dive time. The airgun signals caused a prolonged increase in respiration
rate, a decrease in dive time, and movement of travel path away from the sound source (as indicated by
the reduction in southward movement). This avoidance was more likely at received SELs greater than
135 dB re 1µPa2-sec and at ranges less than 2.2 nmi (4 km). A similar experiment with a single 20 cubic
inch or 140 cubic inch airgun found that avoidance was more likely within 1.6 nmi (3 km) of the vessel
and at SELs greater than 140 dB re 1µPa2-sec, with no response during control periods, indicating
avoidance was due to the air guns and not the source vessel itself (Dunlop, et al., 2017).
In summary, the results of these studies show that behavioral responses can occur at a range of received
levels and may or may not rise to the level of biologically significant impacts. The current scientific
literature on the possible effects of LF sound transmissions on marine species provide no contradictory
information showing different potential behavioral impacts than those documented by the LFS SRP. The
results of the SRP remain the best available data to estimate the potential for biologically important
behavioral responses to the use of SURTASS LFA sonar since the studies used the SURTASS LFA sonar
and exposed LF specialists while engaged in critical behaviors. The LFA risk continuum function, which is
based on LFS SRP data, continues to be used to define behavioral effects from exposure to LFA sonar.
Additionally no other studies have been conducted with low frequency sonars or other non-impulsive
sources that utilize frequency bands similar to SURTASS LFA sonar that could be used to supplement the
SRP results. The Navy acknowledges the age of the LFS SRP data, but as noted previously, the mere age
of these data does not invalidate them, their contributions to science, nor the conclusions based upon
those data.
6.4 Masking
Erbe et al. (2016) reviewed the current state of understanding of masking in marine mammals, including
anti-masking strategies for both receivers and senders. When a signal and noise are received from
different directions, a receiver with directional hearing can reduce the masking impact. This is known as
spatial release from masking, and this ability has been found in dolphins, killer whales and harbor seals.
Given the hearing abilities of marine mammals, it is likely that most, if not all, species have this ability to
some extent.
LOA and Rulemaking Application Under the MMPA for Use of SURTASS LFA Sonar
6-11 Incidental Takes
The detectability of a signal amidst noise may also be affected by the temporal and spectral properties
of the signal. Cunningham et al. (2014) conducted masking experiments where the signals were
complex, including frequency and amplitude modulation as well as the presence of harmonics,
parameters that are typical for natural animal signals. The ability of the receivers to detect complex
signals was far better than predicted using simple energetic masking predictions, likely because of the
complex structure of the signal.
Animals may be able to counteract masking by involuntarily increasing the source level of their
vocalizations in the presence of noise, known as the Lombard effect or Lombard reflex. The source levels
of vocalizations by killer whales and beluga whales have been shown to increase as the level of ship
noise in the environment increased (Holt et al., 2011; Scheifele et al., 2005). Another mechanism may be
to increase their calling rate or change the call structure, as demonstrated by gray whales when exposed
to vessel noise (Dahlheim and Castellote, 2016). Changes in call structure included increased source
level, more frequency-modulated calls, and an increased number of pulses per call. Migrating humpback
whales off Australia increased the amplitude of their social calls by 0.9 dB for every 1.0 dB increase in
wind-created ambient noise (Dunlop et al., 2014). While increasing their amplitude may be effective at
improving communication, it may come with an increased metabolic cost, as was shown with bottlenose
dolphins (Holt et al., 2015).
The potential for masking from LFA sonar signals is limited for a number of reasons. First, the typical LFA
sonar signal is not a constant tone but consists of a sequence of sound transmissions (waveforms) that
vary in frequency and duration. Continuous-frequency waveforms have durations of no longer than 10
seconds. Waveforms with varying frequencies have limited bandwidths (30 Hz). Therefore, within the
frequency range in which masking is possible, the impact would be limited because animals that use this
frequency range typically use signals with greater durations and bandwidths. Thus, only a portion of the
frequency band for the animal’s signal is likely to be masked by the LFA sonar transmissions.
Furthermore, when LFA sonar is in operation, the source is active only 7.5 to 10 percent of the time,
with a maximum of 20 percent duty cycle, which means that for 80 to 92.5 percent of the time, there is
no potential for masking. Therefore, within the area in which energetic masking is possible, any impact
of LFA sonar transmissions would be minimal because of the limited bandwidth and intermittent nature
of the signal, and the fact that animals that use this frequency region typically produce signals with
greater bandwidth that are repeated for many hours.
6.5 Physiological Stress
Atkinson et al. (2015) reviewed the physiology of the stress response in marine mammals. As a result of
the interest of the National Research Council in the population consequences of underwater noise (NRC,
2005), there has been broadened research into marine mammal responses to environmental stressors
and linking these responses to costs at the individual level that may have repercussions at the
population level (Maresh et al., 2014; New et al., 2014; Robinson et al., 2012). The data do not exist for
such an assessment with noise exposure, but the processes being developed highlight the research gaps
that need to be prioritized for those advances to be made. A study with southern elephant seals (New et
al., 2014) highlights the linkages between animal foraging success, environmental change, and
population growth rates, and the level of data needed for such an assessment.
A limited amount of research has been conducted on stress responses resulting from sound exposure.
Belugas demonstrated no catecholamine (hormones released in situations of stress) response to the
playback of oil drilling sounds (Thomas et al., 1990), but showed an increase in catecholamines following
LOA and Rulemaking Application Under the MMPA for Use of SURTASS LFA Sonar
6-12 Incidental Takes
exposure to impulsive sounds produced from a seismic water gun (Romano et al., 2004). A bottlenose
dolphin exposed to the same seismic water gun signals did not demonstrate a catecholamine response,
but did demonstrate an elevation in aldosterone, a hormone that has been suggested as being a
significant indicator of stress in odontocetes (St. Aubin and Geraci, 1989).
Increases in heart rate were observed in bottlenose dolphins to which calls from other bottlenose
dolphins were played, although no increase in heart rate was observed when ambient noise from
aquarium tanks was played back (Miksis et al., 2001). A beluga's heart rate was observed to increase
during exposure to noise, with increase dependent on frequency band of noise and duration of
exposure, with a sharp decrease to normal or below-normal levels upon cessation of the exposure
(Lyamin et al., 2011). A recently-capture beluga whale showed a two-phase heart rate response to noise
exposures (frequencies of 19 to 38 kHz, levels of 150 to 160 dB). The heart rate response was indicative
of changes in response to stress or emotionally negative external stimuli in terrestrial mammals and
humans (Bakhchina et al., 2017). After one year of captivity, the beluga whale showed no response to
the same or more intense noise exposures, indicating habituation within the dolphinarium.
It is unknown how chronic exposure to acoustic stressors may affect marine mammals. Opportunistic
comparison of levels of stress-related hormone metabolites in North Atlantic right whale feces collected
before and after the events of 11 September 2001 showed a decrease in metabolite levels
corresponding to lower levels of ambient noise due to reduced ship traffic (Rolland et al., 2012).
Collectively, these results suggest a variable response that depends on the characteristics of the
received signal and prior experience with the received signal.
Atkinson et al. (2015) highlighted the need for long-term monitoring of individuals to better understand
natural life-history influences on variations in stress responses and develop baselines that can be used
for comparison. Since marine mammals are air-breathers that live in an underwater, oceanic
environment, they have separated their need for oxygen from many biological functions for which it is
directly linked in terrestrial mammals. Thus, there appear to be significant modifications to expected
physiological mediators, resulting in unexpected observations. For example, where a terrestrial animal
may start breathing heavily as part of a stress response, a marine mammal may have decoupled that
response to conserve oxygen for underwater survival. Much more research is needed to begin to
understand the potential for physiological stress in marine mammals during noise exposure scenarios.
6.6 Quantitative Impact Analysis for Marine Mammals
The Navy conducted a risk assessment to analyze and assess potential impacts associated with using
SURTASS LFA sonar for training and testing activities in the western and central North Pacific and
eastern Indian oceans. The acoustic impact analysis presented herein represents an evolution that builds
upon the analysis, methodology, and impact criteria documented in previous SURTASS LFA sonar NEPA
efforts (DoN, 2001, 2007, 2012, 2017a), but incorporates the most current acoustic impact criteria and
methodology to assess the potential for auditory impacts (PTS and TTS) and behavioral responses of
marine mammal species.
Fifteen representative model areas in the western and central North Pacific and eastern Indian oceans
were analyzed to represent the acoustic regimes and marine mammal species that may be encountered
during SURTASS LFA sonar training and testing activities (Table 3-1). Modeling was conducted in each
season for each model area. Seasons were defined according to the following monthly breakdown:

LOA and Rulemaking Application Under the MMPA for Use of SURTASS LFA Sonar
6-13 Incidental Takes
• Winter: December, January, and February
• Spring: March, April, and May
• Summer: June, July, and August
• Fall: September, October, and November.
For consistency, the seasonality for marine mammals in all model areas is presented according to this
monthly arrangement, even for the one model area located in the southern hemisphere. Winter
(December, January, and February) in the southern hemisphere is austral summer, when for instance,
most baleen whales would be expected to be foraging in Antarctic waters.
To estimate the potential impacts to marine mammals in each of the model areas, a list of marine
mammal stocks likely to be encountered in each region, by season, was developed and abundance and
density estimates were derived from the most current published literature and documentation available
(Chapter 3).
Modeling was conducted for one 24-hr period in each of the four seasons in each model area. To predict
acoustic exposure, the LFA sonar ship was simulated traveling in a triangular pattern at a speed of 4 kt
(7.4 kph), with the time on each bearing (each “leg” of the triangle) being 8 hr (480 min). The duration of
LFA sonar transmissions was modeled as 24 hr, with a signal duration of 60 sec and a duty cycle of 10
percent (i.e., the source transmitted for 60 sec every 10 min for 24 hr, which equates to a total of 2.4
transmission hours). The acoustic field around the LFA sonar source was predicted with the Navy
standard parabolic equation propagation model using the defined LFA sonar operating parameters. Each
marine mammal species potentially occurring in a model area in each season was simulated by creating
animats (model simulated animals) programmed with behavioral values describing their dive and
movement patterns, including dive depth, dive duration, surfacing time, swimming speed, and direction
change.
The Acoustic Integration Model© (AIM) integrated the acoustic field created from the underwater
transmissions of LFA sonar with the three-dimensional (3D) movement of marine mammals to estimate
their potential sonar exposure at each 30-sec timestep within the 24-hr modeling period. Thus, the
output of AIM is the time history of exposure for each animat.
Since AIM records the exposure history for each individual animat, the potential impact is determined
on an individual animal basis. The sound energy received by each individual animat over the 24-hr
modeled period was calculated as SEL and the potential for that animal to experience PTS and then TTS
was considered using the NMFS (2018b) acoustic guidance thresholds. If an animal was not predicted to
experience PTS or TTS, then the sound energy received over the 24-hr modeled period was calculated as
dB SPE and used as input to the LFA risk continuum function to assess the potential risk of a behavioral
reaction. A step-wise process is undertaken to ensure that each individual is considered for only one
potential impact (i.e., there is no double counting). The potential for PTS is considered first, as it
represents the highest threshold. If an individual does not exceed the PTS threshold, then the potential
for TTS is considered. If an animal does not exceed the TTS threshold, then the potential for a behavioral
response is considered. Thus, individuals are only considered for one acoustic impact during a 24-hr
exposure scenario.
To estimate the potential impacts for each marine mammal stock on an annual basis, several calculation
steps are required. The first step is to calculate the potential impact for one LFA sonar transmission

LOA and Rulemaking Application Under the MMPA for Use of SURTASS LFA Sonar
6-14 Incidental Takes
hour. The 24-hr modeling results for each season are for 2.4 transmission hours (i.e., the SURTASS LFA
sonar was simulated to transmit at a 10 percent duty cycle, so 24 hours of LFA sonar use equate to 2.4
sonar transmission hours). Therefore, the impact estimates from 24 hours of LFA sonar use (2.4
transmission hours) were divided by 2.4 to transform the results into potential impacts on a per
transmission hour basis. Then, because the use of SURTASS LFA sonar is not driven by any seasonal
factors, and LFA sonar activities are most likely to occur with equal frequency in any of the four seasons,
the per transmission hour impact estimates for each season were averaged to provide a single annual
per transmission hour impact estimate. At this point, the average impact of an hour of SURTASS LFA
transmission during any time of the year has been calculated for every species or stock.
The second step for calculating the potential impacts from all SURTASS LFA transmsisions within a year is
to determine the number of LFA sonar transmission hours that might occur in each model area, for each
activity. To develop the total annual LFA sonar transmission hours, the Navy determined the training and
testing activities that occur each year, the number of transmission hours conducted during each activity,
and the model areas in which each activity is expected to occur (Table 6-2), as not all proposed activities
would occur in all modeled areas. To calculate the potential impact in each model area for each activity,
the number of annual LFA sonar transmissions hours for each activity was evenly distributed across the
model areas in which that activity might occur. The hours were evenly distributed across model areas
because there is an equal chance of activities happening in each model area identified for an activity;
the Navy is not aware of any planning factors that would influence the distribution of activity hours
among model areas. For example, the execution of vessel and equipment maintenance is estimated to
require a total of 64 transmission hours, which are planned to occur only in either Model Area #2 or
Model Area #3. Therefore, the 64 transmission hours were equally distributed to Model Areas #2 and
#3, or 32 hours in each model area, for vessel and equirpment maintenance activities.
The third step was to determine the number of model areas in which each stock may occur for each
activity. The fourth step was to select the maximum per hour impact for each stock that may occur in
the model areas for that activity. For instance, for maintenance activities that occur in model areas #2
and #3, if a stock occurs in both model areas, whichever per hour impact estimate for that stock was
higher between the two modeling areas was selected for all subsequent calculations for estimating the
impacts from mainteance activities.
The final step was to multiply the results of steps two, three, and four to calculate the potential annual
impacts per activity, which are then summed across the stocks for a total potential impact for all
activities. The maximum estimate of the per hour impact (result of step three) was multiplied by the
planned transmission hours for each activity per model area (result of step two) and by the number of
model areas in which the stock might occur for that activity (result of step four). The end result is the
maximum potential impact per stock for each activity, allowing flexibility for the activity to occur in any
season and any of the planned model areas for that activity. These maximum impacts per activity are
summed across the stocks for Years 1 to 4 (Table 6-3) and Years 5 to 7 (Table 6-4).
To help explain the modeling process, the potential impacts to the Blainville’s beaked whale are
described as an illustrative example. Three stocks of Blainville’s beaked whale are found in the study
area, with the WNP stock occurring in Model Areas #2, 3, 4, 6, and 7; the Hawaii stock found in Model
Areas #10 and 11; and the Indian Ocean stock occurring in Model Areas #12, 13, and 14. Contractor
training (total of 80 transmission hr) and maintenance (total of 64 transmission hr) may occur in Model
Areas #2 or 3, for a total of 144 transmission hr across both model areas or 72 transmission hr per
model area (result of step two). Only the WNP stock of Blainville’s beaked whale occurs in these two
LOA and Rulemaking Application Under the MMPA for Use of SURTASS LFA Sonar
6-15 Incidental Takes
model areas. The potential impact in Model Area #2 is 0.68 behavioral takes per transmission hour,
while in Model Area #3, 0.53 behavioral takes per transmission hour were computed. Since 0.68
behavioral takes per transmission hour is the greater or maximum take of the two model areas in which
these two activities may occur, 0.68 behavioral takes per transmission hour is selected as the maximum
(result of step four). The potential impact of 0.68 behavioral takes per transmission hour is multiplied by
72 transmission hours per model area and by 2 model areas (since Blainville’s beaked whale may occur
in both model areas; result of step three) for a total potential impact of 97.92 behavioral takes for both
contractor training and maintenance activities for the WNP stock of Blainville’s beaked whales. The
algebraic equation for these steps is presented below:
0.68 𝑡𝑎𝑘𝑒𝑠
𝑡𝑟𝑎𝑛𝑠𝑚𝑖𝑠𝑠𝑖𝑜𝑛 ℎ𝑟 𝑥 72
𝑡𝑟𝑎𝑛𝑠𝑚𝑠𝑠𝑖𝑜𝑛 ℎ𝑟
𝑚𝑖𝑠𝑠𝑖𝑜𝑛 𝑎𝑟𝑒𝑎 𝑥 2 𝑚𝑖𝑠𝑠𝑖𝑜𝑛 𝑎𝑟𝑒𝑎𝑠 = 97.92 𝑡𝑎𝑘𝑒𝑠
The LFA sonar use as part of the naval exercises support activity may occur in Model Areas #2, 3, 4, 7,
10, and 11 for a total of 96 transmission hours. This results in 16 transmission hours per model area,
when the 96 transmission hoursare divided equally among the 6 model areas (result of step two). Two
stocks of Blainville’s beaked whale might be exposed to transmissions from the Navy exercise support
activity: the WNP stock occurs in Model Areas #2, 3, 4, and 7 (result of step three is four model areas for
the WNP stock) and the Hawaii stock occurs in Model Areas #10 and 11 (result of step three is two
model areas for the Hawaii stock). The maximum potential impact in any of the modeling areas in which
the WNP stock occurs is 0.94 behavioral takes (result of step four); the maximum potential impact in any
of the modeling areas in which the Hawaii stock occurs is 0.95 behavioral takes (result of step four).
Thus for the WNP stock, the potential impact of 0.94 behavioral takes per transmission hour is
multiplied by 16 transmission hours per model area and by 4 model areas for a total potential impact of
60.16 behavioral takes from SURTASS LFA use during Navy exercise support activities. For the Hawaii
stock, the potential impact of 0.95 behavioral takes per transmission hour is multiplied by 16
transmission hours per model area and by 2 model areas for a total potential impact of 30.40 behavioral
takes from SURTASS LFA use during naval exercises support activities. The same process occurs for the
remaining activities (MILCREW training and acoustic research in years 1 to 4, plus the addition of new
LFA sonar system testing in years 5 to 7), which may occur in all fifteen model areas.
To develop the overall potential impact from all SURTASS LFA sonar tranmsissions within a year to each
marine mammal stock, the potential impacts to each stock from each individual activity are then
summed to derive the total maximum potential impact on an annual basis in Years 1 to 4 (Table 6-3) and
Years 5 to 7 (Table 6-4). This is a conservative estimate since it is based on the maximum potential
impact to a stock across all model areas in which an activity may occur. Therefore, if the activity occurs
in a different model area than the area where the maximum potential impact was predicted, the actual
potential impact could be less than that estimated. However, since the Navy cannot forecast where a
specific activity may be conducted this far in advance, this maximum estimate provides the Navy with
the flexibility to conduct its training and testing activities across all model areas identified for each
activity.
The potential for PTS (MMPA Level A) is considered within the context of the mitigation and monitoring
efforts that would occur whenever SURTASS LFA sonar is transmitting (Chapter 11). Mitigation
monitoring is designed to detect marine mammals before they are exposed to 180 dB SPL RLs, which is

LOA and Rulemaking Application Under the MMPA for Use of SURTASS LFA Sonar
6-16 Incidental Takes
estimated to occur at a distance of approximately 1 km (0.54 nmi) from SURTASS LFA sonar operating at
full power under ideal propagation conditions. The NMFS (2018b) acoustic guidance for estimating the
potential for PTS defines weighted thresholds as sound exposure levels. The length of a nominal LFA
sonar transmission is 60 sec, which lowers the thresholds by approximately 18 dB SEL (10xlog10 [60 sec]
=17.8) if the assumption is made that all RLs are at the same SPL. In addition to signal duration, hearing
sensitivity must be considered. If transmissions at 300 Hz are considered for this example, as it is in
about the middle of the frequency range of LFA sonar transmissions (100 to 500 Hz), the thresholds
must be appropriately weighted to account for each functional hearing group’s sensitivity. This results in
an increase in the thresholds of approximately 1.5, 56, 56, 15, and 20 dB, respectively, for LF, MF, HF,
PW, and OW groups when considering a signal at 300 Hz. Based on simple spherical spreading (i.e., a
transmission loss [TL] based on 20 × log10 [range in meters]), all functional hearing groups except LF
cetaceans would need to remain within 22 ft (7 m) for the entirety of an LFA sonar transmission (60 sec)
to potentially experience PTS. An LF cetacean would need to remain within 135 ft (41 m) for the entirety
of an LFA sonar transmission to potentially experience PTS. Based on the mitigation procedures used
during SURTASS LFA sonar activities, the chances of this occurring are negligible. Therefore, no PTS
(MMPA Level A harassment) is expected with the implementation of mitigation measures.
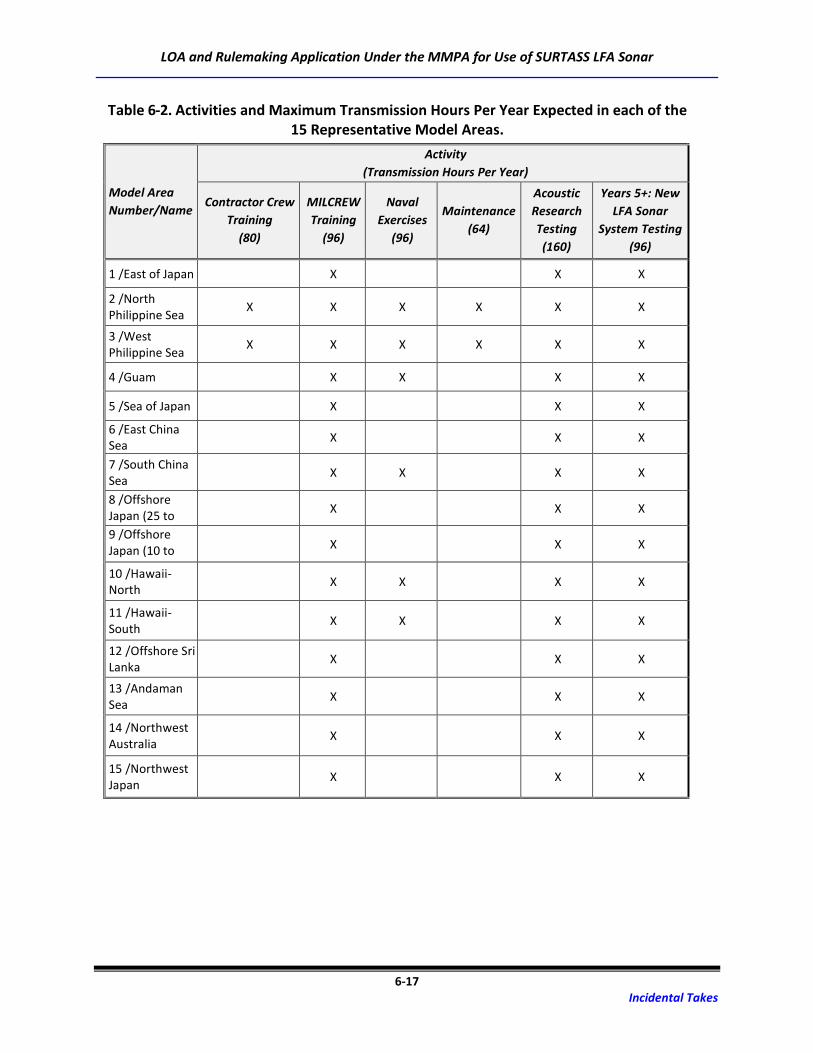
LOA and Rulemaking Application Under the MMPA for Use of SURTASS LFA Sonar
6-17 Incidental Takes
Table 6-2. Activities and Maximum Transmission Hours Per Year Expected in each of the 15 Representative Model Areas.
Model Area
Number/Name
Activity
(Transmission Hours Per Year)
Contractor Crew
Training
(80)
MILCREW
Training
(96)
Naval
Exercises
(96)
Maintenance
(64)
Acoustic
Research
Testing
(160)
Years 5+: New
LFA Sonar
System Testing
(96)
1 /East of Japan X X X
2 /North Philippine Sea
X X X X X X
3 /West Philippine Sea
X X X X X X
4 /Guam X X X X
5 /Sea of Japan X X X
6 /East China Sea
X X X
7 /South China Sea
X X X X
8 /Offshore Japan (25 to 40N)
X X X
9 /Offshore Japan (10 to 25N)
X X X
10 /Hawaii-North
X X X X
11 /Hawaii-South
X X X X
12 /Offshore Sri Lanka
X X X
13 /Andaman Sea
X X X
14 /Northwest Australia
X X X
15 /Northwest Japan
X X X

LOA and Rulemaking Application Under the MMPA for Use of SURTASS LFA Sonar
6-18 Incidental Takes
Table 6-3. Maximum Total Annual MMPA Level B Harassment Requested for Years 1 to 4 by SURTASS LFA Sonar (Species and Stocks Listed Alphabetically).
Marine Mammal Species Stock9
Maximum Annual MMPA Level B Harassment: Years 1 to 4
Behavior (Individuals)
Behavior (Percent
Stock)
TTS (Individuals)
TTS (Percent
Stock)
Total Level B (Individuals)
Total Level B (Percent
Stock)
Antarctic minke whale ANT 0.14 0.00% 0 0.00% 0 0.00%
Blue whale
CNP 3.12 2.39% 0 0.00% 3 2.39%
NIND 0.43 0.00% 0 0.00% 0 0.00%
WNP 6.58 0.07% 83 0.83% 90 0.90%
SIND 0.81 0.07% 0 0.00% 1 0.07%
Bryde’s whale
ECS 3.41 2.49% 11 7.79% 14 10.28%
Hawaii 5.44 0.62% 0 0.00% 5 0.62%
WNP 184.11 1.08% 194 0.86% 378 1.94%
NIND 4.05 0.04% 4 0.04% 8 0.07%
SIND 5.01 0.04% 2 0.02% 7 0.05%
Common minke whale
Hawaii 277.85 1.10% 294 1.19% 572 2.30%
IND 816.07 0.28% 455 0.14% 1,271 0.43%
WNP JW 3.31 0.12% 0 0.00% 3 0.12%
WNP OE 1,053.71 4.29% 1,073 4.29% 2,127 8.59%
YS 53.89 1.20% 135 2.99% 189 4.20%
Fin whale
ECS 1.88 0.37% 7 1.42% 9 1.80%
Hawaii 3.49 2.30% 0 0.00% 3 2.30%
IND 0.14 0.00% 0 0.00% 0 0.00%
SIND 13.17 0.04% 9 0.02% 22 0.05%
WNP 259.28 2.85% 2,299 24.70% 2,558 27.55%
Humpback whale CNP stock and Hawaii DPS 175.75 1.74% 311 3.11% 487 4.85%
9 ANT=Antarctic; CNP=Central North Pacific; NP=North Pacific; WNP=Western North Pacific; WP=Western Pacific; ECS=East China Sea; SOJ=Sea of Japan; IA=Inshore Archipelago; YS=Yellow Sea;
OE=Offshore Japan; OW=Nearshore Japan; JW=Sea of Japan/Minke; SH=Southern Hemisphere; NIND=Northern Indian; SIND=Southern Indian; IND=Indian; WAU=Western Australia; DPS=distinct population segment

LOA and Rulemaking Application Under the MMPA for Use of SURTASS LFA Sonar
6-19 Incidental Takes
Table 6-3. Maximum Total Annual MMPA Level B Harassment Requested for Years 1 to 4 by SURTASS LFA Sonar (Species and Stocks Listed Alphabetically).
Marine Mammal Species Stock9
Maximum Annual MMPA Level B Harassment: Years 1 to 4
Behavior (Individuals)
Behavior (Percent
Stock)
TTS (Individuals)
TTS (Percent
Stock)
Total Level B (Individuals)
Total Level B (Percent
Stock)
Humpback whale (Continued)
WAU stock and DPS 0.85 0.00% 0 0.00% 1 0.00%
WNP stock and DPS 315.07 23.82% 2,788 210.03% 3,103 233.84%
North Pacific right whale WNP 3.65 0.33% 85 9.24% 89 9.57%
Omura's whale
NIND 4.05 0.04% 4 0.04% 8 0.07%
SIND 5.01 0.04% 0 0.00% 5 0.04%
WNP 13.68 0.81% 0 0.00% 14 0.81%
Sei whale
Hawaii 9.46 2.39% 9 2.39% 19 4.78%
SIND 0.16 0.00% 0 0.00% 0 0.00%
NP 220.27 3.23% 3,058 43.73% 3,278 46.97%
NIND 3.93 0.04% 0 0.00% 4 0.04%
Western North Pacific gray whale
WNP stock and Western DPS
0.45 0.33% 0 0.00% 0 0.00%
Baird’s beaked whale WNP 2,746.60 48.26% 0 0.00% 2,747 48.26%
Blainville’s beaked whale
Hawaii 35.06 1.83% 0 0.00% 35 1.83%
WNP 269.35 3.30% 0 0.00% 269 3.30%
IND 47.41 0.27% 0 0.00% 47 0.27%
Common bottlenose dolphin
4-Islands 4.68 2.48% 0 0.00% 5 2.48%
Hawaii Island 0.41 0.34% 0 0.00% 0 0.00%
Hawaii Pelagic 95.14 0.41% 0 0.00% 95 0.41%
IA 104.12 0.11% 0 0.00% 104 0.11%
IND 1,128.21 0.14% 0 0.00% 1,128 0.14%
Japanese Coastal 1,686.43 47.94% 0 0.00% 1,686 47.94%
Kauai/Niihau 13.23 7.16% 0 0.00% 13 7.16%
Oahu 38.16 5.17% 0 0.00% 38 5.17%
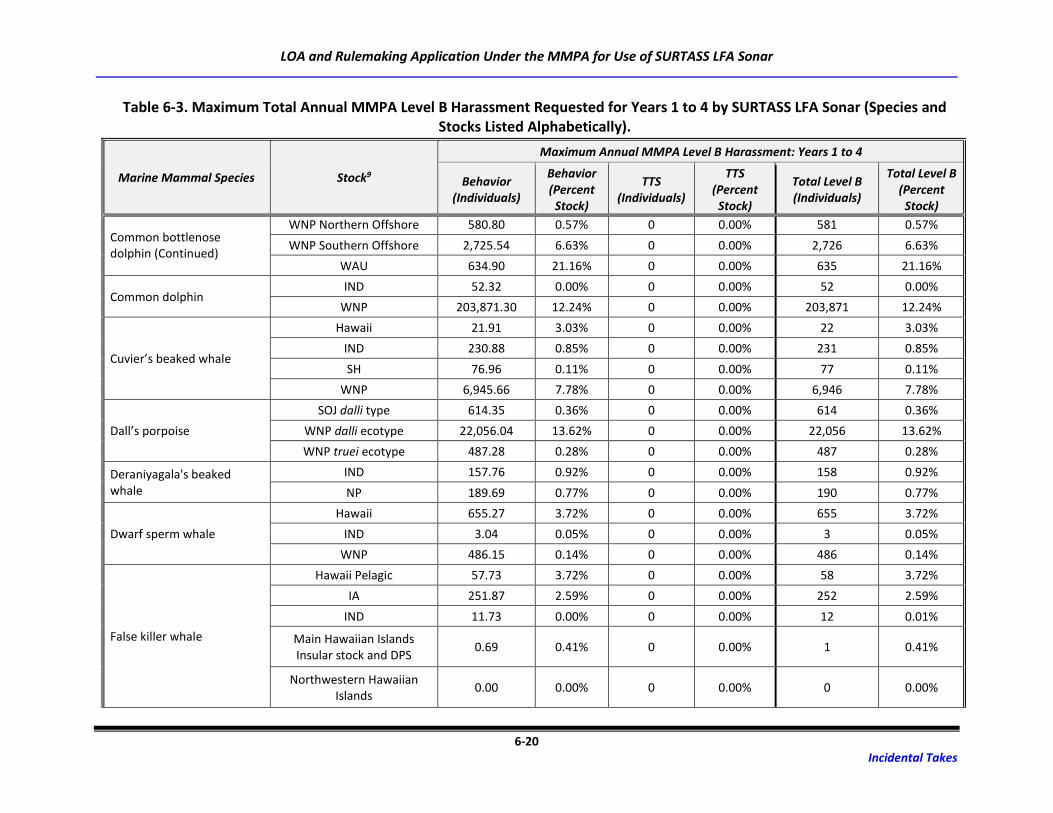
LOA and Rulemaking Application Under the MMPA for Use of SURTASS LFA Sonar
6-20 Incidental Takes
Table 6-3. Maximum Total Annual MMPA Level B Harassment Requested for Years 1 to 4 by SURTASS LFA Sonar (Species and Stocks Listed Alphabetically).
Marine Mammal Species Stock9
Maximum Annual MMPA Level B Harassment: Years 1 to 4
Behavior (Individuals)
Behavior (Percent
Stock)
TTS (Individuals)
TTS (Percent
Stock)
Total Level B (Individuals)
Total Level B (Percent
Stock)
Common bottlenose dolphin (Continued)
WNP Northern Offshore 580.80 0.57% 0 0.00% 581 0.57%
WNP Southern Offshore 2,725.54 6.63% 0 0.00% 2,726 6.63%
WAU 634.90 21.16% 0 0.00% 635 21.16%
Common dolphin IND 52.32 0.00% 0 0.00% 52 0.00%
WNP 203,871.30 12.24% 0 0.00% 203,871 12.24%
Cuvier’s beaked whale
Hawaii 21.91 3.03% 0 0.00% 22 3.03%
IND 230.88 0.85% 0 0.00% 231 0.85%
SH 76.96 0.11% 0 0.00% 77 0.11%
WNP 6,945.66 7.78% 0 0.00% 6,946 7.78%
Dall’s porpoise
SOJ dalli type 614.35 0.36% 0 0.00% 614 0.36%
WNP dalli ecotype 22,056.04 13.62% 0 0.00% 22,056 13.62%
WNP truei ecotype 487.28 0.28% 0 0.00% 487 0.28%
Deraniyagala's beaked whale
IND 157.76 0.92% 0 0.00% 158 0.92%
NP 189.69 0.77% 0 0.00% 190 0.77%
Dwarf sperm whale
Hawaii 655.27 3.72% 0 0.00% 655 3.72%
IND 3.04 0.05% 0 0.00% 3 0.05%
WNP 486.15 0.14% 0 0.00% 486 0.14%
False killer whale
Hawaii Pelagic 57.73 3.72% 0 0.00% 58 3.72%
IA 251.87 2.59% 0 0.00% 252 2.59%
IND 11.73 0.00% 0 0.00% 12 0.01%
Main Hawaiian Islands Insular stock and DPS
0.69 0.41% 0 0.00% 1 0.41%
Northwestern Hawaiian Islands
0.00 0.00% 0 0.00% 0 0.00%
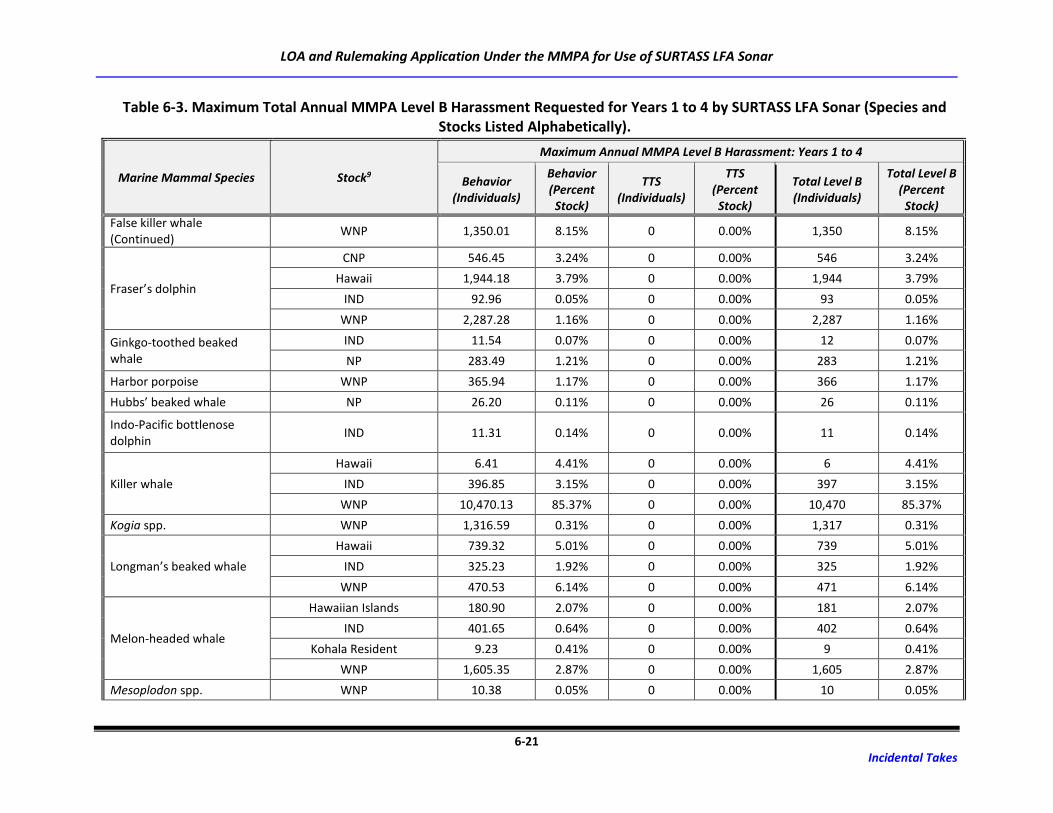
LOA and Rulemaking Application Under the MMPA for Use of SURTASS LFA Sonar
6-21 Incidental Takes
Table 6-3. Maximum Total Annual MMPA Level B Harassment Requested for Years 1 to 4 by SURTASS LFA Sonar (Species and Stocks Listed Alphabetically).
Marine Mammal Species Stock9
Maximum Annual MMPA Level B Harassment: Years 1 to 4
Behavior (Individuals)
Behavior (Percent
Stock)
TTS (Individuals)
TTS (Percent
Stock)
Total Level B (Individuals)
Total Level B (Percent
Stock)
False killer whale (Continued)
WNP 1,350.01 8.15% 0 0.00% 1,350 8.15%
Fraser’s dolphin
CNP 546.45 3.24% 0 0.00% 546 3.24%
Hawaii 1,944.18 3.79% 0 0.00% 1,944 3.79%
IND 92.96 0.05% 0 0.00% 93 0.05%
WNP 2,287.28 1.16% 0 0.00% 2,287 1.16%
Ginkgo-toothed beaked whale
IND 11.54 0.07% 0 0.00% 12 0.07%
NP 283.49 1.21% 0 0.00% 283 1.21%
Harbor porpoise WNP 365.94 1.17% 0 0.00% 366 1.17%
Hubbs’ beaked whale NP 26.20 0.11% 0 0.00% 26 0.11%
Indo-Pacific bottlenose dolphin
IND 11.31 0.14% 0 0.00% 11 0.14%
Killer whale
Hawaii 6.41 4.41% 0 0.00% 6 4.41%
IND 396.85 3.15% 0 0.00% 397 3.15%
WNP 10,470.13 85.37% 0 0.00% 10,470 85.37%
Kogia spp. WNP 1,316.59 0.31% 0 0.00% 1,317 0.31%
Longman’s beaked whale
Hawaii 739.32 5.01% 0 0.00% 739 5.01%
IND 325.23 1.92% 0 0.00% 325 1.92%
WNP 470.53 6.14% 0 0.00% 471 6.14%
Melon-headed whale
Hawaiian Islands 180.90 2.07% 0 0.00% 181 2.07%
IND 401.65 0.64% 0 0.00% 402 0.64%
Kohala Resident 9.23 0.41% 0 0.00% 9 0.41%
WNP 1,605.35 2.87% 0 0.00% 1,605 2.87%
Mesoplodon spp. WNP 10.38 0.05% 0 0.00% 10 0.05%
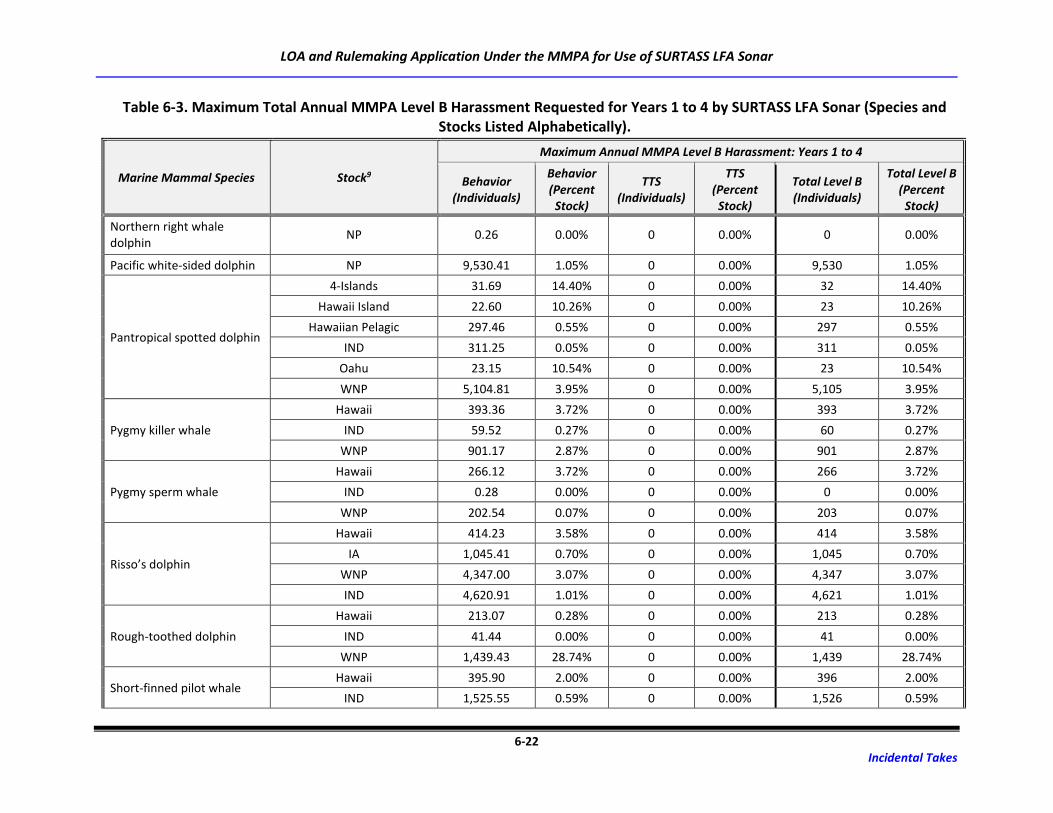
LOA and Rulemaking Application Under the MMPA for Use of SURTASS LFA Sonar
6-22 Incidental Takes
Table 6-3. Maximum Total Annual MMPA Level B Harassment Requested for Years 1 to 4 by SURTASS LFA Sonar (Species and Stocks Listed Alphabetically).
Marine Mammal Species Stock9
Maximum Annual MMPA Level B Harassment: Years 1 to 4
Behavior (Individuals)
Behavior (Percent
Stock)
TTS (Individuals)
TTS (Percent
Stock)
Total Level B (Individuals)
Total Level B (Percent
Stock)
Northern right whale dolphin
NP 0.26 0.00% 0 0.00% 0 0.00%
Pacific white-sided dolphin NP 9,530.41 1.05% 0 0.00% 9,530 1.05%
Pantropical spotted dolphin
4-Islands 31.69 14.40% 0 0.00% 32 14.40%
Hawaii Island 22.60 10.26% 0 0.00% 23 10.26%
Hawaiian Pelagic 297.46 0.55% 0 0.00% 297 0.55%
IND 311.25 0.05% 0 0.00% 311 0.05%
Oahu 23.15 10.54% 0 0.00% 23 10.54%
WNP 5,104.81 3.95% 0 0.00% 5,105 3.95%
Pygmy killer whale
Hawaii 393.36 3.72% 0 0.00% 393 3.72%
IND 59.52 0.27% 0 0.00% 60 0.27%
WNP 901.17 2.87% 0 0.00% 901 2.87%
Pygmy sperm whale
Hawaii 266.12 3.72% 0 0.00% 266 3.72%
IND 0.28 0.00% 0 0.00% 0 0.00%
WNP 202.54 0.07% 0 0.00% 203 0.07%
Risso’s dolphin
Hawaii 414.23 3.58% 0 0.00% 414 3.58%
IA 1,045.41 0.70% 0 0.00% 1,045 0.70%
WNP 4,347.00 3.07% 0 0.00% 4,347 3.07%
IND 4,620.91 1.01% 0 0.00% 4,621 1.01%
Rough-toothed dolphin
Hawaii 213.07 0.28% 0 0.00% 213 0.28%
IND 41.44 0.00% 0 0.00% 41 0.00%
WNP 1,439.43 28.74% 0 0.00% 1,439 28.74%
Short-finned pilot whale Hawaii 395.90 2.00% 0 0.00% 396 2.00%
IND 1,525.55 0.59% 0 0.00% 1,526 0.59%

LOA and Rulemaking Application Under the MMPA for Use of SURTASS LFA Sonar
6-23 Incidental Takes
Table 6-3. Maximum Total Annual MMPA Level B Harassment Requested for Years 1 to 4 by SURTASS LFA Sonar (Species and Stocks Listed Alphabetically).
Marine Mammal Species Stock9
Maximum Annual MMPA Level B Harassment: Years 1 to 4
Behavior (Individuals)
Behavior (Percent
Stock)
TTS (Individuals)
TTS (Percent
Stock)
Total Level B (Individuals)
Total Level B (Percent
Stock)
Short-finned pilot whale (Continued)
WNP Northern Ecotype 524.55 2.52% 0 0.00% 525 2.52%
WNP Southern Ecotype 5,682.72 18.03% 0 0.00% 5,683 18.03%
Southern bottlenose whale IND 22.44 0.00% 0 0.00% 22 0.00%
Spade-toothed beaked whale
IND 15.80 0.09% 0 0.00% 16 0.09%
Sperm whale
Hawaii 105.88 2.34% 0 0.00% 106 2.34%
NIND 33.32 0.14% 0 0.00% 33 0.14%
NP 1,429.07 1.28% 0 0.00% 1,429 1.28%
SIND 15.70 0.07% 0 0.00% 16 0.07%
Spinner dolphin
Hawaii Island 1.24 0.21% 0 0.00% 1 0.21%
Hawaii Pelagic 191.51 5.72% 0 0.00% 192 5.72%
IND 239.68 0.05% 0 0.00% 240 0.05%
Kauai/Niihau 83.08 13.85% 0 0.00% 83 13.85%
Kure/Midway Atoll 0.00 0.00% 0 0.00% 0 0.00%
Oahu/4-Islands 19.70 2.88% 0 0.00% 20 2.88%
Pearl and Hermes Reef 0.00 0.00% 0 0.00% 0 0.00%
WNP 574.02 0.00% 0 0.00% 574 0.00%
Stejneger’s beaked whale WNP 200.96 2.49% 0 0.00% 201 2.49%
Striped dolphin
Hawaii 269.01 0.41% 0 0.00% 269 0.41%
IND 5,059.47 0.75% 0 0.00% 5,059 0.75%
Japanese Coastal 3,365.96 17.18% 0 0.00% 3,366 17.18%
WNP Northern Offshore 266.95 0.07% 0 0.00% 267 0.07%
WNP Southern Offshore 3,282.31 6.28% 0 0.00% 3,282 6.28%
Hawaiian monk seal Hawaii 9.71 0.69% 0 0.00% 10 0.69%
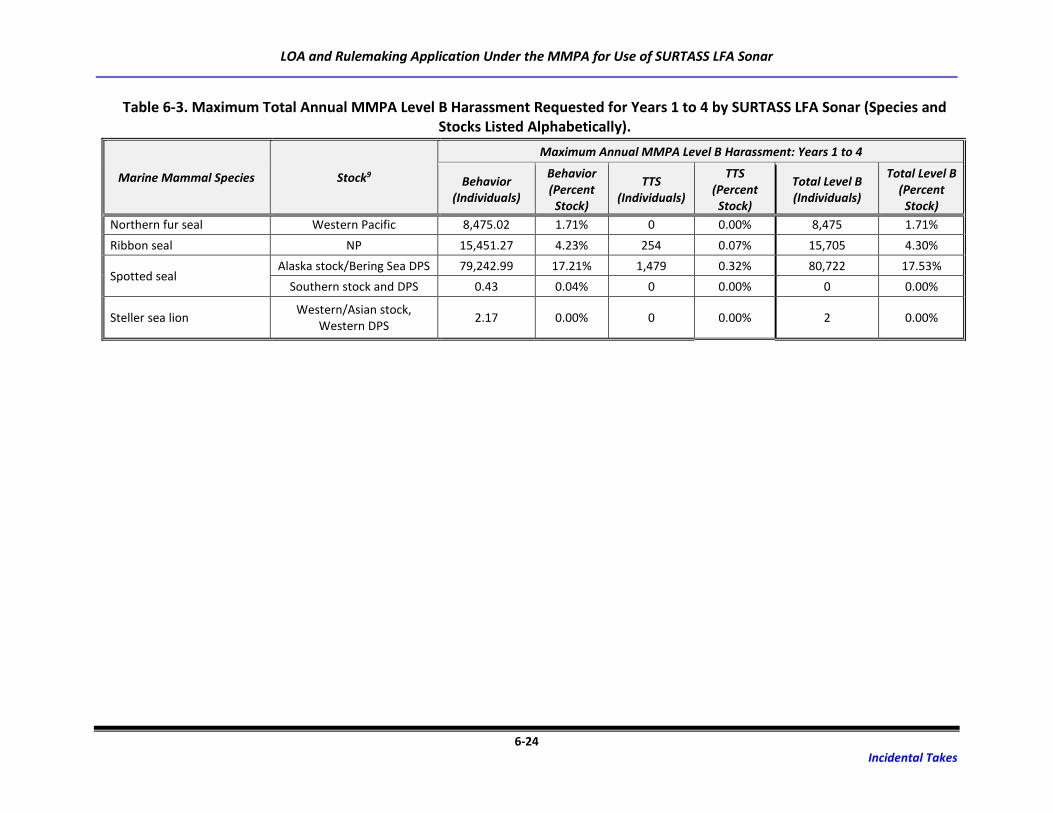
LOA and Rulemaking Application Under the MMPA for Use of SURTASS LFA Sonar
6-24 Incidental Takes
Table 6-3. Maximum Total Annual MMPA Level B Harassment Requested for Years 1 to 4 by SURTASS LFA Sonar (Species and Stocks Listed Alphabetically).
Marine Mammal Species Stock9
Maximum Annual MMPA Level B Harassment: Years 1 to 4
Behavior (Individuals)
Behavior (Percent
Stock)
TTS (Individuals)
TTS (Percent
Stock)
Total Level B (Individuals)
Total Level B (Percent
Stock)
Northern fur seal Western Pacific 8,475.02 1.71% 0 0.00% 8,475 1.71%
Ribbon seal NP 15,451.27 4.23% 254 0.07% 15,705 4.30%
Spotted seal Alaska stock/Bering Sea DPS 79,242.99 17.21% 1,479 0.32% 80,722 17.53%
Southern stock and DPS 0.43 0.04% 0 0.00% 0 0.00%
Steller sea lion Western/Asian stock,
Western DPS 2.17 0.00% 0 0.00% 2 0.00%
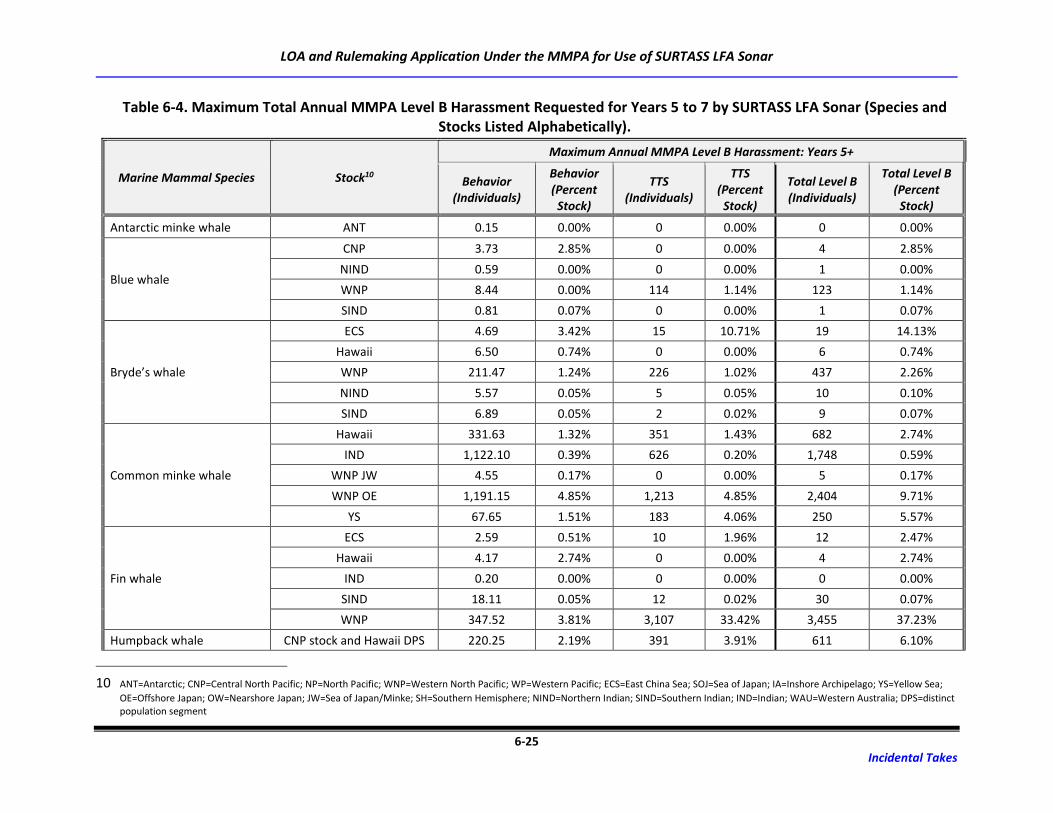
LOA and Rulemaking Application Under the MMPA for Use of SURTASS LFA Sonar
6-25 Incidental Takes
Table 6-4. Maximum Total Annual MMPA Level B Harassment Requested for Years 5 to 7 by SURTASS LFA Sonar (Species and Stocks Listed Alphabetically).
Marine Mammal Species Stock10
Maximum Annual MMPA Level B Harassment: Years 5+
Behavior (Individuals)
Behavior (Percent
Stock)
TTS (Individuals)
TTS (Percent
Stock)
Total Level B (Individuals)
Total Level B (Percent
Stock)
Antarctic minke whale ANT 0.15 0.00% 0 0.00% 0 0.00%
Blue whale
CNP 3.73 2.85% 0 0.00% 4 2.85%
NIND 0.59 0.00% 0 0.00% 1 0.00%
WNP 8.44 0.00% 114 1.14% 123 1.14%
SIND 0.81 0.07% 0 0.00% 1 0.07%
Bryde’s whale
ECS 4.69 3.42% 15 10.71% 19 14.13%
Hawaii 6.50 0.74% 0 0.00% 6 0.74%
WNP 211.47 1.24% 226 1.02% 437 2.26%
NIND 5.57 0.05% 5 0.05% 10 0.10%
SIND 6.89 0.05% 2 0.02% 9 0.07%
Common minke whale
Hawaii 331.63 1.32% 351 1.43% 682 2.74%
IND 1,122.10 0.39% 626 0.20% 1,748 0.59%
WNP JW 4.55 0.17% 0 0.00% 5 0.17%
WNP OE 1,191.15 4.85% 1,213 4.85% 2,404 9.71%
YS 67.65 1.51% 183 4.06% 250 5.57%
Fin whale
ECS 2.59 0.51% 10 1.96% 12 2.47%
Hawaii 4.17 2.74% 0 0.00% 4 2.74%
IND 0.20 0.00% 0 0.00% 0 0.00%
SIND 18.11 0.05% 12 0.02% 30 0.07%
WNP 347.52 3.81% 3,107 33.42% 3,455 37.23%
Humpback whale CNP stock and Hawaii DPS 220.25 2.19% 391 3.91% 611 6.10%
10 ANT=Antarctic; CNP=Central North Pacific; NP=North Pacific; WNP=Western North Pacific; WP=Western Pacific; ECS=East China Sea; SOJ=Sea of Japan; IA=Inshore Archipelago; YS=Yellow Sea;
OE=Offshore Japan; OW=Nearshore Japan; JW=Sea of Japan/Minke; SH=Southern Hemisphere; NIND=Northern Indian; SIND=Southern Indian; IND=Indian; WAU=Western Australia; DPS=distinct population segment

LOA and Rulemaking Application Under the MMPA for Use of SURTASS LFA Sonar
6-26 Incidental Takes
Table 6-4. Maximum Total Annual MMPA Level B Harassment Requested for Years 5 to 7 by SURTASS LFA Sonar (Species and Stocks Listed Alphabetically).
Marine Mammal Species Stock10
Maximum Annual MMPA Level B Harassment: Years 5+
Behavior (Individuals)
Behavior (Percent
Stock)
TTS (Individuals)
TTS (Percent
Stock)
Total Level B (Individuals)
Total Level B (Percent
Stock)
Humpback whale (Continued)
WAU stock and DPS 1.17 0.00% 0 0.00% 1 0.00%
WNP stock and DPS 381.92 28.87% 3,884 292.62% 4,266 321.49%
North Pacific right whale WNP 4.77 0.44% 117 12.71% 122 13.15%
Omura's whale
NIND 5.57 0.05% 5 0.05% 10 0.10%
SIND 6.89 0.05% 0 0.00% 7 0.05%
WNP 15.97 0.95% 0 0.00% 16 0.95%
Sei whale
Hawaii 11.29 2.85% 11 2.85% 22 5.70%
SIND 0.22 0.00% 0 0.00% 0 0.00%
NP 302.27 4.43% 4,204 60.13% 4,507 64.57%
NIND 5.40 0.05% 0 0.00% 5 0.05%
Western North Pacific gray whale
WNP stock and Western DPS
0.59 0.44% 0 0.00% 1 0.44%
Baird’s beaked whale WNP 3,776.57 66.36% 0 0.00% 3,777 66.36%
Blainville’s beaked whale
Hawaii 47.22 2.40% 0 0.00% 47 2.40%
WNP 311.35 3.82% 0 0.00% 311 3.82%
IND 65.19 0.37% 0 0.00% 65 0.37%
Common bottlenose dolphin
4-Islands 5.59 2.96% 0 0.00% 6 2.96%
Hawaii Island 0.49 0.41% 0 0.00% 0 0.00%
Hawaii Pelagic 113.55 0.49% 0 0.00% 114 0.49%
IA 140.04 0.15% 0 0.00% 140 0.15%
IND 1,551.29 0.20% 0 0.00% 1,551 0.20%
Japanese Coastal 1,789.16 50.86% 0 0.00% 1,789 50.86%
Kauai/Niihau 15.79 8.55% 0 0.00% 16 8.55%
Oahu 45.55 6.17% 0 0.00% 46 6.17%

LOA and Rulemaking Application Under the MMPA for Use of SURTASS LFA Sonar
6-27 Incidental Takes
Table 6-4. Maximum Total Annual MMPA Level B Harassment Requested for Years 5 to 7 by SURTASS LFA Sonar (Species and Stocks Listed Alphabetically).
Marine Mammal Species Stock10
Maximum Annual MMPA Level B Harassment: Years 5+
Behavior (Individuals)
Behavior (Percent
Stock)
TTS (Individuals)
TTS (Percent
Stock)
Total Level B (Individuals)
Total Level B (Percent
Stock)
Common bottlenose dolphin (Continued)
WNP Northern Offshore 798.60 0.78% 0 0.00% 799 0.78%
WNP Southern Offshore 3,062.72 7.45% 0 0.00% 3,063 7.45%
WAU 872.98 29.09% 0 0.00% 873 29.09%
Common dolphin IND 71.94 0.00% 0 0.00% 72 0.00%
WNP 275,078.61 16.08% 0 0.00% 275,079 16.08%
Cuvier’s beaked whale
Hawaii 26.15 3.62% 0 0.00% 26 3.62%
IND 317.46 1.17% 0 0.00% 317 1.17%
SH 105.82 0.15% 0 0.00% 106 0.15%
WNP 8,980.39 10.04% 0 0.00% 8,980 10.04%
Dall’s porpoise
SOJ dalli type 844.73 0.49% 0 0.00% 845 0.49%
WNP dalli ecotype 30,327.05 18.72% 0 0.00% 30,327 18.72%
WNP truei ecotype 670.01 0.39% 0 0.00% 670 0.39%
Deraniyagala's beaked whale
IND 216.92 1.27% 0 0.00% 217 1.27%
NP 222.15 0.91% 0 0.00% 222 0.91%
Dwarf sperm whale
Hawaii 782.10 4.44% 0 0.00% 782 4.44%
IND 4.18 0.07% 0 0.00% 4 0.07%
WNP 635.07 0.18% 0 0.00% 635 0.18%
False killer whale
Hawaii Pelagic 68.90 4.44% 0 0.00% 69 4.44%
IA 341.17 3.51% 0 0.00% 341 3.51%
IND 16.13 0.00% 0 0.00% 16 0.00%
Main Hawaiian Islands Insular stock and DPS
0.82 0.49% 0 0.00% 1 0.49%
Northwestern Hawaiian Islands
0.00 0.00% 0 0.00% 0 0.00%

LOA and Rulemaking Application Under the MMPA for Use of SURTASS LFA Sonar
6-28 Incidental Takes
Table 6-4. Maximum Total Annual MMPA Level B Harassment Requested for Years 5 to 7 by SURTASS LFA Sonar (Species and Stocks Listed Alphabetically).
Marine Mammal Species Stock10
Maximum Annual MMPA Level B Harassment: Years 5+
Behavior (Individuals)
Behavior (Percent
Stock)
TTS (Individuals)
TTS (Percent
Stock)
Total Level B (Individuals)
Total Level B (Percent
Stock)
False killer whale (Continued)
WNP 1,596.09 9.63% 0 0.00% 1,596 9.63%
Fraser’s dolphin
CNP 685.97 4.06% 0 0.00% 686 4.06%
Hawaii 2,320.48 4.52% 0 0.00% 2,320 4.52%
IND 127.82 0.07% 0 0.00% 128 0.07%
WNP 2,558.59 1.29% 0 0.00% 2,559 1.29%
Ginkgo-toothed beaked whale
IND 15.86 0.10% 0 0.00% 16 0.10%
NP 328.95 1.40% 0 0.00% 329 1.40%
Harbor porpoise WNP 503.16 1.61% 0 0.00% 503 1.61%
Hubbs’ beaked whale NP 36.03 0.15% 0 0.00% 36 0.15%
Indo-Pacific bottlenose dolphin
IND 15.55 0.20% 0 0.00% 16 0.20%
Killer whale
Hawaii 7.65 5.26% 0 0.00% 8 5.26%
IND 545.67 4.33% 0 0.00% 546 4.33%
WNP 14,387.33 117.31% 0 0.00% 14,387 117.31%
Kogia spp. WNP 1,494.11 0.35% 0 0.00% 1,494 0.35%
Longman’s beaked whale
Hawaii 882.41 11.59% 0 0.00% 882 11.59%
IND 447.19 2.64% 0 0.00% 447 2.64%
WNP 574.04 7.50% 0 0.00% 574 7.50%
Melon-headed whale
Hawaiian Islands 215.92 2.47% 0 0.00% 216 2.47%
IND 552.27 0.88% 0 0.00% 552 0.88%
Kohala Resident 11.02 0.49% 0 0.00% 11 0.49%
WNP 1,823.43 3.27% 0 0.00% 1,823 3.27%
Mesoplodon spp. WNP 14.28 0.07% 0 0.00% 14 0.07%

LOA and Rulemaking Application Under the MMPA for Use of SURTASS LFA Sonar
6-29 Incidental Takes
Table 6-4. Maximum Total Annual MMPA Level B Harassment Requested for Years 5 to 7 by SURTASS LFA Sonar (Species and Stocks Listed Alphabetically).
Marine Mammal Species Stock10
Maximum Annual MMPA Level B Harassment: Years 5+
Behavior (Individuals)
Behavior (Percent
Stock)
TTS (Individuals)
TTS (Percent
Stock)
Total Level B (Individuals)
Total Level B (Percent
Stock)
Northern right whale dolphin
NP 0.36 0.00% 0 0.00% 0 0.00%
Pacific white-sided dolphin NP 12,890.33 1.41% 0 0.00% 12,890 1.41%
Pantropical spotted dolphin
4-Islands 37.82 17.18% 0 0.00% 38 17.18%
Hawaii Island 26.97 12.25% 0 0.00% 27 12.25%
Hawaiian Pelagic 355.04 0.66% 0 0.00% 355 0.66%
IND 427.97 0.07% 0 0.00% 428 0.07%
Oahu 27.63 12.58% 0 0.00% 28 12.58%
WNP 5,883.15 4.53% 0 0.00% 5,883 4.53%
Pygmy killer whale
Hawaii 469.49 4.44% 0 0.00% 469 4.44%
IND 81.84 0.37% 0 0.00% 82 0.37%
WNP 1,035.09 3.30% 0 0.00% 1,035 3.30%
Pygmy sperm whale
Hawaii 317.62 4.44% 0 0.00% 318 4.44%
IND 0.39 0.00% 0 0.00% 0 0.00%
WNP 264.88 0.09% 0 0.00% 265 0.09%
Risso’s dolphin
Hawaii 494.40 4.28% 0 0.00% 494 4.28%
IA 1,374.49 0.92% 0 0.00% 1,374 0.92%
WNP 4,914.00 3.47% 0 0.00% 4,914 3.47%
IND 6,353.75 1.39% 0 0.00% 6,354 1.39%
Rough-toothed dolphin
Hawaii 254.31 0.33% 0 0.00% 254 0.33%
IND 56.98 0.00% 0 0.00% 57 0.00%
WNP 1,731.81 34.56% 0 0.00% 1,732 34.56%
Short-finned pilot whale Hawaii 472.53 2.38% 0 0.00% 473 2.38%
IND 2,097.63 0.81% 0 0.00% 2,098 0.81%
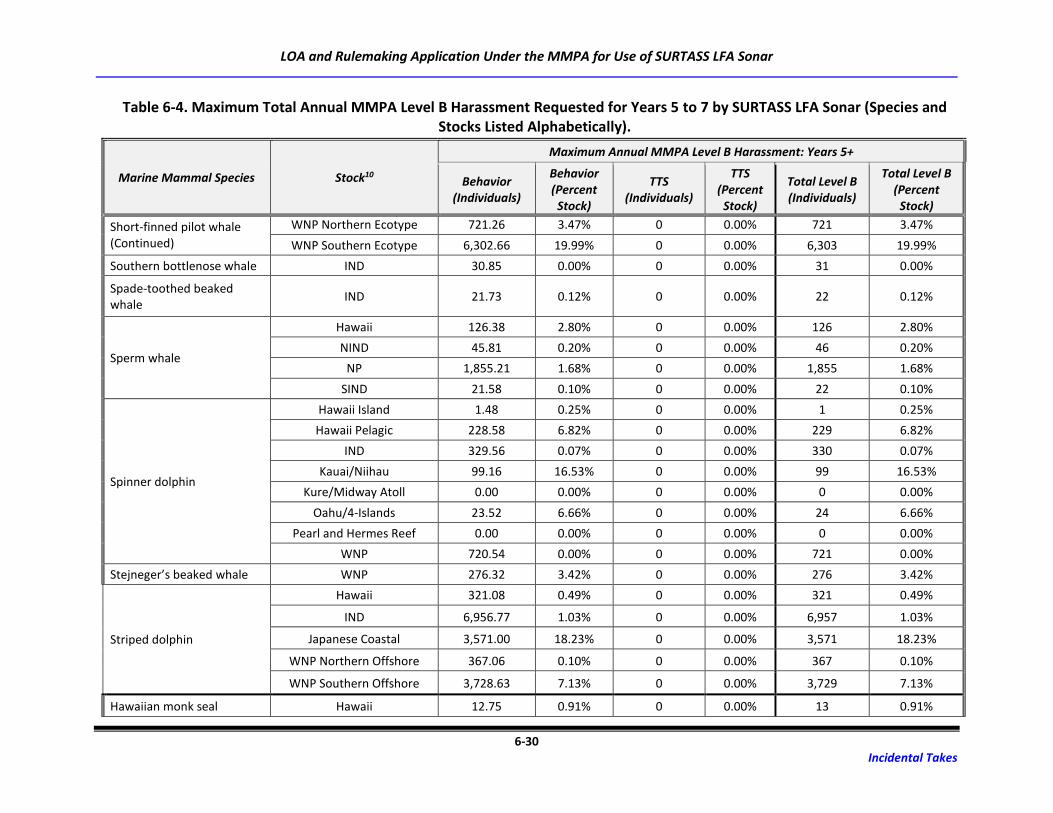
LOA and Rulemaking Application Under the MMPA for Use of SURTASS LFA Sonar
6-30 Incidental Takes
Table 6-4. Maximum Total Annual MMPA Level B Harassment Requested for Years 5 to 7 by SURTASS LFA Sonar (Species and Stocks Listed Alphabetically).
Marine Mammal Species Stock10
Maximum Annual MMPA Level B Harassment: Years 5+
Behavior (Individuals)
Behavior (Percent
Stock)
TTS (Individuals)
TTS (Percent
Stock)
Total Level B (Individuals)
Total Level B (Percent
Stock)
Short-finned pilot whale (Continued)
WNP Northern Ecotype 721.26 3.47% 0 0.00% 721 3.47%
WNP Southern Ecotype 6,302.66 19.99% 0 0.00% 6,303 19.99%
Southern bottlenose whale IND 30.85 0.00% 0 0.00% 31 0.00%
Spade-toothed beaked whale
IND 21.73 0.12% 0 0.00% 22 0.12%
Sperm whale
Hawaii 126.38 2.80% 0 0.00% 126 2.80%
NIND 45.81 0.20% 0 0.00% 46 0.20%
NP 1,855.21 1.68% 0 0.00% 1,855 1.68%
SIND 21.58 0.10% 0 0.00% 22 0.10%
Spinner dolphin
Hawaii Island 1.48 0.25% 0 0.00% 1 0.25%
Hawaii Pelagic 228.58 6.82% 0 0.00% 229 6.82%
IND 329.56 0.07% 0 0.00% 330 0.07%
Kauai/Niihau 99.16 16.53% 0 0.00% 99 16.53%
Kure/Midway Atoll 0.00 0.00% 0 0.00% 0 0.00%
Oahu/4-Islands 23.52 6.66% 0 0.00% 24 6.66%
Pearl and Hermes Reef 0.00 0.00% 0 0.00% 0 0.00%
WNP 720.54 0.00% 0 0.00% 721 0.00%
Stejneger’s beaked whale WNP 276.32 3.42% 0 0.00% 276 3.42%
Striped dolphin
Hawaii 321.08 0.49% 0 0.00% 321 0.49%
IND 6,956.77 1.03% 0 0.00% 6,957 1.03%
Japanese Coastal 3,571.00 18.23% 0 0.00% 3,571 18.23%
WNP Northern Offshore 367.06 0.10% 0 0.00% 367 0.10%
WNP Southern Offshore 3,728.63 7.13% 0 0.00% 3,729 7.13%
Hawaiian monk seal Hawaii 12.75 0.91% 0 0.00% 13 0.91%

LOA and Rulemaking Application Under the MMPA for Use of SURTASS LFA Sonar
6-31 Incidental Takes
Table 6-4. Maximum Total Annual MMPA Level B Harassment Requested for Years 5 to 7 by SURTASS LFA Sonar (Species and Stocks Listed Alphabetically).
Marine Mammal Species Stock10
Maximum Annual MMPA Level B Harassment: Years 5+
Behavior (Individuals)
Behavior (Percent
Stock)
TTS (Individuals)
TTS (Percent
Stock)
Total Level B (Individuals)
Total Level B (Percent
Stock)
Northern fur seal Western Pacific 11,653.16 2.35% 0 0.00% 11,653 2.35%
Ribbon seal NP 21,245.50 5.82% 350 0.10% 21,595 5.92%
Spotted seal Alaska stock/Bering Sea DPS 108,959.11 23.66% 2,034 0.44% 110,993 24.10%
Southern stock and DPS 0.59 0.05% 0 0.00% 1 0.05%
Steller sea lion Western/Asian stock,
Western DPS 2.98 0.00% 0 0.00% 3 0.00%

LOA and Rulemaking Application Under the MMPA for Use of SURTASS LFA Sonar
7-1 Impacts to Species or Stocks
7 IMPACTS TO MARINE MAMMAL SPECIES OR STOCKS
Acoustic analyses were conducted to determine the potential impacts to marine mammals at both the
individual level and at the population level associated with exposure to SURTASS LFA sonar
transmissions. The take request for MMPA Level B incidental harassment reflects a a representative
number of anticipated SURTASS LFA sonar transmission hours in years 1 to 4 and years 5 to 7 at each
model area. From those analyses, the maximum number of individuals potentially affected and the
maximum percentage of the population potentially affected in one year were identified (Tables 6-3 and
6-4, respectively).
Level A harassment can result from auditory or non-auditory injury. Auditory injury includes PTS, which
is a condition that occurs when sound intensity is very high and/or of such long duration that the result
is a permanent loss of hearing sensitivity over the frequency band of the exposure; i.e., a physical injury.
The NMFS (2018b) guidance specifies auditory-weighted (SELcum) thresholds for the onset of PTS, which
is considered as the onset of injury (Table 6-1). As stated previously, based on simple spherical spreading
(i.e., TL based on 20 × log10 [range {m}]), all hearing groups except LF cetaceans would need to remain
within 22 ft (7 m) for an entire LFA sonar ping (60 sec) to potentially experience PTS. LF cetaceans would
need to remain at the greatest distance, 135 ft (41 m), from the transmitting sonar for an entire LFA
sonar ping (60 sec) before experiencing the onset of injury.
The NMFS (2018b) acoustic guidance was used in analysis and modeling to assess the potential for Level
A harassment or auditory injury to marine mammals resulting from use of the SURTASS LFA sonar.
Fifteen representative, real-world marine environments were selected for analysis and modeling. The
comprehensive modeling and analysis has resulted in no (0 percent) estimated risk of MMPA Level A
harassment for any marine mammal species or stocks, based on the full suite of mitigation measures
being implemented when SURTASS LFA sonar is transmitting.
Non-auditory injury or Level A harassment may be possible as the result of direct acoustic impact on
tissue, indirect acoustic impact on tissue surrounding a structure, and acoustically mediated bubble
growth within tissues from supersaturated dissolved nitrogen gas. Physical impacts, such as direct
acoustic trauma or acoustically enhanced bubble growth, require relatively intense received energy that
would only occur at short distances from high-powered sonar sources (Nowacek et al., 2007; Zimmer
and Tyack, 2007). While resonance can occur in marine animals, this resonance does not necessarily
cause injury, and any such injury is not expected to occur below the received levels at which auditory
injury (PTS) may occur. Damage to the lungs and large sinus cavities of cetaceans from air space
resonance is not regarded as a likely significant non-auditory injury because resonance frequencies of
marine mammal lungs are below that of the LFA sonar signal (Finneran, 2003). No non-auditory or Level
A harassment are reasonably expected as the result of exposure to LFA sonar signals.
To date, no strandings of marine mammals have been associated with the use of SURTASS LFA sonar
since its use began in the early 2000s. Use of SURTASS LFA sonar, with the comprehensive suite of
mitigation measures implemented, have produced no known lethal removal impacts (i.e., Level A takes)
to marine mammal stocks or species as reported in the DoN Annual Reports from 2003 through 2017. In
summary, for the reasons listed above, the Navy has concluded that the likelihood of SURTASS LFA sonar
Requirement 7: Anticipated impact of the activity upon the species or stocks.

LOA and Rulemaking Application Under the MMPA for Use of SURTASS LFA Sonar
7-2 Impacts to Species or Stocks
transmissions (with mitigation measures implemented) causing injury or Level A harassment in marine
mammals is considered negligible.
The primary impact anticipated from SURTASS LFA sonar transmission is MMPA Level B harassment of
marine mammals. This Rulemaking and LOA application assumes that short-term, non-injurious sound
exposures that may cause temporary threshold shifts (TTS) or temporary behavioral disruptions
constitute Level B incidental harassment. Behavioral reactions of marine mammals to underwater sound
are known to occur, but they are very difficult to predict. The potential behavioral impacts predicted
here are based on the best available scientific data, which included a research program (LFS SRP) that
exposed baleen whales to SURTASS LFA sonar while they were engaged in biologically important
behaviors (blue and fin whales foraging off the U.S. west coast, gray whales migrating along the U.S.
west coast, and humpback whales singing off the Hawaiian Islands). The results of the LFS SRP confirmed
that some portion of the total number of whales exposed to LFA sonar responded behaviorally by
changing their vocal activity, moving away from the source vessel, or both; but the responses were
short-lived and animals returned to their normal activities within tens of minutes after initial exposure.
The LFS SRP results also showed that the context of an exposure scenario is clearly important for
determining the probability, magnitude, and duration of a response (Ellison et al., 2012).
For most stocks of marine mammal species, the maximum annual percent of the stock or population
that may experience Level B incidental harassment is less than 15 percent. This means that during one
24-hr period during the year, less than 15 percent of the population may react to SURTASS LFA sonar by
changing behavior or moving a small distance, or may experience TTS. Of the 139 stocks within the
SURTASS LFA sonar study area, eleven stocks in years 1 to 4 and fifteen stocks in years 5 to 7 have the
potential for MMPA Level B incidental harassment greater than 15 percent. The highest percentage of a
population that may experience Level B harassment is the WNP stock and DPS of humpback whales at
233.84% and 321.49% in years 1 to 4 and years 5 to 7, respectively. This means that each individual in
the population may react behaviorally or have TTS two to three times during one year. The percentage
of the WNP stock and DPS of humpback whales that may experience Level B harassment is influenced by
the size of the population, which is small (1,328 individuals). The next highest stock is the WNP stock of
killer whales, with 85.37% and 117.31% in years 1 to 4 and years 5 to 7, respectively.
The number of individual marine mammals that may be impacted over the seven years of the proposed
training and testing activities has been estimated. The maximum number of individual marine mammals
potentially affected in one year during years 1 to 4 (with 496 SURTASS LFA sonar transmission hours
each year) and years 5 to 7 (with 592 SURTASS LFA sonar transmission hours each year) were multiplied
to yield the total number of indivduals potentially impacted over seven years (Table 7-1). For example,
for the WNP blue whale, four years of 496 transmission hours (years 1 to 4; 90 individuals per year x 4
years = 360 individuals) plus three years of 592 transmission hours (years 5 to 7; 123 individuals per year
x 3 years = 369 individuals) are summed for an estimate of 729 WNP blue whales that might be
impacted over the seven-year duration of the proposed SURTASS LFA sonar training and testing
activities. As stated in Chapter 6, this is a conservative estimate since it is based on the maximum
potential impact to a stock across all model areas in which an activity may occur. Therefore, if the
activity occurs in a different model area than the area where the maximum potential impact was
predicted, the actual potential impact could be less than that estimated. However, since the Navy
cannot forecast where a specific activity may be conducted this far in advance, this maximum estimate
provides the Navy with the flexibility to conduct its training and testing activities across all model areas
identified for each activity.
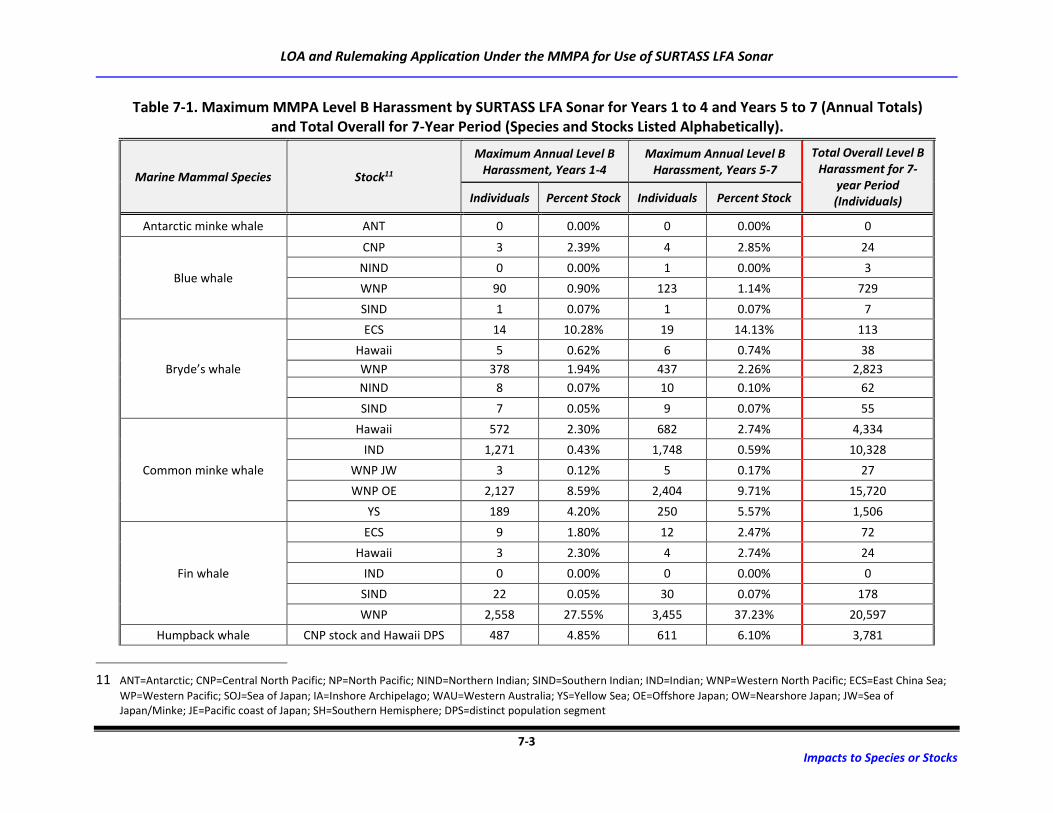
LOA and Rulemaking Application Under the MMPA for Use of SURTASS LFA Sonar
7-3 Impacts to Species or Stocks
Table 7-1. Maximum MMPA Level B Harassment by SURTASS LFA Sonar for Years 1 to 4 and Years 5 to 7 (Annual Totals) and Total Overall for 7-Year Period (Species and Stocks Listed Alphabetically).
Marine Mammal Species Stock11
Maximum Annual Level B Harassment, Years 1-4
Maximum Annual Level B Harassment, Years 5-7
Total Overall Level B Harassment for 7-
year Period (Individuals) Individuals Percent Stock Individuals Percent Stock
Antarctic minke whale ANT 0 0.00% 0 0.00% 0
Blue whale
CNP 3 2.39% 4 2.85% 24
NIND 0 0.00% 1 0.00% 3
WNP 90 0.90% 123 1.14% 729
SIND 1 0.07% 1 0.07% 7
Bryde’s whale
ECS 14 10.28% 19 14.13% 113
Hawaii 5 0.62% 6 0.74% 38
WNP 378 1.94% 437 2.26% 2,823
NIND 8 0.07% 10 0.10% 62
SIND 7 0.05% 9 0.07% 55
Common minke whale
Hawaii 572 2.30% 682 2.74% 4,334
IND 1,271 0.43% 1,748 0.59% 10,328
WNP JW 3 0.12% 5 0.17% 27
WNP OE 2,127 8.59% 2,404 9.71% 15,720
YS 189 4.20% 250 5.57% 1,506
Fin whale
ECS 9 1.80% 12 2.47% 72
Hawaii 3 2.30% 4 2.74% 24
IND 0 0.00% 0 0.00% 0
SIND 22 0.05% 30 0.07% 178
WNP 2,558 27.55% 3,455 37.23% 20,597
Humpback whale CNP stock and Hawaii DPS 487 4.85% 611 6.10% 3,781
11 ANT=Antarctic; CNP=Central North Pacific; NP=North Pacific; NIND=Northern Indian; SIND=Southern Indian; IND=Indian; WNP=Western North Pacific; ECS=East China Sea;
WP=Western Pacific; SOJ=Sea of Japan; IA=Inshore Archipelago; WAU=Western Australia; YS=Yellow Sea; OE=Offshore Japan; OW=Nearshore Japan; JW=Sea of Japan/Minke; JE=Pacific coast of Japan; SH=Southern Hemisphere; DPS=distinct population segment
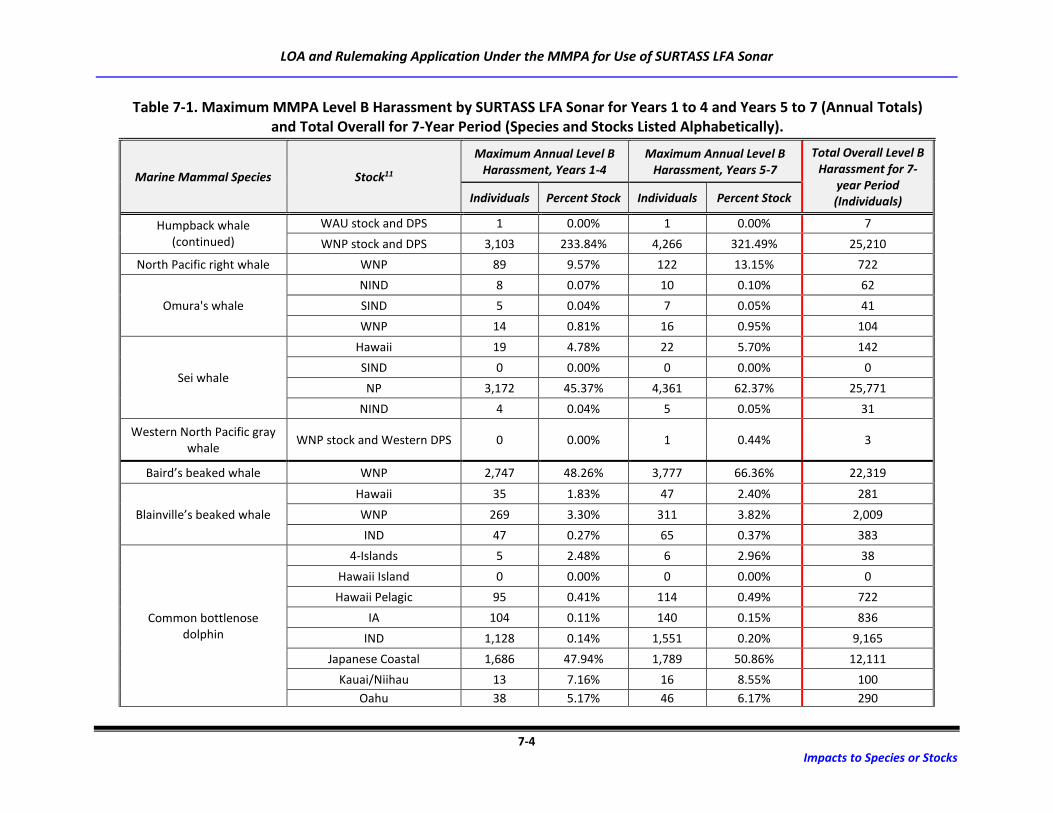
LOA and Rulemaking Application Under the MMPA for Use of SURTASS LFA Sonar
7-4 Impacts to Species or Stocks
Table 7-1. Maximum MMPA Level B Harassment by SURTASS LFA Sonar for Years 1 to 4 and Years 5 to 7 (Annual Totals) and Total Overall for 7-Year Period (Species and Stocks Listed Alphabetically).
Marine Mammal Species Stock11
Maximum Annual Level B Harassment, Years 1-4
Maximum Annual Level B Harassment, Years 5-7
Total Overall Level B Harassment for 7-
year Period (Individuals) Individuals Percent Stock Individuals Percent Stock
Humpback whale (continued)
WAU stock and DPS 1 0.00% 1 0.00% 7
WNP stock and DPS 3,103 233.84% 4,266 321.49% 25,210
North Pacific right whale WNP 89 9.57% 122 13.15% 722
Omura's whale
NIND 8 0.07% 10 0.10% 62
SIND 5 0.04% 7 0.05% 41
WNP 14 0.81% 16 0.95% 104
Sei whale
Hawaii 19 4.78% 22 5.70% 142
SIND 0 0.00% 0 0.00% 0
NP 3,172 45.37% 4,361 62.37% 25,771
NIND 4 0.04% 5 0.05% 31
Western North Pacific gray whale
WNP stock and Western DPS 0 0.00% 1 0.44% 3
Baird’s beaked whale WNP 2,747 48.26% 3,777 66.36% 22,319
Blainville’s beaked whale
Hawaii 35 1.83% 47 2.40% 281
WNP 269 3.30% 311 3.82% 2,009
IND 47 0.27% 65 0.37% 383
Common bottlenose dolphin
4-Islands 5 2.48% 6 2.96% 38
Hawaii Island 0 0.00% 0 0.00% 0
Hawaii Pelagic 95 0.41% 114 0.49% 722
IA 104 0.11% 140 0.15% 836
IND 1,128 0.14% 1,551 0.20% 9,165
Japanese Coastal 1,686 47.94% 1,789 50.86% 12,111
Kauai/Niihau 13 7.16% 16 8.55% 100
Oahu 38 5.17% 46 6.17% 290

LOA and Rulemaking Application Under the MMPA for Use of SURTASS LFA Sonar
7-5 Impacts to Species or Stocks
Table 7-1. Maximum MMPA Level B Harassment by SURTASS LFA Sonar for Years 1 to 4 and Years 5 to 7 (Annual Totals) and Total Overall for 7-Year Period (Species and Stocks Listed Alphabetically).
Marine Mammal Species Stock11
Maximum Annual Level B Harassment, Years 1-4
Maximum Annual Level B Harassment, Years 5-7
Total Overall Level B Harassment for 7-
year Period (Individuals) Individuals Percent Stock Individuals Percent Stock
Common bottlenose dolphin (Continued)
WNP Northern Offshore 581 0.57% 799 0.78% 4,721
WNP Southern Offshore 2,726 6.63% 3,063 7.45% 20,093
WAU 635 21.16% 873 29.09% 5,159
Common dolphin IND 52 0.00% 72 0.00% 424
WNP 203,871 12.24% 275,079 16.08% 1,640,721
Cuvier’s beaked whale
Hawaii 22 3.03% 26 3.62% 166
IND 231 0.85% 317 1.17% 1,875
SH 77 0.11% 106 0.15% 626
WNP 6,946 7.78% 8,980 10.04% 54,724
Dall’s porpoise
SOJ dalli type 614 0.36% 845 0.49% 4,991
WNP dalli ecotype 22,056 13.62% 30,327 18.72% 179,205
WNP truei ecotype 487 0.28% 670 0.39% 3,958
Deraniyagala's beaked whale
IND 158 0.92% 217 1.27% 1,283
NP 190 0.77% 222 0.91% 1,426
Dwarf sperm whale
Hawaii 655 3.72% 782 4.44% 4,966
IND 3 0.05% 4 0.07% 24
WNP 486 0.14% 635 0.18% 3,849
False killer whale
Hawaii Pelagic 58 3.72% 69 4.44% 439
IA 252 2.59% 341 3.51% 2,031
IND 12 0.01% 16 0.00% 96
Main Hawaiian Islands Insular stock and DPS
1 0.41% 1 0.49% 7
Northwestern Hawaiian Islands
0 0.00% 0 0.00% 0
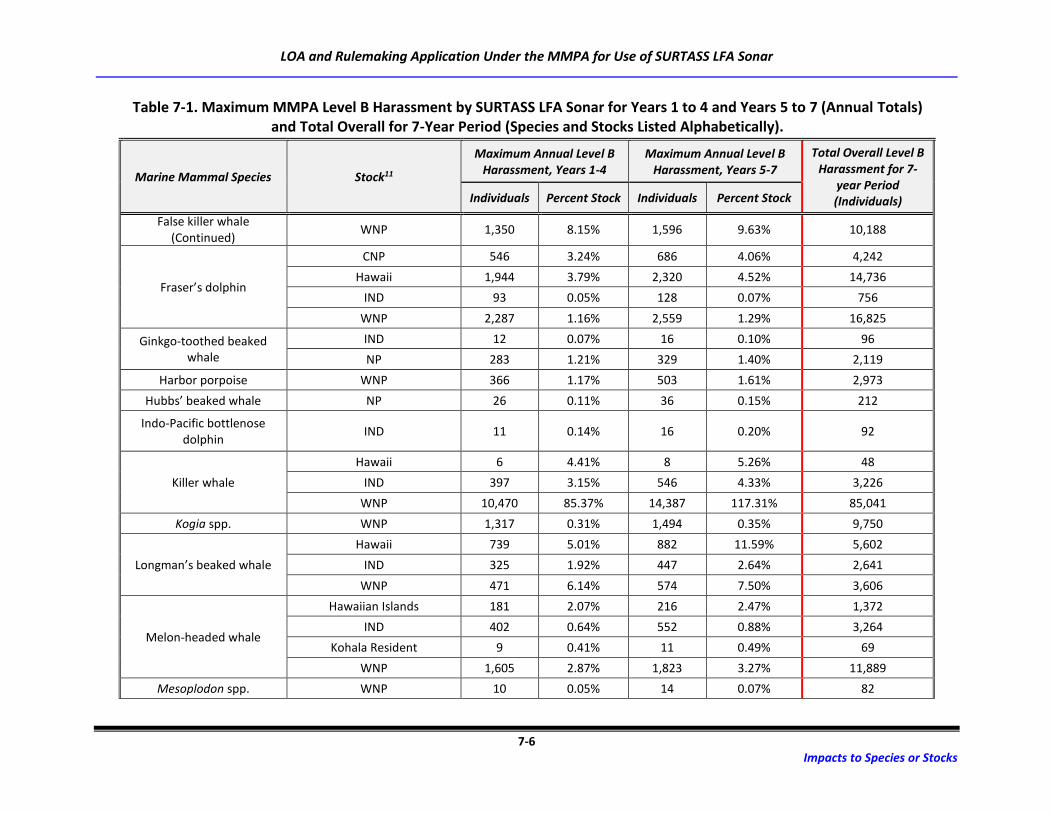
LOA and Rulemaking Application Under the MMPA for Use of SURTASS LFA Sonar
7-6 Impacts to Species or Stocks
Table 7-1. Maximum MMPA Level B Harassment by SURTASS LFA Sonar for Years 1 to 4 and Years 5 to 7 (Annual Totals) and Total Overall for 7-Year Period (Species and Stocks Listed Alphabetically).
Marine Mammal Species Stock11
Maximum Annual Level B Harassment, Years 1-4
Maximum Annual Level B Harassment, Years 5-7
Total Overall Level B Harassment for 7-
year Period (Individuals) Individuals Percent Stock Individuals Percent Stock
False killer whale (Continued)
WNP 1,350 8.15% 1,596 9.63% 10,188
Fraser’s dolphin
CNP 546 3.24% 686 4.06% 4,242
Hawaii 1,944 3.79% 2,320 4.52% 14,736
IND 93 0.05% 128 0.07% 756
WNP 2,287 1.16% 2,559 1.29% 16,825
Ginkgo-toothed beaked whale
IND 12 0.07% 16 0.10% 96
NP 283 1.21% 329 1.40% 2,119
Harbor porpoise WNP 366 1.17% 503 1.61% 2,973
Hubbs’ beaked whale NP 26 0.11% 36 0.15% 212
Indo-Pacific bottlenose dolphin
IND 11 0.14% 16 0.20% 92
Killer whale
Hawaii 6 4.41% 8 5.26% 48
IND 397 3.15% 546 4.33% 3,226
WNP 10,470 85.37% 14,387 117.31% 85,041
Kogia spp. WNP 1,317 0.31% 1,494 0.35% 9,750
Longman’s beaked whale
Hawaii 739 5.01% 882 11.59% 5,602
IND 325 1.92% 447 2.64% 2,641
WNP 471 6.14% 574 7.50% 3,606
Melon-headed whale
Hawaiian Islands 181 2.07% 216 2.47% 1,372
IND 402 0.64% 552 0.88% 3,264
Kohala Resident 9 0.41% 11 0.49% 69
WNP 1,605 2.87% 1,823 3.27% 11,889
Mesoplodon spp. WNP 10 0.05% 14 0.07% 82

LOA and Rulemaking Application Under the MMPA for Use of SURTASS LFA Sonar
7-7 Impacts to Species or Stocks
Table 7-1. Maximum MMPA Level B Harassment by SURTASS LFA Sonar for Years 1 to 4 and Years 5 to 7 (Annual Totals) and Total Overall for 7-Year Period (Species and Stocks Listed Alphabetically).
Marine Mammal Species Stock11
Maximum Annual Level B Harassment, Years 1-4
Maximum Annual Level B Harassment, Years 5-7
Total Overall Level B Harassment for 7-
year Period (Individuals) Individuals Percent Stock Individuals Percent Stock
Northern right whale dolphin
NP 0 0.00% 0 0.00% 0
Pacific white-sided dolphin NP 9,530 1.05% 12,890 1.41% 76,790
Pantropical spotted dolphin
4-Islands 32 14.40% 38 17.18% 242
Hawaii Island 23 10.26% 27 12.25% 173
Hawaiian Pelagic 297 0.55% 355 0.66% 2,253
IND 311 0.05% 428 0.07% 2,528
Oahu 23 10.54% 28 12.58% 176
WNP 5,105 3.95% 5,883 4.53% 38,069
Pygmy killer whale
Hawaii 393 3.72% 469 4.44% 2,979
IND 60 0.27% 82 0.37% 486
WNP 901 2.87% 1,035 3.30% 6,709
Pygmy sperm whale
Hawaii 266 3.72% 318 4.44% 2,018
IND 0 0.00% 0 0.00% 0
WNP 203 0.07% 265 0.09% 1,607
Risso’s dolphin
Hawaii 414 3.58% 494 4.28% 3,138
IA 1,045 0.70% 1,374 0.92% 8,302
WNP 4,347 3.07% 4,914 3.47% 32,130
IND 4,621 1.01% 6,354 1.39% 37,546
Rough-toothed dolphin
Hawaii 213 0.28% 254 0.33% 1,614
IND 41 0.00% 57 0.00% 335
WNP 1,439 28.74% 1,732 34.56% 10,952
Short-finned pilot whale Hawaii 396 2.00% 473 2.38% 3,003
IND 1,526 0.59% 2,098 0.81% 12,398

LOA and Rulemaking Application Under the MMPA for Use of SURTASS LFA Sonar
7-8 Impacts to Species or Stocks
Table 7-1. Maximum MMPA Level B Harassment by SURTASS LFA Sonar for Years 1 to 4 and Years 5 to 7 (Annual Totals) and Total Overall for 7-Year Period (Species and Stocks Listed Alphabetically).
Marine Mammal Species Stock11
Maximum Annual Level B Harassment, Years 1-4
Maximum Annual Level B Harassment, Years 5-7
Total Overall Level B Harassment for 7-
year Period (Individuals) Individuals Percent Stock Individuals Percent Stock
Short-finned pilot whale (continued)
WNP Northern Ecotype 525 2.52% 721 3.47% 4,263
WNP Southern Ecotype 5,683 18.03% 6,303 19.99% 41,641
Southern bottlenose whale IND 22 0.00% 31 0.00% 181
Spade-toothed beaked whale
IND 16 0.09% 22 0.12% 130
Sperm whale
Hawaii 106 2.34% 126 2.80% 802
NIND 33 0.14% 46 0.20% 270
NP 1,429 1.28% 1,855 1.68% 11,281
SIND 16 0.07% 22 0.10% 130
Spinner dolphin
Hawaii Island 1 0.21% 1 0.25% 7
Hawaii Pelagic 192 5.72% 229 6.82% 1,455
IND 240 0.05% 330 0.07% 1,950
Kauai/Niihau 83 13.85% 99 16.53% 629
Kure/Midway Atoll 0 0.00% 0 0.00% 0
Oahu/4-Islands 20 2.88% 24 6.66% 152
Pearl and Hermes Reef 0 0.00% 0 0.00% 0
WNP 574 0.00% 721 0.00% 4,459
Stejneger’s beaked whale WNP 201 2.49% 276 3.42% 1,632
Striped dolphin
Hawaii 269 0.41% 321 0.49% 2,039
IND 5,059 0.75% 6,957 1.03% 41,107
Japanese Coastal 3,366 17.18% 3,571 18.23% 24,177
WNP Northern Offshore 267 0.07% 367 0.10% 2,169
WNP Southern Offshore 3,282 6.28% 3,729 7.13% 24,315
Hawaiian monk seal Hawaii 10 0.69% 13 0.91% 79

LOA and Rulemaking Application Under the MMPA for Use of SURTASS LFA Sonar
7-9 Impacts to Species or Stocks
Table 7-1. Maximum MMPA Level B Harassment by SURTASS LFA Sonar for Years 1 to 4 and Years 5 to 7 (Annual Totals) and Total Overall for 7-Year Period (Species and Stocks Listed Alphabetically).
Marine Mammal Species Stock11
Maximum Annual Level B Harassment, Years 1-4
Maximum Annual Level B Harassment, Years 5-7
Total Overall Level B Harassment for 7-
year Period (Individuals) Individuals Percent Stock Individuals Percent Stock
Northern fur seal Western Pacific 8,475 1.71% 11,653 2.35% 68,859
Ribbon seal NP 15,705 4.30% 21,595 5.92% 127,605
Spotted seal Alaska stock/Bering Sea DPS 80,722 17.53% 110,993 24.10% 655,867
Southern stock and DPS 0 0.00% 1 0.05% 3
Steller sea lion Western/Asian stock,
Western DPS 2 0.00% 3 0.00% 17
LOA and Rulemaking Application Under the MMPA for Use of SURTASS LFA Sonar
7-10 Impacts to Species or Stocks
Based on the results of the analyses conducted for SURTASS LFA sonar and more than fifteen years of
documented results that are summarized in this application and presented in the associated NEPA
documentation, use of SURTASS LFA sonar, when used in accordance with the mitigation measures
(geographic restrictions and monitoring/reporting), support a negative impact determination. In
summary:
• Potential impacts on marine mammal species and stocks are expected to be limited to MMPA
Level B harassment. Since the potential Level B harassment would not involve long-term
displacement or disruption of foraging, breeding, or migrations, the Navy does not estimate that
the Level B impacts would affect rates of recruitment or survival of the associated marine
mammal species and stocks. Thus, impacts on recruitment or survival are expected to be
negligible.
o Level B harassment of marine mammals would not occur in ocean areas that are biologically
important to marine mammals (e.g., foraging, reproductive areas, rookeries, ESA critical
habitat) or where small, localized populations occur. Received levels of LFA sonar above 180
dB rms would not occur in the four biologically important marine habitat areas (i.e., OBIAs)
that are located within the study area.
• Based on the Navy‘s impact analysis results, no mortality and no injury (i.e., MMPA Level A
harassment) of marine mammals may occur as a result of SURTASS LFA sonar, and the potential
to cause strandings of marine mammals is considered negligible.
• The use of SURTASS LFA sonar would entail the addition of sound energy to the oceanic ambient
noise environment, which in conjunction with the sound produced by other anthropogenic
sources, may increase the overall oceanic ambient noise level. Increases in ambient noise levels
have the potential to affect marine animals by causing masking. However, broadband,
continuous low-frequency ambient noise is more likely to affect marine mammals than
narrowband, low duty cycle SURTASS LFA sonar. Moreover, the bandwidth of any SURTASS LFA
sonar transmitted signal is limited (approximately 30 Hz), the average maximum pulse length is
60 sec, signals do not remain at a single frequency for more than 10 sec, and the system is off
nominally 90 to 92.5 percent of the time during an at-sea activities. With the nominal duty cycle
of 7.5 to 10 percent, masking by LFA sonar would only occur over a very small temporal scale.
The cumulative impacts related to the potential for masking are not a reasonably foreseeable
significant adverse impact on marine animals.
• Use of SURTASS LFA sonar would not impact the habitat of marine mammals nor result in loss or
modification of marine habitat.
• The availability of marine mammals for subsistence use would not be adversely impacted.
• A comprehensive suite of mitigation measures, including three types of monitoring (passive
acoustic, active acoustic, and visual) during sonar transmissions, coastal standoff range (180 dB
SPL sound field restricted to 22 km [12 nmi] from shore), and OBIA restrictions (sound field
produced by sonar below 180 dB RL, based on SPL modeling), would be implemented to reduce
the potential for harassment to marine mammals that may be associated with exposure to
SURTASS LFA sonar.
Consideration of negligible impact is required for NMFS to authorize incidental take of marine mammals.
By definition, an activity has a “negligible impact” on a species or stock when ‘‘an impact resulting from
the specified activity that cannot be reasonably expected to, and is not reasonably likely to, adversely
LOA and Rulemaking Application Under the MMPA for Use of SURTASS LFA Sonar
7-11 Impacts to Species or Stocks
affect the species or stock through impacts on annual rates of recruitment or survival’’ (50 CFR 216.103).
The Navy has concluded that the incidental taking of marine mammals by the use of SURTASS LFA sonar
would have a negligible impact on the affected marine mammal stocks or species of marine mammals.

LOA and Rulemaking Application Under the MMPA for Use of SURTASS LFA Sonar
8-1 Impacts to Subsistence Use
8 IMPACT ON SUBSISTENCE USE
SURTASS LFA sonar would not be used for training and testing purposes in Arctic waters nor in the Gulf
of Alaska or off the Aleutian Island chain where subsistence uses of marine mammals occurs. Therefore,
there would be no impact on subsistence hunting, nor would SURTASS LFA sonar cause abandonment of
any harvest/hunting locations, displace any subsistence users, or place physical barriers between marine
mammals and the hunters. No mortalities of marine mammals have been associated with the use of
SURTASS LFA sonar and the Navy undertakes a suite of mitigation measures whenever SURTASS LFA
sonar is actively transmitting. Therefore, the possible future use of SURTASS LFA sonar would not lead to
unmitigatable adverse impacts on the availability of marine mammal species or stocks for subsistence
uses.
Requirement 8: Anticipated impact of the activity on the availability of the species or stocks of marine
mammals for subsistence uses.

LOA and Rulemaking Application Under the MMPA for Use of SURTASS LFA Sonar
9-1 Impacts to Habitat
9 IMPACT TO MARINE MAMMAL HABITAT
9.1 Physical Habitat
Use of SURTASS LFA sonar entails the periodic deployment of acoustic transducers and receivers into the
water column from ocean-going ships. SURTASS LFA sonar is deployed from ocean surveillance ships
that are U.S. Coast Guard-certified for operations and operate in accordance with all applicable federal,
international, and U.S. Navy rules and regulations related to environmental compliance, especially for
discharge of potentially hazardous materials. In particular, SURTASS LFA sonar ships comply with all
requirements of the Clean Water Act (CWA) and Act to Prevent Pollution from Ships (APPS). SURTASS
LFA sonar vessel movements are not unusual or extraordinary and are in line with routine operations of
seagoing vessels. Therefore, no discharges of pollutants regulated under the APPS or CWA would result
from the operation of the sonar systems nor would unregulated environmental impacts from the
operation of the SURTASS LFA sonar vessels occur.
9.2 Sound in the Environment
Use of the sonar systems results in no physical alterations to the marine environment other than the
addition of sound energy to the oceanic ambient noise environment, which may have some impact on
marine mammals. Anthropogenic sources of ambient noise that are most likely to have contributed to
increases in ambient noise levels are commercial shipping, offshore oil and gas exploration and drilling,
and naval and other uses of sonar (ICES, 2005; MMC, 2007). Hildebrand (2005) concluded that increases
in anthropogenic oceanic sound sources most likely to contribute to increased noise in order of
importance are: commercial shipping, offshore oil and gas exploration and drilling, and naval and other
uses of sonar.
The potential impacts of SURTASS LFA sonar on the overall oceanic ambient noise level are reviewed in
the following contexts:
• Recent reports on ambient sound levels in the world’s oceans;
• Operational parameters of the SURTASS LFA sonar system;
• Contribution of SURTASS LFA sonar to oceanic noise levels relative to other human-generated
sources of oceanic noise; and
• Cumulative impacts from LFA sonar activities concurrent with other anthropogenic sources.
9.2.1 Oceanic Noise Levels
Ambient noise is the typical or persistent background noise that is part of an environment. Ambient
noise is produced by both natural and anthropogenic (man-made) sources, is typically characterized by a
broad range of frequencies, and is directional both horizontally and vertically, so that the received
sound levels are not equal from all directions. Noise generated by surface ocean waves and biologically-
produced sounds are the two primary contributors of natural ambient sound over the frequency range
Requirement 9: Anticipated impact of the activity upon the habitat of the marine mammal populations,
and the likelihood of restoration of the affected habitat.

LOA and Rulemaking Application Under the MMPA for Use of SURTASS LFA Sonar
9-2 Impacts to Habitat
of 300 Hz to 5 kHz. The sound produced by propulsion systems of ocean-going ships, with frequencies
centered in the frequency range of 20 to 200 Hz, is the dominate source of anthropogenic sound in the
ocean (Tyack, 2008).
In the Indian Ocean, LF (5 to 115 Hz) sounds have increased 2 to 3 dB over the past decade, while
acoustic measurements in the Northeast Pacific Ocean indicate that LF (10 to 100 Hz), deep water
ambient sound levels have been rising for the last 60 years (Miksis-Olds and Nichols, 2016). Ambient
noise data from the 1950s and 1960s show that noise levels increased at a rate of approximately 3 dB
per decade or 0.55 dB per year. Beginning in the 1980s, the rate of increase in ambient noise levels
slowed to 0.2 dB per year (Chapman and Price, 2011). Andrew et al. (2002) reported an increase of
about 10 dB in the range of the 20 to 80 Hz band during a six-year observation period (1995 to 2001),
which was less than expected based on a rate of 0.55 dB increase per year (Andrew et al., 2011).
The overall increasing ambient noise trends in both the Pacific and Indian Oceans have primarily been
attributed to increasing shipping noises (Miksis-Olds and Nichols, 2016). Recent measurements in the
Northeast Pacific region show a leveling or slight decrease in sound levels, even though shipping activity
continued to rise, which confirms the prediction by Ross (1976) that the rate of increase in ambient
ocean noise levels would be less at the end of the twentieth century compared to that observed in the
1950s and 1960s (Andrew et al., 2011). Better design of propulsion systems and economic conditions
affecting the price of oil were some factors that may contribute to this reduced rate of increase in
oceanic noise levels (Chapman and Price, 2011).
Shipping alone does not fully account for the increases in noise levels in the 30 to 50 Hz LF band that
was observed from 1965 to 2003. Other sources of anthropogenic ambient noise in the ocean contribute
to the overall ocean soundscape, including noise from oil and gas exploration, seismic airgun activity,
and renewable energy sources (e.g., wind farms) (Miksis-Olds et al., 2013). Many of these anthropogenic
sources are located along well-traveled shipping routes and encompass coastal and continental shelf
waters, areas that are important marine habitats (Hildebrand, 2009).
Sound produced by renewable-energy production developments, particularly that of offshore wind
energy, differ from other types of anthropogenic sound sources in that the underwater noise levels
generated from the operation of the wind farms is more persistent and of long duration. Anthropogenic
noise generated by seismic exploration is transient in nature, but the expected lifetime of an offshore
wind farm is twenty to thirty years. The associated noises from the operation of the wind farm would
result in an almost constant and permanent source of noise in the vicinity of a wind farm (Tougaard et
al., 2009).
The impacts that climate change may have on our ocean continue to be understood in relation to
observed ocean ambient noise trends. It’s important to consider components of the ocean soundscape
such as noise from changing ice dynamics and other yet-to-be-identified changes in natural sound
source producing mechanisms in relation to ocean sound levels. Global climate change is projected to
impact the frequency, intensity, timing, and distribution of hurricanes and tropical storms, which would
also affect the ocean soundscapes on many levels (Miksis-Olds and Nichols, 2016).
Ocean acidification and its potential impact on ocean noise via changes in the acoustic absorption
coefficient at low frequencies has become a subject of worldwide concern. Ocean acidification, due to
the decrease of pH in the ocean from an increase in dissolved CO2, would affect sound absorption, which
has a strong dependency on pH at frequencies less than 2 kHz (Joseph and Chiu, 2010). This decrease in

LOA and Rulemaking Application Under the MMPA for Use of SURTASS LFA Sonar
9-3 Impacts to Habitat
sound absorption may impact ocean ambient noise levels within the auditory range critical for
environmental, military, and economic interests (Hester et al., 2008).
In parts of the North Atlantic Ocean, for example, a conservative estimate is that LF sound absorption
has decreased over 15 percent at 440 Hz from the pre-Industrial Revolution until the 1990s, with a
greater than 10 percent decrease common above 1,312 ft (400 m) in the Pacific and Atlantic oceans
(Hester et al., 2008). While these decreases in LF absorptivity represent truly immeasurably small
changes, to try and resolve the uncertainty regarding the amount noise levels could increase due to
these changes in sound absorption, some researchers have tried to calculate and quantify changes in
ambient noise levels. Joseph and Chiu (2010) reported an expected increase of 0.2 dB for a scenario that
has a surface pH change of 0.7 over the years from 1960 to 2250 in the frequency range of 50 to 2,000
Hz. Reeder and Chiu (2010) predicted changes of less than 0.5 dB for all frequencies in the deep ocean,
with no statistically significant change in shallow water or surface duct environments when there was a
decrease in pH from 8.1 to 7.4. Last, Ilyina et al. (2010) estimated that ocean pH could fall by 0.6 by 2100
and sound absorption in the 100 Hz to 100 kHz band could decrease by 60 percent in high latitudes and
deep-ocean waters over the same period. These authors further predicted that over the 21st Century
sound absorption in the 100 Hz to 100 kHz frequency band would decrease by almost half in regions of
the world’s oceans with significant anthropogenic noise, such as the North Atlantic Ocean. However,
because sound absorption is a very small factor in acoustic propagation at low frequencies, the impact
of these changes in absorption are likely to be so vanishingly small as to be insignificant (i.e., less than 1
dB).
9.2.2 SURTASS LFA Sonar Combined with Other Human-Generated Sources of Oceanic Noise
When deployed and transmitting during training and testing activities, transmissions from SURTASS LFA
sonar would temporarily add to the ambient noise level in the frequency band (100 to 500 Hz) in which
LFA sonar operates, but the impact on the overall noise levels in the ocean would be minimal. In most of
the ocean, the 10 to 500 Hz portion of the ambient noise spectrum is dominated by anthropogenic noise
sources, particularly shipping and seismic airguns. Commercial vessels are the most common source of
low-frequency noise and their impact on ambient noise is basin-wide (Hildebrand, 2009).
SURTASS LFA sonar produces a coherent low-frequency signal with a duty cycle of less than 20 percent
and an average pulse length of 60 sec. In the proposed activity, the Navy would transmit SURTASS LFA
sonar for up to a total of 496 hr in years 1-4 and 592 hr in years 5-7. The total acoustic energy output of
individual sources was considered in calculating an annual noise energy budget in energy units of Joules
(Hildebrand, 2005). Commercial supertankers were estimated to contribute 3.7 x 10¹² Joules of acoustic
energy into the marine environment each year (Joules/yr); seismic airguns were estimated to contribute
3.9 x 10¹³ Joules/yr; and mid-frequency military sonar was estimated to contribute 2.6 x 10¹³ Joules/yr
(Hildebrand, 2005). Scaling the calculations in Hildebrand (2005) to account for the proposed
transmission hours, the contribution from 496 hours of LFA sonar transmissions would be 2.0 x 10¹¹
Joules/yr and the contribution from 592 hours of LFA sonar transmissions would be 2.3 x 10¹¹ Joules/yr.
The percentage of the total anthropogenic acoustic energy budget added by LFA sonar source
transmissions is estimated to be 0.29 and 0.34 percent, respectively, for years 1-4 and years 5-7
(Hildebrand, 2005). Therefore, within the existing ocean environment, the potential for accumulation of
noise due to the intermittent transmission of SURTASS LFA sonar is considered negligible.

LOA and Rulemaking Application Under the MMPA for Use of SURTASS LFA Sonar
9-4 Impacts to Habitat
9.3 Protected Marine Habitats
Many habitats in the marine environment are protected for a variety of reasons but typically, habitats
are designated to conserve and manage natural and cultural resources. Protected marine and aquatic
habitats have defined boundaries and are typically enabled under some Federal, State, or international
legal authority. Habitats are protected for a variety of reasons including intrinsic ecological value;
biological importance to specific marine species or taxa, which are often also protected by federal or
international agreements; management of fisheries; and cultural or historic significance. Due to their
importance as marine mammal habitat, two types of marine habitats protected under U.S. legislation or
Presidential EO are considered here. These marine habitats include critical habitat designated under the
ESA and marine protected areas (MPAs) designated under the National Marine Sanctuaries Act and EO
13158.
9.3.1 ESA Critical Habitat
The ESA, and its amendments, require the responsible agencies of the Federal government to designate
critical habitat for any species that it lists under the ESA. Critical habitat is defined under the ESA as:
• the specific areas within the geographic area occupied by a listed threatened or endangered
species on which the physical or biological features essential to the conservation of the species
are found, and that may require special management consideration or protection; and
• specific areas outside the geographic area occupied by a listed threatened or endangered
species that are essential to the conservation of the species (16 U.S.C. §1532(5)(A), 1978).
Critical habitat is not designated in foreign countries or any other areas outside U.S. jurisdiction.
Although not required, critical habitat may be established for those species listed under the ESA prior to
the 1978 amendments to the ESA that added critical habitat provisions. Under Section 7 of the ESA, all
Federal agencies must ensure that any actions they authorize, fund, or carry out are not likely to
jeopardize the continued existence of a listed species or destroy or adversely modify its designated
critical habitat. Critical habitat designations must be based on the best scientific information available
and designated in an open public process and within specific timeframes. Before designating critical
habitat, careful consideration must be given to the economic impacts, impacts on national security, and
other relevant impacts of specifying any particular area as critical habitat.
Of the marine mammals that have been listed as threatened or endangered under the ESA, critical
habitat has been designated within the study area for two species, the Hawaiian monk seal and the
Main Hawaiian Island (MHI) Insular DPS of the false killer whale.
➢ Hawaiian monk seal
Critical habitat for the Hawaiian monk seal has been designated in the Northwestern (NWHI) and MHI
and includes seafloor and marine neritic and pelagic waters within 33 ft (10 m) of the seafloor from the
shoreline seaward to the 628-ft (200-m) depth contour at 10 areas in the NWHI on Kure Atoll, Midway
Islands, Pearl and Hermes Reef, Lisianski Island, Laysan Island, Maro Reef, Gardner Pinnacles, French
Frigate Shoals, Necker Island, Nihoa, Kaula Island and Niihau and Lehua Islands, and six areas in the MHI
on Kaula, Niihau, Kauai, Oahu, Maui Nui (i.e., Kahoolawe, Lanai, Maui, and Molokai), and Hawaii
(excluding National Security Exclusion zones off Kauai, Oahu, and Kahoolawe) (NOAA, 2015c). The MHI
critical habitat also includes specific terrestrial areas from the shoreline inland 16 ft (5 m).

LOA and Rulemaking Application Under the MMPA for Use of SURTASS LFA Sonar
9-5 Impacts to Habitat
The physical or biological features of the Hawaiian monk seal critical habitat that support the species’
life history needs include 1) areas with characteristics preferred by monk seals for pupping and nursing;
2) shallow, sheltered nearshore marine areas preferred by monk seals for pupping and nursing; 3)
marine areas up to 1,640 ft (500 m) in depth preferred by juvenile and adult monk seals for foraging; 4)
areas with low levels of human disturbance; 5) marine areas with adequate prey quantity and quality;
and 6) significant shore areas used by monk seals for hauling out, resting, or molting (NOAA, 2015c).
Nearly all of the critical habitat for the Hawaiian monk seal lies within the coastal standoff distance for
SURTASS LFA sonar, wherein the sound field generated by LFA sonar cannot exceed 180 dB re 1 μPa
(rms) (SPL) within 22 km (12 nmi) of any land, including islands. A small area of the monk seal’s critical
habitat at Penguin Bank extends beyond the 22-km (12-nmi) coastal standoff distance. However, per the
CZMA consultation with the State of Hawaii for SURTASS LFA sonar, the Navy agreed not to operate
SURTASS LFA sonar in waters of Penguin Bank to the 600-ft (183-m) isobath, which is the boundary of
the Penguin Bank OBIA for SURTASS LFA sonar. Thus, the critical habitat of the Hawaiian monk seal
beyond the coastal standoff range would not be exposed to SURTASS LFA sonar training and testing
activities.
• Potential Effects to the Physical Features of Hawaiian Monk Seal Critical Habitat
Use of SURTASS LFA sonar entails the periodic deployment of acoustic transducers and receivers into the
water column from ocean-going ships. SURTASS LFA sonar is deployed from ocean surveillance ships
that are U.S. Coast Guard-certified for operations and operate in accordance with all applicable federal,
international, and U.S. Navy rules and regulations related to environmental compliance, especially for
discharge of potentially hazardous materials. In particular, SURTASS LFA sonar ships comply with all
requirements of the Clean Water Act (CWA) and Act to Prevent Pollution from Ships (APPS). SURTASS
LFA sonar vessel movements are not unusual or extraordinary and are part of routine operations of
seagoing vessels. Therefore, no discharges of pollutants regulated under the APPS or CWA would result
from the operation of the SURTASS LFA sonar systems nor would unregulated environmental effects
from the operation of the SURTASS LFA sonar vessels occur. In no way can the employment of the
SURTASS LFA sonar systems affect the physical circulation processes or bathymetry of the waters in
which the sonar would be operated. Thus, the critical habitat features of water quality, bathymetry, and
physical circulation processes would not be affected by the operation of SURTASS LFA sonar.
Deployment and use of the SURTASS LFA sonar systems results in no physical alterations to the marine
environment other than the addition of ephemeral sound energy to the oceanic ambient noise
environment only when the sonar is transmitting. When deployed and transmitting, transmissions from
SURTASS LFA sonar would temporarily add to the ambient noise level in the frequency band (100 to 500
Hz) in which LFA sonar operates, but the effect on the overall noise levels in the ocean would be
minimal. Anthropogenic sources of ambient noise that are most likely to contribute to increases in
ambient noise levels are commercial shipping, offshore oil and gas exploration and drilling, and naval
and other uses of sonar (ICES, 2005; MMC, 2007). Hildebrand (2005) concluded that increases in
anthropogenic oceanic sound sources most likely to contribute to increased noise in order of magnitude
are commercial shipping, offshore oil and gas exploration and development, and naval and other sonar.
The addition of even a small percentage to the ambient noise environment of the ocean would have no
effect on the relevant physical features of the designated critical habitat. Thus, transmissions of
SURTASS LFA sonar may effect but would not adversely affect the physical features of the Hawaiian
monk seal critical habitat.

LOA and Rulemaking Application Under the MMPA for Use of SURTASS LFA Sonar
9-6 Impacts to Habitat
• Potential Effects to the Biological Features of Hawaiian Monk Seal Critical Habitat
The remaining potential for critical habitat effects associated with SURTASS LFA sonar activities would
be to biological features of the habitat, namely to the availability and density of prey and the availability
of reproductive partners. Although the majority of the Hawaiian monk seal’s prey would not be affected
by SURTASS LFA sonar transmissions, marine fishes may be affected by exposure to LFA sonar
transmissions, but only if they are within close proximity (<0.54 nmi [<1 km]) to the transmitting sonar
source. The Navy’s analysis indicates a minimal to negligible potential for an individual fish to experience
non-auditory or auditory effects or a stress response from exposure to SURTASS LFA sonar
transmissions. A low potential exists for minor, temporary behavioral responses or masking effects to an
individual fish when LFA sonar is transmitting, but no potential is estimated for fitness level
consequences to fish stocks. Since it is highly unlikely that a significant percentage of any fish stock
would be in sufficient proximity during LFA sonar transmissions to experience such effects, there is
minimal potential for LFA sonar to affect fish stocks. Thus, no adverse effects are reasonably expected
on the availability of prey fishes or reproductive fish partners as the result of exposure to SURTASS LFA
sonar. As a result, SURTASS LFA sonar activities are not expected to adversely affect the biological
features of the Hawaiian monk seal’s designated critical habitat.
➢ Main Hawaiian Island Insular DPS of False Killer Whales
Critical habitat has been designated for the MHI Insular DPS of the false killer whale (NOAA, 2018). The
critical habitat for the MHI DPS of false killer whales includes waters from the 148- to 10,499-ft (45-to
3,200-m) depth contours around the MHI from Niihau east to Hawaii. Some Navy and other federal
agency areas, such as the Pacific Missile Range Facility offshore ranges, are excluded from the critical
habitat designation (NOAA, 2018).
One physical or biological feature of the designated critical habitat has been defined as being essential
for the conservation of the MHI Insular DPS of false killer whales: island-associated marine habitat
(NOAA, 2018). The four charateristics that support the critical habitat feature of island-associated
marine habitat are:
1. adequate space for movement and use within the continental shelf and slope habitat;
2. prey species of sufficient quantity, quality, and availability to support individual growth,
reproduction, and development, as well as overall population growth;
3. waters free of pollutants of a type and amount harmful to MHI Insular false killer whales; and
4. sound levels that would not significantly impair false killer whales’ use or occupancy (NOAA,
2018).
In most areas of the waters surrounding the MHI, the coastal standoff range for SURTASS LFA (12 nmi
[22 km]) is located closer to shore than the outer boundary of the critical habitat for the MHI Insular DPS
of the false killer whale, which is the 10,499-ft (3,200-m) isobath. The Penguin Bank OBIA encompasses
some of the critical habitat, but a small part of the critical habitat lies beyond or in deeper waters than
the OBIA. Additionally, as part of the CZMA stipulations for SURTASS LFA sonar use in Hawaiian waters,
the Navy agreed not to use SURTASS LFA sonar in the waters over Penguin Bank to a water depth of 600
ft (183 m).
• Potential Effects to the Physical and Biological Feature of False Killer Whale Critical Habitat
Only one physical or biological feature of the false killer whale critical habitat is defined, that of island-
associated habitat. The supporting physical characteristics of this features are adequate space for
LOA and Rulemaking Application Under the MMPA for Use of SURTASS LFA Sonar
9-7 Impacts to Habitat
movements and use of the habitat, waters free of pollutants, and underwater sound levels that would
not significantly impair false killer whale’s use or occupancy of the habitat.
SURTASS LFA sonar is deployed from ocean surveillance ships that are U.S. Coast Guard-certified for
operations and operate in accordance with all applicable federal, international, and U.S. Navy rules and
regulations related to environmental compliance, especially for discharge of potentially hazardous
materials. In particular, SURTASS LFA sonar vessels comply with all requirements of the CWA and APPS.
SURTASS LFA sonar vessel movements are not unusual or extraordinary and are part of routine
operations of seagoing vessels. Therefore, no discharges of pollutants regulated under the APPS or CWA
would result from SURTASS LFA sonar training and testing activities nor would unregulated
environmental effects from SURTASS LFA sonar training and testing activities occur.
The transmission of LF sound during SURTASS LFA sonar activities is the one stressor associated with
SURTASS LFA sonar training and testing activities that could possibly impact the physical supporting
characteristics of spatial availability and sound levels in the island-associated marine environment.
Portions of the designated critical habitat of the MHI Insular DPS of false killer whales are located within
the coastal standoff range for SURTASS LFA sonar training and testing activities wherein the power level
of LFA sonar transmissions would be limited, while a portion of the critical habitat lies beyond the spatial
extent of the coastal standoff range. In the coastal standoff range, LFA sonar transmissions would be
restricted to a lower power level, with transmissions less than 180 dB re 1 μPa [rms] SPL.
When deployed and transmitting, transmissions from SURTASS LFA sonar would temporarily add to the
ambient noise level in the frequency band (100 to 500 Hz) in which LFA sonar transmits, but the effect
on the overall noise levels in the ocean would be minimal. With HF/M3 monitoring and associated LFA
source shutdown protocol in areas outside the coastal standoff zone, false killer whales would be
detected before entering the LFA mitigation zone. Therefore, at no time in any area of their critical
habitat would these whales experience a sound field greater than 180 dB (rms).
The hearing and echolocation ability of false killer whales have been studied with captive animals (e.g.,
Kloepper et al., 2010; Yuen et al., 2005). They have some level of overall sensitivity between 2 to 115
Khz, with best sensitivity found between 16 and 24 kHz and echolocation clicks centered around 40 kHz.
Therefore, SURTASS LFA sonar produces frequencies outside their known hearing range and well below
their frequencies of best sensitivity.
Only the SURTASS and LFA sonar arrays are deployed into the marine environment during training and
testing activities. With the exception of underwater sound production, no aspect of training and testing
activites would reasonably be expected to impact the spatial use of false killer whales. As a result, the
use of SURTASS LFA sonar for training and testing activities in Hawaiian waters would not reasonably be
expected to have any impact on the physical characteristics of the false killer whale critical habitat since
the spatial availability nor sound levels in the continental shelf and slope habitat would be significantly
impacted.
Only one biological characteristic of the MHI Insular DPS of false killer whale critical habitat is defined,
that of prey availability (large pelagic fish and squid) of sufficient quantity, quality, and availability to
support individual growth, reproduction, and development, as well as overall population growth of false
killer whales. The Navy has determined that no mortality of marine invertebrates is reasonably expected
to occur from exposure to LFA sonar training and testing activities nor are population level effects likely.
Thus, marine invertebrates such as squid would not reasonably be affected by SURTASS LFA sonar
training and testing activities. Marine fishes, however, may be affected by exposure to LFA sonar

LOA and Rulemaking Application Under the MMPA for Use of SURTASS LFA Sonar
9-8 Impacts to Habitat
transmissions, but only if they are located within close proximity (<0.54 nmi [<1 km]) to the transmitting
sonar source. The Navy’s analysis indicates a minimal to negligible potential for an individual fish to
experience non-auditory or auditory effects or a stress response from exposure to SURTASS LFA sonar
transmissions. A low potential exists for minor, temporary behavioral responses or masking effects to an
individual fish when LFA sonar is transmitting, but no potential is estimated for fitness level
consequences to fish stocks. Since it is highly unlikely that a significant percentage of any prey stock
would be in sufficient proximity during LFA sonar transmissions to experience such effects, there is
minimal potential for LFA sonar to affect prey fish stocks. Thus, no adverse effects are reasonably
expected on the quantity, quality, and availability of prey fishes as the result of exposure to SURTASS
LFA sonar training and testing activities. Accordingly, SURTASS LFA sonar training and testing activities
would not significantly impact the biological characteristic of prey availability of the MHI Insular DPS of
the false killer whale’s designated critical habitat.
9.3.2 Marine Protected Areas
The term “marine protected area” (MPA) is very generalized and is used to describe specific regions of
the marine and aquatic environments that have been set aside for protection, usually by individual
nations within their territorial waters, although a small number of internationally recognized MPAs exist.
Of the estimated 5,000 global MPAs, about 10 percent are international (WDPA, 2009). The variety of
names and uses of MPAs has led to confusion over what the term really means and where MPAs are
used. Internationally, a MPA is considered “any area of the intertidal or subtidal terrain, together with
its overlying water and associated flora, fauna, historical and cultural features, which has been reserved
by law or other effective means to protect part or all of the enclosed environment” (Kelleher, 1999).
MPAs have been proven to be effective conservation tools to manage fisheries, preserve habitat and
biodiversity, and enhance the aesthetic and recreational value of marine areas (NRC, 2000). Although
the objectives for establishing protection of marine areas vary widely, MPAs are typically used to
achieve two broad objectives: 1) habitat protection, and 2) fisheries management and protection
(Agardy, 2001). Many MPAs are multi-use areas while others only allow restricted uses within the
designated MPA boundaries.
9.3.2.1 U.S. Marine Protected Areas
In the U.S., MPAs have conservation or management purposes, defined boundaries, a permanent
protection status, and some legal authority to protect marine or aquatic resources. In the U.S., a MPA is
defined by EO 13158 as “any area of the marine environment that has been reserved by federal, state,
territorial, tribal, or local laws or regulations to provide lasting protection for part or all of the natural
and cultural resources therein."In practice, U.S. MPAs are defined marine and aquatic geographic areas
where natural and/or cultural resources are given greater protection than is given in the surrounding
waters. U.S. MPAs span a range of habitats including the open ocean, coastal areas, inter-tidal zones,
estuaries, as well as the Great Lakes and vary widely in purpose, legal authority, agencies, management
approaches, level of protection, and restrictions on human uses (NMPAC, 2009a). Currently, about 100
Federal, state, territory, and tribal agencies manage more than 1,500 marine areas in the U.S. and its
territories (NMPAC, 2009b). Two federal agencies primarily manage federally designated MPAs. The
Department of Commerce’s NOAA manages national marine sanctuaries (NMS), fishery management
zones, and in partnership with states, national estuarine research reserves, while the Department of
Interior manages the national wildlife refuges and the national park system, which includes national
parks, national seashores, and national monuments.

LOA and Rulemaking Application Under the MMPA for Use of SURTASS LFA Sonar
9-9 Impacts to Habitat
Over the past century in the U.S., Federal, state, territory, and local legislation; voter initiatives; and
regulations have created the plethora of 1,500 MPAs that now exist, each of which was established for a
specific purpose. The resulting collection of U.S. MPAs, consisting of reserves, refuges, preserves,
sanctuaries, parks, monuments, national seashores, areas of special biological significance, fishery
management zones, and critical habitats, is so fragmented, unrelated, and confusing that potential
opportunities for broader regional conservation through coordinated planning and management are
often missed.
To address this situation and improve the nation’s ability to understand and preserve its marine
resources, Presidential EO 13158 of 2000 called for an evaluation and inventory of the existing MPAs
and development of a national MPA system and national MPA center. The EO called for a national
system that protects both natural and cultural marine resources and is based on a strong scientific
foundation. The Department of Commerce established the National MPA Center (NMPAC), which has
inventoried the existing U.S. MPAs and has developed the criteria for the national MPA system.
Although EO 13158 provided the formal definition of a MPA, the NMPAC has developed a classification
system that provides definitions and qualifications for the various terms within the EO (NMPAC, 2009a).
The MPA classification system consists of five key functional criteria that objectively describe MPAs:
• Conservation focus (i.e., sustainable production or natural and/or cultural heritage),
• Level of protection (i.e., no access, no impact, no-take, zoned with no-take area(s), zoned
multiple use, or uniform multiple use),
• Permanence of protection,
• Constancy of protection, and
• Ecological scale of protection (NMPAC, 2009a).
The first two of these criteria, conservation and protection, are the keystones of the classification
system. These five criteria influence the effect MPAs have on the local ecosystem and on human users.
In April 2009, the NMPAC, in collaboration with federal, state, and territory agencies, tribes, advisory
committees, non-governmental organizations/associations, industry, and the public, announced the
establishment of the National MPA System with its initial listing of over 200 MPAs. The list of National
System MPAs contains all the mutually accepted MPAs that were nominated during the initial listing.
Eligible MPAs can become part of the national system by applying to the NMPAC through their
managing agency.
Federal agencies that function in the marine or aquatic environment have a responsibility under EO
13158. Section 5 of EO 13158 stipulates, "…each Federal agency whose actions affect the natural or
cultural resources that are protected by MPAs shall identify such actions. To the extent permitted by law
and to the maximum extent practicable, each federal agency, in taking such actions, shall avoid harm to
the natural and cultural resources that are protected by an MPA."
Of the more than 200 National System MPAs, three of those listed in the National System MPAs are in
the SURTASS LFA sonar study area, largely because a part or their entire seaward boundary is located
beyond 12 nmi (22 km) from the coastline, and are relevant to marine mammals. These MPAs include:
• Penguin Bank area of the Hawaiian Islands Humpback Whale NMS
• Papahānaumokuākea Marine National Monument
• Pacific Remote Islands Marine National Monument
LOA and Rulemaking Application Under the MMPA for Use of SURTASS LFA Sonar
9-10 Impacts to Habitat
9.3.2.2 International Marine Protected Areas
Although there are several efforts to document international MPAs, no network or system of
international MPAs currently exists. International MPAs encompass a very wide variety of habitat types
and types of MPAs as well as a good degree of variability in the levels of protection and legal mandates
associated with each MPA. It is, thus, even more difficult to compile an international list of MPAs than it
is in the U.S. MPAs have been designated by nearly every coastal country of the world, and by current
estimates, more than 15,000 MPAs exist globally, providing protection for 3.7 to 7.3 percent of the
world’s oceans (IUCN, 2017; Marine Conservation Institute, 2017; Protected Planet, ,2018). A number of
international MPAs have been established for the sole purpose of protecting cetaceans.
Although most international MPAs lie along the coast of the designating country, some international
MPAs encompass large extents of ocean area and encompass international as well as territorial waters.
Many of the large oceanic MPAs are also listed as World Heritage Sites (UNESCO, 2009). The
Papahānaumokuākea Marine National Monument of the U.S. is the largest MPA in the study area for
SURTASS LFA sonar.
9.3.2.3 Impacts of Sonar on Marine Protected Areas
Many MPAs around the world that were established specifically to protect marine mammals have been
considered during the OBIA selection process. Parts of several marine mammal MPAs are amongst the
29 OBIAs where SURTASS LFA sonar would be used such that the received sound level would be less
than 180 dB re 1 µPa (rms) during biologically important seasons; four OBIAs are located in the study
area for SURTASS LFA sonar training and testing activities. Areas such as Penguin Bank, part of the
Hawaiian Islands Humpback Whale National Marine Sanctuary, have been designated as OBIAs so that
these critical areas for marine mammals are not exposed to received levels greater than 180 dB re 1 μPa
(rms) from SURTASS LFA sonar training and testing activities.
Potential impacts on MPAs are associated solely with the transmission of LF sound by SURTASS LFA
sonar. Although no potential exists for physical or chemical alterations of the water or substrate from
sound transmissions, there is a potential for SURTASS LFA sonar to temporarily add to the ambient noise
levels when it is transmitting. Increases in ambient noise levels would only occur during SURTASS LFA
sonar transmissions (nominal 60-sec duration wavetrain every 10 min) and within the narrow bandwidth
of the signal (duration of each continuous-frequency sound transmission within the wavetrain is no
longer than 10 sec) for 496 hr in years 1 through 4 and 592 hr in years 5 through 7. Therefore, there is
little to no potential for impacts to MPAs or for indirect impacts to the habitat upon which marine
mammals depend. In many cases, critical habitat is designated to protect foraging or reproductive areas
in which marine mammals congregate for these biologically significant behaviors. SURTASS LFA sonar
activities are unlikely to impact the prey on which animals may be foraging. Neither water quality nor
the physical processes that may affect the retention of prey in a specific critical habitat area would be
impacted by the use of SURTASS LFA sonar.
LOA and Rulemaking Application Under the MMPA for Use of SURTASS LFA Sonar
10-1 Impacts to Marine Mammals from Habitat Loss
10 IMPACTS TO MARINE MAMMALS FROM HABITAT LOSS OR
MODIFICATION
Use of SURTASS LFA sonar in the study area beyond 12 nmi (22 km) from land, outside of potential
OBIAs, would not adversely impact the habitat of marine mammals nor result in loss or modification of
marine habitat. Although SURTASS LFA sonar would not harm the marine habitat, certain mitigation
measures are undertaken to further guard the resources of specific types of habitats such as OBIAs.
Requirement 10: Anticipated impact of the loss or modification of the habitat on the marine mammal
populations involved.

LOA and Rulemaking Application Under the MMPA for Use of SURTASS LFA Sonar
11-1 Mitigation Measures
11 MEANS OF EFFECTING LEAST PRACTICABLE ADVERSE IMPACTS—
MITIGATION MEASURES
Mitigation, as defined by the Council on Environmental Quality, includes measures to minimize impacts
by limiting the degree or magnitude of a proposed action and its implementation. The objective of the
mitigation and monitoring measures presented for SURTASS LFA sonar training and testing activities are
designed to effect the least practicable adverse impact on marine mammal species or stocks and their
habitats and to avoid risk of injury to marine mammals. These objectives are met by ensuring that
SURTASS LFA sonar training and testing activities:
• Do not expose coastal waters within 12 nmi (22 km) of emergent lands to SURTASS LFA sonar
RLs ≥180 dB re 1 µPa (rms) SPL;
• Do not expose OBIAs to SURTASS LFA sonar RLs ≥180 dB re 1 µPa (rms) during biologically
important seasons; and
• Minimize exposure of marine mammals to RLs of SURTASS LFA sonar transmissions above 180
dB re 1 µPa (rms) by monitoring for their presence and delaying/suspending transmissions when
one of these animals enters the LFA mitigation zone (Section 11.2.2).
Strict adherence to these measures would minimize impacts on marine mammal stocks and species as
well as on sea turtle stocks and recreational or commercial divers, swimmers, snorkelers, or fishing.
11.1 Re-evaluation of Mitigation Basis
The 180 dB re 1 µPa (rms) threshold for the onset of potential injury has been used for SURTASS LFA
sonar since 2001 (DoN, 2001, 2007, 2012, 2015). However, the NMFS (2018b) acoustic guidance defines
a new method for estimating onset of permanent threshold shift (PTS), therefore, the basis for the
mitigation threshold was re-evaluated. The results of the new guidance are such that, based on simple
spherical spreading (i.e., TL based on 20 × log10 [range {m}]), all hearing groups except LF cetaceans
would need to remain within 22 ft (7 m) for the duration of an entire LFA sonar ping (60 sec) to
potentially experience PTS. LF cetaceans would need to remain at the greatest distance from the
transmitting LFA sonar before experiencing the onset of injury, 135 ft (41 m) for this example. If an LF
cetacean were exposed to two full pings of SURTASS LFA sonar, the resulting SPL would be 179.7 dB re 1
μPa (rms). This exposure scenario is unlikely, as a marine mammal would have to remain close, <200 ft
(61 m), to the transmitting LFA sonar array for about 20 minutes to experience two full pings (one ping
every 10 min). However, to be conservative, the Navy intends to retain the existing mitigation basis of
180 dB re 1 μPa (rms) for SURTASS LFA sonar transmissions. Further details on these calculations follow.
The NMFS guidance (2018b) specifies auditory weighted (SELcum) values for the onset of PTS, which is
considered as the onset of injury. The NMFS guidance also categorized marine mammals into five
hearing groups for which generalized hearing ranges were defined:
Requirement 11: Availability and feasibility (economic and technological) of equipment, methods, and
manner of conducting such activity or other means of effecting the least practicable adverse impact
upon the affected species or stocks, their habitat, and on their availability for subsistence uses, paying
particular attention to rookeries, mating grounds, and areas of similar significance.
LOA and Rulemaking Application Under the MMPA for Use of SURTASS LFA Sonar
11-2Mitigation Measures
• Low-frequency (LF) Cetaceans—mysticetes (baleen whales)
• Mid-frequency (MF) Cetaceans—includes most dolphins, all toothed whales except Kogia spp.,
and all beaked and bottlenose whales
• High-frequency (HF) Cetaceans—consists of all true porpoises, river dolphins, Kogia spp.,
Cephalorhynchid spp. (genus in the dolphin family Delphinidae), and two species of
Lagenorhynchus (Peale’s and hourglass dolphins)
• Phocids Underwater (PW)—consists of true seals
• Otariids Underwater (OW)—includes sea lions and fur seals
NMFS’s (2018b) guidance presents the auditory weighting functions developed for each of these
functional hearing groups that reflect the best available data on hearing, impacts of sound on hearing,
and data on equal latency. When estimating the onset of injury (PTS), the NMFS guidance (2018b)
defines weighted thresholds as sound exposure levels (SELs) (Table 6-1). To determine what the SEL for
each hearing group would be when exposed to a 60-sec (length of a nominal LFA sonar transmission or 1
ping), 300 Hz (the center frequency in the possible transmission range of 100 to 500 Hz) SURTASS LFA
sonar transmission, and the auditory weighting functions must be applied to account for each hearing
group’s sensitivity. Applying the auditory weighting functions to the nominal LFA sonar signal results in
the thresholds increasing by approximately 1.5, 46, 56, 15, and 20 dB for LF, MF, HF, PW, and OW
groups, respectively. Based on simple spherical spreading (i.e., TL based on 20 × log10 [range {m}]), all
hearing groups except LF cetaceans would need to be within 22 ft (7 m) for an entire LFA sonar ping (60
sec) to potentially experience PTS. LF cetaceans would be at the greatest distance from the transmitting
sonar before experiencing the onset of injury, 135 ft (41 m) for this example. Consequently, the distance
at which SURTASS LFA sonar transmissions should be mitigated for marine mammals would be the
distance associated with LF cetaceans (baleen whales), as the mitigation ranges would be greatest for
this group of marine mammals. Any mitigation measure developed for LF cetaceans would be highly
conservative for any other marine mammals potentially exposed to SURTASS LFA sonar transmissions.
The following illustrates what the SPL RL would be at the distance an LF cetacean would begin to
experience PTS from transmitting LFA sonar. Per NMFS (2018b) acoustic guidance, the LF cetacean
threshold is 199 dB re 1 µPa2-sec (weighted). The magnitude of the LF auditory weighting function at
300 Hz for SURTASS LFA sonar is 1.5 dB, with the equivalent unweighted SELcum12 value of 200.5 dB re 1
µPa2-sec. To convert this value into an SPL value, total duration of sound exposure is needed:
SPL = SELcum – 10 x log10(T)
Where T is the duration in seconds.
Applying the duration of a single ping of SURTASS LFA sonar, or 60 sec, would result in 17.8 dB being
subtracted from the unweighted SELcum value of 200.5 dB, for an SPL of 182.7 dB re 1 µPa (rms). The
mitigation distance to the 182.7 dB re 1 µP (rms) isopleth would be somewhat smaller than that
associated with the previously used 180 dB re 1 µPa (rms) isopleth. If an LF cetacean was exposed to
two full pings of SURTASS LFA sonar, the resulting SPL would be 179.7 dB re 1 µPa (rms). This exposure
is unlikely, as a marine mammal would have to be close to the LFA sonar array for an extended period,
approximately 20 minutes, to experience two full pings. Although the RL in this unlikely scenario (179.7
dB re 1 µP [rms]) is so close to the 180 dB re 1 µP (rms) RL level on which previous mitigation measures
12 SELcum=cumulative sound exposure level

LOA and Rulemaking Application Under the MMPA for Use of SURTASS LFA Sonar
11-3 Mitigation Measures
for SURTASS LFA sonar have been based, the Navy proposes to retain the current mitigation basis of 180
dB re 1 µPa (rms) for SURTASS LFA sonar transmissions.
11.2 Mitigation Measures
11.2.1 Operational Parameters
The sound signals transmitted by the SURTASS LFA sonar source would be maintained between 100 and
500 Hz with a SL for each of the 18 projectors of no more than 215 dB re 1 µPa m) (rms) and a maximum
duty cycle of 20 percent. The Navy is currently approved under the NDE to transmit 1,020 hours of LFA
sonar transmission hours per year. In this application, the Navy is proposing to reduce the annual
number of transmit hours to 496 hours of SURTASS LFA sonar transmissions in years 1 to 4 and 592
hours in years 5 to 7.
11.2.2 Mitigation Zone
In previous applications for SURTASS LFA sonar rulemaking, the Navy proposed a mitigation zone
covering a volume of water ensonified to the 180 dB re 1 µPa isopleth (i.e., the volume subjected to
sound pressure levels of 180 dB rms or greater), and noted that the nominal outer boundary of this
volume of water is approximately 0.54 nmi (1 km). In each of the resultant Final Rules, NMFS added a
0.54-nmi (1-km) buffer zone beyond the Navy’s proposed LFA sonar mitigation zone, so the total
resulting mitigation/buffer zone was nominally 1.08 nmi (2 km).
Navy is again proposing a mitigation zone for the volume of water ensonified to the 180 dB re 1 µPa
isopleth. However, if NMFS intends to propose a buffer zone for this Final Rule as well, the Navy
requests that NMFS instead establish a single, fixed, combined mitigation/buffer zone of 2,000 yards
(yd) (0.99 nmi) (1,829 m/1.83 km) rather than a combined mitigation/buffer zone of nominally 1.08 nmi
(2 km). This 2,000 yd (1.83 km) single fixed mitigation/buffer zone would cover virtually all of the
previous combined mitigation/buffer zone of nominally 1.08 nmi (2 km), since the difference between
2,000 yd and 2 km is only about 187 yd (or 0.09 nmi [167 m]). Likewise, the difference in the sound field
of the combined mitigation/buffer zones of 2,000 yd (1.83 km) versus 1.08 nmi (2,187 yd; 2 km) would
also be negligible. At 2,000 yd (1.83 km), modeling shows that the sound field would be about 174.75 dB
while at 1.08 nmi (2 km), the sound file would be 173.98 dB, which is a difference of only 0.77 dB. This
very slight sound field difference would not be perceptible to a marine mammal.
Establishing a single, fixed, combined mitigation/buffer zone for SURTASS LFA sonar training and testing
activities would standardize and thus simplify implementation of this monitoring requirement, including
a buffer zone, using standard Navy metrics (yards not meters), while continuing to ensure protection to
marine mammals in all acoustic environments, even in the rare event of a strong acoustic duct in which
the volume of water ensonified to 180 dB could be somewhat greater than 0.54 nmi (1 km) (DoN, 2001).
With the combined mitigation/buffer zone of 2,000 yd (1.83 km), there is no potential for animals to be
exposed to received levels greater than 180 dB rms.
11.2.3 Buffer Zone
In the 2002 to 2007 Final Rule for SURTASS LFA sonar under the MMPA (NOAA, 2002), NMFS added a
mitigation measure to preclude the potential for injury to marine mammals from resonance impacts by
establishing a 1-km (0.54-nmi) buffer shutdown zone outside of the LFA sonar mitigation zone. In the
second five-year Rule (2007 to 2012) and third five-year Rule (2012 to 2017), NMFS once more required
that the 1-km (0.54 nmi) buffer zone be implemented. This restriction has proven to be practical, but the

LOA and Rulemaking Application Under the MMPA for Use of SURTASS LFA Sonar
11-4 Mitigation Measures
analysis, provided in Subchapter 2.5.1 of the SURTASS LFA Sonar FSEIS (DoN, 2007) demonstrates that it
did not appreciably minimize adverse impacts below 180 dB re 1 µPa (rms) RL. Thus, the removal of this
mitigation measure would not generate a change of any significance in the percentage of animals
potentially affected. However, the Navy would adhere to a buffer zone if implemented by NMFS in the
new Rule, although as noted above, if NMFS imposes a buffer zone, Navy requests that NMFS impose a
fixed, single, combined mitigation/buffer zone of 2,000 yd (1.83 km). Subchapter 2.5.1 of the 2007 FSEIS
is incorporated herein by reference.
11.2.4 Ramp-up of High Frequency Marine Mammal Monitoring (HF/M3) Sonar
The ramp-up procedure would be implemented to ensure that there would be no inadvertent exposures
of marine animals in close proximity to the sonar system to RLs ≥180 dB re 1 µPa (rms) from the HF/M3
active sonar system. Prior to full-power use, the HF/M3 sonar power level would be ramped up over a
period of no less than 5 minutes from a SL of 180 dB re 1 µPa @ 1 m (rms) (SPL) in 10 dB increments
until full power (if required) is attained. This ramp-up procedure would be implemented at least 30
minutes prior to any SURTASS LFA sonar transmissions, prior to any sonar calibrations or testing that are
not part of the regularly planned transmissions, and any time after the HF/M3 sonar has been powered
down for more than two minutes. The HF/M3 active sonar system’s sound pressure level may not
increase once a marine mammal is detected. The ramp-up may resume once marine mammals are no
longer detected.
11.2.5 LFA Sonar Suspension/Delay
During training and testing activities, SURTASS LFA sonar transmissions would be delayed or suspended
if the Navy detects a marine animal entering or within the LFA sonar mitigation zone (i.e., the 180 dB re
1 µPa isopleth or, if NMFS imposes a buffer zone, the requested fixed, single, combined
mitigation/buffer zone of 2,000 yd (1.83 km). The suspension or delay of LFA sonar transmissions would
occur if the marine animal is detected by any of the monitoring methods: visual, passive acoustic, or
active acoustic monitoring. During the delay/suspension, the Navy would still operate the HF/M3 active
sonar system to monitor for the presence of marine mammals in addition to conducting visual and
passive acoustic monitoring for marine animals. Transmissions would be allowed to commence/resume
no sooner than 15 minutes after all marine mammals/animals are no longer detected within the
SURTASS LFA sonar mitigation zone and no further detections of marine animals by visual, passive
acoustic, and active acoustic monitoring have occurred within the mitigation zone.
11.2.6 Geographic Sound Field Operational Constraints
The Navy intends to continue applying the following geographic restrictions to the use of SURTASS LFA
sonar:
• SURTASS LFA sonar training and testing activities would not occur within the territorial seas of
foreign nations and the SURTASS LFA sonar-generated sound field would be below RLs of 180 dB
re 1 µPa (rms) (SPL) within 12 nmi (22 km) of any emergent land (including islands);
• SURTASS LFA sonar-generated sound field would be below RLs of 180 dB re 1 µPa (rms) (SPL)
from the outer boundary of OBIAs during the biologically important period that have been
determined by NMFS and the Navy; and
• SURTASS LFA sonar analysts would estimate LFA sonar sound field RLs (SPL) prior to and during
active sonar transmissions so that the distance from the LFA sonar system to the 180 dB re 1
LOA and Rulemaking Application Under the MMPA for Use of SURTASS LFA Sonar
11-5 Mitigation Measures
µPa (rms) isopleth is known to define the LFA mitigation zone. However, if NMFS imposes a
buffer zone and implements the requested fixed, single, combined mitigation/buffer zone of
2,000 yd (1.83 km), then sound field modeling to define the mitigation zone would not be
necessary because the volume of water ensonified to 180 dB would be subsumed in the fixed,
single, combined mitigation/buffer zone of 2,000 yd. Accordingly, sound field modeling to
estimate the distance to 180 dB would not be conducted or necessary.
11.2.6.1 Coastal Standoff Distance
The coastal standoff distance or range refers to the distance of 12 nmi (22 km) from any land wherein
the sound field generated by SURTASS LFA sonar training and testing activities would not exceed 180 dB
re 1 μPa (rms) SPL. This distance and sound field measure were established to lower the risk to many
marine animals such as marine mammals and especially sea turtles, which aggregate in coastal waters.
The Navy would continue to implement the 12 nmi (22 km) coastal standoff distance while using
SURTASS LFA sonar. In addition, the Navy would not conduct SURTASS LFA sonar training and testing
activities within the territorial seas of foreign nations.
11.2.6.2 Offshore Biologically Important Areas (OBIAs)
Since certain areas of biological importance to marine mammals lie outside the coastal standoff range
for SURTASS LFA sonar, the Navy and NMFS developed the concept of OBIAs to ensure exposure of
marine mammals to SURTASS LFA sonar transmissions is minimized in areas where marine mammals
conduct biologically significant behaviors (i.e., OBIAs; Chapter 2). Accordingly, the Navy would conduct
SURTASS LFA sonar training and testing activities such that the LFA sonar sound field would be below
RLs of 180 dB re 1 µPa (rms) at the outer (seaward) boundary of designated marine mammal OBIAs
during the biologically important season specified for each OBIA.
11.2.7 Sound Field Modeling
SURTASS LFA sonar crew would estimate SURTASS LFA sonar sound field RLs (SPL) prior to and during
training and testing transmissions to provide the information necessary to modify transmissions,
including the delay or suspension of transmissions, so that the sound field criteria referenced in this
chapter are not exceeded. If NMFS imposes a buffer zone and implements the requested fixed, single,
combined mitigation/buffer zone of 2,000 yd (1.83 km), then sound field modeling to determine the
mitigaton shutdown range to the 180 dB re 1 µPa (rms) isopleth would not be necessary and would not
be conducted. Sound field limits would be estimated using near real-time environmental data and
underwater acoustic performance prediction models. These models are an integral part of the SURTASS
LFA sonar processing system. Acoustic model updates would nominally be made every 12 hours or more
frequently, depending upon the variance in meteorological or oceanographic conditions.
11.3 Monitoring to Prevent Injury to Marine Mammals
The Navy is required to cooperate with NMFS and other federal agencies to monitor impacts on marine
mammals, to designate qualified on-site personnel to conduct mitigation monitoring and reporting
activities. The Navy would continue to conduct the following monitoring to prevent injury to marine
mammals when SURTASS LFA sonar is being used in training and testing activities:

LOA and Rulemaking Application Under the MMPA for Use of SURTASS LFA Sonar
11-6 Mitigation Measures
• Visual monitoring for marine mammals and sea turtles from the SURTASS LFA sonar vessel
during daylight hours by personnel trained to detect and identify marine mammals and sea
turtles;
• Passive acoustic monitoring using the passive SURTASS towed array to listen for sounds
generated by marine mammals as an indicator of their presence; and
• Active acoustic monitoring using the HF/M3 sonar, which is a Navy-developed, enhanced HF
commercial sonar, to detect, locate, and track marine mammals and, to some extent, sea
turtles, that may pass close enough to the SURTASS LFA sonar’s transmit array to enter the LFA
mitigation zone.
All sightings of marine mammals are recorded and provided to NMFS in annual reports that
demonstrate the Navy’s monitoring for potential long-term environmental impacts.
11.3.1 Visual Monitoring
Visual monitoring would include daytime observations for marine mammals and sea turtles from the
SURTASS LFA sonar vessel. Daytime is defined as 30 minutes before sunrise until 30 minutes after
sunset. Visual monitoring begins 30 minutes before sunrise or 30 minutes before the SURTASS LFA sonar
is deployed. Monitoring continues until 30 minutes after sunset or until the SURTASS LFA sonar is
recovered aboard the vessel. Observations would be made by personnel trained in detecting and
identifying marine mammals and sea turtles from the ship’s bridge using standard binoculars (7x) and
the naked eye. Marine mammal biologists qualified in conducting at-sea marine mammal visual
monitoring from surface vessels would train and qualify designated ship personnel to conduct at-sea
visual monitoring; this training may be accomplished either in-person or via video training. The objective
of these observations is to maintain a track of marine mammals (and/or sea turtles) observed and to
ensure that none approach the source close enough to enter the LFA mitigation zone.
The trained visual observers would maintain a topside watch for marine mammals and sea turtles at the
sea surface and observation log during SURTASS LFA sonar transmissions. The numbers and
identification of observed marine mammals or sea turtles, as well as any unusual behavior, would be
entered into the log. A designated ship’s officer would monitor the conduct of the visual watches and
would periodically review the log entries. If a potentially affected marine mammal or sea turtle would be
sighted anywhere within the LFA mitigation zone , the visual observer would notify the senior military
member-in-charge, who would order the immediate delay or suspension of SURTASS LFA sonar
transmissions. Similarly, if a marine mammal or sea turtle were sighted outside the LFA mitigation zone,
the bridge officer would notify the senior military member-in-charge of the estimated range and bearing
of the observed marine mammal or sea turtle. The senior military member-in-charge would notify the
HF/M3 sonar operator to verify or determine the range and projected track of the detected marine
mammal/sea turtle. If the sonar operator would determine that the animal would pass into the LFA
mitigation zone, the senior military member-in-charge would order the immediate delay or suspension
of SURTASS LFA sonar transmissions when the animal enters the LFA mitigation zone. The visual
observer would continue visual monitoring and recording until the marine mammal/sea turtle is no
longer observed. SURTASS LFA sonar transmissions would only commence/resume 15 minutes after
there would be no further detection of marine mammals or sea turtles by visual, active acoustic (HF/M3
sonar), or passive acoustic monitoring within the LFA mitigation zone. If a detected marine mammal
were exhibiting abnormal behavior, visual monitoring would continue until the behavior returns to
normal or conditions did not allow monitoring to continue.

LOA and Rulemaking Application Under the MMPA for Use of SURTASS LFA Sonar
11-7 Mitigation Measures
11.3.2 Passive Acoustic Monitoring
Passive acoustic monitoring would be conducted when SURTASS is deployed, using the SURTASS towed
HLA to listen for vocalizing marine mammals as an indicator of their presence. If a detected sound were
estimated to be from a vocalizing marine mammal that may be potentially affected by SURTASS LFA
sonar, the sonar technician would notify the senior military member-in-charge, who would alert the
HF/M3 sonar operator and visual observers (during daylight). The delay or suspension of SURTASS LFA
sonar transmissions would be ordered when the HF/M3 sonar and/or visual observation indicates the
marine mammal’s range is within the LFA mitigation zone. Passive acoustic sonar technicians identify
the detected vocalizations to marine mammal species whenever possible. As with the other types of
monitoring, passive acoustic monitoring would begin 30 min prior to the first LFA sonar transmission,
continue throughout all LFA sonar transmissions, and end at least 15 minutes after LFA sonar
transmissions would no longer be broadcast.
11.3.3 Active Acoustic Monitoring
HF active acoustic monitoring uses the HF/M3 sonar to detect, locate, and track marine mammals (and
possibly sea turtles) that could pass close enough to the SURTASS LFA sonar array to enter the LFA
mitigation zone. HF/M3 sonar monitoring would begin 30 minutes before the first SURTASS LFA sonar
transmission is scheduled to commence and continue until 15 minutes after LFA sonar transmissions are
terminated. Prior to full-power use, the HF/M3 sonar power level would be ramped up over a period of
5 minutes from the SL of 180 dB re 1 µPa @ 1 m (rms) (SPL) in 10 dB increments until full power (if
required) would be attained to ensure that there are no inadvertent exposures of marine mammals or
sea turtles to RLs ≥180 dB re 1 µPa (rms) from the HF/M3 sonar.
If a contact were detected during HF/M3 monitoring within the LFA mitigation zone, the sonar operator
would notify the senior military member-in-charge, who would order the immediate delay or suspension
of LFA sonar transmissions. Likewise, if HF/M3 monitoring were to detect a possible marine mammal or
sea turtle outside the LFA mitigation zone, the HF/M3 sonar operator would determine the range and
projected track of the marine mammal or sea turtle and notify the senior military member-in-charge
that a detected animal would pass within the LFA mitigation zone. The senior military member-in-charge
would notify the bridge and passive sonar operator of the potential presence of a marine animal
projected to enter the mitigation zone. The senior military member-in-charge would order the delay or
suspension of LFA sonar transmissions when the marine mammal/sea turtle would be predicted to enter
the LFA mitigation zone. SURTASS LFA sonar transmissions would commence/resume 15 minutes after
there are no further detections by the HF/M3 sonar, visual, or passive acoustic within the LFA mitigation
zone.
The effectiveness of the HF/M3 sonar system to monitor and detect marine mammals has been
described in the Navy’s 2001 FOEIS/EIS (Chapters 2 and 4) for SURTASS LFA sonar (DoN, 2001) in
addition to the technical report by Ellison and Stein (2001). To summarize the effectiveness of the
HF/M3 sonar system, the Navy’s testing and analysis of the HF/M3 sonar system’s capabilities indicated
that the system:
• Substantially increased the probability of detecting a marine mammal within the LFA mitigation
zone;
• Provides a superior monitoring capability, especially for medium- to large-sized marine
mammals to a distance of 1.1 to 1.3 nmi (2 to 2.5 km) from the system (DoN, 2001);
LOA and Rulemaking Application Under the MMPA for Use of SURTASS LFA Sonar
11-8 Mitigation Measures
• Would result in several detections of a marine mammal before it even entered the LFA
mitigation zone (DoN, 2001). Indeed, based on the scan rate of the HF/M3 sonar system, most
animals would receive at least eight pings from the sonar (i.e., eight sonar returns or detections)
before even entering the LFA mitigation zone.
o based on this, the probability of a marine mammal being detected prior to entering the
mitigation zone approaches 100 percent (Ellison and Stein, 2001).
o the probability of the HF/M3 sonar system detecting a medium- to large-sized (~33 to 98 ft
[10 to 30 m]) marine mammal (humpback to blue whale) swimming towards the system in
the LFA mitigation zone with only one HF/M3 ping would be near 100 percent (Ellison and
Stein, 2001);
o for small (~8 ft [2.5 m]) marine mammals such as a dolphin, the detection is 55 percent from
one HF/M3 ping when the sonar is located at a distance of 2,625 to 3,051 ft (800 to 930 m)
from the animal, while the detection probability increases to 90 percent for four HF/M3
pings; and
• May result in higher detection probabilities in a typical at-sea environment—during HF/M3
testing, analysts noted that in the expected at-sea conditions of reduced clutter interference in
the open ocean and small marine mammals traveling in their typical group configurations (i.e.,
in pods), the detection rate would be higher (Ellison and Stein, 2001).
Qualitative and quantitative assessments of the HF/M3 system’s ability to detect marine mammals of
various sizes were verified by 170 hours of at-sea testing (Ellison and Stein, 2001).
11.4 Other Mitigation Measures Considered
The Navy considered additional mitigation measures for effecting the least practicable adverse impact
upon potentially affected species or stocks, their habitat, and their availability for subsistence uses.
However, when evaluated under the least practicable advserve impact standard, these measures did not
reduce the likelihood or degree of adverse impacts on species or stocks or were impracticable when
personnel safety, practicality of implementation, and impact on the effectiveness of the military
readiness activity were considered. Discussions of previously evaluated mitigation measures may be
found in Chapter 10 of the 2007 FSEIS (DoN, 2007), Chapter 7 of the 2012 SEIS/SOEIS (DoN, 2012), and
Chapter 5 of the 2017 SEIS/SOEIS (DoN, 2017a).
11.4.1 Longer Suspension/Delay Period
Navy has considered whether a longer clearance time of 30 minutes before LFA sonar transmissions are
allowed to commence/resume after an animal is detected would be more be protective than the current
15-minute clearance time. The 30-minute timeframe is more widely used in other mitigation plans
where marine mammals are principally detected by visual monitoring and this time period allows for the
visual detection of marine mammals that are longer-duration divers. However, given the high
effectiveness of the HF/M3 sonar system in detecting marine mammals under water in addition to the
use of the SURTASS passive system, such a long clearance time to detect deeper diving marine mammals
is not necessary. HF/M3 sonar used in combination with passive acoustic and visual mitigation
monitoring would effectively detect marine mammals present in the mitigation zone within the 15
minute timeframe.
LOA and Rulemaking Application Under the MMPA for Use of SURTASS LFA Sonar
11-9 Mitigation Measures
11.4.2 Restrict Transmissions to Daylight Hours
The Navy assessed the requirements for the use of SURTASS LFA sonar for the proposed training and
testing activities. It is a necessity that the Navy conduct training and testing at night in addition to during
daylight hours. The Navy must train and test in the same manner in which it would conduct activities
during combat. Training and operating differently from what would be needed in an actual combat
scenario would decrease training effectiveness, reduce crews' abilities, and introduce an increased
safety risk to personnel. The operators must be capable of operating the SURTASS LFA sonar systems in
all environments that may be experienced year-round, including night conditions. Training and operating
at night is vital because environmental differences between day and night affect the detection
capabilities of sonar. Consequently, personnel must train and operate during all hours of the day and
night to ensure they identify and respond to changing environmental conditions. Avoiding or reducing
active sonar at night for the purpose of mitigation would result in an unacceptable impact on military
readiness.
The Navy is proposing to implement a three-part mitigation monitoring that includes active and passive
acoustic monitoring in addition to visual monitoring. Therefore, while visual monitoring would not be
able to occur effectively at night, passive acoustic and active acoustic monitoring would be able to occur
and would be highly effective at detecting marine mammals and triggering mitigation measures
(shutdown). Therefore, the mitigation measure to restrict sonar transmissions to daylight hours was
eliminated from further consideration.
11.4.3 Reduce Training and Testing Activities
The Navy is currently approved to transmit 1,020 hours of LFA sonar transmissions per year. After
careful consideration, the Navy is proposing to reduce its transmissions to 496 hours in the first four
years and 592 hours in year five and continuing into the foreseeable future. In Section 2.1, the Navy
detailed the six activities that comprise their proposed use of SURTASS LFA sonar for training and testing
activities. The Navy carefully considered the amount of transmission hours that are necessary to meet
its purpose and need when developing this application. The ability to operate SURTASS LFA sonar is skill
that must be repeatedly practiced under realistic conditions. Training and testing during multiple
conditions is critical since environmental conditions differ between day and night and varying weather
conditions affect sound propagation and the detection capabilities of SURTASS LFA sonar. The Navy uses
computer simulation to augment training and testing whenever possible. Computer simulation can
provide familiarity and complement live training; however, it cannot provide the fidelity and level of
training necessary nor replicate all possible environmental scenarios found in the real world. Therefore,
the Navy would continue to use simulation to augment training and testing, but a further reduction in
transmission hours would not meet the Navy’s need and is eliminated from further consideration.
11.4.4 Increased Coastal Standoff Range
The Navy analyzed an increased coastal standoff range of 25 nmi (46 km) in Section 4.7.6 of the 2007
FSEIS/SOEIS (DoN, 2007), which is incorporated by reference. In summary, increasing the coastal
standoff range to 25 nmi (46 km) decreased the exposures of coastal shelf species to SURTASS LFA sonar
transmissions but increased the exposures of shelf break and pelagic species. This result is due to the
reduced overlap of the LFA sonar exposure area with land when the sound source moves farther
offshore, resulting in greater overlap of the LFA sonar exposure area with shelf break and pelagic
species. Therefore, the Navy did not implement this option.

LOA and Rulemaking Application Under the MMPA for Use of SURTASS LFA Sonar
11-10 Mitigation Measures
11.4.5 Expanded Geographic Sound Field Operational Constraints
The Navy considered reducing the SURTASS LFA sonar-generated sound field for the coastal standoff
range and at the outer boundary of OBIAs from below RLs of 180 dB re 1 µPa to below RLs of 150 dB re 1
µPa. The selection of the 180 dB re 1 µPa isopleth was reconfirmed with NMFS (2018b) acoustic
guidance to encompass the zone within which onset of potential injury (PTS) could occur, as well as
most of the non-injurious physiological (TTS) and exposure levels that could be associated with
potentially more severe behavioral responses. Considering the 60-sec duration of a SURTASS LFA sonar
pulse at a frequency of 300 Hz, the PTS SEL threshold (199 dB SEL) with frequency weighting for an LF
cetacean is equivalent to a SPL RL of the LFA sonar transmission of 182.7 dB re 1 µPa (rms) SPL.
Therefore, using a threshold of 180 dB re 1 µPa (rms) SPL at the coastal standoff range and OBIA
boundary is conservative. In addition, the LFA sonar vessel is in constant motion, so any transmission
within an OBIA or the coastal standoff range at levels expected to cause behavioral disruption would
likely be experienced briefly as the ship moves by and likely perceived as occurring in the distance,
which are important contextual factors to consider. Furthermore, the range to the 150 dB (rms) isopleth
would vary from tens of kilometers to over 54 nmi (100 km) based on propagation conditions. Increasing
the buffer zones to such sizes would result in significant impacts to military readiness activities by
reducing the acoustic regions in which training and testing of the SURTASS LFA sonar could occur, due to
the distance the system would have to operate off these areas. Therefore, since the current suite of
mitigation measures already prevent injury, most TTS, and more severe behavioral responses, the
expanded geographic sound field constraints do not significantly decrease the anticipated impact and
are elminated from consideration.
11.5 Summary of Mitigation Measures for SURTASS LFA Sonar Use
There are a suite of mitigation measures that apply to the use of SURTASS LFA sonar as well as three
types of monitoring measures to prevent injury that comprehensively mitigate adverse impacts to
marine mammals when SURTASS LFA sonar is in use (Table 11-1).
Table 11-1. Summary of Mitigation Measures for Use of SURTASS LFA Sonar.
Mitigation Measure Criteria Actions
Geographic Restrictions
12 nmi (22 km) from coastline Sound field below 180 dB RL, based on
SPL modeling
Delay/suspend SURTASS LFA sonar transmissions if sound field
criterion is exceeded
OBIA during biologically important seasons
Sound field below 180 dB RL, based on SPL modeling
Delay/suspend SURTASS LFA sonar transmissions if sound field
criterion is exceeded
Monitoring to Prevent Injury to Marine Mammals and Sea Turtles
Visual Monitoring Potentially affected species near the
vessel but outside of the LFA mitigation zone
Notify senior military member in charge

LOA and Rulemaking Application Under the MMPA for Use of SURTASS LFA Sonar
11-11 Mitigation Measures
Table 11-1. Summary of Mitigation Measures for Use of SURTASS LFA Sonar.
Mitigation Measure Criteria Actions
Potentially affected species sighted within 1.1 nmi (2 km) and 45 degrees either side of the bow or inside of the
LFA mitigation zone
Delay/suspend SURTASS LFA sonar transmissions
Passive Acoustic Monitoring Potentially affected species detected Notify senior military member-in-
charge
Active Acoustic Monitoring
Contact detected and determined to have a track that would pass within the
LFA mitigation zone
Notify senior military member-in-charge
Potentially affected species detected inside of the LFA mitigation zone
Delay/suspend SURTASS LFA sonar transmissions

LOA and Rulemaking Application Under the MMPA for Use of SURTASS LFA Sonar
12-1 Minimizing Adverse Effects on Subsistence Uses
12 MINIMIZATION OF ADVERSE EFFECTS ON SUBSISTENCE USES
SURTASS LFA sonar would not be operated during training and testing activities in Arctic waters, nor in
the Gulf of Alaska or off the Aleutian Island chain where subsistence uses of marine mammals occurs.
Therefore, there would be no impact on subsistence hunting, nor would SURTASS LFA sonar cause
abandonment of any harvest/hunting locations, displace any subsistence users, or place physical
barriers between marine mammals and the hunters. The Navy undertakes a suite of mitigation
measures whenever SURTASS LFA sonar is actively transmitting. Therefore, the use of SURTASS LFA
sonar would not lead to any adverse effects on subsistence-hunted marine mammals nor would it
reduce the availability of marine mammal stocks or species for subsistence uses. For this reason, a
cooperation plan is not applicable to this activity.
Requirement 12: Where the proposed activity would take place in or near a traditional Arctic
subsistence hunting area and/or may affect the availability of a species or stock of marine mammals
for Arctic subsistence uses, the applicant must submit either a “plan of cooperation” or information
that identifies what measures have been taken and/or will be taken to minimize any adverse effects
on the availability of marine mammals for subsistence uses.
LOA and Rulemaking Application Under the MMPA for Use of SURTASS LFA Sonar
13-1 Monitoring and Reporting
13 MONITORING AND REPORTING
13.1 Monitoring to Increase Knowledge of Affected Marine Mammal Species
In addition to the mitigation monitoring the Navy conducts during at-sea SURTASS LFA sonar activities,
the Navy also conducts numerous monitoring efforts that provide information about the marine
environment and marine mammal occurrence and behavior.
13.1.1 Ambient Noise Data Monitoring
The Navy collects ambient noise data on the marine environment when the SURTASS passive towed HLA
is deployed. However, because the collected ambient noise data may also contain sensitive acoustic
information, the Navy classifies the data, and thus, does not make these data publicly available. These
ambient noise data, especially from areas of the ocean for which ambient noise data may be lacking,
would be a beneficial addition to the comprehensive ocean noise budget (i.e., an accounting of the
relative contributions of various underwater sources to the ocean noise field) that is being developed for
the world’s oceans. Ocean noise budgets are an important component of varied marine environmental
analyses, including studies of masking in marine animals, marine habitat characterization, and marine
animal impact analyses. Additionally, these additional marine ambient noise data may also illustrate
how noise levels in specific parts of the ocean change over time.
In acknowledgement of the valuable ambient noise data the Navy routinely collects, NMFS has
recommended that the Navy continue to explore the feasibility of declassifying and archiving the
ambient noise data for incorporation into appropriate ocean noise budget efforts. The Navy continues
to study the feasibility of declassifying portions of these data after all related security concerns have
been resolved. SURTASS LFA sonar’s Marine Mammal Monitoring (M3) program is working to compile
information on the ambient noise data that have been collected from various systems as a starting point
for further discussions on data dissemination, either at a classified or unclassified level.
13.1.2 Marine Mammal Monitoring (M3) Program
SURTASS LFA sonar’s M3 program uses the Navy’s fixed and mobile passive acoustic monitoring systems
to enhance the Navy’s collection of long-term data on individual and population levels of acoustically
active marine mammals, principally baleen and sperm whales. The data that the M3 program collects
are classified, however, M3 analysts are working to develop reports that can be declassified and result in
scientific papers that are peer-reviewed publications in scientific journals. Progress has been achieved
Requirement 13: The suggested means of accomplishing the necessary monitoring and reporting that
will result in increased knowledge of the species, the level of taking or impacts on populations of
marine mammals that are expected to be present while conducting activities and suggested means of
minimizing burdens of coordinating such reporting requirements with other schemes already
applicable to persons conducting such activity. Monitoring plans should include a description of the
survey techniques that would be used to determine the movement and activity of marine mammals
near the activity site(s) including migration and other habitat uses, such as feeding. Guidelines for
developing site-specific monitoring plan may be obtained by writing to the Director, Office of Protected
Resources.

LOA and Rulemaking Application Under the MMPA for Use of SURTASS LFA Sonar
13-2 Monitoring and Reporting
on addressing security concerns and declassifying a report of fin whale singing and swimming behaviors
from which a scientific paper has been submitted to a scientific journal for review (DoN, 2015). In
addition, information on detections of western gray whale vocalizations has been shared with the
International Union for the Conservation of Nature on possible wintering areas for this highly-
endangered marine mammal. The Navy (OPNAV N2/N6F24) continues to assess and analyze M3 data
collected from Navy passive acoustic monitoring systems and is working toward making some portion of
that data, after appropriate security reviews, available to scientists with appropriate clearances and
ultimately made publicly available.
13.2 Reporting
The Navy would report on the level of SURTASS LFA sonar training and testing transmissions over annual
periods, the locations in which marine mammals may have been exposed to SURTASS LFA sonar training
and testing activities, the associated taking of marine mammals from those exposures to LFA sonar
transmissions, and the potential population or stock level impacts that occurred due to the use of
SURTASS LFA sonar. The Navy would keep track of the level of SURTASS LFA sonar training and testing
transmission hours throughout the year to ensure that the approved level of transmissions is not
exceeded.
13.2.1 Incident Monitoring
Crews of the SURTASS LFA sonar vessels systematically observe the sea surface during and after
SURTASS LFA sonar transmissions for injured or disabled marine mammals. The Navy routinely monitors
the principal marine mammal stranding networks, the Internet, and social media to compile stranding
data for the regions in which SURTASS LFA sonar transmissions occurred and correlates the marine
mammal strandings temporally and spatially with SURTASS LFA sonar transmissions.
Additionally, the Navy would notify NMFS immediately, or as soon as clearance procedures allow, if an
injured, stranded, or dead marine mammal were found during, shortly after (within 24 hr), and in the
vicinity of any SURTASS LFA sonar transmissions. In the event that an injured, stranded, or dead marine
mammal is found by the SURTASS LFA sonar vessel crew during transit, or that is not in the vicinity of, or
found during or shortly after SURTASS LFA sonar activities, the Navy would report the incident as soon
as operationally feasible and clearance procedures allow. In addition, the Navy would immediately, or as
soon as clearance procedures allow, report any ship strikes of marine mammals by one of the SURTASS
LFA sonar vessels, including all pertinent information on the strike and associated vessel. No marine
mammals have ever been struck by SURTASS LFA sonar vessels.
13.2.2 Annual and Comprehensive Reports
The Navy would submit an annual report to the NMFS Office of Protected Resources Director no later
than 60 days after the anniversary of the date on which the LOA becomes effective. The annual report
on SURTASS LFA sonar training and testing activities would contain summaries of the dates/times and
locations of LFA sonar activity; marine mammal detections from visual, passive acoustic, and active
acoustic monitoring; and delays or suspensions of LFA sonar transmissions due to mitigation monitoring
protocol. Marine mammal detections would include general type of marine mammals (i.e., whales,
dolphins) and/or species identifications, number of marine mammals detected, time frame of
detections, type of detection (visual, passive acoustic, HF/M3 sonar), bearing and range from the vessel,
abnormal behavior (if any), and remarks/narrative (as necessary). The annual report would include the
Navy’s estimates of the percentage of marine mammal stocks and number of individual marine

LOA and Rulemaking Application Under the MMPA for Use of SURTASS LFA Sonar
13-3 Monitoring and Reporting
mammals affected by exposure to SURTASS LFA sonar transmissions using acoustic impact modeling
based on locations, seasons, system characteristics, oceanographic environmental conditions, and
marine mammal demographics; estimations of total percentages of each marine mammal stock affected
by all SURTASS LFA sonar transmissions during the annual period; analysis of the effectiveness of
mitigation measures; estimation of cumulative impacts; and long-term effects on marine mammals from
SURTASS LFA sonar transmissions.
Each annual report would build on the previous annual report to provide a cumulative overview of the
level of training and testing transmission hours per year as well as estimates of total percentages of each
marine mammal stock affected by SURTASS LFA sonar transmissions during each annual period. At the
end of the effective period of the LOA, the final annual report would be a cumulative, comprehensive
report of impacts of SURTASS LFA sonar training and testing activities on marine mammal species or
stocks during the MMPA regulation period.
13.3 Adaptive Management
Since the understanding of the potential effects of SURTASS LFA sonar on marine mammals is
continually evolving, the Navy is including an adaptive management component within the scientific
framework of this application for rule-making and a letter of authorization. The adaptive management
process allows NMFS, in consultation with the Navy, to modify or augment existing mitigation or
monitoring measures if doing so would have a reasonable likelihood of more effectively accomplishing
the mitigation and monitoring objectives of minimizing adverse impacts on marine mammals (50 CFR
218.241). Adaptive management allows the Navy and NMFS to consider, on a case-by-case basis, new
peer-reviewed and published scientific data and information or survey data to determine whether
consideration, practicability included, should be given to the modification of current SURTASS LFA sonar
mitigation monitoring measures or the designation of additional OBIAs for SURTASS LFA sonar, if new
scientific data indicate that such modifications would be appropriate. The adaptive management
process also allows for updates to marine mammal stock estimates which, in turn, provide for the use of
the best available scientific data for predictive models. Under the adaptive management process, the
Navy and NMFS would meet annually, if deemed necessary.
LOA and Rulemaking Application Under the MMPA for Use of SURTASS LFA Sonar
14-1 Research
14 RESEARCH
The Navy sponsors significant research and monitoring projects to study the potential impacts of its
activities on marine mammals. The most recently available data are for Fiscal Year 2015 in which the
Navy reported that it spent $35.9 million that year on marine mammal research and conservation
(Marine Mammal Commission [MMC], 2017). The survey was designed to capture information on
marine mammal-related programs, projects, and grants, including the nature of the research, the
species and geographic areas studied, the threats and issues addressed, and the funding amounts
obligated during the fiscal year. Within the Navy, research is funded primarily by the Office of Naval
Research, the Living Marine Resources (LMR) program, and the Navy’s Atlantic and Pacific fleets, with
about $3.5M of the $35.9M being funded by the Naval Sea Systems Command and the Naval Air
Systems Command (MMC, 2017). The Navy developed an Integrated Comprehensive Monitoring Plan to
ensure coordinated and efficient research and monitoring efforts within an overarching framework.
The Office of Naval Research Marine Mammals and Biology program supports basic and applied
research and technology development related to understanding the impacts of sound on marine
mammals, including physiological, behavioral, ecological, and population-level impacts. There are
currently four program thrusts:
• Monitoring and detection (development of passive, infrared, and other technologies).
• Integrated ecosystem research (sensor and tag development).
• Impacts of sound on marine life (behavioral response studies, diving physiology, physiological
stress response, hearing, population consequences of acoustic disturbance).
• Models and databases for environmental compliance.
The mission of the Navy’s LMR program is to develop, demonstrate, and assess information and
technology solutions to minimize the environmental risks of Navy at-sea training and testing activities
while preserving core Navy readiness capabilities. The five key investment areas of LMR are: (1) data to
support risk threshold criteria, (2) improved collection and processing of protected species data in areas
of Navy interest, (3) monitoring and mitigation technology demonstrations, (4) standards and metrics,
and (5) education and outreach, emergent opportunities.
The Navy’s Marine Species Monitoring program is designed to address the Navy’s research and
monitoring requirements under the ESA and the MMPA across the various geographic regions where the
Navy trains. Individual projects are funded after evaluation against a Strategic Planning Process that was
developed with input from a science advisory group, NMFS, and other regional experts. Current projects
include monitoring pinniped haul-outs and photo-identification in coastal areas of the eastern North
Atlantic Ocean, humpback whale distribution in the mid-Atlantic region, cetacean occurrence in the
continental shelf break region of the Virginia Capes Operating Area and U.S. west coast ranges, and
behavioral response studies of marine mammals to Navy training and testing activities.
Requirement 14: Suggested means of learning of, encouraging, and coordinating research
opportunities, plans, and activities relating to reducing such incidental taking and evaluating its
effects.

LOA and Rulemaking Application Under the MMPA for Use of SURTASS LFA Sonar
14-2 Research
14.1 SURTASS LFA Sonar’s Marine Mammal Monitoring (M3) Program
The Navy has and continues to sponsor multi-year research studies using fixed passive acoustic assets.
Beginning in 1993, the M3 program was designed to assess the feasibility of detecting and tracking
marine mammals using Navy assets. The M3 program has evolved into a valuable tool by which the
acoustic activity levels of vocalizing whales can be quantitatively documented and trends of oceanic
ambient noise levels measured over ecologically meaningful ocean scales and time periods under
varying ocean noise conditions.
As part of the research component of the SURTASS LFA sonar program, M3 data are collected to: a)
document occurrence, distribution, and behaviors of acoustically active whale species over ocean basin
and decadal scales; b) objectively assess changes in marine mammal activity levels under normal
conditions (e.g., weather, wind, time of year, or time of day) relative to acoustic conditions with varying
levels of anthropogenic sources (e.g., seismic profilers13, naval sonar, shipping, or fishing activity); c)
uniquely inform environmental assessments of current and future anti-submarine warfare systems; and
d) assemble a long-term database of ocean ambient noise data to enable scientifically-based evaluations
of potential influences on cetaceans or other species.
Acoustic data and information collected and archived by the M3 program allow program analysts to
statistically quantify how cetacean acoustic behaviors are affected by various factors, such as ocean
basin topographic features, hydrographic conditions, seasonality, time, weather conditions, and ambient
noise conditions. The compiled acoustic data can be used to estimate the total number of vocalizing
whales per unit area, as well as document the seasonal or localized movements of individual animals. In
addition, observations over time can also show the interaction and influence of noise sources on large
whale behavior.
Besides documenting known sound sources, the M3 analysts use their expertise to expand the Navy’s
catalog of biological sounds that cannot be identified to species. This collection of unknown biologic
sounds includes some signal types that are clearly from large whales, some that are most likely
echolocation clicks from diving odontocetes, some that are from fishes, and some that are from
invertebrates (e.g., daily vertical migrations). By authenticating that a sound source is of biological
origin, the M3 program has significantly contributed to the proper identification of marine sound
sources that are not of biological origin.
13 The term seismic profiler refers to a vessel operating a seismic airgun array or arrays as part of a geological and geophysical survey,
usually to explore for sub-bottom oil and gas but also to conduct basic research.
LOA and Rulemaking Application Under the MMPA for Use of SURTASS LFA Sonar
15-1 Literature Cited
15 LITERATURE CITED
Aburto, A., Rountry, D. J., & Denzer, J. L. (1997). Behavioral response of blue whales to active signals.
(Technical Report 1746). San Diego, CA: Naval Command, Control and Ocean Surveillance
Center, RDT&E Division.
Acebes, J. M. V., Darling, J.D., & Yamaguchi, M. (2007). Status and distribution of humpback whales
(Megaptera novaeangliae) in northern Luzon, Philippines. Journal of Cetacean Research and
Management, 9(1), 37-43.
Agardy, T. (2000). Key steps taken to preserve the U.S.'s marine heritage. Issues in Science and
Technology, 17(1), 26.
Agardy, T., P. Bridgewater, M.P. Crosby, J. Day, P.K. Dayton, R. Kenchington, D. Laffoley, P. Mcconney,
P.A. Murray, J.E. Parks, and L. Peau. (2003). Dangerous targets? Unresolved issues and
ideological clashes around marine protected areas. Aquatic Conservation: Marine and
Freshwater Ecosystems, 13, 353-367.
Aguilar, A., & García-Vernet, R. (2018). Fin whale Balaenoptera physalus. Pages 368-371 in B. Wursig,
J.G.M. Thewissen, & K.M. Kovacs, (Eds). Encyclopedia of marine mammals, 3rd ed. San Diego,
California: Academic Press.
Aguilar de Soto, N., Johnson, M.P., Madsen, P. T., Diaz, F., Dominguez, I., Brito, A., & Tyack, P. (2008).
Cheetahs of the deep sea: deep foraging sprints in short-finned pilot whales off Tenerife
(Canary Islands). Journal of Animal Ecology, 77, 936-947.
Akamatsu, T., M. H. Rasmussen, & M. Iversen. (2014). Acoustically invisible feeding blue whales in
Northern Icelandic waters. The Journal of the Acoustical Society of America, 136(2), 939-944.
doi:10.1121/1.4887439.
Allen, B. M., & Angliss, R. P. (2014). Alaska marine mammal stock assessments, 2013. (NOAA Technical
Memorandum NMFS-AFSC-277). Seattle, Washington: Alaska Fisheries Science Center, National
Marine Fisheries Service.
Allen, B. M., & Angliss, R. P. (2015). Alaska marine mammal stock assessments, 2014. (NOAA Technical
Memorandum NMFS-AFSC-301). Seattle, Washington: Alaska Fisheries Science Center, National
Marine Fisheries Service.
Alling, A.K., & Payne, R. (1990). Song of the Indian Ocean blue whale, Balaenoptera musculus. S.
Leatherwood, ed. Special issue on the Indian Ocean Sanctuary. Cambridge, Massachusetts:
International Whaling Commission.
Alves, A., Antunes, R., Bird, A., Tyack, P. L., Miller, P. J. O., Lam, F.-P. A., & Kvadsheim,P. H. (2014). Vocal
matching of naval sonar signals by long-finned pilot whales (Globicephala melas). Marine
Mammal Science, 30(3), 1248-1257. doi:10.1111/mms.12099.
Alves, F., A. Dinis, I. Cascão, & L. Freitas. (2010). Bryde's whale (Balaenoptera brydei) stable associations
and dive profiles: New insights into foraging behavior. Marine Mammal Science, 26(1), 202-
212.
LOA and Rulemaking Application Under the MMPA for Use of SURTASS LFA Sonar
15-2 Literature Cited
Alves, F., Dinis, A., Ribeiro, C., Nicolau, C., Kaufmann, M., Fortuna, C. M., & Freitas, L. (2013). Daytime
dive characteristics from six short-finned pilot whales Globicephala macrorhynchus off Madeira
Island. Arquipelago-Life and Marine Sciences, 31, 1-8.
American National Standard Institute (ANSI). (2006). ANSI reference quantities for acoustical levels,
ANSI-S1-8-1989, revised 2006. New York, New York: Acoustic Society of America.
Andersen, J. M., Skern-Mauritzen, M., Boehme, L., Wiersma, Y. F., Rosing-Asvid, A., Hammill, M. O., &
Stenson, G. B. (2013). Investigating annual diving behaviour by hooded seals (Cystophora
cristata) within the Northwest Atlantic Ocean. PLoS ONE, 8(11), e80438.
doi:10.1371/journal.pone.0080438.
Andersen, J. M., Stenson, G. B., Skern-Maurizen, M., Wiersma, Y. F., Rosing-Asvid, A., Hammill, M. O., &
Boehme, L. (2014). Drift diving by hooded seals (Cystophora cristata) in the northwest Atlantic
Ocean. PLoS ONE, 9(7), e103072. doi:10.1371/journal.pone.0103072.
Andrew, R.K., Howe, B.M. & Mercer, J.A. (2011). Long-time trends in ship traffic noise for four sites off
the North American West Coast. The Journal of the Acoustical Society of America, 129(2), 642-
651. doi:10.1121/1.3518770.
Andrew, R.K., Howe, B.M., Mercer, J A., & Dzieciuch, M.A. (2002). Ocean ambient sound: Comparing the
1960s with the 1990s for a receiver off the California coast. Acoustics Research Letters Online,
3(2), 65. doi:10.1121/1.1461915.
Andrews, K. R., Karczmarski, L., Au, W. W. L., Rickards, S. H., Vanderlip, C. A., & Toonen, R. J. (2006).
Patterns of genetic diversity of the Hawaiian spinner dolphin (Stenella longirostris). Atoll
Research Bulletin, 543, 65-73.
Ansmann, I. C., Goold, J. C., Evans, P. G. H., Simmonds, M., & Keith, S. G. (2007). Variation in the whistle
characteristics of short-beaked common dolphins, Delphinus delphis, at two locations around
the British Isles. Journal of the Marine Biological Association of the United Kingdom, 87(01), 19-
26.
Antunes, R., Kvadsheim, P. H., Lam, F. P., Tyack, P. L., Thomas, L., Wensveen, P. J., & Miller, P. J. (2014).
High thresholds for avoidance of sonar by free-ranging long-finned pilot whales (Globicephala
melas). Marine Pollution Bulletin, 83(1), 165-180.
Aragones, L. V., Roque, M. A. A., Flores, M. B., Encomienda, R. P., Laule, G. E., Espinos, B. G., Maniago, F.
E., Diaz, G. C., Alesna, E. B., & Braun, R. C. (2010). The Philippine marine mammal strandings
from 1998 to 2009: Animals in the Philippines in peril? Aquatic Mammals, 36(3), 219-233.
doi:10.1578/am.36.3.2010.219.
Archer, F. I., II (2009). Striped dolphin Stenella coeruleoalba. In W. F. Perrin, B. Würsig, & J. G. M.
Thewissen (Eds.), Encyclopedia of marine mammals (pp. 1127-1129). New York, NY: Academic
Press.
Archer, F. I., II, & Perrin, W. F. (1999). Stenella coeruleoalba. Mammalian Species, 603, 1-9.
Arnould, J. P. Y. (2009). Southern fur seals Arctocephalus spp. In W. F. Perrin, B. Würsig, & J. G. M.
Thewissen (Eds.), Encyclopedia of marine mammals. New York, NY: Academic Press.

LOA and Rulemaking Application Under the MMPA for Use of SURTASS LFA Sonar
15-3 Literature Cited
Arnould, J. P. Y., & Hindell, M. A. (2001). Dive behaviour, foraging locations, and maternal-attendance
patterns of Australian fur seals (Arctocephalus pusillus doriferus). Canadian Journal of Zoology,
79: 35-48.
Aroyan, J. L. (2001). Three-dimensional modeling of hearing in Delphinus delphis. The Journal of the
Acoustical Society of America, 110(6), 3305-3318.
Aroyan, J. L., McDonald, M. A., Webb, S. C., Hildebrand, J. A., Clark, D., Laitman, J. T., & Reidenberg, J. S.
(2000). Acoustic models of sound production and propagation. In W. W. L. Au, A. N. Popper, &
R. R. Fay (Eds.), Hearing by whales and dolphins (pp. 409-469). New York, New York: Springer-
Verlag.
Aschettino, J. M. (2010). Population size and structure of melon-headed whales (Peponocephala electra)
around the Main Hawaiian Islands: Evidence of multiple populations based on photographic
data. Master’s thesis. Hawai'i Pacific University, Honolulu, HI.
Au, W. W., G. Giorli, J. Chen, A. Copeland, M. Lammers, M. Richlen, S. Jarvis, R. Morrissey, D. Moretti, &
H. Klinck. (2013). Nighttime foraging by deep diving echolocating odontocetes off the Hawaiian
islands of Kauai and Ni'ihau as determined by passive acoustic monitors. The Journal of the
Acoustical Society of America, 133(5), 3119-3127. doi:10.1121/1.4798360.
Au, W. W. L. (1993). The sonar of dolphins. New York, NY: Springer-Verlag.
Au, W. W. L., & M. C. Hastings. (2008). Principles of Marine Bioacoustics (1st ed.). New York, NY:
Springer.
Au, W. W. L., & D. L. Herzing. (2003). Echolocation signals of wild Atlantic spotted dolphin (Stenella
frontalis). Journal of the Acoustical Society of America, 113(1), 598-604.
Au, W. W. L., P. E. Nachtigall, & J. A. Pawloski. (1997). Acoustic effects of the ATOC signal (75 Hz, 195 dB)
on dolphins and whales. Journal of the Acoustical Society of America, 101, 2973-2977.
Au, W. W. L., A. A. Pack, M. O. Lammers, L. M. Herman, M. H. Deakos, & K. Andrews. (2006). Acoustic
properties of humpback whale songs. The Journal of the Acoustical Society of America, 120(2),
1103-1110.
Australian Government. (2016). Aipysurus fuscus in species profile and threats database. Department of
the Environment, Australian Government, Canberra, Australia. Accessed April 2016. Retrieved
from: <http://www.environment.gov.au/sprat>.
Awbrey, F. T. (1982). Ross Sea killer whale vocalizations: Preliminary description and comparison with
those of some Northern Hemisphere killer whales. Reports to the International Whaling
Commission, 32, 667-670.
Awbrey, F. T., J. C. Norris, A. B. Hubbard, & W. E. Evans. (1979). The bioacoustics of the Dall porpoise-
salmon drift net interaction. (Hubbs/Sea World Research Institute Technical Report 79-120).
San Diego, CA: Hubbs/Sea World Research Institute.
Azzolin, M., Papale, E., Lammers, M. O., Gannier, A., & Giacoma, C. (2013). Geographic variation of
whistles of the striped dolphin (Stenella coeruleoalba) within the Mediterranean Sea. The
Journal of the Acoustical Society of America, 134(1), 694-705. doi:10.1121/1.4808329.
LOA and Rulemaking Application Under the MMPA for Use of SURTASS LFA Sonar
15-4 Literature Cited
Babushina, Y. S., Zaslavskii, G. L. & Yurkevich, L. I. (1991). Air and underwater hearing characteristics of
the northern fur seal audiograms frequency and differential thresholds. Biophysics, 36(5), 909-
913.
Bain, D. E., B. Kriete, & M. E. Dahlheim. (1993). Hearing abilities of killer whales (Orcinus orca). Journal of
the Acoustical Society of America, 94(3), 1829.
Baird, R. W. (2009a). False killer whale Pseudorca crassidens. In W. F. Perrin, B. Würsig, & J. G. M.
Thewissen (Eds.), Encyclopedia of marine mammals (pp. 405-406). New York: Academic Press.
Baird, R. W. (2009b). Risso’s Dolphin Grampus griseus. In W. F. Perrin, B. Würsig, & J. G. M. Thewissen
(Eds.), Encyclopedia of marine mammals (pp. 975-976). New York: Academic Press.
Baird, R. W., Dill, L. M., & Hanson, B. (1998). Diving behaviour of killer whales. Paper presented at the
World Marine Mammal Science Conference, Monaco.
Baird, R. W., Ligon, A. D., Hooker, S. K., & Gorgone, A. M. (2001). Subsurface and nighttime behaviour of
pantropical spotted dolphins in Hawai'i. Canadian Journal of Zoology, 79, 988-996.
Baird, R. W., J. F. Borsani, M. B. Hanson, & P. L. Tyack. (2002). Diving and night-time behavior of long-
finned pilot whales in the Ligurian Sea. Marine Ecology Progress Series, 237, 301-305.
Baird, R. W., D. J. McSweeney, A. D. Ligon, & D. L. Webster. (2004). Tagging feasibility and diving of
Cuvier’s beaked whales (Ziphius cavirostris) and Blainville’s beaked whales (Mesoplodon
densirostris) in Hawaii. (Contract report, order number AB133F-03-SE-0986). La Jolla, CA.
Baird, R. W., Hanson, M. B., & Dill, L. M. (2005). Factors influencing the diving behaviour of fish-eating
killer whales: sex differences and diel and interannual variation in diving rates. Canadian
Journal of Zoology, 83(2), 257-267.
Baird, R. W., Gorgone, A. M., McSweeney, D. J., Webster, D. L., Salden, D. R., Deakos, M. H., Ligon, A. D.,
Schorr, G. S., Barlow, J., & Mahaffy, S.D. (2008). False killer whales (Pseudorca crassidens)
around the main Hawaiian Islands: Long-term site fidelity, inter-island movements, and
association patterns. Marine Mammal Science, 24, 591-612.
Baird, R. W., Gorgone, A. M., McSweeney, D.J., Ligon, A. D., Deakos, M. H., Webster, D. L., Schorr, G. S.,
Martien, K.K., Salden, D. R., & Mahaffy, S. D. (2009). Population structure of island-associated
dolphins: Evidence from photo-identification of common bottlenose dolphins (Tursiops
truncatus) in the main Hawaiian Islands. Marine Mammal Science, 25(2), 251-274.
Baird, R. W., Schorr, G. S., Webster, D. L., McSweeney, D. J., Hanson, M. B. and Andrews, R. D. (2011).
Movements of two satellite-tagged pygmy killer whales (Feresa attenuata) off the island of
Hawai‘i. Marine Mammal Science, 27(4), E332–E337. doi:10.1111/j.1748-7692.2010.00458.x.
Baird, R. W., Oleson, E. M., Barlow, J., Ligon, A. D., Gorgone, A. M., & Mahaffy, S. D. (2013). Evidence of
an island-associated population of false killer whales (Pseudorca crassidens) in the
Northwestern Hawaiian Islands. Pacific Science, 67(4), 513-521. doi: 10.2984/67.4.2
Baker, A. N. (1985). Pygmy right whale Caperea marginata. In S. H. Ridgway & R. Harrison (Eds.), The
Sirenians and Baleen Whales (Vol. 3, pp. 345-354).
Ballance, L. T. (2009). Cetacean ecology. In W. F. Perrin, B. Wursig, & J. G. M. Thewissen (Eds.),
Encyclopedia of marine mammals (2nd edition ed., pp. 196-201). San Diego, California:
Academic Press.

LOA and Rulemaking Application Under the MMPA for Use of SURTASS LFA Sonar
15-5 Literature Cited
Ballance, L. T., & R. L. Pitman. (1998). Cetaceans of the western tropical Indian Ocean: Distribution,
relative abundance, and comparisons with cetacean communities of two other tropical
ecosystems. Marine Mammal Science, 14(3), 429-459.
Bannister J. L., & Hedley, S. L. (2001). Southern Hemisphere Group IV humpback whales: Their status
from recent aerial survey. Memoirs of the Queensland Museum, 47, 587-598.
Bannister, J. L., Kemper, C. M., & Warneke, J. M. (1996). The action plan for Australia cetaceans.
Canberra, AU: Australian Nature Conservation Agency. ISBN 0 642 21388 7.
Barlow, J. (1999). Trackline detection probability for long-diving whales. In G. W. Garner, S. C. Amstrup,
J. L. Laake, B. F. J. Manly, L. L. McDonald, & D. G. Robertson (Eds.), Marine Mammal Survey and
Assessment Methods (pp. 209-221). Brookfield, IL: A.A Balkema.
Barlow, J. (2006). Cetacean abundance in Hawaiian waters estimated from a summer/fall survey in 2002.
Marine Mammal Science, 22(2), 446-464.
Barlow, J. (2010). Cetacean abundance in the California Current from a 2008 ship-based line-transect
survey. (NOAA Technical Memorandum NOAA-TM-NMFS-SWFSC-456). La Jolla, CA: Southwest
Fisheries Service, National Marine Fisheries Service.
Barlow, J., & Forney, K. (2007). Abundance and population density of cetaceans in the California Current
ecosystem. Fishery Bulletin, 105, 509-526.
Barlow, J., Ferguson, M. C., Perrin, W. F., Ballance, L., Gerrodette, T., Joyce, G., Macleod, C. D., Mullin, K.,
Palka, D. L., & Waring, G. (2006). Abundance and densities of beaked and bottlenose whales
(family Ziphiidae). Journal of Cetacean Research and Management, 7, 263-270.
Barlow, J., Ferguson, M. C., Becker, E. A., Redfern, J. V., Forney, K. A., Vilchis, I. L., Fiedler, P.C.,
Gerrodette, T., & Ballance, L. T. (2009). Predictive modeling of cetacean densities in the Eastern
Pacific Ocean. (NOAA-TM-NMFS-SWFSC-444). La Jolla, CA: Southwest Fisheries Science Center,
National Marine Fisheries Service.
Baumann-Pickering, S., M. A. Roch, S. M. Wiggins, H. U. Schnitzler, & J. A. Hildebrand. (2015a). Acoustic
behavior of melon-headed whales varies on a diel cycle. Behavioral Ecology and Sociobiology,
69(9), 1553-1563. doi:10.1007/s00265-015-1967-0.
Baumann-Pickering, S., A. E. Simonis, E. M. Oleson, R. W. Baird, M. A. Roch, & S. M. Wiggins. (2015b).
False killer whale and short-finned pilot whale acoustic identification. Endangered Species
Research, 28(2), 97-108. doi:10.3354/esr00685.
Baumann-Pickering, S., S. M. Wiggins, J. A. Hildebrand, M. A. Roch, & H.-U. Schnitzler. (2010).
Discriminating features of echolocation clicks of melon-headed whales (Peponocephala
electra), bottlenose dolphins (Tursiops truncatus), and Gray’s spinner dolphins (Stenella
longirostris longirostris). The Journal of the Acoustical Society of America, 128(4), 2212.
doi:10.1121/1.3479549.
Bazua-Duran, C., & W. W. L. Au. (2002). The whistles of Hawaiian spinner dolphins. Journal of the
Acoustical Society of America, 112(6), 3064-3072.
Bazua-Duran, C., & W. W. L. Au. (2004). Geographic variations in the whistles of spinner dolphins
(Stenella longirostris) of the Main Hawai'ian Islands. Journal of the Acoustical Society of
America, 116(6), 3757-3769.
LOA and Rulemaking Application Under the MMPA for Use of SURTASS LFA Sonar
15-6 Literature Cited
Bearzi, G., Reeves, R. R., Remonato, E., Pierantonio, N., & Airoldi, S. (2011). Risso's dolphin Grampus
griseus in the Mediterranean Sea. Mammalian Biology, 76(4), 385-400.
Bernaldo de Quirós, Y., O. Gonzalez-Diaz, M. Arbelo, E. Sierra, S. Sacchini, & A. Fernandez. (2012).
Decompression vs. decomposition: Distribution, amount, and gas composition of bubbles in
stranded marine mammals. Frontiers in Physiology, 3, 177.
Bernaldo de Quiros, Y., O. Gonzalez-Diaz, A. Mollerlokken, A. O. Brubakk, A. Hjelde, P. Saavedra, & A.
Fernandez. (2013). Differentiation at autopsy between in vivo gas embolism and putrefaction
using gas composition analysis. International Journal of Legal Medicine, 127(2), 437-445.
Berta, A. (2009). Pinnipeds, overview. In W. F. Perrin, B. Würsig, & J. G. M. Thewissen (Eds.),
Encyclopedia of marine mammals (pp. 878-884). New York, NY: Academic Press.
Best, P. B. (1960). Further information on Bryde's whale (Balaenoptera edeni Anderson) from Saldanha
Bay, South Africa. Norsk Hvalfangst-Tidende, 49, 201-215.
Best, P. B. (1975). Status of Bryde's whale (Balaenoptera edeni or B. brydei). (Paper presented at the
Marine Mammal Symposium, Rome, Italy).
Best, P. B., Bannister, J. L., Brownell, Jr., R. L., & Donovan, G. P. (Eds). (2001). Right whales: Worldwide
status. Journal of Cetacean Research and Management, (Special Issue 2), 1-309.
Best, P.-B., R.-A. Rademeyer, C. Burton, D. Ljungblad, K. Sekiguchi, H. Shimada, D. Thiele, D. Reeb, & D.-S.
Butterworth. (2003). The abundance of blue whales on the Madagascar Plateau, December
1996. Journal of Cetacean Research and Management 5(3), 253-260.
Bettridge, S., Baker, C. S., Barlow, J., Clapham, P. J., Ford, M., Gouveia, D., Mattila, D. K., Pace, III, R. M.,
Rosel, P. E., Silber, G. K., & Wade, P. R. (2015). Status review of the humpback whale
(Megaptera novaeangliae) under the Endangered Species Act. (NOAA Technical Memorandum
NOAA-TM-NMFS-SWFSC-540). La Jolla, CA: Southwest Fisheries Service, National Marine
Fisheries Service.
Bjorge, A., & K. A. Tolley. (2009). Harbor porpoise Phocoena phocoena. In W. F. Perrin, B. Würsig, & J. G.
M. Thewissen (Eds.), Encyclopedia of marine mammals (pp. 530-533). New York, NY: Academic
Press.
Black, N. (2009). Pacific white-sided dolphin Lagenorhynchus obliquidens. In W. F. Perrin, B. Würsig, & J.
G. M. Thewissen (Eds.), Encyclopedia of marine mammals (pp. 817-819). New York, NY:
Academic Press.
Black, N. A. (1994). Behavior and ecology of Pacific white-sided dolphins (Lagenorhynchus obliquidens)
in Monterey Bay, California. (Unpublished Masters thesis). San Francisco State University, San
Francisco, CA.
Bonner, W. N. (1990). The natural history of seals. New York, NY: Facts on File.
Boveng, P. L., Bengtson, J. L., Buckley, T. W., Cameron, M. F., Dahle, S. P., Kelly, B. P., Megrey, B. A.,
Overland, J. E., & Williamson, N. J. (2009). Status review of the spotted seal (Phoca largha).
(NOAA Technical Memorandum NMFS-AFSC-200). Seattle, WA: Alaska Fisheries Science Center,
National Marine Fisheries Service.
LOA and Rulemaking Application Under the MMPA for Use of SURTASS LFA Sonar
15-7 Literature Cited
Boveng, P. L., Bengtson, J. L., Cameron, M. F., Dahle, S. P., Logerwell, E. A., London, J. M., Overland, J. E.,
Sterling, J. T., Stevenson, D. E., Taylor, B. L., & Ziel, H. L. (2013). Status review of the ribbon seal.
(NOAA Technical Memorandum NMFS-AFSC-255). Seattle, WA: Alaska Fisheries Science Center,
National Marine Fisheries Service.
Bowen, B. W., F. A. Abreu-Grobois, G. H. Balazs, N. Kamezaki, C. J. Limpus, & R. J. Ferl. (1995). Trans-
Pacific Migrations of the Loggerhead Turtle (Caretta caretta) Demonstrated with Mitochondrial
DNA Markers. Proceedings of the National Academy of Sciences of the United States of
America, 92(9), 3731-3734.
Bowen, D. W., C. A. Beck, & D. A. Austin. (2009). Pinniped ecology. In W. F. Perrin, B. Würsig, & J. G. M.
Thewissen (Eds.), Encyclopedia of marine mammals (pp. 852-861). San Diego, CA: Academic
Press.
Bradford. A. L., Forney, K. A., Oleson, E. M., & Barlow, J. (2013). Line-transect abundance estimates of
cetaceans in the Hawaiian EEZ. (PIFSC Working Paper WP-13-004; PSRG-2013-18). Honolulu, HI:
Pacific Islands Fishery Science Center, National Marine Fisheries Service.
Bradford, A. L., Forney, K. A., Oleson, E. M., & Barlow, J. (2014). Accounting for subgroup structure in
line-transect abundance estimates of false killer whales (Pseudorca crassidens) in Hawaiian
waters. PLoS ONE 9(2), e90464. doi:10.1371/journal.pone.0090464.
Bradford, A. L., Oleson, E. M., Baird, R. W., Boggs, C. H., Forney, K. A., & Young, N. C. (2015). Revised
stock boundaries for false killer whales (Pseudorca crassidens) in Hawaiian waters. (NOAA
Technical Memorandum NOAA-TM-NMFS-PIFSC-47). Honolulu, HI: Pacific Islands Fishery
Science Center, National Marine Fisheries Service.
Bradford, A. L., Forney, K. A., Oleson, E. M., & Barlow, J. (2017). Abundance estimates of cetaceans from
a line-transect survey within the U.S. Hawaiian Island exclusive economic zone. Fishery Bulletin, 115, 129-142.
Branch, T. A., & Butterworth, D. S. (2001). Estimates of abundance south of 60°S for cetacean species
sighted frequently on the 1978/79 to 1997/98 IWC/IDCR-SOWER sighting surveys. Journal of
Cetacean Research and Management, 3(3), 251-270.
Branch, T. A., K. M. Stafford, D. M. Palacios, C. Allison, J. L. Bannister, C. L. K. Burton, E. Cabrera, C. A.
Carlson, B. G. vernazzani, P. C. Gill, R. Hucke-gaete, K. C. S. Jenner, M.-N. M. Jenner, K.
Matsuoka, Y. A. Mikhalev, T. Miyashita, M. G. Morrice, S. Nishiwaki, V. J. Sturrock, D. Tormosov,
R. C. Anderson, A. N. Baker, P. B. Best, P. Borsa, R. L. B. jr, S. Childerhouse, K. P. Findlay, T.
Gerrodette, A. D. Ilangakoon, M. Joergensen, B. Kahn, D. K. Ljungblad, B. Maughan, R. D.
Mccauley, S. Mckay, T. F. Norris, Oman whale and dolphin research group, S. Rankin, F.
Samaran, D. Thiele, K. V. Waerebeek, & R. M. Warneke. (2007). Past and present distribution,
densities and movements of blue whales Balaenoptera musculus in the Southern Hemisphere
and northern Indian Ocean. Mammal Review, 37(2), 116–175. doi:10.1111/j.1365-
2907.2007.00106.x.
Braulik, G. T., S. Ranjbar, F. Owfi, T. Aminrad, S. M. H. Dakhteh, E. Kamrani, & F. Mohsenizadeh. (2010).
Marine mammal records from Iran. Journal of Cetacean Research and Management, 11(1), 49-
63.

LOA and Rulemaking Application Under the MMPA for Use of SURTASS LFA Sonar
15-8 Literature Cited
Brown, D. H., D. K. Caldwell, & M. C. Caldwell. (1966). Observations on the behavior of wild and captive
false killer whales, with notes on associated behavior of other genera of captive delphinids. Los
Angeles County Museum Contributions in Science, 95, 1-32.
Brownell, R. L., Jr., & C. Chun. (1977). Probable existence of the Korean stock of the gray whale
(Eschrichtius robustus). Journal of Mammalogy, 58(2), 237-239.
Buccowich, J. (2014). Fin whale song variability in the Southern California Bight, from 2008 through
2012. Master’s thesis, University of California, San Diego, CA. Viewed at
<https://escholarship.org/uc/item/6741g38s>.
Buckland, S.T., Cattanach, K. L., & Miyashita, T. (1992). Minke whale abundance in the northwest Pacific
and the Okhotsk Sea, estimated from 1989 and 1990 sighting surveys. Report of the
International Whaling Commission, 42, 387-392.
Buckland, S.T., Cattanach, K. L., and Hobbs, R. C. (1993). Abundance estimates of Pacific white-sided
dolphin, northern right whale dolphin, Dall's porpoise and northern fur seal in the North Pacific,
1987-1990. International North Pacific Fisheries Commission Bulletin, 53, 387-407.
Burkanov, V. (2017). Results of breeding season Steller sea lion pup surveys in Russia, 2011-2016.
Memorandum to T. Gelatt and J. Bengston, April 6, 2017. Retrieved from
<https://www.afsc.noaa.gov/nmml/PDF/SSLRussiaPupCountsMemo2017.pdf>.
Buscaino, G., Buffa, G., Filiciotto, F., Maccarrone, V., Di Stefano, V., Ceraulo, M., Mazzola, S., & Alonge,
G. (2015). Pulsed signal properties of free-ranging bottlenose dolphins (Tursiops truncatus) in
the central Mediterranean Sea. Marine Mammal Science, 31(3), 891-901.
doi:10.1111/mms.12194.
Busnel, R. G., & A. Dzeidzic. (1966). Acoustic signals of the pilot whale Globicephala melaena and of the
porpoises Delphinus delphis and Phocoena phocoena. Pages 606-646 in Whales, dolphins and
porpoises. Los Angeles, CA: University of California Press.
Busnel, R. G., and Z. Dziedzic. (1968). Caracteristiques physiques des signaux acoustiques de pseudorca
crassidens owen (cetaces odontocetes). Extrait de Mammalia, 32(1), 1-5.
Calambokidis, J. (2013). Updated abundance estimates of blue and humpback whales off the US west
coast incorporating photo-identifications from 2010 and 2011. Document PSRG-2013-13
presented to the Pacific Scientific Review Group, April 2013, Southwest Fisheries Science Center,
National Marine Fisheries Service.
Calambokidis, J., Falcone, E. A., Quinn, T. J., Burdin, A. M., Clapham, P. J., Ford, J.K.B., Gabriele, C.M.,
Leduc, R., Mattila, D., Rojas-Bracho, L., Straley, J. M., Taylor, B.L., Urbán R., J., Weller, D.,
Witteveen, B.H., Yamaguchi, M., Bendlin, A., Camacho, D., Flynn, K., Havron, A., Huggins, J., &
Maloney, N. (2008a). SPLASH: Structure of populations, levels of abundance and status of
humpback whales in the North Pacific. (Final report for Contract AB133F-03-RP-00078, Report
prepared for U.S. Department of Commerce, Western Administrative Center, Seattle,
Washington). Olympia, WA: Cascadia Research.
Calambokidis, J., G.S. Schorr, G.H. Steiger, J. Francis, M. Bakhtiari, G. Marshal, . . . Robertson, K. (2008b).
Insights into the underwater diving, feeding, and calling behavior of blue whales from a
suction-cup-attached video-imaging tag (CRITTERCAM). Marine Technology Society Journal,
41(4), 19-29.
LOA and Rulemaking Application Under the MMPA for Use of SURTASS LFA Sonar
15-9 Literature Cited
Calderan, S., B. Miller, K. Collins, P. Ensor, M. Double, R. Leaper, & J. Barlow. (2014). Low-frequency
vocalizations of sei whales (Balaenoptera borealis) in the Southern Ocean. The Journal of the
Acoustical Society of America, 136(6), EL418-EL423. doi:10.1121/1.4902422.
Caldwell, D. K., and M. C. Caldwell. (1989). Pygmy sperm whale Kogia breviceps (de Blainville, 1838):
Dwarf sperm whale Kogia simus Owen, 1866 Handbook of marine mammals, Vol. 4: River
dolphins and the larger toothed whales (pp. 234-260): Academic Press.
Caldwell, M. C., and D. K. Caldwell. (1969). Simultaneous but different narrow-band sound emissions by
a captive eastern Pacific pilot whale, Globicephala scammoni. Mammalia, 33, 505-508.
Carder, D., S. H. Ridgway, B. Whitaker, and J. Geraci. (1995). Hearing and echolocation in a pygmy sperm
whale Kogia. Paper presented at the 11th biennial conference on the biology of marine
mammals, Orlando, FL.
Carretta, J. V., Forney, K. A., Oleson, E., Martien, K., Muto, M. M., Lowry, M. S., Barlow, J., Baker, J.,
Hanson, B., Lynch, D., Carswell, L., Brownell, Jr., R. L., Robbins, R., Mattila, D. K., Ralls, K., & Hill,
M. C. (2011). U.S. Pacific marine mammal stock assessments: 2010. (NOAA-TM-NMFS-SWFSC-
476). La Jolla, CA: Southwest Fisheries Science Center, National Marine Fisheries.
Carretta, J. V., Oleson, E., Weller, D. W., Lang, A. R., Forney, K. A., Baker, J., Hanson, B., Martien, K.,
Muto, M. M., Orr, A. J., Huber, H., Lowry, M. S., Barlow, J., Lynch, D., Carswell, L., Brownell, Jr,
R. L., & Mattila, D. K. (2014). U.S. Pacific Marine Mammal Stock Assessments, 2013. (NOAA-TM-
NMFS-SWFSC-532). LaJolla, CA: Southwest Fisheries Science Center, National Marine Fisheries
Service.
Carretta, J. V., Oleson, E. M., Weller, D. W. , Lang, A. R., Forney, K. A., Baker, J., Muto, M. M., Hanson, B.,
Orr, A. J., Huber, H., Lowry, M. S., Barlow, J., Moore, J. E., Lynch, D., Carswell, L., & Brownell, Jr.,
R. L. (2015). U.S. Pacific Marine Mammal Stock Assessments: 2014. (NOAA-TM-NMFS-SWFSC-
549). LaJolla, CA: Southwest Fisheries Science Center, National Marine Fisheries Service.
doi:10.7289/V5/TM-SWFSC-549.
Carretta, J. V., Oleson, E. M., Baker, J., Weller, D. W. , Lang, A. R., Forney, K. A., Muto, M. M., Hanson, B.,
Orr, A. J., Huber, H., Lowry, M. S., Barlow, J., Moore, J. E., Lynch, D., Carswell, L., & Brownell, Jr.,
R. L. (2016). U.S. Pacific Marine Mammal Stock Assessments: 2015. (NOAA-TM-NMFS-SWFSC-
561). LaJolla, CA: Southwest Fisheries Science Center, National Marine Fisheries Service.
doi:10.7289/V5/TM-SWFSC-561.
Carretta, J. V., Oleson, E. M., Forney, K. A., Baker, J., Moore, J. E., Weller, D. W., Lang, A. R., Muto, M. M.,
Hanson, B., Orr, A. J., Huber, H., Lowry, M. S., Barlow, J., Lynch, D., Carswell, L., & Brownell, Jr.,
R. L. (2018). Draft U.S. marine mammal stock assessment report: 2017. NOAA Technical
Memorandum NOAA-TM-NMFS-SWFSC-XXX. LaJolla, CA: Southwest Fisheries Science Center,
National Marine Fisheries Service.
Carroll, E. L., W. J. Rayment, A. M. Alexander, C. S. Baker, N. J. Patenaude, D. Steel, R. Constantine, R.
Cole, L. J. Boren, and S. Childerhouse. (2014). Reestablishment of former wintering grounds by
New Zealand southern right whales. Marine Mammal Science, 30(1), 206-220.
doi:10.1111/mms.12031.

LOA and Rulemaking Application Under the MMPA for Use of SURTASS LFA Sonar
15-10 Literature Cited
Carroll, A.G., Przeslawski, R., Duncan, A., Gunning, M., & Bruce, B. (2017). A critical review of the
potential impacts of marine seismic surveys on fish and invertebrates. Marine Pollution Bulletin
114, 9-24. doi: 10.1016/j.marpolbul.2016.11.038.
Castellote, M., C. W. Clark, & M. O. Lammers. (2012). Acoustic and behavioural changes by fin whales
(Balaenoptera physalus) in response to shipping and airgun noise. Biological Conservation,
147(1), 115-122. doi:10.1016/j.biocon.2011.12.021.
Cerchio, S., B. Andrianantenaina, A. Lindsay, M. Rekdahl, N. Andrianarivelo, & T. Rasoloarijao. (2015).
Omura’s whales (Balaenoptera omurai) off northwest Madagascar: Ecology, behaviour and
conservation needs. Royal Society Open Science, 2(10), 150301. doi:10.1098/rsos.150301.
Cerchio, S., S. Strindberg, T. Collins, C. Bennett, & H. Rosenbaum. (2014). Seismic Surveys Negatively
Affect Humpback Whale Singing Activity off Northern Angola. PLoS ONE, 9(3), e86464.
doi:10.1371/journal.pone.0086464.
Charif, R. A., D. K. Mellinger, K. J. Dunsmore, & C. W. Clark. (2002). Estimated source levels of fin whale
(Balaenoptera physalus) vocalizations: Adjustments for surface interference. Marine Mammal
Science, 18(1), 81-98.
Charif, R. A., A. Rahaman, C. A. Muirhead, M. S. Pitzrick, A. M. Warde, J. Hall, C. Pyć, & C. W. Clark.
(2013). Bowhead whale acoustic activity in the southeast Beaufort Sea during late summer
2008–2010. The Journal of the Acoustical Society of America, 134(6), 4323.
doi:10.1121/1.4824679.
Cholewiak, D., S. Baumann-Pickering, & S. Van Parijs. (2013). Description of sounds associated with
Sowerby's beaked whales (Mesoplodon bidens) in the western North Atlantic Ocean. The
Journal of the Acoustical Society of America, 134(5), 3905-3912. doi:10.1121/1.4823843.
Christensen, I., Haug, T., & Oien, N. (1992). A review of feeding and reproduction in large baleen whales
(Mysticeti) and sperm whales Physeter macrocephalus in Norwegian and adjacent waters.
Fauna norvegica Series A, 13, 39-48.
Christiansen, F., N. M. Lynas, D. Lusseau, & U. Tscherter. (2015). Structure and dynamics of minke whale
surfacing patterns in the gulf of st. Lawrence, Canada. PLoS ONE, 10(5), e0126396.
doi:10.1371/journal.pone.0126396.
Chu, K. C. (1988). Dive times and ventilation patterns of singing humpback whales (Megaptera
novaeangliae). Canadian Journal of Zoology, 66(6), 1322-1327.
Cipriano, F. (2009). Atlantic white-sided dolphin Lagenorhynchus acutus. In W. F. Perrin, B. Würsig, & J.
G. M. Thewissen (Eds.), Encyclopedia of marine mammals (2nd ed.) (pp. 56-58). San Diego, CA:
Academic Press.
Cipriano, F. W. (1992). Behavior and occurrence patterns, feeding ecology, and life history of dusky
dolphins (Lagenorhynchus obscurus) off Kaikoura, New Zealand. (Ph.D.), University of Arizona.
Citta, J. J., R. S. Suydam, L. T. Quakenbush, K. J. Frost, & G. M. O’Corry-Crowe. (2013). Dive Behavior of
Eastern Chukchi Beluga Whales (Delphinapterus leucas), 1998 – 2008. Arctic, 66(4), 389-406.
Clapham, P. J. (2009). Humpback whale (Megaptera novaeangliae). In W. F. Perrin, B. Würsig, and J. G.
M. Thewissen (Eds.), Encyclopedia of marine mammalss (pp. 582-585 ). San Diego, CA:
Academic Press.

LOA and Rulemaking Application Under the MMPA for Use of SURTASS LFA Sonar
15-11 Literature Cited
Clapham, P. J., L. S. Baraff, C. A. Carloson, M. A. Christian, D. K. Matilla, C. A. Mayo, M. A. Murphy, & S.
Pittman. (1993). Seasonal occurrence and annual return of humpback whales, Megaptera
novaeangliae, in the southern Gulf of Maine. Canadian Journal of Zoology, 71, 440-443.
Clapham, P. J., & Mattila, D. K. (1990). Humpback whale songs as indicators of migration routes. Marine
Mammal Science, 6(2), 155-160.
Clark, C. W. (1980). A real-time direction finding device for determining the bearing to the underwater
sounds of Southern Right Wales, Eubalaena australis. The Journal of the Acoustical Society of
America, 68(2), 508-511.
Clark, C. W. (1982). The acoustic repertoire of the Southern right whale, a quantitative analysis. Animal
Behaviour, 30(4), 1060-1071.
Clark, C. W. (1983). Acoustic communication and behavior of the southern right whale (Eubalaena
australis). In R. Payne (Ed.), Communication and behavior of whales (pp. 163-198). Boulder,
Colorado: Westview Press.
Clark, C. W. (1990). Acoustic behavior of mysticete whales. In J. Thomas and R. Kastelein (Eds.), Sensory
abilities of cetaceans (pp. 580-583). Plenum Press.
Clark, C. W., J. F. Borsani, & G. Notarbartolo di Sciara. (2002). Vocal activity of fin whales, Balaenoptera
physalus, in the Ligurian Sea. Marine Mammal Science, 18(1), 286-295.
Clark, C. W., & P. J. Clapham. (2004). Acoustic monitoring on a humpback whale (Megaptera
novaeangliae) feeding ground shows continual singing into late spring. Proceedings of the Royal
Society of London Part B, 271(1543), 1051-1057.
Clark, C. W., & W. T. Ellison. (2004). Potential use of low-frequency sounds by baleen whales for probing
the environment: evidence from models and empirical measurements. In J. A. Thomas, C. F.
Moss, and M. Vater (Eds.), Advances in the study of echolocation in bats and dolphins (pp. 564-
589): University of Chicago Press.
Clark, C. W., & K. Fristrup. (1997). Whales '95: A combined visual and acoustic survey of blue and fin
whales off southern California. Reports of the International Whaling Commission, 47, 583-600.
Clark, C. W., Tyack, P., & Ellison, W. T. (1999). Technical Report 1: Low frequency sound scientific
research program technical report (responses of four species of whales to sounds of SURTASS
LFA sonar transmissions). Report for the U.S. DoN. Included in Overseas environmental impact
statement and environmental impact statement for Surveillance Towed Array Sensor System
Low Frequency Active (SURTASS LFA) sonar.
Clarke, M. R. (1976). Observations on sperm whale diving. Journal of the Marine Biological Association of
the United Kingdom, 56, 809-810.
Cole, T. V. N., P. Hamilton, A. G. Henry, P. Duley, R. M. Pace, B. N. White, and T. Frasier. (2013). Evidence
of a North Atlantic right whale Eubalaena glacialis mating ground. Endangered Species
Research, 21(1), 55-64. doi:10.3354/esr00507
Conn, P. B., Ver Hoef, J. M., McClintock, B. T., Moreland, E. E., London, J. M., Cameron, M. F., Dahle, S.
P., & Boveng, P. L. (2014). Estimating multispecies abundance using automated detection
systems: Ice-associated seals in the Bering Sea. Methods in Ecology and Evolution 5, 1280-1293.
doi: 10.1111/2041-210X.12127.
LOA and Rulemaking Application Under the MMPA for Use of SURTASS LFA Sonar
15-12 Literature Cited
Cook, M. L. H., C. A. Manire, & D. A. Mann. (2005). Auditory evoked potential (AEP) measurements in
stranded rough-toothed dolphins (Steno bredanensis). The Journal of the Acoustical Society of
America, 117(4), 2441.
Cooke, J. G., Weller, D. ., Bradford, A. L., Sychenko, O. A., Burdin, A. M. and Brownell, R. L., Jr. (2013).
Population assessment of the Sakhalin gray whale aggregation. (Paper SC/65a/BRG27
presented to the International Whaling Commission Scientific Committee). Retrieved from
<http://www.iwcoffice.org/>.
Corkeron, P. J., & Van Parijs, S. M. (2001). Vocalizations of eastern Australian Risso's dolphins, Grampus
griseus. Canadian Journal of Zoology, 79(1), 160-164.
Costa, D., & Gales, N. (2000). Foraging energetics and diving behavior of lactating New Zealand sea lions,
Phocarctos hookeri. Journal of Experimental Biology, 203(23), 3655-3665.
Costa, D. P., & Gales, N. J. (2003). Energetics of a benthic diver: Seasonal foraging ecology of the
Australian sea lion, Neophoca cinerea. Ecological Monographs, 73(1), 27-43.
Courbis, S., Baird, R. W., Cipriano, F., & Duffield, D. (2014). Multiple populations of pantropical spotted
dolphins in Hawaiian waters. 2014. Journal of Heredity, 105(5), 627-614.
Crance, J. L., Berchok, C. L., & Keating, J. L. (2017). Gunshot call production by the North Pacific right
whale Eubalaena japonica in the southeastern Bering Sea. Endangered Species Research, 34,
251-267.
Cribb, N., C. Miller, and L. Seuront. (2013). Indo-Pacific bottlenose dolphin (Tursiops aduncus) habitat
preference in a heterogeneous, urban, coastal environment. Aquatic Biosystems, 9(3), 1-9.
Crocker, D. E., Gales, N.J., & Costa, D. P. (2001). Swimming speed and foraging strategies of New Zealand
sea lions (Phocarctos hookeri). Journal of Zoology, 254, 267-277.
Croll, D. A., Acevedo-Gutierrez, A., Tershy, B. R., & Urban-Ramirez, J. (2001a). The diving behavior of blue
and fin whales: is dive duration shorter than expected based on oxygen stores? Comparative
Biochemistry and Physiology—Part A: Molecular & Integrative Physiology, 129(4), 797-809.
Croll, D. A., Clark, C. W., Acevedo, A., Tershy, B., Floress, S., Gedamke, J., & Urban, J. (2002). Only male
fin whales sing loud songs. Nature, 417, 809.
Croll, D. A., Clark, C. W., Calambokidis, J., Ellison, W. T., & Tershy, B. R. (2001b). Effect of anthropogenic
low-frequency noise on the foraging ecology of Balaenoptera whales. Animal Conservation,
4(1), 13-27.
Cruickshank, R. A., & Brown, S. G. (1981). Recent observations and some historical records of southern
right-whale dolphins Lissodelphis peronii. Fishery Bulletin of South Africa, 15, 109-121.
Cummings, W. C. (1985). Bryde's whale Balaenoptera edeni Anderson, 1878. In S. H. Ridgway and R.
Harrison (Eds.), Handbook of marine mammals, Vol. 3: The sirenians and baleen whales (pp.
137-154). London: Academic Press.
Cummings, W. C., & Holliday, D. V. (1987). Sounds and source levels from bowhead whales off Pt.
Barrow, Alaska. The Journal of the Acoustical Society of America, 82(3), 814-821.
Cummings, W. C., & Thompson, P. O. (1971). Underwater sounds from the blue whale, Balaenoptera
musculus. The Journal of the Acoustical Society of America, 50(4 (Part 2)), 1193-1198.

LOA and Rulemaking Application Under the MMPA for Use of SURTASS LFA Sonar
15-13 Literature Cited
Cummings, W. C., Fish, J. F., & Thompson, P. O. (1972). Sound production and other behavior of
southern right whales, Eubalena glacialis. San Diego Society of Natural History Transactions,
17(1), 1-14.
Cummings, W. C., Holliday, D. V., & Graham, B. J. (1981) Measurements and localization of underwater
sounds from the Prudhoe Region, Alaska, March, 1981. A report to OCSEAP, Arctic Project
Office, and the Alaska Eskimo Whaling Commission. Tracer Document T-82-SD-001. 50 pages.
Cummings, W. C., Holliday, D. V., & Lee, B. J. (1984). Potential impacts of manmade noise on ringed
seals: Vocalizations and reactions. Outer Continental Shelf Environmental Assessment Program,
Final Report. OCS Study MMS 86-0021; NTIS PB87-107546. Anchorage, AK: NOAA.
Cunningham, K. A., Southall, B. L., & Reichmuth, C. (2014). Auditory sensitivity of seals and sea lions in
complex listening scenarios. The Journal of the Acoustical Society of America, 136(6), 3410.
doi:10.1121/1.4900568.
D'Vincent, C. G., Nilson, R. M., & Hanna, R. E. (1985). Vocalization and coordinated feeding behavior of
the humpback whale Megaptera novaeangliae in southeastern Alaska USA. Scientific Reports to
the Whales Research Instititue of Tokyo, 0(36), 41-48.
Dahlheim, M. E., & Ljungblad, D. K. (1990). Preliminary hearing study on gray whales Eschrichtius
robustus in the field. In J. Thomas and R. Kastelein (Eds.), Sensory abilities of cetaceans (pp.
335-346). New York: Plenum Press.
Dahlheim, M. E., A. Schulman-Janiger, N. Black, R. Ternullo, D. Ellifritt, and K. C. Balcomb, III. (2008).
Eastern temperate North Pacific offshore killer whales (Orcinus orca): Occurrence, movements,
and insights into feeding ecology. Marine Mammal Science, 24(3), 719-729.
Dalebout, M. L., Robertson, K. M., Frantzis, A., Engelhaupt, D. A. N., Mignucci-Giannoni, A. A., Rosario-
Delestre, R. J., & Baker, C. S. (2005). Worldwide structure of mtDNA diversity among Cuvier's
beaked whales (Ziphius cavirostris): Implications for threatened populations. Molecular
Ecology, 14, (11), 3353-3371.
Dalebout, M. L., Baker, C. S., Steel, D., Thompson, K., Robertson, K. M., Chivers, S. J., Perrin, W. F.,
Goonatilake, M., Anderson, R. C., Mead, J. G., Potter, C. W., Thompson, L., Jupiter, D., and
Yamada, T. K. (2014). Resurrection of Mesoplodon hotaula Deraniyagala 1963: A new species of
beaked whale in the tropical Indo-Pacific. Marine Mammal Science, 30(3), 1081-1108.
Dares, L. E., Hoffman, J. M., Yang, S. C., & Wang, J. Y. (2014). Habitat characteristics of the critically
endangered Taiwanese humpback dolphins (Sousa chinensis) of the Eastern Taiwan Strait.
Aquatic Mammals, 40(4), 368-374. Doi:10.1578/AM.40.4.2014.368.
Davies, C. E., Kovacs, K. M., Lydersen, C., & Van Parijs, S. M. (2006). Development of display behavior in
young captive bearded seals. Marine Mammal Science, 22(4), 952-965. Retrieved from
<http://www.blackwell-synergy.com/doi/abs/10.1111/j.1748-7692.2006.00075.x>.

LOA and Rulemaking Application Under the MMPA for Use of SURTASS LFA Sonar
15-14 Literature Cited
Davis, R., Fuiman, L., Williams, T., Le Boeuf, B. (2001). Three-dimensional movements and swimming
activity of a northern elephant seal. Comparative Biochemistry and Physiology Part A, 129, 759-
770.
Davis, R. W. (2010, 1 December). [Personal communication via email between Dr. Randall W. Davis,
Texas A&M University at Galveston, Galveston, Texas, and Ms. Cheryl Schroeder, Marine
Acoustics, Inc., Arlington, Virginia,].
Davis, R. W., N. Jaquet, D. Gendron, U. Markaida, G. Bazzino, and W. Gilly. (2007). Diving behavior of
sperm whales in relation to behavior of a major prey species, the jumbo squid, in the Gulf of
California, Mexico. Marine Ecology Progress Series, 333, 291-302.
Dawbin, W. H., and D. H. Cato. (1992). Sounds of a pygmy right whale Caperea marginata. Marine
Mammal Science, 8(3), 213-219.
Dawson, S., J. Barlow, and D. Ljungblad. (1998). Sounds recorded from Baird's beaked whale, Berardius
bairdii. Marine Mammal Science, 14(2), 335-344.
Dawson, S. M. (2009). Cephalorhynchus Dolphins C. heavisidii, C. eutropia, C. hectori, and C.
commersonii. In W. F. Perrin, B. Würsig, and J. G. M. Thewissen (Eds.), Encyclopedia of marine
mammals (pp. 191-196): Academic Press.
De Boer, M. N. (2000). A note on cetacean observations in the Indian Ocean Sanctuary and the South
China Sea, Mauritius to the Philippines, April 1999. Journal of Cetacean Research and
Management, 2(3), 197-200.
De Boer, M. N., Baldwin, R., Burton, C. L. K., Eyre, E. L., Jenner, K. C. S., Jenner, M.-N. M., . . . Simmonds,
M. P., (Eds). (2003). Cetaceans in the Indian Ocean Sanctuary: A review. Wiltshire, United
Kingdom: Whale and Dolphin Conservation Society.
de Freitas, M., F. H. Jensen, J. Tyne, L. Bejder, and P. T. Madsen. (2015). Echolocation parameters of
Australian humpback dolphins (Sousa sahulensis) and Indo-Pacific bottlenose dolphins (Tursiops
aduncus) in the wild. The Journal of the Acoustical Society of America, 137(6), 3033.
doi:10.1121/1.4921277.
de Vos, A., F. Christiansen, R. G. Harcourt, and C. B. Pattiaratchi. (2013). Surfacing characteristics and
diving behaviour of blue whales in Sri Lankan waters. Journal of Experimental Marine Biology
and Ecology, 449, 149-153. doi:10.1016/j.jembe.2013.09.010.
de Vos, A., C. Pattiaratchi, and R. Harcourt. (2014). Inter-Annual Variability in Blue Whale Distribution off
Southern Sri Lanka between 2011 and 2012. Journal of Marine Science and Engineering, 2(3),
534-550. doi:10.3390/jmse2030534.
Delarue, J., M. Laurinolli, & B. Martin. (2009). Bowhead whale (Balaena mysticetus) songs in the Chukchi
Sea between October 2007 and May 2008. The Journal of the Acoustical Society of America,
126(6), 3319-3328.
Delarue, J., B. Martin, & D. Hannay. (2013). Minke whale boing sound detections in the northeastern
Chukchi Sea. Marine Mammal Science, 29(3), E333-E341. doi:10.1111/j.1748-
7692.2012.00611.x.
LOA and Rulemaking Application Under the MMPA for Use of SURTASS LFA Sonar
15-15 Literature Cited
Dendrinos, P., A. A. Karamanlidis, E. Androukaki, and B. J. McConnell. (2007). Diving development and
behavior of a rehabilitated Mediterranean monk seal (Monachus monachus). Marine Mammal
Science, 23(2), 387-397. doi:10.1111/j.1748-7692.2007.00115.x.
Dennison, S., M. J. Moore, A. Fahlman, K. Moore, S. Sharp, C. T. Harry, J. Hoppe, M. Niemeyer, B. Lentell,
& R. S. Wells. (2012). Bubbles in live-stranded dolphins. Proceedings of the Royal Society B:
Biological Sciences, 279(1732), 1396-1404.
Department of the Navy (DoN). (2001). Final overseas environmental impact statement and
environmental impact statement for Surveillance Towed Array Sensor System Low Frequency
Active (SURTASS LFA) sonar. Washington, DC: Chief of Naval Operations, Department of the
Navy. <http://www.surtass-lfa-eis.com/wp-content/uploads/2018/02/FEIS-Vol-I.pdf>.
DoN. (2006). Application for letters of authorization under Section 101 (a)(5)(A) of the Marine Mammal
Protection Act for activities associated with the employment of Surveillance Towed Array
Sensor System Low Frequency Active (SURTASS LFA) sonar. Washington, D.C.: Chief of Naval
Operations.
DoN. (2007). Final supplemental environmental impact statement for Surveillance Towed Array Sensor
System Low Frequency Active (SURTASS LFA) sonar. Washington, D.C.: Chief of Naval
Operations, Department of the Navy. <http://www.surtass-lfa-eis.com/wp-
content/uploads/2018/02/SURTASS_LFA_FSEIS.pdf>.
DoN. (2011). Application for letters of authorization under Section 101 (a)(5)(A) of the Marine Mammal
Protection Act for activities associated with the employment of Surveillance Towed Array
Sensor System Low Frequency Active (SURTASS LFA) sonar. Washington, D.C.: Chief of Naval
Operations.
DoN. (2012). Final supplemental environmental impact statement/supplemental overseas
environmental impact statement for Surveillance Towed Array Sensor System Low Frequency
Active (SURTASS LFA) sonar. Washington, D.C.: Chief of Naval Operations, Department of the
Navy. <http://www.surtass-lfa-eis.com/wp-content/uploads/2018/02/SURTASS_LFA_FSEIS-
SOEIS.pdf>.
DoN. (2015). Final supplemental environmental impact statement/supplemental overseas
environmental impact statement for Surveillance Towed Array Sensor System Low Frequency
Active (SURTASS LFA) sonar. Washington, D.C.: Chief of Naval Operations, Department of the
Navy.
DoN. (2017a). Final supplemental environmental impact statement/supplemental overseas
environmental impact statement for Suveillance Towed Array Sensor System Low Frequency
Active (SURTASS LFA) sonar. Washington, D.C.: Chief of Naval Operations, Department of the
Navy. <http://www.surtass-lfa-eis.com/wp-content/uploads/2018/02/Navy_SURTASS-
LFA_FSEIS-SOEIS.pdf>.
DoN. (2017b). Draft environmental impact statement/overseas environmental impact statement for
Hawaii-Southern California training and testing. San Diego, CA: Pacific Fleet.
LOA and Rulemaking Application Under the MMPA for Use of SURTASS LFA Sonar
15-16 Literature Cited
DoN. (2018a). Draft supplemental environmental impact statement/supplemental overseas
environmental impact statement for Suveillance Towed Array Sensor System Low Frequency
Active (SURTASS LFA) sonar. Washington, D.C.: Chief of Naval Operations, Department of the
Navy.
DoN. (2018b). Navy marine species density database. Geospatial global database. Accessed May 2018. Chief of Naval Operations, DoN.
Díaz López, B. (2011). Whistle characteristics in free-ranging bottlenose dolphins (Tursiops truncatus) in
the Mediterranean Sea: Influence of behaviour. Mammalian Biology-Zeitschrift fur
Saugetierkunde, 76(2), 180-189. doi:10.1016/j.mambio.2010.06.006.
Diercks, K.J., R.T. Trochta, C.F. Greenlaw, & W.E Evans. (1971). Recording and analysis of dolphin
echolocation signals. The Journal of the Acoustical Society of America 49(1A):135-135.
Diercks, K.J., R.T. Trochta, & W.E. Evans. (1973). Delphinid sonar: Measurement and analysis.The Journal
of the Acoustical Society of America 54(1):200-204.
Dolar, M. L. (2005). Cetaceans of American Samoa. Pago Pago, American Samoa: Department of Marine
and Wildlife Resources, Government of American Samoa.
Dolar, M.L.L. (2009). Frasier's dolphin (Lagenodelphis hosei). Pages 469-471 in W.F. Perrin, B.G. Wursig,
and J.G.M. Thewissen, eds. Encyclopedia of marine mammals, 2nd Edition. San Diego,
California: Academic Press.
Dolar, M. L. L., Walker, W. A., Kooyman, G. L., & Perrin, W. F. (2003). Comparative feeding ecology of
spinner dolphins (Stenella longirostris) and Fraser's dolphins (Lagenodelphis hosei) in the Sulu
Sea. Marine Mammal Science, 19(1), 1-19.
Dolar, M.L.L., W.F. Perrin, B.L. Taylor, G.L. Kooyman, & M.N.R. Alava. (2006). Abundance and
distributional ecology of cetaceans in the central Philippines. Journal of Cetacean Research and
Management, 8(1), 93-111.
Dolphin, W.F. (1987). Dive behavior and estimated energy expenditure of foraging humpback whales in
southeast Alaska. Canadian Journal of Zoology 65(2):354-362.
Donahue, M., & Perryman, W. L. (2009). Pygmy killer whale Feresa attenuata. In W. F. Perrin, B. Würsig,
and J. G. M. Thewissen (Eds.), Encyclopedia of marine mammals, 2nd Ed (pp. 938-939). San
Diego, CA: Academic Press.
Donovan, G. P. (1991). A review of IWC stock boundaries. Report of the International Whaling
Commission, 0(0), 39-68.
Dorsey, E.M., S.J. Stern, A.R. Hoelzel, & J. Jacobsen. (1990). Minke whales (Balaenoptera acutorostrata)
from the west coast of North America: Individual recognition and small-scale site fidelity.
Special Report of the International Whaling Commission Special Issue, 12,357-368.
dos Santos, M. E., Caporin, G., Moreira, H., Ferreira, A. J., & Coelho, J. L. B. (1990). Acoustic behavior in a
local population of bottlenose dolphins. In J. Thomas & R. Kastelein (Eds.), Sensory abilities of
cetaceans (pp. 585- 598). New York, NY.: Plenum Press.

LOA and Rulemaking Application Under the MMPA for Use of SURTASS LFA Sonar
15-17 Literature Cited
Double, M. C., V. Andrews-Goff, C. Jenner, M.-N. Jenner, S. M. Laverick, T. A. Branch, and N. J. Gales.
(2014). Migratory Movements of Pygmy Blue Whales (Balaenoptera musculus brevicauda)
between Australia and Indonesia as Revealed by Satellite Telemetry. PloS one, 9(4).
doi:10.1371/journal.pone.0093578.t001
Dragon, A. C., Bar-Hen,A., Monestiez, P., & Guinet, C. (2012). Horizontal and vertical movements as
predictors of foraging success in a marine predator. Marine Ecology Progress Series, 447, 243-
257. doi:10.3354/meps09498.
Dunlop, R. A., D. H. Cato, & M. J. Noad. (2014). Evidence of a Lombard response in migrating humpback
whales (Megaptera novaeangliae). The Journal of the Acoustical Society of America, 136(1),
430. doi:10.1121/1.4883598.
Dunlop, R. A., D. H. Cato, M. J. Noad, & D. M. Stokes. (2013). Source levels of social sounds in migrating
humpback whales (Megaptera novaeangliae). The Journal of the Acoustical Society of America,
134(1), 706-714. doi:10.1121/1.4807828.
Dunlop, R. A., M. J. Noad, D. H. Cato, & D. Stokes. (2007). The social vocalization repertoire of east
Australian migrating humpback whales (Megaptera novaeangliae). The Journal of the
Acoustical Society of America, 122(5), 2893-2905.
Durban, J. W., & Pitman, R. L. (2012). Antarctic killer whales make rapid, round-trip movements to
subtropical waters: evidence for physiological maintenance migrations? Biology letters, 8(2),
274-277. doi:10.1098/rsbl.2011.0875.
Durban, J., Weller, D., Lang, A., & Perryman, W. (2013). Estimating gray whale abundance from shore-
based counts using a multilevel Bayesian model. Paper SC/65a/BRG02 presented to the IWC
Scientific Committee.
Dziedzic, A., & de Buffrenil, V. (1989). Acoustic signals of the Commerson's dolphin, Cephalorhynchus
commersonii, in the Kerguelen Islands. Journal of Mammalogy 70(2):449-452.
Edds, P.L. (1982). Vocalizations of the blue whale, Balaenoptera musculus, in the St. Lawrence River.
Journal of Mammalogy 63(2):345–347.
Edds, P. L. (1988). Characteristics of finback Balaenoptera physalus vocalizations in the St. Lawrence
Estuary. Bioacoustics, 1, 131-149.
Edds, P.L., D.K. Odell, & B.R Tershy. 1993. Vocalizations of a captive juvenile and free-ranging adult-calf
pairs of Bryde's whales, Balaenoptera edeni. Marine Mammal Science 9(3):269-284.
Edds-Walton, P. L. (1997). Acoustic communication signals of mysticete whales. Bioacoustics, 8(1-2), 47-
60.
Edds-Walton, P.L. (2000). Vocalizations of minke whales Balaenoptera acutorostrata in the St. Lawrence
Estuary. Bioacoustics 11(1):31-50.
Eguchi, T., & J.T. Harvey. (2005). Diving behavior of the Pacific harbor seal (Phoca vitulina richardii) in
Monterey Bay, California. Marine Mammal Science 21(2):283-295.
Ellison, W. T., & P. J. Stein. (1999, updated 2001). SURTASS LFA high frequency marine mammal
monitoring (HF/M3) system: System description and test and evaluation. Marine Acoustics, Inc.
and Scientific Solutions, Inc., 26 Nov 99. Retrieved from <http://www.surtass-lfa-
eis.com/docs/HF-M3%20Ellison%20Report%202-4a.pdf>.

LOA and Rulemaking Application Under the MMPA for Use of SURTASS LFA Sonar
15-18 Literature Cited
Ellison, W. T., B. L. Southall, C. W. Clark, & A. S. Frankel. (2012). A new context-based approach to assess
marine mammal behavioral responses to anthropogenic sounds. Conservation Biology, 26(1),
21-28.
Elwen, S. H., Reeb, D., Thornton, M., & Best, P. B. (2009). A population estimate of Heaviside's dolphins,
Cephalorhynchus heavisidii, at the southern end of their range. Marine Mammal Science, 25(1),
107-124.
Emek Inanmaz, Ö., Değirmenci, Ö., & Gücü, A. C. (2014). A new sighting of the Mediterranean Monk
Seal, Monachus monachus (Hermann, 1779), in the Marmara Sea (Turkey). Zoology in the
Middle East, 60(3), 278-280. doi:10.1080/09397140.2014.944438.
Erbe, C. (2002). Underwater noise of whale-watching boats and potential effects on killer whales
(Orcinus orca), based on an acoustic impact model. Marine Mammal Science 18(2):394-418.
Erbe, C., C. Reichmuth, K. Cunningham, K. Lucke, and R. Dooling. (2016). Communication masking in
marine mammals: A review and research strategy. Marine Pollution Bulletin, 103(1-2), 15-38.
Eskesen, I. G., Wahlberg, M., Simon, M., & Larsen, O. N. (2011). Comparison of echolocation clicks from
geographically sympatric killer whales and long-finned pilot whales (L). The Journal of the
Acoustical Society of America, 130(1), 9. doi:10.1121/1.3583499.
Evans, P. G. H. (1987). The natural history of whales and dolphins. New York, NY: Facts on File
Publications.
Evans, P. G. H., & Raga, J. A. (2001). Marine mammals: Biology and conservation. New York, NY: Kluwer
Academic/Plenum Publishers.
Evans, W. E. (1971). Orientation behavior of delphinids: Radio telemetric studies. Annals of the New York
Academy of Sciences, 188, 142-160.
Evans, W. E. (1973). Echolocation by marine delphinids and one species of fresh-water dolphin. The
Journal of the Acoustical Society of America 54(1):191-199.
Evans, W. E. (1994). Common dolphin, white-bellied porpoise Delphinus delphis Linnaeus, 1758. Pages
191-224 in .H. Ridgeway and R. Harrison, eds. Handbook of marine mammals. Volume 5: The
first book of dolphins. New York, New York: Academic Press.
Evans, W. E., & Awbrey, F. T. (1984). High frequency pulses of Commerson's dolphin and Dall's porpoise.
American Zoologist 24(3):2A.
Evans, W. E., & Maderson, P. F. A. (1973). Mechanisms of sound production in delphinid cetaceans: a
review of some anatomical considerations. American Zoologist, 13, 1205-1213.
Falcone, E. A., Schorr, G. S., L.Watwood, S., DeRuiter, S. L., Zerbini, A. N., Andrews, R. D., . . . Moretti, D.
J. (2017). Diving behaviour of Cuvier’s beaked whales exposed to two types of military sonar.
Royal Society Open Science, 4, 170629. doi:http://dx.doi.org/10.1098/rsos.170629.
Farrokhrooz, M., Wage, K. E., Dzieciuch, M. A., & Worcester, P. F. (2017). Vertical line array
measurements of ambient noise in the North Pacific. The Journal of the Acoustical Society of
America, 141(3), 1571–1581. doi: 10.1121/1.4976706.

LOA and Rulemaking Application Under the MMPA for Use of SURTASS LFA Sonar
15-19 Literature Cited
Fedoseev, G. (2002). Ribbon seal, Histriophoca fasciata. Pages 1027-1030 in Perrin, W.F., B. Würsig and
J.G.M. Thewissen, editors. Encyclopedia of marine mammals. San Diego, California: Academic
Press.
Fedoseev, G. A. (2000). Population biology of ice‐associated forms of seals and their role in the northern
Pacific ecosystems. Center for Russian Environmental Policy, Russian Marine Mammal Council,
Moscow, Russia. 271 pages (Translated from Russian by I. E. Sidorova, 271 p.).
Fedoseev, G. A. (2009). Ribbon seal. Pages 955-958 in W.F. Perrin, B. Wursig, and J.G.M. Thewissen, eds.
Encyclopedia of marine mammals, 2nd ed. San Diego, California: Academic Press.
Félix, F., Castro, C, Laake, J., Haase, B., and Scheidat, M. (2011). Abundance and survival estimates of the
southeastern Pacific humpback whale stock from 1991-2006 photoidentification surveys in
Ecuador. Journal of Cetacean Research and Management (Special issue), (3), 301-307.
Ferguson, M. C., & Barlow, J. (2001). Spatial distribution and density of cetaceans in the eastern tropical
Pacific Ocean based on summer/fall research vessel surveys in 1986-1996. (NMFS-SWFSC
Administrative Report LJ-01-04). La Jolla, California: Southwest Fisheries Science Center,
National Marine Fisheries Service.
Ferguson, M. C., & Barlow, J. (2003). Addendum: Spatial distribution and density of cetaceans in the
eastern tropical Pacific Ocean based on summer/fall research vessel surveys in 1986-96. (NMFS-
SWFSC Administrative Report LJ-01-04, Addendum). La Jolla, California: Southwest Fisheries
Science Center, National Marine Fisheries Service.
Figueiredo, I., & C. R. Weir. (2014). Blue whales Balaenoptera musculus off Angola: recent sightings and
evaluation of whaling data. African Journal of Marine Science, 36(2), 269-278.
doi:10.2989/1814232x.2014.928652.
Figueiredo, L. (2014). Bryde’s Whale (Balaenoptera edeni) Vocalizations from Southeast Brazil. Aquatic
Mammals, 40(3), 225-231. doi:10.1578/am.40.3.2014.225.
Filatova, O. A., Ford, J. K., Matkin, C. O., Barrett-Lennard, L. G., Burdin, A. M., & Hoyt, E. (2012).
Ultrasonic whistles of killer whales (Orcinus orca) recorded in the North Pacific (L). The Journal
of the Acoustical Society of America, 132(6), 3618-3621. doi:10.1121/1.4764874.
Filatova, O. A., Guzeev, M. A., Fedutin, I. D., Burdin, A. M., & Hoyt, E. (2013). Dependence of killer whale
(Orcinus orca) acoustic signals on the type of activity and social context. Biology Bulletin, 40(9),
790-796. doi:10.1134/s1062359013090045.
Finley, K. J., Miller, G. W., Davis, R. A., and Koski, W. R. (1983). A distinctive large breeding population of
ringed seals (Phoca hispida) inhabiting the Baffin Bay pack ice. Arctic, 36, 162‐173.
Finneran, J. J. (2015). Auditory weighting functions and TTS/PTS exposure functions for cetaceans and
marine carnivores. Appendix A: Draft guidance for assessing the effects of anthropogenic sound
on marine mammal hearing: Underwater acoustic threshold levels for onset of permanent and
temporary threshold shifts. Silver Spring, MD: National Oceanic and Atmospheric
Administration.
Finneran, J.J., R. Dear, D.A. Carder, & S.H. Ridgway. (2003). Auditory and behavioral responses of
California sea lions (Zalophus californianus) to single underwater impulses from an arc-gap
transducer. The Journal of the Acoustical Society of America 114(3), 1667-1677.
LOA and Rulemaking Application Under the MMPA for Use of SURTASS LFA Sonar
15-20 Literature Cited
Finneran, J.J., D.S. Houser, B. Mase-Guthrie, R.Y. Ewing, & R.G. Lingenfelser. (2009). Auditory evoked
potentials in a stranded Gervais’ beaked whale (Mesoplodon europaeus). The Journal of the
Acoustical Society of America, 126(1), 484-490.
Finneran, J.J., C.E. Schlundt, R. Dear, D.A. Carder, & S.H. Ridgway. (2002). Temporary shift in masked
hearing thresholds in odontocetes after exposure to single underwater impulses from a seismic
watergun. The Journal of the Acoustical Society of America, 111(6), 2929-2940.
Fish, F. E., & Hui, C. A. (1991). Dolphin swimming—A review. Mammal Review, 21(4), 181-195.
Fish, F. E., Nicastro, A. J., & Weihs, D. (2006). Dynamics of the aerial maneuvers of spinner dolphins.
Journal of Experimental Biology, 209(4), 590-598.
Fish, J. F., & Turl, C. W. 1976. Acoustic source levels of four species of small whales. Naval Undersea
Center Report. San Diego, California: U.S. Naval Undersea Center.
Fitch, J. E., & Brownell, R. L. (1968). Fish otoliths in cetacean stomachs and their importance in
interpreting feeding habits. Journal of the Fisheries Research Board of Canada, 25(12), 2561–
2574.
Ford, J. K. B. (1989). Acoustic behaviour of resident killer whales (Orcinus orca) off Vancouver Island,
British Columbia. Canadian Journal of Zoology, 67(3), 727-745.
Ford, J. K. B. (2009). Killer whale (Orcinus orca). Pages 650-657 in W.F. Perrin, B. Wursig, and J.G.M.
Thewissen, eds. Encyclopedia of marine mammals, 2nd ed. San Diego, California: Academic
Press.
Ford, J. K. B., & Fisher, H. D. (1982). Killer whale (Orcinus orca) dialects as an indicator of stocks in British
Columbia. Report of the International Whaling Commission, 32, 671-679.
Ford, J. K. B., Durban, J. W., Ellis, G. M., Towers, J. R., Pilkington, J. F., Barrett-Lennard, L. G., & Andrews,
R. D. (2013). New insights into the northward migration route of gray whales between
Vancouver Island, British Columbia, and southeastern Alaska. Marine Mammal Science, 29,
325-337.
Forney, K. (2007). Preliminary estimates of cetacean abundance along the U.S. west coast and within
four National Marine Sanctuaries during 2005. (NOAA Technical Memorandum NOAA-TM-
NMFS-SWFSC-406). La Jolla, CA: Southwest Fisheries Science Center, National Marine Fisheries
Service.
Forney, K. A., & Wade, P. (2006). Worldwide distribution and abundance of killer whales. In J. A. Estes, R.
L. Brownell, D. P. DeMaster, D. F. Doak, & T. M. Williams (Eds.), Whales, whaling and ocean
ecosystems (pp. 145-162). Berkeley, CA: University of California Press.
Forney, K. A., Barlow, J. & Carretta, J. V. (1995). The abundance of cetaceans in California waters. Part II:
Aerial surveys in winter and spring of 1991 and 1992. Fishery Bulletin, 93, 15-26.
Forney, K. A., Becker, E. A., Foley, D. G., Barlow, J., & Oleson, E. M. (2015). Habitat-based models of
cetacean density and distribution in the central North Pacific. Endangered Species Research, 27,
1-20. doi: https://doi.org/10.3354/esr00632.
Fournet, M. E., A. Szabo, & D. K. Mellinger. (2015). Repertoire and classification of non-song calls in
Southeast Alaskan humpback whales (Megaptera novaeangliae). The Journal of the Acoustical
Society of America, 137(1), 1. doi:10.1121/1.4904504.

LOA and Rulemaking Application Under the MMPA for Use of SURTASS LFA Sonar
15-21 Literature Cited
Francis, J., Boness, D., & Ochoa-Acuna, H. (1998). A protracted foraging and attendance cycle in female
Juan Fernandez fur seals. Marine Mammal Science, 14(3), 552-574.
Frankel, A. S. (2005). Gray whales hear and respond to signals 21 kHz and higher. Paper presented at the
16th biennial conference on the biology of marine mammals, San Diego.
Frankel, A. S. (2018). Sound. Pages 889-901 in B. Würsig, J. G. M. Thewissen, & K. Kovacs, (Eds.).
Encyclopedia of marine mammals, 3rd Ed. San Diego, CA: Academic Press.
Frankel, A. S., & Yin, S. (2010). A description of sounds recorded from melon-headed whales
(Peponocephala electra) off Hawai'i. The Journal of the Acoustical Society of America, 127(5),
3248–3255.
Frankel, A.S., Mobley, J., & Herman, L. (1995). Estimation of auditory response thresholds in humpback
whales using biologically meaningful sounds. Pages 55–70 in R.A. Kastelein, J.A. Thomas, and
P.E. Nachtigall, eds. Sensory systems of aquatic mammals. Woerden, Netherlands: De Spil
Publication.
Frantzis, A., Goold, J. C., Skarsoulis, E. K., Taroudakis, M. I., & Kandia, V. (2002). Clicks from Cuvier’s
beaked whales, Ziphius cavirostris (L). The Journal of the Acoustical Society of America, 112(1),
34-37.
Freuchen, P. (1935). Mammals. Part II. Field notes and biological observations. In M. Degerbøl & P.
Freuchen (Eds.). Mammals, Vol. 2, pp. 68-278. Copenhagen: Gyldendalske Boghandel, Nordisk
Forlag.
Friedlaender, A. S., J. A. Goldbogen, D. P. Nowacek, A. J. Read, D. Johnston, & N. Gales. (2014). Feeding
rates and under-ice foraging strategies of the smallest lunge filter feeder, the Antarctic minke
whale (Balaenoptera bonaerensis). The Journal of Experimental Biology, 217(Pt 16), 2851-2854.
doi:10.1242/jeb.106682.
Frouin-Mouy, H., Mouy, X., Martin, B. and Hannay, D. (2016), Underwater acoustic behavior of bearded
seals (Erignathus barbatus) in the northeastern Chukchi Sea, 2007–2010. Marine Mammal
Science, 32(1), 141–160. doi:10.1111/mms.12246.
Fulling, G.L., Thorson, P.H., and Rivers, J. (2011). Distribution and abundance estimates for cetaceans in
the waters off Guam and the Commonwealth of the Northern Mariana Islands. Pacific Science,
65(3), 321-343.
Gabriele, C., & Frankel, A. S. 2002. The occurrence and significance of humpback whale songs in Glacier
Bay, southeastern Alaska. Arctic Research of the United States, 16, 42-47.
Gabriele, C. M., Straley, J. M., Herman, L. M., & Coleman, R. J. (1996). Fastest documented migration of a
North Pacific humpback whale. Marine Mammal Science, 12(3), 457-464.
Gales, N. J. (2009). New Zealand sea lion (Phocarctos hookeri). Pages 763-765 in W.F. Perrin, B. Wursig,
and J.G.M. Thewissen, eds. Encyclopedia of marine mammals, 2nd ed. San Diego, CA: Academic
Press.
LOA and Rulemaking Application Under the MMPA for Use of SURTASS LFA Sonar
15-22 Literature Cited
Gallo Reynosa, J. P. (1994). Factors affecting the population status of Guadalupe fur seal, Arctocephalus
townsendi (Merriam, 1897), at Isla de Guadalupe, Baja California, Mexico. (Doctoral
dissertation). University of California, Santa Cruz. Retrieved from
<https://www.researchgate.net/publication/261795932_Factors_affecting_the_population_sta
tus_of_Guadalupe_Fur_Seal_Arctocephalus_townsendi_Merriam_1897_at_Isla_de_Guadalupe
_Baja_California_Mexico>.
Gambell, R. (1985). Sei whale (Balaenoptera borealis) Lesson, 1828. Pages 155-170 in S.H. Ridgeway and
R. Harrison, eds. Handbook of marine mammals, Volume 3: The sirenians and baleen whales.
San Diego, CA: Academic Press.
Gaskin, D. E. (1992). Status of the harbour porpoise, Phocoena phocoena. Canadian Field-Naturalist,
106(1), 36–54.
Gaskin, D. E., Arnold, P. W., & Blair, B. A. (1974). Phocoena phocoena. Mammalian Species, 42, 1-8.
Gassmann, M., Henderson, E. E., Wiggins, S. M., Roch, M. A., & Hildebrand, J. A. (2013). Offshore killer
whale tracking using multiple hydrophone arrays. The Journal of the Acoustical Society of
America, 134(5), 3513-3521. doi:10.1121/1.4824162.
Gazo, M., & Aguilar, A. (2005). Maternal attendance and diving behavior of a lactating Mediterranean
monk seal. Marine Mammal Science, 21(2), 340-345.
Gedamke, J., Costa,D. P., & Dunstan, A. (2001). Localization and visual verification of a complex minke
whale vocalization. The Journal of the Acoustical Society of America, 109(6), 3038-3047.
Gelatt, T., & Sweeney, K. (2016). Eumetopias jubatus. The IUCN Red List of Threatened Species 2016:
e.T8239A45225749. Retrieved from <http://www.iucnredlist.org/details/8239/0>.
Gelatt, T., Ream, R., & Johnson, D. (2015). Callorhinus ursinus. The IUCN red list of threatened species
2015, (e.T3590A45224953). Accessed March 2016 from
<http://dx.doi.org/10.2305/IUCN.UK.2015-4.RLTS.T3590A45224953.en>.
Gentry, R. (2009b). Northern fur seal Callorhinus ursinus. In W. F. Perrin, B. Würsig, & J. G. M. Thewissen
(Eds.), Encyclopedia of marine mammals, 2nd ed. (pp. 788-791). New York: Academic Press.
Gentry, R. L. (2009a). Eared seals. Pages 339-348 in W.F. Perrin, B. Wursig, and J.G.M. Thewissen, eds.
Encyclopedia of marine mammals, 2nd ed. San Diego, CA: Academic Press.
Gerrodette, T., and Forcada, J. (2005). Non-recovery of two spotted and spinner dolphin populations in
the eastern tropical Pacific Ocean. Marine Ecology Progress Series, 291, 1-21.
Gerrodette, T., Watters, G., Perryman, W., & Balance, L. (2008). Estimates of 2006 dolphin abundance in
the Eastern Tropical Pacific, with revised estimates from 1996-2003. (NOAA-TM-NMFS-SWFSC-
422). La Jolla, CA: Southwest Fisheries Science Center, National Marine Fisheries Service.
Gewalt, W. (1990). The Jacobita, or Commerson’s dolphin (Cephalorhynchus commersoni). Aquatic
Mammals, 16(2), 53-64.
Gilmartin, W. G., & Forcada, J. (2009). Monk seals Monachus monachus, M. tropicalis, and M.
schauinslandi. Pages 741-744 in Perrin, W.F., B. Würsig, and J.G.M. Thewissen, eds.
Encyclopedia of marine mammals, 2nd ed. San Diego, CA: Academic Press.
LOA and Rulemaking Application Under the MMPA for Use of SURTASS LFA Sonar
15-23 Literature Cited
Gjertz, I., Kovacs, K. M., Lydersen, C., & Wiig, O. (2000a). Movements and diving of adult ringed seals
(Phoca hispida) in Svalbard. Polar Biology, 23(9), 651-656.
Gjertz, I., Kovacs, K. M., Lydersen, C., & Wiig, O. (2000b). Movements and diving of bearded seal
(Erignathus barbatus) mothers and pups during lactation and post-weaning. Polar Biology,
23(8), 559-566.
Goebel, M. E. (1998). Female foraging behavior: Inter-and intraannual variation in individuals. Pages
243-259 in R.L. Gentry, ed. Behaviour and ecology of the northern fur seal. Princeton, NJ:
Princeton University Press.
Goldbogen, J. A., B. L. Southall, S. L. Deruiter, J. Calambokidis, A. S. Friedlaender, E. L. Hazen, E. A.
Falcone, G. S. Schorr, A. Douglas, D. J. Moretti, C. Kyburg, M. F. McKenna, and P. L. Tyack.
(2013). Blue whales respond to simulated mid-frequency military sonar. Proc Biol Sci B. Biol Sci,
280(1765), 20130657. doi:10.1098/rspb.2013.0657
Gómez de Segura, A., Crespo, E. A., Pedraza, S. N., Hammond, P. S., & Raga, J. A. (2006). Abundance of
small cetaceans in waters of the central Spanish Mediterranean. Marine Biology, 150(1), 149-
160. doi 10.1007/s00227-006-0334-0.
Goodall, R. N. P. (1994a). Commerson's dolphin Cephalorhynchus commersonii (Lacepede, 1804). Pages
241-267 in S.H. Ridgeway and R. Harrison, eds. Handbook of marine mammals, Volume 5: The
first book of dolphins. New York, NY: Academic Press.
Goodall, R. N. P. (1994b). Chilean dolphin Cephalorhynchus eutropia (Gray, 1846). Pages 269-287 in S.H.
Ridgeway and R. Harrison, eds. Handbook of marine mammals, Volume 5: The first book of
dolphins. New York, NY: Academic Press.
Goodall, R. N. P. (2009a). Peale's dolphin (Lagenorhunchus australis). Pages 844-847 in W.F. Perrin, B.
Würsig, and J.G.M. Thewissen, eds. Encyclopedia of marine mammals, 2nd ed. San Diego, CA:
Academic Press.
Goodall, R. N. P. (2009b). Hourglass dolphin (Lagenorhunchus cruciger). Pages 573-576 in W.F. Perrin, B.
Würsig, and J.G.M. Thewissen, eds. Encyclopedia of marine mammals, 2nd ed. San Diego,
California: Academic Press.
Goodall, R. N. P. (2009c). Spectacled porpoise (Phocoena dioptrica). Pages 1087-1091 in W.F. Perrin, B.
Wursig, and J.G.M. Thewissen, eds. Encyclopedia of marine mammals, 2nd ed. San Diego, CA:
Academic Press.
Goodall, R.N.P, A.R. Galeazzi, S. Leatherwood, K.W. Miller, I.S. Cameron, R.K. Kastelein, & A.P. Sobral.
(1988). Studies of Commerson's dolphins, Cephalorhynchus commersonii, off Tierra del Fuego,
1976-1984, with a review of information on the species in the South Atlantic. Report of the
International Whaling Commission, 9, 3-70.
Goold, J.C., & Jones, S.E. (1995). Time and frequency domain characteristics of sperm whale clicks. The
Journal of the Acoustical Society of America, 98(3), 1279-1291.
Gordon, J.D.C., D. Gillespie, L.E. Rendell, & R. Leaper. (1996). Draft report on the playback of ATOC like
sounds to sperm whales (Physeter macrocephalus) off the Azores. Unpublished manuscript
submitted to the ATOC Marine Mammal Research Program Bioacoustics Research Program.
Ithaca, NY: Laboratory of Ornithology, Cornell University.

LOA and Rulemaking Application Under the MMPA for Use of SURTASS LFA Sonar
15-24 Literature Cited
Gordon, J. C. D., Matthews, J. N., Panigada, S., Gannier, A., Borsani, J. F., & di Sciara, G. N. (2000).
Distribution and relative abundance of striped dolphins, and distribution of sperm whales in
the Ligurian Sea cetacean sanctuary: Results from a collaboration using acoustic monitoring
techniques. Journal of Cetacean Research and Management, 2(1), 27-36.
Götz, T., Antunes, R., & Heinrich, S. (2010). Echolocation clicks of free-ranging Chilean dolphins
(Cephalorhynchus eutropia) (L). The Journal of the Acoustical Society of America, 128(2), 563-
566.
Gowans, S. (2009). Bottlenose whales Hyperoodon ampullatus and H. planifrons.Pages 129-131 in W.F.
Perrin, B. Wursig, and J.G.M. Thewissen, eds. Encyclopedia of marine mammals, 2nd ed. San
Diego, CA: Academic Press.
Greenhow, D. R., Brodsky, M. C., Lingenfelser, R. G., & Mann, D. A. (2014). Hearing threshold
measurements of five stranded short-finned pilot whales (Globicephala macrorhynchus). The
Journal of the Acoustical Society of America, 135(1), 531-536. doi:10.1121/1.4829662.
Greenhow, D.R., Cardwell, A., Powell, J.R., Hill-Cook, M.L., Stamper, M.A., Byrd, L., Manire, C.A., Brodsky,
M.C., Bauer, G.B., & Mann, D.A. (2016). Comparison of three Stenella spp. audiograms
measured using auditory evoked potentials and behavioral methods. The Journal of the
Acoustical Society of America, 140(4), 3297. doi:10.1121/1.4970482.
Gregr, E. J. (2011). Insights into North Pacific right whale Eubalaena japonica habitat from historic
whaling records. Endangered Species Research, 15(3), 223-239. doi:10.3354/esr00381.
Gridley, T., Cockcroft, V. G., Hawkins, E. R., Blewitt, M. L., Morisaka, T., & Janik, V. M. (2014). Signature
whistles in free-ranging populations of Indo-Pacific bottlenose dolphins,Tursiops aduncus.
Marine Mammal Science, 30(2), 512-527. doi:10.1111/mms.12054.
Gridley, T., Nastasi, A., Kriesell, H. J., & Elwen, S. H. (2015). The acoustic repertoire of wild common
bottlenose dolphins (Tursiops truncatus) in Walvis Bay, Namibia. Bioacoustics, 24(2), 153-174.
doi:10.1080/09524622.2015.1014851.
Groch, K., J. J. T. Palazzo, P. A. C. Flores, F. R. Adler, & M. E. Fabian. (2005). Recent rapid increases in the
right whale (Eubalaena australis) population off southern Brazil. LAJAM, 4(1), 41-47.
Hakamada, T., & Hatanaka, H. (2010). Reconsideration of the population status of the J stock common
minke whales. Report of the International Whaling Commission, SC/62/NPM31.
Hall, J. D., & Johnson, C. S. (1972). Auditory thresholds of a killer whale Orcinus orca Linnaeus. The
Journal of the Acoustical Society of America, 51(2), 515-517.
Hall, A., & Thompson, D. (2009). Gray seal (Halichoerus grypus). Pages 500-503 in W.F. Perrin, B.G.
Wursig, and J.G.M. Thewissen, eds. Encyclopedia of marine mammals, 2nd ed. San Diego,
California: Academic Press.
Hamilton, P. K., Stone, G. S., & Martin, S. M. (1997). Note on a deep humpback whale Megaptera
novaeangliae dive near Bermuda. Bulletin of Marine Science, 61(2). 491-494.
Han, J.‐B., Sun, F.‐Y., Gao, X.‐G., He, C.‐B., Wang, P. L., Ma, Z.‐Q., & Wang, Z.‐H. (2010). Low
microsatellite variation in spotted seal (Phoca largha) shows a decrease in population size in
the Liaodong Gulf colony. Annales Zoologici Fennici, 47, 15-27.

LOA and Rulemaking Application Under the MMPA for Use of SURTASS LFA Sonar
15-25 Literature Cited
Hanson, M. B., Baird, R. W., & DeLong, R. L. (1998). Short-term movements and dive behavior of tagged
Dall’s porpoise in Haro Strait, Washington. Pages 59-60 in Abstracts, World Marine Mammal
Science Conference, Monaco, 22-24 January 1998.
Hatakeyama, Y., & Soeda, H. (1990). Studies on echolocation of porpoises taken in salmon gillnet
fisheries. Pages 269–28 in J.A. Thomas and R.A. Kastelein, eds. Sensory abilities of cetaceans:
Laboratory and field evidence. New York, NY: Plenum Press.
Hatakeyama, Y., K. Ishii, T. Akamatsu, H. Soeda, T. Shimamura, & T. Kojima. (1994). A review of studies
on attempts to reduce the entanglement of the Dall‘s porpoise, Phocoenoides dalli, in the
Japanese salmon gillnet fishery. Report of the International Whaling Commission, 15, 549-563.
Hawkins, E. R. (2010). Geographic variations in the whistles of bottlenose dolphins (Tursiops aduncus)
along the east and west coasts of Australia. The Journal of the Acoustical Society of America,
128(2), 924. doi:10.1121/1.3459837.
Heath, C. B., & Perrin, W. F. (2009). California, Galapagos, and Japanese sea lions (Zalophus
californianus, Z. wollebaeki, and Z. japonicus). Pages 170-176 in W.F. Perrin, B. Wursig, and
H.G.M. Thewissen, eds. Encyclopedia of marine mammals, 2nd ed. San Diego, CA: Academic
Press.
Heide-Jørgensen, M. P., K. L. Laidre, M. V. Jensen, L. Dueck, & L. D. Postma. (2006). Dissolving stock
discreteness with satellite tracking: bowhead whales in Baffin Bay. Marine Mammal Science,
22(1), 34-45.
Heide-Jørgensen, M. P., K. L. Laidre, D. Litovka, M. Villum Jensen, J. M. Grebmeier, & B. I. Sirenko.
(2012). Identifying gray whale (Eschrichtius robustus) foraging grounds along the Chukotka
Peninsula, Russia, using satellite telemetry. Polar Biology, 35(7), 1035-1045.
doi:10.1007/s00300-011-1151-6.
Henderson, E. E., M. H. Smith, M. Gassmann, S. M. Wiggins, A. B. Douglas, & J. A. Hildebrand. (2014).
Delphinid behavioral responses to incidental mid-frequency active sonar. The Journal of the
Acoustical Society of America, 136(4), 2003.
Herzing, D. L. (1996). Vocalizations and associated underwater behavior of free-ranging Atlantic spotted
dolphins, Stenella frontalis and bottlenose dolphins, Tursiops truncatus. Aquatic Mammals,
22(2), 61-79.
Hester, K.C., Peltzer, E.T., Kirkwood, W.J., & Brewer, P.G. (2008). Unanticipated consequences of ocean
acidification: A noisier ocean at lower pH. Geophysical Research Letters, 35(19).
doi:10.1029/2008gl034913.
Heyning, J. E. (1989). Cuvier's beaked whale—Ziphius cavirostris (G. Cuvier, 1823). Pages 289-308 in
Ridgway, S.H., and R. Harrison, eds. Handbook of marine mammals. Volume 4: River dolphins
and the larger toothed whales. San Diego, CA: Academic Press.
Heyning, J.E., & Mead, J.G. (2009). Cuvier's beaked whale (Ziphius cavirostris). Pages 294-295 in W.F.
Perrin, B.G. Wursig, and J.G.M. Thewissen, eds. Encyclopedia of marine mammals, 2nd ed. San
Diego, CA: Academic Press.
Heyning, J.E., & Perrin, W.F. (1994). Evidence for two species of common dolphins (genus Delphinus)
from the eastern North Pacific. Contributions in Science, 442, 1-35.

LOA and Rulemaking Application Under the MMPA for Use of SURTASS LFA Sonar
15-26 Literature Cited
Hildebrand, J. A. (2005). Impacts of anthropogenic sound. Pages 101-124 in J.E. Reynolds, W.F. Perrin,
R.R. Reeves, S. Montgomery, and T.J. Ragen, eds. Marine mammal research: Conservation
beyond crisis. Baltimore, Maryland: Johns Hopkins University Press.
Hildebrand, J. A. (2009). Anthropogenic and natural sources of ambient noise in the ocean. Marine
Ecology Progress Series, 395, 5-20. doi:10.3354/meps08353.
Hill, M. C., Bradford, A. L., Andrews, K. R., Baird, R. W., Deakos, M. H., Johnston, S. D., . . . Yin, S. (2011).
Abundance and movements of spinner dolphins off the main Hawaiian Islands: Pacific Islands
Fisheries Science Center Working Paper WP-11-013.
Hindell, M. A., & Pemberton, D. (1997). Successful use of a translocation program to investigate diving
behavior in a male Australian fur seal, Arctocephalus pusillus doriferus. Marine Mammal
Science, 13(2), 219-228.
Hindell, M. A., & Perrin, W. F. 2009. Elephant seals (Mirounga angustirostris and M. leonina). Pages 364-
368 in W.F. Perrin, B. Wursig, and H.G.M. Thewissen, eds. Encyclopedia of marine mammals, 2nd
ed. San Diego, CA: Academic Press.
Hobbs, R. C., & Waite, J. M. (2010). Abundance of harbor porpoise (Phocoena phocoena) in three
Alaskan regions, corrected for observer errors due to perception bias and species
misidentification, and corrected for animals submerged from view. Fishery Bulletin, 108, 251–
267.
Hobson, R. P., & Martin, A. R. (1996). Behaviour and dive times of Arnoux's beaked whales, Berardius
arnuxii, at narrow leads in fast ice. Canadian Journal of Zoology, 74(2), 388-393.
Hofmeyr, G. J. G. (2015). Arctocephalus pusillus. The IUCN Red List of Threatened Species 2015.
T2060A45224212. <http://dx.doi.org/10.2305/IUCN.UK.2015-4.RLTS.T2060A45224212.en>.
Holt, M. M., D. P. Noren, R. C. Dunkin, & T. M. Williams. (2015). Vocal performance affects metabolic
rate in dolphins: implications for animals communicating in noisy environments. The Journal of
Experimental Biology, 218(Pt 11), 1647-1654.
Holt, M. M., D. P. Noren, & C. K. Emmons. (2011). Effects of noise levels and call types on the source
levels of killer whale calls. The Journal of the Acoustical Society of America, 130(5), 3100-3106.
Hooker, S. K., & Baird, R. W. (1999). Deep-diving behaviour of the northern bottlenose whale,
Hyperoodon ampullatus (Cetacea: Ziphiidae). Proceedings of the Royal Society B: Biological
Sciences, 266(1420), 671-676.
Hooker, S. K., & Whitehead, H. (1998). Echolocation of northern bottlenose whales—an analysis of click
characteristics and their implications for foraging. Abstracts of World Marine Mammal Science
Conference, Monaco, 20-24 January 1998.
Hoos, L. (2013). Resting habitat suitability for spinner dolphins (Stenella longirostris) in the northwestern
Hawaiian Islands. (Masters of Environmental Management project). Duke University, Durham,
NC.
Horimoto, T., Mitani, Y., & Sakurai, Y. (2016). Spatial association between northern fur seal (Callorhinus
ursinus) and potential prey distribution during the wintering period in the northern Sea of
Japan. Fisheries Oceanography, 25(1), 44-53. doi:10.1111/fog.12133.

LOA and Rulemaking Application Under the MMPA for Use of SURTASS LFA Sonar
15-27 Literature Cited
Horton, T. W., R. N. Holdaway, A. N. Zerbini, N. Hauser, C. Garrigue, A. Andriolo, & P. J. Clapham. (2011).
Straight as an arrow: humpback whales swim constant course tracks during long-distance
migration. Biology Letters, 7(5), 674-679. doi:10.1098/rsbl.2011.0279.
Horwood, J. (2009). Sei whale (Balaenoptera borealis). Pages 1001-1003 in W.F. Perrin, B.G. Würsig, and
J.G.M. Thewissen, eds. Encyclopedia of marine mammals, 2nd edition. San Diego, CA: Academic
Press.
Houser, D.S., Helweg, D. A., & Moore, P.W. (1999). Classification of dolphin echolocation clicks by energy
and frequency distributions. The Journal of the Acoustical Society of America, 106(3, Part I),
1579-1585.
Houser, D.S., Helweg, D. A., & Moore, P.W.B. (2001). A bandpass filter-bank model of auditory sensitivity
in the humpback whale. Aquatic Mammals, 27(2), 82-91.
Houser, D.S., Gomez-Rubio, A., & Finneran, J. J. (2008). Evoked potential audiometry of 13 Pacific
bottlenose dolphins (Tursiops truncatus gilli). Marine Mammal Science 24(1), 28-41.
Houser, D. S., Martin, S. W., & Finneran, J. J. (2013a). Behavioral responses of California sea lions to mid-
frequency (3250-3450 Hz) sonar signals. Marine Environmental Research, 92, 268-278.
Houser, D. S., Martin, S. W., & Finneran, J. J. (2013b). Exposure amplitude and repetition affect
bottlenose dolphin behavioral responses to simulated mid-frequency sonar signals. Journal of
Experimental Marine Biology and Ecology, 443, 123-133.
Houston, J. (1991). Status of Cuvier's beaked whale, Ziphius cavirostris, in Canada. Canadian Field-
Naturalist, 105(2), 215-218.
Hui, C.A. (1987). Power and speed of swimming dolphins. Journal of Mammalogy, 68(1), 126-132.
Ilyina, T., R. E. Zeebe, and P. G. Brewer. (2010). Future ocean increasingly transparent to low-frequency
sound owing to carbon dioxide emissions. Nature Geoscience, 3, 18-22.
Insley, S. J. (2000). Long-term vocal recognition in the northern fur seal. Nature, 406, 404-405.
International Council for Exploration of the Sea (ICES). (2005). Report of the ad-hoc group on the impacts
of sonar on cetaceans and fish (AGISC). International Council for the Exploration of the Sea.
Accessed: <http://www.ices.dk/advice/Request/EC/DG±20Env/sonar/agisc05.pdf>.
ICES. (2013). Report of the working group on harp and hooded seals (WGHARP), 26-30 August 2013,
PINRO Murmansk, Russia. ICES CM 2013/ACOM:20. Copenhagen, Denmark: International
Council for Exploration of the Sea.
International Fund for Animal Welfare (IFAW). 2001. Report of the workshop on right whale acoustics:
Practical applications in conservation. Technical Report. Yarmouth Port, MA: International Fund
for Animal Welfare.
International Union for the Conservation of Nature and Natural Resources (IUCN). (2017). Global shift in
marine protected area analysis and reporting. Retrieved from <https://www.iucn.org/news/
protected-areas/201709/global-shift-marine-protected-area-analysis-and-reporting>.
International Whaling Commission (IWC). 1981. Report of the subcommittee on other baleen whales.
Report of the International Whaling Commission 31, 122-132.

LOA and Rulemaking Application Under the MMPA for Use of SURTASS LFA Sonar
15-28 Literature Cited
IWC. (1996). Report of the subcommittee on North Pacific Bryde’s whales. Report of the International
Whaling Commission 46, 147-159.
IWC. (2008). International Whaling Commission: Report of the scientific committee. Report to the
International Whaling Commission 60/Report 1. Cambridge, U.K.: IWC.
IWC. (2009). Population estimates. Retrieved from IWC website
<http.www.iwcoffice.org/conservation/estimate.htm>.
IWC. (2010). Whale population estimates. Retrieved from <https://iwc.int/estimate>.
IWC. (2016). Whale population estimates. Retrieved January 2016 from <https://iwc.int/estimate>.
Isojunno, S., C. Cure, P. H. Kvadsheim, F.-P. A. Lam, P. L. Tyack, P. J. Wensveen, & P. J. O. m. Miller.
(2016). Sperm whales reduce foraging effort during exposure to 1–2 kHz sonar and killer whale
sounds. Ecological Applications, 26(1), 77–93.
Ivashchenko, Y., & Clapham, P. (2010). Bowhead whales Balaena mysticetus in the Okhotsk Sea.
Mammal Review, 40(1), 65-89. doi:10.1111/j.1365-2907.2009.00152.x.
Jaquet, N., S. Dawson, & L. Douglas. (2001). Vocal behavior of male sperm whales: Why do they click?
The Journal of the Acoustical Society of America, 109(5), Part I, 2254-2259.
Janik, V. M., King, S. L., Sayigh, L. S., & Wells, R. S. (2013). Identifying signature whistles from recordings
of groups of unrestrained bottlenose dolphins (Tursiops truncatus). Marine Mammal Science,
29(1), 109-122. doi:10.1111/j.1748-7692.2011.00549.x.
Jefferson, T. A. (2009a). Rough-toothed dolphin (Steno bredanensis). Pages 990-992 in W.F. Perrin, B.
Würsig, and H.G.M. Thewissen, (Eds). Encyclopedia of marine mammals, 2nd Ed. San Diego, CA:
Academic Press.
Jefferson, T. A. (2009b). Dall’s porpoise (Phocoenoides dalli). Pages 296-297 in W.F. Perrin, B. Würsig,
and H.G.M. Thewissen, (Eds). Encyclopedia of marine mammals, 2nd Ed. San Diego, CA:
Academic Press.
Jefferson, T. A., & Barros, N. B. (1997). Peponocephala electra. Mammalian Species, 553, 1-6.
Jefferson, T. A., Leatherwood, S., & Webber, M. A. (1993). FAO species identification guide: Marine
mammals of the world. Rome, Italy: Food and Agriculture Organization of the United Nations.
Jefferson, T. A., Webber, M. A., & Pitman, R. L. (2008). Marine mammals of the world a comprehensive
guide to their identification. San Diego, CA: Elsevier.
Jefferson, T. A., Webber, M. A., & Pitman, R. L. (2015). Marine mammals of the world a comprehensive
guide to their identification (2nd ed.). San Diego, CA: Elsevier.
Jenner, C., Jenner, M., Burton, C., Sturrock, V., Salgado Kent, C., Morrice, M., Attard, C., Moller, L. &
Double, M.C. (2008). Mark recapture analysis of pygmy blue whales from the Perth Canyon,
Western Australia 2000-2005. Paper submitted for consideration by the International Whaling
Commission Scientific Committee SC/60/SH16.

LOA and Rulemaking Application Under the MMPA for Use of SURTASS LFA Sonar
15-29 Literature Cited
Jérémie, S., A. Gannier, S. Bourreau, & J.-C. Nicolas. (2006). Acoustic monitoring of cetaceans in
territorial waters off La Martinique (FWI), Lesser Antilles: Global abundance and first
description of Kogia simus vocalisations (November-December 2004). Page 91 in Abstracts,
Twentieth annual conference of the European Cetacean Society, 2-7 April 2006, Gdynia,
Poland.
Johnson, C.S. (1967). Sound detection thresholds in marine mammals. Pages 247-255 in W.N. Tavolga,
ed. Marine bioacoustics. New York, NY: Pergamon Press.
Johnson, C.S., M.W. McManus, & D. Skaar. (1989). Masked tonal hearing thresholds in the beluga whale.
The Journal of the Acoustical Society of America, 85(6), 2651-2654.
Johnson, M., & Tyack, P. L. (2003). A digital acoustic recording tag for measuring the response of wild
marine mammals to sound. IEEE Journal of Oceanic Engineering, 28(1), 3-12.
Johnson, M., P.T. Madsen, W.M.X. Zimmer, N.A. De Soto, & P.L. Tyack. (2004). Beaked whales
echolocate on prey. Proceedings of the Royal Society, Part B 271, 383-386.
Johnson, M., P.T. Madsen, W.M.X. Zimmer, N.A. de Soto, & P.L. Tyack. (2006). Foraging Blainville's
beaked whales (Mesoplodon densirostris) produce distinct click types matched to different
phases of echolocation. Journal of Experimental Biology, 209(24), 5038-5050.
Johnson, H. D., K. M. Stafford, J. C. George, W. G. Ambrose, & C. W. Clark. (2014). Song sharing and
diversity in the Bering-Chukchi-Beaufort population of bowhead whales (Balaena mysticetus),
spring 2011. Marine Mammal Science, 31(3), 902-922. doi:10.1111/mms.12196.
Johnston, S. E., Zerbini, A. N., & Butterworth, D. S. (2011). A Bayesian approach to assess the status of
Southern Hemisphere humpback whales (Megaptera novaeangliae) with an application to
breeding stock G. Journal of Cetacean Research and Management, (Special issue, 3, 309-18.
Jones, E. L., McConnell, B. J., Smout, S., Hammond, P. S., Duck, C. D., Morris, C. D., Thompson, D.,
Russell, D. J. F., Vincent, C., Cronin, M., Sharples, R. J., & Matthiopoulos, J. (2015). Patterns of
space use in sympatric marine colonial predators reveal scales of spatial partitioning. Marine
Ecology Progress Series, 534, 235-249.
Jones, G. J., & Sayigh, L. S. (2002). Geographic variation in rates of vocal production of free-ranging
bottlenose dolphins. Marine Mammal Science, 18(2),374-393.
Jones, J. M., Thayre, B. J., Roth, E. H., Mahoney, M., Sia, I., Merculief, K., Jackson, C., Zeller, C., Clare, M.,
Bacon, A. et al. (2014). Ringed, bearded, and ribbon seal vocalizations north of Barrow, Alaska:
Seasonal presence and relationship with sea ice. Arctic, 67, 203-222.
Jones, M.L., & Swartz, S. L. (2009). Gray whale (Eschrichtius robustus). Pages 503-511 in W.F. Perrin, B.G.
Wursig, & J.G.M. Thewissen, eds. Encyclopedia of marine mammals, 2nd ed. San Diego, CA:
Academic Press.
Joseph, J.E., & Chiu, C.S. (2010). A computational assessment of the sensitivity of ambient noise level to
ocean acidification. The Journal of the Acoustical Society of America, 128(3), EL144-149.
doi:10.1121/1.3425738.

LOA and Rulemaking Application Under the MMPA for Use of SURTASS LFA Sonar
15-30 Literature Cited
Joyce, T. W., Durban, J. W., Claridge, D. E., Dunn, C. A., Fearnbach, H., Parsons, K. M., . . . Ballance, L. T.
(2017). Physiological, morphological, and ecological tradeoffs influence vertical habitat use of
deep-diving toothed-whales in the Bahamas. PLoS ONE, 12(10), e0185113.
doi:10.1371/journal.pone.0185113.
Kamminga, C., & van Velden, J. G. (1987). Investigations on cetecean sonar. VIII: Sonar signals of
Pseudorca crassidens in comparison with Tursiops truncatus. Aquatic Mammals, 13(2),43-49.
Kanaji, Y., Miyashita, T., Yoshida, H., Okazaki, M., & Kishiro, T. (2015). Abundance estimates of dalli-type
and truei-type of Dall’s porpoise Phocoenoides dalli in the western central part of the Sea of
Okhotsk, July–September between 1990 and 2010. Fisheries Science, 81, 611-619.
Kanaji, Y., Miyashita, T., Minamikawa, S., & Yoshida, H. (2018). Abundance estimates of six species of
Delphinidae cetaceans off the Pacific coast of Japan between 1985 and 2015. Marine Mammal
Science. doi: 10.1111/mms.12502
Karamanlidis, A. A., Dendrinos, P., de Larrinoa, P. F., Gücü, A. C., Johnson, W. M., Kiraç, C. O., & Pires, R.
(2015). The Mediterranean monk seal Monachus monachus: status, biology, threats, and
conservation priorities. Mammal Review, 46(2), 92-105. doi:10.1111/mam.12053.
Karlsen, J., A. Bisther, C. Lydersen, T. Haug, & K. Kovacs. (2002). Summer vocalisations of adult male
white whales (Delphinapterus leucas) in Svalbard, Norway. Polar Biology, 25(11), 808-817.
Kasamatsu, F., & Joyce, G. G. (1995). Current status of odontocetes in the Antarctic. Antarctic Science,
7(4), 365-379.
Kaschner, K. (2006). Mapping world-wide distributions of marine mammal species using a relative
environmental suitability (RES) model. Marine Ecology Progress Series, 316, 285-310.
Kastak, D., & Schusterman, R. J. (1996). Temporary threshold shift in a harbor seal (Phoca vitulina). The
Journal of the Acoustical Society of America, 100(3), 1905-1908.
Kastak, D., & Schusterman, R. J. (1998). Low-frequency amphibious hearing in pinnipeds: Methods,
measurements, noise, and ecology. The Journal of the Acoustical Society of America, 103(4),
2216-2228.
Kastak, D., & Schusterman, R. J. (1999). In-air and underwater hearing sensitivity of a northern elephant
seal (Mirounga angustirostris). Canadian Journal of Zoology, 77(11), 1751-1758.
Kastak, D., B.L. Southall, R.J. Schusterman, & C.R. Kastak. (2005). Underwater temporary threshold shift
in pinnipeds: Effects of noise level and duration. The Journal of the Acoustical Society of
America, 118(5), 3154-3163.
Kastelein, R. (2013). Brief behavioral response threshold levels of a harbor porpoise (Phocoena
phocoena) to five helicopter dipping sonar signals (1.33 to 1.43 kHz). Aquatic Mammals, 39(2),
162-173.
Kastelein, R.A., & Gerrits, N.M. (1991). Swimming, diving and respiration patterns of a northern
bottlenose whale (Hyperoodon ampullatus, Forster 1770). Aquatic Mammals, 17, 20-30.
Kastelein, R.A., P. Bunskoek, M. Hagedoorn, W.W.L Au, & D. de Haan. (2002). Audiogram of a harbor
porpoise (Phocoena phocoena) measured with narrow-band frequency-modulated signals. The
Journal of the Acoustical Society of America, 112(1), 334-344.
LOA and Rulemaking Application Under the MMPA for Use of SURTASS LFA Sonar
15-31 Literature Cited
Kastelein, R.A., M. Hagedoorn, W.W.L. Au, & D. de Haan. (2003). Audiogram of a striped dolphin
(Stenella coeruleoalba). The Journal of the Acoustical Society of America, 113(2), 1130-1137.
Kastelein, R. A., Hoek, L., & de Jong, C. A. F. (2011). Hearing thresholds of a harbor porpoise (Phocoena
phocoena) for sweeps (1–2 kHz and 6–7 kHz bands) mimicking naval sonar signals. The Journal
of the Acoustical Society of America, 129(5). 3393. doi:10.1121/1.3569739.
Kastelein, R. A., Hoek, L., Wensveen, P. J, Terhune, J. M., & de Jong, C. A. F. (2010). The effect of signal
duration on the underwater hearing thresholds of two harbor seals (Phoca vitulina) for single
tonal signals between 0.2 and 40 kHz. The Journal of the Acoustical Society of America, 127(2),
1135-1145.
Kastelein, R. A., Schop, J., Hoek, L., & Covi, J. (2015). Hearing thresholds of a harbor porpoise (Phocoena
phocoena) for narrow-band sweeps. The Journal of the Acoustical Society of America, 138(4),
2508. doi:10.1121/1.4932024.
Kastelein, R. A., Steen, N., Gransier, R., Wensveen, P. J., & de Jong, C. A. (2012). Threshold received
sound pressure levels of single 1-2 kHz and 6-7 kHz up-sweeps and down-sweeps causing
startle responses in a harbor porpoise (Phocoena phocoena). The Journal of the Acoustical
Society of America, 131(3), 2325-2333.
Kastelein, R. A., van Schie, R., Verboom, W. C., & de Haan, D. (2005). Underwater hearing sensitivity of a
male and a female Steller sea lion (Eumetopias jubatus). The Journal of the Acoustical Society of
America, 118(3), 1820-1829.
Kastelein, R. A., Wensveen, P. J., Hoek, L., Verboom, W. C., & Terhune, J. M. (2009). Underwater
detection of tonal signals between 0.125 and 100 kHz by harbor seals (Phoca vitulina). Journal
of the Acoustical Society of America, 125(2), 1222-1229.
Kasuya, T. (1971). Consideration of distribution and migration of toothed whales off the Pacific coast of
Japan based upon aerial sighting record. Scientific Report of the Whales Research Institute 23,
37-60.
Kasuya, T. (1986). Distribution and behavior of Baird's beaked whales off the Pacific coast of Japan.
Scientific Report of the Whales Research Institute, 37, 61-83.
Kasuya, T. (1998). Evidence of statistical manipulations in Japanese coastal sperm whale fishery. Paper
SC/50/CAWS10 presented to the International Whaling Commission, June 1998 (unpublished).
As cited in Muto et al. 2018.
Kasuya, T. (2009). Giant beaked whales Berardius bairdii and B. arnuxii. Pages 498-500 in W.F. Perrin, B.
Wursig, & H.G.M. Thewissen, (Eds.). Encyclopedia of marine mammals, 2nd ed. San Diego, CA:
Academic Press.
Kasuya, T., & Perrin, W. F. (2017). Small Cetaceans of Japan: Exploitation and Biology. New York: CRC
Press.
Kato, H., & Miyashita,T. (1998). Current status of North Pacific sperm whales and its preliminary
abundance estimates. Report SC/50/CAWS/52 submitted to the International Whaling
Commission.
LOA and Rulemaking Application Under the MMPA for Use of SURTASS LFA Sonar
15-32 Literature Cited
Kato, H., & Perrin, W.F. (2018). Bryde’s whale—Balaenoptera edeni. Pages 143-145 in Wursig, B.,
Thewissen, J.G.M., & Kovacs, K.M., (Eds). Encyclopedia of marine mammals, 3rd Ed. Cambridge,
MA: Academic Press.
Kelleher, G. (1999). Guidelines for marine protected areas. Gland, Switzerland and Cambridge, United
Kingdom:IUCN World Commission on Protected Areas.
Kelly, B. P., Bengtson, J. L., Boveng, P. L., Cameron, M. F., Dahle, S. P., Jansen, J. K., Logerwell, E. A.,
Overland, J. E., Sabine, C. L., Waring, G. T., & Wilder, J. M. (2010). Status review of the ringed
seal (Phoca hispida). (NOAA Technical Memorandum NMFS-AFSC-212). Seattle, WA: Alaska
Fisheries Science Center, National Marine Fisheries Service.
Kenney, R. D. (2009). North Atlantic, North Pacific, and southern right whales (Eubalaena glacialis, E.
japonica, and E. australis). Pages 962-971 in W.F. Perrin, B. Wursig, and H.G.M. Thewissen,
(Eds.). Encyclopedia of marine mammals, 2nd ed. San Diego, CA: Academic Press.
Kerosky, S. M., A. Širović, L. K. Roche, S. Baumann-Pickering, S. M. Wiggins, & J. A. Hildebrand. (2012).
Bryde's whale seasonal range expansion and increasing presence in the Southern California
Bight from 2000 to 2010. Deep Sea Research Part I: Oceanographic Research Papers, 65, 125-
132. doi:10.1016/j.dsr.2012.03.013.
Ketten, D. R. (1994). Functional analyses of whale ears: Adaptations for underwater hearing. IEEE, 264-
270.
Ketten, D. R. (1997). Structure and function in whale ears. Bioacoustics, 8(1), 103-136.
Ketten, D. R. (2000). Cetacean ears. In W. W. L. Au, A. N. Popper, and R. R. Fay (Eds.), Hearing by whales
and dolphins (pp. 43-108). New York, NY: Springer-Verlag.
King, J. E. (1983). Seals of the world. 2nd edition. London, UK: British Museum (Natural History) and
Oxford University Press. 240 pages.
Klatsky, L. J., Wells, R. S., & Sweeney, J. C. (2007). "Offshore bottlenose dolphins (Tursiops truncatus): movement and dive behavior near the Bermuda pedestal," Journal of Mammalogy 88, 59-66.
Kooyman, G. L., & Gentry, R. L. (1986). Diving behavior of South African fur seals. Pages 142-152 in R.L.
Gentry & G.L. Kooyman, eds. Fur seals: Maternal strategies on land and sea. Princeton, NJ:
Princeton University Press.
Kovacs, K. & Lowry, L. (IUCN SSC Pinniped Specialist Group). (2008b). Erignathus barbatus. The IUCN Red
List of Threatened Species 2008: e.T8010A12882802.
<http://dx.doi.org/10.2305/IUCN.UK.2008.RLTS.T8010A12882802.en>.
Kovacs, K., Lowry, L., and Harkonen, T. (2008a). Pusa hispida. The IUCN Red List of Threatened Species
2008: e.T41672A10505155. IUCN SSC Pinniped Specialist Group.
<http://dx.doi.org/10.2305/IUCN.UK.2008.RLTS.T41672A10505155.en>.
Kruse, S.,Caldwell, D. K.,& Caldwell, M. C. (1999). Risso’s dolphin Grampus griseus (G. Cuvier, 1812).
Pages 183–212 in Ridgway, S. H., & Harrison, R. (Eds.). Handbook of marine mammals, vol.6,
The second book of dolphins and porpoises. San Diego, CA: Academic Press.
Kuczaj, S. A., Eskelinen, H. C., Jones, B. L., & Borger-Turner, J. L. (2015). Dolphin (Tursiops truncatus)
mothers use individually distinctive acoustic signals to call their calves.
doi:10.12966/abc.02.07.2015.

LOA and Rulemaking Application Under the MMPA for Use of SURTASS LFA Sonar
15-33 Literature Cited
Kuningas, S., Similä, T., & Hammond, P. S. (2014). Population size, survival and reproductive rates of
northern Norwegian killer whales (Orcinus orca) in 1986-2003. Journal of the Marine Biological
Association of the United Kingdom, 9, 1277-1291.
Kuzin, A. E. (2014). New data on the abundance of the northern fur seal (Callorhinus ursinus), Steller sea
lion (Eumetopias jubatus), and spotted seal (Phoca largha) on Tyuleniy Island, Sea of Okhotsk.
Russian Journal of Marine Biology, 40(7), 532-538.
Kuzin, A. E. (2015). New data on the abundance of the northern fur seal (Callorhinus ursinus), Steller sea
lion (Eumetopias jubatus), and spotted seal (Phoca largha) on Tyuleniy Island, Sea of Okhotsk.
Russian Journal of Marine Biology, 40(7), 532-538. doi: 10.1134/s1063074014070037
Kvadsheim, P. H.,Sevaldsen, E. M., Folkow, L. P., & Blix, A. S. (2010). Behavioural and physiological
responses of hooded seals (Cystophora cristata) to 1 to 7 kHz Sonar Signals. Aquatic Mammals,
36(3), 239-247. doi:10.1578/am.36.3.2010.239.
Kyhn, L.A., F.H. Jensen, K. Beedholm, J. Tougaard, M. Hansen, & P. T. Madsen. (2010). Echolocation in
sympatric Peale’s dolphins (Lagenorhynchus australis) and Commerson’s dolphins
(Cephalorhynchus commersonii) producing narrow-band high-frequency clicks. The Journal of
Experimental Biology, 213, 1940-1949.
Kyhn, L. A., Tougaard, J., Beedholm, K., Jensen, F. H., Ashe, E., Williams, R., & Madsen, P. T. (2013).
Clicking in a killer whale habitat: narrow-band, high-frequency biosonar clicks of harbour
porpoise (Phocoena phocoena) and Dall's porpoise (Phocoenoides dalli). PLoS ONE, 8(5),
e63763. doi:10.1371/journal.pone.0063763.
Kyhn, L.A., J. Tougaard, F. Jensen, M. Wahlberg, G. Stone, A. Yoshinaga, K. Beedholm, & P.T. Madsen.
(2009). Feeding at a high pitch: Source parameters of narrow band, high-frequency clicks from
echolocating off-shore hourglass dolphins and coastal Hector’s dolphins. The Journal of the
Acoustical Society of America, 125(3), 1783-1791.
Lacsamana, J. K. M, Ventolero, M. F. H., Blatchley, D., & Santos, M.D. (2015). First record of a rare
beaked whale Mesoplodon hotaula in the Philippines. Marine Biodiversity Records, 8, e77.
doi:10.1017/S1755267215000457.
Laidre, K. L., Stern, H., Kovacs, K. M., Lowry, L.,Moore, S. E., Regehr, E. V., Ferguson, S. H., Wiig, Ø.,
Boveng, P., Angliss, R. P., Born, E. W.,Litovka, D., Quakenbush, L., Lydersen, C., Vongraven, D., &
Ugarte, F. (2015). Arctic marine mammal population status, sea ice habitat loss, and
conservation recommendations for the 21st century. Conservation Biology, 29(3), 724-737.
doi:10.1111/cobi.12474.
Lammers, M.O., W.W.L. Au, & D.L. Herzing. (2003). The broadband social acoustic signaling behavior of
spinner and spotted dolphins. The Journal of the Acoustical Society of America, 114(3), 1629.
Lang, T.G. (1966). Hydrodynamic analysis of cetacean performance. In K.S. Norris, (Ed.). Whales,
dolphins, and porpoises. Berkeley, CA: University of California Press.
Laran, S., Joiris, C., Gannier, A. & Kenney, R. D. (2010). Seasonal estimates of densities and predation
rates of cetaceans in the Ligurian Sea, northwestern Mediterranean Sea: An initial examination.
Journal of Cetacean Research and Management, 11, 31-40.

LOA and Rulemaking Application Under the MMPA for Use of SURTASS LFA Sonar
15-34 Literature Cited
Lauriano, G., Pierantonio, N., Donovan, G., & Panigada, S. (2014). Abundance and distribution of
Tursiops truncatus in the Western Mediterranean Sea: An assessment towards the Marine
Strategy Framework Directive requirements. Marine Environmental Research 100, 86-93.
<http://dx.doi.org/10.1016/j.marenvres.2014.04.001>.
Laws, R. M. (1994). History and present status of southern elephant seal populations. Pages 49-65 in B.J.
Le Boeuf and R.M. Laws. Elephant seals: population ecology, behavior and physiology. Berkeley,
CA: University of California Press.
Lawson, J. W., and Gosselin, J.-F. (2009). Distribution and preliminary abundance estimates for cetaceans
seen during Canada’s Marine megafauna survey-A component of the 2007 TNASS. (Canadian
Scientific Advisory Secretariat Research Document 2009/031).
Leatherwood, J.S., & Dalheim, M. E. (1978). Worldwide distribution of pilot whales and killer whales.
NOSC Technical Note 443. Naval Ocean Systems Center (NOSC), San Diego, California.
Leatherwood, S., & Reeves, R. R. (1983). The Sierra Club handbook of whales and dolphins. San
Francisco, CA: Sierra Club Books.
LeDuc, R. G. (2009). Delphinids, overview. Pages 298-302 in W.F. Perrin, B. Wursig, & H.G.M. Thewissen,
(Eds.) Encyclopedia of marine mammals, 2nd ed. San Diego, CA: Academic Press.
Lee, O., Andrews, R. D., Burkanov, V. N., & Davis, R. W. (2014). Ontogeny of early diving and foraging
behavior of northern fur seal (Callorhinus ursinus) pups from Bering Island, Russia. Marine
Biology, 161(5), 1165-1178. doi:10.1007/s00227-014-2408-8.
LGL (LGL Limited, Environmental Research Associates). (2008). Environmental assessment of a marine
geophysical survey by the R/V Marcus G. Langseth in Southeast Asia, March–July 2009.
LGL. (2011). Environmental assessment of a low-energy marine geophysical survey by the R/V Thompson
in the western tropical Pacific Ocean, November–December 2011.
Lima, I. M. S. d., de Andrade, L. G., de Carvalho, R. R., Lailson-Brito, Jr., J., & de Freitas Azevedo, A.
(2012). Characteristics of whistles from rough-toothed dolphins (Steno bredanensis) in Rio de
Janeiro coast, southeastern Brazil. The Journal of the Acoustical Society of America 131(5),
4173-4181. doi:10.1121/1.3701878.
Ling, J. K. (2009). Australian sea lion. Pages 58-61 in W. F. Perrin, B. Würsig, & H. G. M. Thewissen, (Eds.).
Encyclopedia of marine mammals, 2nd ed. San Diego, CA: Academic Press.
Linnenschmidt, M., Teilmann, J., Akamatsu, T., Dietz, R., & Miller, L. A. (2013). Biosonar, dive, and
foraging activity of satellite tracked harbor porpoises (Phocoena phocoena). Marine Mammal
Science, 29(2), E77-E97. doi:10.1111/j.1748-7692.2012.00592.x.
Lipsky, J. D. (2009). Right whale dolphins (Lissodelphis borealis and L. peronii). Pages 958-962 in W.F.
Perrin, B. Wursig, and J.G.M. Thewissen, (Eds.). Encyclopedia of marine mammals, 2nd edition.
San Diego, CA: Academic Press.
Ljungblad, D. K., P. D. Scoggins, & W. G. Gilmartin. (1982). Auditory thresholds of a captive eastern
Pacific bottle-nosed dolphin, Tursiops spp. The Journal of the Acoustical Society of America,
72(6), 1726-1729.
Lockyer, C. (1984). Review of baleen whale (Mysticeti) reproduction and implications for management.
Report of the International Whaling Commission, Special Issue 6, 27-50.
LOA and Rulemaking Application Under the MMPA for Use of SURTASS LFA Sonar
15-35 Literature Cited
Lockyer, C., & Morris, R. (1987). Observations on diving behavior and swimming speeds in a wild juvenile Tursiops truncatus. Aquatic Mammals, 13, 31-35.
Loughlin, T. R. (2009). Stellar's sea lion (Eumetopias jubatus). Pages 1107-1110 in W.F. Perrin, B. Wursig,
& J.G.M. Thewissen, (Eds.). Encyclopedia of marine mammals, 2nd ed. San Diego, CA: Academic
Press.
Lowry, L. F., Frost, K. J., Davis, R., DeMaster, D. P., & Suydam, R. S. (1998). Movements and behavior of
satellite-tagged spotted seals (Phoca largha) in the Bering and Chukchi Seas. Polar Biology,
19(4), 221-230.
Lydersen, C. (1991). Monitoring ringed seal (Phoca hispida) activity by means of acoustic telemetry.
Canadian Journal of Zoology, 69(5), 1178-1182.
Lydersen, C.,& Kovacs, K. M. (1993). Diving behaviour of lactating harp seal, Phoca groenlandica, females
from the Gulf of St Lawrence, Canada. Animal Behaviour, 46,1213-1221.
Lynn, S. K., & Reiss, D. L. (1992). Pulse sequence and whistle production by two captive beaked whales,
Mesoplodon species. Marine Mammal Science, 8(3), 299-305.
Maclean, S. A. (2002). Occurrence, behavior and genetic diversity of bowhead whales in the western Sea
of Okhotsk, Russia. (Unpublished Master’s thesis). Texas A&M University, College Station, TX.
Madsen, P. T., & Mohl, B. (2000). Sperm whales (Physeter catodon L-1758) do not react to sounds from
detonators. The Journal of the Acoustical Society of America 107, 668-671.
Madsen, P. T., Kerr, I., & Payne, R. (2004a). Echolocation clicks of two free-ranging, oceanic delphinids
with different food preferences: false killer whales Pseudorca crassidens and Risso's dolphins
Grampus griseus. The Journal of Experimental Biology, 207(11), 1811-1823.
Madsen, P. T., Kerr, I., & Payne, R. (2004b). Source parameter estimates of echolocation clicks from wild
pygmy killer whales (Feresa attenuata) (L). The Journal of the Acoustical Society of America,
116(4), 1909-1912.
Madsen, P. T., R. Payne, N. U. Kristiansen, M. Wahlberg, I. Kerr, & B. Mohl. (2002a). Sperm whale sound
production studied with ultrasound time/depth-recording tags. Journal of Experimental
Biology, 205(13), 1899-1906.
Madsen, P. T., M. Wahlberg, & B. Møhl. (2002b). Male sperm whale (Physeter macrocephalus) acoustics
in a high- latitude habitat: Implications for echolocation and communication. Behavioral
Ecology and Sociobiology, 53(1), 31-41.
Magnúsdóttir, E. E., M. H. Rasmussen, M. O. Lammers, & J. Svavarsson. (2014). Humpback whale songs
during winter in subarctic waters. Polar Biology, 37(3), 427-433. doi:10.1007/s00300-014-1448-
3.
Malme, C.I., P.R. Miles, P. Tyack, C.W. Clark, & J.E. Bird. (1985). Investigation of the potential effects of
underwater noise from petroleum industry activities on feeding humpback whale behavior.
Prepared by Bolt, Beranek and Newman, Inc., Cambridge, MA for U.S. Department of Interior,
Minerals Management Service, Alaska OCS Office.
Maresh, J. L., S. E. Simmons, D. E. Crocker, B. I. McDonald, T. M. Williams, and D. P. Costa. (2014). Free-
swimming northern elephant seals have low field metabolic rates that are sensitive to an
increased cost of transport. The Journal of Experimental Biology, 217(Pt 9), 1485-1495.

LOA and Rulemaking Application Under the MMPA for Use of SURTASS LFA Sonar
15-36 Literature Cited
Marine Conservation Institute. (2017b). SeSeaStates 2017 report. Retrieved from <http://mpatlas.org/>.
Marine Mammal Commission (MMC). (2007). Marine Mammal Cmmission: Annual report to Congress—
2006. Bethesda, Maryland: U.S. Marine Mammal Commission.
MMC. (2016). Survey of Federally-Funded Marine Mammal Research and Conservation: Fiscal Year 2014.
Bethesda, Maryland: U.S. Marine Mammal Commission.
Markowitz, T. M. (2004). Social organization of the New Zealand dusky dolphin. Ph.D. dissertation, Texas
A&M University, Galveston, TX. 278 pp.
Martin, S. W., C. R. Martin, B. M. Matsuyama, & E. E. Henderson. (2015). Minke whales (Balaenoptera
acutorostrata) respond to navy training. The Journal of the Acoustical Society of America,
137(5), 2533. doi:10.1121/1.4919319.
Martin Lopez, L. M., Miller, P. J., Aguilar de Soto, N., & Johnson, M. (2015). Gait switches in deep-diving
beaked whales: biomechanical strategies for long-duration dives. The Journal of Experimental
Biology, 218(Pt 9), 1325-1338. doi:10.1242/jeb.106013.
Masaki, Y. (1977). The separation of the stock units of sei whales in the North Pacific. Report of the
International Whaling Commission Special Issue, 1, 71-79.
Mate, B. R., V. Y. Ilyashenko, A. L. Bradford, V. V. Vertyankin, G. A. Tsidulko, V. V. Rozhnov, & L. M.
Irvine. (2015). Critically endangered western gray whales migrate to the eastern North Pacific.
Biology Letters, 11(4), 20150071. doi:10.1098/rsbl.2015.0071.
Mate, B.R., G.K. Krutzikowsky, & M.H. Winsor. (2000). Satellite-monitored movements of radio-tagged
bowhead whales in the Beaufort and Chukchi seas during the late-summer feeding season and
fall migration. Canadian Journal of Zoology, 78(7), 1168-1181.
Mate, B. R., B. A. Lagerquist, & J. Calambokidis. (1999). Movements of North Pacific blue whales during
the feeding season off southern California and their southern fall migration. Marine Mammal
Science, 15(4), 1246-1257.
Mate, B. R., S. L. Nieukirk, & S. D. Kraus. (1997). Satellite-monitored movements of the northern right
whale. Journal of Wildlife Management, 61(4), 1393-1405.
Mate, B.R., S. Nieukirk, R. Mesecar, & T. Martin. (1992). Application of remote sensing methods for
tracking large cetaceans: North Atlantic right whales (Eubalaena glacialis). U.S. Departmant of
the Interior, Minerals Management Service, Alaska and Atlantic OCS Regional Offices, Herndon,
Virginia. Herndon, VA: U.S. Departmant of the Interior, Minerals Management Service, AK and
Atlantic OCS Regional Offices, Herndon, VA.
Mate, B.R., K.A. Rossbach, S.L. Nieukirk, R.S. Wells, A.B. Irvine, M.D. Scott, & A.J. Read. (1995). Satellite-
monitored movements and dive behavior of a bottlenose dolphin (Tursiops truncatus) in Tampa
Bay, Florida. Marine Mammal Science, 11(4), 452-463.
Mate, B.R., K.M. Stafford, R. Nawojchik, & J.L. Dunn. (1994). Movements and dive behavior of a satellite-
monitored Atlantic white-sided dolphin (Lagenorhynchus acutus) in the Gulf of Maine. Marine
Mammal Science, 10(1), 116-121.
McAlpine, D. F. (2009). Pygmy and dwarf sperm whales Kogia breviceps and K. sima. In W. F. Perrin, B.
Würsig, and J. G. M. Thewissen (Eds.), Encyclopedia of marine mammals (pp. 936-938). New
York, NY: Academic Press.
LOA and Rulemaking Application Under the MMPA for Use of SURTASS LFA Sonar
15-37 Literature Cited
McCauley, R.D., & Jenner, C. (2010). Migratory patterns and estimated population size of pygmy blue
whales (Balaenoptera musculus brevicauda) traversing the Western Australian coast based on
passive acoustics. Paper SC/62/SH26 presented to the Scientific Committee, International
Whaling Commission.
McCowan, B., & Reiss, D. (1995). Quantitative comparison of whistle repertoires from captive adult
bottlenose dolphins (Delphinidae, Tursiops truncatus): A re-evaluation of the signature whistle
hypothesis. Ethology, 100(3), 194-209.
McDonald, M. A., & Fox, C. G. (1999). Passive acoustic methods applied to fin whale population density
estimation. The Journal of the Acoustical Society of America, 105(5), 2643-2651.
McDonald, M. A., & Moore, S. E. (2002). Calls recorded from North Pacific right whales (Eubalaena
japonica) in the eastern Bering Sea. Journal of Cetacean Research and Management, 4(3), 261-
266.
McDonald, B. I., & Ponganis, P. J. (2014). Deep-diving sea lions exhibit extreme bradycardia in long-
duration dives. The Journal of Experimental Biology, 217(Pt 9), 1525-1534.
doi:10.1242/jeb.098558.
McDonald, M. A., J. A. Hildebrand, and S. C. Webb. (1995). Blue and fin whales observed on a seafloor
array in the Northeast Pacific. Journal of the Accoustical Society of America, 98(2), 712-721.
McDonald, M.A., J.A. Hildebrand, S.M. Wiggins, D. Thiele, D. Glasgow and S.E. Moore. (2005). Sei whale
sounds recorded in the Antarctic. The Journal of the Acoustical Society of America, 118(6),
3941-3945.
McDonald, M. A., J. A. Hildebrand, & S. M. Wiggins. (2006). Increases in deep ocean ambient noise in the
Northeast Pacific west of San Nicolas Island, California. The Journal of the Acoustical Society of
America, 120(2), 711-718.
McSweeney, D. J., Baird, R. W., Mahaffy, S. D., Webster, D. L., & Schorr, G. S. (2009). Site fidelity and
association patterns of a rare species: Pygmy killer whales (Feresa attenuata) in the main
Hawaiian Islands. Marine Mammal Science, 25(3), 557-572. doi: 10.1111/j.1748-7692.2008.00267.x.
Mead, J. G. (2009). Shepherd's beaked whale. Pages 1011-1014 in W.F. Perrin, B.G. Wursig, & J.G.M.
Thewissen, eds. Encyclopedia of marine mammals, 2nd ed. San Diego, CA: Academic Press.
Melcón, M. L., A. J. Cummins, S. M. Kerosky, L. K. Roche, S. M. Wiggins, and J. A. Hildebrand. (2012). Blue
whales respond to anthropogenic noise. PLoS ONE, 7(2), 1-6.
doi:10.1371/journal.pone.0032681.t00110.1371/journal.pone.0032681.g001.
Mellinger, D. K., & Clark, C. W. (2000). Recognizing transient low-frequency whale sounds by
spectrogram correlation. The Journal of the Acoustical Society of America, 107(6), 3518-3529.
Mellinger, D. K., & Clark, C. W. (2003). Blue whale (Balaenoptera musculus) sounds from the North
Atlantic. The Journal of the Acoustical Society of America, 114(2), 1108-1119.
Mellinger, D.K., C.D. Carson, & C.W. Clark. (2000). Characteristics of minke whale (Balaenoptera
acutorostrata) pulse trains recorded near Puerto Rico. Marine Mammal Science, 16(4), 739-
756.
Merkens, K., Mann, D., Janik, V. M., Claridge, D., Hill, M., & Oleson, E. (2018). Clicks of dwarf sperm
whales (Kogia sima). Marine Mammal Science. doi:10.1111/mms.12488.

LOA and Rulemaking Application Under the MMPA for Use of SURTASS LFA Sonar
15-38 Literature Cited
Mignucci-Giannoni, A. A., & Odell, D. K. 2001. Tropical and subtropical records of hooded seals
(Cystophora cristata) dispel the myth of extant Caribbean monk seals (Monachus tropicalis).
Bulletin of Marine Science, 68(1), 47-58.
Miksis-Olds, J.L., Bradley, D.L., and Niu, X.M. (2013). Decadal trends in Indian Ocean ambient sound. The
Journal of the Acoustical Society of America, 134(5), 3464-3475. doi:10.1121/1.4821537.
Miksis-Olds, J.L., and Nichols, S.M. (2016). Is low frequency ocean sound increasing globally? The Journal
of the Acoustical Society of America, 139(1), 501-511. doi:10.1121/1.4938237.
Miller, E. H., & Job, D. A. (1992). Airborne acoustic communication in the Hawaiian monk seal, Monachus
schauinslandi. Pages 485-531 in J.A. Thomas, R.A. Kastelein, and A.Y. Supin, (Eds). Marine
mammal sensory systems. New York, NY: Plenum Press.
Miller, P. J., P. H. Kvadsheim, F. P. Lam, P. L. Tyack, C. Cure, S. L. DeRuiter, L. Kleivane, L. D. Sivle, I. S. P.
van, F. Visser, P. J. Wensveen, A. M. von Benda-Beckmann, L. M. Martin Lopez, T. Narazaki, & S.
K. Hooker. (2015). First indications that northern bottlenose whales are sensitive to behavioural
disturbance from anthropogenic noise. Royal Society Open Science 2(6), 140484.
Miller, P .J. O., & Bain, D. E. (2000). Within-pod variation in the sound production of a pod of killer
whales, Orcinus orca. Animal Behaviour, 60(5), 617-628.
Miller, P. J. O., R. N. Antunes, P. J. Wensveen, F. I. P. Samarra, A. Catarina Alves, P. L. Tyack, P. H.
Kvadsheim, L. Kleivane, F.-P. A. Lam, M. A. Ainslie, & L. Thomas. (2014). Dose-response
relationships for the onset of avoidance of sonar by free-ranging killer whales. The Journal of
the Acoustical Society of America, 135(2), 975-993.
Miller, P. J. O., P. H. Kvadsheim, F. P. Lam, P. J. Wensveen, R. Antunes, A. C. Alves, F. Visser, L. Kleivane,
P. L. Tyack, & L. D. Sivle. (2012). The severity of behavioral changes observed during
experimental exposures of killer (Orcinus orca), long-finned pilot (Globicephala melas), and
sperm (Physeter macrocephalus) whales to naval sonar. Aquatic Mammals, 38(4), 362-401.
Miller, P. J. O. M., A. D. Shapiro, & V. B. Deecke. (2010). The diving behaviour of mammal-eating killer
whales (Orcinus orca): Variations with ecological not physiological factors. Canadian Journal of
Zoology, 88(11), 1103-1112. doi:10.1139/z10-080.
Minamikawa, S., Iwasaki, T., & Kishiro. T. (2007). Diving behaviour of a Baird’s beaked whale, Berardius
bairdii, in the slope water region of the western North Pacific: first dive records using a data
logger. Fisheries Oceanography, 16(6), 573-577. doi:10.1111/j.1365-2419.2007.00456.x.
Minamikawa, S., Watanabe, H., & Iwasaki, T. (2013). Diving behavior of a false killer whale, Pseudorca
crassidens, in the Kuroshio-Oyashio transition region and the Kuroshio front region of the
western North Pacific. Marine Mammal Science, 29(1), 177-185. doi:10.1111/j.1748-
7692.2011.00532.x.
Minton, G., Collins, T. J. Q., Pomilla, C., Findlay, K. P., Rosenbaum, H. C., Baldwin, R. & Brownell, Jr., R. L.
(2008). Megaptera novaeangliae, Arabian Sea subpopulation. IUCN Red List of Threatened
Species. <http://www.iucnredlist.org/details/132835>.

LOA and Rulemaking Application Under the MMPA for Use of SURTASS LFA Sonar
15-39 Literature Cited
Minton, G., Collins, T. J. Q., Findlay, K. P., Ersts, P. J., Rosenbaum, H. C., Berggren, P., & Baldwin, R. M.
(2011). Seasonal distribution, abundance, habitat use and population identity of humpback
whales in Oman. Journal of Cetacean Research and Management, Special Issue on Southern
Hemisphere Humpback Whales, 185–198.
Miralles, R., G. Lara, J. Antonio Esteban, & A. Rodriguez. (2012). The pulsed to tonal strength parameter
and its importance in characterizing and classifying Beluga whale sounds. Journal of the
Acoustical Society of America, 131(3), 2173-2179. doi:10.1121/1.3682056.
Mitchell, E. D., (Ed). 1975. Review of biology and fisheries for smaller cetaceans. Report of the meeting
on smaller cetaceans in Montreal, April 1-11, 1974. Journal of the Fisheries Research Board of
Canada, 32, 889-983.
Mitchell, E. D. (1977). Initial population size of bowhead whale Balaena mysticetus stocks: cumulative
estimates. Paper SC/29/33 presented to the Internationl Whaling Commission Scientific
Committee, London 1976 (unpublished).
Mitchell, E., & Chapman, D. G. (1977). Preliminary assessment of stocks of northwest Atlantic sei whales
(Balaenoptera borealis). Report of the International Whaling Commission (Special Issue 1), 117-
120.
Miyashita, T. (1986). Population estimates of dolphins using research vessels data. In T. Tamura, S.
Ohsumi, & S. Arai (Eds.), Report of the investigation in search of resolution of the dolphin-
fishery conflict in the Iki Island area (pages 202-213). Tokyo, Japan: The Investigating
Committee.
Miyashita, T. (1993). Abundance of dolphin stocks in the western North Pacific taken by the Japanese
drive fishery. International Whaling Commission, 43, 417-437.
Miyashita, T., & Okamura, H. (2011). Abundance estimates of common minke whales using the Japanese
dedicated sighting survey data for RMP Implementation and CLA—Sea of Japan and Sea of
Okhotsk. SC/63/RMP11. 34 pages.
Miyashita, T., V. L. Vladimirov, & H. Kato. (2005). Current status of cetaceans in the Sea of Okhotsk,
Japanese and Russian survey results. (S3-2489). Presentation and abstract, North Pacific Marine
Science Organization (PICES) fourteen annual meeting, September 29–October 9, 2005,
Valdivostock, Russia: <http://www.pices.int/publications/presentations/PICES_14/S3/
Miyashita.pdf>.
Miyazaki, N. (2002). Ringed, Caspian, and Baikal seals Pusa hispida, P. caspica, and P. sibirica. Pages
1033-1037 in Perrin, W. F., Wursig, B., and Thewissen, J. G. M. (eds). Encyclopedia of marine
mammals. San Diego, CA: Academic Press.
Miyazaki, N.,& Perrin, W. F. (1994). Rough-toothed dolphin, Steno bredanensis (Lesson, 1828). Pages 1-
21 in S.H. Ridgeway and R. Harrison, eds. Handbook of marine mammals, Volume 5: The first
book of dolphins. San Diego, CA: Academic Press.
Mizroch, S. A., Rice, D. W., Zwiefelhofer, D., Waite, J. M., & Perryman, W. L. (2009). Distribution and
movements of fin whales in the North Pacific Ocean. Mammal Review, 39(3), 193-227.
LOA and Rulemaking Application Under the MMPA for Use of SURTASS LFA Sonar
15-40 Literature Cited
Mizroch, S.A., Conn, P.B., & Rice, D.W. (2015). The mysterious sei whale: Its distribution, movements
and population decline in the North Pacific revealed by whaling data and recoveries of
Discovery-type marks. [Presentation]. Paper SC/66a/IA/14 presented at the 66a IWC Scientific
Committee Meeting in San Diego, CA, 22 May to 3 June 2015.
Mizuno, A.W., A. Wada, T. Ishinazaka, K. Hattori, Y. Watanabe, & N. Ohtaishi. (2002). Distribution and
abundance of spotted seals Phoca largha and ribbon seals Phoca fasciata in the southern Sea
of Okhotsk. Ecological Research, 17, 79-96.
Mobley, J. R., Jr., Spitz, S., & Grotefendt, R. A. (2001). Abundance of humpback whales in Hawaiian
waters: Results of 1993-2000 aerial surveys. Honolulu, HI: Hawaiian Islands Humpback Whale
National Marine Sanctuary. 16 pages.
Møhl, B., Wahlberg, M., Madsen, P. T., Heerfordt, A., & Lund, A. (2003). The monopulsed nature of
sperm whale clicks. The Journal of the Acoustical Society of America 114, 1143-1154.
Møhl, B., Wahlberg, M., Madsen, P. T., Miller, L. A., & Surlykke, A. (2000). Sperm whale clicks:
Directionality and source level revisited. The Journal of the Acoustical Society of America
107(1), 638-648.
Montie, E.W., C.A. Manire, & Mann, D.A. (2011). Live CT imaging of sound reception anatomy and
hearing measurements in the pygmy killer whale, Feresa attenuata. The Journal of
Experimental Biology 214, 945-955.
Mooney, T.A., P.E. Nachtigall, M. Castellote, K.A. Taylor, A.F. Pacini, & J.A Esteban. (2008). Hearing
pathways and directional sensitivity of the beluga whale, Delphinapterus leucas. Journal of
Experimental Marine Biology and Ecology, 362(2), 108-116.
Mooney, T. A., Tyack, P., Baird, R. W., & Nachtigall, P. E. (2012). Acoustic behavior, baseline ecology and
habitat use of pelagic odontocete species of concern. Annual progress report to the Office of
Naval Research, FY 2013. Award Number: N000141110612. Arlington, VA: Office of Naval
Research. Retrieved from <http://www.onr.navy.mil/reports/FY13/mbmoone1.pdf>.
Mooney, T. A., W. C. Yang, H. Y. Yu, D. R. Ketten, & I. F. Jen. (2015). Hearing abilities and sound reception
of broadband sounds in an adult Risso's dolphin (Grampus griseus). Journal of Comparative
Physiology. A, Neuroethology, Sensory, Neural, and Behavioral Physiology, 201(8), 751-761.
doi:10.1007/s00359-015-1011-x.
Moore, J. E., & Barlow, J. (2011). Bayesian state-space model of fin whale abundance trends from a
1991-2008 time series of line-transect surveys in the California Current. Journal of Applied
Ecology, 48, 1195-1205.
Moore, J. E., & Barlow, J. P. (2013). Declining abundance of beaked whales (family Ziphiidae) in the
California Current large marine ecosystem. PLoS ONE, 8(1), e52770.
doi:10.1371/journal.pone.0052770.
Moore J. E., & Barlow, J. P. (2014). Improved abundance and trend estimates for sperm whales in the
eastern North Pacific from Bayesian hierarchical modeling. Endangered Species Research, 25,
141-150.
Moore, P. W. B, & Schusterman, R. J. (1987). Audiometric assessment of northern fur seals, Callorhinus
ursinus. Marine Mammal Science, 3(1), 31-53.
LOA and Rulemaking Application Under the MMPA for Use of SURTASS LFA Sonar
15-41 Literature Cited
Moore, S. E. & Reeves., R. R. (1993). Distribution and movement. Pages 313-386 in J. J. Burns, J. J.
Montague and C. J. Cowles, (Eds). The bowhead whale. Lawrence, KS: Society for Marine
Mammalogy.
Moore, S. E., & Ridgway, S. H. (1995). Whistles produced by common dolphins from the Southern
California Bight. Aquatic Mammals, 21, 55-55.
Moore, S. E., M. E. Dahlheim, K. M. Stafford, C. G. Fox, H. W. Braham, M. A. McDonald, and J. Thomason.
(1999). Acoustic and visual detection of large whales in the eastern North Pacific Ocean. Seattle,
WA.
Morano, J. L., D. P. Salisbury, A. N. Rice, K. L. Conklin, K. L. Falk, and C. W. Clark. (2012). Seasonal and
geographical patterns of fin whale song in the western North Atlantic Ocean. The Journal of the
Acoustical Society of America, 132(2), 1207-1212. doi:10.1121/1.4730890.
Moreland, E., Cameron, M., & Boveng, P. (2012). Bering Okhotsk Seal Surveys (BOSS): Joint U.S.-Russian
aerial surveys. Alaska Fisheries Science Center Quarterly Report, April‐May‐June 2012.
Moretti, D., L. Thomas, T. Marques, J. Harwood, A. Dilley, B. Neales, J. Shaffer, E. McCarthy, L. New, S.
Jarvis, and R. Morrissey. (2014). A risk function for behavioral disruption of Blainville's beaked
whales (Mesoplodon densirostris) from mid-frequency active sonar. PLoS ONE, 9(1), e85064.
Mori, M., & Butterworth, D. S. (2006). A first step towards modelling the krill-predator dynamics of the
Antarctic ecosystem. CCAMLR Science, 13, 217-277.
Morisaka, T., M. Shinohara, F. Nakahara, T. Akamatsu. 2005. Effects of ambient noise on the whistles of
Indo-Pacific bottlenose dolphin populations. Journal of Mammalogy, 86(3), 541-546.
Morisaka, T., M. Shinohara, F. Nakahara, and T. Akamatsu. 2005a. Geographic variations in the whistles
among three Indo-Pacific bottlenose dolphin Tursiops aduncus populations in Japan. Fisheries
Science, 71, 568–576.
Morisaka, T., Shinohara, M., Nakahara, F., & Akamatsu, T. (2005b). Geographic variations in the whistles
among three Indo-Pacific bottlenose dolphin Tursiops aduncus populations in Japan. Fisheries
Science, 71(3), 568-576.
Mulsow, J., and C. Reichmuth. 2010. Psychophysical and electrophysiological aerial audiograms of a
Steller sea lion (Eumetopias jubatus). The Journal of the Acoustical Society of America
127(4):2692-2701.
Mulsow, J., Houser, D. S., & Finneran, J. J. (2012). Underwater psychophysical audiogram of a young
male California sea lion (Zalophus californianus). The Journal of the Acoustical Society of
America, 131(5), 4182-4187. doi:10.1121/1.3699195.
Munger, L. M., S. M. Wiggins, & J. A. Hildebrand. (2011). North Pacific right whale up-call source levels
and propagation distance on the southeastern Bering Sea shelf. The Journal of the Acoustical
Society of America, 129(6), 4047. doi:10.1121/1.3557060.
Murase, H., Hakamada, T., Matsuoka, K., Nishiwaki, S., Inagake, D., Okazaki, M., . . . Kitakado, T. (2014).
Distribution of sei whales (Balaenoptera borealis) in the subarctic–subtropical transition area of
the western North Pacific in relation to oceanic fronts. Deep Sea Research Part II: Topical
Studies in Oceanography, 107, 22-28. doi: 10.1016/j.dsr2.2014.05.002.

LOA and Rulemaking Application Under the MMPA for Use of SURTASS LFA Sonar
15-42 Literature Cited
Murase, H., Tamura, T., Otani, S., & Nishiwaki, S. (2016). Satellite tracking of Bryde’s whales
Balaenoptera edeni in the offshore western North Pacific in summer 2006 and 2008. Fisheries
Science, 82(1), 35-45. doi:10.1007/s12562-015-0946-8.
Murray, A., A. N. Rice, & C. W. Clark. (2013). Extended seasonal occurrence of humpback whales in
Massachusetts Bay. Journal of the Marine Biological Association of the United Kingdom, 94(06),
1117-1125. doi:10.1017/s0025315412001968.
Murray, S.O., E. Mercado, & H.L. Roitblat. (1998). Characterizing the graded structure of false killer
whale (Pseudorca crassidens) vocalizations. The Journal of the Acoustical Society of America,
104(3, Part I), 1679-1688.
Muto, M. M., Helker, V. T., Angliss, R. P., Allen, B. A., Boveng, P. L., Breiwick, J. M., Cameron, M. F.,
Clapham, P. J., Dahle, S. P., Dahlheim, M. E., Fadely, B. S., Ferguson, M. C., Fritz, L. W., Hobbs, R.
C., Ivashchenko, Y. V., Kennedy, A. S., London, J. M., Mizroch, S. A., Ream, R. R., Richmond, E. L.,
Shelden, K. E. W., Towell, R. G., Wade, P. R., Waite, J. M., & Zerbini, A. N. (2018). Draft Alaska
marine mammal stock assessments, 2017. NOAA Technical Memorandum NMFS-AFSC-X.
Seattle, WA: Alaska Fishery Science Center, National Marine Fisheries Service. 176 pages.
Retrieved from <https://www.fisheries.noaa.gov/national/marine-mammal-protection/draft-
marine-mammal-stock-assessment-reports>.
Nachtigall, P. E., & Supin, A. Y. (2008). A false killer whale adjusts its hearing when it echolocates. Journal
of Experimental Biology, 211(11), 1714-1718.
Nachtigall, P. E., & Supin, A. Y. (2013). A false killer whale reduces its hearing sensitivity when a loud
sound is preceded by a warning. The Journal of Experimental Biology, 216(Pt 16), 3062-3070.
doi:10.1242/jeb.085068.
Nachtigall, P. E., & Supin, A. Y. (2015). Conditioned frequency-dependent hearing sensitivity reduction in
the bottlenose dolphin (Tursiops truncatus). The Journal of Experimental Biology, 218(Pt 7),
999-1005. doi:10.1242/jeb.114066.
Nachtigal, P.E., W.W.L. Au, J.L. Pawloski, & P.W.B. Moore. (1995). Risso's dolphin (Grampus griseus)
hearing thresholds in Kaneohe Bay, Hawaii. Pages 49-53 in R.A. Kastelein, J.A. Thomas, and P.E.
Nachtigall, (Eds). Sensory systems of aquatic mammals. Woerden, Netherlands: De Spil
Publication.
Nachtigall, P. E., Lemonds, D. W., & Roitblat, H. L. (2000). Psychoacoustic studies of dolphin and whale
hearing Hearing by whales and dolphins. New York, NY: Springer-Verlag.
Nachtigall, P.E., T.A. Mooney, K.A. Taylor, L.A. Miller, M.H. Rasmussen, T. Akamatsu, J. Teilmann, M.
Linnenschmidt, and G.A. Vikingsson. (2008). Shipboard measurements of the hearing of the
white-beaked dolphin Lagenorhynchus albirostris. Journal of Experimental Biology 211(4), 642-
647.
Nachtigall, P. E., Yuen, M. M. L., Mooney, T. A., & Taylor, K. A. (2005). Hearing measurements from a
stranded infant Risso's dolphin, Grampus griseus. Journal of Experimental Biology, 208(21),
4181-4188.

LOA and Rulemaking Application Under the MMPA for Use of SURTASS LFA Sonar
15-43 Literature Cited
National Marine Fisheries Service (NMFS). (2018a). Hawaiian monk seal population at a glance;
Hawaiian monk seal research. National Marine Fisheries Service, Pacific Islands Fishery Science
Center. Retrieved from
<https://www.pifsc.noaa.gov/hawaiian_monk_seal/population_at_a_glance.php>.
NMFS. (2018b). 2018 Revision to: Technical guidance for assessing the effects of anthropogenic sound on
marine mammal hearing (Version 2.0): Underwater acoustic thresholds for onset of permanent
and temporary threshold shifts. Silver Spring, MD: National Marine Fisheries Service, National
Oceanic and Atmospheric Administration. NOAA Technical Memorandum NMFS-OPR-59, 178 p.
Retrieved from < https://www.fisheries.noaa.gov/webdam/download/75962998>.
NMFS. (2018c). North Pacific right whale—Population highlights. Retrieved from
<https://www.fisheries.noaa.gov/species/north-pacific-right-whale/highlights>.
NMFS. (2018d). Hawaiian monk seal population—Northwestern Hawaiian Islands. Pacific Islands Fishery
Science Center, National Marine Fisheries Service. Retrieved from
<https://www.pifsc.noaa.gov/hawaiian_monk_seal/nwhi_population.php>.
National Marine Protected Areas Center (NMPAC). (2009a). National marine protected areas center: All
about marine protected areas—The basics. Accessed October 2009.
<http://mpa.gov/all_about_mpa/basics.html>.
NMPAC. (2009b). National marine protected areas center: Inventory of marine protected areas in the
United States. Accessed September 2009. <http://mpa.gov/helpful_resources/inventory.html>.
National Oceanic and Atmospheric Administration (NOAA). (1994). Designated critical habitat; northern
right whale. National Marine Fisheries Service, NOAA. Federal Register, 59(106), 28793-28808.
NOAA. (2002). Taking and importing marine mammals; taking marine mammals incidental to Navy
operations of Surveillance Towed Array Sensor System Low Frequency Active sonar. Final Rule.
National Marine Fisheries Service, National Oceanic and Atmospheric Administration. Federal
Register, 67(136), 46712-46789.
NOAA. (2005). Endangered and threatened wildlife and plants: Endangered status for Southern Resident
Killer whales; Final rule. National Marine Fisheries Service, National Oceanic and Atmospheric
Administration. Federal Register, 70(222), 69903-69912.
NOAA. (2006). Endangered and threatened species; Designation of critical habitat for southern resident
killer whale. Final Rule. National Marine Fisheries Service, National Oceanic and Atmospheric
Administration. Federal Register, 71(229), 69054-69070.
NOAA. (2007). Taking and importing marine mammals; taking marine mammals incidental to Navy
operations of Surveillance Towed Array Sensor System Low Frequency Active sonar. Final rule.
National Marine Fisheries Service, National Oceanic and Atmospheric Administration. Federal
Register, 72(161), 46846-46893.
NOAA. (2011). Endangered and threatened species; Designation of critical habitat for Cookm Inlet
Beluga Whale. Final rule. National Marine Fisheries Service, National Oceanic and Atmospheric
Administration. Federal Register, 76(69), 20180-20214.

LOA and Rulemaking Application Under the MMPA for Use of SURTASS LFA Sonar
15-44 Literature Cited
NOAA. (2012a). Taking and importing marine mammals: Taking marine mammals incidental to U.S. Navy
operations of Surveillance Towed Array Sensor System Low Frequency Active sonar: Final rule,
50 CFR Part 218. Federal Register, 77(161), 50290-50322. <http://www.surtass-lfa-eis.com/wp-
content/uploads/2018/02/LFA-Final-MMPA-Rule_2012_Federal-Register.pdf>.
NOAA. (2012b). Endangered and threatened wildlife and plants; Endangered status for the Main
Hawaiian Islands Insular false killer whale distinct population segment; Final rule. National
Marine Fisheries Service, National Oceanic and Atmospheric Administration. Federal Register,
77(229), 70915-70939.
NOAA. (2015a). Endangered and threatened species: Final rulemaking to revise critical habitat for
Hawaiian monk seals. Federal Register, 80(162), 50926-50988.
NOAA. (2015b). Endangered and threatened species; Identification of 14 distinct population segments of
the humpback whale (Megaptera novaeangliae) and proposed revision of species-wide listing;
Proposed rule. National Marine Fisheries Service, National Oceanic and Atmospheric
Administration. Federal Register 80(76):22304-22356.
NOAA. (2015c). Endangered and threatened species: Final rulemaking to revise critical habitat for
Hawaiian monk seals. National Marine Fisheries Service; National Oceanic and Atmospheric
Administration. Federal Register, 80(162), 50926-50988.
NOAA. (2018). Endangered and threatened wildlife and plants: Final rulemaking to designate critical
habitat for the Main Hawaiian Islands insular false killer whale distinct population segment;
Final rule. National Marine Fisheries Service, National Oceanic and Atmospheric Administration.
Federal Register, 83(142), 35062-35095.
National Research Council (NRC). (2005). Marine mammal populations and ocean noise: Determining
when noise causes biologically significant effects. Washington, D.C.: National Research Council.
Nedwell, J.R., B. Edwards, A.W.H. Turnpenny, and J. Gordon. (2004). Fish and marine mammal
audiograms: A summary of available information. Subacoustech Report Number 534R0214.
281 pp.
Nelson, D.R., & Lien, J. (1996). The status of the long-finned pilot whale, Globicephala melas, in Canada.
Canadian Field-Naturalist, 110(3), 511-524.
Nemiroff, L., & Whitehead, H. (2009). Structural characteristics of pulsed calls of long-finned pilot whales
Globicephala melas. Bioacoustics, 19(1-2), 67-92.
Nesterenko, V. A., & Katin, I. O. (2008). The spotted seal (Phoca largha ) in the south of the range: The
results and problems of research. Marine mammals of the Holoarctic—Collection of Scientific
Papers after the 5th International Conference, Odessa, Ukraine, 2008, (pp. 386 to 389).
New, L. F., J. S. Clark, D. P. Costa, E. Fleishman, M. A. Hindell, T. Klanjšček, D. Lusseau, S. Kraus, C. R.
McMahon, P. W. Robinson, R. S. Schick, L. K. Schwarz, S. E. Simmons, L. Thomas, P. Tyack, and J.
Harwood. (2014). Using short-term measures of behaviour to estimate long-term fitness of
southern elephant seals. Marine Ecology Progress Series, 496, 99-108.
Niño-Torres, C. A., R. Jorge Urbán, T. Olavarrieta, M. d. P. Blanco-Parra, & K. A. Hobson. (2014). Dietary
preferences of Bryde's whales (Balaenoptera edeni) from the Gulf of California: Aδ13C,δ15N
analysis. Marine Mammal Science, 30(3), 1140-1148. doi:10.1111/mms.12081.

LOA and Rulemaking Application Under the MMPA for Use of SURTASS LFA Sonar
15-45 Literature Cited
Nishiwaki, M. (1972). General biology. In S.H. Ridgway, (Ed). Mammals of the sea: Biology and medicine.
Springfield, IL: Charles C.Thomas Publisher.
Noad, M.J., Dunlop, R.A., Paton, D., & Cato, D.H. (2011). Absolute and relative abundance estimates of
Australian east coast humpback whales (Megaptera novaeangliae) Journal of Cetacean
Research and Management Special issue, 3, 243–252.
Norris, J.C., & S. Leatherwood. (1981). Hearing in the bowhead whale, Balaena mysticetus, as estimated
by cochlear morphology. Pages 745-787 in T.F. Albert, ed. Tissue structural studies and other
investigations on the biology of endangered whales in the Beaufort Sea. Volume II. Contract
number AA851-CTO-22.. Prepared for Bureau of Land Management, Alaska OCS Office,
Anchorage, Alaska by Department of Veterinary Science, University of Maryland, College Park,
Maryland, Research unit 1580.
Norris, K. S. (1969). The echolocation of marine mammals. Pages 391-423 in H.T. Andersen, (Ed). The
biology of marine mammals. New York, NY: Academic Press.
Norris, K. S., & Evans, W. E. (1967). Directionality of echolocation clicks in the rough-toothed porpoise,
Steno bredanensis. Pages 305-316 in W.N. Tavolga,(Ed). Marine bio-acoustics, Volume 2.
Proceedings of the 2nd symposium on marine bio-acoustics held at the American Museum of
Natural History, New York, New York, April 13-15, 1966. Oxford, United Kingdon: Pergamon
Press.
Norris, K. S., & Prescott, J. H. (1961). Observations on Pacific cetaceans of Californian and Mexican
waters. Berkeley, California: University of California Press.
Norris, K. S., & Watkins, W. A. (1971). Underwater sounds of (Arctocephalus philippii), the Juan
Fernandez fur seal. In W. H. Burt (Ed.), Antarctic pinnipedia (pp. 169-171). Washington, D.C.:
American Geophysical Union.
Norris, K.S., B. Würsig, R.S. Wells, & M. Würsig. 1994. The Hawaiian spinner dolphin. Berkeley, California:
University of California Press.
Norris, T. F., Dunleavy, K. J., Yack, T. M., & Ferguson, E. L. (2017). Estimation of minke whale abundance
from an acoustic line transect survey of the Mariana Islands. Marine Mammal Science, 33(2),
574-592. doi: 10.1111/mms.12397
Notarbartolo di Sciara, G. (1983). Bryde's whales (Balaenopteraa edeni, 1878) off eastern Venezuela
(Cetacea, Balaenopteridae). Technical Report 83-153. San Diego, California: Hubbs-Sea World
Research Institute. 47 pages.
Nowacek, D. P., L. H. Thorne, D. W. Johnston, and P. L. Tyack. (2007). Responses of cetaceans to
anthropogenic noise. Mammal Review, 37(2), 81-115.
Odell, D. K., & McClune, K. M. (1999). False killer whale (Pseudorca crassidens [Owen, 1846]). Pages 213-
243 in S.H. Ridgeway and R. Harrison, (Eds). Handbook of marine mammals, Volume 6: The
second book of dolphins and the porpoises. San Diego, CA: Academic Press.
Ohsumi, S. (1977). Bryde's whales in the pelagic whaling ground of the North Pacific. Report of the
International Whaling Commission Special Issue, 1, 140-149.

LOA and Rulemaking Application Under the MMPA for Use of SURTASS LFA Sonar
15-46 Literature Cited
Ohsumi, S. (1980). Population study of the Bryde’s whale in the Southern Hemisphere under scientific
permit in the three seasons, 1976/77-1978/79. Reports of the International Whaling
Commission, 30, 319-331.
Ohizumi, H., T. Isoda, T. Kishiro, & Kato, H. (2003). Feeding habits of Baird's beaked whale Berardius
bairdii, in the western North Pacific and Sea of Okhotsk off Japan. Fisheries Science, 69(1), 11-
20.
Oleson, E.M., J. Barlow, J. Gordon, S. Rankin, & J.A. Hildebrand. (2003). Low frequency calls of Bryde's
whales. Marine Mammal Science, 19(2), 407-419.
Oleson, E. M., Boggs, C. H., Forney, K. A., Hanson, M. B., Kobayashi, D. R., Taylor, B. L., Wade, P. R., &
Ylitalo, G.M. (2010). Status review of Hawaiian insular false killer whales (Pseudorca crassidens)
under the Endangered Species Act. (NOAA Technical Memorandum NMFS-PIFSC-22). Honolulu,
HI: Pacific Islands Fisheries Science Center, National Marine Fisheries Service.
Oleson, E. M., Baird, R. W., Martien, K. K., & Taylor, B. L. (2013). Island-associated stocks of odontocetes
in the main Hawaiian Islands: A synthesis of available information to facilitate evaluation of
stock structure. Document PSRG-2013-16 presented to the Pacific Scientific Review Group, Del
Mar, California, April 2013.
Oleson, E. M., Sirovic, A., Bayless, A. R., & Hildebrand, J. A. (2014). Synchronous seasonal change in fin
whale song in the North Pacific. PLoS ONE, 9(12), e115678. doi:10.1371/journal.pone.0115678.
Oliver, G. W. (1978). Navigation in mazes by a grey seal, Halichoerus grypus (Fabricius). Behaviour, 67(1),
97-114.
Olson, P. A. (2009). Pilot whales (Globicephata melas and G. macrorhynchus). Pages 847-851 in W.F.
Perrin, B. Wursig, & J.G.M. Thewissen, (Eds). Encyclopedia of marine mammals, 2nd ed. San
Diego, California: Academic Press.
Omura, H. (1959). Bryde's whale from the coast of Japan. Scientific Reports of the Whales Research
Institute 14, 1-33.
Omura, H., K. Fujino, & S. Kimura. (1955). Beaked whale Berardius bairdi of Japan, with notes on Ziphius
cavirostris. Scientific Reports of the Whales Research Institute, 10, 89-132.
Oswald, J.N., J. Barlow, & T.F. Norris. (2003). Acoustic identification of nine delphinid species in the
eastern tropical Pacific Ocean. Marine Mammal Science, 19(1), 20-37.
Oswald, J. N., Rankin, S., & Barlow, J. (2008). To whistle or not to whistle? Geographic variation in the
whistling behavior of small odontocetes. Aquatic Mammals, 34(3), 288-302.
Oswald, J. N., Rankin, S., Barlow, J., & Lammers, M. O. (2007). A tool for real-time acoustic species
identification of delphinid whistles. The Journal of the Acoustical Society of America, 122(1),
587-595.
Pacini, A.F., P.E. Nachtigall, L.N. Kloepper, M. Linnenschmidt, A. Sogorb, & S. Matias. (2010). Audiogram
of a formerly stranded long-finned pilot whale (Globicephala melas) measured using auditory
evoked potentials. The Journal of Experimental Biology, 213, 3138-3143.
Pacini, A. F., P. E. Nachtigall, C. T. Quintos, T. D. Schofield, D. A. Look, G. A. Levine & J. P. Turner. (2011).
Audiogram of a stranded Blainville's beaked whale (Mesoplodon densirostris) measured using
auditory evoked potentials. The Journal of Experimental Biology 214(Pt 14), 2409-2415.
LOA and Rulemaking Application Under the MMPA for Use of SURTASS LFA Sonar
15-47 Literature Cited
Page, B., Goldsworthy, S. D., Hindell, M. A., & McKenzie, J. (2002). Interspecific differences in male
vocalizations of three sympatric fur seals (Arctocephalus spp.). Journal of Zoology, 258, 49-56.
Papastavrou, V., S.C. Smith, & H. Whitehead. (1989). Diving behaviour of the sperm whale, Physeter
macrocephalus, off the Galapagos Islands. Canadian Journal of Zoology, 67(4), 839-846.
Parrish, F. A., & Abernathy, K. (2006). Movements of monk seals relative to ecological depth zones in the
lower Northwestern Hawaiian Islands. Atoll Research Bulletin, 543, 115-130.
Parrish, F.A., K. Abernathy, G.J. Marshall, & B.M. Buhleier. (2002). Hawaiian monk seals (Monachus
schauinslandi) foraging in deep-water coral beds. Marine Mammal Science, 18(1), 244-258.
Parsons, K. M., Durban, J. W., Burdin, A. M., Burkanov, V. N., Pitman, R. L., Barlow, J., Barrett-Lennard, L.
G., LeDuc, R. G., Robertson, K. M., Matkin, C. O., & Wade, P. R. (2013). Geographic patterns of
genetic differentiation among killer whales in the northern North Pacific. The Journal of
Heredity, 104, 737-754.
Pastene, L.A. & Goto, M. (1998). An estimate of the mixing proportion of ‘J’ and ‘O’ stocks minke whales
in subarea 11 based on mitochondrial DNA haplotype data. Report of the International Whaling
Commission, 48, 471-474.
Pastene, L. A., Goto, M., & Kishino, H. (1998). An estimate of the mixing proportion of "J" and "O" stocks
minke whales in sub-area 11 based on mitochondrial DNA haplotype data. Report of the
International Whaling Commission, 38,471-474.
Patterson, B., and G.R. Hamilton. 1964. Repetitive 20 cycle per second biological hydroacoustic signals at
Bermuda. In W.M. Tavolga, ed. Marine bio-acoustics, Volume 1. Oxford, England: Pergamon
Press.
Payne, R. S., & S. McVay. (1971). Songs of humpback whales. Science, 173, 585-597.
Payne, R., & Payne, K. (1971). Underwater sounds of southern right whales. Zoologica, 58, 159-165.
Perrin, W. F. (2009a). Common dolphins (Delphinus delphis and D. capensis). Pages 255-259 in W.F.
Perrin, B. Wursig, & J.G.M. Thewissen, (Eds). Encyclopedia of marine mammals, 2nd Edition. San
Diego, CA: Academic Press.
Perrin, W. F. (2009b). Pantropical spotted dolphin (Stenella attenuata). Pages 819-821 in W.F. Perrin, B.
Wursig, and J.G.M. Thewissen, eds. Encyclopedia of Marine Mammals, 2nd Edition. San Diego,
California: Academic Press.
Perrin, W. F. (2009d). Spinner dolphin (Stenella longirostris). Pages 1100-1103 in W.F. Perrin, B. Wursig,
& J.G.M. Thewissen, (Eds). Encyclopedia of marine mammals, 2nd ed. San Diego, California:
Academic Press.
Perry, S. L., DeMaster, D. P., & Silber, G. K. (1999). The great whales: History and status of six species
listed as endangered under the U.S. Endangered Species Act of 1973. Marine Fisheries Review,
61(1), 1-74.
Philips, J.D., P.E. Nachtigall, W.W.L. Au, J.L. Pawloski, & H.L. Roitblat. (2003). Echolocation in the Risso’s
dolphin, Grampus griseus. The Journal of the Acoustical Society of America, 113(1), 605-616.

LOA and Rulemaking Application Under the MMPA for Use of SURTASS LFA Sonar
15-48 Literature Cited
Pitman, R. (2009a). Indo-Pacific beaked whale (Indopacetus pacificus). Pages 600-602 in W.F. Perrin, B.G.
Wursig, & J.G.M. Thewissen, (Eds). Encyclopedia of marine mammals, 2nd ed. San Diego, CA:
Academic Press.
Pitman, R. (2009b). Mesoplodont whales (Mesoplodon spp.). Pages 721-726 in W.F. Perrin, B.G. Wursig,
& J.G.M. Thewissen, eds. Encyclopedia of marine mammals, 2nd ed. San Diego, CA: Academic
Press.
Pitman, R.L., D.M. Palacios, P.L. Rodriguez, B.J. Brennan, K.C. Balcomb, & T. Miyashita. (1998). Probable
sightings of Longman's beaked whale (Indopacetus [Mesoplodon] pacificus) from the equatorial
Indian and Pacific oceans. Abstracts of the World Marine Mammal Science Conference,
Monaco, 24-28 January 1998.
Pomilla, C., A. R. Amaral, T. Collins, G. Minton, K. Findlay, M. S. Leslie, L. Ponnampalam, R. Baldwin, & H.
Rosenbaum. (2014). The world's most isolated and distinct whale population? Humpback
whales of the Arabian Sea. PLoS ONE, 9(12), e114162. doi:10.1371/journal.pone.0114162.
Popov, V. V., & Klishin, V. O. (1998). EEG study of hearing in the common dolphin, Delphinus delphis.
Aquatic Mammals, 24(1), 13-20.
Popper, A. N. (1980). Sound emission and detection by delphinids. In L. M. Herman (Ed.), Cetacean
behavior: Mechanisms and functions (pp. 1-52). New York, NY: John Wiley & Sons.
Poulter, T. C. (1968). Underwater vocalization and behavior of pinnipeds. Pages 69-84 in R.J. Harrison,
R.C. Hubbard, S.B. Peterson, C.E. Rice, & R.J. Schusterman, (Eds). The behavior and physiology
of pinnipeds. New York, NY: Appleton-Century-Crofts.
Preen, A. R., Marsh, H., Lawler, I. R., Prince, R. I. T., & Shepherd, R. (1997). Distribution and abundance
of dugongs, turtles, dolphins and other megafauna in Shark Bay, Ningaloo Reef and Exmouth
Gulf, Western Australia. Wildlife Research, 24(2), 185-208.
Prieto, R., Silva, M. A., Waring, G. T., & Gonçalves, J. M. A. (2014). Sei whale movements and behaviour
in the North Atlantic inferred from satellite telemetry. Endangered Species Research, 26, 101-
113. doi: 10.3354/esr00630.
Protected Planet. (2018). Protected area coverage in 2018. Retrieved from <https://protectedplanet.
net/marine>.
Pryor, T., K. Pryor, & K. S. Norris. (1965). Observations on a pygmy killer whale (Feresa attenuata Gray)
from Hawaii. Journal of Mammalogy, 46(3), 450-461.
Rankin, S., & Barlow, J. (2005). Source of the North Pacific “boing” sound attributed to minke whales.
The Journal of the Acoustical Society of America, 118(5), 3346-3351.
Rankin, S., & Barlow, J. (2007). Vocalizations of the Sei Whale Balaenoptera borealis off the Hawaiian
Islands. Bioacoustics, 16(2), 137-145. doi:10.1080/09524622.2007.9753572.
Rankin, S., S. Baumann-Pickering, T. Yack, & J. Barlow. (2011). Description of sounds recorded from
Longman's beaked whale, Indopacetus pacificus. The Journal of the Acoustical Society of
America, 130(5), EL339-344. doi:10.1121/1.3646026.
Raum-Suryan, K. L., Rehberg, M. J., Pendleton, G. W., Pitcher, K. W., & Gelatt, T. S. (2004). Development
of dispersal, movement patterns, and haul-out use by pup and juvenile Steller sea lions
(Eumetopias jubatus) in Alaska. Marine Mammal Science 20, 823-850.

LOA and Rulemaking Application Under the MMPA for Use of SURTASS LFA Sonar
15-49 Literature Cited
Read, A. J., & Westgate, A. J. (1997). Monitoring the movements of harbour porpoises (Phocoena
phocoena) with satellite telemetry. Marine Biology, 130(2), 315-322.
Ream, R. R., J. T. Sterling, & Loughlin, T. R. (2005). Oceanographic features related to northern fur seal
migratory movements. Deep-Sea Research, Part II 52(5), 823-843.
Recalde-Salas, A., C. P. Salgado Kent, M. J. Parsons, S. A. Marley, & R. D. McCauley. (2014). Non-song
vocalizations of pygmy blue whales in Geographe Bay, Western Australia. The Journal of the
Acoustical Society of America, 135(5), EL213-218. doi:10.1121/1.4871581.
Reeder, D.B., & Chiu, C.S. (2010). Ocean acidification and its impact on ocean noise: phenomenology and
analysis. The Journal of the Acoustical Society of America, 128(3), EL137-143.
doi:10.1121/1.3431091.
Reeves, R.R., & Leatherwood, S. (1994). Dolphins, porpoises, and whales: 1994-1998 action plan for the
conservation of cetaceans. Gland, Switzerland: International Union for Conservation of Nature
(IUCN).
Reeves, R.R., & Whitehead, H. (1997). Status of the sperm whale, Physeter macrocephalus, in Canada.
Canadian Field-Naturalist, 111(2), 293-307.
Rehberg, M.J., R.D. Andrews, U.G. Swain, & D.G. Calkins. (2009). Foraging behavior of adult female
Steller sea lions during the breeding season in Southeast Alaska. Marine Mammal Science,
25(3), 588-604.
Reichmuth, C., Holt, M. M., Mulsow, J., Sills, J. M., & Southall, B. L. (2013). Comparative assessment of
amphibious hearing in pinnipeds. [Research Support, U.S. Gov't, Non-P.H.S.]. Journal of
comparative physiology. A, Neuroethology, sensory, neural, and behavioral physiology, 199(6),
491-507. doi: 10.1007/s00359-013-0813-y.
Reilly, S.B., Bannister, J.L., Best, P.B., Brown, M., Brownell Jr., R.L., Butterworth, D.S., Clapham, P.J.,
Cooke, J., Donovan, G.P., Urbán, J. & Zerbini, A.N. (2008a). Eschrichtius robustus. The IUCN Red
List of Threatened Species 2008: e.T8097A12885255.
http://dx.doi.org/10.2305/IUCN.UK.2008.RLTS.T8097A12885255.en. Downloaded on 03 June
2018.
Reilly, S.B., Bannister, J.L., Best, P.B., Brown, M., Brownell Jr., R.L., Butterworth, D.S., Clapham, P.J.,
Cooke, J., Donovan, G.P., Urbán, J. & Zerbini, A.N. (2008b). Balaenoptera bonaerensis. The IUCN
Red List of Threatened Species 2008: e.T2480A9449324.
http://dx.doi.org/10.2305/IUCN.UK.2008.RLTS.T2480A9449324.en. Downloaded on 03 June
2018.
Reilly, S.B., Bannister, J.L., Best, P.B., Brown, M., Brownell Jr., R.L., Butterworth, D.S., Clapham, P.J.,
Cooke, J., Donovan, G.P., Urbán, J. & Zerbini, A.N. (2008c). Balaenoptera musculus. The IUCN
Red List of Threatened Species 2008: e.T2477A9447146.
http://dx.doi.org/10.2305/IUCN.UK.2008.RLTS.T2477A9447146.en. Downloaded on 03 June
2018.

LOA and Rulemaking Application Under the MMPA for Use of SURTASS LFA Sonar
15-50 Literature Cited
Reilly, S.B., Bannister, J.L., Best, P.B., Brown, M., Brownell Jr., R.L., Butterworth, D.S., Clapham, P.J.,
Cooke, J., Donovan, G.P., Urbán, J. & Zerbini, A.N. (2008d). Balaenoptera edeni. The IUCN Red
List of Threatened Species 2008: e.T2476A9445502.
http://dx.doi.org/10.2305/IUCN.UK.2008.RLTS.T2476A9445502.en. Downloaded on 03 June
2018.
Reilly, S.B., Bannister, J.L., Best, P.B., Brown, M., Brownell Jr., R.L., Butterworth, D.S., Clapham, P.J.,
Cooke, J., Donovan, G.P., Urbán, J. & Zerbini, A.N. (2008e). Balaenoptera acutorostrata. The
IUCN Red List of Threatened Species 2008: e.T2474A9444043.
http://dx.doi.org/10.2305/IUCN.UK.2008.RLTS.T2474A9444043.en. Downloaded on 03 June
2018.
Reilly, S.B., Bannister, J.L., Best, P.B., Brown, M., Brownell Jr., R.L., Butterworth, D.S., Clapham, P.J.,
Cooke, J., Donovan, G.P., Urbán, J. & Zerbini, A.N. (2008f). Megaptera novaeangliae. The IUCN
Red List of Threatened Species 2008: e.T13006A3405371.
http://dx.doi.org/10.2305/IUCN.UK.2008.RLTS.T13006A3405371.en. Downloaded on 03 June
2018.
Reilly, S.B., Bannister, J.L., Best, P.B., Brown, M., Brownell Jr., R.L., Butterworth, D.S., Clapham, P.J.,
Cooke, J., Donovan, G.P., Urbán, J. & Zerbini, A.N. (2008g). Balaenoptera omurai. The IUCN Red
List of Threatened Species 2008: e.T136623A4319390.
http://dx.doi.org/10.2305/IUCN.UK.2008.RLTS.T136623A4319390.en. Downloaded on 03 June
2018.
Reilly, S.B., Bannister, J.L., Best, P.B., Brown, M., Brownell Jr., R.L., Butterworth, D.S., Clapham, P.J.,
Cooke, J., Donovan, G.P., Urbán, J. & Zerbini, A.N. (2008h). Balaenoptera borealis. The IUCN Red
List of Threatened Species 2008: e.T2475A9445100.
http://dx.doi.org/10.2305/IUCN.UK.2008.RLTS.T2475A9445100.en. Downloaded on 03 June
2018.
Reilly, S.B., Bannister, J.L., Best, P.B., Brown, M., Brownell Jr., R.L., Butterworth, D.S., Clapham, P.J.,
Cooke, J., Donovan, G.P., Urbán, J. & Zerbini, A.N. (2008i). Eubalaena japonica. The IUCN Red
List of Threatened Species 2008: e.T41711A10540463.
http://dx.doi.org/10.2305/IUCN.UK.2008.RLTS.T41711A10540463.en. Downloaded on 03 June
2018.
Reilly, S.B., Bannister, J.L., Best, P.B., Brown, M., Brownell Jr., R.L., Butterworth, D.S., Clapham, P.J.,
Cooke, J., Donovan, G.P., Urbán, J. & Zerbini, A.N. (2013). Balaenoptera physalus. The IUCN Red
List of Threatened Species 2013: e.T2478A44210520. http://dx.doi.org/10.2305/IUCN.UK.2013-
1.RLTS.T2478A44210520.en. Downloaded on 03 June 2018.
Reisinger, R. R., M. Keith, R. D. Andrews, & P. J. N. de Bruyn. (2015). Movement and diving of killer
whales (Orcinus orca) at a Southern Ocean archipelago. Journal of Experimental Marine Biology
and Ecology, 473, 90-102. doi:10.1016/j.jembe.2015.08.008.
Rendell, L., Simião, S., Brotons, J. M., Airoldi, S., Fasano, D., & Gannier, A. (2014). Abundance and
movements of sperm whales in the western Mediterranean basin. Aquatic Conservation:
Marine and Freshwater Ecosystems, 24 (Supplement 1), 31-40. doi: 10.1002/aqc.2426.
Rendell, L. E., J. Matthews, A. Gill, J. Gordon, and D. W. Macdonald. (1999). Quantitative analysis of the
tonal calls of five odontocete species. Journal of Zoology, 249(4), 403-410.

LOA and Rulemaking Application Under the MMPA for Use of SURTASS LFA Sonar
15-51 Literature Cited
Rice, D. (1998). Marine mammals of the world: Systematics and distribution. Special Publication Number
4. Lawrence, KS: The Society for Marine Mammalogy.
Rice, D. W. (1989). Sperm whale, Physeter macrocephalus. Pages 177-233 in S. H. Ridgway and R.
Harrison (Eds). Handbook of marine mammals. Volume 4: River dolphins and the larger toothed
whales. New York, NY: Academic Press.
Richardson, W. J., C. R. Greene, Jr., C. I. Malme and D. H. Thomson, eds. (1995). Marine mammals and
noise. San Diego, California: Academic Press.
Ridgway, S. H. (1966). Dall’s porpoise, Phocoenoides dalli (True): Observations in captivity and at sea.
Norsk Hvalfangst-Tidende, 55(5), 97-110.
Ridgway, S. H. (1986). Diving by cetaceans. Pages 33-62 in A.O. Brubakk, J.W. Kanwisher, and G.
Sundress, (Eds). Diving in animals and man. Trondheim, Norway: The Royal Norwegian Society
of Science and Letters.
Ridgway, S. H., & Carder, D. A. (2001). Assessing hearing and sound production in cetaceans not
available for behavioral audiograms: Experiences with sperm, pygmy sperm, and gray whales.
Aquatic Mammals, 27(3), 267-276.
Ridgway, S. H., & Joyce, P. L. (1975). Studies on seal brain by radiotelemetry. Rapports et Proces-Verbaux
des Reunions Conseil International pour I'Exploration de la Mar 169, 81-91.
Ridgway, S.H., C.A. Bowers, D. Miller, M.L. Schultz, C.A. Jacobs, & C.A. Dooley. (1984). Diving and blood
oxygen in the white whale. Canadian Journal of Zoology, 62(11), 2349-2351.
Ridgway, S. H., D. A. Carder, T. Kamolnick, R. R. Smith, C. E. Schlundt, & W. R. Elsberry. (2001). Hearing
and whistling in the deep sea: Depth influences whistle spectra but does not attenuate hearing
by white whales (Delphinapterus leucas) (Odontoceti, Cetacea). Journal of Experimental
Biology, 204(22), 3829-3841.
Riedman, M. L. (1990). The pinnipeds: Seals, sea lions, and walruses. Berkeley, CA: University of
California Press.
Risch, D., Clark, C. W., Corkeron, P. J., et al. (2007). Vocalizations of male bearded seals, Erignathus
barbatus: Classification and geographical variation. Animal Behaviour, 73, 747–762.
Risch, D., Clark, C. W., Dugan, P. J., Popescu, M., Siebert, U., & Van Parijs, S. M. (2013). Minke whale
acoustic behavior and multi-year seasonal and diel vocalization patterns in Massachusetts Bay,
USA. Marine Ecology Progress Series, 489, 279-295. doi:10.3354/meps10426.
Risch, D., N. J. Gales, J. Gedamke, L. Kindermann, D. P. Nowacek, A. J. Read, U. Siebert, I. C. Van
Opzeeland, S. M. Van Parijs, and A. S. Friedlaender. (2014a). Mysterious bio-duck sound
attributed to the Antarctic minke whale (Balaenoptera bonaerensis). Biology Letters, 10(4),
20140175. doi:10.1098/rsbl.2014.0175.
Risch, D., S. M. Van Parijs, and U. Siebert. (2014b). Individual calling behaviour and movements of North
Atlantic minke whales (Balaenoptera acutorostrata). Behaviour, 151(9), 1335-1360.
doi:10.1163/1568539x-00003187.
Ritter, F. (2002). Behavioural observations of rough-toothed dolphins (Steno bredanensis) off La
Gomera, Canary Islands (1995-2000), with special reference to their interactions with humans.
Aquatic Mammals, 28(1), 46-59.

LOA and Rulemaking Application Under the MMPA for Use of SURTASS LFA Sonar
15-52 Literature Cited
Rivers, J. A. (1997). Blue whale, Balaenoptera musculus, vocalizations from the waters off central
California. Marine Mammal Science, 13(2), 186-195.
Roberts, J. J., Best, B. D., Mannocci, L., Fujioka, E., Halpin, P. N., Palka, D. L., Garrison, L. P., Mullin, K. D.,
Cole, T. V. N., Khan, C. B., McLellan, W. A., Pabst, D. A., & Lockhart, G. G. (2016). Habitat-based
cetacean density models for the U.S. Atlantic and Gulf of Mexico. Scientific Reports, 6, 22615.
Robinson, P. W., D. P. Costa, D. E. Crocker, J. P. Gallo-Reynoso, C. D. Champagne, M. A. Fowler, C.
Goetsch, K. T. Goetz, J. L. Hassrick, L. A. Huckstadt, C. E. Kuhn, J. L. Maresh, S. M. Maxwell, B. I.
McDonald, S. H. Peterson, S. E. Simmons, N. M. Teutschel, S. Villegas-Amtmann, & K. Yoda.
(2012). Foraging behavior and success of a mesopelagic predator in the northeast Pacific
Ocean: insights from a data-rich species, the northern elephant seal. PLoS ONE, 7(5), e36728.
Rogachev, K.A., E.C. Carmack, and M.G.G. Foreman. (2008). Bowhead whales feed on plankton
concentrated by estuarine and tidal currents in Academy Bay, Sea of Okhotsk. Continental Shelf
Research, 28, 1811-1826.
Rogers, T. L.,& Brown, S. M. (1999). Acoustic observations of Arnoux's beaked whale (Berardius arnuxii)
off Kemp Land, Antarctica. Marine Mammal Science, 15(1), 192-198.
Rolland, R. M., S. E. Parks, K. E. Hunt, M. Castellote, P. J. Corkeron, D. P. Nowacek, S. K. Wasser, & S. D.
Kraus. (2012). Evidence that ship noise increases stress in right whales. Proceedings of the
Royal Society B, 279(1737), 2363-2368.
Romano, T. A., M. J. Keogh, C. Kelly, P. Feng, L. Berk, C. E. Schlundt, D. A. Carder, & J. J. Finneran. (2004).
Anthropogenic sound and marine mammal health: Measures of the nervous and immune
systems before and after intense sound exposure. Canadian Journal of Fisheries and Aquatic
Sciences, 61, 1124-1137.
Ronald, K., & Healey, P. J. (1981). Harp seal, Phoca groenlandica Erxleben, 1777. Pages 55-87 in Ridgway,
S.H., & R.J. Harrison, (Eds). Handbook of marine mammals. Volume 2: Seals. New York, NY:
Academic Press.
Rohr, J.J., F.E. Fish, & J.W. Gilpatrick. (2002). Maximum swim speeds of captive and free-ranging
delphinids: Critical analysis of extraordinary performance. Marine Mammal Science, 18(1), 1-
19.
Rosenbaum, H. C., Pomilla, C., Mendez, M., Leslie, M. S., Best, P. B., Findlay, K. P., . . . Kiszka, J. (2009).
Population structure of humpback whales from their breeding grounds in the South Atlantic
and Indian Oceans. PLoS ONE, 4(10). e7318. doi:10.1371/journal.pone.0007318.
Ross, D. (1976). Mechanics of underwater noise. New York: Pergamon.
Ross, G. J. B., Best, P. B., & Donnelly, B. G. (1975). New records of the pygmy right whale Caperea
marginata new record from South Africa with comments on distribution migration appearance
and behavior. Journal of the Fisheries Research Board of Canada, 32(7), 1005-1018.
Ruegg, K. C., E. C. Anderson, C. S. Baker, M. Vant, J. A. Jackson, & S. R. Palumbi. (2009). Are Antarctic
minke whales unusually abundant because of 20th century whaling? Molecular Ecology, 19(2),
281-291.
LOA and Rulemaking Application Under the MMPA for Use of SURTASS LFA Sonar
15-53 Literature Cited
Rugh, D., D. DeMaster, A. Rooney, J. Breiwick, K. Shelden, & S. Moore. (2003). A review of bowhead
whale (Balaena mysticetus) stock identity. Journal of Cetacean Research and Management,
5(3), 67-279.
Rugh, D. J., K. E. W. Shelden, & B. A. Mahoney. (2000). Distribution of belugas, Delphinapterus leucas, in
Cook Inlet, Alaska, during June/July 1993–2000. Marine Fisheries Review, 62(3), 6-21.
St. Aubin, D. J., & J. R. Geraci. (1989). Adaptive changes in hematologic and plasma chemical
constituents in captive beluga whales, Delphinapterus leucas. Canadian Journal of Fisheries and
Aquatic Sciences, 46, 796-803.
Sala, J. E., Quintana, F., Wilson, R. P., Dignani, J., Lewis, M. N, & Campagna, C. (2011). Pitching a new
angle on elephant seal dive patterns. Polar Biology, 34(8), 1197-1209. doi:10.1007/s00300-011-
0981-6.
Salm, R.V., R.A.C. Jensen, & V.A. Papastavrou. 1993. Marine fauna of Oman: Cetaceans, turtles, seabirds,
and shallow water corals. IUCN, Gland, Switzerland. 66 pages.
Samarra, F. I. P., Deecke, V. B., Simonis, A. E., & Miller, P. J. O. (2015). Geographic variation in the time-
frequency characteristics of high-frequency whistles produced by killer whales (Orcinus orca).
Marine Mammal Science, 31(2), 688-706. doi:10.1111/mms.12195.
Santoro, A.K., K.L. Martin, & T.W. Cranford. (1989). Pygmy sperm whale sounds (Kogia breviceps). In
Abstracts of the 8th biennial conference on the biology of marine mammals, Pacific Grove,
California, December 1989.
Sasaki, T., M. Nikaido, S. Wada, T.K. Yamada, Y. Cao, M. Hasegawa, & N. Okada. 2006. Balaenoptera
omurai is a newly discovered baleen whale that represents an ancient evolutionary lineage.
Molecular Phylogenetics and Evolution 41, 40-52.
Sathasivam, K. (2002). A catalogue of Indian marine mammal records. Paper presented at Convention on
Biological Diversity regional workshop to facilitate the description of ecologically or biologically
significant marine areas (EBSAs) in the north-east Indian Ocean region, Columbo, Sri Lanka,
March 2015. Retrieved from: <https://www.cbd.int/doc/meetings/mar/ebsaws-2015-
01/other/ebsaws-2015-01-gobi-submission5-en.pdf>.
Sayigh, L., N. Quick, G. Hastie, and P. Tyack. (2013). Repeated call types in short-finned pilot whales,
Globicephala macrorhynchus. Marine Mammal Science, 29(2), 312-324. doi:10.1111/j.1748-
7692.2012.00577.x.
Scheer, M., B. Hofmann, & P.I. Behr. (1998). Discrete pod-specific call repertoires among short-finned
pilot whales (Globicephala macrorhynchus) off the SW coast of Tenerife, Canary Islands.
Abstracts of the World Marine Mammal Science Conference, Monaco, 22-24 January 1998.
Scheifele, P. M., S. Andrew, R. A. Cooper, M. Darre, F. E. Musiek, & L. Max. (2005). Indication of a
Lombard vocal response in the St. Lawrence River beluga. The Journal of the Acoustical Society
of America, 117(3), 1486-1492.
Schevill, W. E. (1964). Underwater sounds of cetaceans. Pages 307-366 in W.N. Tavolga, ed. Marine bio-
acoustics. Oxford, United Kingdom: Pergamon Press.
Schevill, W. E, & Lawrence, B. (1949). Underwater listening to the white porpoise (Delphinapterus
leucas). Science, 109(2824), 143-144.
LOA and Rulemaking Application Under the MMPA for Use of SURTASS LFA Sonar
15-54 Literature Cited
Schevill, W. E., & Watkins, W. A. (1966). Sound structure and directionality in Orcinus (killer whale).
Zoologica, 51(6), 71-76.
Schevill, W. E., & Watkins, W. A. (1971). Pulsed sounds of the porpoise Lagenorhynchus australis.
Breviora 366, 1-10.
Schevill, W. E., & Watkins, W. A. (1972). Intense Low-frequency sounds from an Antarctic minke whale,
(Balaenoptera acurostrata). Breviora 388, 1-8.
Schilling, M.R., I. Seipt, M.T. Weinrich, S.E. Frohock, A.E. Kuhlberg, & P.J. Clapham. (1992). Behavior of
individually-identified sei whales Balaenoptera borealis during an episodic influx into the
southern Gulf of Maine in 1986. Fishery Bulletin, 90, 749-755.
Schlundt, C.E., R.L. Dear, D.S. Houser, T. Reidarson, & J.J. Finneran. (2011). Auditory evoked potentials in
two short-finned pilot whales (Globicephala macrorhynchus). The Journal of the Acoustical
Society of America, 129(2), 1111-1116.
Schorr, G.S., R.W. Baird, M.B. Hanson, D.L. Webster, D.J. McSweeney, & R.D. Andrews. (2009).
Movements of satellite-tagged Blainville’s beaked whales off the island of Hawai‘i. Endangered
Species Research, 10, 203-213.
Schorr, G. S., Falcone, E. A., Moretti, D. J., & Andrews, R. D. (2014). First long-term behavioral records
from Cuvier’s beaked whales (Ziphius cavirostris) reveal record-breaking dives. PLoS One, 9(3),
1-10. doi:10.1371/journal.pone.0092633.g001.
Schotten, M., W.W.L. Au, M.O. Lammers, & R. Aubauer. (2004). Echolocation recordings and localization
of wild spinner dolphins (Stenella longirostris) and pantropical spotted dolphins (S. attenuata)
using a four-hydrophone array. Pages 393-400 in Thomas, J.A., C.F. Moss and M. Vater, (Eds).
Echolocation in bats and dolphins. Chicago, IL: University of Chicago Press.
Schreer, J. F., & Kovacs, K. M. 1997. Allometry of diving capacity in air-breathing vertebrates. Canadian
Journal of Zoology, 75(3), 339-358.
Schultz, K.W., D.H. Cato, P.J. Corkeron, & M.M. Bryden. (1995). Low frequency narrow-band sounds
produced by bottlenose dolphins. Marine Mammal Science, 11(4), 503-509.
Schusterman, R. J. (1966). Perception and Determinants of Underwater Vocalization in the California Sea
Lion. In R. G. Busnel (Ed.), Symp. of Animal Sonar Systems, Biology and Bionics (pp. 535-617).
Schusterman, R. J. (1978). Vocal communication in pinnipeds. Pages 247-308 in H. Markowitz and V.J.
Stevens, (Eds). Behavior of captive wild animals. Chicago, IL: Nelson-Hall.
Scott, M. D., & Chivers, S. J. 1990. Distribution and herd structure of bottlenose dolphins in the eastern
tropical Pacific Ocean. Pages 387-402 in S.H. Ridgeway and R. Harrison, (Eds). Handbook of
marine mammals. Volume 6: The second book of dolphins and porpoises. New York, NY:
Academic Press.
Scott, M.D., A.A. Hohn, A.J. Westgate, J.R. Nicolas, B.R. Whitaker, & W.B. Campbell. (2001). A note on
the release and tracking of a rehabilitated pygmy sperm whale (Kogia breviceps). Journal of
Cetacean Research and Management, 3(1), 87-94.
Sears, R., & Perrin, W.F. (2009). Blue whale (Balaenoptera musculus). Pages 120-124 in W.F. Perrin, B.G.
Wursig, and J.G.M. Thewissen, eds. Encyclopedia of marine mammals, 2nd edition. San Diego,
CA: Academic Press.

LOA and Rulemaking Application Under the MMPA for Use of SURTASS LFA Sonar
15-55 Literature Cited
Sekiguchi, K., N. Klages, K. Findlay, & P. Best. (1993). Feeding habits and possible movements of southern
bottlenose whales (Hyperoodon planifrons). Paper presented at the Proceedings of the NIPR
Symposium on Polar Biology, No. 6, Tokyo.
Sekiguchi, K., M.A. Meyer, P.B. Best, R. Davis, & J.H.M. David. (1998). Satellite-monitored movements
and diving patterns of Heaviside’s dolphin (Cephalorhynchus heavisidii) off St. Helena Bay,
South Africa. Pages 122–123 in Proceedings for World Marine Mammal Science Conference,
Monaco.
Sekiguchi, K., H. Onishi, H. Sasaki, S. Haba, Y. Iwahara, D. Mizuguchi, M. Otsuki, D. Saijo, B. Nishizawa, H.
Mizuno, N. Hoshi, & T. Kamito. (2014). Sightings of the western stock of North Pacific right
whales (Eubalaena japonica) in the far southeast of the Kamchatka Peninsula. Marine Mammal
Science, 30(3), 1199-1209. doi:10.1111/mms.12105.
Sergeant, D.E. (1962). The biology of the pilot or pothead whale Globicephala melaena (Traill) in
Newfoundland waters. Bulletin of the Fisheries Research Board of Canada, 132, 1-84.
Serrano, A. (2001). New underwater and aerial vocalizations of captive harp seals (Pagophilus
groenlandicus). Canadian Journal of Zoology, 79, 75-81.
Serrano, A., & Terhune, J. M. (2001). Within-call repetition may be an anti-masking strategy in
underwater calls of harp seals (Pagophilus groenlandicus). Canadian Journal of Zoology, 79(8),
1410-1413.
Serrano, A., & Terhune, J. M. (2002). Antimaksing aspects of harp seal (Pagophilus groenlandicus)
underwater vocalizations. The Journal of the Acoustical Society of America, 112(6), 3083-3090.
Shane, S. H. (1995a). Behavior patterns of pilot whales and Risso's dolphins off Santa Catalina Island,
California. Aquatic Mammals, 21(3), 195-197.
Shane, S. H. (1995b). Human-pilot whale encounter: An update. Marine Mammal Science, 11(1), 115.
Sharpe, F. A., & Dill, L. M. (1997). The behavior of Pacific herring schools in response to artificial
humpback whale bubbles. Canadian Journal of Zoology, 75(5), 725-730.
Shpak, O., & Glazov, D. (2013). Review of the recent scientific data on the Okhotsk Sea white whale
(Delphinapterus leucas) population structure and its application to management. (Paper
SC/65a/SM23 presented to the Scientific Committee at the 2013 International Whaling
Commission SC65a Meeting). Journal of Cetacean Research and Management.
Silber, G. K. (1986). The relationship of social vocalizations to surface behavior and aggression in the
Hawaiian humpback whale Megaptera novaeangliae. Canadian Journal of Zoology, 64(10),
2075-2080.
Sills, J. M., B. L. Southall, & C. Reichmuth. (2014). Amphibious hearing in spotted seals (Phoca largha):
underwater audiograms, aerial audiograms and critical ratio measurements. The Journal of
Experimental Biology, 217(Pt 5), 726-734. doi:10.1242/jeb.097469.
Sills, J. M., Southall, B. L., & Reichmuth, C. (2015). Amphibious hearing in ringed seals (Pusa hispida):
Underwater audiograms, aerial audiograms and critical ratio measurements. The Journal of
Experimental Biology, 218, 2250-2259, doi:10.1242/jeb.120972.
Simard, P., Mann, D. A., & Gowans, S. (2008). Burst-pulse sounds recorded from white-beaked dolphins
(Lagenorhynchus albirostris). Aquatic Mammals, 34(4), 464-470.
LOA and Rulemaking Application Under the MMPA for Use of SURTASS LFA Sonar
15-56 Literature Cited
Simmonds, M. P., & Hutchinson, J. D., (Eds). (1996). The conservation of whales and dolphins: Science
and practice. Chichester, United Kingdom: John Wiley and Sons.
Simon, M., Ugarte, F., Wahlberg, M., & Miller, L. A. (2006). Icelandic killer whales Orcinus orca use a
pulsed call suitable for manipulating the schooling behaviour of herring Clupea harengus.
Bioacoustics, 16, 57-74.
Simonis, A. E., Baumann-Pickering, S., Oleson, E., Melcon, M. L., Gassmann, M., Wiggins, S. M., &
Hildebrand, J. A. (2012). High-frequency modulated signals of killer whales (Orcinus orca) in the
North Pacific. The Journal of the Acoustical Society of America, 131(4), EL295-301.
doi:10.1121/1.3690963.
Simpkins, M. A. (2000). Three-dimensional diving behavior of ringed seals. (Ph.D. thesis). University of
Alaska Fairbanks, Fairbanks, AK. p. 123.
Simpkins, M. A., Kelly, B. P., & Wartzok, D. (2001). Three-dimensional diving behaviors of ringed seals
(Phoca hispida). Marine Mammal Science, 17(4), 909-925.
Širović, A., Hildebrand, J.A., & Wiggins, S.M. (2007). Blue and fin whale call source levels and
propagation range in the Southern Ocean. The Journal of the Acoustical Society of America,
122, 1208−1215.
Širović, A., L. N. Williams, S. M. Kerosky, S. M. Wiggins, & J. A. Hildebrand. (2012). Temporal separation
of two fin whale call types across the eastern North Pacific. Marine Biology, 160(1), 47-57.
doi:10.1007/s00227-012-2061-z.
Širović, A., Williams, L. N., Kerosky, S. M., Wiggins, S. M., & Hildebrand, J. A. (2013). Temporal separation
of two fin whale call types across the eastern North Pacific. Marine Biology, 160(1), 47-57.
doi:10.1007/s00227-012-2061-z.
Širović, A., H. R. Bassett, S. C. Johnson, S. M. Wiggins, & J. A. Hildebrand. (2014). Bryde's whale calls
recorded in the Gulf of Mexico. Marine Mammal Science, 30(1), 399-409.
doi:10.1111/mms.12036.
Širović, A., Oleson, E.M., Buccowich, J., Rice, A., & Bayless, A.R. (2017). Fin whale song variability in
southern California and the Gulf of California. Scientific Reports, 7, 10126.
Sivle, L. D., P. H. Kvadsheim, C. Curé, S. Isojunno, P. J. Wensveen, F.-P. A. Lam, F. Visser, L. Kleivane, P. L.
Tyack, C. M. Harris, & P. J. O. Miller. (2015). Severity of expert-identified behavioural responses
of humpback whale, minke whale, and northern bottlenose whale to naval sonar. Aquatic
Mammals, 41(4), 469-502.
Sjare, B. L., & Smith, T. G. (1986). The vocal repertoire of white whales, Delphinapterus leucas,
summering in Cunningham Inlet, Northwest Territories. Canadian Journal of Zoology, 64(2),
407-415.
Skaug, H. J., Øien, N., Schweder, T., & Bøthun, G. (2004). Abundance of minke whales (Balaenoptera
acutorostrata) in the Northeast Atlantic: Variability in time and space. Canadian Journal of
Fisheries and Aquatic Sciences, 61, 870-886.
Slooten, E., & Dawson, S. M. (1994). Hector's dolphin, Cephalorhynchus hectori (van Beneden, 1881).
Pages 311-333 in S.H. Ridgeway and R.J. Harrison, (Eds). Handbook of marine mammals.
Volume 5: The first book of dolphins. New York, NY: Academic Press.
LOA and Rulemaking Application Under the MMPA for Use of SURTASS LFA Sonar
15-57 Literature Cited
Slooten, E., Dawson, S. & Rayment, W. (2002). Quantifying abundance of Hector's dolphins between
Farewell Spit and Milford Sound. DOC Science Internal Series 35, 5-18. Department of
Conservation, Wellington, New Zealand.
Society for Marine Mammalogy (SMM). (2017). List of marine mammal species and subspecies.
Committee on Taxonomy, Society for Marine Mammalogy. Accessed February 2018.
<https://www.marinemammalscience.org/species-information/list-marine-mammal-species-
subspecies/>.
Soldevilla, M. S., Henderson, E. E., Campbell, G. S., Wiggins, S. M., Hildebrand, J. A., & Roch, M. A. (2008).
Classification of Risso's and Pacific white-sided dolphins using spectral properties of
echolocation clicks. The Journal of the Acoustical Society of America, 124(1), 609-624.
Southall, B. (2015). Biological and behavioral response studies of marine mammals in southern
California, 2015 (SOCAL‐15). <http://sea-inc.net/wp-content/uploads/2015/06/SOCAL15-
summary.pdf>. 6 pages.
Southall, B. L., A. E. Bowles, W. T. Ellison, J. J. Finneran, R. L. Gentry, C. R. Greene, Jr., D. Kastak, D. R.
Ketten, J. H. Miller, P. E. Nachtigall, W. J. Richardson, J. A. Thomas, & P. L. Tyack. (2007). Marine
mammal noise exposure criteria: Initial scientific recommendations. Aquatic Mammals, 33(4),
411-521.
Southall, B. L., D. Moretti, B. Abraham, J. Calambokidis, & P. L. Tyack. (2012). Marine mammal behavioral
response studies in Southern California: Advances in technology and experimental methods.
Marine Technology Society Journal, 46, 46-59.
Special Committee on Seals (CSOS). (2015). Scientific advice on matters related to the management of
seal populations: 2015. Report of Sea Mammal Research Unit and Natural Environment
Research Council. St. Andrew’s, Scotland: Sea Mammal Research Unit, St. Andrew’s University.
Springer, A. M., Estes, J. A., van Vliet, G. B., Williams, T. M., Doak, D. F., Danner, E. M., Forney, K. A., &
Pfister, B. (2003). Sequential megafaunal collapse in the North Pacific Ocean: An ongoing legacy
of industrial whaling? Proceedings of the National Academy of Sciences of the United States of
America, 100(21), 12223-12228.
Stacey, P.J., S. Leatherwood, & R.W. Baird. (1994). Pseudorca crassidens. Mammalian Species, 456, 1-6.
Stafford, K. M., C. G. Fox, & D. S. Clark. (1998). Long-range acoustic detection and localization of blue
whale calls in the northeast Pacific Ocean. Journal of the Acoustical Society of America, 104(6),
3616-3625.
Stafford, K. M., S. L. Nieukirk, & C. G. Fox. (1999a). An acoustic link between blue whales in the eastern
tropical Pacific and the Northeast Pacific. Marine Mammal Science, 15(4), 1258-1268.
Stafford, K. M., S. L. Nieukirk, & C. G. Fox. (1999b). Low-frequency whale sounds recorded on
hydrophones moored in the eastern tropical Pacific. The Journal of the Acoustical Society of
America, 106(6), 3687-3698.
Stafford, K. M., Nieukirk, S. L., & Fox, C. G. (2001). Geographic and seasonal variation of blue whale calls
in the North Pacific. Journal of Cetacean Research and Management, 3(1), 65-76.
Sterling, J. T., & R. R. Ream. (2004). At-sea behavior of juvenile male northern fur seals (Callorhinus
ursinus). Canadian Journal of Zoology, 82(10), 1621-1637.

LOA and Rulemaking Application Under the MMPA for Use of SURTASS LFA Sonar
15-58 Literature Cited
Stern, S. J. (1992). Surfacing rates and surfacing patterns of minke whales (Balaenoptera acutorostrata)
off central California, and the probability of a whale surfacing within visual range. Report of the
International Whaling Commission, 42, 379-385.
Stevick, P. T., Neves, M. C., Johansen, F., Engel, M. H., Allen, J., Marcondes, M. C., & Carlson, C. (2011). A
quarter of a world away: Female humpback whale moves 10,000 km between breeding areas.
Biology Letters, 7(2), 299-302. doi:10.1098/rsbl.2010.0717.
Stewardson, C. L. (2001). Biology and conservation of the Cape (South African) fur seal Arctocephalus
pusillus pusillus (Pinnipedia: Otariidae) from the Eastern Cape Coast of South Africa. Ph. D.
thesis, Australian National University, Canberra.
Stewart, B. S. (2009). Diving behavior. Pages 321-327 in W.F. Perrin, B. Wursig, and H.G.M. Thewissen,
eds. Encyclopedia of marine mammals, 2nd ed. San Diego, California: Academic Press.
Stewart, B. S, & DeLong, R. L. (1994). Postbreeding foraging migrations of northern elephant seals. Pages
290-309 in B.J. Le Boeuf and R.M. Laws, (Eds). Elephant seals: Population, ecology, behavior and
physiology. Berkeley, CA: University of California Press.
Stimpert, A. K., W. W. Au, S. E. Parks, T. Hurst, & D. N. Wiley. (2011). Common humpback whale
(Megaptera novaeangliae) sound types for passive acoustic monitoring. The Journal of the
Acoustical Society of America, 129(1), 476-482. doi:10.1121/1.3504708.
Stimpert, A. K., D. N. Wiley, W. W. L. Au, M. P. Johnson, & R. Arsenault. (2007). Megapclicks’: Acoustic
click trains and buzzes produced during night-time foraging of humpback whales (Megaptera
novaeangliae). Biology Letters, 3(5), 467-470. doi:10.1098/rsbl.2007.0281.
Stirling, I. (1971). Studies on the behaviour of the South Australian fur seal, Arctocephalus forsteri
(Lesson). I. Annual cycles, postures, and call of adult males during the breeding season.
Australian Journal of Zoology 19, 267-273.
Stirling, I. (1973). Vocalization in the ringed seal (Phoca hispida). Journal of the Fishery Research Board of
Canada, 30, 1592-1594.
Stirling, I., Calvert, W., & Cleator, H. (1983). Underwater vocalizations as a tool for studying the
distribution and relative abundance of wintering pinipeds in the high Arctic. Arctic, 36(3), 262-
274.
Straley, J. M. (1999). Overwintering North Pacific humpback whales in Alaskan waters. Paper presented
at the 13th biennial meeting of the Society for Marine Mammalogy, Kihei, Maui.
Strong, C. S. (1990). Ventilation patterns and behavior of balaenopterid whales in the Gulf of California,
Mexico. San Francisco, CA: San Francisco State University.
Sudara, S., & Mahakunayanakul, S. (1998). Distribution and river intrusion of dolphins in the inner Gulf of
Thailand. Abstract in World Marine Mammal Science Conference, Monaco, 22-24 January 1998.
Szymanski, M.D., D.E. Bain, K. Kiehl, S. Pennington, S. Wong, & K.R. Henry. (1999). Killer whale (Orcinus
orca) hearing: Auditory brainstem response and behavioral audiograms. The Journal of the
Acoustical Society of America 106(2), 1134-1141.
LOA and Rulemaking Application Under the MMPA for Use of SURTASS LFA Sonar
15-59 Literature Cited
Taruski, A. G. (1979). The whistle repertoire of the North Atlantic pilot whale (Globicephala melaena)
and its relationship to behavior and environment. Pages 345-368 in H.E. Winn and B.L. Olla,
(Eds). Behavior of marine animals: Current perspectives in research: Volume 3. Cetaceans. New
York, NY: Plenum Press.
Terhune, J. M. (1989). Underwater click hearing thresholds of a harbour seal, Phoca vitulina. Aquatic
Mammals, 15(1), 22-26.
Terhune, J.M. (1991). Masked and unmasked pure tone detection thresholds of a harbour seal listening
in air. Canadian Journal of Zoology, 69(8), 2059-2066.
Terhune, J.M., & Ronald, K. (1971). The harp seal, Pagophilus groenlandicus (Erxleben, 1777). X. The air
audiogram. Canadian Journal of Zoology 49 3):385-390.
Terhune, J.M., & Ronald, K. (1972). The harp seal, Pagophilus groenlandicus (Erxleben, 1777). Part 3: The
underwater ethogram. Canadian Journal of Zoology, 49, 385-390.
Terhune, J.M., & Ronald, K. (1973). Some hooded seal (Cystophora cristata) sounds in March. Canadian
Journal of Zoology, 51(3), 319-321.
Terhune, J.M., & Ronald, K. (1975a). Masked hearing thresholds of ringed seals. Journal of the Acoustical
Society of America, 58(2), 515-516.
Terhune, J.M., & Ronald, K .(1975b). Underwater hearing sensitivity of two ringed seals. Canadian
Journal of Zoology, 53, 227-231.
Terhune, J.M., & Ronald, K. (1976). The upper frequency limit of ringed seal hearing. Canadian Journal of
Zoology, 54, 1226-1229.
Terhune, J. M., & Turnbull, S. (1995). Variation in the psychometric functions and hearing thresholds of a
harbour seal. In R. A. Kastelein, J. A. Thomas, and P. E. Nachtigall (Eds.), Sensory systems of
aquatic mammals. Woerden: De Spil.
Tershy, B. R. (1992). Body size, diet, habitat use, and social behavior of Balaenoptera whales in the Gulf
of California. Journal of Mammalogy, 73(3), 477-486.
Tervo, O. M., M. F. Christoffersen, S. E. Parks, R. Mobjerg Kristensen, & P. Teglberg Madsen. (2011).
Evidence for simultaneous sound production in the bowhead whale (Balaena mysticetus). The
Journal of the Acoustical Society of America, 130(4), 2257. doi:10.1121/1.3628327.
Tervo, O.M., S.E. Parks, & L.A. Miller. (2009). Seasonal changes in the vocal behavior of bowhead whales
(Balaena mysticetus) in Disko Bay, Western-Greenland. The Journal of the Acoustical Society of
America, 126(3), 1570-1580.
Thewissen, J. G. M. (2002). Hearing. In W. F. Perrin, B. Würsig, and J. G. M. Thewissen (Eds.),
Encyclopedia of marine mammals (pp. 570-574). San Diego: Academic Press.
Thode, A., Bonnel, J., Thieury, M., Fagan, A., Verlinden, C., Wright, D., Berchok, C., & Crance, J. (2017). Using nonlinear time warping to estimate North Pacific right whale calling depths in the Bering Sea. The Journal of the Acoustical Society of America, 141, 3059.
Thode, A., D.K. Mellinger, S. Stienessen, A. Martinez, & K. Mullin. (2002). Depth-dependent acoustic
features of diving sperm whales (Physeter macrocephalus) in the Gulf of Mexico. The Journal of
the Acoustical Society of America, 112(1), 308-321.

LOA and Rulemaking Application Under the MMPA for Use of SURTASS LFA Sonar
15-60 Literature Cited
Thomas, J.A.,& Turl, C.W. (1990). Echolocation characteristics and range detection threshold of a false
killer whale (Pseudorca crassidens). Pages 321-334 in J.A. Thomas and R.A. Kastelein, (Eds).
Sensory abilities of cetaceans: Laboratory and field evidence. New York, NY: Plenum Press.
Thomas, J. A., Moore, P. W. B., Nachtigall, E., & Gilmartin, W. G. (1990a). A new sound from a stranded
pygmy sperm whale. Aquatic Mammals, 16, 28-30.
Thomas, J., Moore, P., Withrow, R., & Stoermer, M. (1990b). Underwater audiogram of a Hawaiian monk
seal (Monachus schauinslandi). Journal of the Acoustical Society of America, 87(1), 417-420.
Thomas, J. A., Pawloski, J. L., & Au, W. W. L. (1990). Masked hearing abilities in a false killer whale
(Pseudorca crassidens). In J. Thomas & R. Kastelein (Eds.). Sensory abilities of cetaceans (pp.
395-404). New York, NY: Plenum Press.
Thomas, T., W.J. Richardson, W.R. Koski, & B. Würsig. (2003). Surfacing, respiration and dive cycles of
bowhead whales (Balaena mysticetus) in the Beaufort Sea: Calves, subadults and adults. Page
162 in Abstracts, Fifteenth Biennial Conference on the Biology of Marine Mammals,
Greensboro, North Carolina.
Thompson, D., S.E.W. Moss, & P. Lovell. (2003). Foraging behaviour of South American fur seals
Arctocephalus australis: Extracting fine scale foraging behaviour from satellite tracks. Marine
Ecology Progress Series 260, 285-296.
Thompson, P. O., & W. A. Friedl. (1982). A long term study of low frequency sounds from several species
of whales off Oahu, Hawaii. Cetology, 45, 1-19.
Thompson, P.O., W.C. Cummings, & S.J. Ha. (1986). Sounds, source levels, and associated behavior of
humpback whales, southeast Alaska. The Journal of the Acoustical Society of America, 80(3),
735-740.
Thompson, P. O., L. T. Findley, & O. Vidal. (1992). 20-Hz pulses and other vocalizations of fin whales,
Balaenoptera physalus, in the Gulf of California, Mexico. The Journal of the Acoustical Society of
America, 92(6), 3051-3057.
Thompson, T.J., H.E. Winn, &d P.J. Perkins. (1979). Behavior of marine animals, Vol. 3. H.E. Winn & B.L.
Olla, (Eds). New York, NY: Plenum Press.
Thomson, D.H., & W.J. Richardson. (1995). Marine mammal sounds. Pages 159-204 in Richardson, W.J.,
C.R. Greene, Jr., C.I. Malme, and D.H. Thomson, (Eds). Marine mammals and noise. San:
Academic Press.
Thorpe, C.W.,& C.W. Dawson. (1991). Automatic measurement of descriptive features of Hector’s
dolphin vocaliations. The Journal of the Acoustical Society of America, 89(1), 435-443.
Tillman, M. F. (1977). Estimates of population size for the North Pacific sei whale. Report of the
International Whaling Commission Special Issue, 1, 98-106.
Tougaard, J., & L.Y. Kyhn. (2010). Echolocation sounds of hourglass dolphins (Lagenorhynchus cruciger)
are similar to the narrow band high-frequency echolocation sounds of the dolphin genus
Cephalorhynchus. Marine Mammal Science, 26(1), 239-245.
Tougaard, J., Henriksen, O.D., & Miller, L.A. (2009). Underwater noise from three types of offshore wind
turbines: estimation of impact zones for harbor porpoises and harbor seals. The Journal of the
Acoustical Society of America, 125(6), 3766-3773. doi:10.1121/1.3117444.
LOA and Rulemaking Application Under the MMPA for Use of SURTASS LFA Sonar
15-61 Literature Cited
Tougaard, J., A. J. Wright, & P. T. Madsen. (2015). Cetacean noise criteria revisited in the light of
proposed exposure limits for harbour porpoises. Marine Pollution Bulletin, 90(1-2), 196-208.
Tremel, D.P., J.A. Thomas, K.T. Ramirez, G.S. Dye, W.A. Bachman, A.N. Orban & K.K. Grimm. (1998).
Underwater hearing sensitivity of a Pacific white-sided dolphin, Lagenorhynchus obliquidens.
Aquatic Mammals, 24(2), 63-69.
Tripovich, J.S., R. Canfield, T.L. Rogers, & J.P.Y. Arnould. (2008). Characterization of Australian fur seal
vocalizations during the breeding season. Marine Mammal Science, 24(4), 913-928.
Trukhin, A.M., & A.W. Mizuno. (2002). Distribution and abundance of the largha seal (Phoca largha Pall.)
on the coast of Primorye Region (Russia): A literature review and survey report. Mammal
Study, 27, 1-14.
Tubelli, A. A., A. Zosuls, D. R. Ketten, M. Yamato, & D. C. Mountain. (2012). A prediction of the minke
whale (Balaenoptera acutorostrata) middle-ear transfer function. The Journal of the Acoustical
Society of America, 132(5), 3263-3272. doi:10.1121/1.4756950.
Tyack, P. (1981). Interactions between singing Hawaiian humpback whales and conspecifics nearby.
Behavioral Ecology and Sociobiology, 8(2), 105-116.
Tyack, P. L. (2000). Functional aspects of cetacean communication. In J. Mann, R. C. Connor, P. L. Tyack,
and H. Whitehead (Eds.), Cetacean societies: Field studies of dolphins and whales. Chicago, IL:
University of Chicago Press.
Tyack, P. (2008). Implications for marine mammals of large-scale changes in the marine acoustic
environment. Journal of Mammalogy, 89(3), 549-558.
Tyack, P., & H. Whitehead. (1983). Male competition in large groups of wintering humpback whales.
Behaviour, 83, 132-154.
Tyne, J. A., Pollock, K. H., Johnston, D. W., & Bejder, L. (2014). Abundance and survival rates of the Hawai'i
Island associated spinner dolphin (Stenella longirostris) stock. PLoS ONE, 9(1), e86132. doi:
10.1371/journal.pone.0086132.
Tyurneva, O. Y., Y. M. Yakovlev, V. V. Vertyankin, & N. I. Selin. (2010). The peculiarities of foraging
migrations of the Korean-Okhotsk gray whale (Eschrichtius robustus) population in russian
waters of the Far Eastern seas. Russian Journal of Marine Biology, 36(2), 117-124.
doi:10.1134/s1063074010020069.
United Nations Educational, Scientific, and Cultural Organization (UNESCO). (2009). Pelagos: The
cetacean sanctuary. Accessed September 2009.
<http://whc.unesco.org/en/tentativelists/2032/>.
Urick, R.J. (1983). Principles of underwater sound, 3rd ed. New York, New York: McGraw-Hill.
Van Beest, F. M., Teilmann, J., Dietz, R., Galatius, A., Mikkelsen, L., Stalder, D., . . . Nabe-Nielsen, J.
(2018). Environmental drivers of harbour porpoise fine-scale movements. Marine Biology,
165(95), 1-13. doi:10.1007/s00227-018-3346-7.
Van Bree, P. J. H. (1997). On extralimital records of Arctic seals (Mammalia, Pinnipedia) on the
Westeuropean continental coast in the past and at present—A summary. Beaufortia, 47(5),
153-156.

LOA and Rulemaking Application Under the MMPA for Use of SURTASS LFA Sonar
15-62 Literature Cited
Van Cise, A. M., Morin, P. A., Baird, R. W., Lang, A. R., Robertson, K. M., Chivers, S. J., . . . Martien, K. K.
(2016). Redrawing the map: mtDNA provides new insight into the distribution and diversity of
short-finned pilot whales in the Pacific Ocean. Marine Mammal Science, 32(4), 1177-1199.
doi:10.1111/mms.12315.
Van Cise, A. M., Roch, M. A., Baird, R. W., Mooney, T. A., & Barlow, J. (2017a). Acoustic differentiation of
Shiho- and Naisa-type short-finned pilot whales in the Pacific Ocean. The Journal of the
Acoustical Society of America, 141(2), 737-748. doi:10.1121/1.4974858.
Van Cise, A. M., Martien, K. K., Mahaffy, S. D., Baird, R. W., Webster, D. L., Fowler, J. H., . . . Morin, P. A.
(2017b). Familial social structure and socially driven genetic differentiation in Hawaiian short-
finned pilot whales. Molecular Ecology, 26, 6730-6741. doi:10.1111/mec.14397.
Van Opzeeland, I., S. Van Parijs, L. Kindermann, E. Burkhardt, & O. Boebel. (2013). Calling in the cold:
Pervasive acoustic presence of humpback whales (Megaptera novaeangliae) in Antarctic
coastal waters. PLoS ONE, 8(9), e73007. doi:10.1371/journal.pone.0073007.
Van Parijs, S. M. (2003). Aquatic mating in pinnipeds: A review. Aquatic Mammals, 29, 214–226.
Varga, L. M., Wiggins, S. M., & Hildebrand, J. A. (2018). Behavior of singing fin whales Balaenoptera
physalus tracked acoustically offshore of Southern California. Endangered Species Research, 35,
113-124. doi:10.3354/esr00881.
Verboom, W.C., & R.A. Kastelein. (1995). Acoustic signals by harbour porpoises (Phocoena phocoena).
Pages 1-39 in Nachtigall, P.E., J. Lien, W.W.L. Au and A.J. Read, (Eds). Harbour porpoises:
Laboratory studies to reduce bycatch. Woerden, the Netherlands, De Spil Publishers.
Ver Hoef, J. M., Cameron, M. F., Boveng, P. L., London, J. M., & Moreland, E. E. (2014). A spatial
hierarchical model for abundance of three ice-associated seal species in the eastern Bering Sea.
Statistical Methodology, 17, 46-66.
Villadsgaard, A., M. Wahlberg, & J. Tougaard. (2007). Echolocation signals of wild harbour porpoises,
Phocoena phocoena. Journal of Experimental Biology, 210(1), 56-64.
Wada, S., M. Oishi, & T. K. Yamada. (2003). A newly discovered species of living baleen whale. Nature,
426(6964), 278-281.
Wade, P. R., & Baker, C. S. (2011). A summary of the plausibility of western North Pacific minke whale
stock structure hypotheses I, II and III. Report of the International Whaling Commission,
SC/63/RMP8.
Wade, P. R., & Gerrodette, T. (1993). Estimates of cetacean abundance and distribution in the eastern
tropical Pacific. Report of the International Whaling Commission, 43, 477-493.
Wade, P., M.P. Heide-Jørgensen, K. Shelden, J. Barlow, J. Caretta, J. Durban, R. Leduc, L. Munger, S.
Rankin, & C. Stinchcomb. (2006). Acoustic detection and satellite-tracking leads to discovery of
rare concentration of endangered North Pacific right whales. Biology Letters, 2(3), 417-419.
Wahlberg, M. (2002). The acoustic behaviour of diving sperm whales observed with a hydrophone array.
Journal of Experimental Marine Biology and Ecology, 281(1), 53-62.
LOA and Rulemaking Application Under the MMPA for Use of SURTASS LFA Sonar
15-63 Literature Cited
Wahlberg, M., Jensen, F. H., Aguilar Soto, N., Beedholm, K., Bejder, L., Oliveira, C., Rasmussen, M.,
Simon, M., Villadsgaard, A., & Madsen, P. T. (2011b). Source parameters of echolocation clicks
from wild bottlenose dolphins (Tursiops aduncus and Tursiops truncatus). The Journal of the
Acoustical Society of America, 130(4), 2263. doi:10.1121/1.3624822.
Wang, J.Y., & S.C. Yang. (2009). Indo-Pacific bottlenose dolphin. Page 602-608 in W.F. Perrin, B. Wursig,
and J.G.M. Thewissen, (Eds). Encyclopedia of marine mammals, 2nd ed. San Diego, CA: Academic
Press.
Wartzok, D., A. N. Popper, J. Gordon, & J. Merrill. (2003/04). Factors affecting the responses of marine
mammals to acoustic disturbance. Marine Technology Society Journal, 37(4), 6-15.
Watkins, W. A. (1967). The harmonic interval: Fact or artifact in spectral analysis of pulse trains. In W.M.
Tavolga, (Ed). Marine bio-acoustics, Volume 2. Oxford, United Kingdom: Pergamon Press.
Watkins, W. A. (1981). Activities and underwater sounds of fin whales. The Scientific Reports of the
Whales Research Institute, 33, 83-117.
Watkins, W. A., & Ray, G. C. (1977). Underwater sounds from ribbon seal, Phoca (Histriophoca) fasciata.
Fishery Bulletin, 75, 450-453.
Watkins, W. A., & Schevill, W. E. (1977). Sperm whale codas. The Journal of the Acoustical Society of
America, 62(6), 1485-1490.
Watkins, W.A., M.A. Daher, K.M. Fristrup, & G. Notarbartolo-Di-Sciara. (1994). Fishing and acoustic
behavior of Fraser’s dolphin (Lagenodelphis hosei) near Dominica, Southeast Caribbean.
Caribbean Journal of Science, 30(1), 76–82.
Watkins, W.A., M.A. Daher, A. Samuels, and D.P. Gannon. (1997). Observations of Peponocephala
electra, the melon-headed whale, in the southeastern Caribbean. Caribbean Journal of Science,
33(1-2), 34-40.
Watkins, W.A., M.A. Daher, N.A. Dimarzio, A. Samuels, D. Wartzok, K.M. Fristrup, P.W. Howey, & R.R.
Maiefski. (2002). Sperm whale dives tracked by radio tag telemetry. Marine Mammal Science,
18(1), 55-68.
Watkins, W. A., W. E. Schevill, & Best, P. B. (1977). Underwater sounds of Cephalorhynchus heavisidii
(Mammalia: Cetacea). Journal of Mammalogy, 58(3), 316-320.
Watkins, W. A., P. Tyack, & K. E. Moore. (1987a). The 20-Hz signals of finback whales (Balaenoptera
physalus). The Journal of the Acoustical Society of America, 82(6), 1901-1912.
Watkins, W.A., P. Tyack, K.E. Moore, and G. Notarbartolo-Di-Sciara. (1987b). Steno bredanensis in the
Mediterranean Sea. Marine Mammal Science, 3(1), 78-82.
World Database on Protected Areas (WDPA). (2009). 2009 World database on protected areas annual
release. Accessed October 2009. <http://www.wdpa.org/AnnualRelease.aspx>.
Weilgart, L.S. & Whitehead, H. (1990). Vocalization of the North Atlantic pilot whale (Globicephala
melaena) as related to behavioral contexts. Behavioral Ecology and Sociobiology, 26(6), 399-
402.
Weilgart, L., & Whitehead, H. (1993). Coda communication by sperm whales (Physeter macrocephalus)
off the Galapagos Islands. Canadian Journal of Zoology, 71(4), 744-752.
LOA and Rulemaking Application Under the MMPA for Use of SURTASS LFA Sonar
15-64 Literature Cited
Weilgart, L., & Whitehead, H. (1997). Group-specific dialects and geographical variation in coda
repertoire in South Pacific sperm whales. Behavioral Ecology and Sociobiology, 40(5), 277-285.
Weirathmueller, M. J., W. S. Wilcock, and D. C. Soule. (2013). Source levels of fin whale 20 Hz pulses
measured in the Northeast Pacific Ocean. The Journal of the Acoustical Society of America,
133(2), 741-749. doi:10.1121/1.4773277
Weller, D. W., A. Klimek, A. L. Bradford, J. Calambokidis, A. R. Lang, B. Gisborne, A. M. Burdin, W.
Szaniszlo, J. Urbán, A. Gomez-Gallardo Unzueta, S. Swartz, & R. L. Brownell. (2012). Movements
of gray whales between the western and eastern North Pacific. Endangered Species Research,
18(3), 193-199. doi:10.3354/esr00447.
Wells, R. (2013). Movements and dive patterns of short-finned pilot whales (Globicephala
macrorhynchus) released from a mass stranding in the Florida Keys. Aquatic Mammals, 39(1),
61-72. doi:10.1578/am.39.1.2013.61.
Wells, R. S., Manire, C. A., Byrd, L., Smith, D. R., Gannon, J. G., Fauquier, D., & Mullin, K., (2009).
Movements and dive patterns of a rehabilitated Risso’s dolphin, Grampus griseus, in the Gulf of
Mexico and Atlantic Ocean. Marine Mammal Science, 25(2), 420–429.
Wells, R. S., & Scott, M. D. (2009). Common bottlenose dolphin (Tursiops truncatus). Pages 249-255 in
W.F. Perrin, B. Wursig, and H.G.M. Thewissen, (Eds). Encyclopedia of marine mammals, 2nd ed.
San Diego, CA: Academic Press.
Werner, R., & Campagna, C. (1995). Diving behaviour of lactating southern sea lions (Otaria flavescens)
in Patagonia. Canadian Journal of Zoology, 73(11), 1975-1982.
West, K. L., S. Sanchez, D. Rotstein, K. M. Robertson, S. Dennison, G. Levine, N. Davis, D. Schofield, C. W.
Potter, & B. Jensen. (2012). A Longman's beaked whale (Indopacetus pacificus) strands in Maui,
Hawaii, with first case of morbillivirus in the central Pacific. Marine Mammal Science,29(4),
767-776. doi:10.1111/j.1748-7692.2012.00616.x.
Westgate, A.J., A.J. Read, P. Berggren, H.N. Koopman, & D.E. Gaskin. (1995). Diving behaviour of harbour
porpoises, Phocoena phocoena. Canadian Journal of Fisheries and Aquatic Sciences, 52(5),
1064–1073.
Whitehead, H. (2002). Estimates of the current global population size and historical trajectory for sperm
whales. Marine Ecology Progress Series, 242, 295-304.
Whitehead, H. (2009). Sperm whale. Pages 1091-1097 in W.F. Perrin, B. Wursig, & J.G.M. Thewissen,
(Eds). Encyclopedia of marine mammals, 2nd ed. San Diego, CA: Academic Press.
Whitehead, H., & Hooker, S. K. (2012). Uncertain status of the northern bottlenose whale Hyperoodon
ampullatus: Population fragmentation, legacy of whaling and current trends. Endangered
Species Research, 19, 47-61.
Whitehead, H., & L. Weilgart. (1991). Patterns of visually observable behaviour and vocalizations in
groups of female sperm whales. Behaviour, 118(3-4), 275-296.
Wiggins, S. M., Frasier, K. E., Henderson, E. E., & Hildebrand, J. A. (2013). Tracking dolphin whistles using
an autonomous acoustic recorder array. The Journal of the Acoustical Society of America, 133,
3813-3818.
LOA and Rulemaking Application Under the MMPA for Use of SURTASS LFA Sonar
15-65 Literature Cited
Wild, L. A., & C. M. Gabriele. (2014). Putative contact calls made by humpback whales (Megaptera
novaeangliae) in Southeastern Alaska. Canadian Acoustics, 42(4), 23-31.
Williams, T.M. (2009). Swimming. Pages 1140-1147 in W.F. Perrin, B. Wursig, & H.G.M. Thewissen, eds.
Encyclopedia of marine mammals, 2nd ed. San Diego, CA: Academic Press.
Willis, P. M., & Baird, R. W. (1998). Status of the dwarf sperm whale, Kogia simus, with special reference
to Canada. Canadian Field-Naturalist, 112(1), 114-125.
Wilson, K. C. (2015). Integrating multiple technologies to understand the foraging behaviour of monk
seals in the main Hawaiian Islands. Doctoral dissertation, Duke University, Durham, NC.
Wilson, K., Littnan, C. L., & Read, A. J. (2017a). Movements and home ranges of monk seals in the main Hawaiian Islands. Marine Mammal Science, 33, 1080-1096. doi: 10.1111/mms.12429.
Wilson, K., Littnan, C., Halpin, P., Read, A. (2017b). Integrating multiple technologies to understand the
foraging behaviour of Hawaiian monk seals. Royal Society Open Science, 4, 160703.
http://dx.doi.org/10.1098/rsos.160703.
Winn, H.E., & P.J. Perkins. (1976). Distribution and sounds of the minke whale, with a review of
mysticete sounds. Cetology, 19, 1-12.
Wolski, L.F., R.C. Anderson, A.E. Bowles, & P.K. Yochem. (2003). Measuring hearing in the harbor seal
(Phoca vitulina): Comparison of behavioral and auditory brainstem response techniques. The
Journal of the Acoustical Society of America, 113(1), 629-637.
Wong, S. N. P., & Whitehead, H. (2014). Seasonal occurrence of sperm whales (Physeter macrocephalus)
around Kelvin Seamount in the Sargasso Sea in relation to oceanographic processes. Deep Sea
Research Part I: Oceanographic Research Papers, 91, 10-16. doi:10.1016/j.dsr.2014.05.001.
Würsig, B., & W.J. Richardson. (2009). Effects of noise. Pages 765-773 in W.F. Perrin, B.G. Wursig, and
J.G.M. Thewissen, (Eds). Encyclopedia of marine mammals, 2nd ed. San Diego, California:
Academic Press.
Würsig, B., & C. Clark. (1993). Behavior. In J. J. Burns, J. J. Montague, and C. J. Cowles (Eds.). The
bowhead whale (pp. 157-199). Lawrence, KS: The Society for Marine Mammalogy.
Yack, T. M., J. Barlow, J. Calambokidis, B. Southall, & S. Coates. (2013). Passive acoustic monitoring using
a towed hydrophone array results in identification of a previously unknown beaked whale
habitat. The Journal of the Acoustical Society of America, 134(3), 2589-2595.
doi:10.1121/1.4816585.
Yamada, T. K. (2009). Omura's whale. Pages 799-801 W. F. Perrin, B. Würsig, & J. G. M. Thewissen (Eds.).
Encylopedia of marine mammals, 2nd ed. New York: Academic Press.
Yamato, M., K. Khidas, N. D. Pyenson, R. E. Fordyce, & J. G. Mead. (2016). Extensively remodeled,
fractured cetacean tympanic bullae show that whales can survive traumatic injury to the ears.
Journal of Anatomy 228, 125-136. doi: 10.1111/joa.12385.
Yatabe, A., N. Kubo, M. Otsuka, S. Shima, T. Kubodera & T. K. Yamada. (2010). Stomach contents and
structure of a Longman's beaked whale (Indopacetus pacificus) stranded in Kyushu, Japan.
Aquatic Mammals 36(2), 172-177.

LOA and Rulemaking Application Under the MMPA for Use of SURTASS LFA Sonar
15-66 Literature Cited
Yin, S. E. (1999). Movement patterns, behaviors, and whistle sounds of dolphin groups off Kaikoura, New
Zealand. (Master’s thesis). Texas A & M University, College Station, TX.
Yoshida, Y. M., Morisaka, T., Sakai, M., Iwasaki, M., Wakabayashi, I., Seko, A., Kasamatsu, M., Akamatsu,
T., & Kohshima, S. (2014). Sound variation and function in captive Commerson's dolphins
(Cephalorhynchus commersonii). Behavioral Processes, 108C, 11-19.
doi:10.1016/j.beproc.2014.08.017.
Yuen, M.M.L., P.E. Nachtigall, M. Breese,& A.Y. Supin. (2005). Behavioral and auditory evoked potential
audiograms of a false killer whale (Pseudorca crassidens). The Journal of the Acoustical Society
of America, 118(4), 2688-2695.
Zimmer, W.M.X., & Tyack, P.L. (2007). Repetitive shallow dives pose decompression risk in deep-diving
beaked whales. Marine Mammal Science 23(4), 888-925.
Zimmer, W. M. X., Johnson, M. P., Madsen, P. T., & Tyack, P. L. 2005a Echolocation clicks of free-ranging
Cuvier’s beaked whales (Ziphius cavirostris). The Journal of the Acoustical Society of America
117(6):3919-3927.
Zimmer, W. M. X., Tyack, P. L., Johnson, M. P., & Madsen, P. T. 2005b. Three-dimensional beam pattern
of regular sperm whale clicks confirms bent-horn hypothesis. The Journal of the Acoustical
Society of America 117(3), Part I:1473-1485.
Zoidis, A. M., M. A. Smultea, A. S. Frankel, J. Hopkins, A. Day, S. Ertl, A. Whitt, & D. Fertl. (2008). Sounds
attributed to humpback whale (Megaptera novaeangliae) calves recorded in Hawai‘i. The
Journal of the Acoustical Society of America, 123(3), 1737-1746.