Areal identification of groundwater nitrate contamination sources in periurban areas
8
Urban Impact on Soils and Groundwater Groundwater Nitrate Contamination 159 © 2007 ecomed publishers (Verlagsgruppe Hüthig Jehle Rehm GmbH), D-86899 Landsberg and Tokyo • Mumbai • Seoul • Melbourne • Paris J Soils Sediments 7 (3) 159 – 166 (2007) Urban Impact on Soils and Groundwater (Guest Editors – Ulf Mohrlok and Thomas Schiedek) Eds.: Ulf Mohrlok 1 and Thomas Schiedek 2 1 Dr. Ulf Mohrlok, Universität Karlsruhe (TH), Institut für Hydromechanik (IfH), Kaiserstraße 12, 76128 Karlsruhe, Germany ( [email protected]) 2 Dr. Thomas Schiedek, Technical University Darmstadt, Department for Applied Geosciences, Schnittspahnstr. 9, 64287 Darmstadt, Germany ( [email protected]) Areal Identification of Groundwater Nitrate Contamination Sources in Periurban Areas Alfonso Corniello, Daniela Ducci* and Giovanni Ruggieri Sez. Geologia Applicata, Dip. Ing. Geotecnica, Università di Napoli Federico II, P.le Tecchio 80, 80125 Naples, Italy * Corresponding author ([email protected]) relation in the Land Use Map are in the 'urban areas and artificial land' class, the source of the groundwater nitrate is not necessar- ily related to intensive farming and livestock. Conclusions. The Potential Agricultural Nitrate Contamination Risk Map in urban and periurban environments indicates the rela- tionship between the high nitrate values and land use, giving useful information about the source of nitrate in groundwater. Recommendations and Perspectives. Based on this study, we for- mulate a hypothesis on the source of groundwater nitrate which should be verified on several case studies using nitrogen isotope techniques. Keywords: Agriculture; geographic information system (GIS); groundwater contamination; groundwater vulnerability; nitrate; periurban areas; risk assessment DOI: http://dx.doi.org/10.1065/jss2007.03.213 Please cite this paper as: Corniello A, Ducci D, Ruggieri G (2007): Areal Identification of Groundwater Nitrate Contami- nation Sources in Periurban Areas. J Soils Sediments 7 (4) 159–166 Abstract Background, Aims and Scope. The purpose of this study is to verify a method for groundwater contamination risk assessment in urban and periurban areas using Geographic Information Sys- tems (GIS). The method is based on agricultural hazard evalua- tion. In urban and periurban areas, the problem of dealing with NO 3 concentrations mainly entails identifying nitrate sources from the excessive use of fertilizers, or leaks from the sewage network and old septic systems. Residential areas coexisting with farming, and high and increasing nitrate concentrations, were identified in a densely inhabited area (>2 million inhabitants in about 1,000 km 2 ) with an alluvial aquifer, located in southern Italy. Methods. First of all, comparison between the Contamination Vulnerability Map and the distribution of NO 3 concentrations highlights anomalous areas with low or moderate vulnerability in spite of the diffuse nitrate contamination of the aquifer. Assum- ing the agricultural origin of the nitrates, the hazard is calculated using the ANHI (Agricultural Nitrate Hazard Index), a paramet- ric index which assesses the potential hazard of nitrate contami- nation originating from agriculture on a regional scale (Padovani and Trevisan 2002). The ANHI integrates two categories of pa- rameters: the hazard factors (HF), which represent all farming activities that cause, or might cause, an impact on soil quality in terms of nitrate (use of fertilizers, application of livestock and poultry manure, food industry wastewater and urban sludge), and the control factors (CF) which adapt the hazard factors to the characteristics of the site (geographical location, climatic condi- tions and agronomic practices). Organization, processing and mapping are performed using a Geographical Information Sys- tem (GIS: ILWIS 3.3 and ARCGIS 9.1). Results. The ANHI Map is obtained by multiplying the hazard factors (HF) and the control factors (CF), and dividing the result- ing values into 6 classes. Finally, the Potential risk Map (R) is obtained by coupling the potential hazard of nitrate pollution (ANHI) and the aquifer Contamination Vulnerability Map. Discussion. By using spatial statistics, the Potential Agricultural Nitrate Contamination Risk Map and the Nitrate content of the aquifer correlation can be correlated. Where areas with low cor- Introduction In developed countries, continuing urbanization in cities and in nearby periurban areas causes many social, economic and environmental changes, which have considerable impact on groundwater resources. Rapid population growth and irregu- lar urban development determine the presence of landscape between urban spaces and consequently the coexistence of ur- ban, industrial and agricultural/livestock activities. In this con- text, nitrate groundwater contamination occurs very often. The research reported herein presents statistical and geo- graphic information system (GIS) spatial analysis approaches for identifying the causes of nitrate content in groundwater. A method for groundwater contamination risk assessment based on the evaluation of agricultural hazard was used to identify nitrate sources in the high use of fertilizers, leaking from the sewage network and the presence of old septic sys- tems. Moreover, in urban and periurban areas, high NO 3 concentrations can be a cumulative result of the different activities in the area. At a regional scale, water treatment processes for reducing nitrate contents cannot be carried out and the only feasible policies are fertilizer use reduction and/or the surveillance of the sewage system network. Hence, identification of the source or sources of nitrate contamination is critical.
-
Upload
independent -
Category
Documents
-
view
0 -
download
0
Transcript of Areal identification of groundwater nitrate contamination sources in periurban areas
Urban Impact on Soils and Groundwater Groundwater Nitrate Contamination
159© 2007 ecomed publishers (Verlagsgruppe Hüthig Jehle Rehm GmbH), D-86899 Landsberg and Tokyo • Mumbai • Seoul • Melbourne • ParisJ Soils Sediments 77777 (3) 159 – 166 (2007)
Urban Impact on Soils and Groundwater (Guest Editors – Ulf Mohrlok and Thomas Schiedek)
Eds.: Ulf Mohrlok1 and Thomas Schiedek2
1Dr. Ulf Mohrlok, Universität Karlsruhe (TH), Institut für Hydromechanik (IfH), Kaiserstraße 12, 76128 Karlsruhe, Germany ([email protected])2Dr. Thomas Schiedek, Technical University Darmstadt, Department for Applied Geosciences, Schnittspahnstr. 9, 64287 Darmstadt, Germany ([email protected])
Areal Identification of Groundwater Nitrate Contamination Sources inPeriurban AreasAlfonso Corniello, Daniela Ducci* and Giovanni Ruggieri
Sez. Geologia Applicata, Dip. Ing. Geotecnica, Università di Napoli Federico II, P.le Tecchio 80, 80125 Naples, Italy
* Corresponding author ([email protected])
relation in the Land Use Map are in the 'urban areas and artificialland' class, the source of the groundwater nitrate is not necessar-ily related to intensive farming and livestock.
Conclusions. The Potential Agricultural Nitrate ContaminationRisk Map in urban and periurban environments indicates the rela-tionship between the high nitrate values and land use, giving usefulinformation about the source of nitrate in groundwater.
Recommendations and Perspectives. Based on this study, we for-mulate a hypothesis on the source of groundwater nitrate whichshould be verified on several case studies using nitrogen isotopetechniques.
Keywords: Agriculture; geographic information system (GIS);groundwater contamination; groundwater vulnerability; nitrate;periurban areas; risk assessment
DOI: http://dx.doi.org/10.1065/jss2007.03.213
Please cite this paper as: Corniello A, Ducci D, Ruggieri G(2007): Areal Identification of Groundwater Nitrate Contami-nation Sources in Periurban Areas. J Soils Sediments 7 (4)159–166
Abstract
Background, Aims and Scope. The purpose of this study is toverify a method for groundwater contamination risk assessmentin urban and periurban areas using Geographic Information Sys-tems (GIS). The method is based on agricultural hazard evalua-tion. In urban and periurban areas, the problem of dealing withNO3 concentrations mainly entails identifying nitrate sources fromthe excessive use of fertilizers, or leaks from the sewage networkand old septic systems. Residential areas coexisting with farming,and high and increasing nitrate concentrations, were identified in adensely inhabited area (>2 million inhabitants in about 1,000 km2)with an alluvial aquifer, located in southern Italy.
Methods. First of all, comparison between the ContaminationVulnerability Map and the distribution of NO3 concentrationshighlights anomalous areas with low or moderate vulnerability inspite of the diffuse nitrate contamination of the aquifer. Assum-ing the agricultural origin of the nitrates, the hazard is calculatedusing the ANHI (Agricultural Nitrate Hazard Index), a paramet-ric index which assesses the potential hazard of nitrate contami-nation originating from agriculture on a regional scale (Padovaniand Trevisan 2002). The ANHI integrates two categories of pa-rameters: the hazard factors (HF), which represent all farmingactivities that cause, or might cause, an impact on soil quality interms of nitrate (use of fertilizers, application of livestock andpoultry manure, food industry wastewater and urban sludge), andthe control factors (CF) which adapt the hazard factors to thecharacteristics of the site (geographical location, climatic condi-tions and agronomic practices). Organization, processing andmapping are performed using a Geographical Information Sys-tem (GIS: ILWIS 3.3 and ARCGIS 9.1).
Results. The ANHI Map is obtained by multiplying the hazardfactors (HF) and the control factors (CF), and dividing the result-ing values into 6 classes. Finally, the Potential risk Map (R) isobtained by coupling the potential hazard of nitrate pollution(ANHI) and the aquifer Contamination Vulnerability Map.
Discussion. By using spatial statistics, the Potential AgriculturalNitrate Contamination Risk Map and the Nitrate content of theaquifer correlation can be correlated. Where areas with low cor-
Introduction
In developed countries, continuing urbanization in cities andin nearby periurban areas causes many social, economic andenvironmental changes, which have considerable impact ongroundwater resources. Rapid population growth and irregu-lar urban development determine the presence of landscapebetween urban spaces and consequently the coexistence of ur-ban, industrial and agricultural/livestock activities. In this con-text, nitrate groundwater contamination occurs very often.
The research reported herein presents statistical and geo-graphic information system (GIS) spatial analysis approachesfor identifying the causes of nitrate content in groundwater.A method for groundwater contamination risk assessmentbased on the evaluation of agricultural hazard was used toidentify nitrate sources in the high use of fertilizers, leakingfrom the sewage network and the presence of old septic sys-tems. Moreover, in urban and periurban areas, high NO3concentrations can be a cumulative result of the differentactivities in the area.
At a regional scale, water treatment processes for reducingnitrate contents cannot be carried out and the only feasiblepolicies are fertilizer use reduction and/or the surveillanceof the sewage system network. Hence, identification of thesource or sources of nitrate contamination is critical.

Groundwater Nitrate Contamination Urban Impact on Soils and Groundwater
160 J Soils Sediments 77777 (3) 2007
1 Background, Aims and Scope
Groundwater and surface water quality degradation oftendepends on the use of nitrogen fertilizers. In recent years,the use of residues has increased, especially livestock resi-dues (liquid and semi-liquid manure), leaching towards thesubsoil through rainfall or irrigation. This problem is amplydocumented (Vrba and Romijn 1986, USEPA 1987, Bacci etal. 1994, Rivers et al. 1996, Carter 1997, Pacheco and Cab-rera 1997, Nolan et al. 1998, Smith et al. 1999, DEFRA2002, Stigter et al. 2002, Owens 2003, WHO 2004, Zapo-rozec 2004).
The excessive use of mineral and organic nitrogen in agri-culture has generated an increase and a diffusion of poorquality water in many regions of the EU, constituting a haz-ard for human health and the environment. The EU's Ni-trate Directive (Council of European Communities, 1991)limits the application of fertilizers and nitrogen from farmmanure with the intention of protecting water. The guide-lines concern: a) the definition of "nitrate contaminationvulnerable areas" and b) the Action Programme to reducewater pollution (by limiting the application of nitrogen fer-tilizers and organic manures).
Various forms of nitrogen (oxidized and reduced forms) arepresent in many possible recharge sources of urban aqui-fers. They include sewage and mains leakage, septic tanks,industrial spillages, contaminated land, landfills, river orchannel infiltration, fertilizers used in gardens, house build-ing, storm water and direct recharge. Because of the num-ber of nitrogen sources in urban areas, it is not surprisingto find elevated nitrogen concentrations in urban aquifers.The sources of nitrogen in the urban environment are amixture of point sources (e.g., landfills and coal gasificationworks), multipoint sources (e.g., soakaways and leaky sew-ers) and diffuse sources (atmospheric deposition, house build-ing and recreation areas) (Lerner et al. 1999, Wakida andLerner 2005).
1.1 Environmental concerns of periurban areas
Continuing urbanization and its confrontation with nearbysurrounding periurban areas cause many social, economicand environmental changes, which to a large extent reflectan adaptation to the new emerging reality. Large urban cen-ters attract the population and lead to the unchecked ex-pansion into nearby periurban areas (Katzir 1996).
Development around big cities (more than one million in-habitants) is characterized by:– the industrial development from landscape to town with
industrial settlements;– the presence of landscape between urban spaces which
frames unbridled urban development within the arisingagglomerations;
– the break-up of large-spatial urban spaces and the fallingback to individual spaces, surrounded and interrupted bylandscape appropriate for small industrial transformation.
Intensive urbanization is also creating extreme ecologicaldisturbances, caused by wastewater, domestic and industrialsolid waste, and so forth. Sound agroecological solutions
can offer mutual benefit both to farmers and the urban popu-lation: wastewater can be recycled for irrigating crops andorganic refuse can be composted.
In developed countries with strong economies, agroecologicalsolutions are being applied, whereas in developing coun-tries with fewer economic resources, ecological disturbancesin periurban areas are not dealt with sufficiently. Quite fre-quently they are completely neglected, thus creating haz-ards for both the local population and the environment, suchas illegal sewage connections or on-site sewage disposal (cess-pools, septic tanks and pit latrines) (Katzir 1996, Vázquez-Suñé et al. 2005, Wakida and Lerner 2005).
1.2 Case study: The sector of the Campania alluvial plainaround Naples
In some areas of Campania, nitrate levels in groundwaterwere already high in the 1990s. Results of recent scientificstudies demonstrate that the high nitrate concentrations haveincreased. The problem is evident in the highly urbanizedlarge coastal plains (Campania, Sarno and Sele River Plains)where intensive agriculture takes place, often in greenhouseswhich are major potential contamination sources. Recently,many wells in the Campania Plain showed very high nitrateconcentrations (up to 200 mg/l), well over the WHO thresh-old of 50 mg/l, also recognized by Italian drinking waterlegislation (DPR 236/88, D. Lgs. 31/2001).
These very high nitrate concentrations obviously affect theuse of groundwater for potable purposes, such as in theCampania Plain, where some wells contribute to supply thecity of Naples, albeit with reduced extraction. Moreover,the Plains receive a groundwater inflow from carbonate aqui-fers, generally without contamination. In recent years, theintensive tapping of the carbonate aquifers produced a gen-eralized lowering of the piezometric surface; in the futurethis evolution might reverse the groundwater exchange, withconsequences on the carbonate groundwater quality.
The study area is part of the highly urbanized (26%)Campania alluvial plain (~1,000 km2), located in southernItaly. The plain's main aquifer lies in the alluvial-pyroclasticand pyroclastic porous units underlying "Campanian Ign-imbrite" tuffs (Fig. 1). The spatial distribution and the crosssections of the hydrogeological units (Corniello and Ducci2005) permitted one to define their relationship in the sub-soil. In fact, the hydrogeological setting is strongly relatedto the thickness and physical characteristics (lithification,granulometry, amount of scoria, etc.) of Campanian Ignim-brite, which plays the role of semi-confining or confiningbed. The main aquifer is recharged by rainwater infiltrationand by underflow from the adjacent reliefs: the limestoneMesozoic mountains (NE), the Somma-Vesuvius volcano (S)and the pyroclastic hills of the Phlegrean Fields (SW).
Although the area presents different hydrogeological fea-tures, the main aquifer can be considered a single continu-ous body. The piezometric surface (constructed on the basisof a monitoring network of almost 700 wells and shown inFig. 1) stresses the groundwater inflows to the CampaniaPlain aquifer and shows a groundwater divide, which sepa-rates the flow in two parts: the first directed towards W andthe second towards S, in the eastern part of Naples. More-

Urban Impact on Soils and Groundwater Groundwater Nitrate Contamination
J Soils Sediments 77777 (3) 2007 161
over, the piezometric surface shows the same pattern as in1988, but a generalized lowering, due to intensive extrac-tion for agricultural, industrial and domestic use. In twoareas, located respectively in the Acerra area and near thecoast, there are shallow groundwater bodies in the incoher-ent sediments overlapping the 'Campanian Ignimbrite' tuff.
The same monitoring network wells were used to draw watersamples to analyze nitrate contents (Fig. 2) and the major ions.The nitrate content often exceeds the 50 mg/l limit establishedin 1980 by the Drinking Water Directive of the EuropeanCommunity and identifying the 'Groundwater Nitrate Vul-nerable Zones (NVZs)' by the EC Nitrate Directive of 1991.
Fig. 1: Hydrogeological map showing the study area (dotted line), the piezometric surface of the main aquifer (continuous line) and, where present, of theshallow aquifer (broken line), in m a.s.l. (February 2003) (modified from Corniello and Ducci 2005)
Fig. 2: Distribution of nitrate in groundwater in the main aquifer in 2003. The map shows where values exceeded 50 mg/l. This is the maximumallyadmissible concentration in drinking water as stipulated by the European Union

Groundwater Nitrate Contamination Urban Impact on Soils and Groundwater
162 J Soils Sediments 77777 (3) 2007
In spite of this diffuse nitrate contamination of the aquifer(see Fig. 2), The Contamination Vulnerability Map of the mainaquifer, drawn up in a previous study (Corniello and Ducci2005) by the SINTACS method (Civita and De Maio 2000),shows that the prevalent vulnerability degree is moderate.
The nitrate contamination may well be due to the high haz-ard levels of this area due to the widespread presence ofpolluting activities in a densely inhabited area (>2 millioninhabitants).
2 Methods
2.1 Overview on aquifer contamination risk assessment methods
The problematic definition of nitrate-vulnerable areas is thefirst step towards protection of groundwater against pollu-tion. It allows the areas concerned to be divided into sectorssubject to different land use restrictions. The difficulty de-fining nitrate-vulnerable areas lies in the number of factorsto be taken into account:– the pollutant load discharged on the soil (type of animal
farming, livestock density, type and intensity of crop cul-tivation, etc.)
– the environmental factors concurring in pollution increaseand/or decrease such as intrinsic aquifer vulnerability,rates of groundwater recharge, soil denitrification andsoil degradation.
There are many examples of sound applications of 'AquiferVulnerability to Pollution', especially by the Point CountSystem Model (Aller et al. 1987, Civita and De Maio 2000,Corniello et al. 1997, Gogu and Dassargues 2000, Zaporozec2004). In the last fifteen years, the advent of GIS, permittingthe inventory, archiving, retrieval and display of spatial dataand the link to numerical rating systems, has resulted in thewidespread use of point count system methods, such asDRASTIC (Aller et al. 1987), widely used in the USA, andSINTACS (Civita and De Maio 2000), an Italian modifica-tion, based on the most commonly found Italian hydrogeo-logic settings. Both evaluate vertical vulnerability using thesame seven parameters: depth to groundwater (S), rechargeaction (I), attenuation aptitude of the vadose zone (N), at-tenuation aptitude of the soil (T), hydrogeologic character-istics of the aquifer media (A), hydraulic conductivity (C)and topographic slope (S).
If aquifer intrinsic vulnerability assessment is well definedand the gathering of other factors concurring in nitrate con-tamination is clear, the problem in assessing the nitrate-vul-nerable areas remains in the combination of these factorswith intrinsic vulnerability.
Significant experimentation involving analysis of vulnerabil-ity derived from a specific pollutant or identification of ar-eas of different pollution risk degrees has been reportedworldwide (Corniello and Ducci 2001, Ducci 1999, Faye etal. 2005, Gerhardt 1996, Zaporozec 2004). Generally, therisk map is obtained by crossing the basic thematic maps(Vulnerability, Hazard and Value).
Recently, Portuguese researchers (Stigter et al. 2006) used aDRASTIC adaptation to assess nitrate-specific vulnerabilityusing the specific Susceptibility Index (SI), considering land
use as an additional layer. Some Italian methods should alsobe considered, such as the IPA (Agricultural Danger Index)described by Capri et al. (1999) and the ANHI (Agricul-tural Nitrate Hazard Index) of Padovani and Trevisan (2002).
2.2 The ANHI method
In this study the hazard is calculated using the ANHI, aparametric index which assesses the potential hazard of ni-trate contamination originating from agriculture at a regionalscale. The method was applied in a densely inhabited area(>2 million inhabitants in about 1,000 km2) with an alluvialaquifer, located near Naples (southern Italy), described indetail in section 3.1.
The ANHI integrates two categories of parameters:– the hazard factors (HF) represented by all farming ac-
tivities that cause, or might cause, an impact on soil qual-ity in terms of nitrate;
– the control factors (CF) are the site characteristics (geo-graphical location, climatic conditions and agronomic prac-tices) which aid or mitigate the nitrate contamination.
The Hazard Factors (HF) include:• use of mineral fertilizers (HFf). This factor derives from
the Land Use Map (from 1:50,000 CUAS of Campania,2004): the area is classified into factors from 0 to 5 ac-cording to land use (the chief land use units are urbanareas, orchard and vegetable plants; the predominantvalue is 3);
• use of organic fertilizers (livestock and poultry manure –HFm). This factor expresses the contamination due tothe nitrogen content in livestock residues spread on thesoil surface. On the basis of ISTAT (Italian Statistics In-stitute), data on the number of livestock in each munici-pality, the amount of residues per cultivated hectare wascalculated and converted into a hazard class from 0 to 5.The whole study area is in the lower classes 1 and 2;
• food industry wastewater and urban sludge (HFs). Theuse of wastewater and urban sludge for agricultural pur-poses is negligible in Campania, as demonstrated by thestudy of the Agency for Environmental Protection andTechnical Services in 2004 (APAT-CTN_TES). The wholestudy area is in hazard class 0.
The Control Factors (CF) are:• the nitrogen soil content (CFn); in the study area the soil
units of the soil map were associated with the amount ofnitrogen in the soil. The predominant value is 1.0 (corre-sponding to a nitrogen content in the soil of 0.15–0.22 %);
• the effect of the weather (CFw ) depends on the yearly rain-fall in mm and on the mean yearly temperature in centi-grade. Higher rainfalls and lower temperatures increasethe danger of aquifer contamination from agriculture. Inthe study area the annual rainfall is 600–1,000 mm andthe mean temperature 15°–16°C. Almost the whole studyarea is in hazard class 1.02 (Tyrrhenian climate);
• the effect of agronomic practices (CFap) refers to soil till-age, which affects soil status, modifying physical prop-erties such as porosity. In the study area, the land useunits of the Land Use Map (CUAS of Campania, 2004)were associated with different kinds of agronomic prac-
Urban Impact on Soils and Groundwater Groundwater Nitrate Contamination
J Soils Sediments 77777 (3) 2007 163
tices. The most widespread are traditional tillage (1) andnon-tillage agriculture (0.94);
• the type of irrigation (CFi); this practice influences themovement of nitrogen in groundwater. Sprinkler irriga-tion is the least dangerous method. This factor was evalu-ated on the basis of ISTAT data for the year 2002 aboutthe type of irrigation used by farms in each municipality.
The HF values range between 0 and 5 and CF values be-tween 0.94 and 1.10. The hazard index (HI) can be calcu-lated as:
HI= (HFf + HFm + HFs) x CFn x CFw x CFap x CFi.
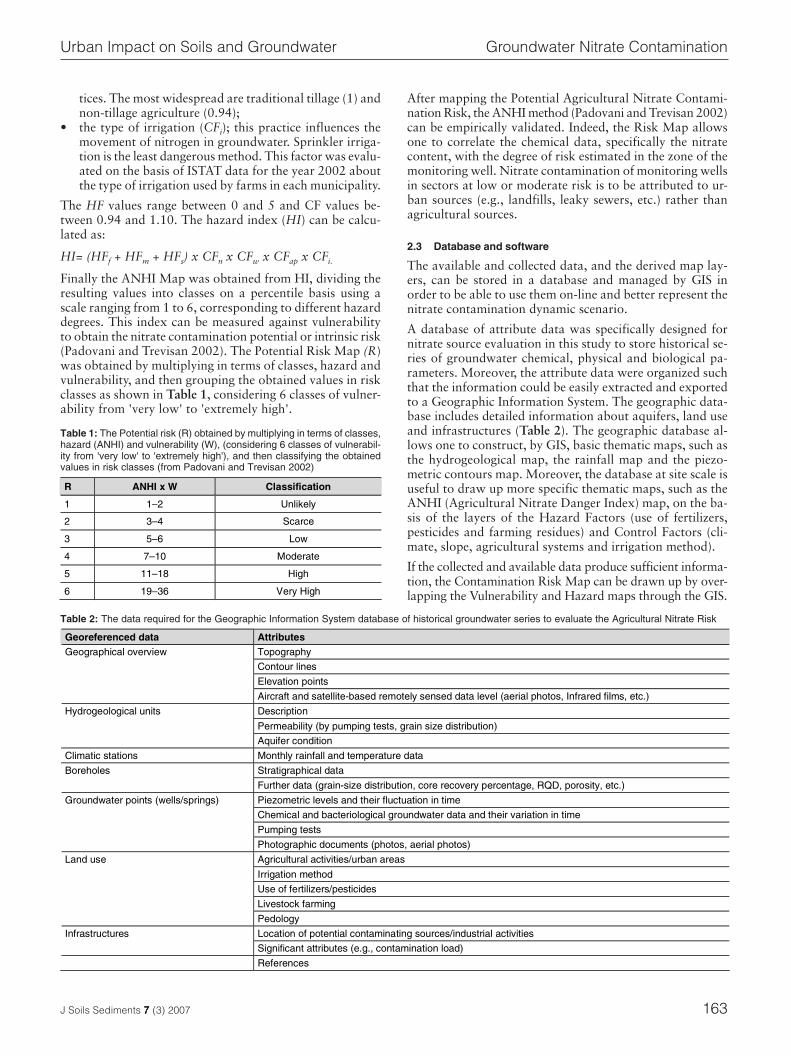
Finally the ANHI Map was obtained from HI, dividing theresulting values into classes on a percentile basis using ascale ranging from 1 to 6, corresponding to different hazarddegrees. This index can be measured against vulnerabilityto obtain the nitrate contamination potential or intrinsic risk(Padovani and Trevisan 2002). The Potential Risk Map (R)was obtained by multiplying in terms of classes, hazard andvulnerability, and then grouping the obtained values in riskclasses as shown in Table 1, considering 6 classes of vulner-ability from 'very low' to 'extremely high'.
After mapping the Potential Agricultural Nitrate Contami-nation Risk, the ANHI method (Padovani and Trevisan 2002)can be empirically validated. Indeed, the Risk Map allowsone to correlate the chemical data, specifically the nitratecontent, with the degree of risk estimated in the zone of themonitoring well. Nitrate contamination of monitoring wellsin sectors at low or moderate risk is to be attributed to ur-ban sources (e.g., landfills, leaky sewers, etc.) rather thanagricultural sources.
2.3 Database and software
The available and collected data, and the derived map lay-ers, can be stored in a database and managed by GIS inorder to be able to use them on-line and better represent thenitrate contamination dynamic scenario.
A database of attribute data was specifically designed fornitrate source evaluation in this study to store historical se-ries of groundwater chemical, physical and biological pa-rameters. Moreover, the attribute data were organized suchthat the information could be easily extracted and exportedto a Geographic Information System. The geographic data-base includes detailed information about aquifers, land useand infrastructures (Table 2). The geographic database al-lows one to construct, by GIS, basic thematic maps, such asthe hydrogeological map, the rainfall map and the piezo-metric contours map. Moreover, the database at site scale isuseful to draw up more specific thematic maps, such as theANHI (Agricultural Nitrate Danger Index) map, on the ba-sis of the layers of the Hazard Factors (use of fertilizers,pesticides and farming residues) and Control Factors (cli-mate, slope, agricultural systems and irrigation method).
If the collected and available data produce sufficient informa-tion, the Contamination Risk Map can be drawn up by over-lapping the Vulnerability and Hazard maps through the GIS.
R ANHI x W Classification
1 1–2 Unlikely
2 3–4 Scarce
3 5–6 Low
4 7–10 Moderate
5 11–18 High
6 19–36 Very High
Georeferenced data Attributes Topography
Contour lines
Elevation points
Geographical overview
Aircraft and satellite-based remotely sensed data level (aerial photos, Infrared films, etc.)
Description
Permeability (by pumping tests, grain size distribution)
Hydrogeological units
Aquifer condition
Climatic stations Monthly rainfall and temperature data
Stratigraphical data Boreholes
Further data (grain-size distribution, core recovery percentage, RQD, porosity, etc.)
Piezometric levels and their fluctuation in time
Chemical and bacteriological groundwater data and their variation in time
Pumping tests
Groundwater points (wells/springs)
Photographic documents (photos, aerial photos)
Agricultural activities/urban areas
Irrigation method
Use of fertilizers/pesticides
Livestock farming
Land use
Pedology
Location of potential contaminating sources/industrial activities Infrastructures
Significant attributes (e.g., contamination load)
References
Table 2: The data required for the Geographic Information System database of historical groundwater series to evaluate the Agricultural Nitrate Risk
Table 1: The Potential risk (R) obtained by multiplying in terms of classes,hazard (ANHI) and vulnerability (W), (considering 6 classes of vulnerabil-ity from 'very low' to 'extremely high'), and then classifying the obtainedvalues in risk classes (from Padovani and Trevisan 2002)

Groundwater Nitrate Contamination Urban Impact on Soils and Groundwater
164 J Soils Sediments 77777 (3) 2007
3 Results
In the sample area of the Campania alluvial plain aroundNaples, stratigraphic data, available from public authori-ties or private companies, were collected, georeferenced andstandardized. Moreover, a wells network exploiting the samegroundwater body was selected for piezometric and chemi-cal monitoring.
Other data were collected in order to assess the nitrate con-tamination vulnerability, especially:• type of animal husbandry;• climatic and hydrologic factors,• land cover and agricultural activities.
All the collected data were stored in a geographic databaseas explained in Section 2.3 and shown in Table 2.
Using the geographic data base, the hazard was calculatedusing the ANHI method (Agricultural Nitrate Hazard In-dex) explained in section 2.2, considering the Land Use Map(Table 3) obtained from the 'Map of Agricultural Land Usein Campania' at the scale of 1:50,000 published in 2004 bySESIRCA (Testing, Information, Research and Consultingin Agriculture – Campania Region), supported by ITA (Ital-ian Association for Remotely Sensed Data in Agriculture),interpreting aerial photos (1998–99) and LANDSAT images(May 2001, July 2001 and April 2002) (Fig. 3).
The Potential risk Map (R) was obtained by multiplying interms of classes, hazard and vulnerability, and then classify-ing the obtained values into risk classes (see Section 2.2).
4 Discussion
The Potential Agricultural Nitrate Contamination Risk Map(Fig. 4) shows a low spatial correlation with the nitrate con-tent of the main aquifer (see Fig. 2; Table 4). Many areas(30% of the whole area) present a low or very low risk ofnitrate values exceeding 50 mg/l. Almost all these areas(87.5%) are in the class 'urban areas and artificial land' inthe Land Use Map (see Fig. 3). This suggests that the sourceof the groundwater nitrate is not necessarily only related tointensive cropping or livestock, but also to leakage from thesewage network and old septic systems.
Identification of nitrate sources in groundwater is very im-portant in order to mitigate NO3 contamination. This is usu-ally accomplished with geochemical analyses (including theexamination of general chemical characteristics, temporalchanges in NO3, nitrate-to-chloride ratios, stable isotopeanalysis, nitrogen isotopes, etc.).
In the sample area, isotope techniques (δ15N) are now be-ing applied by the authors in the shallow aquifers to dis-card another hypothesis: that high nitrate contaminationcould derive from the connection of the main aquifer withshallow aquifers (at high vulnerability and risk) which areheavily polluted (up to 300 mg/l in parts). Such connec-tions are made by a large number of improperly constructedwells: typically, in this area, drillers install the well screenacross the whole length of the borehole, intersecting morethan one aquifer.
Fig. 3: Simplified regional Land Use Map (from 1:50,000 CUAS of Campania, 2004)

Urban Impact on Soils and Groundwater Groundwater Nitrate Contamination
J Soils Sediments 77777 (3) 2007 165
Land Use % Vineyards 0.02 Fruit trees and berry plantations 21.31 Olive groves 1.46 Citrus orchards 0.02 Pastures 2.83 Unused pastures (Fallow land??) 0.18 Annual crops associated with permanent crops 0.42 Complex cultivation patterns 3.40 Broad-leaved forest 0.32 Coniferous forest 0.52 Mixed forest 0.00 Natural grasslands 0.28 Moors and heathland 0.07 Beaches, dunes and sand plains 0.21 Bare rocks 0.06 Sparsely vegetated areas 0.17 Coastal wetlands 0.04 Urban areas and artificial lands 26.02 Water bodies 1.07 Fall/winter cereals crop 6.65 Roots and tubers 0.45 Spring/summer cereal crops 4.86 Horticultural crops 16.26 Industrial crops 8.82 Rotation grass 0.14 Croplands 3.14 Natural reclaimed lands 0.01 Artificial, reclaimed lands 0.06 Horticultural and fruit crops 1.15 Flowering and ornamental plants 0.05
Table 4: Correlation matrix between the spatial distribution of the NitrateConcentration map (see Fig. 2) and the Potential Agricultural Nitrate Con-tamination Risk map (see Fig. 4)
Table 3: Land use as a percentage of total sample area (from 1:50,000CUAS of Campania 2004)
Fig. 4: Potential Agricultural Nitrate Contamination Risk of the main aquifer derived from the ANHI (Agricultural Nitrate Hazard Index) map and theVulnerability map
NO3 in mg/l
Contamination Risk 0–5 5–25 25–50 >50
Very low – 0.39 0.96 0.84
Low – 3.82 8.42 16.92
Moderate 0.08 7.22 10.88 20.48
High 0.60 4.22 7.89 13.47
Very high 0.79 0.80 0.74 1.47
5 Conclusions
This paper evaluates the degree of nitrate risk contamina-tion in the different parts of the aquifer in relation to urbandevelopment, land use and aquifer characteristics. The origi-nality of this paper lies not in the application of the ANHImethod (Padovani and Trevisan, 2002) to assess nitrate con-tamination risk, but rather in the combination of the 'Ni-trate distribution map' and the 'Nitrate Contamination RiskMap' (or the Land Use Map) for identifying nitrate sources.
The sample area is very large (about 1,000 km2), and nitrateconcentrations throughout most of the groundwater gener-ally exceed 50 mg/L. The use of 'point by point' classicalanalysis was not feasible at this scale: normally very effec-tive isotope techniques (nitrogen-15 – 15N – a stable nitro-gen isotope) cannot be proposed in such large areas (hun-dreds of km2) or in the first phases of contamination studies.

Groundwater Nitrate Contamination Urban Impact on Soils and Groundwater
166 J Soils Sediments 77777 (3) 2007
The contribution of this work is in highlighting the possibili-ties of applying, as a preliminary analysis or as an analysis oflarge areas, vulnerability maps and spatial correlation by GISto discriminate different sectors and/or different sources. In-deed, the use of GIS spatial statistics (Norra et al. 2001) tocompare vulnerable and contaminated areas allows us to iden-tify the more significant nitrate vulnerability indicators andselect the most reliable nitrate-specific vulnerability methods.Moreover, in periurban areas, high NO3 concentrations canbe a cumulative result of the various activities in the area.
In this context, limitations of the quantities of nitrogen com-pounds applied to farmland are absolutely necessary, alsoto balance the nitrogen generated by waste and sewage.Hence, in these areas, a strict agricultural policy will be nec-essary, limiting the amounts of nitrogen compounds, andnitrate contamination vulnerable areas will need to be de-fined. On the other hand, water treatment processes for re-ducing nitrate contents cannot be carried out in such largeareas, where nitrate concentrations will decrease onlythrough a slow transfer of groundwater to surface waterand the progressive dilution effect of infiltration water.
6 Recommendations and Perspectives
Based on our findings, the nitrate risk contamination map andthe spatial distribution maps of nitrate concentrations may beused to formulate a hypothesis on the source of groundwaternitrate. However, we recommend complementary nitrogenisotope analysis to verify the hypothesis and test the validityof the method, in several case studies, if possible in differenthydrogeological environments. Detailed investigations intosuch issues will contribute to ascertain the usefulness of anitrate risk contamination map in helping environmentalbodies and agencies manage contamination problems.
Acknowledgements. The authors would agree and thank the review-ers for their comments and for their careful revising and suggestions,allowing us to improve this paper.
References
Aller L, Bennet T, Lehr JH, Petty RJ, Hackett G (1987): DRASTIC: A stan-dardized system for evaluating ground water pollution potential usinghydrogeologic settings. EPA/600/2–87/035, U.S. Environmental Protec-tion Agency, Ada, Oklahoma, 641 pp
Bacci E, Franchi A, Bensi L, Gaggi C (1994): Evaluation of Fate and Expo-sure Models – Calibrating a Simple Model for Ranking the Contamina-tion Potential. Env Sci Pollut Res 2, 94–97
Carter LW (1997): Nitrates in groundwater. Lewis, Boca Raton, Florida,USA, 263 pp
Capri E, Padovani L, Trevisan M (1999): La previsione della contaminazionedelle acque sotterranee da prodotti fitosanitari. Pitagora, Bologna
Civita M, De Maio M (2000): Valutazione e cartografia automatica dellavulnerabilità degli acquiferi all'inquinamento con il sistema parametricoSINTACS R5. A new parametric system for the assessment and auto-matic mapping of ground water vulnerability to contamination. Quadernidi Tecniche e di Protezione ambientale, 72, Pitagora, Bologna, 226 pp
Corniello A, Ducci D (2001): The Risk Contamination Map of the Aquiferunderlying the Middle Volturno River plain. Proceedings of the 3rd In-ternational Conference on 'Future Groundwater at Risk', Lisbon (Por-tugal), June 2001, pp 25–33
Corniello A, Ducci D (2005): Carta della Vulnerabilità all'inquinamento delsettore meridionale della Piana del F. Volturno. Aquifer Vulnerabilityand Risk, 2nd International Workshop Aquifer vulnerability assessmentand mapping. 4th Congress on the Protection and Management ofGroundwater, Colorno, 21–23 September 2005
Corniello A, Ducci D, Napolitano P (1997): Comparison between Paramet-ric Methods to Evaluate Aquifer Pollution Vulnerability Using a GIS. An
example in the Piana Campana. Engineering Geology and the Environ-ment, Balkema, pp 1721–1726
Council of European Communities (1991): Council Directive 91/676/EECof 12 December 1991 concerning the protection of waters against pollu-tion caused by nitrates from agricultural sources
DEFRA (2002): Guidelines for farmers in NVZ – England. Nitrate vulner-able zones
Ducci D (1999): GIS techniques for mapping groundwater contaminationrisk. Natural Hazard 20 (2/3) 279–294
Faye SC, Faye S, Wohnlich S, Gaye CB (2004): An assessment of the riskassociated with urban development in the Thiaroye area (Senegal). Envi-ronmental Geology 45, 312–322
Gerhardt A (1996): Behavioural Early Warning Responses to Polluted Wa-ter. Performance of Gammarus pulex L. (Crustacea) and Hydropsyheangustipennis (Curtis) (Insecta) to a Complex Industrial Effluent. EnvSci Pollut Res 2, 63–70
Gogu RC, Dassargues A (2000): Current trends and future challenges ingroundwater vulnerability assessment using overlay and index methods.Environmental Geology 39 (6) 549–559
Katzir R (1996): Agroecological Aspects of the Peri-urban Process. <http://www.cityfarmer.org/israel.html>
Lerner DN, Yang Y, Barrett MH, Tellam JH (1999): Loading of non-agricul-tural nitrogen in urban groundwater. In: Ellis JB (ed), Impacts of urbangrowth on surface and groundwater quality. IAHS Publ., 259, 117–123
Nolan BT, Ruddy BC, Hitt KJ, Helsel DR (1998): A National Look At Ni-trate Contamination of Ground Water. USGS-NAWQA. Issue of WaterConditioning and Purification 39 (12) 76–79
Norra S, Weber A, Kramar U, Stüben D (2001): Mapping of Trace Metals inUrban Soils: The Example of Mühlburg/Karlsruhe, Germany. J Soils Sedi-ments 2, 77–93
Owens LB (2003): Ground water pollution by nitrogen fertilizer. Encyclo-pedia of Water Sciences. Steward and Howell Eds., Dekker, N.T.
Pacheco JA, Cabrera AS (1997): Groundwater Contamination by Nitrates inthe Yucatan Peninsula, Mexico. Hydrogeology Journal 5 (2) 47–53
Padovani L, Trevisan M (2002): I nitrati di origine agricola nelle acquesotterranee. Quaderni di tecniche di protezione ambientale 75. PitagoraEditrice 15, 103 pp
Rivers CN, Barrett MH, Hiscock KM, Dennis PF, Feast NA, Lerner DN(1996): Use of Nitrogen Isotopes to Identify Nitrogen Contamination ofthe Sherwood Sandstone Aquifer Beneath the City of Nottingham, UnitedKingdom. Hydrogeology Journal 4, 90–102
Smith GD, Wetselaar R, Fox JJ, van de Graaff RHM, Moeljohardjo D,Sarwono J, Wiranto, Asj'ari SR, Tjojudo S, Basuki (1999): The originand distribution of nitrate in groundwater from village wells in Kotagede,Yogyakarta, Indonesia. Hydrogeology Journal 7, 1–14
SESIRCA – Settore Sperimentazione Informazione Ricerca e Consulenza inAgricoltura della Regione Campania (2004): Carta dell’UtilizzazioneAgricola dei Suoli della Campania. Carta in scala 1/50.000
Stigter T, Almeida P, Carvalho Dill A, Ribeiro L (2002): Influence of irriga-tion on groundwater nitrate concentrations in areas considered to havelow vulnerability to contamination. In: Proc XXXII IAH & VI ALHSUDCongress, Oct. 2002, Mar del Plata, Argentina (CD-ROM)
Stigter TY, Ribeiro L, Carvalho Dill AMM (2006): Evaluation of an Intrinsicand a Specific Vulnerability Assessment Method in Comparison with Ground-water Salinisation and Nitrate Contamination Levels in Two AgriculturalRegions in the South of Portugal. Hydrogeology Journal 14, 79–99
US EPA (1987): Estimated national occurrence and exposure to nitrate andnitrite in public drinking water supplies. Washington, DC, US Environ-mental Protection Agency, Office of Drinking Water
Van Stempvoort D, Evert L, Wassenaar L (1993): Aquifer Vulnerability In-dex: a GIS compatible method for groundwater vulnerability mapping.Canadian Water Resources Journal 18, 25–37
Vrba J, Romijn E (1986): Impact of agriculture activities on groundwater.International Contribution to Hydrogeology, 5, AIH
Vázquez-Suñé E, Sanchez-Vilá X, Carrera J (2005): Introductory review ofspecific factors influencing urban groundwater, an emerging branch ofhydrogeology, with reference to Barcelona, Spain. Hydrogeology Jour-nal 13, 522–533
Wakida FT, Lerner DN (2005): Non-agricultural sources of groundwaternitrate: a review and case study. Water Research 39, 3–16
WHO – World Health Organization (2004): Nitrates and nitrites in drink-ing-water WHO/SDE/WSH/04.08/56
Zaporozec A (ed) (2004): Groundwater Contamination Inventory: A Meth-odological Guide. International Hydrological Programme (IHP) VIGroundwater Series No. 2,UNESCO, 160 pp
Received: August 2nd, 2006Accepted: March 15th, 2007
OnlineFirst: March 15th, 2007