Are warbles and bots related to reproductive status in West Greenland caribou?
16
243 Rangifer, Special Issue No. 20, 2012 The 13 th North American Caribou Workshop Winnipeg, Manitoba, Canada 25–28 October, 2010 Are warbles and bots related to reproductive status in West Greenland caribou? Christine Cuyler 1 , Robert R. White 2 , Keith Lewis 3 , Colleen Soulliere 3 , Anne Gunn 4 , Don E. Russell 5 , & Colin Daniel 6 1 Greenland Institute of Natural Resources, P.O. Box 570, 3900 Nuuk, Greenland ([email protected]). 2 Office of Research & Graduate Studies, University of Alaska Anchorage, Anchorage, Alaska USA. & Institute of Arctic Biology, University of Alaska Fairbanks, 500M St #304, Anchorage, Alaska 99501, USA. 3 Environment & Conservation, P.O. Box 8700, 2 Canada Drive, St. John’s NL, A1B 4J6, Canada. 4 Roland Road, Salt Spring Island, British Columbia, V8K 1V1, Canada. 5 Yukon College, 500 College Drive, PO Box 2799, Whitehorse, Yukon Y1A 5K4, Canada. 6 Apex Resource Management Solutions Ltd., 937 Kingsmere Ave, OTTAWA, Ontario, K2A 3K2 Canada. Abstract: In March-April 2008-09, using CARMA protocols, 81 cows and 16 calves were collected in West Greenland from two caribou populations; Akia-Maniitsoq (AM) and Kangerlussuaq-Sisimiut (KS). In both populations, warble lar- vae numbers were highest in calves and higher in non-pregnant than pregnant cows. Nose bots showed no relationship with pregnancy or lactation; KS calves had higher nose bot loads than cows, a pattern not observed in AM. Pregnant cows had more rump fat than non-pregnant cows. KS cows lacking rump fat entirely had the highest warble burdens. We observed lactating pregnant cows with moderate larval burdens. Projected energy cost of the heaviest observed combined larvae burdens was equivalent to 2-5 days basal metabolic rate (BMR) for a cow, and 7-12 days BMR for a calf. Foregone fattening in adult cows with average burdens was 0.2 to 0.5 kg, but almost doubled with the heaviest infestations to 0.4 and 0.8 kg. Average burdens in calves resulted in forgone fattening of about 0.5 kg, with peak costs equivalent to 0.7 and 1.1 kg fat for AM and KS calves respectively. Although modest, these projected energy costs of hosting larvae for cows support the negative relationship between rump fat and larvae burden. For calves, hosting high burdens of warble larvae could affect winter survival, specifically those weaned normally in October or in early winter. Harmful effects of oestrid larvae burdens may remain subtle but clearly cumulative in relation to seasonal forage availability and incidence of other parasites. Key words: energetics; nose bot larvae; oestridae; Rangifer; reproduction; survival; warble larvae. Rangifer, Special Issue No. 20: 243–257 Introduction Parasites are increasingly considered to play an important role in cycles of host abundance and population dynamics (Hudson et al., 2001; Gunn & Irvine, 2003). In totally or relatively predator-free environments, gastro-intestinal parasites with direct life-cycles, have been shown to have population level consequences in hares (Lepus timidus ), feral Soay sheep ( Ovis aries ) and Svalbard reindeer (Rangifer tarandus platyrhynchus ), reducing fecundity and contributing to population instability (Dobson & Hudson, 1992; Gulland et al ., 1993; Iver et al ., 2002; Albon et al ., 2004; Newery & Thirgood, 2004). The parasite– mediated reduction in calf production in Svalbard
Transcript of Are warbles and bots related to reproductive status in West Greenland caribou?

243Rangifer, Special Issue No. 20, 2012
The 13th North American Caribou WorkshopWinnipeg, Manitoba, Canada25–28 October, 2010
Are warbles and bots related to reproductive status in West Greenland caribou?
Christine Cuyler1, Robert R. White2, Keith Lewis3, Colleen Soulliere3, Anne Gunn4, Don E. Russell5, & Colin Daniel6
1 Greenland Institute of Natural Resources, P.O. Box 570, 3900 Nuuk, Greenland ([email protected]). 2 Office of Research & Graduate Studies, University of Alaska Anchorage, Anchorage, Alaska USA. & Institute of Arctic
Biology, University of Alaska Fairbanks, 500M St #304, Anchorage, Alaska 99501, USA.3 Environment & Conservation, P.O. Box 8700, 2 Canada Drive, St. John’s NL, A1B 4J6, Canada.4 Roland Road, Salt Spring Island, British Columbia, V8K 1V1, Canada.5 Yukon College, 500 College Drive, PO Box 2799, Whitehorse, Yukon Y1A 5K4, Canada.6 Apex Resource Management Solutions Ltd., 937 Kingsmere Ave, OTTAWA, Ontario, K2A 3K2 Canada.
Abstract: In March-April 2008-09, using CARMA protocols, 81 cows and 16 calves were collected in West Greenland from two caribou populations; Akia-Maniitsoq (AM) and Kangerlussuaq-Sisimiut (KS). In both populations, warble lar-vae numbers were highest in calves and higher in non-pregnant than pregnant cows. Nose bots showed no relationship with pregnancy or lactation; KS calves had higher nose bot loads than cows, a pattern not observed in AM. Pregnant cows had more rump fat than non-pregnant cows. KS cows lacking rump fat entirely had the highest warble burdens. We observed lactating pregnant cows with moderate larval burdens. Projected energy cost of the heaviest observed combined larvae burdens was equivalent to 2-5 days basal metabolic rate (BMR) for a cow, and 7-12 days BMR for a calf. Foregone fattening in adult cows with average burdens was 0.2 to 0.5 kg, but almost doubled with the heaviest infestations to 0.4 and 0.8 kg. Average burdens in calves resulted in forgone fattening of about 0.5 kg, with peak costs equivalent to 0.7 and 1.1 kg fat for AM and KS calves respectively. Although modest, these projected energy costs of hosting larvae for cows support the negative relationship between rump fat and larvae burden. For calves, hosting high burdens of warble larvae could affect winter survival, specifically those weaned normally in October or in early winter. Harmful effects of oestrid larvae burdens may remain subtle but clearly cumulative in relation to seasonal forage availability and incidence of other parasites.
Key words: energetics; nose bot larvae; oestridae; Rangifer; reproduction; survival; warble larvae.
Rangifer, Special Issue No. 20: 243–257
IntroductionParasites are increasingly considered to play an important role in cycles of host abundance and population dynamics (Hudson et al., 2001; Gunn & Irvine, 2003). In totally or relatively predator-free environments, gastro-intestinal parasites with direct life-cycles, have been shown to have population level
consequences in hares (Lepus timidus), feral Soay sheep (Ovis aries) and Svalbard reindeer (Rangifer tarandus platyrhynchus), reducing fecundity and contributing to population instability (Dobson & Hudson, 1992; Gulland et al., 1993; Iver et al., 2002; Albon et al., 2004; Newery & Thirgood, 2004). The parasite–mediated reduction in calf production in Svalbard

244 Rangifer, Special Issue No. 20, 2012
reindeer was dependent on parasite density in the host, which in turn was a delayed density dependent response to host densities (Albon et al., 2004). The effects of other direct life-cycle parasites in predator-free environments are not well understood.
Whereas intestinal parasites exert influence through metabolic effects within the host (Hudson et al., 2001; Gunn & Irvine 2003), macro-parasites such as larvae of warble (Hypoderma tarandi ) and nose bot flies (Cephenemyia trompe ) of the Oestridae family, that are host-specific endoparasites in reindeer and caribou (Rangifer tarandus), as well as having metabolic costs, also cause energetically costly behavioural responses. In summer, the presence of adult oestrid flies can provoke intense behavioural responses in Rangifer, disturbing foraging and increasing movement (Kel-sall, 1968; White et al., 1975, Reimers, 1980; Helle & Tarvainen, 1984; Kojola, 1991; Walsh et al., 1992; Russell, et al., 1993; Iver et al., 2002; Bergerud et al., 2008; Witter et al., 2011). Adult flies are strong fast fliers (Nilssen & Anderson 1995), which make it easy to locate, track and follow their hosts (Iver, et al., 2002). Hot summers increase adult fly activity and thus harassment of caribou (Thomas & Kiliaan, 1990; Folstad et al., 1991; Nilssen & Haugerud, 1994; Mörschell, 1999; Witter et al., 2011). An extreme example of the influence of oestrid flies was the sum-mer of 1977 in north-west Alaska. High tempera-tures and exceptionally low precipitation (Haugen & Brown, 1980) resulted in warble fly harassment and overwinter loss of a portion of the 1977 calf cohort. Warble larvae numbered between 1900 and 2000 in one dead calf (Davis et al., 1980), in excess of 1000 in others (White, unpubl. data), and upon palpation, hides of these dead calves resembled bubble-wrap in appearance and texture (White, unpubl. observa-tions). In semi-domestic reindeer extreme cases of parasitic larvae infection, which weaken body con-dition, can cause death (Helle, 1980; Folstad, et al., 1989). Scandinavian reindeer husbandry considers warbles the parasite causing the most losses (Josefsen et al., 2006). Thus combined effects of adult warble fly disturbance and the energetic cost of harbouring larval stages internally can impact demography. In addition to mortality, a negative relationship between the number of warble larvae and the probability of pregnancy, or of fat reserves in cows in late winter, could also drive demographic outcomes (Thomas & Kiliaan, 1990; Hughes et al., 2009).
Oestrid flies have a one year direct life cycle, with no intermediate hosts (Savel’ev, 1961; Anderson & Nilssen, 1990; Nilssen & Haugerud, 1994, 1995; Nilssen, 1997). Adult flies develop and mate in sum-mer, while larvae over-winter inside reindeer/caribou.
Over-wintering warble larvae live under the skin, typically on either side of the host’s spine, and nose bot larvae live in nasal cavities and pharynx. Warble numbers in caribou vary widely both among popula-tions and years (Kelsall, 1975; Bergerud et al., 2008). Mean larvae numbers in North American caribou cows of 38 ± 43 (Thomas & Kiliaan, 1990) and 51 ± 4 have been observed (Bergerud et al., 2008), and means of under a 100 larvae are common (Kelsall, 1975). Semi-domestic reindeer cows in Finland had mean warble numbers < 50 larvae (Helle, 1980). However, exceptional maximums of from 300 to 600 warble larvae also were observed in female caribou (Kelsall, 1975).
Caribou are not defenceless against their oestrid parasite predators. In addition to initial avoidance reactions to the presence of adult flies, a caribou’s immune system mounts biochemical and inflam-matory responses to larvae (Helle, 1980; Solomakha, 1990) and larval mortality has been observed (Kelsall, 1975). There is high mortality among warble larvae in the first larval stage, specifically in hosts of good body condition (Savel’ev, 1961). Although oestrid lar-vae occur in 97-100% of caribou, calves or juveniles generally have greater warble infections than adults, and bulls more than cows (Helle, 1980; Folstad, et al., 1989; Thomas & Kiliaan, 1990; Syroechkovskii 1995; Bergerud et al., 2008). Beyond weather and caribou density, individual variation in defence response, e.g., migratory behaviour, avoidance behaviour, immune response and timing of hair moult, may account for observed differences in larvae number by late winter (Thomas & Kiliaan 1990).
We explored the number and weight of warble and nose bot fly larvae parasites in Greenland caribou cows and their calves-at-heel. We also investigated late-winter body condition and reproductive status, which was categorized by whether the cow was preg-nant, lactating, recently weaned, had a calf at heel or any combination thereof. Specifically we tested whether: 1) 10-month old calves-at-heel had greater number / weight of larvae than adults, 2) non-preg-nant cows had greater number / weight of larvae than pregnant cows, and 3) non-lactating cows had greater number / weight of larvae than lactating cows. Since the energetic cost of larvae loads may not be trivial, we also calculated the approximate energetic cost to the host associated with the cumulative oestrid para-site burden and discuss this cost in relation to the basal metabolic rates of cows and calves, the amount of foregone fattening based on the energy costs, and possible consequences for winter survival.

245Rangifer, Special Issue No. 20, 2012
Study area and populationsWe studied the largest, Kangerlussuaq-Sisimiut (KS), and second largest, Akia-Maniitsoq (AM), caribou populations in West Greenland (Fig. 1), as both are commercially important and significant to Greenland culture and traditions (Cuyler et al., 2005). KS cari-bou were from the North region in close proximity to the Greenland Ice Cap, 67°03’N, 50°59’W, in an area characterised by dry continental desert steppe climate and lacking the macro-lichens favoured by caribou. The winter diet of KS caribou is dependent on dwarf shrubs, grasses and sedges, which regener-ate each year (Lund et al., 2000). Winter snow cover often arrives late, is incomplete (patchy), light (< 15 cm deep), often absent, and can disappear early. The terrain is rugged and largely under 500 m elevation. AM caribou were from the Central region’s Akia-Nordland area north of the Godthåbfjord system, 64°34’N, 51°44’W, where although rugged, eleva-tions are largely < 100 metres. The area is charac-terised by a wet maritime climate and presence of macro-lichens that are showing signs of overgrazing. The AM winter diet is dependent on lichens (Lund et al., 2000), which may take decades to regenerate and about a century to achieve climax status (Kumpula et al., 2000). Similar to KS, AM winter snow cover is incomplete; however it can be ca. 70 cm deep, arrive early and remain late. In summer many AM cows migrate to the inland near the Greenland Ice Cap where elevations are generally 500-800 m. Throughout their range, AM caribou have access to
elevations >500 m. Local knowledge, which is neither confirmed or refuted, states that warbles and bots arrived in Greenland with the introduction of semi-domesticated reindeer from Norway to the inner fjord system east of Nuuk in 1952.
In March 2010 the KS and AM populations num-bered approximately 98 000 and 32 000 respectively (Cuyler, et al., 2011). The KS and AM herds have been at high abundance for at least the last decade, with current densities on preferred winter range of about seven and two caribou per square kilometre respectively (Cuyler et al., 2005, 2011). While the KS herd has remained stable in number, the AM herd abundance has declined slowly (Cuyler et al., 2011). Both herds are predator free. Spring migration dis-tances are short and on a generally east-west gradient for both the KS and AM caribou, with maximums of about 60 and 170 km respectively (Cuyler & Linnell, 2004).
MethodsFrom 29 March to 13 April 2008, we shot 41 cows and 6 calves-at-heel (age ca. 10-months) from the AM caribou population. Similarly, 40 cows and 10 calves-at-heel (age ca. 10-months) were collected from the KS caribou population from 3 to 17 March 2009. Animals were shot in the neck. We conducted thorough post-mortem examinations as detailed in CARMA (CircumArctic Rangifer Monitoring & Assessment) protocols (http://www.carmanetwork.com). For each caribou these included measuring total and dressed carcass weight (i.e., carcass minus hide, head, all thoracic and abdominal organs, and the metacarpals / metatarsals with hooves), rump fat depth, the presence or absence of pregnancy, lacta-tion status (white/milky-lactating, or clear liquid-recently weaned (R.G. White & W.E. Hauer, unpubl. observations; White et al., 2000)), and presence of calf-at-heel. We counted the number of warble larvae manually, and weighed 10. This weight with the total number was used to calculate total warble larvae weight. Bot larvae were measured similarly.
We used weather data from the CARMA MERRA files (Russell et al., in press), for the period 15 June to 15 August for the preceding summers to the AM and KS collections, i.e., 2007 and 2008 respectively, to calculate an oestrid fly activity index (OFI). The index employed daily mean temperature (T, °C) and wind (W, m/s). Thus OFI = T1 x W1, where, T1=1 if (daily mean temperature >18 °C) else if (daily mean temperature <13 °C) = 0 else = 1-((18- daily mean temperature)/10), and W1= 0 if (wind at 10 m/s > 9) else = (9-wind 10 m/s)/9 (Russell et al., 1993).
Fig. 1. Regions for the Kangerlussuaq-Sisimiut and Akia-Maniitsoq caribou herds in West Greenland, elevations are not shown.

246 Rangifer, Special Issue No. 20, 2012
We used caribou body weights from adult cows, to estimate basal metabolic rate (BMRkcal = 70 x weight0.75, weight given in kg) in kcal (Kleiber, 1975), and converted to kJ by multiplying by the factor 4.187. Metabolic rate of individual larvae was esti-mated from its weight assuming a BMR of 5% of interspecies coefficient (Glazier, 2005). Thus oestrid daily BMR = (0.05*70*4.187* (individual larvae weight, kg)0.75. Larvae weights during the growing period were estimated from observed mean weights in March-April, and an emergent weight of 2.25 g. The metabolic cost of BMR, i.e., maintenance cost of an individual larva, was determined as the integral of daily BMR of an individual larva assuming an efficiency of use of the host’s metabolizable energy of 0.85. To estimate net energy deposited in the larvae (NE, kJ) we assumed a larva was composed of 60% water and 40% dry matter that was composed of 50% fat at 39.54 kJ/g, 40% protein at 23.7 kJ/g, and 10% carbohydrate at 17.5 kJ/g (Standard energy contents - White, et al., 2010). We assumed metabo-lizable energy absorbed from the host was deposited as NE in larvae fat, protein and carbohydrate with 98% efficiency. Cost to the host for NE was the individual larval NE/0.98 multiplied by the number of larvae. Costs of BMR to the host were assessed as the accumulated daily BMR/0.85 to a shedding weight of 2.25 g for warbles and 0.5 g for bots on or about 1 June. Total energy cost to the host was (NE/0.98) + (cumulative BMR/0.85). Average and maximum cumulative energy costs of the oestrid larvae burden were calculated for calves-at-heel and for adult cows stratified by pregnancy status. In cal-culating the energy cost of larvae burden we ignored the energy costs of mounting an immune response and that due to increased heat loss that would result from a disrupted fur surface. Specific cow age was obtained from incisor cementum rings (McEwan, 1963; Reimers & Nordby, 1968). Alternately we used two age categories in analyses, 10-month old calves or adults (age > 3 years). Adult cows were classified by reproductive status into four categories; pregnant and non-lactating (P+NL), pregnant and lactating (P+L), non-pregnant and non-lactating (NP+NL) and non-pregnant and lactating (NP+L).
We used the Student’s t-test to compare dressed carcass weights and rump fat depths of pregnant and non-pregnant adult cows. We used ANOVA’s to describe differences in parasite burden with the four reproductive categories and age. Herds were analysed separately because collections were made in separate years. In all cases assumptions of the model were met or violation of an assumption was insubstantial to the result of the test. If the original ANOVA was
significant, we conducted three planned comparisons (i.e. 1-tailed contrasts) to further test our hypotheses that larval numbers and weights vary by age and reproductive status (Crawley 2007). All analyses were conducted in R (R Development Core Team, 2009). We used regressions to examine cow age against their rump fat depth or pregnancy.
ResultsPregnancy and age of sampled caribouThe 41 cows shot in March/April 2008 from the AM herd included 34 adults of age > 3-years (Fig. 2) and seven sub-adults. The latter were 2.83 years old, not pregnant and had no calf-at-heel. Similarly, among the 40 cows shot in March 2009 from the KS herd, 36 were adults of age > 3-years (Fig. 3) and four sub-adults aged 2.83 years. One of the latter was pregnant, and none had a calf-at-heel. The pregnancy rates among sampled adult cows were 82% for the AM herd and 53% for the KS. Six female calves-at-heel were sampled from the AM herd and six females and four male calves from the KS herd. There was no relationship between cow age and pregnancy (P > 0.05) in KS and AM caribou.
Rump fat and lactationFour mature AM cows (Fig. 2), aged ca. 7.85 to 9.85 years, possessed rump fat while being pregnant and with a ca. 10-month old calf-at-heel. Their rump fat depths were a mean 0.7 cm with a range of 0.5 to 1.0 cm. Based on expressible mammary fluid two of these cows were producing white milk and still nursing their calf. Two of the four cows had recently weaned, based on clear expressible liquid, and a further cow had recently weaned and had no visible calf-at-heel. All non-pregnant adult cows with a calf-at-heel were producing white milk. There was no relationship between cow age and rump fat depth or lactation (P > 0.05) in KS and AM caribou.
Of the 19 pregnant adult KS cows (Fig. 3), three aged ca. 4.83, 7.83 and 8.83 years, were pregnant, had their 10-month old calf-at-heel, which they were nursing, and still possessed some remaining rump fat. The youngest had a fat depth of 1.5 cm remain-ing, while the two older cows had 0.8 and 0.1 respec-tively (n=3, mean 0.8 cm). For the pregnant cows, three that had a calf-at heel had recently weaned. A further five pregnant cows had probably weaned as they showed a clear mammary fluid, but had no visible calf-at-heel. Of the 17 non-pregnant adult KS cows, 15 had their calf-at-heel and 14 of these were producing white milk.

247Rangifer, Special Issue No. 20, 2012
Fig. 2. Reproductive status among the adult cows from the Akia-Maniitsoq caribou herd of West Greenland collected from 29 March to 13 April 2008.
Fig. 3. Reproductive status among the adult cows from the Kangerlussuaq-Sisimiut caribou herd of West Greenland collected from 3 to 17 March 2009.

248 Rangifer, Special Issue No. 20, 2012
Within herds, pregnant adult cows (age > 3-years) possessed significantly greater rump fat than non-pregnant (AM P < 0.0001, df = 32, t = 5.929; KS P = 0.0005, df = 34, t = 3.849) (Table 1, 2). Fat depth did not differ between herds for either pregnant or non-pregnant adult cows. All 10-month old calves-at-heel had zero rump fat regardless of herd. Zero rump fat on adult cows was observed on 22 KS and 9 AM cows. All seven AM sub-adult cows and two of the four KS sub-adults had zero rump fat and were not pregnant. The remaining two KS sub-adult cows had rump fat depths of 0.1 and 0.4 cm, and the latter sub-
adult was pregnant. Although mean rump fat depths were 1.2 ± 0.7 cm for the 14 KS adult cows pos-sessing rump fat and 0.9 ± 0.6 for the 25 AM adult cows, the difference was not significant (P = 0.12, df = 37, t = 1.570). Within the KS herd adult cows with zero rump fat had significantly higher larvae burdens than cows possessing rump fat (P = 0.0005, df = 34, t = 3.857). In contrast, no significant difference was found among AM adult cows (P = 0.17, df = 32, t = 1.401).
Table 1. Akia-Maniitsoq caribou of West Greenland: data from adult cows (age > 3-years) and calves-at-heel (age 10-months) collected 29 March – 13 April 2008, mean ± SD or maximum.
Akia-Maniitsoq 2008
Pregnant Non-pregnant Calf-at-heel
Number collected (n) 28 6 6
Mean age (yr) 6.2 ± 2.3 8.3 ± 1.4 10-months
Mean total body weight (kg) 60.5 ± 3.2 52.8 ± 7.1 30.8 ± 4.2
Mean dressed carcass weight (kg) 29.0 ± 2.1 27.1 ± 4.0 15.3 ± 3.1
Mean BMR1 caribou (kJ/day) 6361 ± 251 5735 ± 579 3821 ± 385
Mean rump fat depth (cm) 0.8 ± 0.7 0.05 ± 0.08 0
Mean warble number 119 ± 77 205 ± 186 318 ± 160
Max warble number 294 537 517
Mean weight ONE warble larva (g) 1.35 ± 0.18 1.28 ± 0.16 1.54 ± 0.13
Mean warbles total weight (g) 160 ± 107 260 ± 246 478 ± 218
Mean energy cost warbles (kJ) 6240 10 749 16 674
Mean fat equivalent warbles (g) 158 271 421
Maximum1 energy cost warbles (kJ) 15 416 28 158 27 109
Maximum fat equivalent warbles (g) 389 711 685
Mean nose bot number 70 ± 63 67 ± 63 53 ± 50
Max nose bot number 180 178 125
Mean weight ONE nose bot larva (g) 0.22 ± 0.13 0.18 ± 0.14 0.18 ± 0.06
Mean nose bot total weight (g) 21 ± 25 19 ± 28 10 ± 11
Mean energy cost nose bots (kJ) 667 639 505
Mean fat equivalent nose bots (g) 17 16 13
Maximum energy cost nose bots (kJ) 1716 1697 1192
Maximum fat equivalent nose bots (g) 43 43 30
Warbles & bots combined
Mean energy cost (kJ) 6907 11 388 17 180
Mean fat equivalent (g) 174 288 434
Maximum energy cost (kJ) 17 132 29 855 28 301
Maximum fat equivalent (g) 433 754 715
Mean equivalent days of caribou BMR 1.1 2 4.5
Maximum equivalent days of caribou BMR 2.7 5.2 7.41 Maximums were the heaviest infestations observed.

249Rangifer, Special Issue No. 20, 2012
Larvae abundance and weightAbundance and weight of warble larvae exceeded nose bot larvae in both herds (P < 0.0001, df = 80, t = 4.108 AM; p < 0.00001, df = 78, t = 7. 088 KS) (Figs. 4, 5). Adult KS cows carried fewer nose bots (P = 0.0007, df = 79, t = 3.533) and more warbles (P = 0.006, df = 79, t = 2. 828) than AM cows; warble number in AM and KS calves were not significantly different (P = 0.234, df = 14, t = 1.244), and KS calves had marginally fewer nose bots than AM calves (P = 0.0481, df = 14, t = 1.166).
Akia-Maniitsoq caribou and warble larvae Number of warbles differed among reproductive cat-egories (F4,41 = 5.104, P = 0.002) (Figure 4). 10-month old calves-at-heel had significantly higher numbers of warbles than adults (t = 2.907, P = 0.003). Preg-nant cows had fewer warbles than non-pregnant (t = 1.734, P = 0.045); although the sample size was small and the P-value was close to 0.05. The num-ber of warbles was not influenced by whether a cow was lactating or not (t = 0.814, P = 0.2). Similarly, weight of warbles differed among the categories (F4,41
= 6.045, P = 0.0006). 10-month old calves-at-heel
Table 2. Kangerlussuaq-Sisimiut caribou of West Greenland: data from adult cows (age > 3-years) and calves-at-heel (age 10-months) collected 3 – 17 March 2009, mean ± SD or maximum.
Kangerlussuaq-Sisimiut 2009
Pregnant Non-pregnant Calf-at-heel
Number collected (n) 19 17 10
Mean age (yr) 8.0 ± 2.5 8.1 ± 2.9 10-months
Mean total body weight (kg) 68.3 ± 3.7 61.8 ± 3.6 32.8 ± 4.4
Mean dressed carcass weight (kg) 32.8 ± 2.3 29.5 ± 2.0 15.5 ± 2.7
Mean BMR1 caribou (kJ/day) 6961 ± 279 6458 ± 282 4006 ± 401
Mean rump fat depth (cm) 0.8 ± 0.8 0.1 ± 0.2 0
Mean warble number 138 ± 64 311 ± 189 457 ± 284
Max warble number 287 722 1008
Mean weight ONE warble larva (g) 0.87 ± 0.23 0.99 ± 0.13 1.12 ± 0.11
Mean warbles total weight (g) 127 ± 82 298 ± 165 498 ± 299
Mean energy cost warbles (kJ) 6494 14 636 21 507
Mean fat equivalent warbles (g) 164 370 543
Maximum1 energy cost warbles (kJ) 13 506 33 978 47 437
Maximum fat equivalent warbles (g) 341 858 1198
Mean nose bot number 18 ± 28 37 ± 49 0.3 ± 0.7
Max nose bot number 112 119 2
Mean weight ONE nose bot larva (g) 0.28 ± 0.11 0.3 ± 0.1 0.23 ± 0.25
Mean nose bot total weight (g) 6 ± 10 13 ± 17 0.2 ± 0.2
Mean energy cost nose bots (kJ) 154 317 3
Mean fat equivalent nose bots (g) 4 8 0,1
Maximum energy cost nose bots (kJ) 958 1018 17
Maximum fat equivalent nose bots (g) 24 26 0,4
Warbles & bots combined
Mean energy cost (kJ) 6648 14 952 21 509
Mean fat equivalent (g) 168 378 543
Maximum energy cost (kJ) 14 465 34 996 47 454
Maximum fat equivalent (g) 365 884 1198
Mean equivalent days of caribou BMR 1 2.3 5.4
Maximum equivalent days of caribou BMR 2.1 5.4 11.81 Maximums were the heaviest infestations observed.

250 Rangifer, Special Issue No. 20, 2012
had significantly higher warble weights than adults (t = 3.611, P = 0.0004). Pregnant cows had lower warble weights than non-pregnant cows (t = 1.834, P = 0.03). Weight of warbles was not influenced by lactation (t =0.496, P = 0.3).
Akia-Maniitsoq caribou and nose bot larvaeThe number and weight of nose bot larvae did not differ among categories (Number: F4,41 = 0.9996, P = 0.4188; Weight: F4,41 = 1.267, P = 0.2985). All hypotheses were rejected. Nose bots were not signifi-cantly related to age, pregnancy, or lactation in the AM herd.
Kangerlussuaq-Sisimiut caribou and warble larvaeNumber of warbles differed between categories (F4,45
= 6.409, P = 0.00036) (Figure 5). 10-month old calves-at-heel had significantly higher numbers of warbles than adults (t = 3.873, P = 0.0002). Pregnant cows had fewer warbles than non-pregnant cows (t = 2.569, P = 0.007). Number of warbles did not appear influenced by whether a cow was lactating or not (t = 0.21, P = 0.4).
The weight of warbles differed among categories (F4,41 = 4.168, P = 0.00589). 10-month old calves-at-heel had significantly (t = 4.545, P = 0.00002) higher warble weight than adults. Pregnant cows had less warble weight than non-pregnant (t = 2.825, P = 0.0035). Lactation was not related to the weight of warbles (t = 0.27, P = 0.4).
Fig. 4. Average number and weight of warble and nose bot larvae in Akia-Maniitsoq caribou collected in March/April 2008 in West Greenland: preg-nant & not-lactating (P+NL) n = 23; pregnant & lactating (P+L) n = 4; not-pregnant & not-lac-tating (NP+NL) n = 9; not-pregnant & lactating (NP+L) n = 4; calf n = 6.
Fig. 5. Average number and weight of warble and nose bot larvae in Kangerlussuaq-Sisimiut caribou, March 2009 in West Greenland: pregnant & not-lactating (P+NL) n = 12; pregnant & lac-tating (P+L) n = 8; not-pregnant & not-lactat-ing (NP+NL) n = 6; not-pregnant & lactating (NP+L) n = 14; calf n = 10.

251Rangifer, Special Issue No. 20, 2012
Kangerlussuaq-Sisimiut caribou and nose bot larvaeMany KS caribou lacked the presence of nose bot larvae (Fig. 5). Number of nose bot larvae was sig-nificantly and inversely related to age category (F4,41
= 4.168, P = 0.006). 10-month old calves-at-heel had significantly (t = -1.822, P = 0.037) fewer nose bots than adults. Pregnancy and lactation were not related to the number of nose bots (t = 0.341, P = 0.35 and t = 1.237, P = 0.11 respectively), and nose bot weight was not significant (F4,20 = 2.174, P = 0.1090). Sample size for this data set is small and given the number of animals without nose bot larvae, all hypotheses were rejected.
Warble larvae grow during early spring (Fig. 6), while bot larvae do not (Fig. 7). These data were used to assess minimal average warble and bot larvae of 2.25 g and 0.5 g at shedding for modeling energy costs and a mean growth of warble larvae of 0.016 g/day was assumed. Bot larvae were assumed to make minor growth between sampling and dates of shed-ding in June.
Metabolic costs of larval growth and metabolismBasal metabolism of cows and calves-at-heelAdult KS cows were larger bodied than AM (Tables 1, 2). Mean total body weight of the AM adult cows (age > 3-years) was significantly less than the KS cows, e.g., for pregnant adult cows P < 0.0001, df = 46, and for non-pregnant cows P = 0.01, df = 22. Dressed carcass weight for adult pregnant KS cows was also greater than AM (P < 0.0001). Within herds, non-pregnant cows weighed significantly less than those pregnant (AM P = 0.02, df = 33; KS P < 0.0001, df = 35). For calves-at-heel we found no significant difference in mean total body weight (P = 0.21, df = 15) between the AM and KS herds. Basal
metabolic rate (BMR) of adult cows was 6250 ± 400 kJ/day for AM and 6723 ± 376 kJ/day for KS, while calves-at-heel were 3936 ± 418 kJ/day (Tables 1, 2).
Warbles and nose botsImportant to estimating a metabolic cost to the host of warble burdens is knowledge of the larval growth functions and the approximate weight of larvae at shedding. Within herds pregnant and non-pregnant adult cows had mean individual warble weight that did not differ significantly, AM (P = 0.3, df = 33) and KS (P = 0.06, df = 35). Given the almost one month difference in collection periods between herds, mean individual warble weight in adult pregnant cows at 1.35 g for AM (April) and 0.87 g for KS (March) were different (P < 0.0001, df = 46). Similarly, mean war-ble weights in adult non-pregnant cows were 1.28 g for AM and 0.99 g for KS (P = 0.006, df = 22) (Table 1, 2). Within both herds individual warble weight in calves exceeded that of the adult cows (1.5 g and 1.1 g for AM and KS respectively (P < 0.02)). Mean individual nose bot weight in adult cows showed no significant differences (P > 0.05), whether within or between herds or between pregnant and non-preg-nant. The situation was similar for mean individual nose bot weight in calves versus adults (P > 0.8).
Due to differences in sampling date, we used a mature larvae weight of 2.25 g in early June. Expected weight gains between sampling and emer-gence were similar at approximately 0.016 g/day for warble larvae from both herds (Fig. 6). Estimated peak weight of individual bot larvae at 1 March was approximately 0.5 g (Fig. 7), and we assumed all bot larvae reached this weight at shedding. At shedding, the estimate cost of hosting an individual larva was 17-19 kJ/g of which 54-60% was attributable to NE and 40-46% to the summated support metabolism. Absolute costs to caribou were then assessed from lar-
Fig. 6. Individual weight of warble larvae in relation to date from 3 March to 13 April during two sam-pling years (2008, 2009). Regression slope was significant (P < 0.0001).
Fig. 7. Individual weight of bot larvae in relation to date from 3 March to 13 April during two sampling years (2008, 2009). Regression slope was not sig-nificant (P = 0.19).

252 Rangifer, Special Issue No. 20, 2012
vae burdens as reported above. Among AM caribou the approximate energy cost associated with larvae burden was a mean 7000 to 11 000 kJ for adult preg-nant and non-pregnant cows respectively. Heavily infested cows had energy costs of 17 000 to 30 000 kJ (Table 1). Of these costs only 10-15% were due to bot fly larvae. The energy cost to the most heavily infected cows was equivalent to about 3-5 days BMR. Similarly for the KS caribou (Table 2), larvae burden cost a mean 7000 to 15 000 kJ for adult pregnant and non-pregnant cows respectively, while heavily infested cows had burdens costing 14 000 to 35 000 kJ, which were equivalent to about 2-5 days BMR. Because of the low infestation by bot fly larvae only approximately 2% of this cost was attributable to them. For calves-at-heel larvae burdens were greater and energy costs for mean burdens were 17 000 and 21 000 kJ for AM and KS calves respectively. In the most heavily infested calves, energy costs were about 28 000 kJ and 47 000 kJ for AM and KS respectively. These latter costs were equivalent to about 7-12 days BMR of a calf-at-heel. Again, due to low infestation by bot larvae, the cost for AM calves was only 3% while that for KM calves was less than 0.1%. An alternate expression of the energy cost is to express that cost in terms of forgone fattening. Lowest levels in forgone fattening were for pregnant cows at about 0.1-0.4 kg for the mean and highest infestation rates in both AM and KS females (Table 1, 2). Greatest levels of foregone fattening were estimated in non-pregnant cows at 0.7 and 0.8 kg for respectively the AM and KS herds (Table 1, 2). Foregone fattening was even higher in calves-at-heal at 0.7 kg for the AM and 1.2 kg for the KS animals.
DiscussionOur results were similar to other studies that have found a relationship between warble infection, fat reserves and pregnancy (Thomas & Kiliaan, 1990; Hughes et al., 2009). Further, a recent experimen-tal approach employing removal of warble larvae observed that warbles have a significant negative impact on cow body mass, despite relatively low numbers of larvae (Ballesteros et al., 2011). Our results are also interpreted in relation to a theoretical analysis of energetic costs of hosting variable bur-dens of warble and bot larvae. For the two herds we examined in West Greenland age was not associated with reproductive status of cows in March-April, however, warble larvae burden was. Pregnant cows had fewer warbles and greater rump fat than non-pregnant cows, and lower energy cost associated with hosting larvae. Cow age was not associated with
rump fat reserves. Adult cows that we examined had rump fat reserves with a mean < 1 cm, compared to pregnant cows, non-pregnant cows had significantly greater number of warbles, and less rump fat, specifi-cally notable in non-pregnant KS cows. Again these findings are consistent with the higher host energy costs and the predicted fat draw-down necessary to meet the oestrid cost when all nutrients are obtained from the host’s reserves. Sampled adult KS cows had high warble burdens and a low pregnancy rate of 53%. Relative to KS, the AM cows had lower warble burdens and a pregnancy rate of 82%. Calves-at-heel had zero rump fat and exhibited the highest mean larvae numbers observed. Our findings support those by Hughes et al. (2009), who observed that warble abundance was higher in animals with less back fat and that the difference was most apparent in non-pregnant cows, even at lower abundance of warble larvae. Hughes et al. (2009) concluded that a negative relationship exists between abundance of warbles and probability of being pregnant. They proposed that high infestations have a cost to the host, reflected in reduced weight gain owing to harassment and reduced time feeding the previous summer. Further, that poor condition or social status of an animal may increase susceptibility to adult fly attack.
Warble load in winter may be influenced by the timing of summer hair shedding among caribou, which occurs in warble fly season (Thomas & Kil-iaan, 1990; Syroechkovski, 1995; Bergerud et al., 2008). The successful implant of warble larvae under the hide may be related to the stage of hair loss at the time of peak adult fly harassment, i.e., mid-July to mid-August (Syroechkovski, 1995, p. 162; Josefsen et al., 2006). Lactating cows are actively shedding their winter coat during the height of warble fly season. We suggest that eggs deposited on the winter coat of cows may be lost with shed hair before being able to burrow under the skin. In contrast, calves, juveniles and bulls are well advanced in their hair shedding at peak fly season (Fig. 8), and thus may be more susceptible to successful adherence of eggs to newly growing hair and implantation by warble fly larvae. The warble eggs have a flexible stem which is glued to the hair (Cogley et al., 1981). Thus the eggs lie flat along the hair shaft and would be resistant to grooming but not to loss of the hair shaft. The variation in warble counts may then be related to the timing of hair loss relative to the time adult flies are laying eggs.
Mean numbers of warble larvae in the adult KS cows were 138 ± 64 SD for pregnant and 311 ± 189 SD for non-pregnant, while means in the AM cows were 119 ± 77 SD and 205 ± 186 SD respectively.

253Rangifer, Special Issue No. 20, 2012
These means range from roughly double to eight times greater than the 38 ± 43, 51 ± 4 or median 76 observed in North American caribou (respectively: Thomas & Kiliaan, 1990; Bergerud et al., 2008 Hughes et al., 2009). Even higher were the mean war-ble larvae number in calves, 457 ± 284 KS, and 318 ± 160 AM. The high larval burdens in Greenland cari-bou, relative to observations from other CircumArc-tic herds, may be connected to their short spring migrations (<200 km). Migration can minimize re-infestation by warble and bot flies in wild reindeer and caribou (Thomas & Kiliaan 1990; Folstad et al., 1991) and timing of movement between ranges is recommended as a means of minimizing infestation in domestic reindeer herds (Folstad et al., 1991). The short spring migration distances of the AM and KS herds would not separate them from the areas where the larvae were dropped to pupate, which would put the caribou in close proximity to adult flies when these emerged, promoting high infestations of larvae the following winter.
KS caribou showed a higher average warble to nose bot ratio by number of larvae than the AM (KS, 3.75-7.5 : 1; AM, 1.42-2.85 : 1). This regional differ-ence suggests that parasite prevalence differs between these two West Greenland populations or differed substantially between the years in which the collec-tions were made. Explanations for the high number of warble larvae in KS relative to AM might include the dissimilarities in topography, weather and cari-
bou density. The sampled KS cows inhabit an area lacking high elevations, while AM habitat includes elevations > 700 metres, which provide options for caribou to reduce the risk of exposure to the adult flies. Recent KS densities are ca. 7 caribou per km2 relative to AM’s ca. 2 caribou per km2 (Cuyler et al., 2011) and spring migration distances are about ½ those of the AM caribou. Both would allow adult flies to easily locate KS caribou. Local weather in the summer preceding the March collections can also explain some of the difference in AM and KS larval burdens. Hot dry summers benefit adult fly activity (Thomas & Kiliaan, 1990) and also could control phenology of shedding or pupation (Nilssen & Haugerud, 1994). The dryer warmer calmer weather at KS resulted in a summer oestrid index of 16.4, in contrast to 5.5 at AM (Table 3).
In adult cows, nose bot larvae were far outnum-bered by warble larvae. We do not know why nose bot larvae occurred in lower numbers than warble larvae. Syroechkovski (1995) also found fewer bot larvae in Russian reindeer. At the prevalence and intensity of infection that we recorded, nose bot larvae were not related to reproductive status, although detecting an effect was difficult due to low number or absence of nose bots, which reduced already low sample sizes for some categories in particular. Alternately, these tests may have suffered from low statistical power. Nose bot presence should not yet be rejected as influencing fitness of the host.
Table 3. Temperature, precipitation and cumulative oestrid (adult warble & bot fly) index for the period 15 June to 15 August 2007 for Akia-Maniitsoq and 2008 for Kangerlussuaq-Sisimiut.
Daily Temperature (°C)1
Population Mean Max Min Mean daily total surface precipitation (kg/m2)
Warble & Bot Fly Cumulative Index
AM 10.2 20.2 0.1 4.1 5.52
KS 12.9 23.6 1.2 0.8 16.4
1 Two metres above ground surface.
Fig. 8. Differential timing of hair moult among caribou during July (Photo, Leslie Witter).
254 Rangifer, Special Issue No. 20, 2012
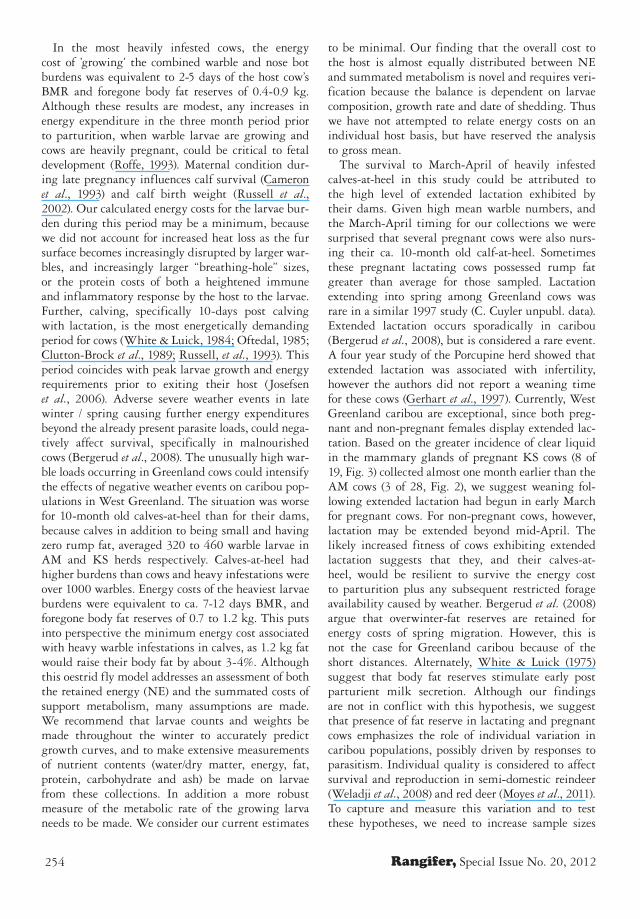
In the most heavily infested cows, the energy cost of ’growing’ the combined warble and nose bot burdens was equivalent to 2-5 days of the host cow’s BMR and foregone body fat reserves of 0.4-0.9 kg. Although these results are modest, any increases in energy expenditure in the three month period prior to parturition, when warble larvae are growing and cows are heavily pregnant, could be critical to fetal development (Roffe, 1993). Maternal condition dur-ing late pregnancy influences calf survival (Cameron et al., 1993) and calf birth weight (Russell et al., 2002). Our calculated energy costs for the larvae bur-den during this period may be a minimum, because we did not account for increased heat loss as the fur surface becomes increasingly disrupted by larger war-bles, and increasingly larger “breathing-hole” sizes, or the protein costs of both a heightened immune and inflammatory response by the host to the larvae. Further, calving, specifically 10-days post calving with lactation, is the most energetically demanding period for cows (White & Luick, 1984; Oftedal, 1985; Clutton-Brock et al., 1989; Russell, et al., 1993). This period coincides with peak larvae growth and energy requirements prior to exiting their host (Josefsen et al., 2006). Adverse severe weather events in late winter / spring causing further energy expenditures beyond the already present parasite loads, could nega-tively affect survival, specifically in malnourished cows (Bergerud et al., 2008). The unusually high war-ble loads occurring in Greenland cows could intensify the effects of negative weather events on caribou pop-ulations in West Greenland. The situation was worse for 10-month old calves-at-heel than for their dams, because calves in addition to being small and having zero rump fat, averaged 320 to 460 warble larvae in AM and KS herds respectively. Calves-at-heel had higher burdens than cows and heavy infestations were over 1000 warbles. Energy costs of the heaviest larvae burdens were equivalent to ca. 7-12 days BMR, and foregone body fat reserves of 0.7 to 1.2 kg. This puts into perspective the minimum energy cost associated with heavy warble infestations in calves, as 1.2 kg fat would raise their body fat by about 3-4%. Although this oestrid fly model addresses an assessment of both the retained energy (NE) and the summated costs of support metabolism, many assumptions are made. We recommend that larvae counts and weights be made throughout the winter to accurately predict growth curves, and to make extensive measurements of nutrient contents (water/dry matter, energy, fat, protein, carbohydrate and ash) be made on larvae from these collections. In addition a more robust measure of the metabolic rate of the growing larva needs to be made. We consider our current estimates
to be minimal. Our finding that the overall cost to the host is almost equally distributed between NE and summated metabolism is novel and requires veri-fication because the balance is dependent on larvae composition, growth rate and date of shedding. Thus we have not attempted to relate energy costs on an individual host basis, but have reserved the analysis to gross mean.
The survival to March-April of heavily infested calves-at-heel in this study could be attributed to the high level of extended lactation exhibited by their dams. Given high mean warble numbers, and the March-April timing for our collections we were surprised that several pregnant cows were also nurs-ing their ca. 10-month old calf-at-heel. Sometimes these pregnant lactating cows possessed rump fat greater than average for those sampled. Lactation extending into spring among Greenland cows was rare in a similar 1997 study (C. Cuyler unpubl. data). Extended lactation occurs sporadically in caribou (Bergerud et al., 2008), but is considered a rare event. A four year study of the Porcupine herd showed that extended lactation was associated with infertility, however the authors did not report a weaning time for these cows (Gerhart et al., 1997). Currently, West Greenland caribou are exceptional, since both preg-nant and non-pregnant females display extended lac-tation. Based on the greater incidence of clear liquid in the mammary glands of pregnant KS cows (8 of 19, Fig. 3) collected almost one month earlier than the AM cows (3 of 28, Fig. 2), we suggest weaning fol-lowing extended lactation had begun in early March for pregnant cows. For non-pregnant cows, however, lactation may be extended beyond mid-April. The likely increased fitness of cows exhibiting extended lactation suggests that they, and their calves-at-heel, would be resilient to survive the energy cost to parturition plus any subsequent restricted forage availability caused by weather. Bergerud et al. (2008) argue that overwinter-fat reserves are retained for energy costs of spring migration. However, this is not the case for Greenland caribou because of the short distances. Alternately, White & Luick (1975) suggest that body fat reserves stimulate early post parturient milk secretion. Although our findings are not in conflict with this hypothesis, we suggest that presence of fat reserve in lactating and pregnant cows emphasizes the role of individual variation in caribou populations, possibly driven by responses to parasitism. Individual quality is considered to affect survival and reproduction in semi-domestic reindeer (Weladji et al., 2008) and red deer (Moyes et al., 2011). To capture and measure this variation and to test these hypotheses, we need to increase sample sizes

255Rangifer, Special Issue No. 20, 2012
and to consider more targeted and stratified sampling in order to measure differential effect of parasites on their hosts.
Despite the apparent high level of maternal invest-ment, extended lactation still may not satisfy the energy demands of the most heavily infected calves. Normal autumn weaning or in early winter, or an inability of females to maintain extended lactation, plus unfavourable events creating additional energy expenditures in late winter / spring, separately or in combination, could negatively affect survival of calves with poor body condition and large numbers of war-ble larvae. This may be a factor behind the observed decreasing trend in late-winter calf-recruitment over the last decade (Cuyler et al., 2005, 2011).
Greenland caribou cows are smaller bodied than other CircumArctic herds, which typically range about 80-90 kg in March-April (Adamczewski et al., 1987; Gerhart et al., 1996; Bergerud et al., 2008). Greenland cow weights are even below Bergerud et al.’s (2008) June cows in Ungava, Canada, which were at their lowest annual weight. Pregnancy rates in relation to body weight of Ungava caribou in April (Fig. 9.15, Bergerud et al., 2008) would predict a pregnancy rate of 20-45% based on body weights for AM and KS cows (Table 1, 2). These predictions for light weight cows are low compared with the 53-82% observed for the KS and AM herds. Although these body weight results partially explain the level of fecundity, we cannot discount a bias in sampling and errors associated with small sample sizes. Body size differences between the small AM and KS caribou are best reflected by dressed carcass weight, because KS ingest copious amounts of graminoids (Lund et al., 2000), which cause higher rumen volume and weight (C. Cuyler unpubl.). A comparison of AM and KS calf body and carcass weights clearly confirms a larger alimentary fill in the KS calves compared to AM calves. While pregnant KS cows were larger than AM, their amount of rump fat was the same, making their percentage of fat less than for AM. KS also had greater warble burdens with accompanying greater winter energy costs, and a low pregnancy rate, i.e., 53%. The latter may be another factor behind the decreasing trend in calf-recruitment mentioned above. Regardless, despite their small body size and high warble loads relative to other herds, Greenland cows may maintain extended lactation to their calf-at-heel in addition to being pregnant. Thus to date, it appears that both KS and AM have been able to com-pensate with adequate winter energy intake. For KS the abundance of readily available graminoids may be the key, while for AM it may be the presence of macro-lichens (albeit reduced in abundance this past
decade, C. Cuyler pers. observation). Until the occur-rence of a regional negative stochastic weather event, e.g., severe thaw-refreeze icing restricting forage availability, warbles will not appear detrimental to their hosts, as their effects are subtle. Further analysis for other parasite species will reveal the extent that high oestrid larvae burdens described coincide with elevated levels of gastro-intestinal nematodes that have been implicated in affecting reproduction in Svalbard reindeer (Albon et al., 2004).
AcknowledgementsThis research was supported by the Greenland Insti-tute of Natural Resources, Yukon College, CARMA, and the Greenland Fisheries and Licensing Agency (GFLK). Special thanks are extended to Greenland hunting officers Hans Mølgaard (Sisimiut) and Vittus Nielsen (Nuuk), and also to biology assistant Sofie Ruth Jeremiassen. We thank Josephine Nymand, Karin Orsel, Wendy Nixon, Rán Þórarinsdóttir, Elina Kaarlejärvi, Tuperna Larsen, Lars Maltha Ras-mussen, Eivind Jensen, Akkalo Lyberth, Morten Lyberth, Ado Holm and Ludvig Hansen for their assistance with the data collection from carcasses. The Kangerlussuaq Science Support Centre provided facilities for the KS collection. We thank the review-ers for their constructive comments.
Literature citedAdamczewski, J. Z., Gates, C. C., Hudson, R.J., &
Price, M. A. 1987. Seasonal changes in body composi-tion of mature female caribou and calves (Rangifer taran-dus groenlandicus) on an arctic island with limited winter resources. – Can. J. Zool. 65: 1149-1157.
Albon, S. D., Stien, A., Irvine, R.J., Langvatn, R., Rop-stad, E., & Halvorsen, O. 2002. The role of parasites in the dynamics of a reindeer population. – Proc. R. Soc. Lond. B 269: 1625–1632.
Anderson, J. R. & Nilssen, A. C. 1990. The method by which Cephenemyia trompe (Modeer) larvae invade rein-deer (Rangifer tarandus). – Rangifer Special Issue No. 3: 281–297.
Ballesteros, M., Bårdsen, B.-J., Langeland, K., Fau-chald, P., Stien, A., & Tveraa, T. 2011. The effect of warble fl ies on reindeer fi tness: a parasite removal experiment. – Journal of Zoology (Zoological Soci-ety of London): 2 DEC 2011 | DOI: 10.1111/j.1469-7998.2011.00883.x http://onlinelibrary.wiley.com/doi/10.1111/j.1469-7998.2011.00883.x/full
Bergerud, A. T., Luttich, S. N., & Camps, L. 2008. The return of caribou to Ungava. McGill-Queens University Press. Montreal & Kingston/ London/ Ithaca. 586 pp.

256 Rangifer, Special Issue No. 20, 2012
Cameron, R, D., Smith, W. T., Fancy, S, G., Gerhart, K. L., & White, R. G. 1993. Calving success of female caribou in relation to body weight. – Can. J. Zool. 71: 480–486.
Clutton-Brock, T. H., Albon, S. D.; & Guinness, F. E. 1989. Fitness costs of gestation and lactation in wild mammals. – Nature 337: 260–262.
Cogley, T. P., Anderson, J. R., & Weinraub, J. 1981. Ultrastructure and function of the
Attachment organ of warble fl y eggs (Diptera : Oestridae : Hypodermatinae). – Intl. J. Insect Morphol. & Entomol. IO: 7-8.
Crawley, M. J. 2007. The R book. John Wiley & Sons Ltd, West Sussex England.
Cuyler, C. & Linnell, J. D. C. 2004. Årlig vandringsmøn-ster hos satellitmærkede rensdyr i Vestgrønland. Kapitel 6.: pp. 189-210 – In: Aastrup P. (ed.). Samspillet mellem rensdyr, vegetation og menneskelige aktiviteter i Vestgrønland. – Greenland Institute of Natural Resources. Technical report No. 49. 321pp.
Cuyler, L.C., Rosing, M., Egede, J., Heinrich, R., & Mølgaard, H. 2005. Status of two west Greenland caribou populations 2005; 1) Akia-Maniitsoq & 2) Kangerlussuaq-Sisimiut. – Greenland Institute of Natural Resources. Technical report No. 61. Part I-II, 64+44pp.
Cuyler, C., Mølgaard, H., Heinrich, R., & Rosing, M. 2011. Status of two west Greenland caribou populations 2010; 1) Kangerlussuaq-Sisimiut & 2) Akia-Maniitsoq. – Greenland Institute of Natural Resources. Technical report No. 78. Part I-II.
Davis, J. L., Valkenburg, P., & Reynolds, H. V. 1980. Population dynamics of Alaska’s Western Arctic cari-bou herd. – In: Reimers, E., Gaare, E. & Skjenneberg, S. (eds.). Proc. 2nd Intl. Reindeer/Caribou Symp., Røros, Norway, 1979. Direktoratete for vilt og ferskvannsfi sk, Trondheim, 2: 595– 604.
Dobson, A. P. & Hudson, P. J. 1992. Regulation and sta-bility of a free-living host-parasite system: Trichostrongy-lus tenuis in red grouse. II. Population models. – J. Anim. Ecol. 61: 487-498.
Folstad, I., Nilssen, A. C., Halvorsen, O., & Andersen, J. 1989. Why do male reindeer (Rangifer t. tarandus) have higher abundance of second and third instar larvae of Hypoderna tarandi than females? – Oikos 55: 87-92.
Folstad, I., Nilssen, A. C., Halvorsen, O., & Andersen, J. 1991. Parasite avoidance: The cause of post-calving migrations in Rangifer? – Can. J. Zool. 69: 2423-2429.
Gerhart, K. L., Russell, D. E., van de Wetering, D., White, R. G., & Cameron, R.D. 1997. Pregnancy of adult caribou (Rangifer tarandus): evidence for lactational infertility. – J. Zool., Lond. 242: 17-30.
Gerhart, K. L., White, R. G., Cameron, R. D. & Rus-sell, D. E. 1996. Body composition and nutrient re-serves of arctic caribou. – Can. J. Zool. 74: 136-146.
Gulland, F., Albon, S., Pemberton, J., Moorcroft, P., & Clutton-Brock; T. H. 1993. Parasite associated poly-
morphism in a cyclic ungulate population. – Proc. R. Soc. Lond. B 254: 7-13.
Gunn, A. & Irvine, R. J. 2003. Subclinical parasitism and ruminant foraging strategies – a review. – Wildlife Society Bulletin 31 (1): 117–126.
Haugen, R. K. & Brown, J. 1980. Coastal-inland distri-butions of summer air temperatures and precipitations in northern Alaska. – Arctic and Alpine Research. 12 (4): 403–412.
Helle, T. & Tarvainen, L. 1984. Effects of insect harass-ment on weight gain and survival in reindeer calves. – Rangifer 4: 24–27.
Helle, T. 1980. Abundance of warble fl y (Oedemagena tarandi) larvae in semi-domestic reindeer (Rangifer tarandus) in Finland. – Report from the Kevo Subarctic Re-search Station, 16: 1-6.
Hudson, P. J., Rizzoli, A., Grenfell, B. T, Heesterbeek, H., & Dobson, A. P. 2001. The ecology of wildlife diseases. Oxford University Press.
Hughes, J., Albon, S. D., Irvine, R. J. & Woodin, S. 2009. The cost of parasites to caribou. – Parasitology. 136: 253-265.
Iver, R., Hagemoen, M., & Reimers, E. 2002. Reindeer summer activity pattern in relation to weather and in-sect harassment. – Journal of Animal Ecology, 71 (5): 883 – 892.
Josefsen, T. D., Åsbakk, K., & Oksanen, A. 2006. Para-sitter og sjukdom hos rein. – Ottar No. 263, 5-2006: 30-38.
Kelsall, J. P. 1968. The caribou. Ottawa: Queen’s Printer.Kelsall, J. P. 1975, Warble fl y distribution among some
Canadian caribou. – In: Luick, J. R., Lent, P. C., Klein, D. R., & White, R. G. (eds.). Proc. 1st Int. Reindeer/Caribou Symp. Fairbanks 1972. Biol. Pap. University of Alaska, Special Report No.1: 509-517.
Kleiber, M. 1975. The fi re of life. Robert E. Kreiger Pub-lishing Company.
Kojola, I. 1991. Reproductive status and behavioural re-sponses to attacking insects by female reindeer. – Appl. Anim. Behav. Sci. 32: 91-93.
Kumpula, J., Colpaert, A., & Nieminen, M. 2000. Condition, potential recovery rate, and productivity of lichen (Cladonia spp.) ranges in the Finnish reindeer management area. – Arctic. 53 (2): 152-180.
Lund, P. M., Gaare, E, Holand, Ø., & Motzfeldt. K. G. 2000. Fødevalg hos rensdyr i Akia og nær Kangerlus-suaq, Vestgrønland, vinteren 1996/97. – Greenland Insti-tute of Natural Resources. Technical report No. 37. 38pp.
McEwan, E. H. 1963. Seasonal annuli in the cementum of the teeth of barren ground caribou. – Can. J. Zool. 41: 111-113.
Moyes, K., Morgan, B., Morris, A., Clutton-Brock, T., & Coulson, T. 2011. Individual differences in repro-ductive costs examined using multi-state methods. – J. Animal Ecology 80: 456-465.

257Rangifer, Special Issue No. 20, 2012
Mörschel, F. M . 1999. Use of Climatic Data to Model the Presence of Oestrid Flies in Caribou Herds. – Journal of Wildlife Management 63 (2): 588-593.
Newery, S. & Thirgood, S. 2004. Parasite-mediated re-duction in fecundity of mountain hares. – Proc. R. Soc. Lond. B (Suppl.) 271: S413-S415.
Nilssen, A. C. 1997. Effect of temperature on pupal devel-opment and eclosion dates in reindeer oestrids Hypoder-ma tarandi and Cephenemyia trompe (Diptera: Oestridae). – Environmental Entomology 26 (2): 296–306.
Nilssen, A. C. & Anderson, J. R. 1995. Flight capacity of the reindeer warble fl y, Hypoderma tarandi (L.), and the reindeer nose bot fl y, Cephenemyia trompe (Modeer) (Dip-tera: Oestridae). – Can. J. Zool. 73: 1228–1238.
Nilssen, A. C. & Haugerud, R. E. 1994. The timing and departure rate of larvae of the warble fl y Hypoderma (= Oedemagena) tarandi (L.) and the nose bot fl y Cephen-emyia trompe Modeer) (Diptera: Oestridae) from reindeer. – Rangifer 14: 113–122.
Nilssen, A. C. & Haugerud, R. E. 1995. Epizoology of the reindeer nose bot fl y Cephenemyia trompe (Modeer) (Diptera: Oestridae), in reindeer, Rangifer tarandus (L.) in Norway. – Can. J. Zool. 73: 1024–1036.
Oftedal, O. T. 1985. Pregnancy and lactation. – In: Hud-son, R. & White, R. G. (eds.). Bioenergetics of wild herbi-vores. CRC Press, Boca Raton, pp. 215–238.
R Development Core Team. 2009. R: A language and environment for statistical computing. R Foundation for Sta-tistical Computing, Vienna, Austria. ISBN 3-900051-07-0, URL http://www.R-project.org
Reimers, E. 1980. Activity pattern; the major determi-nant for growth and fattening in Rangifer. – In: Re-imers, E., Gaare, E. & Skjenneberg, S. (eds.). Proc. 2nd Intl. Reindeer/Caribou Symp., Røros, Norway, 1979. Di-rektoratete for vilt og ferskvannsfi sk, Trondheim, pp. 466-474.
Reimers, E. & Nordby, Ø. 1968. Relationship between age and tooth cementum layers in Norwegian reindeer. – J. Wildl. Manage. 32 (4): 957-961.
Roffe, T. J. 1993. Perinatal mortality in caribou from the Porcupine herd, Alaska. – J. Wildlife Diseases. 29: 295-303.
Russell, D. E., Martell, A. M. & Nixon, W. A. C. 1993. Range Ecology of the Porcupine Caribou Herd in Cana-da. Monograph. – Rangifer Special Issue No. 8. 168pp.
Russell, D. E., Kofi nas, G., & Griffi th, B. 2002. Bar-ren-ground caribou calving ground workshop: Report of proceedings. – Technical Report Series Number 390. Canadian Wildlife Service, Ottawa, Ontario, Canada. 40pp.
Russell, D. E., Whitfi eld, P. H., Cai, J., & Gunn, A. In prep. CARMA’s Climate Database. 13th Arctic Ungulate Conference, Yellowknife, NT, Canada, August 2011.
Saval’ev, D. V. 1961. Control of warble fl ies and blood-sucking diptera. – In: P. S. Zhigunov (ed.). Reindeer husbandry. U.S. Department of the Interior and the Na-tional Science Foundation, Washington D.C., USA, pp. 294-310.
Solomahka, A. I. 1990. Parasite-host relationships of warble fl y (Oedemanga tarandi L.) and reindeer (Rangifer tarandi L.). – Rangifer Special Issue No. 3: 391-394.
Syroechkovski, E. E. 1995. Wild reindeer. Washington, Smithsonian Inst. Libraries Press. 290pp.
Thomas, D. C. & Kiliaan, H. P. 1990. Warble infesta-tions in some Canadian caribou and their signifi cance. – Rangifer Special Issue No. 3: 409-417.
Walsh, N. E., Fancy, S. G., McCabe, T. R., & Pank, L. F. 1992. Habitat use by the Porcupine caribou herd dur-ing predicted insect harassment. – J. Wildl. Manage. 56: 465-473.
Weladji, R. B., Loison, A., Gaillard, J. M., Holand, Ø., Mysterud, A., Yoccoz, N. G, Nieminen, M., & Sten-seth, N. C. 2008. Heterogeneity in individual quality overrides costs of reproduction in female reindeer. – Oe-cologia. 156: 237–247.
White, R. G. & Luick, J. R. 1984. Plasticity and con-straints in the lactational strategy of reindeer and cari-bou. pp. 215-232. – In: M. Peaker, R.G. Vernon, & C. H. Knight (eds.). Physiological Strategies in Lactation. – Symp. Zool. Soc. London No. 51, Academic Press.
White, R. G., Daniel, C., Gunn, A., Cuyler, C., & Rus-sell, D. E. 2010. Modeling energy and protein costs of para-sites in caribou and reindeer. 13th North American Caribou Workshop, Winnipeg, Oct. 2010. [http://carmanetwork.com/display/public/Vancouver+2010+Conference]
White, R. G., Gerhart, K. L., Russell, D. E., & van de Wetering, D. 2000. Composition of milk during lacta-tion. – Rangifer Special Issue No. 12: 148 [Abstract].
White, R. G., Thomson, B. R., Skogland, T., Person, S. J., Russell, D. E., Holleman, D. F., & Luick, J. R. 1975. Ecology of caribou at Prudhoe Bay, Alaska. – In: Brown, J. (ed.). Ecological Investigations of the Tundra Bi-ome in the Prudhoe Bay Region, Alaska. – Biol. Papers, Univ. Alaska, Spec. Report No. 2: 151-201.
Witter, L. A., Johnson, C. J., Croft, B., Gunn, A., & Gillingham, M. P. 2011. Behavioural trade-offs in response to external stimuli: time allocation of an Arctic ungulate during varying intensities of harass-ment by parasitic fl ies. – Journal of Animal Ecology. dpi: 10.1111/j.1365-2656.2011.01905.x.

258 Rangifer, Special Issue No. 20, 2012