ArcNews | Summer 2021 | Vol. 43, No. 3 - Esri
40
Briefly Noted Scaling GIS for Sustainable Development For nations in need of geospatial data to help accelerate their work toward achieving the United Nations (UN) Sustainable Development Goals (SDGs), Esri is joining other organizations around the world—including governments, foundations, universities, and civil society groups—to develop virtual centers of excellence for geospatial information. These centers will make it easier for more people to access SDG data hubs, which allow countries to measure, monitor, and report on the SDGs in a geographic context. Esri and SAP Advance Partnership ArcGIS Enterprise now supports SAP HANA Cloud, enabling users, especially large organizations, to accelerate their adoption of cloud-based location intelligence platforms. SAP’s high-performance cloud environment acts as a central repository to unify disparate databases and provide a complete overview of data. “Migrating to SAP HANA Cloud [has provided] us with insights that were impossible to get before,” said Stefan Vancraeyenest, project manager for IT applications at Open Grid Europe, which manages Germany’s largest natural gas pipeline. “We can go beyond mere maintenance of data to visualizing business and operational data for real- time analysis.” Learn to Apply the Racial Equity Workflow A new online course from Esri Training, Applying the Racial Equity Workflow Using ArcGIS, teaches participants how to use GIS to analyze inequities and foster change while engaging with their communities. Learn more and register at ow.ly/PX5d50EPC6c. Arc News Esri | Summer 2021 | Vol. 43, No. 3 e COVID-19 pandemic has transformed people’s lifestyles beyond measure. Because exposure to in- fectious respiratory droplets and aerosol particles is the primary way humans contract the disease, ArcGIS Pro Add-In Makes Outdoor Airflow Analysis More Accessible By Ryo Araya, Environmental GIS Laboratory Co., and Takanori Uchida, the Research Institute for Applied Mechanics at Kyushu University continued on page 4 much of the world has spent good portions of the last year and a half social distancing, restrict- ing outside-the-home activities, sanitizing spaces, washing hands, and wearing masks. It will take time for life to return to normal. In the in- terim, the new normal will require continuing to reduce the risk of spreading COVID-19 by promoting ventila- tion in spaces where large numbers of people gather. e World Health Organization (WHO) has published a road map for improving airflow inside buildings to protect against COVID-19. But in out- door and semioutdoor areas like public transit sta- tions, stadiums, and other open spaces, there is a limit to how much ventilation can be controlled by mechanical means alone. It is essential to examine natural airflow as well. Airflow Analyst, an add-in for ArcGIS Pro, uses 3D urban models along with meteorological data to examine wind conditions and predict the ven- tilation performance of outdoor and semioutdoor Airflow Analyst is an add-in for ArcGIS Pro that uses 3D urban models and meteorological data to examine wind conditions in outdoor and semioutdoor spaces. continued on page 9 Esri Provides Open Access to Key Federal Geospatial Data Free Open Data, Data Downloads, and Web Services Working with federal agencies, Esri is opening up access in ArcGIS Online to dozens of high-priority, high-demand national data layers, often referred to as A-16 data. ese include cartographic boundary files and demographic data from the US Census Bureau; National Agriculture Imagery Program (NAIP) data from the US Department of Agriculture (USDA); and the National Inventory of Dams (NID) database, managed by the US Army Corps of Engineers. Esri is making three significant enhancements that will broaden access to A-16 data. First, this data collection is now publicly accessible under an open commons license agreement, making it free for anyone to use. Second, the data is available for download in a variety of interoperable formats. And third, it is served as both Esri and Open Geospatial Consortium, Inc. (OGC)-compliant services, meaning it is ready to incorporate into apps. ese open data services are provided through ArcGIS Living Atlas of the World, which significantly expands their visibility. Additionally, the new open- access license, along with added technical options for using the data services, extends their reach beyond the Esri community. is supports the vision of the Geospatial Data Act of 2018 (GDA), which seeks to empower more people to use geospatial data, and breaks down more barriers to interoperability. The Data Is There—Now It’s Time to Open It Up Globally, the trend is toward making data more open, accessible, and reusable. e number of public open data sites provided by national agencies as well as The National Land Cover Database (NLCD), which was used to produce this 3D map of Anchorage, Alaska, is the result of federal agencies working together to create up-to-date, consistent land-cover products for the entire country.
-
Upload
khangminh22 -
Category
Documents
-
view
1 -
download
0
Transcript of ArcNews | Summer 2021 | Vol. 43, No. 3 - Esri

Briefl yNotedScaling GIS for Sustainable DevelopmentFor nations in need of geospatial data to help accelerate their work toward achieving the United Nations (UN) Sustainable Development Goals (SDGs), Esri is joining other organizations around the world—including governments, foundations, universities, and civil society groups—to develop virtual centers of excellence for geospatial information. These centers will make it easier for more people to access SDG data hubs, which allow countries to measure, monitor, and report on the SDGs in a geographic context.
Esri and SAPAdvance PartnershipArcGIS Enterprise now supports SAP HANA Cloud, enabling users, especially large organizations, to accelerate their adoption of cloud-based location intelligence platforms. SAP’s high-performance cloud environment acts as a central repository to unify disparate databases and provide a complete overview of data. “Migrating to SAP HANA Cloud [has provided]us with insights that were impossible to get before,” said Stefan Vancraeyenest, project manager for IT applications at Open Grid Europe, which manages Germany’s largest natural gas pipeline. “We can go beyond mere maintenance of data to visualizing business and operational data for real-time analysis.”
Learn to Applythe Racial Equity Workfl owA new online course from Esri Training, Applying the Racial Equity Workfl ow Using ArcGIS, teaches participants how to use GIS to analyze inequities and foster change while engaging with their communities. Learn more and register at ow.ly/PX5d50EPC6c.
ArcNews Esri | Summer 2021 | Vol. 43, No. 3
Th e COVID-19 pandemic has transformed people’s lifestyles beyond measure. Because exposure to in-fectious respiratory droplets and aerosol particles is the primary way humans contract the disease,
ArcGIS Pro Add-In Makes Outdoor Airfl ow Analysis More AccessibleBy Ryo Araya, Environmental GIS Laboratory Co., and Takanori Uchida, the Research Institute for Applied Mechanics at Kyushu University
continued on page 4
much of the world has spent good portions of the last year and a half social distancing, restrict-ing outside-the-home activities, sanitizing spaces, washing hands, and wearing masks.
It will take time for life to return to normal. In the in-terim, the new normal will require continuing to reducethe risk of spreading COVID-19 by promoting ventila-tion in spaces where large numbers of people gather. Th e World Health Organization (WHO) has published a road map for improving airfl ow inside buildings to protect against COVID-19. But in out-door and semioutdoor areas like public transit sta-tions, stadiums, and other open spaces, there is a limit to how much ventilation can be controlled by mechanical means alone. It is essential to examine natural airfl ow as well. Airfl ow Analyst, an add-in for ArcGIS Pro, uses 3D urban models along with meteorological data to examine wind conditions and predict the ven-tilation performance of outdoor and semioutdoor
Airfl ow Analyst is an add-in for ArcGIS Pro that uses 3D urban models and meteorological data to examine wind conditions in outdoor and semioutdoor spaces.
continued on page 9
Esri Provides Open Access to Key Federal Geospatial DataFree Open Data, Data Downloads,and Web Services
Working with federal agencies, Esri is opening up access in ArcGIS Online to dozens of high-priority, high-demand national data layers, often referred to as A-16 data. Th ese include cartographic boundary fi les and demographic data from the US Census Bureau; National Agriculture Imagery Program (NAIP) data from the US Department of Agriculture (USDA); and the National Inventory of Dams (NID) database, managed by the US Army Corps of Engineers. Esri is making three signifi cant enhancements that will broaden access to A-16 data. First, this data collection is now publicly accessible under an open commons license agreement, making it free for anyone to use. Second, the data is available for download in a variety of interoperable formats. And third, it is served as both Esri and Open Geospatial Consortium, Inc. (OGC)-compliant services, meaning it is ready to incorporate into apps. Th ese open data services are provided through ArcGIS Living Atlas of the World, which signifi cantly expands their visibility. Additionally, the new open-access license, along with added technical options for using the data services, extends their reach beyond the Esri community. Th is supports the vision of the
Geospatial Data Act of 2018 (GDA), which seeks to empower more people to use geospatial data, and breaks down more barriers to interoperability.
The Data Is There—Now It’s Time to Open It UpGlobally, the trend is toward making data more open, accessible, and reusable. Th e number of public open data sites provided by national agencies as well as
The National Land Cover Database (NLCD), which was used to produce this 3D map of Anchorage, Alaska, is the result of federal agencies working together to create up-to-date, consistent land-cover products for the entire country.

Advertise in ArcNewsReach more than 800,000 potential customers.
Reserve space in the longest-running GIS magazine.
Copyright © 2021 Esri. All rights reserved.
Share Your Story in ArcNewsTell readers around the world how your organization saved money and time or acquired new capabilities through using GIS.
esri.com/ansubmissionCopyright © 2021 Esri. All rights reserved.
8
19
26
34
20
2 ArcNews Summer 2021 esri.com/arcnews
ArcNewsEsri | Summer 2021 | Vol. 43, No. 3
City, state, and federal healthoffi cials are endeavoring to increase confi dence in the COVID-19vaccines so that people can get back to their prepandemic activities. To help with this, Esri startup partner Epistemix models COVID-19 infec-tions based on varying levels of population immunity. The results are easy to understand—and convincing.
Table of Contents
NEWS1 Esri Provides Open Access to Key Federal Geospatial Data
1 ArcGIS Pro Add-In Makes Outdoor Airfl ow Analysis More Accessible
1 Briefl y Noted
3 Test-Drive Imagery Capabilities in New MOOC
ESRI TECHNOLOGY6 Esri Establishes Closer Ties with the Developer Community
8 New Dashboard Technology Now Widely Available
11 New Ways to Explore ArcGIS Hub Content
16 More Data Sharing and Collaboration in ArcGIS Enterprise
17 In ArcGIS Online, Extend and Multiply the Power of GIS
18 Enterprise Workfl ow Management System Streamlines Operations
YOUR WORK19 Location-Based Simulations Aim to Increase COVID-19 Vaccine Uptake
20 Fire Department Improves Hydrant Inspections with ArcGIS Field Maps
22 Spatial Analysis of Opioid Use Gets Lifesaving Medicine to the Right Places
24 After Cyberattack, Transportation Organization Recovers Using Cloud-Based GIS
26 How Minnesota Is Making Maps Accessible
GIS PEOPLE10 Grow Your Open Data Ecosystem
12 The Map of the Future
14 A Leader Who Embodies the Mission
28 Answer the Call to Action for Equity and Social Justice
30 Geoethics in the Geospatial Community
35 New Book Highlights Importance of Cartography in Achieving SDGs
COLLABORATIONS32 Esri Partners Cultivate Excellence
34 Startup Improves Address Accuracy for Multiunit Complexes
36 Esri Press
38 New Training and Certifi cation Offerings
Executive EditorMonica Pratt
Managing EditorCitabria Stevens
Graphic DesignerTakeshi Kanemura
IllustratorDerick Mendoza
Manage Your ArcNews Subscription To subscribe, unsubscribe, or make changes to your Esri publications, please go to esri.com/manage-subscriptions.
Outside the United States, please contact your international distributor to subscribe, unsubscribe, or change your address. For a directory of distributors, visit esri.com/distributors.
Article Submission GuidelinesBefore writing an article, read and follow the publication guidelines at esri.com/ansubmission.
ArcNews Esri 380 New York Street Redlands, CA 92373-8100 USA [email protected].: 909-793-2853, ext. 1-2730Website: esri.com/arcnews
ArcNews (ISSN 1064-6108) is published quarterly by Esri at 380 New York Street, Redlands, CA 92373-8100 USA. ArcNewsis written for the Esri user community as well as others interested in mapping and geographic information system (GIS) technology. It contains material of interest to planners, foresters, scientists, cartogra-phers, geographers, engineers, business professionals, and others who use spatial information.

World-class UAVs for• Architecture• Engineering• Construction• Full RTK
www.AGSGIS.com
• Esri ArcGIS UAV workflows at centimeter level• Experts in Esri GIS Software, UAVs and RTK• East Coast, Midwest and West Coast sales/support offices
3esri.com/arcnews ArcNews Summer 2021
Test-Drive Imagery Capabilities in New MOOCEsri has a new massive open online course (MOOC) debuting in August: Imagery in Action, a no-cost, six-week course that introduces the latest ArcGIS capabili-ties for working with imagery and remotely sensed data. Participants will learn ArcGIS workfl ows for tackling critical imagery and remote sensing tasks—from fi nding, processing, and analyzing imagery to delivering actionable insight. Imagery has become an increasingly valuable source for daily decision-making across various industries, including all levels of government; com-mercial retail and fi nancial services; utilities; natural resource organizations; and architecture, engineering, and construction fi rms. As organizations of all types and sizes are challenged by disruptions like climate change; geopolitical and social unrest; and, of course, the global COVID-19 pandemic, they need quick access to reliable information. Imagery off ers that, given that it is widely available and fast to procure using unmanned aerial vehicles (UAVs), satellites, and other sensors. And ArcGIS provides robust tools to swiftly ingest, process, visualize, analyze, and share imagery products that are key to maintaining situ-ational awareness, monitoring change, and mitigating risks. Th e Imagery in Action MOOC showcases cutting-edge apps and image anal-ysis tools that can help organizations better understand and solve the complex issues they face. Participants will explore the rich repository of high-quality im-agery available from ArcGIS Living Atlas of the World and work with ArcGIS Pro, ArcGIS Online, and other ArcGIS software to process, visualize, analyze, and share imagery. All Esri MOOCs include video lectures by experts on the topic; guided, hands-on software exercises; quizzes; polls; and discussion forums. A new sec-tion opens every week that a course is in session, and attendees can study at their own pace when it’s convenient for them. All the software needed to do course exercises is provided. Participants who complete the course content receive a certifi cate. Imagery in Action is for anyone who wants to learn—or learn more—about the many uses and types of imagery and the rapidly growing integration of im-agery with GIS. Th e course is especially relevant for GIS professionals, imagery analysts, geospatial intelligence analysts, researchers, and image and data sci-entists. Experience with GIS or ArcGIS software is helpful but not required. View complete course details for Imagery in Action, which runs August 11–September 22, and register at go.esri.com/imagery-mooc.
High-resolution imagery has myriad applications, including monitoring change over time.
Course attendees will work with ArcGIS Pro to visualize, process, and analyze imagery.

Certified GIS Plan ¤ Needs Assessment ¤ System Design ¤ Governance ¤ GIS Software ¤ Data ¤ IT Architecture ¤ Workflow ¤ Interoperability ¤ Training
Secure Buy-in and Funding for Geospatial Technology — Optimize Performance, Streamline Operations, and Build Enterprise Solutions.
Learn more at GISPlan.com
CREATE A GIS STRATEGIC PLAN
Beyond Location Intelligence
continued from cover
spaces. In the past, this kind of fl uid simulation required enor-mous computing resources. But now it can be done on general-use personal computers using GIS, meaning this technology is more accessible than ever and can help facility managers plan ventilation eff ectively.
Complex Methodologies for Measuring VentilationAre Now Easier to EmployTh e use of computational fl uid dynamics (CFD) simulations is essential for evaluating ventilation performance in outdoor and semioutdoor spaces. Wind that passes through a stadium, for example, is turbulent and more complex than humans can imag-ine. CFD can predict convoluted airfl ows in places like that by solving the equations that govern fl uid motion. For most urban planners, CFD simulations are too complicated and time-consuming to put into practice. Th at’s where Airfl ow Analyst comes in. It is the fi rst CFD software that runs in ArcGIS Pro, and it uses terrain and building data organized in GIS to predict a va-riety of wind-related phenomena, including ventilation performance. Airfl ow Analyst lets users apply commonly available GIS data—including 3D urban models, topography, and building information modeling (BIM) data—to wind analysis. Th e calcu-lation algorithm is set up specifi cally for doing outdoor-airfl ow analysis, so users without any technical knowledge of how CFD works can put together a simulation. Th e software performs all the operations needed for a wind simulation exercise, from set-ting up the calculations to visualizing the results on a map. Th us, users who are familiar with ArcGIS technology can learn how to do a wind simulation in a short amount of time. Th e turbulence model that Airfl ow Analyst applies is called the Large Eddy Simulation (LES), and its precision at predict-ing airfl ow has been verifi ed by wind tunnel experiments. While LES typically requires a lot of computational time and power, Airfl ow Analyst uses multicore central processing units (CPUs)
or graphics processing units (GPUs) to produce results in a rea-sonable amount of time—several hours—on personal comput-ers. Th is opens up this kind of important analysis to a whole host of new users who need to do things like plan human traffi c in public spaces, visualize strong urban winds, or predict the extent of toxic gas diff usion due to potential chemical accidents.
A Case Study for Measuring and Predicting VentilationAs of press time, the 2020 Olympics in Tokyo, Japan, which were postponed to 2021, will be the fi rst major international event to take place since the outbreak of COVID-19. Th e main venue, Japan’s new National Stadium, has good ventilation, thanks to a gap between the stands and the roof that draws airfl ow into the stadium from outside. Th e architects who designed the stadium introduced this
ArcGIS Pro Add-In Makes Outdoor Airfl ow Analysis More Accessible
feature to mitigate the summer’s hot and humid thermal environ-ment. But is it enough to prevent the spread of COVID-19? To explore this, we used Airfl ow Analyst to simulate wind conditions inside the stadium so that we could see how much ventilation it would get from the natural wind that fl ows through Tokyo. Using AW3D—commercially available 3D map data—we reproduced the buildings and trees throughout the city. To rep-licate National Stadium’s complex shape, we created a 3D CAD model based on drawings of the stadium and made it a multi-patch feature in ArcGIS Pro. Next, we set a calculation area of about 1.3 square kilome-ters that centered on the stadium. We then set the grid spacing around the stadium to within 1 meter to reproduce the structure’s shape in even more detail. Th e total number of computational
The software was used to analyze the natural airfl ow inside Tokyo’s National Stadium, based
on the wind that blows around it.
4 ArcNews Summer 2021

grid points was about 11.1 million, making this a relatively large-scale wind simulation. We were able to simulate and visualize the wind that fl ows in and out of the stadium via its eaves and holes in the ceiling. It turns out that wind takes a tangled path through the interior of the sta-dium. To ensure that we were capturing data on how aerosols—like those that emanate from people’s mouths—fi ll space, spread out, and then disappear, we placed a virtual tracer gas inside the stadium model as well to observe its concentration over time. Th is simulation found that all the air inside the stadium is re-placed in about 13 minutes when a northerly wind with an annual average wind speed of 3 meters per second—which is common in Tokyo—blows outside the stadium. Th is means that the stadium gets new air approximately 4.6 times per hour. Hence, the structure benefi ts from a decent amount of ventilation that occurs naturally. Of course, whether this amount of ventilation is suffi cient to prevent the spread of COVID-19 needs to be evaluated based on the number of people and types of activities happening in the stadium. Th is case study is based solely on a northerly wind, but wind direction and speed change constantly throughout the day. So the results for only one wind direction are not adequate for evaluating National Stadium’s full natural ventilation. To get a more complete picture of its ventilation capabilities and even estimate natural ven-tilation conditions in real time, it would be useful to combine the re-sults of simulations done for 16 wind directions with real-time wind observation data or weather forecast data. Th is information would help facility managers come up with a comprehensive plan for en-suring proper ventilation in National Stadium during the Olympics and for any other events that take place there.
New Ways to Create Safety and Comfort in Urban SpacesIn cities around the world, detailed 3D digital maps are yield-ing digital twins of urban areas that can help immensely with city and event planning—especially as communities begin to emerge from the COVID-19 pandemic and enter a new normal. What’s more, integrating geospatial infrastructure with Internet
of Th ings (IoT) sensors, which measure everything from tem-perature to wind speed, can foster deeper understanding and better management of built environments. By combining urban data with wind simulation technology specifi cally, urban planners can help create safety and comfort in densely populated areas in multiple ways including the following:• Bringing fresh air into a city to reduce heat islands• Making the pedestrian experience easier by analyzing
how strong winds whip around high-rise buildings• Evaluating the wind loads that structures can handle
during heavy storms• Introducing effi cient natural ventilation in and
around buildings In this digital transformation that is moving through the world, being able to decipher the wind environment in various areas will provide valuable solutions for urban planning.
About the Authors
Ryo Araya is the president of Esri partner Environmental GIS Laboratory Co., a software development and consulting company based in Fukuoka City, Japan. Takanori Uchida is an associate professor at the Research Institute for Applied Mechanics at Japan’s Kyushu University.
A trial version of Airfl ow Analyst is available in the ArcGIS Marketplace. Go to ow.ly/9bAN50ELwxS to try it out.
The number of grid points in the analysis, shown here around the stadium, totaled about 11.1 million, making this a relatively large-scale simulation.
Wind takes a convoluted path through the interior of the stadium. (Note: The roof of the stadium in this rendition is not visible.)
The simulation found that when a northerly wind with an annual average wind speed of 3 meters per second blows outside the stadium, the air in the stadium gets replaced every 13 minutes.
5esri.com/arcnews ArcNews Summer 2021

GIS technology is quickly advancing in new directions, ben-efi ting developers in many ways that will impact their work. That was evident from the news that came out of the 2021 Esri Developer Summit (DevSummit), held virtually in April. For example, Esri announced the release of ArcGIS Enterprise on Kubernetes, which gives organizations a new way to deliver GIS using microservices. Esri also released ArcGIS Platform, a platform as a service (PaaS) product that provides software developers with mapping and location capabilities to integrate into their apps. Geospatial artifi cial intelligence (GeoAI) capabilities are becoming highly so-phisticated, and new 3D GIS capabilities in ArcGIS API for JavaScript give developers the ability to provide more con-textual awareness for locations and even create and visual-ize 3D scenes on Mars. Additionally, Esri has opened up the Calcite Design System to developers, allowing them to give their apps a consistent look and feel. More than 5,500 developers from over 60 countries gath-ered for the three-day virtual event. Attendees received up-dates on Esri software and developer technologies during a series of plenary and technical sessions. The virtual Ask Our Experts Showcase also gave app developers the opportunity to get their technical questions answered by Esri staff. While Esri wants to bring DevSummit back to its usual ven-ue of Palm Springs, California, in 2022, the mission remains the same, whether people meet in person or online. “This event is by developers, for developers,” Jim McKinney, chief technology offi cer for desktop development at Esri, said in welcoming attendees. “DevSummit is the larg-est gathering of geospatial developers on the planet, and you are a signifi cant part of that. We are not only hoping to educate you but inspire you.” Esri president Jack Dangermond joined McKinney for a few minutes to talk to the audience about the strong connec-tion between Esri and the developer community, especially as Esri continues to redesign the developer experience. The aim is to bring the power of mapping and location intelligence to all developers by making capabilities more accessible.
“The developer community…has been foundational to our success, and I appreciate very much the work that you do—this year particularly,” Dangermond said. In 2021 and beyond, Esri plans to build on that founda-tion and establish closer ties with app developers. “This is the year of opening up GIS to developers in a more amplifi ed way,” Dangermond announced. He said he sees the important work that developers are doing in areas such as public health, climate change, racial equity, and biodiversity. He noted one prominent example: the work done by a team at Johns Hopkins University us-ing ArcGIS technology to create a dashboard that mapped COVID-19 cases and deaths globally. “That whole gamut [of work] is so important, whether it’s putting a map in an app or whether it’s building rich, science-modeling tools that are looking at the future of our world and how to make it a better place,” Dangermond said. “Especially [important are] you, the GIS developers who bring the maps and the language of our world to life in various ways.”
Esri Introduces ArcGIS Enterprise on KubernetesA major announcement made at the DevSummit this year was the release of ArcGIS Enterprise on Kubernetes. Increasingly, apps are being built using containers or microservices to increase effi ciency, scalability, and sta-bility. Kubernetes is open-source software (originally de-signed by Google but now maintained by the Cloud Native Computing Foundation) that deploys, manages, and scales these types of containers or microservices. “ArcGIS Enterprise on Kubernetes delivers GIS technology using cloud-native architecture,” Sud Menon, director of soft-ware product development at Esri, told the developer com-munity during his DevSummit Plenary Session presentation. In brief, ArcGIS Enterprise on Kubernetes is a new de-ployment option based on a microservices architecture for scalability and resilience, containers for delivering software, and Kubernetes for orchestrating the containers. “Each independent capability, such as hosted feature services or spatial analysis services, is delivered as its own, independently scalable microservice,” said Menon. The main benefi ts of ArcGIS Enterprise on Kubernetes, he pointed out, are streamlined installation, dynamic scal-ing, easy upgrades that minimize downtime, higher resil-ience, and easy IT integration. Initially, ArcGIS Enterprise for Kubernetes is available for Red Hat OpenShift (an on-premises deployment option),
Esri Establishes Closer Tieswith the Developer Community
Microsoft Azure Kubernetes Service (AKS), and Amazon Elastic Kubernetes Service (Amazon EKS). Menon said that later in 2021, ArcGIS Enterprise on Kubernetes will be available for the Google Cloud Platform Google Kubernetes Engine (GKE).
ArcGIS Platform: A PaaS for DevelopersWhile current ArcGIS software users can already access loca-tion content, services, and capabilities using ArcGIS Enterprise, ArcGIS Pro, and ArcGIS Online, Esri released ArcGIS Platform to reach the wider software developer community. A PaaS offering, ArcGIS Platform is for software devel-opers who want to integrate location capabilities into their apps, products, and business systems. “It’s designed to bring powerful mapping and location ca-pabilities as a set of independent services to you in the form that you are expecting,” said David Cardella, product man-ager for ArcGIS Platform. “These services have been power-ing ArcGIS for many years, but now we’ve opened them up in ways we haven’t before, and we are making them available to the global developer community.”
ArcGIS Platform offers three main elements:• An excellent developer experience with mapping APIs,
open-source mapping libraries, and developer resources• Location services that deliver extensive geographic con-
tent and capabilities• A consumption-based business model that is simple,
transparent, and easy to understand Developers get access to the mapping library of their choice. ArcGIS Platform comes with ArcGIS API for JavaScript for creating web apps; a set of APIs for developing mobile and desktop apps; scripting APIs for automating mapping and analysis; and support for popular open-source mapping libraries, including Leafl et, OpenLayers, and Mapbox GL JS. “With the work we’ve done to enhance our back-end ser-vices, you will be able to use these libraries to access our location services in just a couple of lines of code,” Cardella said. “The choice of mapping libraries is yours. But regard-less of the one you choose, you will be able to use location services from ArcGIS Platform.” Cardella said that the location services available in ArcGIS Platform—basemaps, data hosting, data visualiza-tion, routing and directions, spatial analytics, geocoding and search, image analysis, and more—are now easier to access and integrate into solutions.
Technology Showcased at the Esri Developer Summit Aims to Inspire Software Developers
6 ArcNews Summer 2021 esri.com/arcnews
Sud Menon explained ArcGIS Enterprise on Kubernetes, a new deployment option based
on a microservices architecture.
Jack Dangermond (left) joined Jim McKinney (right) to talk about the strong connection between Esri and the developer community.
With ArcGIS Platform, developers can integrate location capabilities into their apps, products, and business systems.

The business model is transparent and easy to under-stand, he added, stating that developers will only pay for the services they use, regardless of the API or authentica-tion method they use. Esri offers a free account to developers to help them get started using ArcGIS Platform. “You will receive a generous free tier to kick-start your development that includes two million map tiles and thou-sands of other service transactions, [such as] searching, routing, or geocoding,” Cardella said.
Building Apps Using Services from ArcGIS PlatformEuan Cameron, chief technology offi cer of developer technology at Esri, said developers have many options to choose from when they use services from ArcGIS Platform to build apps. These options include low- or no-code ser-vices, APIs to create web apps, native and embedded apps, and apps built using game engines. “We even have a design system to help you buildbeautiful-looking apps,” Cameron said. This design system has Cascading Style Sheet (CSS) and JavaScript frameworks that include a set of web compo-nents that can be integrated into apps, an interactive help system with great examples and documentation, and de-sign guidelines and graphic resources. Julie Powell, principal product manager of web develop-ment technologies at Esri, said that the new design system from Esri creates a consistent look and experience among a suite of apps with its user interface (UI) components, col-ors, icons, and design patterns. And Esri is now sharing its design system with developers. “It’s called Calcite, and now we are making it available to all of you so you can use it in your web apps,” Powell said. “All you have to do is go to the [ArcGIS] Developers web-site, create an account, and you can start using it.”
The new Map Viewer in ArcGIS Online and ArcGIS Enterpriseuses the Calcite Design System for the user experience. In her presentation, Powell showed the audience the li-brary of UI components in the design system, such as accor-dion, button, card, label, data picker, and alerts. “Because they are web components, you can use them with any JavaScript framework,” she said. “They are also fl exible, so you can confi gure them for your particular use case. The part that I like the best is [that] because they are responsive, they are designed to work on any form factor, so you have confi dence when you build your application that it will adapt well to any screen size.” The design system also comes with colors and themes. While the UI components default to the ArcGIS color pal-ette, users can confi gure a color scheme that matches their organization’s branding. It’s also easy to switch from a light to a dark theme or vice versa by changing a single property. All the components then adjust accordingly to the theme. “There are also 1,400 icons you can choose from,” said Powell. “This helps tell more of a visual story and simplify the text in your apps.”
Powell explained that the Calcite Design System can help developers create consistency in all their web apps. “You can seamlessly integrate with the ArcGIS eco-system and, at the same time, highlight your brand and style,” she said.
New Map Viewer DebutsDevelopers got to see the Calcite Design System compo-nents in action during a demonstration of the new Map Viewer, which came out of beta in April. Jeremy Bartley, group manager of the ArcGIS API for JavaScript team, demonstrated the viewer, which is avail-able in ArcGIS Online and ArcGIS Enterprise. “Map Viewer is a good example of an application that’s completely built [using] the underlying technology within Esri, from ArcGIS API for JavaScript to the Calcite compo-nents to hosted feature services,” he said. Bartley showed attendees around several of the new and improved analysis, thematic mapping, and sketching tools that are included with Map Viewer. It also comes with an im-proved and intuitive UI for creating web maps. In addition, there are better pop-up confi gurations and labeling options, scale-driven styling, more printing layouts, reverse geocoding, new smart mapping styles, and new color ramps—including ones that are color-blind accessible—to better express data.
3D GIS Is Out of This WorldNew 3D capabilities in ArcGIS API for JavaScript make many things possible, including creating 3D scenes of Mars. Arno Fiva, an Esri 3D developer evangelist for ArcGIS API for JavaScript, showed the DevSummit audience an app built by Esri developers that supports two extraterrestrial coordinate systems. Other developers can use ArcGIS API for JavaScript in a similar way to create 3D scenes of the Martian landscape. The Explore Mars app, available at explore-mars.esri.com, provides users with detailed elevation and imagery data for the whole planet. Fiva demonstrated how to use the app to zoom in to any location on Mars, including craters, valleys, and sites where various rovers have landed. The app comes with line, area, and elevation measurement tools and tools to compare areas on Mars with 3D models of Earth-based regions, including cities such as Zurich, Switzerland, and nat-ural features like the Grand Canyon. For example, to see how much area Sudan would take up on Mars, users can click on the country on a globe and select Place it on Mars.
The New Data Engineering ExperienceNew tools in the May 2021 release of ArcGIS Pro 2.8 make data engineering—a highly time-consuming aspect of the spatial analysis process—much easier, according to Lauren Bennett, who leads the spatial analysis and data science software development team at Esri. Data engineering—getting data ready for analysis by add-ing new fi elds or fi lling missing values—is crucial, she said. “Our analysis is only ever as good as the data that we put into it,” Bennett pointed out. The release of ArcGIS Pro 2.8 introduced a data engi-neering experience that makes it easier to explore and visu-alize data. Tools that are in the ArcGIS system are brought together to construct, clean, format, and integrate data to prepare it for analysis, Bennett said. Esri solution engineer Lakeisha Coleman demonstrated this new capability using data from the Supplemental Nutrition Assistance Program (SNAP) and demographic and unemployment data. As McKinney said during the Plenary Session, the hope is to educate and inspire. “You have a great set of tools and developer technologies for yourself, your customers, or your enterprise,” he said. He then encouraged developers to stay connected through the Esri Community at community.esri.com. “We look forward to hearing from you!” he added.
7esri.com/arcnews ArcNews Summer 2021
Julie Powell demonstrated Esri’s new Calcite Design System, which developers can use in their web apps.
Map Viewer has new and improved tools for doing analysis, thematic mapping, and sketching.
New tools in ArcGIS Pro 2.8 make data engineering—the process of getting data ready for analysis by adding new fi elds or fi lling missing values—easier.

Get GIS News, Views, and Insights from ArcWatch
go.esri.com/subscribe
Current and future mapmakers and geospatial app makers can have the latest stories, tech tips, training information, and product news delivered straight to their inboxes.
Copyright © 2021 Esri. All rights reserved.
We help you putGIS to work!
[email protected]/gis/training
Professional GIS training in our Seattle facility or at your site.
GIS TRAININGEXPRESS ™
� Expert ArcGIS® Training
� Custom Classes and Workshops
� GIS Certification Institute Qualified
� URISA’s Pacific NW Education Center
� Veterans’ GI Bill BenefitsSelected programs of study at the King
County GIS Center are approved for those eligible to receive bene�ts under Title 38 and Title 10, USC.
8 ArcNews Summer 2021 esri.com/arcnews
Dashboards—with their interactive visual ele-ments, including maps, charts, and gauges—funda-mentally change the way we explore information. Th ey make data consumption easy and convenient. Th e last year and a half has seen an exponen-tial increase in the number of dashboards being created and shared. An array of industries is put-ting dashboards to good use, from emergency organizations coordinating disaster responses to public safety agencies monitoring events. When the COVID-19 pandemic hit in early 2020 and organizations, including local gov-ernments, universities, and national and inter-national health agencies, were clamoring for dashboards, Esri introduced a version of ArcGIS Dashboards that was built on ArcGIS API 4.x for JavaScript. Th e underlying technology in Dashboards needed an upgrade to provide bet-ter performance for dashboards that had gone viral, enhanced features to fi t growing use cases, and refreshed designs that could meet various new user requirements. After extensive testing and feedback from beta users, the product is now out of beta and available for general use. Th is updated version of ArcGIS Dashboards, which has a number of new capabili-ties and enhancements for dashboard authors, is now the default experience for all organizational users when they access dashboards.
Better Performance and Improved UsabilityTh e new Dashboards is robust, built on powerful technology that can support several workfl ows, including those for mission-critical projects. Maps can now load more features, and those features load faster. Additionally, Dashboards can incorporate maps that make use of many valuable capabilities in the new Map Viewer, such as dot density mapping, layer blending, and group layers. Th ese features ensure that dashboards perform as expected and that maps are tailored to convey the most relevant infor-mation to particular audiences. Th e new version of Dashboards also brings improved usability. Users can employ a wider range of data sources within a dashboard and its elements, including feature collections and CSV web layers. In addition, Dashboards now has summary statistics for percentiles within the Indicator, Gauge, and Serial Chart elements. Th is is crucial for supporting the specifi c met-rics that disaster response and emergency man-agement agencies require. Other enhancements to Dashboards include the ability to use ArcGIS Arcade for advanced formatting. Dashboard authors can compose Arcade expressions to apply conditional for-matting to both the List and Indicator ele-ments in their dashboards. Th is new level of
NEW DASHBOARD TECHNOLOGY NOW WIDELY AVAILABLE
customization alters how data points are ren-dered to fi t a theme, workfl ow, or goal.
Additional Customization OptionsTwo additional capabilities—selection-based display and data expressions—enable dash-board authors to further customize how they present data to their audiences. For dashboards that include a lot of data, it’s sometimes diffi cult to ensure that users are get-ting the information they need. In these cases, dashboards need more context. Over the years, dashboard authors have found creative ways of guiding users’ interactions with their dashboards. To help authors fi ne-tune what their users see, the new ArcGIS Dashboards in-cludes the ability to confi gure element displays so that they’re based on a user’s selections. Th is selection-based display allows authors to set conditions or dependencies for when and how data is presented on a dashboard. Having dash-board elements display data only when neces-sary makes dashboards easier to read and allows authors to create products that have a specifi c focus and only show relevant data. Th e new ArcGIS Dashboards also introduces data expressions—a way to structure data so it presents insightful visualizations to a targeted au-dience. With this capability, dashboard authors can leverage the data they have access to and return a feature set that powers one (or more) data-driven element and makes it interactive. For example, an organization collecting raw data on water quality across its state might want to show summary sta-tistics to its audience, but what is being collected is many individual observations. A single data ex-pression can bring these individual observations together, calculate a variety of statistics, and pres-ent insight about the data as a whole. Data expressions are useful for a variety of purposes, such as when data needs restructur-ing, when a specifi c summary statistic is miss-ing, or to calculate metrics from values across columns within one source or from multiple sources. Typically, it can be challenging for users to make such small data refi nements, especially when they don’t own the dataset. But using data expressions makes this easier, enabling dash-board authors to structure data in a way that can help communicate a story more eff ectively.
Try the New ArcGIS DashboardsTh e new enhancements built into ArcGIS Dashboards make it easier to eff ectively convey information in an intuitive and interactive man-ner. Experienced dashboard authors will rec-ognize a user interface similar to the one they were using before, and new users can get up and running quickly, thanks to the app’s straightfor-ward user experience. Th ere are numerous resources avail-able to help anyone get started using ArcGIS Dashboards. Visit go.esri.com/arcgisdashboards for more information.
This dashboard uses percentile statistics to compare 90th percentile response times to a standard key performance indicator. It also makes use of ArcGIS Arcade in the List and Indicator elements.
While the list on the left side of this dashboard makes it diffi cult to see statistics at the county level, the list on the right—made using data expressions, Arcade, and some HTML edits—aggregates statistics across sites within a county.

9esri.com/arcnews ArcNews Summer 2021
continued from cover
state and local governments around the world has skyrocketed, with more than 11,000 powered by ArcGIS alone. Recent legislation in the United States, including the GDA and the Open, Public, Electronic, and Necessary (OPEN) Government Data Act, is pushing this movement forward at the national level. It calls on all agencies that serve National Geospatial Data Assets (NGDA)—the priority national data layers—to expand standards-based open access. Th e overriding intent is to foster greater public and private sector use of federal data to encourage innovation and data-driven decision-making. US federal agencies have excelled at creating and managing criti-cal geospatial data to meet their own needs. Disseminating the data widely and making it available as accessible, usable services are more recent endeavors. Successful examples of open data providers at the national level do exist, though. For example, the Department of Homeland Security’s Homeland Infrastructure Foundation-Level Data (HIFLD) program works with multiple federal agencies to cu-rate and serve out geospatial data services. Demand for these web services is growing, with usage up 75 percent from 2019 to 2020. So the desire for open federal data is there. But this is just the tip of the iceberg. Vast amounts of federal data exist, although many data owners have yet to modernize their data management and dissemination infrastructure. Increased collabo-ration among Esri and federal agencies will accelerate the pace at which more data is openly served. Expanding access to federal data by making it public in ArcGIS Living Atlas empowers a wider audience to address challenges such as climate change, disaster relief, broadband access, and racial equi-ty. Furthermore, off ering that data as services makes it readily usable by not only GIS professionals but also web-savvy developers, scien-tifi c audiences, and even citizen scientists and app developers. Th is is the only way to satisfy the data demands of today and tomorrow and increase the value of the investments made in geo-spatial data.
New Levels of Inclusiveness and InteroperabilityTo help address current data access and use challenges, Esri is working collaboratively with federal agencies to amplify their good work by in-creasing the visibility of their data and delivering it in app-ready formats. A new collection of federal maps and apps is now available in a curated, Esri-managed group in ArcGIS Online called the US Federal Maps and Apps organization. To government users, this collection of data is known as A-16. To everyone else, this is a fantastic collec-tion of nearly 100 national geospatial datasets on things like dams, bridges, federal public lands, runways, and rail nodes. Th e collection serves the Esri and broader geospatial user communities as well as the open-source and web developer communities. To enable enhanced open access to this collection, Esri is changing both the terms of use and the technical parameters of the data. Th e collection is now available under the Creative Commons Attribution 4.0 International (CC BY 4.0) license, meaning anyone can use, share, and adapt the data with proper attribution. Th is considerable policy update removes a historic barrier to access. On the technical side, Esri is making cached and direct connec-tions to public services within the federal government. Th e layers can be exported to multiple open formats, such as shapefi le, CSV, KML, and GeoJSON, to perform further analysis. Th ey are also accessible as OGC-compliant standards, like Web Map Tile Service (WMTS) and Web Feature Service (WFS), as well as Esri formats to support inter-active exploration, visualization, and analysis. Th e geospatial layers are updated regularly and reference the federal agencies’ metadata. Th ese advancements in open access to federal data demonstrate a new level of inclusiveness and interoperability across the geospatial community. Nadine Alameh, the OGC’s chief executive offi cer, wel-comed this development. “I’m happy to see a practical, operational example of how open standards and services can advance the GDA objectives,” she said. “Th ank you, Esri, for making this government data available not only
to its vast geospatial community but also anyone through open OGC services, enabling further interoperability and innovation.”
Benefi ts That Cut Across Governments and SectorsTh is collaborative eff ort implements a “create once, use manytimes” philosophy. Because the federal government produces and manages key data, the pressure is reduced on other organizations to engage in these time-consuming and cost-intensive tasks. Once that data is created and shared, it is thus advantageous for users to have many pathways for fi nding it. While federal agencies can publish their data on their own websites, put it on thematic or regional portals, and post it to the Federal Geographic Data Committee’s (FGDC) GeoPlatform, making the data available through Esri technology just amplifi es its exposure and increases the likelihood that it will be discovered and used. According to Ivan B. DeLoatch, executive director of the FGDC, developing public-private partnerships is critical to advancing the United States’ National Spatial Data Infrastructure. “Th e exploration of a public partnership [between] Esri and the FGDC community will be an exciting opportunity to support the on-going development of our National Geospatial Data Assets, or A-16 datasets,” DeLoatch said. “Th is will encourage the use of open data and standards, as well as data sharing initiatives with stakeholders, to address national challenges and priorities.” For example, the data needs of state and local governments do not stop at their borders. Th ey often rely on federal data to add broader perspectives to local projects and initiatives. Th e National States Geographic Information Council (NSGIC) has long advocated for the federal government and organizations across the country to provide openly accessible and interoperable geospatial services. And Frank Winters, current president of the NSGIC and executive director of the New York State Geospatial Advisory Council, commended this eff ort for advancing that vision. “We need to maximize the reach of geospatial data, and that means we should think of everyone as a decision-maker,” said Winters. “When our data reaches thousands or millions of people—to help them de-cide where to live, buy property, go to school, or start a business—our impact can scale to a point where it moves the dial of our economy. Removing barriers to high-quality spatial data, time and again, results in people using data in ways I could never predict, making interesting and meaningful contributions to their communities.” In the commercial sector, for instance, large companies with assets and interests spread throughout the United States need data that cuts across cities, states, and regions. Having high-quality national datasets on a variety of topics that are easy to access and available as services benefi ts countless businesses, from national retailers and insurance companies to railroads and utilities. It saves them the time and money required to gath-er and process the data themselves and enables them to carry out impor-tant operations more quickly and cost eff ectively, such as conducting risk assessments, doing environmental screenings to evaluate the feasibility of getting a project permitted, and analyzing growth opportunities.
Continuing to Elevate Federal DataGeospatial data is critical to understanding and meeting the chal-lenges that continually crop up all over the world. Esri is committed to collaborating with federal government organizations and agen-cies to make their spatial data easy to access and use so that it can better serve the geospatial community; developers; scientists; and, ultimately, people. It is Esri’s goal to build on the great content that federal agencies al-ready collect and bring it to life through well-documented, open, and in-teroperable services and downloads. Th is cooperative eff ort will elevate the value of that data through increased usage, fuel the development of problem-solving apps across all sectors, and spur new innovations.
Esri Provides Open Access to Key Federal Geospatial Data
A-16 geospatial data layers cover topics such as bridge conditions, shown here for St. Louis, Missouri.
The Soil Survey Geographic Database (SSURGO) is available through ArcGIS Living Atlas of the World and can be used to see the effects of long-term fl ooding.
Expanding access to federal data empowers more people to address challenges like racial equity—for example, by building dot density maps that highlight different racial and ethnicity groups.
The National Inventory of Dams (NID) database is another high-priority national dataset, used here to map dams in parts of Washington and Oregon.

10 ArcNews Summer 2021 esri.com/arcnews
As the world has become digitized, sheafs of pa-per and fi le drawers have transformed into ephem-eral, infi nite, and globally accessible databases. Th e data recorded in informa-tion systems—whether generated to comply with
regulatory requirements or for specifi c tasks—has a nominal life cycle of birth; growth; and, fi nally, obsolescence. While the data never truly dies, it often atrophies in old, unmaintained sys-tems. It is archived and stored for potential re-use later—if anyone remembers where the data is or how the old systems work. When data is instead accessible, reusable, and open for continuous improvement, it is often of higher quality and has a greater impact on com-munities. We’ve seen this happen with software over the decades: at fi rst, it was stored on fragile punch cards, and now it is being freely and rap-idly shared for reuse and collaboration. Th is has resulted in undeniably more rapid, complex, and high-quality software innovation. As Eric Raymond stated in Th e Cathedral and the Bazaar: Musings on Linux and Open Source by an Accidental Revolutionary, “given enough eyeballs, all bugs are shallow.” In other words, software code that can be read, used, and fi xed by other software engineers will result in better software with fewer problems. And beyond fi x-ing issues with software, making source code available for public access enables it to continu-ally grow and be improved on—which is the
case for many key projects that now underpin computer systems around the world. Open data is experiencing a transformation similar to that of software. Databases that were locked in silos of singular use are now made available and accessible to anyone. Th is means that people from other departments, munici-palities, businesses, and community groups can immediately reuse the data in their own work, providing better context for evaluating complex relationships, making important decisions, and measuring program outcomes. It also means that journalists can use it when researching and reporting on specifi c issues or trends. And all consumers of the data can provide feedback on data quality issues, possible corrections that need to made, and other potential improve-ments to the data.
The Benefi ts of Open DataOrganizations often face scrutiny of their poli-cies to ensure that they are equitable, eff ective, effi cient, and evolving. When organizations and programs openly share the data that fuels their decision-making—including data from other organizations that relates to the topic and geog-raphy of their work—it encourages independent evaluation. Th is, in turn, can dramatically improve organizational transparency and, thus, trust. What’s more, solving complex problems, such as disaster response or the need for af-fordable housing, depends on developing and maintaining partnerships. Th ese types of rela-tionships are strengthened when information is shared freely across groups. Data that is already
Grow Your Open Data EcosystemBy Andrew Turner, Esri
available and connected can produce opportu-nities for better collaboration and action. All this requires an increased and ongoing investment in data maintenance and improve-ment—which can be done with already existing infrastructure, generating a multitude of benefi ts. For one, sharing data can reduce an organiza-tion’s operating costs by making staff members more effi cient at fi nding data for their work and encouraging interdepartmental collaboration earlier in a project. It can also improve the de-velopment and growth of markets by making it easier to compare business metrics with contex-tual trends and enhancing data-driven decision-making. By contrast, limiting data sharing due to cost-recovery policies, in which potential data users pay for access to public information, is de-monstrably regressive. Sharing data prioritizes the development of best practices that make it possible for other peo-ple to understand and appropriately use that data. To ensure that users always have the most up-to-date and accurate data available, for example, it’s expedient to make data accessible through web hyperlinks so that it can easily be integrated into apps, websites, and software tools. It’s also advis-able to make sure that data can be downloaded in open-fi le formats that work in common tools like spreadsheets, dashboards, and developer APIs. Th en, users can be automatically notifi ed when the data gets updated so that they can quickly download new versions. In addition, the metadata should be com-plete and readable, which improves discovery in search engines such as Google, the most
Andrew Turner
common way people look for and fi nd infor-mation. Providing a data dictionary about at-tributes—such as the data’s origin, usage, and relationships to other data—ensures that users know what the data means and how to best use it in analyses. Also, including contact informa-tion with data makes it possible for people to ask questions about the data and provide useful feedback that can, ultimately, improve it.
Getting Started with Open DataAchieving the ideals of data sharing can seem daunting. Many organizations face policy re-strictions on data sharing or are unsure about how to start sharing data. Fortunately, over the past few decades, many successful pioneers have developed useful strategies for iteratively growing their own healthy open data programs. For instance, the City of Washington, DC, has a spectrum of data—from open data to private and license-restricted data—and needed a com-prehensive policy to cover a wide range of data sharing options. Th e city published a draft data policy that was available for anyone to read and comment on. Over several weeks, hundreds of respondents posted specifi c comments, recom-mendations, and requests to change various as-pects of the policy. Based on that, the city created astructured taxonomy that goes from Level 0 data,which is completely open and can be reused by anyone, to Level 4 data, which is restricted and confi dential. Th is simple structure provides city departments with clear guidance on open data and empowers them to make explicit and appro-priate decisions about what data to share. Many organizations are concerned about where to begin with open data. Wake County, North Carolina, started small by releasing a few datasets each month. Th is phased approach allowed em-ployees at the county to focus their limited time on improving data quality and strengthening their data sharing processes. Each data release they put out had a focused story that highlighted the pur-pose of the data and opportunities for reusing it. Th is included integrating open data into popular consumer apps like Yelp and Waze. Sometimes the best place for open data is inside the apps people are already using. Regional organizations that connect dif-ferent government administrations are an-other healthy driver of open data. While data infrastructure and services are usually man-aged within specifi c administrative boundar-ies, the data necessarily intersects and requires coordinated action with nearby municipali-ties. Regional data sharing programs, like NC OneMap in North Carolina, defi ne common data standards and priorities that support statewide local data sharing. Open data has become a common and popu-lar movement that continues to grow. National governments are leading the way with modern policies and programs that encourage local mu-nicipalities to share their data. Additionally, the commercial industry is sharing data that is ac-celerating health, energy, and transportation
The City of Washington, DC, empowers city departments to make appropriate decisions regarding open data by providing clear guidance on what data they can share and what data should remain restricted.
Wake County, North Carolina, started its open data program by releasing a few datasets at a time and highlighting various ways to reuse them, such as integrating the data into popular consumer apps.

Explore more at marketplace.arcgis.com.
Co
pyr
ight
© 2
021
Esr
i. A
ll ri
ght
s re
serv
ed.
Meet us in the ArcGIS® M arketplace!
cityworks.com
here.com
con-terra.com
khatibalami.com
geocortex.com
se.com
gisinc.com
sspinnovations.com
geodecisions.com
Esri® ArcGIS Marketplace partners provide product and service offerings that extend the capabilities of ArcGIS.
11esri.com/arcnews ArcNews Summer 2021
Smart cities recognize how important it is to provide local communities with the informa-tion they need to stay informed and take part in decision-making. Since 2016, ArcGIS Hub has enabled organiza-tions across government, business, and academia to create customized websites for sharing content related to local projects and initiatives. Hub sites have keyword searches and galleries that make it easy for users to discover data, maps, documents, and surveys. Additionally, each site includes a content library for building the website’s search catalog, a group for collaborating with peers, and a dashboard for tracking community interest. A key aspect of ArcGIS Hub is helping us-ers share content that’s clear, operational, and accessible to their audiences. Over the years, the ArcGIS Hub team has worked with users through the ArcGIS Hub User Lab to learn how they produce and employ digital content to communicate and engage with their com-munities. Th is research shows that organiza-tions want to remove barriers to engagement
New Ways toExplore ArcGIS Hub Content
by creating thoughtful, easy-to-use tools for fi nding and working with their data. Th at’s why ArcGIS Hub recently launched a new approach to how it handles the con-tent that users share through the software as a service. Now, it’s easier for people to explore data within the context of hub sites. When visitors go to a hub site, they can more easily preview data and other content prior to downloading or using a resource. Spatial data, including raster images and shapefi les, are fea-tured on full-screen maps to encourage visitors to start exploring it straight away. Th e map’s view can be switched to a full-screen view of its tabular data, and users can fi lter data in both views. Nonspatial tabular data and documents also now automatically open in full screen. To symbolize attribute data in maps, us-ers can employ new fi lter and styling options. Once the fi lters and styles are in place, the URL for the content preview page updates to refl ect that, enabling users to share the pat-terns they’ve identifi ed.
About the Author
Andrew Turner is the director and chief technology offi cer of Esri’s Research and Development Center in Washington, DC, where he leads the development of ArcGIS Hub and supports Esri’s strategies for open standards and open-source data. Turner joined Esri in 2012 from GeoIQ and has been developing open data sharing systems for more than 20 years.
innovation, and nonprofi t organizations are sharing data that validates their important work and builds trust among their partners and do-nors. Together, all these organizations in various places around the world are developing a healthy ecosystem of data that overlaps and intercon-nects. But there are still signifi cant gaps in avail-able data. So regressive or restrictive policies need to evolve to provide open, free, and well-maintained data for all—a surefi re way to better support local businesses and constituents. It doesn’t take much to share more data. Start small with focused open data releases that support specifi c priorities and issues. Find a champion in your organization who can pro-vide leadership in this endeavor and demon-strate the eff ective outcomes of an open data program. Build partnerships with others, both within and outside your organization—includ-ing data providers, analysts, and users—to grow the reach and success of your program. And join the thriving open data ecosystem.
A collapsible side panel gives users the ability to access additional information about a piece of content via its full details page. Th e side panel also contains options to fi lter and download content. When downloading something, users can now select the format of their choice and track the status of their download. In addition, developers can access a dataset’s API using the API explorer, available either on the side panel or in the item’s full details page. Any content that doesn’t render in full screen opens as a full details page that features actions that users can take with that data, such as creat-ing a web map or story. Th e full details page also contains metadata for the item, points users to related content, and has a link to the content’s details page in ArcGIS Online. To view these enhancements and learn more about what’s new with ArcGIS Hub, check out the ArcGIS Hub content demo site at go.esri.com/content-views-demo and read the blog post “How ArcGIS Hub makes it simple to share engag-ing content” at go.esri.com/content-views-blog.
Immersive displays, like this map, encourage visitors to immediately start exploring content.
New fi lter and styling options allow users to quickly visualize trends and patterns.
A full details page provides in-depth information about an item.

TruPulse® Laser Rangefinders for High-Accuracy GNSS Laser Offset Mapping
Seamlessly integrates with Esri ArcGIS Field Maps
for iOS!
Learn More with Workflow Videos MeasuringTheFuture.com/remote
Position yourself to capture remote asset locations
from a single safe location.
REMOTELYIntegrate with Eos Arrow Series™ GNSS receivers,
Tools Pro App and devices.
FEATURESBuilt-in laser measurement
routines allow you to collect more data than ever before.
COLLECT
Experience The Difference
12 ArcNews Summer 2021 esri.com/arcnews
THE MAPOF THE FUTURE
Scientifi c CurrentsBy Dawn WrightChief Scientist, Esri
“Th e map of the future is an intelligent image” is one of my favor-ite sayings, coined a few years ago by Esri’s director of imagery and remote sensing, Lawrie Jordan. Remotely sensed earth observation data—generally referred to as imagery—is the defi nitive visual reference at the heart of GIS. Moreover, the increasing availability of low-cost, high-temporal sources of data is making imagery foundational for a growing majority of geospatial workfl ows. Imagery is a geographic Rosetta stone, of sorts, that unlocks the mysteries of how the planet operates. As Jordan has pointed out, although the technology powering this Rosetta stone is ad-vanced, we can comprehend it in practice when we begin to un-derstand the pictures. It is indeed easier to understand something when we can see it. But the future lies in what goes on analytically, behind the scenes, to produce that picture. As is the case with most technological innovation, the future is now. To get a glimpse of this present-future, let’s go behind the scenes and get technical. What’s so diff erent about this present-future I refer to? Two words: cloud native. Cloud-native software is specifi cally designed to take advan-tage of cloud computing, including its considerable, on-demand resources such as storage and computing power. It is a software development approach in which scalable apps are built and run on services provided by Microsoft Azure; Amazon Web Services; and other dynamic, cloud-based environments. For some time, Esri has been moving toward cloud-native solutions, including those with multiple types of imagery from
satellites, airplanes, ships, drones, and other sensors. Th is move is to ensure that GIS is scalable to nearly every kind of image and workfl ow. And it’s all brought together conveniently and ef-fi ciently in every kind of cloud—private, public, or a combination of the two—through server network architecture. Similar to how real-time information lives in the cloud (think about COVID-19 outbreaks expressed as points), Esri now pro-vides a much easier way for imagery to be incorporated into the ArcGIS environment. Th e ArcGIS Image product suite, composed of ArcGIS Image Server for ArcGIS Enterprise and ArcGIS Image Analyst for ArcGIS Pro, is now available both as an extension to ArcGIS Online and as a dedicated single-tenant cloud system wherein the server hosts just one user. ArcGIS Image for ArcGIS Online supports image management completely in the cloud and—more importantly for scientists—off ers full support for high-ly scalable image processing and raster analytics. In terms of image processing and management, ArcGIS Image Online will change for the better how some users handle their imag-ery, especially those who work at national, regional, and state govern-ment agencies and universities that acquire large stores of data. Ratherthan having to buy the infrastructure or set up their own instances of
data warehouses, these individuals and organizations can use ArcGIS Image Online as a service and achieve the same outcomes. In ArcGIS Image Online, images can be streamed as static tiled imagery layers; intelligent tiled imagery, which maintains the per-formance benefi ts of tiling while being able to do pixel-level analysis; or dynamic imagery layers that support mosaicking and on-the-fl y, server-side processing. By using drag-and-drop functionality for im-age fi les and their metadata, users can instantly host their imagery layers in ArcGIS Online. From the web interface, they can then select the layer confi guration, choose the data type, and fi ll in additional in-formation such as custom metadata types and processing templates. In terms of raster analytics, ArcGIS Image is especially attractive to members of the scientifi c community who want to perform big data analytics on large imagery collections directly in the cloud. For example, instead of having to bring data into ArcGIS, scientists (or their organizations) can take analytics directly to their data. If they want to deploy raster analytics right next to existing big data stores or data lakes, that’s a perfect use case for ArcGIS Image Dedicated, a set of services off ered to organizations that store imagery in their own clouds. For some scientists, it may make more sense to use ArcGIS Image Online to leverage the ready-to-use imagery
Directly integrate imagery intoall your geospatial work� ows
ArcGIS Image for ArcGIS Online supports image management completely in the cloud.

© 2021. Trimble Inc. All rights reserved. GEO-196 (01/21)
Reality Captured.
GIS Empowered.
Intelligence Delivered.
Trimble® GNSS hardware, apps, and services integrate with ArcGIS® Collector and ArcGIS Field Maps to precision-enable your workflow and drive confidence in your spatial data.
Learn more about precision-enabled Esri® field workflows here:
Geospatial.trimble.com/esri
13esri.com/arcnews ArcNews Summer 2021
About the Author
As chief scientist of Esri, Dr. Dawn Wright aids in strengthening the scientifi c foundation for Esri software and services while also representing Esri to the scientifi c community. A specialist in marine geology, Wright has authored and contributed to some of the most defi nitive literature on marine GIS.
services and raster datasets that are stored in ArcGIS Living Atlas of the World, such as Landsat, Sentinel, the National Agriculture Imagery Program (NAIP), and the Moderate-Resolution Imaging Spectroradiometer (MODIS). ArcGIS gives users ready-to-use tools to perform powerful analytical functions, such as anomaly detec-tion, predictive analysis, and artifi cial intelligence (AI) workfl ows, in addition to the out-of-the-box collaboration capabilities. What’s more, the raster function editor in ArcGIS Image provides access to more than 150 out-of-the-box raster functions that can be strung together to create custom image processing chains. Users can use and share these image processing chains as raster function templates in ArcGIS Online, ArcGIS Pro, and ArcGIS Enterprise de-ployments. Once a template is loaded in the Map Viewer or ArcGIS Pro, users can adjust the parameters and preview the processing re-sults, then simply click Run Analysis to get persisted results. Jupyter-style notebooks in ArcGIS Notebooks can also be de-ployed in the cloud to build automation, modeling, and machine learning tools right into basic scientifi c workfl ows, including an open-source ecosystem. Esri is taking geospatial artifi cial intelligence (GeoAI) to the next level as well with ready-to-use models in ArcGIS Living Atlas (ow.ly/RO2q50EoBhU) that can be easily deployed with ArcGIS Image. Th ese newly released models have been pretrained by Esri on huge volumes of data and can be used—with no training required—to automate the tedious tasks of digitizing and extracting geographic features from satellite imagery and point cloud datasets. Anyone with an ArcGIS Online subscription can access these at no additional cost. So, for example, if you are conducting a burn severity analysis and need to discern how many building structures might be in a wild-fi re’s path, you can now leverage the deep-learning capabilities in ArcGIS Online to automate feature extraction and extract building footprints in your study area. By selecting Raster Analysis Tools in ArcGIS Image, you can select Deep Learning and invoke the Detect Objects Using Deep Learning tool. You can then specify your input imagery source—in this case, high-resolution imagery provided by Maxar—and choose the relevant model from a library of ready-to-use deep learning packages, including ones that perform road ex-traction; human settlement detection; land-cover classifi cation; and, of course, building footprint extraction. In this case, you would choose the building footprint extraction model. Running the tool with these inputs extracts tens of thousands of building footprints in a matter of minutes—all thanks to the cloud.
A fi nal example comes courtesy of Esri’s ongoing partnership with the US Forest Service and its Forest Inventory and Analysis (FIA) Program. First introduced to the Esri user community at the 2016 Esri Federal User Conference (ow.ly/MJvZ50EoBkT), the FIA Program has an extensive engagement portfolio with a profusion of resources, available at ow.ly/nS2C50EoBn5. FIA researchers Charles H. “Hobie” Perry and Christopher M. Oswalt, along with their team, have been working with all the 30-meter Landsat imagery that’s available for the continental United States over a fi ve-year time se-ries in what is essentially a multidimensional data cube. Th is imag-ery is frequently used in studies that examine the relative predictive power of land-cover models—in particular, those related to tree cov-er—using harmonic regression (HR) as a primary predictor variable. In successive single runs processing HR for the continental United States (with no tiling or mosaicking of multiple runs), Esri has re-duced the processing time from 31 days to 33 hours. Th is means that 21.7 trillion pixels can be processed in 33 hours! Breaking that down even further, when an FIA researcher initiates a job, raster analytics is processing 15.8 trillion pixels per day, 657.6 billion pixels per hour, 10.96 billion pixels per minute, or 182.7 million pixels per second.
With new geospatial artifi cial intelligence (GeoAI), machine learning, and deep learning capabilities—all now provisioned in the cloud—ArcGIS offers many new opportunities for scientifi c innovation.
At the time of writing, FIA is using only four dedicated midtier, memory-optimized raster analytics machines, managed by Esri Managed Cloud Services, as part of this collaboration. FIA has no need for a massive cluster of high-end servers or supercom-puters. For many, this is a clear example of the sheer power and elegance of Esri’s raster analytics software. Indeed, the map of the future is an intelligent image that is powered by raster analytics. As such, this is a map that can free scientists up to do their best science. Since we generally understand things much better when we see them, go check out ArcGIS Image in action at ow.ly/eZOq50EoBpZ.

1Based on IDC Quarterly Workstation Tracker, Q4 CY2020 (based on units)
learn more > www.workstationguides.com/gis
GIS Industry Guide
Dell Technologies offers a full range of solutions including Precision workstations, Latitude Rugged tablets and laptops, PowerEdge servers and VxRail hyperconverged infrastructure for ArcGIS Pro and ArcGIS Enterprise
applications.
S O L U T I O N S F O R G I S P R O F E S S I O N A L S
Built to withstand the world's harshest environments while maintaining the highest
levels of performance and connectivity - Dell Rugged tablets and laptops.
Precision workstations are the #1 workstation brand in the world1, offering Dell’s highest performing, most reliable and fully customizable mobile, tower and rack workstations for GIS professionals.
Customer-inspired, future-ready technology goes
into every server, offering exceptional performance
for small-business offices to enterprise hyperscale
environments.
Powered by
DELLTECHNOLOGIES.COM/VXRAIL
DELLTECHNOLOGIES.COM/POWEREDGE
DELLTECHNOLOGIES.COM/RUGGED
DELLTECHNOLOGIES.COM/PRECISION
VISIT DELLTECHNOLOGIES.COM
DellESRIArcNewsSummerV1.indd 1DellESRIArcNewsSummerV1.indd 1 4/28/2021 2:28:58 PM4/28/2021 2:28:58 PM
“I was curious about population location, why cities are where they are,” said Dellagnello. “For example, you can trace an old buf-falo trail and how the Native Americans used that, and then you can see that a road was made there. So we have highways that follow ancient roads. Th at type of information—why we use the lines of transportation and communication that we do and why this population lived where they lived—has always intrigued me.” At a time when computers still required punch cards, Dellagnello was trained in manual cartography, “with scrib-ers and all,” he said. But when he got his fi rst job out of college at a small fi rm that produced maps for Kentucky’s coal min-ing industry, he did his work digitally. “I really learned the whole process, from aerial photogra-phy and imagery to collecting features digitally,” he said about that job. When he made his next career move and started work-ing at the Defense Mapping Agency (DMA) in Louisville, Kentucky, Dellagnello went back to mapping by hand, pro-ducing 1:50,000-scale topographical line maps and joint oper-ation graphics at the 1:250,000 scale. So he really came of age in the mapping industry as it evolved from manual processes to mostly digital systems. Th e DMA offi ce where Dellagnello worked eventually shut down as part of the Base Realignment and Closure (BRAC) program, so he was moved to Washington, DC. Th ere, he continued to work for the DMA, which became the National Imagery and Mapping Agency (NIMA) and, later, the NGA. “Th at’s where I started really doing GIS work,” he said. He was part of the VMap Co-production Working Group (VACWG), a partnership of 19 countries that producedmedium-resolution vector data of areas around the globe. Th e VMap Group expanded on the work of earlier cooperative pro-grams at the NGA. Th ese included the Inter-American Geodetic Survey (IAGS), which from the 1940s to the 1980s surveyed un-mapped areas of Central America and South America, and theDigital Land Mass System (DLMS), which in the 1980s linked eightcountries in creating a digital cartographic product for Europe. “At the beginning, I was just a worker bee collecting fea-tures,” Dellagnello said about his time in the VMap Group. “Th en I had the opportunity to engage with some European countries that were doing the same work, so I accepted a po-sition in the international offi ce.” Eventually, he became the chair of the VMap Group and saw it through to the end of its mandate. Th e MGCP, which came about after the September 11, 2001, terrorist attacks on the World Trade Center and the Pentagon, was built on lessons learned from the VMap Group. At the time, the NGA was tasked with furnishing geospatial readiness anywhere in the world that the fi ght against terrorism might take the United States or its allies. But doing that alone was beyond the NGA’s mapping budget. “Th e MGCP founders quickly brought 27 nations together to solve the organizational, resource, technical, sourcing, policy, and legal matters involved in producing and maintaining high-resolution geospatial data that’s functional for all their needs,” according to Cygan. “In less than two years, they went from hav-ing nothing to having a technical reference document in which they agreed on what all the features and attributes would be and what was needed to support defense forces in the fi eld.”
By convening in this coproduction program, the 27 coun-tries that initially got involved, along with the 5 that have been added in the years since, have produced more than they ever could have individually. And Dellagnello, with his deter-mination to get things done in a collaborative and inclusive manner, embodied the ethos of the mission. “One of the things [the NGA] mostly unconsciously tried to do initially was to not act like the 600-pound gorilla. We did not want the US to try to dominate this group. We wanted it to be a real team eff ort,” said Hild. “I believe, especially in retrospect, that the success of [the MGCP] was in taking that strategy. And Marzio was the heart and soul of all that.” According to Dellagnello, most of what he did was decon-fl ict various members’ interests to ensure that the data was produced according to certain specifi cations and delivered on time, when it was needed. “We’re all on the same side, but…every country has a diff erent way of working, diff erent responsibilities, and even diff erent fi s-cal years,” said Dellagnello. “Trying to get the funding in place for everybody to work and deliver the data was not all the same.” One of Dellagnello’s main priorities was to ensure that each country was working on areas of interest that were valuable to it. “For example, there are parts of the world where the United States may not have priorities but other countries do,” he said. “It was important to make sure that we paired up the right countries with the right areas of responsibility so the data was delivered in a timely manner.” Since 97 percent of the MGCP’s member countries use Esri software, it was also important that the group’s data would work seamlessly with ArcGIS technology. Members of Esri’s ArcGIS Defense Mapping team are typically present in the MGCP’s technical meetings to ensure that the ArcGIS Defense Mapping solution fully supports the MGCP’s data standard. “We have a symbiotic relationship with the MGCP, the NGA, and geospatial intelligence defense mapping agen-cies around the world,” said Cygan. “We support many dif-ferent defense standards and models for data as well as for cartography, including the Topographic Data Store (TDS), the Topographic Map (TM), the MGCP Topographic Map (MTM), and others.” It’s this kind of symbiosis, both within the MGCP and with outside partners, that has led many MGCP members to coop-erate in other endeavors as well. “When the Olympic Games were in Turin in 2006, I went to Italy, and I was able to work with Italian defense forces on the data and products that covered the area where the Winter Olympics happened,” said Dellagnello. “Th ere was no need for the NGA to produce any data for that, since Italy was well-covered by high-resolution data in that region, but it was a collaboration that was a big success.” And Dellagnello knows what makes a successful collabora-tion at the bilateral and multinational levels. “You need to search for an equitable quid pro quo because you want everybody to participate,” he said. “You need to standardize production. Relationships are critical. Don’t be bound by conven-tion. Look at the long-term focus rather than a very quick return. And remember that no single partner has all the answers.” He credits these principles, along with contributions from everyone on the NGA team, with keeping the MGCP on course and ensuring that it continues to be improved on and strengthened today.
He led one of the largest international geospatial coopera-tives in history. And his easygoing, unassuming nature is a big part of why it’s been a resounding success. Marzio Dellagnello, who recently retired as senior geo-spatial intelligence offi cer for international programs at the National Geospatial-Intelligence Agency (NGA), helped stand up and then managed the Multinational Geospatial Co-production Program (MGCP), a consortium of 32 nations that has created, updated, and maintained 5,300 one-by-one-degree cells of primarily 1:50,000-scale geographic data for key areas of interest around the world. Th at’s roughly the equivalent of mapping 27 percent of land on the globe with enough detail to carry out tactical operations, from military campaigns to disaster relief. “It’s not easy to get 32 countries to work together. Th ey all have their own national interests, their own data standards and standard operating procedures, and hundreds of military systems that need to be supported,” said Mark Cygan, direc-tor of national mapping solutions at Esri. “To get them all to agree on this and then produce more than 5,000 cells—that’s phenomenal. No one’s ever accomplished that. And now, as allies, they can all work off the same map.” “Th ere’s something about [Dellagnello’s] leadership style that just allowed him to get along with virtually everybody,” said Jack Hild, a former executive at NGA who was also instrumental in the MGCP. “Th e fact that he spoke a number of languages cer-tainly helped a lot. But he had a really unique combination of hav-ing the technical knowledge and simply the right personality and leadership style to interact with all the governments involved.” Born in Italy, Dellagnello moved to the United States when he was a teenager. He had always been interested in why hu-man behavior happens in certain places, so he studied geog-raphy and cartography at the University of Kentucky.
esri.com/arcnews14 ArcNews Summer 2021
Marzio Dellagnello

1Based on IDC Quarterly Workstation Tracker, Q4 CY2020 (based on units)
learn more > www.workstationguides.com/gis
GIS Industry Guide
Dell Technologies offers a full range of solutions including Precision workstations, Latitude Rugged tablets and laptops, PowerEdge servers and VxRail hyperconverged infrastructure for ArcGIS Pro and ArcGIS Enterprise
applications.
S O L U T I O N S F O R G I S P R O F E S S I O N A L S
Built to withstand the world's harshest environments while maintaining the highest
levels of performance and connectivity - Dell Rugged tablets and laptops.
Precision workstations are the #1 workstation brand in the world1, offering Dell’s highest performing, most reliable and fully customizable mobile, tower and rack workstations for GIS professionals.
Customer-inspired, future-ready technology goes
into every server, offering exceptional performance
for small-business offices to enterprise hyperscale
environments.
Powered by
DELLTECHNOLOGIES.COM/VXRAIL
DELLTECHNOLOGIES.COM/POWEREDGE
DELLTECHNOLOGIES.COM/RUGGED
DELLTECHNOLOGIES.COM/PRECISION
VISIT DELLTECHNOLOGIES.COM
DellESRIArcNewsSummerV1.indd 1DellESRIArcNewsSummerV1.indd 1 4/28/2021 2:28:58 PM4/28/2021 2:28:58 PM

16 ArcNews Summer 2021 esri.com/arcnews
More Data Sharing and Collaboration in ArcGIS Enterprise
versioned layers, and nonversioned layers with archiving enabled. Data management was also enhanced in ArcGIS Enterprise. For example, users can now append data—including CSV and Microsoft Excel fi les, shapefi les, and GeoJSON fi les—to hosted feature layers. Th ey can also choose whether to add or update features in the exist-ing layer or overwrite the layer. A new home page editor for ArcGIS Enterprise is benefi cial to users who want to customize
their home pages, choose diff erent layouts, and incorporate more branding. With the editor, us-ers can make their home pages responsive for desktop and mobile devices, display a full-screen cover image, rearrange the layout of the page, and adjust the tone to either light or dark. Edits can even be reviewed as they’re being made. New administrative reports now provide a helpful overview of content and member ac-tivity. For example, they let administrators see how many web maps their organizations have,
With the Q2 2021 release of ArcGIS in May, ArcGISEnterprise gained several exciting and long-awaited features that provide users with needed updates and better tools for collaboration. One of the most valuable updates to ArcGIS Enterprise is shared editing (two-way sync). Th is allows for distributed collaboration, en-abling users to share data edits and sync con-tent across ArcGIS Enterprise deployments and with ArcGIS Online. Additionally, ArcGIS Enterprise now supports hosted layers, branch
how many were created within a specifi c time frame, and which items need to be updated. Th e reports also allow administrators to export these ArcGIS Enterprise item and member in-ventories to CSV fi les. In 2022, ArcMap software-based runtime components will be removed from ArcGIS Enterprise, aff ecting services that are published from and run in ArcMap. So this latest release of ArcGIS Enterprise incorporates migration tool-ing to help users prepare for the change. Th e UpdateArcMapServices tool is now included with ArcGIS Server, which enables users to do inventories or bulk migrations of service run-times ahead of next year’s removal. Users can also migrate services individually through the ArcGIS Server Manager. Any other services, however, will need to be migrated manually. Finally, for eligible customers seeking a con-tainerized deployment option, ArcGIS Enterprise on Kubernetes is now available. To fi nd out more about this new cloud-native off ering, see “Esri Establishes Closer Ties with the Developer Community” on page 6. Users who are experi-enced in using Kubernetes can reach out to their Esri representatives to get more information. Please note, this is a short-term support re-lease that builds on previous releases of ArcGIS Enterprise and includes new features, apps, and improved functionality to the product. For more details on any of these topics, visit ArcGIS Blogat esri.com/arcgis-blog.
A new home page editor lets users display a full-screen cover image, rearrange the layout of the page, incorporate more branding, and more.

17esri.com/arcnews ArcNews Summer 2021
In ArcGIS Online, Extend and Multiply the Power of GIS
hours, or regularly update datasets by scheduling ArcGIS Notebooks to run in ArcGIS Online at a set time or on a recurring basis. Users can also pass parameters into a notebook on a schedule to account for diff erent analytical scenarios or for security purposes. Specifi c examples in which scheduling notebooks to run would be helpful include inspecting all the items in an ArcGIS Online organiza-tion and reporting items that are missing required metadata, such as descriptions, terms of use, credits, or tags. Another example is train-ing a deep-learning model overnight to save on computing resources during work hours. Scheduling a notebook to run after an online data source updates and then cleaning and engineering the data for use in an analysis workfl ow or a dashboard is an additional use pattern.
More Home Page Customization OptionsFor users who have wanted additional customization options for their organization’s home page, they can now use preset or cus-tom color themes that are available in the new home page editor. Th ere are eight curated color themes, and users can create a cus-tom theme as well. To ensure that the text on the home page remains legible, ArcGIS Online checks the contrast ratio of the selected colors and informs users whether the colors pass accessibility stan-dards. After selecting a theme, users can immediately apply dif-ferent colors to each content block on the home page.
Th e April update to ArcGIS Online ushered in several important changes that not only make it easier to work within the cloud-based mapping and analysis software but also improve collabo-ration across organizations. For starters, it is now easier for independent ArcGIS Online or-ganizations to establish formal relationships with each other to share maps and data, multiplying the power of GIS. Th e new Map Viewer was released for general availability as well, and it is now possible to schedule ArcGIS Notebooks to run in ArcGIS Online. Administrators and those with specifi c privileges can create acces-sible custom color themes for their organization’s home page. And a new gallery of focused app templates—complete with guidance for how to choose the one that best fi ts particular needs, plus an express setup option—is now available in ArcGIS Online. Read on for more details about all these updates.
Improved Collaboration Among Multiple OrganizationsBuilding and privately sharing maps across diff erent organizations is a powerful capability of ArcGIS Online. A common use case is when various emergency response agencies work together during a crisis to protect people and lands. In the April update to ArcGIS Online, this kind of collaborative experience was improved and expanded. It’s called partnered collaboration, and it provides a way for two or more ArcGIS Online organizations to establish a formal rela-tionship. Once a partnered collaboration is formed, the organiza-tions in it can work with each other securely in groups to edit items and share content. Managing groups in a partnered collaboration is simple. Organizations can make key people collaboration coordinators by assigning them the new facilitator role. Th ose people can then cre-ate and manage groups. Th ey also become an established point of contact for other organizations and can be easily found and di-rectly added to a group without an invite. When collaboration coordinators are promoted to group manag-ers, they can quickly get their team involved in a project by adding members from their organization to the group without having to send them an invitation. Th ey can also fi nd members in the partner organization by searching or fi ltering by organization affi liation (if this capability is enabled by the collaboration owner). After a partnered collaboration is established and the shared update group is created, members from the collaborating orga-nizations can build and edit maps and apps together. Whoever shares an item with the shared update group remains the owner of that item. Additionally, sharing content with a group can be lim-ited to group owners and managers in diff erent organizations who can ensure that the right content is curated and shared.
New Map Viewer Moves into General AvailabilityTh e new Map Viewer, recently out of beta, is now available for general use. Th is next generation mapmaking tool for ArcGIS Online and ArcGIS Enterprise provides new ways to visualize data and build compelling web maps. New capabilities were also added to Map Viewer in the April update. Users can now draw features and place stamps anywhere on their maps using sketch layers. Th is is a fast way to add infor-mation and personality to a map. Th e original Map Viewer is now called Map Viewer Classic. Administrators or individual users can make the new Map Viewer the primary viewer through their organization or user settings.
ArcGIS Notebooks in ArcGIS Online Supports SchedulingIn ArcGIS Online, ArcGIS Notebooks provides a Jupyter notebook ex-perience that’s optimized for spatial analysis. And now, users can au-tomate routine tasks, run large or lengthy processes outside of work
A New Way to Quickly Make Apps for StakeholdersArcGIS Instant Apps, which helps users quickly transform maps and data into apps, is now available in ArcGIS Online. Composed of a gallery of app templates, Instant Apps steers users to the ones that best fi t their maps and data. It then off ers two confi gu-ration experiences: express and full. Th e gallery includes focused apps, each with a specifi c pur-pose—for example, viewing a map, comparing two things, getting directions, or fi nding something nearby. Instant Apps guides users through the selection process by suggesting the best app template for the maps and data being presented. It does this by analyzing map components, like pop-ups, symbolization, and attachments, and then recommending app templates with compatible capabilities. After selecting their preferred app template, users can decide to do either a speedy setup with express confi guration or a full one for more advanced customization. With the express setup, users can choose and confi gure an app within fi ve minutes. Th e full setup is available when users need to confi gure additional capabilities. Instant Apps gives users confi dence that they are creating an app that meets the needs of their audience. Th e apps in Instant Apps have a mobile-fi rst design, meaning they can be used on any device. Th ey are also localized to support many languages and ac-cessible to people using assistive technologies.
Partnered collaboration is an effi cient way for two or more ArcGIS Online organizations to manage groups, edit items together, and share content.
In Map Viewer, the sketch layers capability allows users to quickly draw features and place stamps anywhere on their maps.
ArcGIS Instant Apps helps users select the best app template for the maps and data they need to present.
To learn more about the new capabilities in ArcGIS Online, visit go.esri.com/ArcGISOnlineApril2021.

18 ArcNews Summer 2021 esri.com/arcnews
Enterprise Workfl ow Management System Streamlines Operations
or pushed to a more advanced automated or manual data correction process before reenter-ing the normal data processing pipeline. By running a largely automated process like this, organizations can save on time and labor while maintaining the integrity of their data.
Discover Integrated Workfl owsWant to see a real example of a Workfl ow Managerworkfl ow? Watch the video Telecommunication
Lots of organizations are looking for ways to improve their business processes and maximize the value of their GIS investments. But GIS pro-fessionals are often asked to do more without enough resources. ArcGIS Workfl ow Manager can help. Th is scal-able enterprise workfl ow management system en-ables employees to complete tasks and projects in a predictable, accurate, and timely manner. While work management and productivity systems are not unique, Workfl ow Manager is diff erent because it focuses on optimizing both GIS- and non-GIS-based processes to create seamless, end-to-end workfl ows that are syn-chronized across web, mobile, and desktop de-vices. Workfl ow Manager is also location aware, meaning it employs spatial analysis to report on work statuses and metrics.
Step-by-Step Workfl owsUsers of Workfl ow Manager benefi t from its simple interface that takes them, step-by-step, through GIS workfl ow processes authored by their organizations. Th e steps are tightly inte-grated with Esri technology, allowing users to carry out actions such as the following:• Creating a work order using ArcGIS Survey123• Accessing web maps or apps in ArcGIS Enterprise• Coordinating fi eld crews with ArcGIS Workforce• Performing editing and analysis in ArcGIS Pro For example, to fi gure out if a proposed project is within 50 feet of a water boundary, Workfl ow Manager can guide users through the whole pro-cess. Th e person submitting the permit request does so using Workfl ow Manager, then the sys-tem determines whether the project’s location meets specifi c permitting criteria. From there, Workfl ow Manager leads both the submitter and the person reviewing the project through any ad-ditional questions that need to be answered or forms that need to be fi lled out. Workfl ow Manager lets users easily confi gure business processes like these in workfl ow diagrams that break operations down into digestible actions. Diagrams can include detailed steps directing us-ers, for instance, to add an attachment or send an email. As an organization’s processes evolve over time, employees can update their Workfl ow Manager systems to mature with them. So the pro-gram operates as a sort of living help system.
Based on a Four-Stage ProcessStreamlining a GIS production process is not specifi c to certain industries or use cases. In fact, most standard workfl ows follow the same four-stage process: submit the work order, validate the quality of the submission, complete the re-sultant work, and deliver the results. When someone submits a request to an organi-zation, it is either validated as a request that can be handled, or it is invalidated and sent back to the submitter or canceled altogether. A valid request is pushed forward in the process, and work is done to complete the job. Th e fi nal product of the request is then delivered to the stakeholder.
Workfl ow Manager establishes the design and review process for requests and assists all project participants in completing their tasks effi ciently. Th is works well for workfl ows that include doing inspections, allocating permits, soliciting or contributing data, managing inci-dents, and dealing with address changes.
An Automatic Production SystemSome workfl ows—such as data aggregation, in-gestion, and analysis—are becoming either fully automated or semiautomated, meaning that humans only need to intervene when necessary. Workfl ow Manager is evolving to act as the coor-dinator for heavily automated processes. By com-bining Esri technology and third-party systems, Workfl ow Manager is creating a powerful, stream-lined, and scalable automatic production system. Contributed data, for example, may not ad-here to an organization’s attribute or spatial data standards, so it might need to be reviewed, adjusted, or enriched before being added to the organization’s larger data repository. Workfl ow Manager coordinates the steps the data needs to take from the point of being received through getting published. If the contributed data fails certain checks, it can be automatically rejected
Solution: Network Design Workfl ow Management at youtu.be/ZheS9-8zju8 to be guided through a workfl ow that helps a utility coordinate and track network designs. Th e workfl ow crosses from the web to ArcGIS Pro and shows how ArcGIS Workforce and web apps are integrated into a simple infrastructure design process. Visit go.esri.com/ArcGISWorkfl owManager for more information on ArcGIS Workfl ow Manager, or reach out to your Esri representative.
ArcGIS Workfl ow Manager lets users easily confi gure business processes in workfl ow diagrams that break operations down into digestible actions.
Most standard workfl ows follow the same process: submit the work order, validate the quality of the submission, complete the work, and deliver the results.
Workfl ow Manager employs spatial analysis to report on work statuses and metrics.
Workfl ow Manager is tightly integrated with other Esri technology, such as ArcGIS Survey123, ArcGIS Enterprise, ArcGIS Workforce, and ArcGIS Pro.

19esri.com/arcnews ArcNews Summer 2021
If 50 percent of the population of Washington, DC, is vaccinated by the end of a 15-week period, there will be many more active cases of COVID-19 than if 70 percent of the population gets vaccinated within that time frame.
Location-Based Simulations Aim to Increase COVID-19 Vaccine UptakeCity, state, and federal health offi cials are leading the eff ort to in-crease confi dence in COVID-19 vaccines throughout the United States. Th eir goal is to get enough people vaccinated so that com-munities reach immunity levels that make it possible for people to safely get back to their prepandemic activities and ways of life. Achieving this objective requires developing tools that clearly communicate the benefi ts of the COVID-19 vaccines. Leaders across the country can then use those assets to encourage people in their communities to get vaccinated. Esri startup partner Epistemix used a computational simula-tion to model future COVID-19 infections in Washington, DC, over a 15-week period based on how many people receive vaccines and whether they are partially or fully vaccinated. Th e results are easy to visualize and understand—and they’re also convincing.
Challenges in Persuading People to Get VaccinatedTh e messaging for encouraging people to get vaccinated against COVID-19 might seem straightforward: just tell people where and when to get their shots. But public understanding of and confi dence in the COVID-19 vaccines varies tremendously across cities, counties, and states. Moreover, individual communities have diverse demographic and cultural groups that interpret offi cial guidance diff erently. Epidemiology is a complex topic that draws on a wide array of disci-plines, from microbiology to sociology. So offi cials must balance all these factors as they endeavor to increase vaccination rates. One powerful way to communicate the eff ectiveness of the vac-cines is to show side-by-side scenarios of the spread of COVID-19infections based on levels of population immunity. By comparing fore-casts of how COVID-19 spreads at diff erent levels of immunity over thesame geographic area and time frame, offi cials can clearly present to community members the specifi c collective impacts of their vaccines. It’s a lot more compelling to see what getting the shot could do for your family, friends, and neighbors than to try to interpret abstract statistics.
Visualizing Disease Spread Around Washington, DCEpistemix used its platform to build a model that simulates the impact of varying levels of COVID-19 immunity in Washington, DC. Th is platform has been employed to forecast both infectious and noninfectious diseases for groups such as the World Health Organization (WHO), the RAND Corporation, the Centers for Disease Control and Prevention (CDC), and the State of Indiana. Th e simulation incorporates the latest public health data, calibrates it to local conditions, represents every person and place in the area with statistical accuracy, and uses realistic social dynamics. A team of epidemiological modelers at Epistemix ran the sim-ulation for COVID-19 in Washington, DC, and then exported the data from Epistemix’s platform to ArcGIS Online. Th is enabled them to visualize how the disease would spread around the city under various conditions. Th e results revealed a stark diff erence between reaching 50 per-cent and 70 percent population immunity. In the fi gures below, every red dot represents an infected person, while every blue dot represents a person who has recovered from infection. Th e dramatic reduction in COVID-19 infections is clear if just 20 percent more of the population of Washington, DC, gets vaccinated. Fewer people get infected with the disease, which means fewer people end up hos-pitalized, and fewer people die. Th e city and the economy can open back up, and life can start getting back to normal. But if people delay or refuse to get vaccinated and Washington, DC, stalls at 50 percent immunity, then successive waves of the disease will continually put residents at risk. Th is would likely lead to additional lockdowns and activity restrictions. Grounded in the best epidemiological data available, these visualizations paint a precise and compelling picture of why resi-dents of the US capital should get vaccinated as soon as they are eligible—and encourage others to do the same. People can see the direct impact of their vaccination decisions on the communi-ties in which they live—what it means for their families, friends, neighbors, coworkers, schools, and local businesses.
By showing people how they can contribute to reopening in-stead of just telling them what to do, health offi cials invite those they serve to actively participate in the solution.
What It Takes to Get More Shots in ArmsCombining simulations with location intelligence to create pow-erful visuals that reveal real-world impacts can help offi cials, like those in Washington, DC, accelerate COVID-19 vaccine uptake in their areas. Enabled by ArcGIS technology, Epistemix’s tools synthesize de-tailed information—current vaccination levels, the eff ectiveness of vaccines, variant strains of the virus, vaccine hesitancy rates, evolving social distancing rules, and mobility considerations—into actionable visualizations that make sense to a diverse audience of stakeholders. Th is is what it takes to get shots in arms. Epistemix’s model for Washington, DC, is currently available in ArcGIS Marketplace and is already being replicated for other ar-eas. Th e company has run similar simulations for cities including San Francisco and Miami, states such as Michigan and Indiana, and events like the Erie County Fair and the Chicago Marathon. Funding for this and other vaccine confi dence data is available un-der the American Rescue Plan Act of 2021, section 2302. Beyond COVID-19, location-based computational modeling can provide unique insights on health equity, chronic health conditions, and precision public health. And although health offi cials face his-toric challenges as the world combats the COVID-19 pandemic, they have better tools at their disposal than ever.
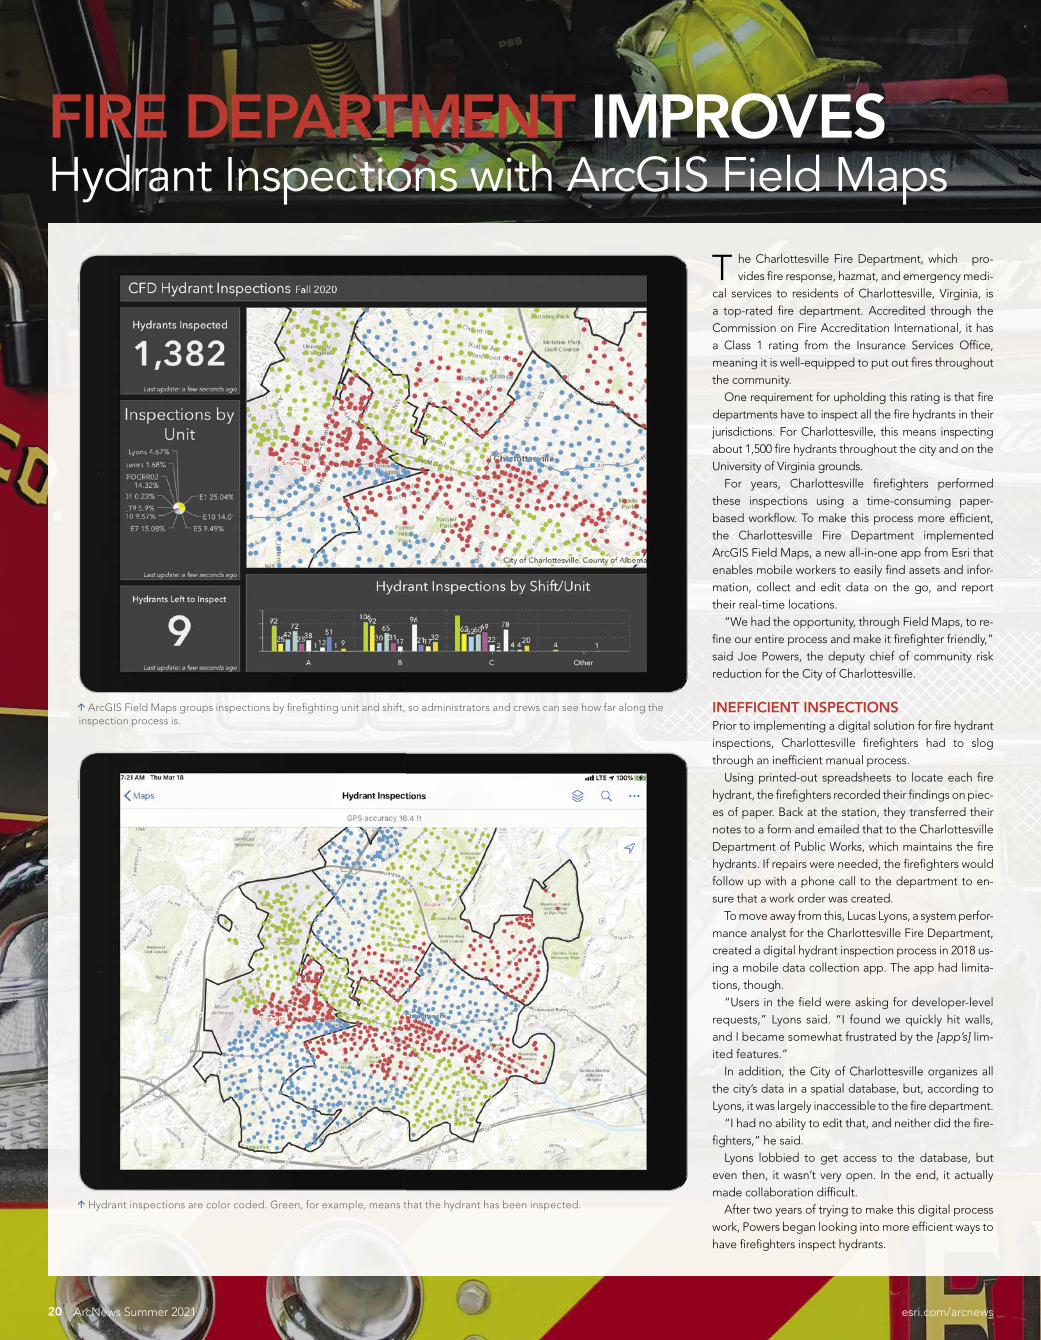
FIRE DEPARTMENT IMPROVESHydrant Inspections with ArcGIS Field Maps
he Charlottesville Fire Department, which pro-vides fi re response, hazmat, and emergency medi-
cal services to residents of Charlottesville, Virginia, is a top-rated fi re department. Accredited through the Commission on Fire Accreditation International, it has a Class 1 rating from the Insurance Services Offi ce, meaning it is well-equipped to put out fi res throughout the community. One requirement for upholding this rating is that fi re departments have to inspect all the fi re hydrants in their jurisdictions. For Charlottesville, this means inspecting about 1,500 fi re hydrants throughout the city and on the University of Virginia grounds. For years, Charlottesville fi refi ghters performed these inspections using a time-consuming paper-based workfl ow. To make this process more effi cient, the Charlottesville Fire Department implemented ArcGIS Field Maps, a new all-in-one app from Esri that enables mobile workers to easily fi nd assets and infor-mation, collect and edit data on the go, and report their real-time locations. “We had the opportunity, through Field Maps, to re-fi ne our entire process and make it fi refi ghter friendly,” said Joe Powers, the deputy chief of community risk reduction for the City of Charlottesville.
INEFFICIENT INSPECTIONSPrior to implementing a digital solution for fi re hydrant inspections, Charlottesville fi refi ghters had to slog through an ineffi cient manual process. Using printed-out spreadsheets to locate each fi re hydrant, the fi refi ghters recorded their fi ndings on piec-es of paper. Back at the station, they transferred their notes to a form and emailed that to the Charlottesville Department of Public Works, which maintains the fi re hydrants. If repairs were needed, the fi refi ghters would follow up with a phone call to the department to en-sure that a work order was created. To move away from this, Lucas Lyons, a system perfor-mance analyst for the Charlottesville Fire Department, created a digital hydrant inspection process in 2018 us-ing a mobile data collection app. The app had limita-tions, though. “Users in the fi eld were asking for developer-level requests,” Lyons said. “I found we quickly hit walls, and I became somewhat frustrated by the [app’s] lim-ited features.” In addition, the City of Charlottesville organizes all the city’s data in a spatial database, but, according to Lyons, it was largely inaccessible to the fi re department. “I had no ability to edit that, and neither did the fi re-fi ghters,” he said. Lyons lobbied to get access to the database, but even then, it wasn’t very open. In the end, it actually made collaboration diffi cult. After two years of trying to make this digital process work, Powers began looking into more effi cient ways to have fi refi ghters inspect hydrants.
20 ArcNews Summer 2021 esri.com/arcnews
Hydrant inspections are color coded. Green, for example, means that the hydrant has been inspected.
ArcGIS Field Maps groups inspections by fi refi ghting unit and shift, so administrators and crews can see how far along the inspection process is.

FIRE DEPARTMENT IMPROVESHydrant Inspections with ArcGIS Field Maps
AN ALL-IN-ONE APPPowers not only wanted to completely move away from a paper-based process, he also wanted each in-spection to be tied to that hydrant’s record. He and Lyons were cognizant that some users weren’t famil-iar with GIS, so they needed the digital solution to be user-friendly as well. Field Maps—with its data collec-tion and editing capabilities, digital maps, and ability to capture location tracks—ended up fi tting the bill. Using just a feature layer of the hydrants, Lyons cre-ated the fi re department’s Field Maps solution. The app groups inspections fi rst by fi refi ghting unit and then into three different shifts, which ensures that the work is di-vided up equitably and enables fi refi ghters to see which inspections have been completed by people on other shifts. Additionally, Lyons color-coded the inspections (for example, a green dot means that the hydrant has already been inspected) to provide at-a-glance information. “With Field Maps, you have a way to collect data without having to go through this whole process of [asking], Where should this data live? You just need to set up a feature layer, and you’re good to go,” said Lyons. “I like that.” After Powers and Lyons received some training on Field Maps from Esri, they created a three-minute training video to educate fi refi ghters on how to use the new app. The video showed Lyons using Field Maps to do a hydrant inspection. “We made a few little tweaks to [the app] once we were out on the street testing hydrants,” said Lyons. “Then we deployed it to our fi refi ghters.” Powers said the app was so straightforward that several fi refi ghters went out with their iPads and other mobile devices the day it was released to inspect hy-drants. And according to Lyons, the fi refi ghters asked very few questions. “I think [the app is] a game changer for the fi re servic-es,” Powers said. “It allows fi refi ghters to record informa-tion and collect data [using one app], and it’s what the fi re department needs to be successful in collecting data.” “I think we’ll have more and better data in the future [by] having an application like this in users’ hands,” Lyons added.
QUICK AND COLLABORATIVESince implementing Field Maps in November 2020, the Charlottesville Fire Department has expediently completed two inspection cycles for its 1,500 fi re hy-drants. According to Powers, the new, streamlined process has helped decrease the workload while in-creasing productivity. “From a staffi ng perspective, [� re� ghters] are not spending as much time on the street doing hydrant in-spections because they’re not writing it all down,” said Powers. “They’re doing it one time, and it’s done.” Rather than having to write emails, make phone calls, and scan paper work related to hydrant inspec-tions, Charlottesville’s fi refi ghters can complete other
21esri.com/arcnews ArcNews Summer 2021
tasks, such as taking hazmat or online training and keeping up their physical fi tness—all of which is part of a fi refi ghter’s job, according to Powers. Increased collaboration was also an important out-come of the Charlottesville Fire Department’s Field Maps implementation. Being able to visualize all hy-drant inspection data in real time and see who is doing what has eliminated a lot of duplicate work. And Lyons built the dashboard to track all this in an hour—some-thing he attributes to having reliable data. “In the past, administrators and the crews didn’t have that kind of insight,” Lyons said. “When the last hydrant was inspected and that form was turned in, then the whole process was done. But now we can track, in real time, how that’s happening using dashboards.” The real-time updates from Field Maps have also improved the fi re department’s communication with Charlottesville Department of Public Works. Having the data and documentation for hydrant inspections as soon as it’s ready allows staff members there to create work orders for repairs more quickly.
TECHNOLOGY THAT WORKSPowers believes that, from an administrative perspec-tive, team members have gained a huge amount of organizational equity because they seized an opportu-nity to improve an ineffi cient process. “One of the big benefi ts is the goodwill of our work-force, who now believe in technology and see [that]it can work,” said Powers. “Whenever we can show a win and show that life is easier with technology, that’s good, because that hasn’t always been the case.” Following such a favorable deployment of Field Maps, the Charlottesville Fire Department plans to use the app for hydrant inspections every year as well as broaden its use. One project will be to use the app to track the instal-lation of free, city-provided smoke alarms. “When you say, ‘We’re going to increase your pro-ductivity and save you time,’ it’s almost a pipe dream,” said Powers. “But with Field Maps…that’s exactly what we did.”
Field Maps makes it easy to collect and edit data on the go.
Firefi ghters now inspect fi re hydrants
using ArcGIS Field Maps on iPads and other
mobile devices.

22 ArcNews Summer 2021 esri.com/arcnews
According to the Centers for Disease Control and Prevention (CDC), nearly 71,000 overdose deaths in the United States in 2019 involved opioids. In addition, the economic burden of the opioid crisis—including health-care and treat-ment costs, lost productivity, and criminal jus-tice involvement—totals $78.5 billion per year. Fortunately, overdose treatments are eff ective—particularly naloxone, a medication that quickly reverses the eff ects of opioids. Naloxone is easy to administer and has been used for many years as an immediate treatment for opioid overdoses. Distribution programs for naloxone, which train nonmedical persons to recognize opioid overdoses and administer the medication, have been around since the 1990s. And more recently, a widely ad-opted “leave behind” program expanded access to naloxone by having emergency medical services (EMS) personnel who respond to an opioid over-dose leave behind a naloxone kit with friends or relatives in case the person overdoses again. In Hamilton County, Tennessee, approximately 106 people died from overdoses and other drug-related issues in 2019, and that number increased by 50 percent in 2020 to about 160, according to the medical examiner (ME). Law enforcement agencies across the county responded to more than 700 overdose incidents in 2020, per the Tennessee Bureau of Investigation, and 90–95 per-cent of those calls likely involved opioids. Th e rise in opioid overdoses prompted area health organizations to search for a way to get the state’s fi rst leave behind program for nalox-one up and running. Using GIS, a research team at the University of Tennessee at Chattanooga
(UTC) and its Interdisciplinary Geospatial Technology Lab (IGTLab) analyzed opioid overdose trends in Hamilton County and de-termined the most eff ective way to distribute naloxone kits among local EMS stations.
Identifying Clusters of OverdosesTh e IGTLab, run by UTC GIS director Charlie Mix, provides spatial data analysis and
Spatial Analysis of Opioid Use Gets Lifesaving Medicine to the Right Places
cartographic support to UTC faculty, staff , and students and the greater Chattanooga commu-nity. It also gives students unique learning op-portunities that help them hone their GIS skills on real-world problems while supporting local nonprofi ts and other organizations. “Over the years, the lab has provided GIS sup-port in areas including conservation, outdoor recreation, and public health,” said Mix.
It was 2018 when the IGTLab was ap-proached by a coalition composed of the University of Tennessee Health Science Center, Erlanger Health System, and the University of Tennessee at Chattanooga to help develop so-lutions to the area’s opioid problem. Th e group had a limited supply of naloxone kits and want-ed to come up with spatially based criteria for allocating them.
Charts and graphics in ArcGIS Insights helped the team see the month, day, and time when opioid overdoses are most common and gain a better understanding of the victims’ demographics.

ATHENS, GEORGIAsoforgis.uga.edu
Remote connection and limited in-personattendance will be accommodated
Save the Date!Save the Date!
December 6-7, 2021December 6-7, 2021
13th Southern Forestryand Natural Resource
Management GIS Conference
23esri.com/arcnews ArcNews Summer 2021
Mix and UTC GIS analyst Nyssa Hunt used ArcGIS Pro, ArcGIS Online, and ArcGIS Insights to conduct the spatial analysis. Th ey obtained two years of tabular EMS response and ME re-ports for opioid overdoses, which were scrubbed of personally identifi able information, from re-searchers in the coalition. To geocode the data, team members used the ArcGIS World Geocoding Service. Th ey did the EMS data separately from the ME data, since they were in diff erent schemas. Duplicate records in the datasets were identifi ed and removed. Th e EMS data and the ME data were then combined in ArcGIS Pro using the Merge tool, and data schema diff erences were reconciled using the Field Map parameter. Th is workfl ow resulted in three separate opioid overdose point datasets that were suitable for analysis: EMS data, ME data, and EMS and ME data combined. Th e team then used the geoprocessing tool Optimized Hot Spot Analysis in ArcGIS Pro to identify spatial clusters of opioid overdoses for all three datasets. Th ese represented areas in the county with the most overdoses over the study period, which was two years.
“Th is allowed [ for] the easy identifi cation of areas in the county with the most overdoses re-fl ected by the data,” said Mix.
Recognizing Patterns of Opioid-Related DeathsTo apportion the naloxone kits, the research team, along with the two doctors leading the study, decided to distribute them based on the number of opioid overdose calls each EMS sta-tion got. Th is would identify which EMS stations were likely to respond to the highest number of opioid overdoses and provide an opioid over-dose map for EMS station coverage areas. For this analysis, the team fi rst needed to cal-culate the opioid overdose percentage for each EMS coverage area. Th is would be used to de-termine the proportion of the total number of naloxone kits to allocate to each EMS station. To evaluate the total number of overdoses per 911 response zone in Hamilton County, team members performed a spatial join of the point data representing opioid overdoses and a shapefi le of the 911 response zones served by the EMS stations. Th en, using the Enrich tool in ArcGIS Pro, they determined the total estimat-ed population for each 911 response zone and used that to calculate the rate of overdose cases per EMS service area. Th is allowed the team to create maps that displayed the normalized rate of overdoses by 911 zone. “Visualizing the data in this way enabled us to recognize patterns of opioid-related deaths within the county,” said Dr. Rebecca Martin, an emergen-cy medical physician with Erlanger Health System who was involved in the project. “Identifying opi-oid overdose hot spots within Hamilton County allowed us to better understand the local epidem-ic and where to target interventions.” Additionally, because Erlanger Health System operates multiple regional hospitals
and emergency departments throughout the county, the data has “infl uenced administrative decisions within the health system regarding where to initiate programs aimed at combat-ting the opioid epidemic in order to benefi t the most patients,” Martin added.
Gaining Deeper UnderstandingIn presenting their fi ndings, team members from IGTLab also wanted stakeholders to be able to quickly understand other descriptive data contained in the EMS reports and ME re-cords. So they used ArcGIS Insights to create and share graphs and other visuals that showed trends buried in the data, such as the age and racial characteristics of those who overdosed and the month, day, and time when these events occurred most frequently. It also gave researchers and medical planners the added benefi t of interacting with the data and being able to perform their own analyses. “Th e data has been used by administrators to reallocate EMS resources as well as emer-gency department resources to better serve the most vulnerable populations,” said Jessica Whittle, director of research in the Department of Emergency Medicine at UTC. “In addition, some of our medics have indicated that it gave them a sense of encouragement because they felt that the high rates of overdoses they were seeing were everywhere, when in fact they were working in an overdose hot spot. Now they view themselves more as specialists rather than peo-ple fi ghting an unwinnable war.” Projects like this illustrate the power of maps and GIS as a collaborative tool for taking action and bringing about change, according to Mix. “Th e UTC community is grateful for Esri’s sup-port in helping respond [to] and solve these issues that our communities face,” he concluded.
Identifying opioid overdose hot spots in Hamilton County, helped the research team determine where to target interventions.
The team calculated the rate of overdose cases per emergency medical services (EMS) service area and created maps, like this one, that showed the normalized rate of overdoses by 911 response zone.
When responding to an opioid overdose call, emergency personnel can leave behind naloxone, a medication that quickly reverses the effects of opioids.

To protect data and systems from cyberattacks, organizations need to be in a position to quickly identify their IT vulnerabilities. According to a 2020 Cybersecurity Ventures report, the costs associated with cybercrimes are estimated to grow globally by 15 percent year over year for the next fi ve years. Th e report calculates cybercrime costs to include “damage and destruc-tion of data, stolen money, lost productivity, theft of intellectual property, theft of personal and fi -nancial data, embezzlement, fraud, postattack dis-ruption to the normal course of business, forensic investigation, restoration and deletion of hacked data and systems, and reputational harm.” When the City of Durham, North Carolina, suf-fered a cyberattack in March 2020, it lost all access to its servers, resulting in major data loss. One of the departments aff ected by the cyberattack was the Durham-Chapel Hill-Carrboro Metropolitan Planning Organization (DCHC MPO), which man-ages regional transportation planning for the west-ern area of North Carolina’s Research Triangle. With the cyberattack came the loss of DCHC MPO’s Electronic Transportation Improvement Program (eTIP), a map-based app that allows staff to search projects and identify where planned improvements are to be located. In addition, the organization lost access to all its enterprise GIS data, including municipal data layers and data for the City and County of Durham, Chatham County, Orange County, and the North Carolina Department of Transportation. Th ese crippling casualties left DCHC MPO in search of a solution that would not only retrieve what was lost but also put in place a plan, pro-cesses, and support to ensure that this would never happen again. Moving its data to the cloud instead of maintaining an on-premises server en-vironment seemed to be the best solution. DCHC MPO teamed up with Esri partner GeoDecisions to regain access to its server data; in-crease security; and build more effi ciency by lever-aging technology that includes ArcGIS Enterprise, ArcGIS Pro, ArcGIS Online, and Microsoft Azure. Th e GeoDecisions team decided to tackle the proj-ect in a phased approach that included procuring
cloud services, setting up the cloud environment, migrating eTIP and GIS data, conducting trainings, and doing system maintenance.
The Road to RecoveryJumping into action, the GeoDecisions team moved DCHC MPO’s GIS databases and eTIP app to the Microsoft Azure cloud computing service. During this phase, the team developed the work plan, provided project management and oversight, and met with DCHC MPO staff members and key stakeholders to discuss rec-ommendations for cloud migration. To move to Azure, the team needed to iden-tify what data would move, how much RAM and bandwidth would be needed, and whether it should be a single- or multiserver confi guration. One challenge that arose during this assessment was that almost 400 feature services would need to be moved while keeping the RAM costs within DCHC MPO’s budget. Th e organization decided to publish existing feature services using ArcGIS Pro, which can reduce RAM consumption by taking advantage of shared instances that pool central processing unit (CPU) resources for lightly used feature services. Th is ended up re-ducing DCHC MPO’s RAM consumption needs by at least 60 percent. Setting up the cloud environment in-volved consolidating servers to create a single, Windows-based virtual machine (VM) that would act as a production application and data-base server for the eTIP app. Th is VM contains all the software required to run and maintain eTIP and its supporting functions. In addition, the VM hosts the GIS databases and provides the storage and networking resources the system needs. GeoDecisions implemented system security measures as well, which included restricting re-mote desktop access to specifi c employees’ IP ad-dresses and updating administrators’ user names and passwords. Th e team also put into place DCHC MPO’s full system backup strategy, which involved using Azure’s Recovery Services vault to store snapshots of the VMs. Th is enables instant recovery of the system in the event of a disaster.
After Cyberattack, Transportation Organization Recovers Using Cloud-Based GISBy Sean Burke and Chuck Harris, GeoDecisions
Finally, to migrate and confi gure DCHC MPO’s apps, the team installed and confi gured the pre-requisite software packages needed for eTIP, in-cluding Internet Information Services (IIS) for Windows Server, SQL Server, and ArcGIS Server. Once all the software was installed and opera-tive, the team began migrating the eTIP app da-tabase and additional GIS databases.
ArcGIS Online ReturnsTo deal with DCHC MPO’s 400 feature services, the GeoDecisions team created a script to automate the publication of each feature service to the new ArcGIS Enterprise instance. Th is typically tedious and manual task was completed via background processing over the course of a couple afternoons. When the feature services were republished, they maintained their nomenclature and link structure, so no additional confi guration was required to remap existing ArcGIS Online apps or various links within DCHC MPO’s GISweb presence. With the new server structure and ArcGIS Online up and running, Casey Chae, client manag-er at DCHC MPO, was pleased with the outcome. “It gave us increased security and a renewed confi dence in our disaster recovery,” said Chae. “We are now able to be more proactive than reac-tive in our eff orts to manage and protect our data.”
System Maintenance, Visualization, and Ongoing SupportIn addition to assisting DCHC MPO in recovering from its cyberattack, GeoDecisions now providesmaintenance of the eTIP app and the server it runson. Th is includes doing Windows updates, execut-ing minor software patches, and performing virus defi nition updates. Th e project team developed a set of test plans for the app as well to ensure that it is functioning as expected. Th e owners of the eTIP app can visualize sys-tem health and costs via a portal view provided by the Azure environment. And confi gurable dashboards allow for more proactive monitor-ing of critical metrics, meaning that DCHC MPO would immediately notice and be able to
respond to issues such as high RAM and CPU usage, low disk space, or a failed backup. Th roughout the project, the GeoDecisions team created system documentation to ensure that DCHC MPO stakeholders can perform any nec-essary tasks themselves if need be. GeoDecisions recommended that DCHC MPO implement a backup and recovery process, too, which the two organizations worked together to develop.
A Successful OutcomeAfter nearly nine months of not having access to its GIS data and eTIP app, DCHC MPO is up and running again, continuing to do its impor-tant work addressing the transportation needs of the communities it serves. Th e migration to Azure provided DCHC MPO with greater security and maintenance capabili-ties for its data and apps. And the integration with ArcGIS Pro allowed the organization to conserve its valuable RAM budget, reducing consumption needs by 60 percent. With the move to a more secure environment, proactive monitoring, and an improved backup and recovery process, DCHC MPO’s GIS data is now more secure and fl exible than ever. For more information, contact GeoDecisions GIS architect Chuck Harris at 804-767-1870, or visit the GeoDecisions website at geodecisions.com.
About the Authors
Sean Burke is a GIS architect at GeoDecisions and has a background in GIS database administration. He specializes in data integration and creating SQL and Python extract, transform, and load (ETL) procedures for app development. Chuck Harris is also a GIS architect at GeoDecisions. He has more than 25 years of experience in the industry and specializes in providing ongoing support and maintenance for ArcGIS Enterprise, enterprise geodatabases, and related systems.
Microsoft Azure’s Recovery Services stores snapshots of virtual machines, enabling instant system recovery in the event of a disaster.
Dashboards let stakeholders monitor critical metrics so that they can quickly respond to issues such as high RAM and CPU usage or low disk space.
24 ArcNews Summer 2021 esri.com/arcnews

Creating Systems of Action with Real-time IoTand Intelligent Asset Management Solutions.
Cityworks, combined with Trimble and Esri® platform solutions, help you create ‘systems of action’ to care for critical assets and services that support your communities. Improve your asset reliability and resilience by enabling effective responses to infrastructure problems, extreme weather events, or other disasters by leveraging your Esri ArcGIS® investment with real-time monitoring and intelligent asset management.
Reguest your personal demo at Cityworks.com
EMPOWERINGFOR UTILITIES & LOCAL GOVERNMENT
Join us for the Cityworks ConferenceJune 8 - 9, 2021 Registration is Free
at Cityworks.com

“Make it accessible.” Gulp. It was 2016, and the State of Minnesota was ramping up its digital accessibility efforts. Maps were on the list of products that needed an accessibility makeover, but just how to tackle this problem remained elusive. Standards such as Section 508—the US General Services Administration’s IT accessibility program—and the Web Content Accessibility Guidelines (WCAG) didn’t in-clude detailed, map-specific information. Online resources were scarce, too. And any presentations about maps only had general solutions—for example, to use alt text for images. So staff members did what any good government agency does when presented with a problem: they formed a committee. It started small but quickly grew into a statewide team of acces-sibility experts and mapping professionals who all came from diverse backgrounds. Called the Maps Community of Practice (MCOP), the team focused on creating practical guidance for making accessible maps. The result was an online map accessibility resource center, available at ow.ly/nHCs50ELwKh. Launched in 2019, the website is filled with a growing number of guidance documents, quick tips, implementation tools, and additional web content to help anyone create an accessible map.
WHY ACCESSIBILITY?Accessibility is crucial for making maps that everyone can use. It means taking proactive steps to remove potential barriers for people of varying abilities. For example, high-contrast colors are important for those with color vision deficiency. Placing space around an object makes it easier for people with low vision to distinguish it. And alternative text, or alt text, helps people who use assistive technology, such as screen readers, to envisage photos, illustrations, maps, graph-ics, and other visuals. The beauty of accessibility is that it assists people of all abili-ties. Who doesn’t appreciate a well-designed map with clear la-bels and a strong visual hierarchy?
WHAT MAKES A MAP ACCESSIBLEChoosing the right design elements to make a map accessible can be challenging, especially when wading into this space for the first time. That’s why the MCOP came up with a series of top four tips for designing accessible maps.
HOW MINNESOTA IS MAKING MAPS ACCESSIBLEBy Members of the Maps Community of Practice Team, State of Minnesota
For Map Design in GeneralWell-designed maps use fonts, colors, symbols, and more to help people navigate or share complex information in simple and easy-to- understand formats. Here’s how to make these choices more accessible:
1 Fonts The minimum font size for printed labels should be 6 point, and
the minimum font size for explanatory text should be 12 point.
2 Colors Use a color checker, such as Color Oracle (colororacle.org), to
confirm how accessible certain colors are to people with varied vision abilities. Select colors with high contrast to make impor-tant information stand out. The MCOP’s Map Design Guide, available at ow.ly/4Z9a50ELxgo, includes color palette options.
3 Symbology Use colors and symbols that people associate with what’s
being represented. For example, blue should symbolize wa-ter, not land. Imitate the real world whenever possible.
4 Labels Labels should be consistent and easy to read. Make their orien-
tation and placement uniform. Never let labels overlap.
Find more resources for designing accessible maps, includingstyle downloads for Esri and Adobe software, at ow.ly/kmcS50ELxm0.
For Static MapsStatic digital maps are stand-alone graphics, such as JPGs or PDFs, that are not typically interactive. They serve as useful guides for visual and textual information. Here’s how these maps can be ac-cessible to digital readers and visually impaired audiences:
1 Design for accessibility. Use descriptive text for the map’s title, captions, alt text,
links, and body text to convey the map’s main messages. These elements should all work together to tell a story. Imagine you’re writing a report but don’t have the images yet and need to show a rough draft to stakeholders. What text would you use to fill in the gaps?
2 Enable human contact. Provide general contact information that is easy to find, and
ensure that someone will be available to answer questions.
3 Export usable formats. Export flattened PDFs (without layers) with as few attributes
as possible. Otherwise, items could disappear when adding ac-cessibility tags to the PDF. Alternatively, export maps as images
and insert them in a document in a program like Microsoft Word or Adobe InDesign that allows users to apply accessibility elements such as headings, alt text, and metadata.
4 Tag maps. To aid assistive technology in reading and structuring static
content, maps need to be tagged. Tag everything in a map as one figure or image. Add alt text to the map that complements other textual elements. Tag unique identifiers, like titles and captions, as text. For elements that are present only for visual appeal, tag them as background or artifacts.
The MCOP’s Accessibility Guide for Static Digital Maps, available at ow.ly/OSWT50ELxyM, has additional details about how to make static maps more accessible. Further information, such as how to tag maps using Adobe Acrobat, can be found at ow.ly/YATX50ELxyZ.
For Interactive Web MapsInteractive web maps allow users to interact with maps using a mouse, keyboard, touch screen, voice commands, and other tools. Users can select areas of interest, enter coordinates, and toggle lay-ers on and off. They can typically zoom in and out and pan around the map while data changes dynamically. Here’s how to simplify the accessibility requirements for this:
1 Define the map’s purpose. Focus on delivering key messages when designing an in-
teractive web map. The content drives the accessibility re-quirements, so make the main points clear and simple.
2 Use native HTML. Where possible, use native HTML when coding elements. Only
use Accessible Rich Internet Applications (ARIA) when needed, as it can complicate things unnecessarily. For example, when making a button, use <button> instead of div role="button".
3 Ensure full keyboard control. Support a user interface (UI) that can be controlled using only
the keyboard. This ensures that any user can access all the ele-ments in a web map.
4 Test early and often. Perform both automated and manual accessibility tests to
help evaluate how accessible a web map’s content is.
Using certain colors can help people with color vision deficiencies—such as protanopia, tritanopia, and deuteranopia—see the details in a map.
26 ArcNews Summer 2021 esri.com/arcnews
Small changes in color, contrast, and
label placement can increase readability
for all map users.

27esri.com/arcnews ArcNews Summer 2021
About the Authors
The State of Minnesota Maps Community of Practice team is composed of more than 60 staff members across 15 state agencies, educational and public organizations in Minnesota, and Esri employees. Team members have extensive professional experience in geography, cartography, accessibility, and web development.
For additional information on making interactive web maps more ac-cessible, see the MCOP’s Accessibility Guide for Interactive Web Maps at ow.ly/ZjQw50ELxTf and visit the Interactive Web Maps web pageat ow.ly/4yUr50ELxTu.
WHAT’S NEXTGoing forward, the MCOP remains focused on providing easy-to-understand information and tools to help people make better, more readable maps. Some of its current and future projects include putting together guidance for building dashboards and interactive maps and working in ArcGIS Pro. Th e group also wants to continue coming up with new techniques and tools for changing technology, share more of its resources, and develop training videos. Maps that are accessible ensure that whole audiences can fully utilize the products that mapmakers have taken so much time and care to cre-ate. Hopefully these free resources from the MCOP can help other people and organizations in their own journeys toward making accessible maps. All information and tools produced by the MCOP are avail-able on the Minnesota IT Services Map Accessibility web page atow.ly/nHCs50ELwKh. For more information, email the Minnesota IT Services Offi ce of Accessibility at [email protected].
Figure 2. Water-table elevation and groundwater fl ow directions
Water-table elevations in Washington County cover a wide rage of values: high elevations along the Mississippi—St. Croix watershed divide and portions of the northeast and southwest.
The lower elevations are along major rivers (Mississippi and St. Croix) and associated tributaries of the St. Croix River including Brown's Creek, Valley Creek, and Trout Brook.
The Cottage Grove ravine in the eastern parts of Cottage Grove and Woodbury is a large area of low water-table elevation that is not drained by a perennial stream.
The main groundwater-fl ow directions are from the center to the east toward the St. Croix River, south or southwest toward the Mississippi River, or west toward Ramsey and Anoka counties. Local water-table fl ow is toward the major tributaries, lakes and other surface-water features.
When conveying information by color, it’s best to summarize the information elsewhere as a caption, body text, table, or link to more information.
Quick cards are downloadable reference guides that summarize best practices for making accessible maps.

28 ArcNews Summer 2021 esri.com/arcnews
Th e last year and a half has been marked by the intersection of the COVID-19 pandemic, increased awareness of ongoing racism, and technological advances. Th e confl uence of these powerful and transformative events has provided fertile ground for accom-plishing real and lasting change. Th e opportunity to create a new, shared vision of a more equitable future is at a tipping point, and people’s urge to take concrete action is palpable. Race and place predict whether people have the opportunity to thrive, so geography matters. US president Joseph Biden recognized this when, on the day of his inauguration, he signed the Executive Order on Advancing Racial Equity and Support for Underserved Communities Th rough the Federal Government. Th is order pinpoints the need to assess the geographic location of underrepresented or dis-advantaged communities and to manage programs using technology. Th e GIS profession is uniquely situated to lead the change that this executive order envisions. GIS practitioners are change agents that have brought new ways of doing business into organizations for the last several decades. Th us, it is no surprise that many GIS profession-als are ready and eager to help make equity and social justice a reality. Th e Urban and Regional Information Systems Association (URISA), with support from many key staff members at Esri, is answering that call to action by modeling how to institute orga-nizational change and creating volunteer opportunities to do this transformative work. Th ere are various ways to contribute that correspond to where GIS practitioners are in their own journeys regarding equity and social justice work, as well as to the level of commitment they can make.
Answer the Call to Action for Equity and Social JusticeBy Kathryn Brewer, Spatial Relationships, LLC
TMI Consulting Inc., cofounder of Loom Technology, and partner at Now Partners—reminds us that the core of what we can do to heal racism lies within ourselves. “Th e minute that we are unkind to another human being, it doesn’t matter what their identity is, necessarily. An act of un-kindness, a thought of unkindness, or any action that makes one person feel excluded or a group of people feel excluded, these are the [kinds] of actions that refl ect something back at us,” Jana stated in a lecture they gave during the Inner MBA program for New York University’s MindfulNYU program. Most people are afraid of this unwanted refl ection of themselves. Instead of lashing out because of fear, though, Jana went on to explain that “the minute that you fi nd those experiences, or you know that you have not been kind, or you know that your thoughts were biased and a little bit skewed, it’s important to identify those, to forgive your-self, and [to] have grace for yourself, understanding that this is a jour-ney…and all of it is an opportunity to learn and grow.” GIS is a powerful tool for driving transformative change. It is imperative that each practitioner use the technology consciously and with clarity of character to create welcoming spaces that fos-ter equity and belonging.
URISA Leads by ExampleJust as it is important for individuals to confront racism, it is also crucial for organizations to refl ect on their work and look for opportunities to modify policies, practices, and procedures that contribute to institutional racism. Leading by example, URISA has formed the Pro-Equity Anti-Racism (PEAR) committee, which will review the organization’s internal practices annually and inform its yearly work plans and bud-gets. Th e committee is led by pioneering professionals in the GIS fi eld who have extensive experience doing this invaluable work at other organizations. PEAR worked with URISA’s GISCorps to gain a valu-able volunteer, Rylee Wrenner, to use ArcGIS Hub to create a hub site—scheduled to launch later this year—that supports communityinvolvement in pro-equity and antiracism eff orts. Anyone with experi-ence in antioppression work, particularly in antiracism, is encouragedto reach out and lend their expertise to the process. Please email cochairs Nicole D. Franklin at [email protected] or Greg Babinski at [email protected] to learn more about PEAR. URISA also established the GIS for Equity and Social Justice workgroup, which is poised to take external ac-tion against racism and social injustice as part of the Professional Education Committee. In partnership with PEAR, these groups authored URISA’s Anti-Racism Pro-Equity & Social Justice Statement as well as An Open Letter to Acknowledge and Combat Anti-Asian Hate. Other areas of focus for this workgroup are GIS and redistricting, developing social justice indicators, hosting workshops, writing book reviews, and putting together informative articles to continue educating URISA members—and others—about these important topics. To learn more, reach out to the GIS for Equity and Social Justice workgroup chair, Judy Colby-George, at [email protected].
If staying local is more enticing, connecting with local URISA chapters (listed at ow.ly/Lgt050EMm6o) is also a great way to get involved. Th e New England Chapter of URISA (NEURISA), for ex-ample, is in the process of organizing a new GIS for Social Justice subcommittee. To learn more about this initiative, email NEURISA chapter president Jodie Gosselin at [email protected].
Tools That Can Help Bring About ChangeWhile the focus of this article has been on making personal and institutional change, it is also useful to talk about the tools that can help bring about these transformations. Esri has developed a framework, along with targeted geospatial solutions—all avail-able at esri.com/racial-equity—to advance racial equity and so-cial justice. Esri education manager Joseph Kerski also has a great blog, at ow.ly/PKAq50EMmqd, that highlights good resources for teaching about racial equity and social justice using GIS. In addition, PEAR committee cochairs Franklin and Babinski developed a half-day workshop to introduce GIS professionals to doing racial equity and social justice work. Registration is open and available at ow.ly/e84950EMmqU. In 2019, Babinski was awarded the EthicalGEO Fellowship by the American Geographical Society to study how GIS is an eff ective tool for equity and social justice work. Th e resultant article, which con-tains best practices and is published on the EthicalGEO website at ow.ly/MK5n50EMmrY, has been peer reviewed by more than 50 GIS professionals and ethical and social justice practitioners.
What About Other Inequities?Given that URISA and Esri have made antiracism a priority, this might spark curiosity about how other oppressed communi-ties—including but not limited to women, immigrants, members of the LGBTQIA community, and people who identify as neuro-divergent and diff erently abled—will be heard. By examining where institutional racism exists in GIS, new practices will be put in place that ensure that other underserved groups gain a sense of belonging, too. In short, antioppression work that utilizes an equity lens for one underserved community helps lead the way for equitable change for all. Now is the time to create lasting change for racial equity. Please join the eff ort at whatever level resonates with you, with whatever time commitment you can make. Let’s also keep the conversation going on URISA Connect at connect.urisa.org. To learn more about other URISA volunteer opportunities, visit ow.ly/CRRF50EMmuv. For more information, email Kathryn Brewer at [email protected].
Managing GISA column from members of theUrban and Regional InformationSystems Association
Fostering Excellence in GISwww.URISA.org
Begin with Individual ChangeTh e fi rst and most important step to take to confront rac-ism and other systems of oppression that lead to inequities is at the individual level. Prosci, a leading change management organization, recognizes this in its article “5 Tenets of Change Management” (available at ow.ly/WKuJ50EMm3j), which states, “Organizational change requires individual change.” Challenging topics such as racism, equity, and social justice are often thought to be easier to work through in external settings, by participating in or donating to organizations doing work on insti-tutional racism, for example. However, Dr. Tiff any Jana—CEO of
Many GIS professionals are ready and eager to help make equity and social justice a reality.
About the Author
Kathryn Brewer, GISP, is a partner at Spatial Relationships, LLC, and has more than 20 years of experience leading change in the geospatial technology fi eld. She currently serves on the URISA Board of Directors and as board liaison to PEAR and the GIS for Equity and Social Justice workgroup. While working diligently in the geospatial technology fi eld, Brewer is bridging her professional and personal lives by championing neurodiversity in many areas, including the workplace. Her goal is to lead—and be—the change needed to create workplaces where neurodivergent individuals are not only welcome but sought after as well for their expertise and unique perspectives.
Creating lasting change for racial equity will put in place new practices that ensure that other underserved groups gain a sense of belonging, too.

HARNESS THE POWER OF WHERE
The University of Redlands is a private, nonprofit university located in Redlands, California—close neighbors and partners with geospatial leader, Esri.
All Redlands academic programs enable access to Esri technology, training, people, events, and internships, including classes taught by Esri employees.
ONLINE GR ADUATE SPATIAL PROGR AMS
Geographic Information Systems (GIS) Certificate
Advance your career in a GIS-related field with an introductory graduate certificate that teaches you how to manage a spatial database, extract useful information from remotely sensed data, use Python to extend GIS, and develop a web GIS application. Access to extensive Esri resources complements your GIS education with diverse cutting-edge applications and technologies.
Online + On campus4 courses
11-13 credits*
32 weeks
Business Location Analytics Certificate
Master the business of “where” with a graduate certificate that focuses on using GIS to achieve business success. Learn how leading organizations deploy location analytics to gain customer insights, expand the business, manage risk, and design effective spatial business strategies. Develop technical skills in location analytics and spatial storytelling that can improve business decision-making and positively impact society.
Online only3 courses
10 credits
20 weeks
MBA – Location Analytics Concentration
Use the power of location intelligence to lead 21st century businesses and organizations. The MBA with a location analytics concentration equips you to unlock the potential of spatial data, solve real-world problems, and gain a competitive advantage in today’s business world.
Online + On campus9-12 courses
36-48 credits
18-24 months
* Credits can be applied to MGIS and MSGIS degree programs.
Learn morespatial.redlands.edu
SPA-21-001 Redlands Ad ArcNews Spring 21.indd 1SPA-21-001 Redlands Ad ArcNews Spring 21.indd 1 1/27/21 2:46 PM1/27/21 2:46 PM

30 ArcNews Summer 2021 esri.com/arcnews
Geoethics in the Geospatial CommunityEthics has long been a topic of concern in the geospatial community. Since the earliest development of technologies that permitted remote and closeup surveillance, geographers have been concerned about the limits—or, more accurately, lack thereof—of what is possible with geospatial data collection.
Interest in geoethics has increased dramatically in recent years with the rise of social media and personal devices that serve up abundant user data, as well as the greater capacity of open mapping and voluntary data collection. Building on previous efforts over the past two decades, the American Geographical Society currently has its EthicalGEO project (ethicalgeo.org); the American Association of Geographers (AAG) and Open Geospatial Consortium, Inc. (OGC), have organized online meetings to discuss ethics; and the United Nations Global Geospatial Information Management group is focusing on teaching geospatial ethics.
From the MeridianBy Michael GoodchildUniversity of California, Santa Barbara

About the Author
Michael Goodchild is an emeritus professor of geography at UCSB. He holds positions at universities around the world, including distinguished chair
professor at the Hong Kong Polytechnic University and research professor at ASU. Until his retirement in June 2012, Goodchild
held the Jack and Laura Dangermond Endowed Chair in Geography and was the director of the UCSB
Center for Spatial Studies.
31esri.com/arcnews ArcNews Summer 2021
Such interest may refl ect a response to the growing power of geospatial technology and its potential for intrusion, surveillance, and misuse. Th is interest has been especially
prominent during the COVID-19 pandemic, which has shown, more conspicuously than
ever before, the potential of geospatial technol-ogy to trace individuals and their contacts. Perhaps the increased engagement with geoethics also refl ects the consequences of the rapid research that had to be done to track the spread of COVID-19—consequences that may have included cutting secu-rity and privacy corners to produce helpful results. Th is year, the AAG, in collaboration with Esri and the Center for Spatial Studies at the University of California, Santa Barbara (UCSB), began a multiyear conversation about ethical issues
associated with location information and geospatial tech-nologies. Currently, the project is taking the form of a we-binar series. Th e fi rst of these, on ethical spatial analytics, occurred on February 9. More gatherings are planned in
the next few months with the intent of holding an international summit in late 2021 or early 2022. Th e series seeks to bring together geospatial professionals from all sectors—academics, industry, and nongovernmental organiza-tions—to create an action plan for directing greater attention to the ethical issues facing those of us who practice geography and GIS. Th e organizing committee, which I cochair along with AAG execu-
tive director Gary Langham, has been working for the past half year to put this programming together. Led by AAG di-
rector of geographic research Coline Dony, committee members include Mei-Po Kwan of the Chinese
University of Hong Kong, Jeremy
Crampton of Newcastle University in the United Kingdom, Katina Michael of Arizona State University (ASU), Richard Appelbaum and Krzysztof Janowicz of UCSB, and William Herbert of Hunter College of the City University of New York. Geoethics is a vast topic. Some of the ethical issues we face are common to all professions, although the expression of these is-sues is distinctly spatial. Diversity, equity, and inclusion are espe-cially important, as many events from 2020 demonstrated, such as COVID-19’s inequitable impacts in terms of race and income and the highlighted police violence that is part of larger, ongoing pat-terns in the United States. Other ethical issues arise more or less uniquely in the activities of geospatial professionals. Th e project has chosen to focus the majority of its eff orts on these. Organizers of the geoethics series developed four topic ar-eas to address both the overarching issues and the specifi cally geographic concerns. Th ese will form the initial emphasis of our conversation, although we fully expect to modify and augment the following topics as other matters are identifi ed:• Surveillance: Th e availability of technologies that do surveil-
lance—tracking individuals, recognizing faces in closed-circuit television (CCTV) videos, building profi les of individuals based on their spatial behavior, and compiling information on people’s social contacts—raises many ethical issues. What can be done to protect individuals’ privacy while preserving individuals’ freedom?
• Labor and employment: Surveillance is increasingly used in the workplace, much of it with a geospatial dimension. How can workers be protected? What regulations are needed? What are best practices in this area? And how should employ-ers deal fairly with employees?
• Governance: What are alternative models for the ethical regula-tion of geospatial technologies? What ethical issues are raised by open data and software, data ownership, and the presence of both private and public agencies in the geospatial industry?
• Geospatial analytics: Analyzing geospatial data, as well as for-mulating predictions and drawing inferences from it, raises important ethical issues. Some of these are well known, such as the ecological fallacy and the eff ects of modifying areal units. New issues are coming to light with the growth of geo-spatial artifi cial intelligence (GeoAI), the ability to replicate and generalize inferences from geospatial analytics, and the ease with which anonymized data can be reidentifi ed.
In its earliest stages in late 2019 and early 2020, this geoethics project was supposed to have launched at an in-person meeting
in Santa Barbara. But the arrival of COVID-19 postponed that, and the webinar program was introduced to build interestand momentum. Th e fi rst webinar in February was organized jointly with ASU as its 2021 Spatial Analysis Research Center (SPARC) workshop. It attracted more than 250 registrants. Peter Kedron and Amy Frazier of ASU moderated the webinar, and fi ve speakers intro-duced four major topics on ethical spatial analytics:• Mia Bennett from the University of Hong Kong and Luis
Alvarez León from Dartmouth College discussed the ethical implications and property regimes of remote sensing, along with the importance of ethnography as a human-oriented source of ground truth.
• Peter Rogerson from the University at Buff alo presented ethi-cal paradoxes that arise when attempting to make decisions based on inferences informed by doing spatial statisticalanalysis on sociodemographic data.
• Renee Sieber from McGill University discussed the ethical im-plications of GeoAI and locational big data, touching on the use of doorbell video cameras, biases in facial recognition technol-ogy, the internal workings of machine learning systems, and the ethical responsibilities the investigator has in using these tools.
• Jacqueline Vadjunec from Oklahoma State University focused on the ethical dimensions of spatial analyses based on data generated during citizen science projects, the ongoing need for mixed meth-ods research, and the implications of both for reproducibility.
Video recordings of these presentations and the subsequent discussion are available at sgsup.asu.edu/sparc/ethics. It has become abundantly clear from these and previous eff orts that ethical issues emerge throughout geospatial practice. In my own teaching, I have addressed many of these under the rubric of critical spatial thinking—that is, the thought processes that expe-rienced users of geospatial technologies go through. For example, what do I know about the origins and quality of this dataset, and what does it not tell me about real conditions on the ground? Th e data seems to support a particular inference, but what other in-ferences might also explain the data? What can I do to ensure that the results of this analysis are used appropriately and in the best interests of the public? Our students must be encouraged to think beyond the immediate operations of the GIS interface and about each project’s broader ethical issues—and then carry those con-cerns with them into their careers. Additional webinars in the series will be announced when details become available, so please check the website at ow.ly/LAu450EfA2L for updates. Th e organizing committee is hoping that the long-delayed face-to-face meeting will be possible in December. We welcome any comments about and expressions of inter-est in the project, the webinars, the in-person meeting, and other activities. Please contact me ([email protected]), Coline Dony([email protected]), or any other member of the organizing committee.

Esri PartnersCultivate ExcellenceAt the 2021 Esri Partner Conference, held in March, Esri recognized 26 partners in 10 award categories fortheir GIS expertise and exceptional use of Esri software. Read on to fi nd out more about their outstanding work.
Geographic Business Solutions, Ltd. (GBS) |gbs.kiwi
GBS delivers world-class location intelligence solutions across a wide range of industries, primarily in New Zealand. When Auckland Council needed to modernize its conservation activities, GBS built the organization a Conservation Information System using ArcGIS Enterprise, ArcGIS Dashboards, ArcGIS Field Maps, and ArcGIS Survey123.
Demonstrating Highly Aligned Solutions Built with the ArcGIS System
Trimble Forestry | forestry.trimble.com
From harvest to mill, Trimble helps companies around the globe improve forest management, automate workfl ows, and make smart decisions. ArcGIS technology is deployed throughout Trimble Forestry’s CONNECTED FOREST portfolio, which includes the Land Resource Manager (LRM) platform and a new Chemical Application Management (CAM) solution.
Symology | symology.co.ukSymology’s new integrated street works and asset management solution, Aurora, offers users a feature-rich experience along with real-world benefi ts. Built on ArcGIS Enterprise and ArcGIS API for JavaScript, Aurora dynamically connects clients with their information so they can effi ciently manage assets and highway networks.
Compelling Use of Esri Technology to Drive User Engagement
Clearion | clearion.com
Clearion empowers utilities and infrastructure agencies with native Esri solutions to automate every stage of their vegetation and asset maintenance programs. Its cross-platform ArcGIS Runtime apps improve safety and effi ciency for asset managers and their contractors while enabling engagement with sustainability initiatives and community-facing programs.
VEGA Monitoramento |vegamonitoramento.com.br
Brazilian company VEGA Monitoramento, which focuses on agribusiness and the environment, is committed to ensuring the origin and sustainability of products throughout the food chain. Incorporating ArcGIS technology into its data, monitoring, and spatial intelligence deliverables, VEGA supports decision-making at trade organizations, cooperatives, and suppliers.
Timmons Group | timmons.com/gis
Timmons Group’s technology practice has consistently employed Esri software to facilitate robust user engagement. Throughout the COVID-19 pandemic, the organization advanced this use to facilitate public meetings and interface with stakeholders in a richer way by incorporating ArcGIS Hub, ArcGIS StoryMaps, and ArcGIS Survey123.
Delivering Creative Content to ArcGIS Users
Environics Analytics | environicsanalytics.com
Organizations in every industry need to know who their customers are, how they behave, where they’re located, and how best to reach them—not to mention more of them. Environics Analytics does just that by providing exceptional data; purpose-built, ArcGIS technology-based software; and analytics expertise.
UM | um.co
UM is a leading provider of human movement data for retail companies, restaurants, tourist organizations, city governments, and academic institutions. With datasets optimized for ArcGIS Pro and ArcGIS Online, organizations rely on UM to furnish timely, accurate, and effi cient business intelligence on people and places.
Locatus | locatus.com
To help retailers, local governments, and real estate companies in Europe invest in the right retail locations, Locatus gathers its own data on shops and consumer-oriented service companies and makes this information accessible to clients through Locatus Online, an ArcGIS technology- and web-based platform.
32 ArcNews Summer 2021 esri.com/arcnews
Compelling Use of Esri Technology to Address Crises Around the World
BlueDot | bluedot.global
BlueDot combines artifi cial intelligence (AI) with medical expertise to deliver comprehensive information on epidemics. The team anticipated the spread of Ebola and the Zika virus and published what it believes was the fi rst paper on COVID-19. With ArcGIS Pro, BlueDot has empowered governments and businesses throughout the pandemic.
IDEMA | idema.com.tr
Turkish consultancy IDEMA generates innovative ideas and map-based solutions for national and international projects that revolve around socioeconomic development. Using real-time, location-based analytic data collection with software such as ArcGIS Survey123, IDEMA has helped clients improve their productivity and effi ciency during crisis management situations.
GeoAcuity | geoacuity.com
GeoAcuity provides geospatial insight, analytics, and mapping solutions to commercial and government sectors. During California’s recent wildfi res, it partnered with public safety unmanned aerial system (UAS) teams to leverage Site Scan for ArcGIS, ArcGIS Pro, and ArcGIS Online to deliver geospatial intelligence in record time.

Ensuring Customer Success by Implementing the ArcGIS System
Ardent | ardentmc.com
Ardent delivers enterprise location intelligence solutions across the homeland security sector. Its work spans law enforcement, intelligence, emergency management, and national operations. In 2020, Ardent planned and executed one of the largest federal ArcGIS Enterprise cloud migrations with zero downtime to the mission it serves.
Tracasa | tracasa.es
Based in Spain, Tracasa provides GIS services to water distribution organizations to help them improve how they manage resources. Employing the ArcGIS system ensures that clients use data and information effi ciently. Currently, Tracasa works with 11 water companies in Spain, serving 4.5 million people.
SSP Innovations | sspinnovations.com
SSP Innovations delivers ArcGIS Pro solutions to electric and gas utilities, telecommunications providers, and pipeline operators around the world. Its solutions are designed to help customers meet their unique business challenges through a combination of deep technology expertise and unmatched familiarity with industry best practices.
Evolving Customers and Solutions to the Web GIS Pattern with SaaS
Aegean Energy Group |aegeanenergygroup.com
Aegean Energy Group’s Maps to Megawatts solution helps wind and solar companies organize and manage the development, construction, and operation of renewable energy projects. A comprehensive, web-based mobile solution that leverages a suite of ArcGIS technology, Maps to Megawatts is technologically advanced, scalable, and secure.
1Spatial | 1spatial.com
Working primarily with government, utility, and transportation organizations, 1Spatial is an international leader in offering software as a service (SaaS)-based solutions for managing geospatial data. Its 1Spatial Location Master Data Management (LMDM) platform delivers powerful business applications on premises, via mobile devices, and in the cloud.
Atos | atos.net
Atos is a global leader in providing secure and decarbonized digital transformation services and solutions. Using ArcGIS Enterprise, the company delivers hybrid and scalable cloud-based spatial solutions to diverse customers, such as Germany’s Federal Offi ce for Goods Transport (known by its German acronym, BAG).
Delivering Analytics and Insight to Users Through Location Intelligence
Swift Geospatial | swiftgeospatial.solutions
Swift Geospatial converts data into knowledge. For the forestry, agriculture, and mining sectors, the company provides advanced GIS analytics derived from remotely sensed data, including satellite imagery. Clients get ongoing decision support via Esri imagery services that are delivered through an online monitoring web app.
con terra | conterra.de
con terra transforms technological innovation into measurable success. When companies and organizations integrate con terra’s ArcGIS technology-based GeoIT solutions into business operations, they make their data decisive. This puts geoinformation to profi table use—making processes more effi cient, cost-effective, and transparent in the long term.
Outstanding Presence on ArcGIS Marketplace
Spatial.ai | spatial.ai
Spatial.ai’s geosocial dataset, which works in ArcGIS Business Analyst and ArcGIS Pro, organizes public, geotagged social media posts into 72 segments. Companies like TSCG, Subway, and P&G use this data to predict sales by identifying specifi c social behaviors within proximity of potential retail sites.
Geospark Analytics | geospark.io
With Geospark Analytics’s AI engine, users can mitigate risk and capitalize on opportunities by identifying and forecasting emerging global events. The Federal Emergency Management Agency (FEMA), for example, integrates these AI models into ArcGIS Online apps to aid with disaster readiness and response.
Substantial Opportunities for Growth with Esri
SymGEO | symgeo.com
Located near Washington, DC, SymGEO provides digital community engagement platforms and innovative GIS solutions to government, commercial, and nonprofi t organizations. Specializing in ArcGIS Hub, ArcGIS Online, data analytics, visual design, and focused messaging, SymGEO helps clients make well-informed decisions and communicate clearly with their audiences.
Equinox Geospatial, LLC | equinoxgeo.com
Equinox Geospatial partners with clients across the renewable energy sector to fully integrate their projects from development through construction and even into operations. Its specialties include implementing ArcGIS Enterprise and web-based mapping tools and building custom solutions for ArcGIS Survey123 and ArcGIS Field Maps.
Innovative Technical or Business Collaboration with Esri and Partners
Spatial Business Systems (SBS) | spatialbiz.com
SBS provides intelligent design solutions that help utility and telecommunications organizations leverage their investments in GIS, CAD, and enterprise systems. SBS utilizes ArcGIS Utility Network and other Esri technology to help its clients streamline workfl ows, improve design, and engage in building information modeling (BIM).
Quiet Professionals | quietprofessionalsllc.com
Cerebra Grey, from Quiet Professionals, is a cloud-based, open-source visualization and data management platform that integrates with ArcGIS Enterprise. Key capabilities include AI and machine learning, big data analysis, spatial analysis, data stream modeling, dynamic asset tracking, geofencing areas of interest, and event-oriented alerting.
33esri.com/arcnews ArcNews Summer 2021
Esri partners represent a rich ecosystem of organizations around the world that work together to amplify The Science of Where by extending ArcGIS technology and implementing it in distinct ways. Search for and discover partners, solutions, and services that meet your needs at esri.com/partners.

The Esri Startup Program gives emerging businesses anedge by helping them integrate spatial functionality intotheir products and services. Learn more about the programat developers.arcgis.com/startups.
edge by helping them integrate spatial functionality intotheir products and services. Learn more about the programat developers.arcgis.com/startups.
Accurate addressing is crucial to the rhythms of modern life. Whether dispatching basic deliveries, ensuring that service pro-viders perform the right work, or helping emergency responders save lives, there are times when it’s critical that people be found. But in an age when communities and industrial areas are con-tinually changing or expanding, accurate addressing, in some ways, has never been more complicated to achieve. It can be dif-fi cult to locate the right address, especially in large multiunit de-velopments such as apartment buildings, colleges, hospitals, and commercial complexes. And the time wasted trying to complete the last 100 feet of an address search can be costly. Th at’s why one innovative company, Esri startup partner One Hundred Feet (beans.ai), is using advanced geographic data to improve address accuracy at every step of the journey.
The Challenges of Complex-Level Address DataIn the United States, about a quarter of all recorded addresses con-tain multiple units. Th ose units sometimes have distinct spatial loca-tions, making them hard for people to fi nd once they arrive on-site. With most complex-level address data, one location point rep-resents many individual units that are spread over a considerable area—at times even in separate buildings. What’s more, depend-ing on what the adjacent road network looks like, some units aren’t even accessible from the offi cial address point. Th is lack of accurate subaddress geocoding creates signifi cant challenges. Delivery companies, for example, experience costly delays in the fi nal 100 feet of distribution if their drivers have to search for the correct address. Th is kind of time wasted is particularly challenging for gig-economy delivery drivers, who depend on effi ciency to ensure customer satisfaction and, ultimately, their ability to earn an income. Inaccurate unit-level addressing also aff ects utility and internet companies that are looking to provide precise services. And when emergency responders need to reach people quickly, they can’t af-ford to spend time searching large complexes for the correct unit.
Startup Improves Address Accuracy for Multiunit Complexes
Precise Location Data to Navigate Multiunit DevelopmentsOne Hundred Feet, a geospatial mapping company based in Palo Alto, California, is using precise location intelligence to create maps of addresses in complexes that include even structural fea-tures such as stairwells and entrances. Th e data that the compa-ny generates enables users to navigate to an exact destination in a housing, offi ce, or industrial complex, eliminating the problems that tend to occur in the last 100 feet of an address search. Th e startup built an adaptable framework that integrates ad-dress data drawn from diverse sources, including fi eld operations and machine learning data models. Its in-house tools, combined with GIS software made accessible through the Esri Startup Program, have allowed One Hundred Feet to move quickly to cre-ate detailed address data for complexes across the United States. “Becoming an Esri startup partner gave us access to a wide range of remarkable GIS tools and solutions,” said Nitin Gupta, cofounder and CEO of One Hundred Feet. “It’s really helping us tackle the toughest challenges in address mapping.” Employing massive fi eld operations using apps such as ArcGIS Survey123 and ArcGIS Collector, together with machine learn-ing models, One Hundred Feet is creating a wealth of data for apartments and multiunit dwellings at scale. Its data includes the following:• Unit geocodes—accurate locations of units in apartment
buildings and other types of complexes• Semantic waypoints, such as the locations of entrances,
elevators, and parking, to enrich unit context• Points of interest, including swimming pools and
community entrances• Above ground level (AGL) and above sea level (ASL) elevation By combining location and elevation data, One Hundred Feet’s datasets can be used in augmented and virtual reality simula-tions of apartment units and other features. Additionally, the
company is working on accurately mapping indoor elements to enhance indoor navigation. To accommodate the wide array of use cases for thissubaddress-level data, One Hundred Feet provides its data in sev-eral formats, including a hosted geocoding service, hosted feature services ( for units, entrances, points of interest, and more), refer-ence tables, and an enterprise geodatabase. Th is range of off erings allows users to easily integrate the company’s services into web apps, mobile apps, ArcGIS Pro, ArcGIS Online, and more.
A Positive Impact on Several IndustriesOne Hundred Feet has mapped more than eight million apartment units in the United States and now has what it believes to be the largest database of pinpoint multidwelling address locations in the country. With its unit locations presented as point features, the com-pany has generated a granular network dataset of high-quality sub-address data that is already having an impact on several industries. Delivery drivers, for instance, have reported reduced trip times of, on average, two to eight minutes per trip and a 40–50 percent decrease in failed deliveries. Both outcomes have a direct impact on logistics companies’ bottom line. Utility asset managers can now perform network tracing and modeling at the subaddress level. Th is helps them provide more accurate and timely services. And public safety agencies that use One Hundred Feet’s sub-address unit location data, along with maps that show key features such as entrances, parking locations, and stairwells, have reported reduced arrival times for emergency responders. According to the American Heart Association, when someone has a cardiac incident, every minute that passes without CPR decreases that person’s chance of survival by 7–10 percent. So the faster that emergency responders can fi nd people, the greater the number of lives that can be saved.
34 ArcNews Summer 2021 esri.com/arcnews
A map with typical addressing (left) has one location point that represents many individual units, whereas a map with subaddress-level data (right) identifi es the various units.
It can be diffi cult to locate the right address in large, multi-
unit developments like apartment buildings and
college campuses.

New Book Highlights Importance of Cartography in Achieving SDGsCartography is a highly effective tool for engaging with the Sustainable Development Goals (SDGs), the objectives set forth by the United Nations (UN) to ensure a more sus-tainable, equitable future. That’s why the International Cartographic Association (ICA) partnered with the UN to produce a valuable book—Mapping for a Sustainable World—for anyone interested in how mapping can contribute to understanding the SDGs. Recently released as an e-book (available at ow.ly/yQP950Eyex7), Mapping for a Sustainable World is a must read for those who are contributing to or acting on the SDGs.
The Relevance of CartographyA Cartographer’s Perspective
By Tim TrainorPresident, International Cartographic Association
About the Author
Tim Trainor is a part-time consultant to the UN and is the former chief geospatial scientist for the US Census Bureau. He is a member of the US Federal Geographic Data Committee’s National Geospatial Advisory Committee, has served as cochair for the UN Committee of Experts on Global Geospatial Information Management, and was the senior agency offi cial for geospatial information for the US Department of Commerce.
the fi rst line of this section affi rms, “Designing a map is not a trivial task”—a point that is evident throughout the book as the authors demonstrate all the decisions cartographers must make, many of which are not perfect or preferred because of the nature of the data be-ing mapped or other limitations. For example, how do cartographers proceed when data is either defi cient or missing? Identifying when data elements need attention is just one of the many ways that cartographic processes can inform SDG-related data management efforts. Different types of maps and diagrams are described in the third section, which em-phasizes how choosing the best depiction depends on the fi nal product’s purpose and intended use. For instance, the authors point out that making thematic maps of indica-tor data is a requirement for meeting the SDGs. They then use sample datasets to put together thematic map designs—from choropleth maps to dot density maps—to show the visual variations of particular map displays. The last section of the book focuses on map use environments, which involves looking at the characteristics of different audiences. Because the SDGs are critical to tackling the biggest challenges facing our world today, map content and design often need to speak to decision-makers, political leaders, and other infl uencers and champions of the varied topics within the 17 SDGs. A key focus of this section describes diverse user environments, which, due to technology, have opened up many new ways for users to make maps and for audiences to experience them. Anyone interested in learning more and seeing examples of mapping data associated with each SDG will fi nd the various visualizations presented in this section useful. The afterword closes the book with important summaries, observations, and lessons learned. As the authors explain, the data needed to achieve the SDGs is voluminous, com-plex, and disparate, yet the visualizations made possible through mapping offer compelling
At one level, it is a basic cartography textbook centered on the singular theme of the SDGs. But on another level, it shows how the processes involved in making maps, includ-ing managing data, can pinpoint areas that need more at-tention and, ultimately, help achieve the SDGs.
A Big Topic Revolving Around One ThemeMapping for a Sustainable World has myriad uses, from educating those who seek knowledge about the world to supporting experts in one of the many disciplines—cartography—that can be wielded to attain these goals. As Kyoung-Soo Eom, chief of the UN’s Geospatial Information Section, notes in the foreword to the book, “The United Nations Secretary-General called for mak-ing better use of data so that everyone, everywhere uses data for insight, impact, and integrity.” Cartography does this, he continues, by enabling people to analyze large amounts of data and visualize the results. According to the editors of Mapping for a Sustainable World, the book offers “guidelines for mapping geographic datasets related to the SDGs by introducing basic principles of map design and use, discussing established best practic-es and conventions, and explaining how different mapping techniques support understanding of the SDGs.” In a sense, then, this is a book about cartography, the various types of data used for mapping, and how one can create different maps—all using the SDGs as a com-mon theme. This single-purpose approach to teaching the fundamentals of cartography enriches the value of the practice by also fostering increased knowledge about the SDGs.
An Extensive Survey of CartographyMapping for a Sustainable World is divided into four sections: SDGs & Geospatial Data, Map Design Considerations, Maps & Diagrams, and Map Use Environments. The fi rst section describes the SDGs and goes over the characteristics of many SDG indica-tors, introducing readers to some of the types of data required for each indicator. This section also examines the geospatial information that’s needed to address the indicators’ intrinsic complexities. General information, defi nitions, and numerous examples give readers context about different kinds of data—such as geospatial, attribute, and statistical data—in an easy-to-understand style. Descriptions of how data is organized and made available for the SDGs is benefi cial for helping readers develop a fuller understanding about the nature of the data and how to apply it to cartographic applications. The value of cartography is made evident in a segment on visual style, which states that the “treatment of map design as an artistic pro-cess enables new ways to humanize the otherwise abstract statistical SDG indicator data.” Helpful links to resources and current efforts coordinated by various UN expert and working groups provide up-to-date information for anyone interested in more detail. The second section, on map design, introduces novice mapmakers to the assorted com-ponents, options, and decisions involved in creating an effective cartographic portrayal. As
options for seeing, informing, and ultimately understanding it all in a variety of ways, depending on one’s needs, interests, and intended use. Put simply, maps aid in making compli-cated numbers and messages easier to understand.
An Unfi nished, Ongoing ProcessMapping for a Sustainable World reveals, yet again, how maps and mapping are critical for solving real-world chal-lenges. The strength of this single-themed cartography book, with its focus on the SDGs, is in its examples. They show readers how to use several techniques to map a va-riety of data and encourage practitioners to apply similar approaches to data at the subnational level. This, however, often presents challenges—albeit also unique solutions. Cartographers are still limited by a lack of small-area statis-tics for many communities. Currently, most SDG mapping re-fl ects national-level datasets. To facilitate real change, there needs to be an increased focus on collecting data at ever more local levels to facilitate small-area mapping. Imagine the value of being able to visualize community-level data as it relates to national- and global-scale SDG indicators—and then making relevant decisions based on that. According to observations made by the book’s contribu-tors, it is clear that even though there is a plethora of data that supports the SDGs, this data is incomplete and/or incon-sistent. Additionally, the availability of SDG data and associ-ated mapping is not the end of the story, nor will that meet all the challenges presented by the SDGs. As the authors state,
“mapping the SDGs is much more of an ongoing process than a fi nal product.” Efforts in working to achieve the SDGs have begun to expose topics that need to be ex-plored at the global, national, and local levels to improve the world in which we live. In 2015, the 17 goals, targets, and indicators that were identifi ed as the SDGs were classifi ed as some of the most important global issues that need to be addressed. While their relevance has not lessened, other issues have come to the forefront—including racial disparity, social injustice, and climate change’s even wider-reaching effects—that can benefi t from similar attention. So please, seek out, explore, and use Mapping for a Sustainable World. As mentioned in a section on open access, the SDG datasets and cartographic guidance in this book are openly available. That means that more people than ever before can make maps in support of an economically, environmentally, and socially sustainable future.
Mapping for a Sustainable World is available as an e-book.
35esri.com/arcnews ArcNews Summer 2021

Take the Next Step! Earn Your Master’s in GIS Management
Salisbury University’s M.S. in GISM – now in its 14th year – is designed specically for the working GIS professional who seeks the management credentials needed for career advancement. Specialized Program n Combines management and technical proficiency n Customized for those in government, business and non-profits n Earn education credits toward GISP® certification Convenient and Accessible: 100% online n Earn degree full time in 13 months or part time in 2 years n Complete coursework on your schedule n Begin classes summer, fall or spring n Open to international students n Flexible scheduling for U.S. military,
including those serving overseas Value-Added Education n Degree frequently leads to substantial salary increases n Third-party billing options make employer payment easy n Flat tuition rate, regardless of location
www.salisbury.edu/msgism
APPLY NOW
Top Online Master’s Degrees Ranked #1 Online GIS Program Nationally
GRE Waived for 2021-22 Enrollment 100% Online
More Information: Dr. Stuart Hamilton [email protected]
SU_MS_GISM_ArcNEWS_Ad_32021_4C.qxp_Layout 1 3/16/21 2:43 PM Page 1
36 ArcNews Summer 2021 esri.com/arcnews
GIS Tutorial for Health for ArcGIS 10.8, Sixth EditionBy Kristen S. Kurland and Wilpen L. Gorr
Knowing how technology can improve health research and health-care management has never been more im-portant. A workbook for learning the basics of ArcGIS within a health context, GIS Tutorial for Health for ArcGIS 10.8, Sixth Edition, shows readers how to prepare, visu-alize, and analyze health data using ArcGIS Desktop. Readers get hands-on tutorials, mostly in ArcMap, that re-volve around concrete health-care scenarios. Th is edition also features an introduction to ArcGIS Online and ex-amples that employ international health data. Suitable for health management students, health-care managers, IT specialists, and researchers either as a computer lab text-book or for self study, GIS Tutorial for Health incorporates proven teaching methods, Your Turn sections, and home-work assignments. May/June 2021, 400 pp. E-book ISBN: 9781589486799 and paperback ISBN: 9781589486782.
Modern Policing Using ArcGIS ProBy Eric L. Piza and Jonas H. Baughman
Crime mapping and spatial analysis play a key role in day-to-day police functions. For crime analysts, Modern Policing Using ArcGIS Pro off ers an easy-to-use, hands-on guide to employing ArcGIS Pro for creating crime pre-vention strategies, measuring program implementation outputs, and conducting crime control evaluations. Th e book covers strategic and predictive analysis and work-fl ow automation, making it an essential read for anyone looking to enhance their agency’s operations. June/August 2021, 340 pp. E-book ISBN: 9781589485983 and paperback ISBN: 9781589485976.
Protecting the Places We Love:Conservation Strategies for EntrustedLands and ParksBy Breece Robertson
Bold conservation requires strategic action. In Protecting the Places We Love: Conservation Strategies for Entrusted Lands and Parks, veteran conservationist and geospa-tial designer Breece Robertson uses her experience and myriad resources to demonstrate how to act now for conservation and collaborate to achieve better results. Written for professionals and advocates at conservation organizations, park agencies, and small to midsize land trusts, Protecting the Places We Love includes strategies and methods for conservation, plus real-world examples from land protection organizations all over the globe. April/July 2021, 280 pp. E-book ISBN: 9781589486171 and paperback ISBN: 9781589486164.
Women and GIS, Volume 3: Champions of a Sustainable WorldBy Esri
Th e third volume of the popular Women and GIS series shows how 31 women and people of diverse genders in various science, technology, engineering, and mathemat-ics (STEM) fi elds discovered their passions; broke down barriers; and used maps, analysis, imagery, and GIS to advance their work and improve the world. Sharing their experiences from childhood and throughout their careers, the people featured in the book reveal the obstacles they have overcome, the knowledge they have gained along the way, and how tenacity and determination have helped them succeed. May/June 2021, 320 pp. E-book ISBN: 9781589486386 and paperback ISBN: 9781589486379.

For more information on all Esri Press publications, visit esri.com/esripress.
37esri.com/arcnews ArcNews Summer 2021
GIS for Science, Volume 3: Maps for Saving the PlanetEdited by Dawn J. Wright and Christian Harder
Th e natural world is on the line. More than ever, we need GIS-driven mapping to make scientifi cally informed de-cisions about the myriad forces aff ecting life on Earth. With a foreword by two-time Pulitzer Prize winnerE. O. Wilson, GIS for Science, Volume 3: Maps for Saving the Planet highlights real-world examples of how scien-tists are creating the maps that are saving the planet. Th e stories in this volume, which center on biodiversity, are written for professional scientists and anyone inter-ested in learning about how conservation and technol-ogy intersect. Contributors represent a cross section of scientists using ArcGIS software to bring to life the geo-graphic data they gather via remote sensing and on-site technologies. Th e ideas presented in GIS for Science and its companion website—including collaboration, spatial analysis, and science communication—can be applied across many disciplines and will hopefully inspire read-ers to join in the eff ort to save planet Earth while there’s still time. Fall 2021, 206 pp. E-book ISBN: 9781589486720 and paperback ISBN: 9781589486713.
GIS Jumpstart for Health ProfessionalsBy Kristen S. Kurland
GIS Jumpstart for Health Professionals is a concise work-book that introduces location analytics and ArcGIS technology to health professionals; medical students, residents, fellows, and researchers; nursing students; and others interested in health IT and informatics, health-care administration, and health policy. Tutorials demonstrate how to use things like web-based data and storytelling apps, while short video lectures in-cluded with the book improve learning outcomes. Focused lessons get health professionals up and run-ning with GIS quickly, so they can experience fi rsthand the value of location data, maps, and analytics. August/September 2021, 150 pp. E-book ISBN: 9781589486546 and paperback ISBN: 9781589486539.
Building a Smarter Community: GIS for State and Local GovernmentBy Christopher Thomas and Keith Mann
Continual advancements in smart technologies mean that the use of location intelligence in state and local governments is no longer just for GIS specialists. In Building a Smarter Community: GIS for State and Local Government, readers can see how government leaders at the city, county, and state levels apply GIS to decision-making in planning, operations, and civic inclusion. Th rough web apps, hub sites, dashboards, and other GIS solutions, state and local government professionals can not only develop a deeper understanding of the com-munities they serve but also improve urban plans and designs, increase operational eff ectiveness, and fi nd new ways to communicate with the public. May/June 2021, 120 pp. E-book ISBN: 9781589486850 and paperback ISBN: 9781589486843.
Esri Press has several new textbooks for the classroom. Ideal for teachers of spatial analysis, cartographic design, human geography, and more, these books are written for a variety of learning levels. Recommended titles include the following:
• Introduction to Human Geography Using ArcGIS Online• The Esri Guide to GIS Analysis, Volume 2:
Spatial Measurements and Statistics, Second Edition• Understanding Crime: Analyzing the Geography of Crime• Modern Policing Using ArcGIS Pro• Mapping by Design: A Guide to ArcGIS Maps for Adobe Creative Cloud• Resilient Communities Across Geographies
Esri also offers reference copies of its textbooks to professors, instructors, and university faculty members. Educators can submit a request at ow.ly/XvE250ERULm.
Understanding Crime: Analyzing the Geography of CrimeBy Spencer Chainey
Understanding Crime: Analyzing the Geography of Crimeis the fi rst book to fully explain how to truly analyze the geography of crime. With comprehensive content that includes both new and old techniques, the book shows readers how to examine the spatial and temporal patterns of crime, analyze crime with other spatial data, and evalu-ate the impact of geographically targeted interventions. Topics covered in the book include the following:• Hot spot analysis using microplace crime concentra-
tion and cluster analysis techniques• Temporal analysis, including methods of examining
the stability of crime patterns• Analyses of troublesome places, repeat and near-
repeat victimization, and persistent and emerging crime patterns
• Th e dispersion of crime concentration over time
Whether readers are new to analyzing the geographic patterns of crime or are experienced pros, they will benefi t from learning the techniques presented in Understanding Crime. November 2020/January 2021, 304 pp. E-book ISBN: 9781589485853 and paperback ISBN: 9781589485846.
The Locators: Adventure in South AmericaBy Kyle Bauer, Colleen Conner, and Wesley Jones
Th e Locators—a group of kids who solve problems using maps, technology, and spatial thinking—are determined to help those who need it. After crash-landing in the Amazon during their fi rst mission, Lucy, Oliver, and Moe the Parrot embark on an exciting adventure to fi nd and protect several endangered species in South America. Full of colorful illustrations; activities; and facts about endan-gered species, habitats, and more, Th e Locators: Adventure in South America keeps kids interested and makes learn-ing easy. At the end of the story, readers can get their own Locator member ID number and become part of the team! July 2021, 120 pp. E-book ISBN: 9781589485839 and paperback ISBN: 9781589484986.

New Training and Certification Offerings
Go to esri.com/training for more information. Find courses at esri.com/training/catalog/search. Keep up with Esri training news by subscribing to the newsletter (go.esri.com/training-news), visiting the Esri Training Matters blog (go.esri.com/trainingblog), connecting with the Esri Training community on the Esri Community(go.esri.com/training-community), and following @EsriTraining on Twitter.
Esri Corporate HeadquartersEsri Technical Supportesri.com/support
Esri Desktop Order Center and Software InformationTel.: 1-800-447-9778 (USA only)
Esri Productsesri.com/products
Esri Storeesri.com/store
ArcGIS Developersdevelopers.arcgis.com
Customer Care Portalmy.esri.com
Esri US Regional Offi cesesri.com/about-esri/usa
Esri Distributorsesri.com/distributors
TrainingNew Instructor-Led CoursesEsri’s instructor-led courses are developed in-house by subject matter experts who have a deep understanding of ArcGIS best practices and recom-mended workfl ows. All instructors have Esri Technical Certifi cations and CompTIA CTT+ certifi cation. Courses are currently off ered online, in real time (in multiple time zones), and as private training events. Do you need to ensure the accuracy of your authoritative GIS database? Are you looking to build the skills required to share actionable insight with decision-makers? If either of these scenarios speaks to you, check out the following courses:• Con� guring Branch Versioning in ArcGIS—For organizations that use ArcGIS Pro and ArcGIS Enterprise, branch versioning supports multiuser
editing workfl ows. Th is one-day class provides GIS database managers with the knowledge they need to create and edit branch versions of geoda-tabase feature classes, confi gure user roles and privileges, resolve editing confl icts, and support online and offl ine editing workfl ows.
• ArcGIS Enterprise: Analysis Work� ows for Intelligence—Th is course, which caters to analysts in the defense, intelligence, and public safety communities, goes over the mapping and analysis capabilities that are available through an organization’s ArcGIS Enterprise portal. Participants learn how to make web maps, analyze data, and share intelligence using ArcGIS apps and app builders.
Take an Esri MOOCMassive open online courses (MOOCs) are free and convenient and off er a great way to keep up-to-date with fast-changing technologies. Participants get access to ArcGIS software, and each course includes video lectures by Esri experts, hands-on software exercises, and interactive forums to engage with learners from around the world. Everyone who completes the course content receives a certifi cate of completion. View all the MOOCs Esri has available at esri.com/mooc. For a closer look at some upcoming courses, check out the following:• Imagery in Action, August 11–September 22: Th is brand-new course is for anyone who wants to learn more about imagery. Participants get to
explore cutting-edge imagery apps and the latest ArcGIS capabilities for working with imagery and remotely sensed data. Find out more about the course on page 3, and register at go.esri.com/imagery-mooc.
• Going Places with Spatial Analysis, September 22–November 3: Th is MOOC introduces spatial analysis concepts and workfl ows that are grounded in ArcGIS Online. Course exercises examine interesting, real-world examples in which conducting spatial analysis creates information that leads people to make better decisions. View course details and register at go.esri.com/going-places-mooc.
• Spatial Data Science: � e New Frontier in Analytics, October 27–December 8: Explore how to apply spatial data science to uncover hidden pat-terns, gain deeper insight into data, and improve predictive modeling. Participants will work with powerful ArcGIS analytical tools, use machine learning and deep learning techniques, and discover how to integrate popular open data science packages into their analyses. Learn more and register at go.esri.com/sds-mooc.
Certifi cationDid you know that the Esri Technical Certifi cation program off ers specialty exams that measure users’ knowledge and skills on focused topics, includ-ing ArcGIS API for Python and ArcGIS Online administration? Th ese shorter exams are popular with those who are interested in showcasing their ongoing commitment to professional development and excellence. Th e steps to attain a specialty certifi cation vary based on where you are in the eligibility framework.• Recently Certi� ed: Specialty exams are designed to stack on top of core desktop and enterprise exams. Together, these certifi cations showcase foun-
dational ArcGIS skills and knowledge as well as focused expertise. If you currently hold a core certifi cation at version 10.3 or higher (think 10.4, 10.5, and 19-001), then you are eligible to take a specialty exam right now. Simply determine which specialty topic applies to your skills and experience.
• Certi� ed, But Need to Update: Do you currently hold a certifi cation at a version older than 10.3? Although Esri Technical Certifi cations never expire, you will need to earn a later-version core certifi cation before you can achieve a specialty certifi cation. Finding the right core exam to support your specialty aspirations starts with choosing the one that best aligns with your ArcGIS knowledge and experience.
• Not Yet Certi� ed: Are you ready to embark on your certifi cation journey? Great! Start by reviewing the core exams to determine which one best matches your skills. Th en use the information and resources provided to prepare for the exam. Getting core certifi ed will solidify your foundational ArcGIS knowledge and put you just a step away from earning a specialty certifi cation.
Understanding eligibility requirements is an important part of validating the specifi c ArcGIS skills you have honed on the job or in school. Whether you’re just starting out or continuing your certifi cation journey, engaging in the right planning and preparation is key to achieving your goals. Get some inspiration for your GIS journey by viewing certifi cation success stories at go.esri.com/certifi cation-success. Also, explore the latest Esri Technical Certifi cation exams at esri.com/training/certifi cation, and join the Esri Technical Certifi cation groups on LinkedIn and the Esri Community.
38 ArcNews Summer 2021 esri.com/arcnews

QUICKLY. ACCURATELY. AFFORDABLY.
E S
Made in Canada
Visit Eos at the2021 VIRTUAL ESRI UC

Copyright © 2021 Esri. All rights reserved.
WE’RE BRINGING THE ESRI USER CONFERENCE TO YOU AGAINJuly 12–15, 2021 | Virtual Event
Join the global GIS community for our virtual Esri User Conference. Watch
the Plenary Session live, explore libraries of technical sessions and user
presentations, and engage with peers and Esri experts—all from
anywhere in the world. Registration is complimentary for users
current on maintenance and subscription, as well as
recent graduates and current students.
Sign up at esri.com/uc.
g1572862-esri-uc-2021-arcnews-0221.indd 1g1572862-esri-uc-2021-arcnews-0221.indd 1 2.24.21 11.26 a2.24.21 11.26 a
380 New York Street Redlands, CA 92373-8100
Presorted Standard
US Postage PaidEsri
178276
Copyright © 2021 Esri. All rights reserved. Printed in the United States of America.
Th e information contained in this document is the exclusive property of Esri or its licensors. Th is work is protected under United States copyright law and other international copyright treaties and conventions. No part of this work may be reproduced or transmitted in any form or by any means, electronic or mechanical, including photocopying and recording, or by any information storage or retrieval system, except as expressly permitted in writing by Esri. All requests should be sent to Attention: Director, Contracts and Legal Department, Esri, 380 New York Street, Redlands, CA 92373-8100 USA.
Th e information contained in this document is subject to change without notice.
@esri.com, 3D Analyst, ACORN, Address Coder, ADF, AML, ArcAtlas, ArcCAD, ArcCatalog, ArcCOGO, ArcData, ArcDoc, ArcEdit, ArcEditor, ArcEurope, ArcExplorer, ArcExpress, ArcGIS, arcgis.com, ArcGlobe, ArcGrid, ArcIMS, ARC/INFO, ArcInfo, ArcInfo Librarian, ArcLessons, ArcLocation, ArcLogistics, ArcMap, ArcNetwork, ArcNews, ArcObjects, ArcOpen, ArcPad, ArcPlot, ArcPress, ArcPy, ArcQuest, ArcReader, ArcScan, ArcScene, ArcSchool, ArcScripts, ArcSDE, ArcSdl, ArcSketch, ArcStorm, ArcSurvey, ArcTIN, ArcToolbox, ArcTools, ArcUSA, ArcUser, ArcView, ArcVoyager, ArcWatch, ArcWeb, ArcWorld, ArcXML, Atlas GIS, AtlasWare, Avenue, BAO, Business Analyst, Business Analyst Online, BusinessMAP, CityEngine, Community, Community Analyst, CommunityInfo, Community Maps, Companion, Database Integrator, DBI Kit, Drone2Map, EDN, Esri, esri.com, Esri—Team GIS, Esri—Th e GIS Company, Esri—Th e GIS People, Esri—Th e GIS Software Leader, Excalibur, FormEdit, GeoBIM, GeoCard, GeoCollector, GeoEnrichment, GeoEvent, Geographic Design System, Geography Matters, Geography Network, geographynetwork.com, Geoloqi, GeoPlanner, Geoportal, Geostatistical Analyst, Geotrigger, GIS by Esri, gis.com, GISData Server, GIS Day, gisday.com, GIS for Everyone, Hub, Indoors, Insights, JTX, MapIt, Maplex, MapObjects, MapStudio, ModelBuilder, MOLE, MPS—Atlas, Network Analyst, Ortho Maker, PLTS, Rent-a-Tech, Scene Viewer, SDE, See What Others Can’t, SML, Sourcebook·America, SpatiaLABS, Spatial Analyst, Spatial Database Engine, StoryMaps, Story Maps Basic, Story Maps Cascade, Story Maps Crowdsource, Story Maps Journal, Story Maps Series, Story Maps Shortlist, Story Maps Swipe and Spyglass, Story Maps Tour, StreetMap, SURE, Tapestry, the ARC/INFOlogo, the ArcGIS Explorer logo, the ArcGIS logo, the ArcPad logo, the Esri globe logo, the Esri Press logo, Th e Geographic Advantage, Th e Geographic Approach, the GIS Day logo, the MapIt logo, Th e Science of Where, Th e World’s Leading Desktop GIS, Velocity, Water Writes, and Your Personal Geographic Information System are trademarks, service marks, or registered marks of Esri in the United States, the European Community, or certain other jurisdictions.
Other companies and products or services mentioned herein may be trademarks, service marks, or registered marks of their respective mark owners.
Add a Subscription, Change Your Address, or UnsubscribeSubscribe, unsubscribe, or update information at esri.com/manage-subscriptions.Outside the United States, contact your local distributor.To request other publication services, see page 2.