Esri News - Esri Community
20
for Business Winter 2012/2013 Esri News Cloud GIS to the Rescue Cloud-based GIS from Esri helped the staff at Wall Street Network (WSN) keep producing online maps even after flooding from super- storm Sandy cut the power at the company’s offices at 110 Wall Street in New York City. Coincidentally—and fortunately—WSN, a technology solution provider based in New York City’s Financial District, had recently licensed ArcGIS and ArcGIS Online. The company uses the software to create solutions that help its clients—including risk manag- ers in organizations such as insurance and financial service companies—analyze and effectively present vast amounts of data to better understand the risks associated with a catastrophe such as Sandy. Kristina Mazelis, chief operating officer and chief financial officer at WSN, learned about flooding near the WSN offices from Sandy in the early evening of October 29, 2012. She received a notification from her data center monitoring equipment, indicating that the offices’ backup power supplies had been activated. “The loss of power we experienced, along with flooding, meant that the company would not be able to use [its] offices and had to instead rely on people to work from home,” Modeling and visualizing high winds can give risk managers a better idea of what may happen during and after a storm. Mazelis said. “We also had to support dozens of small and medium-sized business clients in the same situation. They needed us to deploy their business continuity and disaster response plans—making sure they, too, could continue to do business even in the face of such a devastating event.” WSN’s engineers located in New York and Michigan were already equipped with all the tools they needed to remotely monitor and manage their systems as well as provide live end-user support over the Internet. ArcGIS Online, a cloud-based platform, was one of those tools. Failsafe Business System WSN uses ArcGIS Online to create interactive maps and applications that can be quickly incorporated in risk managers’ workflows so that content created by one user can easily be shared with others. WSN’s clients can view and work with maps and perform analysis on smartphones, tablets, and notebooks, as well as the traditional office desktop. “Because Esri software is easy to use and incorporates all the data we need, we can build better products quickly and focus on solving busi- ness problems and delivering users new perspectives,” Mazelis said. “We can remove the complexities of working with spatial data and provide our clients with the extensive discovery, collaboration, and analysis tools they need in their businesses.” When Sandy hit on October 29, WSN engi- neers never missed a beat. They continued to create customized solutions for their clients using ArcGIS Online and other cloud-based software. “Because our development is in the cloud, our developers’ efforts have not been impacted,” Mazelis said. “If we hadn’t been continued on page 3
-
Upload
khangminh22 -
Category
Documents
-
view
6 -
download
0
Transcript of Esri News - Esri Community
for Business Winter 2012/2013
Esri News
Cloud GIS to the Rescue
Cloud-based GIS from Esri helped the staff at
Wall Street Network (WSN) keep producing
online maps even after flooding from super-
storm Sandy cut the power at the company’s
offices at 110 Wall Street in New York City.
Coincidentally—and fortunately—WSN, a
technology solution provider based in New
York City’s Financial District, had recently
licensed ArcGIS and ArcGIS Online. The
company uses the software to create solutions
that help its clients—including risk manag-
ers in organizations such as insurance and
financial service companies—analyze and
effectively present vast amounts of data to
better understand the risks associated with a
catastrophe such as Sandy.
Kristina Mazelis, chief operating officer and
chief financial officer at WSN, learned about
flooding near the WSN offices from Sandy in
the early evening of October 29, 2012. She
received a notification from her data center
monitoring equipment, indicating that the
offices’ backup power supplies had been
activated.
“The loss of power we experienced, along
with flooding, meant that the company would
not be able to use [its] offices and had to
instead rely on people to work from home,”
Modeling and visualizing high winds can give risk managers a better idea of what may happen during and after a storm.
Mazelis said. “We also had to support dozens
of small and medium-sized business clients
in the same situation. They needed us to
deploy their business continuity and disaster
response plans—making sure they, too, could
continue to do business even in the face of
such a devastating event.”
WSN’s engineers located in New York and
Michigan were already equipped with all the
tools they needed to remotely monitor and
manage their systems as well as provide live
end-user support over the Internet. ArcGIS
Online, a cloud-based platform, was one of
those tools.
Failsafe Business SystemWSN uses ArcGIS Online to create interactive
maps and applications that can be quickly
incorporated in risk managers’ workflows so
that content created by one user can easily
be shared with others. WSN’s clients can view
and work with maps and perform analysis on
smartphones, tablets, and notebooks, as well
as the traditional office desktop. “Because
Esri software is easy to use and incorporates
all the data we need, we can build better
products quickly and focus on solving busi-
ness problems and delivering users new
perspectives,” Mazelis said. “We can remove
the complexities of working with spatial data
and provide our clients with the extensive
discovery, collaboration, and analysis tools
they need in their businesses.”
When Sandy hit on October 29, WSN engi-
neers never missed a beat. They continued to
create customized solutions for their clients
using ArcGIS Online and other cloud-based
software. “Because our development is in the
cloud, our developers’ efforts have not been
impacted,” Mazelis said. “If we hadn’t been
continued on page 3
Winter 2012/2013
Esri News for Business is a publication of the Business Solutions Group of Esri.To contact the Esri Desktop Order Center, call 1-800-447-9778 within the United States or 909-793-2853, ext. 1-1235, outside the United States.
Visit the Esri website at esri.com.
View Esri News for Business online at esri.com/business or scan the code below with your smartphone.
Advertise with UsE-mail [email protected].
Submit ContentTo submit articles for publication in Esri News for Business, contact Karen Richardson at [email protected].
Manage Your SubscriptionTo update your mailing address or subscribe or unsubscribe to Esri publications, visit esri.com/publications.
Customers outside the US should contact an Esri distributor to manage their subscriptions.
For a directory of distributors, visit esri.com/distributors.
Circulation ServicesFor back issues, missed issues, and other circulation services, e-mail [email protected]; call 909-793-2853, extension 2778; or fax 909-798-0560.
2 Esri News for Business Winter 2012/2013
ContentsCover
1 Cloud GIS to the Rescue
Case Study
4 Born Again
7 Miele Turns to Esri to Drive Growth
7 A&P Enhances Real Estate Strategy with Esri GIS Software
Spotlight
8 Location Intelligence Is More Than a Map
Software
10 Esri Maps for Office Is Now Available
11 Business Sense
Data
12 Demographic State of the United States in 2012
Solution
14 Location Analytics: The Next Big Step in Business Analysis
16 Esri Online
Partner Spotlight
17 Location—The Tie That Binds
Special
18 Keeping Service Levels High and Costs Low
The information contained in this work is the exclusive property of Esri or its licensors. This work is protected under United States copyright law and other international copyright treaties and conventions. No part of this work may be reproduced or transmitted in any form or by any means, electronic or mechanical, including photocopying and recording, or by any information storage or retrieval system, except as expressly permitted in writing by Esri. All requests should be sent to Attention: Contracts and Legal Services Manager, Esri, 380 New York Street, Redlands, CA 92373-8100 USA.
The information contained in this work is subject to change without notice.
The Geographic Advantage, Esri, the Esri globe logo, 3D Analyst, ArcAtlas, ArcCatalog, ArcData, ArcDoc, ArcEditor, ArcExplorer, ArcGIS, the ArcGIS logo, ArcGlobe, ArcIMS, ARC/INFO, ArcInfo, ArcLogistics, ArcMap, ArcNetwork, ArcNews, ArcObjects, ArcPad, ArcPress, ArcReader, ArcSDE, ArcSurvey, ArcToolbox, ArcTools, ArcUser, ArcView, ArcVoyager, ArcWatch, ArcWeb, ArcWorld, ArcXML, Business Analyst Online, BusinessMAP, CommunityInfo, EDN, Geography Network, GIS Day, MapData, MapObjects, Maplex, MapStudio, ModelBuild-er, MOLE, NetEngine, RouteMAP, SDE, Sourcebook•America, StreetMap, Tapestry, @esri.com, esri.com, arcgis.com, geographynetwork.com, gis.com, and gisday.com are trademarks, service marks, or registered marks of Esri in the United States, the European Community, or certain other jurisdictions.
Other companies and products or services mentioned herein may be trademarks, service marks, or registered marks of their respective mark owners.
Copyright © 2013 Esri.All rights reserved. Printed in the United States of America.
equipped with Internet and cloud capabilities,
we would have been dead in the water—no
pun intended.”
Minimizing Risk before a Catastrophe HappensIn what may now seem like a bit of fore-
shadowing, WSN decided months before
the storm to create its first ArcGIS Online
application for the insurance industry. “We
chose this solution because we wanted to
provide customers with tools to easily view
and understand their policies by location to
see how they are affected by perils just like
superstorm Sandy,” Mazelis said.
The ability for WSN to host this solu-
tion means its clients don’t have to host it
themselves. “This is an important point,”
said Mazelis. “The small carriers that exist in
the US provide quite a bit of insurance in the
marketplace but lack the budget necessary
to run sophisticated catastrophe models.
We’ve lowered the costs for some by hosting
the data and platform. We are able to put
together these apps, so now carriers of any
size can subscribe to the solution without a
huge capital expense.”
After a disaster like Sandy, insurance compa-
nies try to quickly create models that calculate
its impact. With ArcGIS Online, WSN staff can
help these companies understand their true
risk instead of playing a guessing game.
Geography traditionally plays a part in this
process. Risk managers use a property’s loca-
tion to judge how far away it is from a hazard
such as a storm surge zone. With the help of
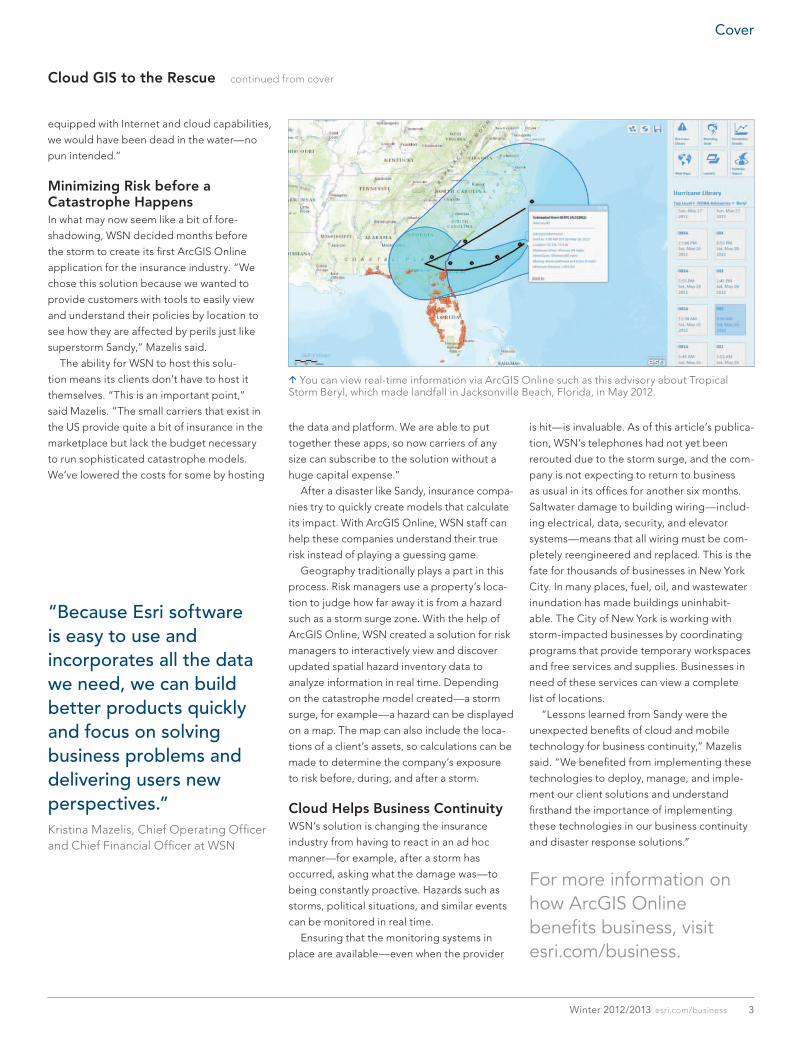
ArcGIS Online, WSN created a solution for risk
managers to interactively view and discover
updated spatial hazard inventory data to
analyze information in real time. Depending
on the catastrophe model created—a storm
surge, for example—a hazard can be displayed
on a map. The map can also include the loca-
tions of a client’s assets, so calculations can be
made to determine the company’s exposure
to risk before, during, and after a storm.
Cloud Helps Business ContinuityWSN’s solution is changing the insurance
industry from having to react in an ad hoc
manner—for example, after a storm has
occurred, asking what the damage was—to
being constantly proactive. Hazards such as
storms, political situations, and similar events
can be monitored in real time.
Ensuring that the monitoring systems in
place are available—even when the provider
is hit—is invaluable. As of this article’s publica-
tion, WSN’s telephones had not yet been
rerouted due to the storm surge, and the com-
pany is not expecting to return to business
as usual in its offices for another six months.
Saltwater damage to building wiring—includ-
ing electrical, data, security, and elevator
systems—means that all wiring must be com-
pletely reengineered and replaced. This is the
fate for thousands of businesses in New York
City. In many places, fuel, oil, and wastewater
inundation has made buildings uninhabit-
able. The City of New York is working with
storm-impacted businesses by coordinating
programs that provide temporary workspaces
and free services and supplies. Businesses in
need of these services can view a complete
list of locations.
“Lessons learned from Sandy were the
unexpected benefits of cloud and mobile
technology for business continuity,” Mazelis
said. “We benefited from implementing these
technologies to deploy, manage, and imple-
ment our client solutions and understand
firsthand the importance of implementing
these technologies in our business continuity
and disaster response solutions.”
For more information onhow ArcGIS Onlinebenefits business, visit esri.com/business.
You can view real-time information via ArcGIS Online such as this advisory about Tropical Storm Beryl, which made landfall in Jacksonville Beach, Florida, in May 2012.
3Winter 2012/2013 esri.com/business
Cloud GIS to the Rescue continued from cover
“Because Esri software is easy to use and incorporates all the data we need, we can build better products quickly and focus on solving business problems and delivering users new perspectives.”Kristina Mazelis, Chief Operating Officer and Chief Financial Officer at WSN
Cover
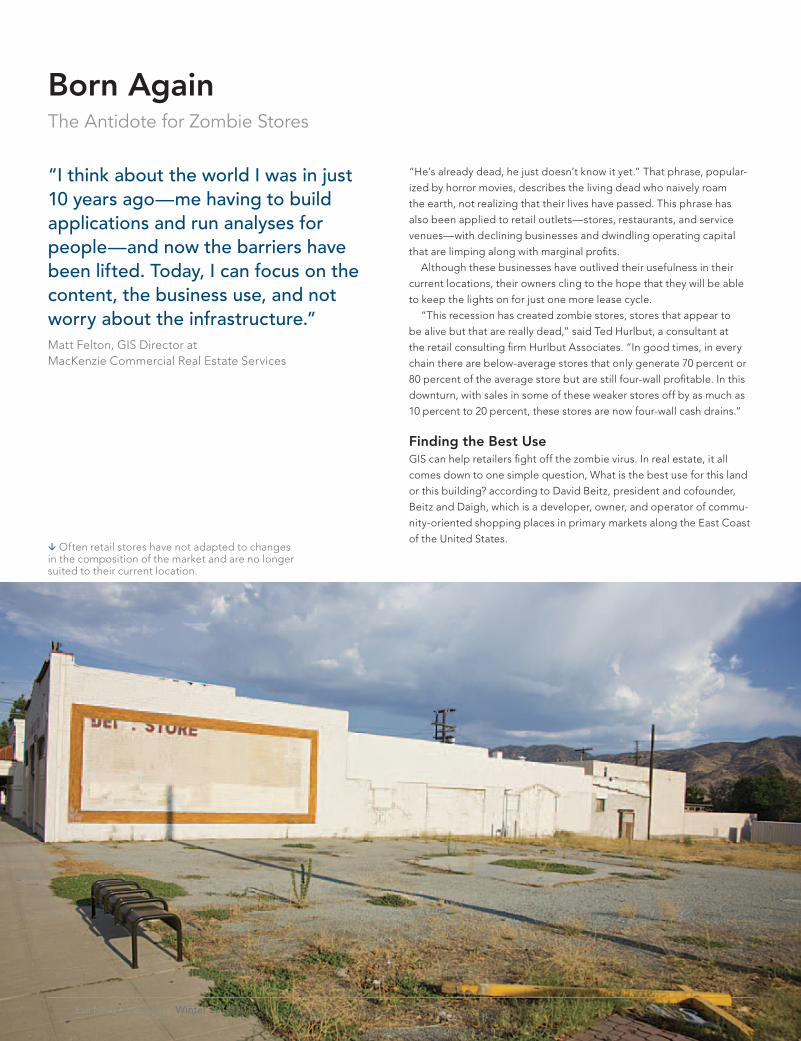
Born AgainThe Antidote for Zombie Stores
“He’s already dead, he just doesn’t know it yet.” That phrase, popular-
ized by horror movies, describes the living dead who naively roam
the earth, not realizing that their lives have passed. This phrase has
also been applied to retail outlets—stores, restaurants, and service
venues—with declining businesses and dwindling operating capital
that are limping along with marginal profits.
Although these businesses have outlived their usefulness in their
current locations, their owners cling to the hope that they will be able
to keep the lights on for just one more lease cycle.
“This recession has created zombie stores, stores that appear to
be alive but that are really dead,” said Ted Hurlbut, a consultant at
the retail consulting firm Hurlbut Associates. “In good times, in every
chain there are below-average stores that only generate 70 percent or
80 percent of the average store but are still four-wall profitable. In this
downturn, with sales in some of these weaker stores off by as much as
10 percent to 20 percent, these stores are now four-wall cash drains.”
Finding the Best UseGIS can help retailers fight off the zombie virus. In real estate, it all
comes down to one simple question, What is the best use for this land
or this building? according to David Beitz, president and cofounder,
Beitz and Daigh, which is a developer, owner, and operator of commu-
nity-oriented shopping places in primary markets along the East Coast
of the United States.
“I think about the world I was in just 10 years ago—me having to build applications and run analyses for people—and now the barriers have been lifted. Today, I can focus on the content, the business use, and not worry about the infrastructure.”Matt Felton, GIS Director at MacKenzie Commercial Real Estate Services
Often retail stores have not adapted to changes in the composition of the market and are no longer suited to their current location.
4 Esri News for Business Winter 2012/2013
“If a retail site is barely making it, GIS can be used proactively to spot
opportunities that could increase the value of the real estate,” Beitz
said. “Maybe that tired chain store location would make a great bank
branch. Or maybe it could be combined with several other parcels to
build an apartment complex. GIS gives us the tools to research locations
and find opportunities in order to make smarter real estate decisions.”
Matt Felton, GIS director at MacKenzie Commercial Real Estate
Services, agrees: “With GIS, we can help owners of vacant stores with
[information on] current, up-to-date market reach, customer profiles,
and market potential for zombie sites. Most of these zombie stores are
in markets that have dramatically changed quicker than the owners can
adapt. Often, these types of stores have outlived their nature in a given
market and should instead turn into something new, or they have been
completely outpositioned so that no other retailers will want to show
interest in the site.”
Connecting People to Real PlacesAs a shopping center company, EDENS uses GIS in the leasing process
to first identify potential retailers for a site, then uses the technology to
communicate to the retailer why EDENS leasing and development staff
think a site is good for it. “Studies show that the more time customers
spend at a shopping center, the more money they spend,” said Beitz.
“Great shopping places provide a variety of activities for people in the
community to connect through shopping, services, entertainment, and
restaurants.”
For example, when EDENS has a retail space or outparcel [a small lot
at the outer edge of a shopping center, reserved for later sale] that—if
developed as a restaurant—would complement one of their shopping
centers, staff look at a number of questions: • What other restaurants are nearby? • Who is not in this market but is successfully operating in other
similar markets? • How do the demographics of their target site line up with the
potential restaurant’s other locations?
• Is this a breakfast/lunch crowd or lunch/dinner crowd? • What is the daytime (employment) population? • Where are the schools nearby that help determine commuting patterns?
GIS helps EDENS to understand and communicate the answers
to these questions, determining if additional retail square footage
might be profitable for landlord and tenant. In addition to maps and
demographics, EDENS has also been using Esri Tapestry Segmentation
data to better understand its markets. Tapestry classifies US residential
neighborhoods into 65 unique market segments based on socioeco-
nomic and demographic characteristics. By understanding the life-
styles, life stages, likes, and wants of people, it is easier to understand
what may interest people living in specific neighborhoods.
“If a retail site is barely making it, GIS can be used proactively to spot opportunities that could increase the value of the real estate. Maybe that tired chain store location would make a great bank branch. Or maybe it could be combined with several other parcels to build an apartment complex. GIS gives us the tools to research locations and find opportunities in order to make smarter real estate decisions.”David Beitz, President and Cofounder, Beitz and Daigh
continued on page 6
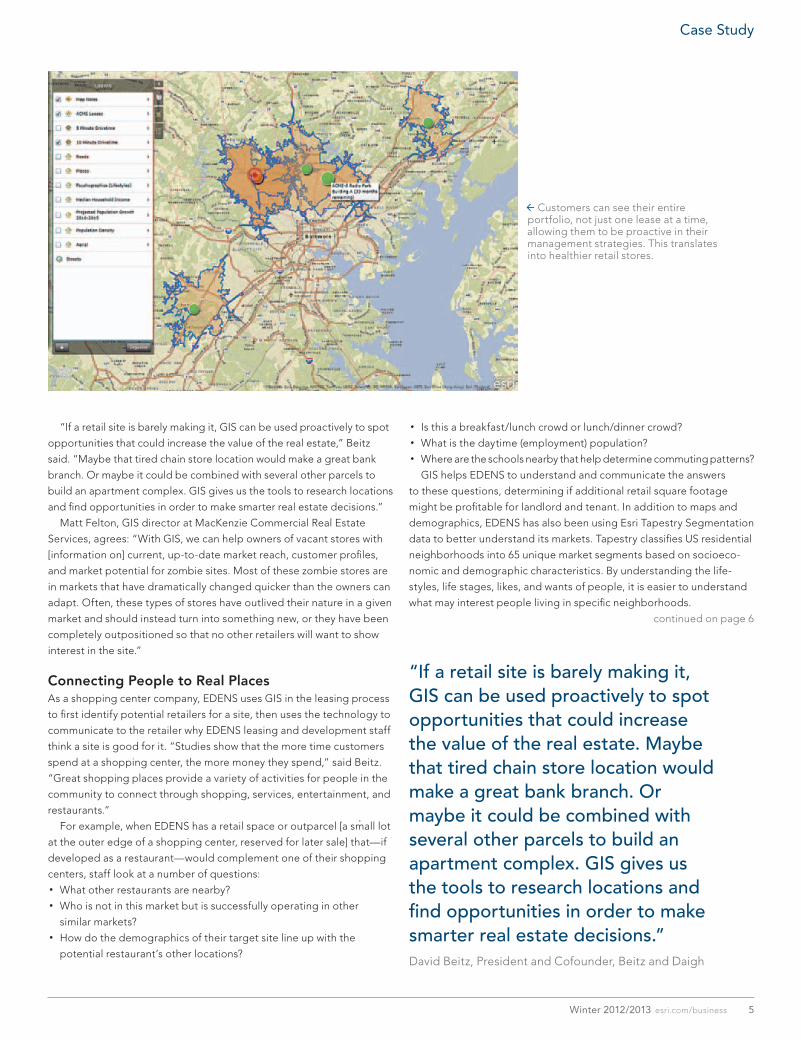
Customers can see their entire portfolio, not just one lease at a time, allowing them to be proactive in their management strategies. This translates into healthier retail stores.
5Winter 2012/2013 esri.com/business
Case Study
“Above and beyond demographics, the Tapestry data profiles the
households and gives us a deeper view of the consumers in the market,”
said Beitz. “I think the key here is to add retail space only if it accom-
plishes the larger goal of creating a dynamic shopping place where
people want to spend time. If you only look at retail square footage per
capita, then you will see that lots of areas are overretailed. The problem
is that often the retailer has not adapted to the changing composition
of the market. Tapestry gives us the consumer understanding of the
business equation to better capitalize on opportunities in the market.”
Secure Access to Information AnywhereMacKenzie brokers and retail partners can present retail centers in
the most positive light using an online dashboard created by Felton.
MapDash, built on Esri’s cloud-based solution ArcGIS Online for
Organizations provides designated staff with secure access to informa-
tion from anywhere.
When an anchor store leaves a mall, customer counts and sales often
decline. This triggers the material adverse change clause in most leases
and affects the rates other tenants pay. To counter this situation, Felton
and his team use MapDash to define the current customer dynamics
in trade areas and quantify the market opportunity, depth of demand,
and spending capability of consumers in the area. With this informa-
tion, MacKenzie staff can match opportunities with tenant prospects.
“I think about the world I was in just 10 years ago—me having to
build applications and run analyses for people—and now the barriers
have been lifted,” said Felton. “Today, I can focus on the content, the
business use, and not worry about the infrastructure.”
From Reactive to ProactiveMapDash helps the brokers communicate lease information to their
customers. The dashboard helps organizations that hold between
10 and 40 leases in a region access all related information, identify
where properties are located, and know when leases on those proper-
ties should be renewed.
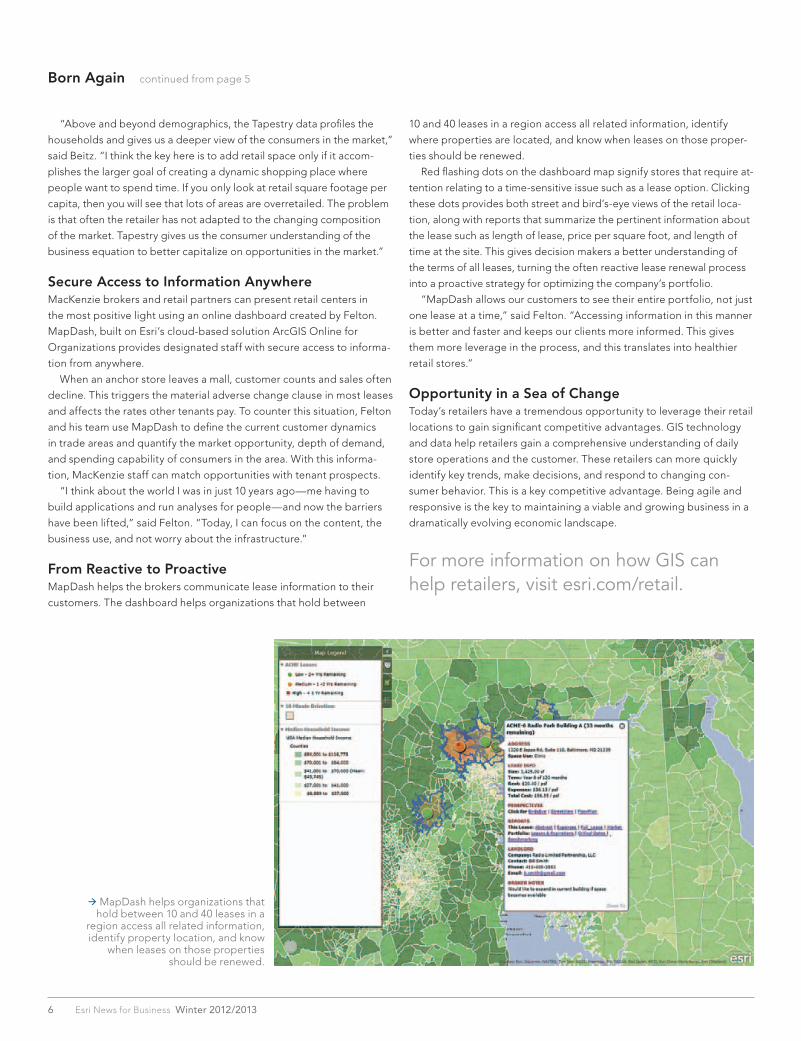
Red flashing dots on the dashboard map signify stores that require at-
tention relating to a time-sensitive issue such as a lease option. Clicking
these dots provides both street and bird’s-eye views of the retail loca-
tion, along with reports that summarize the pertinent information about
the lease such as length of lease, price per square foot, and length of
time at the site. This gives decision makers a better understanding of
the terms of all leases, turning the often reactive lease renewal process
into a proactive strategy for optimizing the company’s portfolio.
“MapDash allows our customers to see their entire portfolio, not just
one lease at a time,” said Felton. “Accessing information in this manner
is better and faster and keeps our clients more informed. This gives
them more leverage in the process, and this translates into healthier
retail stores.”
Opportunity in a Sea of ChangeToday’s retailers have a tremendous opportunity to leverage their retail
locations to gain significant competitive advantages. GIS technology
and data help retailers gain a comprehensive understanding of daily
store operations and the customer. These retailers can more quickly
identify key trends, make decisions, and respond to changing con-
sumer behavior. This is a key competitive advantage. Being agile and
responsive is the key to maintaining a viable and growing business in a
dramatically evolving economic landscape.
For more information on how GIS canhelp retailers, visit esri.com/retail.
MapDash helps organizations that hold between 10 and 40 leases in a
region access all related information, identify property location, and know
when leases on those properties should be renewed.
6 Esri News for Business Winter 2012/2013
Born Again continued from page 5
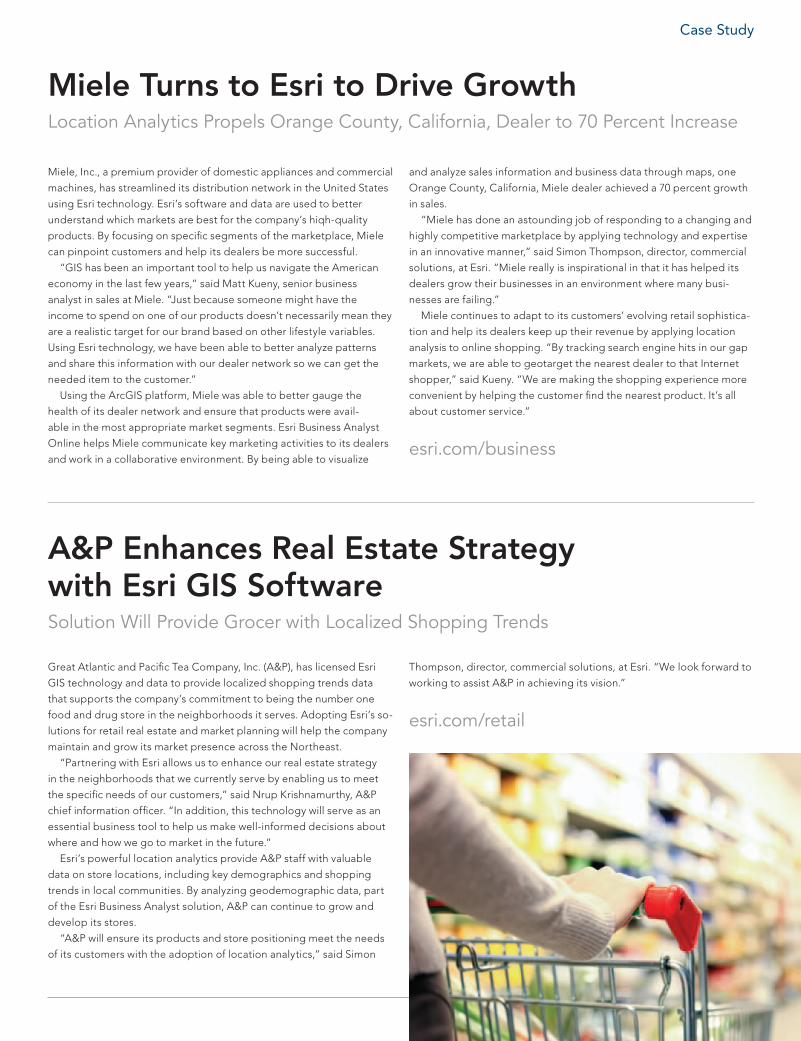
A&P Enhances Real Estate Strategy with Esri GIS SoftwareSolution Will Provide Grocer with Localized Shopping Trends
Great Atlantic and Pacific Tea Company, Inc. (A&P), has licensed Esri
GIS technology and data to provide localized shopping trends data
that supports the company’s commitment to being the number one
food and drug store in the neighborhoods it serves. Adopting Esri’s so-
lutions for retail real estate and market planning will help the company
maintain and grow its market presence across the Northeast.
“Partnering with Esri allows us to enhance our real estate strategy
in the neighborhoods that we currently serve by enabling us to meet
the specific needs of our customers,” said Nrup Krishnamurthy, A&P
chief information officer. “In addition, this technology will serve as an
essential business tool to help us make well-informed decisions about
where and how we go to market in the future.”
Esri’s powerful location analytics provide A&P staff with valuable
data on store locations, including key demographics and shopping
trends in local communities. By analyzing geodemographic data, part
of the Esri Business Analyst solution, A&P can continue to grow and
develop its stores.
“A&P will ensure its products and store positioning meet the needs
of its customers with the adoption of location analytics,” said Simon
Miele Turns to Esri to Drive GrowthLocation Analytics Propels Orange County, California, Dealer to 70 Percent Increase
Miele, Inc., a premium provider of domestic appliances and commercial
machines, has streamlined its distribution network in the United States
using Esri technology. Esri’s software and data are used to better
understand which markets are best for the company’s hiqh-quality
products. By focusing on specific segments of the marketplace, Miele
can pinpoint customers and help its dealers be more successful.
“GIS has been an important tool to help us navigate the American
economy in the last few years,” said Matt Kueny, senior business
analyst in sales at Miele. “Just because someone might have the
income to spend on one of our products doesn’t necessarily mean they
are a realistic target for our brand based on other lifestyle variables.
Using Esri technology, we have been able to better analyze patterns
and share this information with our dealer network so we can get the
needed item to the customer.”
Using the ArcGIS platform, Miele was able to better gauge the
health of its dealer network and ensure that products were avail-
able in the most appropriate market segments. Esri Business Analyst
Online helps Miele communicate key marketing activities to its dealers
and work in a collaborative environment. By being able to visualize
and analyze sales information and business data through maps, one
Orange County, California, Miele dealer achieved a 70 percent growth
in sales.
“Miele has done an astounding job of responding to a changing and
highly competitive marketplace by applying technology and expertise
in an innovative manner,” said Simon Thompson, director, commercial
solutions, at Esri. “Miele really is inspirational in that it has helped its
dealers grow their businesses in an environment where many busi-
nesses are failing.”
Miele continues to adapt to its customers’ evolving retail sophistica-
tion and help its dealers keep up their revenue by applying location
analysis to online shopping. “By tracking search engine hits in our gap
markets, we are able to geotarget the nearest dealer to that Internet
shopper,” said Kueny. “We are making the shopping experience more
convenient by helping the customer find the nearest product. It’s all
about customer service.”
esri.com/business
Case Study
Thompson, director, commercial solutions, at Esri. “We look forward to
working to assist A&P in achieving its vision.”
esri.com/retail
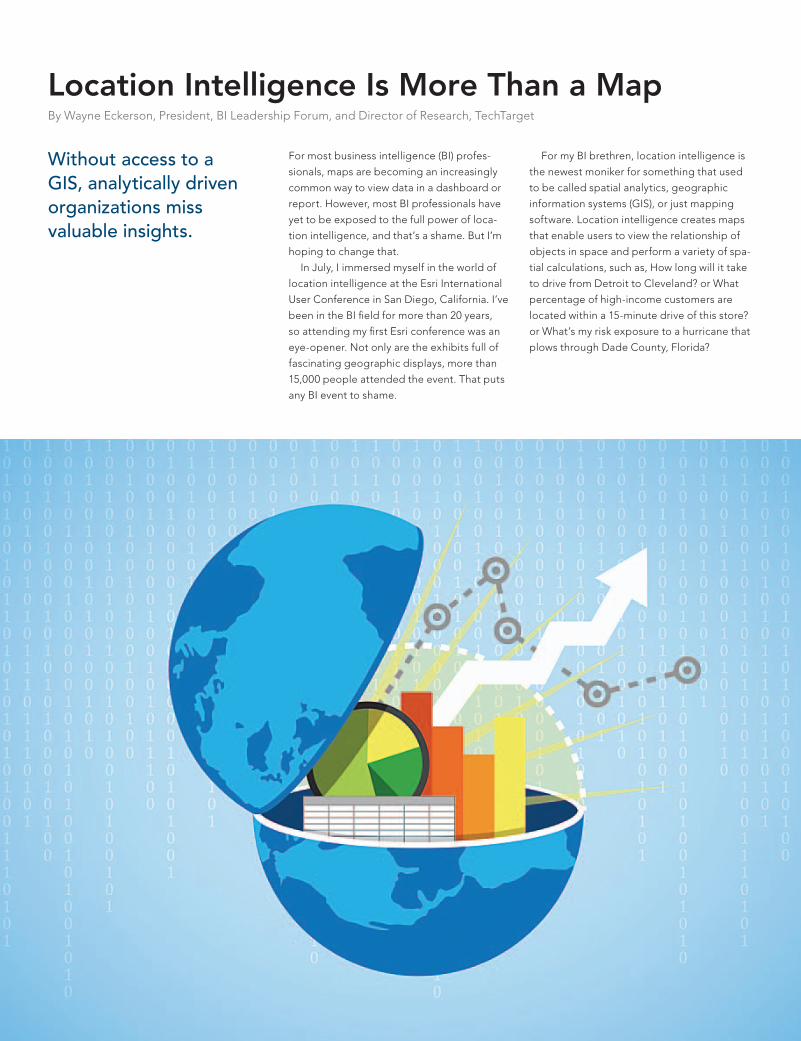
Location Intelligence Is More Than a MapBy Wayne Eckerson, President, BI Leadership Forum, and Director of Research, TechTarget
For my BI brethren, location intelligence is
the newest moniker for something that used
to be called spatial analytics, geographic
information systems (GIS), or just mapping
software. Location intelligence creates maps
that enable users to view the relationship of
objects in space and perform a variety of spa-
tial calculations, such as, How long will it take
to drive from Detroit to Cleveland? or What
percentage of high-income customers are
located within a 15-minute drive of this store?
or What’s my risk exposure to a hurricane that
plows through Dade County, Florida?
For most business intelligence (BI) profes-
sionals, maps are becoming an increasingly
common way to view data in a dashboard or
report. However, most BI professionals have
yet to be exposed to the full power of loca-
tion intelligence, and that’s a shame. But I’m
hoping to change that.
In July, I immersed myself in the world of
location intelligence at the Esri International
User Conference in San Diego, California. I’ve
been in the BI field for more than 20 years,
so attending my first Esri conference was an
eye-opener. Not only are the exhibits full of
fascinating geographic displays, more than
15,000 people attended the event. That puts
any BI event to shame.
Without access to a GIS, analytically driven organizations miss valuable insights.
Parallel WorldsLike business intelligence, location intelligence
supports analysis and decision making. But for
the past 20 years, these two data-centric
disciplines have forged independent but
parallel paths. Only now are they beginning to
converge.
After my presentation at the conference,
one attendee asked, “Why hasn’t location
intelligence taken off in the business intel-
ligence community?” My first response was
that a majority of BI shops have been con-
sumed trying to get adoption for basic report-
ing and analysis applications and only now are
ready to incorporate new capabilities such as
location intelligence, predictive analytics, and
unstructured data.
But later I realized that the BI community
has already embraced location intelligence,
at least the mapping part of it. During the
past 10 years, most BI professionals have
spent significant time learning how to display
the shape and content of data in visual form,
using charts and graphics, including maps.
Meanwhile, BI vendors have invested heavily
in beefing up the visualization capabilities of
their tools and adding new charting compo-
nents, including maps. To BI professionals,
maps are now an integral charting component
of any BI portfolio.
The Intelligence in GISBut location intelligence is more than just a
map with dots on it. Location intelligence is a
full-fledged analytical system. These so-called
geographic information systems specialize in
storing and manipulating spatial data, which
consists of points, lines, and polygons plotted
as coordinates in space.
Each spatial object can be imbued with
various properties or rules that govern its
behavior. For example, a road (i.e., a line) has
a surface condition and a speed limit, and the
only points that can be located in the middle
of the road are traffic lights. Spatial engines
can then run complex calculations against
coordinate data to determine relationships
among spatial objects, such as the driving
distance between two cities or the shadows
that a proposed skyscraper would cast on sur-
rounding buildings or RFID tagged products
that move beyond a specific area (e.g.,
geofencing). In essence, a GIS is an object-
oriented analytical system that models things
in space.
So without access to a GIS, analytically
driven organizations miss valuable insights.
Until recently, most spatial analysis was con-
ducted by a handful of GIS specialists working
in the bowels of a company who imported
business data into GIS to create spatial
models. But now, spatial insights can be deliv-
ered to all users via GIS-enabled applications,
including BI, ERP, and CRM. And GIS provid-
ers, like Esri, can publish GIS applications to
the cloud, allowing users to access interactive
maps via web browsers.
Integration with Business IntelligenceIn the BI world, the first step toward con-
verging location and business intelligence
is plotting business metrics on a map. Like
other types of visualization, maps bring data
to life and make it easier for business users
to identify the significant trends and issues
contained in most reports and dashboards.
But location intelligence goes beyond basic
geographic displays; it delivers interactive
spatial models that correlate business data on
a three-dimensional surface.
For example, BI users might use interactive
maps to sift through hundreds of variables to
optimize the siting of new stores, dealerships,
branch offices, factories, drill heads, or pipe-
lines. Or they could use maps to view how the
buying habits and demographics of custom-
ers located around stores have changed over
time. Facilities managers could use interac-
tive maps to plot the optimal evacuation
routes from any point in an office building or
estimate the physical and financial impact of a
bomb that explodes outside their building at
various distances. Insurance agents could use
GIS-enabled BI tools to simulate what they
would have to pay policyholders whose homes
are damaged by a hurricane, based on the
wind speed and path of the oncoming storm.
Finally, the explosion of mobile devices,
such as smartphones and tablet computers,
places a premium on integration of business
and location intelligence. For example, mobile
dashboards will notify plant managers about
the status of poorly performing machines as
they walk a factory floor or alert store manag-
ers about stock-outs as they move through
the aisles. Mobile dashboards will deliver to
executives and salespeople a 360-degree
view of a customer as they approach the
customer’s site. The use cases are endless,
and organizations will discover new ones once
they GIS enable their BI applications.
Integration OptionsIntegrating BI and GIS applications is not as
hard as it once was. GIS vendors now offer rich
REST-based web services APIs to integrate
GIS with other applications. And some, like
Esri, now offer cloud-based GIS services so
you don’t even need to own a GIS to benefit
from GIS functionality.
As a result, BI vendors are integrating
greater GIS functionality into their applica-
tions. A decade ago, BI vendors delivered
static, graphic maps that customers could
overlay with dots. Many now embed GIS
shapefiles that enable BI users to plot busi-
ness data on standard baseline maps and
support basic GIS functionality such as zoom,
hover, drill, and synchronized filtering. And
a few interface directly with GIS, allowing BI
report authors to easily add custom maps
and more sophisticated GIS functionality to
reports and dashboards without having to
write code.
SummaryAs BI shops seek to infuse reports and
dashboards with better visualization and more
analytics, it’s imperative that they explore
the rich opportunities afforded by location
intelligence. GIS integration is a simple way
to add more robust analytical capabilities to
run-of-the-mill reports and dashboards.
9Winter 2012/2013 esri.com/business
Spotlight
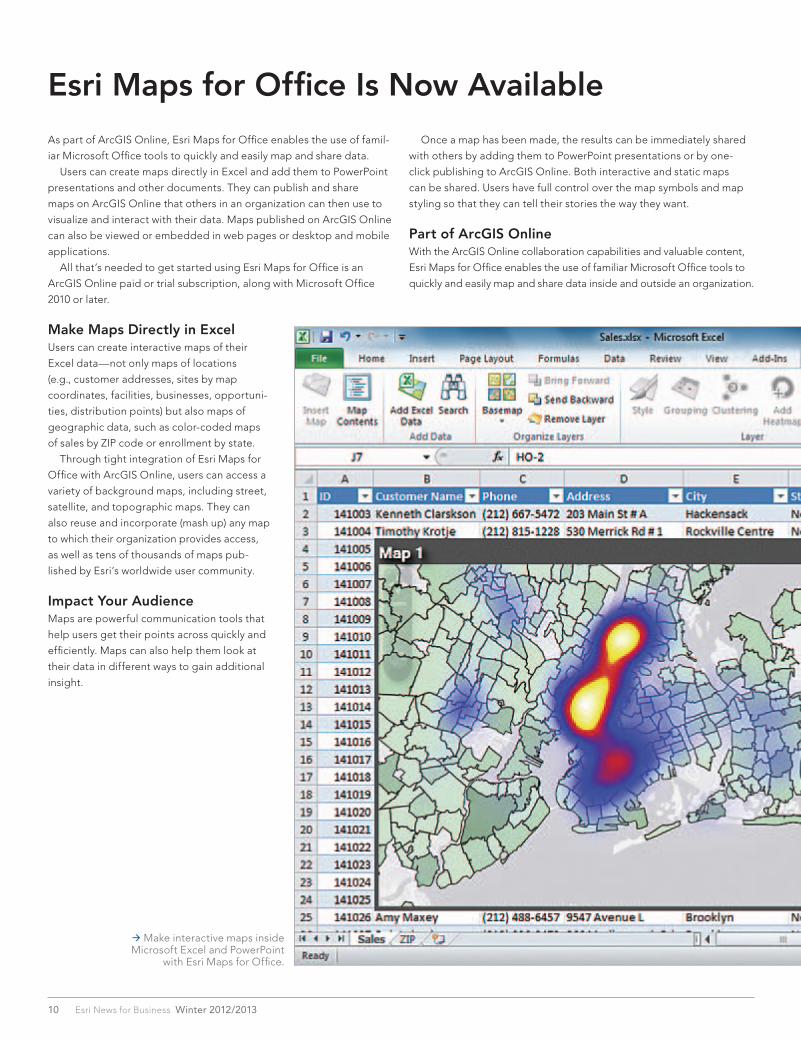
As part of ArcGIS Online, Esri Maps for Office enables the use of famil-
iar Microsoft Office tools to quickly and easily map and share data.
Users can create maps directly in Excel and add them to PowerPoint
presentations and other documents. They can publish and share
maps on ArcGIS Online that others in an organization can then use to
visualize and interact with their data. Maps published on ArcGIS Online
can also be viewed or embedded in web pages or desktop and mobile
applications.
All that’s needed to get started using Esri Maps for Office is an
ArcGIS Online paid or trial subscription, along with Microsoft Office
2010 or later.
Make Maps Directly in ExcelUsers can create interactive maps of their
Excel data—not only maps of locations
(e.g., customer addresses, sites by map
coordinates, facilities, businesses, opportuni-
ties, distribution points) but also maps of
geographic data, such as color-coded maps
of sales by ZIP code or enrollment by state.
Through tight integration of Esri Maps for
Office with ArcGIS Online, users can access a
variety of background maps, including street,
satellite, and topographic maps. They can
also reuse and incorporate (mash up) any map
to which their organization provides access,
as well as tens of thousands of maps pub-
lished by Esri’s worldwide user community.
Impact Your AudienceMaps are powerful communication tools that
help users get their points across quickly and
efficiently. Maps can also help them look at
their data in different ways to gain additional
insight.
Esri Maps for Office Is Now Available
Once a map has been made, the results can be immediately shared
with others by adding them to PowerPoint presentations or by one-
click publishing to ArcGIS Online. Both interactive and static maps
can be shared. Users have full control over the map symbols and map
styling so that they can tell their stories the way they want.
Part of ArcGIS OnlineWith the ArcGIS Online collaboration capabilities and valuable content,
Esri Maps for Office enables the use of familiar Microsoft Office tools to
quickly and easily map and share data inside and outside an organization.
Make interactive maps inside Microsoft Excel and PowerPoint
with Esri Maps for Office.
10 Esri News for Business Winter 2012/2013
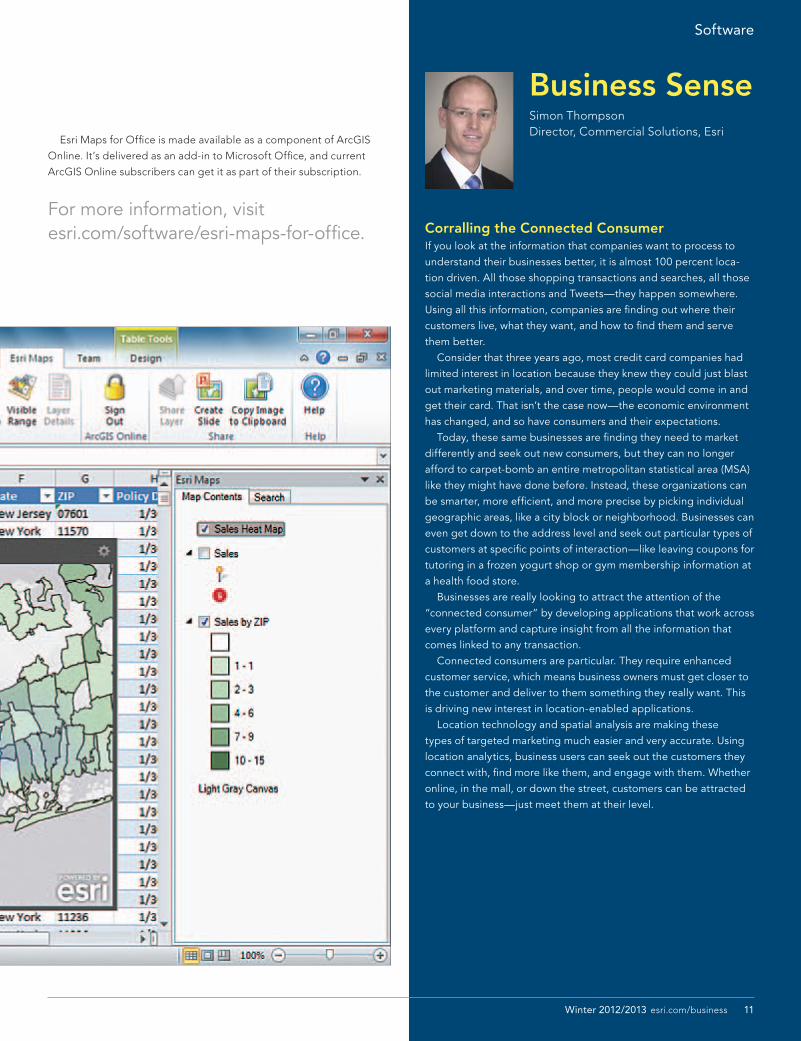
Esri Maps for Office is made available as a component of ArcGIS
Online. It’s delivered as an add-in to Microsoft Office, and current
ArcGIS Online subscribers can get it as part of their subscription.
For more information, visit esri.com/software/esri-maps-for-office.
11Winter 2012/2013 esri.com/business
Business SenseSimon ThompsonDirector, Commercial Solutions, Esri
Corralling the Connected ConsumerIf you look at the information that companies want to process to understand their businesses better, it is almost 100 percent loca-tion driven. All those shopping transactions and searches, all those social media interactions and Tweets—they happen somewhere. Using all this information, companies are finding out where their customers live, what they want, and how to find them and serve them better. Consider that three years ago, most credit card companies had limited interest in location because they knew they could just blast out marketing materials, and over time, people would come in and get their card. That isn’t the case now—the economic environment has changed, and so have consumers and their expectations. Today, these same businesses are finding they need to market differently and seek out new consumers, but they can no longer afford to carpet-bomb an entire metropolitan statistical area (MSA) like they might have done before. Instead, these organizations can be smarter, more efficient, and more precise by picking individual geographic areas, like a city block or neighborhood. Businesses can even get down to the address level and seek out particular types of customers at specific points of interaction—like leaving coupons for tutoring in a frozen yogurt shop or gym membership information at a health food store. Businesses are really looking to attract the attention of the “connected consumer” by developing applications that work across every platform and capture insight from all the information that comes linked to any transaction. Connected consumers are particular. They require enhanced customer service, which means business owners must get closer to the customer and deliver to them something they really want. This is driving new interest in location-enabled applications. Location technology and spatial analysis are making these types of targeted marketing much easier and very accurate. Using location analytics, business users can seek out the customers they connect with, find more like them, and engage with them. Whether online, in the mall, or down the street, customers can be attracted to your business—just meet them at their level.
Software
Because the economic recovery is proceeding
much more slowly than expected, companies
are still trying to attract consumers who
are reluctant to spend as they continue to
pay down debt. Although some positive
signs, such as modest increases in consumer
spending and slightly higher sales of existing
homes, are noted in a few areas, effects of the
recession are still impacting overall economic
recovery. The US population also continues to
change in terms of more diversity and differ-
ent family types and households.
Population Diversity and ChangeIn 2012, the US population was 313 million.
Growing racial/ethnic diversity continued to
produce striking changes in the population.
This is evident from use of Esri’s proprietary
Diversity Index, which summarizes racial
and ethnic diversity in an area. This measure
shows the likelihood that two people, chosen
at random from the same area, belong to
different races or ethnic groups. The index
ranges from 0 (no diversity) to 100 (complete
diversity). Esri’s Diversity Index for the United
States rose from 60.6 in 2010 to 61.4 in 2012,
with a forecast to 63.8 in five years.
The composition of America’s 118 million
households is also becoming more diverse.
Although husband-wife families remain the
dominant household type, their share of all
households continues to slip—from
52 percent in 2000 to 48 percent in 2010. From
2000 to 2010, the real increase in family house-
holds was in single-parent families, up by
22 percent, and multigenerational house-
holds, up by 30 percent. Husband-wife
families increased by less than 4 percent in
10 years, and husband-wife families with
children declined.
All family households increased by 8 percent
from 2000 to 2010; nonfamily households, by
16 percent. The fastest-growing nonfamily
households, however, are unmarried part-
ners—opposite sex partners by 40 percent
and same-sex partners by 52 percent from
2000 to 2010. At 80 percent, single-person
households retain the highest proportion of
nonfamily households; however, the increase
was less than 15 percent in the past decade.
in workers. The total number of unemployed
shrank from 16.7 million to 14.9 million people.
The US rate of unemployment (the percentage
of unemployed people within the civilian labor
force) declined. The US labor force participa-
tion rate (civilians employed, plus the unem-
ployed as a percentage of the US population
aged 16 years and older) also declined by less
than 1 percent to 63.4 percent. Some of the
reduction in unemployment results from both
increasing employment and workers leaving
the labor force.
Impact of These Changes on BusinessChange is the new constant in these challeng-
ing times. Just being “better, cheaper, faster”
Demographic State of the United States in 2012Companies Still Struggle to Attract Consumers
Nontraditional families are the types of house-
holds that are growing.
HousingAlthough positive signs are noted in areas
less affected by the housing boom/bust
and employment decline, recovery of the
overall housing market remains slow. The 2011
homeownership rate of 64 percent remained
the same for 2012. Since 2010, housing growth
has been sluggish. Fewer than 900,000 units
were added annually, down from 2 million an-
nually at the peak of the housing boom. Many
markets are still coping with an excess of
vacant, for sale, and foreclosed properties left
over from the collapse of the housing market
and the Great Recession. Almost one in four
counties shows no growth or a loss of housing
from Census 2010 to 2012. Significant housing
losses also occurred due to natural disasters
in the past year, such as the wildfire in Bastrop
County, Texas, and tornadoes in Indiana and
Missouri. Recovery is happening at different
rates across the nation. In many areas, no
new housing units are being built; however, in
other places, new construction is back in full
swing, and demand is high.
Diverse reasons are causing housing growth
in certain metropolitan statistical areas (MSA).
The military presence is driving housing
growth in the Jacksonville, NC; Killeen-
Temple-Fort Hood, TX; and Manhattan, KS
MSAs. Growth is also apparent in Morgantown,
WV; Auburn-Opelika, AL; Logan UT-ID; and
Manhattan, KS—large college towns with
good climates and growing economies.
Kennewick-Pasco-Richland, WA is a retirement
hot spot—especially for Californians. Growth
also continues in the Austin, TX; Raleigh-Cary,
NC; and Myrtle Beach, SC MSAs.
EmploymentThe US labor force is emerging from the most
severe contraction since World War II. Since
2010, the economy added nearly 3 million
jobs, raising the total work force to 142 million.
This growth has been geographically broad,
with every region and division adding people
to payrolls. Only Alabama, Arizona, Hawaii,
and Rhode Island registered a net reduction
HAWAII
ALASKA
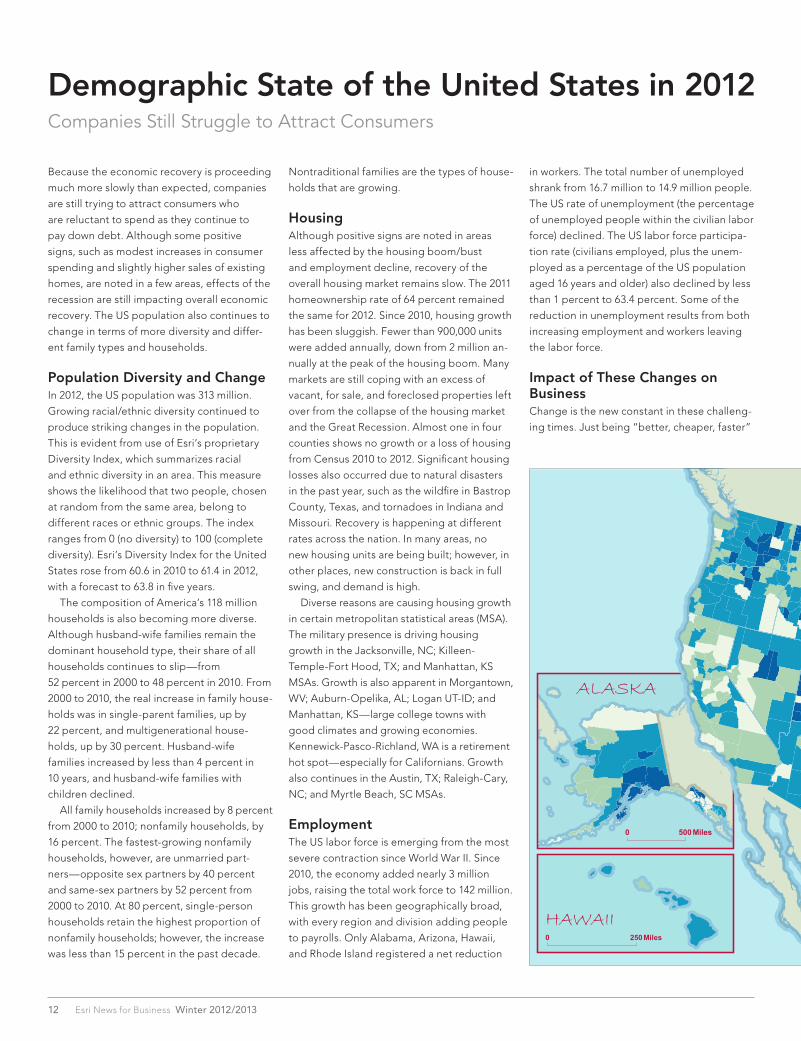
Far Above Average (1.26% or More)
Above Average (.64% to 1.25%)
Below Average (.23% to .63%)
Far Below Average (.22% or Less)
Source: Esri 2012 UpdatedDemographics
2010-2012 Population Growth Rate
0 250 500 Miles0 250 Miles
0 500 Miles
12 Esri News for Business Winter 2012/2013
no longer works for companies to succeed
in this age of social media and increased
competition with brick-and-mortar stores.
Demographic changes offer additional chal-
lenges and many opportunities for businesses
to capture more consumers. For example,
growing segments of nontraditional, multi-
generational, and single-person households,
along with increasingly racially/ethnically
diverse populations, provide multiple oppor-
tunities for business. Senior consumers also
have formidable buying power and are ready
to spend. Companies that target these new
types of consumers with specific products and
messaging with multiple media have the best
chance of thriving in this difficult business
environment.
How can you learn more about your area’s
demographics? Esri’s 2012/2017 Updated
Demographics data can provide the answers.
About 2012/2017 Updated DemographicsTo perform actionable location analytics in
this challenging business environment, you
need the industry’s most accurate data. Esri’s
2012/2017 Updated Demographics database
includes a full roster of current-year estimates
and five-year projections for population,
income, race/ethnicity, home value, net worth,
disposable income, and more.
Recently ranked number one for accuracy
in a blind, independent study, Esri’s 2012/2017
Updated Demographics data was produced
HAWAII
ALASKA
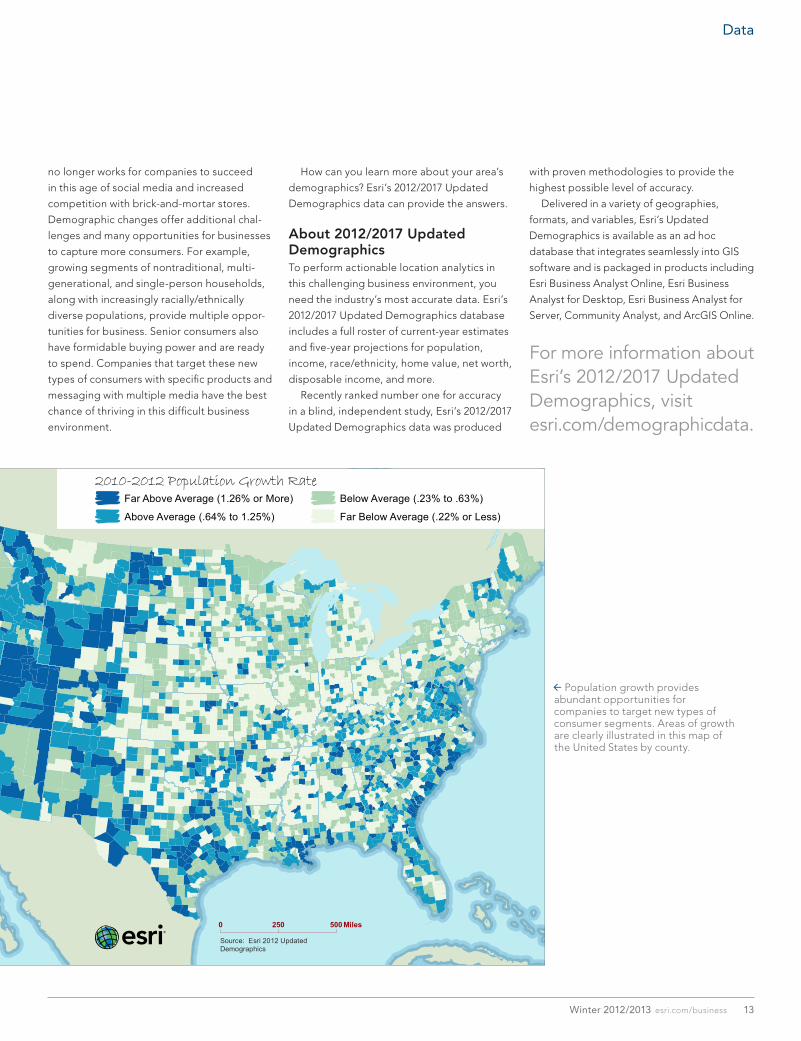
Far Above Average (1.26% or More)
Above Average (.64% to 1.25%)
Below Average (.23% to .63%)
Far Below Average (.22% or Less)
Source: Esri 2012 UpdatedDemographics
2010-2012 Population Growth Rate
0 250 500 Miles0 250 Miles
0 500 Miles
with proven methodologies to provide the
highest possible level of accuracy.
Delivered in a variety of geographies,
formats, and variables, Esri’s Updated
Demographics is available as an ad hoc
database that integrates seamlessly into GIS
software and is packaged in products including
Esri Business Analyst Online, Esri Business
Analyst for Desktop, Esri Business Analyst for
Server, Community Analyst, and ArcGIS Online.
For more information about Esri’s 2012/2017 UpdatedDemographics, visitesri.com/demographicdata.
Population growth provides abundant opportunities for companies to target new types of consumer segments. Areas of growth are clearly illustrated in this map of the United States by county.
13Winter 2012/2013 esri.com/business
Data
Today it seems that no conversation about information technology
(IT) is complete without a discussion about big data, the cloud, or the
consumerization of IT. However, arguably, the most impactful trend to
hit IT has been analytics—both in media buzz and in corporate invest-
ment. Since the publication of Thomas Davenport and Jeanne Harris’s
book Competing on Analytics: The New Science of Winning in 2007,
both private- and public-sector organizations have been sold on the
notion that they need to leverage analytics on their data to gain insight
and drive decision making.
Business analytics has now become pervasive in most large public-
and private-sector organizations. Current estimates are that 97 percent
of large companies leverage analytics, with over 100 million users
Location Analytics:The Next Big Step in Business Analysis
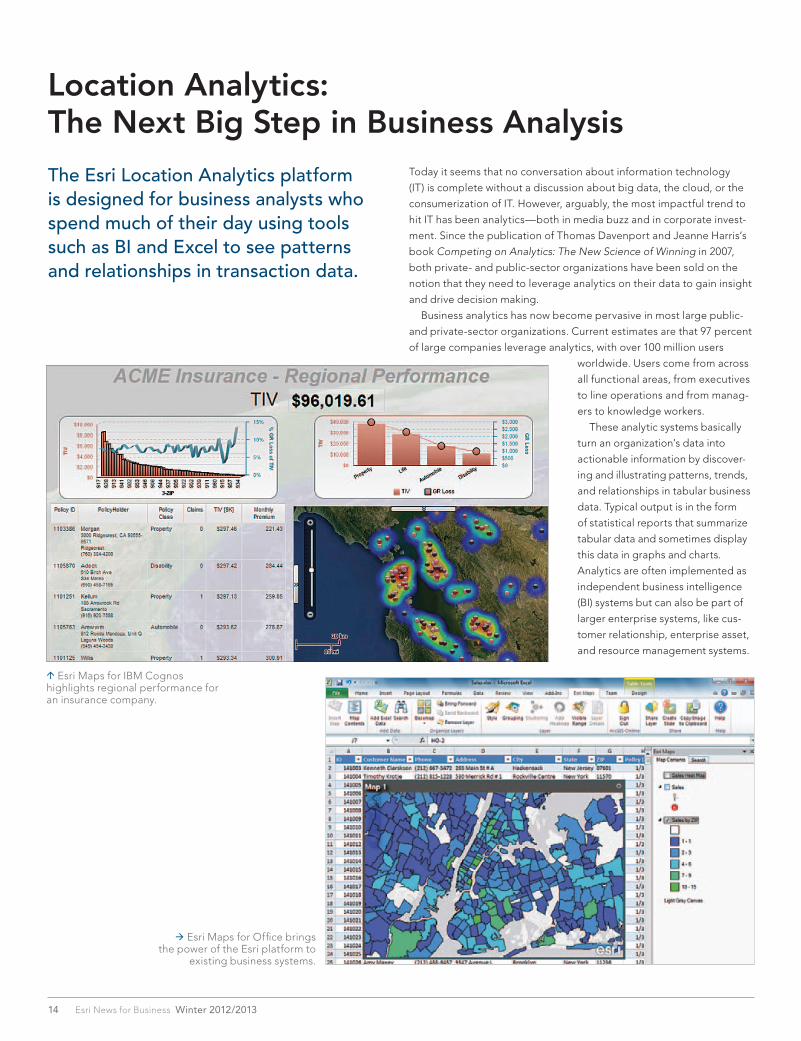
The Esri Location Analytics platform is designed for business analysts who spend much of their day using tools such as BI and Excel to see patterns and relationships in transaction data.
worldwide. Users come from across
all functional areas, from executives
to line operations and from manag-
ers to knowledge workers.
These analytic systems basically
turn an organization’s data into
actionable information by discover-
ing and illustrating patterns, trends,
and relationships in tabular business
data. Typical output is in the form
of statistical reports that summarize
tabular data and sometimes display
this data in graphs and charts.
Analytics are often implemented as
independent business intelligence
(BI) systems but can also be part of
larger enterprise systems, like cus-
tomer relationship, enterprise asset,
and resource management systems.
Esri Maps for Office brings the power of the Esri platform to
existing business systems.
Esri Maps for IBM Cognos highlights regional performance for an insurance company.
14 Esri News for Business Winter 2012/2013
Business Analytics and GeographyThere is a growing realization that by adding geographic location to
business data and mapping it, organizations can dramatically enhance
their insights into tabular data. Maps and spatial analytics provide a
whole new context that is simply not possible with tables and charts.
This context can almost immediately help users reach new understand-
ing and more effectively communicate and collaborate using maps as
a common language. While this geographic aspect has been largely
absent from business analytics solutions, many organizations would like
to incorporate it into their operations.
For years, a few progressive organizations have integrated maps
and spatial analytics with their business data using GIS technology and
netted powerful results. This approach has not become widespread
because of the expense of custom integration with enterprise systems
and because the capabilities of GIS are beyond the technical knowl-
edge of the business analytics users.
A second approach has been the use of consumer web mapping
technologies. This has likewise been problematic because of both dif-
ficulties with enterprise integration and a fundamental lack of needed
capabilities.
Location Analytics—The Missing PerspectiveIndustry analysts are suggesting that the demand for mapping and geo-
graphic intelligence is emerging as an important segment of the business
analytics software category. This interest is reflected in the fact that spa-
tial visualization is one of Deloitte’s top 10 technology priorities of 2012.
This new segment is being called location analytics and is focused on
thematic mapping and spatial analysis for the world of business analytics.
This solution space involves simple mapping and spatial analysis capabili-
ties that work directly with business analytics packages and enterprise
data systems with no custom integration efforts.
Esri Location Analytics—Esri MapsEsri has recently built a simple and powerful solution for the loca-
tion analytics space known as Esri Maps. This product complements
and extends the leading business analytics products: Cognos,
MicroStrategy, SharePoint, and others. Esri Maps supports easy-to-use
mapping and spatial analytics. These capabilities are complemented
with a full library of geographic content for enrichment that makes Esri
Maps simple to use and inexpensive, and users can immediately make
maps of data contained in business analytics systems. Esri’s direct
integration with leading business analytics platforms means there is no
cost for integration or ongoing maintenance. Also, because it is built
using ArcGIS (Esri’s core technology platform), it can provide powerful
GIS analytic capabilities and make use of other GIS investments in an
organization.
Specific capabilities include the following: • Mapping visualization: Point, color-coded, temporal, clustered, heat
maps • Spatial analytics: Bidirectional interaction, map filtering, proximity,
custom area (drive time, trade area), and advanced analysis tools
(geoprocessing) • Geographic information enrichment: Basemaps, imagery, demo-
graphics, consumer and lifestyle data, environment and weather,
social media, business, etc.
Esri supports multiple business analytics platforms. For example,
Esri Maps for IBM Cognos delivers maps, spatial analytics, and geo-
graphic information to the IBM Cognos BI environment. Similarly, Esri
Maps for Office, a feature of ArcGIS Online, delivers complete location
analytics capabilities to Microsoft Office users (see “Esri Maps for
Office Is Now Available,” page 10).
The Esri technology augments and extends leading enterprise
technology, like BI, customer relationship management, and enter-
prise asset management, providing mapping, spatial analytics, and
geographic data enrichment in a complementary and nondisruptive
manner. Users of these systems benefit from enhanced insight into
their business data without leaving the business system or changing
their information workflow—making these systems more impactful and
effective for the users, as well as the business at large.
Enterprise Implications of Location AnalyticsWhile Esri Maps provides a location analytics solution for business
analysts, this capability is also part of a larger web mapping platform
(ArcGIS Online—arcgis.com) that provides enterprise mapping and
geographic analysis services for an entire organization. ArcGIS is used
to share, visualize, and analyze all sorts of organization data using
geography as a common framework. This system can also dynamically
integrate (mash up) varied data, including data that has been mapped
using location analytics. When integrated with the growing volume of
geospatially referenced data available on the web, new insights begin
to emerge.continued on page 16
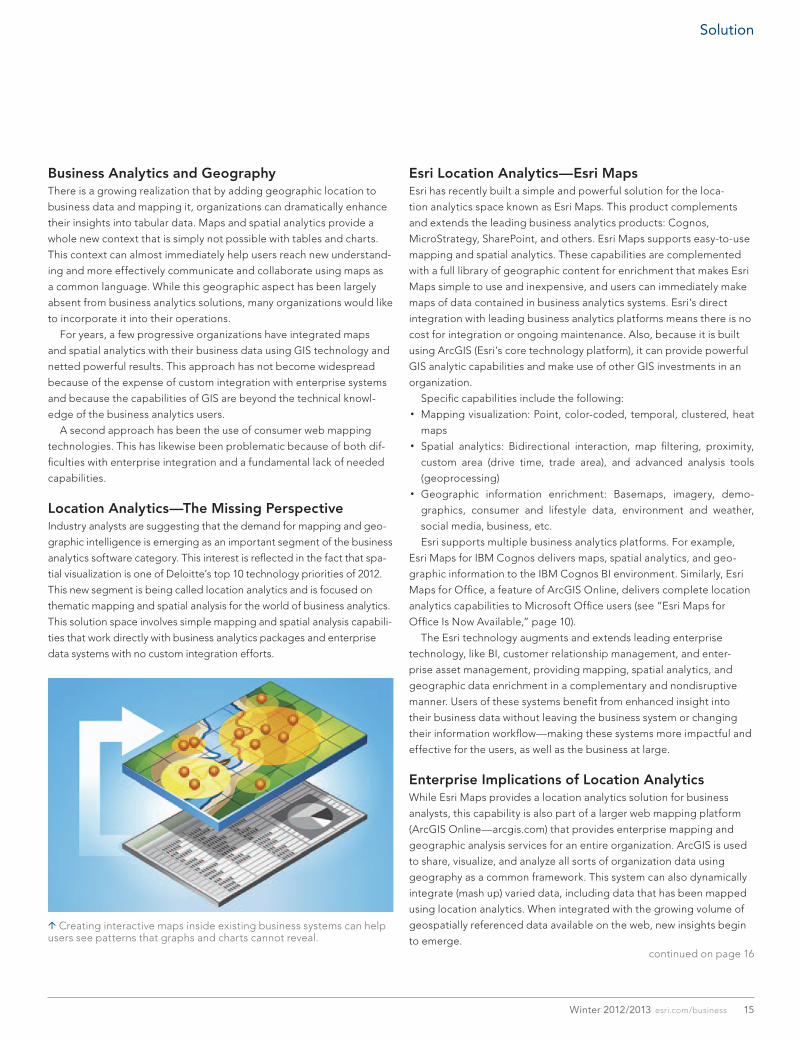
Creating interactive maps inside existing business systems can help users see patterns that graphs and charts cannot reveal.
15Winter 2012/2013 esri.com/business
Solution
Listen to New PodcastsVisit esri.com/podcasts to listen to the latest Speaker Series podcasts. Here’s a glimpse of what you’ll find:
Understanding the American ConsumerMatt Carmichael, director of information for Ad Age magazine, discusses using GIS technology and data to understand demographics and consumer trends.
Become a FanJoin thousands from around the world in an online community on Facebook, LinkedIn, and Twitter.
“Like” these Facebook pages: Esri, Esri UC, Official Esri DevSummit, GIS Day.Sign up for these LinkedIn groups: Esri, Esri Commercial Business, Esri Insurance Special Interest Group.Follow these Twitter handles for the latest breaking news on Esri GIS in commercial business:
• Simon Thompson, director, commercial solutions, at Esri— @SiAction
• Esri business team—@EsriBizTeam • Esri Business Summit—@BizSummit • Karen Richardson, Esri News for Business editor—@mudmo
Find ResourcesFor more information on Esri in the news, including videos and blogs, visit esri.com/news. Visit resources.arcgis.com to find the information you need including help documentation, tutorials, videos, ArcGIS templates, models, and scripts.
Attend a Free Online Training SeminarLive training seminars bring the GIS instruction you need to your desktop. Technical experts lead these hour-long sessions, which are streamed live. If you miss the interactive presentation, you can access the recording online. Visit training.esri.com for more information.
Watch a recorded webinarVisit esri.com/business and click on any one of several informa-tive prerecorded webinars that will help you understand the power of place in your business. The latest, Customizing the In-Store Experience by Lifestyle Segment, explains how retailers can analyze the lifestyle of their customers down to the store level to grow market share.
Esri News for Business NewsletterSubscribe to the Esri News for Business print newsletter, published quarterly, to keep up with the very latest news in the business industry. To subscribe, visit esri.com/subscribe.
Esri Online
ArcGIS Online is helping enterprises extend the concepts of simple
location analytics into whole new areas of information sharing; commu-
nication; collaboration; and, ultimately, better decisions. In the private
sector, this capability is helping companies be more efficient and
create a competitive advantage. In the public sector, it means more
effective, transparent, and efficient services.
Location Analytics:The Next Big Step in Business Analysiscontinued from page 15
Location Analytics and Enterprise GISThe Esri Location Analytics platform is designed for business analysts
who spend much of their day using tools such as BI and Excel to see
patterns and relationships in transaction data. They want self-service
mapping and simple spatial analytics that are delivered within the
analytic systems they use every day. These users will drive the prolifera-
tion of location analytics across the organization.
GIS professionals are in a unique position to help these analysts.
They are already creating useful frameworks, data, and map layers
that let non-GIS professionals, knowledge workers, and anyone in the
organization start to use location and geography to make better busi-
ness decisions.
They can also support this new community and help integrate and
leverage their capabilities with other enterprise data to maximize the
positive impact.
The integration of mapping and geographic intelligence across the
entire enterprise will reinforce and leverage the mission of GIS profes-
sionals, particularly in transforming the way organizations leverage
geographic knowledge.
For more information, visit esri.com/locationanalytics.
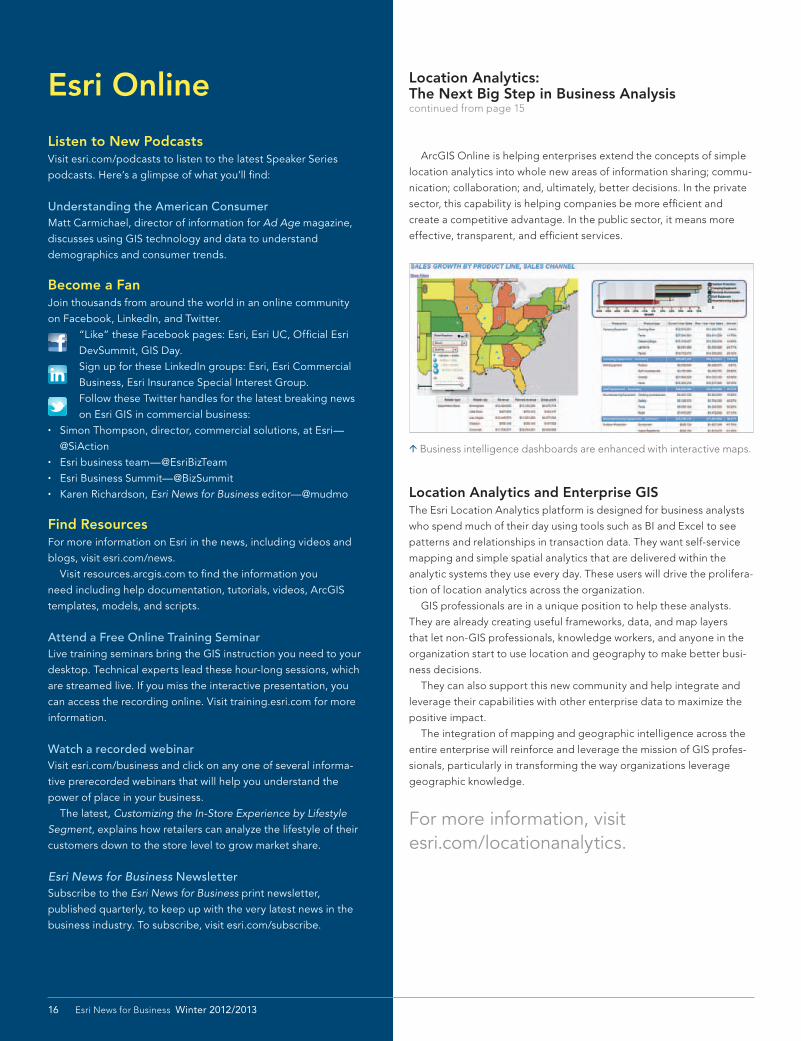
Business intelligence dashboards are enhanced with interactive maps.
16 Esri News for Business Winter 2012/2013
Location—The Tie That BindsBy Keith King, General Manager, Private Sector Group, GISi
As an executive, how hard is it for you to get a complete view of what is
really happening in all parts of your enterprise? Is the information you
receive fragmented? Out of date? Do you have multiple versions of the
“truth”? Can you spot trends? Would you like to wake up in the morn-
ing and use your iPad to review KPIs? Can you make timely decisions
about your business with confidence?
In other words, are you getting the information you need, in the
format you need, when and where you need it?
Organizations have worked for years to tear down information silos,
but challenges remain. If this is the case for you, consider utilizing
geography as an integrating platform to organize, analyze, visualize,
and share your enterprise data assets.
Spatial, or location, information is contained in much business
data. For example, wouldn’t it be great to integrate and visualize the
following: • Customer addresses and disaster event data • Supply chain requirements with weather and traffic data • Point of sale and demographic data • Indoor customer mobility patterns with product placement and cus-
tomer demographic data • Regulatory compliance requirements with housing loans history • Store location and crime data • Location of Tweets related to marketing campaign actions • Asset information and maintenance compliance performance
The list goes on. My point: It makes good sense to utilize geography
as an integration strategy because location is often the common de-
nominator across disparate data assets and systems. Once these items
are integrated and organized around location, the next logical step is
to use spatial technology to analyze, visualize,
and share the data.
Esri has developed an entire technology
stack for utilizing geography as an enterprise
platform. Wiring up CRMs, ERPs, data ware-
houses, and other operational business systems to a geographic
platform is not as hard as you might think. If you want, you can start
with small investments in technology and services and quickly develop
new and powerful ways of running your business.
The trends are clear. It will be commonplace for organizations to
have specialized spatial analytics divisions. Interactive maps will be a
standard part of the executive’s BI dashboard. Geographic platforms
are increasingly being recognized as good options for dealing with big
data, predictive analytics, risk analysis, and data from mobile devices,
to name a few. Geography is also a great platform to use for providing
value-added services for your customers. Put simply, maps serve as a
common language for effectively communicating complex ideas.
Geography as a technology platform is a game changer that delivers
a distinct competitive advantage.
Don’t get left behind.
Contact Keith King at [email protected] or 205-941-0442, extension 159, with questions or comments.
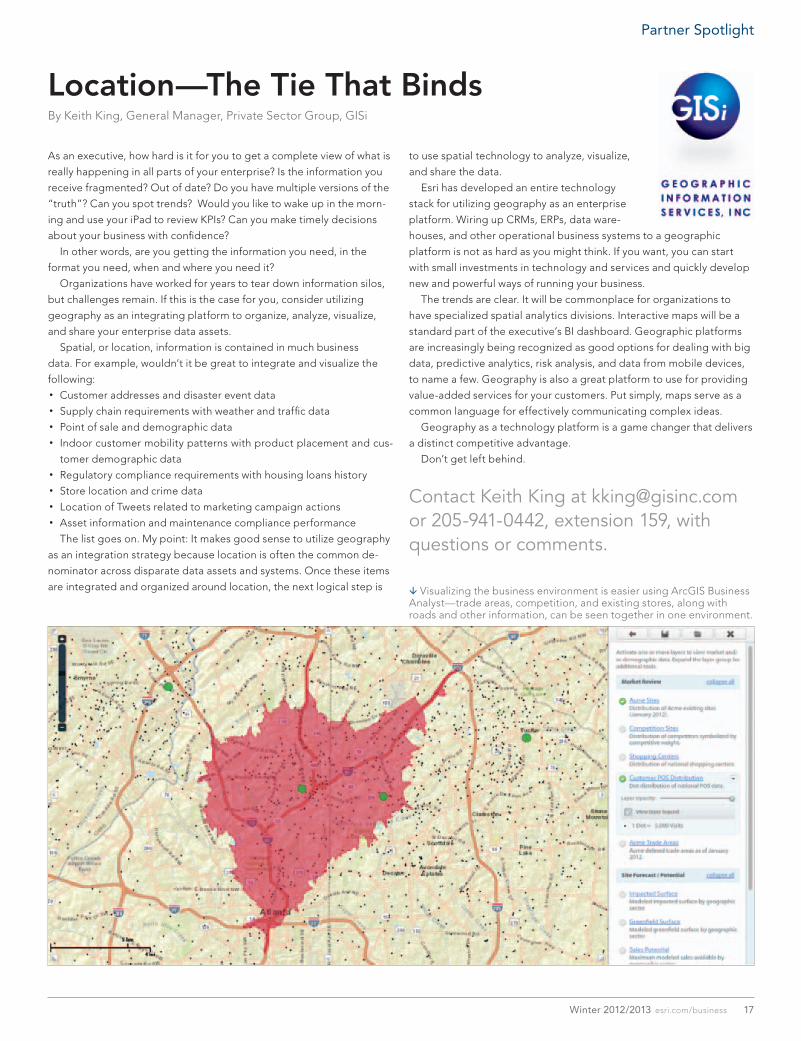
Visualizing the business environment is easier using ArcGIS Business Analyst—trade areas, competition, and existing stores, along with roads and other information, can be seen together in one environment.
17Winter 2012/2013 esri.com/business
Partner Spotlight
Keeping Service Levels High and Costs LowEsri Business Summit Delivers the Goods on Location AnalyticsBy Karen Richardson, Esri Writer
“Using location analytics significantly changes
your insights into the future—you get an
understanding of where you came from
and find out where you want to go,” said
Bruce Wong, manager of advanced network
analytics at General Motors (GM) Company
as he spoke at the Plenary Session of the 2012
Esri Business Summit, held July 22–24 in San
Diego, California.
The Esri Business Summit brings some of
the best minds in business together to share
how commercial organizations worldwide
are using place-based decision making to
support customer service, grow profitabil-
ity, and manage change in an increasingly
complex world. Nearly 400 attendees listened
to plenary speakers in the morning and then
attended focused sessions on topics such as
using GIS for better customer service, retail
applications, and spatial modeling for better
growth.
Being in the Best PlaceWong was the first of several plenary speak-
ers. He began the morning talking about
how important it is for GM to understand and
improve its business analytics. The company
transformed itself, going from bankruptcy to
profitability and posting $1 billion in first quar-
ter profits this year. Wong said the company
has been using more GIS analytics to trim fat
and become more fiscally fit.
Dr. Wayne M. Gearey Jr., senior vice presi-
dent of location intelligence at Jones Lang
LaSalle, reiterated Wong’s emphasis on loca-
tion and added that location intelligence is
the game changer. “Using location analytics,
we can define our data filters to understand
the best location based on what the business
ecosystem looks like,” said Gearey. “This is
important because our ultimate goal is to get
our clients to a geography of opportunity
using the right people, data, and technology.
As a result, we build trust and they come back
again and again.”
Knowing What the Customer Needs and WantsRob Bakker, knowledge manager at Achmea,
an insurance and financial services firm in the
Netherlands, stressed that it is imperative
for business managers to think about old
things in new ways. Achmea’s use of GIS has
led to streamlining processes for its 18,000
employees, cutting costs, and innovating new
products.
While neither a GIS expert nor a practiced
public speaker, Bakker said he felt compelled
to share Achmea’s success using GIS for risk
management, more efficient business pro-
cesses, and transparency to both government
authorities and its customers.
“Achmea has a complex structure—many
labels and brands,” explained Bakker. “We
have divisions in health, banking, real estate,
life and pensions, and non-life. Each division
has its own dynamics and methods of product
distribution.”
Working on priority key performance
indicators for each of these divisions, Bakker’s
GIS team was able to build business cases
showcasing the effectiveness of GIS for
diverse business functions. “One tenet is to
be a leader in our industry,” said Bakker. “So,
we focused on social solidarity and created
a pilot project with the City of Eindhoven [in
the south of the Netherlands] to help them
measure rainfall and mitigate flooding. That
translates to creating a digital underwrit-
ing map for the reduction of unknown risk
accumulation. By doing this, we talk the same
language as the decision makers and connect
GIS to the strategic goals of our business.”
Using GIS, Achmea managers believe they
also have a better view on underwritten fire
risks and thus are more effective in their risk
management. Having this common opera-
tional picture for the underwriters of several
Achmea brands is more efficient and competi-
tive. It makes claims data available for custom-
ers, increasing the company’s transparency,
and allows Achmea staff to develop products
and services that make them an insurer that
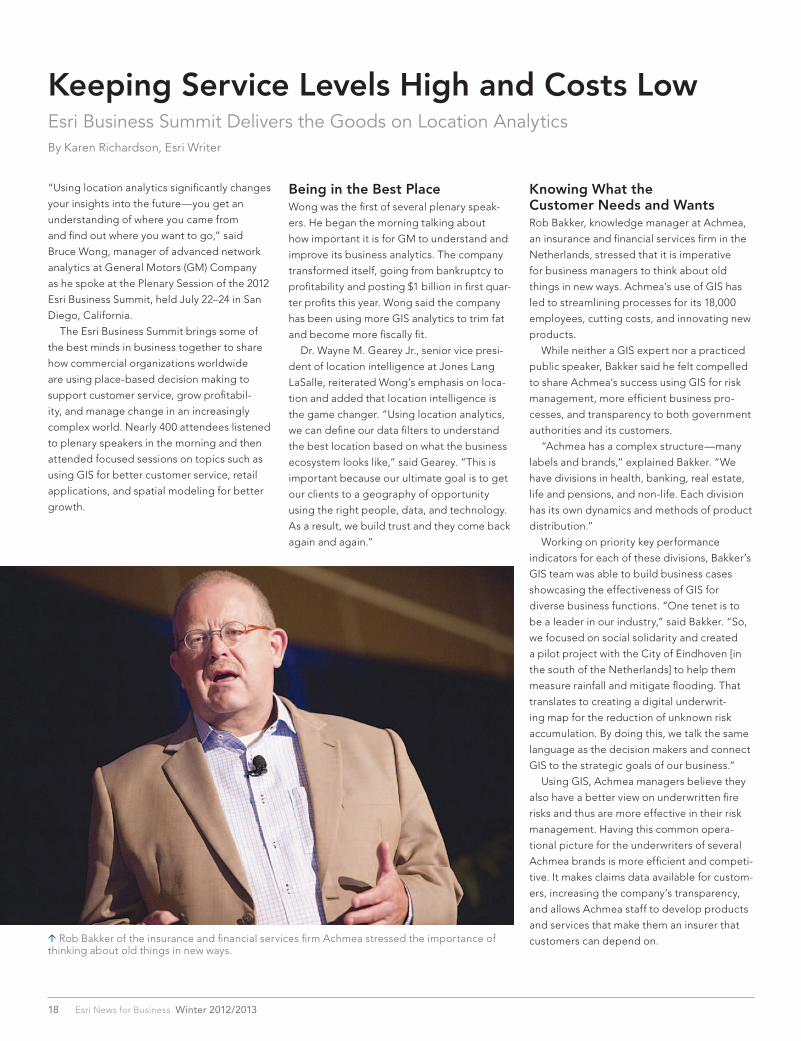
customers can depend on. Rob Bakker of the insurance and financial services firm Achmea stressed the importance of thinking about old things in new ways.
18 Esri News for Business Winter 2012/2013
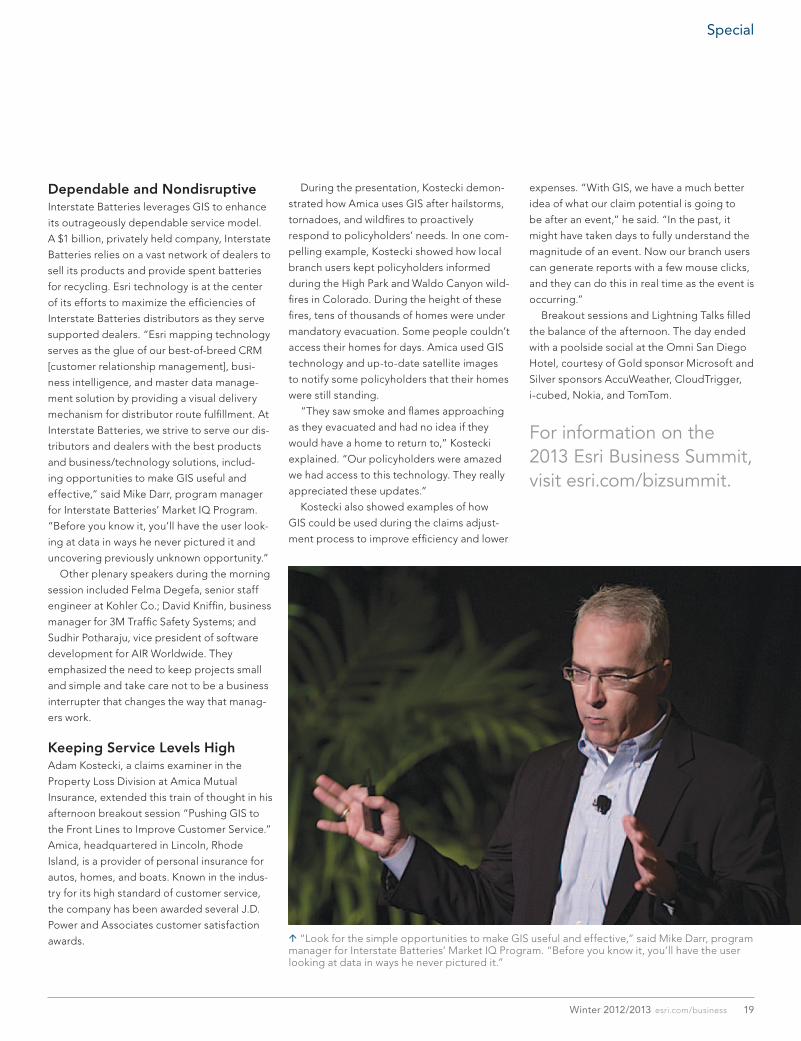
Dependable and NondisruptiveInterstate Batteries leverages GIS to enhance
its outrageously dependable service model.
A $1 billion, privately held company, Interstate
Batteries relies on a vast network of dealers to
sell its products and provide spent batteries
for recycling. Esri technology is at the center
of its efforts to maximize the efficiencies of
Interstate Batteries distributors as they serve
supported dealers. “Esri mapping technology
serves as the glue of our best-of-breed CRM
[customer relationship management], busi-
ness intelligence, and master data manage-
ment solution by providing a visual delivery
mechanism for distributor route fulfillment. At
Interstate Batteries, we strive to serve our dis-
tributors and dealers with the best products
and business/technology solutions, includ-
ing opportunities to make GIS useful and
effective,” said Mike Darr, program manager
for Interstate Batteries’ Market IQ Program.
“Before you know it, you’ll have the user look-
ing at data in ways he never pictured it and
uncovering previously unknown opportunity.”
Other plenary speakers during the morning
session included Felma Degefa, senior staff
engineer at Kohler Co.; David Kniffin, business
manager for 3M Traffic Safety Systems; and
Sudhir Potharaju, vice president of software
development for AIR Worldwide. They
emphasized the need to keep projects small
and simple and take care not to be a business
interrupter that changes the way that manag-
ers work.
Keeping Service Levels HighAdam Kostecki, a claims examiner in the
Property Loss Division at Amica Mutual
Insurance, extended this train of thought in his
afternoon breakout session “Pushing GIS to
the Front Lines to Improve Customer Service.”
Amica, headquartered in Lincoln, Rhode
Island, is a provider of personal insurance for
autos, homes, and boats. Known in the indus-
try for its high standard of customer service,
the company has been awarded several J.D.
Power and Associates customer satisfaction
awards.
During the presentation, Kostecki demon-
strated how Amica uses GIS after hailstorms,
tornadoes, and wildfires to proactively
respond to policyholders’ needs. In one com-
pelling example, Kostecki showed how local
branch users kept policyholders informed
during the High Park and Waldo Canyon wild-
fires in Colorado. During the height of these
fires, tens of thousands of homes were under
mandatory evacuation. Some people couldn’t
access their homes for days. Amica used GIS
technology and up-to-date satellite images
to notify some policyholders that their homes
were still standing.
“They saw smoke and flames approaching
as they evacuated and had no idea if they
would have a home to return to,” Kostecki
explained. “Our policyholders were amazed
we had access to this technology. They really
appreciated these updates.”
Kostecki also showed examples of how
GIS could be used during the claims adjust-
ment process to improve efficiency and lower
expenses. “With GIS, we have a much better
idea of what our claim potential is going to
be after an event,” he said. “In the past, it
might have taken days to fully understand the
magnitude of an event. Now our branch users
can generate reports with a few mouse clicks,
and they can do this in real time as the event is
occurring.”
Breakout sessions and Lightning Talks filled
the balance of the afternoon. The day ended
with a poolside social at the Omni San Diego
Hotel, courtesy of Gold sponsor Microsoft and
Silver sponsors AccuWeather, CloudTrigger,
i-cubed, Nokia, and TomTom.
For information on the 2013 Esri Business Summit,visit esri.com/bizsummit.
“Look for the simple opportunities to make GIS useful and effective,” said Mike Darr, program manager for Interstate Batteries’ Market IQ Program. “Before you know it, you’ll have the user looking at data in ways he never pictured it.”
19Winter 2012/2013 esri.com/business
Special
Presorted Standard
US Postage Paid Esri
380 New York Street Redlands, California 92373-8100 usa
Copyright © 2012 Esri. All rights reserved.
Better business analytics? Just add location.Learn all about it at the Esri Business Summit.July 7–9, 2013, San Diego, California
Register to attend at esri.com/bizsummit.
G57029_E_BusGIS_Sum_EsriNewsBus_HH0113.indd 1 2/11/13 1:02 PM
133809 QUAD51.8M3/13tk