Archaeometry for Beograd
92
PORTABLE SYSTEMS FOR ENERGY DISPERSIVE X-RAY FLUORESCENCE ANALYSIS OF WORKS OF ART Roberto Cesareo + , Maurizio Marabelli § , Stefano Ridolfi *, Alfredo Castellano ** , Giovanni Buccolieri ** , Stefano Quarta ** , Giovanni E. Gigante ++ , Antonio Brunetti + +Istituto di Matematica e Fisica, Università di Sassari, Sassari, Italy e-mail: [email protected] ; fax 0039-079-229482 § Istituto Centrale del Restauro, Rome, Italy * Ars Mensurae, Rome, Italy ** Dip. di Scienza dei Materiali, Università di Lecce, Lecce, Italy ++ Dip. di Fisica, Università di Roma “La Sapienza”, Rome, Italy 1. SUMMARY Energy dispersive X-ray fluorescence (EDXRF) analysis is a valuable technique for the study of works of art, because it is non destructive, multielemental, simple and relatively inexpensive. Further, portable EDXRF equipments can be easily assembled. For this reason EDXRF is a very popular analytical technique in the field of "archaeometry" . Portability is, of course, extremely useful and almost mandatory in many cases, such as analysis of frescoes, of large paintings , bronzes, brasses and gold alloys, and etc., especially when located in Museums . In fact, only in a few cases it is possible to study a work of art outside its normal location (museum, church, excavation and, etc.) and in any case, the bureaucratic problems and high costs for doing that are prohibitive. There are a variety of materials that can be studied by using a EDXRF apparatus: -paintings of all type and frescos (Table 1); 1
Transcript of Archaeometry for Beograd
PORTABLE SYSTEMS FOR ENERGY DISPERSIVEX-RAY FLUORESCENCE ANALYSIS OF WORKS OFART
Roberto Cesareo +, Maurizio Marabelli §,Stefano Ridolfi *, Alfredo Castellano **,Giovanni Buccolieri **, Stefano Quarta **,Giovanni E. Gigante ++, Antonio Brunetti + +Istituto di Matematica e Fisica, Università diSassari, Sassari, Italy e-mail: [email protected]; fax 0039-079-229482§ Istituto Centrale del Restauro, Rome, Italy
* Ars Mensurae, Rome, Italy** Dip. di Scienza dei Materiali, Università diLecce, Lecce, Italy++ Dip. di Fisica, Università di Roma “LaSapienza”, Rome, Italy
1. SUMMARY Energy dispersive X-ray fluorescence (EDXRF)analysis is a valuable technique for the study ofworks of art, because it is non destructive,multielemental, simple and relatively inexpensive.Further, portable EDXRF equipments can be easilyassembled. For this reason EDXRF is a very popularanalytical technique in the field of "archaeometry". Portability is, of course, extremely useful andalmost mandatory in many cases, such as analysis offrescoes, of large paintings , bronzes, brassesand gold alloys, and etc., especially when locatedin Museums . In fact, only in a few cases it ispossible to study a work of art outside its normallocation (museum, church, excavation and, etc.) andin any case, the bureaucratic problems and highcosts for doing that are prohibitive. There are a variety of materials that can bestudied by using a EDXRF apparatus: -paintings of all type and frescos (Table 1);
1
-alloys (bronzes, brasses, gold and silver alloysand so on) (Table 2); -ceramics and porcelains, both for bulk materialand decoration analysis (Table 3); -illuminated manuscripts; -papers; -stones of all type, marbles, oxidians and so on; -glasses and etc.;-ink. There are then cases in which a qualitative(or semiquantitative) analysis is sufficient (forexample in the case of paintings) and others inwhich a quantitative approach is required (forexample in the case of alloys or ceramics). EDXRF analysis generally involves an area ofmm2 to cm2, and a thickness between m and fractionsof mm. The analysis is, therefore, superficial anddependent on the surface conditions . In some case "capillary collimators" may beemployed, to focus the radiation into smaller areasof the order 10-1 to 10-4 mm2 . Due to reduced involved thickness, EDXRF analysis is representative of the bulk composition only for homogeneous samples. -------------------------------------------------------------------------------------
Table 1 - Elements in the most important pigments and composition 1
AntimonyAntimony white – Sb2O3
Neaple’s yellow – Pb3(SbO4)2
Lead, tin, antimony yellow – PbSnSbO 6.5
Antimony orange –Sb2S3
ArsenicOrpiment – As2S3
Realgar – AsSCobalt arseniate – Co3(AsO4)2
Barium
2
Barium white – BaSO4
Barium yellow – BaCrO4 >1809BromineFtalocianine green – organic pigment containing Br >1930CadmiumCadmium yellow – CdS >1850Cadmium red – CdS(Se) >1909CalciumChalk (Sangiovanni white) – CaCO3
CobaltCobalt blue – CoO.nSnO2 >1800Cobalt yellow – K3(Co(NO2)6) >1860Cobalt red – CoO + MgO –modern pigmentChromiumChromium yellow – PbCrO4 >1800Viridian – Cr2O3 >1860IronIron is employed in a large number of pigments:Yellow ochre – Fe2O3 .nH2ORed ochre Fe2O3
Prussian blue Fe4(Fe(CN)6)3
Black iron oxide – FeO . Fe2O3
ManganeseManganese bleu – see Barium >end 1800Terra d’ombra MnO2 + Fe2O3 +SiO2 + Al2O3 ancient pigmentMercuryCinnabar – HgSLeadBiacca – 2PbCO3 . Pb(OH)2 ancient pigmentMassicot yellow – PbO ancient pigmentLead-Tin yellow – Pb2SnO4 >XIII CenturyMinimum red – Pb3O4 ancient pigmentCopperA large number of pigments is based on coppercompounds, mainly bleu and greenAzurite – 2CuCO3 . Cu(OH)2
Malachite – CuCO3 . Cu (OH)2
Verdigris – Cu(CH3COO)2 . nCu(OH)2
Selenium
3
Cadmium Red (see Cadmium)TinTin white >1500Lead-Tin yellow Lead, Tin, Antimony yellowTitaniumTitanium white – TiO2 >1919ZincZinc white – ZnO >1840--------------------------------------------------------------------------------------------
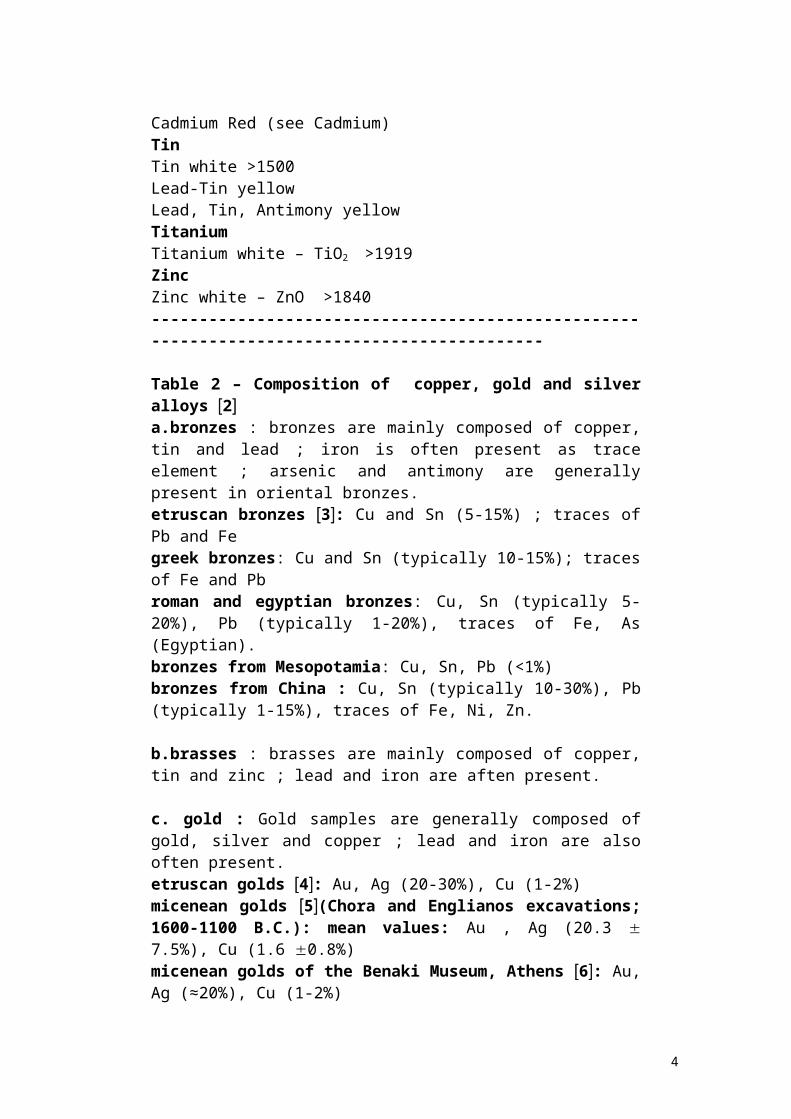
Table 2 – Composition of copper, gold and silveralloys 2a.bronzes : bronzes are mainly composed of copper,tin and lead ; iron is often present as traceelement ; arsenic and antimony are generallypresent in oriental bronzes. etruscan bronzes 3: Cu and Sn (5-15%) ; traces ofPb and Fegreek bronzes: Cu and Sn (typically 10-15%); tracesof Fe and Pbroman and egyptian bronzes: Cu, Sn (typically 5-20%), Pb (typically 1-20%), traces of Fe, As(Egyptian).bronzes from Mesopotamia: Cu, Sn, Pb (<1%)bronzes from China : Cu, Sn (typically 10-30%), Pb(typically 1-15%), traces of Fe, Ni, Zn.
b.brasses : brasses are mainly composed of copper,tin and zinc ; lead and iron are aften present.
c. gold : Gold samples are generally composed ofgold, silver and copper ; lead and iron are alsooften present.etruscan golds 4: Au, Ag (20-30%), Cu (1-2%)micenean golds 5(Chora and Englianos excavations;1600-1100 B.C.): mean values: Au , Ag (20.3 7.5%), Cu (1.6 0.8%)micenean golds of the Benaki Museum, Athens 6: Au,Ag (≈20%), Cu (1-2%)
4
egyptian golds : Ag, Au, traces of Cuceltic golds: Au (70-90), Ag (10-25), Cu (1-7)
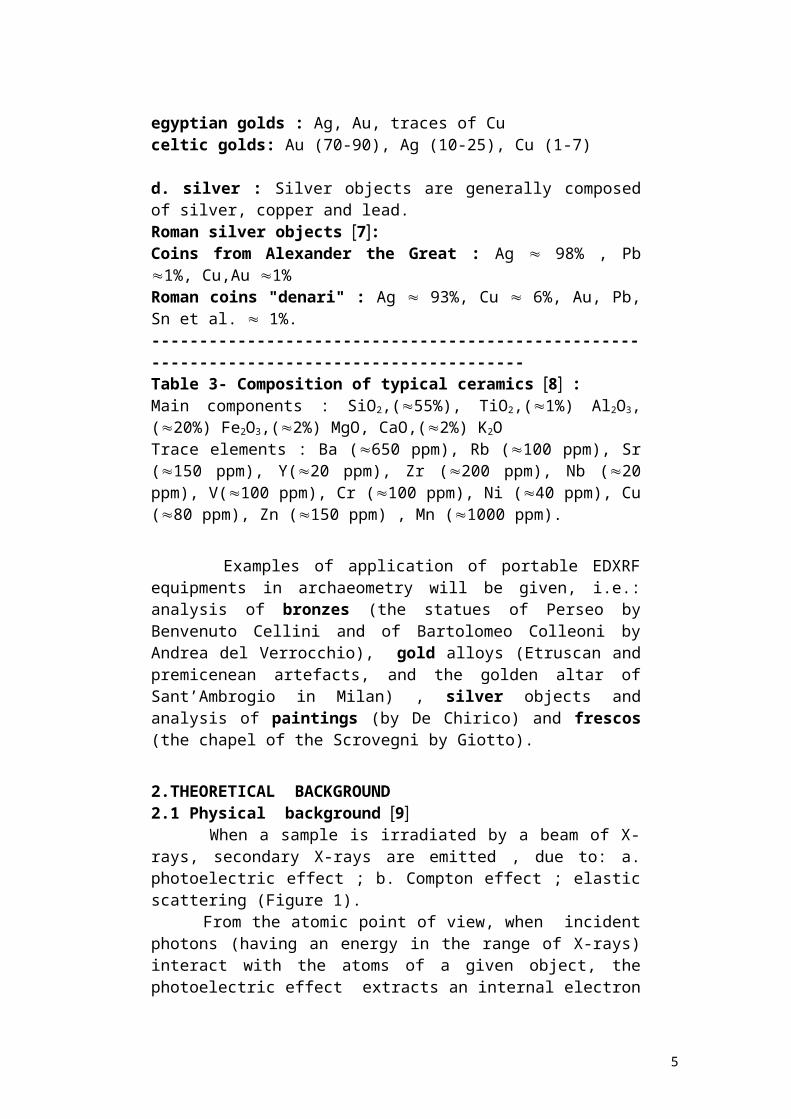
d. silver : Silver objects are generally composedof silver, copper and lead. Roman silver objects 7:Coins from Alexander the Great : Ag 98% , Pb1%, Cu,Au 1%Roman coins "denari" : Ag 93%, Cu 6%, Au, Pb,Sn et al. 1%.------------------------------------------------------------------------------------------Table 3- Composition of typical ceramics 8 : Main components : SiO2,(55%), TiO2,(1%) Al2O3,(20%) Fe2O3,(2%) MgO, CaO,(2%) K2O Trace elements : Ba (650 ppm), Rb (100 ppm), Sr(150 ppm), Y(20 ppm), Zr (200 ppm), Nb (20ppm), V(100 ppm), Cr (100 ppm), Ni (40 ppm), Cu(80 ppm), Zn (150 ppm) , Mn (1000 ppm).
Examples of application of portable EDXRFequipments in archaeometry will be given, i.e.:analysis of bronzes (the statues of Perseo byBenvenuto Cellini and of Bartolomeo Colleoni byAndrea del Verrocchio), gold alloys (Etruscan andpremicenean artefacts, and the golden altar ofSant’Ambrogio in Milan) , silver objects andanalysis of paintings (by De Chirico) and frescos(the chapel of the Scrovegni by Giotto).
2.THEORETICAL BACKGROUND2.1 Physical background 9 When a sample is irradiated by a beam of X-rays, secondary X-rays are emitted , due to: a.photoelectric effect ; b. Compton effect ; elasticscattering (Figure 1). From the atomic point of view, when incidentphotons (having an energy in the range of X-rays)interact with the atoms of a given object, thephotoelectric effect extracts an internal electron
5
(for example from the most internal K-shell),producing a hole in the corresponding atomic shell,which will be filled by a more external electron(for example from the successive L-shell), withcontemporary emission of a secondary photon. Theenergy of this photon is given by the binfingenergy difference of the two considered shell, i.e.EX = EK – EL (Figure 2). In concurrence with the photoelectric effect,and with more probability at higher X-ray energy,the incident photon may interact with an externalelectron of the atomic structure, resultingdeflected with respect to the incident direction,with a reduced energy. The residual energy istransferred to the electron. This effect is calledCompton effect (Figure 3). A further possible effect, mainly occurring atlow X-ray energy, is given by the elasticscattering of the incident X-ray photon by an atomof a given object. Due to this effect, the incidentphoton is deflected, and its energy remainsconstant (Figure 4). The three above described effects finallyproduces a. fluorescent X-rays of variousenergies ; b. Compton (inelastic) scatteredphotons ; elastic scattered photons (Figure 5). The energy of the secondary fluorescent X-rayscharacterizes the elements present in the sample(see Table 4) , and the intensity is, in some way,proportional to their concentration. Compton andelastic scattered photons generally contributes tothe background, but may be also employed foranalytical purposes The technique based on the analysis of thesesecondary fluorescent X-rays is called energy-dispersive X-ray fluorescence (EDXRF). It is a nondestructive, multi-elemental and simple technique. The sample can be whatever (solid, liquid,gaseous, of various size and nature), it will in nomanner be alterated by the analysis, and for thatreason it can be analyzed many times.
6
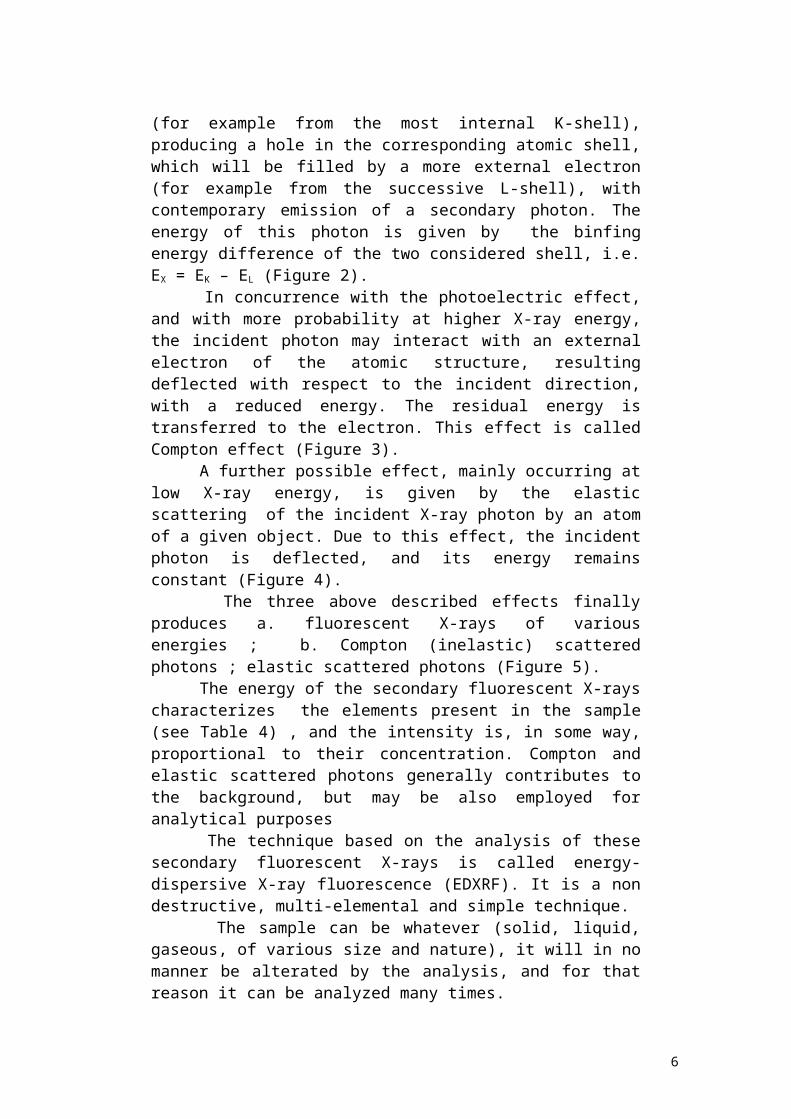
Further, EDXRF is a “surface analysis”because of the limited penetration of the radiationin the sample, both primary and fluorescent. As anexample, Table 5 gives the object depth originating90% of the fluorescent radiation (FR), in the caseof sulfur in frescoes, copper, tin and lead in abronze, and gold, silver and copper in a goldalloy. The values reported in Table 4 are onlyindicative; the exact values, in fact, depend onthe incident energy, homogeneity of the sample,orientation of incident and output radiation.
7
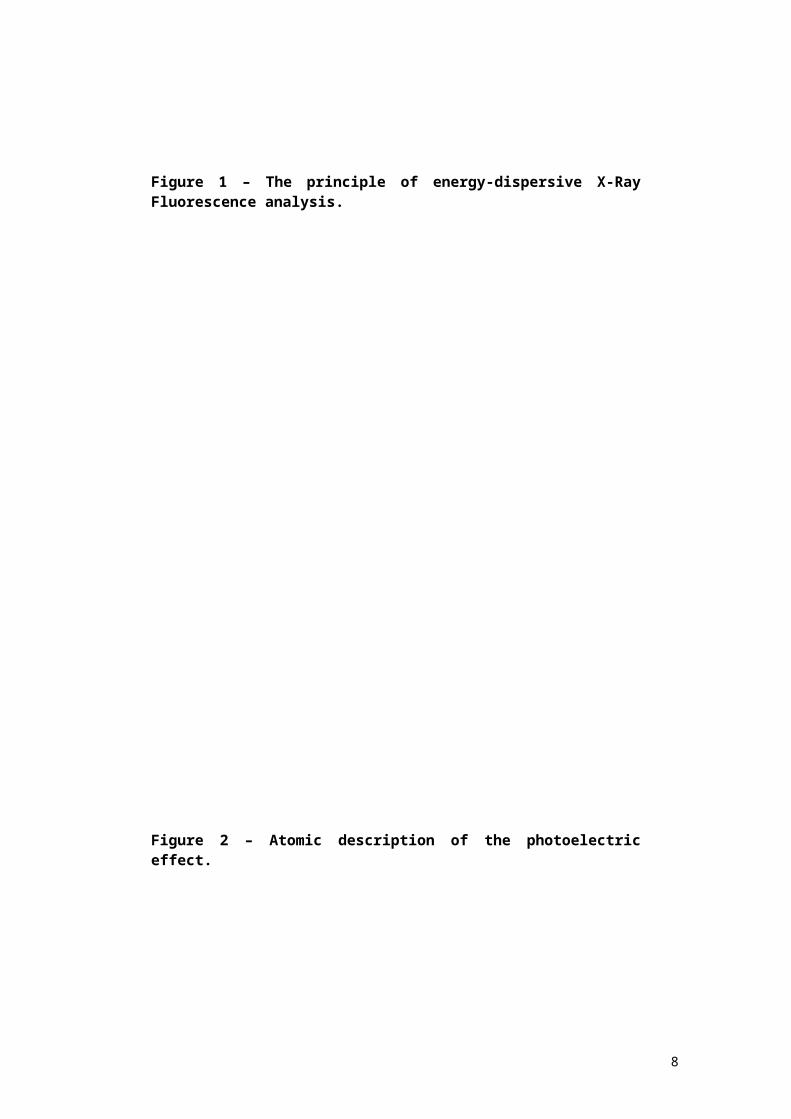
Figure 1 – The principle of energy-dispersive X-RayFluorescence analysis.
Figure 2 – Atomic description of the photoelectriceffect.
8
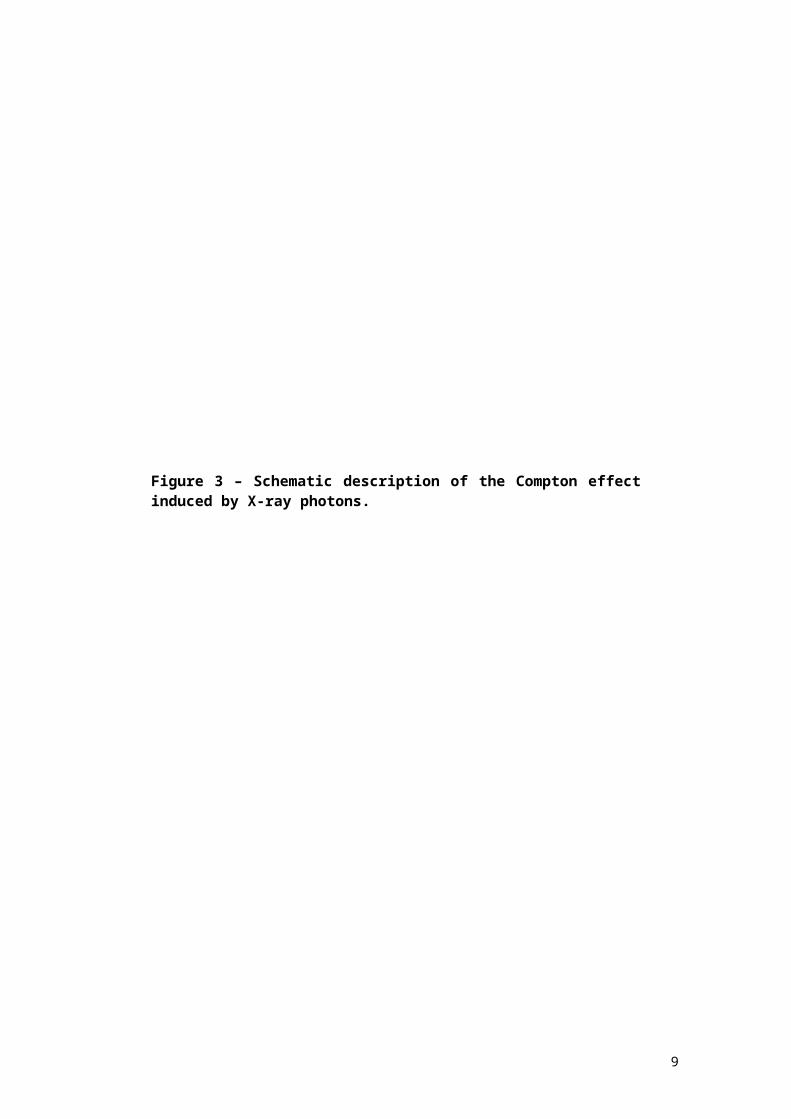
Figure 3 – Schematic description of the Compton effectinduced by X-ray photons.
9

Figure 4 – Schematic description of elastic scatteringof X-ray photons.
10
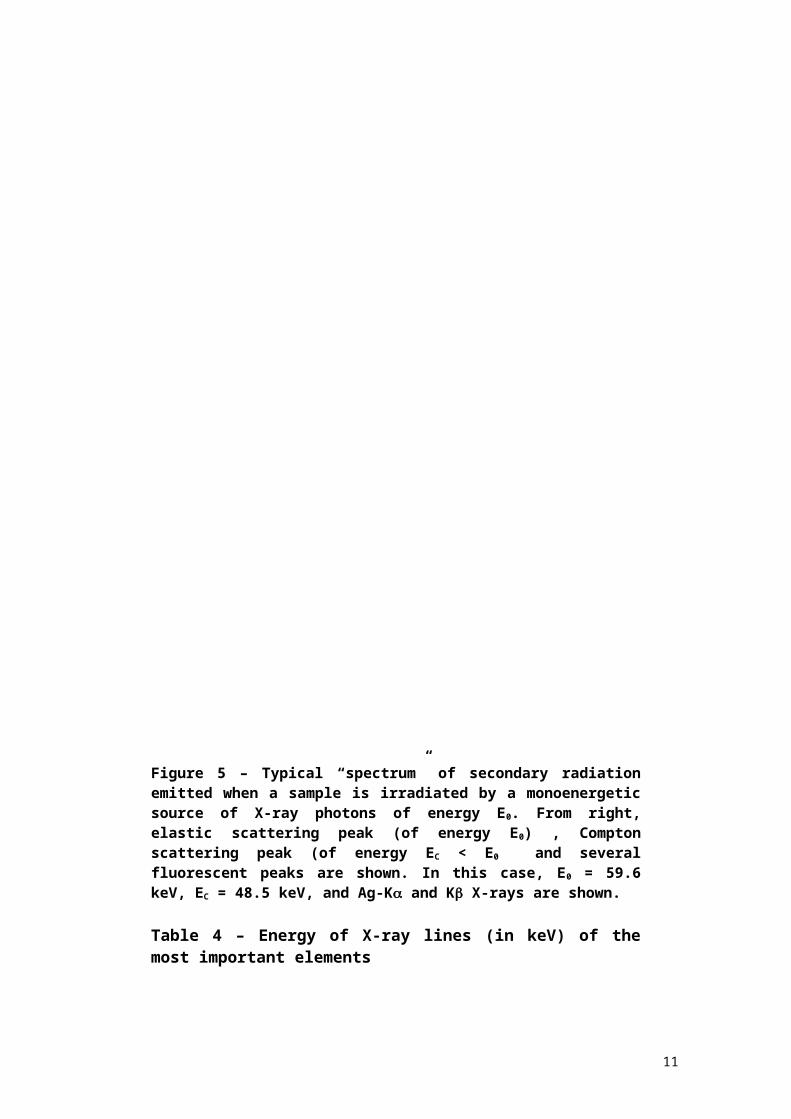
Figure 5 – Typical “spectrum” of secondary radiationemitted when a sample is irradiated by a monoenergeticsource of X-ray photons of energy E0. From right,elastic scattering peak (of energy E0) , Comptonscattering peak (of energy EC < E0 and severalfluorescent peaks are shown. In this case, E0 = 59.6keV, EC = 48.5 keV, and Ag-K and K X-rays are shown.
Table 4 – Energy of X-ray lines (in keV) of themost important elements
11

Element K K L L
12

Sodium 1.04Magnesium
1.25
Aluminium
1.5
Silicon 1.74Phosphor 2.0Sulphur 2.3Chlorine 2.62 2.81Argon 2.96 3.2Potassium
3.3 3.6
Calcium 3.7 4.0Titanium 4.5 4.93Chromium 5.4 5.95Manganese
5.9 6.5
Iron 6.4 7.06Cobalt 6.93 7.65Nickel 7.5 8.26Copper 8.05 8.9Zinc 8.64 9.6Arsenic 10.54 11.7Selenium 11.22 12.5Bromine 11.92 13.3Rubidium 13.39 15.0 1.7Strontium
14.16 15.8 1.8
Yttrium 15.0 16.7 1.92Zirconium
15.8 17.7 2.04
Niobium 16.6 18.6 2.16Molibdenum
17.5 19.6 2.3 2.5
Silver 22.2 24.9 3.0 3.2Cadmium 23.2 26.1 3.13 3.45Tin 25.3 28.5 3.4 3.8Antimony 26.4 29.7 3.6 4.0Barium 32.2 36.4 4.45 5.0Tungsten 59.3 67.2 8.4 9.9
13
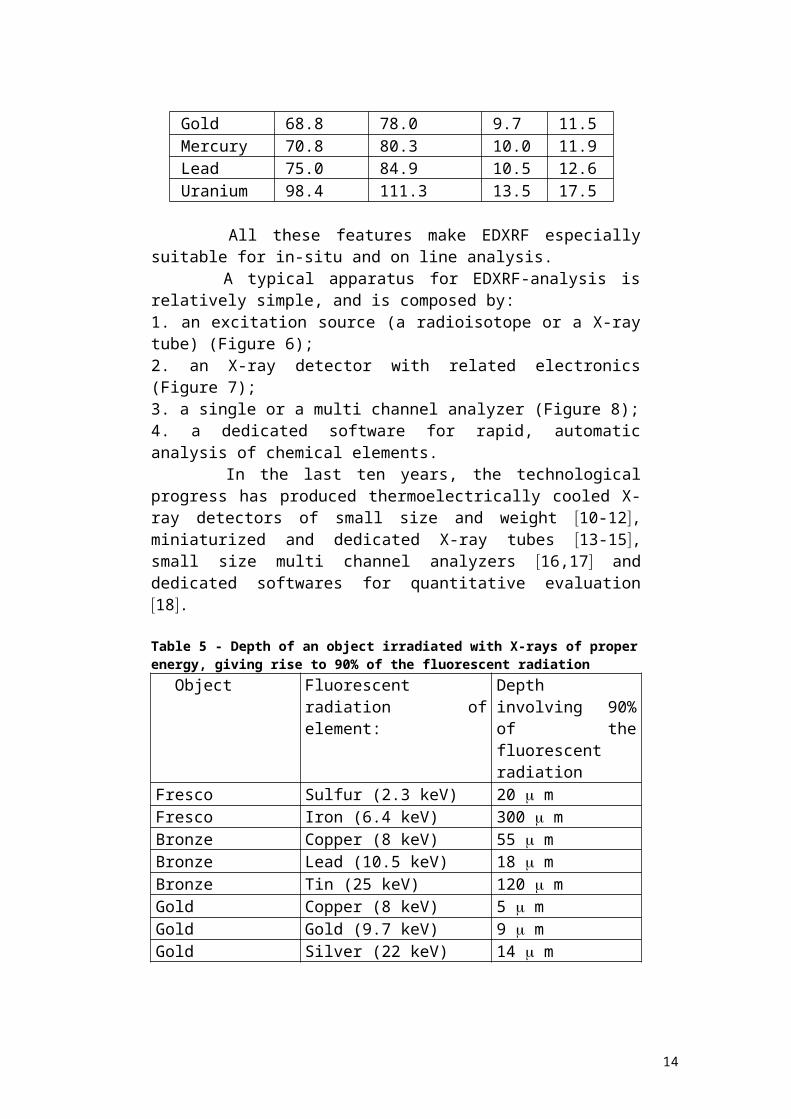
Gold 68.8 78.0 9.7 11.5Mercury 70.8 80.3 10.0 11.9Lead 75.0 84.9 10.5 12.6Uranium 98.4 111.3 13.5 17.5
All these features make EDXRF especiallysuitable for in-situ and on line analysis. A typical apparatus for EDXRF-analysis isrelatively simple, and is composed by: 1. an excitation source (a radioisotope or a X-raytube) (Figure 6); 2. an X-ray detector with related electronics(Figure 7);3. a single or a multi channel analyzer (Figure 8);4. a dedicated software for rapid, automaticanalysis of chemical elements. In the last ten years, the technologicalprogress has produced thermoelectrically cooled X-ray detectors of small size and weight 10-12,miniaturized and dedicated X-ray tubes 13-15,small size multi channel analyzers 16,17 anddedicated softwares for quantitative evaluation18.
Table 5 - Depth of an object irradiated with X-rays of properenergy, giving rise to 90% of the fluorescent radiation Object Fluorescent
radiation ofelement:
Depthinvolving 90%of thefluorescentradiation
Fresco Sulfur (2.3 keV) 20 mFresco Iron (6.4 keV) 300 mBronze Copper (8 keV) 55 mBronze Lead (10.5 keV) 18 mBronze Tin (25 keV) 120 mGold Copper (8 keV) 5 mGold Gold (9.7 keV) 9 mGold Silver (22 keV) 14 m
14
All these progresses allowed the constructionof completely portable small size EDXRF systemswith similar performance as Laboratory systems,but without the problems connected with nitrogencooling, big size X-ray tubes and high costs(Figure 9). Portable EDXRF (PEDXRF) systems arenecessary in many cases, where objects to beanalyzed cannot be transported or where the mappingof the object would require too many samples. Thisis particularly true in the field of archaeometry,where samples are generally in museums, churches,excavations and so on.
15
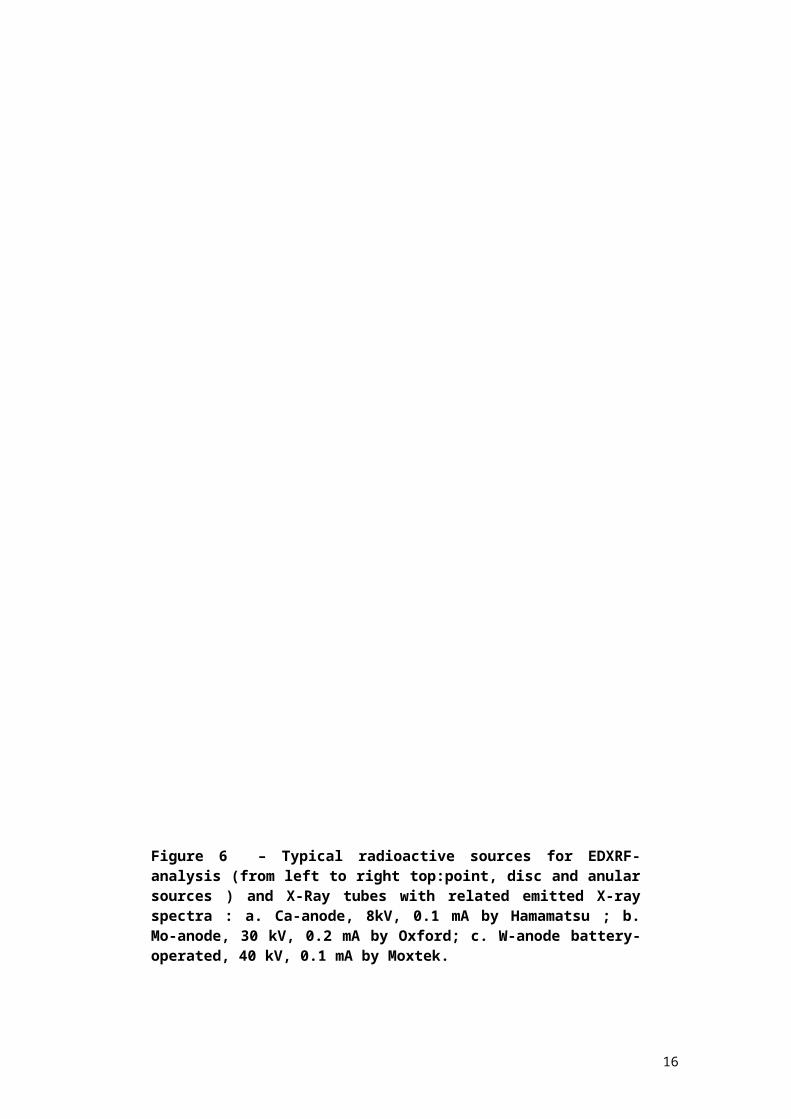
Figure 6 – Typical radioactive sources for EDXRF-analysis (from left to right top:point, disc and anularsources ) and X-Ray tubes with related emitted X-rayspectra : a. Ca-anode, 8kV, 0.1 mA by Hamamatsu ; b.Mo-anode, 30 kV, 0.2 mA by Oxford; c. W-anode battery-operated, 40 kV, 0.1 mA by Moxtek.
16

17
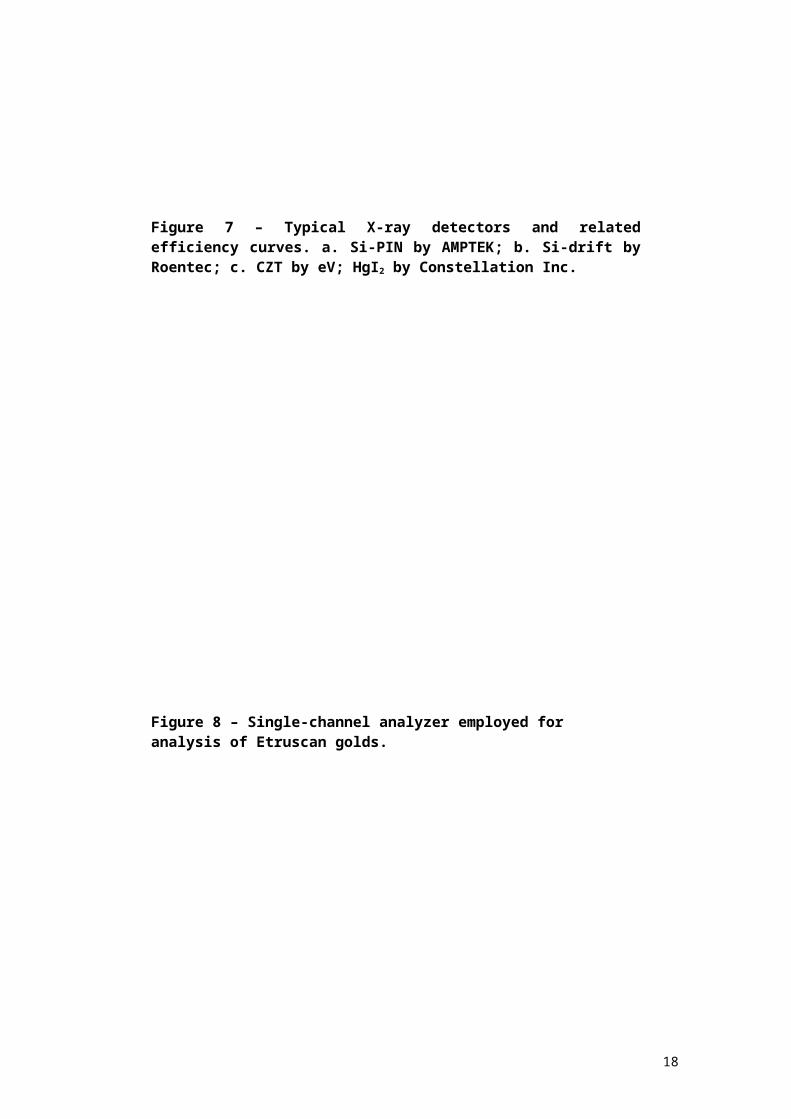
Figure 7 – Typical X-ray detectors and relatedefficiency curves. a. Si-PIN by AMPTEK; b. Si-drift byRoentec; c. CZT by eV; HgI2 by Constellation Inc.
Figure 8 – Single-channel analyzer employed for analysis of Etruscan golds.
18
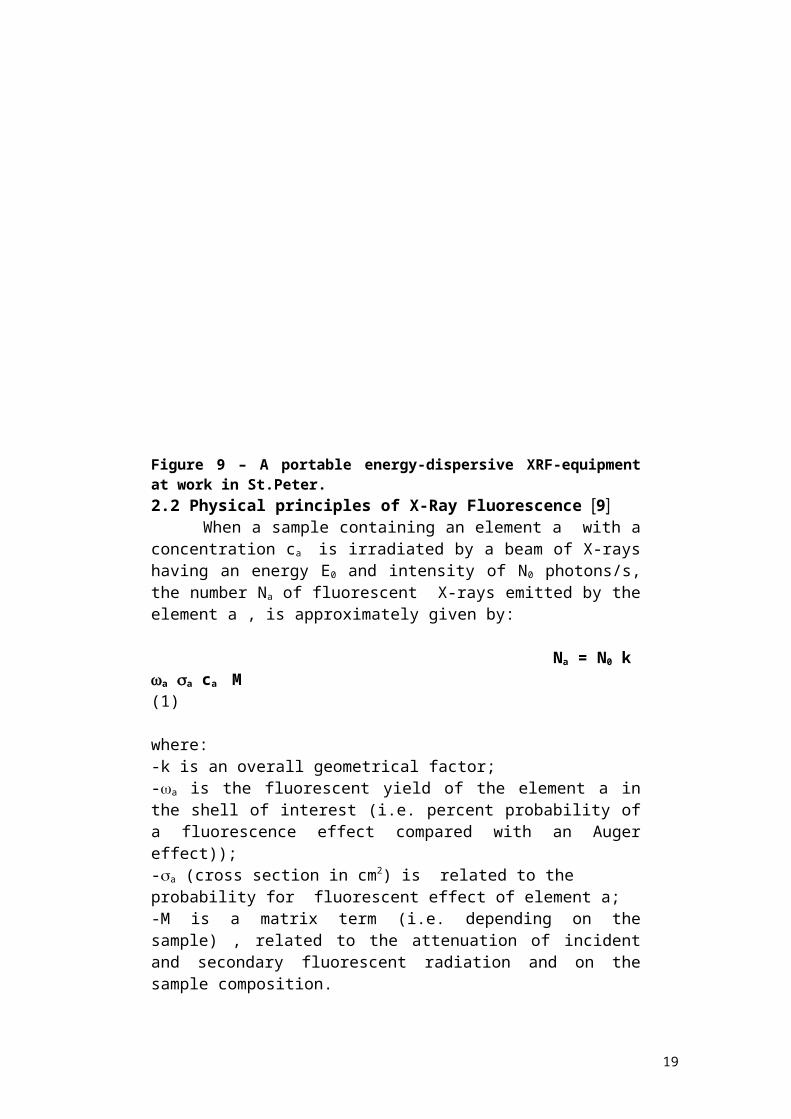
Figure 9 – A portable energy-dispersive XRF-equipmentat work in St.Peter.2.2 Physical principles of X-Ray Fluorescence 9 When a sample containing an element a with aconcentration ca is irradiated by a beam of X-rayshaving an energy E0 and intensity of N0 photons/s,the number Na of fluorescent X-rays emitted by theelement a , is approximately given by:
Na = N0 k a a ca M (1)
where:-k is an overall geometrical factor;-a is the fluorescent yield of the element a inthe shell of interest (i.e. percent probability ofa fluorescence effect compared with an Augereffect));-a (cross section in cm2) is related to the probability for fluorescent effect of element a;-M is a matrix term (i.e. depending on thesample) , related to the attenuation of incidentand secondary fluorescent radiation and on thesample composition.
19
It is very useful to consider two extremeconditions related to the sample thickness:
2.2.1 Thick samples 9 Artifacts like statues, columns, alloys andetc., generally appear to EDXRF analysis as"infinitely thick samples", in the sense that thesize of the objects is infinitely large withrespect to the “radiation penetration” (see Table 2for values of radiation penetration). When a “thick” sample is irradiated by photonsof proper energy, it emits secondary photons whichare characteristic X-rays from the elementscomposing the sample . When a generic element a with concentrationca , in an infinitely thick and homogeneous sampleis irradiated with N0 incident photons, thesecondary fluorescent X-ray intensity Na isgiven by :
Na = No k a ca ph.a (E 0 ) / t (E 0 ) + t (Ea ) (2)where: k is an overall geometric and intrinsic efficiency;a is the fluorescence yield of element a ; ph.a
(E o ) represents the photoelectric attenuationcoefficient of element a at incident energy E o ; t (E o ) and t (E a ) represent the totalattenuation coefficient of the sample at incidentand fluorescent energies (E 0 and E a )respectively. As observed above, besides fluorescent X-rays,given by Eq. (1), the X-ray spectrum emitted by theirradiated “infinitely thick”sample is alsocomposed by scattered photons, which intensityNsc (mainly due to Compton scattering) isapproximately given by:
Nsc N0 k sc(E0)/ 2 t (E0) (3)
20
where:sc(E0) and t(E0) are the scattering and the totalattenuation coefficient of the sample at incidentenergy E0 respectively. Scattered radiation is generally a disturbing effect that should be reduced as much as possible, but it can also be employed for normalization purposes. Equations (1) and (2) are strictly valid forthick samples and for monoenergetic incidentradiation. It may be calculated that for low valuesof ca (10-15%) or for limited ca intervals, Eq.(1) yields approximately a linear relationshipbetween Na and ca (Figure 10) 19. Standard samples are required for anexperimental test of Eq.(1) and to quantitativelyestablish the correlation between N a and c a .
Figure 10 – Correlation between counts andconcentration for iron in the situation of a thicksample.
2.2.2 Thin samples 9
21
In the case of thin samples, primary andsecondary X-rays are characterized by a penetrationdepth much larger than the sample thickness. Inthis case the matrix term in Eq. (1) isapproximately equal to 1, and Eq. (1) will be givenby:
Na = N0 k a
a ca (4)
i.e. counts of element a are linearly proportionalto its concentration (Figure 11). Intensity Nsc of scattered photons in the caseof thin samples (mainly due to Compton scattering)is approximately given by:
Nsc N0 k sc(E0) m (5)
where m (in g/cm2) is the mass per unit area of thesample.
Artifacts are often thin samples. For example,in the case of frescoes, (see Section 4b), there isa thick layer of plaster over which thin layerscontaining the pigments were painted (with athickness from fractions of mm to mm). Finally,over the pictorial layer there is, in many cases athin layer due to pollution effects (tenths of m)containing sulphur, typically in the form of CaSO4
20. For example, when this sulfur is analyzed,then the pathway of its K- radiation is comparableto the thickness of gypsum. The same occurs whenelements from Fe to Ag are analyzed: the K-radiation penetration is of the same order ofmagnitude of the pigments layer. A quantitativeapproach is therefore, extremely difficult in thiscase and generally not useful.
22
When radiation from a X-ray tube penetratesthe pigments of a fresco or of a painting, it isabsorbed along its path. A fraction of the energyof the absorbed photons is converted intofluorescent photons of the various elements, andsome of them, according to the thickness of theinvolved layers, reach the surface of the frescoand are detected. In the case of a fresco, the deepest layer isgiven by the plaster. Superimposed there is thepreparation, and above one or more pigment layers,generally thin. In the case of a painting, the deepest layeris given by the canvas or the wood. Superimposedthere is again the preparation, and above one ormore thin pigment layers.
23
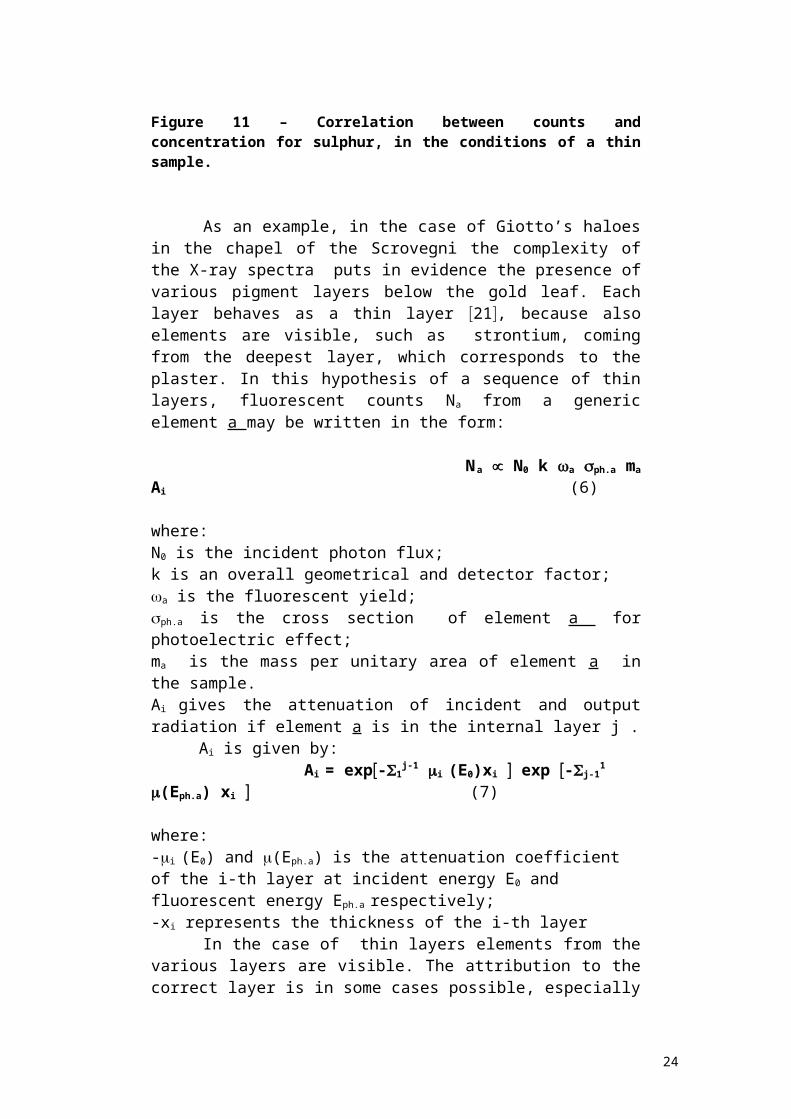
Figure 11 – Correlation between counts andconcentration for sulphur, in the conditions of a thinsample.
As an example, in the case of Giotto’s haloesin the chapel of the Scrovegni the complexity ofthe X-ray spectra puts in evidence the presence ofvarious pigment layers below the gold leaf. Eachlayer behaves as a thin layer 21, because alsoelements are visible, such as strontium, comingfrom the deepest layer, which corresponds to theplaster. In this hypothesis of a sequence of thinlayers, fluorescent counts Na from a genericelement a may be written in the form: N a µ N0 k a ph.a ma
Ai (6)
where: N0 is the incident photon flux; k is an overall geometrical and detector factor; a is the fluorescent yield; ph.a is the cross section of element a forphotoelectric effect; ma is the mass per unitary area of element a inthe sample.Ai gives the attenuation of incident and outputradiation if element a is in the internal layer j . Ai is given by: Ai = exp-S1
j-1 i (E0)xi exp -Sj-11
(Eph.a) xi (7)
where:-i (E0) and (Eph.a) is the attenuation coefficient of the i-th layer at incident energy E0 and fluorescent energy Eph.a respectively;-xi represents the thickness of the i-th layer In the case of thin layers elements from thevarious layers are visible. The attribution to thecorrect layer is in some cases possible, especially
24

when heavy elements are present in a deep layer,and L-lines of these elements (gold, lead) arepresent and clearly visible. In these cases theapproximate thickness of the pigments may becalculated by the differential attenuation of L-lines, and/or autoattenuation. For example the ratio R= L /L for a heavyelement, following auto attenuation in the sameelement present in a pigment and having thicknessx, is given by: R = (0+2)/(0+1)(1-exp-(0+1)rx)/(1-exp-(0+2)rx (8)
where-0 , 1, 2 are the mass attenuation coefficients(in cm2/g) at incident and at L and L energiesrespectively;-r is the physical density of the sample (ing/cm3);-x is the thickness of the sample. Differential attenuation of L and L X-raysof a heavy element a (for example lead) present inthe second layer by another heavy element b (forexample gold present in the first layer, as in thecase of gold halos which will be discussed later)is given by:
L /La = L /La0 exp-(2-1rx)b (9)
where L /La0 represents the L /L ratio (for exampleof lead) simply autoattenuated.The term (2-1) is positive for example for goldattenuation, because of the gold edges, andnegative for example for tin.Figure 12 shows the attenuation coefficients ofgold, lead and tin versus energy 22, and Figure13 the ratio R= L /L for lead L-linesattenuated by a gold leaf or by a tin sheet.
25
Figure 12 – Mass attenuation coefficients of lead andgold versus energy (in keV). Pb-L and Pb-L bracketsthe gold L photoelectric discontinuity and aretherefore absorbed in a different manner by differentAu-thicknesses. The Pb-L/Pb-L ratio allows,therefore, the determination of the Au-thickness.
26

27
Figure 13 – Ratio of L/L Pb- lines attenuated by agold leaf, versus Au thickness x, following Eq. 9. A similar, but opposite phenomenon allows thedetermination of a tin sheet located above a whitelead pigment.
3.COMPONENTS OF A PORTABLE EDXRF EQUIPMENT A portable EDXRF system is composed of a Xor -ray source (a X-ray tube or, in some cases aradioactive source), of a X-ray detector(generally a semiconductor detectorthermoelectrically cooled ) and of a multichannelanalyzer (Figure 14).
3.1 – Radiation sources The optimal radiation source for a portableEDXRF equipment should have the following features:-small size and weight;-good stability versus time;-sufficiently flexibility in terms of energy andintensity.
a.radioactive sources A few radioactive sources are compatible withthe conditions above cited, and can be, therefore,used in a portable EDXRF equipment. Among them themost important are listed in Table 6 : Radioactive sources are small and stable, andthey have a fixed energy and intensity output.However the photon flux is generally too low formany applications, also in the field ofarchaeometry, and it is not flexible in terms ofenergy . b. X-ray tubes Due to the relatively low cost of small sizelow power x-ray tubes, dedicated X-ray tubes are
28
available for each type of problem and coupled toa specific detector 23 . They should becharacterized by:-high voltage between 5 and 40 kV approximately;-current between 10 and 1000 A; For low atomic number elements (from 11 to19, including sulfur and chlorine), a low-powerCa-anode X-ray tube may be employed 24, workingat 6-8 kV, 0.1-0.3 mA maximum voltage andcurrent . For the elements with Z from 11 to 17also a low-power Pd or Ag-anode X-ray tube may beemployed, working at about 5-6 kV and hundreds ofmA 23 . In this case the L-lines of Pd or Ag areused for excitation, which energy of 2.8 to 3.2 keVis close to the excitation energy of theseelements. The last two X-ray tubes, working at 30-35 kVcan be employed also for excitation of medium (K-lines) and high (L-lines) atomic number elements.A W-anode X-ray tube working at 40 kV, 0.1 mAmay be also employed, especially when elements fromAg to Sn should be analyzed.
29
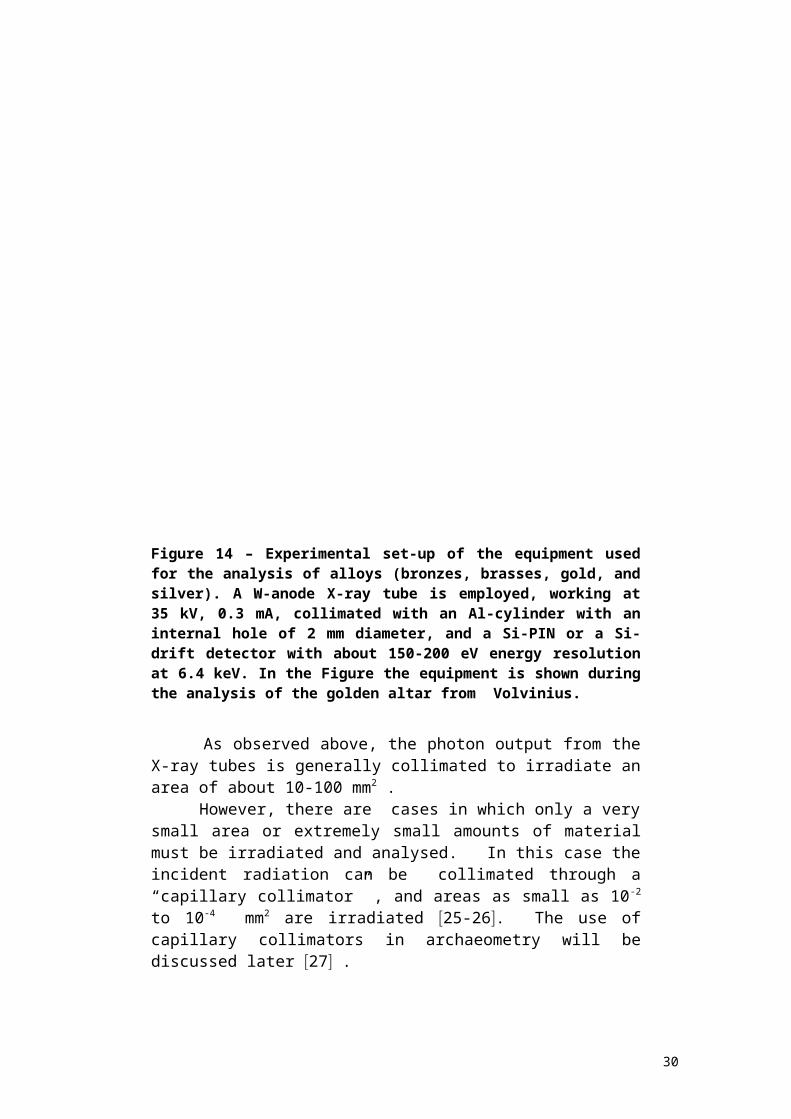
Figure 14 – Experimental set-up of the equipment usedfor the analysis of alloys (bronzes, brasses, gold, andsilver). A W-anode X-ray tube is employed, working at35 kV, 0.3 mA, collimated with an Al-cylinder with aninternal hole of 2 mm diameter, and a Si-PIN or a Si-drift detector with about 150-200 eV energy resolutionat 6.4 keV. In the Figure the equipment is shown duringthe analysis of the golden altar from Volvinius.
As observed above, the photon output from theX-ray tubes is generally collimated to irradiate anarea of about 10-100 mm2 . However, there are cases in which only a verysmall area or extremely small amounts of materialmust be irradiated and analysed. In this case theincident radiation can be collimated through a“capillary collimator” , and areas as small as 10-2
to 10-4 mm2 are irradiated 25-26. The use ofcapillary collimators in archaeometry will bediscussed later 27 .
30
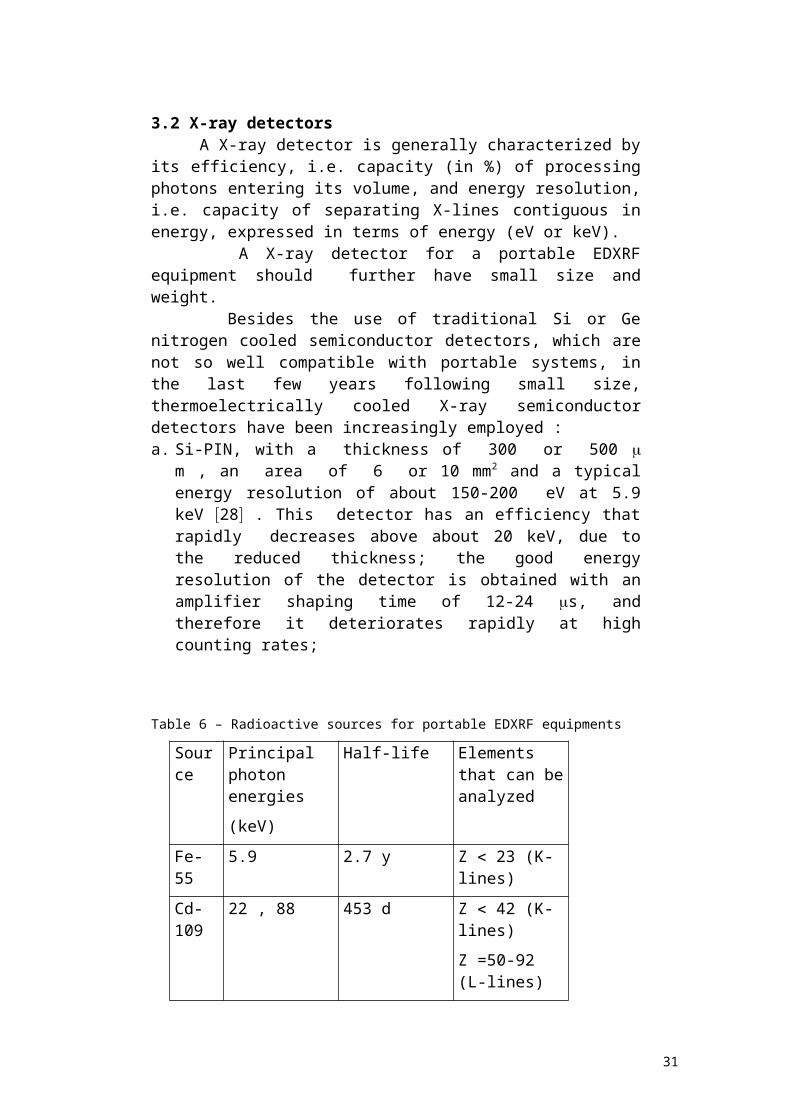
3.2 X-ray detectors A X-ray detector is generally characterized byits efficiency, i.e. capacity (in %) of processingphotons entering its volume, and energy resolution,i.e. capacity of separating X-lines contiguous inenergy, expressed in terms of energy (eV or keV). A X-ray detector for a portable EDXRFequipment should further have small size andweight. Besides the use of traditional Si or Genitrogen cooled semiconductor detectors, which arenot so well compatible with portable systems, inthe last few years following small size,thermoelectrically cooled X-ray semiconductordetectors have been increasingly employed : a. Si-PIN, with a thickness of 300 or 500
m , an area of 6 or 10 mm2 and a typicalenergy resolution of about 150-200 eV at 5.9keV 28 . This detector has an efficiency thatrapidly decreases above about 20 keV, due tothe reduced thickness; the good energyresolution of the detector is obtained with anamplifier shaping time of 12-24 s, andtherefore it deteriorates rapidly at highcounting rates;
Table 6 – Radioactive sources for portable EDXRF equipments
Source
Principal photon energies(keV)
Half-life Elements that can beanalyzed
Fe-55
5.9 2.7 y Z 23 (K-lines)
Cd-109
22 , 88 453 d Z 42 (K-lines)Z =50-92 (L-lines)
31
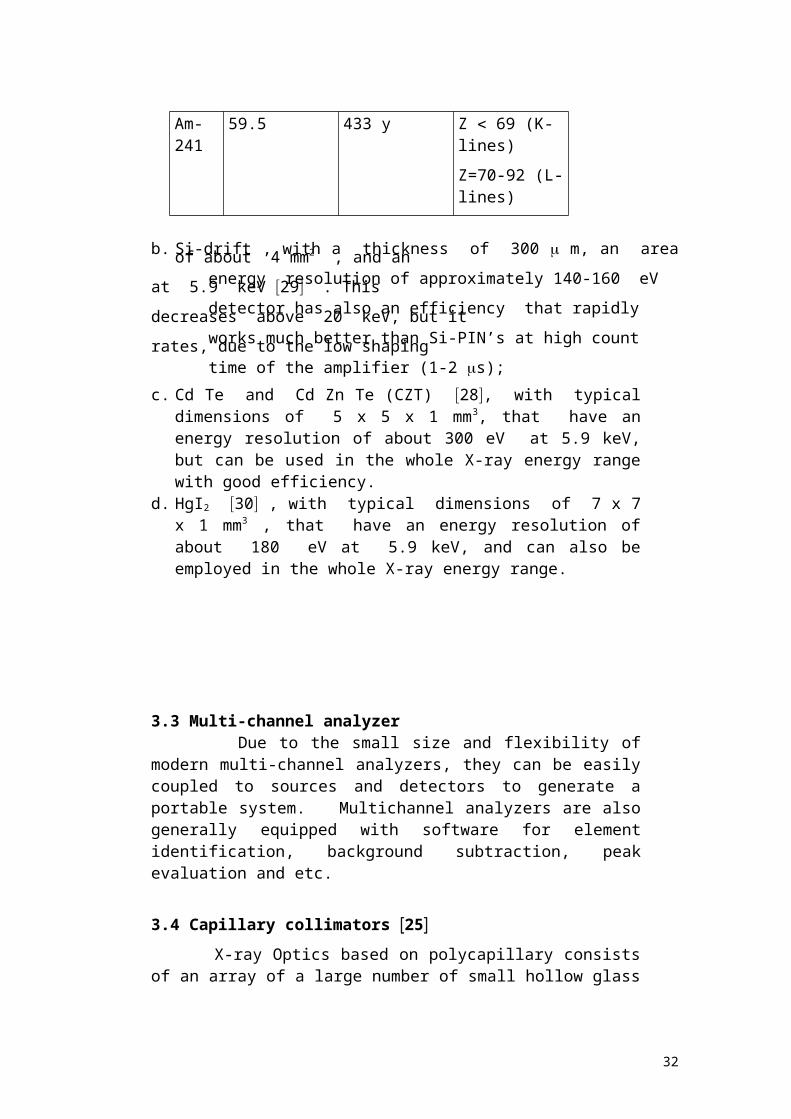
Am-241
59.5 433 y Z 69 (K-lines)Z=70-92 (L-lines)
b. Si-drift , with a thickness of 300 m, an areaof about 4 mm2 , and an energy resolution of approximately 140-160 eV at 5.9 keV 29 . This detector has also an efficiency that rapidly decreases above 20 keV, but it works much better than Si-PIN’s at high count rates, due to the low shaping time of the amplifier (1-2 s);c. Cd Te and Cd Zn Te (CZT) 28, with typical
dimensions of 5 x 5 x 1 mm3, that have anenergy resolution of about 300 eV at 5.9 keV,but can be used in the whole X-ray energy rangewith good efficiency.
d. HgI2 30 , with typical dimensions of 7 x 7x 1 mm3 , that have an energy resolution ofabout 180 eV at 5.9 keV, and can also beemployed in the whole X-ray energy range.
3.3 Multi-channel analyzer Due to the small size and flexibility ofmodern multi-channel analyzers, they can be easilycoupled to sources and detectors to generate aportable system. Multichannel analyzers are alsogenerally equipped with software for elementidentification, background subtraction, peakevaluation and etc.
3.4 Capillary collimators 25 X-ray Optics based on polycapillary consistsof an array of a large number of small hollow glass
32
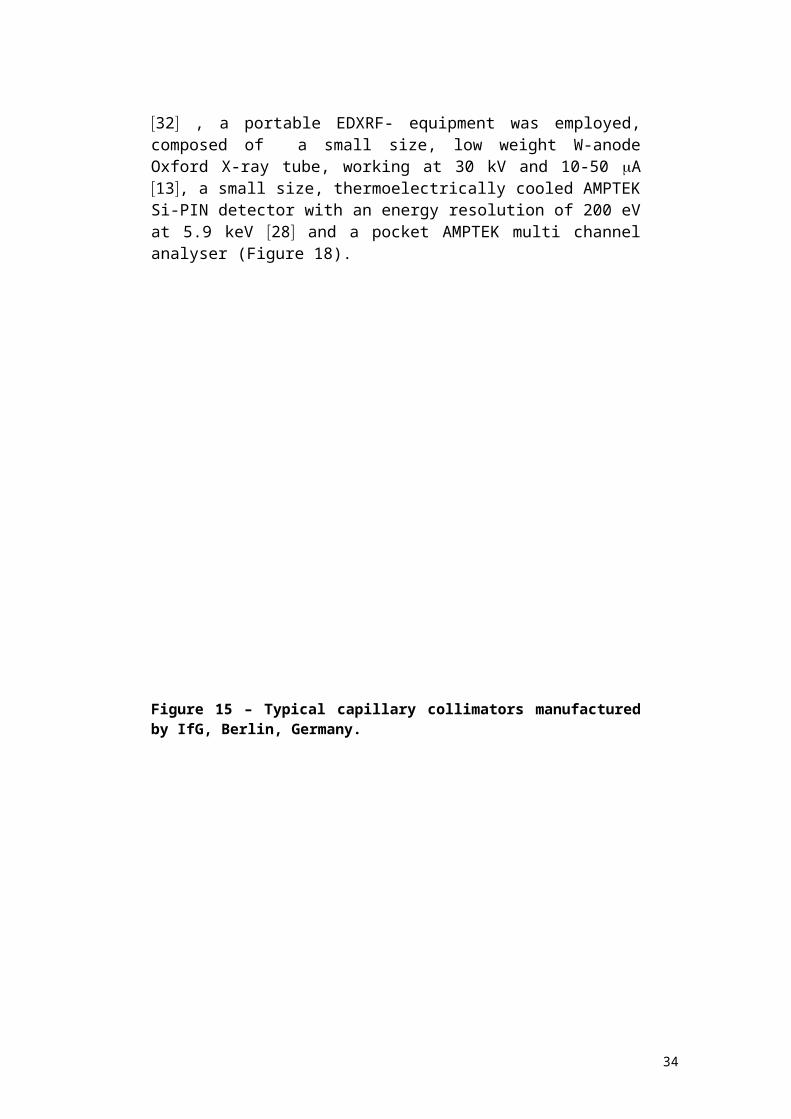
tubes formed into a certain shape. The opticcollects X-rays that emerge from an X-ray sourcewithin a large solid angle and redirects them bymultiple external total reflections to form eithera focused beam or a parallel beam. Small spots of20-50 µm diameter can be obtained. The use of polycapillary optics has becomewidespread in various X-ray analysis applications,and also in the field of archaeometry, where it isoften useful to strongly collimate the incidentbeam, in order to carry out “microanalysis”. Therapid development of capillary optics alsotriggered the development of related X-rayequipment such as microfocus X-ray sources. Monocapillary optics (single tapered channeloptics) also offer further improvement in spaceresolution (spots of 5-25 µm diameter) beyond thatcurrently achieved with polycapillary optics. Capillary collimators are shown in Figure 15,and their effects on a fluorescent X-ray spectrumis shown in Figure 16.
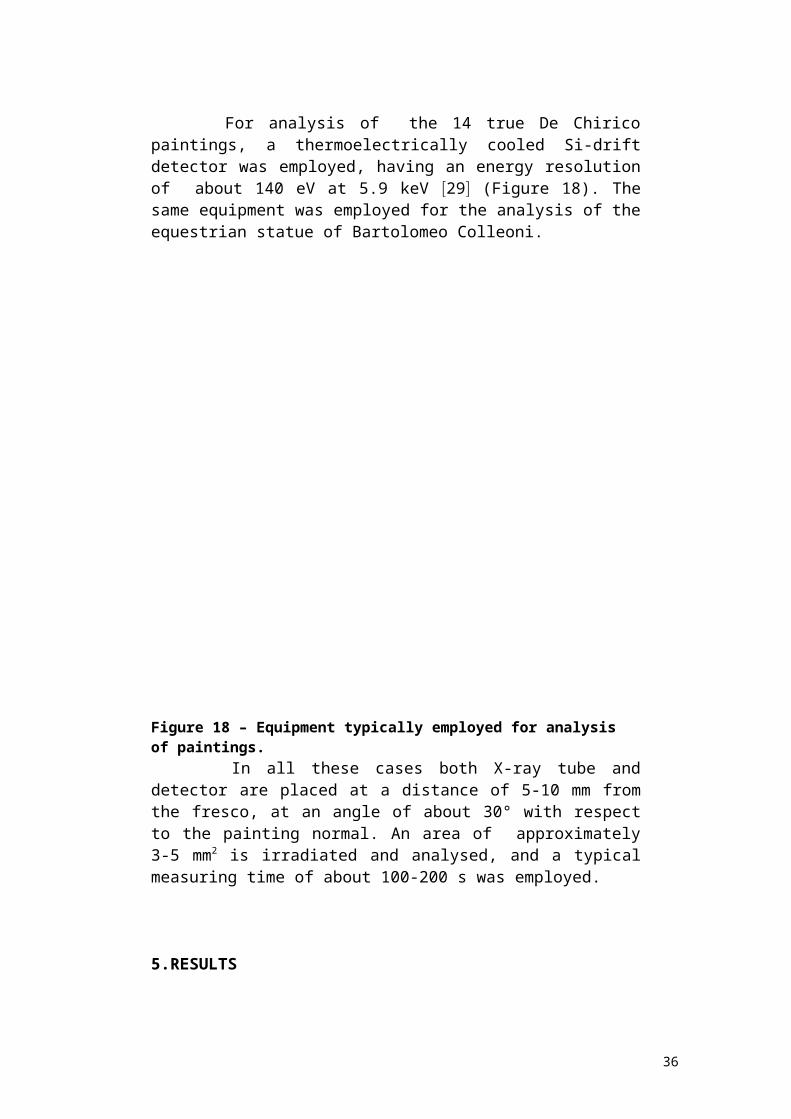
4. EXPERIMENTAL SET-UP For analysis of low atomic number elements(sulphur, chlorine, potassium, calcium) a portableEDXRF-equipment was assembled, composed of a Ca-anode X-ray tube working at 5-8 kV 31 (Figure 17). In this case the incident radiation iscomposed of the Ca-K lines at 3.7 keV, and of thebremsstrahlung radiation. Alternatively, also a Pd-anode X-ray tube wasemployed, working at 4-6 kV 28. In this case theincident radiation is composed of the Pd-L lines at2.9 keV and of the bremsstrahlung radiation. In both cases an AMPTEK thermoelectricallycooled Si-PIN detector was employed, having anenergy resolution of 200 eV at 5.9 keV and coupledto a pocket AMPTEK multi channel analyser 18. For analysis of pigments, both of Giotto’sChapel of the Scrovegni, and De Chirico paintings
33
32 , a portable EDXRF- equipment was employed,composed of a small size, low weight W-anodeOxford X-ray tube, working at 30 kV and 10-50 A13, a small size, thermoelectrically cooled AMPTEKSi-PIN detector with an energy resolution of 200 eVat 5.9 keV 28 and a pocket AMPTEK multi channelanalyser (Figure 18).
Figure 15 – Typical capillary collimators manufacturedby IfG, Berlin, Germany.
34
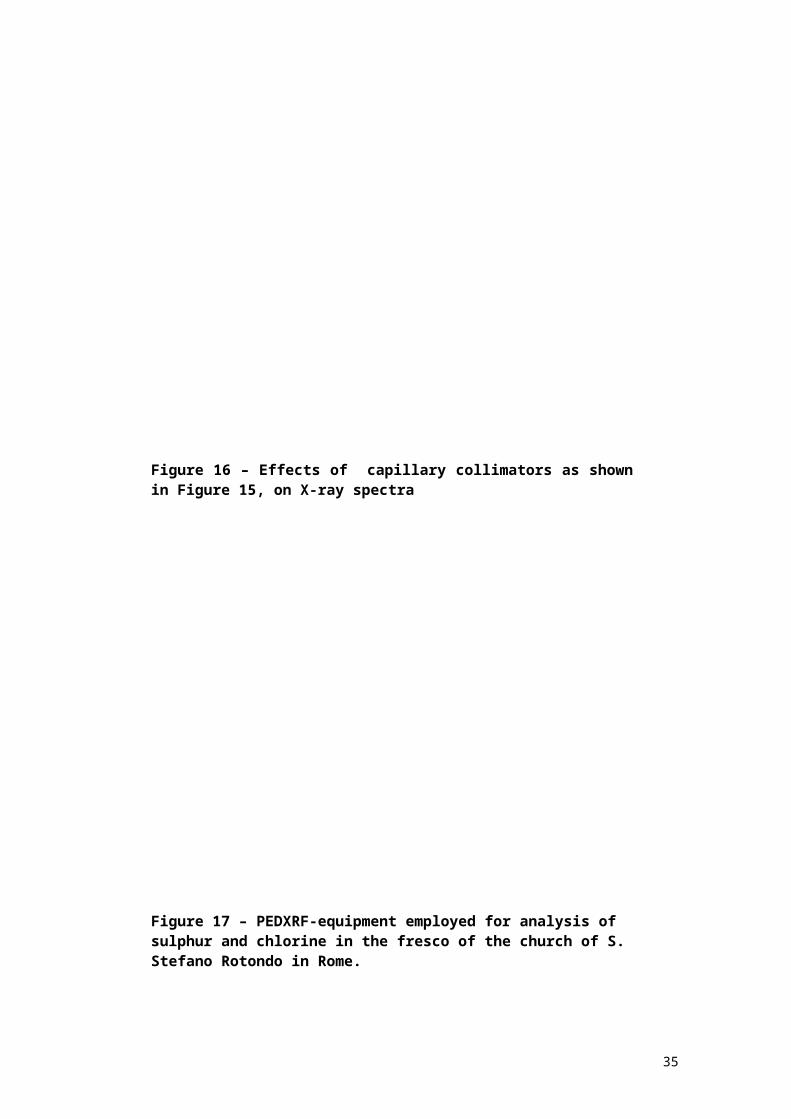
Figure 16 – Effects of capillary collimators as shownin Figure 15, on X-ray spectra
Figure 17 – PEDXRF-equipment employed for analysis of sulphur and chlorine in the fresco of the church of S. Stefano Rotondo in Rome.
35
For analysis of the 14 true De Chiricopaintings, a thermoelectrically cooled Si-driftdetector was employed, having an energy resolutionof about 140 eV at 5.9 keV 29 (Figure 18). Thesame equipment was employed for the analysis of theequestrian statue of Bartolomeo Colleoni.
Figure 18 – Equipment typically employed for analysis of paintings. In all these cases both X-ray tube anddetector are placed at a distance of 5-10 mm fromthe fresco, at an angle of about 30° with respectto the painting normal. An area of approximately3-5 mm2 is irradiated and analysed, and a typicalmeasuring time of about 100-200 s was employed.
5.RESULTS
36
In the following are reported some selectedresults obtained in the field of archaeometry, inthe case of bronzes, paintings and frescos and goldartefacts.
5.1.Bronzes: The Perseo by Benvenuto Cellini 33The huge statue of Perseo by Benvenuto Cellini (completed in 1554 and located in Piazzadella Signoria in Florence), composed of 1800 Kg of bronze was analyzed during the restoration process in the Uffizi Museum in Florence . The Perseo (figure 19) is composed of two parts: the Perseo itself and the Medusa ; additionally someaccessories were analyzed, such as the sword. These bronzes are covered by a thick patina,and therefore 10 areas of about 5x5 mm2 werecleaned before the analysis. In addition, 4 micro-samples were withdrawn and 2 metallographicsamples. All these samples were analyzed by EDXRF with metallographic and electric conducibility studies performed as well 34 . The results were generally consistent. Typical X-ray spectra ofPerseo and Medusa are shown in the same Figure 18. The mean values of Perseo and Medusa bronzes are shown in Table 7.
Table 7- Mean concentration values (in %) of Perseo and Medusa bronzesObject
Cu Fe Pb Ag Sn Sb
Perseo
94 1.5
0.5 0.3
2.2 0.3
0.05 0.1
2.5 0.3
0.6 0.3
Medusa
90 2
0.4 0.3
1.2 0.3
0.05 0.1
7.0 0.3
0.4 0.2
From the results of Table 3 it appears clearthat Perseo and Medusa have differentcompositions.
37

Following Benvenuto Cellini , due to problemsduring the casting of the Perseo he threw in thefusion 60 pounds of Sn and 22 english dishes (whichcontain about 10% Sb).This could be compatible withthe results of Table 7.
38
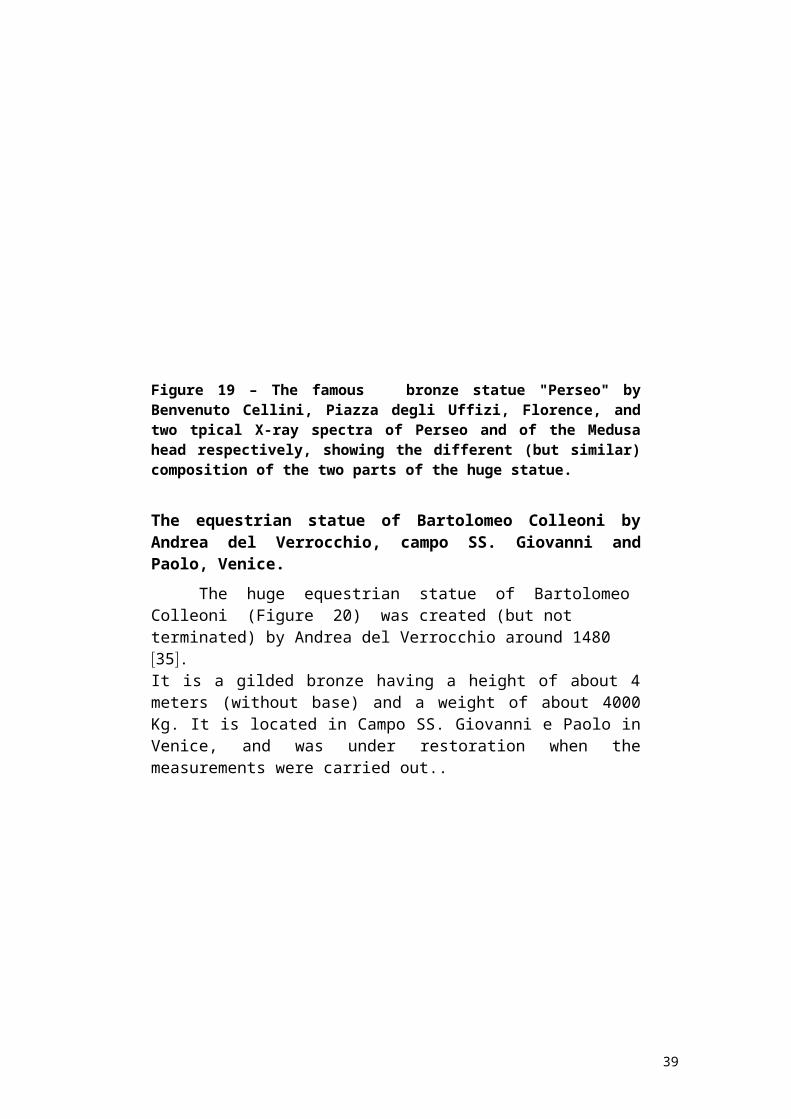
Figure 19 – The famous bronze statue "Perseo" byBenvenuto Cellini, Piazza degli Uffizi, Florence, andtwo tpical X-ray spectra of Perseo and of the Medusahead respectively, showing the different (but similar)composition of the two parts of the huge statue.
The equestrian statue of Bartolomeo Colleoni byAndrea del Verrocchio, campo SS. Giovanni andPaolo, Venice. The huge equestrian statue of Bartolomeo Colleoni (Figure 20) was created (but not terminated) by Andrea del Verrocchio around 1480 35.It is a gilded bronze having a height of about 4meters (without base) and a weight of about 4000Kg. It is located in Campo SS. Giovanni e Paolo inVenice, and was under restoration when themeasurements were carried out..
39
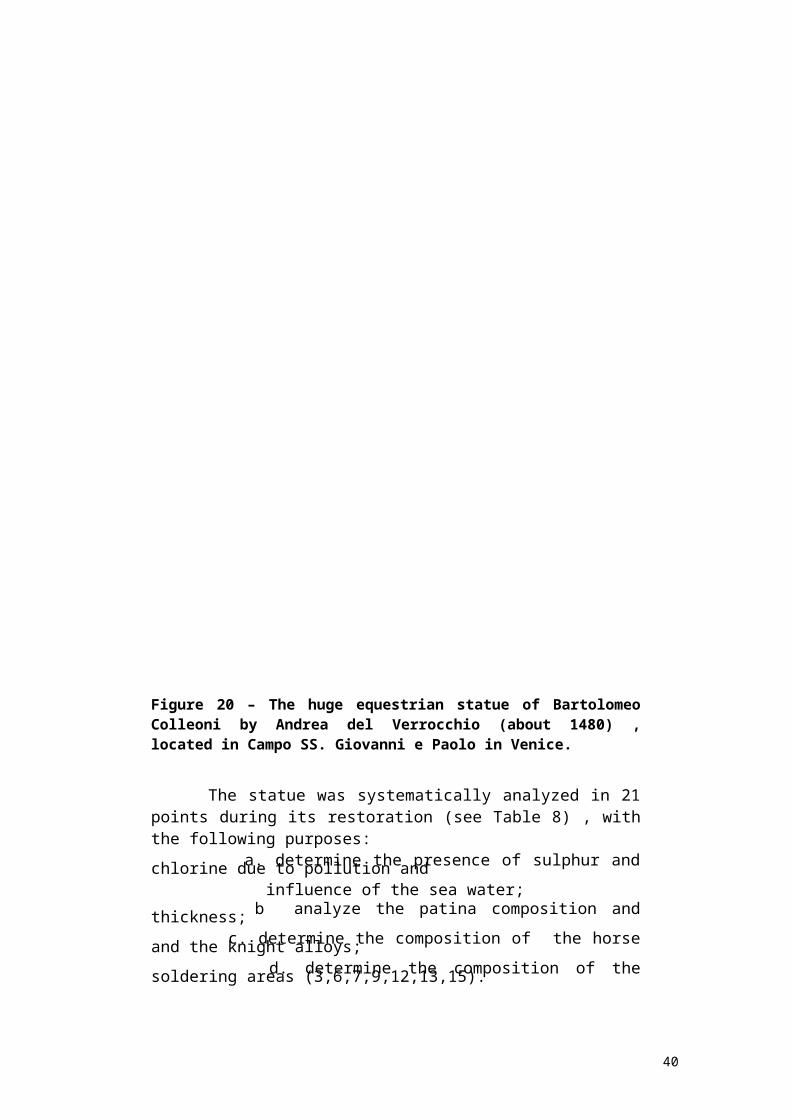
Figure 20 – The huge equestrian statue of BartolomeoColleoni by Andrea del Verrocchio (about 1480) ,located in Campo SS. Giovanni e Paolo in Venice.
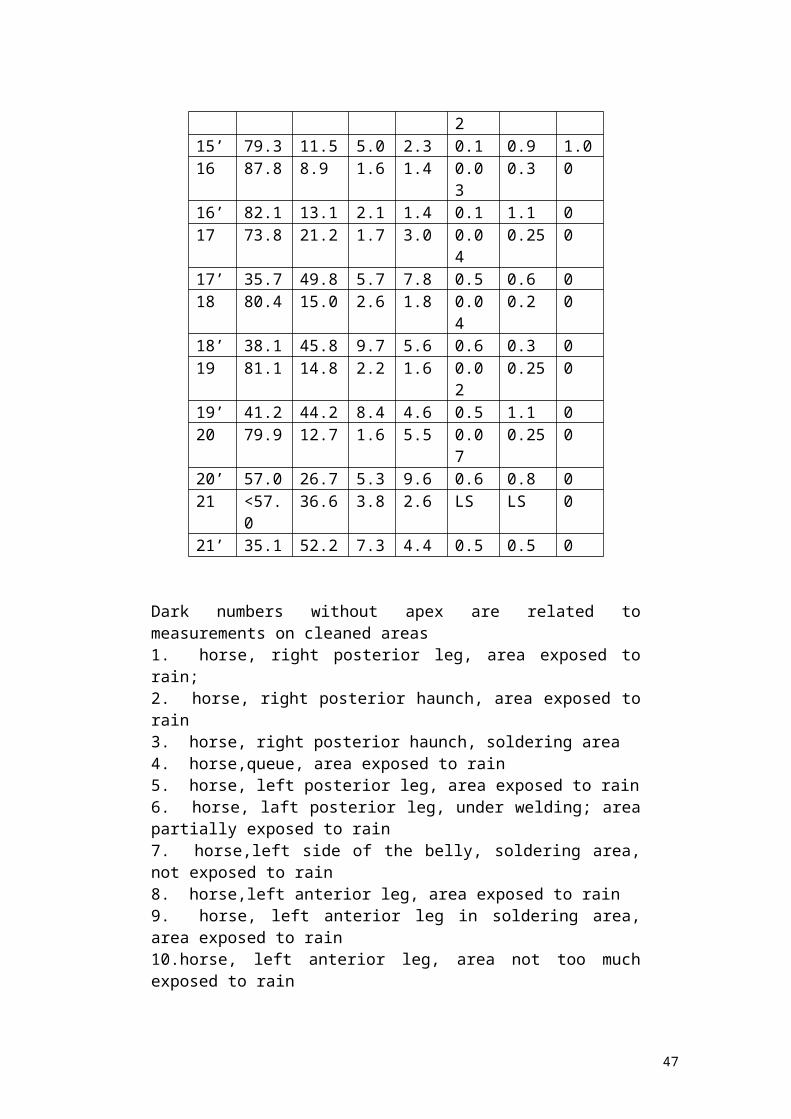
The statue was systematically analyzed in 21points during its restoration (see Table 8) , withthe following purposes: a. determine the presence of sulphur andchlorine due to pollution and influence of the sea water; b analyze the patina composition andthickness; c. determine the composition of the horseand the knight alloys; d. determine the composition of thesoldering areas (3,6,7,9,12,13,15).
40
To this aim 21 points were selected, and firstanalyzed without any cleaning of the surface, inorder to clarify points a. and b. Further, an areaof few mm2 of these 21 points were completelycleaned to remove patina and analyzed.Following results were obtained: a.sulphur and chlorine are present almosteverywhere on the surface of the statue (see Table 8). It is not easyto exactly determine their concentration but it should range in the orderof percents to tens percent; a typical X-ray spectrum showing the presenceof S and Cl is shown in Figure 21;
41
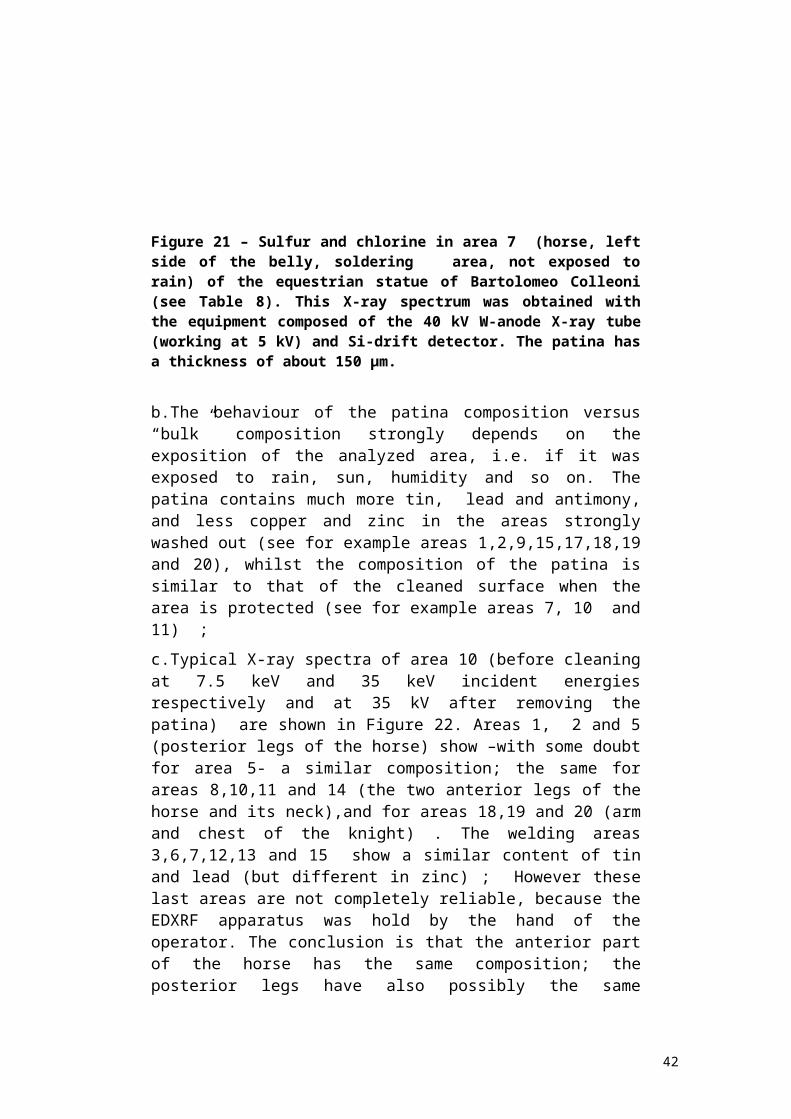
Figure 21 – Sulfur and chlorine in area 7 (horse, leftside of the belly, soldering area, not exposed torain) of the equestrian statue of Bartolomeo Colleoni(see Table 8). This X-ray spectrum was obtained withthe equipment composed of the 40 kV W-anode X-ray tube(working at 5 kV) and Si-drift detector. The patina hasa thickness of about 150 µm.
b.The behaviour of the patina composition versus“bulk” composition strongly depends on theexposition of the analyzed area, i.e. if it wasexposed to rain, sun, humidity and so on. Thepatina contains much more tin, lead and antimony,and less copper and zinc in the areas stronglywashed out (see for example areas 1,2,9,15,17,18,19and 20), whilst the composition of the patina issimilar to that of the cleaned surface when thearea is protected (see for example areas 7, 10 and11) ;c.Typical X-ray spectra of area 10 (before cleaningat 7.5 keV and 35 keV incident energiesrespectively and at 35 kV after removing thepatina) are shown in Figure 22. Areas 1, 2 and 5(posterior legs of the horse) show –with some doubtfor area 5- a similar composition; the same forareas 8,10,11 and 14 (the two anterior legs of thehorse and its neck),and for areas 18,19 and 20 (armand chest of the knight) . The welding areas3,6,7,12,13 and 15 show a similar content of tinand lead (but different in zinc) ; However theselast areas are not completely reliable, because theEDXRF apparatus was hold by the hand of theoperator. The conclusion is that the anterior partof the horse has the same composition; theposterior legs have also possibly the same
42
composition. The queue was superimposed at adifferent time. Concerning the knight, the superiorpart has a similar composition. The left leg seemsto be a different composition, so as the helmet,which has a quite different composition. However inarea 17 tin content is strongly dependent on thecleaning, and cannot be excluded that a small partof the irradiated area could be not enough cleaned.The same consideration could be made for areas 1and 2. (Table 8).
43

Figure 22 – X-ray spectra of area 10 of the equestrianstatue of Bartolomeo Colleoni before removing patina
44
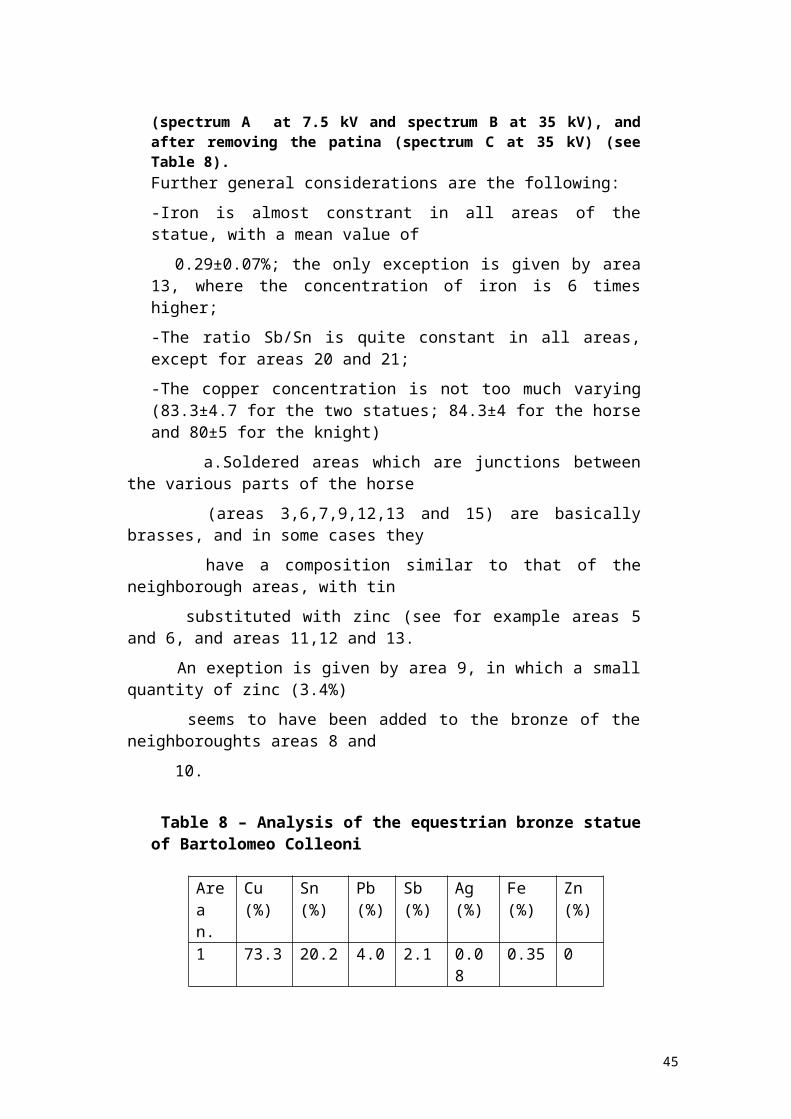
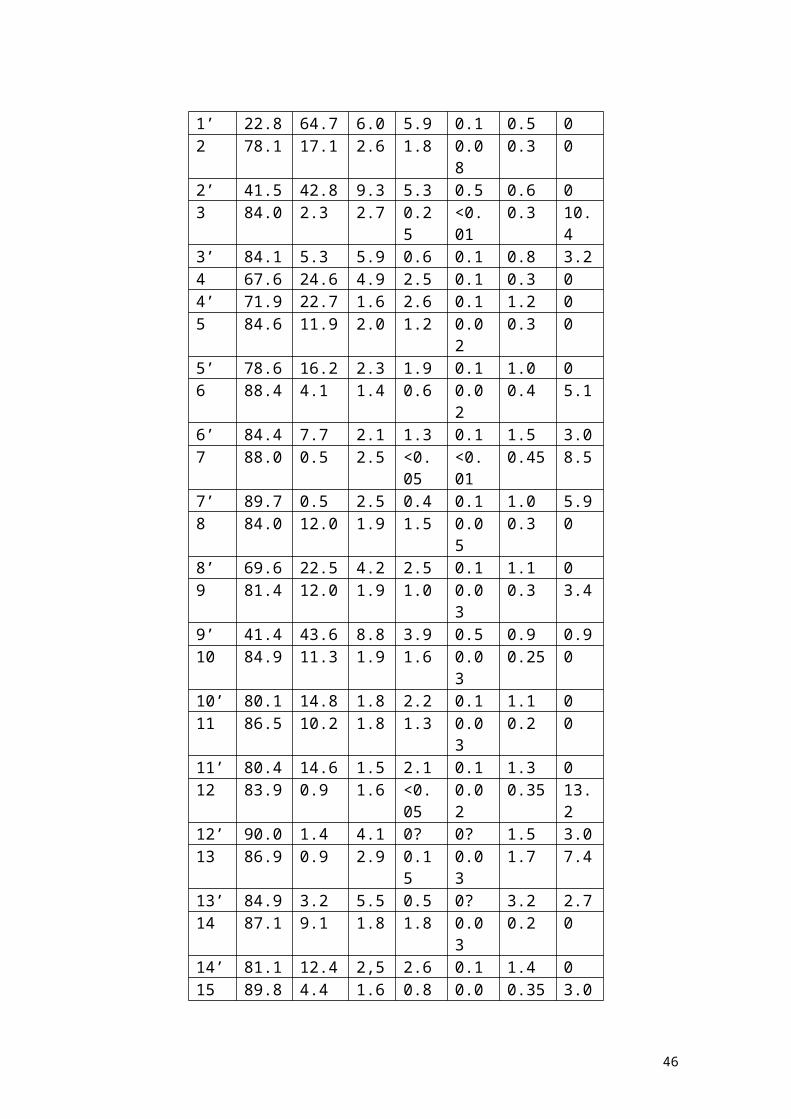
(spectrum A at 7.5 kV and spectrum B at 35 kV), andafter removing the patina (spectrum C at 35 kV) (seeTable 8). Further general considerations are the following:-Iron is almost constrant in all areas of thestatue, with a mean value of 0.29±0.07%; the only exception is given by area13, where the concentration of iron is 6 timeshigher;-The ratio Sb/Sn is quite constant in all areas,except for areas 20 and 21;-The copper concentration is not too much varying(83.3±4.7 for the two statues; 84.3±4 for the horseand 80±5 for the knight)
a.Soldered areas which are junctions betweenthe various parts of the horse (areas 3,6,7,9,12,13 and 15) are basicallybrasses, and in some cases they have a composition similar to that of theneighborough areas, with tin substituted with zinc (see for example areas 5and 6, and areas 11,12 and 13. An exeption is given by area 9, in which a smallquantity of zinc (3.4%) seems to have been added to the bronze of theneighboroughts areas 8 and 10.
Table 8 – Analysis of the equestrian bronze statueof Bartolomeo Colleoni
Arean.
Cu(%)
Sn(%)
Pb(%)
Sb(%)
Ag(%)
Fe(%)
Zn(%)
1 73.3 20.2 4.0 2.1 0.08
0.35 0
45
1’ 22.8 64.7 6.0 5.9 0.1 0.5 02 78.1 17.1 2.6 1.8 0.0
80.3 0
2’ 41.5 42.8 9.3 5.3 0.5 0.6 03 84.0 2.3 2.7 0.2
5<0.01
0.3 10.4
3’ 84.1 5.3 5.9 0.6 0.1 0.8 3.24 67.6 24.6 4.9 2.5 0.1 0.3 04’ 71.9 22.7 1.6 2.6 0.1 1.2 05 84.6 11.9 2.0 1.2 0.0
20.3 0
5’ 78.6 16.2 2.3 1.9 0.1 1.0 06 88.4 4.1 1.4 0.6 0.0
20.4 5.1
6’ 84.4 7.7 2.1 1.3 0.1 1.5 3.07 88.0 0.5 2.5 <0.
05<0.01
0.45 8.5
7’ 89.7 0.5 2.5 0.4 0.1 1.0 5.98 84.0 12.0 1.9 1.5 0.0
50.3 0
8’ 69.6 22.5 4.2 2.5 0.1 1.1 09 81.4 12.0 1.9 1.0 0.0
30.3 3.4
9’ 41.4 43.6 8.8 3.9 0.5 0.9 0.910 84.9 11.3 1.9 1.6 0.0
30.25 0
10’ 80.1 14.8 1.8 2.2 0.1 1.1 011 86.5 10.2 1.8 1.3 0.0
30.2 0
11’ 80.4 14.6 1.5 2.1 0.1 1.3 012 83.9 0.9 1.6 <0.
050.02
0.35 13.2
12’ 90.0 1.4 4.1 0? 0? 1.5 3.013 86.9 0.9 2.9 0.1
50.03
1.7 7.4
13’ 84.9 3.2 5.5 0.5 0? 3.2 2.714 87.1 9.1 1.8 1.8 0.0
30.2 0
14’ 81.1 12.4 2,5 2.6 0.1 1.4 015 89.8 4.4 1.6 0.8 0.0 0.35 3.0
46
215’ 79.3 11.5 5.0 2.3 0.1 0.9 1.016 87.8 8.9 1.6 1.4 0.0
30.3 0
16’ 82.1 13.1 2.1 1.4 0.1 1.1 017 73.8 21.2 1.7 3.0 0.0
40.25 0
17’ 35.7 49.8 5.7 7.8 0.5 0.6 018 80.4 15.0 2.6 1.8 0.0
40.2 0
18’ 38.1 45.8 9.7 5.6 0.6 0.3 019 81.1 14.8 2.2 1.6 0.0
20.25 0
19’ 41.2 44.2 8.4 4.6 0.5 1.1 020 79.9 12.7 1.6 5.5 0.0
70.25 0
20’ 57.0 26.7 5.3 9.6 0.6 0.8 021 <57.
036.6 3.8 2.6 LS LS 0
21’ 35.1 52.2 7.3 4.4 0.5 0.5 0
Dark numbers without apex are related tomeasurements on cleaned areas1. horse, right posterior leg, area exposed torain;2. horse, right posterior haunch, area exposed torain3. horse, right posterior haunch, soldering area4. horse,queue, area exposed to rain5. horse, left posterior leg, area exposed to rain6. horse, laft posterior leg, under welding; areapartially exposed to rain7. horse,left side of the belly, soldering area,not exposed to rain8. horse,left anterior leg, area exposed to rain9. horse, left anterior leg in soldering area,area exposed to rain 10.horse, left anterior leg, area not too muchexposed to rain
47
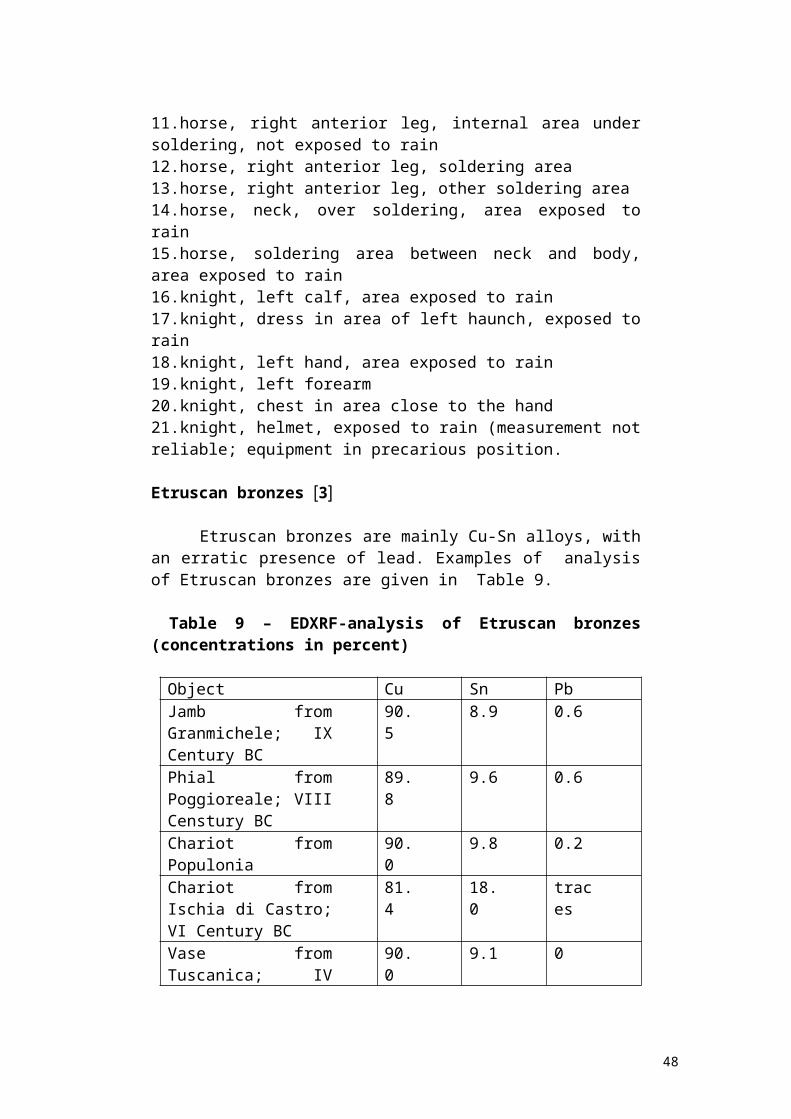
11.horse, right anterior leg, internal area undersoldering, not exposed to rain12.horse, right anterior leg, soldering area13.horse, right anterior leg, other soldering area14.horse, neck, over soldering, area exposed torain15.horse, soldering area between neck and body,area exposed to rain16.knight, left calf, area exposed to rain17.knight, dress in area of left haunch, exposed torain18.knight, left hand, area exposed to rain19.knight, left forearm20.knight, chest in area close to the hand21.knight, helmet, exposed to rain (measurement notreliable; equipment in precarious position.
Etruscan bronzes 3
Etruscan bronzes are mainly Cu-Sn alloys, withan erratic presence of lead. Examples of analysisof Etruscan bronzes are given in Table 9.
Table 9 – EDXRF-analysis of Etruscan bronzes(concentrations in percent)
Object Cu Sn PbJamb fromGranmichele; IXCentury BC
90.5
8.9 0.6
Phial fromPoggioreale; VIIICenstury BC
89.8
9.6 0.6
Chariot fromPopulonia
90.0
9.8 0.2
Chariot fromIschia di Castro;VI Century BC
81.4
18.0
traces
Vase fromTuscanica; IV
90.0
9.1 0
48
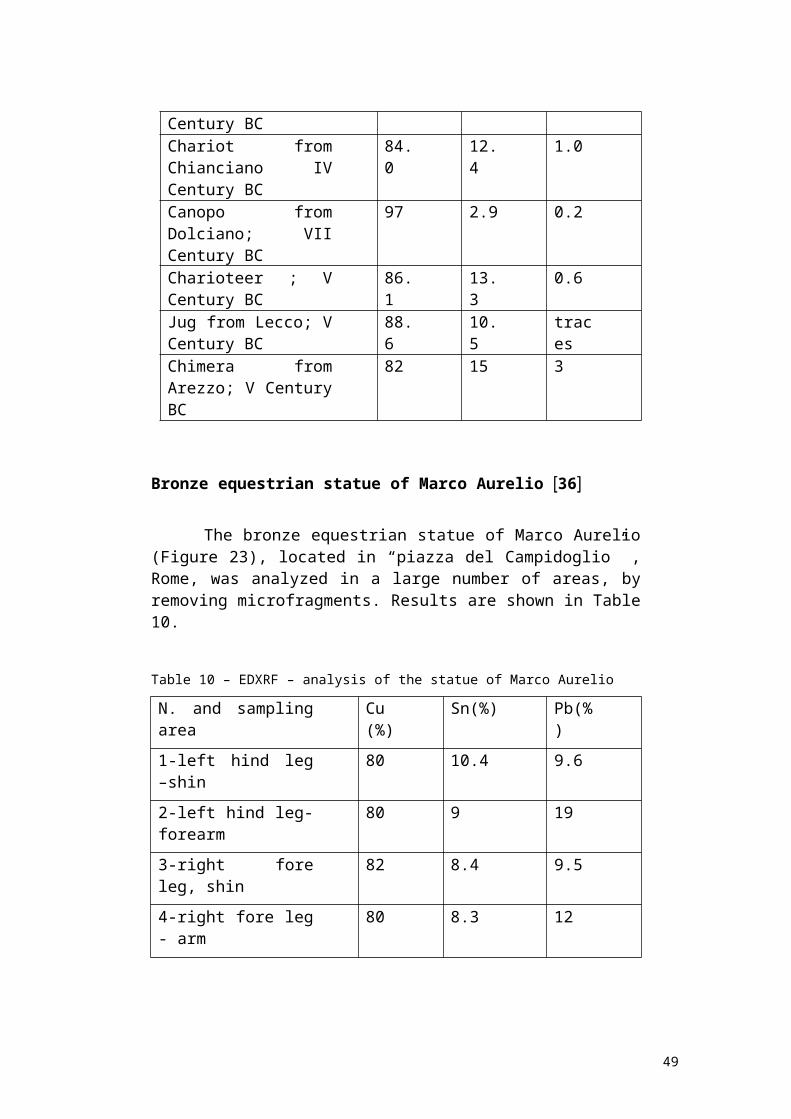
Century BCChariot fromChianciano IVCentury BC
84.0
12.4
1.0
Canopo fromDolciano; VIICentury BC
97 2.9 0.2
Charioteer ; VCentury BC
86.1
13.3
0.6
Jug from Lecco; VCentury BC
88.6
10.5
traces
Chimera fromArezzo; V CenturyBC
82 15 3
Bronze equestrian statue of Marco Aurelio 36
The bronze equestrian statue of Marco Aurelio(Figure 23), located in “piazza del Campidoglio” ,Rome, was analyzed in a large number of areas, byremoving microfragments. Results are shown in Table10.
Table 10 – EDXRF – analysis of the statue of Marco Aurelio
N. and samplingarea
Cu(%)
Sn(%) Pb(%)
1-left hind leg–shin
80 10.4 9.6
2-left hind leg-forearm
80 9 19
3-right foreleg, shin
82 8.4 9.5
4-right fore leg- arm
80 8.3 12
49
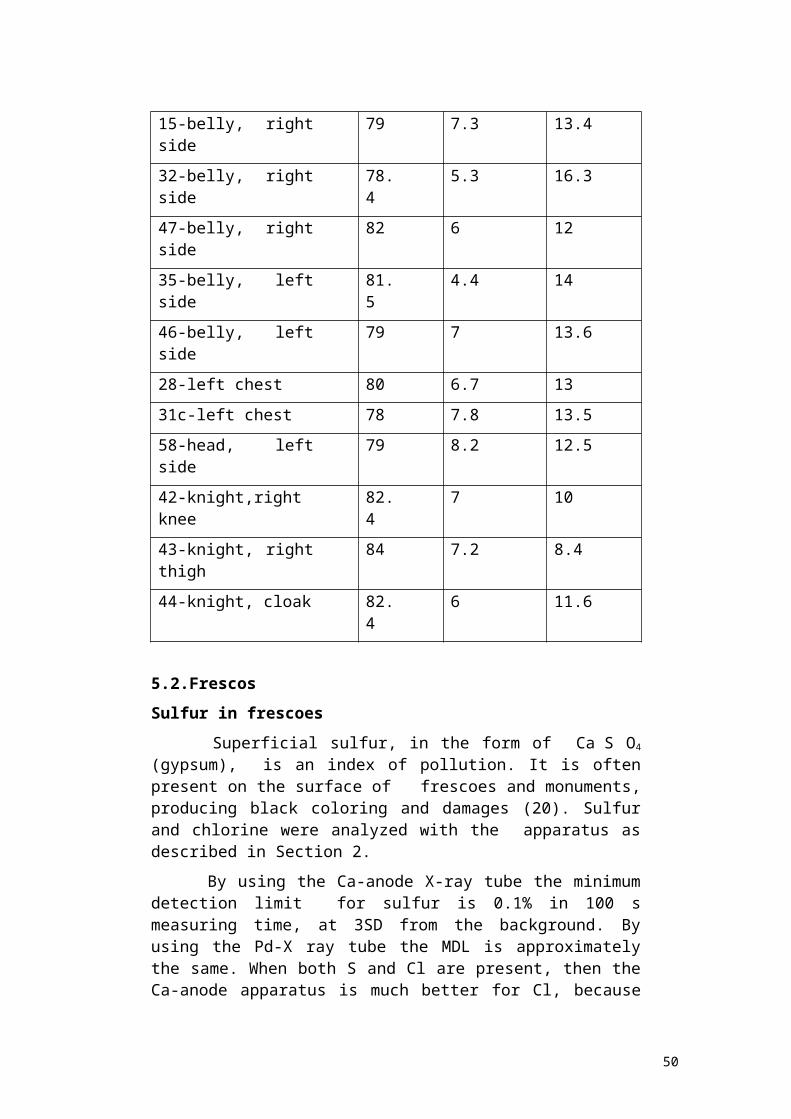
15-belly, rightside
79 7.3 13.4
32-belly, rightside
78.4
5.3 16.3
47-belly, rightside
82 6 12
35-belly, leftside
81.5
4.4 14
46-belly, leftside
79 7 13.6
28-left chest 80 6.7 1331c-left chest 78 7.8 13.558-head, leftside
79 8.2 12.5
42-knight,rightknee
82.4
7 10
43-knight, rightthigh
84 7.2 8.4
44-knight, cloak 82.4
6 11.6
5.2.Frescos Sulfur in frescoes Superficial sulfur, in the form of Ca S O4
(gypsum), is an index of pollution. It is oftenpresent on the surface of frescoes and monuments,producing black coloring and damages (20). Sulfurand chlorine were analyzed with the apparatus asdescribed in Section 2. By using the Ca-anode X-ray tube the minimumdetection limit for sulfur is 0.1% in 100 smeasuring time, at 3SD from the background. Byusing the Pd-X ray tube the MDL is approximatelythe same. When both S and Cl are present, then theCa-anode apparatus is much better for Cl, because
50
the separation between Cl-lines and exciting peakis greater in the first case. The following frescoes were analyzed : a. frescoes attributed to Pomarancio in the churchof S. Stefano Rotondo in Rome, which was under restoration by the “Istituto Centrale del Restauro” of Rome ( see Figure 17). A large number of areas were analyzed 37 and three typical situations were detected : a. inunrestored areas, sulfur was found everywhere atconcentrations up to about 12%; b. areas that weresimply sponged with a proper solution, sulfur wasfound at concentrations between 2% and 4% ; c. inareas accurately treated to remove pollutionlayers, no sulfur was found.b. frescoes of Piero della Francesca, Church of S.Francesco, Arezzo, where sulfur was found practically everywhere 37 ; c. frescoes of Domenichino, Nolfi Chapel, Cathedralof Fano, again sulfur was found everywhere,except in the restored areas 37 .d.ancient roman frescoes, Church of S. Clemente,Rome . In this church both the ancient fresco inthe mithraic school and the fresco in the lowerbasilica were analysed 37 .
51
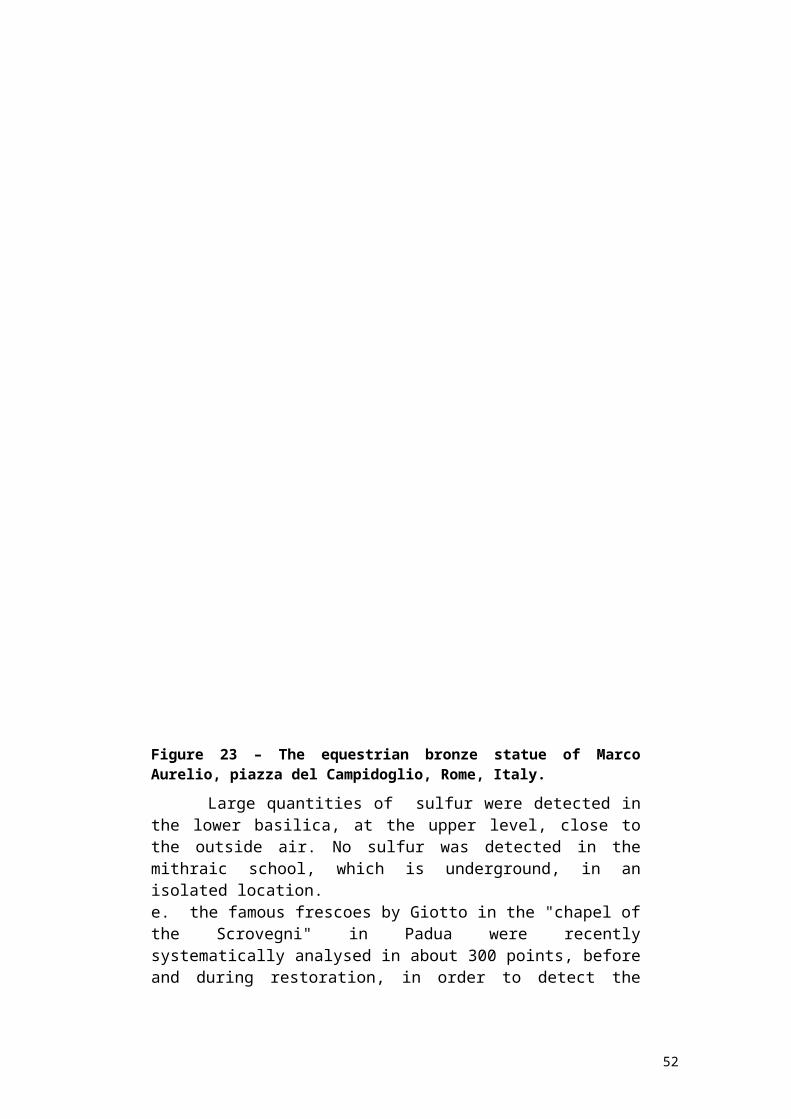
Figure 23 – The equestrian bronze statue of MarcoAurelio, piazza del Campidoglio, Rome, Italy. Large quantities of sulfur were detected inthe lower basilica, at the upper level, close tothe outside air. No sulfur was detected in themithraic school, which is underground, in anisolated location.e. the famous frescoes by Giotto in the "chapel ofthe Scrovegni" in Padua were recentlysystematically analysed in about 300 points, beforeand during restoration, in order to detect the
52
possible presence of sulfur and to characterize thepigments composition employed by Giotto. Begun in 1303 and consecrated on march 25,1305, the chapel, dedicated to Our Lady of theAnnunciation, was commissioned by Enrico Scrovegniin suffrage for the soul of his father, Reginaldo,accused of usury. It was E. Scrovegni whocommissioned Giotto to execute the frescoes in theinterior of the chapel, where the Master attainedthe height of his artistry, for this cycle ofpaintings signals " a point of no return in theentire history of western painting" (Figure 24). Sulphur was analyzed with two different typesof equipment: one using the Ca-anode X-ray tube,the second one using the Pd-anode working at lowvoltages, to selectively excite Pd-L lines, with anenergy of about 2.8 keV, suited to the excitationof sulfur and chlorine. The fresco-pigments wereanalyzed with the same Pd X-ray tube working atabout 10 kV, and with a W-X ray tube working at 30keV. The following results were obtained 38:-Sulfur was detected everywhere, at a concentrationlevel from about 1% to about 10%, depending on theexposition and on the undergoing pigment; sulfurcontent was for example lower in the case ofazzurrite pigments, higher in the white and greenpigments; the S-content strongly decreases afterusing a cleaning process based on ion-exchangeresins (Figure 25); the use of the Ca-anode X-raytube gives rise to a "cleaner" spectrum withrespect to the Pd-L X-ray tube, but the countingrates are much lower, due to the large outputwindow of the first tube (X-ray tubes output isstronglycollimated to irradiate an area of about 1 cm2);
analysis of Giotto’s haloes in the Chapel of theScrovegni
53
About 30 haloes were analysed, many of them in goodconditions (golden haloes), other damaged, andother completely black 21-22. A X-ray spectrum of a good condition gold halocompared with the X-ray spectrum of a black one isshown in Figure 26. From left to right fluorescencepeaks are visible due to the following elements: -gold M-lines at 2.1 keV;-sulphur K-lines at 2.3 keV, due to pollutioneffects;-lead M-lines at 2.34 keV;-argon K-lines, at 2.95 keV, due to the presence ofthis element in air;-tin L lines, at 3.45 keV, present in the blackhalo only;-calcium K-lines, at 3.7 keV;-iron K and K lines, at 6.4 and 7.06 keV;-nickel K and K lines, at 7.5 and 8.3 keV, due to background effects in the X-ray tube;-copper K and K lines, at 8.04 and 8.94 keV;-tungsten L-lines, at 8.35, 9.8 and 11.3 keV respectively, due to the X-ray tube anode;-gold L-lines, at 9.67, 11.5 and 13.4 keV, present in the golden halo only;-silver K-lines, at 22.1 and 25.2 keV, mainly due to fluorescence effects in the detector;-lead L-lines, at 10.5, 12.6 and 14.8 keV;-strontium K lines, at 14.15 keV;-tin K and K lines, at 25.2 and 28.7 keV respectively, present in the black halo only.
54
Figure 24 – General view of the Chapel of the Scrovegniin Padua, painted by Giotto between 1303 and 1305.Specifically shown is the “life of Christ”.
55
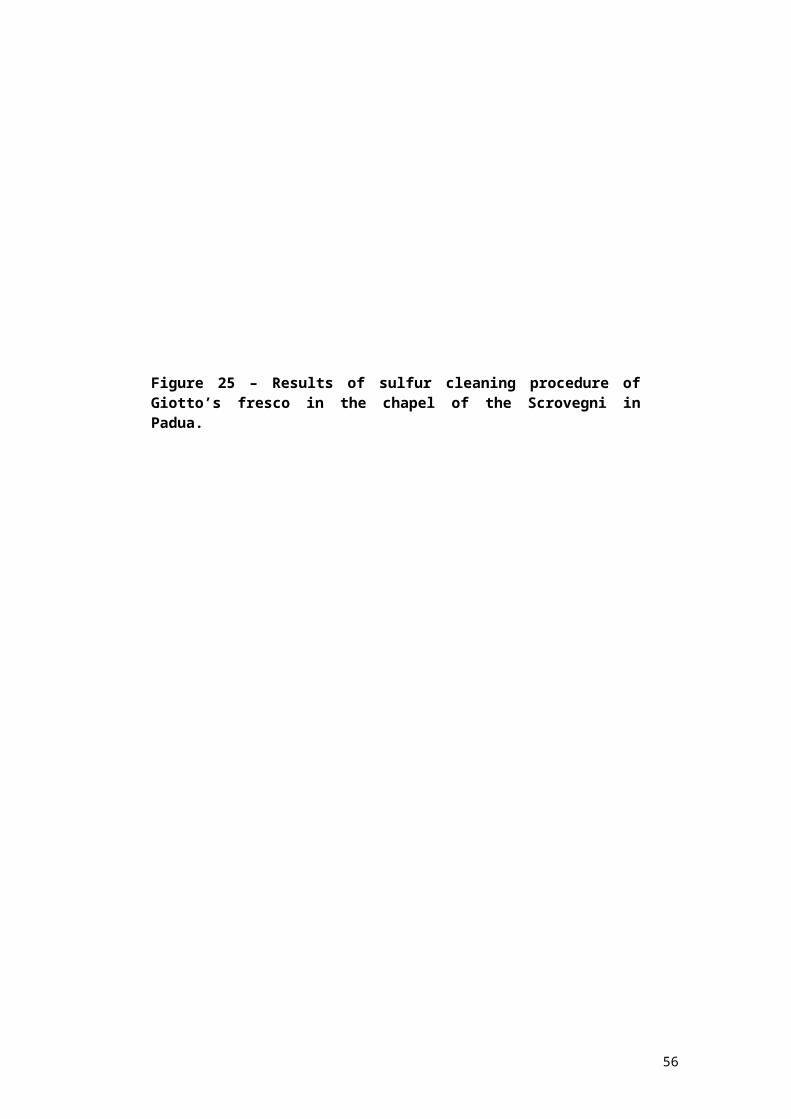
Figure 25 – Results of sulfur cleaning procedure ofGiotto’s fresco in the chapel of the Scrovegni inPadua.
56
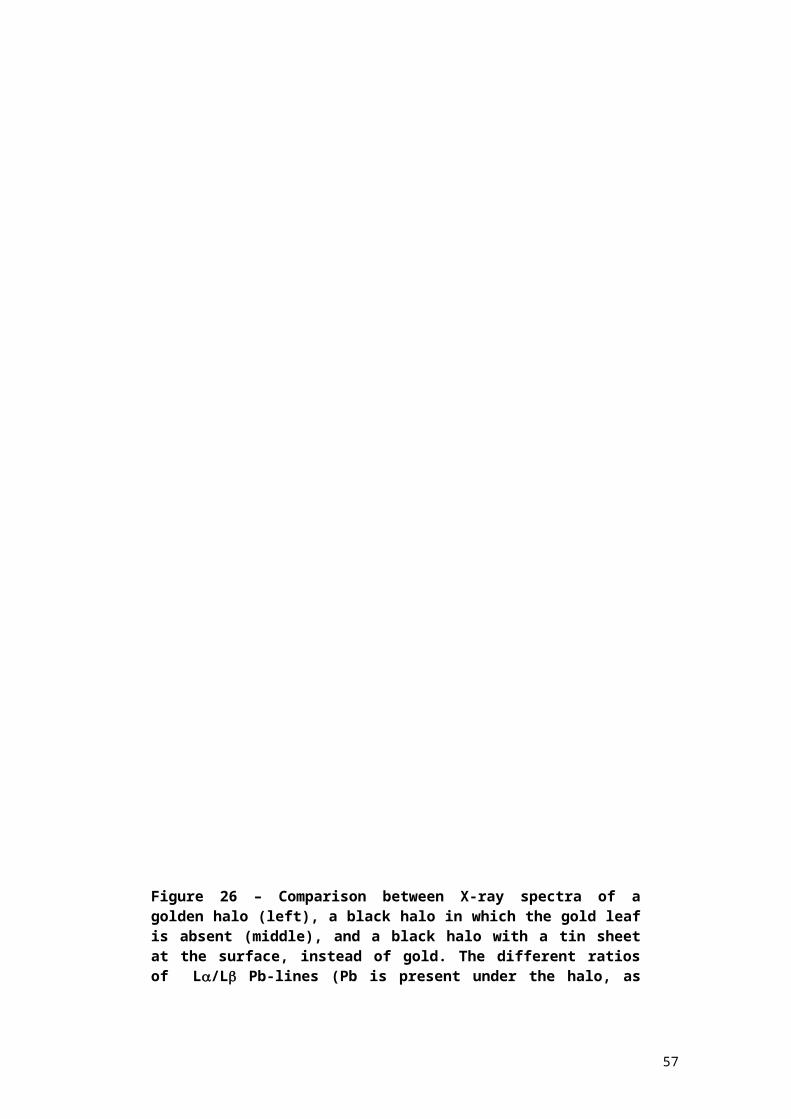
Figure 26 – Comparison between X-ray spectra of agolden halo (left), a black halo in which the gold leafis absent (middle), and a black halo with a tin sheetat the surface, instead of gold. The different ratiosof L/L Pb-lines (Pb is present under the halo, as
57
preparation) in the three X-ray spectra is due todifferent attenuation of Pb-L lines by the gold leaf,auto-attenuation in Pb, and attenuation by the tinsheet respectively. The Pb-L line is more attenuatedby the Au leaf than the L line; the opposite occurswith the black halo having tin at the surface.
There are several cases of peaks overlap:sulphur K with lead M, tin L with calcium K, goldL with tungsten L. X-rays of elements argon, nickel, tungsten andsilver are due to the X-ray tube anode (W), or tothe interaction of the X-ray beam with the detector(Ag), air (Ar), tube material (Ni) , the other X-lines are related to the fresco pigments and/or tothe plaster. However, they must be assigned to theproper layer. The ratio of the X-rays of all elements withrespect to gold L-X rays was first calculated andthe Pb (L/L) ratio (Table 11). If an elementbelongs to the gold alloy, typically composed ofAu, Ag, Cu, Pb and Fe, then its ratio with respectto gold should remain approximately constant. From the mean values of these ratios it may bededuced that no one of the elements essentiallybelongs to the gold alloy, even if cannot beexcluded that a small amount of them could belongto it. The gold employed by Giotto is, therefore,with high probability, of high purity. Further, lead should belong to the “secondlayer”, because it appears at the surface whengold is partially damaged. This point is confirmedfrom results shown in Table 11, where it may beobserved that lead/gold is not varying too much. Inthis hypothesis, of a gold leaf superimposed to alayer of lead white, the Pb-L lines should beattenuated in a different manner by the gold leaf,when present. This effect is, in fact, clearlyvisible in Figure 26, where the X-ray spectrum of agolden halo is compared with a black one, in whichthe contemporary presence of tin and lead is
58
apparent (in this case a tin sheet is superimposedto the white lead pigment). The differentattenuation of Pb-L and Pb-L lines by gold andtin is clearly visible. By plotting the attenuation coefficients ofgold, lead and tin (Figure 12), it may becalculated that Pb-L lines are more attenuatedwith respect to Pb-L lines when crossing a goldleaf, less attenuated when crossing a tin sheet(Figure 12). Considering these effects for all gold haloesin good conditions, the mean thickness of the goldlayer may be calculated, which turns out to be:
1.6 0.5m
From this result it may be concluded that thegold leaf is extremely thin and of relativelyconstant thickness (minimum and maximum values: 1m and 2.3 m respectively). Calculating the totalarea covered by gold haloes, the total amount ofgold employed by Giotto can be approximatelyevaluated as mAu = 540 170 g . The thickness of the layer of white lead(basic carbonate of lead) can be calculated fromthe Pb-L lines autoattenuation when the Au-leaf isno present as being about (62)m Pb-equivalent,corresponding, of course, to a much largerthickness of the pigment. Complicated is the attribution of copper tothe correct layer. Looking at the X-ray spectra ofirradiated areas, it turns out that X-rays of Cuare clearly more intense when the halo issuperimposed to an azurite background, which is ata deeper layer than lead . Excluding these cases,from Table 11, Cu continues to present and thecalculated ratio Cu/Au is approximately constant atthe value Cu/Au (0.6 0.25). It is thereforereasonable that Cu-X rays come both from theazurite and from a layer below the gold leaf. Fromother measurements and considerations it seemsprobable to be between lead carbonate and gold (may
59
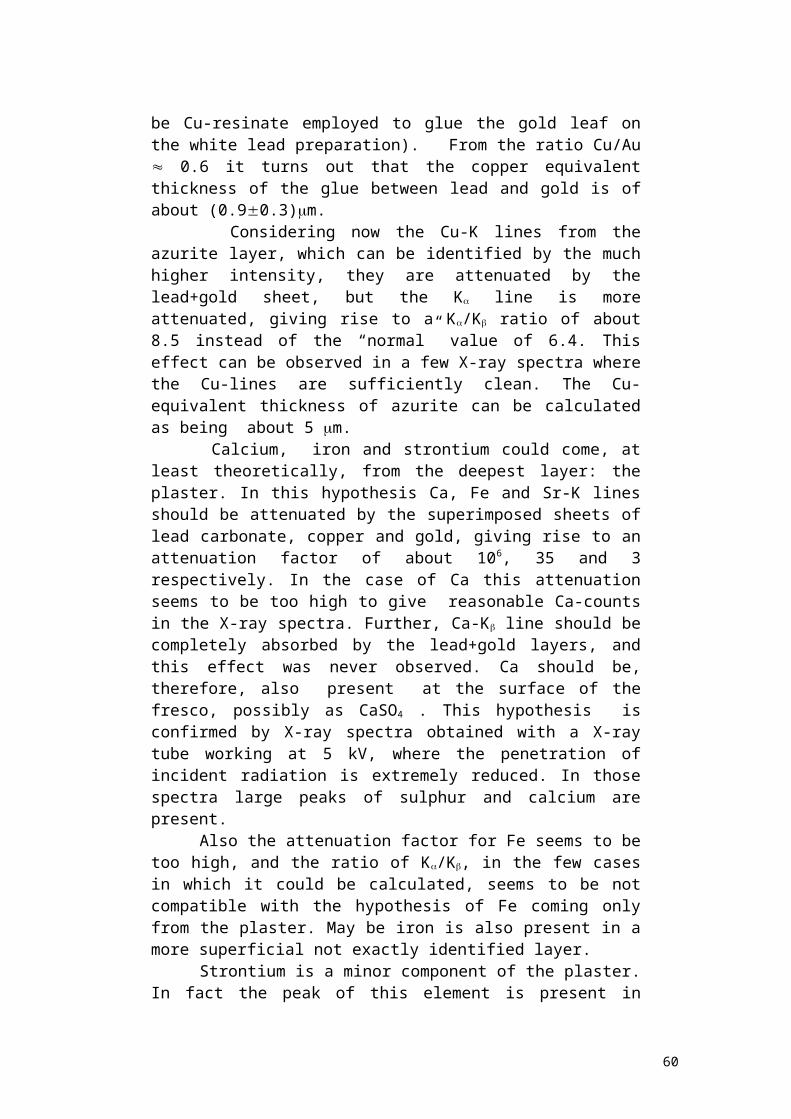
be Cu-resinate employed to glue the gold leaf onthe white lead preparation). From the ratio Cu/Au 0.6 it turns out that the copper equivalentthickness of the glue between lead and gold is ofabout (0.90.3)m. Considering now the Cu-K lines from theazurite layer, which can be identified by the muchhigher intensity, they are attenuated by thelead+gold sheet, but the K line is moreattenuated, giving rise to a K/K ratio of about8.5 instead of the “normal” value of 6.4. Thiseffect can be observed in a few X-ray spectra wherethe Cu-lines are sufficiently clean. The Cu-equivalent thickness of azurite can be calculatedas being about 5 m. Calcium, iron and strontium could come, atleast theoretically, from the deepest layer: theplaster. In this hypothesis Ca, Fe and Sr-K linesshould be attenuated by the superimposed sheets oflead carbonate, copper and gold, giving rise to anattenuation factor of about 106, 35 and 3respectively. In the case of Ca this attenuationseems to be too high to give reasonable Ca-countsin the X-ray spectra. Further, Ca-K line should becompletely absorbed by the lead+gold layers, andthis effect was never observed. Ca should be,therefore, also present at the surface of thefresco, possibly as CaSO4 . This hypothesis isconfirmed by X-ray spectra obtained with a X-raytube working at 5 kV, where the penetration ofincident radiation is extremely reduced. In thosespectra large peaks of sulphur and calcium arepresent. Also the attenuation factor for Fe seems to betoo high, and the ratio of K/K, in the few casesin which it could be calculated, seems to be notcompatible with the hypothesis of Fe coming onlyfrom the plaster. May be iron is also present in amore superficial not exactly identified layer. Strontium is a minor component of the plaster.In fact the peak of this element is present in
60
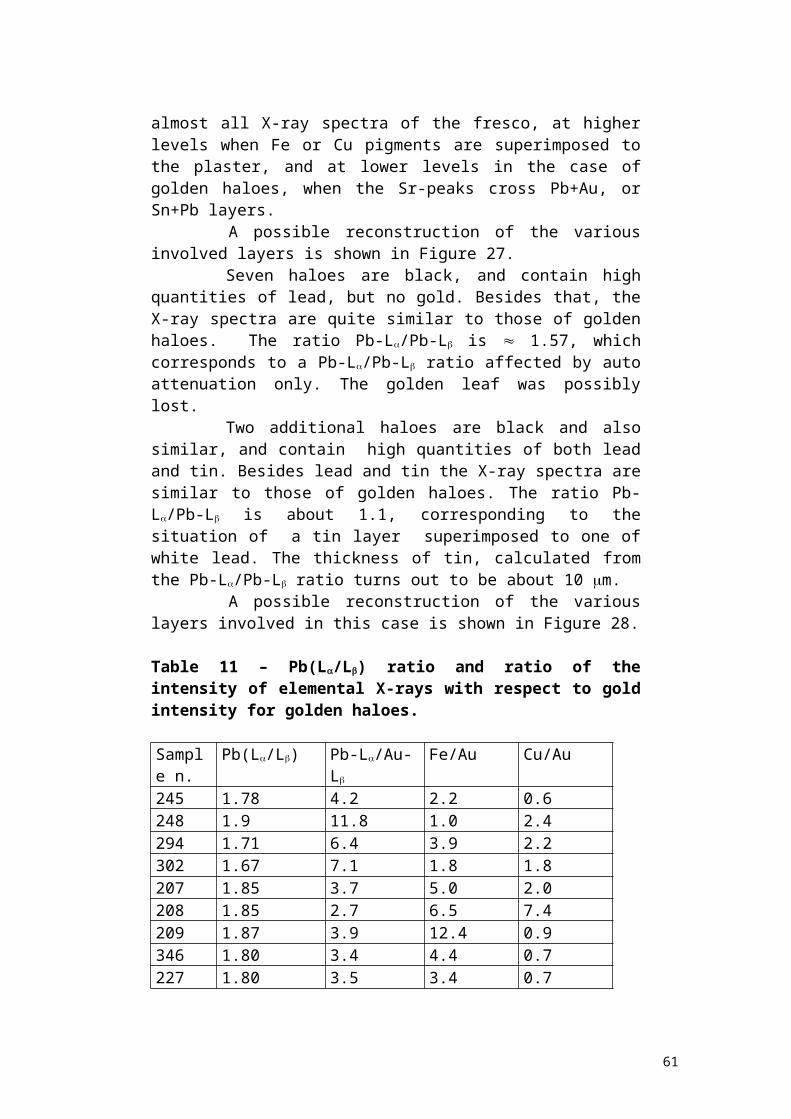
almost all X-ray spectra of the fresco, at higherlevels when Fe or Cu pigments are superimposed tothe plaster, and at lower levels in the case ofgolden haloes, when the Sr-peaks cross Pb+Au, orSn+Pb layers. A possible reconstruction of the variousinvolved layers is shown in Figure 27. Seven haloes are black, and contain highquantities of lead, but no gold. Besides that, theX-ray spectra are quite similar to those of goldenhaloes. The ratio Pb-L/Pb-L is 1.57, whichcorresponds to a Pb-L/Pb-L ratio affected by autoattenuation only. The golden leaf was possiblylost. Two additional haloes are black and alsosimilar, and contain high quantities of both leadand tin. Besides lead and tin the X-ray spectra aresimilar to those of golden haloes. The ratio Pb-L/Pb-L is about 1.1, corresponding to thesituation of a tin layer superimposed to one ofwhite lead. The thickness of tin, calculated fromthe Pb-L/Pb-L ratio turns out to be about 10 m. A possible reconstruction of the variouslayers involved in this case is shown in Figure 28.
Table 11 – Pb(L/L) ratio and ratio of theintensity of elemental X-rays with respect to goldintensity for golden haloes.
Sample n.
Pb(L/L) Pb-L/Au-L
Fe/Au Cu/Au
245 1.78 4.2 2.2 0.6248 1.9 11.8 1.0 2.4294 1.71 6.4 3.9 2.2302 1.67 7.1 1.8 1.8207 1.85 3.7 5.0 2.0208 1.85 2.7 6.5 7.4209 1.87 3.9 12.4 0.9346 1.80 3.4 4.4 0.7227 1.80 3.5 3.4 0.7
61
228 1.67 4.4 8.0 0.8348 1.74 3.4 3.7 0.6236 1.65 7.4 3.3 1.1238 1.65 10.4 4.7 0.6239 1.77 6.9 2.6 0.5240 1.66 6.4 1.9 0.5242 1.70 4.2 2.1 0.3246 1.65 3.8 2.4 2.4295 1.77 6.0 4.8 1.2296 1.65 6.5 6.4 1.3310 1.74 6.7 2.2 1.5319 1.8 8.0 2.5 0.18320 1.79 3.6 3.9 0.2246 1.71 3.9 5.2 1.7Meanvalues
1.750.08 5.62.2 4.13.0 1.31.4
62

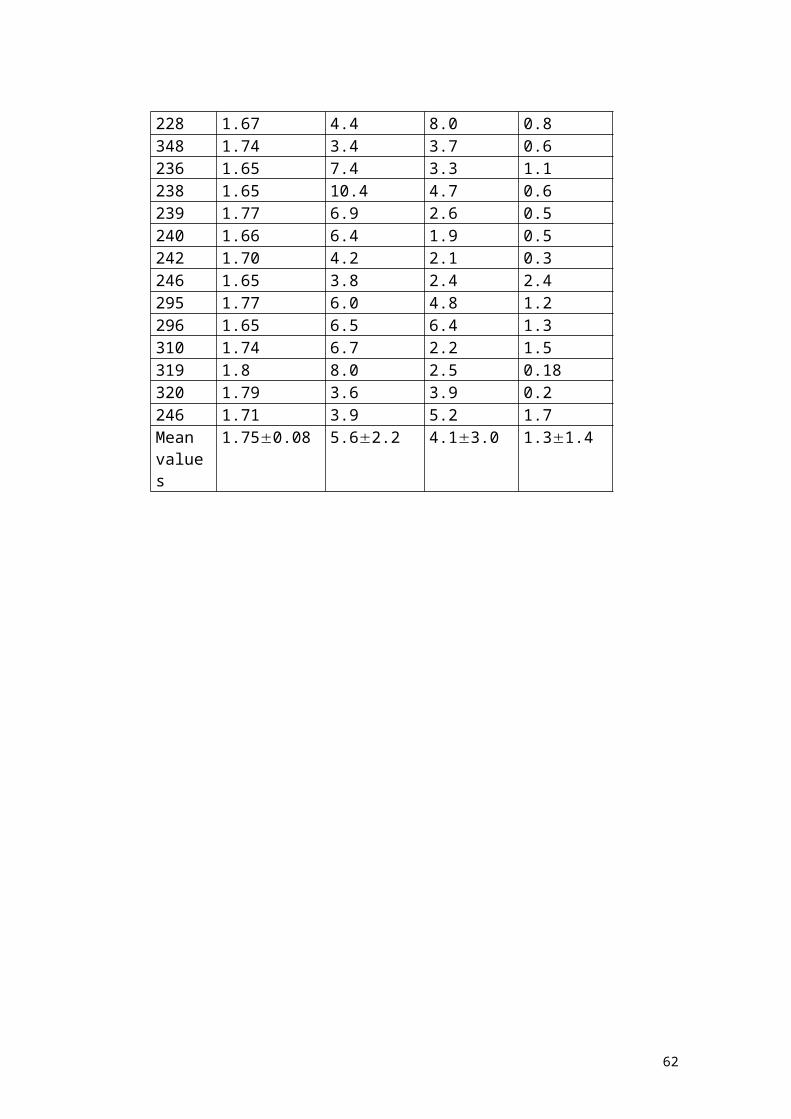
Figure 27 – Possible “reconstruction” of the various layers present in a golden halo (left). An
63

example of the X-ray spectrum of this halo is also shown.
64
Figure 28 – Possible “reconstruction” of the various layers present in a black halo (left). An example of the X-ray spectrum of this halo is also shown.
Paintings by Giorgio De Chiricoanalysis of 15 paintings of De Chirico 15 paintings of the last period of Giorgio DeChirico (1960-1970) were analysed, to identify thepigments typically employed by the artist in thisperiod 32. All these paintings seem to have asimilar composition. The “pingerprint” of thesepaintings is:-a preparation made with a mixture of lead whiteand zinc white;-a systematic use of lead, not only for thepreparation;-the red colours based on the use of cinnabar(HgS);-a moderate use of organic pigments. A typical painting with corresponding analysed points and X-ray spectra is shown in Figure 29.
analysis of 11 paintings supposed of De Chirico11 paintings supposed of De Chirico were analysed,to identify the pigments typically used by theauthor (authors) and to establish if these pigmentsare similar or different from those employed by DeChirico 32. First of all it was verified that allpaintings seem to have a similar composition,signifying that they were painted by the sameartist. The “fingerprint” of these paintings is:-a preparation made with zinc oxide;-almost absence of lead;-the red colour made with cadmium red;-a very frequent use of organic pigments.
65
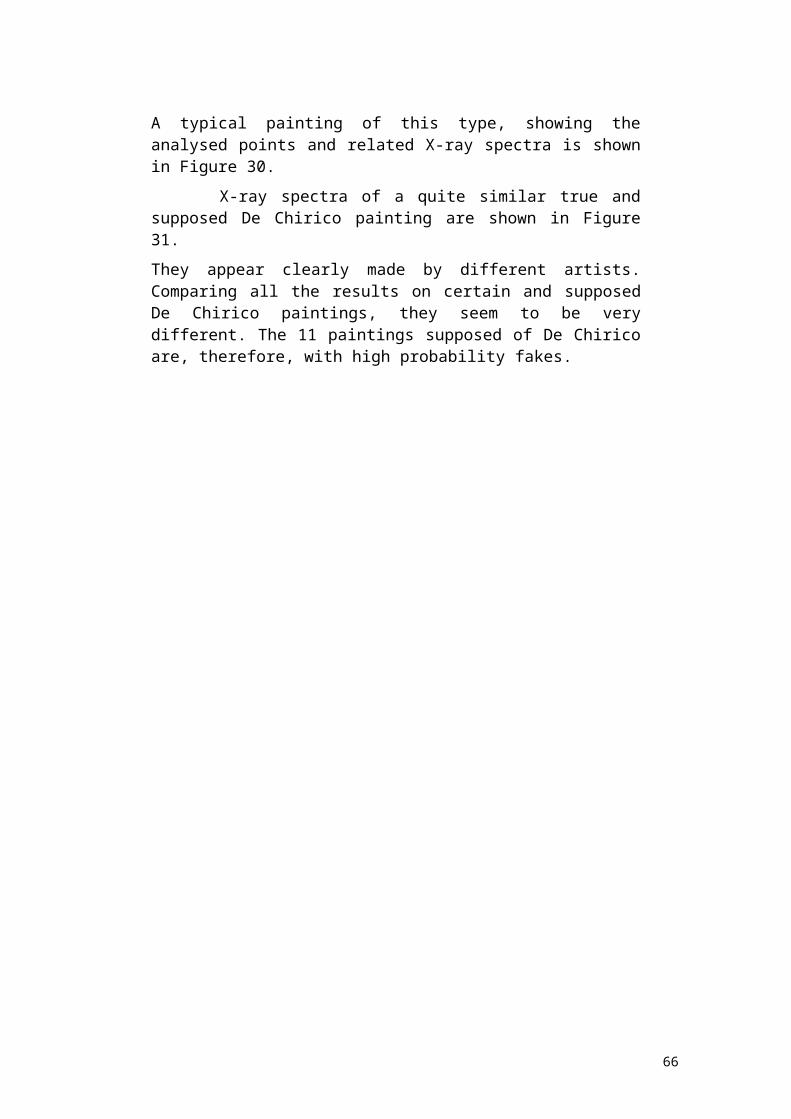
A typical painting of this type, showing theanalysed points and related X-ray spectra is shownin Figure 30. X-ray spectra of a quite similar true andsupposed De Chirico painting are shown in Figure31.They appear clearly made by different artists.Comparing all the results on certain and supposedDe Chirico paintings, they seem to be verydifferent. The 11 paintings supposed of De Chiricoare, therefore, with high probability fakes.
66

Figure 29 – X-Ray spectrum of a De Chirico painting, Fondazione De Chirico collection, Piazza di Spagna, Rome.
67

68

Figure 30 – Self portrait of De Chirico, Fondazione DeChirico collection, Piazza di Spagna, Rome, and X-rayspectrum of a red pigment.
69
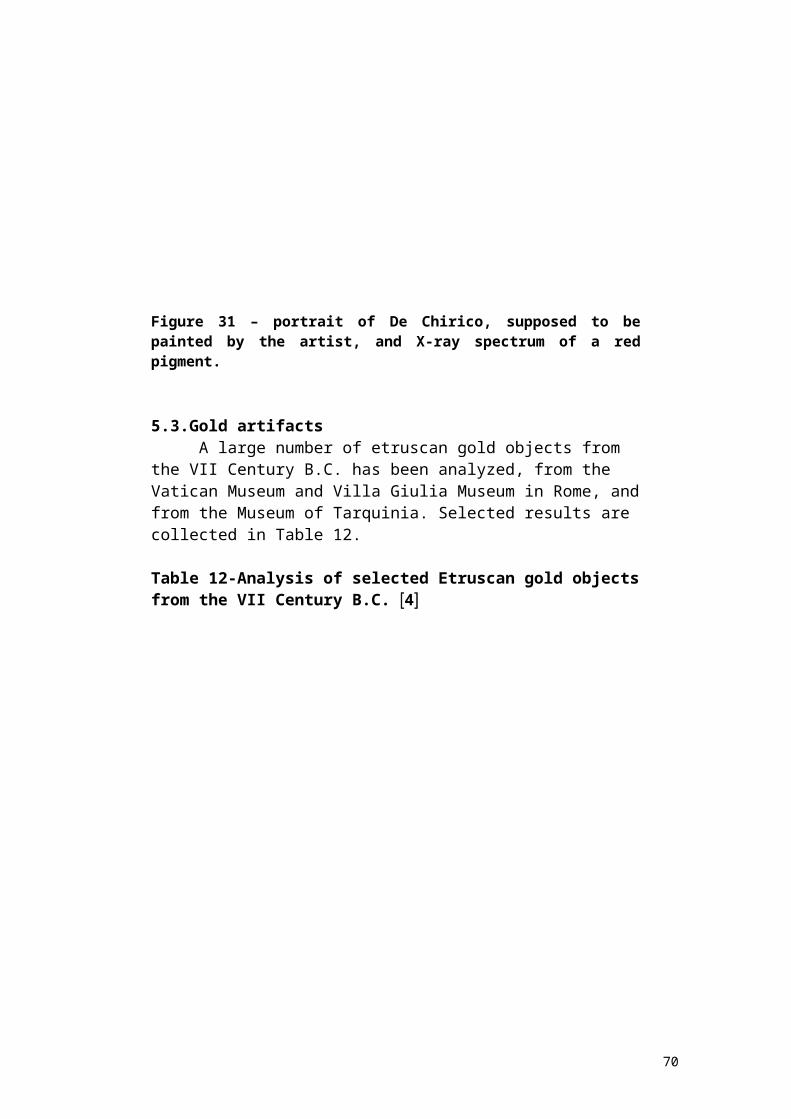
Figure 31 – portrait of De Chirico, supposed to bepainted by the artist, and X-ray spectrum of a redpigment.
5.3.Gold artifacts A large number of etruscan gold objects from the VII Century B.C. has been analyzed, from the Vatican Museum and Villa Giulia Museum in Rome, andfrom the Museum of Tarquinia. Selected results are collected in Table 12.
Table 12-Analysis of selected Etruscan gold objectsfrom the VII Century B.C. 4
70
The golden altar of Sant’Ambrogio The golden altar of S. Ambrogio in Milan isconsidered one of the most important goldsmith’swork ever realized 39. It was constructedapproximately in the period between 824 and 859A.C. from Volvinius, not historicallyidentified . It is composed of four sides, three –north, south and east- made on gilded silver (butgold survived only in a few areas) and one –thewest side- on gold. Each side is composed of 12panels. Ancient gold is generally composed of gold,silver and copper, while ancient silver is normallycomposed by copper, lead, gold and iron (gold andiron at concentrations below 1%) and in somecases tin, nickel and zinc at trace levels 2. Insilver alloys, there is a frequent occurrence ofsurface enrichment, especially for base silver orfor copper-rich alloys .
71
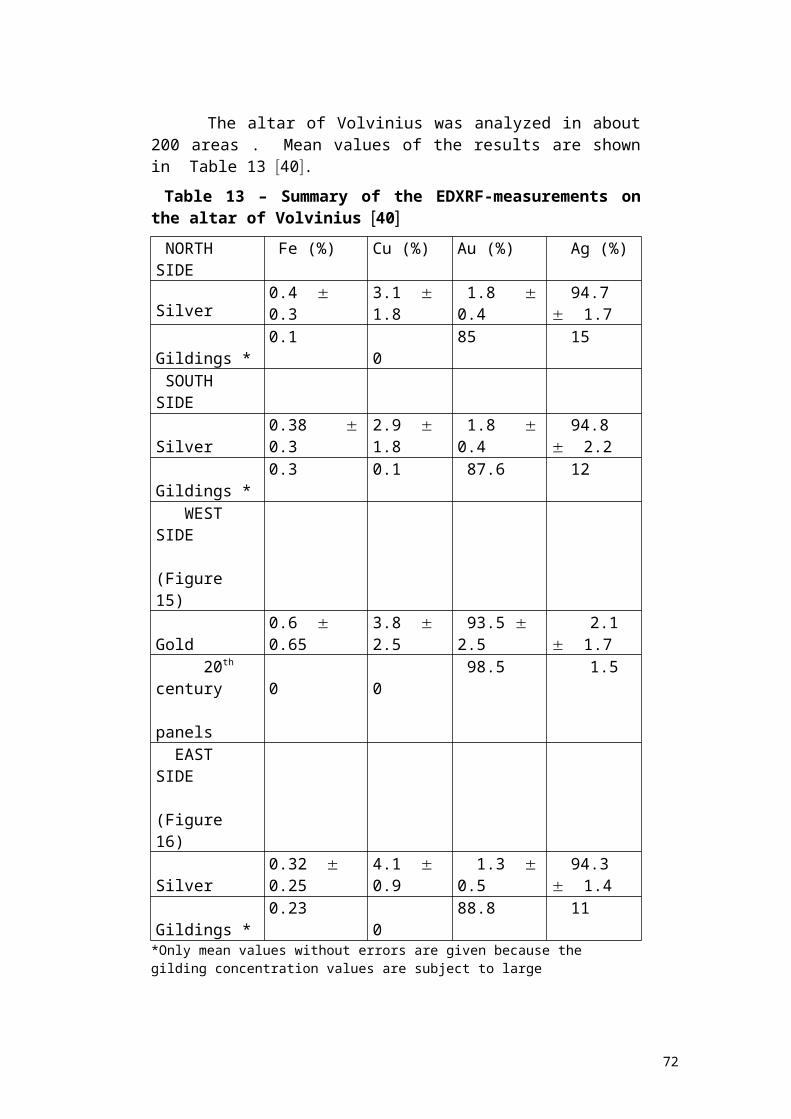
The altar of Volvinius was analyzed in about200 areas . Mean values of the results are shownin Table 13 40. Table 13 – Summary of the EDXRF-measurements onthe altar of Volvinius 40 NORTH SIDE
Fe (%) Cu (%) Au (%) Ag (%)
Silver
0.4 0.3
3.1 1.8
1.8 0.4
94.7 1.7
Gildings *
0.1 0
85 15
SOUTH SIDE Silver
0.38 0.3
2.9 1.8
1.8 0.4
94.8 2.2
Gildings *
0.3 0.1 87.6 12
WEST SIDE (Figure 15) Gold
0.6 0.65
3.8 2.5
93.5 2.5
2.1 1.7
20th century panels
0
0
98.5 1.5
EAST SIDE (Figure 16) Silver
0.32 0.25
4.1 0.9
1.3 0.5
94.3 1.4
Gildings *
0.23 0
88.8 11
*Only mean values without errors are given because the gilding concentration values are subject to large
72
fluctuations, due to its thin and variable depth (10-15 m) in all areas.
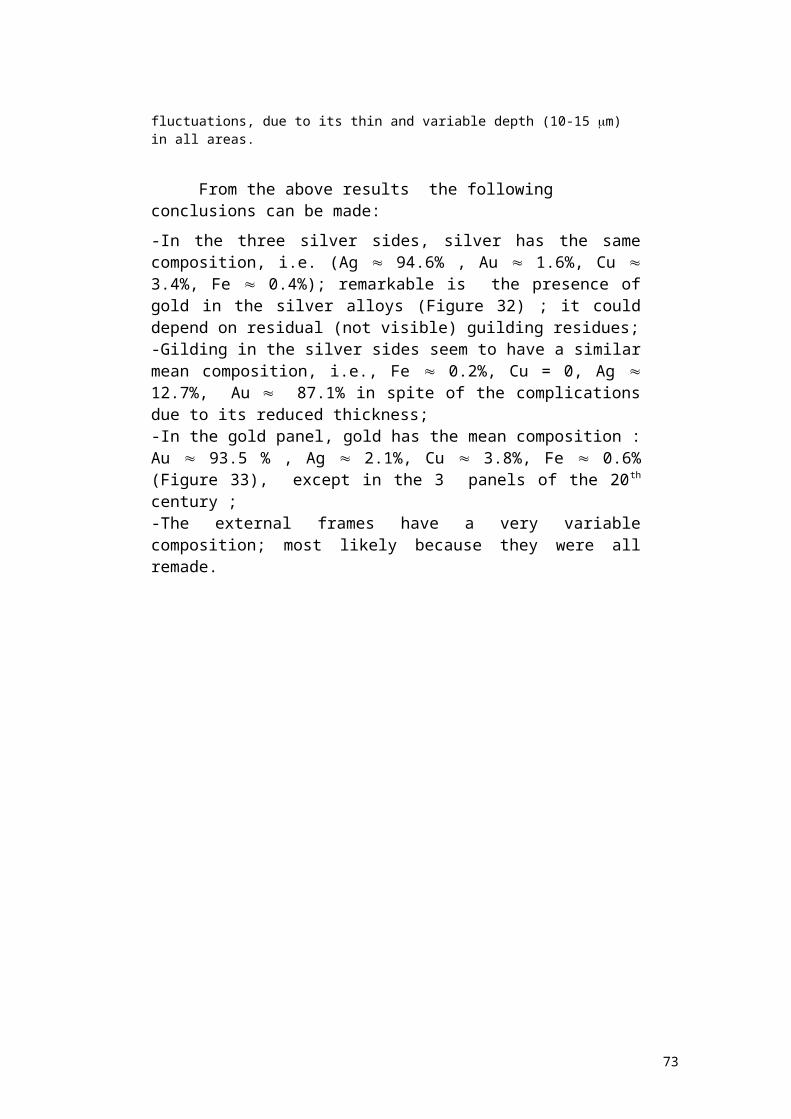
From the above results the following conclusions can be made:-In the three silver sides, silver has the samecomposition, i.e. (Ag 94.6% , Au 1.6%, Cu 3.4%, Fe 0.4%); remarkable is the presence ofgold in the silver alloys (Figure 32) ; it coulddepend on residual (not visible) guilding residues;-Gilding in the silver sides seem to have a similarmean composition, i.e., Fe 0.2%, Cu = 0, Ag 12.7%, Au 87.1% in spite of the complicationsdue to its reduced thickness;-In the gold panel, gold has the mean composition :Au 93.5 % , Ag 2.1%, Cu 3.8%, Fe 0.6%(Figure 33), except in the 3 panels of the 20th
century ; -The external frames have a very variablecomposition; most likely because they were allremade.
73
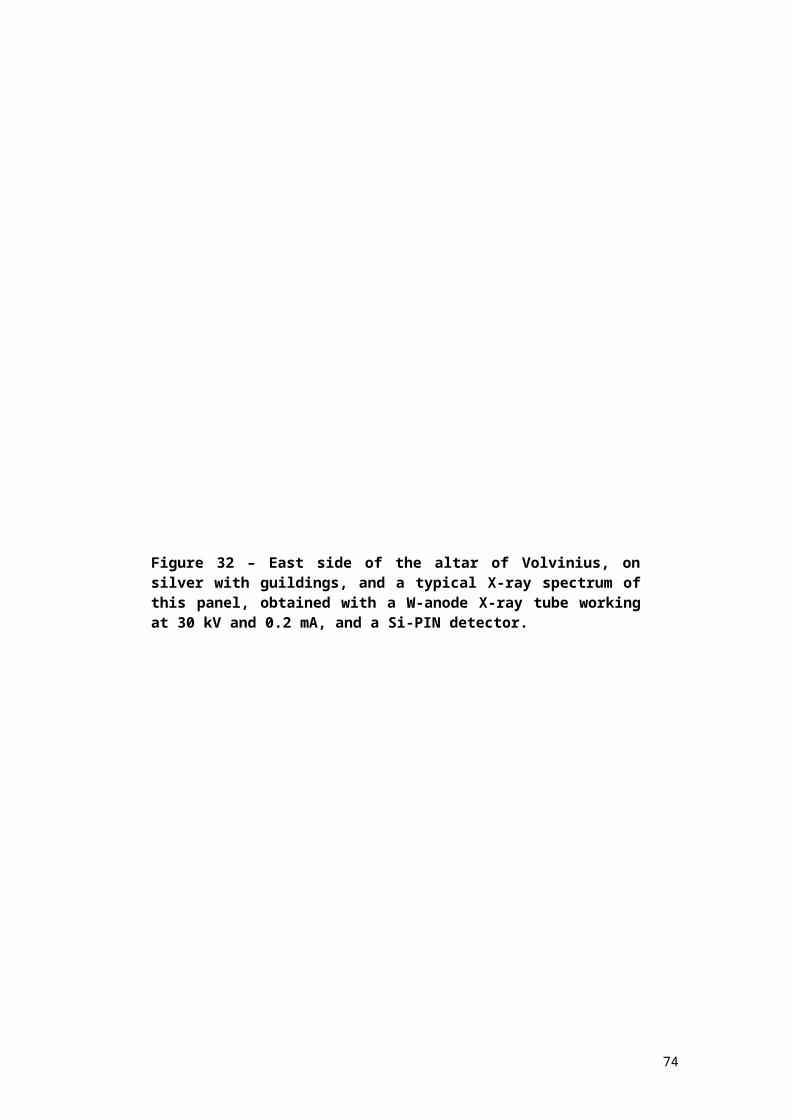
Figure 32 – East side of the altar of Volvinius, onsilver with guildings, and a typical X-ray spectrum ofthis panel, obtained with a W-anode X-ray tube workingat 30 kV and 0.2 mA, and a Si-PIN detector.
74
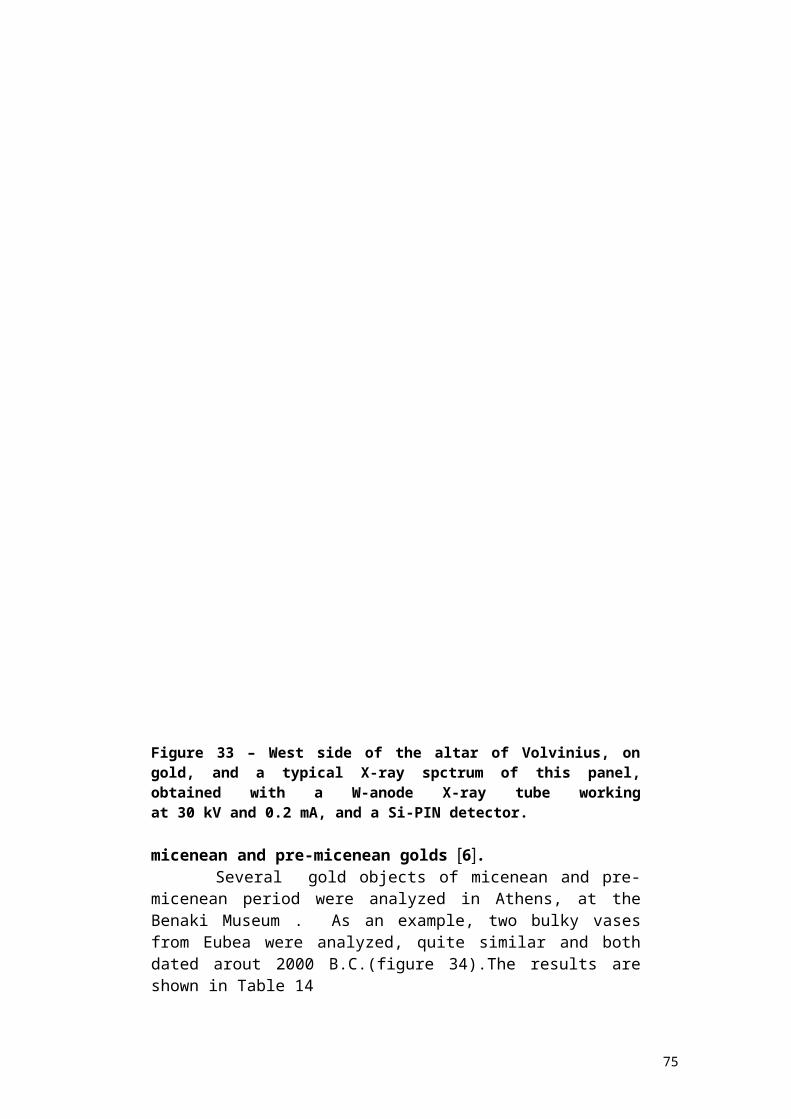
Figure 33 – West side of the altar of Volvinius, ongold, and a typical X-ray spctrum of this panel,obtained with a W-anode X-ray tube workingat 30 kV and 0.2 mA, and a Si-PIN detector. micenean and pre-micenean golds 6. Several gold objects of micenean and pre-micenean period were analyzed in Athens, at theBenaki Museum . As an example, two bulky vasesfrom Eubea were analyzed, quite similar and bothdated arout 2000 B.C.(figure 34).The results areshown in Table 14
75
Table 14- EDXRF-results (in %) of two eubean gold vases ( 2000 B.C.)
Object Au Ag Cu FeVase .2049 (Fig.19)
80.5 18 2
1.4 0.3
0.05 0.1
Vase n. 1516 (Fig. 19)
79.5 21 3
0.9 0.3
0.05 0.1
The two vases of same origin and age seem tohave also a quite similar composition. A quite different composition was found in athin decorated vase , which was analyzed at 8different places. The results are shown in Table15 .
Table 15 - EDXRF results (in %) of a thin decoratedvase
Vase 27515
Au Ag K(*) Ca (*) Cu Fe
1 98.9
0.2* *
0 0.3 0.3 0.1
0.5
2 (Figure 20)
96.6
0.2 0.5 0.2
5.5 0.2
0.2 2.5
3 98.2
0.2 0.3 1.2 0.3 1.2
4 97.7
0.2 0.4 2.8 0.3 1.7
5 97.0
0.2 0.5 3.2 0.3 1.9
6 95.1
0.2 0.5 5.3 0.2 4.0
7 98.5
0.2 0.1 1.2 0.3 0.9
76
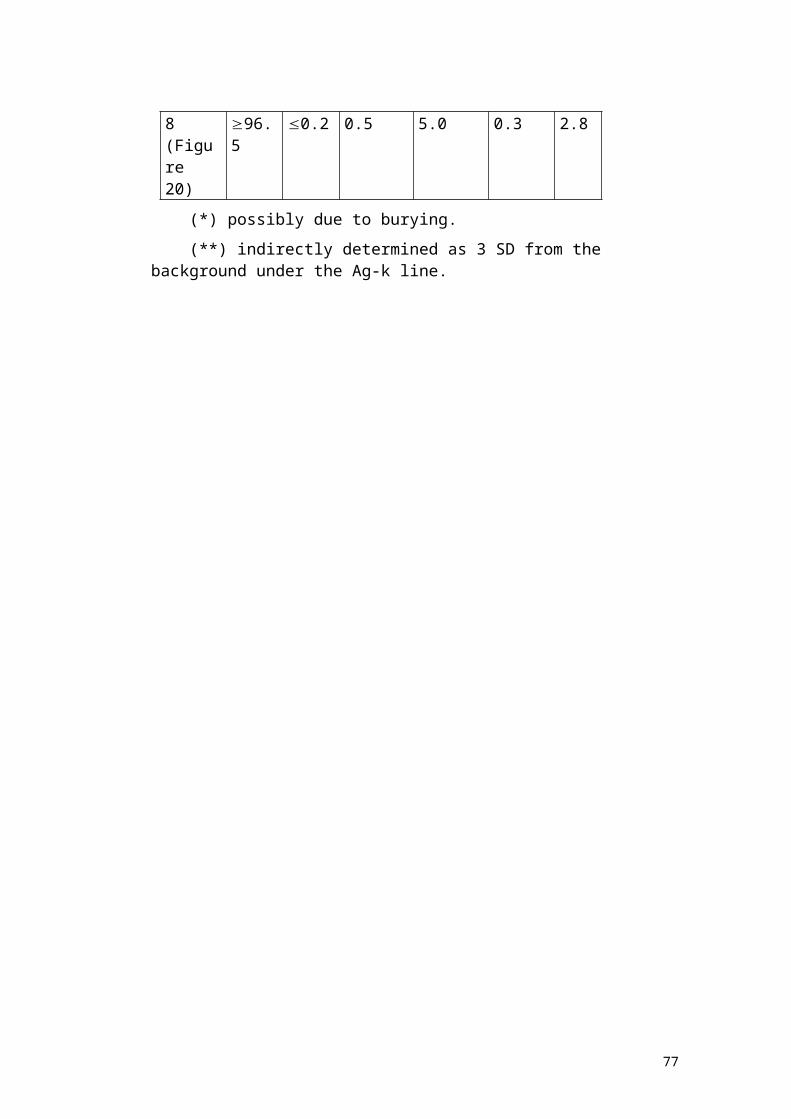
8 (Figure 20)
96.5
0.2 0.5 5.0 0.3 2.8
(*) possibly due to burying. (**) indirectly determined as 3 SD from the background under the Ag-k line.
77
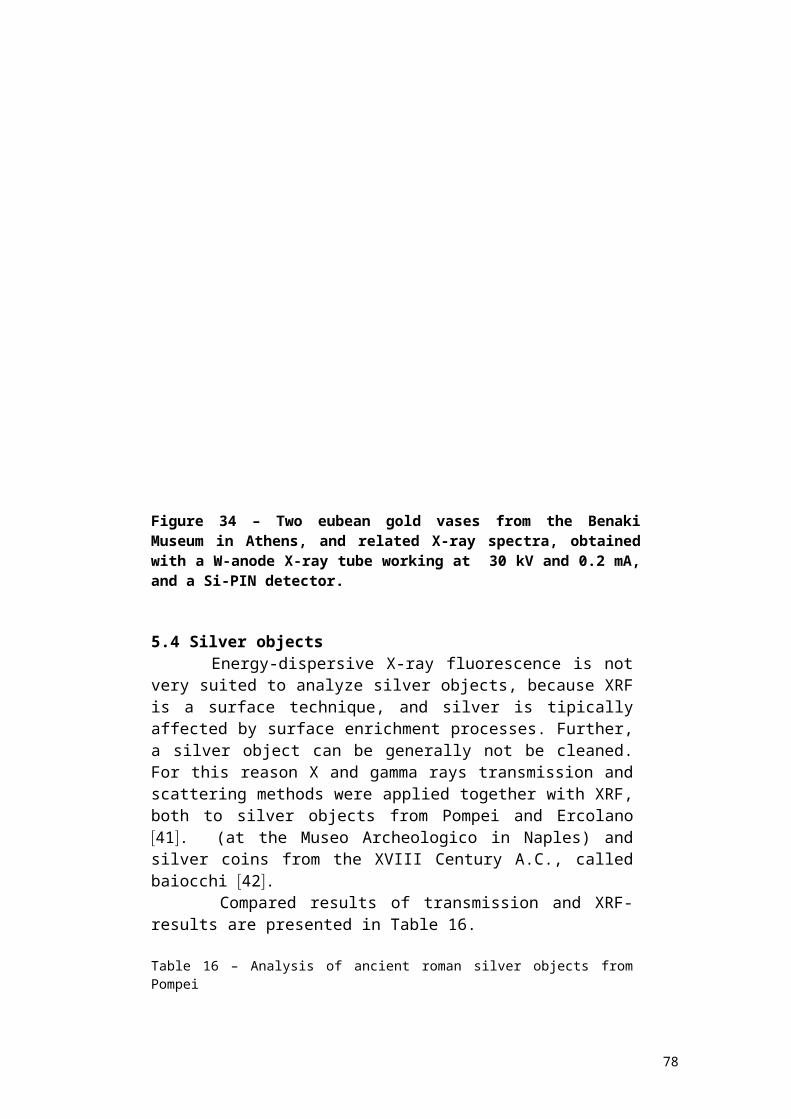
Figure 34 – Two eubean gold vases from the BenakiMuseum in Athens, and related X-ray spectra, obtainedwith a W-anode X-ray tube working at 30 kV and 0.2 mA,and a Si-PIN detector.
5.4 Silver objects Energy-dispersive X-ray fluorescence is notvery suited to analyze silver objects, because XRFis a surface technique, and silver is tipicallyaffected by surface enrichment processes. Further,a silver object can be generally not be cleaned.For this reason X and gamma rays transmission andscattering methods were applied together with XRF,both to silver objects from Pompei and Ercolano41. (at the Museo Archeologico in Naples) andsilver coins from the XVIII Century A.C., calledbaiocchi 42. Compared results of transmission and XRF-results are presented in Table 16.
Table 16 – Analysis of ancient roman silver objects fromPompei
78
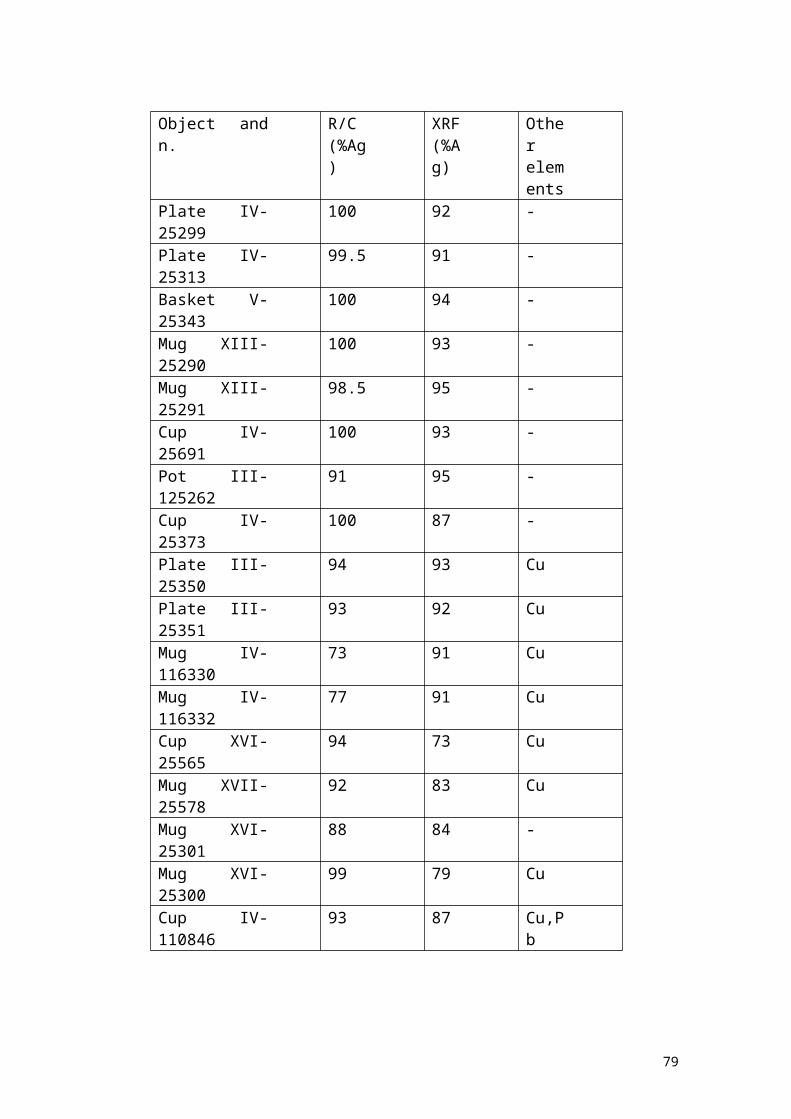
Object andn.
R/C(%Ag)
XRF(%Ag)
Otherelements
Plate IV-25299
100 92 -
Plate IV-25313
99.5 91 -
Basket V-25343
100 94 -
Mug XIII-25290
100 93 -
Mug XIII-25291
98.5 95 -
Cup IV-25691
100 93 -
Pot III-125262
91 95 -
Cup IV-25373
100 87 -
Plate III-25350
94 93 Cu
Plate III-25351
93 92 Cu
Mug IV-116330
73 91 Cu
Mug IV-116332
77 91 Cu
Cup XVI-25565
94 73 Cu
Mug XVII-25578
92 83 Cu
Mug XVI-25301
88 84 -
Mug XVI-25300
99 79 Cu
Cup IV-110846
93 87 Cu,Pb
79
5.5 Ceramics
ACKNOWLEDGEMENTSThis work was partially supported by the ConsiglioNazionale delle Ricerche, Programma Finalizzato"Beni Culturali”.The authors are grateful to: -Drs. P. Santopadre and M. Ioele of the “IstitutoCentrale del Restauro”, Rome-the archaeologists of the Benaki Museum, Athens-Dr. S. Bandera, Soprintendenza Beni Artistici eStorici, Milano-Prof. P. Picozza and coworkers, Fondazione DeChirico, Rome-Giovanni Moriggi.
REFERENCES
1. C. Seccaroni, P. Moioli : FluorescenzaX:prontuario per l’analisi XRF portatileapplicata a superfici policrome; Nardini Ed.,Firenze 2002.
2. E.R. Caley: Analysis of ancient metals; PergamonPress, London 1964.
3. R. Cesareo, S. Sciuti, M. Marabelli: Non-destructive analysis of ancient bronzes; Studies in Conservation 18 (1973)64.4. R. Cesareo, F.W. von Hase: Non destructiveradioisotope XRF analysis
80
of early etruscan gold objects; Kerntechnik15 (1973) 565. R. Cesareo, F.W. von Hase : analisi di orietruschi del VII secolo a.C. con uno strumento portatile che impiega latecnica della fluorescenza X eccitata da radioisotopi; in Applicazionidel metodi nucleari nel campo delle opere d’arte; Congr. Intern.“Applicazione dei metodi nucleari nel campo delle opere d’arte; Roma-Venezia 24-29 maggio 1973; Accad. Naz. Dei Lincei (1976)259-296.5. G.S. Korres, G.E. Gigante, S. Ridolfi :studio archeometallurgico di manufatti in oro della Messenia mediantesistema portatile EDXRF; in Atti del 3° Congresso Naz. Di Archeometria,Bressanone, febbraio 2004; Patron Ed., Bologna, pp. 313-21.6. R. Cesareo, A. Castellano, S. Ridolfi, G. Buccolieri, S. Quarta, M. Marabelli, G.E. Gigante, A. Brunetti, M.A. Rosales : Portable-systems for energy dispersive X-ray fluorescence analysis of works of art; to be published.7. R. Cesareo, M. Marabelli, M. Ferretti : Analysis of Silver objects by scattering and X-ray fluorescence of monoenergetic gamma-rays ; Archaeometry 24 (1982) 170.
R. Cesareo: Analysis of silver alloys byelastic and inelastic scattering of gamma rays; Nucl. Instrum. Methods 179 (1981) 545.
8. P.J. Potts, A.G. Tindle, P.C. Webb : Geochemical reference material composition ; CRC Press, Boca Raton, London,Tokyo 1992.
81
9. R. Cesareo: Photon induced X-ray emissionin Nuclear analytical techniques in medicine; Ed. R. Cesareo, Elsevier, Amsterdam, 1988.
10. P. Lechner, S. Eckbauer, R. Hartmann, S. Krisch, D. Hauff, R. Richter, H.
Soltau, L. Struder, C. Fiorini, E. Gatti, A.Longoni, M. Sampietro; Nucl.
Instrum. Methods A377 (1996) 346.12. Constallation Technology Co, 7887 Bryan DairyRd., Largo, FL 33777, USA.13. Oxford Analytical Systems Division; 275 Technology Circle, Scotts Valley, CA 95066 USA
15. X-Ray and Specialty Instruments Inc., P.O.Box 3707, Ann Arbor, MI 48106, USA. 16. see Reference 28 17. see, for example ORTEC AN34: Experiments in Nuclear Science, 1976 18. K. Janssens, L. Vince, B. Vekemans : Evaluation and calibration of μ- XRF data ; in microscopic X-Ray Fluorescence Analysis ; K. Janssens, F. Adams, A. Rindby eds., J. Wiley & Sons, 2000, 155-210.
19. R. Cesareo, C. Cappio Borlino, G. Stara, A. Brunetti, A. Castellano, G.Buccolieri, M. Marabelli, J. Teixeira de Assis, G.E. Gigante: Analysis of S and Cl in frescoes and lapideous monuments by using a portable EDXRF apparatus; Proc. 2nd Int. Congress on science and technology for the safeguard of cultural heritage in the mediterranean basin, Parigi, 673-678, 2000.20. M. Laurenzi Tabasso and M. Marabelli : Ildegrado dei monumenti in
82
Roma in rapporto all’inquinamentoatmosferico, BetaGamma Ed., Viterbo (1992).21. R. Cesareo: Non-destructive EDXRF-analysis ofthe golden haloes of Giotto’s frescos in the chapel of theScrovegni in Padua; Nucl. Instrum. Methods in Phys. Res. B 211 (2003) 133-137. 22. R. Cesareo, A. Castellano, G. Buccolieri, S.Quarta, M. Marabelli : Giotto in the chapel of the Scrovegni : EDXRFanalysis of the golden haloes with portable equipment; X-RaySpectrometry 33 (2004) 289-93.23. R. Cesareo, A. Brunetti, A. Castellano, M.Rosales Medina : Portable equipment for X-Ray Fluorescence Analysis ;X-Ray Spectrometry, Recent Technological Advances, Ed. By K.Tsuji, I. Iniuk, R. van Grieken; J. Wiley & Sons, 2004, 307-341.24. R. Cesareo, A. Castellano, G. Buccolieri, M.Marabelli: A portable apparatus for energy-dispersive X-rayfluorescence analysis of sulphur and chlorine in frescoes and stone monuments;Nucl. Instrum. Methods in Phys. Res. B 155 (1999) 326-330.25. Institut für Gerätebau GmbH, Berlin, Germany;www.ifg-adlershof.de26. X-Ray optical systems, Albany, NY, USA.27. K. Janssens: Use of microscopic XRF for non-destructive analysis in art and archaeometry; in 16th Int. Conf. on X-rayOptics and Microanalysis; Vienna, (July 2-6, 2001),44.28. AMPTEK Inc., 6 De Angelo Drive, Bedford, MA 01730-2204 USA29. EIS-XRS, Via Silvani, Rome, Italy30. J.S. Iwanczyk, B.E. Patt, Y.J. Wang, A. Khusainov :Comparison of HgI2,
83
CdTe and Si-PIN X-ray detectors; Nucl. Instrum. Methods (1996)31. Hamamatsu Photonics, Hamamatsu City, Japan;www.hamamatsu.com32. R.Cesareo, A. Castellano, G. Buccolieri, S. Quarta, M. Marabelli, P. Santopadre, M. Ioele, G.E. Gigante, S. Ridolfi: From Giotto to De Chirico: analysis of paintings with portableEDXRF equipment; in Cultural Heritage Conservation by non-destructive testing; Van Grieken & Janssens eds.; Taylor & Francis Group, London 2005, pp. 183-196. 33. J. Pope-Hennessy: Benvenuto Cellini; Firenze,1989.34. R.Cesareo, M.Cordaro,G.E.Gigante,G.Guida, M.Marabelli:Indagini non distruttive sulla statua di bronzo del Perseomediante EDXRF, metallografia non distruttiva econducibilità IACS; 35. L. Butterfield: The sculptures of Andrea delVerrocchio; Yale Univ. Press, 1998.
36. M. Ferretti, R. Cesareo, M. Marabelli, G. Guida: The analysis of bronze alloys from the equestrian statueof Marco Aurelio by means of a thin sample XRF technique; Nucl. Instrum. Methods B36 (1989) 194.
37. R.Cesareo,C. Cappio Borlino, G. Stara, A.Brunetti, A. Castellano, G. Buccolieri, M. Marabelli, A.M. Giovagnoli, A.Gorghinian, G.E. Gigante: A portable energy dispersive X -ray fluorescence apparatus for the analysis of sulphur and chlorinein frescos; J. Trace and microprobe techniques; 18 (2000) 23-33.
84
38. R. Cesareo, A. Castellano, G. Buccolieri, S. Quarta, M. Marabelli, P. Santopadre, A. Brunetti: Portable equipment for energy dispersive X- ray fluorescence analysis of Giotto’s frescoes in the Chapel of the Scrovegni; Nucl. Instrum. Methods in Phys. Res. B 213 (2004) 703- 706.39. L’altare d’oro di Sant’Ambrogio; a cura di C.Capponi, Banca Agricola Milanese, 1996.40. R. Cesareo, A. Castellano, M. Marabelli, S.Bandera, C. Fiorini, A. Longoni, G.E. Gigante: The golden altar of S.Ambrogio in Milan: non destructive XRF-analysis with a portableapparatus; 2nd int. Congress on Science and Safeguard of cultural heritage inthe Mediterranean basin; Paris July 5-9, 1999, 678.
85
R. Cesareo, G.E. Gigante, A. Castellano, M. Marabelli, C. Giardino, P. Canegallo, A. Brunetti, M.A. Rosales Medina, M. Aliphat, F. de la Fuente, J. Meitin, A. Mendoza, J.S. Iwanczyk, J.A. Pantazis: Sistemi portatili per l'analisi di opere d'arte mediante raggi X ; 1st Int. Congr. "Science & Technology for the safeguard of cultural heritage in the mediterranean basin" Nov. 27- Dec. 2, 1995, Catania, Italy, pp. 763-766.
I.Caruso, R. Cesareo, C. Giardino, G.E. Gigante: Nouvelles recherches sur
les ors etrusques de la collection Castellani; Suppl. a la Revue d’Archeometrie (1996) 157. R. Cesareo, G.E. Gigante, A. Castellano, M.A. Rosales, M. Aliphat, F. de la Fuente, J.J. Meitin, A. Mendoza, J.S. Iwanczyk, J.A. Pantazis; J. Trace and microprobe techniques 14 (1996) 711.
R. Cesareo: Le aureole d’oro di Giotto nella Cappella degli Scrovegni; Il Nuovo Saggiatore 19 (2003) 74-77.R. Cesareo: Non-destructive EDXRF-analysis of the golden haloes of Giotto’s frescos in the Chapel
86

of the Scrovegni in Padua; Nucl. Instrum. and Methods in Phys. Res. B211 (2003)133-137.R. Cesareo, A. Castellano, G. Buccolieri, S. Quarta, M. Marabelli: Giotto in the Chapel of the Scrovegni: EDXRF-analysis of the golden haloes with a portable equipment; Berlin EXRS-2002, X-RaySpectrometry 33 (2004).R. Cesareo, A. Brunetti, A. Castellano, M.A. Rosales: Portable equipment for X- ray fluorescence analysis; in X-Ray Spectrometry: Recent Technological Advances, Ed. By K.Tsuji, J. Injuk, R. Van Grieken Eds.; J. Wiley & Sons (2004)pp. 307-341.R. Cesareo, A. Castellano, G. Buccolieri, S. Quarta, M. Marabelli, P. Santopadre, M. Ioele, G. Gigante, S. Ridolfi : From Giotto to De Chirico : analysis of paintings with portable EDXRF equipment; in Cultural Heritage Conservation and environmental impact assessment by non destructive testing; Van Grieken & Janssens Eds., Balkema Publ. Leiden, London, New York M. Marabelli, M. Ioele, D. Artioli, A. Castellano,R. Cesareo, G. Buccolieri, S. Quarta, C.Cappio Borlino: Distribution of sulphates and controllingtheir presence before and after restoration work; in Restoration of the Scrovegni Chapel; Ed. G. Basile, Skira Ed. 2005.M. Marabelli, P. Santopadre, M. Ioele, P.L. Bianchetti, A. Castellano, R. Cesareo: Giotto’s painting techniques in the Scrovegni chapel : a study of the materials; in Bollettino d’arte, volume speciale: Giotto in the Scrovegni chapel; Istituto poligrafico dello Stato 17-47 (2005)M. Marabelli, P. Santopadre, M. Ioele, R. Cesareo,A. Castellano,M.Verità: Metal leaves utilized fordecoration of Giotto’s mural paintings; Ibidem 121-145.
1. Photon Imaging Inc., Northridge, CA 91324, USA2. R. Arlt, V. Ivanov, A. Khusainov: Advances in high-
resolution CdTe and CdZnTe detectors; in Hard X-ray and
87
gamma-Ray detector physics, optics and applications; S. Diego, CA 31 July-1 August 1997 ,SPIE Proc. Vol. 3115,76.
3. E. Gatti, P. Rehak, Nucl. Instrum. Methods 225 (1984) 608.
4. C. Fiorini, A. Longoni: Application of a new non cryogenic X-ray detector in portable instruments for archaeometric analysis; Rev. Sci. Instrum. 69 (1998) 1523.
5. R. Cesareo, A. Castellano, C. Fiorini, G.E. Gigante, J.S. Iwanczyk, A. Longoni, J.A. Pantazis, J.L. Pena Chapa, M.A. Rosales , Proc. of SPIE, 31 July-1 August 1997, S. Diego, CA , USA, Vol. 3115, pp.274-282.
88
1.R.Cesareo:Photon induced X-ray emission inNuclear Analyt.Techniques in Medicine ed. by R.Cesareo; Elsevier, Amsterdam, New York, Tokyo(1988) 19-119.4. R. Cesareo, A. Castellano, A. Mendoza Cuevas:EDXRF-analysis of thin and intermediateenvironmental samples; X-ray Spectrometry 27 (1998)257.5.M.J. Berger and J.H. Hubbell: XCOM:photon crosssections on a personal computer; US Dept. ofCommerci, NBSIR 87-3597.6.Oxford Analytical Systems Division; 275Technology Circle, Scotts Valley, CA 95066 USA.7. Hamamatsu Photonics System Division, HamamatsuCity, 431-32 Japan; www.hamamatsu.com.8.X-ray optical systems Inc., Corporate Circle,Albany, NY 12203, USA.9.IfG Institut für Gerätebau GmbH, Rudower Chaussee29/31, 12489 Berlin, Germany.11.AMPTEK Inc., 6 De Angelo Drive, Bedford, MA01730-2204 USA.12. C. Fiorini, A. Longoni: Application of a newnon cryogenic X-ray detector in portableinstruments for archaeometric analysis; Rev. Sci.Instrum. 69 (1998) 1523.14.see for example N. Gao and K. Janssens:polycapillary X-ray optics in X-ray spectrometry:recent technological advances; K. Tsuji, J. Iniuk,R. Van Grieken Eds.; J. Wiley & Sons, 2004, 89-110.
89
15.R. Cesareo, A. Castellano, G. Buccolieri, S.Quarta, M. Marabelli, P. Santopadre, A. Brunetti:Portable equipments for energy dispersive X-rayfluorescence analysis of Giotto’s frescoes in theChapel of the Scrovegni, Nucl. Instrum. Methods inPhys. Res. B213 (2003) 703-706.16.The detector was manufactured by EIS, viaSilvani, 00100 Rome, Italy.
6. Oxford Analytical Systems Division; 275 Technology Circle, Scotts Valley, CA 95066 USA
7. EIS-XRS, Via Silvani, Rome, Italy8. X-Ray and Specialty Instruments Inc., P.O. Box 3707, Ann Arbor, MI
48106, USA9. Photon Imaging Inc., Northridge, CA 91324, USA10. AMPTEK Inc., 6 De Angelo Drive, Bedford, MA 01730-2204 USA11. P. Lechner, S. Eckbauer, R. Hartmann, S. Krisch, D. Hauff, R.
Richter, H. Soltau, L. Struder, C. Fiorini, E. Gatti, A. Longoni, M. Sampietro; Nucl. Instrum. Methods A377 (1996) 346.
12. R. Arlt, V. Ivanov, A. Khusainov: Advances in high-resolution CdTe and CdZnTe detectors; in Hard X-ray and gamma-Ray detector physics, optics and applications; S. Diego, CA 31 July-1 August 1997 ,SPIE Proc. Vol. 3115,76.
13. E. Gatti, P. Rehak, Nucl. Instrum. Methods 225 (1984) 608.14. C. Fiorini, A. Longoni: Application of a new non cryogenic X-ray
detector in portable instruments for archaeometric analysis; Rev. Sci. Instrum. 69 (1998) 1523.
22.R.Cesareo, A. Castellano, G. Buccolieri, S.Quarta, M. Marabelli, P. Santopadre, M. Ioele:Giotto nella Cappella degli Scrovegni; analisi difluorescenza X dispersive in energia conapparecchiature portatili; Prove non distruttive24. M. Fagiolo dell’Arco: De Chirico,Rizzoli/Skira, 2004.
Riportare:-composizione di argenti-composizione di ceramiche
90

91

92


![Request for Proposal [RFP] For Empanelment of Suppliers For ...](https://static.fdokumen.com/doc/165x107/631e521885e2495e150fdc8f/request-for-proposal-rfp-for-empanelment-of-suppliers-for-.jpg)