Archaeomagnetic results on three Early Iron Age salt-kilns from Moyenvic (France
13
Geophys. J. Int. (2011) 185, 144–156 doi: 10.1111/j.1365-246X.2011.04933.x GJI Geomagnetism, rock magnetism and palaeomagnetism Archaeomagnetic results on three Early Iron Age salt-kilns from Moyenvic (France) Gwena¨ el Herv´ e, 1,3 Elisabeth Schnepp, 2 Annick Chauvin, 3 Philippe Lanos 1,3 and Norbert Nowaczyk 4 1 Centre de Recherches en Physique Appliqu´ ee ` a l’Arch´ eologie, UMR 5060, Universit´ e de Bordeaux 3, CNRS, et UMR 6118, Universit´ e de Rennes 1, CNRS, Campus de Beaulieu, CS 74205, 35042 Rennes Cedex, France. E-mail: [email protected] 2 Paleomagnetic Laboratory Gams, Chair of Geophysics, University of Leoben, Gams 45, Frohnleiten A8170, Austria 3 G´ eosciences-Rennes, UMR 6118, Universit´ e de Rennes 1, CNRS, Campus de Beaulieu, Bat 15, CS 74205, Rennes Cedex 35042, France 4 GeoForschungsZentrum Potsdam, Section 5.2—Palaeoclimate & Landscape Evolution Helmholtz-Zentrum Potsdam Deutsches GeoForschungsZentrum GFZ Telegrafenberg Haus C321, Potsdam D-14473, Germany Accepted 2010 December 26. Received 2010 December 17; in original form 2010 June 23 SUMMARY Variations of the Earth’s magnetic field during the first millennium BC in western Europe remain poorly constrained, especially archaeointensity changes. Three salt-kilns (MOA, MOB and MOC) sampled in Moyenvic (Lorraine, eastern France) have been studied to provide new reference data. Each kiln has been dated by radiocarbon to originate from the Early Iron Age or Hallstatt period (between VIII and Vth Century BC). Rock magnetic experiments and hys- teresis results suggest the predominance of pseudo-single domain (PSD) Ti-poor magnetite. Archaeomagnetic directions obtained by thermal and alternating field demagnetizations have high mean inclination (close to 70 ◦ ) and declination (between 19 and 31 ◦ ). A first set of classical Thellier–Thellier experiments was conducted on 46 samples with a laboratory field almost parallel to the direction of the characteristic remanent magnetization (ChRM). Only 24 of these specimens present a linear NRM–TRM plot. For other specimens, NRM–TRM plots are concave-up with positive pTRM checks. The very large dispersion observed between the determined palaeointensity values suggests some artefacts have not been fully recognized. A second set of Thellier experiments was conducted on 34 sister specimens with the laboratory field applied quasi-perpendicular to the ChRM. In these cases, mineralogical evolutions during heating and chemical remanent magnetization acquisitions have been clearly recognized, de- spite positive pTRM checks. The concave-up shapes of NRM–TRM plots appear mainly due to mineralogical alteration rather than to the presence of PSD–MD grains. For the entire set of samples the success rate of the palaeointensity determinations is very low with 80 per cent of the samples rejected. Nevertheless, reliable mean archaeointensities have been obtained for two of the three kilns (MOA, 80.1 ± 14.5 μT and MOB, 86.6 ± 6.9 μT at the latitude of Paris). The high field strength and the archaeomagnetic directions determined, combined with previous published data, provide further evidence for important changes of the Earth magnetic field in Europe during the first half of the first millennium BC. These large variations of the geomagnetic field during the Iron Ages indicate that archaeomagnetism is highly suitable for dating of structures from this period. Key words: Archaeomagnetism; Magnetic field; Palaeointensity; Palaeomagnetic secular variation. 1 INTRODUCTION Knowledge of the secular variation of the geomagnetic field in West- ern Europe has been considerably improved over recent years using archaeodirections (e.g. Gallet et al. 2002; Schnepp & Lanos 2005; Gomez-Paccard et al. 2006; Tema et al. 2006; Zananiri et al. 2007) as well as archaeointensities (Gomez-Paccard et al. 2008; Genevey et al. 2009, Schnepp et al. 2009). These new data have allowed considerable improvement in geomagnetic field models, on both global (ARCH3k, Korte et al. 2009) and regional (SCHA.DIF.3k, Pavon-Carrasco et al. 2009) scales. Archaeomagnetic dating has also become increasingly applicable in many European countries (Lanos 2004). In France and in Germany, directional secular vari- ation curves cover, respectively, the last 2500 and 3000 yr. (Gallet 144 C 2011 The Authors Geophysical Journal International C 2011 RAS Geophysical Journal International
-
Upload
independent -
Category
Documents
-
view
0 -
download
0
Transcript of Archaeomagnetic results on three Early Iron Age salt-kilns from Moyenvic (France
Geophys. J. Int. (2011) 185, 144–156 doi: 10.1111/j.1365-246X.2011.04933.x
GJI
Geo
mag
netism
,ro
ckm
agne
tism
and
pala
eom
agne
tism
Archaeomagnetic results on three Early Iron Age salt-kilnsfrom Moyenvic (France)
Gwenael Herve,1,3 Elisabeth Schnepp,2 Annick Chauvin,3 Philippe Lanos1,3
and Norbert Nowaczyk4
1Centre de Recherches en Physique Appliquee a l’Archeologie, UMR 5060, Universite de Bordeaux 3, CNRS, et UMR 6118, Universite de Rennes 1,CNRS, Campus de Beaulieu, CS 74205, 35042 Rennes Cedex, France. E-mail: [email protected] Laboratory Gams, Chair of Geophysics, University of Leoben, Gams 45, Frohnleiten A8170, Austria3Geosciences-Rennes, UMR 6118, Universite de Rennes 1, CNRS, Campus de Beaulieu, Bat 15, CS 74205, Rennes Cedex 35042, France4GeoForschungsZentrum Potsdam, Section 5.2—Palaeoclimate & Landscape Evolution Helmholtz-Zentrum Potsdam Deutsches GeoForschungsZentrum GFZTelegrafenberg Haus C321, Potsdam D-14473, Germany
Accepted 2010 December 26. Received 2010 December 17; in original form 2010 June 23
S U M M A R YVariations of the Earth’s magnetic field during the first millennium BC in western Europeremain poorly constrained, especially archaeointensity changes. Three salt-kilns (MOA, MOBand MOC) sampled in Moyenvic (Lorraine, eastern France) have been studied to provide newreference data. Each kiln has been dated by radiocarbon to originate from the Early Iron Ageor Hallstatt period (between VIII and Vth Century BC). Rock magnetic experiments and hys-teresis results suggest the predominance of pseudo-single domain (PSD) Ti-poor magnetite.Archaeomagnetic directions obtained by thermal and alternating field demagnetizations havehigh mean inclination (close to 70◦) and declination (between 19 and 31◦). A first set ofclassical Thellier–Thellier experiments was conducted on 46 samples with a laboratory fieldalmost parallel to the direction of the characteristic remanent magnetization (ChRM). Only 24of these specimens present a linear NRM–TRM plot. For other specimens, NRM–TRM plotsare concave-up with positive pTRM checks. The very large dispersion observed between thedetermined palaeointensity values suggests some artefacts have not been fully recognized. Asecond set of Thellier experiments was conducted on 34 sister specimens with the laboratoryfield applied quasi-perpendicular to the ChRM. In these cases, mineralogical evolutions duringheating and chemical remanent magnetization acquisitions have been clearly recognized, de-spite positive pTRM checks. The concave-up shapes of NRM–TRM plots appear mainly dueto mineralogical alteration rather than to the presence of PSD–MD grains. For the entire setof samples the success rate of the palaeointensity determinations is very low with 80 per centof the samples rejected. Nevertheless, reliable mean archaeointensities have been obtained fortwo of the three kilns (MOA, 80.1 ± 14.5 µT and MOB, 86.6 ± 6.9 µT at the latitude ofParis). The high field strength and the archaeomagnetic directions determined, combined withprevious published data, provide further evidence for important changes of the Earth magneticfield in Europe during the first half of the first millennium BC. These large variations of thegeomagnetic field during the Iron Ages indicate that archaeomagnetism is highly suitable fordating of structures from this period.
Key words: Archaeomagnetism; Magnetic field; Palaeointensity; Palaeomagnetic secularvariation.
1 I N T RO D U C T I O N
Knowledge of the secular variation of the geomagnetic field in West-ern Europe has been considerably improved over recent years usingarchaeodirections (e.g. Gallet et al. 2002; Schnepp & Lanos 2005;Gomez-Paccard et al. 2006; Tema et al. 2006; Zananiri et al. 2007)as well as archaeointensities (Gomez-Paccard et al. 2008; Genevey
et al. 2009, Schnepp et al. 2009). These new data have allowedconsiderable improvement in geomagnetic field models, on bothglobal (ARCH3k, Korte et al. 2009) and regional (SCHA.DIF.3k,Pavon-Carrasco et al. 2009) scales. Archaeomagnetic dating hasalso become increasingly applicable in many European countries(Lanos 2004). In France and in Germany, directional secular vari-ation curves cover, respectively, the last 2500 and 3000 yr. (Gallet
144 C© 2011 The Authors
Geophysical Journal International C© 2011 RAS
Geophysical Journal International

Archaeomagnetic results from Moyenvic (France) 145
et al. 2002; Schnepp & Lanos 2005). However, the resolution ofthese curves only permits reliable archaeomagnetic dating of ar-chaeological structures for the last two millennia. Archaeomagneticdating is not yet sufficiently developed for the first millenium BC,that is, for the Iron Age.
The archaeointensity reference curve of Gomez-Paccard et al.(2008), established with western Europe data, covers only the lasttwo millenia. Archaeointensity data for the first millennium BCwere mainly obtained on sites from the Mediterranean area (Hillet al. 2007, 2008; Gallet et al. 2009) and eastern Europe (De Marcoet al. 2008; Kovacheva et al. 2009). The number of data fromnorthwestern Europe has to be increased to improve geomagneticfield model for this time period.
Moreover, all preliminary European data for the first milleniumBC indicate very strong variations of the Earth’s magnetic field,especially for declination and archaeointensity. Accordingly, thisperiod appears very interesting for both understanding the evolutionof the geomagnetic field and increasing the resolution of archaeo-magnetic dating. As radiocarbon is not very precise for this perioddue to plateau effects on the dendrochronological calibration curve,archaeologists need another effective chronometric dating method.The aim of this study is to provide new reference data contributingto the French and German databases for the first millenium BC. Itrepresents a new step to build secular variation curves useful forarchaeomagnetic dating.
2 A RC H A E O L O G I C A L C O N T E X T
The village of Moyenvic is located in the Seille Valley, in the Lor-raine region (eastern France, Fig. 1). The Seille valley is known asthe most important centre of salt production in Northern Europeduring the Early Iron Age (Bertaux 1987). Because of leaching ofTriassic evaporitic layers, all springwaters in the area present a highsalinity. Salt was produced in kilns during the Early Iron Age by the‘briquetage’ technique (Daire 2003), which begins with an evapo-ration step, followed by the agglomeration of salt crystals at highertemperatures (700–750◦C). It is in that latter step that kiln wallsacquired a thermoremanent magnetization (TRM).
The survey excavation at the archaeological site of ‘les Croleurs’(48.80◦N, 6.6◦E) was undertaken by J.-D. Laffitte in 1999 and com-pleted in 2001 (Laffitte 2002). 15 salterns and 40 salt-kilns wereidentified over 1 ha. Like most other kilns in this area, the threekilns we sampled, identified here as kilns MOA, MOB and MOC(Fig. 1) are underground and horseshoe shaped. Sampled kilns are
Figure 2. Example of radiocarbon dating on charcoal found in kiln MOA.Despite accurate uncalibrated 14C-age, the presence of a plateau on thecalibration curve during the Early Iron Age leads to large intervals on dateestimate.
1.50–2.50 m long. Kiln walls seem to be have been well heated,particularly the central pillar.
The use period of the three kilns has been dated by radiocarbonanalysis on charcoals found in each one of them. These analyseswere carried out at the Groningen laboratory. Calibration of radio-carbon ages was realized with the Intcal04 curve (Reimer et al.2004), using Oxcal software (v. 3.10, Bronk Ramsey 2005). Al-though the uncalibrated radiocarbon ages are precise, the calibrateddate intervals are large, due to the long plateau in the calibrationcurve during the Early Iron Age (Fig. 2). Table 1 presents uncali-brated ages and calibrated dates at 95 per cent confidence for thethree kilns. The absence of stratigraphic relationships between thesekilns does not permit to reduce the intervals of calibrated dates.
3 S A M P L E P R E PA R AT I O NA N D M E A S U R E M E N T S
29 large blocks samples on MOA, 23 on MOB and 18 on MOCwere collected. They were oriented by placing plaster hats on thetop surface (levelled horizontal using a bubble) and oriented using amagnetic compass and if possible a sun compass (MOB and MOC).
The block samples were very brittle and have been consolidatedwith waterglass. Two slices of 20 mm thickness, designated A andB, were cut from each block. One slice of each block has been
Figure 1. Location of the archaeological site Moyenvic les Croleurs (48.780◦N, 6.570◦E) in Lorraine, Eastern France (left-hand side) and field photograph ofhorseshoe kiln MOC during sampling (right-hand side).
C© 2011 The Authors, GJI, 185, 144–156
Geophysical Journal International C© 2011 RAS

146 G. Herve et al.
Table 1. Results of radiocarbon dating on charcoal sampled in each kiln. Calibrated 14C dates areobtained with Oxcal software (Bronk Ramsey 2005) using the IntCal04 calibration curve (Reimeret al. 2004).
Uncalibrated 14C age Calibrated 14C dates at 95.4 per cent 14C Age used in Fig. 13Kiln (years BP) confidence (CalBC) (years BC)
MOA 2460 ± 35 [760; 680] and [670; 410] 585 ± 176MOB 2550 ± 30 [800; 740], [690; 660] and [650; 540] 672 ± 129MOC 2550 ± 50 [820; 510] 665 ± 155
further processed in the palaeomagnetic laboratory of GeosciencesRennes (France) and the other half was treated in the palaeomag-netic laboratory Grubenhagen of the LIAG (Germany) and in thepalaeomagnetic laboratory Gams of the University of Leoben (Aus-tria). Slices were cut into cubes of 8 cm3 that were weighed.
Natural remanent magnetization (NRM) was measured with a2G cryogenic magnetometer (Rennes, GAMS and Grubenhagen)or a Molspin spinner magnetometer (Rennes). Bulk susceptibil-ity was measured with a Minikappa (Grubenhagen) or a Bart-ington MS2 (Rennes). In Rennes, thermomagnetic curves wereobtained with a KLY3 Agico susceptibility meter with fitted fur-nace by heating–cooling cycles successively up to 350 and 650◦C.In the palaeomagnetic laboratory of the GFZ Potsdam, hysteresisloop measurements have been carried out in a Princeton MicromagAGFM on small chips (a few milligrams) and for 11 additional chipsisothermal remanent magnetization (IRM) acquisition and back-field curves were determined. First-order reversal curve (FORC)diagrams (Pike et al. 1999; Roberts et al. 2000) were measured atPotsdam.
Pilot alternating field demagnetizations were carried out using aMagnon demagnetizer up to 200 mT (Grubenhagen) or in a 2G-AF demagnetizer in line with the 2G cryogenic magnetometer. Onespecimen per sample was used, sometimes two. Thermal demag-netization was performed with a Magnon thermal demagnetizer(Grubenhagen) and a Magnetic Measurements Thermal Demagne-tization (MMTD) oven (Rennes) for one specimen per sample andsteps of 50◦C from 150 to 600◦C. A Thellier viscosity test (Thellier& Thellier 1944) was performed in Grubenhagen by storing twospecimens per samples during 14 d with the +Z and then the −Zdirection aligned with the Earth’s magnetic field direction.
The classical Thellier–Thellier method (Thellier & Thellier 1959)with partial thermoremanent magnetization (pTRM) checks wasused to estimate archaeointensity. Heating steps were realized in airin a MMTD oven in the laboratory of Rennes. At each temperaturestep, specimens were heated and cooled twice, first in a laboratoryfield +FLab and second in the opposite field −FLab. Only specimenswhose AF or thermally demagnetized sisters-specimens presenteda single component of magnetization have been chosen. First, spec-imens of the three kilns were heated in a laboratory field of 60.0 µTapplied along their Z-axis. In a second step, new Thellier experi-ments have been conducted with a laboratory field of 70 µT appliedalong the X -axis of the specimens. Eight to 12 temperature stepswere performed from 100 to 560◦C. Low-field susceptibility wasmeasured after each heating step.
4 RO C K M A G N E T I C R E S U LT S
4.1 Koenigsberger ratios
NRM intensity is plotted versus bulk susceptibility in Fig. 3(a) to-gether with lines of increasing Koenigsberger ratios (Q defined asthe ratio of NRM to the induced magnetization, a field of 40 A m−1
was used). In most cases, Q values are above 10 showing that thesespecimens acquired a TRM during the use of the kilns. For kilnMOA, the position of the block with respect to the combustionchamber is indicated by colour variations. Here most specimens(black crosses in Fig. 3) from blocks taken in the inner part of thekiln have higher NRM and susceptibility values comparable withthose of the other kilns. The material of kiln MOA is very inhomo-geneous and contains fragments of baked clay and some potsherds.Presumably this contributes to the large scatter in NRM intensitiesand in bulk susceptibilities. Generally, specimens from blocks sam-pled in the outer parts of the kiln (grey crosses) have Q-ratios below5, suggesting that they acquired a weak partial thermoremanence.
4.2 Viscosity index
The viscosity index is defined as the ratio of the viscous remanentmagnetization acquired within 14 days of storage in the laboratoryfield to that of the NRM (Thellier & Thellier 1944). Here it ismostly below 5 per cent (Fig. 3b), thus indicating little viscouscontribution to a stable NRM. Only a very weak directional changeof NRM directions is obtained after removing these small viscouscomponents. No viscosity tests were performed on blocks MOA12–29, because a partial thermoremanence is expected for thesesamples.
4.3 Magnetic stability
Figs 3(c) and (d) show the median destructive temperatures (MDT)and median destructive fields (MDF) for thermal and AF demagne-tization, respectively. Usually the values of MDT lie above 350◦Cindicating high unblocking temperatures. Most MDF values are be-tween 15 and 30 mT. These properties suggest the predominance ofa magnetic carrier close to a magnetite composition.
4.4 Curie points
Furthermore, a Curie point close to 580 ◦C is observed on most of the28 thermomagnetic curves (Fig. 4) suggesting that the predominantmagnetic carrier is magnetite. However, in several specimens (e.g.MOB7 and MOB3), a Curie point around 200 ◦C is also observed. Inaddition, some specimens like MOB15 carry a ferrimagnetic phasewith a Curie temperature of 620◦C, which could indicate the pres-ence of partially oxidized titanomagnetite or titanomaghemite. Mostthermomagnetic curves are reversible for heating up to 350–400 ◦Cbut irreversible for heating up to 600 ◦C, especially for kilnMOC.
4.5 Hysteresis
In total, 24 IRM hysteresis curves have been measured with max-imum fields of 1 T or 2 T. The results are plotted (Fig. 5) in a
C© 2011 The Authors, GJI, 185, 144–156
Geophysical Journal International C© 2011 RAS

Archaeomagnetic results from Moyenvic (France) 147
median destructive field (mT)
0
2
4
6
8
10
12
14
16
18
20
22
24
freq
uen
cy
0
10
20
freq
uen
cy
viscosity index (%)
0 100 20 00 400 500 600median destructive temperature (°C)
0
2
4
6
8
freq
uen
cy
(a) (b)
(d)(c)
1x10⁻¹ 1x100 1x101 1x10²
susceptibility (10-3)
1x10
-11x
100
1x10
11x
102
1x10
31x
104
NR
M in
ten
sity
(m
A/m
)
Q=0.1
Q=1
Q=10
Q=100
MOA 1-11MOA 12-29MOBMOC
Figure 3. Rock magnetic parameters of the kilns. (a) Intensity of natural remanent magnetization (NRM) is plotted versus bulk susceptibility. Lines indicateconstant Koenigsberger ratios between 0.1 and 100. Kiln MOA was divided into inner (1–11) and outer part (12–29). (b) Viscosity index obtained fromexperiments according to (Thellier & Thellier 1944). (c) Median destructive temperature. (d) Median destructive field obtained from thermal and alternatingfield demagnetization, respectively.
Day diagram (Day et al. 1977) showing that the domain state ispseudo-single domain (PSD). All specimens are far away fromthe single domain (SD) field, but some are close to the multido-main (MD) region. Specimens with accepted results of palaeoin-tensity are marked green, rejected are marked red. No systematictrend is observed between the position in the Day plot and the suc-cess in palaeointensity determination. Two specimens from MOBkiln have wasp-waisted hysteresis loops and therefore contain aconsiderable fraction of hematite. All other specimens plot closeto lines determined by Dunlop (2002) for mixtures of SD andMD pure magnetite. As other ferromagnetic crystals are presentin our samples, those experiments should be considered withcaution.
For two specimens, first-order reversal curves (FORC) measure-ments have been carried out which demonstrate that the magneticcarriers are populations of MD and small PSD or SD grains (Fig. 5).According to Carvallo et al. (2006), SD particles are associatedwith closed concentric contours with a central peak in the FORCdistribution. This is seen in the right diagram for the sister speci-men of a successful Thellier experiment. Nevertheless there is alsoanother fraction giving diverging contours along the Hb-axis andrepresenting MD grains. For a sister specimen of a rejected Thellierexperiment (left diagram) only open contours occur. Additionally,the vertical spread of the distribution indicates magnetostaticallyinteracting grains.
5 D I R E C T I O N A N D S TA B I L I T Y O F N R M
Although many specimens have scattered NRM directions a well-defined cluster can be seen at about 30◦ declination and 70◦ inclina-tion (Fig. 6) for MOB and the inner part of kiln MOA (block samples1–11). Samples from the outer part of MOA (12–29) and MOC showa considerable scatter and many aberrant directions. Such aberrantdirections are very often correlated with low Q-factors.
AF demagnetization has been carried out for one specimen fromeach block representing various Koenigsberger ratios and also aber-rant directions. Eight to 13 steps were performed in most cases withmaximum fields of 120 mT. Additional thermal demagnetizationof one specimen per block was performed for kiln MOA on cho-sen specimens with high Q-factor. Generally stable directions areobserved, except for many specimens from the outer part of kilnMOA. Fig. 7 shows examples of demagnetization experiments. ForMOA (Figs 7a and b) each orthogonal projection diagram shows acomparison of thermal and AF demagnetizations. In Fig. 7(a), twoexamples are shown which have no secondary component. Such abehaviour was found for three further specimens all coming fromthe inner part of the kiln MOA. Fig. 7(b) represents 12 specimensfrom the inner part and some from the outer part, which have onlyvery weak secondary components removed by 10–20 mT or 150◦C.Most specimens from the outer part showed an unstable behaviouror aberrant directions, and some had strong secondary components.
C© 2011 The Authors, GJI, 185, 144–156
Geophysical Journal International C© 2011 RAS

148 G. Herve et al.
Low
-fie
ld s
usce
ptib
ilit
y (1
0-6 m
3 /kg
)L
ow-f
ield
sus
cept
ibil
ity
(10
-6 m
3 /kg
)
2.0
3.0
4.0
0.0
1.0
0 200 400 600 °C
MOA05
0.0
1.0
0 200 400 600 °C
MOB03
2.0
0.00
0.20
0.40
0.60
0.80
0 200 400 600 °C
MOB07
MOB15
0.0
10.0
0 200 400 600 °C
(a)
(d)(c)
(b)
0 200 400 600 °C 0.0
1.0
2.0
3.0
4.0
5.0
Low
-fie
ld s
usce
ptib
ilit
y (
10-6
m3 /
kg)
MOC13
(e)
Figure 4. Examples of thermomagnetic curves: archaeointensity results of some sisters specimens are described later. Specimen (a) represents reliablearchaeointensity results without mineralogical changes. Mineralogical alteration appears at 350–450◦C for specimens (b), (c) and (d), but also before thesetemperatures, especially for specimens of kiln MOC (e).
Kiln MOB is characterized mainly by weak secondary components(Fig. 7c) and only three specimens needed more than 15 mT toreach the characteristic remanent magnetization (ChRM) direction.The resulting ChRM directions are well concentrated except forone outlier. Kiln MOC shows behaviour similar to MOA (Fig. 7d)with five specimens yielding no stable direction, secondary com-ponents removed after 20–25 mT on six specimens, and the restof the samples with only weak secondary components (two exam-ples are shown in Fig. 7d). The resulting ChRM directions are wellconcentrated except for one outlier.
Fig. 8(a) shows equal area projections of specimen ChRM di-rections for which principal component analysis (PCA, Kirschvink1980) was possible. Some obvious aberrant ChRM directions (threefrom MOA with negative inclination and one from MOC with zeroinclination) were not taken into account. Four specimens of MOAand MOC, respectively, did not allow application of PCA. Whilekilns MOB and MOC show well-concentrated archaeodirections,with only one outlier for MOC, the directions of MOA are muchmore scattered. To identify aberrant directions, which are causedby incomplete heating and/or inefficient demagnetization, an out-lier test (McFadden 1982) was calculated for all directions (16)lying outside of the grey circle drawn in the diagram. This circle
was drawn where most ChRM directions are concentrated. Eightdirections were finally rejected.
The mean directions of the accepted ChRM directions werethen derived for each sample block. Mean directions are shownin Fig. 8(b) and the highest scatter remains for kiln MOA. Thestructure mean directions and parameters of the Fisher statistics(Fisher 1953) are listed in Table 2. For MOB and MOC, higher pre-cision parameters and smaller α95 radii have been obtained but theresult from MOA can still be considered as reliable. To test, if thesethree directions are significantly different on a statistical basis, anF-test (McFadden & Lowes 1981) has been calculated and resultsare listed in Table 3. All three mean directions are significantlydifferent, at the 95 per cent confidence level.
6 D E T E R M I NAT I O NO F A RC H A E O I N T E N S I T Y
The classical Thellier–Thellier protocol (Thellier & Thellier 1959)was only carried out on specimens whose AF or thermally demag-netized sisters-specimens presented a single component of mag-netization. Almost all 46 specimens of the three kilns that wereheated with a laboratory field applied along their Z-axis (i.e. along
C© 2011 The Authors, GJI, 185, 144–156
Geophysical Journal International C© 2011 RAS

Archaeomagnetic results from Moyenvic (France) 149
Figure 5. Day diagram (top panel): ratio of saturation magnetizations isplotted versus ratio of coercivities. The black lines were obtained accordingto Dunlop (2002) for mixtures of various amounts SD and SP (upper twocurves) or MD magnetite (lower three curves). The successful outcome ofThellier experiments on sister specimens is indicated by green/red dots foraccepted/rejected results. FORC diagrams (bottom panel) for two selectedspecimens from kiln MOB.
a subparallel direction to NRM) have positive pTRM checks. Fol-lowing Chauvin et al. (2000), pTRM checks have been consideredpositive if, at a given temperature step, the difference between theoriginal pTRM and the pTRM check does not exceed 10 per cent ofthe total TRM acquired. Positive pTRM checks should prove thatspecimens have not acquired a chemical remanent magnetization(CRM) during laboratory heating.
However, Fig. 9 illustrates the diversity of observed behavioursduring the Thellier–Thellier experiments, especially for kiln MOC.Only a few specimens (24) presented the ideal linear behaviouron NRM–TRM diagrams, which is theoretically only observed fornon-interacting SD grains (Thellier & Thellier 1959). The otherspecimens present strong concave-up behaviours (Fig. 9). In suchcases, Chauvin et al. (2005) showed that widely different palaeoin-tensities (overestimations or underestimations) could be obtaineddepending on which line segment is chosen.
Concavity cannot be explained by the existence of two compo-nents of magnetization. Moreover, high values of Koenigsbergerratio Q suggests that the magnetization is a TRM and not a thermo-chemical remanent magnetization (TCRM, see Fabian 2009).
The presence of PSD or MD grains (see e.g. Levi 1977; Coe et al.2004; Chauvin et al. 2005; Dunlop et al. 2005; Biggin 2010) alsoresults in concave-up NRM–TRM plots. Hysteresis results show thepresence of a PSD or MD grain fraction, which could have affectedthe archaeointensity results. However, hysteresis properties studied
N
S
E30°W 60°
MOA 1-11MOA 12-29MOBMOC
Figure 6. Directions of natural remanent magnetization (NRM) plotted inequal area projection. Kilns are indicated by different colours. Kiln MOAwas divided into inner (block samples 1–11) and outer part (12–29).
for some sister-specimens do not show a systematic trend betweenlinear/concave-up behaviour and position on the Day plot (Fig. 5).For MD grains, Biggin (2010) also observed no correlation betweenhysteresis results and concavity of NRM–TRM plots. FORC exper-iments show the difference in the grain assemblages for the linearand the concave-up Thellier experiments. Linear behaviour of thespecimen (MOB17B21) is associated with SD particles. FORC dis-tribution showing magnetostatically interacting grains correspondto a specimen with concave-up NRM–TRM plot (MOB11A15). Inconsequence, PSD–MD effects could explain non-ideal behaviourof some specimens, although these two examples are not suffi-cient to define a systematic trend. Moreover, numerous experimen-tal and theoretical studies indicate that in the case of concave-upNRM–TRM diagrams induced by MD magnetic grains, the slopeof the line through the initial and the final points yields the expectedfield strength (see e.g. Levi 1977; Fabian 2001; Coe et al. 2004;Chauvin et al. 2005). In Moyenvic samples, this approach yieldsa huge scatter of archaeointensities (30–110 µT) at the site level(Fig. 9), suggesting that curvature of NRM–TRM diagrams is notthe result of MD magnetic grain effects.
Because thermomagnetic curves show strong alteration above400 ◦C, concavity of NRM–TRM plots might be explained by min-eralogical alteration, not detected by pTRM checks. CRM acquiredduring a Thellier experiment induces a deviation of NRM directiontoward the laboratory field direction. However, if the laboratory fieldis subparallel to NRM, CRM acquisition may not cause a significantvariation of NRM direction. Accordingly, 34 further Thellier exper-iments were carried out with a laboratory field of 70 µT appliedalong the X -axis of specimens, that is, quasi-perpendicular to NRMdirection.
6.1 Angle between laboratory field and NRM
Fig. 10 presents two sisters-specimens heated with FLab appliedalong theirs Z (Fig. 10a) and X axes (Fig. 10b). For the latter, a
C© 2011 The Authors, GJI, 185, 144–156
Geophysical Journal International C© 2011 RAS

150 G. Herve et al.
up,W
N,H
-0.4 -0.2 0.0 0.2 0.4 0.6 0.8 1.01.0
0.8
0.6
0.4
0.2
0.0
-0.2
-0.4
nor
m. c
omp
onen
ts
-0.4 -0.2 0.0 0.2 0.4 0.6 0.8 1.01.0
0.8
0.6
0.4
0.2
0.0
-0.2
-0.4
-0.4 -0.2 0.0 0.2 0.4 0.6 0.8 1.0norm. components
1.0
0.8
0.6
0.4
0.2
0.0
-0.2
-0.4
nor
m. c
omp
onen
ts
-0.4 -0.2 0.0 0.2 0.4 0.6 0.8 1.0
norm. components
1.0
0.8
0.6
0.4
0.2
0.0
-0.2
-0.4
MOA07B32MOA06A22
MOA12B13MOA04A13
(a) (b)
(c) (d)
N,H
N,HN,H
up,W
MOB06A12MOB22B11
MOC05B12MOC17A21
Figure 7. Demagnetization examples for kilns MOA (a and b), MOB (c) and MOC (d). Diagrams show normalized components of magnetization, triangles(diamonds) indicate thermal (AF) demagnetization. Closed (open) symbols are projection on the horizontal (vertical) plane (H corresponds to inclination).Specimen names are colour-coded to correspond to lines of the same colour in each diagram.
xxx
x
x
xx x
x
x
N
S
EW30° 60°
MOA MOB MOC(a)
normal reversed rejectedx
+ mean ChRM
(b)
60°W 70° 80°
Figure 8. (a) Directions of characteristic remanent magnetization (ChRM) obtained from each thermal or AF demagnetization experiment plotted in equal areaprojection. For kiln MOA directions lying outside the grey circle were tested with the outlier test (McFadden & Lowes 1981), they are marked by a grey ‘x’,when rejected. (b) Mean ChRM directions. Black dots are mean directions of each block samples. The grey cross is the site-mean ChRM direction surroundedby the α95 circle in grey.
Table 2. Palaeomagnetic results of kilns from Moyenvic (48.780◦N,6.570◦E): name, number of block samples, number of demagnetization ex-periments with alternating field (AF) or thermal (th), number of ChRMdirections on block level, mean declination, inclination, precision parameterof Fisher statistics and radius α95 of error cone.
Abb. n AF/th N D (◦) I (◦) K α95 (◦)
MOA 29 26/21 20 18.6 66.6 92.0 3.4MOB 23 30/4 22 30.9 73.6 538.2 1.3MOC 18 16/3 12 21.8 71.6 306.8 2.5
strong deviation of the NRM direction toward that of the appliedfield is seen on the Zijderveld diagram and proves acquisition ofa CRM during the Thellier experiment. CRM acquisition is alsosuggested by a weak deviation of the vertical component starting at
Table 3. Results of the F-test (McFadden & Lowes 1981): combination oftested structures, parameter of f -distribution f 1 and f 2, significantly differenton 95 per cent probability level, when f 1 > f 2.
Combination f 1 f 2 Different?
MOA & MOB 0.394574 0.077769 YesMOA & MOC 0.158127 0.105014 YesMOB & MOC 0.153949 0.098139 Yes
425◦C for the other specimen from the same block (Fig. 10a), whichpresents the same variation of low-field susceptibility and decreaseof NRM with temperature (Figs 10c and d). 18 specimens heatedwith FLab applied along their X -axis present the same deviation ofthe NRM direction. Accordingly, concave-up NRM–TRM diagramsare mostly explained by important mineralogical alteration, even
C© 2011 The Authors, GJI, 185, 144–156
Geophysical Journal International C© 2011 RAS

Archaeomagnetic results from Moyenvic (France) 151
Figure 9. Composite NRM–TRM diagrams. Each panel shows the behaviour of samples (only with positive pTRM checks) from the same site (laboratoryfield 60 µT). In each composite Arai diagram, each symbol represents a particular specimen. Laboratory field was applied along the Z-axis of specimens.
MOB1A12Flab = 70 μT along X
NRM
1
TRM1
NRM0 = 1.6 A/m
100
200
360
440
500
545 565
MOB1A22Flab = 60 μT along Z
NRM
1
TRM1
NRM0 = 0.7 A/m
540 500
425
340
240
100
(a)
(b)
(c)
1
K/K
0
100 500 °C
MOB1A22
MOB1A12
(d) 1
100 500 °C
NR
M/N
RM
0
MOB1A22
MOB1A12
X
Z
Y
0 100
170
240 280
340
425 465
500
540
scale: 0.1A/m
Flab
X
Z
Y
0 100
200
280 360
440
500
545 565
scale: 1A/m
Flab
Figure 10. Comparison of NRM–TRM (left-hand side) and Zijderveld (middle) diagrams of sister’s specimens heated with FLab applied along Z-axis (a)or X -axis (b) of the specimens. Directions in the Zijderveld diagrams are shown in specimen coordinates. Open (solid) circles are projections upon vertical(horizontal) planes. NRM–TRM diagrams are normalized to the initial NRM intensity. (c) Variation of low-field susceptibility for both specimens duringsuccessive heating steps. (d) NRM decrease with temperature for both specimens.
if neither negative pTRM checks nor high variation of low-fieldsusceptibility have been observed.
Consequently, it was decided to retain only the specimens with-out significant deviation of their NRM directions toward that of
the applied field. Mineralogical changes sometimes occurred fromthe first temperature steps (Fig. 10b); consequently, 35 speci-mens were rejected. The thermal stability of the specimens islower than that expected according to the Koenigsberger ratio,
C© 2011 The Authors, GJI, 185, 144–156
Geophysical Journal International C© 2011 RAS

152 G. Herve et al.
Rejectedf<0.5
c)MOA5A12 : field applied along X
NRM0 = 10.9 A/mFlab = 70.0 μT
F = 88.9 μTq =MAD = 1.3DANG = 6.1 ß = 0.097
2.8
For 100 to 440°C :
scale: 10A/m
N
Down
E
20 100
280
440
500
545NRM
1
TRM1
100 280
440
500
545
MOB7A12 : field applied along Z
NRM0 = 0.9 A/mFlab = 60.0 μT
F = 88.9 μTq =MAD = 0.6DANG = 0.7 ß = 0.029
25.3
For 100 to 540°C :
a)
scale: 0.1A/m
100
N
Down
E
240
380
465
500
540
NRM
1
TRM1
240
380
465
540
Acceptedf>0.5
ß<0.05
b)MOB15B11 : field applied along Z
NRM0 = 17.3 A/mFlab = 60.0 μT
F = 63.4 μTq =MAD = 0.9DANG = 1.3 ß = 0.053
13.5
For 100 to 555°C :
scale: 10A/m
N
Down
E
100 350
430 465
500
535
555
NRM
1
TRM1
350 430
500
535 555
Rejectedf>0.5
ß>0.05
100 200 300 400 500 600° C
157490B-7A12
K / K
0
Figure 11. Examples of archaeointensity results for specimens that do not present significant deviation of NRM direction towards laboratory field direction.Directions on Zijderveld diagrams (right-hand side) are in situ coordinates. Open (solid) circles are projections upon vertical (horizontal) planes. NRM–TRMdiagrams (left-hand side) are normalized to the initial NRM intensity. Variation of low-field susceptibility during successive heating steps is also provided inFig. 11(a).
viscosity index and K-T experiments. This may be explainedby an insufficient archaeological heating to stabilize magneticmineralogy.
pTRM checks do not seem to be always sufficient criteria todetect mineralogical changes. Despite strong deviation of NRMdirection, the fact that positive pTRM checks are observed may beexplained by a low and continuous evolution at each temperaturestep. The best way to detect acquisition of a CRM seems to be thedistortion of the NRM direction toward the laboratory field directionduring successive heating steps. To be observed, this requires a largeangular deviation between the applied FLab direction and the NRMdirection.
6.2 Choice of criteria
Fig. 11 shows three examples of Thellier experiments on specimensfor which no CRM acquisition is seen. Many authors (Biggin &Thomas 2003; Chauvin et al. 2005; Ben-Yosef et al. 2009) showed
that a high NRM fraction (f factor, Coe et al. 1978) must be used toobtain reliable archaeointensity results. As recommended by Biggin& Thomas (2003) and Xu & Dunlop (2004), we rejected specimenswith f values lower than 0.5 (Fig. 11c).
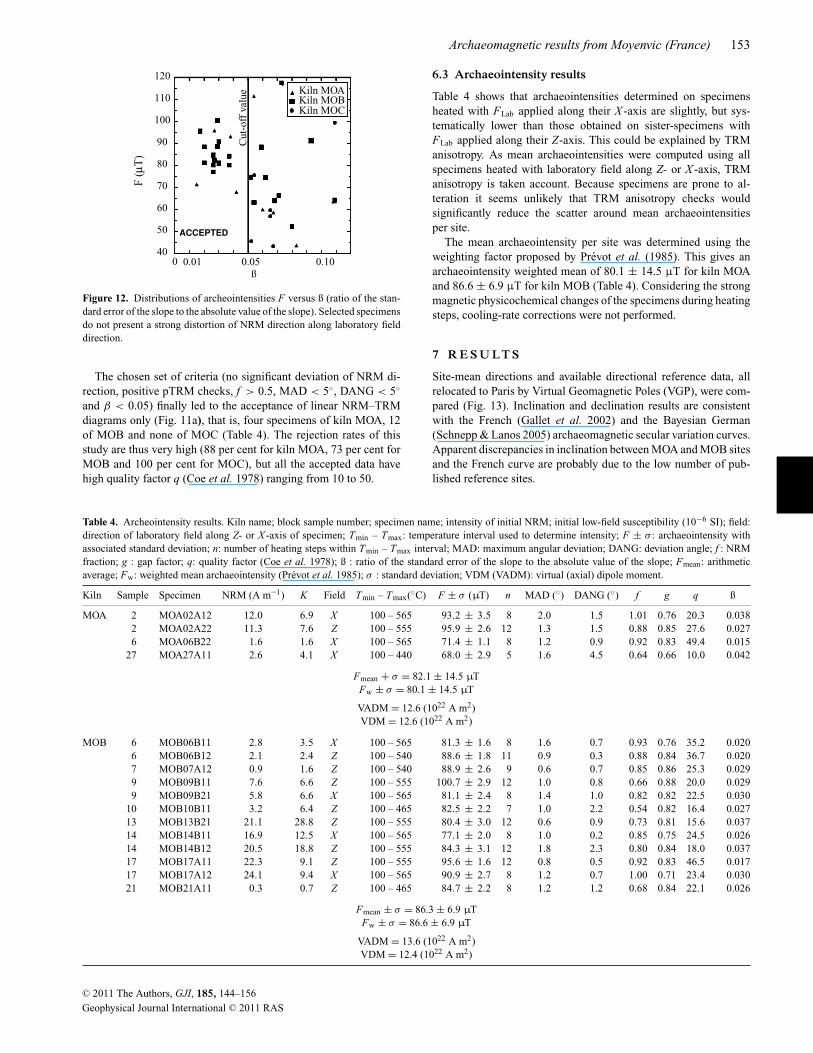
Three others parameters were used to select specimens with ac-ceptable Thellier experiments. First, the maximum angular devia-tion (MAD, Kirschvink 1980), which measures the scatter in NRMdirections, has to be lower than 5◦. Second, the deviation angle(DANG, Selkin & Tauxe 2000) has to be also lower than 5◦. How-ever, it should be noted that the deviation angle is an inefficientrejection criterion if NRM direction and laboratory field are sub-parallel during the Thellier experiment. Third, we used β, the ratioof the standard error of the slope to the absolute value of the best-fitslope for the data on the NRM–TRM plot. An upper limit of 0.05(Gee et al. 2010; Shaar et al. 2010) has been chosen (Fig. 11b)rather than 0.10 (Ben-Yosef et al. 2009) because specimens with ßhigher than 0.05 (i.e. with slightly concave-up plots) tend to havescattered archaeointensities (Fig. 12).
C© 2011 The Authors, GJI, 185, 144–156
Geophysical Journal International C© 2011 RAS
Archaeomagnetic results from Moyenvic (France) 153
Kiln MOA
Kiln MOCKiln MOB
40
50
60
70
80
90
100
110
120
0 0.01 0.05 0.10
F (
μT)
ß
Cut
-off
val
ueACCEPTED
Figure 12. Distributions of archeointensities F versus ß (ratio of the stan-dard error of the slope to the absolute value of the slope). Selected specimensdo not present a strong distortion of NRM direction along laboratory fielddirection.
The chosen set of criteria (no significant deviation of NRM di-rection, positive pTRM checks, f > 0.5, MAD < 5◦, DANG < 5◦
and β < 0.05) finally led to the acceptance of linear NRM–TRMdiagrams only (Fig. 11a), that is, four specimens of kiln MOA, 12of MOB and none of MOC (Table 4). The rejection rates of thisstudy are thus very high (88 per cent for kiln MOA, 73 per cent forMOB and 100 per cent for MOC), but all the accepted data havehigh quality factor q (Coe et al. 1978) ranging from 10 to 50.
6.3 Archaeointensity results
Table 4 shows that archaeointensities determined on specimensheated with FLab applied along their X -axis are slightly, but sys-tematically lower than those obtained on sister-specimens withFLab applied along their Z-axis. This could be explained by TRManisotropy. As mean archaeointensities were computed using allspecimens heated with laboratory field along Z- or X -axis, TRManisotropy is taken account. Because specimens are prone to al-teration it seems unlikely that TRM anisotropy checks wouldsignificantly reduce the scatter around mean archaeointensitiesper site.
The mean archaeointensity per site was determined using theweighting factor proposed by Prevot et al. (1985). This gives anarchaeointensity weighted mean of 80.1 ± 14.5 µT for kiln MOAand 86.6 ± 6.9 µT for kiln MOB (Table 4). Considering the strongmagnetic physicochemical changes of the specimens during heatingsteps, cooling-rate corrections were not performed.
7 R E S U LT S
Site-mean directions and available directional reference data, allrelocated to Paris by Virtual Geomagnetic Poles (VGP), were com-pared (Fig. 13). Inclination and declination results are consistentwith the French (Gallet et al. 2002) and the Bayesian German(Schnepp & Lanos 2005) archaeomagnetic secular variation curves.Apparent discrepancies in inclination between MOA and MOB sitesand the French curve are probably due to the low number of pub-lished reference sites.
Table 4. Archeointensity results. Kiln name; block sample number; specimen name; intensity of initial NRM; initial low-field susceptibility (10−6 SI); field:direction of laboratory field along Z- or X -axis of specimen; Tmin – Tmax: temperature interval used to determine intensity; F ± σ : archaeointensity withassociated standard deviation; n: number of heating steps within Tmin – Tmax interval; MAD: maximum angular deviation; DANG: deviation angle; f : NRMfraction; g : gap factor; q: quality factor (Coe et al. 1978); ß : ratio of the standard error of the slope to the absolute value of the slope; Fmean: arithmeticaverage; Fw: weighted mean archaeointensity (Prevot et al. 1985); σ : standard deviation; VDM (VADM): virtual (axial) dipole moment.
Kiln Sample Specimen NRM (A m–1) K Field Tmin – Tmax(◦C) F ± σ (µT) n MAD (◦) DANG (◦) f g q ß
MOA 2 MOA02A12 12.0 6.9 X 100 – 565 93.2 ± 3.5 8 2.0 1.5 1.01 0.76 20.3 0.0382 MOA02A22 11.3 7.6 Z 100 – 555 95.9 ± 2.6 12 1.3 1.5 0.88 0.85 27.6 0.0276 MOA06B22 1.6 1.6 X 100 – 565 71.4 ± 1.1 8 1.2 0.9 0.92 0.83 49.4 0.015
27 MOA27A11 2.6 4.1 X 100 – 440 68.0 ± 2.9 5 1.6 4.5 0.64 0.66 10.0 0.042
Fmean + σ = 82.1 ± 14.5 µTFw ± σ = 80.1 ± 14.5 µT
VADM = 12.6 (1022 A m2)VDM = 12.6 (1022 A m2)
MOB 6 MOB06B11 2.8 3.5 X 100 – 565 81.3 ± 1.6 8 1.6 0.7 0.93 0.76 35.2 0.0206 MOB06B12 2.1 2.4 Z 100 – 540 88.6 ± 1.8 11 0.9 0.3 0.88 0.84 36.7 0.0207 MOB07A12 0.9 1.6 Z 100 – 540 88.9 ± 2.6 9 0.6 0.7 0.85 0.86 25.3 0.0299 MOB09B11 7.6 6.6 Z 100 – 555 100.7 ± 2.9 12 1.0 0.8 0.66 0.88 20.0 0.0299 MOB09B21 5.8 6.6 X 100 – 565 81.1 ± 2.4 8 1.4 1.0 0.82 0.82 22.5 0.030
10 MOB10B11 3.2 6.4 Z 100 – 465 82.5 ± 2.2 7 1.0 2.2 0.54 0.82 16.4 0.02713 MOB13B21 21.1 28.8 Z 100 – 555 80.4 ± 3.0 12 0.6 0.9 0.73 0.81 15.6 0.03714 MOB14B11 16.9 12.5 X 100 – 565 77.1 ± 2.0 8 1.0 0.2 0.85 0.75 24.5 0.02614 MOB14B12 20.5 18.8 Z 100 – 555 84.3 ± 3.1 12 1.8 2.3 0.80 0.84 18.0 0.03717 MOB17A11 22.3 9.1 Z 100 – 555 95.6 ± 1.6 12 0.8 0.5 0.92 0.83 46.5 0.01717 MOB17A12 24.1 9.4 X 100 – 565 90.9 ± 2.7 8 1.2 0.7 1.00 0.71 23.4 0.03021 MOB21A11 0.3 0.7 Z 100 – 465 84.7 ± 2.2 8 1.2 1.2 0.68 0.84 22.1 0.026
Fmean ± σ = 86.3 ± 6.9 µTFw ± σ = 86.6 ± 6.9 µT
VADM = 13.6 (1022 A m2)VDM = 12.4 (1022 A m2)
C© 2011 The Authors, GJI, 185, 144–156
Geophysical Journal International C© 2011 RAS

154 G. Herve et al.
Kovacheva et al. 2009
Gallet et al. 2009
This study
Burakov 2006
Hill et al. 2007,2008
De Marco 2008
Pesonen 1995 Hedley and Wagner 1991
Latitude of Paris
Arc
heoi
nten
sity
(μT
)
(c)
Years AD
Years AD
(a)
(b)
Dec
lina
tion
(°)
Incl
inat
ion
(°)
Latitude of Paris
0004-008-50
60
70
80
MOA
MOB
MOC
-20
0
20
40
MOA
MOB
MOC
40
50
60
70
80
90
100
110
-1000 -800 -600 -400 -200 040
50
60
70
80
90
100
110
-1000 -800 -600 -400 -200 0
Figure 13. Comparison of Moyenvic declination (a), inclination (b) and ar-chaeointensity (c) with archaeodirections reference curves of France (green)and Germany (blue) or sites from Europe. Archaeointensities based on Thel-lier’s method with pTRM checks only. Data are relocated to Paris (48.85◦N,2.30◦E), via VGP for directional data and VADM for archaeointensitydata.
No archaeointensity reference curve is yet published for proto-historic times in western Europe. Data acquired with the Thelliermethod, including pTRM checks and anisotropy corrections, areonly available for France (Hedley & Wagner 1991), Switzerland(Kovacheva 2009), Mediterranean Europe and Finland (Pesonenet al. 1995). These published data were corrected for anisotropyusing either TRM or magnetic susceptibility (AMS) or anhystericremanent magnetization (ARM) or IRM. Only data published byHill et al. (2007, 2008), De Marco (2008) and Gallet et al. (2009),were corrected for TRM anisotropy and cooling rate effects. Ourarchaeointensity results are consistent (Fig. 13c) with Italian (Hillet al. 2008; Gallet et al. 2009) data. The Spanish data (Burakov et al.2006) obtained from potsherds present somewhat higher values thatcould be explained by the fact that their data were corrected foranisotropy using AMS which give usually a lower correcting factor
than TRM anisotropy (Chauvin et al. 2000). Moreover cooling-rateeffects were not corrected for these data but are relevant for suchmaterial (Genevey & Gallet 2002). Finally, discrepancies betweendata in Fig. 13(c) could be explained by some dating inaccuracyand/or differences in the methods used to correct for anisotropy andcooling rate effect. However our new data confirm high archaeoin-tensity values (about twice the present day field value) during thefirst half of the Early Iron Age.
8 C O N C LU S I O N
In this study a full magnetic field vector analysis was performed onthree salt kilns from Moyenvic (East France), dated by radiocarbonanalysis on charcoals. The mean archaeomagnetic directions wereobtained after thermal and AF demagnetizations and the originalThellier method was used to obtain high-quality archaeointensityresults. The interpretation of the archaeointensity experiments, per-formed on 80 samples, was particularly complex. This might beexplained by insufficient archaeological heating to stabilize mag-netic mineralogy, a common situation on archaeomagnetic sitesfrom the first millennium BC. 75 per cent of the studied specimenspresent concave-up NRM–TRM plots with positive pTRM checks,a behaviour commonly attributed to coarse grains effects predictedby hysteresis and FORC analysis. However, PSD–MD grains ef-fects do not seem the main cause of failures of the palaeointensityexperiments. The obvious distortion of NRM direction towards thelaboratory field direction proves the occurrence of strong miner-alogical alteration, not detected by pTRM checks. Moreover, forsimilar large f factors, archaeointensities of concave-up plots aresignificantly lower than archaeointensities of linear NRM–TRMplots, which would not be expected for MD grains.
Consequently, we advise to apply the laboratory field in a direc-tion at a large angle from that of the NRM, to detect mineralogi-cal alterations and, ultimately, to avoid the incorrect interpretationof concavity on NRM–TRM plots as only due to coarse grainseffects.
High values of eastern declination and strong field archaeoin-tensities were obtained, providing further evidence for importantchanges of the Earth’s magnetic field in Europe during first half ofthe first millennium BC.
This study provides new reliable reference data for the data setsof Germany and France. Further studies have to be carried out forthe first millennium BC, to better characterize these strong vari-ations of the Earth’s magnetic field. Such variations suggest thatarchaeomagnetism would provide an effective tool to date accu-rately archaeological structures of the Early Iron Age, especiallyduring the long plateau found in the radiocarbon calibration curve(Hajdas 2008) lasting from 750 to 400 BC.
A C K N OW L E D G M E N T S
J.D. Laffitte (INRAP) is kindly acknowledged for providing archae-ological information about the site and the kilns. We thank PhilippeDufresne for his help during sampling and sample preparation, Guil-lame Dupont-Nivet for his attentive reading and Pierrick Roperchfor helpful and animated discussions. Dry cutting of the B-slicesand demagnetization of strong B-specimens have been carried out inthe Palaeomagnetic Laboratory of the LIAG (Hannover), ChristianRolf is kindly acknowledged for his support. E.S. has been sup-ported by the Austrian science fund FWF grant P19370-N19. This
C© 2011 The Authors, GJI, 185, 144–156
Geophysical Journal International C© 2011 RAS

Archaeomagnetic results from Moyenvic (France) 155
work was partly financed by the CNRS/INSU Paleo2 programme.We are grateful to Jan Hus and an anonymous reviewer for theirconstructive comments on this paper.
R E F E R E N C E S
Ben-Yosef, E., Tauxe, L., Levy, T.E., Shaar, R., Ron, H. & Najjar, M.,2009. Geomagnetic intensity spike recorded in high resolution slagdeposit in Southern Jordan, Earth planet. Sci. Lett., 287, 529–539,doi:10.1016/j.epsl.2009.09.001.
Bertaux, J.P., 1987. La fabrication du sel a l’epoque protohistorique par latechnique du briquetage, in L’Age du Fer en Lorraine, pp. 85–100, Museede Sarreguemines, Sarreguemines.
Biggin, A.J., 2010. Are systematic differences between thermal and mi-crowave Thellier-types palaeointensity estimates a consequence of mul-tidomain bias in the thermal results?, Phys. Earth planet. Inter., 280,16–40, doi:10.1016/j.pepi.2010.03.005.
Biggin, A.J. & Thomas, D.N., 2003. The application of acceptance cri-teria to results of Thellier palaeointensity experiments performed onsamples with pseudo-single-domain-like chararcteristics, Phys. Earthplanet.Inter., 138, 279–287.
Bronk Ramsey, C., 2005. Improving the resolution of radiocarbon dating bystatistical analysis, in: The Bible and Radiocarbon Dating: Archaeology,Text and Science, pp. 57–64, eds Levy, T.E. & Higham, T.F.G., Equinox,London.
Burakov, K.S., Nachasova, I.E. & Mata, C., 2006. Geomagnetic field inten-sity in the first millenium BC from data on ceramics of the Los Villaresarchaeological monument (Spain), Fizika Zemli, 11, 84–92. [IzvestiyaPhysics of the Solid Earth, 42(11), 942–950].
Carvallo, C., Roberts, A.P., Leonhardt, R., Laj, C., Kissel, C. & Camps, P.,2006. Increasing the efficiency of palaeointensity analyses by selection ofsamples using first-order reversal curve diagrams, J. geophys. Res., 111,B12103, doi:10.1029/2005JB004126.
Chauvin, A., Garcia, Y., Lanos, Ph. & Laubenheimer, F., 2000. Palaeoin-tensity of the geomagnetic field recovered on archaeomagnetic sites fromFrance, Phys. Earth planet.Inter., 120, 111–136.
Chauvin, A., Roperch, P. & Levi, S., 2005. Reliability of geomagneticpalaeointensity data : the effects of the NRM fraction and concave-up be-haviour on palaeointensity determinations by the Thellier method, Phys.Earth planet.Inter., 150, 265–286.
Coe, R.S., Gromme, S. & Mankinen, E.A., 1978. Geomagnetic palaeointen-sities from radiocarbon-dated lava flows on Hawaii and the question ofthe Pacific non-dipole low, J. geophys. Res., 83, 1740–1756.
Coe, R.S., Riisager, J., Plenier, G., Leonhardt, R. & Krasa, D., 2004.Multidomain behaviour during palaeointensity experiments: resultsfrom the 1915 Mt Lassen flow, Phys. Earth planet.Inter., 147, 141–153.
Daire, M.Y., 2003. Le sel des Gaulois, p. 152, Errance, Paris.Day, R., Fuller, M. & Schmidt, V.A., 1977. Hysteresis properties of ti-
tanomagnetites, grain size and compositional dependence, Phys. Earthplanet.Inter., 13(4), 260–267.
De Marco, E., Spataras, V., Gomez-Paccard, M., Chauvin, A. & et Kon-dopoulou, D., 2008. New archaeointensity results from archaeologicalsites and variation of the geomagnetic field intensity for the last 7 mil-lenia in Greece, Phys. Chem. Earth, 33(6–7), 578–595.
Dunlop, D., 2002. Theory and application of the day plot (Mrs/Ms versusHcr/Hc), 2: application to data for rocks, sediments and soils, J. geophys.Res., 107(B3), EPM 5-1–EMP 5-15.
Dunlop, D.J., Zhang, B. & Ozdemir, O., 2005. Linear and nonlinear Thel-lier palaeointensity behaviour of natural minerals, J. geophys. Res., 110,B01103, doi:10.1029/2004JB003095.
Fabian, K., 2001. A theoretical treatment of palaeointensity determinationexperiments on rocks containing pseudo-single or multi domain magneticparticles, Earth planet. Sci. Lett., 168, 45–58.
Fabian, K., 2009. Thermochemical remanence acquisition in single-domainparticle ensembles: a case for possible overestimation of the geo-
magnetic palaeointensity, Geochem. Geophys. Geosyst., 10, Q06Z03,doi:10.1029/2009GC002420.
Fisher, R.A., 1953. Dispersion on a sphere, Proc. R. Soc. Lond., A-127,295–305.
Gallet, Y., Genevey, A. & Le Goff, M., 2002. Three millenia of directionalvariation of the Earth’s magnetic field in western Europe as revealed byarcheological artefacts, Phys. Earth planet.Inter., 131, 81–89.
Gallet, Y., Genevey, A., Le Goff, M., Warme, N., Gran-Aymerich, J. &Lefevre, A., 2009. On the use of archaeology in geomagnetism, andvice-versa: recent developments in archeomagnetism, C.R. Physique, 10,630–648, doi:10.1016/j.crhy.2009.08.005.
Gee, J.S., Yu, Y. & Bowles, J., 2010. Palaeointensity estimates from ign-imbrites: an evaluation of the Bishop Tuff, Geochem. Geophys. Geosyst.,11, Q10007, doi:10.1029/2009GC002888.
Genevey, A. & Gallet, Y., 2002. Intensity of the geomagnetic field in WesternEurope over the past 2000 years: new data from ancient French pottery,J. geophys. Res., 107(B11), 2285, doi:10.1029/2001JB000701.
Genevey, A., Gallet, Y., Rosen, J. & Le Goff, M., 2009. Evidence of rapidgeomagnetic field intensity variation in western Europe over the past800 years from new French archeointensity data, Earth planet. Sci. Lett.,202(1–2), 132–143.
Gomez-Paccard, M. et al. & Archeological working group, 2006. A cata-logue of Spanish archaeomagnetic data, Geophys. J. Int., 166, 1125–1143.
Gomez-Paccard, M., Chauvin, A., Lanos, P. & Thiriot, J., 2008. Newarcheointensity data from Spain and the geomagnetic dipole moment inwestern Europe over the past 2000 years, J. geophys. Res., 113, B09103,doi:10.1029/2008JB005582.
Hajdas, I., 2008. Radiocarbon dating and its applications in Quater-nary studies / Die Radiokohlenstoffmethode und ihre Anwendung inder Quartarforschung, Quaternary Sci. J. (Eiszeitalter und Gegenwart),57(1–2), 2–24.
Hedley, I. & Wagner, G.C., 1991. A magnetic investigation of roman andpre-roman pottery, in Archaeometry ’90, pp. 275–284, eds Pernicka, E.& Wagner, G.C., Birkhauser Verlag, Basel.
Hill, M.J., Lanos, P., Chauvin, A., Vitali, D. & Laubenheimer, F., 2007. Anarcheomagnetic investigation of a roman amphorae workshop in Albinia,Geophys. J. Int., 169(2), 471–472.
Hill, M.J., Lanos, P., Denti, M. & Dufresne, P., 2008. Archeomagnetic in-vestigation of bricks from the VIII century BC Greek-indigenous siteof Incoronata (Metaponto, Italy), Phys. Chem. Earth, 33(6–7), 523–533,doi:10.1016/j.pce.2008.02.026.
Kirschvink, J.L., 1980. The least-squares line and plane and the analysis ofpalaeomagnetic data, Geophys. J. R. astr. Soc., 62, 699–718.
Kovacheva, M., Boyadziev, Y., Kostadinova-Avramova, M., Jordanova, N.& Donadini, F., 2009. Updated archeomagnetic data set of the past 8millennia from the Sofia laboratory, Geochem. Geophys. Geosyst., 10,Q05002, 6PP, doi:10.1029/2008GC002347.
Korte, M, Donadini, F & Constable, C.G., 2009. Geomagnetic field for 0–3ka: 2. A new series of time-varying global models, Geochem. Geophys.Geosyst., 10, Q06008, doi:10.1029/2008GC002297.
Laffitte, J.D., 2002. Le briquetage de la Seille a Moyenvic (Moselle, France)au lieu-dit Les Croleurs, in Archeologie du sel, Techniques et societes dansla Pre et Protohistoire europeenne, pp. 197–207, ed. Weller, O., Actes duXIVe Congres UISPP de Liege, Verlag Marie Leidorf, Rahden/Westfalen.
Lanos P., 2004. Bayesian inference of calibration curves, application toarchaeomagnetism: chapter 3, in Tools for Constructing Chronologies,Crossing Disciplinary Boundaries, Lecture Notes in Statistics, Vol. 177,pp. 43–82, eds, Buck, C.E. & Millard, A.R., Springer-Verlag, London.
Levi, S., 1977. The effect of magnetite particle size on palaeointensitydeterminations of the geomagnetic field, Phys. Earth planet.Inter., 13,245–259.
McFadden, P.L., 1982. Rejection of palaeomagnetic observations, Earthplanet. Sci. Lett., 61, 392–395.
McFadden, P.L. & Lowes, F.J., 1981. The discrimination of mean directionsdrawn from Fisher distributions, Geophys. J., 67, 19–33.
Pavon-Carrasco, F.J., Osete, M.L., Torta, J.M. & Gaya-Pique, L.R., 2009.A regional archeomagnetic model for Europe for the last 3000 years,
C© 2011 The Authors, GJI, 185, 144–156
Geophysical Journal International C© 2011 RAS
156 G. Herve et al.
SCHA.DIF.3k: applications to archeomagnetic dating, Geochem. Geo-phys. Geosyst., 10, Q03013, doi:10.1029/2008GC002244.
Pesonen, L.J., Leino, M.A.H. & Nevanlinna, H., 1995. Archeomagneticintensity in Finland during the last 6400 years: evidence for a latitude-dependant nondipole field at approximate AD 500, J. Geomagn. Geo-electr., 47, 19–40.
Pike, C.R., Roberts, A.P. & Verosub, K.L., 1999. Characterizing interactionsin fine magnetic particle systems using first order reversal curves, J. appl.Phys., 85, 6660–6667.
Prevot, M., Mankinen, E.A., Coe, R.S. & Gromme, C.S., 1985. The SteensMountain (Oregon) geomagnetic polarity transition, 2. Field intensityvariations and discussion of reversal models, J. geophys. Res., 90(B12),10 417–10 448.
Reimer, P.J. et al., 2004. IntCal04 terrestrial radiocarbon age calibration,0–26 cal kyr BP, Radiocarbon, 46(3), 1029–1058.
Roberts, A.P., Pike, C.R. & Verosub, K.L., 2000. FORC diagrams: a new toolfor characterizing the magnetic properties of natural samples, J. geophys.Res., 105(28), 461–475.
Schnepp, E. & Lanos, P., 2005. Archaeomagnetic secular variation in Ger-many during the past 2500 years, Geophys. J. Int., 163, 479–490.
Schnepp, E., Lanos, P. & Chauvin, A., 2009. Geomagnetic palaeoin-tensity between 1300 and 1750 A.D. derived from a bread floor se-
quence in Lubeck, Germany, Geochem. Geophys. Geosyst., 10, Q08003,doi:10.1029/2008GC002470.
Selkin, P.A. & Tauxe, L., 2000. Long-term variations in palaeointensity,Phil. Trans. R. Soc. Lond. A, 358, 1065–1088.
Shaar, R., Ron, H., Tauxe, L., Kessel, R., Agnon, A., Ben-Yosef, E. &Feinberg, J.M., 2010. Testing the accuracy of absolute intensity estimatesof the ancient geomagnetic field using copper slag material, Earth planet.Sci. Lett., 290, 201–213, doi:10.1016/j.epsl.2009.12.022.
Tema, E., Hedley, I. & Lanos, P., 2006. Archaeomagnetism in Italy: a com-pilation of data including new results and a preliminary Italian secularvariation curve, Geophys. J. Int., 167, 1160–1171.
Thellier, E. & Thellier, O., 1944. Recherches geomagnetiques sur descoulees volcaniques d’Auvergne, Ann. Geophys., 1, 37–52.
Thellier, E. & Thellier, O., 1959. Sur l’intensite du champ magnetique ter-restre dans le passe historique et geologique, Ann. Geophys., 15, 285–376.
Xu, S. & Dunlop, D.J., 2004. Thellier palaeointensity theory and ex-periments for multidomain grains, J. geophys. Res., 109, B07103,doi:10.1029/2004JB003024.
Zananiri, I., Batt, C.M., Lanos, P., Tarling, D.H. & Linford, P., 2007. Ar-chaeomagnetic secular variation in the UK during the past 4000 years andits application to archaeomagnetic dating, Phys. Earth planet.Inter., 160,97–107.
C© 2011 The Authors, GJI, 185, 144–156
Geophysical Journal International C© 2011 RAS