Aquatic Assessment of the Pike Hill Copper Mine Superfund ...
124
Prepared in cooperation with the U.S. Environmental Protection Agency Aquatic Assessment of the Pike Hill Copper Mine Superfund Site, Corinth, Vermont Scientific Investigations Report 2012–5288 U.S. Department of the Interior U.S. Geological Survey
-
Upload
khangminh22 -
Category
Documents
-
view
1 -
download
0
Transcript of Aquatic Assessment of the Pike Hill Copper Mine Superfund ...
Prepared in cooperation with the U.S. Environmental Protection Agency
Aquatic Assessment of the Pike Hill Copper Mine Superfund Site, Corinth, Vermont
Scientific Investigations Report 2012–5288
U.S. Department of the InteriorU.S. Geological Survey

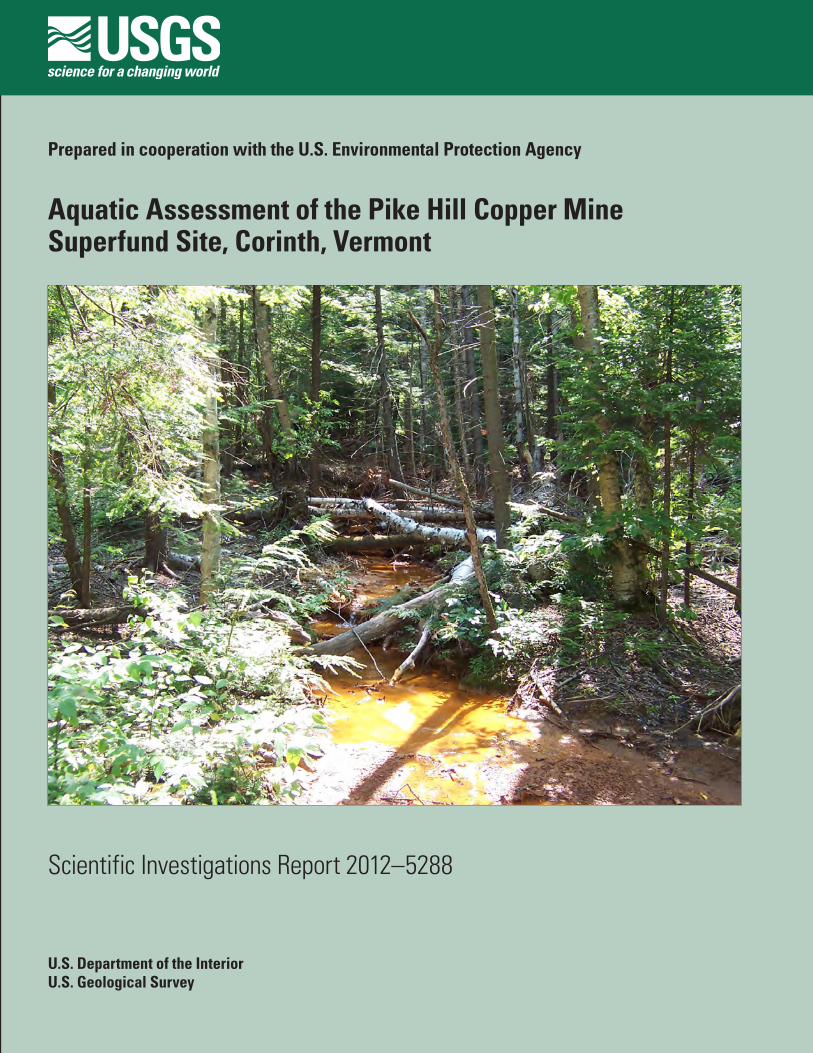
Cover. Headwaters of Pike Hill Brook drain the Union and Eureka mines. Photograph by Robert R. Seal II, U.S. Geological Survey.
Aquatic Assessment of the Pike Hill Copper Mine Superfund Site, Corinth, Vermont
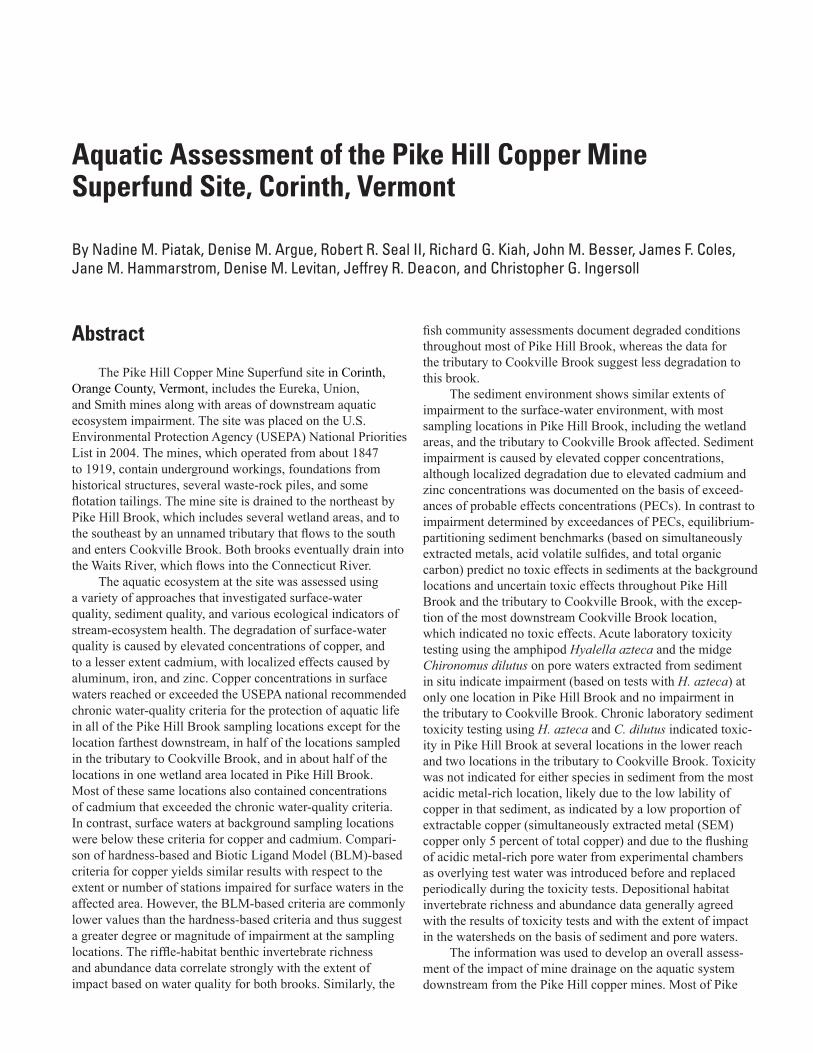
By Nadine M. Piatak, Denise M. Argue, Robert R. Seal II, Richard G. Kiah, John M. Besser, James F. Coles, Jane M. Hammarstrom, Denise M. Levitan, Jeffrey R. Deacon, and Christopher G. Ingersoll
Prepared in cooperation with the U.S. Environmental Protection Agency
Scientific Investigations Report 2012–5288
U.S. Department of the InteriorU.S. Geological Survey
U.S. Department of the InteriorKEN SALAZAR, Secretary
U.S. Geological SurveyMarcia K. McNutt, Director
U.S. Geological Survey, Reston, Virginia: 2013
For more information on the USGS—the Federal source for science about the Earth, its natural and living resources, natural hazards, and the environment, visit http://www.usgs.gov or call 1–888–ASK–USGS.
For an overview of USGS information products, including maps, imagery, and publications, visit http://www.usgs.gov/pubprod
To order this and other USGS information products, visit http://store.usgs.gov
Any use of trade, firm, or product names is for descriptive purposes only and does not imply endorsement by the U.S. Government.
Although this information product, for the most part, is in the public domain, it also may contain copyrighted materials as noted in the text. Permission to reproduce copyrighted items must be secured from the copyright owner.
Suggested citation:Piatak, N.M., Argue, D.M., Seal, R.R., II, Kiah, R.G., Besser, J.M., Coles, J.F., Hammarstrom, J.M., Levitan, D.M., Deacon, J.R., and Ingersoll, C.G., 2013, Aquatic assessment of the Pike Hill Copper Mine Superfund site, Corinth, Vermont: U.S. Geological Survey Scientific Investigations Report 2012–5288, 109 p. plus 14 apps. [separate files], http://pubs.usgs.gov/sir/2012/5288/.
iii
ContentsAbstract ...........................................................................................................................................................1Introduction.....................................................................................................................................................2
Purpose and Scope ..............................................................................................................................2Report Organization ..............................................................................................................................2Previous Studies ...................................................................................................................................5
Description of Study Area ............................................................................................................................5Study Approach and Methodology ...........................................................................................................11
Selection of Sample Locations .........................................................................................................11Hydrologic Data...................................................................................................................................12Surface-Water Data ...........................................................................................................................12Pore-Water Data .................................................................................................................................12Sediment Data .....................................................................................................................................13Wetland Data (Sediment Cores, Surface and Pore Waters, Plants) ..........................................13Macroinvertebrate Data ....................................................................................................................14Fish Assemblage Data........................................................................................................................15Fish Tissue Data ..................................................................................................................................15Toxicity Tests........................................................................................................................................16Quality-Control Procedures ..............................................................................................................16Data Analysis and Statistical Methods ...........................................................................................17
Nature and Extent of Contamination ........................................................................................................19Background Conditions .....................................................................................................................31
Surface-Water Geochemistry ..................................................................................................31Field Parameters and Major Inorganic Constituents ..................................................31Iron, Aluminum, and Manganese ...................................................................................31Minor and Trace Elements ..............................................................................................31Dissolved Organic Carbon and Nutrients .....................................................................36Comparisons with Ambient Water-Quality Criteria .....................................................36
Pore-Water Geochemistry .......................................................................................................36Field Parameters and Major Inorganic Constituents ..................................................36Iron, Aluminum, and Manganese ...................................................................................36Minor and Trace Elements ..............................................................................................38Dissolved Organic Carbon and Nutrients .....................................................................38Comparisons with Ambient Water-Quality Criteria .....................................................38
Sediment Geochemistry ...........................................................................................................38Toxicity Tests with Sediment and Pore Water ......................................................................44Ecological Indicators ................................................................................................................44
Upper Pike Hill Brook .........................................................................................................................51Surface-Water Geochemistry ..................................................................................................51
Field Parameters and Major Inorganic Constituents ..................................................51Iron, Aluminum, and Manganese ...................................................................................51Minor and Trace Elements ..............................................................................................51Dissolved Organic Carbon and Nutrients .....................................................................53Trace Element Loads and Yields .....................................................................................53Comparisons with Ambient Water-Quality Criteria .....................................................53
iv
Pore-Water Geochemistry .......................................................................................................58Field Parameters and Major Inorganic Constituents ..................................................58Iron, Aluminum, and Manganese ...................................................................................58Minor and Trace Elements ..............................................................................................59Dissolved Organic Carbon and Nutrients .....................................................................59Comparisons with Ambient Water-Quality Criteria .....................................................59
Sediment Geochemistry ...........................................................................................................59Toxicity Tests with Sediment and Pore Water ......................................................................60Ecological Indicators ................................................................................................................61Relations Among Trace Elements in Surface Water, Pore Water, Sediment,
and Aquatic Biota .........................................................................................................61Lower Reach of Pike Hill Brook ........................................................................................................61
Surface-Water Geochemistry ..................................................................................................61Field Parameters and Major Inorganic Constituents ..................................................61Iron, Aluminum, and Manganese ...................................................................................63Minor and Trace Elements ..............................................................................................63Dissolved Organic Carbon and Nutrients .....................................................................63Trace Element Loads and Yields .....................................................................................63Comparisons with Ambient Water-Quality Criteria .....................................................63
Pore-Water Geochemistry .......................................................................................................64Field Parameters and Major Inorganic Constituents ..................................................64Iron, Aluminum, and Manganese ...................................................................................64Minor and Trace Elements ..............................................................................................65Dissolved Organic Carbon and Nutrients .....................................................................65Comparisons with Ambient Water-Quality Criteria .....................................................65
Sediment Geochemistry ...........................................................................................................65Toxicity Tests with Sediment and Pore Water ......................................................................66Ecological Indicators ................................................................................................................67Relations Among Trace Elements in Surface Water, Pore Water, Sediment,
and Aquatic Biota .........................................................................................................68Wetlands ..............................................................................................................................................69
Surface- and Pore-Water Geochemistry ...............................................................................69Field Parameters and Major Inorganic Constituents ..................................................69Iron, Aluminum, and Manganese ...................................................................................69Minor and Trace Elements ..............................................................................................70Dissolved Organic Carbon and Nutrients .....................................................................73Trace Element Loads ........................................................................................................73Comparisons with Ambient Water-Quality Criteria .....................................................74
Sediment Geochemistry ...........................................................................................................74Wetland Sediments Collected in July 2007 ...................................................................74Wetland Cores Collected in August 2007 ......................................................................80
Plant Geochemistry ...................................................................................................................83Relations Among Trace Elements in Surface Water, Pore Water, Sediment,
and Plants ......................................................................................................................83Tributary to Cookville Brook ..............................................................................................................84
Surface-Water Geochemistry ..................................................................................................84Field Parameters and Major Inorganic Constituents ..................................................84Iron, Aluminum, and Manganese ...................................................................................84
v
Minor and Trace Elements ..............................................................................................85Dissolved Organic Carbon and Nutrients .....................................................................85Trace Element Loads and Yields .....................................................................................85Comparisons with Ambient Water-Quality Criteria .....................................................85
Pore-Water Geochemistry .......................................................................................................85Field Parameters and Major Inorganic Constituents ..................................................85Iron, Aluminum, and Manganese ...................................................................................86Minor and Trace Elements ..............................................................................................86Dissolved Organic Carbon and Nutrients .....................................................................86Comparisons with Ambient Water-Quality Criteria .....................................................86
Sediment Geochemistry ...........................................................................................................87Toxicity Tests with Sediment and Pore Water ......................................................................88Ecological Indicators ................................................................................................................88Relations Among Trace Elements in Surface Water, Pore Water, Sediment,
and Aquatic Biota .........................................................................................................89Discussion .....................................................................................................................................................89
Surface-Water Quality .......................................................................................................................90Water Chemistry ........................................................................................................................90Trace Element Loads and Yields ..............................................................................................91Evaluation of Water Quality ......................................................................................................91
Toxicity Hazards in Stream Sediment and Pore Water ................................................................95Toxicity Hazards in Wetland Sediment and Pore Water ..............................................................97Toxicity Tests with Sediment and Pore Water ...............................................................................99Ecological Indicators..........................................................................................................................99Comparison of Aquatic Ecosystem Health Indicators ................................................................100
Conclusions.................................................................................................................................................103Acknowledgments .....................................................................................................................................105Selected References .................................................................................................................................105
Appendixes (separate files)Appendix 1. Qualitative geomorphologic characterization of stream segments at the
Pike Hill Copper Mine Superfund site, Corinth, Vermont.Appendix 2. Quality-assurance, quality-control water samples for the Pike Hill copper mine
study area, Corinth, Vermont.Appendix 3. Quality-assurance, quality-control sediment samples from the Pike Hill
copper mine study area, Corinth, Vermont.Appendix 4. Acid volatile sulfide, simultaneously extracted metals, and particle size
results for sediments and quality-assurance, quality-control samples for the Pike Hill copper mine study area, Corinth, Vermont.
Appendix 5. Constituents in surface and pore waters collected from stream and wetland areas in the Pike Hill copper mine study area, Corinth, Vermont.
Appendix 6. Chemistry and mineralogy results for stream sediments collected in October 2007 from the Pike Hill copper mine study area, Corinth, Vermont.
Appendix 7. Bar chart of relative weight percentages of minerals in stream sediments collected in the Pike Hill copper mine study area, Corinth, Vermont, in October 2007.
Appendix 8. Fish community assessment conducted in September 2007 in the Pike Hill copper mine study area, Corinth, Vermont.
Appendix 9. Fish tissue chemistry results in wet weight for fish collected in September 2007 in the Pike Hill copper mine study area, Corinth, Vermont.

vi
Appendix 10. Sample identification, depth, depth category, concentrations of Cu, Pb, Zn, and Fe, source of data, and geographic coordinates of samples analyzed in the field with x-ray fluorescence spectrometry at Pike Hill copper mine study area, Corinth, Vermont.
Appendix 11. Chemistry results for wetland sediment samples collected in July 2007 from the Pike Hill copper mine study area, Corinth, Vermont.
Appendix 12. Chemistry of wetland core sediments collected in August 2007 from the Pike Hill copper mine study area, Corinth, Vermont.
Appendix 13. Bar chart of relative weight percentages of minerals in cores collected from wetlands in the Pike Hill Brook watershed in August 2007.
Appendix 14. Identification and chemistry results for plant material collected in October 2007 from wetland areas at the Pike Hill copper mine study area, Corinth, Vermont.
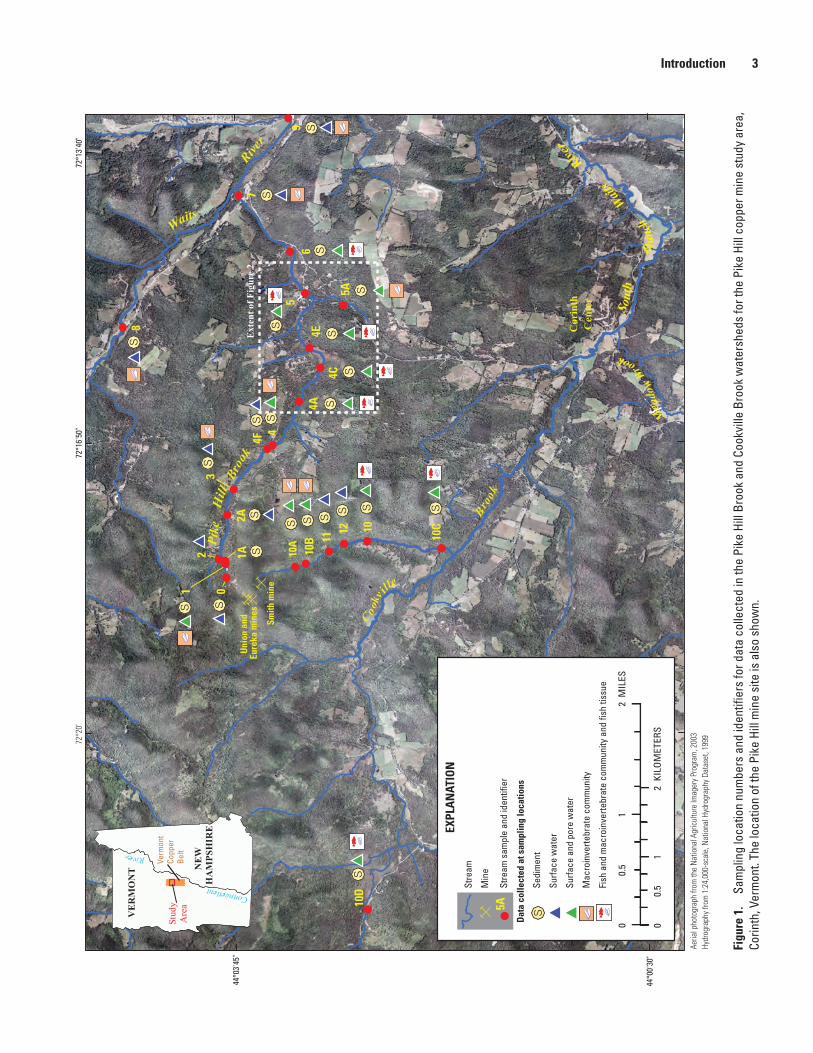
Figures 1. Map showing sampling location numbers and identifiers for data collected in the
Pike Hill Brook and Cookville Brook watersheds for the Pike Hill copper mine study area, Corinth, Vermont .................................................................................................................3
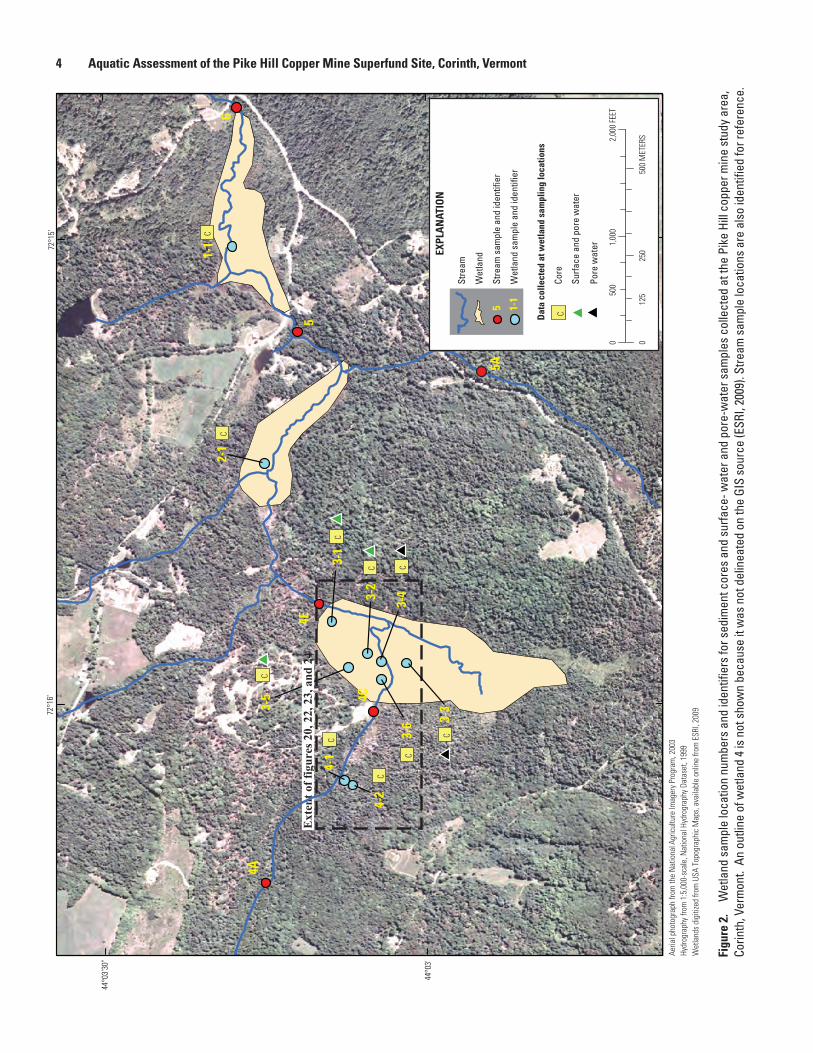
2. Map showing wetland sample location numbers and identifiers for sediment cores and surface-water and pore-water samples collected at the Pike Hill copper mine study area, Corinth, Vermont ......................................................................................................4
3–5. Boxplots showing— 3. Comparison of selected constituent concentrations relative to ambient water-quality
criteria in surface-water samples collected in the upper reach of Pike Hill Brook, at the Pike Hill copper mine study area, Corinth, Vermont ..................................................21
4. Comparison of selected constituent concentrations relative to ambient water-quality criteria in surface-water samples collected in the lower reach of Pike Hill Brook, at the Pike Hill copper mine study area, Corinth, Vermont ..................................................23
5. Comparison of selected constituent concentrations relative to ambient water-quality criteria in surface-water samples collected in the tributary to Cookville Brook, at the Pike Hill copper mine study area, Corinth, Vermont .............................................................25
6–11. Graphs of downstream variation in the Pike Hill copper mine study area, Corinth, Vermont, showing—
6. pH and specific conductance in surface and in situ pore ...................................................32 7. Hardness, alkalinity, and sulfate in surface and in situ pore water ...................................33 8. Iron, aluminum, and manganese in surface and in situ pore water ...................................34 9. Cadmium, copper, and zinc in surface and in situ pore water ............................................35 10. Aluminum, iron, and sulfur in stream sediments collected in the Pike Hill Brook
watershed and the Cookville Brook watershed ....................................................................41 11. Copper, cadmium, and zinc in stream sediments collected in the Pike Hill Brook
watershed and the Cookville Brook watershed ....................................................................42 12–19. Graphs showing— 12. The abundance and richness values of invertebrate communities in upper Pike Hill
Brook compared to the upstream site in the tributary to Cookville Brook ........................46 13. The abundance and richness values of invertebrate communities in lower Pike Hill
Brook compared to reference conditions ..............................................................................47 14. The abundance and richness values of invertebrate communities in the tributary
to Cookville Brook .......................................................................................................................48 15. The concentration of copper, cadmium, and zinc in fish tissue of blacknose dace
and brook trout collected in the Pike Hill Brook and Cookville Brook watersheds .........52
vii
16. Comparison of instantaneous loads of aluminum, cadmium, cobalt, copper, iron, manganese, and zinc at the Pike Hill copper mine study area, Corinth, Vermont ...........54
17. Comparison of yields of aluminum, cadmium, cobalt, copper, iron, manganese, and zinc at the Pike Hill copper mine study area, Corinth, Vermont ..................................56
18. The relations of invertebrate communities to hazard indices for surface water and pore water: abundance and richness values of the epifaunal community (riffle-targeted habitat) as related to the hazard index for surface water; abundance and richness values of the infaunal community (depositional targeted habitat) as related to the hazard index for pore water .........................................................62
19. Comparison of copper and iron concentrations from surface- and pore-water samples that coincide with sediment cores at wetland sample locations at the Pike Hill copper mine study area, Corinth, Vermont .............................................................72
20. Map showing interpolated concentrations of copper based on x-ray fluorescence in near-surface sediments in a wetland along Pike Hill Brook, at the Pike Hill copper mine study area, Corinth, Vermont...........................................................................................73
21. Graph comparing copper, iron, lead, and zinc concentrations based on x-ray fluorescence in wetland samples collected in July 2007 relative to the consensus-based probable effects concentration for freshwater sediments from the Pike Hill copper mine study area, Corinth, Vermont .............................................................................76
22–24. Maps showing— 22. Interpolated concentrations of copper based on x-ray fluorescence in sediments
collected at depth in a wetland along Pike Hill Brook, at the Pike Hill copper mine study area, Corinth, Vermont ....................................................................................................77
23. Interpolated percentage of iron in near-surface sediments based on x-ray fluores-cence in a wetland along Pike Hill Brook, at the Pike Hill Copper Mine study area, Corinth, Vermont .........................................................................................................................78
24. Interpolated percentage of iron in sediments collected at depth based on x-ray fluorescence in a wetland along Pike Hill Brook, at the Pike Hill copper mine study area, Corinth, Vermont ...............................................................................................................79
25–26. Graphs showing— 25. Concentrations of iron and sulfur in cores collected from wetlands in the Pike Hill
Brook watershed ........................................................................................................................81 26. Concentrations of copper and zinc in cores collected from wetlands in the Pike Hill
Brook watershed ........................................................................................................................82 27. Boxplot showing the comparison of historic instantaneous loads from surface-
water samples to recent instantaneous loads for aluminum, cadmium, copper, iron, and zinc at the Pike Hill copper mine study area, Corinth, Vermont ..................................92
28–33. Graphs showing— 28. Downstream variations in iron, aluminum, cadmium, copper, and zinc hazard
quotients and the hazard index in surface waters at the Pike Hill copper mine study area, Corinth, Vermont ....................................................................................................94
29. Downstream variations in hardness-based and Biotic Ligand Model-based hazard quotients for copper in surface waters collected in October 2007 at the Pike Hill copper mine study area, Corinth, Vermont .............................................................................95
30. Copper and iron concentrations in stream sediments in the Pike Hill copper mine study area, Corinth, Vermont ....................................................................................................96
31. Three indices of potential hazard from metals in stream sediments collected in October 2007 from the Pike Hill copper mine study area, Corinth, Vermont .....................98
32. Chronic copper water-quality criteria for surface water based on hardness and the Biotic Ligand Model with the number of riffle-targeted habitat taxa richness .......102
33. Comparison of two sediment-quality hazard indices with two measures of sediment toxicity ..................................................................................................................104
viii
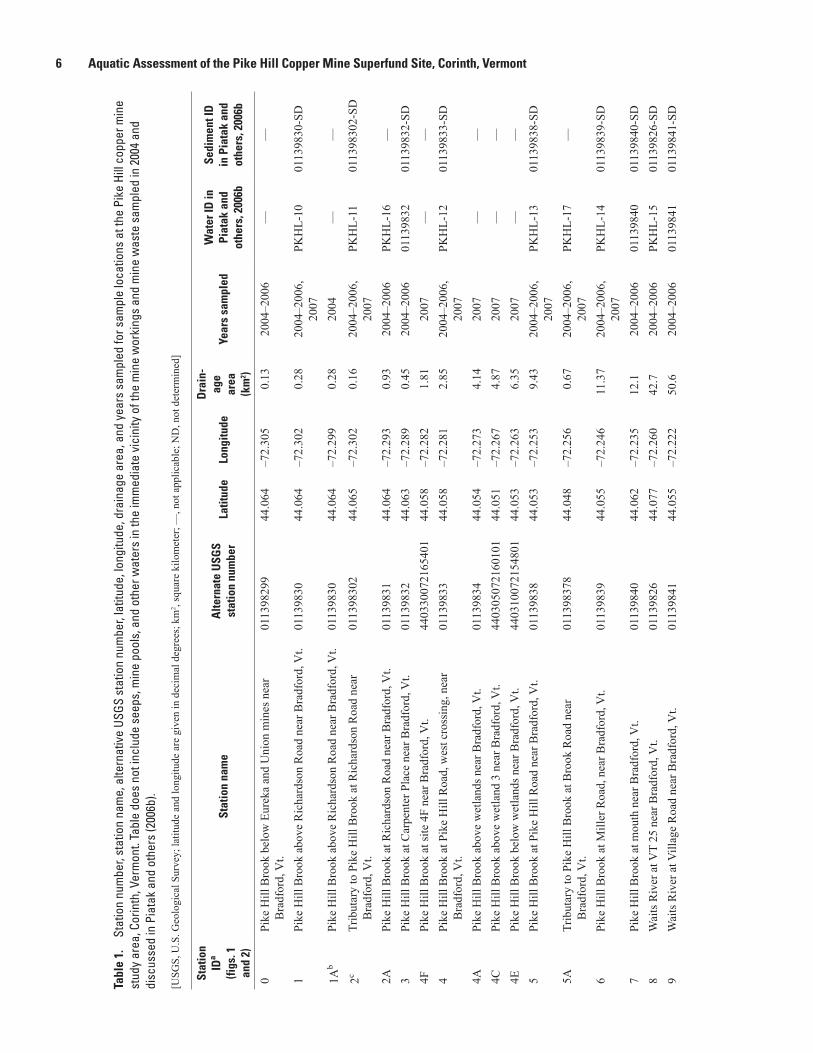
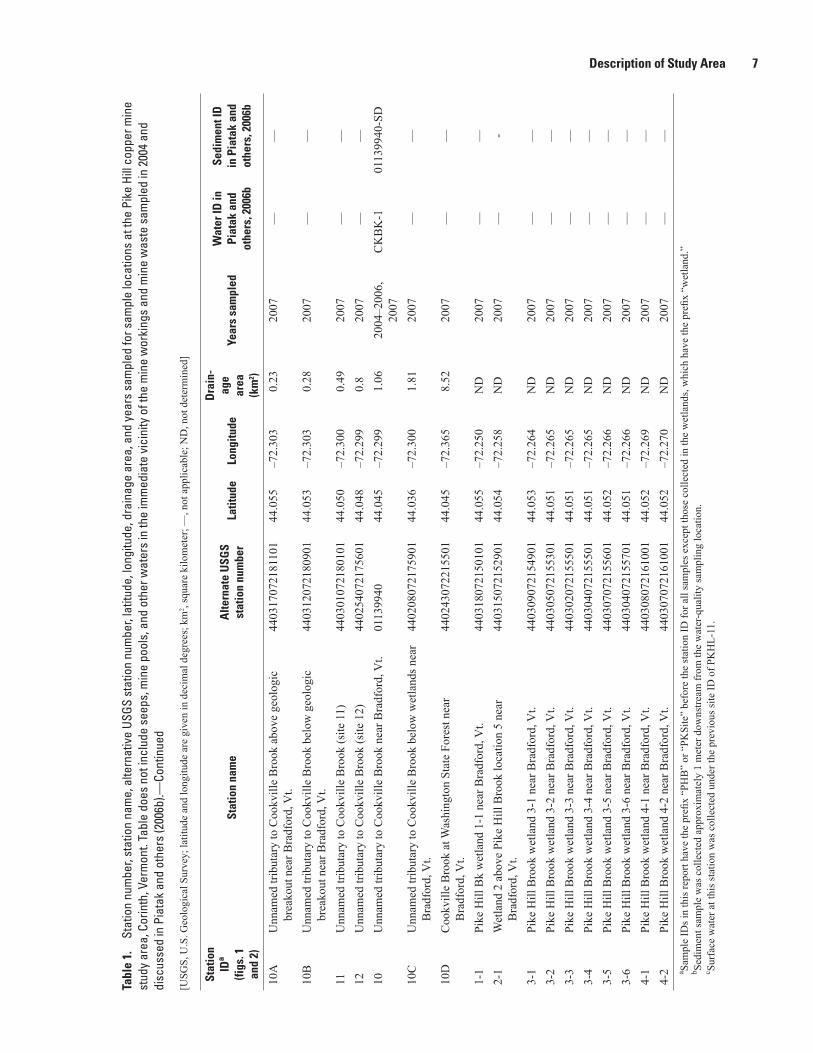
Tables 1. Station number, station name, alternative USGS station number, latitude, longitude,
drainage area, and years sampled for sample locations at the Pike Hill copper mine study area, Corinth, Vermont ......................................................................................................6
2. Selected watershed characteristics of sampled streams at the Pike Hill copper mine study area, Corinth, Vermont.............................................................................................8
3. Selected geomorphic stream reach characteristics at the Pike Hill copper mine study area, Corinth, Vermont ......................................................................................................8
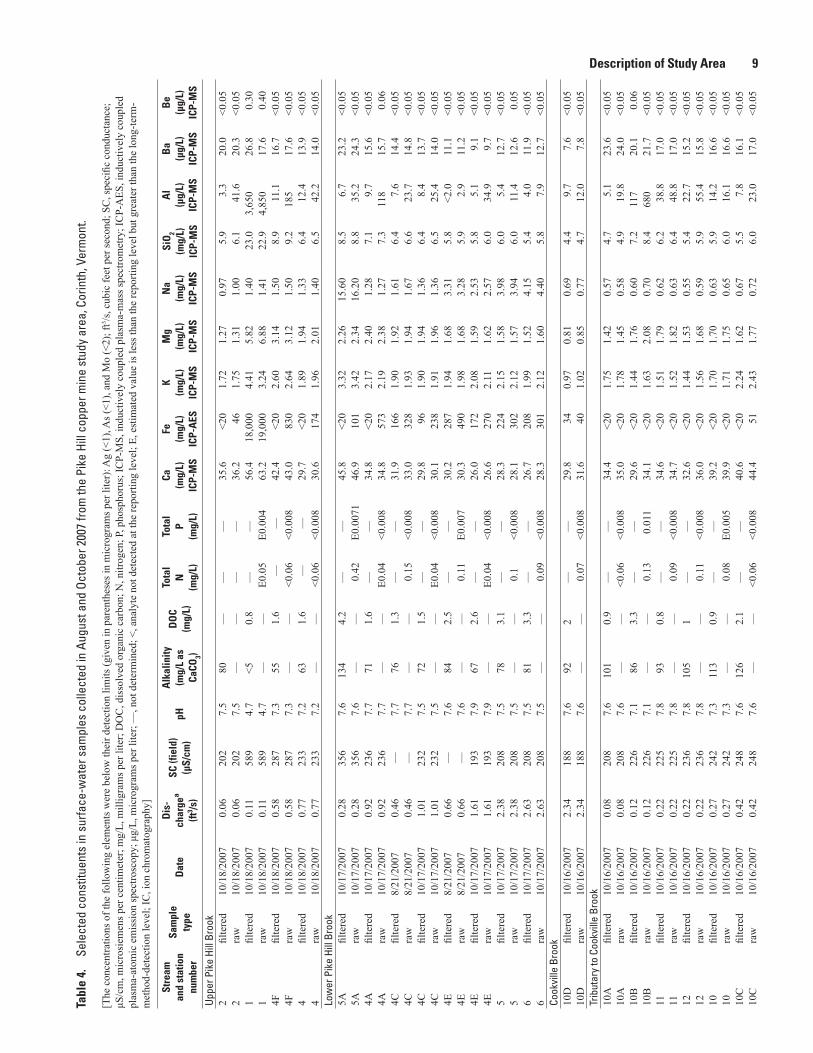
4. Selected constituents in surface-water samples collected in August and October 2007 from the Pike Hill copper mine study area, Corinth, Vermont .......................9
5. Summary of Ambient Water-Quality Criteria or water and probable effects concentrations for sediment used to evaluate element concentrations in samples collected from the Pike Hill copper mine study area, Corinth, Vermont ...........................20
6. Constituents in pore waters collected in October 2007 from the Pike Hill copper mine study area, Corinth, Vermont...........................................................................................27
7. Correlation coefficients that indicate the relations of depositional targeted habitat and riffle-targeted habitat abundance and richness values to hazard indices for pore water in sediments, collected by four different methods, surface waters, and stream sediment from the Pike Hill copper mine study area, Corinth, Vermont ............................31
8. Summary of the hazard quotients and hazard indices for select constituents in waters and stream sediments in the Pike Hill copper mine study area, Corinth, Vermont, October 2007 ................................................................................................37
9. Select chemistry results for stream sediments collected in October 2007 from the Pike Hill copper mine study area, Corinth, Vermont .............................................39
10. Acid volatile sulfide and simultaneously extracted metals results for sediments from the Pike Hill copper mine study area, Corinth, Vermont .............................................43
11. Results of toxicity tests with the amphipod Hyalella azteca and with the midge Chironomus dilutus exposed to sediment and in situ pore waters in 2007 from the Pike Hill copper mine study area, Corinth, Vermont .............................................................45
12. Ecological indicator data associated with invertebrate communities where riffle- targeted habitat and depositional targeted habitat samples were collected in the Pike Hill copper mine study area, Corinth, Vermont .............................................................49
13. Biological assessments of sampling locations in the Pike Hill Copper Mine study area provided by the State of Vermont Department of Environmental Conservation, which are based on the riffle-targeted habitat data collected by the USGS ...................50
14. Concentrations of copper, cadmium, and zinc in fish tissue of blacknose dace and brook trout collected in the Pike Hill copper mine study area, Corinth, Vermont ....53
15. Concentrations of selected elements from surface-water and pore-water samples in wetlands collected at the Pike Hill copper mine study area, Corinth, Vermont ..........70
16. Summary of the hazard quotients and hazard indices for select constituents in waters and sediments from wetlands in the Pike Hill copper mine study area, Corinth, Vermont, August 2007 ..................................................................................................75
17. Summary of geochemical and biological indicators of stream health in the Pike Hill copper mine study area, Corinth, Vermont ...........................................................................101

ix
Conversion FactorsSI to Inch/Pound
Multiply By To obtain
Length
centimeter (cm) 0.3937 inch (in.)millimeter (mm) 0.03937 inch (in.)meter (m) 3.281 foot (ft) kilometer (km) 0.6214 mile (mi)kilometer (km) 0.5400 mile, nautical (nmi) meter (m) 1.094 yard (yd)
Area
square meter (m2) 0.0002471 acre hectare (ha) 2.471 acresquare kilometer (km2) 247.1 acresquare centimeter (cm2) 0.001076 square foot (ft2)square meter (m2) 10.76 square foot (ft2) square centimeter (cm2) 0.1550 square inch (ft2) hectare (ha) 0.003861 square mile (mi2) square kilometer (km2) 0.3861 square mile (mi2)
Volume
liter (L) 33.82 ounce, fluid (fl. oz)liter (L) 2.113 pint (pt)liter (L) 1.057 quart (qt)liter (L) 0.2642 gallon (gal)cubic meter (m3) 264.2 gallon (gal) cubic decimeter (dm3) 0.03531 cubic foot (ft3)
Mass
gram (g) 0.03527 ounce, avoirdupois (oz)kilogram (kg) 2.205 pound avoirdupois (lb)
Temperature in degrees Celsius (°C) may be converted to degrees Fahrenheit (°F) as follows:
°F = (1.8 × °C) + 32
Temperature in degrees Fahrenheit (°F) may be converted to degrees Celsius (°C) as follows:
°C = (°F – 32) / 1.8
Vertical coordinate information is referenced to the North American Vertical Datum of 1927 (NAVD 27).
Horizontal coordinate information is referenced to the North American Datum of 1927 (NAD 27).
Altitude, as used in this report, refers to distance above the vertical datum.
Specific conductance is given in microsiemens per centimeter at 25 degrees Celsius (µS/cm at 25 °C).
Concentrations of chemical constituents in water are given either in milligrams per liter (mg/L) or micrograms per liter (µg/L).

x
Abbreviations
ANOVA analysis of varianceASTM American Society for Testing and MaterialsAVS acid volatile sulfideBKT brook troutBND blacknose daceBLM Biotic Ligand ModelCBR critical body residueCERC Columbia Environmental Research Center (USGS)CERCLA Comprehensive Environmental Response, Compensation, and Liability ActCETIS Comprehensive Environmental Toxicity Information SystemCMERSC Central Mineral and Environmental Resources Science Center CVAF cold vapor atomic fluorescenceDGPS differential global positioning systemDOC dissolved organic carbonDTH depositional targeted habitatEMERSC Eastern Mineral and Environmental Resources Science Center ESB equilibrium-partitioning sediment benchmarkHG-AAS hydride generation atomic absorption spectrometryIBI Index of Biotic IntegrityIC Ion chromatographyICP-AES Inductively coupled plasma-atomic emission spectroscopyICP-MS Inductively coupled plasma-mass spectrometryNRWQC National Recommended Water-Quality CriteriaOEME Office of Environmental Measurement and Evaluation (USEPA)PAL Public Archaeological LaboratoryPEC probable effects concentrationPVC polyvinyl chlorideRTH riffle-targeted habitatSEM simultaneously extracted metalsSEM-AVS simultaneously extracted metals-acid volatile sulfideTOC total organic carbonUSEPA U.S. Environmental Protection AgencyUSFWS U.S. Fish and Wildlife ServiceUSGS U.S. Geological SurveyVTDEC Vermont Department of Environmental ConservationWQC Water-Quality CriteriaWAAS Wide Area Augmentation SystemXRD X-ray diffractionXRF X-ray fluorescence spectrometry
Aquatic Assessment of the Pike Hill Copper Mine Superfund Site, Corinth, Vermont
By Nadine M. Piatak, Denise M. Argue, Robert R. Seal II, Richard G. Kiah, John M. Besser, James F. Coles, Jane M. Hammarstrom, Denise M. Levitan, Jeffrey R. Deacon, and Christopher G. Ingersoll
Abstract
The Pike Hill Copper Mine Superfund site in Corinth, Orange County, Vermont, includes the Eureka, Union, and Smith mines along with areas of downstream aquatic ecosystem impairment. The site was placed on the U.S. Environmental Protection Agency (USEPA) National Priorities List in 2004. The mines, which operated from about 1847 to 1919, contain underground workings, foundations from historical structures, several waste-rock piles, and some flotation tailings. The mine site is drained to the northeast by Pike Hill Brook, which includes several wetland areas, and to the southeast by an unnamed tributary that flows to the south and enters Cookville Brook. Both brooks eventually drain into the Waits River, which flows into the Connecticut River.
The aquatic ecosystem at the site was assessed using a variety of approaches that investigated surface-water quality, sediment quality, and various ecological indicators of stream-ecosystem health. The degradation of surface-water quality is caused by elevated concentrations of copper, and to a lesser extent cadmium, with localized effects caused by aluminum, iron, and zinc. Copper concentrations in surface waters reached or exceeded the USEPA national recommended chronic water-quality criteria for the protection of aquatic life in all of the Pike Hill Brook sampling locations except for the location farthest downstream, in half of the locations sampled in the tributary to Cookville Brook, and in about half of the locations in one wetland area located in Pike Hill Brook. Most of these same locations also contained concentrations of cadmium that exceeded the chronic water-quality criteria. In contrast, surface waters at background sampling locations were below these criteria for copper and cadmium. Compari-son of hardness-based and Biotic Ligand Model (BLM)-based criteria for copper yields similar results with respect to the extent or number of stations impaired for surface waters in the affected area. However, the BLM-based criteria are commonly lower values than the hardness-based criteria and thus suggest a greater degree or magnitude of impairment at the sampling locations. The riffle-habitat benthic invertebrate richness and abundance data correlate strongly with the extent of impact based on water quality for both brooks. Similarly, the
fish community assessments document degraded conditions throughout most of Pike Hill Brook, whereas the data for the tributary to Cookville Brook suggest less degradation to this brook.
The sediment environment shows similar extents of impairment to the surface-water environment, with most sampling locations in Pike Hill Brook, including the wetland areas, and the tributary to Cookville Brook affected. Sediment impairment is caused by elevated copper concentrations, although localized degradation due to elevated cadmium and zinc concentrations was documented on the basis of exceed-ances of probable effects concentrations (PECs). In contrast to impairment determined by exceedances of PECs, equilibrium-partitioning sediment benchmarks (based on simultaneously extracted metals, acid volatile sulfides, and total organic carbon) predict no toxic effects in sediments at the background locations and uncertain toxic effects throughout Pike Hill Brook and the tributary to Cookville Brook, with the excep-tion of the most downstream Cookville Brook location, which indicated no toxic effects. Acute laboratory toxicity testing using the amphipod Hyalella azteca and the midge Chironomus dilutus on pore waters extracted from sediment in situ indicate impairment (based on tests with H. azteca) at only one location in Pike Hill Brook and no impairment in the tributary to Cookville Brook. Chronic laboratory sediment toxicity testing using H. azteca and C. dilutus indicated toxic-ity in Pike Hill Brook at several locations in the lower reach and two locations in the tributary to Cookville Brook. Toxicity was not indicated for either species in sediment from the most acidic metal-rich location, likely due to the low lability of copper in that sediment, as indicated by a low proportion of extractable copper (simultaneously extracted metal (SEM) copper only 5 percent of total copper) and due to the flushing of acidic metal-rich pore water from experimental chambers as overlying test water was introduced before and replaced periodically during the toxicity tests. Depositional habitat invertebrate richness and abundance data generally agreed with the results of toxicity tests and with the extent of impact in the watersheds on the basis of sediment and pore waters.
The information was used to develop an overall assess-ment of the impact of mine drainage on the aquatic system downstream from the Pike Hill copper mines. Most of Pike
2 Aquatic Assessment of the Pike Hill Copper Mine Superfund Site, Corinth, Vermont
Hill Brook, including several wetland areas that are all downstream from the Eureka and Union mines, was found to be impaired on the basis of water-quality data and biological assessments of fish or benthic invertebrate communities. In contrast, only one location in the tributary to Cookville Brook, downstream from the Smith mine, is definitively impaired. The biological community begins to recover at the most downstream locations in both brooks due to natural attenuation from mixing with unimpaired streams. On the basis of water quality and biological assessment, the reference locations were of good quality. The sediment toxicity, chemistry, and aquatic community survey data suggest that the sediments could be a source of toxicity in Pike Hill Brook and the tributary to Cookville Brook. On the basis of water quality, sediment qual-ity, and biologic communities, the impacts of mine drainage on the aquatic ecosystem health of the watersheds in the study area are generally consistent with the toxicity suggested from laboratory toxicity testing on pore water and sediments.
Introduction
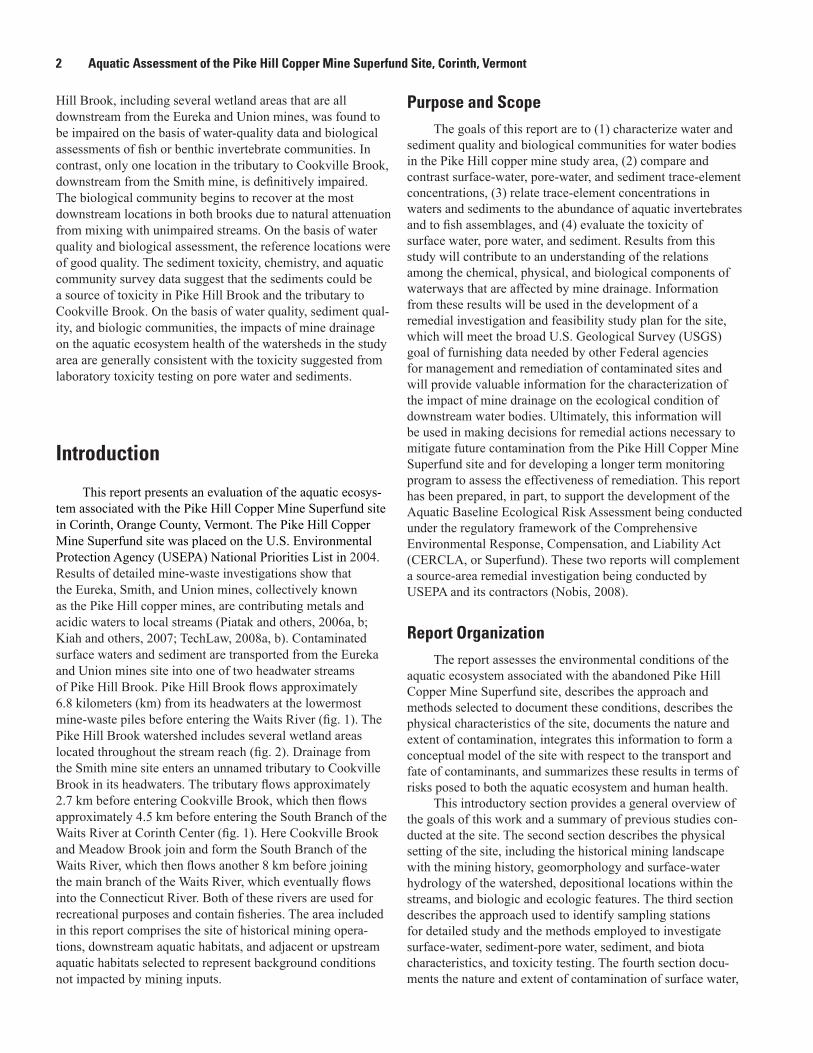
This report presents an evaluation of the aquatic ecosys-tem associated with the Pike Hill Copper Mine Superfund site in Corinth, Orange County, Vermont. The Pike Hill Copper Mine Superfund site was placed on the U.S. Environmental Protection Agency (USEPA) National Priorities List in 2004. Results of detailed mine-waste investigations show that the Eureka, Smith, and Union mines, collectively known as the Pike Hill copper mines, are contributing metals and acidic waters to local streams (Piatak and others, 2006a, b; Kiah and others, 2007; TechLaw, 2008a, b). Contaminated surface waters and sediment are transported from the Eureka and Union mines site into one of two headwater streams of Pike Hill Brook. Pike Hill Brook flows approximately 6.8 kilometers (km) from its headwaters at the lowermost mine-waste piles before entering the Waits River (fig. 1). The Pike Hill Brook watershed includes several wetland areas located throughout the stream reach (fig. 2). Drainage from the Smith mine site enters an unnamed tributary to Cookville Brook in its headwaters. The tributary flows approximately 2.7 km before entering Cookville Brook, which then flows approximately 4.5 km before entering the South Branch of the Waits River at Corinth Center (fig. 1). Here Cookville Brook and Meadow Brook join and form the South Branch of the Waits River, which then flows another 8 km before joining the main branch of the Waits River, which eventually flows into the Connecticut River. Both of these rivers are used for recreational purposes and contain fisheries. The area included in this report comprises the site of historical mining opera-tions, downstream aquatic habitats, and adjacent or upstream aquatic habitats selected to represent background conditions not impacted by mining inputs.
Purpose and ScopeThe goals of this report are to (1) characterize water and
sediment quality and biological communities for water bodies in the Pike Hill copper mine study area, (2) compare and contrast surface-water, pore-water, and sediment trace-element concentrations, (3) relate trace-element concentrations in waters and sediments to the abundance of aquatic invertebrates and to fish assemblages, and (4) evaluate the toxicity of surface water, pore water, and sediment. Results from this study will contribute to an understanding of the relations among the chemical, physical, and biological components of waterways that are affected by mine drainage. Information from these results will be used in the development of a remedial investigation and feasibility study plan for the site, which will meet the broad U.S. Geological Survey (USGS) goal of furnishing data needed by other Federal agencies for management and remediation of contaminated sites and will provide valuable information for the characterization of the impact of mine drainage on the ecological condition of downstream water bodies. Ultimately, this information will be used in making decisions for remedial actions necessary to mitigate future contamination from the Pike Hill Copper Mine Superfund site and for developing a longer term monitoring program to assess the effectiveness of remediation. This report has been prepared, in part, to support the development of the Aquatic Baseline Ecological Risk Assessment being conducted under the regulatory framework of the Comprehensive Environmental Response, Compensation, and Liability Act (CERCLA, or Superfund). These two reports will complement a source-area remedial investigation being conducted by USEPA and its contractors (Nobis, 2008).
Report OrganizationThe report assesses the environmental conditions of the
aquatic ecosystem associated with the abandoned Pike Hill Copper Mine Superfund site, describes the approach and methods selected to document these conditions, describes the physical characteristics of the site, documents the nature and extent of contamination, integrates this information to form a conceptual model of the site with respect to the transport and fate of contaminants, and summarizes these results in terms of risks posed to both the aquatic ecosystem and human health.
This introductory section provides a general overview of the goals of this work and a summary of previous studies con-ducted at the site. The second section describes the physical setting of the site, including the historical mining landscape with the mining history, geomorphology and surface-water hydrology of the watershed, depositional locations within the streams, and biologic and ecologic features. The third section describes the approach used to identify sampling stations for detailed study and the methods employed to investigate surface-water, sediment-pore water, sediment, and biota characteristics, and toxicity testing. The fourth section docu-ments the nature and extent of contamination of surface water,
Introduction 3
Uni
on a
nd
Eure
ka m
ines
Cor
inth
Cen
ter
65
4
1
1211
10
5A
4F
4E4C
4A
1A
10C
10B
10A
2
10D
0
2A
9
72°1
3'40
"72
°16'
50"
72°2
0'
44°0
3'45
"
44°0
0'30
"
Cook v
ille
Br o
ok
Stre
am
Min
e
Stre
am s
ampl
e an
d id
entif
ier
Surfa
ce w
ater
Surfa
ce a
nd p
ore
wat
er
Sedi
men
t
Mac
roin
verte
brat
e co
mm
unity
Fish
and
mac
roin
verte
brat
e co
mm
unity
and
fish
tiss
ue
Dat
a co
llect
ed a
t sam
plin
g lo
catio
ns
Connecticut
River
Verm
ont
Copp
erBe
lt
NE
WH
AM
PSH
IRE
VE
RM
ON
T
Stud
yA
rea
Aeria
l pho
togr
aph
from
the
Nat
iona
l Agr
icul
ture
Imag
ery
Prog
ram
, 200
3Hy
drog
raph
y fro
m 1
:24,
000-
scal
e, N
atio
nal H
ydro
grap
hy D
atas
et, 1
999
8
7
3
Ext
ent o
f Fig
ure
2
Figu
re 1
.
5A
Smith
min
e
Meado
w Brook
01
20.
5M
ILES
01
20.
5KI
LOM
ETER
S
EXPL
AN
ATIO
N
Waits
R
iver
Pike
H
ill B
rook
Sout
h
Bra
nch
Wait
s
River
Sam
plin
g lo
catio
n nu
mbe
rs a
nd id
entif
iers
for d
ata
colle
cted
in th
e Pi
ke H
ill B
rook
and
Coo
kvill
e Br
ook
wat
ersh
eds
for t
he P
ike
Hill
copp
er m
ine
stud
y ar
ea,
Fi
gure
1.
Corin
th, V
erm
ont.
The
loca
tion
of th
e Pi
ke H
ill m
ine
site
is a
lso
show
n.
4 Aquatic Assessment of the Pike Hill Copper Mine Superfund Site, Corinth, Vermont
Ext
ent o
f fig
ures
20,
22,
23,
and
24
4A
4E5
6
4C3-
2
3-4
3-5
3-6 3-
3
4-1
4-2
3-1
2-1
1-1
C
C
CC
C
C
C
C
C C
Aeria
l pho
togr
aph
from
the
Nat
iona
l Agr
icul
ture
Imag
ery
Prog
ram
, 200
3Hy
drog
raph
y fro
m 1
:5,0
00-s
cale
, Nat
iona
l Hyd
rogr
aphy
Dat
aset
, 199
9
72°1
5'72
°16'
44°0
3'30
"
44°0
3'
Figu
re 2
Wet
land
s di
gitiz
ed fr
om U
SA T
opog
raph
ic M
aps,
ava
ilabl
e on
line
from
ESR
I, 20
09
5A
Stre
am
Stre
am s
ampl
e an
d id
entif
ier
Surfa
ce a
nd p
ore
wat
er
Core
Dat
a co
llect
ed a
t wet
land
sam
plin
g lo
catio
ns
Wet
land
sam
ple
and
iden
tifie
r
Pore
wat
er
5 1-1
Wet
land
EXPL
AN
ATIO
N
C
01,
000
2,00
0 FE
ET50
0
025
050
0 M
ETER
S12
5
Figu
re 2
. W
etla
nd s
ampl
e lo
catio
n nu
mbe
rs a
nd id
entif
iers
for s
edim
ent c
ores
and
sur
face
- wat
er a
nd p
ore-
wat
er s
ampl
es c
olle
cted
at t
he P
ike
Hill
copp
er m
ine
stud
y ar
ea,
Corin
th, V
erm
ont.
An
outli
ne o
f wet
land
4 is
not
sho
wn
beca
use
it w
as n
ot d
elin
eate
d on
the
GIS
sour
ce (E
SRI,
2009
). St
ream
sam
ple
loca
tions
are
als
o id
entif
ied
for r
efer
ence
.
Description of Study Area 5
pore water, and sediments in the Pike Hill and Cookville Brooks in terms of water-quality parameters, concentrations of metals, other inorganic constituents, organic constituents, and contaminant loads for comparison with biologic indicators of aquatic ecosystem health. The fifth section incorporates the results of the previous sections to produce an integrated model describing the transport and fate of contaminants away from source areas. The last section is a brief summary of the conclusions of the study.
Previous Studies
The Pike Hill copper mines have been the subject of several historical, geological, chemical, and environmental investigations. Early summaries of the geology and mining history of the Pike Hill copper mines area are provided by Wheeler (1883), Buerger (1935), White and Eric (1944), and Abbott (1973). More recently, the geology of the Pike Hill copper mines has been described by Slack and others (1993, 2001), and the mining history has been discussed by Kierstead (2001). The historical aspects were recently documented by Public Archaeological Laboratory (PAL; 2007), and the site is eligible for the National Register of Historic Places.
The chemistry of stream sediments from watersheds surrounding the mines was discussed in Slack and others (1984, 1990). Power and Milton (1990) reported on geobotani-cal anomalies associated with the mineralization at Pike Hill. Thesis projects by two students from Middlebury College in Vermont discussed geochemistry and mineralogy of mine-waste materials and stream precipitates (Totten, 1999; Wiercinski, 1999). The Vermont Department of Environmental Conservation (VTDEC) examined the macroinvertebrate community and fish populations in 1997 in surface waters near the site (USEPA, 2010).
The remedial investigation, to date, has included a num-ber of studies to define the nature and extent of contamination at the site. At the request of the USEPA, initial USGS inves-tigations conducted during 2004 and 2005 included studying the geochemical characteristics of mine waste, mine drainage, and stream sediments and the surface-water hydrology and quality at the site (Piatak and others, 2006a, b, c; Kiah and others, 2007). Surface-water data for samples collected from 2004 to 2006 were published in the 2006 Annual Water Data Report for the Nation (USGS, 2006a). Overall in the course of the remedial investigations, the USEPA and its contractors have conducted surface-water (2004 to 2007), sediment (2005, 2007), and mine-waste (2004, 2005) sampling, and laboratory toxicity tests (2005, 2007) of surface waters (TechLaw, 2006; Nobis, 2008; TechLaw, 2008a, b). In addition, supporting streamflow and water-quality data are stored in the USGS National Water Information System (http://nwis.waterdata.usgs.gov/nwis).
Description of Study AreaThe Pike Hill copper mines, which include the Smith,
Eureka, and Union mines, are located within the Vermont copper belt in Corinth, Orange County, Vt. (fig. 1). The Vermont copper belt includes the Elizabeth, Ely, and Pike Hill mines, as well as several smaller mines and prospects. The Besshi-type massive sulfide deposits in this belt are of Silurian and Devonian age and were likely formed on an ancient seafloor by submarine hydrothermal-exhalative and replacement processes (Slack and others, 1993). The deposits are hosted by metasedimentary and minor mafic metavolcanic rocks and contain massive ores composed of pyrrhotite, chalcopyrite, and minor sphalerite and pyrite. The deposits and the carbonaceous host rocks that form the underlying geology of the Pike Hill copper mines were deformed during several stages of folding and amphibolite grade metamorphism (Slack and others, 1993). Pike Hill mining exploited a sheet-like ore zone within the Silurian Waits River Formation.
The site is located near the town of Corinth in east-central Vermont (fig. 1; table 1). The mines operated from about 1847 to 1919, although the initial discovery of copper on Pike Hill was prior to 1847. The mines consist of underground workings, foundations from historical structures, several waste-rock piles, and some flotation tailings (USEPA, 2010). Mining activities were most intensive after 1860 because of the increased demand for copper to support the Civil War. The Pike Hill copper mines passed through several owners and changed mining operations several times as mining technolo-gies evolved during the years of operation (USEPA, 2010). Overall, between 1863 and 1918 over 3,500 tonnes of copper were produced as a result of the extraction of the copper ore (USEPA, 2010). The total area of the Pike Hill copper mines is approximately 216 acres (87 hectares; USEPA, 2010).
Approximately 18,000 tonnes of mine waste are piled and scattered over the land surface at the Union and Eureka mines (USEPA, 2010). This mine waste contains high concentrations of metals and sulfides (Piatak and others, 2006b). As water passes over and through the mine waste, sulfides are oxidized, acid is produced, and metals within the mine waste are dissolved and mobilized, resulting in acidic mine drainage. The area is mountainous with elevations ranging from about 362.7 meters (m) at the mouth of Pike Hill Brook to 598.9 m at the summit of Pike Hill and receives about 99.1 centimeters (cm) of precipitation per year (USGS, 2011).
The Eureka and Union mines, each of which is larger than the Smith mine, are near the top and northeast slope of Pike Hill. The northeast slope is drained by a single small stream, which is a major portion of the headwaters to Pike Hill Brook. A second headwater tributary to Pike Hill Brook drains an area not impacted by the mines; this tributary joins the mine-impacted tributary downstream from all mine waste and mine drainage from the Eureka and Union mines. Pike Hill Brook, which flows into the Waits River, has a total stream length of about 6.8 km and a contributing drainage area of 12.1 square kilometers (km2) at the mouth (Olson and
6 Aquatic Assessment of the Pike Hill Copper Mine Superfund Site, Corinth, Vermont
Tabl
e 1.
St
atio
n nu
mbe
r, st
atio
n na
me,
alte
rnat
ive
USGS
sta
tion
num
ber,
latit
ude,
long
itude
, dra
inag
e ar
ea, a
nd y
ears
sam
pled
for s
ampl
e lo
catio
ns a
t the
Pik
e Hi
ll co
pper
min
e st
udy
area
, Cor
inth
, Ver
mon
t. Ta
ble
does
not
incl
ude
seep
s, m
ine
pool
s, a
nd o
ther
wat
ers
in th
e im
med
iate
vic
inity
of t
he m
ine
wor
king
s an
d m
ine
was
te s
ampl
ed in
200
4 an
d di
scus
sed
in P
iata
k an
d ot
hers
(200
6b).—
Cont
inue
d
[USG
S, U
.S. G
eolo
gica
l Sur
vey;
latit
ude
and
long
itude
are
giv
en in
dec
imal
deg
rees
; km
2 , sq
uare
kilo
met
er; —
, not
app
licab
le; N
D, n
ot d
eter
min
ed]
Stat
ion
IDa
(figs
. 1
and
2)
Stat
ion
nam
eA
ltern
ate
USG
S st
atio
n nu
mbe
rLa
titud
eLo
ngitu
de
Dra
in-
age
area
(k
m2 )
Year
s sa
mpl
edW
ater
ID in
Pi
atak
and
ot
hers
, 200
6b
Sedi
men
t ID
in
Pia
tak
and
othe
rs, 2
006b
0Pi
ke H
ill B
rook
bel
ow E
urek
a an
d U
nion
min
es n
ear
Bra
dfor
d, V
t.01
1398
299
44.0
64–7
2.30
50.
1320
04–2
006
——
1Pi
ke H
ill B
rook
abo
ve R
icha
rdso
n R
oad
near
Bra
dfor
d, V
t.01
1398
3044
.064
–72.
302
0.28
2004
–200
6,
2007
PKH
L-10
0113
9830
-SD
1Ab
Pike
Hill
Bro
ok a
bove
Ric
hard
son
Roa
d ne
ar B
radf
ord,
Vt.
0113
9830
44.0
64–7
2.29
90.
2820
04—
—
2cTr
ibut
ary
to P
ike
Hill
Bro
ok a
t Ric
hard
son
Roa
d ne
ar
Bra
dfor
d, V
t.01
1398
302
44.0
65–7
2.30
20.
1620
04–2
006,
20
07PK
HL-
1101
1398
302-
SD
2APi
ke H
ill B
rook
at R
icha
rdso
n R
oad
near
Bra
dfor
d, V
t.01
1398
3144
.064
–72.
293
0.93
2004
–200
6PK
HL-
16—
3Pi
ke H
ill B
rook
at C
arpe
nter
Pla
ce n
ear B
radf
ord,
Vt.
0113
9832
44.0
63–7
2.28
90.
4520
04–2
006
0113
9832
0113
9832
-SD
4FPi
ke H
ill B
rook
at s
ite 4
F ne
ar B
radf
ord,
Vt.
4403
3007
2165
401
44.0
58–7
2.28
21.
8120
07—
—4
Pike
Hill
Bro
ok a
t Pik
e H
ill R
oad,
wes
t cro
ssin
g, n
ear
Bra
dfor
d, V
t.01
1398
3344
.058
–72.
281
2.85
2004
–200
6,
2007
PKH
L-12
0113
9833
-SD
4APi
ke H
ill B
rook
abo
ve w
etla
nds n
ear B
radf
ord,
Vt.
0113
9834
44.0
54–7
2.27
34.
1420
07—
—4C
Pike
Hill
Bro
ok a
bove
wet
land
3 n
ear B
radf
ord,
Vt.
4403
0507
2160
101
44.0
51–7
2.26
74.
8720
07—
—4E
Pike
Hill
Bro
ok b
elow
wet
land
s nea
r Bra
dfor
d, V
t.44
0310
0721
5480
144
.053
–72.
263
6.35
2007
——
5Pi
ke H
ill B
rook
at P
ike
Hill
Roa
d ne
ar B
radf
ord,
Vt.
0113
9838
44.0
53–7
2.25
39.
4320
04–2
006,
20
07PK
HL-
1301
1398
38-S
D
5ATr
ibut
ary
to P
ike
Hill
Bro
ok a
t Bro
ok R
oad
near
B
radf
ord,
Vt.
0113
9837
844
.048
–72.
256
0.67
2004
–200
6,
2007
PKH
L-17
—
6Pi
ke H
ill B
rook
at M
iller
Roa
d, n
ear B
radf
ord,
Vt.
0113
9839
44.0
55–7
2.24
611
.37
2004
–200
6,
2007
PKH
L-14
0113
9839
-SD
7Pi
ke H
ill B
rook
at m
outh
nea
r Bra
dfor
d, V
t.01
1398
4044
.062
–72.
235
12.1
2004
–200
601
1398
4001
1398
40-S
D8
Wai
ts R
iver
at V
T 25
nea
r Bra
dfor
d, V
t.01
1398
2644
.077
–72.
260
42.7
2004
–200
6PK
HL-
1501
1398
26-S
D9
Wai
ts R
iver
at V
illag
e R
oad
near
Bra
dfor
d, V
t.01
1398
4144
.055
–72.
222
50.6
2004
–200
601
1398
4101
1398
41-S
D
Description of Study Area 7
Tabl
e 1.
St
atio
n nu
mbe
r, st
atio
n na
me,
alte
rnat
ive
USGS
sta
tion
num
ber,
latit
ude,
long
itude
, dra
inag
e ar
ea, a
nd y
ears
sam
pled
for s
ampl
e lo
catio
ns a
t the
Pik
e Hi
ll co
pper
min
e st
udy
area
, Cor
inth
, Ver
mon
t. Ta
ble
does
not
incl
ude
seep
s, m
ine
pool
s, a
nd o
ther
wat
ers
in th
e im
med
iate
vic
inity
of t
he m
ine
wor
king
s an
d m
ine
was
te s
ampl
ed in
200
4 an
d di
scus
sed
in P
iata
k an
d ot
hers
(200
6b).—
Cont
inue
d
[USG
S, U
.S. G
eolo
gica
l Sur
vey;
latit
ude
and
long
itude
are
giv
en in
dec
imal
deg
rees
; km
2 , sq
uare
kilo
met
er; —
, not
app
licab
le; N
D, n
ot d
eter
min
ed]
Stat
ion
Dra
in-
Wat
er ID
in
Sedi
men
t ID
ID
a A
ltern
ate
USG
S ag
e St
atio
n na
me
Latit
ude
Long
itude
Year
s sa
mpl
edPi
atak
and
in
Pia
tak
and
(figs
. 1
stat
ion
num
ber
area
ot
hers
, 200
6bot
hers
, 200
6ban
d 2)
(km
2 )
10A
Unn
amed
trib
utar
y to
Coo
kvill
e B
rook
abo
ve g
eolo
gic
44
0317
0721
8110
144
.055
–72.
303
0.23
2007
——
brea
kout
nea
r Bra
dfor
d, V
t.10
BU
nnam
ed tr
ibut
ary
to C
ookv
ille
Bro
ok b
elow
geo
logi
c 44
0312
0721
8090
144
.053
–72.
303
0.28
2007
——
brea
kout
nea
r Bra
dfor
d, V
t.11
Unn
amed
trib
utar
y to
Coo
kvill
e B
rook
(site
11)
4403
0107
2180
101
44.0
50–7
2.30
00.
4920
07—
—12
Unn
amed
trib
utar
y to
Coo
kvill
e B
rook
(site
12)
4402
5407
2175
601
44.0
48–7
2.29
90.
820
07—
—10
Unn
amed
trib
utar
y to
Coo
kvill
e B
rook
nea
r Bra
dfor
d, V
t.01
1399
4044
.045
–72.
299
1.06
2004
–200
6,
CK
BK
-101
1399
40-S
D20
0710
CU
nnam
ed tr
ibut
ary
to C
ookv
ille
Bro
ok b
elow
wet
land
s nea
r 44
0208
0721
7590
144
.036
–72.
300
1.81
2007
——
Bra
dfor
d, V
t.10
DC
ookv
ille
Bro
ok a
t Was
hing
ton
Stat
e Fo
rest
nea
r 44
0243
0722
1550
144
.045
–72.
365
8.52
2007
——
Bra
dfor
d, V
t.1-
1Pi
ke H
ill B
k w
etla
nd 1
-1 n
ear B
radf
ord,
Vt.
4403
1807
2150
101
44.0
55–7
2.25
0N
D20
07—
—2-
1W
etla
nd 2
abo
ve P
ike
Hill
Bro
ok lo
catio
n 5
near
44
0315
0721
5290
144
.054
–72.
258
ND
2007
—-
Bra
dfor
d, V
t.3-
1Pi
ke H
ill B
rook
wet
land
3-1
nea
r Bra
dfor
d, V
t.44
0309
0721
5490
144
.053
–72.
264
ND
2007
——
3-2
Pike
Hill
Bro
ok w
etla
nd 3
-2 n
ear B
radf
ord,
Vt.
4403
0507
2155
301
44.0
51–7
2.26
5N
D20
07—
—3-
3Pi
ke H
ill B
rook
wet
land
3-3
nea
r Bra
dfor
d, V
t.44
0302
0721
5550
144
.051
–72.
265
ND
2007
——
3-4
Pike
Hill
Bro
ok w
etla
nd 3
-4 n
ear B
radf
ord,
Vt.
4403
0407
2155
501
44.0
51–7
2.26
5N
D20
07—
—3-
5Pi
ke H
ill B
rook
wet
land
3-5
nea
r Bra
dfor
d, V
t.44
0307
0721
5560
144
.052
–72.
266
ND
2007
——
3-6
Pike
Hill
Bro
ok w
etla
nd 3
-6 n
ear B
radf
ord,
Vt.
4403
0407
2155
701
44.0
51–7
2.26
6N
D20
07—
—4-
1Pi
ke H
ill B
rook
wet
land
4-1
nea
r Bra
dfor
d, V
t.44
0308
0721
6100
144
.052
–72.
269
ND
2007
——
4-2
Pike
Hill
Bro
ok w
etla
nd 4
-2 n
ear B
radf
ord,
Vt.
4403
0707
2161
001
44.0
52–7
2.27
0N
D20
07—
—a Sa
mpl
e ID
s in
this
repo
rt ha
ve th
e pr
efix
“PH
B”
or “
PKSi
te”
befo
re th
e st
atio
n ID
for a
ll sa
mpl
es e
xcep
t tho
se c
olle
cted
in th
e w
etla
nds,
whi
ch h
ave
the
prefi
x “w
etla
nd.”
b Sedi
men
t sam
ple
was
col
lect
ed a
ppro
xim
atel
y 1
met
er d
owns
tream
from
the
wat
er-q
ualit
y sa
mpl
ing
loca
tion.
c Surf
ace
wat
er a
t thi
s sta
tion
was
col
lect
ed u
nder
the
prev
ious
site
ID o
f PK
HL-
11.

8 Aquatic Assessment of the Pike Hill Copper Mine Superfund Site, Corinth, Vermont
others, 2005). The dominant land cover in this drainage area is forest, with about 16 percent comprising coniferous trees (table 2; Olson and others, 2005). Pike Hill Brook is discussed in this report in two stream segments, the upper reach and lower reach. The upper reach of Pike Hill Brook encompasses the headwaters of Pike Hill Brook to about 3.2 km downstream or just before sampling station 4A (fig. 1). The lower reach of Pike Hill Brook extends about 3.6 km from station 4A to the mouth of the brook, where it joins the Waits River (fig. 1). Pike Hill Brook was divided into two segments because of physical differences between the defined reaches, specifically, the size of the drainage area at the sample locations and morphological attributes.
The upper reach of Pike Hill Brook, including the headwaters, is classified as a first order stream and has a high gradient with a slope of about 4.8 percent (table 3; Olson and others, 2005). The drainage area for the sample locations in the upper reach ranged from 0.13 to 2.85 km2
(table 1). Instantaneous discharge values ranged from 0.06 to 0.77 cubic feet per second (ft3/s; 1.7 to 22 cubic decimeters per second, dm3/s) in the upper reach of Pike Hill Brook (table 4). Sampling locations in 2007 for this stream reach include the following: station 1, the major portion of the headwaters of the brook downstream from the Eureka and Union mines; sta-tion 2, a headwaters tributary not impacted by mine drainage and upstream from the confluence with station 1 waters; station 4F, downstream from station 1 and upstream from the first significant input of waters not affected by mine drainage; and station 4, downstream from the first significant input of waters not affected by mine drainage (fig. 1).
The lower reach of Pike Hill Brook also is classified as a first order stream (table 3) but has a lower slope (2.9 percent; Olson and others, 2005) and includes a series of four wetlands
Table 3. Selected geomorphic stream reach characteristics at the Pike Hill copper mine study area, Corinth, Vermont.
[Values in percent unless otherwise indicated; km, kilometer]
CharacteristicStream reach
Upper Pike Hill Brook
Lower Pike Hill Brook
Tributary to Cookville Brook
Reach length (km) 3.2 3.6 2.7 Slope 4.8 2.9 5.7 Cascade 7.2 0.0 31.2 Riffle 72.2 13.5 19.8 Run 16.0 27.7 5.4 Pool 4.5 1.5 9.7 Wetland 0.0 57.3 33.8
Table 2. Selected watershed characteristics of sampled streams at the Pike Hill copper mine study area, Corinth, Vermont.
[km2, square kilometer; m, meter; cm, centimeter; %, percent; °C, degree Celsius]
CharacteristicStream
Pike Hill BrookTributary to
Cookville BrookCookville Brook
Drainage area (km2) 12.1 1.8 8.5
Coniferous forest (%) 16.3 2.6 7.3Mixed forest (%) 36.3 21.7 27.9Mean temperature (°C) 5.3 5.0 4.8Mean annual precipitation (cm) 95.6 100.6 103.9Strahler stream order 1 1 1
along the stream channel. Drainage areas for sample locations in the lower reach ranged from 4.14 to 12.10 km2 (table 1), and instantaneous discharge values measured at the sample loca-tions ranged from 0.28 to 2.63 ft3/s (7.9 to 74 dm3/s; table 4). Sampling locations in 2007 for this stream reach include the following: station 4A, brook upstream from wetlands; station 4C, brook downstream from wetland 4 and upstream from wetland 3; station 4E, brook downstream from wetland 3 and upstream from wetland 2; station 5, brook downstream from wetland 2 and upstream from wetland 1; station 6, downstream from wetland 1 and upstream from the mouth of the brook; and station 5A, tributary to Pike Hill Brook not impacted by drainage from the Pike Hill copper mine study area (figs. 1, 2).
The wetlands within the lower reach of Pike Hill Brook were sampled separately from the stream samples mentioned above (sampled August, September, and October of 2007). A preliminary investigation of the wetlands consisted of analyzing sediment by x-ray fluorescence spectrometry (XRF) and submitting a subset for more detailed chemical analysis. On the basis of these findings, a total of 10 wetland locations were sampled in August 2007. Samples were collected from within four wetlands, and the locations are shown in figure 2.
In August 2007, surface water was also sampled at stream stations 4C and 4E.
A qualitative geomorphic characterization to determine the distribution of geomorphic channel units of the study area was conducted in September of 2006 (appendix 1). Data from this assessment indicated that the distribution of geo-morphic channel units along the upper reach was dominated by riffles, approximately 72.2 percent, followed by 16.0 percent run, 7.2 percent cascade, and 4.5 percent pools (table 3). In contrast, the geomorphology of Pike Hill Brook in the lower reach is approximately 57.3 percent wetlands, 27.7 percent run, 13.5 percent riffle, and 1.5 percent pool (table 3).
The Smith mine is on the southeast slope of Pike Hill, and mine waste and workings are within 150 m of a small unnamed tributary that
Description of Study Area 9Ta
ble
4.
Sele
cted
con
stitu
ents
in s
urfa
ce-w
ater
sam
ples
col
lect
ed in
Aug
ust a
nd O
ctob
er 2
007
from
the
Pike
Hill
cop
per m
ine
stud
y ar
ea, C
orin
th, V
erm
ont.
[The
con
cent
ratio
ns o
f the
follo
win
g el
emen
ts w
ere
belo
w th
eir d
etec
tion
limits
(giv
en in
par
enth
eses
in m
icro
gram
s per
lite
r): A
g (<
1), A
s (<1
), an
d M
o (<
2); f
t3 /s, c
ubic
feet
per
seco
nd; S
C, s
peci
fic c
ondu
ctan
ce;
μS/c
m, m
icro
siem
ens p
er c
entim
eter
; mg/
L, m
illig
ram
s per
lite
r; D
OC
, dis
solv
ed o
rgan
ic c
arbo
n; N
, nitr
ogen
; P, p
hosp
horu
s; IC
P-M
S, in
duct
ivel
y co
uple
d pl
asm
a-m
ass s
pect
rom
etry
; IC
P-A
ES, i
nduc
tivel
y co
uple
d pl
asm
a-at
omic
em
issi
on sp
ectro
scop
y; μ
g/L,
mic
rogr
ams p
er li
ter;
—, n
ot d
eter
min
ed; <
, ana
lyte
not
det
ecte
d at
the
repo
rting
leve
l; E,
est
imat
ed v
alue
is le
ss th
an th
e re
porti
ng le
vel b
ut g
reat
er th
an th
e lo
ng-te
rm-
met
hod-
dete
ctio
n le
vel;
IC, i
on c
hrom
atog
raph
y]
Stre
am
and
stat
ion
nu
mbe
r
Sam
ple
type
Dat
eD
is-
char
gea
(ft3 /s
)
SC (f
ield
)(μ
S/cm
)pH
Alk
alin
ity(m
g/L
as
CaCO
3)
DO
C(m
g/L)
Tota
lN
(mg/
L)
Tota
lP
(mg/
L)
Ca(m
g/L)
ICP-
MS
Fe(m
g/L)
ICP-
AES
K(m
g/L)
ICP-
MS
Mg
(mg/
L)IC
P-M
S
Na
(mg/
L)IC
P-M
S
SiO
2(m
g/L)
ICP-
MS
Al
(μg/
L)IC
P-M
S
Ba
(μg/
L)IC
P-M
S
Be
(μg/
L)IC
P-M
S
Uppe
r Pik
e Hi
ll Br
ook
2fil
tere
d10
/18/
2007
0.06
202
7.5
80—
——
35.6
<20
1.72
1.27
0.97
5.9
3.3
20.0
<0.0
52
raw
10/1
8/20
070.
0620
27.
5—
——
—36
.246
1.75
1.31
1.00
6.1
41.6
20.3
<0.0
51
filte
red
10/1
8/20
070.
1158
94.
7<5
0.8
——
56.4
18,0
004.
415.
821.
4023
.03,
650
26.8
0.30
1ra
w10
/18/
2007
0.11
589
4.7
——
E0.0
5E0
.004
63.2
19,0
003.
246.
881.
4122
.94,
850
17.6
0.40
4Ffil
tere
d10
/18/
2007
0.58
287
7.3
551.
6—
—42
.4<2
02.
603.
141.
508.
911
.116
.7<0
.05
4Fra
w10
/18/
2007
0.58
287
7.3
——
<0.0
6<0
.008
43.0
830
2.64
3.12
1.50
9.2
185
17.6
<0.0
54
filte
red
10/1
8/20
070.
7723
37.
263
1.6
——
29.7
<20
1.89
1.94
1.33
6.4
12.4
13.9
<0.0
54
raw
10/1
8/20
070.
7723
37.
2—
—<0
.06
<0.0
0830
.617
41.
962.
011.
406.
542
.214
.0<0
.05
Low
er P
ike
Hill
Broo
k5A
filte
red
10/1
7/20
070.
2835
67.
613
44.
2—
—45
.8<2
03.
322.
2615
.60
8.5
6.7
23.2
<0.0
55A
raw
10/1
7/20
070.
2835
67.
6—
—0.
42E0
.007
146
.910
13.
422.
3416
.20
8.8
35.2
24.3
<0.0
54A
filte
red
10/1
7/20
070.
9223
67.
771
1.6
——
34.8
<20
2.17
2.40
1.28
7.1
9.7
15.6
<0.0
54A
raw
10/1
7/20
070.
9223
67.
7—
—E0
.04
<0.0
0834
.857
32.
192.
381.
277.
311
815
.70.
064C
filte
red
8/21
/200
70.
46—
7.7
761.
3—
—31
.916
61.
901.
921.
616.
47.
614
.4<0
.05
4Cra
w8/
21/2
007
0.46
—7.
7—
—0.
15<0
.008
33.0
328
1.93
1.94
1.67
6.6
23.7
14.8
<0.0
54C
filte
red
10/1
7/20
071.
0123
27.
572
1.5
——
29.8
961.
901.
941.
366.
48.
413
.7<0
.05
4Cra
w10
/17/
2007
1.01
232
7.5
——
E0.0
4<0
.008
30.1
238
1.91
1.96
1.36
6.5
25.4
14.0
<0.0
54E
filte
red
8/21
/200
70.
66—
7.6
842.
5—
—30
.228
71.
941.
683.
315.
8<2
.011
.1<0
.05
4Era
w8/
21/2
007
0.66
—7.
6—
—0.
11E0
.007
30.3
490
1.98
1.68
3.28
5.9
2.9
11.2
<0.0
54E
filte
red
10/1
7/20
071.
6119
37.
967
2.6
——
26.0
172
2.08
1.59
2.53
5.8
5.1
9.1
<0.0
54E
raw
10/1
7/20
071.
6119
37.
9—
—E0
.04
<0.0
0826
.627
02.
111.
622.
576.
034
.99.
7<0
.05
5fil
tere
d10
/17/
2007
2.38
208
7.5
783.
1—
—28
.322
42.
151.
583.
986.
05.
412
.7<0
.05
5ra
w10
/17/
2007
2.38
208
7.5
——
0.1
<0.0
0828
.130
22.
121.
573.
946.
011
.412
.60.
056
filte
red
10/1
7/20
072.
6320
87.
581
3.3
——
26.7
208
1.99
1.52
4.15
5.4
4.0
11.9
<0.0
56
raw
10/1
7/20
072.
6320
87.
5—
—0.
09<0
.008
28.3
301
2.12
1.60
4.40
5.8
7.9
12.7
<0.0
5Co
okvi
lle B
rook
10D
filte
red
10/1
6/20
072.
3418
87.
692
2—
—29
.834
0.97
0.81
0.69
4.4
9.7
7.6
<0.0
510
Dra
w10
/16/
2007
2.34
188
7.6
——
0.07
<0.0
0831
.640
1.02
0.85
0.77
4.7
12.0
7.8
<0.0
5Tr
ibut
ary
to C
ookv
ille
Broo
k10
Afil
tere
d10
/16/
2007
0.08
208
7.6
101
0.9
——
34.4
<20
1.75
1.42
0.57
4.7
5.1
23.6
<0.0
510
Ara
w10
/16/
2007
0.08
208
7.6
——
<0.0
6<0
.008
35.0
<20
1.78
1.45
0.58
4.9
19.8
24.0
<0.0
510
Bfil
tere
d10
/16/
2007
0.12
226
7.1
863.
3—
—29
.6<2
01.
441.
760.
607.
211
720
.10.
0610
Bra
w10
/16/
2007
0.12
226
7.1
——
0.13
0.01
134
.1<2
01.
632.
080.
708.
468
021
.7<0
.05
11fil
tere
d10
/16/
2007
0.22
225
7.8
930.
8—
—34
.6<2
01.
511.
790.
626.
238
.817
.0<0
.05
11ra
w10
/16/
2007
0.22
225
7.8
——
0.09
<0.0
0834
.7<2
01.
521.
820.
636.
448
.817
.0<0
.05
12fil
tere
d10
/16/
2007
0.22
236
7.8
105
1—
—32
.6<2
01.
441.
530.
555.
422
.715
.2<0
.05
12ra
w10
/16/
2007
0.22
236
7.8
——
0.11
<0.0
0836
.0<2
01.
561.
680.
595.
955
.415
.8<0
.05
10fil
tere
d10
/16/
2007
0.27
242
7.3
113
0.9
——
39.2
<20
1.70
1.70
0.63
5.9
14.2
16.6
<0.0
510
raw
10/1
6/20
070.
2724
27.
3—
—0.
08E0
.005
39.9
<20
1.71
1.75
0.65
6.0
16.1
16.6
<0.0
510
Cfil
tere
d10
/16/
2007
0.42
248
7.6
126
2.1
——
40.6
<20
2.24
1.62
0.67
5.5
7.8
16.1
<0.0
510
Cra
w10
/16/
2007
0.42
248
7.6
——
<0.0
6<0
.008
44.4
512.
431.
770.
726.
023
.017
.0<0
.05
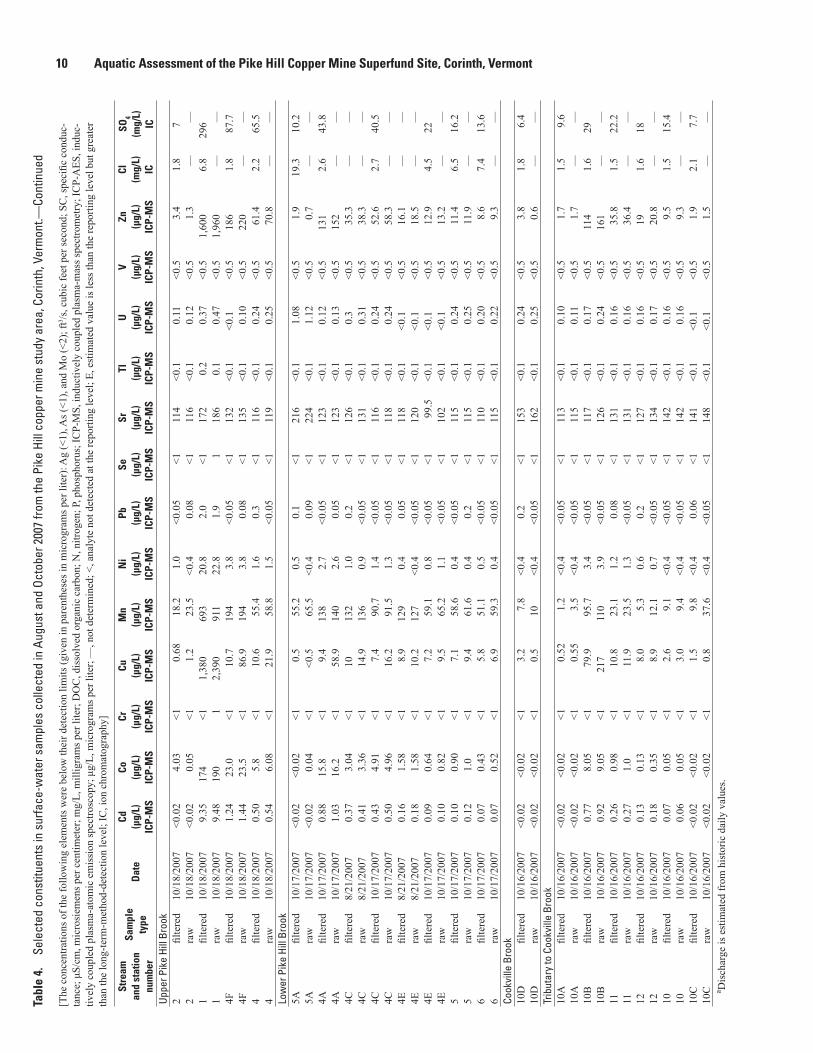
10 Aquatic Assessment of the Pike Hill Copper Mine Superfund Site, Corinth, Vermont
Tabl
e 4.
Se
lect
ed c
onst
ituen
ts in
sur
face
-wat
er s
ampl
es c
olle
cted
in A
ugus
t and
Oct
ober
200
7 fro
m th
e Pi
ke H
ill c
oppe
r min
e st
udy
area
, Cor
inth
, Ver
mon
t.—Co
ntin
ued
[The
con
cent
ratio
ns o
f the
follo
win
g el
emen
ts w
ere
belo
w th
eir d
etec
tion
limits
(giv
en in
par
enth
eses
in m
icro
gram
s per
lite
r): A
g (<
1), A
s (<1
), an
d M
o (<
2); f
t3 /s, c
ubic
feet
per
seco
nd; S
C, s
peci
fic c
ondu
c-ta
nce;
μS/
cm, m
icro
siem
ens p
er c
entim
eter
; mg/
L, m
illig
ram
s per
lite
r; D
OC
, dis
solv
ed o
rgan
ic c
arbo
n; N
, nitr
ogen
; P, p
hosp
horu
s; IC
P-M
S, in
duct
ivel
y co
uple
d pl
asm
a-m
ass s
pect
rom
etry
; IC
P-A
ES, i
nduc
-tiv
ely
coup
led
plas
ma-
atom
ic e
mis
sion
spec
trosc
opy;
μg/
L, m
icro
gram
s per
lite
r; —
, not
det
erm
ined
; <, a
naly
te n
ot d
etec
ted
at th
e re
porti
ng le
vel;
E, e
stim
ated
val
ue is
less
than
the
repo
rting
leve
l but
gre
ater
th
an th
e lo
ng-te
rm-m
etho
d-de
tect
ion
leve
l; IC
, ion
chr
omat
ogra
phy]
Stre
am
and
stat
ion
nu
mbe
r
Sam
ple
type
Dat
eCd
(μg/
L)IC
P-M
S
Co(μ
g/L)
ICP-
MS
Cr(μ
g/L)
ICP-
MS
Cu(μ
g/L)
ICP-
MS
Mn
(μg/
L)IC
P-M
S
Ni
(μg/
L)IC
P-M
S
Pb(μ
g/L)
ICP-
MS
Se(μ
g/L)
ICP-
MS
Sr(μ
g/L)
ICP-
MS
Tl(μ
g/L)
ICP-
MS
U(μ
g/L)
ICP-
MS
V(μ
g/L)
ICP-
MS
Zn(μ
g/L)
ICP-
MS
Cl(m
g/L)
IC
SO4
(mg/
L)IC
Uppe
r Pik
e Hi
ll Br
ook
2fil
tere
d10
/18/
2007
<0.0
24.
03<1
0.68
18.2
1.0
<0.0
5<1
114
<0.1
0.11
<0.5
3.4
1.8
72
raw
10/1
8/20
07<0
.02
0.05
<11.
223
.5<0
.40.
08<1
116
<0.1
0.12
<0.5
1.3
——
1fil
tere
d10
/18/
2007
9.35
174
<11,
380
693
20.8
2.0
<117
20.
20.
37<0
.51,
600
6.8
296
1ra
w10
/18/
2007
9.48
190
12,
390
911
22.8
1.9
118
60.
10.
47<0
.51,
960
——
4Ffil
tere
d10
/18/
2007
1.24
23.0
<110
.719
43.
8<0
.05
<113
2<0
.1<0
.1<0
.518
61.
887
.74F
raw
10/1
8/20
071.
4423
.5<1
86.9
194
3.8
0.08
<113
5<0
.10.
10<0
.522
0—
—4
filte
red
10/1
8/20
070.
505.
8<1
10.6
55.4
1.6
0.3
<111
6<0
.10.
24<0
.561
.42.
265
.54
raw
10/1
8/20
070.
546.
08<1
21.9
58.8
1.5
<0.0
5<1
119
<0.1
0.25
<0.5
70.8
——
Low
er P
ike
Hill
Broo
k5A
filte
red
10/1
7/20
07<0
.02
<0.0
2<1
0.5
55.2
0.5
0.1
<121
6<0
.11.
08<0
.51.
919
.310
.25A
raw
10/1
7/20
07<0
.02
0.04
<1<0
.565
.5<0
.40.
09<1
224
<0.1
1.12
<0.5
0.7
——
4Afil
tere
d10
/17/
2007
0.88
15.8
<19.
413
82.
7<0
.05
<112
3<0
.10.
12<0
.513
12.
643
.84A
raw
10/1
7/20
071.
0316
.2<1
58.9
140
2.6
0.05
<112
3<0
.10.
13<0
.515
2—
—4C
filte
red
8/21
/200
70.
373.
04<1
1013
21.
00.
2<1
126
<0.1
0.3
<0.5
35.3
——
4Cra
w8/
21/2
007
0.41
3.36
<114
.913
60.
9<0
.05
<113
1<0
.10.
31<0
.538
.3—
—4C
filte
red
10/1
7/20
070.
434.
91<1
7.4
90.7
1.4
<0.0
5<1
116
<0.1
0.24
<0.5
52.6
2.7
40.5
4Cra
w10
/17/
2007
0.50
4.96
<116
.291
.51.
3<0
.05
<111
8<0
.10.
24<0
.558
.3—
—4E
filte
red
8/21
/200
70.
161.
58<1
8.9
129
0.4
0.05
<111
8<0
.1<0
.1<0
.516
.1—
—4E
raw
8/21
/200
70.
181.
58<1
10.2
127
<0.4
<0.0
5<1
120
<0.1
<0.1
<0.5
18.5
——
4Efil
tere
d10
/17/
2007
0.09
0.64
<17.
259
.10.
8<0
.05
<199
.5<0
.1<0
.1<0
.512
.94.
522
4Era
w10
/17/
2007
0.10
0.82
<19.
565
.21.
1<0
.05
<110
2<0
.1<0
.1<0
.513
.2—
—5
filte
red
10/1
7/20
070.
100.
90<1
7.1
58.6
0.4
<0.0
5<1
115
<0.1
0.24
<0.5
11.4
6.5
16.2
5ra
w10
/17/
2007
0.12
1.0
<19.
461
.60.
40.
2<1
115
<0.1
0.25
<0.5
11.9
——
6fil
tere
d10
/17/
2007
0.07
0.43
<15.
851
.10.
5<0
.05
<111
0<0
.10.
20<0
.58.
67.
413
.66
raw
10/1
7/20
070.
070.
52<1
6.9
59.3
0.4
<0.0
5<1
115
<0.1
0.22
<0.5
9.3
——
Cook
ville
Bro
ok10
Dfil
tere
d10
/16/
2007
<0.0
2<0
.02
<13.
27.
8<0
.40.
2<1
153
<0.1
0.24
<0.5
3.8
1.8
6.4
10D
raw
10/1
6/20
07<0
.02
<0.0
2<1
0.5
10<0
.4<0
.05
<116
2<0
.10.
25<0
.50.
6—
—Tr
ibut
ary
to C
ookv
ille
Broo
k10
Afil
tere
d10
/16/
2007
<0.0
2<0
.02
<10.
521.
2<0
.4<0
.05
<111
3<0
.10.
10<0
.51.
71.
59.
610
Ara
w10
/16/
2007
<0.0
2<0
.02
<10.
553.
5<0
.4<0
.05
<111
5<0
.10.
11<0
.51.
7—
—10
Bfil
tere
d10
/16/
2007
0.77
8.05
<179
.995
.73.
4<0
.05
<111
7<0
.10.
17<0
.511
41.
629
10B
raw
10/1
6/20
070.
929.
05<1
217
110
3.9
<0.0
5<1
126
<0.1
0.24
<0.5
161
——
11fil
tere
d10
/16/
2007
0.26
0.98
<110
.823
.11.
20.
08<1
131
<0.1
0.16
<0.5
35.8
1.5
22.2
11ra
w10
/16/
2007
0.27
1.0
<111
.923
.51.
3<0
.05
<113
1<0
.10.
16<0
.536
.4—
—12
filte
red
10/1
6/20
070.
130.
13<1
8.0
5.3
0.6
0.2
<112
7<0
.10.
16<0
.519
1.6
1812
raw
10/1
6/20
070.
180.
35<1
8.9
12.1
0.7
<0.0
5<1
134
<0.1
0.17
<0.5
20.8
——
10fil
tere
d10
/16/
2007
0.07
0.05
<12.
69.
1<0
.4<0
.05
<114
2<0
.10.
16<0
.59.
51.
515
.410
raw
10/1
6/20
070.
060.
05<1
3.0
9.4
<0.4
<0.0
5<1
142
<0.1
0.16
<0.5
9.3
——
10C
filte
red
10/1
6/20
07<0
.02
<0.0
2<1
1.5
9.8
<0.4
0.06
<114
1<0
.1<0
.1<0
.51.
92.
17.
710
Cra
w10
/16/
2007
<0.0
2<0
.02
<10.
837
.6<0
.4<0
.05
<114
8<0
.1<0
.1<0
.51.
5—
—a D
isch
arge
is e
stim
ated
from
his
toric
dai
ly v
alue
s.
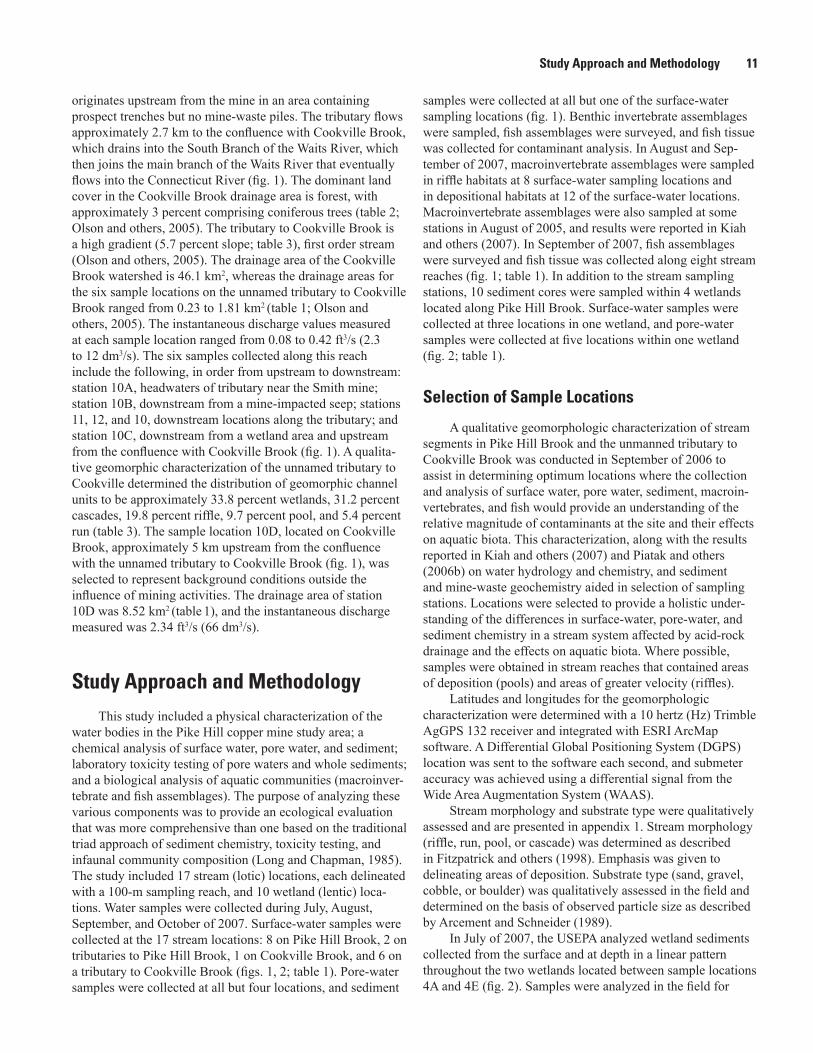
Study Approach and Methodology 11
originates upstream from the mine in an area containing prospect trenches but no mine-waste piles. The tributary flows approximately 2.7 km to the confluence with Cookville Brook, which drains into the South Branch of the Waits River, which then joins the main branch of the Waits River that eventually flows into the Connecticut River (fig. 1). The dominant land cover in the Cookville Brook drainage area is forest, with approximately 3 percent comprising coniferous trees (table 2; Olson and others, 2005). The tributary to Cookville Brook is a high gradient (5.7 percent slope; table 3), first order stream (Olson and others, 2005). The drainage area of the Cookville Brook watershed is 46.1 km2, whereas the drainage areas for the six sample locations on the unnamed tributary to Cookville Brook ranged from 0.23 to 1.81 km2 (table 1; Olson and others, 2005). The instantaneous discharge values measured at each sample location ranged from 0.08 to 0.42 ft3/s (2.3 to 12 dm3/s). The six samples collected along this reach include the following, in order from upstream to downstream: station 10A, headwaters of tributary near the Smith mine; station 10B, downstream from a mine-impacted seep; stations 11, 12, and 10, downstream locations along the tributary; and station 10C, downstream from a wetland area and upstream from the confluence with Cookville Brook (fig. 1). A qualita-tive geomorphic characterization of the unnamed tributary to Cookville determined the distribution of geomorphic channel units to be approximately 33.8 percent wetlands, 31.2 percent cascades, 19.8 percent riffle, 9.7 percent pool, and 5.4 percent run (table 3). The sample location 10D, located on Cookville Brook, approximately 5 km upstream from the confluence with the unnamed tributary to Cookville Brook (fig. 1), was selected to represent background conditions outside the influence of mining activities. The drainage area of station 10D was 8.52 km2 (table 1), and the instantaneous discharge measured was 2.34 ft3/s (66 dm3/s).
Study Approach and MethodologyThis study included a physical characterization of the
water bodies in the Pike Hill copper mine study area; a chemical analysis of surface water, pore water, and sediment; laboratory toxicity testing of pore waters and whole sediments; and a biological analysis of aquatic communities (macroinver-tebrate and fish assemblages). The purpose of analyzing these various components was to provide an ecological evaluation that was more comprehensive than one based on the traditional triad approach of sediment chemistry, toxicity testing, and infaunal community composition (Long and Chapman, 1985). The study included 17 stream (lotic) locations, each delineated with a 100-m sampling reach, and 10 wetland (lentic) loca-tions. Water samples were collected during July, August, September, and October of 2007. Surface-water samples were collected at the 17 stream locations: 8 on Pike Hill Brook, 2 on tributaries to Pike Hill Brook, 1 on Cookville Brook, and 6 on a tributary to Cookville Brook (figs. 1, 2; table 1). Pore-water samples were collected at all but four locations, and sediment
samples were collected at all but one of the surface-water sampling locations (fig. 1). Benthic invertebrate assemblages were sampled, fish assemblages were surveyed, and fish tissue was collected for contaminant analysis. In August and Sep-tember of 2007, macroinvertebrate assemblages were sampled in riffle habitats at 8 surface-water sampling locations and in depositional habitats at 12 of the surface-water locations. Macroinvertebrate assemblages were also sampled at some stations in August of 2005, and results were reported in Kiah and others (2007). In September of 2007, fish assemblages were surveyed and fish tissue was collected along eight stream reaches (fig. 1; table 1). In addition to the stream sampling stations, 10 sediment cores were sampled within 4 wetlands located along Pike Hill Brook. Surface-water samples were collected at three locations in one wetland, and pore-water samples were collected at five locations within one wetland (fig. 2; table 1).
Selection of Sample Locations
A qualitative geomorphologic characterization of stream segments in Pike Hill Brook and the unmanned tributary to Cookville Brook was conducted in September of 2006 to assist in determining optimum locations where the collection and analysis of surface water, pore water, sediment, macroin-vertebrates, and fish would provide an understanding of the relative magnitude of contaminants at the site and their effects on aquatic biota. This characterization, along with the results reported in Kiah and others (2007) and Piatak and others (2006b) on water hydrology and chemistry, and sediment and mine-waste geochemistry aided in selection of sampling stations. Locations were selected to provide a holistic under-standing of the differences in surface-water, pore-water, and sediment chemistry in a stream system affected by acid-rock drainage and the effects on aquatic biota. Where possible, samples were obtained in stream reaches that contained areas of deposition (pools) and areas of greater velocity (riffles).
Latitudes and longitudes for the geomorphologic characterization were determined with a 10 hertz (Hz) Trimble AgGPS 132 receiver and integrated with ESRI ArcMap software. A Differential Global Positioning System (DGPS) location was sent to the software each second, and submeter accuracy was achieved using a differential signal from the Wide Area Augmentation System (WAAS).
Stream morphology and substrate type were qualitatively assessed and are presented in appendix 1. Stream morphology (riffle, run, pool, or cascade) was determined as described in Fitzpatrick and others (1998). Emphasis was given to delineating areas of deposition. Substrate type (sand, gravel, cobble, or boulder) was qualitatively assessed in the field and determined on the basis of observed particle size as described by Arcement and Schneider (1989).
In July of 2007, the USEPA analyzed wetland sediments collected from the surface and at depth in a linear pattern throughout the two wetlands located between sample locations 4A and 4E (fig. 2). Samples were analyzed in the field for
12 Aquatic Assessment of the Pike Hill Copper Mine Superfund Site, Corinth, Vermont
copper, iron, lead, and zinc using XRF. Twenty-three of the XRF samples were submitted to the USGS Central Mineral and Environmental Resources Science Center (CMERSC) Analytical Chemistry Laboratory in Denver, Colorado, for analyses. Based on these findings, in August 2007, eight sample locations were selected within the two wetlands between stations 4A and 4E for detailed analyses of sedi-ments, surface water, and pore water (fig. 2). Two additional sample locations were selected for detailed analyses, one in the wetland between stations 4E and 5 and the other in the wetland between stations 5 and 6. In addition, surface-water samples were collected, and discharge measurements were made from stations 4C and 4E so that information pertaining to concentrations and loads entering and exiting the largest of the four wetlands could be evaluated.
Station identifications (ID) for sample locations are given in table 1. Sample IDs were based on the station names with various prefixes and suffixes. Stream-sediment and wetland-sediment samples were identified with the prefix “PKSite” (abbreviation for Pike Hill mine site) and “wetland,” respec-tively, before the Station ID. Wetland cores were divided into various sample splits based on physical variations, such as grain size or color, and were distinguished by the addition of a suffix to the sample ID. Surface- and pore-water samples were named on the basis of the station ID in addition to the prefix “PHB” (abbreviation for Pike Hill Brook) or “PKHL” (abbreviation for Pike Hill mine site) or “PKSite,” all of which indicate the samples were collected from this study area. Samples of sediment for toxicity testing were identified with the station ID and a prefix to identify the stream segment (Pike Hill Brook = “PB,” Pike Hill tributary = “PT,” Cookville tributary = “CT,” and Cookville Brook = “CB”). Despite the various prefixes and suffixes, the station ID is consistent among all samples collected at a particular location for this study.
Hydrologic Data
Instantaneous streamflow measurements were made at all water sampling locations. Streamflow was measured by the conventional current meter method or by use of a portable Parshall flume using published USGS protocols (Buchanan and Somers, 1969; Rantz and others, 1982; Kilpatrick and Schneider, 1983). Error associated with a streamflow measure-ment made by the current meter method was calculated using protocols developed by Sauer and Meyer (1992). Error associated with a streamflow measurement made by the Parshall flume (stations 1, 5A, 10A, and 10B) was assumed to be equal to half the difference in the rated discharges per unit increase in observed stage. Error associated with streamflow measurements was less than 10 percent.
Surface-Water Data
Surface-water samples were collected using USGS protocols (Wilde and Radtke, 1998; Wilde and others, 1999). Specific conductance, pH, dissolved oxygen, oxidation-reduction potential, and water temperature were determined by discrete measurements at the time of water sample collection; specific conductance was remeasured in the laboratory. Water samples were collected for the analysis of major ions, trace elements, nutrients, alkalinity, and dissolved organic carbon. Samples were analyzed for major ions and trace elements by the USGS CMERSC Analytical Chemistry Laboratory in Denver, Colo. Major ions and trace elements were analyzed using inductively coupled plasma-atomic emission spectroscopy (ICP-AES) and inductively coupled plasma-mass spectrometry (ICP-MS). Mercury was analyzed using continu-ous flow-cold vapor-atomic absorption fluorescence (CVAF). Major anions were analyzed using ion chromatography (IC). Samples included a less than 0.45-micrometer (μm) filtered (dissolved) sample and an unfiltered (total) sample. Samples were analyzed for nutrients, alkalinity, and dissolved organic carbon by the USGS National Water Quality Laboratory in Denver, Colo.
Pore-Water Data
Pore-water samples were obtained using four different methodologies. Pore water was extracted from sediment in situ using protocols described in Zimmerman and others (2005). These samples are referred to herein as “in situ” pore water to distinguish them from pore waters extracted from whole-sediment samples. In situ pore-water samples were collected with the use of a push-point sampler at a depth of 15 cm. A push-point sampler is designed to collect sediment-pore water with minimal disturbance to the sample location. Continuous measurement of specific conductance of sampled water was used to monitor gross chemical differences between surface water and pore water during sampling and to identify the presence of drawdown.
In addition to in situ samples, pore water was extracted from sediments in the laboratory by several methods. First, 2-liter (L) bottles were filled with sediments and topped off with stream water from the sample station. These samples were allowed to age or equilibrate in the laboratory for 28 days, at which point water was drained by gravity from the sediment for analysis. These pore waters are referred to as “equilibrated.” Also, subsamples of the sediments used for pore-water toxicity testing were centrifuged in the laboratory to obtain water for analysis prior to testing; these are referred to as “centrifuged” pore waters. Subsamples of sediment for isolating pore water were centrifuged at about 5,200 revolu-tions per minute (7,000 grams, g) for 15 minutes at 4 degrees Celsius (°C; Ingersoll and others, 1998). Approximately 20 to 50 milliliters (mL) of pore water were used to measure ammonia, and a similar volume of pore water was used to
Study Approach and Methodology 13
measure the other water-quality characteristics. A subsample of about 20 mL of pore water was filtered for dissolved metals analysis using a polypropylene syringe and 0.45-µm pore-size disc cartridge. Lastly, pore water was collected from small dif-fusion samplers (peepers; Brumbaugh and others, 2007) from whole sediment during toxicity testing. The peeper was placed within the sediment in the middle of toxicity testing and deployed for a length of 7 days. Peepers were prepared from nominal 2.5-mL volume polyethylene snap-cap vials in which a 5-millimeter (mm) hole had been cut in the cap using a hole-punch tool. After acid rinsing and soaking in high-purity water, a 0.4-µm pore-size polyether-sulfone membrane was sealed under the cap while the peeper was submerged and then stored in a container of deoxygenated, high-purity water at 4 °C until the peeper was deployed. For each sediment sample, peepers were prepared for in situ pore-water sampling during the 28-day amphipod sediment toxicity tests. (Replicate peeper beakers also contained amphipods that were fed on a daily basis, as described below, for the sediment toxicity beakers.) Upon retrieval, each peeper was rinsed in the test water to remove any visible sediment particles and then was rinsed with a stream of high-purity water. The liquid contents of the peeper were transferred to a 30-mL precleaned low-density polyethylene bottle using an acid-rinsed mini-pipet and then were diluted to 29 mL with 1 percent HNO3.
Pore-water physical properties were measured and chemi-cal data were collected using USGS protocols (USGS, 2006b). Samples were analyzed for major ions and trace elements by the USGS CMERSC Analytical Chemistry Laboratory in Denver, Colo. Major and trace elements were analyzed using ICP-AES and ICP-MS. Mercury was analyzed using CVAF for in situ pore waters. Major anions were analyzed using IC for in situ (collected in the field with a push-point sampler) and equilibrated (aged in the laboratory for 28 days) pore waters. In situ pore-water samples included a less than 0.45-μm filtered (dissolved) sample and an unfiltered (total) sample, and equilibrated pore-water samples included a 0.45-μm filtered dissolved split only. In situ pore-water samples were analyzed for nutrients, alkalinity, and dissolved organic carbon by the USGS National Water Quality Laboratory in Denver, Colo. Alkalinity was determined by titration for equilibrated and centrifuged pore waters in the USGS Eastern Mineral and Environmental Resources Science Center (EMERSC) Laboratory in Reston, Virginia. Centrifuged pore water was analyzed for dissolved organic carbon (DOC) by Engineering Surveys and Services, Columbia, Missouri; ammonia, alkalin-ity, hardness, pH, temperature, and specific conductivity were determined by the USGS Columbia Environmental Research Center (CERC) in Columbia, Mo. An aliquot of each in situ pore-water sample was submitted to the USEPA New England Regional Laboratory in North Chelmsford, Massachusetts, for use in 96-hour toxicity tests using the midge Chironomus dilu-tus (C. dilutus) and the amphipod Hyalella azteca (H. azteca). Methods and results are described in subsequent sections.
Sediment Data
Composite streambed-sediment samples were collected according to USGS protocols (Shelton and Capel, 1994). Samples were collected in areas of deposition that coincided with pore-water sampling locations and analyzed for trace elements, simultaneously extracted metals (SEM), acid volatile sulfide (AVS), grain size, and total organic carbon (TOC). Samples were collected from undisturbed, continu-ously wetted depositional zones in the stream channel. The top 10 cm of streambed sediment were sampled to obtain only the most recently deposited material. Composited samples were collected with 5 to 10 representative subsamples located across the stream channel. Sediments were sieved to a diameter of less than 2 mm. Samples were analyzed for major, minor, and trace elements using a combination of ICP-MS and ICP-AES following acid digestion using a mixture of HCl-HNO3-HClO4-HF. TOC is calculated as the difference between total carbon and carbonate carbon, which were determined using an elemental analyzer and coulometric titration, respectively. Mercury was measured using CVAF, and selenium was measured by hydride generation atomic absorption spectrometry (HG-AAS). The above-mentioned analyses were performed on composite stream sediments by SGS Laboratories in Toronto, Canada, under contract with the USGS CMERSC Analytical Chemistry Services Group in Denver, Colo. Samples were analyzed for simultaneously extracted metals-acid volatile sulfide (SEM-AVS) and grain size by Test America in South Burlington, Vt. Mineralogy was determined with the use of powder x-ray diffraction (XRD) in the USGS EMERSC Laboratory in Reston, Va. The relative amounts of phases in the XRD patterns were estimated using the Siroquant computer program that utilized the full XRD profile in a Rietveld refinement (Taylor and Clapp, 1992). The accuracy of the Siroquant results is about ±5 weight percent.
One grab streambed-sediment sample was collected for chemical and mineralogical characterization. This sample, PKSite1 jar, was analyzed by ICP-AES, following acid diges-tion using a mixture of HCl-HNO3-HClO4-HF, and by HG-AAS in the USGS CMERSC Analytical Chemistry Laboratory in Denver, Colo. Mineralogy was determined with the use of XRD in the USGS EMERSC Laboratory in Reston, Va.
Wetland Data (Sediment Cores, Surface and Pore Waters, Plants)
Sediment cores and surface-water (where present) and pore-water samples were collected within the four wetlands located along Pike Hill Brook. In July of 2007, sediment samples were collected at two depth intervals (0 to 15.2 cm, surface; and 15.2 to 30.5 cm, depth) from the wetlands and analyzed in the field by XRF for copper, iron, lead, and zinc as a preliminary evaluation of the wetland sediment. Of these samples, 23 were dry-sieved to less than 2 mm in diameter and

14 Aquatic Assessment of the Pike Hill Copper Mine Superfund Site, Corinth, Vermont
submitted to SGS Laboratories in Toronto, Canada, under con-tract with the USGS CMERSC Analytical Chemistry Labora-tory in Denver, Colo., and analyzed for major, minor, and trace elements, TOC, and selenium by methods previously described for sediment samples. In addition, samples were analyzed by an elemental analyzer for sulfur and by wavelength dispersive XRF by SGS Laboratories. In August of 2007, sediment cores were collected at 10 wetland sample locations of the organic and clastic sediment layers; core locations were chosen based on preliminary field XRF analyses and targeted sampling the wide range in concentrations found in the wetlands. Core samples were collected to a maximum depth of 1 m through the use of a stainless-steel hand-corer with a transparent cellulose acetate butyrate plastic liner. The coring device worked by creating a partial vacuum that held the sample in place inside the plastic liner. At stations where the root mat of the organic layer was sufficiently thick and the sediments below were substantially saturated such that the partial vacuum would not form inside the coring device, a 20.3-cm-long polyvinyl chloride (PVC) tube was driven into the wetland-sample location, and then the coring device was driven inside the PVC tube. In addition to cores, surface sediments from a depth of 0 to 15.2 cm were collected with a hand-auger and placed in glass jars; surface samples were collected adjacent to the core locations for all cores with the exception of wetland 3-6, at which only core was collected. At two stations (wetland 3-3 and wetland 3-4), cores were collected only between 61 and 91 cm and were composited in glass jars in the field into one sample each. Cores and glass jars were immediately placed on dry ice in the field to freeze the samples until time of analyses. In the laboratory, frozen cores were split into separate samples based on the physical characteristics of the layers within the cores, for example, color or grain size, and then freeze dried. The less than 2-mm size fraction of the sediments from the 10 wetland sample locations were analyzed for major, minor, and trace elements by ICP-MS and ICP-AES following acid digestion using a mixture of HCl-HNO3-HClO4-HF, for TOC using an elemental analyzer (total carbon) and coulometric titration (carbonate carbon), and for selenium by HG-AAS in the USGS CMERSC Analytical Chemistry Laboratory in Denver, Colo. Sediments were analyzed for sulfur using an elemental analyzer and for mineralogy by XRD in the USGS EMERSC Laboratory in Reston, Va. The relative amounts of phases in the XRD patterns were estimated using the Siroquant computer program that utilized the full XRD profile in a Rietveld refinement (Taylor and Clapp, 1992). The accuracy of the Siroquant results is about ±5 weight percent. In addition, sediments were analyzed for SEM-AVS, total sulfide, and grain size by STL Burlington, Colchester, Vt. The SEM-AVS and grain-size analyses were conducted on surface splits collected in glass jars only.
Surface-water samples were collected coincident with cores at stations 3-1, 3-2, and 3-5 using USGS protocols (Wilde and Radtke, 1998; USGS, 2006b). Surface-water samples also were collected at stations 4C and 4E to character-ize the surface-water chemistry coming into and flowing out of
the largest of the four wetlands. Surface-water samples from the wetlands were analyzed as previously described for surface waters from the stream reaches.
In situ pore-water samples were collected coincident with cores at stations 3-1, 3-2, 3-3, 3-4, and 3-5 at depths of 30.5 cm and 60.9 cm using previously described in situ protocols with the push-point sampler (Zimmerman and others, 2005). In situ pore-water samples from the wetlands were analyzed and characterized as previously described for in situ pore waters for the stream reaches.
In October 2007, samples of plants were collected from one wetland at four stations (3-1, 3-2, 3-5, 3-6) and one stream sample station (4C). For trees and shrubs, the leaf material was collected, and for grasses and sedges, leaf and stem material (shoots) were collected. Plant material was examined and prepared for chemical analysis in a USGS EMERSC Labora-tory in Reston, Va. The plant material was placed in glass beakers, submerged and rinsed in tap water, and drained. After repeating the washing sequence three times, the plant materi-als appeared to no longer contain sediment. Next, the plants were submerged and rinsed in deionized water and drained. This process was repeated three times to ensure all sediment was removed. The plant material was then air dried. Class, order, and family of the plant material were identified; plants were collected in the fall and therefore were nonflowering; the genus and species were determined if possible. Plant samples were milled, ashed, digested, and analyzed by ICP-MS (major, minor, and trace elements) and HG-AAS (selenium) by the USGS CMERSC Analytical Chemistry Laboratory in Denver, Colo.
Macroinvertebrate Data
Macroinvertebrate samples coincide with water-chemistry sampling locations and were collected at locations along Pike Hill Brook and the tributary to Cookville Brook that were downstream from the Pike Hill copper mines; macroinvertebrate samples also were collected at one station in the Cookville Brook basin upstream from the influence of the mines (station 10D), in an area that was designated as a biological reference sampling location. Samples were also collected from reference station 5A on a tributary to Pike Hill Brook; however, the macroinvertebrate community was disturbed due to non-mine-related stressors, and therefore the location was sampled but not used as a reference station. The procedures in the USGS protocols for collecting biological samples (Moulton and others, 2002) were followed with some minor modifications described below that were based on State of Vermont protocols (VTDEC, 2006). Because this study was designed to characterize the nature and extent of impacts from the Pike Hill copper mines within the aquatic system, two different types of invertebrate samples were collected, each of which was specific to the habitat being sampled. The first of these samples was from areas representative of riffle-targeted habitat (RTH) to characterize the effects of
Study Approach and Methodology 15
contaminants in surface water on the epifaunal invertebrate community. The second of these samples was from areas representative of a depositional targeted habitat (DTH), such as pools, to characterize the effects of contaminants in depositional sediments and interstitial pore water on the infaunal invertebrate community.
During September 2007, at 9 of the 12 stream locations, RTH and DTH samples were closely paired to assess the condition of the epifaunal (RTH) and infaunal (DTH) inver-tebrate assemblage; at 4 stream locations only DTH samples were collected. RTH samples were also collected at some Pike Hill sampling locations in 2005, which are described in Kiah and others (2007). Where an RTH sample was collected at a location in both years, the data from 2007 are used in this report; however, if an RTH sample was collected only in 2005 at a location, these earlier data are used in this report to more fully characterize the extent of stream impairment. The State of Vermont Bioassessment Program uses epifaunal assemblage data collected from riffle areas as the basis for stream assessments in lotic habitats (VTDEC, 2006). The USEPA Superfund program is also concerned with ecological impacts to infauna in the depositional areas because contaminated sediments tend to collect in the slow-flowing areas, and such areas can serve as secondary sources, releasing accumulated contaminants during periods of high discharge.
RTH samples were collected using a Slack sampler with a 500-μm mesh designed to cover 0.25 square meter (m2) of substrate area (Moulton and others, 2002). At each location, invertebrates were collected at four locations in a swift-flowing area of a sampling reach, and these four samples were composited to represent the invertebrate assemblage on a 1-m2 area of substrate. Although the USGS protocol specifies a composite from five locations (1.25 m2), the change to four locations was made so that the assemblage data would conform to the method used by the VTDEC for high-gradient streams (VTDEC, 2006) and therefore be amenable to the bioassessment procedures used by VTDEC.
DTH samples of infaunal invertebrates were collected with a PVC coring device designed to sample the top 10 cm of sediment in an area of approximately 100 cm2. In a depo-sitional area of a sampling location, sediments were sampled at five locations, which were then composited to represent the infaunal assemblage on a 500-cm2 area of substrate. Sediment samples were collected by pushing the coring device into the sediment and then working a mason’s trowel through the sediment to close off the bottom.
Samples were preserved in 70 percent isopropanol and shipped to EcoAnalysts, Inc., Moscow, Idaho, where a minimum of 300 individuals or 25 percent of the sample was counted and identified for each sample. EcoAnalysts provided taxonomic identification and calculation of metrics of abun-dance, dominance, richness, composition, functional feeding groups, and diversity/evenness. These metrics are typically used as “ecological indicators” to help assess the degree of impairment at stream sampling locations. Total richness (number of species) and total abundance (number of individual
organisms) are two metrics that respond to toxic conditions; therefore, they were used extensively to characterize the relative degree of impairment among sampling locations. The RTH data also were provided to VTDEC so that the agency could base a biological assessment on the data and determine the extent of impairment to the streams.
Fish Assemblage Data
Fish assemblages were surveyed in the field following USGS protocols (Crawford and Luoma, 1993; Moulton and others, 2002). An electrofishing backpack unit was used to capture fish along a 100-m reach at five stations downstream from mine drainage on Pike Hill Brook (4A, 4C, 4E, 5, and 6) and two stations downstream from mine drainage on the tributary to Cookville Brook (10, 10C), as well as one refer-ence location in the Cookville Brook basin (10D). No fish were found at locations on Pike Hill Brook above station 4A. Fish were weighed, measured, and released, except for those specimens used for tissue sample analysis of trace-element concentrations.
An evaluation of the fish community was conducted on the basis of an Index of Biotic Integrity (fish IBI) that is used by the State of Vermont and is derived from compiled scores of metrics that relate to the community structure and function. The fish IBI was developed by the State of Vermont to be used in streams with certain characteristics associated with watershed size and channel gradient, and several of the loca-tions surveyed for this study did not meet all criteria (Richard Langdon, VTDEC, written commun., 2011). For example, the Cookville Brook reference sampling location (10D) was a very low gradient wetland location, and the IBI was not specifically developed to accurately assess this type of flow condition and habitat. In these types of cases, the Vermont State biologist made a best professional judgment as to whether or not such a location met, on the basis of the fish community data, the Vermont Class B water-quality standards.
Fish Tissue Data
Blacknose dace (BND) and brook trout (BKT) were the target species collected at the sampling locations for determin-ing the concentrations of metals in their tissue. Composites of five or more whole fish comprised a BND sample, whereas the BKT were analyzed as whole single fish. Fish tissue samples were freeze dried, water loss during drying was measured, and samples were analyzed for major ions and trace elements using ICP-MS by the USGS CMERSC Analytical Chemistry Laboratory in Denver, Colo. Although the concentrations of many trace elements were determined in the analysis, only cadmium, copper, and zinc concentrations are discussed in detail for fish tissue because these are well documented to be associated with the ore deposit and were identified as contami-nants of potential concern at the nearby Ely Copper mine and Elizabeth mine. Where more than one fish tissue sample was
16 Aquatic Assessment of the Pike Hill Copper Mine Superfund Site, Corinth, Vermont
collected at a station, values were averaged to determine a single concentration.
Toxicity Tests
Toxicity tests were performed on samples of whole-sediment and pore-water samples collected from the Pike Hill copper mine study area. Samples were collected at 13 locations in October of 2007. The toxicity of whole sediments was evaluated by two separate laboratories. The USGS CERC in Columbia, Mo., conducted 28-day whole-sediment exposures with the amphipod H. azteca and 10-day whole-sediment exposures with the midge C. dilutus, with endpoints of survival for both species, growth in length of H. azteca, and growth in ash-free dry weight of C. dilutus. Tests were conducted according to standard methods for conducting whole-sediment toxicity tests (USEPA, 2000; ASTM, 2010) using 300-mL beakers containing 100-mL sediment and 175-mL overlying water at 23 ± 1 °C. Tests with each of the Pike Hill copper mine study area sediments and one control sediment from West Bearskin Lake, Minnesota (Ingersoll and others, 1998), had 8 replicate chambers for each species, with 10 organisms in each chamber. Overlying water in test chambers was well water diluted with deionized water to a target hardness of 100 milligrams per liter (mg/L) as CaCO3. Overlying water in test chambers was renewed by an auto-matic water delivery system to deliver two volume additions per day. Water quality of overlying water was monitored biweekly.
Whole-sediment toxicity tests were also conducted by the USEPA Office of Environmental Measurement and Evaluation (OEME) Laboratory in North Chelmsford, Mass. Tests were performed by contractors at the OEME Laboratory (TechLaw, 2008a). These tests consisted of 10-day exposures with H. azteca with endpoints of survival and growth (dry weight) based on USEPA methods (USEPA, 2000). Eight replicates containing 10 organisms each were used for sediment samples and the control sediment, which was a mixture of sand, aspartic acid, calcium carbonate, alpha cellulose, and humic acid. Tests consisted of 300-mL exposure chambers containing about 100 mL of sediment and overlying water with a hard-ness of 90 mg/L as CaCO3. Room temperature was maintained at 23 ± 1 °C. Overlying water was renewed by an automatic water delivery system twice daily based on dissolved oxygen readings. Water-quality parameters including temperature, pH, and conductivity, among others, was monitored daily.
The toxicity of pore water was tested by TechLaw (2008b). Pore-water samples for toxicity testing were extracted from sediment using a push-point sampler as previously described. Aliquots of each sample were analyzed by the USGS CMERSC Analytical Chemistry Laboratory in Denver, Colo. The toxicity of the pore water was evaluated using 96-hour exposures with H. azteca and C. dilutus, with endpoints of survival for both species. Ten replicates of each
pore-water sample and the laboratory control were tested. The laboratory control water had a hardness of 90 mg/L as CaCO3.
Toxicity testing results of pore water and whole sediment reported by TechLaw (2008a, b) refer to station 10A as the reference for the Pike Hill study area. Although testing revealed relatively good survival and growth of test species, this location does receive some drainage from mine-impacted areas and was not included as a reference station in this report.
Quality-Control Procedures
Field and laboratory quality-control procedures for samples collected in August and October of 2007 included the collection of blanks and replicates for surface- and pore-water samples and replicates for sediment samples. In order to ensure quality data reporting, a Quality Assurance Project Plan was developed and followed for this study (J.R. Deacon and R.R. Seal II, USGS, unpub. data, 2007). Quality-control data for all media are presented in appendixes 2, 3, and 4. Field and laboratory blanks provide information on bias or the potential for contamination of analytical results by sample collection, processing, and analysis (Spahr and Boulger, 1997). Con-centrations of most constituents discussed in this report were below detection limits for the blank samples. However, Al, Be, Co, Fe, K, Li, Mn, Na, Pb, or Zn was detected in at least one of the field-blank samples. Concentrations reported in the field-blank samples were commonly at or near the reporting level and at least one order of magnitude below the concentra-tions measured in the environmental samples from the site. An exception was one concentration of zinc at 7.6 micrograms per liter (μg/L) that is significant when compared to zinc-poor environmental samples. The following elements were detected in laboratory blanks for centrifuged and peeper pore waters by ICP-MS: Al, Ce, K, Li, Mn, Na, Rb, sulfate, Ta, and Zn. The concentrations of sulfate and zinc are significant when compared to environmental samples from the site.
Field-replicate samples provide information on the variability of results (Spahr and Boulger, 1997). Analytical laboratory quality-control procedures are summarized in Tag-gart (2002). The absolute difference between an environmental and replicate water-sample pair for elements discussed in this report ranged from 0 to 2,000 μg/L. Absolute differences greater than 1.0 µg/L occurred more frequently (58 percent) for elements that had concentrations greater than 50 µg/L. To normalize for the range in magnitudes of concentrations and to evaluate differences in the variability of elements, the relative percent difference for each element was determined. Generally, the median relative percent difference for an element was higher in the unfiltered samples as compared to the filtered samples. The median relative percent difference for most elements ranged from 0 to 17 percent. Lead and aluminum had higher median relative percent differences at 40 and 78 percent, respectively. The absolute differences between replicate pairs for lead, however, were all less than
Study Approach and Methodology 17
0.2 μg/L. The absolute difference between replicate pairs for aluminum ranged from 1 to 391 μg/L. The two highest absolute differences in replicate pairs for aluminum were from a filtered surface-water replicate pair collected at station 10A (178 μg/L) and from an unfiltered pore-water replicate pair collected at station 4C (391 μg/L). The surface-water replicate from station 10A also had larger disparities between the environmental sample and replicate sample for copper, iron, manganese, and zinc, as compared with all other replicate pairs. Similarly, the pore-water replicate sample from station 4C had large disparities between the environmental sample and the replicate sample for the same elements when compared to other replicate pairs. Large differences within replicate pairs can result from cross-contamination, either in the field or at the laboratory. For in situ pore-water samples, differences may be due to variations in the effective area sampled with repeated pore-water extractions. Because concentrations of Al, Cu, Fe, Mn, and Zn at the Pike Hill Copper Mine Superfund site can be exceptionally elevated, the opportunity for cross-contamination may increase. The extent to which this high variability in the aluminum results has affected the overall interpretation of the aluminum data cannot be fully known; however, comparisons with the ratio of aluminum concentrations with different elements (Ba, Ca, Cl, Cu, K, Mg, Mn, Na, Zn, and sulfate) were used to help evaluate the potential effect. Selected results from data in Kiah and others (2007) and Piatak and others (2006b) and from this study were used to compute the ratios between aluminum and other elements. Evaluation of these data did show that nearby stations tended to have similar ratios between elements for both surface-water and pore-water samples. This analysis indicated that overall data from this study were consistent with previous studies and that the data were suitable for interpreta-tion. A comparison of the ratios between elements from the surface-water replicate collected at station 10A indicates that the results from the replicate sample were more similar to ratios determined at nearby locations; therefore, data from the replicate sample were used for analysis. Similar analysis of the ratios between aluminum and other elements showed that the pore-water environmental sample collected at station 4C was more similar to results from nearby locations; therefore, data from the environmental sample were used in the analysis.
Concentrations at four stations (5A, 10D, 10, and 10C) for cadmium, copper, and zinc were higher in the filtered sample than in the total sample. However, all of these concentrations were low and some were at the detection limit. These variations in reported concentrations were determined to be within analytical error for the element (Lamothe and others, 2002).
USGS (T-135, T-137, M-150, M-158) and commercial (Q118) reference waters were submitted along with surface and pore waters for chemical analyses (appendix 2). Sediment from West Bearskin Lake, Minn. (WB), was used as a control for the toxicity test by USGS CERC; pore water for chemical analysis was extracted from peepers in the test chamber
(WB-P), and centrifuged pore water was extracted from this sediment at the start of the sediment toxicity tests (WB-C).
Data Analysis and Statistical Methods
Results from this study for samples collected in 2007 are presented in the following sections and are shown as a series of graphs and plots used to analyze the data. For samples collected for this study where multiple analytical methods were used, preference was given to the method with the lower reporting limit with the exception of calcium and silica in surface and pore water. There was a nearly perfect correlation between the ICP-MS and ICP-AES results; the ICP-MS results were used in summary tables and for data analysis for all elements except iron.
Chronic ambient water-quality criteria for the protection of aquatic biota in freshwater, referred to here as Water-Quality Criteria (WQC), were used to compare trace-element concentrations in water; a chronic criterion, or criterion continuous concentration, is an estimate of the highest concentration of a material in surface water to which an aquatic community can be exposed indefinitely without resulting in an unacceptable effect; aquatic life criteria are guidelines intended to protect the majority of aquatic communities (USEPA, 2009). The criteria used in this report include USEPA’s national recommended water-quality criteria (NRWQC; USEPA, 2009) and, if NRWQC are not available, Tier II secondary chronic values, summarized in Suter (1996). NRWQC were used for interpretation of Al, As, Cd, Cr, Cu, Fe, Pb, Hg, Ni, Se, and Zn concentrations in water (USEPA, 2009). Aluminum and iron are non-priority pollutants, whereas the other elements are priority pollutants (USEPA 2009). Criteria are for dissolved concentrations (filtered water splits), which are commonly considered to be the fraction likely to cause biological impairment. The exception is aluminum, for which the criterion is for the total recoverable concentration (USEPA, 2009). The chronic criteria for Cd, Cu, Pb, Ni, and Zn were adjusted based on hardness according to USEPA (2009). Hardness values for samples in this report were calculated from concentrations of calcium and magnesium and converted to equivalent concentration of CaCO3 (in milligrams per liter). Tier II secondary chronic values were used for analysis of dissolved concentrations of Sb, Ba, Be, Co, Mn, Ag, Sr, Tl, U, and V (Suter, 1996). Tier II values are derived using toxicity data for fewer aquatic taxa than the NRWQC and, therefore, are less robust predictors of possible toxicity; however, they are commonly used to evaluate elements for which NRWQC are not available.
The freshwater copper criterion is the only element to have its hardness-dependent NRWQC superseded by aquatic criteria based on the Biotic Ligand Model (BLM; USEPA, 2007). The formula used to calculate the hardness-dependent NRWQC is still given in an appendix in USEPA (2009) but has officially been replaced by the criteria calculated by the BLM (USEPA, 2007). Therefore, for initial evaluation of
18 Aquatic Assessment of the Pike Hill Copper Mine Superfund Site, Corinth, Vermont
water quality presented in the “Nature and Extent of Contami-nation” section, the hardness-dependent NRWQC for copper is used. In the “Discussion” section, the hardness-dependent NRWQC results are compared to the BLM criteria results. BLM criteria are used to predict metal bioavailability and tox-icity incorporating metal speciation and the protective effects of competing cations (Di Toro and others, 2001; USEPA, 2007). The model requires input of various water-quality parameters and was developed using published information on metal toxicity and biotic ligand accumulation as a function of water chemistry; the model therefore has a range of param-eters for which it has been developed and calibrated. Some parameters for waters collected in the Pike Hill copper mine study area were minimally outside of this range.
The potential toxicity hazard of metals in sediments can be assessed by comparing concentrations of toxic metals in sediments to effects-based sediment-quality guidelines. Two sediment-quality guidelines were evaluated: (1) empirical probable effects concentrations (PECs; MacDonald and others, 2000) and (2) equilibrium-partitioning sediment benchmarks (ESB; Di Toro and others, 2005; USEPA, 2005). PECs were compared to total trace metal concentrations in stream and wetland sediments to estimate hazards from Cd, Cu, Pb, Ni, and Zn (MacDonald and others, 2000). The PEC for each chemical represents a concentration, based on laboratory toxicity tests from many sites, above which harmful effects to sediment-dwelling organisms are likely to be observed more often than not in field-collected sediment samples (MacDonald and others, 2000). The ESB index is defined as the molar difference between the combined simultaneously extracted metals (SEM) and the acid volatile sulfide (AVS), normalized to the mass fraction of organic carbon (fOC; [ΣSEM-AVS]/fOC; Di Toro and others, 2005; USEPA, 2005). A conservative approach was used to calculate the ESB index for samples in this study with AVS or SEM values that were less than detec-tion (for example, the biologically available fraction of metals was overestimated). For metals with SEM values reported as less than the detection limit, the detection limit was used in SEM summation calculations (ΣSEM). For samples with AVS reported as less than the detection limit, an AVS value of zero was used to compute the ESB index. ESB index values of less than 130 micromoles per gram of organic carbon (µmol/gOC) are in the range of unlikely toxic effects, whereas 130 to 3,000 µmol/gOC are within the uncertain effects range, and a value greater than 3,000 µmol/gOC is predicted to cause toxic effects (Di Toro and others, 2005; USEPA 2005).
Toxicity hazards of stream water, pore water, and whole sediment were evaluated using the hazard-quotient and hazard-index methods (USEPA, 1986). The hazard quotient is a ratio of the measured trace element concentration in water or in sediment to the chronic water-quality criterion or sediment-quality guideline for that element. Trace elements with a hazard quotient greater than 1.0 are assumed to be potentially toxic to aquatic communities. The hazard index is a sum of the hazard quotients for multiple toxic elements at each location and is used to describe the potential cumulative toxic
effect on aquatic communities; a hazard index greater than 1.0 is assumed to be potentially toxic to aquatic communities. Cadmium, copper, lead, nickel, and zinc were used to calculate a hazard index in this report because of their concentrations in the water and sediment, their inclusion in the simultaneously extracted metals fraction, and their toxicity to aquatic biota. As previously mentioned, in addition to the hardness-based hazard quotient for copper, an aqueous hazard quotient was calculated using the copper concentrations in the sample compared to the BLM calculated chronic criteria value.
Water-quality data were examined within and among stream reaches and background locations through the use of box plots and scatter graphs. Analyses of instantaneous constituent loads from surface-water samples were conducted to investigate the origin and transport of potential contami-nants at the Pike Hill copper mine study area. Results below the laboratory detection limit were used at the detection limit to assume the maximum possible concentrations; however, results were identified as “not detected” (ND) on graphs and figures. For the computation of instantaneous loads, the detection limit concentration was used to provide an estimate of the highest possible load. Graphs depicting instantaneous loads estimated from undetected values were expressed as a dashed line between stations, modified from Helsel (2005). The Spearman’s rank-correlation test was used to determine the strength of association between water-chemistry variables (Helsel and Hirsch, 1992). The level of significance was set at alpha equals 0.05. Water-chemistry data were analyzed using Statview (version 5.0.1) and SAS statistical software (version 8.02; SAS Institute, Inc., 1999, 2002).
The RTH invertebrate and fish survey data were provided to the VTDEC Water Quality Division, which analyzed the data as specified in their bioassessment protocols for wadeable streams and rivers (VTDEC, 2004) to determine the extent of impairment to the locations. The assessment of the ecological condition of a location was based on how the invertebrate or fish assemblage scored among several metric categories that characterized assemblage structure and function. A fish-assemblage assessment was indicated numerically from an index of biotic integrity (IBI), which was based on compiled scores of the individual structure and function metrics. Assessments based on RTH invertebrate assemblages did not rely on an IBI, but instead, each of eight metrics was scored against threshold values for “pass,” “fail,” or “intermediate”; the comprehensive assessment for each location is then based on a compilation of the eight qualitative scores. Depending on how the invertebrate assemblage scored over the eight metrics, or how the fish assemblage scored with the IBI, the assessment was qualitatively summarized as “poor,” “fair,” “good,” “very good,” or “excellent,” and this summary is pertinent to Vermont Class B water-quality standards (VTDEC, 2004). At the time of this study, VTDEC did not have an established protocol for assessing stations with DTH invertebrate data.
Differences in invertebrate assemblages also were mea-sured over stream and contaminant gradients, but assemblage characterizations were not based on a common IBI because
Nature and Extent of Contamination 19
different types of samples were collected (RTH, DTH) and the VTDEC bioassessment procedure of a qualitative ranking only applied to the RTH samples. The assessment for the RTH samples did not derive a single IBI for direct comparison but used a qualitative ranking. Therefore, two of the eight metrics used in bioassessments by VTDEC were used to characterize the biological condition of the sampling locations: invertebrate abundance and richness (total number of individuals and total number of taxa). Values of these two metrics were determined for all of the invertebrate sample types (RTH, DTH) to serve as a common baseline for comparison of all locations. When comparing changes in invertebrate assemblages across sampling locations, the reference baseline was the invertebrate abundance and richness values from a location that appeared to be outside the influence of mine drainage (10D).
Fish-tissue data were compared to the critical body residue (CBR) for Cd, Cu, Ni, Se, and Zn (for site specific values, see next paragraph). For a particular fish species, a CBR is a literature-based benchmark that represents a metal concentration in the tissue at which adverse effects have been observed (effects level) or below which an adverse effect was not observed (no observable effects level). In this study, the CBRs were based only on literature values for no-effects and effects levels in salmonids, because brook trout (a salmonid) is a species of special interest in the waterways affected by the Pike Hill copper mines and also because no relevant data were found for blacknose dace or any other cold-water cyprinid. The salmonid CBR values were compared to metal concentra-tions in the samples of single brook trout. However, brook trout were only captured at two stations (10 and 10D), whereas blacknose dace were captured at all eight fish-survey stations. Thus, the brook trout CBR values were also compared to those for the composite samples of blacknose dace to provide a more comprehensive view of the study area.
Cadmium, copper, and zinc were the elements of concern in fish tissue because of their abundance at the site, and these concentrations were compared to the CBR values. The CBR for copper in salmonids used in this study was 2.4 micrograms per gram (µg/g), wet weight, and represents the copper concentration at which a response is observed (effects level). The copper CBR was based on findings by Kamunde and others (2005) and Hansen and others (2002). The CBR for cadmium and zinc in salmonids, 0.10 and 16.4 µg/g, wet weight, respectively, represents the concentrations below which a response is not observed (no observable effects level; the effects level was not reported for zinc, and the effects level for cadmium is 0.29 µg/g; Kumada and others, 1973; Benoit and others, 1976; Farmer and others, 1979; Holcombe and others, 1979; Sangalang and Freeman, 1979; Calamari and others, 1982; Rombough and Garside, 1982; Pascoe and others, 1986; Hamilton and others, 1987a, b; Handy, 1992; Brown and others, 1994). These CBRs, based on literature values for no-effects and effects levels, were developed for use at the Ely mine (Seal and others, 2010) and are applicable to the Pike Hill copper mine site as well.
Data from whole-sediment toxicity tests by USGS CERC were analyzed by SAS/STAT software (version 9.2; SAS Institute, Inc., 2008). Toxicity data were transformed to ranks before analysis of variance (ANOVA) testing (Conover and Iman, 1981). Overall, ANOVA tests were conducted to determine whether test endpoints differed significantly among all sediments tested (rho < 0.05). For endpoints with signifi-cant overall ANOVA tests, Tukey’s test was used to compare means from reference locations with means from locations downstream from mining.
Toxicity data for tests conducted on whole sediment and in situ pore water by TechLaw (2008a, b) were analyzed using several tests. Statistical analyses of toxicity data were conducted using Comprehensive Environmental Toxicity Information System (CETIS) according to a USEPA decision tree (USEPA, 2000). Data from sediment toxicity tests were first compiled and analyzed using the Shapiro-Wilk W test to check for normality of data and Bartlett’s test to check for homogeneity of variance. Data with normal distribution and homogeneous variance were analyzed using Dunnett’s multiple comparison test. Non-normal and (or) heterogeneous data were analyzed using Steel’s Many-One Rank test. All of the statistical tests mentioned above were used when appropri-ate to determine if there was a significant difference between the site samples and reference samples (TechLaw, 2008a). Data from pore-water toxicity tests were analyzed by several statistical tests. The C. dilutus survival data were analyzed using the Fisher Exact/Bonferroni-Holm test to determine if a significant difference existed between the reference and the site samples. The H. azteca survival data were analyzed using a Bartlett’s test to check for homogeneity of variance, and Shapiro-Wilk W test to check for normality. The results of these tests indicated that the dataset was not normally distributed. Steel’s Many-One Rank test was used to determine if a significant difference existed between the mine site and reference samples (TechLaw, 2008b).
Nature and Extent of ContaminationAcid-mine drainage occurs when sulfide-bearing waste
rock and tailings come in contact with waters containing dissolved oxygen. The resulting oxidation reactions release associated metals and acidity, which may impact the biological community and significantly lower the pH of downstream waterways. Released metals that are transported downstream may be removed from solution through precipitation of and sorption onto iron and manganese hydroxides (Harvey and Fuller, 1998; Tonkin and others, 2004). Attenuation of metals also has been attributed to precipitation and sorption within the hyporheic zone as contaminated waters infiltrate and mix with shallow groundwater (Harvey and Fuller, 1998; Fuller and Harvey, 2000).
Waste-rock piles at the Pike Hill copper mine study area have similar mineralogy and chemistry and leach comparable metal concentrations and acidity to those observed at the
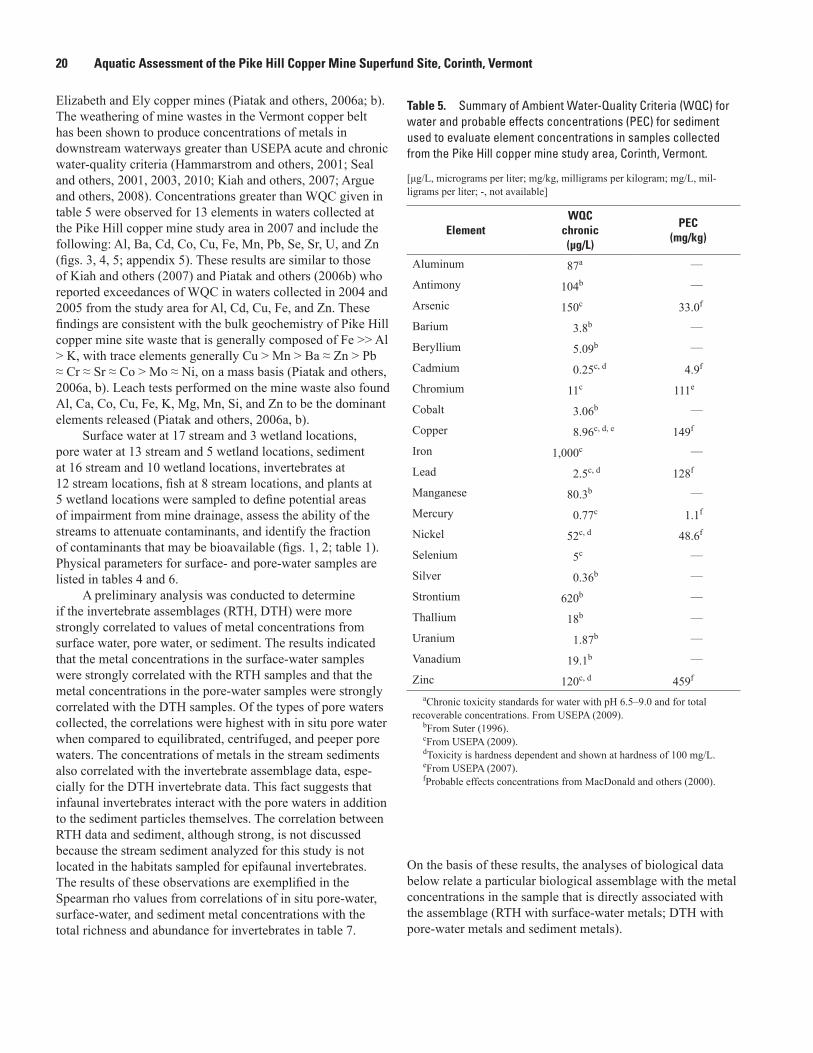
20 Aquatic Assessment of the Pike Hill Copper Mine Superfund Site, Corinth, Vermont
Elizabeth and Ely copper mines (Piatak and others, 2006a; b). The weathering of mine wastes in the Vermont copper belt has been shown to produce concentrations of metals in downstream waterways greater than USEPA acute and chronic water-quality criteria (Hammarstrom and others, 2001; Seal and others, 2001, 2003, 2010; Kiah and others, 2007; Argue and others, 2008). Concentrations greater than WQC given in table 5 were observed for 13 elements in waters collected at the Pike Hill copper mine study area in 2007 and include the following: Al, Ba, Cd, Co, Cu, Fe, Mn, Pb, Se, Sr, U, and Zn (figs. 3, 4, 5; appendix 5). These results are similar to those of Kiah and others (2007) and Piatak and others (2006b) who reported exceedances of WQC in waters collected in 2004 and 2005 from the study area for Al, Cd, Cu, Fe, and Zn. These findings are consistent with the bulk geochemistry of Pike Hill copper mine site waste that is generally composed of Fe >> Al > K, with trace elements generally Cu > Mn > Ba ≈ Zn > Pb ≈ Cr ≈ Sr ≈ Co > Mo ≈ Ni, on a mass basis (Piatak and others, 2006a, b). Leach tests performed on the mine waste also found Al, Ca, Co, Cu, Fe, K, Mg, Mn, Si, and Zn to be the dominant elements released (Piatak and others, 2006a, b).
Surface water at 17 stream and 3 wetland locations, pore water at 13 stream and 5 wetland locations, sediment at 16 stream and 10 wetland locations, invertebrates at 12 stream locations, fish at 8 stream locations, and plants at 5 wetland locations were sampled to define potential areas of impairment from mine drainage, assess the ability of the streams to attenuate contaminants, and identify the fraction of contaminants that may be bioavailable (figs. 1, 2; table 1). Physical parameters for surface- and pore-water samples are listed in tables 4 and 6.
A preliminary analysis was conducted to determine if the invertebrate assemblages (RTH, DTH) were more strongly correlated to values of metal concentrations from surface water, pore water, or sediment. The results indicated that the metal concentrations in the surface-water samples were strongly correlated with the RTH samples and that the metal concentrations in the pore-water samples were strongly correlated with the DTH samples. Of the types of pore waters collected, the correlations were highest with in situ pore water when compared to equilibrated, centrifuged, and peeper pore waters. The concentrations of metals in the stream sediments also correlated with the invertebrate assemblage data, espe-cially for the DTH invertebrate data. This fact suggests that infaunal invertebrates interact with the pore waters in addition to the sediment particles themselves. The correlation between RTH data and sediment, although strong, is not discussed because the stream sediment analyzed for this study is not located in the habitats sampled for epifaunal invertebrates. The results of these observations are exemplified in the Spearman rho values from correlations of in situ pore-water, surface-water, and sediment metal concentrations with the total richness and abundance for invertebrates in table 7.
Table 5. Summary of Ambient Water-Quality Criteria (WQC) for water and probable effects concentrations (PEC) for sediment used to evaluate element concentrations in samples collected from the Pike Hill copper mine study area, Corinth, Vermont.
[μg/L, micrograms per liter; mg/kg, milligrams per kilogram; mg/L, mil-ligrams per liter; -, not available]
ElementWQC
chronic (μg/L)
PEC (mg/kg)
Aluminum 87a —
Antimony 104b —
Arsenic 150c 33.0f
Barium 3.8b —
Beryllium 5.09b —
Cadmium 0.25c, d 4.9f
Chromium 11c 111e
Cobalt 3.06b —
Copper 8.96c, d, e 149f
Iron 1,000c —
Lead 2.5c, d 128f
Manganese 80.3b —
Mercury 0.77c 1.1f
Nickel 52c, d 48.6f
Selenium 5c —
Silver 0.36b —
Strontium 620b —
Thallium 18b —
Uranium 1.87b —
Vanadium 19.1b —
Zinc 120c, d 459f
aChronic toxicity standards for water with pH 6.5–9.0 and for total recoverable concentrations. From USEPA (2009).
bFrom Suter (1996).cFrom USEPA (2009).dToxicity is hardness dependent and shown at hardness of 100 mg/L.eFrom USEPA (2007).fProbable effects concentrations from MacDonald and others (2000).
On the basis of these results, the analyses of biological data below relate a particular biological assemblage with the metal concentrations in the sample that is directly associated with the assemblage (RTH with surface-water metals; DTH with pore-water metals and sediment metals).
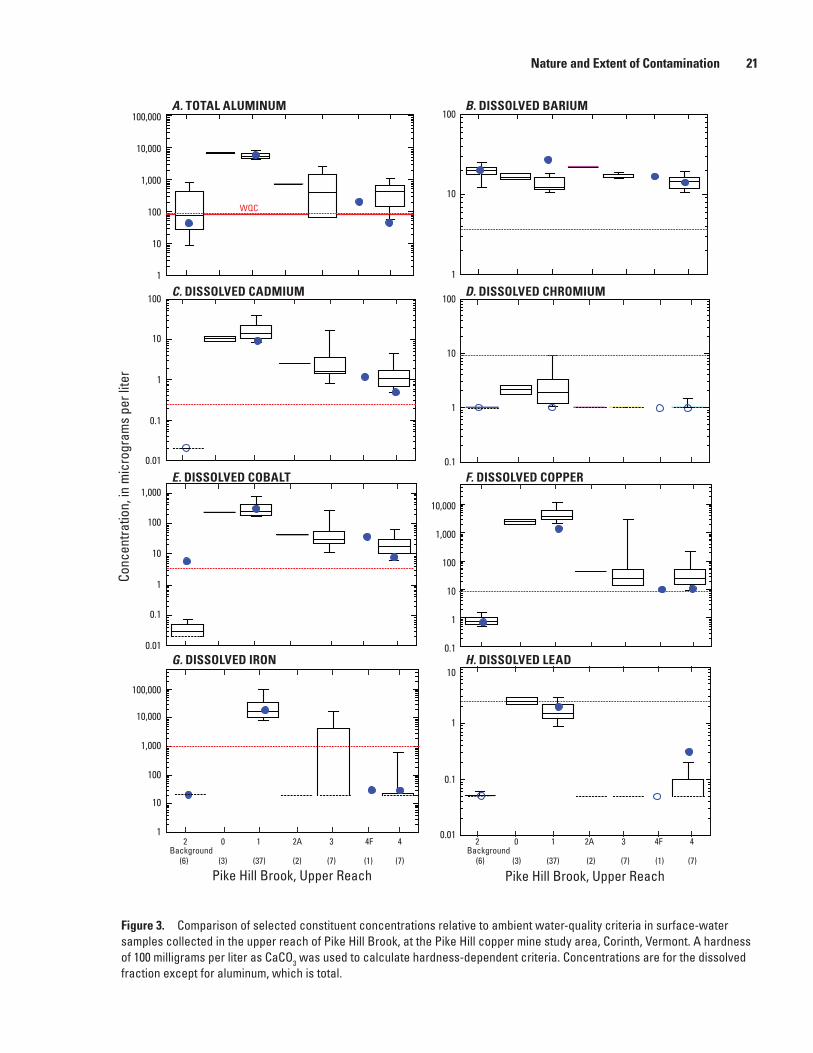
Nature and Extent of Contamination 21
B. DISSOLVED BARIUM
C. DISSOLVED CADMIUM
E. DISSOLVED COBALT
D. DISSOLVED CHROMIUM
F. DISSOLVED COPPER
Conc
entra
tion,
in m
icro
gram
s pe
r lite
r
Pike Hill Brook, Upper Reach
H. DISSOLVED LEADG. DISSOLVED IRON
Background(7)(6) (3) (37) (2) (7) (1)
42 0 1 2A 3 4F 42 0 1 2A 3 4F
(7)(6) (3) (37) (2) (7) (1) Background
A. TOTAL ALUMINUM
WQC
Pike Hill Brook, Upper Reach
100,000
10,000
1,000
100
10
1
10,000
1,000
100
10
1
0.1
100
10
1
0.1
100
10
1
100
10
1
0.1
0.01
100
10
1
0.1
0.01
1,000
100,000
10,000
1,000
100
10
1
10
1
0.1
0.01
Figure 3.Figure 3. Comparison of selected constituent concentrations relative to ambient water-quality criteria in surface-water samples collected in the upper reach of Pike Hill Brook, at the Pike Hill copper mine study area, Corinth, Vermont. A hardness of 100 milligrams per liter as CaCO3 was used to calculate hardness-dependent criteria. Concentrations are for the dissolved fraction except for aluminum, which is total.
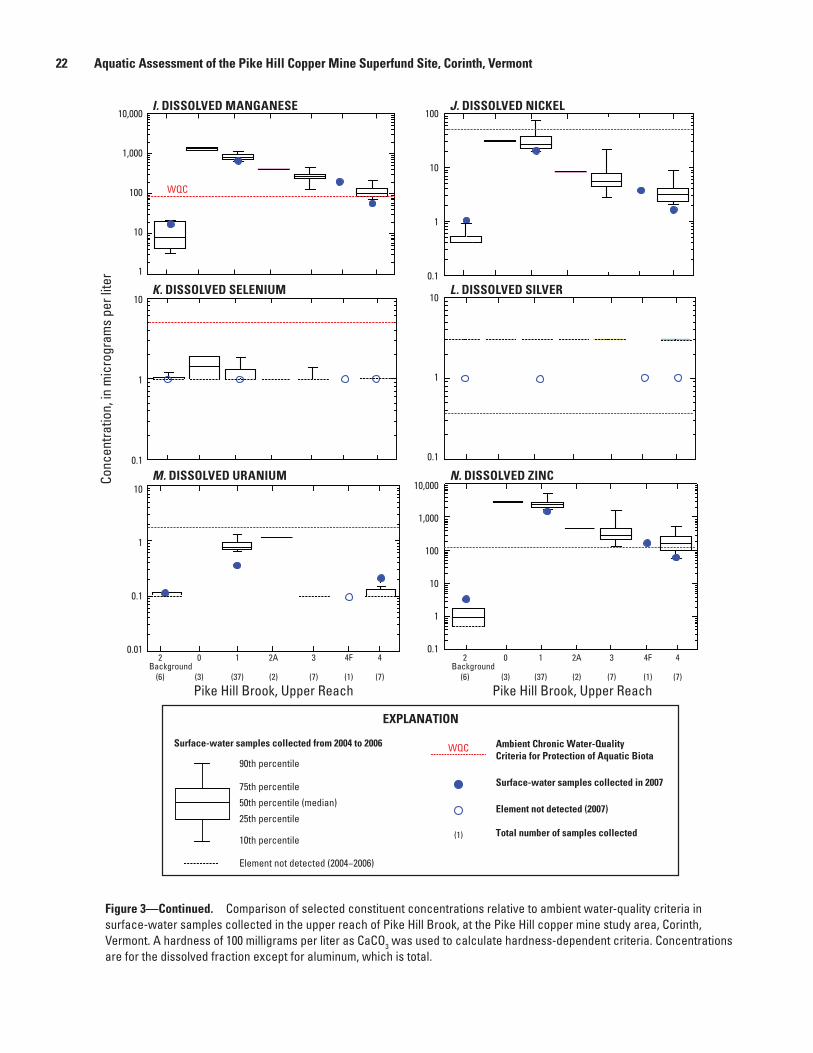
22 Aquatic Assessment of the Pike Hill Copper Mine Superfund Site, Corinth, Vermont
L. DISSOLVED SILVER
M. DISSOLVED URANIUM
I. DISSOLVED MANGANESE
K. DISSOLVED SELENIUM
Background Background
J. DISSOLVED NICKEL
N. DISSOLVED ZINC
Pike Hill Brook, Upper Reach Pike Hill Brook, Upper Reach
Conc
entra
tion,
in m
icro
gram
s pe
r lite
r10,000
1,000
100
10
1
10
1
0.1
10
1
0.1
0.01
100
10
1
0.1
10
1
0.1
1,000
100
10
1
0.1
10,000
WQC
(7)(6) (3) (37) (2) (7) (1)
42 0 1 2A 3 4F 42 0 1 2A 3 4F
(7)(6) (3) (37) (2) (7) (1)
Figure 3. (cont.)
EXPLANATION
Ambient Chronic Water-Quality Criteria for Protection of Aquatic Biota
WQC
Surface-water samples collected in 2007
(1) Total number of samples collected
90th percentile
25th percentile
75th percentile
50th percentile (median)
10th percentile
Surface-water samples collected from 2004 to 2006
Element not detected (2004−2006)
Element not detected (2007)
Figure 3—Continued. Comparison of selected constituent concentrations relative to ambient water-quality criteria in surface-water samples collected in the upper reach of Pike Hill Brook, at the Pike Hill copper mine study area, Corinth, Vermont. A hardness of 100 milligrams per liter as CaCO3 was used to calculate hardness-dependent criteria. Concentrations are for the dissolved fraction except for aluminum, which is total.
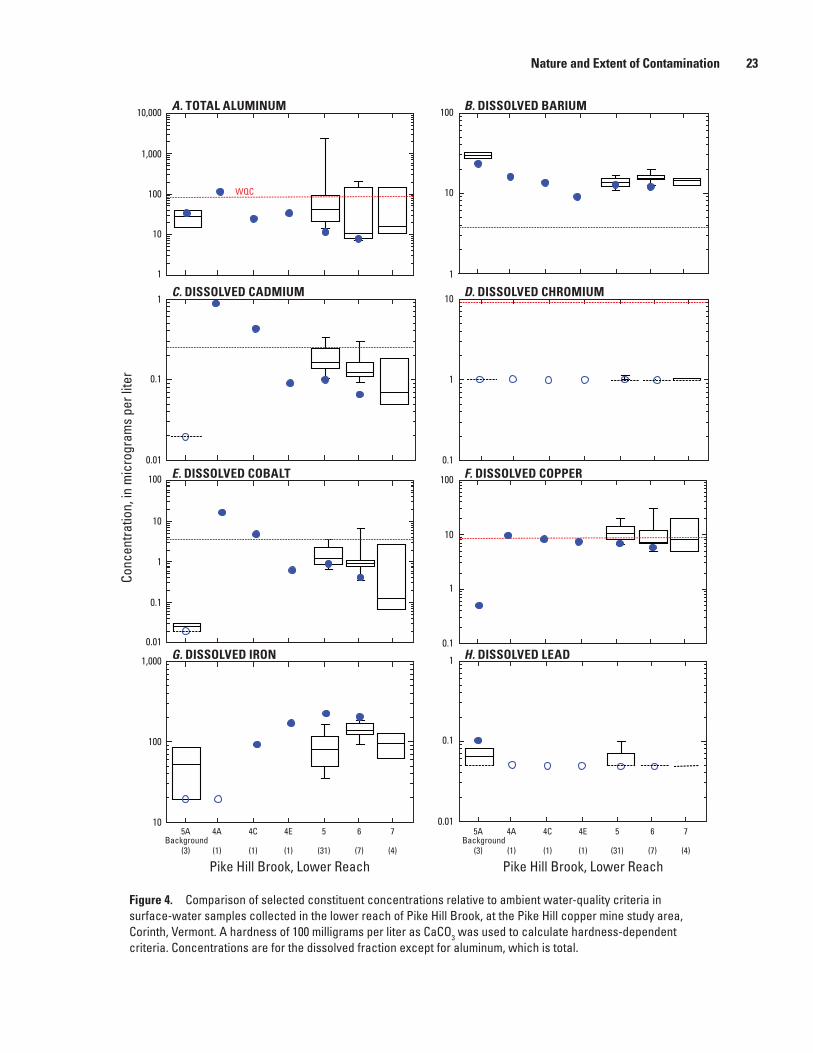
Nature and Extent of Contamination 23
B. DISSOLVED BARIUM
C. DISSOLVED CADMIUM
E. DISSOLVED COBALT
D. DISSOLVED CHROMIUM
F. DISSOLVED COPPER
H. DISSOLVED LEADG. DISSOLVED IRON
A. TOTAL ALUMINUM
WQC
Pike Hill Brook, Lower Reach Pike Hill Brook, Lower Reach
10,000
1,000
100
10
1
1
0.1
0.01
100
10
1
0.1
0.01
1,000
100
10
1
0.1
0.01
100
10
1
0.1
10
1
0.1
100
10
1
Conc
entra
tion,
in m
icro
gram
s pe
r lite
r
Background(4)(3) (1) (1) (1) (31) (7) (4)(3) (1) (1) (1) (31) (7)
75A 4A 4C 4E 5 6 75A 4A 4C 4E 5 6 Background
Figure 4Figure 4. Comparison of selected constituent concentrations relative to ambient water-quality criteria in surface-water samples collected in the lower reach of Pike Hill Brook, at the Pike Hill copper mine study area, Corinth, Vermont. A hardness of 100 milligrams per liter as CaCO3 was used to calculate hardness-dependent criteria. Concentrations are for the dissolved fraction except for aluminum, which is total.
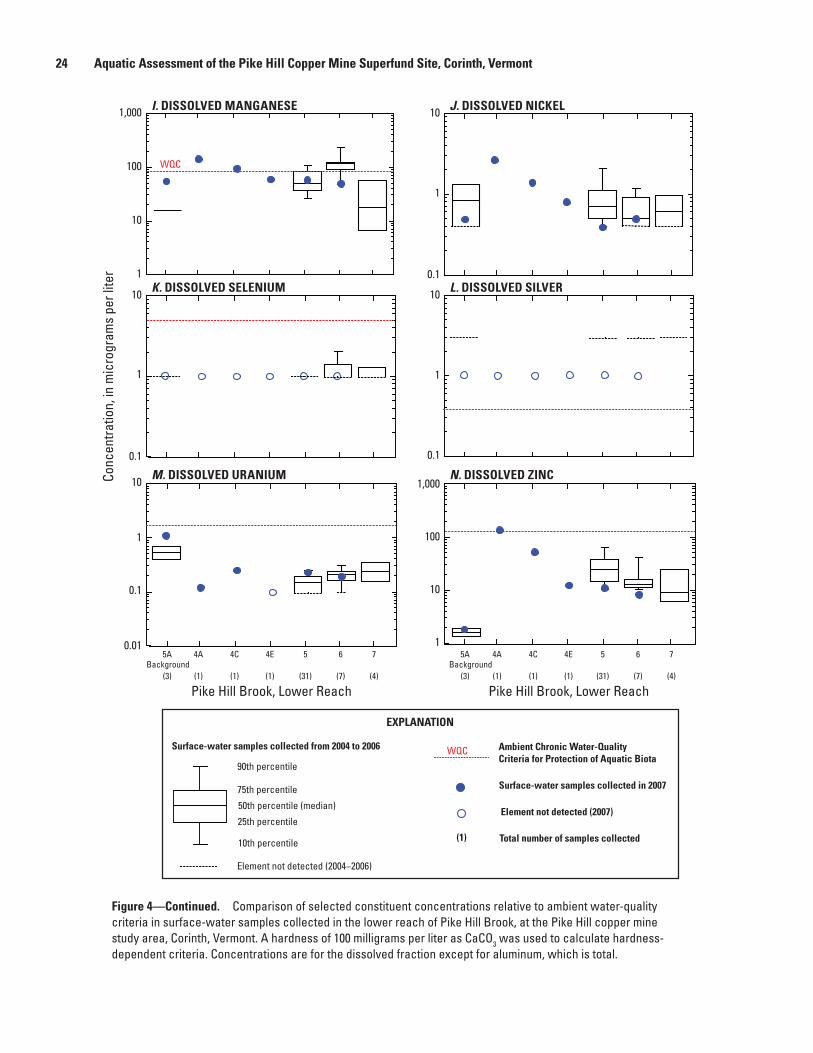
24 Aquatic Assessment of the Pike Hill Copper Mine Superfund Site, Corinth, Vermont
L. DISSOLVED SILVER
M. DISSOLVED URANIUM
I. DISSOLVED MANGANESE
K. DISSOLVED SELENIUM
J. DISSOLVED NICKEL
N. DISSOLVED ZINC
Pike Hill Brook, Lower Reach Pike Hill Brook, Lower Reach
1,000
100
10
1
10
1
0.1
10
1
0.1
0.01
1,000
100
10
1
10
1
0.1
10
1
0.1
WQC
Conc
entra
tion,
in m
icro
gram
s pe
r lite
r
EXPLANATION
Ambient Chronic Water-Quality Criteria for Protection of Aquatic Biota
WQC
Surface-water samples collected in 2007
(1) Total number of samples collected
90th percentile
25th percentile
75th percentile
50th percentile (median)
10th percentile
Surface-water samples collected from 2004 to 2006
Element not detected (2004−2006)
Element not detected (2007)
Background(4)(3) (1) (1) (1) (31) (7) (4)(3) (1) (1) (1) (31) (7)
75A 4A 4C 4E 5 6 75A 4A 4C 4E 5 6 Background
Figure 4 (cont.)Figure 4—Continued. Comparison of selected constituent concentrations relative to ambient water-quality criteria in surface-water samples collected in the lower reach of Pike Hill Brook, at the Pike Hill copper mine study area, Corinth, Vermont. A hardness of 100 milligrams per liter as CaCO3 was used to calculate hardness-dependent criteria. Concentrations are for the dissolved fraction except for aluminum, which is total.
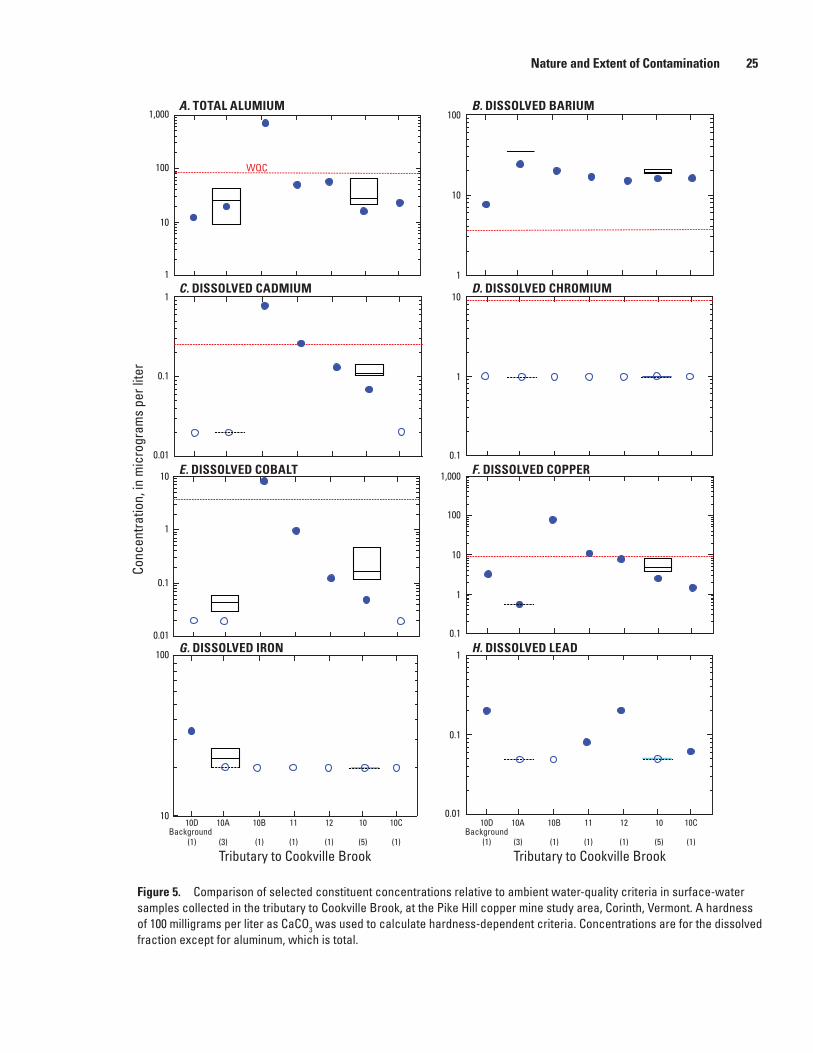
Nature and Extent of Contamination 25
B. DISSOLVED BARIUM
C. DISSOLVED CADMIUM
E. DISSOLVED COBALT
D. DISSOLVED CHROMIUM
F. DISSOLVED COPPER
H. DISSOLVED LEADG. DISSOLVED IRON
A. TOTAL ALUMIUM
WQC
Tributary to Cookville Brook Tributary to Cookville Brook
1,000
100
10
1
1
0.1
0.01
10
1
0.1
0.01
100
10
1
0.1
0.01
1,000
100
10
1
0.1
10
1
0.1
100
10
1
Conc
entra
tion,
in m
icro
gram
s pe
r lite
r
Background(1)(1) (3) (1) (1) (1) (5)
10C10D 10A 10B 11 12 10 Background
(1)(1) (3) (1) (1) (1) (5)
10C10D 10A 10B 11 12 10
Figure 5Figure 5. Comparison of selected constituent concentrations relative to ambient water-quality criteria in surface-water samples collected in the tributary to Cookville Brook, at the Pike Hill copper mine study area, Corinth, Vermont. A hardness of 100 milligrams per liter as CaCO3 was used to calculate hardness-dependent criteria. Concentrations are for the dissolved fraction except for aluminum, which is total.
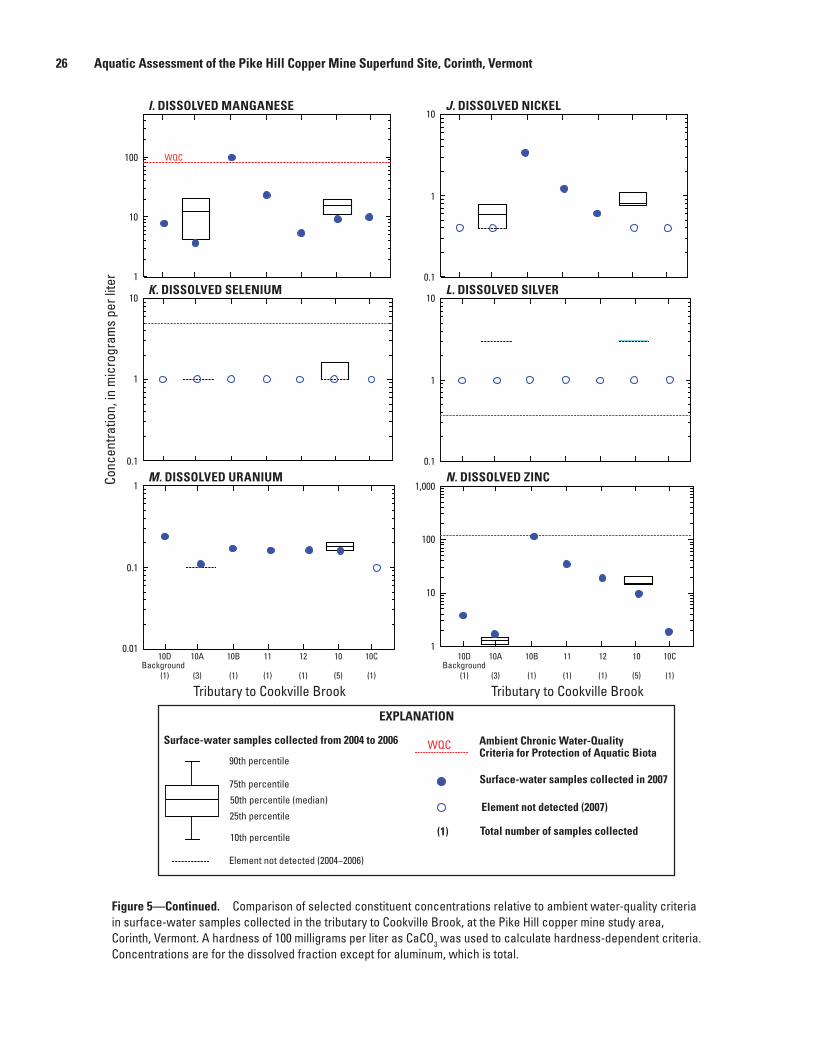
26 Aquatic Assessment of the Pike Hill Copper Mine Superfund Site, Corinth, Vermont
L. DISSOLVED SILVER
M. DISSOLVED URANIUM
I. DISSOLVED MANGANESE
K. DISSOLVED SELENIUM
J. DISSOLVED NICKEL
N. DISSOLVED ZINC
Tributary to Cookville Brook Tributary to Cookville Brook
100
10
1
10
1
0.1
10
1
0.1
1
0.1
0.01
1,000
100
10
1
10
1
0.1
WQC
Conc
entra
tion,
in m
icro
gram
s pe
r lite
r
Background(1)(1) (3) (1) (1) (1) (5)
10C10D 10A 10B 11 12 10 Background
(1)(1) (3) (1) (1) (1) (5)
10C10D 10A 10B 11 12 10
Figure 5 (cont.)
EXPLANATION
Ambient Chronic Water-Quality Criteria for Protection of Aquatic Biota
WQC
Surface-water samples collected in 2007
(1) Total number of samples collected
90th percentile
25th percentile
75th percentile
50th percentile (median)
10th percentile
Surface-water samples collected from 2004 to 2006
Element not detected (2004−2006)
Element not detected (2007)
Figure 5—Continued. Comparison of selected constituent concentrations relative to ambient water-quality criteria in surface-water samples collected in the tributary to Cookville Brook, at the Pike Hill copper mine study area, Corinth, Vermont. A hardness of 100 milligrams per liter as CaCO3 was used to calculate hardness-dependent criteria. Concentrations are for the dissolved fraction except for aluminum, which is total.
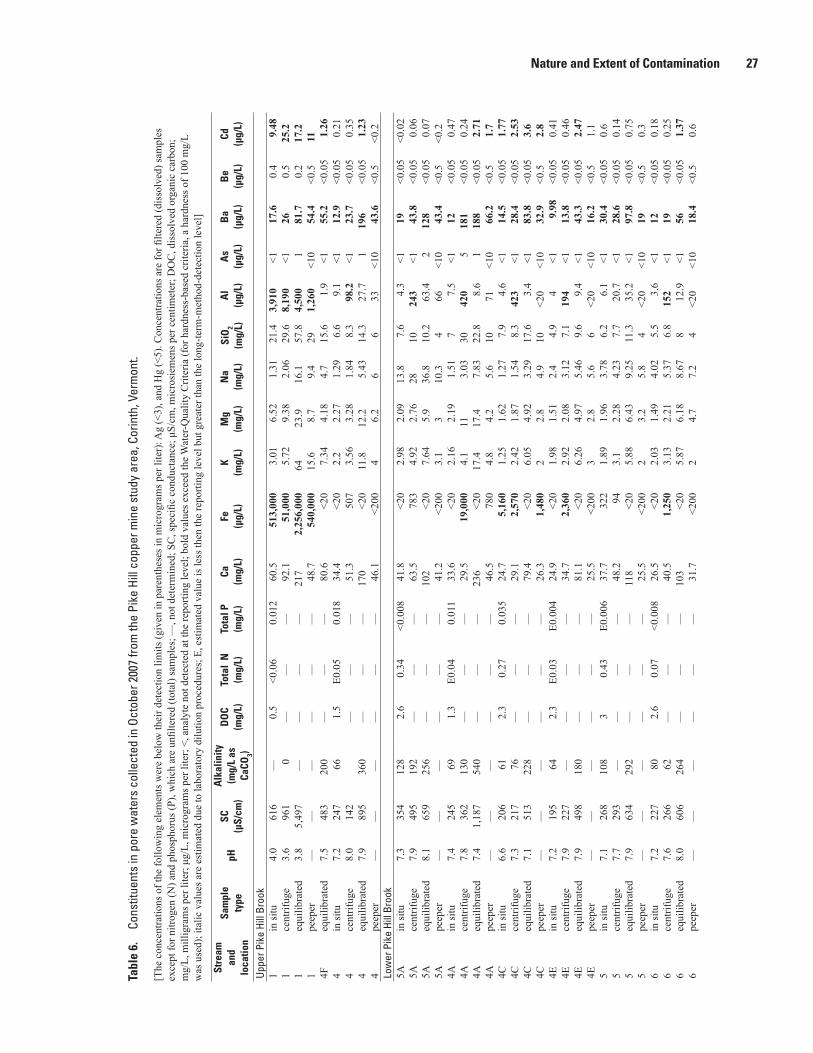
Nature and Extent of Contamination 27
Tabl
e 6.
Co
nstit
uent
s in
por
e w
ater
s co
llect
ed in
Oct
ober
200
7 fro
m th
e Pi
ke H
ill c
oppe
r min
e st
udy
area
, Cor
inth
, Ver
mon
t.
[The
con
cent
ratio
ns o
f the
follo
win
g el
emen
ts w
ere
belo
w th
eir d
etec
tion
limits
(giv
en in
par
enth
eses
in m
icro
gram
s per
lite
r): A
g (<
3), a
nd H
g (<
5). C
once
ntra
tions
are
for fi
ltere
d (d
isso
lved
) sam
ples
ex
cept
for n
itrog
en (N
) and
pho
spho
rus (
P), w
hich
are
unfi
ltere
d (to
tal)
sam
ples
; —, n
ot d
eter
min
ed; S
C, s
peci
fic c
ondu
ctan
ce; μ
S/cm
, mic
rosi
emen
s per
cen
timet
er; D
OC
, dis
solv
ed o
rgan
ic c
arbo
n;
mg/
L, m
illig
ram
s per
lite
r; μg
/L, m
icro
gram
s per
lite
r; <,
ana
lyte
not
det
ecte
d at
the
repo
rting
leve
l; bo
ld v
alue
s exc
eed
the
Wat
er-Q
ualit
y C
riter
ia (f
or h
ardn
ess-
base
d cr
iteria
, a h
ardn
ess o
f 100
mg/
L w
as u
sed)
; ita
lic v
alue
s are
est
imat
ed d
ue to
labo
rato
ry d
ilutio
n pr
oced
ures
; E, e
stim
ated
val
ue is
less
then
the
repo
rting
leve
l but
gre
ater
than
the
long
-term
-met
hod-
dete
ctio
n le
vel]
Stre
am
and
loca
tion
Sam
ple
type
pHSC
(μS/
cm)
Alk
alin
ity(m
g/L
as
CaCO
3)
DO
C(m
g/L)
Tota
l N
(mg/
L)To
tal P
(mg/
L)Ca
(mg/
L)Fe
(μg/
L)K
(mg/
L)M
g(m
g/L)
Na
(mg/
L)Si
O2
(mg/
L)A
l(μ
g/L)
As
(μg/
L)B
a(μ
g/L)
Be
(μg/
L)Cd
(μg/
L)
Uppe
r Pik
e Hi
ll Br
ook
1in
situ
4.0
616
—0.
5<0
.06
0.01
260
.551
3,00
03.
016.
521.
3121
.43,
910
<117
.60.
49.
481
cent
rifug
e 3.
696
10
——
—92
.151
,000
5.72
9.38
2.06
29.6
8,19
0<1
260.
525
.21
equi
libra
ted
3.8
5,49
7—
——
—21
72,
256,
000
6423
.916
.157
.84,
500
181
.70.
217
.21
peep
er—
——
——
—48
.754
0,00
015
.68.
79.
429
1,26
0<1
054
.4<0
.511
4Feq
uilib
rate
d7.
548
320
0—
——
80.6
<20
7.34
4.18
4.7
15.6
1.9
<155
.2<0
.05
1.26
4in
situ
7.2
247
661.
5E0
.05
0.01
834
.4<2
02.
22.
271.
296.
69.
1<1
12.9
<0.0
50.
214
cent
rifug
e 8.
014
2—
——
51.3
507
3.56
3.28
1.84
8.3
98.2
<123
.7<0
.05
0.35
4eq
uilib
rate
d7.
989
536
0—
——
170
<20
11.8
12.2
5.43
14.3
27.7
119
6<0
.05
1.23
4pe
eper
——
——
——
46.1
<200
46.
26
633
<10
43.6
<0.5
<0.2
Low
er P
ike
Hill
Broo
k5A
in si
tu7.
335
412
82.
60.
34<0
.008
41.8
<20
2.98
2.09
13.8
7.6
4.3
<119
<0.0
5<0
.02
5Ace
ntrif
uge
7.9
495
192
——
—63
.578
34.
922.
7628
1024
3<1
43.8
<0.0
50.
065A
equi
libra
ted
8.1
659
256
——
—10
2<2
07.
645.
936
.810
.263
.42
128
<0.0
50.
075A
peep
er—
——
——
—41
.2<2
003.
13
10.3
466
<10
43.4
<0.5
<0.2
4Ain
situ
7.4
245
691.
3E0
.04
0.01
133
.6<2
02.
162.
191.
517
7.5
<112
<0.0
50.
474A
cent
rifug
e 7.
836
213
0—
——
29.5
19,0
004.
111
3.03
3042
05
181
<0.0
50.
244A
equi
libra
ted
7.4
1,18
754
0—
——
236
<20
17.4
17.4
7.83
22.8
8.6
118
8<0
.05
2.71
4Ape
eper
——
——
——
46.5
780
4.8
4.2
5.6
1071
<10
66.2
<0.5
1.7
4Cin
situ
6.6
206
612.
30.
270.
035
24.7
5,16
01.
251.
621.
277.
94.
6<1
14.5
<0.0
51.
774C
cent
rifug
e 7.
321
776
——
—29
.12,
570
2.42
1.87
1.54
8.3
423
<128
.4<0
.05
2.53
4Ceq
uilib
rate
d7.
151
322
8—
——
79.4
<20
6.05
4.92
3.29
17.6
3.4
<183
.8<0
.05
3.6
4Cpe
eper
——
——
——
26.3
1,48
02
2.8
4.9
10<2
0<1
032
.9<0
.52.
84E
in si
tu7.
219
564
2.3
E0.0
3E0
.004
24.9
<20
1.98
1.51
2.4
4.9
4<1
9.98
<0.0
50.
414E
cent
rifug
e 7.
922
7—
——
—34
.72,
360
2.92
2.08
3.12
7.1
194
<113
.8<0
.05
0.46
4Eeq
uilib
rate
d7.
949
818
0—
——
81.1
<20
6.26
4.97
5.46
9.6
9.4
<143
.3<0
.05
2.47
4Epe
eper
——
——
——
25.5
<200
32.
85.
66
<20
<10
16.2
<0.5
1.1
5in
situ
7.1
268
108
30.
43E0
.006
37.7
322
1.89
1.96
3.78
6.2
6.1
<130
.4<0
.05
0.6
5ce
ntrif
uge
7.7
293
——
——
48.2
943.
12.
284.
237.
720
.7<1
28.6
<0.0
50.
145
equi
libra
ted
7.9
634
292
——
—11
8<2
05.
886.
439.
2511
.335
.2<1
97.8
<0.0
50.
755
peep
er—
——
——
—25
.5<2
002
3.2
5.8
4<2
0<1
019
<0.5
0.3
6in
situ
7.2
227
802.
60.
07<0
.008
26.5
<20
2.03
1.49
4.02
5.5
3.6
<112
<0.0
50.
186
cent
rifug
e 7.
626
662
——
—40
.51,
250
3.13
2.21
5.37
6.8
152
<119
<0.0
50.
256
equi
libra
ted
8.0
606
264
——
—10
3<2
05.
876.
188.
678
12.9
<156
<0.0
51.
376
peep
er—
——
——
—31
.7<2
002
4.7
7.2
4<2
0<1
018
.4<0
.50.
6
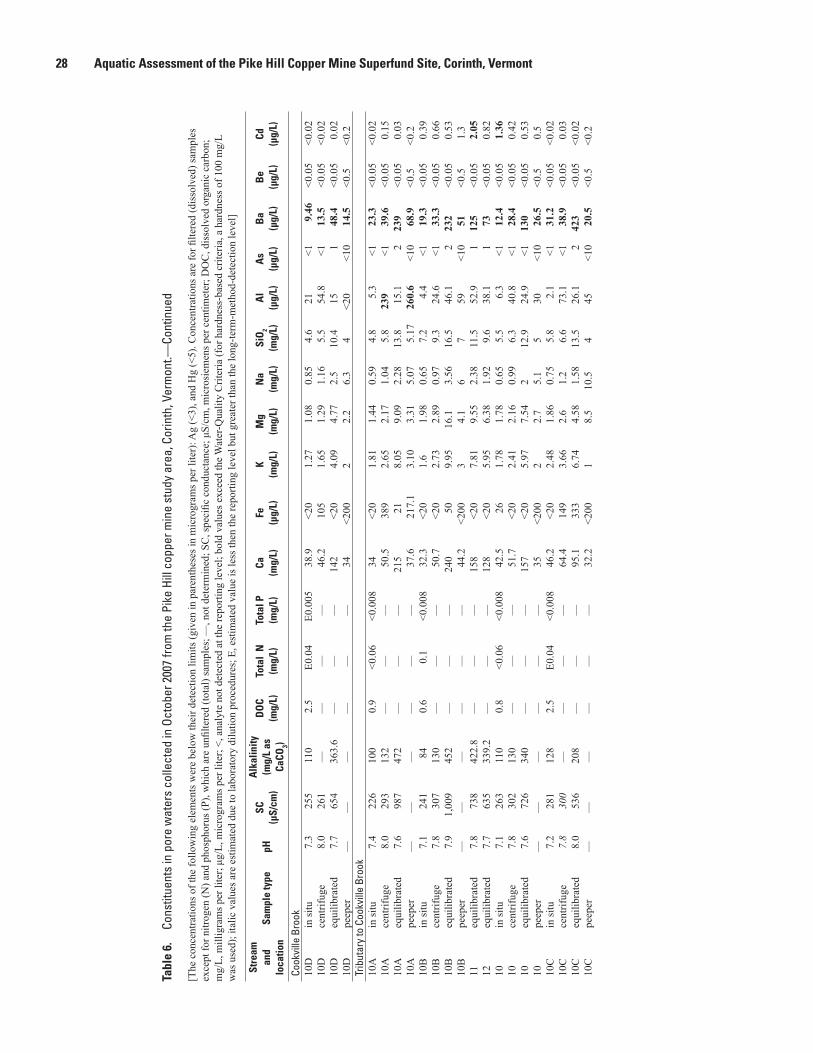
28 Aquatic Assessment of the Pike Hill Copper Mine Superfund Site, Corinth, Vermont
Tabl
e 6.
Co
nstit
uent
s in
por
e w
ater
s co
llect
ed in
Oct
ober
200
7 fro
m th
e Pi
ke H
ill c
oppe
r min
e st
udy
area
, Cor
inth
, Ver
mon
t.—Co
ntin
ued
[The
con
cent
ratio
ns o
f the
follo
win
g el
emen
ts w
ere
belo
w th
eir d
etec
tion
limits
(giv
en in
par
enth
eses
in m
icro
gram
s per
lite
r): A
g (<
3), a
nd H
g (<
5). C
once
ntra
tions
are
for fi
ltere
d (d
isso
lved
) sam
ples
ex
cept
for n
itrog
en (N
) and
pho
spho
rus (
P), w
hich
are
unfi
ltere
d (to
tal)
sam
ples
; —, n
ot d
eter
min
ed; S
C, s
peci
fic c
ondu
ctan
ce; μ
S/cm
, mic
rosi
emen
s per
cen
timet
er; D
OC
, dis
solv
ed o
rgan
ic c
arbo
n;
mg/
L, m
illig
ram
s per
lite
r; μg
/L, m
icro
gram
s per
lite
r; <,
ana
lyte
not
det
ecte
d at
the
repo
rting
leve
l; bo
ld v
alue
s exc
eed
the
Wat
er-Q
ualit
y C
riter
ia (f
or h
ardn
ess-
base
d cr
iteria
, a h
ardn
ess o
f 100
mg/
L w
as u
sed)
; ita
lic v
alue
s are
est
imat
ed d
ue to
labo
rato
ry d
ilutio
n pr
oced
ures
; E, e
stim
ated
val
ue is
less
then
the
repo
rting
leve
l but
gre
ater
than
the
long
-term
-met
hod-
dete
ctio
n le
vel]
Stre
am
and
loca
tion
Sam
ple
type
pHSC
(μS/
cm)
Alk
alin
ity(m
g/L
as
CaCO
3)
DO
C(m
g/L)
Tota
l N
(mg/
L)To
tal P
(mg/
L)Ca
(mg/
L)Fe
(μg/
L)K
(mg/
L)M
g(m
g/L)
Na
(mg/
L)Si
O2
(mg/
L)A
l(μ
g/L)
As
(μg/
L)B
a(μ
g/L)
Be
(μg/
L)Cd
(μg/
L)
Cook
ville
Bro
ok10
Din
situ
7.3
255
110
2.5
E0.0
4E0
.005
38.9
<20
1.27
1.08
0.85
4.6
21<1
9.46
<0.0
5<0
.02
10D
cent
rifug
e 8.
026
1—
——
—46
.210
51.
651.
291.
165.
554
.8<1
13.5
<0.0
5<0
.02
10D
equi
libra
ted
7.7
654
363.
6—
——
142
<20
4.09
4.77
2.5
10.4
151
48.4
<0.0
50.
0210
Dpe
eper
——
——
——
34<2
002
2.2
6.3
4<2
0<1
014
.5<0
.5<0
.2Tr
ibut
ary
to C
ookv
ille
Broo
k10
Ain
situ
7.4
226
100
0.9
<0.0
6<0
.008
34<2
01.
811.
440.
594.
85.
3<1
23.3
<0.0
5<0
.02
10A
cent
rifug
e 8.
029
313
2—
——
50.5
389
2.65
2.17
1.04
5.8
239
<139
.6<0
.05
0.15
10A
equi
libra
ted
7.6
987
472
——
—21
521
8.05
9.09
2.28
13.8
15.1
223
9<0
.05
0.03
10A
peep
er—
——
——
—37
.621
7.1
3.10
3.31
5.07
5.17
260.
6<1
068
.9<0
.5<0
.210
Bin
situ
7.1
241
840.
60.
1<0
.008
32.3
<20
1.6
1.98
0.65
7.2
4.4
<119
.3<0
.05
0.39
10B
cent
rifug
e 7.
830
713
0—
——
50.7
<20
2.73
2.89
0.97
9.3
24.6
<133
.3<0
.05
0.66
10B
equi
libra
ted
7.9
1,00
945
2—
——
240
509.
9516
.13.
5616
.546
.12
232
<0.0
50.
5310
Bpe
eper
——
——
——
44.2
<200
34.
16
759
<10
51<0
.51.
311
equi
libra
ted
7.8
738
422.
8—
——
158
<20
7.81
9.55
2.38
11.5
52.9
112
5<0
.05
2.05
12eq
uilib
rate
d7.
763
533
9.2
——
—12
8<2
05.
956.
381.
929.
638
.11
73<0
.05
0.82
10in
situ
7.1
263
110
0.8
<0.0
6<0
.008
42.5
261.
781.
780.
655.
56.
3<1
12.4
<0.0
51.
3610
cent
rifug
e 7.
830
213
0—
——
51.7
<20
2.41
2.16
0.99
6.3
40.8
<128
.4<0
.05
0.42
10eq
uilib
rate
d7.
672
634
0—
——
157
<20
5.97
7.54
212
.924
.9<1
130
<0.0
50.
5310
peep
er—
——
——
—35
<200
22.
75.
15
30<1
026
.5<0
.50.
510
Cin
situ
7.2
281
128
2.5
E0.0
4<0
.008
46.2
<20
2.48
1.86
0.75
5.8
2.1
<131
.2<0
.05
<0.0
210
Cce
ntrif
uge
7.8
300
——
——
64.4
149
3.66
2.6
1.2
6.6
73.1
<138
.9<0
.05
0.03
10C
equi
libra
ted
8.0
536
208
——
—95
.133
36.
744.
581.
5813
.526
.12
423
<0.0
5<0
.02
10C
peep
er—
——
——
—32
.2<2
001
8.5
10.5
445
<10
20.5
<0.5
<0.2
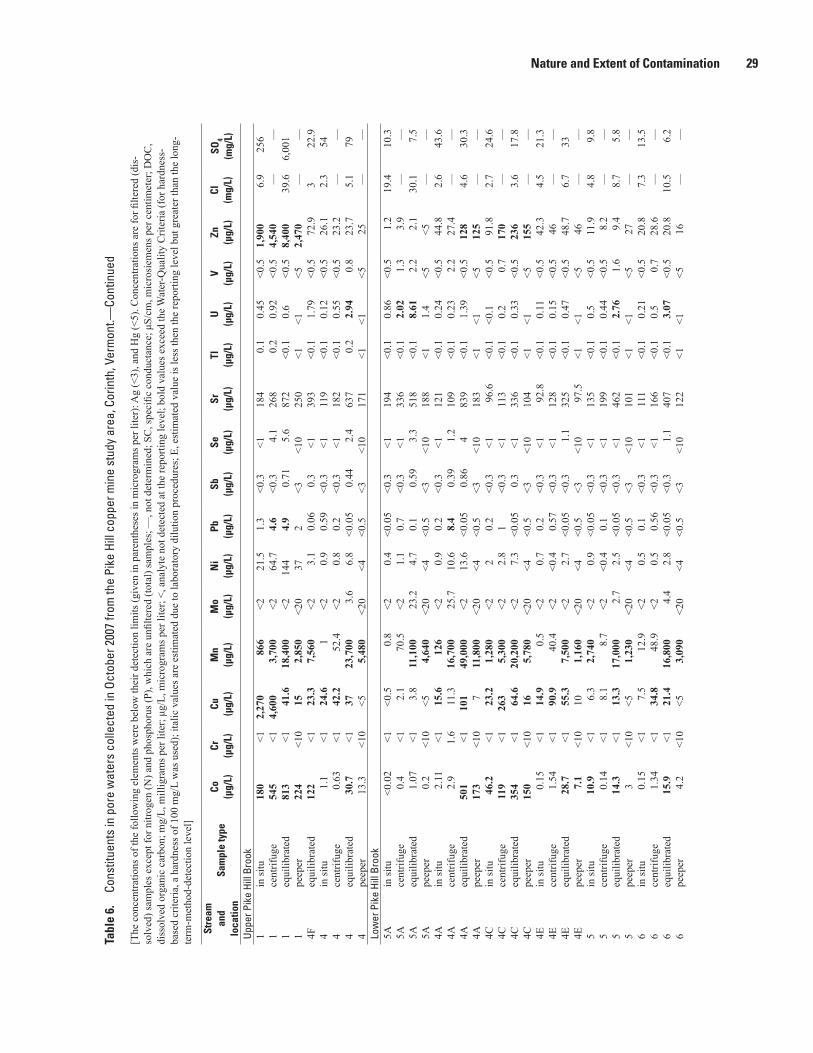
Nature and Extent of Contamination 29
Tabl
e 6.
Co
nstit
uent
s in
por
e w
ater
s co
llect
ed in
Oct
ober
200
7 fro
m th
e Pi
ke H
ill c
oppe
r min
e st
udy
area
, Cor
inth
, Ver
mon
t.—Co
ntin
ued
[The
con
cent
ratio
ns o
f the
follo
win
g el
emen
ts w
ere
belo
w th
eir d
etec
tion
limits
(giv
en in
par
enth
eses
in m
icro
gram
s per
lite
r): A
g (<
3), a
nd H
g (<
5). C
once
ntra
tions
are
for fi
ltere
d (d
is-
solv
ed) s
ampl
es e
xcep
t for
nitr
ogen
(N) a
nd p
hosp
horu
s (P)
, whi
ch a
re u
nfilte
red
(tota
l) sa
mpl
es; —
, not
det
erm
ined
; SC
, spe
cific
con
duct
ance
; μS/
cm, m
icro
siem
ens p
er c
entim
eter
; DO
C,
diss
olve
d or
gani
c ca
rbon
; mg/
L, m
illig
ram
s per
lite
r; μg
/L, m
icro
gram
s per
lite
r; <,
ana
lyte
not
det
ecte
d at
the
repo
rting
leve
l; bo
ld v
alue
s exc
eed
the
Wat
er-Q
ualit
y C
riter
ia (f
or h
ardn
ess-
base
d cr
iteria
, a h
ardn
ess o
f 100
mg/
L w
as u
sed)
; ita
lic v
alue
s are
est
imat
ed d
ue to
labo
rato
ry d
ilutio
n pr
oced
ures
; E, e
stim
ated
val
ue is
less
then
the
repo
rting
leve
l but
gre
ater
than
the
long
-te
rm-m
etho
d-de
tect
ion
leve
l]
Stre
am
and
lo
catio
nSa
mpl
e ty
peCo
(μg/
L)Cr
(μg/
L)Cu
(μg/
L)M
n(μ
g/L)
Mo
(μg/
L)N
i(μ
g/L)
Pb(μ
g/L)
Sb(μ
g/L)
Se(μ
g/L)
Sr(μ
g/L)
Tl(μ
g/L)
U(μ
g/L)
V(μ
g/L)
Zn(μ
g/L)
Cl(m
g/L)
SO4
(mg/
L)
Uppe
r Pik
e Hi
ll Br
ook
1in
situ
180
<12,
270
866
<221
.51.
3<0
.3<1
184
0.1
0.45
<0.5
1,90
06.
925
61
cent
rifug
e 54
5<1
4,60
03,
700
<264
.74.
6<0
.34.
126
80.
20.
92<0
.54,
540
——
1eq
uilib
rate
d81
3<1
41.6
18,4
00<2
144
4.9
0.71
5.6
872
<0.1
0.6
<0.5
8,40
039
.66,
001
1pe
eper
224
<10
152,
850
<20
372
<3<1
025
0<1
<1<5
2,47
0—
—4F
equi
libra
ted
122
<123
.37,
560
<23.
10.
060.
3<1
393
<0.1
1.79
<0.5
72.9
322
.94
in si
tu1.
1<1
24.6
1<2
0.9
0.59
<0.3
<111
9<0
.10.
12<0
.526
.12.
354
4ce
ntrif
uge
0.63
<142
.252
.4<2
0.8
0.2
<0.3
<118
2<0
.10.
55<0
.523
.2—
—4
equi
libra
ted
30.7
<137
23,7
003.
66.
8<0
.05
0.44
2.4
637
0.2
2.94
0.8
23.7
5.1
794
peep
er13
.3<1
0<5
5,48
0<2
0<4
<0.5
<3<1
017
1<1
<1<5
25—
—Lo
wer
Pik
e Hi
ll Br
ook
5Ain
situ
<0.0
2<1
<0.5
0.8
<20.
4<0
.05
<0.3
<119
4<0
.10.
86<0
.51.
219
.410
.35A
cent
rifug
e 0.
4<1
2.1
70.5
<21.
10.
7<0
.3<1
336
<0.1
2.02
1.3
3.9
——
5Aeq
uilib
rate
d1.
07<1
3.8
11,1
0023
.24.
70.
10.
593.
351
8<0
.18.
612.
22.
130
.17.
55A
peep
er0.
2<1
0<5
4,64
0<2
0<4
<0.5
<3<1
018
8<1
1.4
<5<5
——
4Ain
situ
2.11
<115
.612
6<2
0.9
0.2
<0.3
<112
1<0
.10.
24<0
.544
.82.
643
.64A
cent
rifug
e 2.
91.
611
.316
,700
25.7
10.6
8.4
0.39
1.2
109
<0.1
0.23
2.2
27.4
——
4Aeq
uilib
rate
d50
1<1
101
49,0
00<2
13.6
<0.0
50.
864
839
<0.1
1.39
<0.5
128
4.6
30.3
4Ape
eper
173
<10
711
,800
<20
<4<0
.5<3
<10
183
<1<1
<512
5—
—4C
in si
tu46
.2<1
23.2
1,28
0<2
20.
2<0
.3<1
96.6
<0.1
<0.1
<0.5
91.8
2.7
24.6
4Cce
ntrif
uge
119
<126
35,
300
<22.
81
<0.3
<111
3<0
.10.
20.
717
0—
—4C
equi
libra
ted
354
<164
.620
,200
<27.
3<0
.05
0.3
<133
6<0
.10.
33<0
.523
63.
617
.84C
peep
er15
0<1
016
5,78
0<2
0<4
<0.5
<3<1
010
4<1
<1<5
155
——
4Ein
situ
0.15
<114
.90.
5<2
0.7
0.2
<0.3
<192
.8<0
.10.
11<0
.542
.34.
521
.34E
cent
rifug
e 1.
54<1
90.9
40.4
<2<0
.40.
57<0
.3<1
128
<0.1
0.15
<0.5
46—
—4E
equi
libra
ted
28.7
<155
.37,
500
<22.
7<0
.05
<0.3
1.1
325
<0.1
0.47
<0.5
48.7
6.7
334E
peep
er7.
1<1
010
1,16
0<2
0<4
<0.5
<3<1
097
.5<1
<1<5
46—
—5
in si
tu10
.9<1
6.3
2,74
0<2
0.9
<0.0
5<0
.3<1
135
<0.1
0.5
<0.5
11.9
4.8
9.8
5ce
ntrif
uge
0.14
<18.
18.
7<2
<0.4
0.1
<0.3
<119
9<0
.10.
44<0
.58.
2—
—5
equi
libra
ted
14.3
<113
.317
,000
2.7
2.5
<0.0
5<0
.3<1
462
<0.1
2.76
1.6
9.4
8.7
5.8
5pe
eper
3<1
0<5
1,23
0<2
0<4
<0.5
<3<1
010
1<1
<1<5
27—
—6
in si
tu0.
15<1
7.5
12.9
<20.
50.
1<0
.3<1
111
<0.1
0.21
<0.5
20.8
7.3
13.5
6ce
ntrif
uge
1.34
<134
.848
.9<2
0.5
0.56
<0.3
<116
6<0
.10.
50.
728
.6—
—6
equi
libra
ted
15.9
<121
.416
,800
4.4
2.8
<0.0
5<0
.31.
140
7<0
.13.
07<0
.520
.810
.56.
26
peep
er4.
2<1
0<5
3,09
0<2
0<4
<0.5
<3<1
012
2<1
<1<5
16—
—
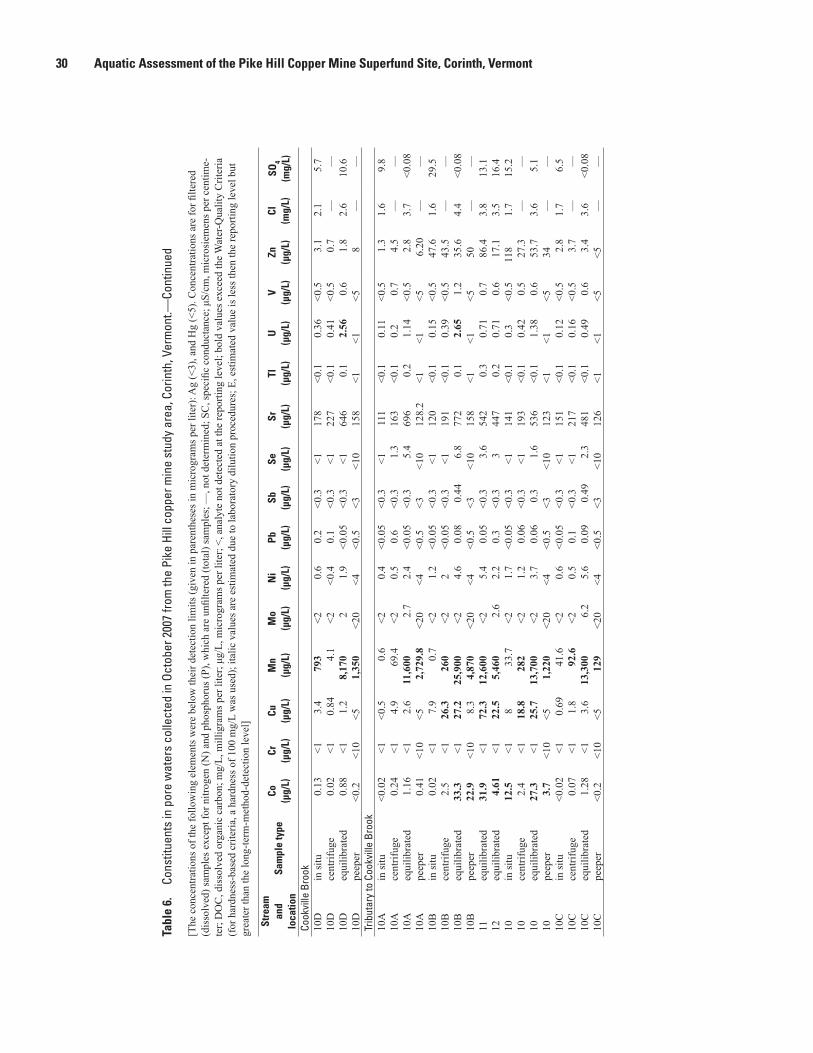
30 Aquatic Assessment of the Pike Hill Copper Mine Superfund Site, Corinth, Vermont
Tabl
e 6.
Co
nstit
uent
s in
por
e w
ater
s co
llect
ed in
Oct
ober
200
7 fro
m th
e Pi
ke H
ill c
oppe
r min
e st
udy
area
, Cor
inth
, Ver
mon
t.—Co
ntin
ued
[The
con
cent
ratio
ns o
f the
follo
win
g el
emen
ts w
ere
belo
w th
eir d
etec
tion
limits
(giv
en in
par
enth
eses
in m
icro
gram
s per
lite
r): A
g (<
3), a
nd H
g (<
5). C
once
ntra
tions
are
for fi
ltere
d (d
isso
lved
) sam
ples
exc
ept f
or n
itrog
en (N
) and
pho
spho
rus (
P), w
hich
are
unfi
ltere
d (to
tal)
sam
ples
; —, n
ot d
eter
min
ed; S
C, s
peci
fic c
ondu
ctan
ce; μ
S/cm
, mic
rosi
emen
s per
cen
time-
ter;
DO
C, d
isso
lved
org
anic
car
bon;
mg/
L, m
illig
ram
s per
lite
r; μg
/L, m
icro
gram
s per
lite
r; <,
ana
lyte
not
det
ecte
d at
the
repo
rting
leve
l; bo
ld v
alue
s exc
eed
the
Wat
er-Q
ualit
y C
riter
ia
(for
har
dnes
s-ba
sed
crite
ria, a
har
dnes
s of 1
00 m
g/L
was
use
d); i
talic
val
ues a
re e
stim
ated
due
to la
bora
tory
dilu
tion
proc
edur
es; E
, est
imat
ed v
alue
is le
ss th
en th
e re
porti
ng le
vel b
ut
grea
ter t
han
the
long
-term
-met
hod-
dete
ctio
n le
vel]
Stre
am
and
loca
tion
Sam
ple
type
Co(μ
g/L)
Cr(μ
g/L)
Cu(μ
g/L)
Mn
(μg/
L)M
o(μ
g/L)
Ni
(μg/
L)Pb
(μg/
L)Sb
(μg/
L)Se
(μg/
L)Sr
(μg/
L)Tl
(μg/
L)U
(μg/
L)V
(μg/
L)Zn
(μg/
L)Cl
(mg/
L)SO
4(m
g/L)
Cook
ville
Bro
ok10
Din
situ
0.13
<13.
479
3<2
0.6
0.2
<0.3
<117
8<0
.10.
36<0
.53.
12.
15.
710
Dce
ntrif
uge
0.02
<10.
844.
1<2
<0.4
0.1
<0.3
<122
7<0
.10.
41<0
.50.
7—
—10
Deq
uilib
rate
d0.
88<1
1.2
8,17
02
1.9
<0.0
5<0
.3<1
646
0.1
2.56
0.6
1.8
2.6
10.6
10D
peep
er<0
.2<1
0<5
1,35
0<2
0<4
<0.5
<3<1
015
8<1
<1<5
8—
—Tr
ibut
ary
to C
ookv
ille
Broo
k10
Ain
situ
<0.0
2<1
<0.5
0.6
<20.
4<0
.05
<0.3
<111
1<0
.10.
11<0
.51.
31.
69.
810
Ace
ntrif
uge
0.24
<14.
969
.4<2
0.5
0.6
<0.3
1.3
163
<0.1
0.2
0.7
4.5
——
10A
equi
libra
ted
1.16
<12.
611
,600
2.7
2.4
<0.0
5<0
.35.
469
60.
21.
14<0
.52.
83.
7<0
.08
10A
peep
er0.
41<1
0<5
2,72
9.8
<20
<4<0
.5<3
<10
128.
2<1
<1<5
6.20
——
10B
in si
tu0.
02<1
7.9
0.7
<21.
2<0
.05
<0.3
<112
0<0
.10.
15<0
.547
.61.
629
.510
Bce
ntrif
uge
2.5
<126
.326
0<2
2<0
.05
<0.3
<119
1<0
.10.
39<0
.543
.5—
—10
Beq
uilib
rate
d33
.3<1
27.2
25,9
00<2
4.6
0.08
0.44
6.8
772
0.1
2.65
1.2
35.6
4.4
<0.0
810
Bpe
eper
22.9
<10
8.3
4,87
0<2
0<4
<0.5
<3<1
015
8<1
<1<5
50—
—11
equi
libra
ted
31.9
<172
.312
,600
<25.
40.
05<0
.33.
654
20.
30.
710.
786
.43.
813
.112
equi
libra
ted
4.61
<122
.55,
460
2.6
2.2
0.3
<0.3
344
70.
20.
710.
617
.13.
516
.410
in si
tu12
.5<1
833
.7<2
1.7
<0.0
5<0
.3<1
141
<0.1
0.3
<0.5
118
1.7
15.2
10ce
ntrif
uge
2.4
<118
.828
2<2
1.2
0.06
<0.3
<119
3<0
.10.
420.
527
.3—
—10
equi
libra
ted
27.3
<125
.713
,700
<23.
70.
060.
31.
653
6<0
.11.
380.
653
.73.
65.
110
peep
er3.
7<1
0<5
1,22
0<2
0<4
<0.5
<3<1
012
3<1
<1<5
34—
—10
Cin
situ
<0.0
2<1
0.69
41.6
<20.
6<0
.05
<0.3
<115
1<0
.10.
12<0
.52.
81.
76.
510
Cce
ntrif
uge
0.07
<11.
892
.6<2
0.5
0.1
<0.3
<121
7<0
.10.
16<0
.53.
7—
—10
Ceq
uilib
rate
d1.
28<1
3.6
13,3
006.
25.
60.
090.
492.
348
1<0
.10.
490.
63.
43.
6<0
.08
10C
peep
er<0
.2<1
0<5
129
<20
<4<0
.5<3
<10
126
<1<1
<5<5
——
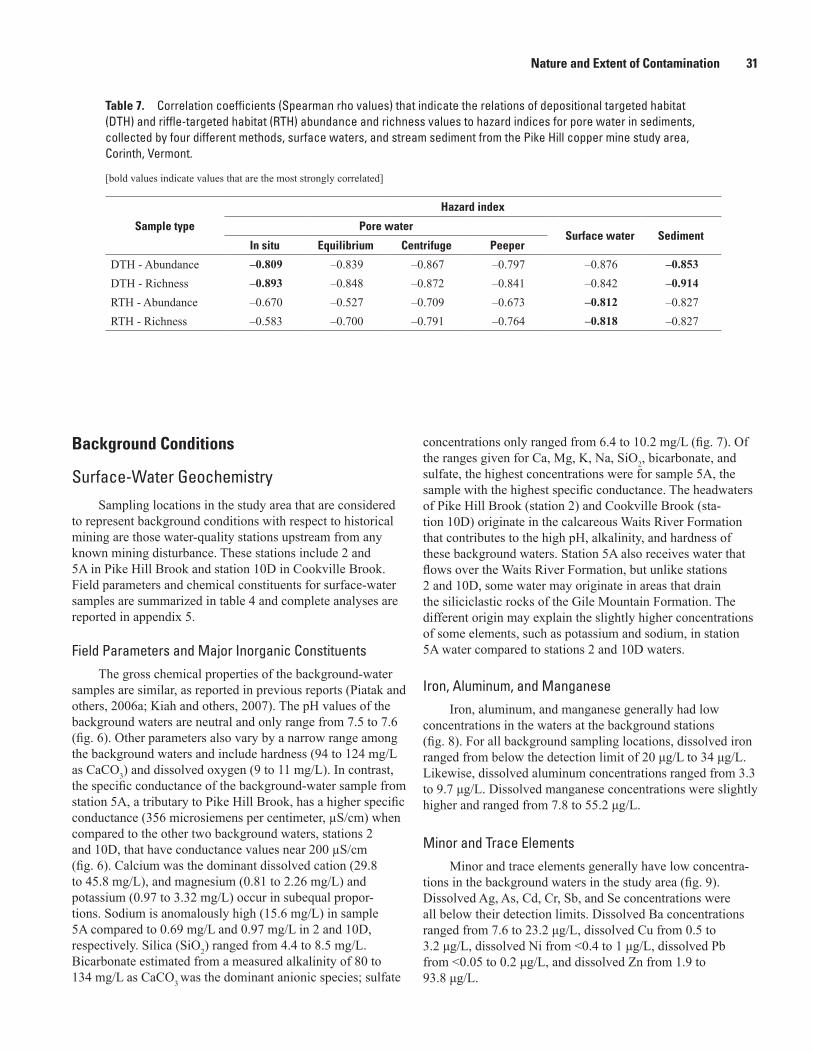
Nature and Extent of Contamination 31
Table 7. Correlation coefficients (Spearman rho values) that indicate the relations of depositional targeted habitat (DTH) and riffle-targeted habitat (RTH) abundance and richness values to hazard indices for pore water in sediments, collected by four different methods, surface waters, and stream sediment from the Pike Hill copper mine study area, Corinth, Vermont.
[bold values indicate values that are the most strongly correlated]
Sample type
Hazard index
Pore waterSurface water Sediment
In situ Equilibrium Centrifuge Peeper
DTH - Abundance –0.809 –0.839 –0.867 –0.797 –0.876 –0.853DTH - Richness –0.893 –0.848 –0.872 –0.841 –0.842 –0.914RTH - Abundance –0.670 –0.527 –0.709 –0.673 –0.812 –0.827RTH - Richness –0.583 –0.700 –0.791 –0.764 –0.818 –0.827
Background Conditions
Surface-Water GeochemistrySampling locations in the study area that are considered
to represent background conditions with respect to historical mining are those water-quality stations upstream from any known mining disturbance. These stations include 2 and 5A in Pike Hill Brook and station 10D in Cookville Brook. Field parameters and chemical constituents for surface-water samples are summarized in table 4 and complete analyses are reported in appendix 5.
Field Parameters and Major Inorganic ConstituentsThe gross chemical properties of the background-water
samples are similar, as reported in previous reports (Piatak and others, 2006a; Kiah and others, 2007). The pH values of the background waters are neutral and only range from 7.5 to 7.6 (fig. 6). Other parameters also vary by a narrow range among the background waters and include hardness (94 to 124 mg/L as CaCO3) and dissolved oxygen (9 to 11 mg/L). In contrast, the specific conductance of the background-water sample from station 5A, a tributary to Pike Hill Brook, has a higher specific conductance (356 microsiemens per centimeter, µS/cm) when compared to the other two background waters, stations 2 and 10D, that have conductance values near 200 µS/cm (fig. 6). Calcium was the dominant dissolved cation (29.8 to 45.8 mg/L), and magnesium (0.81 to 2.26 mg/L) and potassium (0.97 to 3.32 mg/L) occur in subequal propor-tions. Sodium is anomalously high (15.6 mg/L) in sample 5A compared to 0.69 mg/L and 0.97 mg/L in 2 and 10D, respectively. Silica (SiO2) ranged from 4.4 to 8.5 mg/L. Bicarbonate estimated from a measured alkalinity of 80 to 134 mg/L as CaCO3 was the dominant anionic species; sulfate
concentrations only ranged from 6.4 to 10.2 mg/L (fig. 7). Of the ranges given for Ca, Mg, K, Na, SiO2, bicarbonate, and sulfate, the highest concentrations were for sample 5A, the sample with the highest specific conductance. The headwaters of Pike Hill Brook (station 2) and Cookville Brook (sta-tion 10D) originate in the calcareous Waits River Formation that contributes to the high pH, alkalinity, and hardness of these background waters. Station 5A also receives water that flows over the Waits River Formation, but unlike stations 2 and 10D, some water may originate in areas that drain the siliciclastic rocks of the Gile Mountain Formation. The different origin may explain the slightly higher concentrations of some elements, such as potassium and sodium, in station 5A water compared to stations 2 and 10D waters.
Iron, Aluminum, and ManganeseIron, aluminum, and manganese generally had low
concentrations in the waters at the background stations (fig. 8). For all background sampling locations, dissolved iron ranged from below the detection limit of 20 μg/L to 34 μg/L. Likewise, dissolved aluminum concentrations ranged from 3.3 to 9.7 μg/L. Dissolved manganese concentrations were slightly higher and ranged from 7.8 to 55.2 μg/L.
Minor and Trace ElementsMinor and trace elements generally have low concentra-
tions in the background waters in the study area (fig. 9). Dissolved Ag, As, Cd, Cr, Sb, and Se concentrations were all below their detection limits. Dissolved Ba concentrations ranged from 7.6 to 23.2 μg/L, dissolved Cu from 0.5 to 3.2 μg/L, dissolved Ni from <0.4 to 1 μg/L, dissolved Pb from <0.05 to 0.2 μg/L, and dissolved Zn from 1.9 to 93.8 μg/L.
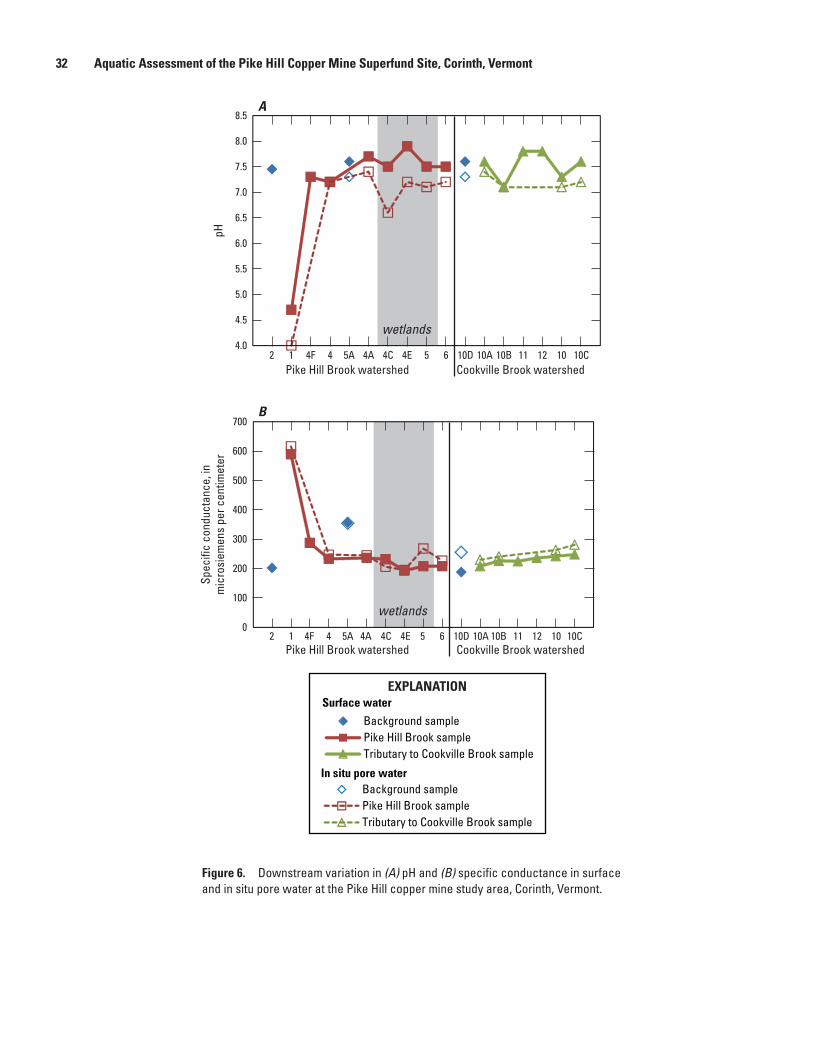
32 Aquatic Assessment of the Pike Hill Copper Mine Superfund Site, Corinth, Vermont
wetlands
wetlands
4.0
4.5
5.0
5.5
6.0
6.5
7.0
7.5
8.0
8.5
pH
0
100
200
300
400
500
600
700
Spec
ific
cond
ucta
nce,
inm
icro
siem
ens
per c
entim
eter
Pike Hill Brook watershed Cookville Brook watershed
2 1 4F 4 5A 4A 4C 4E 5 6 10D 10A 10B 11 12 10 10C
2 1 4F 4 5A 4A 4C 4E 5 6 10D 10A 10B 11 12 10 10C
Pike Hill Brook watershed Cookville Brook watershed
A
B
Background samplePike Hill Brook sampleTributary to Cookville Brook sample
Background samplePike Hill Brook sampleTributary to Cookville Brook sample
In situ pore water
Surface waterEXPLANATION
Figure 6.
Figure 6. Downstream variation in (A) pH and (B) specific conductance in surface and in situ pore water at the Pike Hill copper mine study area, Corinth, Vermont.
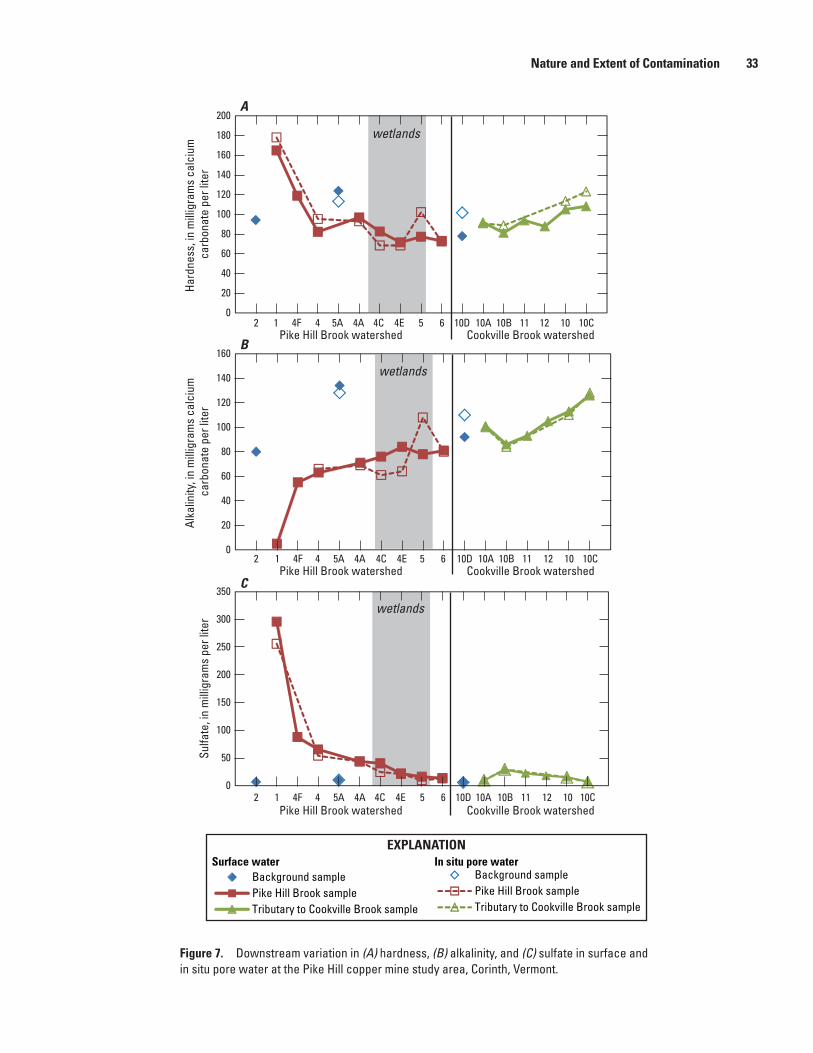
Nature and Extent of Contamination 33
wetlands
0
20
40
60
80
100
120
140
160
180
200
Hard
ness
, in
mill
igra
ms
calc
ium
ca
rbon
ate
per l
iter
0
20
40
60
80
100
120
140
160
Alka
linity
, in
mill
igra
ms
calc
ium
ca
rbon
ate
per l
iter
0
50
100
150
200
250
300
350
Sulfa
te, i
n m
illig
ram
s pe
r lite
r
Pike Hill Brook watershed Cookville Brook watershed
wetlands
Pike Hill Brook watershed Cookville Brook watershed
Pike Hill Brook watershed Cookville Brook watershed
wetlands
A
B
C
2 1 4F 4 5A 4A 4C 4E 5 6 10D 10A 10B 11 12 10 10C
2 1 4F 4 5A 4A 4C 4E 5 6 10D 10A 10B 11 12 10 10C
2 1 4F 4 5A 4A 4C 4E 5 6 10D 10A 10B 11 12 10 10C
Figure 7.
Background samplePike Hill Brook sample Tributary to Cookville Brook sample
Background samplePike Hill Brook sampleTributary to Cookville Brook sample
In situ pore waterSurface waterEXPLANATION
Figure 7. Downstream variation in (A) hardness, (B) alkalinity, and (C) sulfate in surface and in situ pore water at the Pike Hill copper mine study area, Corinth, Vermont.
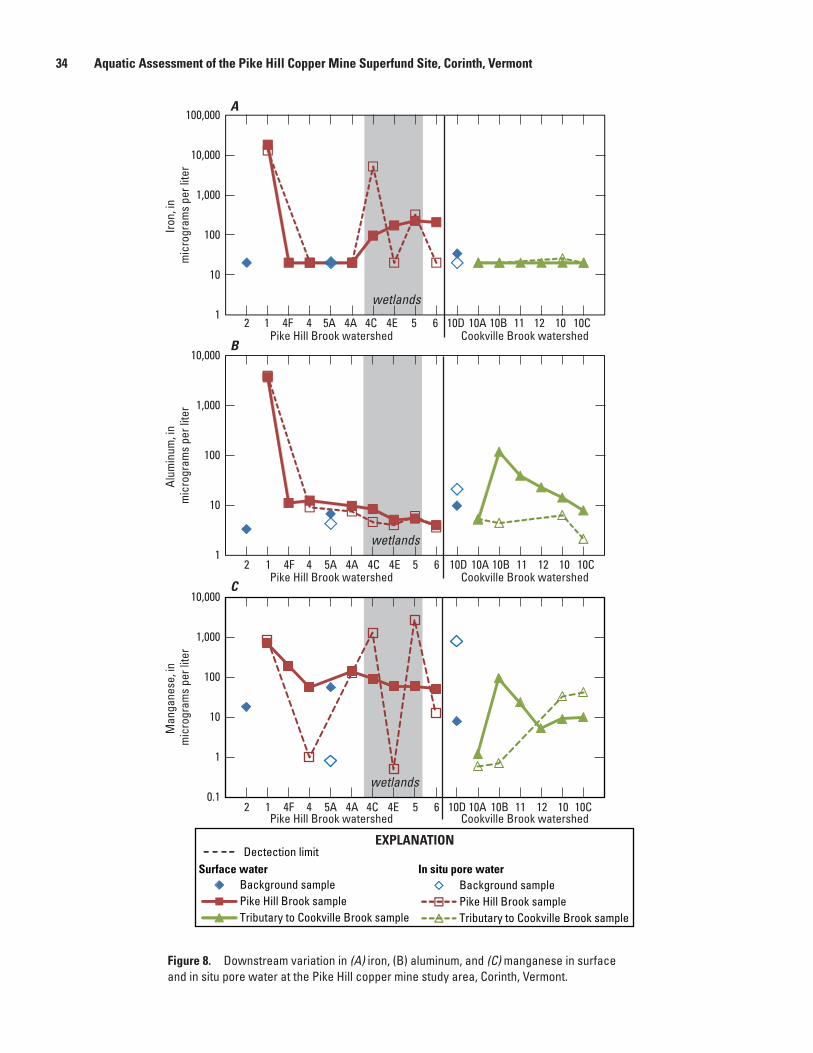
34 Aquatic Assessment of the Pike Hill Copper Mine Superfund Site, Corinth, Vermont
1
10
100
1,000
10,000
100,000
1
10
100
1,000
10,000
Alum
inum
, in
mic
rogr
ams
per l
iter
Iron,
in
mic
rogr
ams
per l
iter
Pike Hill Brook watershed Cookville Brook watershed
wetlands
Pike Hill Brook watershed Cookville Brook watershed
wetlands
0.1
1
10
100
1,000
10,000
Man
gane
se, i
n m
icro
gram
s pe
r lite
r
Pike Hill Brook watershed Cookville Brook watershed
wetlands
A
B
C
2 1 4F 4 5A 4A 4C 4E 5 6 10D 10A 10B 11 12 10 10C
2 1 4F 4 5A 4A 4C 4E 5 6 10D 10A 10B 11 12 10 10C
2 1 4F 4 5A 4A 4C 4E 5 6 10D 10A 10B 11 12 10 10C
Figure 8.
Background samplePike Hill Brook sampleTributary to Cookville Brook sample
Background samplePike Hill Brook sampleTributary to Cookville Brook sample
In situ pore waterSurface water
EXPLANATIONDectection limit
Figure 8. Downstream variation in (A) iron, (B) aluminum, and (C) manganese in surface and in situ pore water at the Pike Hill copper mine study area, Corinth, Vermont.

Nature and Extent of Contamination 35
Cadm
ium
, in
mic
rogr
ams
per l
iter
Pike Hill Brook watershed Cookville Brook watershed
Copp
er, i
n m
icro
gram
s pe
r lite
rZi
nc, i
n m
icro
gram
s pe
r lite
r
Pike Hill Brook watershed Cookville Brook watershed
Pike Hill Brook watershed Cookville Brook watershed
2 1 4F 4 5A 4A 4C 4E 5 6 10D 10A 10B 11 12 10 10C
2 1 4F 4 5A 4A 4C 4E 5 6 10D 10A 10B 11 12 10 10C
2 1 4F 4 5A 4A 4C 4E 5 6 10D 10A 10B 11 12 10 10C
wetlands
wetlands
wetlands
0.01
0.1
1
10
0.1
1
10
100
1,000
10,000
1
10
100
1,000
10,000
A
B
C
Figure 9.
Background samplePike Hill Brook sampleTributary to Cookville Brook sample
Background samplePike Hill Brook sampleTributary to Cookville Brook sample
In situ pore waterSurface water
EXPLANATIONDectection limit
Figure 9. Downstream variation in (A) cadmium, (B) copper, and (C) zinc in surface and in situ pore water at the Pike Hill copper mine study area, Corinth, Vermont.
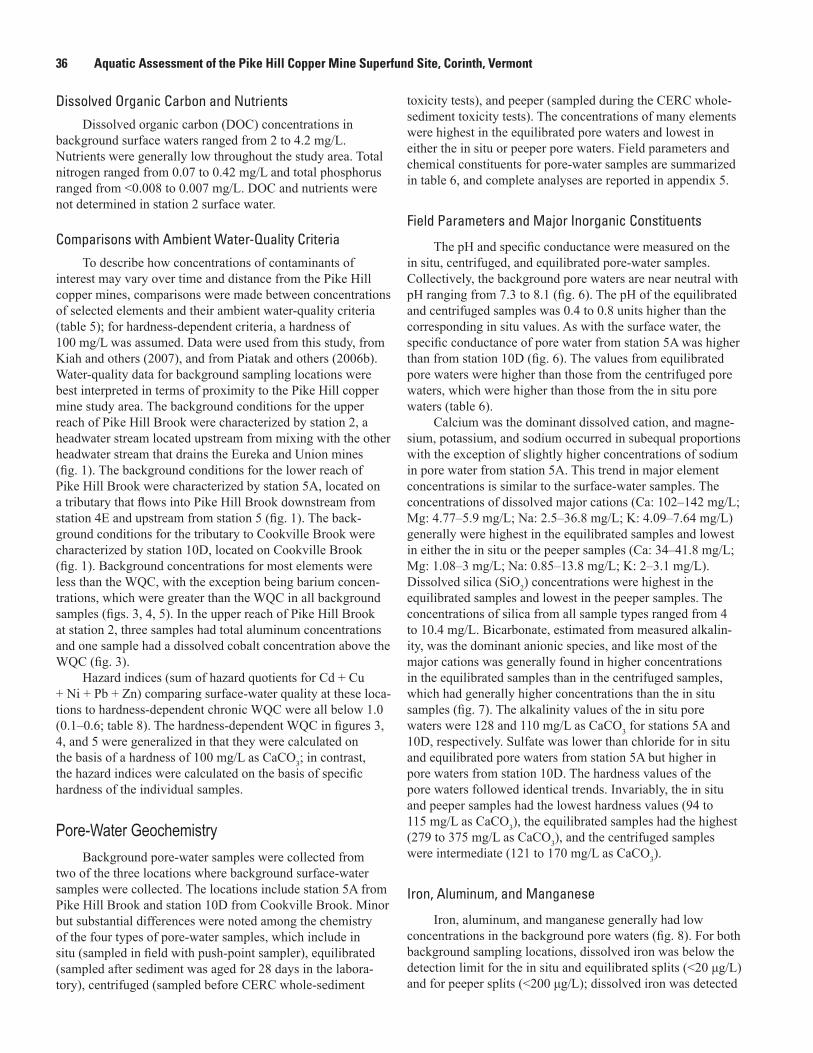
36 Aquatic Assessment of the Pike Hill Copper Mine Superfund Site, Corinth, Vermont
Dissolved Organic Carbon and NutrientsDissolved organic carbon (DOC) concentrations in
background surface waters ranged from 2 to 4.2 mg/L. Nutrients were generally low throughout the study area. Total nitrogen ranged from 0.07 to 0.42 mg/L and total phosphorus ranged from <0.008 to 0.007 mg/L. DOC and nutrients were not determined in station 2 surface water.
Comparisons with Ambient Water-Quality CriteriaTo describe how concentrations of contaminants of
interest may vary over time and distance from the Pike Hill copper mines, comparisons were made between concentrations of selected elements and their ambient water-quality criteria (table 5); for hardness-dependent criteria, a hardness of 100 mg/L was assumed. Data were used from this study, from Kiah and others (2007), and from Piatak and others (2006b). Water-quality data for background sampling locations were best interpreted in terms of proximity to the Pike Hill copper mine study area. The background conditions for the upper reach of Pike Hill Brook were characterized by station 2, a headwater stream located upstream from mixing with the other headwater stream that drains the Eureka and Union mines (fig. 1). The background conditions for the lower reach of Pike Hill Brook were characterized by station 5A, located on a tributary that flows into Pike Hill Brook downstream from station 4E and upstream from station 5 (fig. 1). The back-ground conditions for the tributary to Cookville Brook were characterized by station 10D, located on Cookville Brook (fig. 1). Background concentrations for most elements were less than the WQC, with the exception being barium concen-trations, which were greater than the WQC in all background samples (figs. 3, 4, 5). In the upper reach of Pike Hill Brook at station 2, three samples had total aluminum concentrations and one sample had a dissolved cobalt concentration above the WQC (fig. 3).
Hazard indices (sum of hazard quotients for Cd + Cu + Ni + Pb + Zn) comparing surface-water quality at these loca-tions to hardness-dependent chronic WQC were all below 1.0 (0.1–0.6; table 8). The hardness-dependent WQC in figures 3, 4, and 5 were generalized in that they were calculated on the basis of a hardness of 100 mg/L as CaCO3; in contrast, the hazard indices were calculated on the basis of specific hardness of the individual samples.
Pore-Water GeochemistryBackground pore-water samples were collected from
two of the three locations where background surface-water samples were collected. The locations include station 5A from Pike Hill Brook and station 10D from Cookville Brook. Minor but substantial differences were noted among the chemistry of the four types of pore-water samples, which include in situ (sampled in field with push-point sampler), equilibrated (sampled after sediment was aged for 28 days in the labora-tory), centrifuged (sampled before CERC whole-sediment
toxicity tests), and peeper (sampled during the CERC whole-sediment toxicity tests). The concentrations of many elements were highest in the equilibrated pore waters and lowest in either the in situ or peeper pore waters. Field parameters and chemical constituents for pore-water samples are summarized in table 6, and complete analyses are reported in appendix 5.
Field Parameters and Major Inorganic Constituents
The pH and specific conductance were measured on the in situ, centrifuged, and equilibrated pore-water samples. Collectively, the background pore waters are near neutral with pH ranging from 7.3 to 8.1 (fig. 6). The pH of the equilibrated and centrifuged samples was 0.4 to 0.8 units higher than the corresponding in situ values. As with the surface water, the specific conductance of pore water from station 5A was higher than from station 10D (fig. 6). The values from equilibrated pore waters were higher than those from the centrifuged pore waters, which were higher than those from the in situ pore waters (table 6).
Calcium was the dominant dissolved cation, and magne-sium, potassium, and sodium occurred in subequal proportions with the exception of slightly higher concentrations of sodium in pore water from station 5A. This trend in major element concentrations is similar to the surface-water samples. The concentrations of dissolved major cations (Ca: 102–142 mg/L; Mg: 4.77–5.9 mg/L; Na: 2.5–36.8 mg/L; K: 4.09–7.64 mg/L) generally were highest in the equilibrated samples and lowest in either the in situ or the peeper samples (Ca: 34–41.8 mg/L; Mg: 1.08–3 mg/L; Na: 0.85–13.8 mg/L; K: 2–3.1 mg/L). Dissolved silica (SiO2) concentrations were highest in the equilibrated samples and lowest in the peeper samples. The concentrations of silica from all sample types ranged from 4 to 10.4 mg/L. Bicarbonate, estimated from measured alkalin-ity, was the dominant anionic species, and like most of the major cations was generally found in higher concentrations in the equilibrated samples than in the centrifuged samples, which had generally higher concentrations than the in situ samples (fig. 7). The alkalinity values of the in situ pore waters were 128 and 110 mg/L as CaCO3 for stations 5A and 10D, respectively. Sulfate was lower than chloride for in situ and equilibrated pore waters from station 5A but higher in pore waters from station 10D. The hardness values of the pore waters followed identical trends. Invariably, the in situ and peeper samples had the lowest hardness values (94 to 115 mg/L as CaCO3), the equilibrated samples had the highest (279 to 375 mg/L as CaCO3), and the centrifuged samples were intermediate (121 to 170 mg/L as CaCO3).
Iron, Aluminum, and Manganese
Iron, aluminum, and manganese generally had low concentrations in the background pore waters (fig. 8). For both background sampling locations, dissolved iron was below the detection limit for the in situ and equilibrated splits (<20 μg/L) and for peeper splits (<200 μg/L); dissolved iron was detected
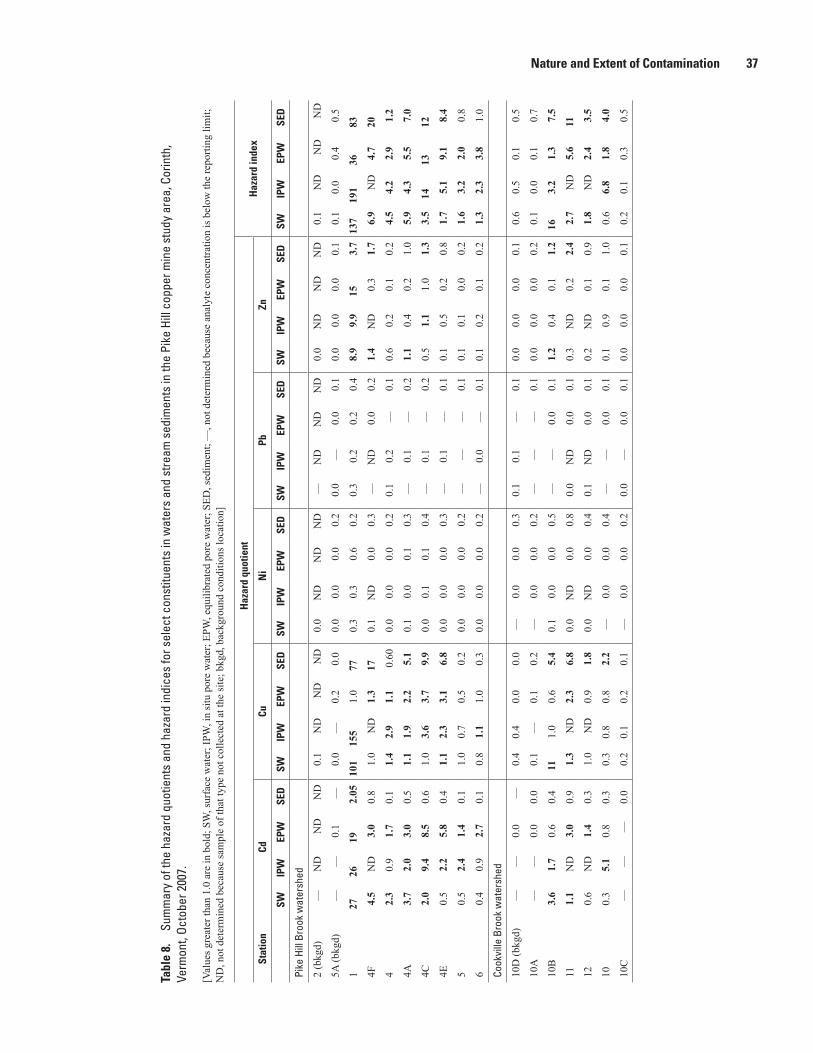
Nature and Extent of Contamination 37
Tabl
e 8.
Su
mm
ary
of th
e ha
zard
quo
tient
s an
d ha
zard
indi
ces
for s
elec
t con
stitu
ents
in w
ater
s an
d st
ream
sed
imen
ts in
the
Pike
Hill
cop
per m
ine
stud
y ar
ea, C
orin
th,
Verm
ont,
Octo
ber 2
007.
[Val
ues g
reat
er th
an 1
.0 a
re in
bol
d; S
W, s
urfa
ce w
ater
; IPW
, in
situ
por
e w
ater
; EPW
, equ
ilibr
ated
por
e w
ater
; SED
, sed
imen
t; —
, not
det
erm
ined
bec
ause
ana
lyte
con
cent
ratio
n is
bel
ow th
e re
porti
ng li
mit;
N
D, n
ot d
eter
min
ed b
ecau
se sa
mpl
e of
that
type
not
col
lect
ed a
t the
site
; bkg
d, b
ackg
roun
d co
nditi
ons l
ocat
ion]
Haz
ard
quot
ient
Haz
ard
inde
xSt
atio
nCd
Cu
N
i Pb
Zn
SWIP
WEP
WSE
DSW
IPW
EPW
SED
SWIP
WEP
WSE
DSW
IPW
EPW
SED
SWIP
WEP
WSE
DSW
IPW
EPW
SED
Pike
Hill
Bro
ok w
ater
shed
2 (b
kgd)
—N
DN
DN
D0.
1N
DN
DN
D0.
0N
DN
DN
D—
ND
ND
ND
0.0
ND
ND
ND
0.1
ND
ND
ND
5A (b
kgd)
——
0.1
—0.
0—
0.2
0.0
0.0
0.0
0.0
0.2
0.0
—0.
00.
10.
00.
00.
00.
10.
10.
00.
40.
5
127
2619
2.05
101
155
1.0
770.
30.
30.
60.
20.
30.
20.
20.
48.
99.
915
3.7
137
191
3683
4F4.
5N
D3.
00.
81.
0N
D1.
317
0.1
ND
0.0
0.3
—N
D0.
00.
21.
4N
D0.
31.
76.
9N
D4.
720
42.
30.
91.
70.
11.
42.
91.
10.
600.
00.
00.
00.
20.
10.
2—
0.1
0.6
0.2
0.1
0.2
4.5
4.2
2.9
1.2
4A3.
72.
03.
00.
51.
11.
92.
25.
10.
10.
00.
10.
3—
0.1
—0.
21.
10.
40.
21.
05.
94.
35.
57.
0
4C2.
09.
48.
50.
61.
03.
63.
79.
90.
00.
10.
10.
4—
0.1
—0.
20.
51.
11.
01.
33.
514
1312
4E0.
52.
25.
80.
41.
12.
33.
16.
80.
00.
00.
00.
3—
0.1
—0.
10.
10.
50.
20.
81.
75.
19.
18.
4
50.
52.
41.
40.
11.
00.
70.
50.
20.
00.
00.
00.
2—
——
0.1
0.1
0.1
0.0
0.2
1.6
3.2
2.0
0.8
60.
40.
92.
70.
10.
81.
11.
00.
30.
00.
00.
00.
2—
0.0
—0.
10.
10.
20.
10.
21.
32.
33.
81.
0
Cook
ville
Bro
ok w
ater
shed
10D
(bkg
d)—
—0.
0—
0.4
0.4
0.0
0.0
—0.
00.
00.
30.
10.
1—
0.1
0.0
0.0
0.0
0.1
0.6
0.5
0.1
0.5
10A
——
0.0
0.0
0.1
—0.
10.
2—
0.0
0.0
0.2
——
—0.
10.
00.
00.
00.
20.
10.
00.
10.
7
10B
3.6
1.7
0.6
0.4
111.
00.
65.
40.
10.
00.
00.
5—
—0.
00.
11.
20.
40.
11.
216
3.2
1.3
7.5
111.
1N
D3.
00.
91.
3N
D2.
36.
80.
0N
D0.
00.
80.
0N
D0.
00.
10.
3N
D0.
22.
42.
7N
D5.
611
120.
6N
D1.
40.
31.
0N
D0.
91.
80.
0N
D0.
00.
40.
1N
D0.
00.
10.
2N
D0.
10.
91.
8N
D2.
43.
5
100.
35.
10.
80.
30.
30.
80.
82.
2—
0.0
0.0
0.4
——
0.0
0.1
0.1
0.9
0.1
1.0
0.6
6.8
1.8
4.0
10C
——
—0.
00.
20.
10.
20.
1—
0.0
0.0
0.2
0.0
—0.
00.
10.
00.
00.
00.
10.
20.
10.
30.
5
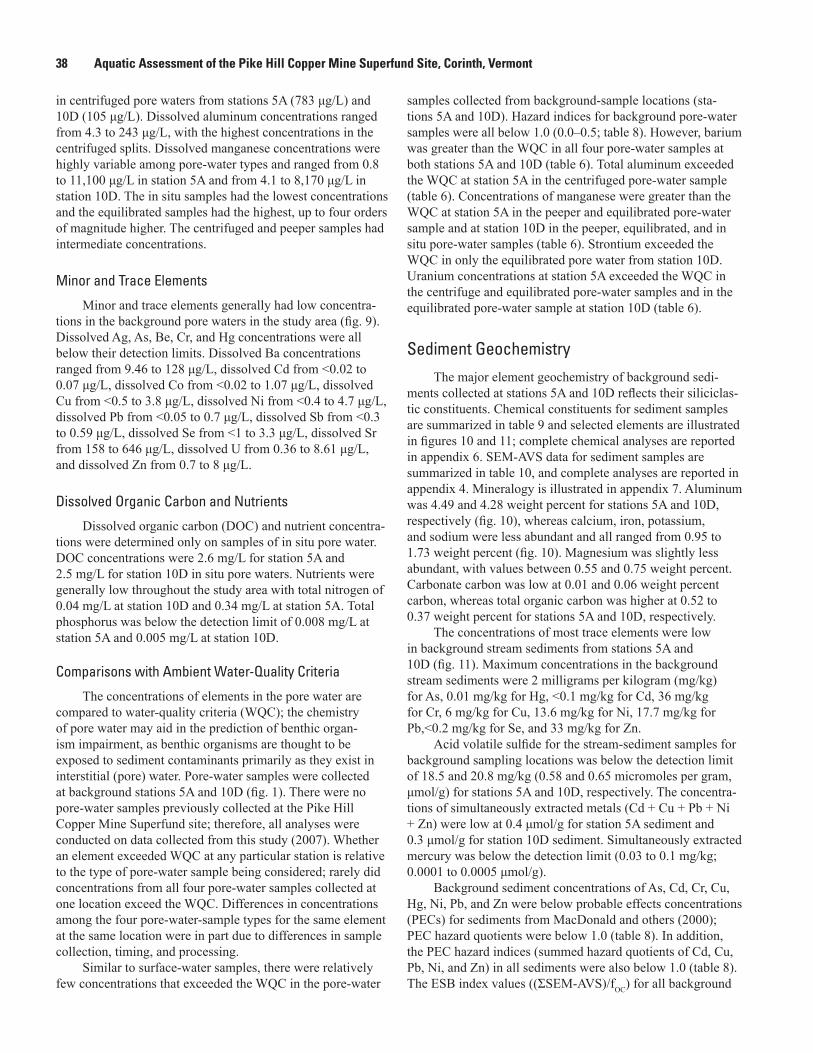
38 Aquatic Assessment of the Pike Hill Copper Mine Superfund Site, Corinth, Vermont
in centrifuged pore waters from stations 5A (783 μg/L) and 10D (105 μg/L). Dissolved aluminum concentrations ranged from 4.3 to 243 μg/L, with the highest concentrations in the centrifuged splits. Dissolved manganese concentrations were highly variable among pore-water types and ranged from 0.8 to 11,100 μg/L in station 5A and from 4.1 to 8,170 μg/L in station 10D. The in situ samples had the lowest concentrations and the equilibrated samples had the highest, up to four orders of magnitude higher. The centrifuged and peeper samples had intermediate concentrations.
Minor and Trace Elements
Minor and trace elements generally had low concentra-tions in the background pore waters in the study area (fig. 9). Dissolved Ag, As, Be, Cr, and Hg concentrations were all below their detection limits. Dissolved Ba concentrations ranged from 9.46 to 128 μg/L, dissolved Cd from <0.02 to 0.07 μg/L, dissolved Co from <0.02 to 1.07 μg/L, dissolved Cu from <0.5 to 3.8 μg/L, dissolved Ni from <0.4 to 4.7 μg/L, dissolved Pb from <0.05 to 0.7 μg/L, dissolved Sb from <0.3 to 0.59 μg/L, dissolved Se from <1 to 3.3 μg/L, dissolved Sr from 158 to 646 μg/L, dissolved U from 0.36 to 8.61 μg/L, and dissolved Zn from 0.7 to 8 μg/L.
Dissolved Organic Carbon and Nutrients
Dissolved organic carbon (DOC) and nutrient concentra-tions were determined only on samples of in situ pore water. DOC concentrations were 2.6 mg/L for station 5A and 2.5 mg/L for station 10D in situ pore waters. Nutrients were generally low throughout the study area with total nitrogen of 0.04 mg/L at station 10D and 0.34 mg/L at station 5A. Total phosphorus was below the detection limit of 0.008 mg/L at station 5A and 0.005 mg/L at station 10D.
Comparisons with Ambient Water-Quality Criteria
The concentrations of elements in the pore water are compared to water-quality criteria (WQC); the chemistry of pore water may aid in the prediction of benthic organ-ism impairment, as benthic organisms are thought to be exposed to sediment contaminants primarily as they exist in interstitial (pore) water. Pore-water samples were collected at background stations 5A and 10D (fig. 1). There were no pore-water samples previously collected at the Pike Hill Copper Mine Superfund site; therefore, all analyses were conducted on data collected from this study (2007). Whether an element exceeded WQC at any particular station is relative to the type of pore-water sample being considered; rarely did concentrations from all four pore-water samples collected at one location exceed the WQC. Differences in concentrations among the four pore-water-sample types for the same element at the same location were in part due to differences in sample collection, timing, and processing.
Similar to surface-water samples, there were relatively few concentrations that exceeded the WQC in the pore-water
samples collected from background-sample locations (sta-tions 5A and 10D). Hazard indices for background pore-water samples were all below 1.0 (0.0–0.5; table 8). However, barium was greater than the WQC in all four pore-water samples at both stations 5A and 10D (table 6). Total aluminum exceeded the WQC at station 5A in the centrifuged pore-water sample (table 6). Concentrations of manganese were greater than the WQC at station 5A in the peeper and equilibrated pore-water sample and at station 10D in the peeper, equilibrated, and in situ pore-water samples (table 6). Strontium exceeded the WQC in only the equilibrated pore water from station 10D. Uranium concentrations at station 5A exceeded the WQC in the centrifuge and equilibrated pore-water samples and in the equilibrated pore-water sample at station 10D (table 6).
Sediment GeochemistryThe major element geochemistry of background sedi-
ments collected at stations 5A and 10D reflects their siliciclas-tic constituents. Chemical constituents for sediment samples are summarized in table 9 and selected elements are illustrated in figures 10 and 11; complete chemical analyses are reported in appendix 6. SEM-AVS data for sediment samples are summarized in table 10, and complete analyses are reported in appendix 4. Mineralogy is illustrated in appendix 7. Aluminum was 4.49 and 4.28 weight percent for stations 5A and 10D, respectively (fig. 10), whereas calcium, iron, potassium, and sodium were less abundant and all ranged from 0.95 to 1.73 weight percent (fig. 10). Magnesium was slightly less abundant, with values between 0.55 and 0.75 weight percent. Carbonate carbon was low at 0.01 and 0.06 weight percent carbon, whereas total organic carbon was higher at 0.52 to 0.37 weight percent for stations 5A and 10D, respectively.
The concentrations of most trace elements were low in background stream sediments from stations 5A and 10D (fig. 11). Maximum concentrations in the background stream sediments were 2 milligrams per kilogram (mg/kg) for As, 0.01 mg/kg for Hg, <0.1 mg/kg for Cd, 36 mg/kg for Cr, 6 mg/kg for Cu, 13.6 mg/kg for Ni, 17.7 mg/kg for Pb,<0.2 mg/kg for Se, and 33 mg/kg for Zn.
Acid volatile sulfide for the stream-sediment samples for background sampling locations was below the detection limit of 18.5 and 20.8 mg/kg (0.58 and 0.65 micromoles per gram, μmol/g) for stations 5A and 10D, respectively. The concentra-tions of simultaneously extracted metals (Cd + Cu + Pb + Ni + Zn) were low at 0.4 μmol/g for station 5A sediment and 0.3 μmol/g for station 10D sediment. Simultaneously extracted mercury was below the detection limit (0.03 to 0.1 mg/kg; 0.0001 to 0.0005 μmol/g).
Background sediment concentrations of As, Cd, Cr, Cu, Hg, Ni, Pb, and Zn were below probable effects concentrations (PECs) for sediments from MacDonald and others (2000); PEC hazard quotients were below 1.0 (table 8). In addition, the PEC hazard indices (summed hazard quotients of Cd, Cu, Pb, Ni, and Zn) in all sediments were also below 1.0 (table 8). The ESB index values ((ƩSEM-AVS)/fOC) for all background
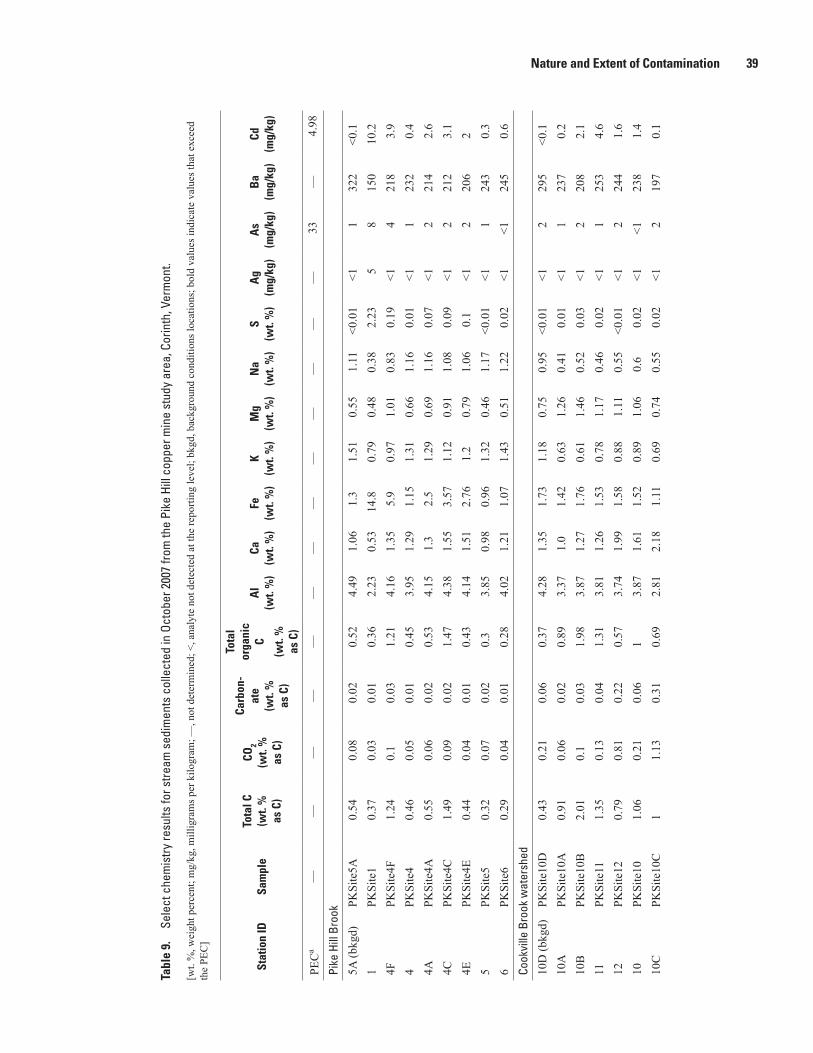
Nature and Extent of Contamination 39
Tabl
e 9.
Se
lect
che
mis
try re
sults
for s
tream
sed
imen
ts c
olle
cted
in O
ctob
er 2
007
from
the
Pike
Hill
cop
per m
ine
stud
y ar
ea, C
orin
th, V
erm
ont.
[wt.
%, w
eigh
t per
cent
; mg/
kg, m
illig
ram
s per
kilo
gram
; —, n
ot d
eter
min
ed; <
, ana
lyte
not
det
ecte
d at
the
repo
rting
leve
l; bk
gd, b
ackg
roun
d co
nditi
ons l
ocat
ions
; bol
d va
lues
indi
cate
val
ues t
hat e
xcee
d th
e PE
C]
Stat
ion
IDSa
mpl
eTo
tal C
(wt.
%
as C
)
CO2
(wt.
%
as C
)
Carb
on-
ate
(wt.
%
as C
)
Tota
l or
gani
c C
Al
(wt.
%)
Ca(w
t. %
)Fe
(wt.
%)
K(w
t. %
)M
g(w
t. %
)N
a(w
t. %
)S
(wt.
%)
Ag
(mg/
kg)
As
(mg/
kg)
Ba
(mg/
kg)
Cd(m
g/kg
)(w
t. %
as
C)
PEC
a—
——
——
——
——
——
——
33—
4.98
Pike
Hill
Bro
ok
5A (b
kgd)
PKSi
te5A
0.54
0.08
0.02
0.52
4.49
1.06
1.3
1.51
0.55
1.11
<0.0
1<1
132
2<0
.11
PKSi
te1
0.37
0.03
0.01
0.36
2.23
0.53
14.8
0.79
0.48
0.38
2.23
58
150
10.2
4FPK
Site
4F1.
240.
10.
031.
214.
161.
355.
90.
971.
010.
830.
19<1
421
83.
94
PKSi
te4
0.46
0.05
0.01
0.45
3.95
1.29
1.15
1.31
0.66
1.16
0.01
<11
232
0.4
4APK
Site
4A0.
550.
060.
020.
534.
151.
32.
51.
290.
691.
160.
07<1
221
42.
64C
PKSi
te4C
1.49
0.09
0.02
1.47
4.38
1.55
3.57
1.12
0.91
1.08
0.09
<12
212
3.1
4EPK
Site
4E0.
440.
040.
010.
434.
141.
512.
761.
20.
791.
060.
1<1
220
62
5PK
Site
50.
320.
070.
020.
33.
850.
980.
961.
320.
461.
17<0
.01
<11
243
0.3
6PK
Site
60.
290.
040.
010.
284.
021.
211.
071.
430.
511.
220.
02<1
<124
50.
6Co
okvi
lle B
rook
wat
ersh
ed
10D
(bkg
d)PK
Site
10D
0.43
0.21
0.06
0.37
4.28
1.35
1.73
1.18
0.75
0.95
<0.0
1<1
229
5<0
.110
APK
Site
10A
0.91
0.06
0.02
0.89
3.37
1.0
1.42
0.63
1.26
0.41
0.01
<11
237
0.2
10B
PKSi
te10
B2.
010.
10.
031.
983.
871.
271.
760.
611.
460.
520.
03<1
220
82.
111
PKSi
te11
1.35
0.13
0.04
1.31
3.81
1.26
1.53
0.78
1.17
0.46
0.02
<11
253
4.6
12PK
Site
120.
790.
810.
220.
573.
741.
991.
580.
881.
110.
55<0
.01
<12
244
1.6
10PK
Site
101.
060.
210.
061
3.87
1.61
1.52
0.89
1.06
0.6
0.02
<1<1
238
1.4
10C
PKSi
te10
C1
1.13
0.31
0.69
2.81
2.18
1.11
0.69
0.74
0.55
0.02
<12
197
0.1
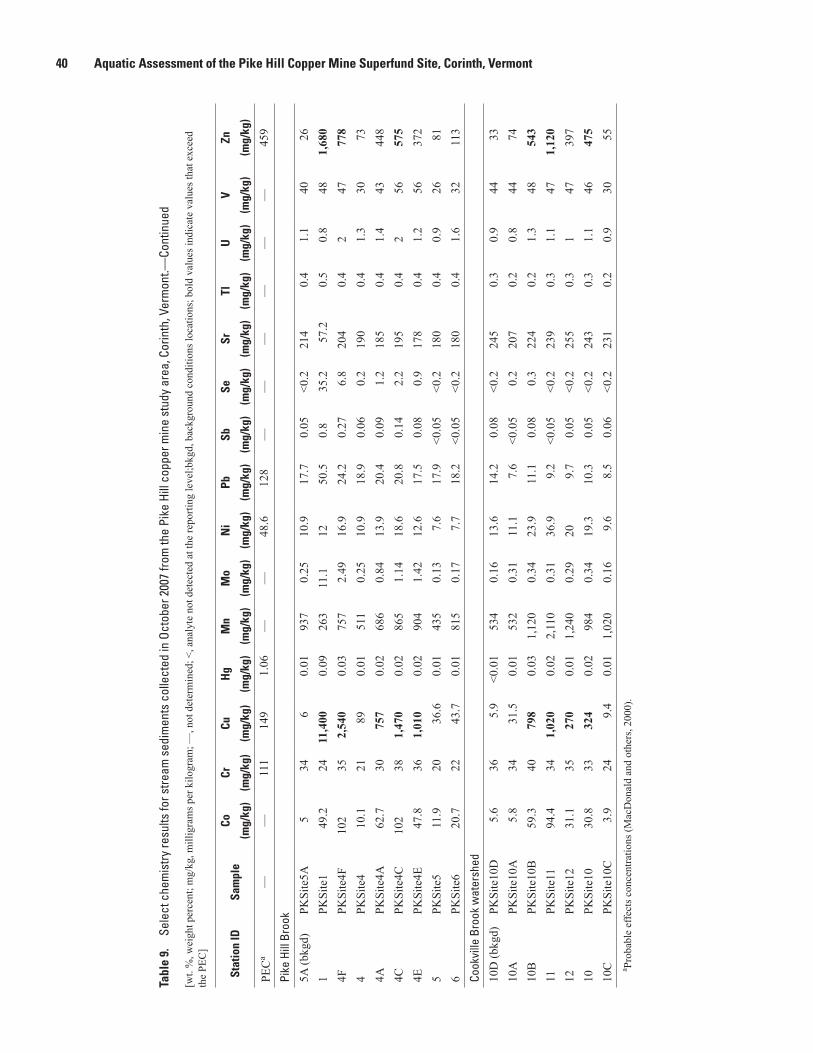
40 Aquatic Assessment of the Pike Hill Copper Mine Superfund Site, Corinth, Vermont
Tabl
e 9.
Se
lect
che
mis
try re
sults
for s
tream
sed
imen
ts c
olle
cted
in O
ctob
er 2
007
from
the
Pike
Hill
cop
per m
ine
stud
y ar
ea, C
orin
th, V
erm
ont.—
Cont
inue
d
[wt.
%, w
eigh
t per
cent
; mg/
kg, m
illig
ram
s per
kilo
gram
; —, n
ot d
eter
min
ed; <
, ana
lyte
not
det
ecte
d at
the
repo
rting
leve
l;bkg
d, b
ackg
roun
d co
nditi
ons l
ocat
ions
; bol
d va
lues
indi
cate
val
ues t
hat e
xcee
d th
e PE
C]
Stat
ion
IDSa
mpl
eCo
CrCu
Hg
Mn
Mo
Ni
PbSb
SeSr
TlU
VZn
(mg/
kg)
(mg/
kg)
(mg/
kg)
(mg/
kg)
(mg/
kg)
(mg/
kg)
(mg/
kg)
(mg/
kg)
(mg/
kg)
(mg/
kg)
(mg/
kg)
(mg/
kg)
(mg/
kg)
(mg/
kg)
(mg/
kg)
PEC
a—
—11
114
91.
06—
—48
.612
8—
——
——
—45
9
Pike
Hill
Bro
ok
5A (b
kgd)
PKSi
te5A
534
60.
0193
70.
2510
.917
.70.
05<0
.221
40.
41.
140
261
PKSi
te1
49.2
2411
,400
0.09
263
11.1
1250
.50.
835
.257
.20.
50.
848
1,68
04F
PKSi
te4F
102
352,
540
0.03
757
2.49
16.9
24.2
0.27
6.8
204
0.4
247
778
4PK
Site
410
.121
890.
0151
10.
2510
.918
.90.
060.
219
00.
41.
330
734A
PKSi
te4A
62.7
3075
70.
0268
60.
8413
.920
.40.
091.
218
50.
41.
443
448
4CPK
Site
4C10
238
1,47
00.
0286
51.
1418
.620
.80.
142.
219
50.
42
5657
54E
PKSi
te4E
47.8
361,
010
0.02
904
1.42
12.6
17.5
0.08
0.9
178
0.4
1.2
5637
25
PKSi
te5
11.9
2036
.60.
0143
50.
137.
617
.9<0
.05
<0.2
180
0.4
0.9
2681
6PK
Site
620
.722
43.7
0.01
815
0.17
7.7
18.2
<0.0
5<0
.218
00.
41.
632
113
Cook
ville
Bro
ok w
ater
shed
10D
(bkg
d)PK
Site
10D
5.6
365.
9<0
.01
534
0.16
13.6
14.2
0.08
<0.2
245
0.3
0.9
4433
10A
PKSi
te10
A5.
834
31.5
0.01
532
0.31
11.1
7.6
<0.0
50.
220
70.
20.
844
7410
BPK
Site
10B
59.3
4079
80.
031,
120
0.34
23.9
11.1
0.08
0.3
224
0.2
1.3
4854
311
PKSi
te11
94.4
341,
020
0.02
2,11
00.
3136
.99.
2<0
.05
<0.2
239
0.3
1.1
471,
120
12PK
Site
1231
.135
270
0.01
1,24
00.
2920
9.7
0.05
<0.2
255
0.3
147
397
10PK
Site
1030
.833
324
0.02
984
0.34
19.3
10.3
0.05
<0.2
243
0.3
1.1
4647
510
CPK
Site
10C
3.9
249.
40.
011,
020
0.16
9.6
8.5
0.06
<0.2
231
0.2
0.9
3055
a Prob
able
effe
cts c
once
ntra
tions
(Mac
Don
ald
and
othe
rs, 2
000)
.
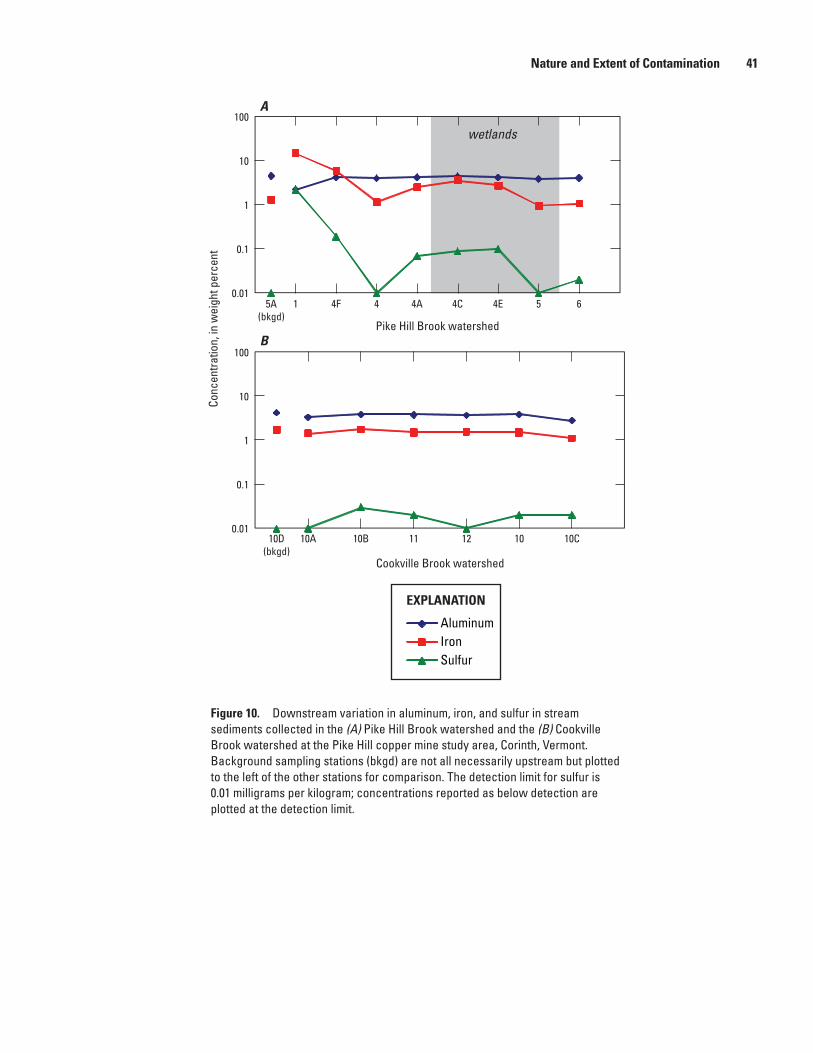
Nature and Extent of Contamination 41
0.01
0.1
1
10
100
wetlands
Pike Hill Brook watershed
Cookville Brook watershed
0.01
0.1
1
10
100
Conc
entra
tion,
in w
eigh
t per
cent
A
B
1 4F 45A(bkgd)
4A 4C 4E 5 6
10D(bkgd)
10A 10B 11 12 10 10C
Figure 10.
AluminumIronSulfur
EXPLANATION
Figure 10. Downstream variation in aluminum, iron, and sulfur in stream sediments collected in the (A) Pike Hill Brook watershed and the (B) Cookville Brook watershed at the Pike Hill copper mine study area, Corinth, Vermont. Background sampling stations (bkgd) are not all necessarily upstream but plotted to the left of the other stations for comparison. The detection limit for sulfur is 0.01 milligrams per kilogram; concentrations reported as below detection are plotted at the detection limit.
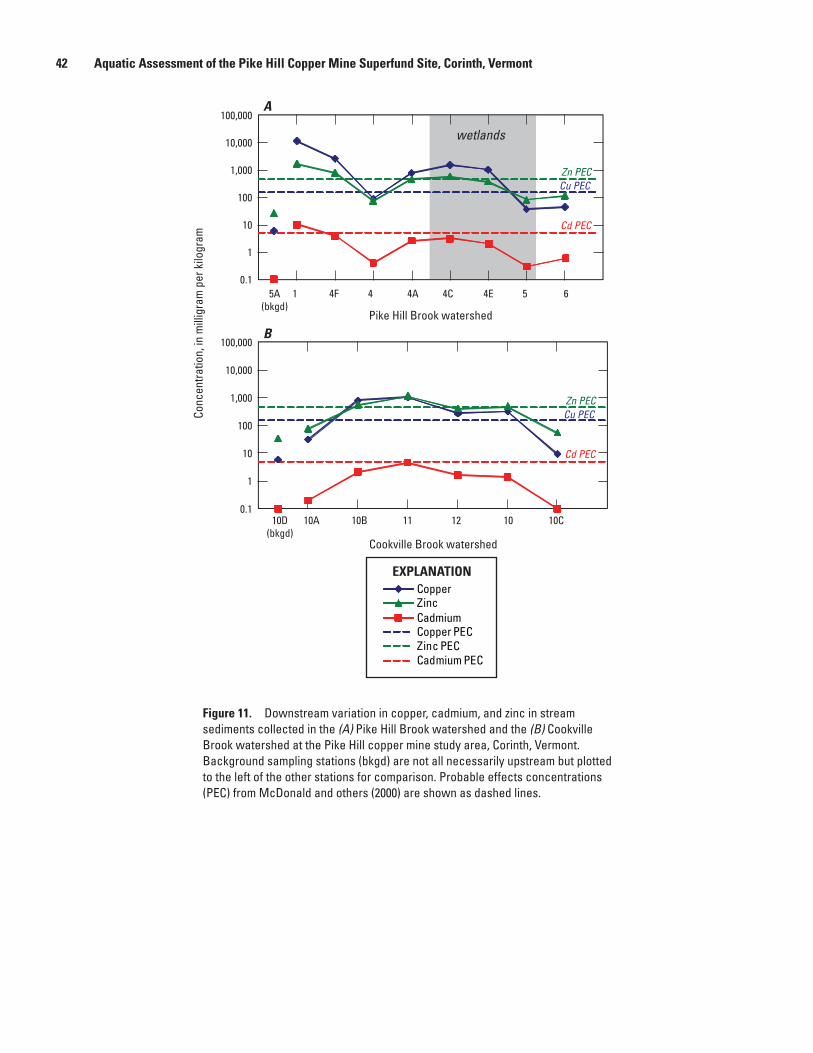
42 Aquatic Assessment of the Pike Hill Copper Mine Superfund Site, Corinth, Vermont
0.1
1
10
100
1,000
10,000
100,000
0.1
1
10
100
1,000
10,000
100,000
Pike Hill Brook watershed
Cookville Brook watershed
wetlands
Zn PECCu PEC
Cd PEC
Zn PECCu PEC
Cd PEC
Conc
entra
tion,
in m
illig
ram
per
kilo
gram
A
B
1 4F 45A(bkgd)
4A 4C 4E 5 6
10D(bkgd)
10A 10B 11 12 10 10C
Figure 11.
Copper
CadmiumZinc
Copper PECZinc PECCadmium PEC
EXPLANATION
Figure 11. Downstream variation in copper, cadmium, and zinc in stream sediments collected in the (A) Pike Hill Brook watershed and the (B) Cookville Brook watershed at the Pike Hill copper mine study area, Corinth, Vermont. Background sampling stations (bkgd) are not all necessarily upstream but plotted to the left of the other stations for comparison. Probable effects concentrations (PEC) from McDonald and others (2000) are shown as dashed lines.
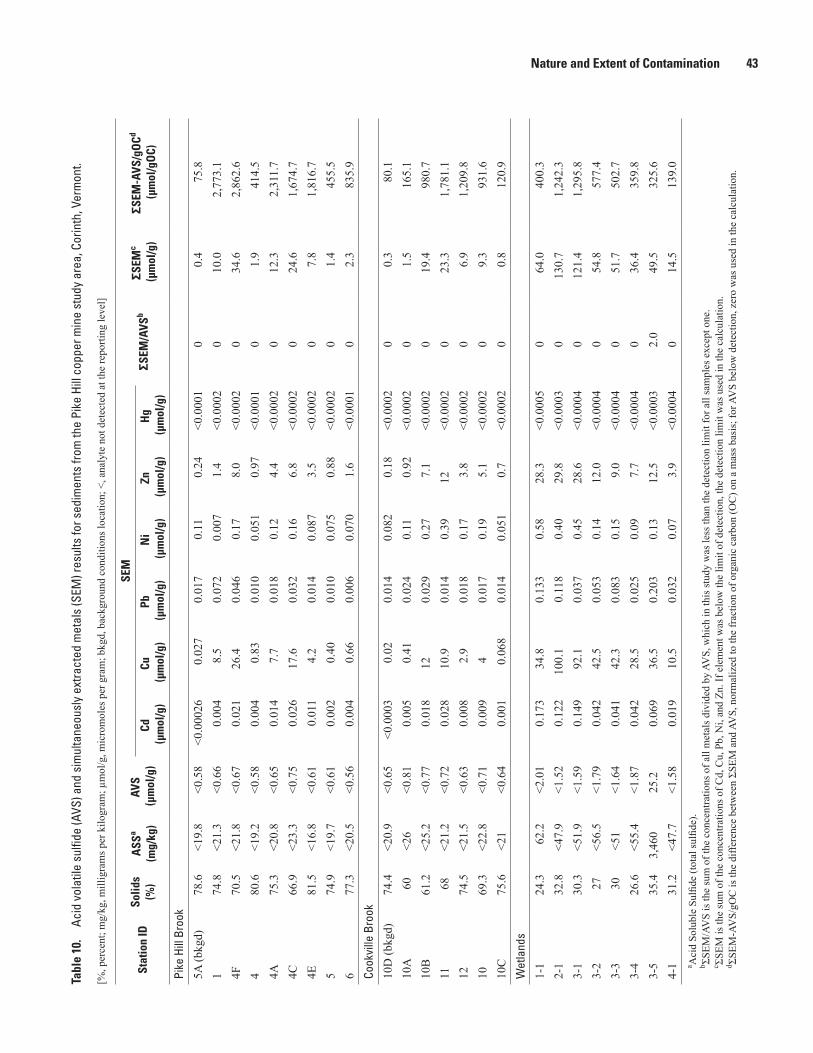
Nature and Extent of Contamination 43Ta
ble
10.
Acid
vol
atile
sul
fide
(AVS
) and
sim
ulta
neou
sly
extra
cted
met
als
(SEM
) res
ults
for s
edim
ents
from
the
Pike
Hill
cop
per m
ine
stud
y ar
ea, C
orin
th, V
erm
ont.
[%, p
erce
nt; m
g/kg
, mill
igra
ms p
er k
ilogr
am; µ
mol
/g, m
icro
mol
es p
er g
ram
; bkg
d, b
ackg
roun
d co
nditi
ons l
ocat
ion;
<, a
naly
te n
ot d
etec
ted
at th
e re
porti
ng le
vel]
Stat
ion
IDSo
lids
(%)
ASS
a
(mg/
kg)
AVS
(μm
ol/g
)
SEM
ΣSEM
/AVS
bΣS
EMc
(μm
ol/g
)ΣS
EM-A
VS/g
OCd
(μm
ol/g
OC)
Cd (μ
mol
/g)
Cu (μ
mol
/g)
Pb (μ
mol
/g)
Ni
(μm
ol/g
)Zn
(μm
ol/g
)H
g (μ
mol
/g)
Pike
Hill
Bro
ok
5A (b
kgd)
78.6
<19.
8<0
.58
<0.0
0026
0.02
70.
017
0.11
0.24
<0.0
001
00.
475
.81
74.8
<21.
3<0
.66
0.00
48.
50.
072
0.00
71.
4<0
.000
20
10.0
2,77
3.1
4F70
.5<2
1.8
<0.6
70.
021
26.4
0.04
60.
178.
0<0
.000
20
34.6
2,86
2.6
480
.6<1
9.2
<0.5
80.
004
0.83
0.01
00.
051
0.97
<0.0
001
01.
941
4.5
4A75
.3<2
0.8
<0.6
50.
014
7.7
0.01
80.
124.
4<0
.000
20
12.3
2,31
1.7
4C66
.9<2
3.3
<0.7
50.
026
17.6
0.03
20.
166.
8<0
.000
20
24.6
1,67
4.7
4E81
.5<1
6.8
<0.6
10.
011
4.2
0.01
40.
087
3.5
<0.0
002
07.
81,
816.
75
74.9
<19.
7<0
.61
0.00
20.
400.
010
0.07
50.
88<0
.000
20
1.4
455.
56
77.3
<20.
5<0
.56
0.00
40.
660.
006
0.07
01.
6<0
.000
10
2.3
835.
9Co
okvi
lle B
rook
10D
(bkg
d)74
.4<2
0.9
<0.6
5<0
.000
30.
020.
014
0.08
20.
18<0
.000
20
0.3
80.1
10A
60<2
6<0
.81
0.00
50.
410.
024
0.11
0.92
<0.0
002
01.
516
5.1
10B
61.2
<25.
2<0
.77
0.01
812
0.02
90.
277.
1<0
.000
20
19.4
980.
711
68<2
1.2
<0.7
20.
028
10.9
0.01
40.
3912
<0.0
002
023
.31,
781.
112
74.5
<21.
5<0
.63
0.00
82.
90.
018
0.17
3.8
<0.0
002
06.
91,
209.
810
69.3
<22.
8<0
.71
0.00
94
0.01
70.
195.
1<0
.000
20
9.3
931.
610
C75
.6<2
1<0
.64
0.00
10.
068
0.01
40.
051
0.7
<0.0
002
00.
812
0.9
Wet
land
s
1-1
24.3
62.2
<2.0
10.
173
34.8
0.13
30.
5828
.3<0
.000
50
64.0
400.
32-
132
.8<4
7.9
<1.5
20.
122
100.
10.
118
0.40
29.8
<0.0
003
013
0.7
1,24
2.3
3-1
30.3
<51.
9<1
.59
0.14
992
.10.
037
0.45
28.6
<0.0
004
012
1.4
1,29
5.8
3-2
27<5
6.5
<1.7
90.
042
42.5
0.05
30.
1412
.0<0
.000
40
54.8
577.
43-
330
<51
<1.6
40.
041
42.3
0.08
30.
159.
0<0
.000
40
51.7
502.
73-
426
.6<5
5.4
<1.8
70.
042
28.5
0.02
50.
097.
7<0
.000
40
36.4
359.
83-
535
.43,
460
25.2
0.06
936
.50.
203
0.13
12.5
<0.0
003
2.0
49.5
325.
64-
131
.2<4
7.7
<1.5
80.
019
10.5
0.03
20.
073.
9<0
.000
40
14.5
139.
0a A
cid
Solu
ble
Sulfi
de (t
otal
sulfi
de).
b ΣSEM
/AV
S is
the
sum
of t
he c
once
ntra
tions
of a
ll m
etal
s div
ided
by
AVS,
whi
ch in
this
stud
y w
as le
ss th
an th
e de
tect
ion
limit
for a
ll sa
mpl
es e
xcep
t one
.c ΣS
EM is
the
sum
of t
he c
once
ntra
tions
of C
d, C
u, P
b, N
i, an
d Zn
. If e
lem
ent w
as b
elow
the
limit
of d
etec
tion,
the
dete
ctio
n lim
it w
as u
sed
in th
e ca
lcul
atio
n.d ΣS
EM-A
VS/
gOC
is th
e di
ffere
nce
betw
een
ΣSEM
and
AV
S, n
orm
aliz
ed to
the
frac
tion
of o
rgan
ic c
arbo
n (O
C) o
n a
mas
s bas
is; f
or A
VS
belo
w d
etec
tion,
zer
o w
as u
sed
in th
e ca
lcul
atio
n.
44 Aquatic Assessment of the Pike Hill Copper Mine Superfund Site, Corinth, Vermont
stream-sediment sample ranges were 76 and 80 μmol/gOC for stations 5A and 10D, which were well within the predicted no-effects range (less than 130 μmol/gOC; USEPA, 2005; table 10).
The mineralogy of the two background conditions samples (5A and 10D) was similar, with quartz making up more than 50 weight percent of the sample (appendix 7). The next most abundant minerals were feldspars and clays. Amphibole was present in a few weight percent in both sediment samples, and only trace amounts of calcite were found. Other phases such as goethite and jarosite were present in trace to non-detectable amounts (appendix 7).
Toxicity Tests with Sediment and Pore WaterAcute (96-hour) toxicity tests with C. dilutus and
H. azteca using in situ pore-water samples (TechLaw, 2008b) indicated that reference pore waters from 5A and 10D had adequate survival (90 percent or higher) except for the C. dilutus test on sample 5A, the Pike Hill Brook reference station, which only had 60 percent survival (table 11). As a result, the laboratory control sample was used for comparison of non-reference samples from Pike Hill Brook.
Toxicity testing of whole sediments was conducted by TechLaw (2008a) with H. azteca for 10-day exposures and by USGS CERC with H. azteca in 28-day exposures and C. dilutus in 10-day exposures (table 11). For both studies and both test organisms, survival in sediment from reference stations 5A and 10D exceeded the minimum test acceptability criterion of 80 percent (table 11). Mean survival was 92.5 percent for both samples during 10-day H. azteca tests, 97.5 percent (station 5A) and 85.0 percent (station 10D) during 28-day H. azteca tests, and 87.5 percent (5A) and 91.3 percent (10D) during 10-day C. dilutus tests. Mean dry weight of H. azteca in 10-day tests was 0.078 milligram (mg) in the sediment 5A and 0.074 mg in sediment 10D. Mean length of H. azteca in 28-day tests was 3.94 mm in sample 5A and 3.88 mm in sample 10D. Mean ash-free-dry weight of C. dilutus in 10-day tests was 1.10 mg in sample 5A and 1.04 mg in sample 10D sediment. On the basis of these results, sediments from stations 5A and 10D were judged to be acceptable reference sediments for whole-sediment toxicity tests with samples from Ely Brook (reference station 5A) and the tributary to Schoolhouse Brook (reference station 10D).
Ecological IndicatorsSampling locations that are selected to represent
background conditions should resemble the potentially impaired locations in their physical aspects when comparing differences across locations in how ecological indictors might reflect impairment associated with drainage from the Pike Hill copper mines. Ensuring that physical similarity exists between impaired and unimpaired locations is important because differences that occur naturally are often reflected in strong
variation in ecological indicators between locations. When this occurs, effects from mine-impacted drainage may become less certain, because physical differences between reference and impaired locations will account for some degree of difference in values of the ecological indicators.
Pike Hill Brook and the tributary to Cookville Brook are systems that are both characterized by headwaters that contain mine workings and mine waste. Downstream from the mine-impacted source areas, the increased drainage areas may contribute to increased flow, and small streams develop that are more physically complex than the headwater streams. The Cookville Brook tributary has a drainage area of about 2 km2 at the confluence of Cookville Brook, and the drainage area of upper Pike Hill Brook (above station 4) is less than 3 km2. Sampling locations in lower Pike Hill Brook have drainages ranging from 4 to 12 km2. To help account for these physical differences when comparing ecological indicators among the locations, separate locations were used for comparison purposes for the headwater streams (Cookville Brook tributary and upper Pike Hill Brook) than for the main stream segment of lower Pike Hill Brook (stations 4A to 6). Station 10D, the reference location on Cookville Brook about 5 km upstream from the confluence of Cookville Brook tributary, was used as the reference location to compare the samples collected from the lower reach of Pike Hill Brook (fig. 1). The headwater station 10A on the Cookville Brook tributary that is upstream from the mine-drainage seep was used for comparison to the other Cookville Brook tributary locations and the upper Pike Hill Brook locations (fig. 1). Station 10A is not a geochemical reference location because it is in proximity to mine waste material from the Smith mine. Despite this, the hazard index for surface and pore waters was significantly less than 1.0, and biological assessment indicated the location is in good condition with respect to the macroinvertebrate community. Therefore, station 10A is used for comparison for the ecological indicators for the headwater streams (tributary to Cookville Brook and upper Pike Hill Brook). The invertebrate community at reference station 5A (used as the geochemical reference for lower Pike Hill Brook) was assessed, but the location is not used as a reference because non-mine related stressors impacted and impaired invertebrate assessment of the location.
The invertebrate metrics for abundance and richness showed high values for both the RTH and DTH communities at stations 10D and 10A, as well as very low hazard index values for both surface and pore waters (figs. 12, 13, 14; table 12). The VTDEC assessed the locations based on the RTH community and classified the headwater reference station 10A as “good” and the small stream reference station 10D as “excellent/very good” (table 13). In addition to the abundance and richness metrics, the VTDEC relies on six other invertebrate metrics for assessing streams. Among the metrics that VTDEC uses for assessments, abundance and richness as a pair worked best at relating overall changes in the invertebrate community to mine-impacted drainage (Seal and others, 2010).
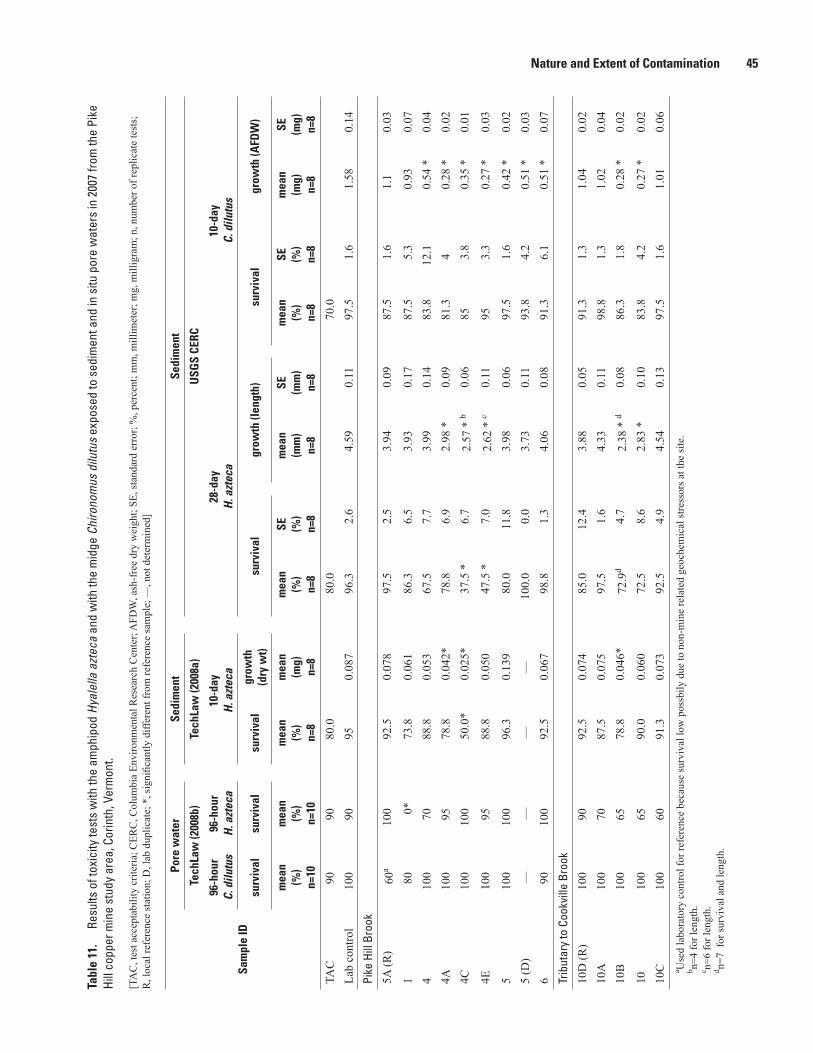
Nature and Extent of Contamination 45
Tabl
e 11
. Re
sults
of t
oxic
ity te
sts
with
the
amph
ipod
Hya
lella
azt
eca
and
with
the
mid
ge C
hiro
nom
us d
ilutu
s ex
pose
d to
sed
imen
t and
in s
itu p
ore
wat
ers
in 2
007
from
the
Pike
Hi
ll co
pper
min
e st
udy
area
, Cor
inth
, Ver
mon
t.
[TA
C, t
est a
ccep
tabi
lity
crite
ria; C
ERC
, Col
umbi
a En
viro
nmen
tal R
esea
rch
Cen
ter;
AFD
W, a
sh-f
ree
dry
wei
ght;
SE, s
tand
ard
erro
r; %
, per
cent
; mm
, mill
imet
er; m
g, m
illig
ram
; n, n
umbe
r of r
eplic
ate
test
s;
R, l
ocal
refe
renc
e st
atio
n; D
, lab
dup
licat
e; *
, sig
nific
antly
diff
eren
t fro
m re
fere
nce
sam
ple;
—, n
ot d
eter
min
ed]
Sam
ple
ID
Pore
wat
erSe
dim
ent
Sedi
men
t
Tech
Law
(200
8b)
Tech
Law
(200
8a)
USG
S CE
RC
96-h
our
C. d
ilutu
s96
-hou
rH
. azt
eca
10-d
ayH
. azt
eca
28-d
ayH
. azt
eca
10-d
ayC.
dilu
tus
surv
ival
surv
ival
surv
ival
grow
th
(dry
wt)
surv
ival
grow
th (l
engt
h)su
rviv
algr
owth
(AFD
W)
mea
n(%
)n=
10
mea
n(%
)n=
10
mea
n(%
)n=
8
mea
n(m
g)n=
8
mea
n(%
)n=
8
SE (%)
n=8
mea
n(m
m)
n=8
SE (mm
)n=
8
mea
n(%
)n=
8
SE (%)
n=8
mea
n(m
g)n=
8
SE (mg)
n=8
TAC
9090
80.0
80.0
70.0
Lab
cont
rol
100
9095
0.08
796
.32.
64.
590.
1197
.51.
61.
580.
14Pi
ke H
ill B
rook
5A (R
)60
a10
092
.50.
078
97.5
2.5
3.94
0.09
87.5
1.6
1.1
0.03
180
0*73
.80.
061
86.3
6.5
3.93
0.17
87.5
5.3
0.93
0.07
410
070
88.8
0.05
367
.57.
73.
990.
1483
.812
.1 0
.54
*0.
044A
100
9578
.80.
042*
78.8
6.9
2.9
8 *
0.09
81.3
4 0
.28
*0.
024C
100
100
50.0
*0.
025*
37
.5 *
6.7
2.5
7 *
b0.
0685
3.8
0.3
5 *
0.01
4E10
095
88.8
0.05
0
47.5
*7.
0 2
.62
* c
0.11
953.
3 0
.27
*0.
03
510
010
096
.30.
139
80.0
11.8
3.98
0.06
97.5
1.6
0.4
2 *
0.02
5 (D
)—
——
—10
0.0
0.0
3.73
0.11
93.8
4.2
0.5
1 *
0.03
690
100
92.5
0.06
798
.81.
34.
060.
0891
.36.
1 0
.51
*0.
07Tr
ibut
ary
to C
ookv
ille
Broo
k
10D
(R)
100
9092
.50.
074
85.0
12.4
3.88
0.05
91.3
1.3
1.04
0.02
10A
100
7087
.50.
075
97.5
1.6
4.33
0.11
98.8
1.3
1.02
0.04
10B
100
6578
.80.
046*
72.9
d4.
7 2
.38
* d
0.08
86.3
1.8
0.2
8 *
0.02
1010
065
90.0
0.06
072
.58.
6 2
.83
*0.
1083
.84.
2 0
.27
*0.
0210
C10
060
91.3
0.07
392
.54.
94.
540.
1397
.51.
61.
010.
06a U
sed
labo
rato
ry c
ontro
l for
refe
renc
e be
caus
e su
rviv
al lo
w p
ossb
ily d
ue to
non
-min
e re
late
d ge
oche
mic
al st
ress
ors a
t the
site
.b n=
4 fo
r len
gth.
c n=6
for l
engt
h.d n=
7 fo
r sur
viva
l and
leng
th.
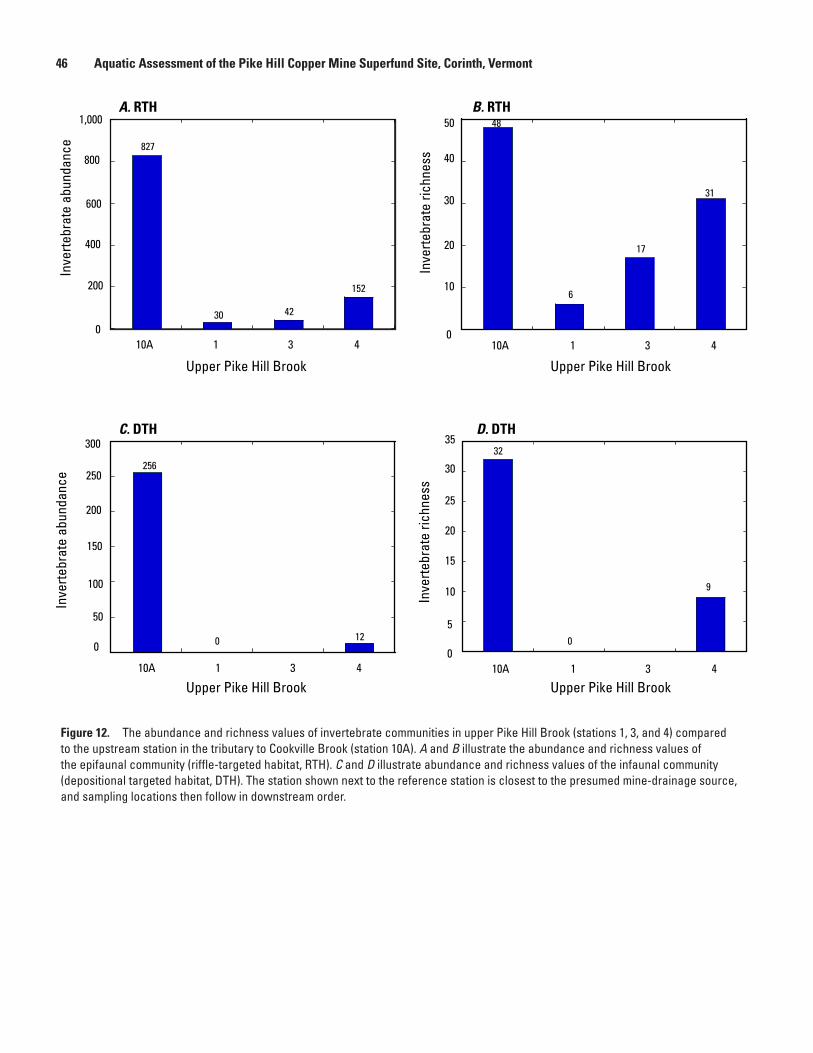
46 Aquatic Assessment of the Pike Hill Copper Mine Superfund Site, Corinth, Vermont
4848
D. DTH
Figure 12.
A. RTH B. RTH
C. DTH
Inve
rtebr
ate
abun
danc
e
Inve
rtebr
ate
richn
ess
Inve
rtebr
ate
richn
ess
Inve
rtebr
ate
abun
danc
e
10A 1 3 4
Upper Pike Hill Brook10A 1 3 4
10A 1 3 4 10A 1 3 4
1,000
800
600
400
200
0
50
40
30
20
10
0
300
250
200
150
100
50
0
35
30
25
20
15
10
5
0
827
30 42
152
48
6
17
31
256
0 12
32
0
9
Upper Pike Hill Brook
Upper Pike Hill BrookUpper Pike Hill Brook
Figure 12. The abundance and richness values of invertebrate communities in upper Pike Hill Brook (stations 1, 3, and 4) compared to the upstream station in the tributary to Cookville Brook (station 10A). A and B illustrate the abundance and richness values of the epifaunal community (riffle-targeted habitat, RTH). C and D illustrate abundance and richness values of the infaunal community (depositional targeted habitat, DTH). The station shown next to the reference station is closest to the presumed mine-drainage source, and sampling locations then follow in downstream order.
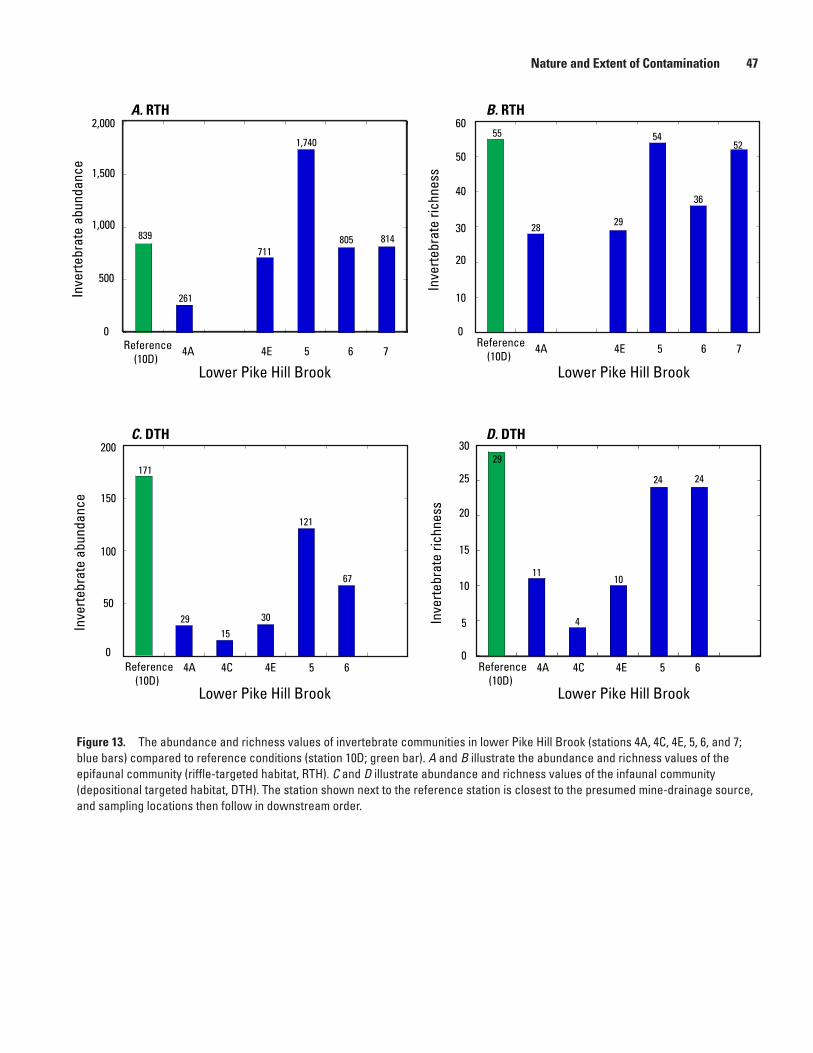
Nature and Extent of Contamination 47
8 3 9
2 6 1
7 1 1
1 7 4 0
8 0 5 8 1 4
5 5
2 8 2 9
5 4
3 6
5 2
1 7 1
2 91 5
3 0
1 2 1
6 7
1 1
4
1 0
2 4 2 4
8 3 9
2 6 1
7 1 1
1 7 4 0
8 0 5 8 1 4
5 5
2 8 2 9
5 4
3 6
5 2
1 7 1
2 91 5
3 0
1 2 1
6 7
Figure 13.
A. RTH B. RTH
C. DTH D. DTH
Inve
rtebr
ate
abun
danc
eIn
verte
brat
e ab
unda
nce
Inve
rtebr
ate
richn
ess
Inve
rtebr
ate
richn
ess
Reference (10D)
4A 5 6 74E
Lower Pike Hill Brook
Reference (10D)
4A 5 6 74E
Reference (10D)
4A 4E 5 64C Reference (10D)
4A 4E 5 64C
2,000
1,500
1,000
500
0
200
150
100
50
0
60
50
40
30
20
10
0
30
25
20
15
10
5
0
839
261
711
1,740
805 814
55
28 29
54
36
52
171
2915
30
121
67
29
11
4
10
24 24
Lower Pike Hill Brook Lower Pike Hill Brook
Lower Pike Hill Brook
Figure 13. The abundance and richness values of invertebrate communities in lower Pike Hill Brook (stations 4A, 4C, 4E, 5, 6, and 7; blue bars) compared to reference conditions (station 10D; green bar). A and B illustrate the abundance and richness values of the epifaunal community (riffle-targeted habitat, RTH). C and D illustrate abundance and richness values of the infaunal community (depositional targeted habitat, DTH). The station shown next to the reference station is closest to the presumed mine-drainage source, and sampling locations then follow in downstream order.
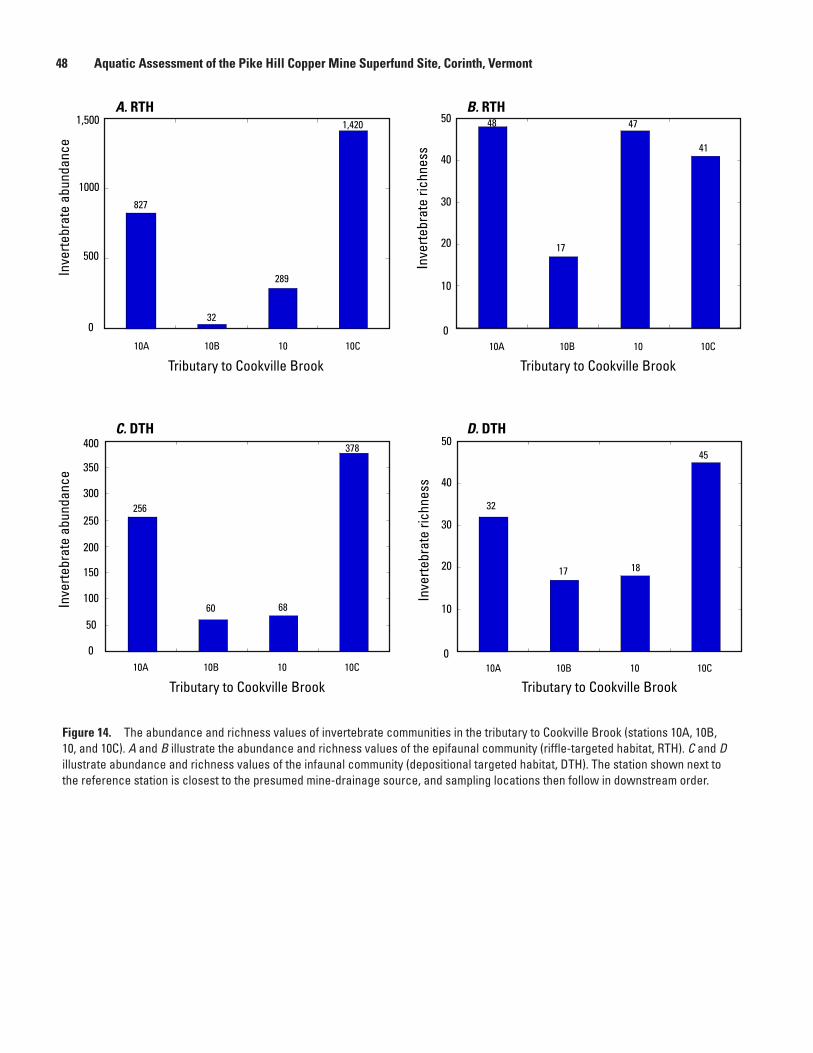
48 Aquatic Assessment of the Pike Hill Copper Mine Superfund Site, Corinth, Vermont
1420
289
32
827
256
60 68
378
32
17 18
45
17
47
4148
1420
289
32
827
256
60 68
378
32
17 18
45
17
47
4148
Figure 14.
827
32
289
1,420 48
17
47
41
256
60 68
378
32
17 18
45
Tributary to Cookville Brook
Inve
rtebr
ate
abun
danc
e
Inve
rtebr
ate
richn
ess
Inve
rtebr
ate
abun
danc
e
Inve
rtebr
ate
richn
ess
1,500
1000
500
0
400
350
300
250
200
150
100
50
0
50
40
30
20
10
0
50
40
30
20
10
0
10A 10B 10 10C 10A 10B 10 10C
10A 10B 10 10C 10A 10B 10 10C
Tributary to Cookville Brook
Tributary to Cookville Brook Tributary to Cookville Brook
A. RTH B. RTH
C. DTH D. DTH
Figure 14. The abundance and richness values of invertebrate communities in the tributary to Cookville Brook (stations 10A, 10B, 10, and 10C). A and B illustrate the abundance and richness values of the epifaunal community (riffle-targeted habitat, RTH). C and D illustrate abundance and richness values of the infaunal community (depositional targeted habitat, DTH). The station shown next to the reference station is closest to the presumed mine-drainage source, and sampling locations then follow in downstream order.
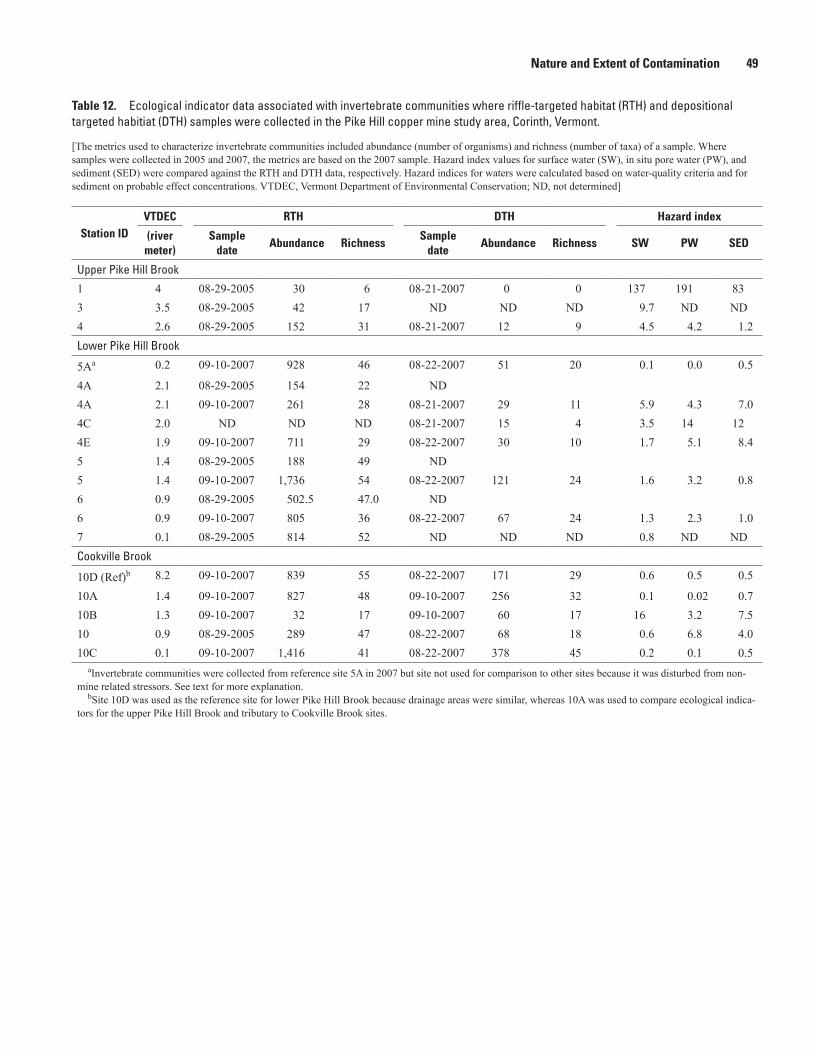
Nature and Extent of Contamination 49
Table 12. Ecological indicator data associated with invertebrate communities where riffle-targeted habitat (RTH) and depositional targeted habitiat (DTH) samples were collected in the Pike Hill copper mine study area, Corinth, Vermont.
[The metrics used to characterize invertebrate communities included abundance (number of organisms) and richness (number of taxa) of a sample. Where samples were collected in 2005 and 2007, the metrics are based on the 2007 sample. Hazard index values for surface water (SW), in situ pore water (PW), and sediment (SED) were compared against the RTH and DTH data, respectively. Hazard indices for waters were calculated based on water-quality criteria and for sediment on probable effect concentrations. VTDEC, Vermont Department of Environmental Conservation; ND, not determined]
Station IDVTDEC RTH DTH Hazard index
(river meter)
Sample date
Abundance RichnessSample
dateAbundance Richness SW PW SED
Upper Pike Hill Brook
1 4 08-29-2005 30 6 08-21-2007 0 0 137 191 833 3.5 08-29-2005 42 17 ND ND ND 9.7 ND ND4 2.6 08-29-2005 152 31 08-21-2007 12 9 4.5 4.2 1.2Lower Pike Hill Brook
5Aa 0.2 09-10-2007 928 46 08-22-2007 51 20 0.1 0.0 0.5
4A 2.1 08-29-2005 154 22 ND4A 2.1 09-10-2007 261 28 08-21-2007 29 11 5.9 4.3 7.04C 2.0 ND ND ND 08-21-2007 15 4 3.5 14 124E 1.9 09-10-2007 711 29 08-22-2007 30 10 1.7 5.1 8.45 1.4 08-29-2005 188 49 ND5 1.4 09-10-2007 1,736 54 08-22-2007 121 24 1.6 3.2 0.86 0.9 08-29-2005 502.5 47.0 ND6 0.9 09-10-2007 805 36 08-22-2007 67 24 1.3 2.3 1.07 0.1 08-29-2005 814 52 ND ND ND 0.8 ND NDCookville Brook
10D (Ref)b 8.2 09-10-2007 839 55 08-22-2007 171 29 0.6 0.5 0.5
10A 1.4 09-10-2007 827 48 09-10-2007 256 32 0.1 0.02 0.710B 1.3 09-10-2007 32 17 09-10-2007 60 17 16 3.2 7.510 0.9 08-29-2005 289 47 08-22-2007 68 18 0.6 6.8 4.010C 0.1 09-10-2007 1,416 41 08-22-2007 378 45 0.2 0.1 0.5
aInvertebrate communities were collected from reference site 5A in 2007 but site not used for comparison to other sites because it was disturbed from non-mine related stressors. See text for more explanation.
bSite 10D was used as the reference site for lower Pike Hill Brook because drainage areas were similar, whereas 10A was used to compare ecological indica-tors for the upper Pike Hill Brook and tributary to Cookville Brook sites.
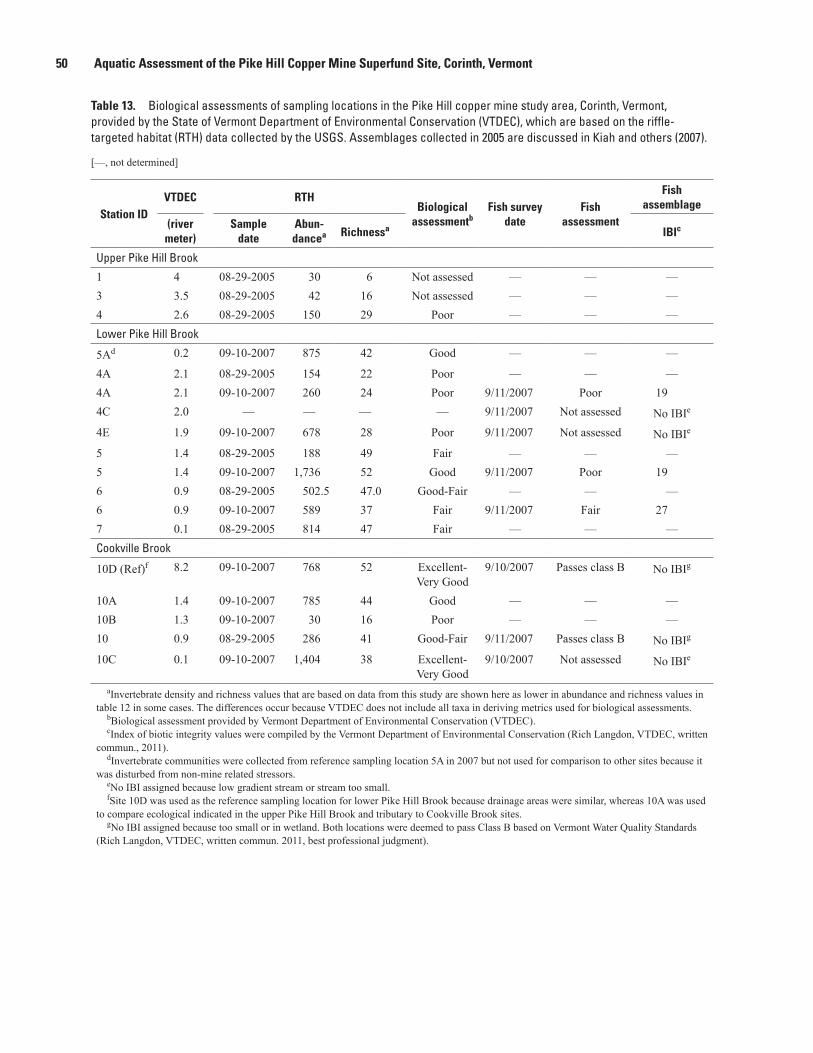
50 Aquatic Assessment of the Pike Hill Copper Mine Superfund Site, Corinth, Vermont
Table 13. Biological assessments of sampling locations in the Pike Hill copper mine study area, Corinth, Vermont, provided by the State of Vermont Department of Environmental Conservation (VTDEC), which are based on the riffle-targeted habitat (RTH) data collected by the USGS. Assemblages collected in 2005 are discussed in Kiah and others (2007).
[—, not determined]
Station IDVTDEC RTH
Biological assessmentb
Fish survey date
Fish assessment
Fish assemblage
(river meter)
Sample date
Abun-dancea Richnessa IBIc
Upper Pike Hill Brook
1 4 08-29-2005 30 6 Not assessed — — —3 3.5 08-29-2005 42 16 Not assessed — — —4 2.6 08-29-2005 150 29 Poor — — —Lower Pike Hill Brook
5Ad 0.2 09-10-2007 875 42 Good — — —
4A 2.1 08-29-2005 154 22 Poor — — —4A 2.1 09-10-2007 260 24 Poor 9/11/2007 Poor 194C 2.0 — — — — 9/11/2007 Not assessed No IBIe
4E 1.9 09-10-2007 678 28 Poor 9/11/2007 Not assessed No IBIe
5 1.4 08-29-2005 188 49 Fair — — —5 1.4 09-10-2007 1,736 52 Good 9/11/2007 Poor 196 0.9 08-29-2005 502.5 47.0 Good-Fair — — —6 0.9 09-10-2007 589 37 Fair 9/11/2007 Fair 277 0.1 08-29-2005 814 47 Fair — — —Cookville Brook
10D (Ref)f 8.2 09-10-2007 768 52 Excellent-Very Good
9/10/2007 Passes class B No IBIg
10A 1.4 09-10-2007 785 44 Good — — —10B 1.3 09-10-2007 30 16 Poor — — —10 0.9 08-29-2005 286 41 Good-Fair 9/11/2007 Passes class B No IBIg
10C 0.1 09-10-2007 1,404 38 Excellent-Very Good
9/10/2007 Not assessed No IBIe
aInvertebrate density and richness values that are based on data from this study are shown here as lower in abundance and richness values in table 12 in some cases. The differences occur because VTDEC does not include all taxa in deriving metrics used for biological assessments.
bBiological assessment provided by Vermont Department of Environmental Conservation (VTDEC).cIndex of biotic integrity values were compiled by the Vermont Department of Environmental Conservation (Rich Langdon, VTDEC, written
commun., 2011).dInvertebrate communities were collected from reference sampling location 5A in 2007 but not used for comparison to other sites because it
was disturbed from non-mine related stressors. eNo IBI assigned because low gradient stream or stream too small.fSite 10D was used as the reference sampling location for lower Pike Hill Brook because drainage areas were similar, whereas 10A was used
to compare ecological indicated in the upper Pike Hill Brook and tributary to Cookville Brook sites. gNo IBI assigned because too small or in wetland. Both locations were deemed to pass Class B based on Vermont Water Quality Standards
(Rich Langdon, VTDEC, written commun. 2011, best professional judgment).
Nature and Extent of Contamination 51
The only reference stream location with a fish community was station 10D. This location is used as the reference sampling location for fish-tissue chemistry. A total of 142 fish were found at station 10D, with subequal proportions of brook trout, creek chub, and blacknose dace (appendix 8). An assessment of the fish community was based on the best professional judgment of a biologist from VTDEC (Richard Langdon, written commun., 2011) because the station did not have the physical habitat characteristics that were necessary for a fish index of biotic integrity (IBI) determination. The station was judged to meet Vermont Class B water-quality standards. The high numbers of blacknose dace and creek chub are likely due to an increase in temperature of the water from the wetland in which the station is located. The average concentrations of copper and cadmium in both the blacknose dace and brook trout were below the respective CBRs; the average concentrations of zinc in both species were above the no-effects level CBR (fig. 15; table 14; appendix 9).
Upper Pike Hill Brook
Surface-Water GeochemistryFour stations were sampled in the upper reach of Pike
Hill Brook in October 2007 (stations 1, 2, 4, 4F), one of which was upstream from mine-impacted drainage and was also discussed in the “Background Conditions” section (station 2). The three other upper Pike Hill Brook locations include station 1, immediately downstream for the Eureka and Unions mine areas; station 4F, downstream from station 1 and upstream from a confluence with non-impacted waters; and station 4, downstream from the confluence with non-impacted waters. Data from these stations for this study will be used to examine downstream variations in chemistry. Chemical constituents for surface-water samples are summarized in table 4, and complete analyses are reported in appendix 5.
Field Parameters and Major Inorganic ConstituentsThe pH of Pike Hill Brook at station 2, the headwaters
sampling location not receiving drainage from the mines, was 7.5; in comparison to station 1, drainage from the Eureka and Union mines had a significantly lower pH of 4.7 (fig. 6). Downstream from the mixing of these two headwaters at station 4F, the pH was near neutral at 7.3. The slight decrease from 7.5 (station 2) to 7.3 (station 4F) was likely due to the mixing with acidic station 1 waters. At the next sampling location downstream (station 4), the pH was similar, at 7.2. Specific conductance was 202 µS/cm at station 2 compared to 589 µS/cm at station 1, the mine-impacted drainage. The specific conductance downstream from the mixing of these waters at station 4F was intermediate, at 287 µS/cm, and then decreased slightly to 233 at station 4, downstream from the input of a non-impacted tributary. In general, the major dissolved cations (calcium, potassium, magnesium, and silica) and hardness fluctuated in the same manner as the specific
conductance, with relatively lower concentrations at station 2, higher concentrations at station 1, and intermediate concentra-tions at stations 4F and 4 (fig. 7). Also, concentrations of these elements and compounds generally decreased from station 4F to station 4. The decrease in concentrations downstream from the sampling location directly impacted by drainage from the mines (station 1) to station 4F and then again to station 4 may be due to dilution after mixing with non-impacted ground or surface waters. Sodium was the only major cation that did not follow the above-mentioned trend; the concentrations of sodium did not vary significantly in upper reach samples (0.97 to 1.5 mg/L). Calcium (29.7 to 56.4 mg/L) was the dominant dissolved cation, followed by silica in abundance (5.9 to 23 mg/L); other major cations include potassium (1.72 to 4.41 mg/L) and magnesium (1.27 to 5.82 mg/L). Bicarbonate, estimated from measured alkalinity, was the dominant anionic species in the background conditions sample (station 2) and the farthest downstream sample in the upper reach (station 4), with alkalinity concentrations of 80 (station 2) and 71 (station 4) mg/L as CaCO3 (fig. 7). In contrast, sulfate dominated in mine-impacted Pike Hill Brook station 1 and the next sampling location downstream (station 4F), with concentrations of 296 and 87.7 mg/L sulfate, respectively (fig. 7). In comparison, chloride concentrations only reached 6.8 mg/L at station 1. Previous reports found similar results (Piatak and others, 2006b; USGS, 2006a; Kiah and others, 2007).
Iron, Aluminum, and ManganeseThe concentrations of dissolved manganese (18.2 to
194 µg/L) were considerably higher than the concentrations of dissolved aluminum (3.3 to 12.4 µg/L) and iron (<20 µg/L) in surface-water samples from stations 2, 4F, and 4 in the upper reach of Pike Hill Brook (fig. 8). In contrast, iron (18,000 µg/L) and aluminum (3,650 µg/L) dominated at station 1 in comparison to manganese (693 µg/L). The con-centrations of dissolved aluminum and manganese generally followed the same trends downstream as did the major cations and anions discussed above. Specifically, the concentrations of aluminum and manganese were highest in station 1 waters, lowest in station 2 waters, and intermediate in stations 4F and 4 waters. These concentrations were similar to those reported in previous studies (fig. 3; Piatak and others, 2006b; USGS, 2006a; Kiah and others, 2007).
Minor and Trace ElementsThe only minor and trace elements present in significant
concentrations in October 2007 surface waters in the upper reach were Ba (13.9 to 26.8 µg/L), Cd (<0.02 to 9.35 µg/L), Co (4.03 to 174 µg/L), Cu (0.68 to 1,380 µg/L), Ni (1 to 20.8 µg/L ), Sr (114 to 172 µg/L), and Zn (3.4 to 1,600 µg/L; fig. 9; appendix 5). The concentrations of these elements from this study are compared with those found in previous studies at these sampling locations in figure 3. As shown, the concentrations of many elements in the October 2007 samples
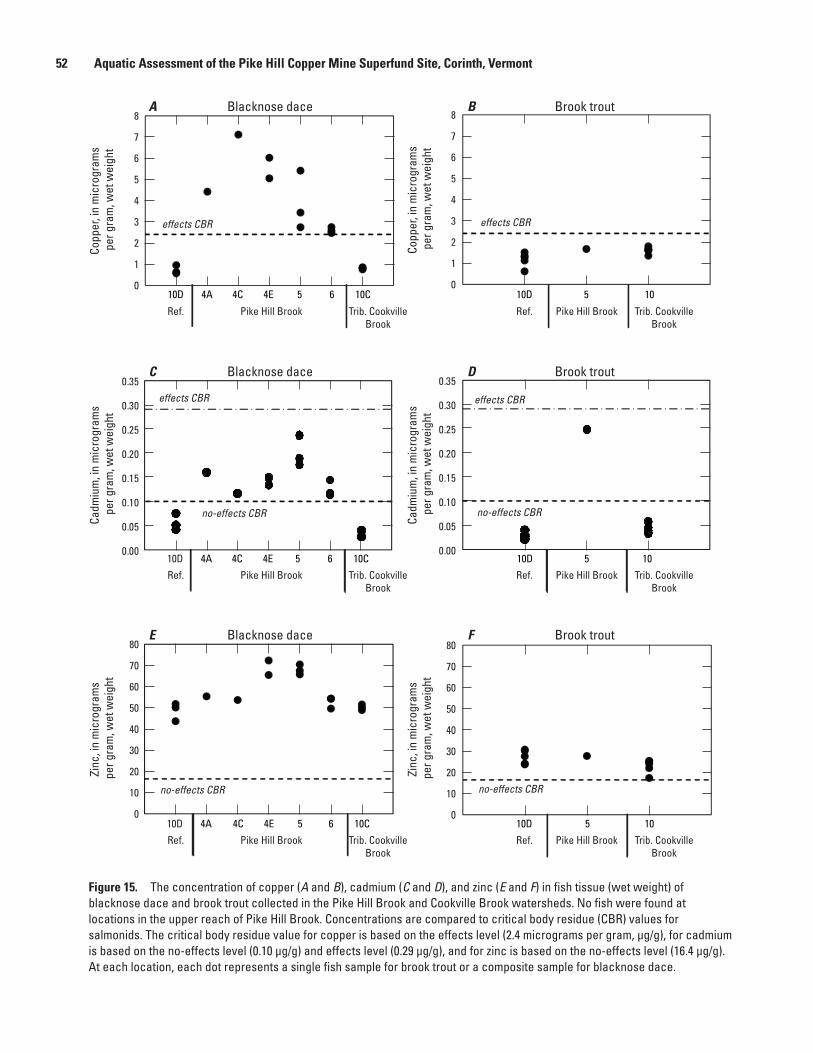
52 Aquatic Assessment of the Pike Hill Copper Mine Superfund Site, Corinth, Vermont
0
1
2
3
4
5
6
7
8
10D 4A 4C 4E 5 6 10C
Copp
er, i
n m
icro
gram
s p
er g
ram
, wet
wei
ght
Pike Hill Brook
0
1
2
3
4
5
6
7
8
0
10
20
30
40
50
60
70
80
0
10
20
30
40
50
60
70
80
10D 5 10
Blacknose dace
Blacknose dace
Brook trout
Brook trout
no-effects CBR
Trib. CookvilleBrook
Ref.
10D 4A 4C 4E 5 6 10C
Pike Hill Brook Trib. CookvilleBrook
Ref. Ref. Pike Hill Brook Trib. CookvilleBrook
10D 5 10
Ref. Pike Hill Brook Trib. CookvilleBrook
no-effects CBR
no-effects CBR
Cadm
ium
, in
mic
rogr
ams
per
gra
m, w
et w
eigh
tZi
nc, i
n m
icro
gram
s p
er g
ram
, wet
wei
ght
Zinc
, in
mic
rogr
ams
per
gra
m, w
et w
eigh
tCa
dmiu
m, i
n m
icro
gram
s p
er g
ram
, wet
wei
ght
Copp
er, i
n m
icro
gram
s p
er g
ram
, wet
wei
ght
A B
C D
E F
0.00
0.05
0.10
0.15
0.20
0.25
0.30
0.35
10D 5 10
Ref. Pike Hill Brook Trib. CookvilleBrook
Brook trout
0.00
0.05
0.10
0.15
0.20
0.25
0.30
0.35
10D 4A 4C 4E 5 6 10C
Pike Hill Brook Trib. CookvilleBrook
Ref.
Blacknose dace
no-effects CBR
effects CBReffects CBR
effects CBReffects CBR
Figure 15.
Figure 15. The concentration of copper (A and B), cadmium (C and D), and zinc (E and F) in fish tissue (wet weight) of blacknose dace and brook trout collected in the Pike Hill Brook and Cookville Brook watersheds. No fish were found at locations in the upper reach of Pike Hill Brook. Concentrations are compared to critical body residue (CBR) values for salmonids. The critical body residue value for copper is based on the effects level (2.4 micrograms per gram, µg/g), for cadmium is based on the no-effects level (0.10 µg/g) and effects level (0.29 µg/g), and for zinc is based on the no-effects level (16.4 µg/g). At each location, each dot represents a single fish sample for brook trout or a composite sample for blacknose dace.
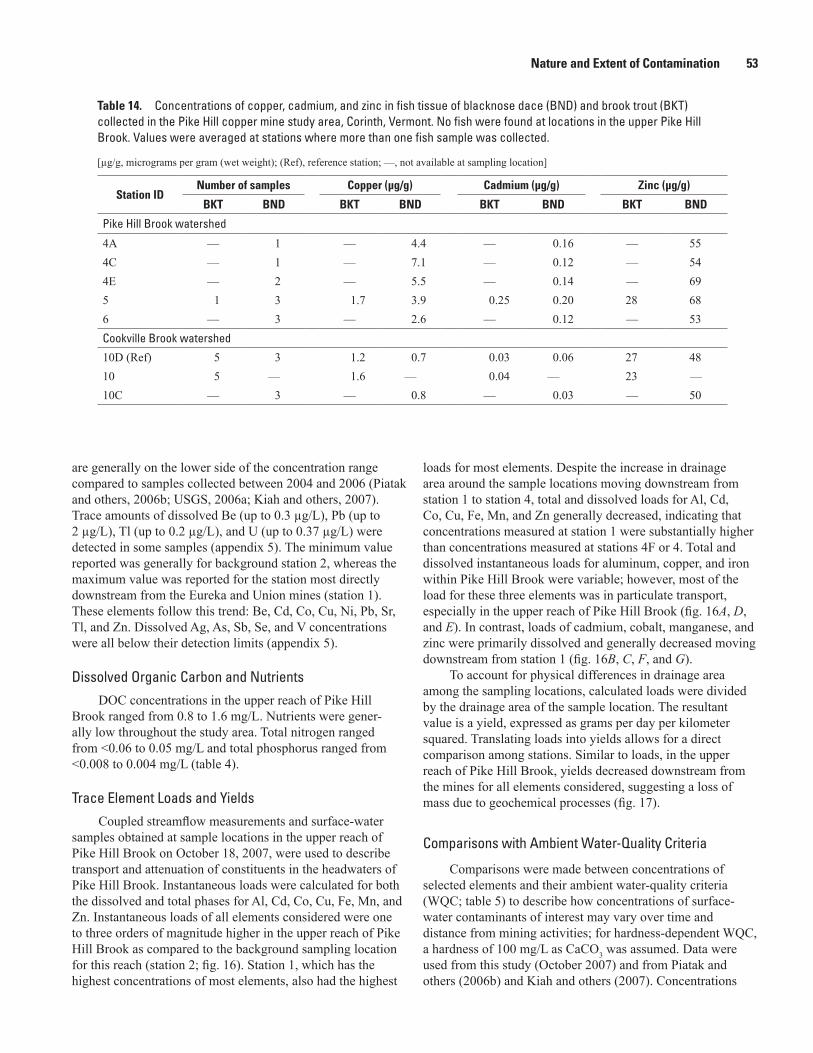
Nature and Extent of Contamination 53
Table 14. Concentrations of copper, cadmium, and zinc in fish tissue of blacknose dace (BND) and brook trout (BKT) collected in the Pike Hill copper mine study area, Corinth, Vermont. No fish were found at locations in the upper Pike Hill Brook. Values were averaged at stations where more than one fish sample was collected.
[µg/g, micrograms per gram (wet weight); (Ref), reference station; —, not available at sampling location]
Station IDNumber of samples Copper (μg/g) Cadmium (μg/g) Zinc (μg/g)
BKT BND BKT BND BKT BND BKT BND
Pike Hill Brook watershed
4A — 1 — 4.4 — 0.16 — 554C — 1 — 7.1 — 0.12 — 544E — 2 — 5.5 — 0.14 — 695 1 3 1.7 3.9 0.25 0.20 28 686 — 3 — 2.6 — 0.12 — 53Cookville Brook watershed
10D (Ref) 5 3 1.2 0.7 0.03 0.06 27 4810 5 — 1.6 — 0.04 — 23 —10C — 3 — 0.8 — 0.03 — 50
are generally on the lower side of the concentration range compared to samples collected between 2004 and 2006 (Piatak and others, 2006b; USGS, 2006a; Kiah and others, 2007). Trace amounts of dissolved Be (up to 0.3 µg/L), Pb (up to 2 µg/L), Tl (up to 0.2 µg/L), and U (up to 0.37 µg/L) were detected in some samples (appendix 5). The minimum value reported was generally for background station 2, whereas the maximum value was reported for the station most directly downstream from the Eureka and Union mines (station 1). These elements follow this trend: Be, Cd, Co, Cu, Ni, Pb, Sr, Tl, and Zn. Dissolved Ag, As, Sb, Se, and V concentrations were all below their detection limits (appendix 5).
Dissolved Organic Carbon and NutrientsDOC concentrations in the upper reach of Pike Hill
Brook ranged from 0.8 to 1.6 mg/L. Nutrients were gener-ally low throughout the study area. Total nitrogen ranged from <0.06 to 0.05 mg/L and total phosphorus ranged from <0.008 to 0.004 mg/L (table 4).
Trace Element Loads and YieldsCoupled streamflow measurements and surface-water
samples obtained at sample locations in the upper reach of Pike Hill Brook on October 18, 2007, were used to describe transport and attenuation of constituents in the headwaters of Pike Hill Brook. Instantaneous loads were calculated for both the dissolved and total phases for Al, Cd, Co, Cu, Fe, Mn, and Zn. Instantaneous loads of all elements considered were one to three orders of magnitude higher in the upper reach of Pike Hill Brook as compared to the background sampling location for this reach (station 2; fig. 16). Station 1, which has the highest concentrations of most elements, also had the highest
loads for most elements. Despite the increase in drainage area around the sample locations moving downstream from station 1 to station 4, total and dissolved loads for Al, Cd, Co, Cu, Fe, Mn, and Zn generally decreased, indicating that concentrations measured at station 1 were substantially higher than concentrations measured at stations 4F or 4. Total and dissolved instantaneous loads for aluminum, copper, and iron within Pike Hill Brook were variable; however, most of the load for these three elements was in particulate transport, especially in the upper reach of Pike Hill Brook (fig. 16A, D, and E). In contrast, loads of cadmium, cobalt, manganese, and zinc were primarily dissolved and generally decreased moving downstream from station 1 (fig. 16B, C, F, and G).
To account for physical differences in drainage area among the sampling locations, calculated loads were divided by the drainage area of the sample location. The resultant value is a yield, expressed as grams per day per kilometer squared. Translating loads into yields allows for a direct comparison among stations. Similar to loads, in the upper reach of Pike Hill Brook, yields decreased downstream from the mines for all elements considered, suggesting a loss of mass due to geochemical processes (fig. 17).
Comparisons with Ambient Water-Quality Criteria
Comparisons were made between concentrations of selected elements and their ambient water-quality criteria (WQC; table 5) to describe how concentrations of surface-water contaminants of interest may vary over time and distance from mining activities; for hardness-dependent WQC, a hardness of 100 mg/L as CaCO3 was assumed. Data were used from this study (October 2007) and from Piatak and others (2006b) and Kiah and others (2007). Concentrations
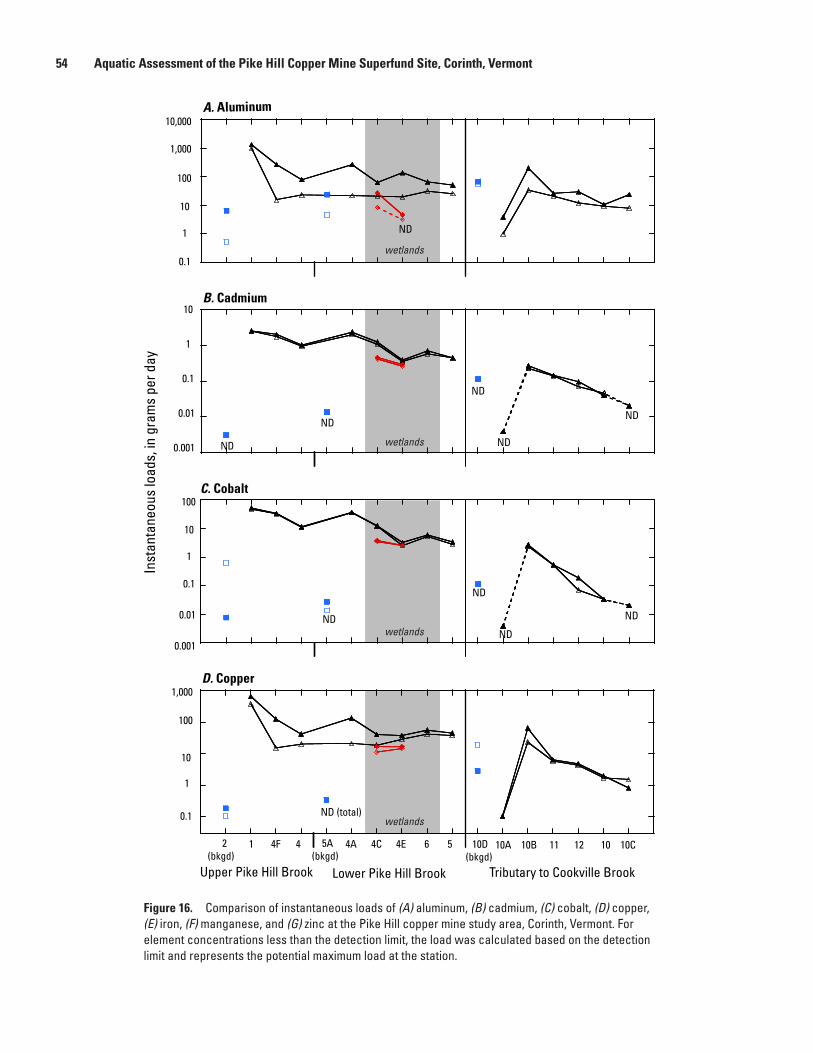
54 Aquatic Assessment of the Pike Hill Copper Mine Superfund Site, Corinth, Vermont
Figure 16.
Upper Pike Hill Brook Lower Pike Hill Brook Tributary to Cookville Brook
Inst
anta
neou
s lo
ads,
in g
ram
s pe
r day
A. Aluminum
B. Cadmium
C. Cobalt
D. Copper
ND
ND
ND
ND
ND
ND
ND
ND
ND
ND
ND (total)
10,000
1,000
100
10
1
0.1
1,000
100
10
1
0.1
10
1
0.1
0.01
0.001
100
10
1
0.1
0.01
0.001
2(bkgd)
1 4F 4 5A(bkgd)
4A 4C 4E 56 10D(bkgd)
10A 10B 11 12 10 10C
wetlands
wetlands
wetlands
wetlands
Figure 16. Comparison of instantaneous loads of (A) aluminum, (B) cadmium, (C) cobalt, (D) copper, (E) iron, (F) manganese, and (G) zinc at the Pike Hill copper mine study area, Corinth, Vermont. For element concentrations less than the detection limit, the load was calculated based on the detection limit and represents the potential maximum load at the station.
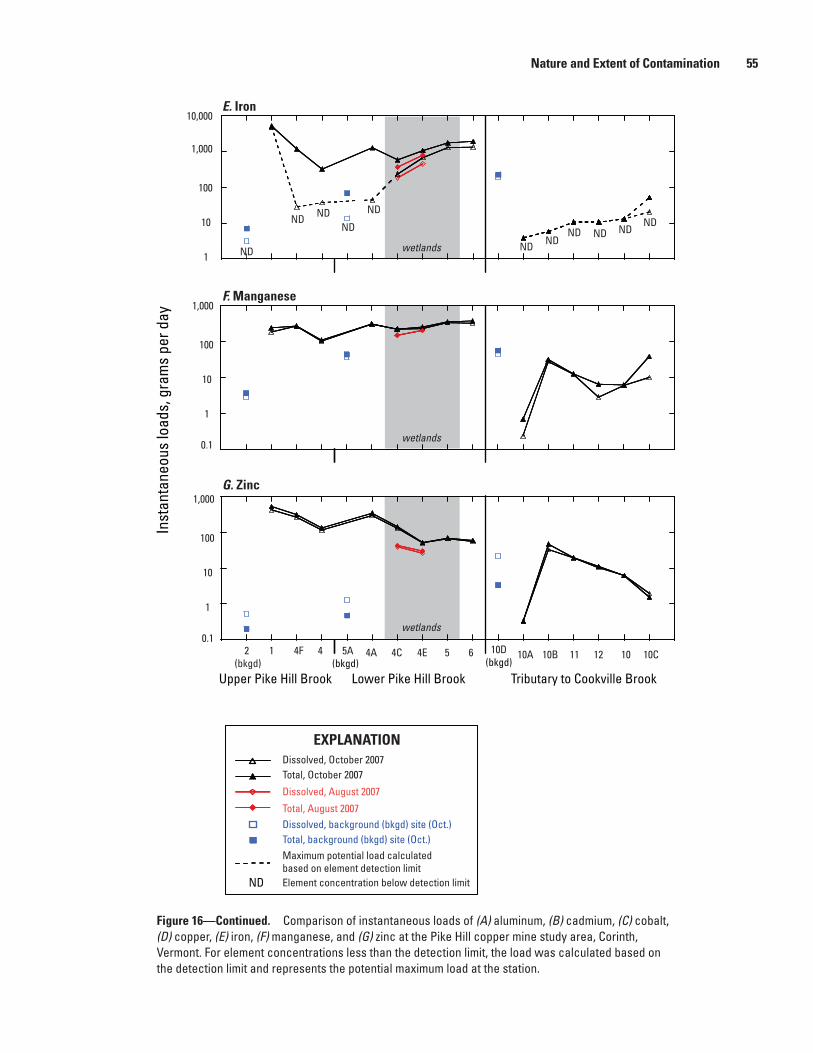
Nature and Extent of Contamination 55
wetlands
ND
Figure 16 (cont.)
Upper Pike Hill Brook Lower Pike Hill Brook Tributary to Cookville Brook
Inst
anta
neou
s lo
ads,
gra
ms
per d
ay
E. Iron
F. Manganese
G. Zinc
ND
NDNDNDND
ND
NDNDND ND
ND
10,000
1,000
100
10
1
0.1
1,000
100
10
1
0.1
1,000
100
10
1
2 (bkgd)
1 4F 4 54A 4C 4E 5A(bkgd)
6 10D(bkgd)
10A 10B 11 12 10 10C
Dissolved, October 2007Total, October 2007
Dissolved, August 2007
Total, August 2007Dissolved, background (bkgd) site (Oct.)Total, background (bkgd) site (Oct.)Maximum potential load calculated based on element detection limitElement concentration below detection limit
EXPLANATION
wetlands
wetlands
Figure 16—Continued. Comparison of instantaneous loads of (A) aluminum, (B) cadmium, (C) cobalt, (D) copper, (E) iron, (F) manganese, and (G) zinc at the Pike Hill copper mine study area, Corinth, Vermont. For element concentrations less than the detection limit, the load was calculated based on the detection limit and represents the potential maximum load at the station.
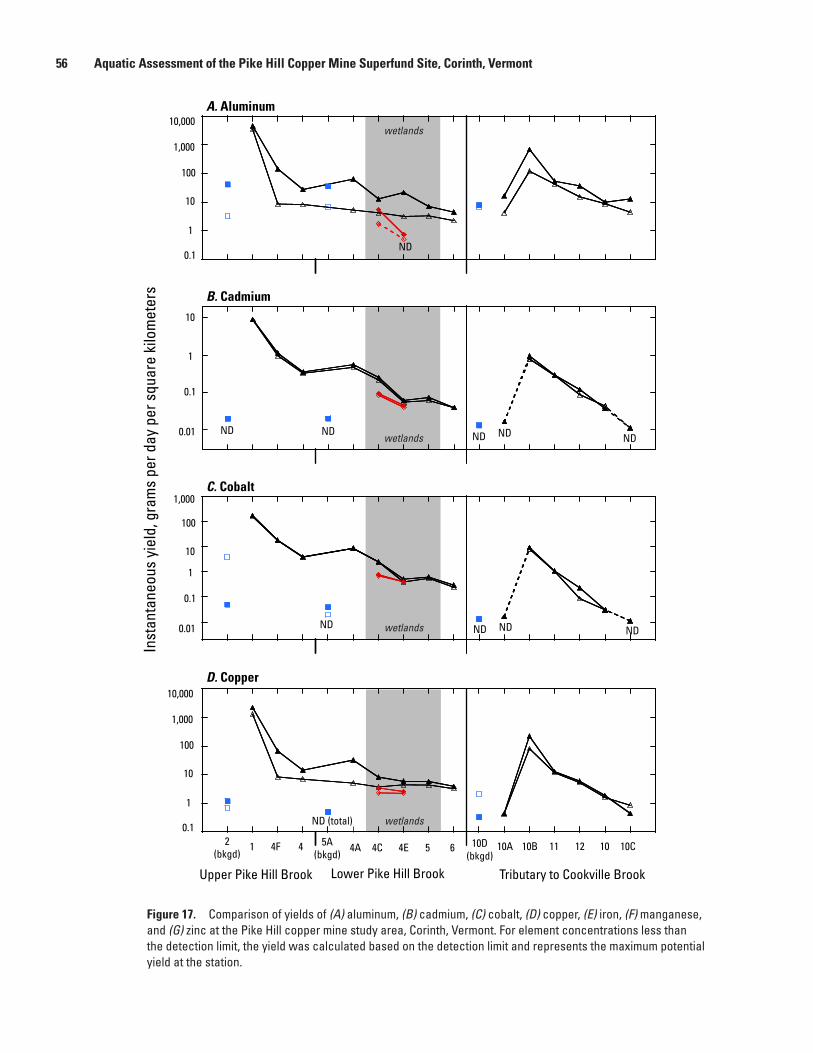
56 Aquatic Assessment of the Pike Hill Copper Mine Superfund Site, Corinth, Vermont
wetlands
Figure 17
Upper Pike Hill Brook Lower Pike Hill Brook Tributary to Cookville Brook
Inst
anta
neou
s yi
eld,
gra
ms
per d
ay p
er s
quar
e ki
lom
eter
s
D. Copper
C. Cobalt
B. Cadmium
A. Aluminum10,000
1,000
100
10
1
0.1
10
1
0.1
0.01
1,000
100
10
1
0.1
0.01
10,000
1,000
100
10
1
0.1
NDND
ND
NDNDNDNDND
NDND
ND (total)
2(bkgd)
1 4F 4 4A 4C 4E 5 6 10D(bkgd)
10A 10B 11 12 10 10C5A(bkgd)
wetlands
wetlands
wetlands
Figure 17. Comparison of yields of (A) aluminum, (B) cadmium, (C) cobalt, (D) copper, (E) iron, (F) manganese, and (G) zinc at the Pike Hill copper mine study area, Corinth, Vermont. For element concentrations less than the detection limit, the yield was calculated based on the detection limit and represents the maximum potential yield at the station.
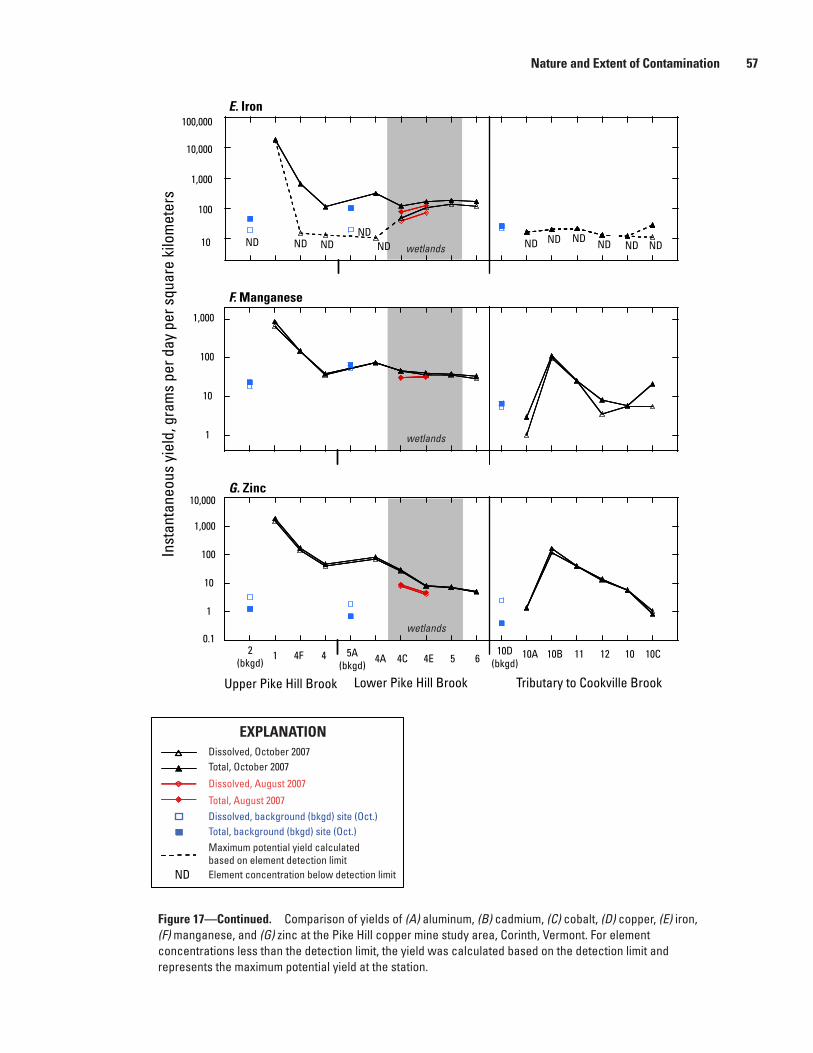
Nature and Extent of Contamination 57
Figure 17 (cont.)
Inst
anta
neou
s yi
eld,
gra
ms
per d
ay p
er s
quar
e ki
lom
eter
s
Upper Pike Hill Brook Lower Pike Hill Brook Tributary to Cookville Brook
E. Iron
F. Manganese
G. Zinc
100,000
10,000
1,000
100
10
10,000
1,000
100
10
1
0.1
ND NDNDNDNDND
NDND NDNDND
1,000
100
10
1
wetlands
wetlands
wetlands
2(bkgd)
1 4F 4 4A 4C 4E 5 610D
(bkgd)10A 10B 11 12 10 10C5A
(bkgd)
ND
Dissolved, October 2007Total, October 2007
Dissolved, August 2007
Total, August 2007Dissolved, background (bkgd) site (Oct.)Total, background (bkgd) site (Oct.)Maximum potential yield calculated based on element detection limitElement concentration below detection limit
EXPLANATION
Figure 17—Continued. Comparison of yields of (A) aluminum, (B) cadmium, (C) cobalt, (D) copper, (E) iron, (F) manganese, and (G) zinc at the Pike Hill copper mine study area, Corinth, Vermont. For element concentrations less than the detection limit, the yield was calculated based on the detection limit and represents the maximum potential yield at the station.
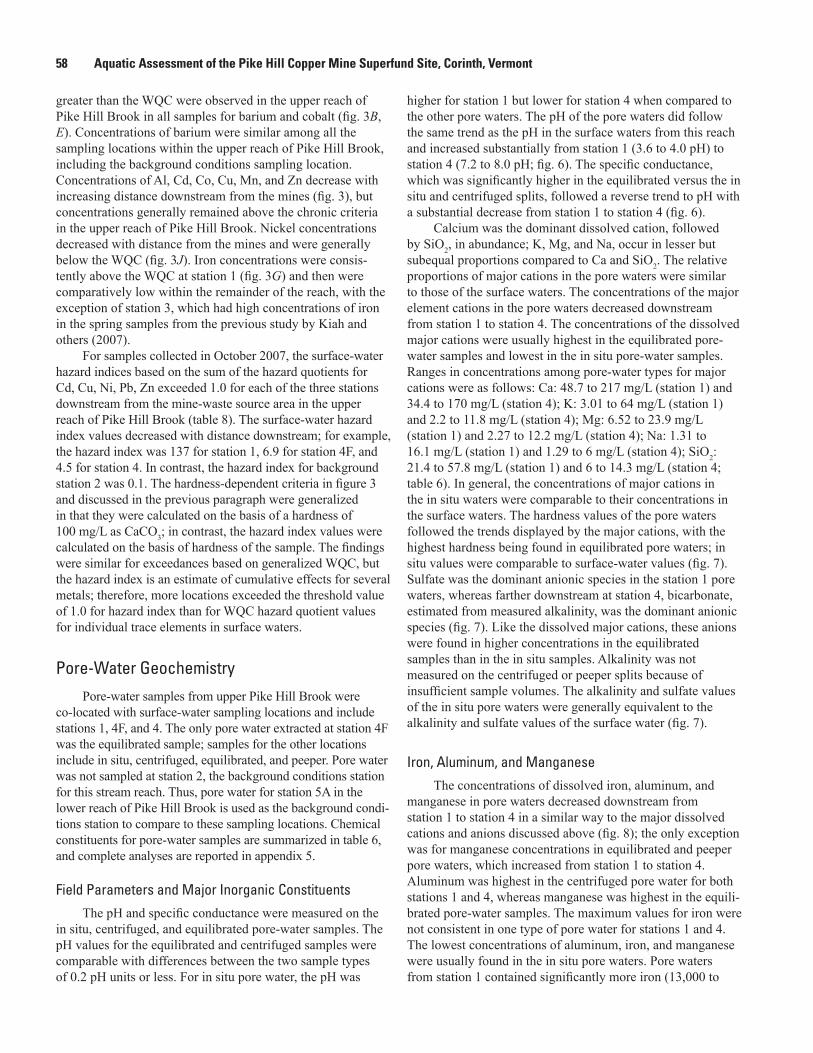
58 Aquatic Assessment of the Pike Hill Copper Mine Superfund Site, Corinth, Vermont
greater than the WQC were observed in the upper reach of Pike Hill Brook in all samples for barium and cobalt (fig. 3B, E). Concentrations of barium were similar among all the sampling locations within the upper reach of Pike Hill Brook, including the background conditions sampling location. Concentrations of Al, Cd, Co, Cu, Mn, and Zn decrease with increasing distance downstream from the mines (fig. 3), but concentrations generally remained above the chronic criteria in the upper reach of Pike Hill Brook. Nickel concentrations decreased with distance from the mines and were generally below the WQC (fig. 3J). Iron concentrations were consis-tently above the WQC at station 1 (fig. 3G) and then were comparatively low within the remainder of the reach, with the exception of station 3, which had high concentrations of iron in the spring samples from the previous study by Kiah and others (2007).
For samples collected in October 2007, the surface-water hazard indices based on the sum of the hazard quotients for Cd, Cu, Ni, Pb, Zn exceeded 1.0 for each of the three stations downstream from the mine-waste source area in the upper reach of Pike Hill Brook (table 8). The surface-water hazard index values decreased with distance downstream; for example, the hazard index was 137 for station 1, 6.9 for station 4F, and 4.5 for station 4. In contrast, the hazard index for background station 2 was 0.1. The hardness-dependent criteria in figure 3 and discussed in the previous paragraph were generalized in that they were calculated on the basis of a hardness of 100 mg/L as CaCO3; in contrast, the hazard index values were calculated on the basis of hardness of the sample. The findings were similar for exceedances based on generalized WQC, but the hazard index is an estimate of cumulative effects for several metals; therefore, more locations exceeded the threshold value of 1.0 for hazard index than for WQC hazard quotient values for individual trace elements in surface waters.
Pore-Water Geochemistry Pore-water samples from upper Pike Hill Brook were
co-located with surface-water sampling locations and include stations 1, 4F, and 4. The only pore water extracted at station 4F was the equilibrated sample; samples for the other locations include in situ, centrifuged, equilibrated, and peeper. Pore water was not sampled at station 2, the background conditions station for this stream reach. Thus, pore water for station 5A in the lower reach of Pike Hill Brook is used as the background condi-tions station to compare to these sampling locations. Chemical constituents for pore-water samples are summarized in table 6, and complete analyses are reported in appendix 5.
Field Parameters and Major Inorganic ConstituentsThe pH and specific conductance were measured on the
in situ, centrifuged, and equilibrated pore-water samples. The pH values for the equilibrated and centrifuged samples were comparable with differences between the two sample types of 0.2 pH units or less. For in situ pore water, the pH was
higher for station 1 but lower for station 4 when compared to the other pore waters. The pH of the pore waters did follow the same trend as the pH in the surface waters from this reach and increased substantially from station 1 (3.6 to 4.0 pH) to station 4 (7.2 to 8.0 pH; fig. 6). The specific conductance, which was significantly higher in the equilibrated versus the in situ and centrifuged splits, followed a reverse trend to pH with a substantial decrease from station 1 to station 4 (fig. 6).
Calcium was the dominant dissolved cation, followed by SiO2, in abundance; K, Mg, and Na, occur in lesser but subequal proportions compared to Ca and SiO2. The relative proportions of major cations in the pore waters were similar to those of the surface waters. The concentrations of the major element cations in the pore waters decreased downstream from station 1 to station 4. The concentrations of the dissolved major cations were usually highest in the equilibrated pore-water samples and lowest in the in situ pore-water samples. Ranges in concentrations among pore-water types for major cations were as follows: Ca: 48.7 to 217 mg/L (station 1) and 34.4 to 170 mg/L (station 4); K: 3.01 to 64 mg/L (station 1) and 2.2 to 11.8 mg/L (station 4); Mg: 6.52 to 23.9 mg/L (station 1) and 2.27 to 12.2 mg/L (station 4); Na: 1.31 to 16.1 mg/L (station 1) and 1.29 to 6 mg/L (station 4); SiO2: 21.4 to 57.8 mg/L (station 1) and 6 to 14.3 mg/L (station 4; table 6). In general, the concentrations of major cations in the in situ waters were comparable to their concentrations in the surface waters. The hardness values of the pore waters followed the trends displayed by the major cations, with the highest hardness being found in equilibrated pore waters; in situ values were comparable to surface-water values (fig. 7). Sulfate was the dominant anionic species in the station 1 pore waters, whereas farther downstream at station 4, bicarbonate, estimated from measured alkalinity, was the dominant anionic species (fig. 7). Like the dissolved major cations, these anions were found in higher concentrations in the equilibrated samples than in the in situ samples. Alkalinity was not measured on the centrifuged or peeper splits because of insufficient sample volumes. The alkalinity and sulfate values of the in situ pore waters were generally equivalent to the alkalinity and sulfate values of the surface water (fig. 7).
Iron, Aluminum, and ManganeseThe concentrations of dissolved iron, aluminum, and
manganese in pore waters decreased downstream from station 1 to station 4 in a similar way to the major dissolved cations and anions discussed above (fig. 8); the only exception was for manganese concentrations in equilibrated and peeper pore waters, which increased from station 1 to station 4. Aluminum was highest in the centrifuged pore water for both stations 1 and 4, whereas manganese was highest in the equili-brated pore-water samples. The maximum values for iron were not consistent in one type of pore water for stations 1 and 4. The lowest concentrations of aluminum, iron, and manganese were usually found in the in situ pore waters. Pore waters from station 1 contained significantly more iron (13,000 to
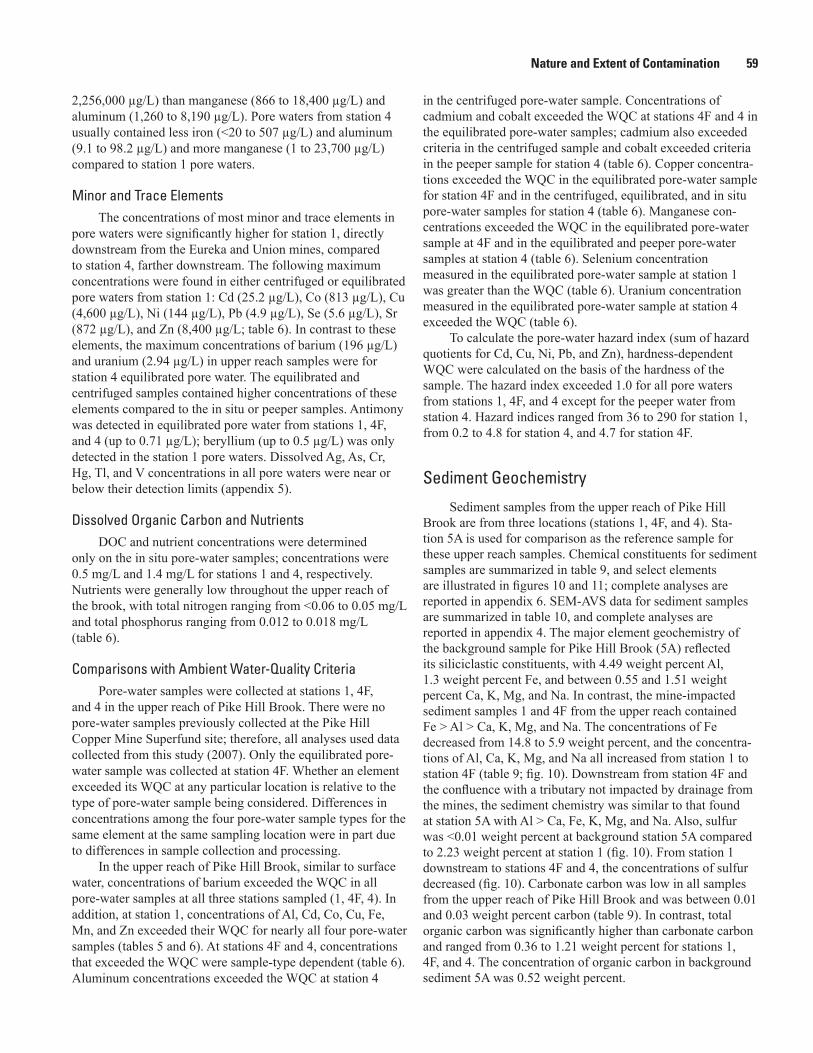
Nature and Extent of Contamination 59
2,256,000 µg/L) than manganese (866 to 18,400 µg/L) and aluminum (1,260 to 8,190 µg/L). Pore waters from station 4 usually contained less iron (<20 to 507 µg/L) and aluminum (9.1 to 98.2 µg/L) and more manganese (1 to 23,700 µg/L) compared to station 1 pore waters.
Minor and Trace ElementsThe concentrations of most minor and trace elements in
pore waters were significantly higher for station 1, directly downstream from the Eureka and Union mines, compared to station 4, farther downstream. The following maximum concentrations were found in either centrifuged or equilibrated pore waters from station 1: Cd (25.2 µg/L), Co (813 µg/L), Cu (4,600 µg/L), Ni (144 µg/L), Pb (4.9 µg/L), Se (5.6 µg/L), Sr (872 µg/L), and Zn (8,400 µg/L; table 6). In contrast to these elements, the maximum concentrations of barium (196 µg/L) and uranium (2.94 µg/L) in upper reach samples were for station 4 equilibrated pore water. The equilibrated and centrifuged samples contained higher concentrations of these elements compared to the in situ or peeper samples. Antimony was detected in equilibrated pore water from stations 1, 4F, and 4 (up to 0.71 µg/L); beryllium (up to 0.5 µg/L) was only detected in the station 1 pore waters. Dissolved Ag, As, Cr, Hg, Tl, and V concentrations in all pore waters were near or below their detection limits (appendix 5).
Dissolved Organic Carbon and NutrientsDOC and nutrient concentrations were determined
only on the in situ pore-water samples; concentrations were 0.5 mg/L and 1.4 mg/L for stations 1 and 4, respectively. Nutrients were generally low throughout the upper reach of the brook, with total nitrogen ranging from <0.06 to 0.05 mg/L and total phosphorus ranging from 0.012 to 0.018 mg/L (table 6).
Comparisons with Ambient Water-Quality CriteriaPore-water samples were collected at stations 1, 4F,
and 4 in the upper reach of Pike Hill Brook. There were no pore-water samples previously collected at the Pike Hill Copper Mine Superfund site; therefore, all analyses used data collected from this study (2007). Only the equilibrated pore-water sample was collected at station 4F. Whether an element exceeded its WQC at any particular location is relative to the type of pore-water sample being considered. Differences in concentrations among the four pore-water sample types for the same element at the same sampling location were in part due to differences in sample collection and processing.
In the upper reach of Pike Hill Brook, similar to surface water, concentrations of barium exceeded the WQC in all pore-water samples at all three stations sampled (1, 4F, 4). In addition, at station 1, concentrations of Al, Cd, Co, Cu, Fe, Mn, and Zn exceeded their WQC for nearly all four pore-water samples (tables 5 and 6). At stations 4F and 4, concentrations that exceeded the WQC were sample-type dependent (table 6). Aluminum concentrations exceeded the WQC at station 4
in the centrifuged pore-water sample. Concentrations of cadmium and cobalt exceeded the WQC at stations 4F and 4 in the equilibrated pore-water samples; cadmium also exceeded criteria in the centrifuged sample and cobalt exceeded criteria in the peeper sample for station 4 (table 6). Copper concentra-tions exceeded the WQC in the equilibrated pore-water sample for station 4F and in the centrifuged, equilibrated, and in situ pore-water samples for station 4 (table 6). Manganese con-centrations exceeded the WQC in the equilibrated pore-water sample at 4F and in the equilibrated and peeper pore-water samples at station 4 (table 6). Selenium concentration measured in the equilibrated pore-water sample at station 1 was greater than the WQC (table 6). Uranium concentration measured in the equilibrated pore-water sample at station 4 exceeded the WQC (table 6).
To calculate the pore-water hazard index (sum of hazard quotients for Cd, Cu, Ni, Pb, and Zn), hardness-dependent WQC were calculated on the basis of the hardness of the sample. The hazard index exceeded 1.0 for all pore waters from stations 1, 4F, and 4 except for the peeper water from station 4. Hazard indices ranged from 36 to 290 for station 1, from 0.2 to 4.8 for station 4, and 4.7 for station 4F.
Sediment Geochemistry
Sediment samples from the upper reach of Pike Hill Brook are from three locations (stations 1, 4F, and 4). Sta-tion 5A is used for comparison as the reference sample for these upper reach samples. Chemical constituents for sediment samples are summarized in table 9, and select elements are illustrated in figures 10 and 11; complete analyses are reported in appendix 6. SEM-AVS data for sediment samples are summarized in table 10, and complete analyses are reported in appendix 4. The major element geochemistry of the background sample for Pike Hill Brook (5A) reflected its siliciclastic constituents, with 4.49 weight percent Al, 1.3 weight percent Fe, and between 0.55 and 1.51 weight percent Ca, K, Mg, and Na. In contrast, the mine-impacted sediment samples 1 and 4F from the upper reach contained Fe > Al > Ca, K, Mg, and Na. The concentrations of Fe decreased from 14.8 to 5.9 weight percent, and the concentra-tions of Al, Ca, K, Mg, and Na all increased from station 1 to station 4F (table 9; fig. 10). Downstream from station 4F and the confluence with a tributary not impacted by drainage from the mines, the sediment chemistry was similar to that found at station 5A with Al > Ca, Fe, K, Mg, and Na. Also, sulfur was <0.01 weight percent at background station 5A compared to 2.23 weight percent at station 1 (fig. 10). From station 1 downstream to stations 4F and 4, the concentrations of sulfur decreased (fig. 10). Carbonate carbon was low in all samples from the upper reach of Pike Hill Brook and was between 0.01 and 0.03 weight percent carbon (table 9). In contrast, total organic carbon was significantly higher than carbonate carbon and ranged from 0.36 to 1.21 weight percent for stations 1, 4F, and 4. The concentration of organic carbon in background sediment 5A was 0.52 weight percent.
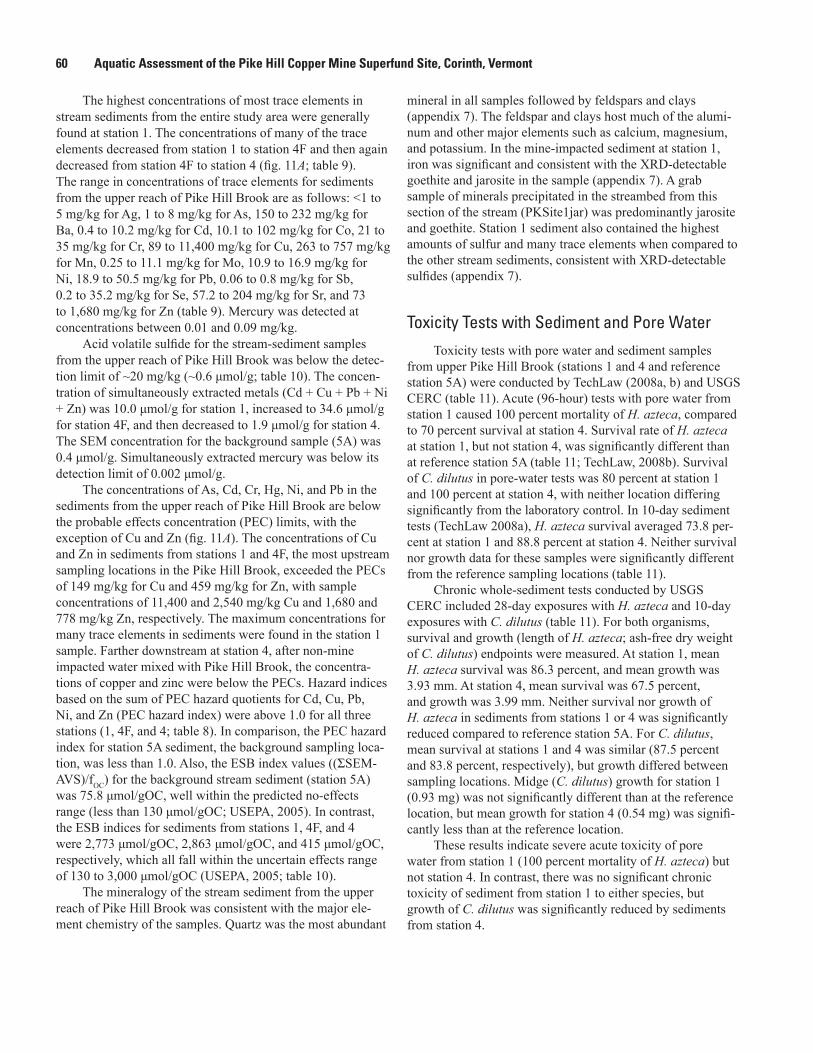
60 Aquatic Assessment of the Pike Hill Copper Mine Superfund Site, Corinth, Vermont
The highest concentrations of most trace elements in stream sediments from the entire study area were generally found at station 1. The concentrations of many of the trace elements decreased from station 1 to station 4F and then again decreased from station 4F to station 4 (fig. 11A; table 9). The range in concentrations of trace elements for sediments from the upper reach of Pike Hill Brook are as follows: <1 to 5 mg/kg for Ag, 1 to 8 mg/kg for As, 150 to 232 mg/kg for Ba, 0.4 to 10.2 mg/kg for Cd, 10.1 to 102 mg/kg for Co, 21 to 35 mg/kg for Cr, 89 to 11,400 mg/kg for Cu, 263 to 757 mg/kg for Mn, 0.25 to 11.1 mg/kg for Mo, 10.9 to 16.9 mg/kg for Ni, 18.9 to 50.5 mg/kg for Pb, 0.06 to 0.8 mg/kg for Sb, 0.2 to 35.2 mg/kg for Se, 57.2 to 204 mg/kg for Sr, and 73 to 1,680 mg/kg for Zn (table 9). Mercury was detected at concentrations between 0.01 and 0.09 mg/kg.
Acid volatile sulfide for the stream-sediment samples from the upper reach of Pike Hill Brook was below the detec-tion limit of ~20 mg/kg (~0.6 μmol/g; table 10). The concen-tration of simultaneously extracted metals (Cd + Cu + Pb + Ni + Zn) was 10.0 μmol/g for station 1, increased to 34.6 μmol/g for station 4F, and then decreased to 1.9 μmol/g for station 4. The SEM concentration for the background sample (5A) was 0.4 μmol/g. Simultaneously extracted mercury was below its detection limit of 0.002 μmol/g.
The concentrations of As, Cd, Cr, Hg, Ni, and Pb in the sediments from the upper reach of Pike Hill Brook are below the probable effects concentration (PEC) limits, with the exception of Cu and Zn (fig. 11A). The concentrations of Cu and Zn in sediments from stations 1 and 4F, the most upstream sampling locations in the Pike Hill Brook, exceeded the PECs of 149 mg/kg for Cu and 459 mg/kg for Zn, with sample concentrations of 11,400 and 2,540 mg/kg Cu and 1,680 and 778 mg/kg Zn, respectively. The maximum concentrations for many trace elements in sediments were found in the station 1 sample. Farther downstream at station 4, after non-mine impacted water mixed with Pike Hill Brook, the concentra-tions of copper and zinc were below the PECs. Hazard indices based on the sum of PEC hazard quotients for Cd, Cu, Pb, Ni, and Zn (PEC hazard index) were above 1.0 for all three stations (1, 4F, and 4; table 8). In comparison, the PEC hazard index for station 5A sediment, the background sampling loca-tion, was less than 1.0. Also, the ESB index values ((ΣSEM-AVS)/fOC) for the background stream sediment (station 5A) was 75.8 μmol/gOC, well within the predicted no-effects range (less than 130 μmol/gOC; USEPA, 2005). In contrast, the ESB indices for sediments from stations 1, 4F, and 4 were 2,773 μmol/gOC, 2,863 μmol/gOC, and 415 μmol/gOC, respectively, which all fall within the uncertain effects range of 130 to 3,000 μmol/gOC (USEPA, 2005; table 10).
The mineralogy of the stream sediment from the upper reach of Pike Hill Brook was consistent with the major ele-ment chemistry of the samples. Quartz was the most abundant
mineral in all samples followed by feldspars and clays (appendix 7). The feldspar and clays host much of the alumi-num and other major elements such as calcium, magnesium, and potassium. In the mine-impacted sediment at station 1, iron was significant and consistent with the XRD-detectable goethite and jarosite in the sample (appendix 7). A grab sample of minerals precipitated in the streambed from this section of the stream (PKSite1jar) was predominantly jarosite and goethite. Station 1 sediment also contained the highest amounts of sulfur and many trace elements when compared to the other stream sediments, consistent with XRD-detectable sulfides (appendix 7).
Toxicity Tests with Sediment and Pore WaterToxicity tests with pore water and sediment samples
from upper Pike Hill Brook (stations 1 and 4 and reference station 5A) were conducted by TechLaw (2008a, b) and USGS CERC (table 11). Acute (96-hour) tests with pore water from station 1 caused 100 percent mortality of H. azteca, compared to 70 percent survival at station 4. Survival rate of H. azteca at station 1, but not station 4, was significantly different than at reference station 5A (table 11; TechLaw, 2008b). Survival of C. dilutus in pore-water tests was 80 percent at station 1 and 100 percent at station 4, with neither location differing significantly from the laboratory control. In 10-day sediment tests (TechLaw 2008a), H. azteca survival averaged 73.8 per-cent at station 1 and 88.8 percent at station 4. Neither survival nor growth data for these samples were significantly different from the reference sampling locations (table 11).
Chronic whole-sediment tests conducted by USGS CERC included 28-day exposures with H. azteca and 10-day exposures with C. dilutus (table 11). For both organisms, survival and growth (length of H. azteca; ash-free dry weight of C. dilutus) endpoints were measured. At station 1, mean H. azteca survival was 86.3 percent, and mean growth was 3.93 mm. At station 4, mean survival was 67.5 percent, and growth was 3.99 mm. Neither survival nor growth of H. azteca in sediments from stations 1 or 4 was significantly reduced compared to reference station 5A. For C. dilutus, mean survival at stations 1 and 4 was similar (87.5 percent and 83.8 percent, respectively), but growth differed between sampling locations. Midge (C. dilutus) growth for station 1 (0.93 mg) was not significantly different than at the reference location, but mean growth for station 4 (0.54 mg) was signifi-cantly less than at the reference location.
These results indicate severe acute toxicity of pore water from station 1 (100 percent mortality of H. azteca) but not station 4. In contrast, there was no significant chronic toxicity of sediment from station 1 to either species, but growth of C. dilutus was significantly reduced by sediments from station 4.
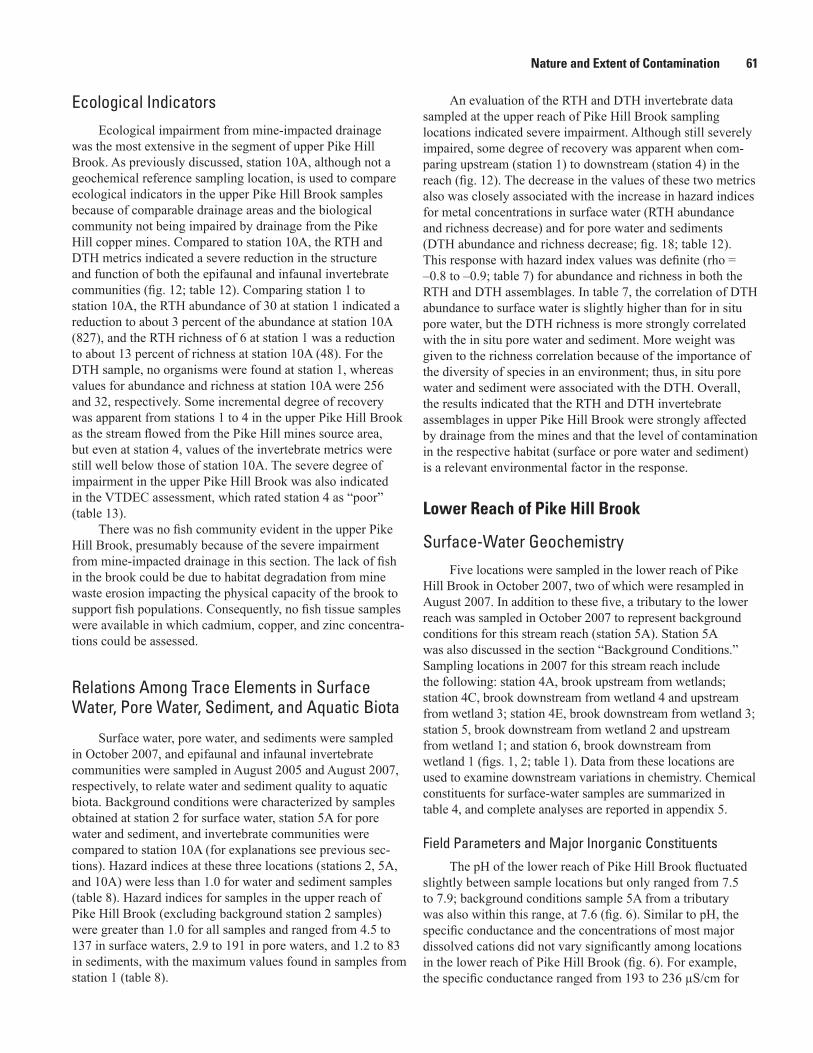
Nature and Extent of Contamination 61
Ecological IndicatorsEcological impairment from mine-impacted drainage
was the most extensive in the segment of upper Pike Hill Brook. As previously discussed, station 10A, although not a geochemical reference sampling location, is used to compare ecological indicators in the upper Pike Hill Brook samples because of comparable drainage areas and the biological community not being impaired by drainage from the Pike Hill copper mines. Compared to station 10A, the RTH and DTH metrics indicated a severe reduction in the structure and function of both the epifaunal and infaunal invertebrate communities (fig. 12; table 12). Comparing station 1 to station 10A, the RTH abundance of 30 at station 1 indicated a reduction to about 3 percent of the abundance at station 10A (827), and the RTH richness of 6 at station 1 was a reduction to about 13 percent of richness at station 10A (48). For the DTH sample, no organisms were found at station 1, whereas values for abundance and richness at station 10A were 256 and 32, respectively. Some incremental degree of recovery was apparent from stations 1 to 4 in the upper Pike Hill Brook as the stream flowed from the Pike Hill mines source area, but even at station 4, values of the invertebrate metrics were still well below those of station 10A. The severe degree of impairment in the upper Pike Hill Brook was also indicated in the VTDEC assessment, which rated station 4 as “poor” (table 13).
There was no fish community evident in the upper Pike Hill Brook, presumably because of the severe impairment from mine-impacted drainage in this section. The lack of fish in the brook could be due to habitat degradation from mine waste erosion impacting the physical capacity of the brook to support fish populations. Consequently, no fish tissue samples were available in which cadmium, copper, and zinc concentra-tions could be assessed.
Relations Among Trace Elements in Surface Water, Pore Water, Sediment, and Aquatic Biota
Surface water, pore water, and sediments were sampled in October 2007, and epifaunal and infaunal invertebrate communities were sampled in August 2005 and August 2007, respectively, to relate water and sediment quality to aquatic biota. Background conditions were characterized by samples obtained at station 2 for surface water, station 5A for pore water and sediment, and invertebrate communities were compared to station 10A (for explanations see previous sec-tions). Hazard indices at these three locations (stations 2, 5A, and 10A) were less than 1.0 for water and sediment samples (table 8). Hazard indices for samples in the upper reach of Pike Hill Brook (excluding background station 2 samples) were greater than 1.0 for all samples and ranged from 4.5 to 137 in surface waters, 2.9 to 191 in pore waters, and 1.2 to 83 in sediments, with the maximum values found in samples from station 1 (table 8).
An evaluation of the RTH and DTH invertebrate data sampled at the upper reach of Pike Hill Brook sampling locations indicated severe impairment. Although still severely impaired, some degree of recovery was apparent when com-paring upstream (station 1) to downstream (station 4) in the reach (fig. 12). The decrease in the values of these two metrics also was closely associated with the increase in hazard indices for metal concentrations in surface water (RTH abundance and richness decrease) and for pore water and sediments (DTH abundance and richness decrease; fig. 18; table 12). This response with hazard index values was definite (rho = –0.8 to –0.9; table 7) for abundance and richness in both the RTH and DTH assemblages. In table 7, the correlation of DTH abundance to surface water is slightly higher than for in situ pore water, but the DTH richness is more strongly correlated with the in situ pore water and sediment. More weight was given to the richness correlation because of the importance of the diversity of species in an environment; thus, in situ pore water and sediment were associated with the DTH. Overall, the results indicated that the RTH and DTH invertebrate assemblages in upper Pike Hill Brook were strongly affected by drainage from the mines and that the level of contamination in the respective habitat (surface or pore water and sediment) is a relevant environmental factor in the response.
Lower Reach of Pike Hill Brook
Surface-Water GeochemistryFive locations were sampled in the lower reach of Pike
Hill Brook in October 2007, two of which were resampled in August 2007. In addition to these five, a tributary to the lower reach was sampled in October 2007 to represent background conditions for this stream reach (station 5A). Station 5A was also discussed in the section “Background Conditions.” Sampling locations in 2007 for this stream reach include the following: station 4A, brook upstream from wetlands; station 4C, brook downstream from wetland 4 and upstream from wetland 3; station 4E, brook downstream from wetland 3; station 5, brook downstream from wetland 2 and upstream from wetland 1; and station 6, brook downstream from wetland 1 (figs. 1, 2; table 1). Data from these locations are used to examine downstream variations in chemistry. Chemical constituents for surface-water samples are summarized in table 4, and complete analyses are reported in appendix 5.
Field Parameters and Major Inorganic ConstituentsThe pH of the lower reach of Pike Hill Brook fluctuated
slightly between sample locations but only ranged from 7.5 to 7.9; background conditions sample 5A from a tributary was also within this range, at 7.6 (fig. 6). Similar to pH, the specific conductance and the concentrations of most major dissolved cations did not vary significantly among locations in the lower reach of Pike Hill Brook (fig. 6). For example, the specific conductance ranged from 193 to 236 µS/cm for

62 Aquatic Assessment of the Pike Hill Copper Mine Superfund Site, Corinth, Vermont
10
100
1,000
10,000
0.01 0.1 1 10 100 1,000
Inve
rtebr
ate
abun
danc
e
Surface-water hazard index
1
10
100
0.01 0.1 1 10 100 1,000
Inve
rtebr
ate
richn
ess
Surface-water hazard index
1
10
100
1,000
0.01 0.1 1 10 100 1,000
Inve
rtebr
ate
abun
danc
e
Pore-water hazard index
*1
10
100
0.01 0.1 1 10 100 1,000
Inve
rtebr
ate
richn
ess
Pore-water hazard index
*
Figure 18.
A. RTH B. RTH
C. DTH D. DTH
ReferenceUpper Pike Hill Brook
Cookville BrookLower Pike Hill Brook
EXPLANATION
station 5 station 5
station 5 station 5
Figure 18. The relations of invertebrate communities to hazard indices for surface water and pore water. A and B illustrate the abundance and richness values of the epifaunal community (riffle-targeted habitat, RTH) as related to the hazard index for surface water. C and D illustrate abundance and richness values of the infaunal community (depositional targeted habitat, DTH) as related to the hazard index for pore water. Note: Points marked with an asterisk (*) have abundance/richness values of zero, which cannot be plotted correctly on a logarithmic scale.
Nature and Extent of Contamination 63
the lower reach samples; background station 5A was higher at 356 µS/cm. The general trend for specific conductance, hardness, and several major cations such as calcium, magnesium, and silica was a slight decrease from station 4A to 4E (figs. 6, 7). Specific conductance, hardness, calcium, and silica concentrations then increased slightly, whereas magnesium decreased slightly, at the next downstream station (station 5). From stations 5 to 6, these constituents decreased slightly in concentration or remained the same. Potassium only fluctuated between 1.9 and 2.17 mg/L in the lower reach, and sodium generally increased in concentration from the upstream sampling locations to the downstream locations. The concentrations of most major cations were higher in the background conditions sample 5A compared to lower reach Pike Hill samples, a finding that is consistent with the higher specific conductance of this sample. In contrast to most major cations, bicarbonate, which was estimated from measured alkalinity and is the dominant anionic species, increased from stations 4A to 4C to 4E and then decreased downstream to station 5 and then again increased slightly at station 6; alkalinity only ranged from 71 to 84 mg/L as CaCO3 in this stream reach (fig. 7). Background station 5A had an alkalinity of 134 mg/L as CaCO3. Chloride and sulfate concentrations reached 7.4 and 43.8 mg/L, respectively; chloride increased downstream, whereas sulfate decreased downstream (fig. 7). For all samples in this reach including 5A, calcium was the dominant dissolved cation and ranged from 26 to 45.8 mg/L. Other major dissolved cations include potassium (1.9 to 3.32 mg/L), magnesium (1.52 to 2.4 mg/L), sodium (1.28 to 15.6 mg/L), and silica (5.4 to 8.5 mg/L; table 4). The ranges in concentration of major cations are similar but generally slightly lower to those reported in previous reports (Piatak and others, 2006b; USGS, 2006a; Kiah and others, 2007).
Iron, Aluminum, and ManganeseThe concentrations of dissolved manganese (51.1 to
138 µg/L) were considerably higher than the concentrations of dissolved aluminum (4 to 9.7 µg/L) for lower reach samples; background sample 5A contained 55.2 µg/L manganese and 6.7 µg/L aluminum. The concentrations of both manganese and aluminum generally decreased downstream from station 4A to station 6 (fig. 8). In contrast, dissolved iron, which ranged from <20 to 224 µg/L, generally increased downstream from station 4A to station 6 (fig. 8A); iron was not detected in surface water from station 5A.
Minor and Trace ElementsThe only minor and trace elements present in significant
concentrations in October 2007 surface-water samples in the lower stream reach were Ba (9.12 to 15.6 µg/L), Co (0.43 to 15.8 µg/L), Cu (5.8 to 9.4 µg/L), Ni (0.4 to 2.7 µg/L ), Sr (99.5 to 123 µg/L), and Zn (8.6 to 131 µg/L; table 4). Trace amounts of dissolved cadmium (up to 0.88 µg/L) and uranium (up to 0.24 µg/L) were also detected in some or all samples. In comparison, the concentrations of many of these elements
in October 2007 surface waters were on the lower end of the range found in previous studies for samples collected between 2004 and 2006 (fig. 4). The concentrations of dissolved Cd, Co, Cu, Ni, and Zn generally decreased downstream from station 4A to station 6 (table 4; fig. 9). The concentrations of cadmium, cobalt, copper, and zinc were lower in station 5A compared to the lower reach Pike Hill Brook samples. Dissolved Ag, As, Be, Cr, Hg, Pb, Sb, Se, Tl, and V concentra-tions were all below the detection limits in lower Pike Hill Brook (appendix 5).
Dissolved Organic Carbon and Nutrients
DOC concentrations throughout the lower stream reach of Pike Hill Brook ranged from 1.3 to 3.3 mg/L and increased downstream from station 4C to station 6; the concentration at station 4A was slightly higher than at 4C. The background conditions sample from the tributary (station 5A) contained 4.2 mg/L DOC. Nutrients were generally low throughout the study area. Total nitrogen ranged from 0.04 to 0.42 mg/L and total phosphorus ranged from <0.008 to 0.007 mg/L for lower Pike Hill Brook and station 5A (table 4).
Trace Element Loads and Yields
Coupled streamflow measurements and surface-water samples obtained at sample locations in the lower Pike Hill Brook reach on October 17, 2007, were used to describe transport and attenuation of constituents. Background condi-tions were characterized by samples obtained from station 5A. Instantaneous loads were calculated for both the dissolved and total phases for Al, Cd, Co, Cu, Fe, Mn, and Zn. Instantaneous loads for these elements were one to three orders of magnitude above the background station (5A; fig. 16). Unlike the upper reach of Pike Hill Brook, which shows a linear depreciation of most loads, instantaneous loads in the lower reach fluctuate and more gradually attenuate. Loads of cadmium, cobalt, zinc, and, to a lesser extent, copper decrease from stations 4A to 4C as Pike Hill Brook passes through the largest of the wetlands. However, for these elements, the instantaneous loads from station 4E to station 5 increase and remain nearly constant for the remainder of the lower reach (fig. 16B, C, D, G). These shifts in instantaneous loads may indicate that the series of wetlands between the sample locations in the lower reach of Pike Hill Brook have an influence on trace metal cycling and bioavailability.
Evaluation of yields in the lower reach of Pike Hill Brook indicated that overall yields of each element decreased with distance from the mines. Yields of aluminum, iron, and man-ganese were near or below background values (fig. 17A, E, F). Yields of cadmium, cobalt, copper, and zinc all remained elevated above background values (fig. 17B, C, D, G).
Comparisons with Ambient Water-Quality CriteriaComparisons were made between concentrations of
selected elements and ambient WQC (table 5) to describe
64 Aquatic Assessment of the Pike Hill Copper Mine Superfund Site, Corinth, Vermont
how concentrations of contaminants of concern may vary over time and distance from mining activities; for hardness-dependent WQC, a hardness of 100 mg/L as CaCO3 was assumed. Data were used from this study (October and August 2007), from Kiah and others (2007), and from Piatak and others (2006b). Concentrations were generally one to three orders of magnitude lower in the lower reach of Pike Hill Brook than in the upper reach of Pike Hill Brook and therefore fewer samples exceeded WQC. An exception was barium concentrations, which were similar in magnitude to surface-water samples collected in the upper reach of Pike Hill Brook and were greater than the WQC in all samples (fig. 4B). Concentrations of dissolved Cd, Co, and Mn were above the WQC at stations 4A and 4C, and concentrations of total Al and dissolved Cu and Zn were above the WQC at station 4A (fig. 4) for samples collected in October 2007.
The hazard indices based on the sum of the hazard quotients for Cd, Cu, Ni, Pb, and Zn exceeded 1.0 for all surface-water samples in the lower stream reach of Pike Hill Brook. The surface-water hazard index values did decrease with distance downstream from 5.9 at station 4A to 1.3 at station 6 (table 8). The hazard index for background station 5A was 0.1. The hardness-dependent WQC in figures 3, 4, and 5 and discussed in the previous paragraph were generalized in that they were calculated on the basis of a hardness of 100 mg/L as CaCO3. In contrast, the surface-water hazard index values were calculated on the basis of the hardness of the individual samples, which ranged from 73 to 97 mg/L as CaCO3. The findings were similar for exceedances based on generalized WQC, but the hazard index is a cumulative effect for several metals; therefore, more sampling locations exceeded the threshold value of 1.0 for hazard index than for WQC values for individual trace elements.
Pore-Water GeochemistryPore-water samples from the lower reach of Pike Hill
Brook were co-located with surface-water sampling locations and include stations 4A, 4C, 4E, 5, 6, and 5A. In situ, centri-fuged, equilibrated, and peeper pore waters were extracted for each sample location (figs. 1, 2); station 5A samples are also discussed in the “Background Conditions” section. Minor but significant differences in the chemical composition among the four types of pore-water samples were noted. Chemical constituents for pore-water samples are summarized in table 6, and complete analyses are reported in appendix 5.
Field Parameters and Major Inorganic ConstituentsThe pH and specific conductance were measured on
the in situ, centrifuged, and equilibrated samples. The pore waters for all sampling locations on the lower reach of Pike Hill Brook including background station 5A were near neutral, with pH ranging from 6.6 to 8.1. Similar to surface water, the pH decreased slightly from stations 4A to 4C and then increased slightly from stations 4C to 4E in each of the
pore-water sample types (fig. 6). The pH of in situ pore water was less than that of the equilibrated and centrifuged pore waters. The specific conductance of the pore water generally decreased from stations 4A to 4C to 4E and then increased from stations 4E to 5 (fig. 6). The specific conductance of equilibrated pore water (498 to 1187 µS/cm) was higher than for in situ (195 to 268 µS/cm) and centrifuged (217 to 362 µS/cm) pore water (table 6).
Calcium was the dominant dissolved cation, followed by silica; potassium, magnesium, and sodium occurred in subequal proportions; relative abundances of major cations in pore waters were similar to the surface-water samples (appendix 5). The background conditions sample 5A from a tributary contained significantly higher concentrations of Na and high to intermediate concentrations of Ca, K, Mg, and SiO2 when compared to lower Pike Hill Brook samples. The concentrations of the major cations in pore waters generally decreased from station 4A, upstream from wetlands, to station 4C, downstream from the first wetland area (wetland 4) in the lower reach of Pike Hill Brook. The concentrations of major cations in most pore-water samples did not vary significantly from stations 4C to 4E, downstream from the next wetland area (wetland 3), and then generally decreased from stations 4E to 5, downstream from the next wetland area (wetland 2). The concentrations of dissolved major cations were usually highest in the equilibrated samples (Ca: 79.4 to 236 mg/L; K: 5.87 to 17.4 mg/L; Mg: 4.92 to 17.4 mg/L; Na: 3.29 to 9.25 mg/L; SiO2: 8 to 22.8 mg/L) and lowest in the in situ samples (Ca: 24.7 to 37.7 mg/L; K: 1.25 to 2.16 mg/L; Mg: 1.49 to 2.19 mg/L; Na: 1.27 to 4.02 mg/L; SiO2: 4.9 to 7.9 mg/L) for pore waters from lower Pike Hill Brook (table 6). Bicarbonate, estimated from measured alkalinity, was the dominant anionic species, and like the major cations was found in higher concentrations in the equilibrated samples (alkalinity of 180 to 540 mg/L as CaCO3) than in the in situ samples (alkalinity of 61 to 108 mg/L as CaCO3), with centrifuged samples, when determined, having intermediate concentrations (alkalinity of 62 to 130 mg/L as CaCO3). The alkalinity values of the in situ pore waters were similar to surface waters (fig. 7). The hardness values of the pore waters followed similar trends as alkalinity, with the highest hardness found in equilibrated pore waters, intermediate values for centrifuged and peeper pore waters, and the lowest values for in situ pore waters; surface waters were similar in hardness to the in situ pore waters (fig. 7). Sulfate concentrations were usually higher than chloride concentrations, reaching 43.6 and 10.5 mg/L, respectively (table 6).
Iron, Aluminum, and ManganeseDissolved iron concentrations were below the detection
limit of 20 µg/L for all equilibrated pore waters and for most in situ pore waters (table 6). The exceptions in the in situ pore waters were for stations 4C (5,160 µg/L) and 5 (322 µg/L; fig. 8A). In contrast, the dissolved concentrations of iron in the centrifuged samples ranged from 94 to 19,000 µg/L;
Nature and Extent of Contamination 65
the maximum concentration was found in sample 4A and decreased in samples from downstream locations to station 5, which contained the minimum concentration; station 6 contained 1,250 µg/L iron. The concentration of iron in the peeper pore water was 780 and 1,480 µg/L for stations 4A and 4C, respectively, and then below the detection limit of 200 µg/L for the three downstream stations. The concentra-tions of dissolved aluminum ranged from 3.6 to 7.5 µg/L for in situ pore waters, from 20.7 to 423 µg/L for the centrifuged samples, from 3.4 to 35.2 µg/L for the equilibrated samples, and from <20 to 71 µg/L for peeper samples. The highest dissolved aluminum was usually in the centrifuged sample, whereas the highest dissolved manganese was always in the equilibrated sample. Dissolved manganese concentrations reached 2,740 µg/L in the in situ pore waters, 16,700 µg/L in centrifuged pore waters, 49,000 µg/L in equilibrated pore waters, and 11,800 µg/L in peeper pore waters. Background conditions sample 5A from the tributary generally contained low to intermediate concentrations of aluminum, iron, and manganese when compared to pore waters from the lower reach of Pike Hill Brook (table 6).
Minor and Trace Elements
The minor and trace elements present in pore waters from the lower reach of Pike Hill Brook were Ba (up to 188 µg/L), Cd (up to 3.6 µg/L), Co (up to 501 µg/L), Cu (up to 263 µg/L), Ni (up to 13.6 µg/L), Pb (up to 8.4 µg/L), Sb (up to 0.86 µg/L), Se (up to 4 µg/L), Sr (up to 839 µg/L), U (up to 1.07 µg/L), and Zn (up to 236 µg/L; table 6). The concentrations of cadmium, cobalt, copper, and zinc were usually highest in pore waters downstream from wetland 4 at station 4C (fig. 9). In addition, the concentrations of most trace elements were lower in the background conditions sample 5A when compared to lower reach samples. Similar to surface-water concentrations, dissolved Ag, As, Be, Cr, Hg, and Tl concentrations in nearly all or all pore waters were near or below their detection limits (appendix 5).
Dissolved Organic Carbon and Nutrients
DOC and nutrient concentrations were determined only on samples of the in situ pore water. DOC concentrations throughout the lower reach of Pike Hill Brook ranged from 1.3 to 3.0 mg/L; background conditions sample 5A contained 2.6 mg/L DOC. Nutrients were generally low throughout the lower brook, with total nitrogen ranging from 0.03 to 0.43 mg/L and total phosphorus ranging from <0.008 to 0.035 mg/L; station 5A concentrations were within these ranges for lower brook samples at 0.34 mg/L N and <0.008 mg/L P (table 6).
Comparisons with Ambient Water-Quality Criteria
Pore-water samples were collected at stations 4A, 4C, 4E, 5, and 6 in the lower reach of Pike Hill Brook. There were no pore-water samples previously collected at the Pike
Hill Copper Mine Superfund site; therefore, all analyses used data collected from this study (2007). Whether an element exceeded its WQC at any particular location is relative to the type of pore-water sample being considered; occasionally concentrations from all four pore-water samples collected at one sampling location exceed the WQC. Differences in concentrations among the four pore-water sample types for the same element at the same location were in part due to differ-ences in sample collection and processing.
Barium concentrations in all pore-water samples at all six locations in the lower reach of Pike Hill Brook were above the WQC. Concentrations were similar to those measured in the pore-water samples collected in the upper reach of Pike Hill Brook (table 6). Aluminum concentrations at stations 4A, 4C, 4E, and 6 exceeded the WQC in the centrifuged samples. Concentrations of Cd, Co, Cu, Mn, and Zn were above their WQC for all or nearly all four pore-water samples collected at station 4C (table 6). Concentrations of cadmium at all other sampling locations in the lower brook exceeded the hardness-dependent WQC in at least two of the four pore-water samples (table 6). In addition to station 4C pore waters, copper exceeded criteria in pore waters from all sampling locations except station 5 in the lower brook. Cobalt concentrations exceeded the WQC in the peeper and equilibrated pore-water samples from stations 4A and 4E, the in situ and equilibrated pore-water samples from station 5, and the equilibrated pore-water samples from station 6 (table 6). Dissolved iron concen-trations at station 4C exceeded the WQC in the centrifuged, peeper, and in situ pore-water samples. Iron concentrations in the centrifuged pore-water samples from stations 4A, 4, and 6 also exceeded the WQC (table 6). One concentration of lead, measured in a centrifuged pore-water sample from station 4A, exceeded the WQC (table 6). Concentrations of manganese at stations 4A and 4C exceeded the WQC in all four pore-water samples. Manganese concentrations exceeded the WQC in the equilibrated and peeper pore-water samples at station 5 and in the equilibrated and peeper pore-water samples at station 6 (table 6). Uranium concentrations measured in the equilibrated pore-water samples from stations 5 and 6 exceeded the WQC (table 6).
Hardness-dependent WQC were calculated on the basis of the hardness of the sample to arrive at the pore-water hazard index (sum of hazard quotients for Cd, Cu, Ni, Pb, and Zn). The hazard index exceeded 1.0 for all pore waters from the lower reach of Pike Hill Brook. The hazard index ranges for each location are as follows: 4.3 to 7.1 for station 4A; 13.3 to 49.5 for station 4C; 5.1 to 13.1 for station 4E; 1.3 to 3.2 for station 5; and 2.3 to 4.9 for station 6. Background conditions station 5A had hazard indices of 0.0 to 0.4 for the four pore-water types.
Sediment GeochemistrySediment samples from the lower reach of Pike Hill
Brook include five locations (stations 4A, 4C, 4E, 5, and 6). Station 5A is used for comparison as the background
66 Aquatic Assessment of the Pike Hill Copper Mine Superfund Site, Corinth, Vermont
sample for these lower reach samples. Chemical constituents for sediment samples are summarized in table 9, and select elements are illustrated in figures 10 and 11; complete chemical analyses are reported in appendix 6. SEM-AVS data for sediment samples are summarized in table 10, and complete analyses are reported in appendix 4. As previously stated, the major element geochemistry of the background sample for Pike Hill Brook (5A) reflected its siliciclastic constituents, with 4.49 weight percent Al, 1.3 weight percent Fe, and between 0.55 and 1.51 weight percent Ca, K, Mg, and Na. The sediment samples in the lower reach of Pike Hill Brook have similar major element geochemistry compared to station 5A, with similar concentrations of Ca (0.98 to 1.55 weight percent), K (1.12 to 1.49 weight percent), Mg (0.46 to 0.91 weight percent), and Na (0.06 to 1.22 weight percent), and slightly lower concentrations of Al (3.85 to 4.38 weight percent). The concentrations of iron ranged from 1.07 to 3.57 weight percent, with the highest being for the more upstream stations (4A, 4C, and 4E) in this reach (fig. 10). Also, sulfur was <0.01 weight percent at background station 5A as well as at station 5. The concentrations of sulfur reached 0.1 weight percent for sediment from station 4E (fig. 10). Carbonate carbon was low in all samples from Pike Hill Brook and was between 0.01 and 0.02 weight percent carbon for lower reach samples. In contrast, total organic carbon was significantly higher than carbonate carbon and ranged from 0.3 to 1.47 weight percent for stations 4A, 4C, 4E, 5, and 6. The concentration of organic carbon in back-ground sediment 5A was 0.52 weight percent.
Maximum concentrations of trace elements in the lower reach of Pike Hill Brook stream sediments are 2 mg/kg for As (several samples), 275 mg/kg for Ba (5X, field replicate of 5), 3.1 mg/kg for Cd (4C), 102 mg/kg for Co (4C), 38 mg/kg for Cr (4C), 1,470 mg/kg for Cu (4C), 905 mg/kg for Mn (4E), 1.42 mg/kg for Mo (4E), 18.6 mg/kg for Ni (4C), 20.8 mg/kg for Pb (4C), 0.14 mg/kg for Sb (4C), 2.2 mg/kg for Se (4C), 203 mg/kg for Sr (5X), and 575 mg/kg for Zn (4C; table 9). Stream sediments from 4C and 4E, just upstream and down-stream from wetland 3, contain the highest concentrations of many trace elements (fig. 11A). The concentrations of Cd, Co, Cr, Cu, Mn, Mo, Ni, Sb, Se, and Zn generally increased from station 4 (in the upper reach of Pike Hill Brook) to stations 4A and 4C and then generally decreased downstream from these two stations (fig. 11A; table 9). The concentrations of most trace elements (that is, cadmium, cobalt, copper, zinc) were significantly higher in sediment from the lower reach compared to the background sample 5A. Silver and mercury were near or below their detection limits for background sample 5A and samples from the lower reach of Pike Hill Brook (appendix 6).
Similar to the upper reach samples, acid volatile sulfide for the stream-sediment samples from the lower reach of Pike Hill Brook was below the detection limit of ~20 mg/kg (~0.6 μmol/g; table 10). The concentration of simultaneously extracted metals (Cd + Cu + Pb + Ni + Zn) was 12.3 μmol/g for station 4A, an increase when compared to the closest
upstream sampling location of station 4, with 1.9 μmol/g. From station 4A downstream to station 4C, the ΣSEM increased to 24.6 μmol/g for station 4C and then decreased to 7.8 (4E), then 1.4 (5), and 2.3 (6) μmol/g. The background sample 5A was 0.4 μmol/g ΣSEM, for comparison. Simultane-ously extracted mercury was below its detection limit of 0.002 μmol/g.
Similar to the upper reach, the concentrations of As, Cd, Cr, Hg, Ni, and Pb in sediments from the lower reach of Pike Hill Brook were below PECs, with the exception of Cu and Zn. The concentrations of copper in sediments from stations 4A, 4C, and 4E exceeded the PEC of 149 mg/kg, with sample concentrations of 757, 1,470, and 1,010 mg/kg copper, respectively (fig. 11A). In addition, the concentration of zinc in sediment from station 4C exceeded the PEC of 459 mg/kg, with a sample concentration of 575 mg/kg zinc. Farther downstream at stations 5 and 6, the concentrations of copper and zinc were below the PECs (fig. 11A). PEC-based hazard indices (summed hazard quotients for Cd, Cu, Ni, Pb, and Zn) were above 1.0 for the three stations 4A, 4C, and 4E (table 8). In comparison, the PEC hazard index for station 5A sediment, the background sampling location, was less than 1.0. Also, the ESB index for the background stream sediment (5A) was 75.8 μmol/gOC, well within the predicted no-effects range (<130 μmol/gOC). In contrast, the ESB indices for sediments from all locations in the lower stream reach of Pike Hill Brook were within the uncertain effects range of 130 to 3,000 μmol/gOC (USEPA 2005); ESB index values for these samples ranged from 455.5 to 2,311.7 μmol/gOC (table 10).
The mineralogy of the stream sediment from the lower reach of Pike Hill Brook was consistent with the major ele-ment chemistry of the samples. Quartz was the most abundant mineral in all samples, followed in abundance by feldspars and clays (appendix 7). The feldspar and clays host much of the aluminum and other major elements such as calcium, magne-sium, and potassium. Iron was present in up to a few weight percent in the stream sediments but goethite and jarosite were not detected; the iron may be hosted in amphiboles or clay minerals or could be present as amorphous material. Sulfur was low or non-detectable based on the chemistry, which is consistent with sulfides generally not being detected in these sediments.
Toxicity Tests with Sediment and Pore Water
Toxicity tests with pore water and sediment samples from lower Pike Hill Brook (stations 4A, 4C, 4E, 5, and 6; reference station 5A) were conducted by TechLaw (2008a, b) and USGS CERC (table 11). Pore-water toxicity testing for sample locations in lower Pike Hill Brook indicated no significant differences in survival of C. dilutus (compared to the labora-tory control) or survival of H. azteca (compared to reference station 5A; table 11; TechLaw, 2008b). Whole-sediment toxicity testing for 10 days with H. azteca indicated significant toxic effects of samples from stations 4A (reduced growth)
Nature and Extent of Contamination 67
and 4C (reduced survival and growth) but not at sampling locations farther downstream (table 11; TechLaw, 2008a).
Whole-sediment toxicity tests conducted by USGS CERC included 28-day exposures with H. azteca and 10-day exposures with C. dilutus. For both organisms, survival and growth (length of H. azteca; ash-free dry weight of C. dilutus) endpoints were measured (table 11). At stations 4C and 4E, mean survival of H. azteca was 37.5 percent and 47.5 percent, respectively, with both means significantly less than at reference station (5A). Growth of H. azteca at stations 4A, 4C, and 4E was significantly less than at the reference station, with means ranging from 2.57 to 2.98 mm, compared to 3.94 mm at the reference station. Farther downstream at stations 5 and 6, survival and growth of H. azteca were not significantly different than at the reference station (table 11). Survival of C. dilutus in sediments from the lower reach of Pike Hill Brook did not differ significantly from survival at reference station 5A, but mean growth of C. dilutus for all samples in this reach was significantly less than the mean for the refer-ence station (1.1 mg). Lowest growth of C. dilutus occurred for stations 4A, 4C, and 4E (range of means, 0.27 to 0.35 mg) with partial recovery downstream at stations 5 and 6 (range of means, 0.42–0.51 mg).
These results indicate that pore waters from lower Pike Hill Brook were not acutely toxic but that sediments from this reach were toxic to both species tested. Sediment toxicity was greatest at stations 4A and 4C, with toxic effects on both species, including toxicity to H. azteca in 10-day tests. Sediment toxicity was intermediate at station 4E, with chronic toxicity to both H. azteca and C. dilutus, and lowest in the reach downstream from the wetlands (stations 5 and 6), with chronic toxicity to C. dilutus only.
Ecological IndicatorsThe extent of recovery of ecological indicators from
upstream to downstream was somewhat more ambiguous in the lower Pike Hill Brook (between stations 4A and 7) than in the upper Pike Hill Brook. As previously discussed, station 10D is used as the reference sampling location for this stream reach due to comparable drainage areas. Compared to reference values at station 10D, invertebrate abundance and richness for the RTH and DTH communities were greatly reduced at stations 4A, 4C, and 4E (table 12; fig. 13). Although no RTH sample was collected at station 4C because it was a low gradient stream without riffles, the values of DTH abundance (15) and richness (4) were the lowest among lower Pike Hill Brook sample locations. The degree of impairment over the segment from 4A to 4E was also indicated in the VTDEC assessment, which rated these stations as “poor” (table 13).
On the basis of ecological indicators near station 5, when compared to reference conditions at station 10D, it appeared that a substantial degree of recovery had occurred; RTH abundance was greater and richness was virtually equal (55 and 54, respectively). DTH abundance and richness
values were also relatively close to reference conditions, at about 70 and 80 percent of reference values, respectively. The degree of recovery at station 5 was also indicated in the VTDEC assessment, which rated the station as “fair” based on the 2005 RTH sample and “good” based on the 2007 RTH sample (table 13). Downstream from station 5 in lower Pike Hill Brook, ecological conditions do not appear to improve at stations 6 and 7, and impairment slightly increased (fig. 13; table 12). RTH abundance and richness values were lower at these locations than at station 5, and although no DTH sample was collected at station 7, the DTH abundance value at station 6 (67) was about half the value at station 5 (121). Compared to station 5, the finding that no further recovery of ecological indicators occurred at stations 6 to 7 was also indicated in the VTDEC assessment, which rated these locations as generally “fair” (table 13).
Assessment of the fish community on the basis of the fish IBI scores of 19 indicated that the condition was “poor” from station 4A downstream to station 5. The fish community for the entire stream segment from 4A through 5 had only two minnow species (blacknose dace and creek chub; appendix 8). Within this segment of the stream were stations 4C and 4E, which did not have the physical habitat characteristics that were necessary for the fish IBI to be used effectively in making an assessment based on the fish community. However, on the basis of the reduced complexity of the fish community at all stations from 4A to 5, and the extent of mine-impacted drainage in this segment, it appears that no portion of this segment currently supports a robust fish community. There appeared to be some degree of recovery in the fish community at station 6, which was assessed as “fair” (table 13). The fish IBI score for this location was 27, and although the commu-nity was dominated by blacknose dace (39 individuals), one specimen each was collected for longnose dace, white sucker, and chain pickerel (appendix 8).
Fish tissue collected in lower Pike Hill Brook (stations 4A to 6) had copper concentrations in blacknose dace that were substantially higher than in fish at the reference location and also higher than the effects level CBR value of 2.4 µg/g (fig. 15; table 14; appendix 9). Concentrations were highest at station 4C, a location that is best characterized as a low gradient wetland (hence, no riffles and RTH sample at the station). Stations downstream from 4C are free flowing, and copper concentrations progressively decreased in fish tissue with downstream distance. However, even at station 6 (the most downstream location in the brook where fish tissue was collected), the copper concentration was more than three times higher than at the reference location and still above the CBR concentration. In contrast, the concentration of copper in a brook trout collected at station 5 was below the CBR (fig. 15). As with copper, the concentrations of cadmium were substantially higher in blacknose dace collected in the lower reach as compared to the reference location (fig. 15; table 14). The concentrations of cadmium in the lower reach samples exceeded the no-effects CBR of 0.10 µg/g but were below the effects level CBR of 0.29 µg/g. Cadmium concentrations
68 Aquatic Assessment of the Pike Hill Copper Mine Superfund Site, Corinth, Vermont
reached 0.25 µg/g in a blacknose dace from station 5. Similar to the cadmium concentration in blacknose dace in the lower reach, the concentration of cadmium in a brook trout from station 5 was above the no-effects level CBR and below the effects level CBR. The concentrations of zinc in all fish collected from the lower reach of Pike Hill Brook exceeded the CBR; values from the reference conditions station 10D also exceeded the CBR (fig. 15). Of the three trace elements, copper exceedances are the most significant, with most samples above the effects level CBR, whereas Cd exceedances were between the no-effects and effects levels; Zn exceed-ances were consistently above the no-effects level in reference and non-reference samples.
Relations Among Trace Elements in Surface Water, Pore Water, Sediment, and Aquatic Biota
Surface water, pore water, and sediment were sampled in October of 2007, and invertebrates and fish were sampled in August and September of 2007 to relate water and sediment quality to aquatic biota. Surface and pore waters, sediment, invertebrates, and fish were sampled at stations 4A, 4C, 4E, 5 and 6. Surface and pore waters, sediment, and invertebrates were sampled at 5A, a tributary to the lower reach of Pike Hill Brook. Station 5A was used to characterize background condi-tions in the lower reach for surface and pore waters and stream sediment. Station 10D, in the Cookville Brook watershed, was used as the reference sampling location to compare conditions for invertebrates and fish. Hazard indices less than 1.0 were observed in water and sediments sampled at the background locations (table 8). Hazard index values for surface-water, pore-water, and sediment samples in the lower reach of Pike Hill brook were greater than 1.0 for most samples mainly due to elevated copper and cadmium in waters and elevated copper in sediment (table 8). Sediment at the most downstream sampling locations (stations 5 and 6) had hazard index values that were 1.0 or slightly less than 1.0.
The invertebrate assemblages sampled in the lower reach of Pike Hill Brook indicated significant impairment from station 4A to station 4E, with a substantial degree of recovery at the next downstream location (station 5). Below station 5, conditions did not seem to improve, and the assemblages indicated a slight increase in impairment (fig. 13). Comparing the RTH assemblage data to the hazard indices indicated that invertebrate abundance and richness were closely associated with the metal concentrations in surface water (fig. 18; tables 7 and 12). Surface-water hazard indices for stations 5A (background conditions) and 4A (most upstream station in reach) were the lowest (0.1) and highest (5.9), respectively, with hazard indices for the other stations ranging from 0.8 to 3.5, with a general decrease in value with increasing distance downstream. With the exception of station 5, the RTH assemblage data did indicate an increase in richness and abundance with increasing distance downstream (fig. 18). The DTH assemblage data were similar to the RTH findings
with anomalously high DTH abundance for station 5 when compared to the pore-water and surface-water hazard indices (fig. 18). Station 4C, downstream from wetland 4, was also sampled for DTH communities. (The location contained no riffles so RTH could not be characterized.) This sampling loca-tion had the lowest DTH abundance and richness for the lower reach and the highest pore-water hazard index (14; table 12). Overall, the RTH, DTH, and hazard index results indicate that a close association exists between biological assemblages and microhabitat conditions and that characterizing this association is crucial when making ecological assessments.
Although assessments of the fish assemblages in the lower reach of Pike Hill Brook could only be made for a few stream locations, the reduced complexity of the fish commu-nity at sampling locations from 4A to 5 indicated impairment. Some fish community recovery occurred at station 6, with an assessment of “fair” (table 13). The fish community trend generally corresponded to the extent of impairment among sampling locations as based on the RTH invertebrate assem-blages, with less impairment at the most downstream stations (table 13). Although fish data were limited, the hazard index values for surface water and fish assemblages were inversely correlated, and this relation was similar to the response of the RTH invertebrate assemblages. These results imply a relation between the invertebrate and fish assemblages. However, this relation does not indicate that the fish assemblage response in the lower reach of Pike Hill Brook was dependent on the RTH invertebrate response; rather, the two assemblages were likely responding similarly to levels of metal toxicity.
Analysis of the fish tissue data indicates that cadmium, copper, and zinc were metals of potential concern when compared with the salmonid CBR values. The CBR value for copper was exceeded by nearly three times in the single blacknose dace from station 4C (fig. 15; table 14). Copper concentrations in the blacknose dace generally decreased with distance downstream (fig. 15), with the exception of the most upstream sampling location in the reach (station 4A). The one brook trout collected from this reach did not contain enough copper to exceed the effects level CBR but did contain enough cadmium to exceed the no-effects level CBR. Cadmium concentrations in blacknose dace exceeded the no-effect CBR in the lower stream reach but did not display the same trend as copper of decreasing concentration with increasing distance downstream (fig. 15). In contrast to copper and cadmium con-centrations, the zinc concentrations in fish tissue exceed the CBR value for that metal at all sampling locations, and there were no discernible patterns of variance among the stations; reference station 10D also exceeded the CBR (fig. 15). Similar to those of copper, the concentrations of zinc in the brook trout were generally lower than those found in the blacknose dace. Although there were not enough samples for an explicit interpretation, the greater variances in copper and cadmium concentrations in both brook trout and blacknose dace suggest that these trace elements could be impairing fish more so than zinc in the lower reach of Pike Hill Brook. In addition, copper concentrations that were greater than the effects level
Nature and Extent of Contamination 69
CBR were likely more ecologically significant than cadmium concentrations that were greater than the no-effects level but below the effects level.
Wetlands
Surface- and Pore-Water GeochemistrySurface and pore waters were collected from five
locations within wetland 3 (stations 3-1, 3-2, 3-3, 3-4, and 3-5 in figure 2 and table 1). No toxicity testing was conducted with pore-water samples collected from these sampling locations. For each location, in situ pore water was collected at two depths, 30.5 cm and 61 cm; surface water was collected at the three locations where it was present (stations 3-1, 3-2, and 3-5). Stations 3-1 and 3-2 appeared to be closer to the natural channel of Pike Hill Brook as it passes through the wetland, whereas station 3-5 was located in a small grove of trees to the north of Pike Hill Brook. Surface and pore water are discussed together in order to highlight potential varia-tions in water chemistry with depth. In addition to wetland 3 samples, surface water at two stream locations, one upstream (station 4C) and one downstream (station 4E) from wetland 3, were sampled in August 2007 (fig. 2; table 1). Surface water and pore waters were also sampled at these two locations in October 2007, the findings of which were discussed in the previous section on the lower reach of Pike Hill Brook. Chemical constituents for water samples from the wetlands and stations 4C and 4E are summarized in table 15, and complete analyses are reported in appendix 5.
Field Parameters and Major Inorganic Constituents
The pH of the waters in wetland 3 were near neutral and ranged from 6.6 to 7.4, with the surface samples generally having a higher pH than the samples collected at depth (pore waters). The pH of waters from stations 4C and 4E were also near neutral. The specific conductance did fluctuate between stations and with depth and ranged from 200 to 467 µS/cm for the locations within the wetlands. The specific conductance of stream waters from station 4C and 4E only ranged from 193 to 232 µS/cm for both in situ pore and surface waters collected in August and October of 2007. The hardness, which ranged from 75 to 172 mg/L as CaCO3 in the wetland samples, remained generally constant or increased with depth. Calcium, the dominant cation controlling hardness, followed a similar trend (table 15). The range in dissolved major cation concen-trations for waters within the wetlands are as follows: 26.8 to 64.7 mg/L Ca; 1.68 to 4.07 mg/L K; 1.46 to 3.31 mg/L Mg; 1.51 to 5.18 mg/L Na; 4.5 to 17.5 mg/L SiO2. Samples from wetland location 3-1 generally contained the lowest concentra-tions of calcium, magnesium, and silica and the highest concentrations of sodium. In contrast, samples from wetland location 3-5 contained the highest concentrations of silica. Concentrations of the other major cations within the wetland-water samples otherwise did not display significant trends.
Similar to the stream locations sampled in the Pike Hill Brook, bicarbonate, estimated from measured alkalinity, is the dominant anionic species in waters within the wetlands and ranged from 33 to 204 mg/L as CaCO3 (table 15). Wetland 3-1 samples generally contained lower alkalinity compared to the other wetland samples (86 to 102 mg/L as CaCO3) with the exception of wetland 3-5 that contained only 33 and 49 mg/L as CaCO3 at the surface and at 30.5 cm, respectively, but contained 190 mg/L as CaCO3 at 61 cm depth. The stream waters (stations 4C and 4E) contained alkalinity between 61 and 84 mg/L as CaCO3. Sulfate and chloride were other anionic species present in wetland-water samples and ranged from <0.08 to 61.3 mg/L and from 1.6 to 8.5 mg/L, respectively (appendix 5). In contrast to alkalinity, sulfate was highest in the surface (61.3 mg/L) and at 30.5 cm depth (49 mg/L) in wetland station 3-5 and low in the 61-cm depth sample (3 mg/L). Both chloride and sulfate were relatively high in wetland 3-1 samples. Sulfate was generally higher (16.4 to 4.5 mg/L) in stream-water samples from stations 4C and 4E compared to wetland waters (appendix 5).
Iron, Aluminum, and Manganese
The concentrations of dissolved iron (30 to 66,000 µg/L) in most waters in the wetlands were significantly higher than the concentrations of dissolved manganese (77.8 to 8,340 µg/L). Iron and manganese were generally low in surface samples compared to at-depth pore-water samples, except for wetland 3-5 samples, which contained the highest iron concentration in the surface sample when compared to the 30.5-cm and 61-cm samples. Dissolved iron and manganese concentrations were not consistently higher in the 30.5-cm or 61-cm sample (fig. 19). Dissolved aluminum concentrations were the lowest when compared to iron and manganese and ranged from <2 to 37.8 µg/L (table 15; appendix 5). Of the wetland locations sampled, none consistently contained the highest or lowest concentrations of dissolved aluminum, iron, and manganese.
Results from the surface-water and pore-water samples collected in the wetland compared to sample locations in Pike Hill Brook 4C and 4E suggest that the wetlands are causing changes in concentrations of elements in surface water and in pore water. Iron concentrations were variable (fig. 19; table 15). Overall, iron concentrations were higher in wetland samples compared to stream samples, and iron in surface water was higher at sample location 4E than at location 4C. This may suggest that dissolved iron concentra-tions were increasing as Pike Hill Brook passes through the wetland, presumably through reductive dissolution of ferric hydroxide particles in anoxic portions of the wetlands at depth. In contrast, dissolved manganese concentrations were generally higher in the wetland waters compared to locations 4C and 4E, and the concentrations of manganese decreased slightly from 4C to 4E (table 15). This decrease may suggest that although the wetland contains significant manganese, it
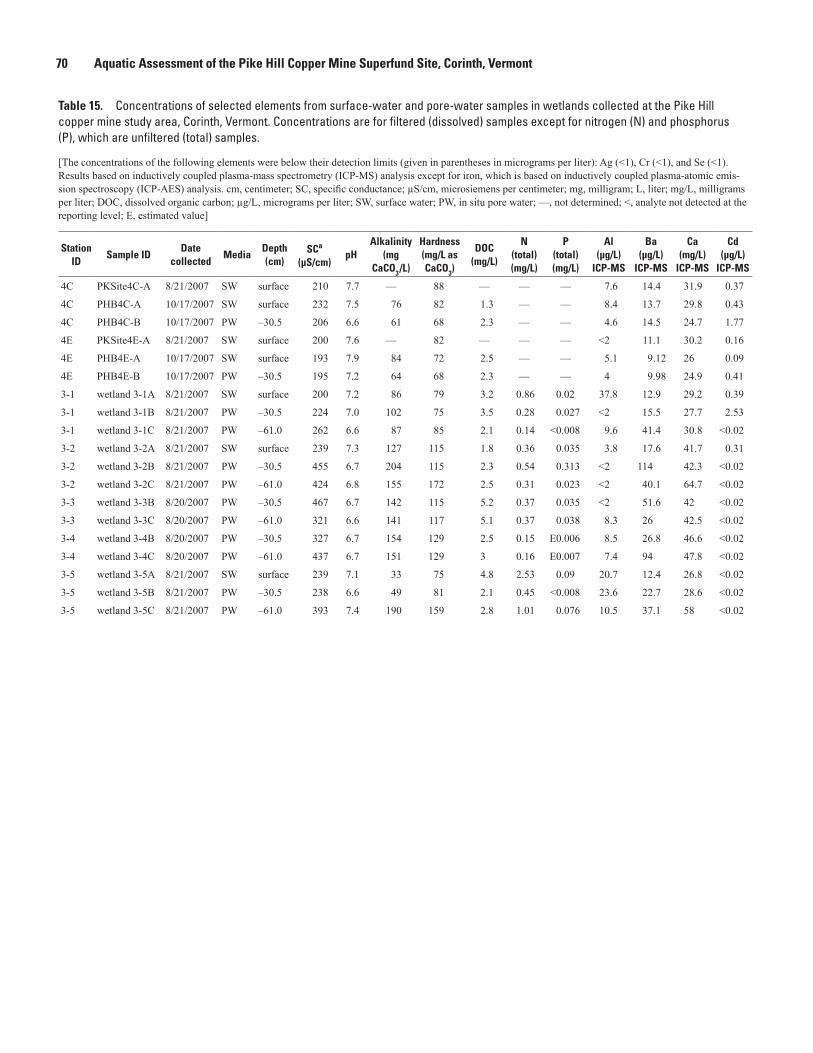
70 Aquatic Assessment of the Pike Hill Copper Mine Superfund Site, Corinth, Vermont
Table 15. Concentrations of selected elements from surface-water and pore-water samples in wetlands collected at the Pike Hill copper mine study area, Corinth, Vermont. Concentrations are for filtered (dissolved) samples except for nitrogen (N) and phosphorus (P), which are unfiltered (total) samples.
[The concentrations of the following elements were below their detection limits (given in parentheses in micrograms per liter): Ag (<1), Cr (<1), and Se (<1). Results based on inductively coupled plasma-mass spectrometry (ICP-MS) analysis except for iron, which is based on inductively coupled plasma-atomic emis-sion spectroscopy (ICP-AES) analysis. cm, centimeter; SC, specific conductance; µS/cm, microsiemens per centimeter; mg, milligram; L, liter; mg/L, milligrams per liter; DOC, dissolved organic carbon; µg/L, micrograms per liter; SW, surface water; PW, in situ pore water; —, not determined; <, analyte not detected at the reporting level; E, estimated value]
Station ID
Sample IDDate
collectedMedia
Depth(cm)
SCa
(μS/cm)pH
Alkalinity(mg
CaCO3 /L)
Hardness(mg/L as CaCO3)
DOC(mg/L)
N (total)(mg/L)
P (total)(mg/L)
Al(μg/L)
ICP-MS
Ba(μg/L)
ICP-MS
Ca(mg/L)
ICP-MS
Cd(μg/L)
ICP-MS
4C PKSite4C-A 8/21/2007 SW surface 210 7.7 — 88 — — — 7.6 14.4 31.9 0.37
4C PHB4C-A 10/17/2007 SW surface 232 7.5 76 82 1.3 — — 8.4 13.7 29.8 0.43
4C PHB4C-B 10/17/2007 PW –30.5 206 6.6 61 68 2.3 — — 4.6 14.5 24.7 1.77
4E PKSite4E-A 8/21/2007 SW surface 200 7.6 — 82 — — — <2 11.1 30.2 0.16
4E PHB4E-A 10/17/2007 SW surface 193 7.9 84 72 2.5 — — 5.1 9.12 26 0.09
4E PHB4E-B 10/17/2007 PW –30.5 195 7.2 64 68 2.3 — — 4 9.98 24.9 0.41
3-1 wetland 3-1A 8/21/2007 SW surface 200 7.2 86 79 3.2 0.86 0.02 37.8 12.9 29.2 0.39
3-1 wetland 3-1B 8/21/2007 PW –30.5 224 7.0 102 75 3.5 0.28 0.027 <2 15.5 27.7 2.53
3-1 wetland 3-1C 8/21/2007 PW –61.0 262 6.6 87 85 2.1 0.14 <0.008 9.6 41.4 30.8 <0.02
3-2 wetland 3-2A 8/21/2007 SW surface 239 7.3 127 115 1.8 0.36 0.035 3.8 17.6 41.7 0.31
3-2 wetland 3-2B 8/21/2007 PW –30.5 455 6.7 204 115 2.3 0.54 0.313 <2 114 42.3 <0.02
3-2 wetland 3-2C 8/21/2007 PW –61.0 424 6.8 155 172 2.5 0.31 0.023 <2 40.1 64.7 <0.02
3-3 wetland 3-3B 8/20/2007 PW –30.5 467 6.7 142 115 5.2 0.37 0.035 <2 51.6 42 <0.02
3-3 wetland 3-3C 8/20/2007 PW –61.0 321 6.6 141 117 5.1 0.37 0.038 8.3 26 42.5 <0.02
3-4 wetland 3-4B 8/20/2007 PW –30.5 327 6.7 154 129 2.5 0.15 E0.006 8.5 26.8 46.6 <0.02
3-4 wetland 3-4C 8/20/2007 PW –61.0 437 6.7 151 129 3 0.16 E0.007 7.4 94 47.8 <0.02
3-5 wetland 3-5A 8/21/2007 SW surface 239 7.1 33 75 4.8 2.53 0.09 20.7 12.4 26.8 <0.02
3-5 wetland 3-5B 8/21/2007 PW –30.5 238 6.6 49 81 2.1 0.45 <0.008 23.6 22.7 28.6 <0.02
3-5 wetland 3-5C 8/21/2007 PW –61.0 393 7.4 190 159 2.8 1.01 0.076 10.5 37.1 58 <0.02
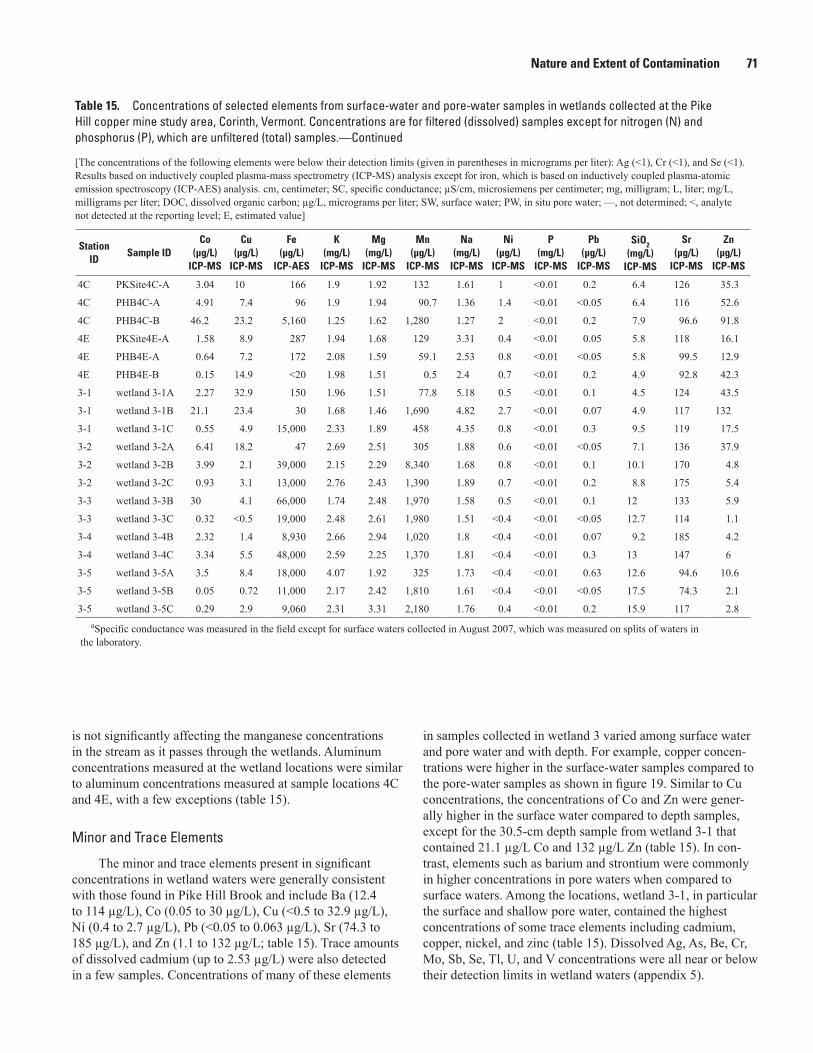
Nature and Extent of Contamination 71
Table 15. Concentrations of selected elements from surface-water and pore-water samples in wetlands collected at the Pike Hill copper mine study area, Corinth, Vermont. Concentrations are for filtered (dissolved) samples except for nitrogen (N) and phosphorus (P), which are unfiltered (total) samples.—Continued
[The concentrations of the following elements were below their detection limits (given in parentheses in micrograms per liter): Ag (<1), Cr (<1), and Se (<1). Results based on inductively coupled plasma-mass spectrometry (ICP-MS) analysis except for iron, which is based on inductively coupled plasma-atomic emission spectroscopy (ICP-AES) analysis. cm, centimeter; SC, specific conductance; µS/cm, microsiemens per centimeter; mg, milligram; L, liter; mg/L, milligrams per liter; DOC, dissolved organic carbon; µg/L, micrograms per liter; SW, surface water; PW, in situ pore water; —, not determined; <, analyte not detected at the reporting level; E, estimated value]
Station ID
Sample IDCo
(μg/L)ICP-MS
Cu(μg/L)
ICP-MS
Fe(μg/L)
ICP-AES
K(mg/L)
ICP-MS
Mg(mg/L)
ICP-MS
Mn(μg/L)
ICP-MS
Na(mg/L)
ICP-MS
Ni(μg/L)
ICP-MS
P(mg/L)
ICP-MS
Pb(μg/L)
ICP-MS
SiO2(mg/L)
ICP-MS
Sr(μg/L)
ICP-MS
Zn(μg/L)
ICP-MS
4C PKSite4C-A 3.04 10 166 1.9 1.92 132 1.61 1 <0.01 0.2 6.4 126 35.3
4C PHB4C-A 4.91 7.4 96 1.9 1.94 90.7 1.36 1.4 <0.01 <0.05 6.4 116 52.6
4C PHB4C-B 46.2 23.2 5,160 1.25 1.62 1,280 1.27 2 <0.01 0.2 7.9 96.6 91.8
4E PKSite4E-A 1.58 8.9 287 1.94 1.68 129 3.31 0.4 <0.01 0.05 5.8 118 16.1
4E PHB4E-A 0.64 7.2 172 2.08 1.59 59.1 2.53 0.8 <0.01 <0.05 5.8 99.5 12.9
4E PHB4E-B 0.15 14.9 <20 1.98 1.51 0.5 2.4 0.7 <0.01 0.2 4.9 92.8 42.3
3-1 wetland 3-1A 2.27 32.9 150 1.96 1.51 77.8 5.18 0.5 <0.01 0.1 4.5 124 43.5
3-1 wetland 3-1B 21.1 23.4 30 1.68 1.46 1,690 4.82 2.7 <0.01 0.07 4.9 117 132
3-1 wetland 3-1C 0.55 4.9 15,000 2.33 1.89 458 4.35 0.8 <0.01 0.3 9.5 119 17.5
3-2 wetland 3-2A 6.41 18.2 47 2.69 2.51 305 1.88 0.6 <0.01 <0.05 7.1 136 37.9
3-2 wetland 3-2B 3.99 2.1 39,000 2.15 2.29 8,340 1.68 0.8 <0.01 0.1 10.1 170 4.8
3-2 wetland 3-2C 0.93 3.1 13,000 2.76 2.43 1,390 1.89 0.7 <0.01 0.2 8.8 175 5.4
3-3 wetland 3-3B 30 4.1 66,000 1.74 2.48 1,970 1.58 0.5 <0.01 0.1 12 133 5.9
3-3 wetland 3-3C 0.32 <0.5 19,000 2.48 2.61 1,980 1.51 <0.4 <0.01 <0.05 12.7 114 1.1
3-4 wetland 3-4B 2.32 1.4 8,930 2.66 2.94 1,020 1.8 <0.4 <0.01 0.07 9.2 185 4.2
3-4 wetland 3-4C 3.34 5.5 48,000 2.59 2.25 1,370 1.81 <0.4 <0.01 0.3 13 147 6
3-5 wetland 3-5A 3.5 8.4 18,000 4.07 1.92 325 1.73 <0.4 <0.01 0.63 12.6 94.6 10.6
3-5 wetland 3-5B 0.05 0.72 11,000 2.17 2.42 1,810 1.61 <0.4 <0.01 <0.05 17.5 74.3 2.1
3-5 wetland 3-5C 0.29 2.9 9,060 2.31 3.31 2,180 1.76 0.4 <0.01 0.2 15.9 117 2.8aSpecific conductance was measured in the field except for surface waters collected in August 2007, which was measured on splits of waters in
the laboratory.
in samples collected in wetland 3 varied among surface water and pore water and with depth. For example, copper concen-trations were higher in the surface-water samples compared to the pore-water samples as shown in figure 19. Similar to Cu concentrations, the concentrations of Co and Zn were gener-ally higher in the surface water compared to depth samples, except for the 30.5-cm depth sample from wetland 3-1 that contained 21.1 µg/L Co and 132 µg/L Zn (table 15). In con-trast, elements such as barium and strontium were commonly in higher concentrations in pore waters when compared to surface waters. Among the locations, wetland 3-1, in particular the surface and shallow pore water, contained the highest concentrations of some trace elements including cadmium, copper, nickel, and zinc (table 15). Dissolved Ag, As, Be, Cr, Mo, Sb, Se, Tl, U, and V concentrations were all near or below their detection limits in wetland waters (appendix 5).
is not significantly affecting the manganese concentrations in the stream as it passes through the wetlands. Aluminum concentrations measured at the wetland locations were similar to aluminum concentrations measured at sample locations 4C and 4E, with a few exceptions (table 15).
Minor and Trace Elements
The minor and trace elements present in significant concentrations in wetland waters were generally consistent with those found in Pike Hill Brook and include Ba (12.4 to 114 µg/L), Co (0.05 to 30 µg/L), Cu (<0.5 to 32.9 µg/L), Ni (0.4 to 2.7 µg/L), Pb (<0.05 to 0.063 µg/L), Sr (74.3 to 185 µg/L), and Zn (1.1 to 132 µg/L; table 15). Trace amounts of dissolved cadmium (up to 2.53 µg/L) were also detected in a few samples. Concentrations of many of these elements
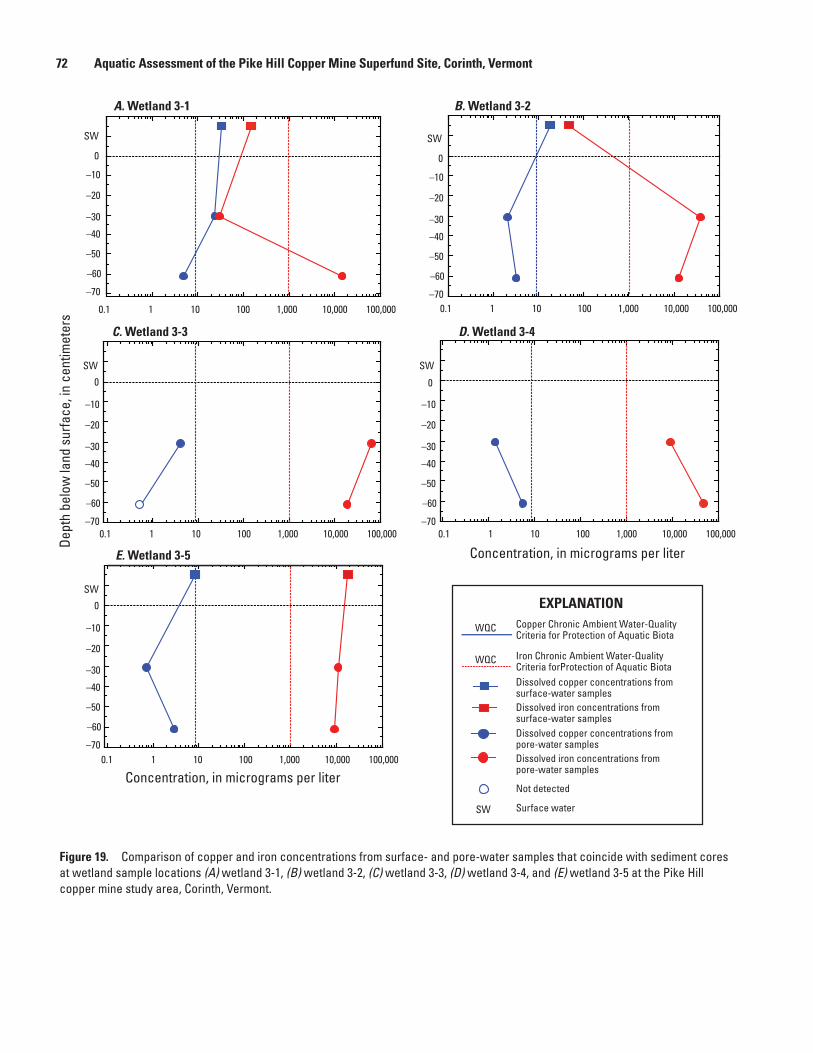
72 Aquatic Assessment of the Pike Hill Copper Mine Superfund Site, Corinth, VermontDe
pth
belo
w la
nd s
urfa
ce, i
n ce
ntim
eter
s
SW
EXPLANATIONCopper Chronic Ambient Water-Quality Criteria for Protection of Aquatic Biota
WQC
Dissolved copper concentrations from pore-water samples
Iron Chronic Ambient Water-Quality Criteria forProtection of Aquatic Biota
WQC
Dissolved iron concentrations from pore-water samples
Dissolved copper concentrations from surface-water samplesDissolved iron concentrations from surface-water samples
Surface water
Not detected
Figure 19
Concentration, in micrograms per liter
0
–10
–20
–30
–40
–50
–60
–70
SW
0
–10
–20
–30
–40
–50
–60
–70
SW
0
–10
–20
–30
–40
–50
–60
–70
SW
0
–10
–20
–30
–40
–50
–60
–70
SW
0
–10
–20
–30
–40
–50
–60
–70
SW
0.1 1 10 100 1,000 10,000 100,000
0.1 1 10 100 1,000 10,000 100,000 0.1 1 10 100 1,000 10,000 100,000
0.1 1 10 100 1,000 10,000 100,0000.1 1 10 100 1,000 10,000 100,000
A. Wetland 3-1 B. Wetland 3-2
C. Wetland 3-3 D. Wetland 3-4
E. Wetland 3-5 Concentration, in micrograms per liter
Figure 19. Comparison of copper and iron concentrations from surface- and pore-water samples that coincide with sediment cores at wetland sample locations (A) wetland 3-1, (B) wetland 3-2, (C) wetland 3-3, (D) wetland 3-4, and (E) wetland 3-5 at the Pike Hill copper mine study area, Corinth, Vermont.
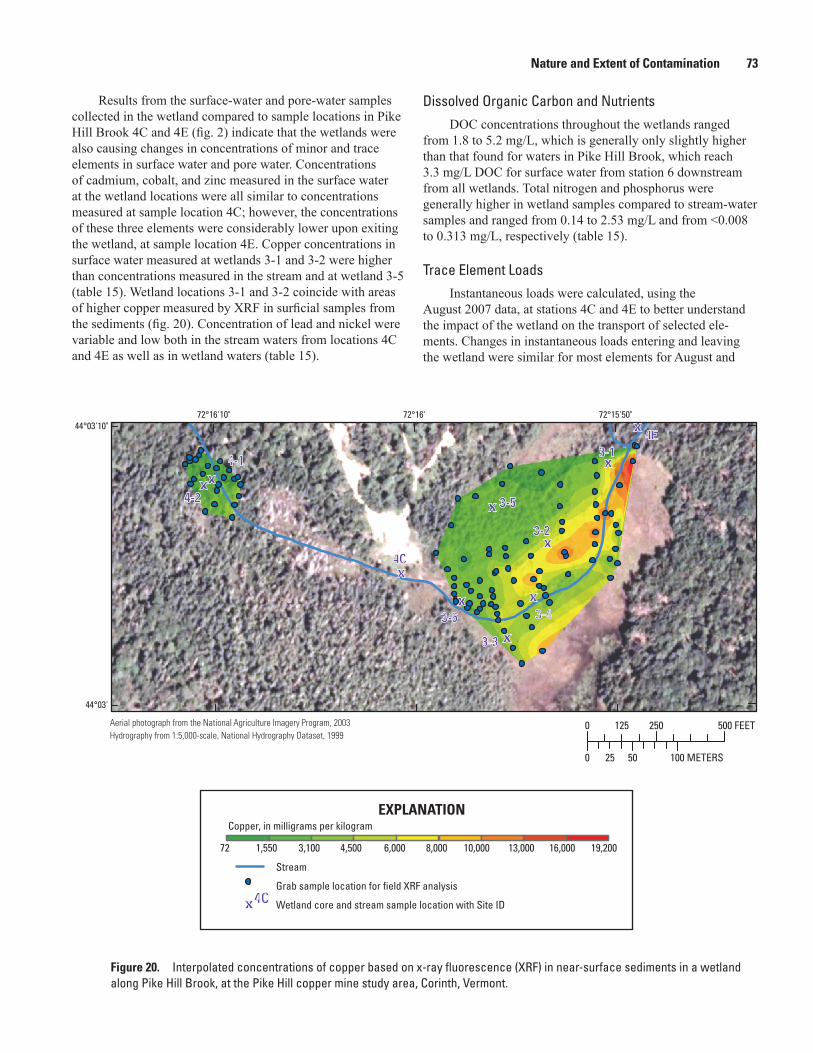
Nature and Extent of Contamination 73
Results from the surface-water and pore-water samples collected in the wetland compared to sample locations in Pike Hill Brook 4C and 4E (fig. 2) indicate that the wetlands were also causing changes in concentrations of minor and trace elements in surface water and pore water. Concentrations of cadmium, cobalt, and zinc measured in the surface water at the wetland locations were all similar to concentrations measured at sample location 4C; however, the concentrations of these three elements were considerably lower upon exiting the wetland, at sample location 4E. Copper concentrations in surface water measured at wetlands 3-1 and 3-2 were higher than concentrations measured in the stream and at wetland 3-5 (table 15). Wetland locations 3-1 and 3-2 coincide with areas of higher copper measured by XRF in surficial samples from the sediments (fig. 20). Concentration of lead and nickel were variable and low both in the stream waters from locations 4C and 4E as well as in wetland waters (table 15).
Dissolved Organic Carbon and NutrientsDOC concentrations throughout the wetlands ranged
from 1.8 to 5.2 mg/L, which is generally only slightly higher than that found for waters in Pike Hill Brook, which reach 3.3 mg/L DOC for surface water from station 6 downstream from all wetlands. Total nitrogen and phosphorus were generally higher in wetland samples compared to stream-water samples and ranged from 0.14 to 2.53 mg/L and from <0.008 to 0.313 mg/L, respectively (table 15).
Trace Element LoadsInstantaneous loads were calculated, using the
August 2007 data, at stations 4C and 4E to better understand the impact of the wetland on the transport of selected ele-ments. Changes in instantaneous loads entering and leaving the wetland were similar for most elements for August and
72°15'50"72°16'72°16'10"44°03'10"
44°03'
Stream
Copper, in milligrams per kilogram
Grab sample location for field XRF analysis
0 250 500 FEET125
0 50 100 METERS25
72 4,500 6,000 8,000 10,000 13,000 16,000 19,2003,1001,550
Aerial photograph from the National Agriculture Imagery Program, 2003Hydrography from 1:5,000-scale, National Hydrography Dataset, 1999
Figure 20.
4E
4C
x
x
x
x
x
x
x
x
x
xx4-2
4-1
4C
3-5
3-2
3-1
3-3
3-6 3-4
Wetland core and stream sample location with Site ID
EXPLANATION
Figure 20. Interpolated concentrations of copper based on x-ray fluorescence (XRF) in near-surface sediments in a wetland along Pike Hill Brook, at the Pike Hill copper mine study area, Corinth, Vermont.
74 Aquatic Assessment of the Pike Hill Copper Mine Superfund Site, Corinth, Vermont
October, although instantaneous loads in October were gener-ally higher (fig. 16). Dissolved loads for cadmium, cobalt, and zinc decrease from station 4C to station 4E as Pike Hill Brook passes through the wetland (fig. 16B, C, G). Aluminum loads also decreased as Pike Hill Brook passed through the wetland, and dissolved aluminum was not detected in the water sample collected from station 4E. Instantaneous loads of copper were nearly constant from station 4C to 4E, whereas instantaneous loads of iron and manganese increased (fig. 16).
Comparisons with Ambient Water-Quality Criteria
The concentrations of several elements were above their respective WQC in wetland-water samples. The concentra-tions of dissolved barium and manganese in all samples exceeded the WQCs of 3.8 µg/L for barium and 80.3 µg/L for manganese (table 15). The concentrations of cobalt in several samples exceeded the WQC of 3.06 µg/L, with five samples containing between 3.34 to 21.1 µg/L Co (table 15). Zinc concentrations exceeded the hardness-dependent (assuming a hardness 100 mg/L as CaCO3) WQC of 120 µg/L in one sample (30.5-cm depth pore water from wetland 3-1). Copper and cadmium concentrations were below their respective hardness-dependent WQC with the exceptions of the surface-water samples from the wetland locations 3-1 and 3-2 and the pore-water sample from 30.5-cm depth from wetland location 3-1. Conversely, iron concentrations were generally above the WQC, except in the surface-water samples from wetland locations 3-1 and 3-2 and in the pore-water 30.5-cm depth sample from wetland location 3-1 (fig. 19). Total aluminum concentrations exceeded guidelines in nearly all of the wetland-water samples, with exceedances occurring in at least one sample from each of the five locations (table 15).
The hazard index based on the sum of the hazard quotients for Cd, Cu, Ni, Pb, and Zn exceeded 1.0 for surface waters from wetlands 3-1, 3-2, and 3-5 and for 30.5-cm depth pore water from wetland 3-1 (table 16). The hardness-dependent WQC discussed in the previous paragraph and illustrated in figure 19 for copper were generalized and calculated on the basis of a hardness of 100 mg/L as CaCO3. In contrast, the haz-ard index values were calculated on the basis of the hardness of the individual samples, which ranged from 75 to 172 mg/L as CaCO3. The findings were similar for exceedances based on generalized WQC and surface-water and pore-water hazard indices; hazard index values greater than 1.0 were mostly due to high copper and cadmium concentrations (table 16).
Sediment GeochemistryIn July 2007, sediment samples were collected from the
surface (0 to 15.2 cm) and at depth (15.2 to 30.5 cm) from two wetlands and analyzed by XRF in the field (appendix 10). In addition, splits of 23 samples were analyzed for chemistry in the laboratory (appendix 11). In August 2007, 10 sediment cores were sampled from 4 wetlands and analyzed in the laboratory for chemistry and mineralogy (appendixes 12
and 13). No toxicity testing was conducted with whole-sediment samples collected from wetland locations.
Wetland Sediments Collected in July 2007
Results of the field XRF analyses conducted in July 2007 revealed elevated copper and zinc concentrations relative to the PECs (fig. 21; table 5; appendix 10). Samples collected from the surface and at depth had similar concentration ranges for each of the four elements analyzed (copper, iron, lead, zinc; fig. 21). Ninety-seven percent of the field XRF samples had concentrations of copper greater than 149 mg/kg, the PEC for copper. On the basis of field XRF analysis, zinc concentra-tion exceeded the PEC for zinc (459 mg/kg) in 80 percent of the samples. None of the lead concentrations were greater than 128 mg/kg, the PEC for lead. Iron concentrations were at least one order of magnitude higher than copper, lead, or zinc concentrations (fig. 21). There is not a defined PEC for iron in sediments. Sediments were not analyzed for cadmium and the detection limit for cadmium using field XRF is typically above the PEC of 4.9 mg/kg.
Copper and iron concentrations from the field XRF samples were used to generate contoured maps of the spatial variability of concentrations, both near the surface and at depth (figs. 20, 22, 23, 24). Iron concentrations were expressed as a weight percent of the sample, whereas copper concentrations were expressed as milligrams per kilogram of sample in the interpolated maps. These contoured maps show highly variable spatial patterns in the occurrence of copper and iron. The concentrations for both iron and copper were lower in the smaller wetland located between stations 4A and 4C (wetland 4), as compared to concentrations measured in the larger wetland located between stations 4C and 4E (wetland 3). Copper and iron concentrations were significantly correlated (rho = 0.8) in both the surface samples and samples collected at depth. A generalized comparison of the spatial pattern between the copper and iron concentrations measured in the surface samples shows lower concentrations (more green-shaded cooler colors) in the western portion, where Pike Hill Brook enters the wetland 3, and higher concentrations (more red-shaded warmer colors) in the central and north-eastern portions (figs. 20, 23). Copper and iron concentration from samples collected at depth show a similar area of higher concentrations (warmer colors) along the central portion of wetland 3 (figs. 22, 24). Samples collected from depth also showed higher concentrations along the northern edge of this wetland, unlike the surface samples.
The concentrations of zinc follow similar trends to the concentrations of copper and iron. Zinc concentrations are generally higher in wetland 3 compared to wetland 4. Similar to copper and iron, zinc measured in the surface samples shows lower concentrations in the western portion of wetland 3 and higher concentrations in the central and northeastern portions; zinc concentrations from samples collected at depth show an area of higher concentrations along the central and northern portions of wetland 3 (appendix 10).

Nature and Extent of Contamination 75
Tabl
e 16
. Su
mm
ary
of th
e ha
zard
quo
tient
s an
d ha
zard
indi
ces
for s
elec
t con
stitu
ents
in w
ater
s (A
) and
sed
imen
ts (B
) fro
m w
etla
nds
in th
e Pi
ke H
ill c
oppe
r min
e st
udy
area
, Cor
inth
, Ver
mon
t, Au
gust
200
7. F
or w
ater
s, th
e Cu
-BLM
quo
tient
is b
ased
on
the
biot
ic li
gand
mod
el; a
ll ot
her q
uotie
nts
are
base
d on
har
dnes
s-de
pend
ent w
ater
-qua
lity
crite
ria. H
azar
d in
dex
is th
e su
m o
f haz
ard
quot
ient
s fo
r Cu,
Cd,
Ni,
Pb, a
nd Z
n.
[Val
ues g
reat
er th
an 1
.0 a
re in
bol
d. B
LM, b
iotic
liga
nd m
odel
; —, n
ot d
eter
min
ed b
ecau
se a
naly
te c
once
ntra
tion
is b
elow
the
repo
rting
lim
it; c
m, c
entim
eter
]
A. S
urfa
ce a
nd in
situ
por
e w
ater
sB
. Sed
imen
ts
Sam
ple
IDD
epth
(c
m)
Haz
ard
quot
ient
Haz
ard
inde
xSa
mpl
e ID
Dep
th
(cm
)H
azar
d qu
otie
ntH
azar
d in
dex
Cu-B
LMCu
CdN
iPb
ZnCu
CdN
iPb
ZnPK
Site
4C-A
surf
ace
3.4
1.3
1.6
0.0
0.1
0.3
3.3
Wet
land
1-1A
0–15
5.0
23.4
1.0
0.3
5.9
35.5
PKSi
te4E
-A
surf
ace
1.7
1.2
0.7
0.0
0.0
0.2
2.1
Wet
land
1-1B
-10–
101.
44.
50.
60.
21.
68.
4W
etla
nd 3
-1A
surf
ace
6.6
4.5
1.9
0.0
0.0
0.4
6.8
Wet
land
1-1B
-210
–15
0.1
0.3
0.4
0.2
0.3
1.3
Wet
land
3-1
B30
.55.
83.
312
.50.
10.
01.
417
.4W
etla
nd1-
1B-3
15–3
10.
00.
10.
50.
20.
10.
9W
etla
nd 3
-1C
613.
50.
6—
0.0
0.1
0.2
0.9
Wet
land
1-1B
-431
–41
0.0
0.2
0.6
0.2
0.2
1.2
Wet
land
3-2
Asu
rfac
e5.
31.
81.
10.
0—
0.3
3.3
Wet
land
2-1A
0–15
3.5
60.9
0.9
0.5
6.3
72.1
Wet
land
3-2
B30
.51.
10.
2—
0.0
0.0
0.0
0.3
Wet
land
2-1B
-10–
130.
52.
30.
60.
20.
94.
6W
etla
nd 3
-2C
611.
20.
2—
0.0
0.0
0.0
0.3
Wet
land
2-1B
-213
–20
0.2
0.3
0.4
0.1
0.5
1.4
Wet
land
3-3
B30
.51.
00.
4—
0.0
0.0
0.0
0.5
Wet
land
2-1B
-320
–41
0.2
0.2
0.4
0.1
0.3
1.2
Wet
land
3-3
C61
——
——
—0.
00.
0W
etla
nd2-
1B-4
41–4
60.
00.
10.
20.
10.
10.
5W
etla
nd 3
-4B
30.5
0.7
0.1
——
0.0
0.0
0.2
Wet
land
3-1A
0–15
6.5
92.6
1.8
0.3
11.5
112.
7W
etla
nd 3
-4C
612.
30.
5—
—0.
10.
00.
6W
etla
nd3-
1B-1
38–4
63.
748
.41.
30.
37.
060
.7W
etla
nd 3
-5A
surf
ace
1.5
1.2
——
0.3
0.1
1.6
Wet
land
3-1B
-246
–76
0.9
6.2
0.9
0.2
1.2
9.4
Wet
land
3-5
B30
.50.
60.
1—
——
0.0
0.1
Wet
land
3-2A
0–15
4.3
86.6
0.9
0.3
8.6
100.
8W
etla
nd 3
-5C
610.
50.
2—
0.0
0.0
0.0
0.3
Wet
land
3-2B
-10–
154.
111
1.4
1.0
0.4
7.7
124.
5W
etla
nd3-
2B-2
15–2
83.
787
.20.
90.
39.
710
1.8
Wet
land
3-2B
-328
–38
4.0
112.
10.
80.
310
.412
7.6
Wet
land
3-3A
0–15
2.0
52.3
0.8
0.4
4.2
59.8
Wet
land
3-3B
61–9
13.
025
.60.
60.
35.
234
.7W
etla
nd3-
4A0–
154.
659
.51.
10.
36.
872
.3W
etla
nd3-
4B61
–91
5.0
27.9
0.7
0.4
8.9
42.9
Wet
land
3-5A
0–15
4.7
45.7
0.6
0.5
6.5
58.0
Wet
land
3-5B
-10–
100.
521
.90.
22.
00.
625
.3W
etla
nd3-
5B-2
10–1
53.
351
.00.
40.
55.
260
.5W
etla
nd3-
5B-3
15–2
49.
995
.31.
40.
311
.711
8.6
Wet
land
3-5B
-424
–41
5.2
27.2
0.6
0.2
6.9
40.2
Wet
land
3-5B
-541
–56
3.0
20.2
0.7
0.2
6.6
30.7
Wet
land
3-6-
10–
150.
719
.40.
60.
21.
822
.8W
etla
nd3-
6-2
15–2
51.
623
.50.
60.
32.
528
.5W
etla
nd3-
6-3
25–3
012
.458
.81.
20.
517
.790
.6W
etla
nd4-
1A0–
151.
723
.50.
80.
32.
428
.8W
etla
nd4-
1B-1
0–15
0.3
4.7
0.7
0.2
0.7
6.7
Wet
land
4-1B
-215
–31
0.1
0.6
0.6
0.2
0.3
1.8
Wet
land
4-2A
0–15
2.8
34.0
1.1
0.3
4.7
43.0
Wet
land
4-2-
10–
153.
741
.71.
10.
35.
752
.6W
etla
nd4-
2-2
15–3
10.
20.
90.
70.
20.
32.
2
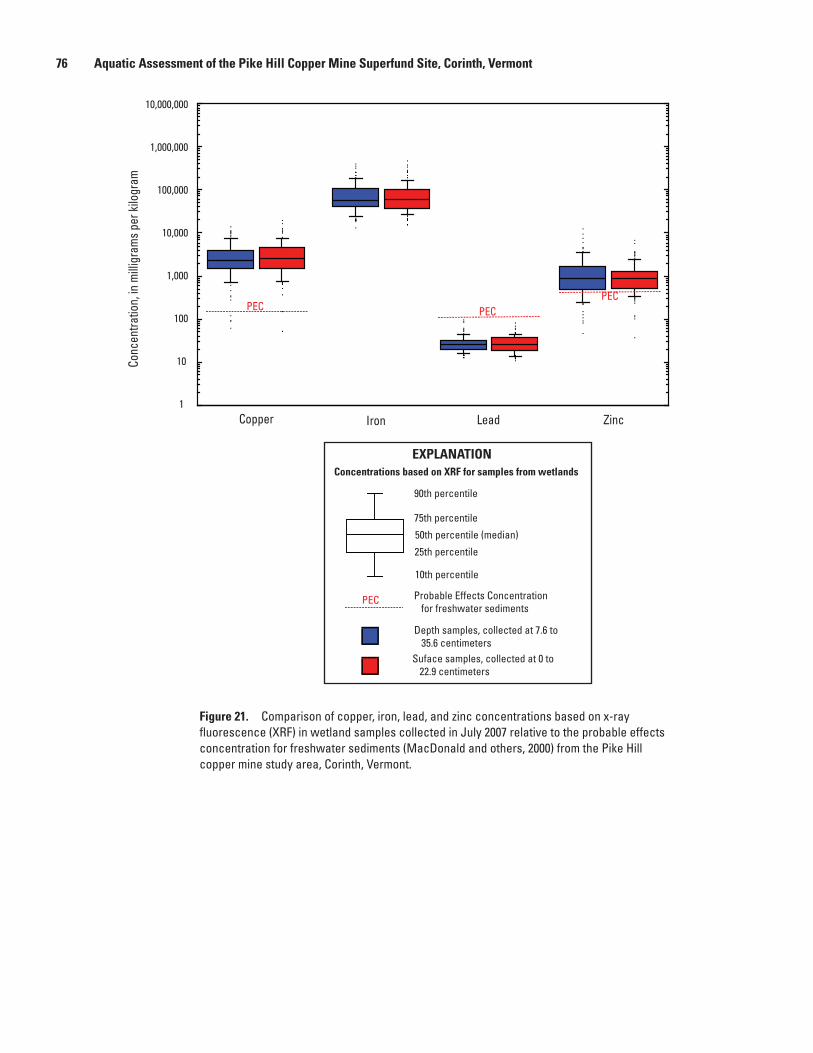
76 Aquatic Assessment of the Pike Hill Copper Mine Superfund Site, Corinth, Vermont
PECPEC
PEC
Copper ZincLeadIron
EXPLANATION
Probable Effects Concentration for freshwater sediments
PEC
Depth samples, collected at 7.6 to 35.6 centimeters
90th percentile
25th percentile
75th percentile
50th percentile (median)
10th percentile
Concentrations based on XRF for samples from wetlands
Suface samples, collected at 0 to 22.9 centimeters
Figure 21
Con
cent
ratio
n, in
mill
igra
ms
per k
ilogr
am
1
10
100
1,000
10,000
100,000
1,000,000
10,000,000
Figure 21. Comparison of copper, iron, lead, and zinc concentrations based on x-ray fluorescence (XRF) in wetland samples collected in July 2007 relative to the probable effects concentration for freshwater sediments (MacDonald and others, 2000) from the Pike Hill copper mine study area, Corinth, Vermont.
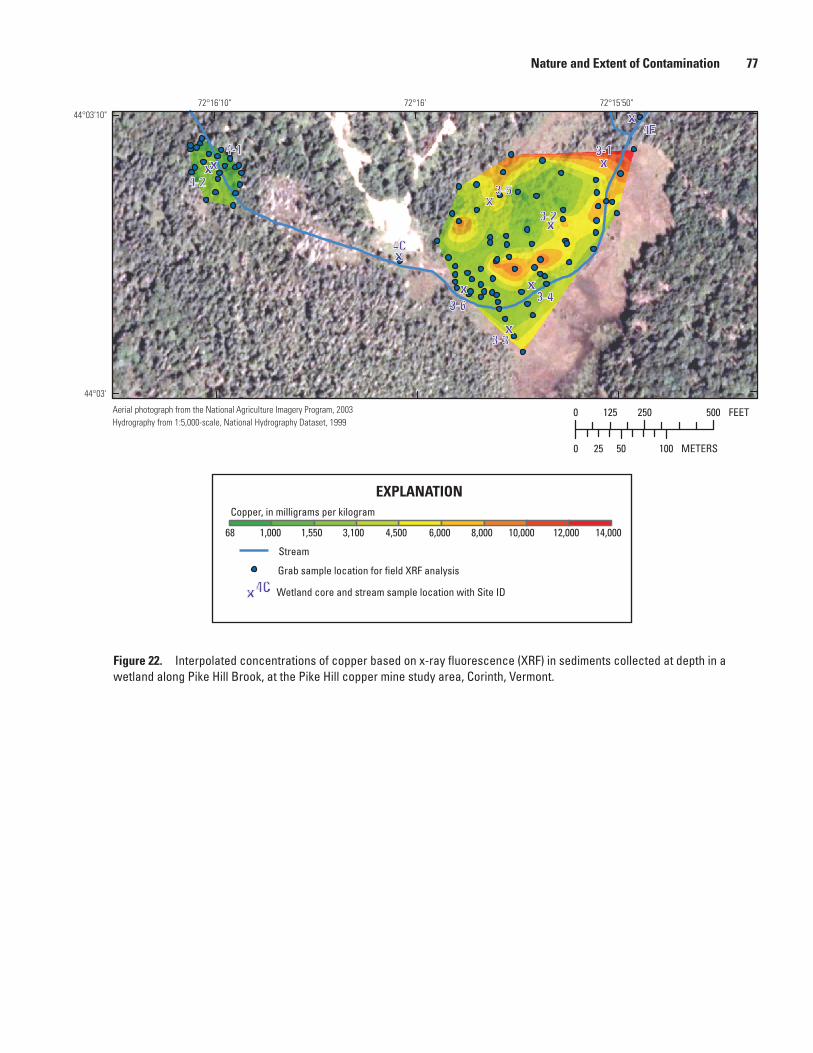
Nature and Extent of Contamination 77
72°15'50"72°16'72°16'10"44°03'10"
44°03'
EXPLANATION
Stream
Copper, in milligrams per kilogram
Grab sample location for field XRF analysis
0 250 500125 FEET
0 50 10025 METERS
68 4,500 6,000 8,000 10,000 12,000 14,0001,550 3,1001,000
Aerial photograph from the National Agriculture Imagery Program, 2003Hydrography from 1:5,000-scale, National Hydrography Dataset, 1999
Figure 22.
x4C Wetland core and stream sample location with Site ID
x
x
x
x
x
x
x
xx4-1
4-2
x
4C
3-6
3-3
3-5
3-4
3-2
4E
3-1
Figure 22. Interpolated concentrations of copper based on x-ray fluorescence (XRF) in sediments collected at depth in a wetland along Pike Hill Brook, at the Pike Hill copper mine study area, Corinth, Vermont.

78 Aquatic Assessment of the Pike Hill Copper Mine Superfund Site, Corinth, Vermont
72°15'50"72°16'72°16'10"
44°03'10"
44°03'
EXPLANATION
Stream
Iron, in weight percent
0.7 10 15 20 25 30 35 40 485
Grab sample location for field XRF analysis
0 250 500 FEET125
0 50 100 METERS25
Aerial photograph from the National Agriculture Imagery Program, 2003Hydrography from 1:5,000-scale, National Hydrography Dataset, 1999
Figure 23.
x4C Wetland core and stream sample location with Site ID
4-2x
x
x
x
x
x
xx
4-1
4C
3-6
3-3
3-4
3-2
3-5
3-14Ex
x
Figure 23. Interpolated percentage of iron in near-surface sediments based on x-ray fluorescence (XRF) in a wetland along Pike Hill Brook, at the Pike Hill copper mine study area, Corinth, Vermont.
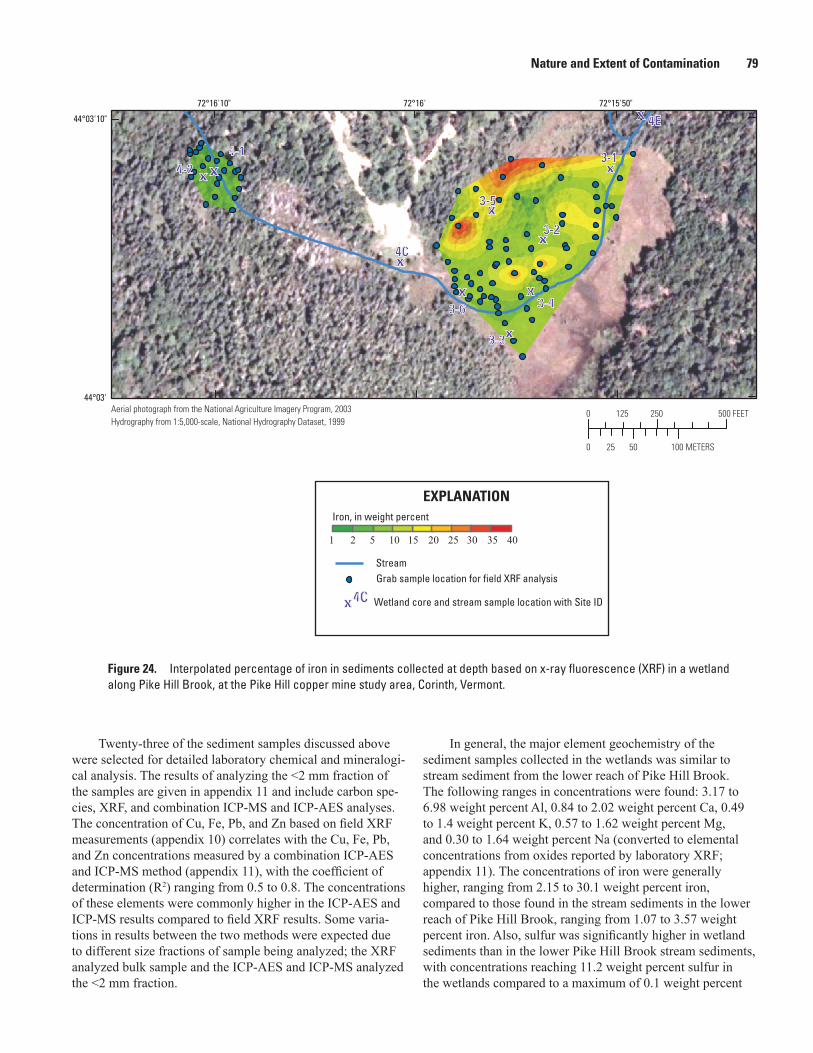
Nature and Extent of Contamination 79
72°15'50"72°16'72°16'10"
44°03'10"
44°03'
EXPLANATION
Stream
Iron, in weight percent
Grab sample location for field XRF analysis
0 250 500 FEET125
0 50 100 METERS25
1 10 15 20 25 30 35 402 5
Aerial photograph from the National Agriculture Imagery Program, 2003Hydrography from 1:5,000-scale, National Hydrography Dataset, 1999
Figure 24.
x
x4C Wetland core and stream sample location with Site ID
4-24-1
x
x
x
x
x
x
x x
x
4C
3-6
3-3
3-4
3-2
3-5
3-1
x 4E
Figure 24. Interpolated percentage of iron in sediments collected at depth based on x-ray fluorescence (XRF) in a wetland along Pike Hill Brook, at the Pike Hill copper mine study area, Corinth, Vermont.
Twenty-three of the sediment samples discussed above were selected for detailed laboratory chemical and mineralogi-cal analysis. The results of analyzing the <2 mm fraction of the samples are given in appendix 11 and include carbon spe-cies, XRF, and combination ICP-MS and ICP-AES analyses. The concentration of Cu, Fe, Pb, and Zn based on field XRF measurements (appendix 10) correlates with the Cu, Fe, Pb, and Zn concentrations measured by a combination ICP-AES and ICP-MS method (appendix 11), with the coefficient of determination (R2) ranging from 0.5 to 0.8. The concentrations of these elements were commonly higher in the ICP-AES and ICP-MS results compared to field XRF results. Some varia-tions in results between the two methods were expected due to different size fractions of sample being analyzed; the XRF analyzed bulk sample and the ICP-AES and ICP-MS analyzed the <2 mm fraction.
In general, the major element geochemistry of the sediment samples collected in the wetlands was similar to stream sediment from the lower reach of Pike Hill Brook. The following ranges in concentrations were found: 3.17 to 6.98 weight percent Al, 0.84 to 2.02 weight percent Ca, 0.49 to 1.4 weight percent K, 0.57 to 1.62 weight percent Mg, and 0.30 to 1.64 weight percent Na (converted to elemental concentrations from oxides reported by laboratory XRF; appendix 11). The concentrations of iron were generally higher, ranging from 2.15 to 30.1 weight percent iron, compared to those found in the stream sediments in the lower reach of Pike Hill Brook, ranging from 1.07 to 3.57 weight percent iron. Also, sulfur was significantly higher in wetland sediments than in the lower Pike Hill Brook stream sediments, with concentrations reaching 11.2 weight percent sulfur in the wetlands compared to a maximum of 0.1 weight percent
80 Aquatic Assessment of the Pike Hill Copper Mine Superfund Site, Corinth, Vermont
in stream sediments (table 9; appendix 11). Carbonate carbon was low (0.01 to 0.33 weight percent), whereas total organic carbon was substantial in most samples (0.21 to 12.42 weight percent; appendix 11).
Trace elements in wetland sediments reach higher con-centrations than those found in the stream sediments from the lower reach of Pike Hill Brook. Maximum concentrations in wetland sediments are as follows: 6 mg/kg for As, 354 mg/kg for Ba, 63.7 mg/kg for Cd, 1,580 mg/kg for Co, 70 mg/kg for Cr, 13,300 mg/kg for Cu, 9,650 mg/kg for Mn, 9.72 mg/kg for Mo, 97.6 mg/kg for Ni, 45.8 mg/kg for Pb, 0.67 mg/kg for Sb, 40.2 mg/kg for Se, 300 mg/kg for Sr, 7,160 mg/kg for Zn, and 9.7 mg/kg for U (appendix 11). The concentrations of several elements exceed their respective PECs. Similar to the field XRF findings in appendix 10, all samples contain copper in concentrations that exceed the PEC of 149 mg/kg, and nearly all samples contain zinc in concentrations that exceed the PEC of 459 mg/kg; concentrations of lead in all samples are below the PEC of 128 mg/kg. In addition to copper and zinc, most samples contain cadmium and a few contain nickel in concentrations that exceed their PECs of 4.9 and 48.6 mg/kg, respectively.
Wetland Cores Collected in August 2007
The locations of the 10 sediment cores collected from wetlands in the Pike Hill Brook watershed are shown in figure 2, and the results of chemical and mineralogical analysis are given in appendixes 12 and 13. In general, the major element geochemistry of the sediment cores from the wetlands was similar to that found for the 23 grab samples analyzed in July 2007 from wetlands 3 and 4. The following range in concentrations were found: 3.02 to 8.93 weight percent Al, 0.72 to 2.53 weight percent Ca, 1.8 to 21.8 weight percent Fe, 0.195 to 2.39 weight percent K, 0.16 to 1.8 weight percent Mg, and 0.122 to 2.06 weight percent Na (appendix 12). The concentrations of iron and sulfur are illustrated in figure 25. Sulfur reached 15.7 weight percent sulfur in the wetlands cores (fig. 25) compared to a maximum of 11.2 weight percent sulfur for grab wetland sediments (appendixes 11 and 12). Carbonate carbon ranged from 0.01 to 1.18 weight percent carbon, and organic carbon ranged from 0.49 to 32.8 weight percent carbon (appendix 12).
Trace elements in wetland-core samples reach similar concentrations when compared to the grab wetland samples collected in July 2007, with the exception of lead and antimony. The maximum concentrations of lead (260 mg/kg) and antimony (3.8 mg/kg) were significantly higher in the cores than in the grab samples because one sample (wetland 3-5B-1) had anomalously high concentrations of these ele-ments (appendix 12). Maximum concentrations of other trace elements in wetland-core samples were as follows: 9.9 mg/kg for As, 470 mg/kg for Ba, 60.8 mg/kg for Cd, 1,550 mg/kg for Co, 91.7 mg/kg for Cr, 16,700 mg/kg for Cu, 10,600 mg/kg for Mn, 7.8 mg/kg for Mo, 88.5 mg/kg for Ni, 50 mg/kg for Se,
354 mg/kg for Sr, 8,140 mg/kg for Zn, and 10.2 mg/kg for U (fig. 26; appendix 12).
Only surface samples (“A” splits) from the wetland cores were analyzed for acid volatile sulfide (AVS) and simultaneously extracted metals (SEM); an “A” split was not collected from the wetland 3-6 location. Similar to the samples collected in Pike Hill Brook, acid volatile sulfide concentrations for nearly all sediment samples from the wetlands were below their respective detection limits, which ranged from ~50 to 60 mg/kg (~1.5 to 2.0 μmols/g; table 10; appendix 4). The only sample that contained detectable AVS, at 806 mg/kg (25.2 μmols/g), was wetland sample 3-5; this sample also contained the highest concentration of total sulfur for the surface samples (3.4 weight percent sulfur). The sum of the concentrations of simultaneously extracted metals (Cd + Cu + Pb + Ni + Zn) were higher in wetlands 1, 2, and 3, ranging from 36.4 to 130.7 µmols/g when compared to ΣSEM in stream sediment collected in Pike Hill Brook, which only reached a maximum of 34.6 µmols/g at station 4F (table 10). The ΣSEM for the wetland 4 surface sample was only 14.5 µmols/g. Although most of the wetlands sediment had higher ΣSEM than stream sediments in Pike Hill Brook, the ΣSEM concentrations in stream sediment directly downstream from the wetlands were not consistently elevated compared to other stream reaches. Simultaneously extracted mercury was below its detection limit of 0.002 µmol/g. Since wetland sample 3-5 was the only sample in the study area to contain detectable AVS, this sample is the only sample that had a reported ΣSEM/AVS greater than zero (table 10).
The concentrations of several elements exceeded their respective PECs. The concentrations of copper in all samples from wetland 3 and in the surface samples from wetlands 1, 2, and 4 all exceeded the PEC of 149 mg/kg (fig. 26). The concentrations of cadmium and zinc follow similar trends to copper with PEC exceedances in nearly all samples from wetland 3 and most surface samples from wetlands 1, 2, and 4 (fig. 26; appendix 12). Nickel concentrations in some surface samples from wetlands 1, 3, and 4 and two samples from depth in wetland 3 exceed the nickel PEC of 48.6 mg/kg. Only one sample contains lead in an amount that exceeded the PEC of 128 mg/kg. Hazard indices based on the sum of hazard quotients for Cd, Cu, Ni, Pb, and Zn are above 1.0 for all samples except for one sample each collected at depth in wetland 1 and wetland 2 (table 16). Overall, the highest PEC hazard indices were for core from wetland 3-2, which had all hazard index values greater than 100; in contrast, the highest PEC hazard index for stream sediments collected in the Pike Hill study area was 83 for station 1, which is directly down-stream from the Eureka and Union mines (tables 8 and 16). Also, the ESB index values for the wetland surface samples (“A” splits) all fall within the uncertain effects range of 130 to 3,000 µmol/gOC (USEPA, 2005; table 10). The lowest ESB index for wetland sediments is 139 µmol/gOC from wetland 4, and the highest ESB index is 1,296 µmol/gOC for sediment from wetland 3-1 (table 10).
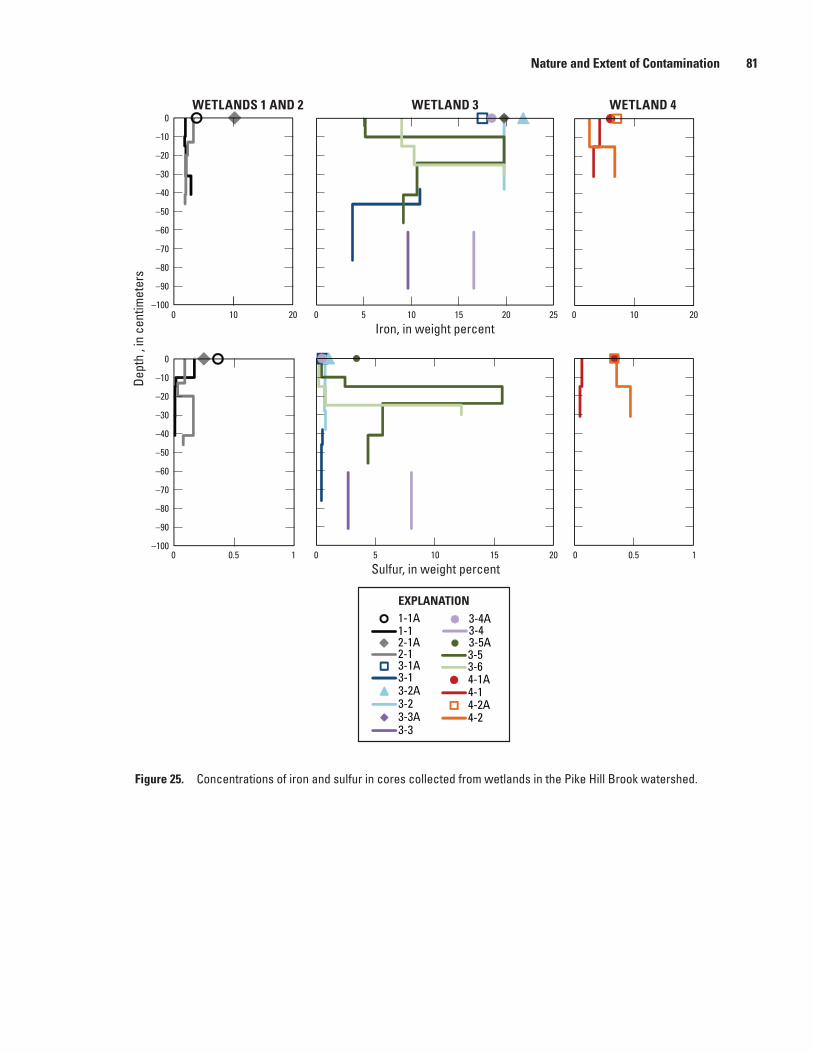
Nature and Extent of Contamination 81
WETLANDS 1 AND 2 WETLAND 3 WETLAND 4
–100
–90
–80
–70
–60
–50
–40
–30
–20
–10
0
0 10 20
Dept
h , i
n ce
ntim
eter
s
0 5 10 15 20 25
Iron, in weight percent0 10 20
–100
–90
–80
–70
–60
–50
–40
–30
–20
–10
0
0 0.5 1 0 5 10 15 20
Sulfur, in weight percent0 0.5 1
Figure 25
1-1A1-12-1A2-13-1A3-13-2A3-23-3A3-3
3-4A3-43-5A3-53-64-1A4-14-2A4-2
EXPLANATION
Figure 25. Concentrations of iron and sulfur in cores collected from wetlands in the Pike Hill Brook watershed.
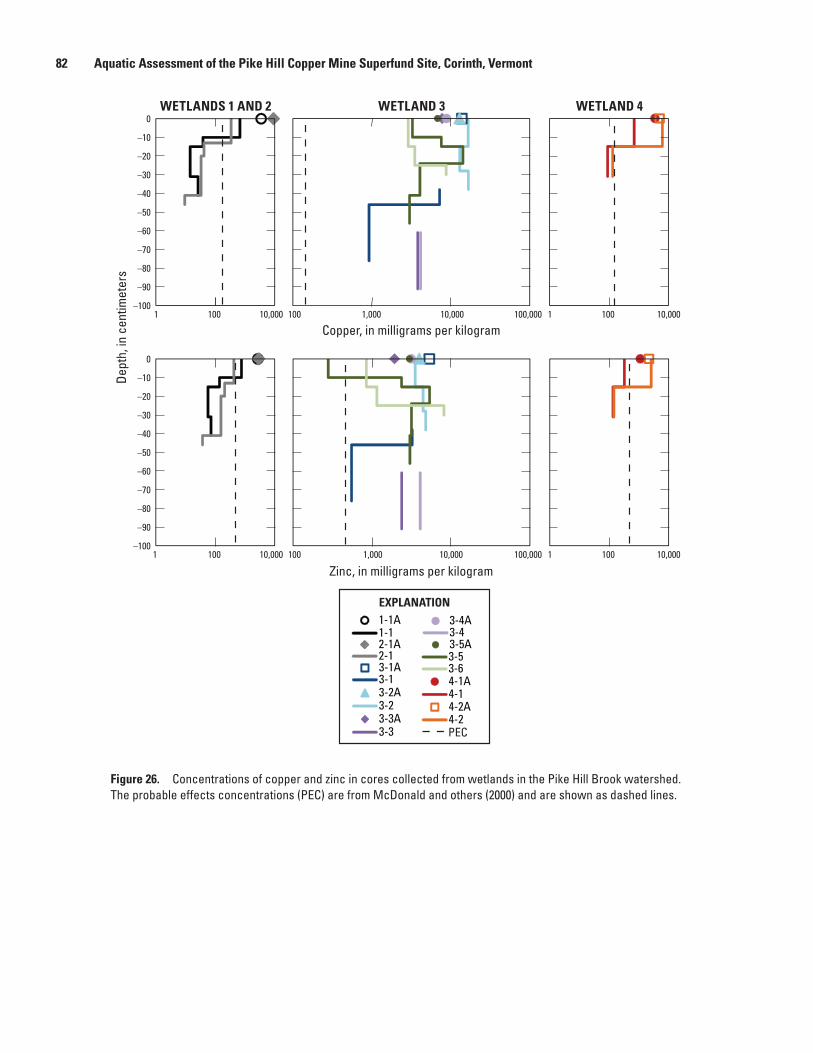
82 Aquatic Assessment of the Pike Hill Copper Mine Superfund Site, Corinth, Vermont
WETLANDS 1 AND 2 WETLAND 3 WETLAND 4
–100
–90
–80
–70
–60
–50
–40
–30
–20
–10
0
1 100 10,000
Dept
h, in
cen
timet
ers
100 1,000 10,000 100,000
Copper, in milligrams per kilogram1 100 10,000
–100
–90
–80
–70
–60
–50
–40
–30
–20
–10
0
1 100 10,000 100 1,000 10,000 100,000
Zinc, in milligrams per kilogram1 100 10,000
Figure 26
1-1A1-12-1A2-13-1A3-13-2A3-23-3A3-3
3-4A3-43-5A3-53-64-1A4-14-2A4-2
EXPLANATION
PEC
Figure 26. Concentrations of copper and zinc in cores collected from wetlands in the Pike Hill Brook watershed. The probable effects concentrations (PEC) are from McDonald and others (2000) and are shown as dashed lines.
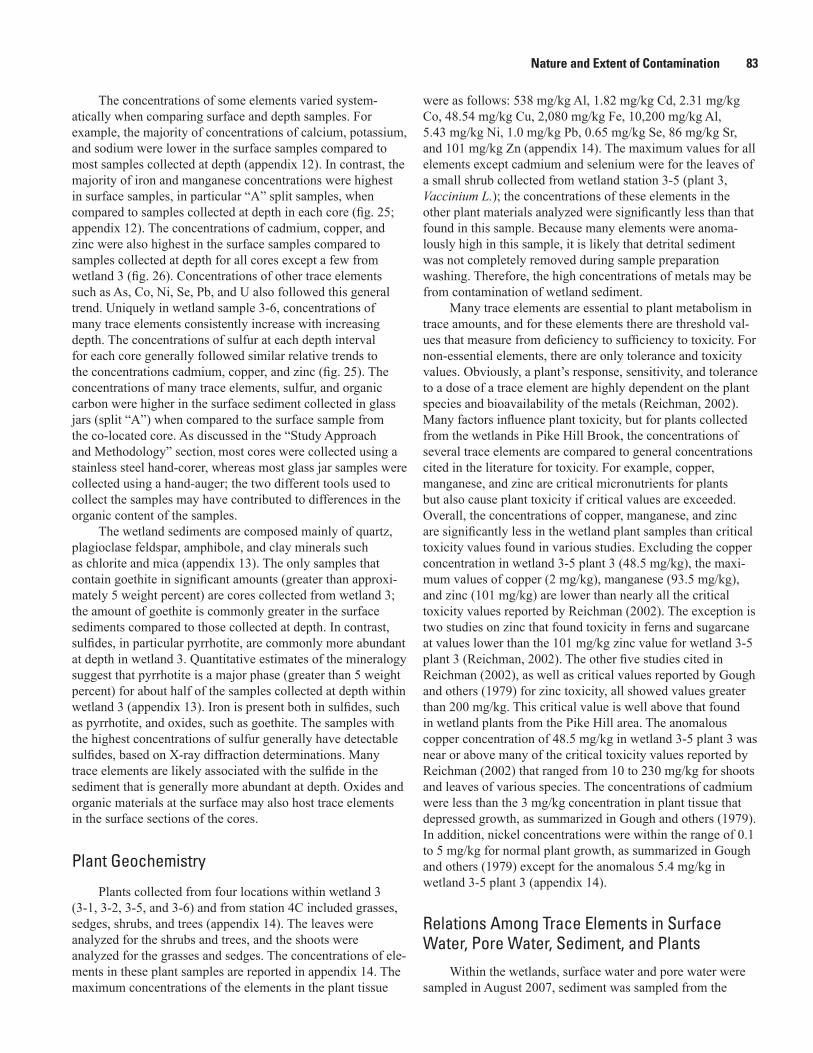
Nature and Extent of Contamination 83
The concentrations of some elements varied system-atically when comparing surface and depth samples. For example, the majority of concentrations of calcium, potassium, and sodium were lower in the surface samples compared to most samples collected at depth (appendix 12). In contrast, the majority of iron and manganese concentrations were highest in surface samples, in particular “A” split samples, when compared to samples collected at depth in each core (fig. 25; appendix 12). The concentrations of cadmium, copper, and zinc were also highest in the surface samples compared to samples collected at depth for all cores except a few from wetland 3 (fig. 26). Concentrations of other trace elements such as As, Co, Ni, Se, Pb, and U also followed this general trend. Uniquely in wetland sample 3-6, concentrations of many trace elements consistently increase with increasing depth. The concentrations of sulfur at each depth interval for each core generally followed similar relative trends to the concentrations cadmium, copper, and zinc (fig. 25). The concentrations of many trace elements, sulfur, and organic carbon were higher in the surface sediment collected in glass jars (split “A”) when compared to the surface sample from the co-located core. As discussed in the “Study Approach and Methodology” section, most cores were collected using a stainless steel hand-corer, whereas most glass jar samples were collected using a hand-auger; the two different tools used to collect the samples may have contributed to differences in the organic content of the samples.
The wetland sediments are composed mainly of quartz, plagioclase feldspar, amphibole, and clay minerals such as chlorite and mica (appendix 13). The only samples that contain goethite in significant amounts (greater than approxi-mately 5 weight percent) are cores collected from wetland 3; the amount of goethite is commonly greater in the surface sediments compared to those collected at depth. In contrast, sulfides, in particular pyrrhotite, are commonly more abundant at depth in wetland 3. Quantitative estimates of the mineralogy suggest that pyrrhotite is a major phase (greater than 5 weight percent) for about half of the samples collected at depth within wetland 3 (appendix 13). Iron is present both in sulfides, such as pyrrhotite, and oxides, such as goethite. The samples with the highest concentrations of sulfur generally have detectable sulfides, based on X-ray diffraction determinations. Many trace elements are likely associated with the sulfide in the sediment that is generally more abundant at depth. Oxides and organic materials at the surface may also host trace elements in the surface sections of the cores.
Plant Geochemistry
Plants collected from four locations within wetland 3 (3-1, 3-2, 3-5, and 3-6) and from station 4C included grasses, sedges, shrubs, and trees (appendix 14). The leaves were analyzed for the shrubs and trees, and the shoots were analyzed for the grasses and sedges. The concentrations of ele-ments in these plant samples are reported in appendix 14. The maximum concentrations of the elements in the plant tissue
were as follows: 538 mg/kg Al, 1.82 mg/kg Cd, 2.31 mg/kg Co, 48.54 mg/kg Cu, 2,080 mg/kg Fe, 10,200 mg/kg Al, 5.43 mg/kg Ni, 1.0 mg/kg Pb, 0.65 mg/kg Se, 86 mg/kg Sr, and 101 mg/kg Zn (appendix 14). The maximum values for all elements except cadmium and selenium were for the leaves of a small shrub collected from wetland station 3-5 (plant 3, Vaccinium L.); the concentrations of these elements in the other plant materials analyzed were significantly less than that found in this sample. Because many elements were anoma-lously high in this sample, it is likely that detrital sediment was not completely removed during sample preparation washing. Therefore, the high concentrations of metals may be from contamination of wetland sediment.
Many trace elements are essential to plant metabolism in trace amounts, and for these elements there are threshold val-ues that measure from deficiency to sufficiency to toxicity. For non-essential elements, there are only tolerance and toxicity values. Obviously, a plant’s response, sensitivity, and tolerance to a dose of a trace element are highly dependent on the plant species and bioavailability of the metals (Reichman, 2002). Many factors influence plant toxicity, but for plants collected from the wetlands in Pike Hill Brook, the concentrations of several trace elements are compared to general concentrations cited in the literature for toxicity. For example, copper, manganese, and zinc are critical micronutrients for plants but also cause plant toxicity if critical values are exceeded. Overall, the concentrations of copper, manganese, and zinc are significantly less in the wetland plant samples than critical toxicity values found in various studies. Excluding the copper concentration in wetland 3-5 plant 3 (48.5 mg/kg), the maxi-mum values of copper (2 mg/kg), manganese (93.5 mg/kg), and zinc (101 mg/kg) are lower than nearly all the critical toxicity values reported by Reichman (2002). The exception is two studies on zinc that found toxicity in ferns and sugarcane at values lower than the 101 mg/kg zinc value for wetland 3-5 plant 3 (Reichman, 2002). The other five studies cited in Reichman (2002), as well as critical values reported by Gough and others (1979) for zinc toxicity, all showed values greater than 200 mg/kg. This critical value is well above that found in wetland plants from the Pike Hill area. The anomalous copper concentration of 48.5 mg/kg in wetland 3-5 plant 3 was near or above many of the critical toxicity values reported by Reichman (2002) that ranged from 10 to 230 mg/kg for shoots and leaves of various species. The concentrations of cadmium were less than the 3 mg/kg concentration in plant tissue that depressed growth, as summarized in Gough and others (1979). In addition, nickel concentrations were within the range of 0.1 to 5 mg/kg for normal plant growth, as summarized in Gough and others (1979) except for the anomalous 5.4 mg/kg in wetland 3-5 plant 3 (appendix 14).
Relations Among Trace Elements in Surface Water, Pore Water, Sediment, and Plants
Within the wetlands, surface water and pore water were sampled in August 2007, sediment was sampled from the
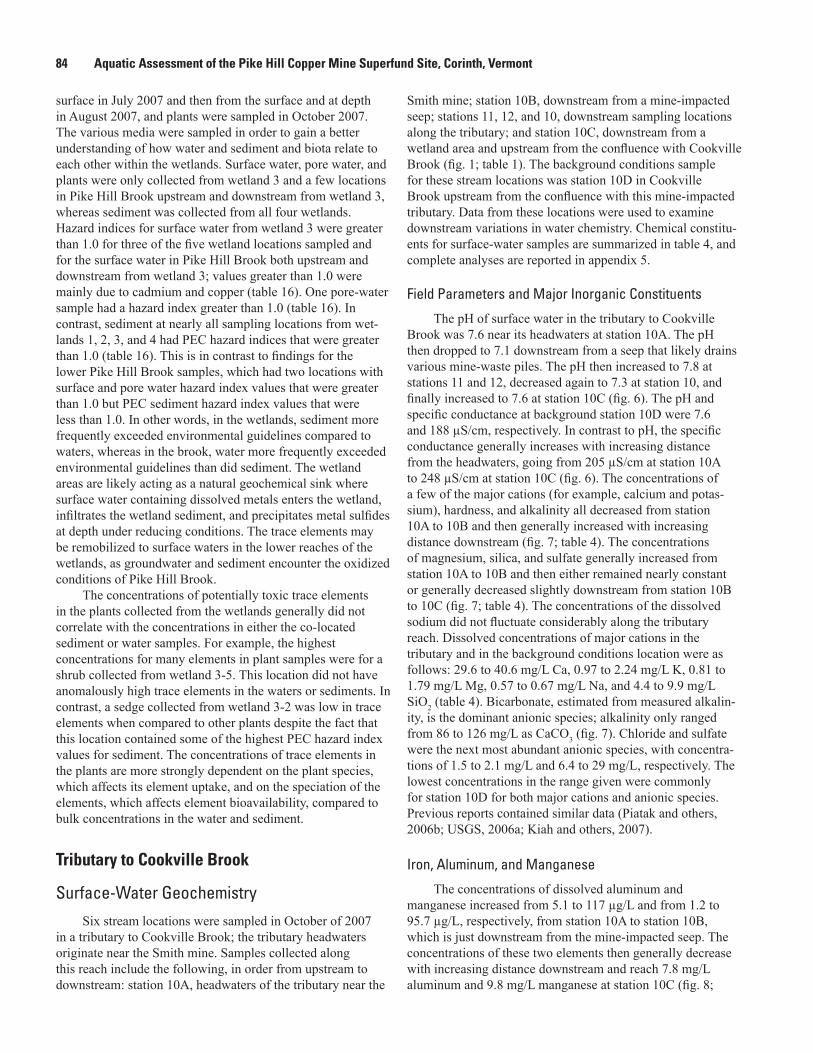
84 Aquatic Assessment of the Pike Hill Copper Mine Superfund Site, Corinth, Vermont
surface in July 2007 and then from the surface and at depth in August 2007, and plants were sampled in October 2007. The various media were sampled in order to gain a better understanding of how water and sediment and biota relate to each other within the wetlands. Surface water, pore water, and plants were only collected from wetland 3 and a few locations in Pike Hill Brook upstream and downstream from wetland 3, whereas sediment was collected from all four wetlands. Hazard indices for surface water from wetland 3 were greater than 1.0 for three of the five wetland locations sampled and for the surface water in Pike Hill Brook both upstream and downstream from wetland 3; values greater than 1.0 were mainly due to cadmium and copper (table 16). One pore-water sample had a hazard index greater than 1.0 (table 16). In contrast, sediment at nearly all sampling locations from wet-lands 1, 2, 3, and 4 had PEC hazard indices that were greater than 1.0 (table 16). This is in contrast to findings for the lower Pike Hill Brook samples, which had two locations with surface and pore water hazard index values that were greater than 1.0 but PEC sediment hazard index values that were less than 1.0. In other words, in the wetlands, sediment more frequently exceeded environmental guidelines compared to waters, whereas in the brook, water more frequently exceeded environmental guidelines than did sediment. The wetland areas are likely acting as a natural geochemical sink where surface water containing dissolved metals enters the wetland, infiltrates the wetland sediment, and precipitates metal sulfides at depth under reducing conditions. The trace elements may be remobilized to surface waters in the lower reaches of the wetlands, as groundwater and sediment encounter the oxidized conditions of Pike Hill Brook.
The concentrations of potentially toxic trace elements in the plants collected from the wetlands generally did not correlate with the concentrations in either the co-located sediment or water samples. For example, the highest concentrations for many elements in plant samples were for a shrub collected from wetland 3-5. This location did not have anomalously high trace elements in the waters or sediments. In contrast, a sedge collected from wetland 3-2 was low in trace elements when compared to other plants despite the fact that this location contained some of the highest PEC hazard index values for sediment. The concentrations of trace elements in the plants are more strongly dependent on the plant species, which affects its element uptake, and on the speciation of the elements, which affects element bioavailability, compared to bulk concentrations in the water and sediment.
Tributary to Cookville Brook
Surface-Water GeochemistrySix stream locations were sampled in October of 2007
in a tributary to Cookville Brook; the tributary headwaters originate near the Smith mine. Samples collected along this reach include the following, in order from upstream to downstream: station 10A, headwaters of the tributary near the
Smith mine; station 10B, downstream from a mine-impacted seep; stations 11, 12, and 10, downstream sampling locations along the tributary; and station 10C, downstream from a wetland area and upstream from the confluence with Cookville Brook (fig. 1; table 1). The background conditions sample for these stream locations was station 10D in Cookville Brook upstream from the confluence with this mine-impacted tributary. Data from these locations were used to examine downstream variations in water chemistry. Chemical constitu-ents for surface-water samples are summarized in table 4, and complete analyses are reported in appendix 5.
Field Parameters and Major Inorganic Constituents
The pH of surface water in the tributary to Cookville Brook was 7.6 near its headwaters at station 10A. The pH then dropped to 7.1 downstream from a seep that likely drains various mine-waste piles. The pH then increased to 7.8 at stations 11 and 12, decreased again to 7.3 at station 10, and finally increased to 7.6 at station 10C (fig. 6). The pH and specific conductance at background station 10D were 7.6 and 188 µS/cm, respectively. In contrast to pH, the specific conductance generally increases with increasing distance from the headwaters, going from 205 µS/cm at station 10A to 248 µS/cm at station 10C (fig. 6). The concentrations of a few of the major cations (for example, calcium and potas-sium), hardness, and alkalinity all decreased from station 10A to 10B and then generally increased with increasing distance downstream (fig. 7; table 4). The concentrations of magnesium, silica, and sulfate generally increased from station 10A to 10B and then either remained nearly constant or generally decreased slightly downstream from station 10B to 10C (fig. 7; table 4). The concentrations of the dissolved sodium did not fluctuate considerably along the tributary reach. Dissolved concentrations of major cations in the tributary and in the background conditions location were as follows: 29.6 to 40.6 mg/L Ca, 0.97 to 2.24 mg/L K, 0.81 to 1.79 mg/L Mg, 0.57 to 0.67 mg/L Na, and 4.4 to 9.9 mg/L SiO2 (table 4). Bicarbonate, estimated from measured alkalin-ity, is the dominant anionic species; alkalinity only ranged from 86 to 126 mg/L as CaCO3 (fig. 7). Chloride and sulfate were the next most abundant anionic species, with concentra-tions of 1.5 to 2.1 mg/L and 6.4 to 29 mg/L, respectively. The lowest concentrations in the range given were commonly for station 10D for both major cations and anionic species. Previous reports contained similar data (Piatak and others, 2006b; USGS, 2006a; Kiah and others, 2007).
Iron, Aluminum, and Manganese
The concentrations of dissolved aluminum and manganese increased from 5.1 to 117 µg/L and from 1.2 to 95.7 µg/L, respectively, from station 10A to station 10B, which is just downstream from the mine-impacted seep. The concentrations of these two elements then generally decrease with increasing distance downstream and reach 7.8 mg/L aluminum and 9.8 mg/L manganese at station 10C (fig. 8;
Nature and Extent of Contamination 85
table 4). Concentrations at the background conditions station (10D) were similar to those found at station 10C (9.7 mg/L aluminum and 7.8 mg/L manganese). The concentrations of dissolved iron were below the detection limit of 20 µg/L in all tributary samples and 34 mg/L in station 10D surface water (fig. 8A).
Minor and Trace Elements
The concentrations of many minor and trace elements increased from station 10A to station 10B due to the input of mine-influenced seep waters between these two locations. The concentrations of most minor and trace elements then decrease with increasing distance downstream from station 10B to station 10C (fig. 9; table 4). These elements include Cd (<0.02 to 0.77 µg/L), Co (<0.02 to 8.05 µg/L), Cu (0.52 to 79.9 µg/L), Ni (<0.4 to 3.4 µg/L), and Zn (1.7 to 114 µg/L). The concentrations of these elements were generally low in the background conditions sample (10D). The variations in con-centrations of barium (15.2 to 23.6 µg/L), strontium (113 to 142 µg/L), and uranium (0.1 to 0.17 µg/L) did not follow the same trend as the previously mentioned elements (table 4). Dissolved Ag, As, Be, Cr, Hg, Sb, Se, Tl, and V concentrations were all below or near their detection limits (appendix 5).
Dissolved Organic Carbon and Nutrients
DOC concentrations in the tributary to Cookville Brook increased from 1.1 mg/L at station 10A to 3.3 mg/L at station 10B and then dropped to between 0.8 and 1 mg/L for the next three downstream stations (11, 12, 10) before increasing to 2.1 mg/L at station 10C. The background water at station 10D contained 2 mg/L DOC. Nutrients were generally low throughout the study area. Total nitrogen was <0.06 to 0.13 mg/L, and total phosphorus ranged from <0.008 to 0.011 mg/L (table 4).
Trace Element Loads and Yields
Coupled streamflow measurements and surface-water samples obtained at sample locations in the tributary to Cookville Brook on October 16, 2007, were used to describe transport and attenuation of constituents. Background conditions were characterized by samples obtained from station 10D on Cookville Brook. Instantaneous loads were calculated for both the dissolved and total phase for Al, Cd, Co, Cu, Fe, Mn, and Zn. Among the sample locations along the tributary to Cookville Brook, the highest loads were observed at station 10B (fig. 16). Loads for cadmium, cobalt, and zinc were all primarily dissolved and attenuated moving downstream from station 10B (fig. 16B, C, G). Total loads of aluminum fluctuate but generally decrease, whereas the dissolved load consistently decreases downstream (fig. 16A). Manganese loads decrease downstream from station 10B to station 12, where the total manganese loads begin to increase. Iron was not detected in the surface-water samples collected in the tributary to Cookville Brook (fig. 16E).
Evaluation of constituent yields in the tributary to Cookville Brook allows for a comparison to background station 10D. Whereas loads for most elements at station 10D were notably higher than those observed along the tributary to Cookville Brook, yields along the tributary to Cookville Brook were demonstrably higher than background conditions. The exception was yields at 10A, which were similar to background conditions (fig. 17). Yields for all elements, except manganese, decrease with distance from the mine. Yields of aluminum, copper, and zinc were near background values at station 10C (fig. 17A, D, G). Yields of cadmium and cobalt remain elevated above background values (fig. 17B).
Comparisons with Ambient Water-Quality Criteria To describe how concentrations of contaminants of con-
cern may vary over time and distance from mining activities, comparisons were made between concentrations of selected elements and their WQC (table 5); for hardness-dependent WQC, a hardness of 100 mg/L as CaCO3 was assumed. Data were used from this study (October 2007), from Kiah and others (2007), and from Piatak and others (2006b). Similar to the upper and lower reach of Pike Hill Brook, all concentra-tions of barium were above the WQC (fig. 5B). Concentrations of dissolved Co and Mn and total Al were above the WQC at station 10B, and Cu and Cd were above WQC at both sta-tions 10B and 11 (fig. 5).
The hardness-dependent WQC in figure 5 were general-ized in that they were calculated on the basis of a hardness of 100 mg/L as CaCO3; in contrast, the hazard indices were calculated on the basis of the hardness of the sample. The hazard index values for surface water in this tributary are 0.1 for the headwater station 10A, above 1.0 for stations 10B, 11, and 12, but decreasing with distance downstream. For this tributary, surface-water hazard index values reach a maximum of 16 for station 10B. The surface-water hazard index for background conditions station 10D is 0.6 (table 8).
Pore-Water GeochemistryPore water was sampled from various locations in the
Cookville Brook watershed. Samples were co-located with surface-water samples. Four types of pore waters (in situ, centrifuged, equilibrated, and peeper) were sampled from background conditions station 10D upstream from mine-impacted drainage and from four locations along the tributary to Cookville Brook (stations 10A, 10B, 10, and 10C; fig. 1). In addition, only equilibrated pore water was collected from stations 11 and 12 in the tributary. Chemical constituents for pore-water samples are summarized in table 6, and complete analyses are reported in appendix 5.
Field Parameters and Major Inorganic ConstituentsThe pH and specific conductance were measured only
on the in situ, equilibrated, and centrifuged samples. The pH of pore waters from the Cookville Brook watershed was near

86 Aquatic Assessment of the Pike Hill Copper Mine Superfund Site, Corinth, Vermont
neutral and ranged from 7.1 to 8.0 (fig. 6). This is comparable to the pH of most pore waters from the lower reach of Pike Hill Brook and to surface water in the Cookville Brook watershed. The pH of the in situ pore waters (pH 7.1 to 7.4) was slightly lower than that of the centrifuged and equilibrated pore waters (pH 7.6 to 8.0) for all stations in the watershed. Similar to that of surface water, the pH of two of the three pore-water types decreased by 0.2 to 0.3 pH units from station 10A to 10B, downstream from the mine-impacted seep (fig. 6). The specific conductance values of the equilibrated pore water (536 to 1,009 µS/cm) were significantly higher than the centrifuged splits (261 to 307 µS/cm), which were higher than the in situ splits (230 to 281 µS/cm), which were higher than surface-water values (188 to 248 µS/cm; fig. 6; table 6).
Calcium was the dominant dissolved cation, followed by SiO2; K, Mg, and Na were less abundant than Ca and SiO2 and occurred in subequal proportions, similar to the surface-water samples (table 6). The concentrations of most of these constituents increased from station 10A to 10B and then from 10B downstream generally decreased for the equilibrated pore waters. The variation in concentrations of these elements in the in situ, centrifuged, and peeper waters was not as significant as in the equilibrated pore waters. In addition, the concentrations of dissolved major cations were usually highest in the equilibrated samples and generally lowest in the in situ samples (table 6). Dissolved cation concentrations reached 240 mg/L for Ca, 9.95 mg/L for K, 16.1 mg/L for Mg, 10.5 mg/L for Na, and 16.5 mg/L for SiO2 in tributary pore waters (table 6). The concentrations of these elements, except sodium, were consistently lower in background conditions station 10D pore waters compared to the tributary pore waters. Hardness ranged from 89 to 123 mg/L as CaCO3 in the in situ samples, from 121 to 172 mg/L as CaCO3 in centrifuged samples, from 257 to 666 mg/L as CaCO3 in equilibrated samples, and from 94 to 127 mg/L as CaCO3 in the peeper samples. Bicarbonate, estimated on the basis of measured alkalinity, was the dominant anionic species; sulfate and chloride concentrations were significantly less, with sulfate generally more abundant than chloride (fig. 7; table 6).
Iron, Aluminum, and Manganese
Similar to those of surface waters, dissolved iron concentrations were below or near the detection limit of 20 μg/L for in situ and equilibrated pore waters and below the detection limit of 200 μg/L for peeper pore waters in most samples except those collected from station 10A (fig. 8A; table 6). In contrast, centrifuged pore waters usually contained detectable iron. The highest concentration of iron was found in centrifuged pore water from station 10A, at 389 μg/L, which dropped to below the detection limit downstream at station 10B. The highest concentrations of dissolved alumi-num were found in the centrifuged (239 μg/L) and peeper (260.6 μg/L) pore waters from station 10A; the concentrations of aluminum in most pore waters decreased from station 10A
to 10B (fig. 8B; table 6). In contrast, the concentration of manganese in pore waters increased from station 10A to 10B. Concentrations of aluminum and manganese were lowest in the in situ pore waters for all samples except the background conditions station 10D. The equilibrated pore-water samples contained the highest concentrations of manganese and ranged from 5,460 to 25,900 μg/L (table 6).
Minor and Trace Elements
The minor and trace elements present in pore waters from the Cookville Brook watershed were Ba (up to 423 μg/L), Cd (up to 2.05 μg/L), Co (up to 33.3 μg/L), Cu (up to 72.3 μg/L), Ni (up to 5.6 μg/L), Pb (up to 0.6 μg/L), Se (up to 6.8 μg/L), Sr (up to 772 µg/L), U (up to 2.65 µg/L), V (up to 1.2 µg/L), and Zn (up to 118 μg/L; table 6). The concentrations of Cd, Co, Cu, Ni, and Zn were generally similar between background conditions station 10D and the farthest upstream sample location on the tributary (10A); the concentrations of these trace elements generally increased from station 10A to station 10B, downstream from the mine-impacted seep (fig. 9; table 6). Only equilibrated pore water was collected from the next downstream sampling location (station 11), and the concentrations of cadmium, copper, and zinc all reached their maximum values found in the Cookville watershed in this pore water. Similar to surface water concentrations, dissolved Ag, As, Be, Cr, Sb, and Tl concentrations in all pore waters were near or below their detection limits (appendix 5).
Dissolved Organic Carbon and Nutrients
Dissolved organic carbon (DOC) and nutrient concentra-tions were determined only on splits of the in situ pore-water samples. DOC concentrations ranged from 0.6 to 2.5 mg/L, with the highest concentration in the background conditions location (station 10D) and the station in the tributary farthest downstream from the mine (station 10C). Nutrients were low, with total nitrogen values between <0.06 and 0.1 mg/L and total phosphorus between <0.008 and 0.005 mg/L (table 6).
Comparisons with Ambient Water-Quality Criteria
Pore-water samples were collected at stations 10A, 10B, 11, 12, 10, and 10C in the tributary to Cookville Brook reach. There were no pore-water samples previously collected at the Pike Hill Copper Mine Superfund site; therefore, all analyses used data collected from this study (2007). Only equilibrated pore waters were sampled at stations 11 and 12. Whether an element exceeded its WQC at any particular location is relative to the type of pore-water sample being considered; occasionally concentrations from all four pore-water samples collected at one location exceed the WQC. Differences in concentrations among the four pore-water-sample types for the same element at the same location were in part due to differ-ences in sample collection and processing.
Nature and Extent of Contamination 87
Generally, there were fewer concentrations that were greater than the WQC in the pore-water samples collected in the Cookville Brook watershed as compared with the pore-water samples from both the upper and lower reach of Pike Hill Brook. Similar to concentrations in the upper and lower reaches of Pike Hill Brook, barium concentrations in all pore-water samples were greater than the WQC (table 6). Aluminum concentrations measured at station 10A in the centrifuged and peeper pore-water samples were greater than the WQC (table 6). Concentrations of cadmium exceeded their hardness-dependent WQC (based on the hardness of the sample) at stations 10B and 10 in the in situ, centrifuged, and peeper pore-water samples, whereas cadmium criteria were exceeded in equilibrated pore-water samples for stations 11 and 12. Overall, at least one pore-water sample exceeded the hardness-dependent WQC for cadmium at each sampling location downstream from the mine-impacted seepage except the farthest downstream station, 10C. Cobalt concentrations were greater than the WQC at station 10B in the peeper and equilibrated pore-water samples, at stations 11 and 12 in the equilibrated pore-water samples, and at station 10 in the peeper, equilibrated, and in situ pore-water samples (table 6). Concentrations of copper in the centrifuged pore-water samples at stations 10B and 10 and in the equilibrated pore-water sample at station 11 were greater than the WQC (table 6). Concentrations of manganese measured in the pore-water samples were above the WQC at stations 10B, 10, and 10C in the centrifuged, peeper, and equilibrated samples, at station 10A in the peeper and equilibrated samples, and in the equilibrated samples at stations 11 and 12 (table 6). In addition, pore waters for background conditions station 10D contained concentrations of manganese that exceeded the WQC for in situ, equilibrated, and peeper samples. Equilibrated pore-water samples exceeded the selenium WQC for stations 10A and 10B and exceeded the strontium WQC for stations 10D, 10A, and 10B. Concentrations of uranium measured in the equilibrated pore-water samples from stations 10D and 10B exceeded the WQC (table 6).
The hardness-dependent WQC were generalized in that they were calculated on the basis of a hardness of 100 mg/L as CaCO3; in contrast, the hazard indices were calculated on the basis of the hardness of the sample. All tributary samples except the farthest downstream station (10C) had pore-water hazard indices greater than 1.0 in at least one pore-water type; the hazard index values for the background conditions location pore waters were all less than 1.0.
Sediment GeochemistrySediment samples from the unnamed tributary to
Cookville Brook include six sampling locations (stations 10A, 10B, 11, 12, 10, and 10C). Station 10D from the headwaters of Cookville Brook was used for comparison as the background sample for the tributary samples. Chemical constituents for sediment samples are summarized in table 9, and select elements are illustrated in figures 10 and 11; complete
chemical analyses are reported in appendix 6. SEM-AVS data for sediment samples are summarized in table 10, and complete analyses are reported in appendix 4. The major element chemistry of the background sample for the Cookville Brook watershed (10D) reflected its siliciclastic constituents with 4.28 weight percent Al, 1.73 weight percent Fe, and between 0.75 and 1.35 weight percent Ca, K, Mg, and Na. The sediment samples in the tributary to Cookville Brook have similar major element chemistry compared to station 10D, with similar concentrations of Ca (1 .0 to 2.18 weight percent), Fe (1.11 to 1.76 weight percent), and Mg (0.74 to 1.46 weight percent), and slightly lower concentrations of Al (3.85 to 4.38 weight percent), K (0.61 to 0.89 weight percent), and Na (0.41 to 0.6 weight percent; fig. 10; table 9). Sulfur values were generally low, with the background sediment at 10D containing <0.01 weight percent and samples from the unnamed tributary containing from <0.01 to only 0.03 weight percent sulfur (fig. 10). Carbonate carbon values were low in all samples from the Cookville Brook watershed; concentra-tions ranged from 0.02 to 0.06 weight percent for stations 10A, 10B, 11, and 10 and reached 0.22 and 0.31 weight percent in sediment from stations 12 and 10C, respectively. In contrast, total organic carbon values were significantly higher than carbonate carbon values and ranged from 0.69 to 1.98 weight percent for sediment from the unnamed tributary to Cookville Brook (table 9). The concentrations of organic carbon in background sediment 10D was 0.37 weight percent.
Maximum concentrations of trace elements in sediment from the unnamed tributary to Cookville Brook are 2 mg/kg for As (several stations), 253 mg/kg Ba (station 11), 4.6 mg/kg Cd (station 11), 94.4 mg/kg Co (station 11), 40 mg/kg Cr (station 10B), 1,020 mg/kg Cu (station 11), 2,110 mg/kg Mn (station 11), 0.34 mg/kg Mo (stations 10B and 10), 36.9 mg/kg Ni (station 11), 11.1 mg/kg Pb (station 10B), 0.08 mg/kg Sb (station 10B), 255 mg/kg Sr (station 12), and 1,120 mg/kg Zn (station 11; table 9). The highest concentrations of many trace elements were found in sediment from station 11. The concentrations of most trace elements, including cadmium, copper, and zinc, were significantly higher in the sediment downstream from the Smith mine area (unnamed tributary to Cookville Brook) compared to the background sample location in the headwaters of Cookville Brook (10D; fig. 11B). Also, the concentrations of these elements, in addition to cobalt and nickel, increased from stations 10A to 10B and 11 and then generally decreased at the farther downstream stations of 12, 10, and 10C (fig. 11B; table 9). Silver, mercury, and selenium were near or below their detection limits (appendix 6).
Acid volatile sulfide for the stream-sediment samples from the Cookville Brook watershed was below the detection limit of ~20 mg/kg (~0.6 μmol/g; table 10). The concentra-tion of simultaneously extracted metals (Cd + Cu + Pb + Ni + Zn) increased from station 10A with 1.5 μmol/g to station 10B with 19.4 μmol/g, and then again to station 11 with 23.3 μmol/g. Downstream from this location, the ΣSEM concentrations were lower, at 6.9 μmol/g (12), 9.3 μmol/g
88 Aquatic Assessment of the Pike Hill Copper Mine Superfund Site, Corinth, Vermont
(10), and 0.8 μmol/g (10C; table 10). The background sample (10D) was 0.3 μmol/g, for comparison. Simultane-ously extracted mercury was below its detection limit of 0.002 μmol/g.
The concentrations of As, Cd, Cr, Hg, Ni, and Pb in the sediments from the Cookville Brook watershed are below the PECs (table 5), with the exception of Cu and Zn. The concen-trations of copper in sediments from stations 10B, 11, 12, and 10 exceeded the PEC of 149 mg/kg with sample concentra-tions of 798 mg/kg, 1,020 mg/kg, 270 mg/kg, and 324 mg/kg, respectively (fig. 11B; table 9). In addition, the concentration of zinc in sediment from stations 10B, 11, and 10 exceed the PEC of 459 mg/kg with sample concentrations of 543, 1,120, and 475 mg/kg Zn (fig. 11B; table 9). At the farthest downstream station of 10C, the concentrations of copper and zinc are below the PECs. PEC hazard indices based on the sum of hazard quotients for Cd, Cu, Pb, Ni, and Zn are above 1.0 for stations 10B, 11, 12, and 10 (table 8). In comparison, the hazard indices for sediments from both the background station 10D and the headwater sampling station 10A are less than 1.0. Also, the ESB index values for the background stream sediment (10D) was 80.1 μmol/gOC, which was within the predicted no-effects range (<130 μmol/gOC; table 10). In contrast, the ESB index for all other sediments except the most downstream station (10C) were within the uncertain effects range of 130 and 3,000 μmol/gOC (USEPA 2005); ESB index values for these samples excluding station 10C range from 165.1 to 1,781.1 μmol/gOC (table 10).
The mineralogy of the stream sediments from the Cookville Brook watershed was consistent with the major element chemistry of the samples. Quartz was the most abundant mineral in all samples, followed in abundance by feldspars and clays (appendix 7). The feldspar and clays host much of the aluminum and other major elements such as calcium, magnesium, and potassium. Iron was present in up to a few weight percent in the stream sediments, but goethite and jarosite were essentially non-detectable; the iron may be hosted in amphiboles or clay minerals or could be present as amorphous material. Sulfur was low or non-detectable on the basis of the chemistry, which is consistent with sulfides generally not being detected in these sediments.
Toxicity Tests with Sediment and Pore WaterToxicity tests with pore water and sediment from the
tributary to Cookville Brook (stations 10A, 10B, 10, and 10C, plus reference station 10D) were conducted by TechLaw (2008a, b) and USGS CERC (table 11). Acute (96-hour) pore-water toxicity tests were conducted with H. azteca and C. dilutus (TechLaw, 2008b). There was 100 percent survival of C. dilutus in all pore-water samples. Pore-water tests with H. azteca suggested lower survival rates for stations 10B, 10, and 10C (range of means of 60 to 65 percent), but these means were not significantly different compared to the reference sample. In the 10-day sediment test with H. azteca (TechLaw, 2008a), no sample had survival that was significantly less than
the reference sample, but growth data for sediment from 10B showed a significant reduction, compared to the reference sample 10D (table 11).
Chronic sediment toxicity tests conducted by USGS CERC lasted for 28 days for H. azteca and 10 days for C. dilutus. For both organisms, survival and growth (length of H. azteca, ash-free dry weight of C. dilutus) endpoints were measured. Results of H. azteca and C. dilutus sediment tests were similar. For both species, survival data for samples from the unnamed tributary to Cookville Brook were not signifi-cantly different from those of the reference sample, but growth data for 10B and 10 samples were significantly less than those of the reference. For H. azteca, mean lengths were 2.38 mm (10B) and 2.83 mm (10), compared to the mean of 3.88 mm at the reference (10D). For C. dilutus, mean ash-free dry weights per individual were 0.28 mg (10B) and 0.27 mg (10), compared to the mean of 1.04 mg for the reference (10D).
Results of toxicity tests indicate that sediment toxicity in this reach was greatest downstream from inputs of metals from a seep influenced by the Smith mine. There were no significant reductions in survival of both H. azteca and C. dilutus in either acute pore-water tests or whole-sediment tests, but there were significant reductions in growth of both H. azteca (10-day or 28-day tests) and C. dilutus (10-day test) at stations 10B and 10. There was no evidence of sediment toxicity at the headwa-ter sampling location 10A or at the downstream station 10C.
Ecological IndicatorsThe invertebrate abundance and richness values indicated
that the tributary to Cookville Brook became impaired for both the RTH and DTH communities at station 10B from the acidic mine-drainage groundwater breakout above that location (fig. 14; table 12). As previously discussed, station 10A, although not a geochemical reference location, is used to compare ecological indicators in the Cookville Brook tribu-tary; station 10A is upstream from the acidic mine-drainage seep, had surface- and pore-water hazard index values below 1.0, and the biological community was assessed as “good.” Comparing station 10A to station 10B, the invertebrate metrics showed substantial declines: RTH abundance from 827 to 32, RTH richness from 48 to 17, DTH abundance from 256 to 60, and DTH richness from 32 to 17. Additionally, these values were consistent with the VTDEC assessments of station 10A as “good” and station 10B as “poor” (table 13).
Some degree of recovery was apparent farther down-stream by station 10, where values for the RTH and DTH abundance and richness metrics increased from station 10B (fig. 14; table 12). This degree of recovery was relatively small for the DTH abundance (from 60 to 68) and richness (from 17 to 18), but RTH abundance and richness increased significantly from 32 and 17 at station 10B to 289 and 47 at station 10. The VTDEC assessment also indicated a degree of ecological recovery at station 10 by rating the station as “good/fair” (table 13). Farther downstream at station 10C, an even greater extent of ecological recovery was apparent, where
Discussion 89
values of the invertebrate metrics exceeded the reference location values except for RTH richness (fig. 14; table 12). The degree of recovery at station 10C was also indicated in the VTDEC assessment, which rated the station as “excellent/very good” (table 13).
Sampling locations within the Cookville Brook drain-age (10, 10C, and 10D) did not have the physical habitat characteristics that were necessary for the fish IBI to be used effectively in making an assessment based on the fish com-munity. Consequently, an assessment of the fish community for stations 10 and 10D was based on the best professional judgment of a biologist from the VTDEC (Richard Langdon, written commun., 2011; appendix 8). Station 10 is near the source areas containing mine waste in Cookville Brook and station 10D is the reference location, and both were judged as meeting the Vermont Class B water-quality standards. Brook trout was the only species collected at station 10 (47 individuals), but brook trout, creek chub, and blacknose dace were collected at station 10D, where each of the three species accounted for about a third of the total number of fish (142 individuals; appendix 8).
Results from the survey indicate that fish in the tributary to Cookville Brook were below the copper and cadmium criti-cal body residue values in both blacknose dace and brook trout (fig. 15; table 14). An assemblage of brook trout at station 10 appeared to be well established, and the average concentration of copper in their tissue was 1.6 μg/g, compared to an average of 1.2 µg/g at the reference station (10D). Downstream at station 10C, the concentration of copper in blacknose dace was 0.8 µg/g, compared to 0.7 µg/g at the reference sampling location. Cadmium in fish tissue was similar to copper, in that reference station (10D) concentrations were similar to non-reference stations (10C and 10). The concentrations of zinc in all fish collected from the Cookville Brook watershed, including reference station 10D, exceeded the no-effects CBR of 16.4 (fig. 15).
Relations Among Trace Elements in Surface Water, Pore Water, Sediment, and Aquatic Biota
Surface water, pore water, and sediment were sampled in October of 2007, and invertebrates and fish were sampled in August and September of 2007 to relate water and sediment quality to aquatic biota. Surface and pore waters and stream sediments were collected from all sampling locations in the watershed (stations 10D, 10A, 10B, 11, 12, 10, and 10C). Invertebrates were collected from stations 10D, 10A, 10B, 10, and 10C, and fish were collected from stations 10D, 10, and 10C. Background conditions were characterized by samples obtained at station 10D for waters, sediment, and fish. Sta-tion 10A was used to compare invertebrate communities in the watershed, instead of station 10D.
Hazard index values less than 1.0 were observed for surface waters, pore waters, and sediment samples at background conditions station 10D and at the most upstream
and most downstream sampling locations on the tributary to Cookville Brook (station 10A and 10C, respectively). The other four stations sampled on the tributary (stations 10B, 11, 12, and 10) had hazard index values greater than 1.0 for most of the waters and sediments sampled. The exceedances were mainly due to cadmium and copper and, locally, zinc.
The RTH and DTH invertebrate data indicated that there is impairment to the tributary to Cookville Brook downstream from the acidic mine-drainage seep, with recovery increasing with increasing distance downstream. In the Cookville Brook watershed, both the RTH and DTH responses were generally inversely correlated with the hazard index values for surface water and pore water, respectively (fig. 18). DTH responses were also inversely correlated with the hazard index values for stream sediment. These correlations are also evident in Pike Hill Brook watershed (table 7). As previously stated, the corre-lations between RTH responses and stream sediment were not considered because the sediment collected was not co-located with stations where the RTH invertebrates were collected.
Only a limited assessment of the fish assemblages in Cookville Brook watershed could be made because the tributary sampling locations were too small and the reference conditions station 10D was in a wetland. Stations 10 and 10D were both judged as meeting Class B water-quality standards, and station 10C was not assessed. The concentrations of copper in both the brook trout and blacknose dace collected from the Cookville Brook watershed were all below the CBR of 2.4 µg/g. The surface-water hazard quotients for copper from locations where fish were collected were also below 1.0. The concentrations of zinc exceeded its CBR of 16.4 µg/g in all samples, although the concentrations of zinc in each fish species were lower than those found in the Pike Hill Brook watershed fish (fig. 15). The surface-water hazard quotients for zinc in waters from the three fish assemblage sampling locations in the Cookville Brook watershed were below 1.0.
DiscussionThe health of the aquatic ecosystem surrounding the
Pike Hill Copper Mine Superfund site has been assessed by investigating a variety of indicators of aquatic ecosystem health and by examining geochemical attributes of associated surface water, whole sediments, and pore water to explain the biological observations. Ecological indicators used in this study include parameters for both invertebrates and fish. Invertebrate measures include infaunal and epifaunal inver-tebrate assemblage abundance and richness data as well as survival and growth of invertebrate taxa in toxicity tests with sediment and pore water. The fish community was assessed primarily using an Index of Biotic Integrity (IBI).
Several approaches are available to estimate toxicity hazards of the surface water, whole sediment, and pore water. Surface-water toxicity hazards can be estimated on the basis of water-quality criteria (WQC)—criterion maximum
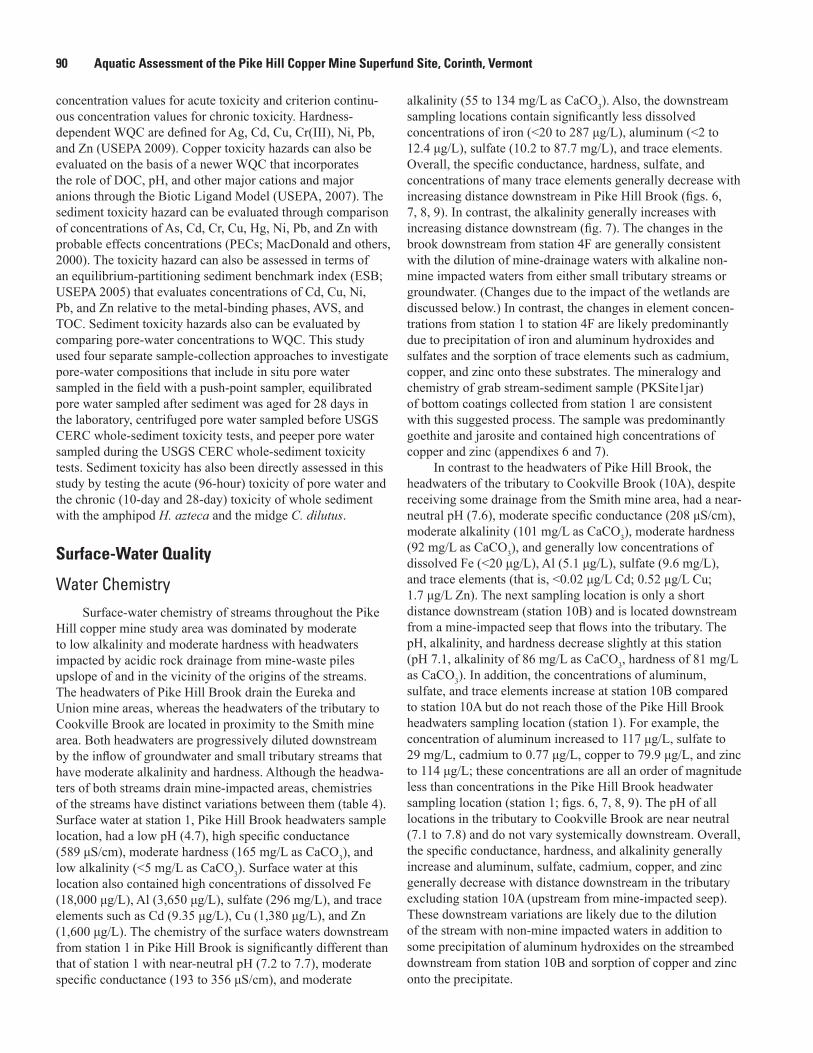
90 Aquatic Assessment of the Pike Hill Copper Mine Superfund Site, Corinth, Vermont
concentration values for acute toxicity and criterion continu-ous concentration values for chronic toxicity. Hardness-dependent WQC are defined for Ag, Cd, Cu, Cr(III), Ni, Pb, and Zn (USEPA 2009). Copper toxicity hazards can also be evaluated on the basis of a newer WQC that incorporates the role of DOC, pH, and other major cations and major anions through the Biotic Ligand Model (USEPA, 2007). The sediment toxicity hazard can be evaluated through comparison of concentrations of As, Cd, Cr, Cu, Hg, Ni, Pb, and Zn with probable effects concentrations (PECs; MacDonald and others, 2000). The toxicity hazard can also be assessed in terms of an equilibrium-partitioning sediment benchmark index (ESB; USEPA 2005) that evaluates concentrations of Cd, Cu, Ni, Pb, and Zn relative to the metal-binding phases, AVS, and TOC. Sediment toxicity hazards also can be evaluated by comparing pore-water concentrations to WQC. This study used four separate sample-collection approaches to investigate pore-water compositions that include in situ pore water sampled in the field with a push-point sampler, equilibrated pore water sampled after sediment was aged for 28 days in the laboratory, centrifuged pore water sampled before USGS CERC whole-sediment toxicity tests, and peeper pore water sampled during the USGS CERC whole-sediment toxicity tests. Sediment toxicity has also been directly assessed in this study by testing the acute (96-hour) toxicity of pore water and the chronic (10-day and 28-day) toxicity of whole sediment with the amphipod H. azteca and the midge C. dilutus.
Surface-Water Quality
Water ChemistrySurface-water chemistry of streams throughout the Pike
Hill copper mine study area was dominated by moderate to low alkalinity and moderate hardness with headwaters impacted by acidic rock drainage from mine-waste piles upslope of and in the vicinity of the origins of the streams. The headwaters of Pike Hill Brook drain the Eureka and Union mine areas, whereas the headwaters of the tributary to Cookville Brook are located in proximity to the Smith mine area. Both headwaters are progressively diluted downstream by the inflow of groundwater and small tributary streams that have moderate alkalinity and hardness. Although the headwa-ters of both streams drain mine-impacted areas, chemistries of the streams have distinct variations between them (table 4). Surface water at station 1, Pike Hill Brook headwaters sample location, had a low pH (4.7), high specific conductance (589 μS/cm), moderate hardness (165 mg/L as CaCO3), and low alkalinity (<5 mg/L as CaCO3). Surface water at this location also contained high concentrations of dissolved Fe (18,000 μg/L), Al (3,650 μg/L), sulfate (296 mg/L), and trace elements such as Cd (9.35 μg/L), Cu (1,380 μg/L), and Zn (1,600 μg/L). The chemistry of the surface waters downstream from station 1 in Pike Hill Brook is significantly different than that of station 1 with near-neutral pH (7.2 to 7.7), moderate specific conductance (193 to 356 μS/cm), and moderate
alkalinity (55 to 134 mg/L as CaCO3). Also, the downstream sampling locations contain significantly less dissolved concentrations of iron (<20 to 287 μg/L), aluminum (<2 to 12.4 μg/L), sulfate (10.2 to 87.7 mg/L), and trace elements. Overall, the specific conductance, hardness, sulfate, and concentrations of many trace elements generally decrease with increasing distance downstream in Pike Hill Brook (figs. 6, 7, 8, 9). In contrast, the alkalinity generally increases with increasing distance downstream (fig. 7). The changes in the brook downstream from station 4F are generally consistent with the dilution of mine-drainage waters with alkaline non-mine impacted waters from either small tributary streams or groundwater. (Changes due to the impact of the wetlands are discussed below.) In contrast, the changes in element concen-trations from station 1 to station 4F are likely predominantly due to precipitation of iron and aluminum hydroxides and sulfates and the sorption of trace elements such as cadmium, copper, and zinc onto these substrates. The mineralogy and chemistry of grab stream-sediment sample (PKSite1jar) of bottom coatings collected from station 1 are consistent with this suggested process. The sample was predominantly goethite and jarosite and contained high concentrations of copper and zinc (appendixes 6 and 7).
In contrast to the headwaters of Pike Hill Brook, the headwaters of the tributary to Cookville Brook (10A), despite receiving some drainage from the Smith mine area, had a near-neutral pH (7.6), moderate specific conductance (208 μS/cm), moderate alkalinity (101 mg/L as CaCO3), moderate hardness (92 mg/L as CaCO3), and generally low concentrations of dissolved Fe (<20 μg/L), Al (5.1 μg/L), sulfate (9.6 mg/L), and trace elements (that is, <0.02 μg/L Cd; 0.52 μg/L Cu; 1.7 μg/L Zn). The next sampling location is only a short distance downstream (station 10B) and is located downstream from a mine-impacted seep that flows into the tributary. The pH, alkalinity, and hardness decrease slightly at this station (pH 7.1, alkalinity of 86 mg/L as CaCO3, hardness of 81 mg/L as CaCO3). In addition, the concentrations of aluminum, sulfate, and trace elements increase at station 10B compared to station 10A but do not reach those of the Pike Hill Brook headwaters sampling location (station 1). For example, the concentration of aluminum increased to 117 μg/L, sulfate to 29 mg/L, cadmium to 0.77 μg/L, copper to 79.9 μg/L, and zinc to 114 μg/L; these concentrations are all an order of magnitude less than concentrations in the Pike Hill Brook headwater sampling location (station 1; figs. 6, 7, 8, 9). The pH of all locations in the tributary to Cookville Brook are near neutral (7.1 to 7.8) and do not vary systemically downstream. Overall, the specific conductance, hardness, and alkalinity generally increase and aluminum, sulfate, cadmium, copper, and zinc generally decrease with distance downstream in the tributary excluding station 10A (upstream from mine-impacted seep). These downstream variations are likely due to the dilution of the stream with non-mine impacted waters in addition to some precipitation of aluminum hydroxides on the streambed downstream from station 10B and sorption of copper and zinc onto the precipitate.
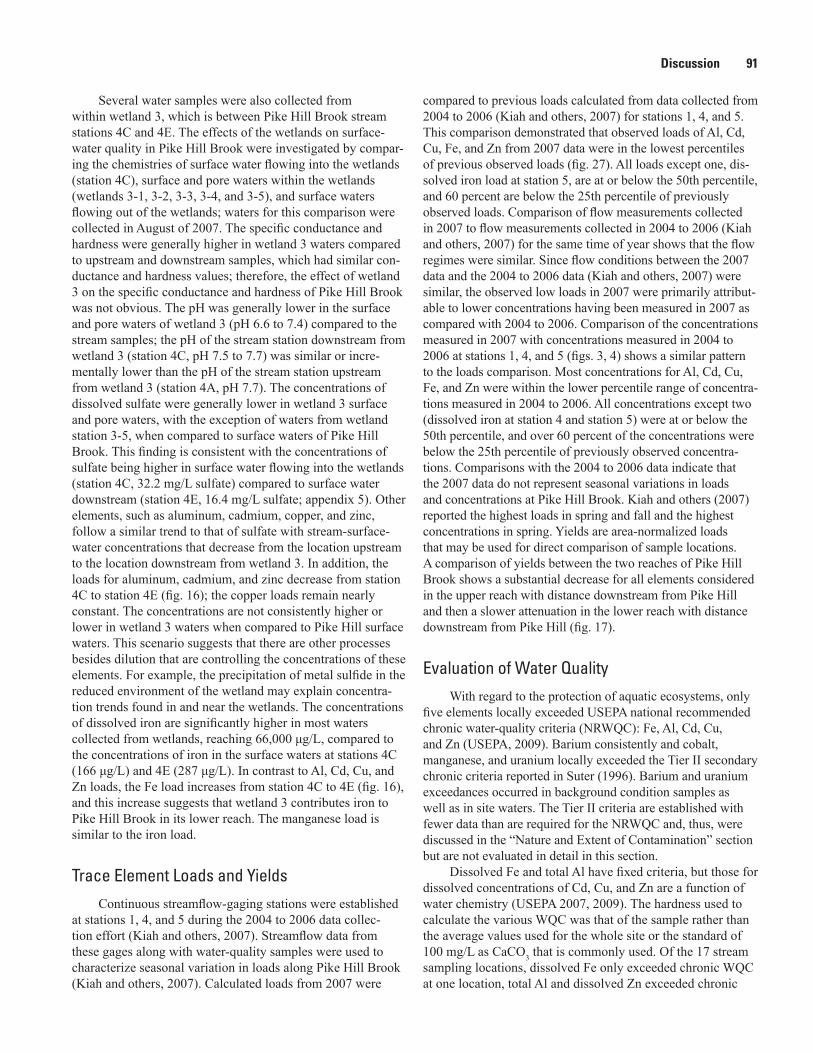
Discussion 91
Several water samples were also collected from within wetland 3, which is between Pike Hill Brook stream stations 4C and 4E. The effects of the wetlands on surface-water quality in Pike Hill Brook were investigated by compar-ing the chemistries of surface water flowing into the wetlands (station 4C), surface and pore waters within the wetlands (wetlands 3-1, 3-2, 3-3, 3-4, and 3-5), and surface waters flowing out of the wetlands; waters for this comparison were collected in August of 2007. The specific conductance and hardness were generally higher in wetland 3 waters compared to upstream and downstream samples, which had similar con-ductance and hardness values; therefore, the effect of wetland 3 on the specific conductance and hardness of Pike Hill Brook was not obvious. The pH was generally lower in the surface and pore waters of wetland 3 (pH 6.6 to 7.4) compared to the stream samples; the pH of the stream station downstream from wetland 3 (station 4C, pH 7.5 to 7.7) was similar or incre-mentally lower than the pH of the stream station upstream from wetland 3 (station 4A, pH 7.7). The concentrations of dissolved sulfate were generally lower in wetland 3 surface and pore waters, with the exception of waters from wetland station 3-5, when compared to surface waters of Pike Hill Brook. This finding is consistent with the concentrations of sulfate being higher in surface water flowing into the wetlands (station 4C, 32.2 mg/L sulfate) compared to surface water downstream (station 4E, 16.4 mg/L sulfate; appendix 5). Other elements, such as aluminum, cadmium, copper, and zinc, follow a similar trend to that of sulfate with stream-surface-water concentrations that decrease from the location upstream to the location downstream from wetland 3. In addition, the loads for aluminum, cadmium, and zinc decrease from station 4C to station 4E (fig. 16); the copper loads remain nearly constant. The concentrations are not consistently higher or lower in wetland 3 waters when compared to Pike Hill surface waters. This scenario suggests that there are other processes besides dilution that are controlling the concentrations of these elements. For example, the precipitation of metal sulfide in the reduced environment of the wetland may explain concentra-tion trends found in and near the wetlands. The concentrations of dissolved iron are significantly higher in most waters collected from wetlands, reaching 66,000 μg/L, compared to the concentrations of iron in the surface waters at stations 4C (166 μg/L) and 4E (287 μg/L). In contrast to Al, Cd, Cu, and Zn loads, the Fe load increases from station 4C to 4E (fig. 16), and this increase suggests that wetland 3 contributes iron to Pike Hill Brook in its lower reach. The manganese load is similar to the iron load.
Trace Element Loads and YieldsContinuous streamflow-gaging stations were established
at stations 1, 4, and 5 during the 2004 to 2006 data collec-tion effort (Kiah and others, 2007). Streamflow data from these gages along with water-quality samples were used to characterize seasonal variation in loads along Pike Hill Brook (Kiah and others, 2007). Calculated loads from 2007 were
compared to previous loads calculated from data collected from 2004 to 2006 (Kiah and others, 2007) for stations 1, 4, and 5. This comparison demonstrated that observed loads of Al, Cd, Cu, Fe, and Zn from 2007 data were in the lowest percentiles of previous observed loads (fig. 27). All loads except one, dis-solved iron load at station 5, are at or below the 50th percentile, and 60 percent are below the 25th percentile of previously observed loads. Comparison of flow measurements collected in 2007 to flow measurements collected in 2004 to 2006 (Kiah and others, 2007) for the same time of year shows that the flow regimes were similar. Since flow conditions between the 2007 data and the 2004 to 2006 data (Kiah and others, 2007) were similar, the observed low loads in 2007 were primarily attribut-able to lower concentrations having been measured in 2007 as compared with 2004 to 2006. Comparison of the concentrations measured in 2007 with concentrations measured in 2004 to 2006 at stations 1, 4, and 5 (figs. 3, 4) shows a similar pattern to the loads comparison. Most concentrations for Al, Cd, Cu, Fe, and Zn were within the lower percentile range of concentra-tions measured in 2004 to 2006. All concentrations except two (dissolved iron at station 4 and station 5) were at or below the 50th percentile, and over 60 percent of the concentrations were below the 25th percentile of previously observed concentra-tions. Comparisons with the 2004 to 2006 data indicate that the 2007 data do not represent seasonal variations in loads and concentrations at Pike Hill Brook. Kiah and others (2007) reported the highest loads in spring and fall and the highest concentrations in spring. Yields are area-normalized loads that may be used for direct comparison of sample locations. A comparison of yields between the two reaches of Pike Hill Brook shows a substantial decrease for all elements considered in the upper reach with distance downstream from Pike Hill and then a slower attenuation in the lower reach with distance downstream from Pike Hill (fig. 17).
Evaluation of Water QualityWith regard to the protection of aquatic ecosystems, only
five elements locally exceeded USEPA national recommended chronic water-quality criteria (NRWQC): Fe, Al, Cd, Cu, and Zn (USEPA, 2009). Barium consistently and cobalt, manganese, and uranium locally exceeded the Tier II secondary chronic criteria reported in Suter (1996). Barium and uranium exceedances occurred in background condition samples as well as in site waters. The Tier II criteria are established with fewer data than are required for the NRWQC and, thus, were discussed in the “Nature and Extent of Contamination” section but are not evaluated in detail in this section.
Dissolved Fe and total Al have fixed criteria, but those for dissolved concentrations of Cd, Cu, and Zn are a function of water chemistry (USEPA 2007, 2009). The hardness used to calculate the various WQC was that of the sample rather than the average values used for the whole site or the standard of 100 mg/L as CaCO3 that is commonly used. Of the 17 stream sampling locations, dissolved Fe only exceeded chronic WQC at one location, total Al and dissolved Zn exceeded chronic
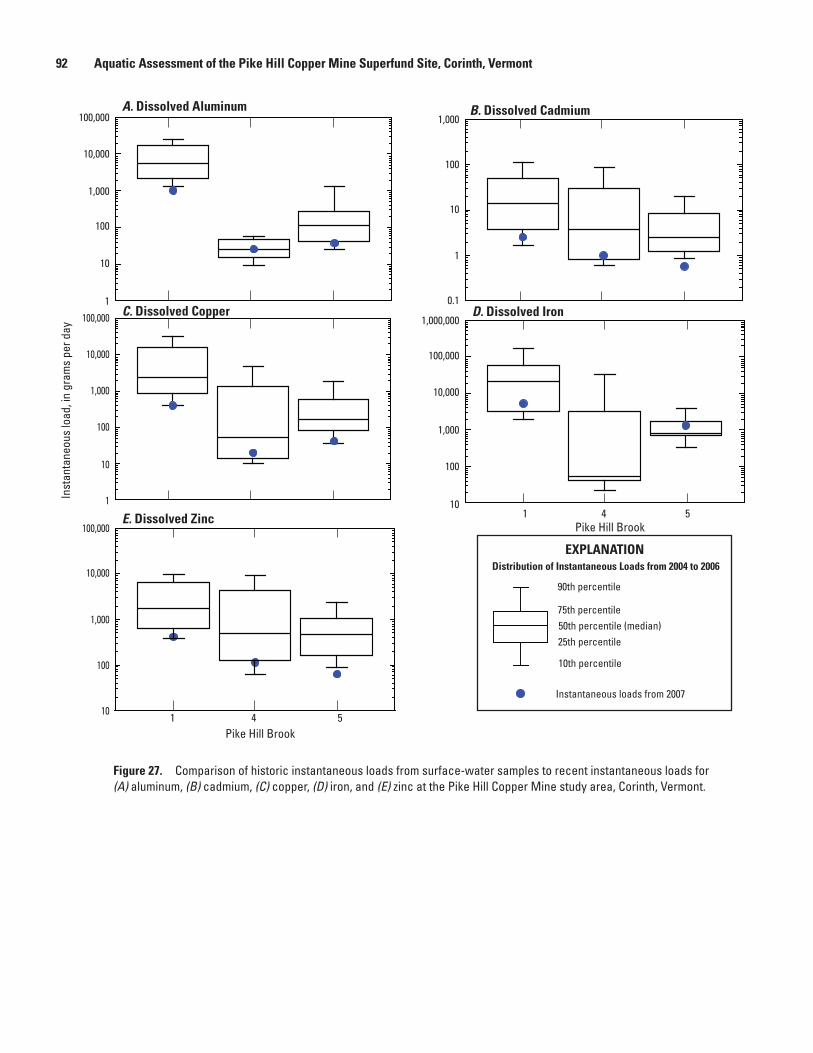
92 Aquatic Assessment of the Pike Hill Copper Mine Superfund Site, Corinth, Vermont
D. Dissolved Iron
E. Dissolved Zinc
A. Dissolved Aluminum B. Dissolved Cadmium
C. Dissolved Copper
1 4 5
Pike Hill Brook 1 4 5
Pike Hill Brook
Inst
anta
neou
s lo
ad, i
n gr
ams
per d
ay
100,000
10,000
1,000
100
10
1
100,000
10,000
1,000
100
10
100,000
10,000
1,000
100
10
1
1,000,000
100,000
10,000
1,000
10
100
0.1
1
10
100
1,000
EXPLANATION
Instantaneous loads from 2007
90th percentile
25th percentile
75th percentile50th percentile (median)
10th percentile
Distribution of Instantaneous Loads from 2004 to 2006
Figure 27.
Figure 27. Comparison of historic instantaneous loads from surface-water samples to recent instantaneous loads for (A) aluminum, (B) cadmium, (C) copper, (D) iron, and (E) zinc at the Pike Hill Copper Mine study area, Corinth, Vermont.
Discussion 93
WQC at four locations each, dissolved Cd exceeded at seven locations, and dissolved Cu exceeded at eight locations (fig. 28). The concentrations of copper at four of the eight exceedance locations were only slightly above the hardness-dependent WQC (that is, concentrations were less than 10 percent above the criteria or hazard index of less than 1.1). The concentrations of Fe, Al, Cd, Cu, and Zn did not exceed their respective criteria at the three background sampling locations (stations 2, 5A, and 10D; fig. 28).
As for waters collected from the wetlands, surface water was collected at three of the five sampling locations. Iron exceeded the chronic aquatic WQC in surface water at one of the three locations, cadmium and aluminum exceeded criteria at two of the three locations, and copper exceeded criteria at all three locations (fig. 28). As for water samples collected at depth within the wetlands, only wetland 3-1B sample contained criteria exceedances of cadmium, copper, and zinc. In contrast, this is the only sample collected from the wetlands at depth that did not exceed the chronic aquatic WQC for iron (table 15). The concentrations of total aluminum in most waters collected from depth at the five wetland sampling locations also exceeded the criteria.
Problematic concentrations of dissolved iron are limited to station 1 and samples collected mostly at depth in wetland 3. Station 1 is directly downstream from the Eureka and Union mines and represents the most concentrated mine-impacted drainage collected in the Pike Hill study area in 2007. This sampling location had the lowest pH and highest specific conductance of all locations included in this aquatic ecosystem assessment. The rapid natural attenuation of iron downstream from station 1 reflected the combined influences of neutralization with attendant oxidation of ferrous iron and hydrolysis of ferric iron, and dilution. The resulting precipitation of ferric iron due to the oxidation of ferrous iron and neutralization of acidic mine-impacted drainage means that most of the iron delivered to the wetlands by Pike Hill Brook is in the form of colloidal particulates (fig. 16). Within the wetlands, the increase in dissolved iron probably reflects the reductive dissolution of ferric iron colloids at depth in the anoxic portions of the wetland.
Problematic concentrations of total aluminum were found at stations 1, 4F, 4A, and 10B. The highest concentrations of total aluminum were in waters from stations 1 and 10B, both of which are headwaters draining mines in the Pike Hill study area. The concentration of aluminum at station 1 was more than an order of magnitude greater than that at station 10B, and the concentrations of aluminum at station 10B were significantly higher than at stations 4F and 4A. Station 1 also has significantly lower pH and higher specific conductance when compared to the other stations. The anomalously high concentration of aluminum at station 1 reflected the control of pH on aluminum solubility; silicate minerals weather and release aluminum more rapidly under low pH conditions compared to neutral pH conditions. The natural attenuation of aluminum concentrations to significantly lower levels down-stream from station 1 was due to neutralization after mixing
with the non-mine impacted tributary waters that flow into Pike Hill Brook just downstream from station 1 and the associ-ated precipitation of aluminum hydroxides. The non-mine impacted water upstream from the mixing is represented by station 2. The dissolved aluminum concentrations in surface water at station 10B and in waters downstream in the tributary to Cookville Brook behaved similarly to the concentrations at Pike Hill Brook station 1 and its downstream sampling loca-tions with an increase in pH at the next downstream location and a subsequent drop in dissolved aluminum concentrations.
The concentrations of cadmium and zinc in surface waters are highly correlated due to their identical source in the mine waste piles—the mineral sphalerite—and the similarity of their geochemical behaviors (Seal and Hammarstrom, 2003). Cadmium exceeded chronic WQC at more than half of the sampling locations where surface water was collected, whereas zinc exceeded criteria at less than one quarter of the sampling locations (fig. 28). Hazard quotients for cadmium exceed 1.0 more often because the WQC for cadmium is much lower than the WQC for zinc.
The concentrations of dissolved copper and cadmium were the most widespread of all of the contaminants in the study area. Figure 28 and table 8 illustrate that the surface-water hazard index, the sum of hazards quotients for Cd, Cu, Ni, Pb, and Zn, is dominated by the cadmium and copper components. Interestingly, the fact that cadmium hazard quo-tients are about twice that of copper hazard quotients for Pike Hill Brook stations 4F, 4, 4A, and 4C suggests that cadmium dominated the contamination at these stations. In contrast, copper dominated the contamination at nearly all the other locations sampled in the Pike Hill study area. This feature may be a reflection of the fact that copper has a greater affinity for adsorption onto ferric hydroxide particles than does cadmium, and this affinity results in a greater proportion of cadmium in the dissolved load relative to copper (Smith, 1999).
Copper is the only element at present to also have a WQC based on the Biotic Ligand Model (Paquin and others, 2002; USEPA, 2007). For surface waters throughout the study area, the copper WQC based on BLM were generally lower than hardness-dependent WQC, so hazard quotients based on BLM are generally higher than those based on hardness (fig. 29; table 16). For samples in the Pike Hill Brook watershed with distinctly disparate surface-water hazard quotients between the two methods, the water chemistry generally had lower DOC, alkalinity, and sodium and higher sulfate, all of which were parameters used in the Biotic Ligand approach but not used in the hardness-based approach. Station 2 in the Pike Hill Brook watershed was not included in the previous comparison because DOC was not measured on the sample and was assumed to be 1 mg/L; if DOC had been greater in this sample, the hazard quotients based on the two methods would have been more similar. All samples in the Cookville Brook watershed had distinctly disparate surface-water hazard quotients between the two methods, with the BLM-based hazard quotient being greater than the hardness-based hazard quotient. This holds true for both surface-water and pore-water
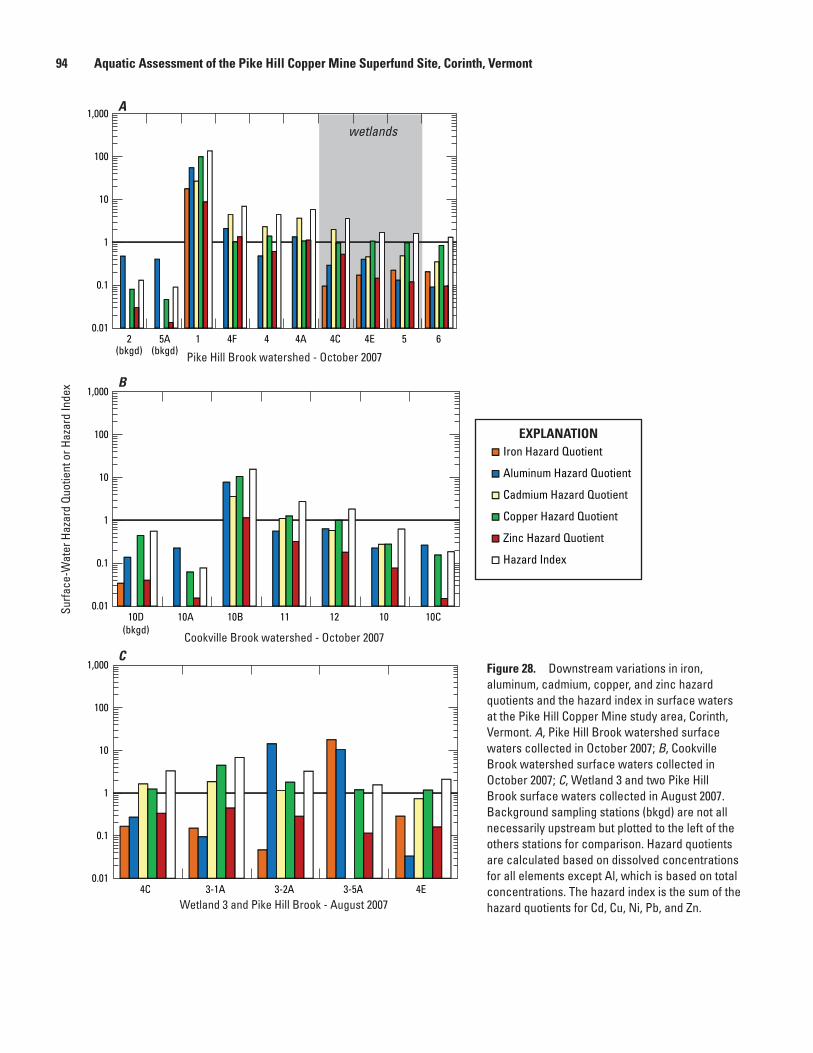
94 Aquatic Assessment of the Pike Hill Copper Mine Superfund Site, Corinth, Vermont
wetlands
Pike Hill Brook watershed - October 2007
Cookville Brook watershed - October 2007
Wetland 3 and Pike Hill Brook - August 2007
0.01
0.1
1
10
100
1,000
2(bkgd)
5A(bkgd)
1 4F 4 4A 4C 4E 5 6
Surfa
ce-W
ater
Haz
ard
Quot
ient
or H
azar
d In
dex
A
B
C
0.01
0.1
1
10
100
1,000
10D(bkgd)
10A 10B 11 12 10 10C
0.01
0.1
1
10
100
1,000
4C 3-1A 3-2A 3-5A 4E
Iron Hazard Quotient
Aluminum Hazard Quotient
Cadmium Hazard Quotient
Copper Hazard Quotient
Zinc Hazard Quotient
Hazard Index
EXPLANATION
Figure 28.
Figure 28. Downstream variations in iron, aluminum, cadmium, copper, and zinc hazard quotients and the hazard index in surface waters at the Pike Hill Copper Mine study area, Corinth, Vermont. A, Pike Hill Brook watershed surface waters collected in October 2007; B, Cookville Brook watershed surface waters collected in October 2007; C, Wetland 3 and two Pike Hill Brook surface waters collected in August 2007. Background sampling stations (bkgd) are not all necessarily upstream but plotted to the left of the others stations for comparison. Hazard quotients are calculated based on dissolved concentrations for all elements except Al, which is based on total concentrations. The hazard index is the sum of the hazard quotients for Cd, Cu, Ni, Pb, and Zn.
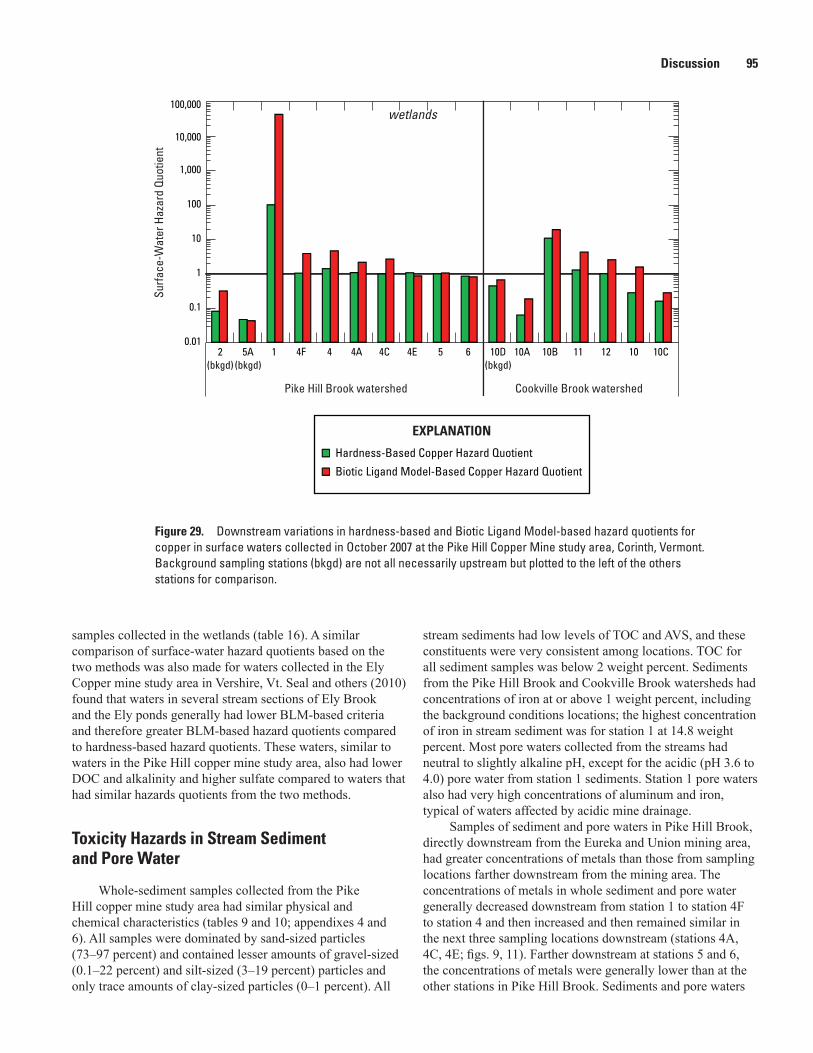
Discussion 95
0.01
0.1
1
10
100
1,000
10,000
100,000
2(bkgd)
5A(bkgd)
1 4F 4 4A 4C 4E 5 6 10D(bkgd)
10A 10B 11 12 10 10C
Cookville Brook watershedPike Hill Brook watershed
Surfa
ce-W
ater
Haz
ard
Quot
ient
wetlands
Hardness-Based Copper Hazard Quotient
Biotic Ligand Model-Based Copper Hazard Quotient
EXPLANATION
Figure 29.
Figure 29. Downstream variations in hardness-based and Biotic Ligand Model-based hazard quotients for copper in surface waters collected in October 2007 at the Pike Hill Copper Mine study area, Corinth, Vermont. Background sampling stations (bkgd) are not all necessarily upstream but plotted to the left of the others stations for comparison.
samples collected in the wetlands (table 16). A similar comparison of surface-water hazard quotients based on the two methods was also made for waters collected in the Ely Copper mine study area in Vershire, Vt. Seal and others (2010) found that waters in several stream sections of Ely Brook and the Ely ponds generally had lower BLM-based criteria and therefore greater BLM-based hazard quotients compared to hardness-based hazard quotients. These waters, similar to waters in the Pike Hill copper mine study area, also had lower DOC and alkalinity and higher sulfate compared to waters that had similar hazards quotients from the two methods.
Toxicity Hazards in Stream Sediment and Pore Water
Whole-sediment samples collected from the Pike Hill copper mine study area had similar physical and chemical characteristics (tables 9 and 10; appendixes 4 and 6). All samples were dominated by sand-sized particles (73–97 percent) and contained lesser amounts of gravel-sized (0.1–22 percent) and silt-sized (3–19 percent) particles and only trace amounts of clay-sized particles (0–1 percent). All
stream sediments had low levels of TOC and AVS, and these constituents were very consistent among locations. TOC for all sediment samples was below 2 weight percent. Sediments from the Pike Hill Brook and Cookville Brook watersheds had concentrations of iron at or above 1 weight percent, including the background conditions locations; the highest concentration of iron in stream sediment was for station 1 at 14.8 weight percent. Most pore waters collected from the streams had neutral to slightly alkaline pH, except for the acidic (pH 3.6 to 4.0) pore water from station 1 sediments. Station 1 pore waters also had very high concentrations of aluminum and iron, typical of waters affected by acidic mine drainage.
Samples of sediment and pore waters in Pike Hill Brook, directly downstream from the Eureka and Union mining area, had greater concentrations of metals than those from sampling locations farther downstream from the mining area. The concentrations of metals in whole sediment and pore water generally decreased downstream from station 1 to station 4F to station 4 and then increased and then remained similar in the next three sampling locations downstream (stations 4A, 4C, 4E; figs. 9, 11). Farther downstream at stations 5 and 6, the concentrations of metals were generally lower than at the other stations in Pike Hill Brook. Sediments and pore waters
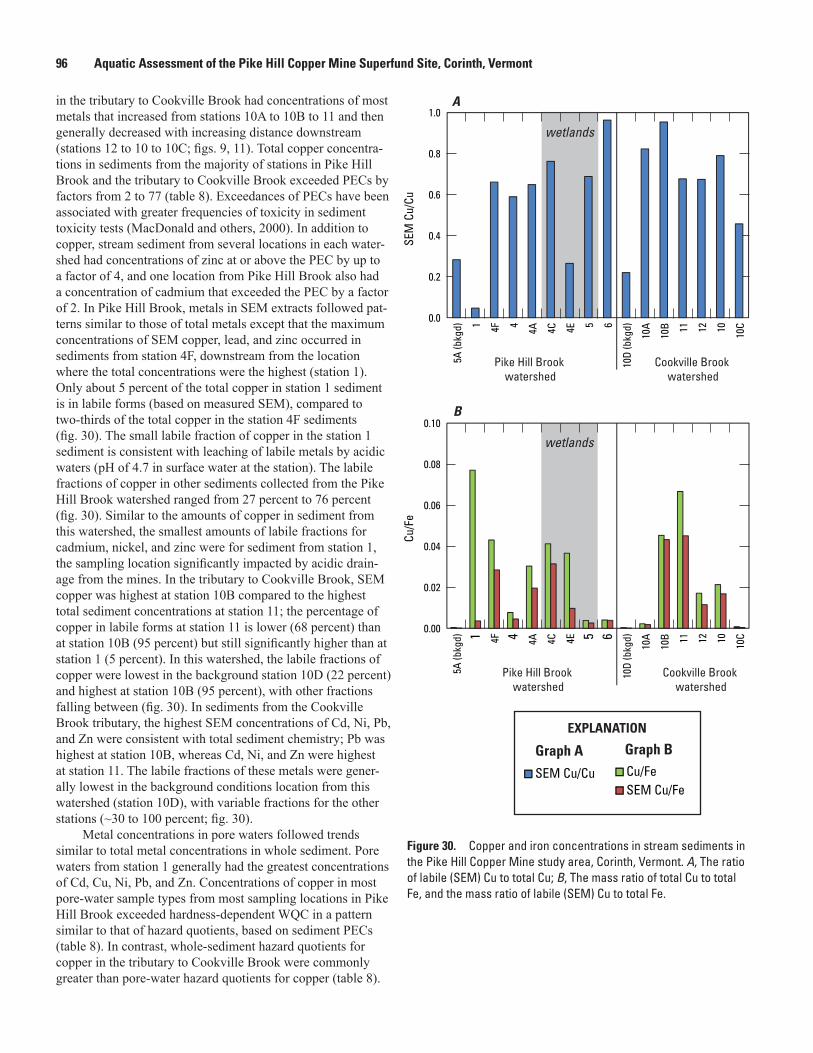
96 Aquatic Assessment of the Pike Hill Copper Mine Superfund Site, Corinth, Vermont
in the tributary to Cookville Brook had concentrations of most metals that increased from stations 10A to 10B to 11 and then generally decreased with increasing distance downstream (stations 12 to 10 to 10C; figs. 9, 11). Total copper concentra-tions in sediments from the majority of stations in Pike Hill Brook and the tributary to Cookville Brook exceeded PECs by factors from 2 to 77 (table 8). Exceedances of PECs have been associated with greater frequencies of toxicity in sediment toxicity tests (MacDonald and others, 2000). In addition to copper, stream sediment from several locations in each water-shed had concentrations of zinc at or above the PEC by up to a factor of 4, and one location from Pike Hill Brook also had a concentration of cadmium that exceeded the PEC by a factor of 2. In Pike Hill Brook, metals in SEM extracts followed pat-terns similar to those of total metals except that the maximum concentrations of SEM copper, lead, and zinc occurred in sediments from station 4F, downstream from the location where the total concentrations were the highest (station 1). Only about 5 percent of the total copper in station 1 sediment is in labile forms (based on measured SEM), compared to two-thirds of the total copper in the station 4F sediments (fig. 30). The small labile fraction of copper in the station 1 sediment is consistent with leaching of labile metals by acidic waters (pH of 4.7 in surface water at the station). The labile fractions of copper in other sediments collected from the Pike Hill Brook watershed ranged from 27 percent to 76 percent (fig. 30). Similar to the amounts of copper in sediment from this watershed, the smallest amounts of labile fractions for cadmium, nickel, and zinc were for sediment from station 1, the sampling location significantly impacted by acidic drain-age from the mines. In the tributary to Cookville Brook, SEM copper was highest at station 10B compared to the highest total sediment concentrations at station 11; the percentage of copper in labile forms at station 11 is lower (68 percent) than at station 10B (95 percent) but still significantly higher than at station 1 (5 percent). In this watershed, the labile fractions of copper were lowest in the background station 10D (22 percent) and highest at station 10B (95 percent), with other fractions falling between (fig. 30). In sediments from the Cookville Brook tributary, the highest SEM concentrations of Cd, Ni, Pb, and Zn were consistent with total sediment chemistry; Pb was highest at station 10B, whereas Cd, Ni, and Zn were highest at station 11. The labile fractions of these metals were gener-ally lowest in the background conditions location from this watershed (station 10D), with variable fractions for the other stations (~30 to 100 percent; fig. 30).
Metal concentrations in pore waters followed trends similar to total metal concentrations in whole sediment. Pore waters from station 1 generally had the greatest concentrations of Cd, Cu, Ni, Pb, and Zn. Concentrations of copper in most pore-water sample types from most sampling locations in Pike Hill Brook exceeded hardness-dependent WQC in a pattern similar to that of hazard quotients, based on sediment PECs (table 8). In contrast, whole-sediment hazard quotients for copper in the tributary to Cookville Brook were commonly greater than pore-water hazard quotients for copper (table 8).
SEM Cu/Cu Cu/FeSEM Cu/Fe
EXPLANATION
Graph BGraph A
0.0
0.2
0.4
0.6
0.8
1.0
5A (b
kgd) 1 4F 4 4A 4C 4E 5 6
10D
(bkg
d)
10A
10B 11 12 10 10C
SEM
Cu/
Cu
Pike Hill Brook watershed
Cookville Brook watershed
A
wetlands
wetlands
0.00
0.02
0.04
0.06
0.08
0.10
5A (b
kgd) 1 4F 4 4A 4C 4E 5 6
10D
(bkg
d)
10A
10B 11 12 10 10C
Cu/F
e
Pike Hill Brook watershed
Cookville Brook watershed
B
Figure 30.
Figure 30. Copper and iron concentrations in stream sediments in the Pike Hill Copper Mine study area, Corinth, Vermont. A, The ratio of labile (SEM) Cu to total Cu; B, The mass ratio of total Cu to total Fe, and the mass ratio of labile (SEM) Cu to total Fe.
Discussion 97
Zinc concentrations in pore waters locally exceeded hardness-dependent WQC in various pore water types at the same sampling locations at which PEC sediment hazard quotients were greater than 1.0, with the exception of station 11. Also, cadmium exceeded the hardness-dependent WQC in pore waters more frequently than whole sediments exceeded the cadmium PEC (table 8). Neither pore waters nor whole sedi-ments had hazard quotients greater than 1.0 for nickel and lead.
Indices of toxicity hazard based on total sediment metals, metals in the SEM fraction adjusted to AVS and organic carbon (ESB index=ΣSEM-AVS/fOC; USEPA, 2005), and pore-water metals indicated a wide range of toxicity hazards among the Pike Hill copper mine study sampling locations (fig. 31). Hazard indices based on the sum of hazard quotients for Cd, Cu, Ni, Pb, and Zn relative to PECs in sediment and relative to hardness-dependent WQC in pore water were similar for loca-tions in this study and indicated consistent patterns of toxicity hazard among the sediments (fig. 31). In situ pore waters were not collected from three locations (stations 4F, 11, and 12), and therefore a pore-water hazard index could not be calculated. The ESB index indicated similar patterns of toxicity hazard to the sediment and pore-water hazard index values (fig. 31). The two hazard index values based on sediment and pore water predicted the greatest toxicity at station 1, and the ESB index nearly reached the range for probable toxic effects. Substantial toxicity hazard was predicted on the basis of the three indices for the next several sampling locations downstream in Pike Hill Brook (stations 4F, 4, 4A, 4C, and 4E). Toxicity hazards were more uncertain for sediments from station 5 and 6, the most downstream stations in Pike Hill Brook, based on PEC hazard indices or the ESB index. Hazards were also uncertain for several sediments collected downstream from the mine-impacted seep in the tributary to Cookville Brook (stations 10B, 11, 12, and 10). In contrast, based on the PEC hazard index or the ESB index for the two background stations (5A and 10D) and for the most upstream and most downstream stations in the tributary to Cookville Brook (station 10A and 10C), toxicity was not predicted (fig. 31).
Toxicity Hazards in Wetland Sediment and Pore Water
The sediments collected from the cores within the Pike Hill Brook wetlands had distinct physical and chemical characteristics when compared to stream sediments in the Pike Hill Brook and Cookville Brook watersheds (appendixes 4, 6, and 12). AVS and grain size were determined on surface samples only (“A” splits). Surface samples were dominated by silt-sized particles (39–69 percent) with generally lesser amounts of sand-sized particles (18–51 percent); clay-sized particles were minor to major components of the samples (4–19 percent), and gravel-sized particles were the least abundant (1–6 percent; appendix 4). This composition is in
contrast to that of the stream sediment samples, which were composed mostly of sand-sized particles (73–97 percent).
In contrast to Pike Hill Brook stream sediments, many wetland core sediments had a significant amount of TOC, with values generally the highest in the samples collected at or near the surface; maximum TOC reached 32.8 weight percent. Similar to Pike Hill Brook stream sediments, most wetland surface whole-sediment samples had non-detectable AVS except for sample wetland 3-5A; samples collected at depth were not analyzed for AVS. Iron concentrations in whole sediments were variable among wetland core sampling locations, with wetland 3 containing the highest concentrations overall when compared to wetlands 1, 2, and 4. The concentra-tions of iron were generally higher in the wetland whole sediments than in most stream whole sediments. Aluminum concentrations were generally slightly greater, whereas other major element concentrations such as calcium, potassium, and magnesium were similar when comparing wetland core sediments to stream sediments in the Pike Hill Brook and Cookville Brook watersheds. Most pore waters collected from the wetlands had near-neutral pH, high dissolved iron, and high total aluminum but low dissolved aluminum.
Whole-sediment samples from the wetlands commonly exceeded the PEC for Cd, Cu, and Zn, with fewer samples that exceeded the PEC for Ni and rarely the PEC for Pb. In contrast, the concentrations of dissolved metals in pore waters in wetland 3, the only wetland in which pore waters were sampled, were generally low and below the hardness-dependent WQC for Cd, Cu, Ni, Pb, and Zn with the exception of Cu, Cd, and Zn in wetland sample 3-1B. The concentrations of these metals in pore waters were not consistently high in any one particular area of wetland 3, whereas sediment from the surface and at depth from wetland core 3-2 overall contained the highest concentrations of metals. In general, pore water and total sediment concentrations were not strongly correlated. In contrast, in wetland surface samples, metals in SEM extracts generally correlated with those of total metal; SEM metals were not determined in samples collected at depth in the wetlands. The ranges in the fractions of the labile forms of Cd, Cu, Ni, Pb, and Zn in wetland surface samples were similar to those found in the stream sediments, excluding the station 1 stream sediment, which has anomalously low labile fractions of Cd, Cu, Ni, and Zn. The following ranges in fractions of labile forms were found for wetlands samples: 21 to 80 percent labile Cd, 19 to 70 percent labile Cu, 10 to 68 percent labile Ni, 12 to 85 percent labile Pb, and 16 to 69 percent labile Zn. Of the surface wetland samples, sediment from wetland locations 1-1 and 2-1 generally had the highest amounts of labile fractions, whereas sediment from wet-land 4-1 generally had the lowest amounts of labile fractions.
Hazard indices based on whole sediment metals, metals in the SEM fraction adjusted to AVS and organic carbon (ESB index=ΣSEM-AVS/fOC), and metals in pore waters collected at 31-cm depth are shown in figure 31. As mentioned previously, total sediment chemistry and metals in the SEM fraction are strongly correlated to each other, but neither is strongly
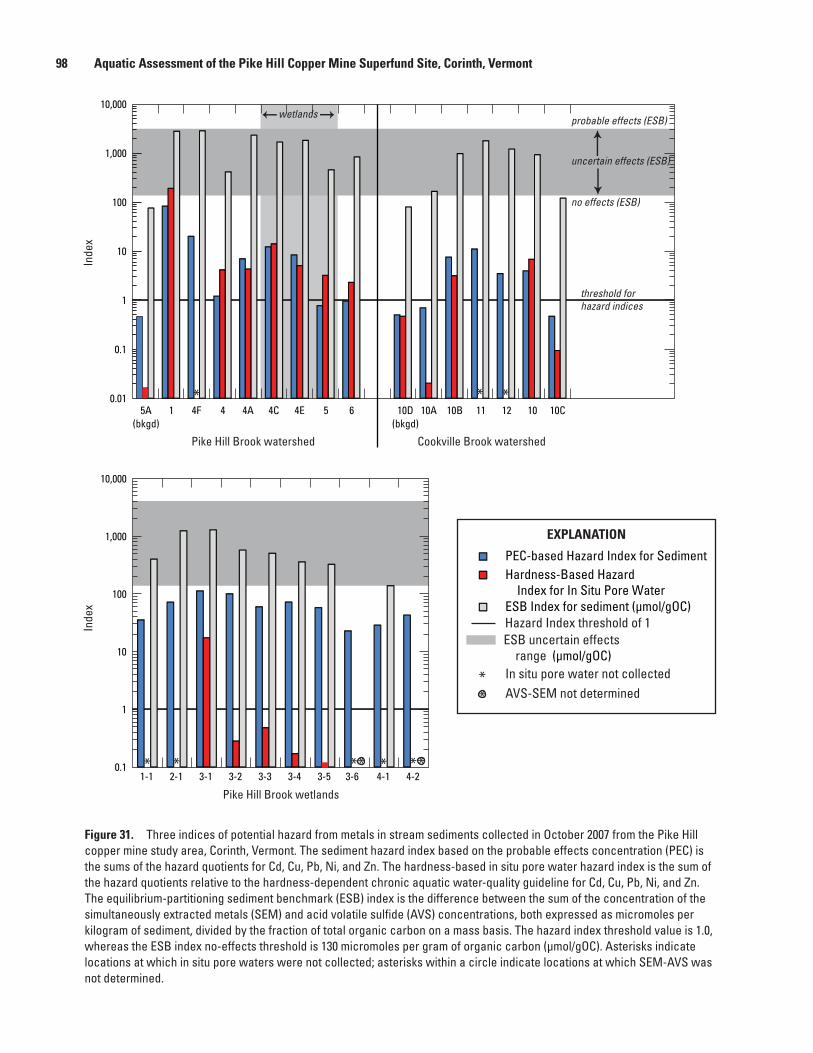
98 Aquatic Assessment of the Pike Hill Copper Mine Superfund Site, Corinth, Vermont
0.01
0.1
1
10
100
1,000
10,000
5A(bkgd)
1 4F 4 4A 4C 4E 5 6 10D(bkgd)
10A 10B 11 12 10 10C***
Pike Hill Brook watershed Cookville Brook watershed
uncertain effects (ESB)
no effects (ESB)
probable effects (ESB)
threshold for hazard indices
0.1
1
10
100
1,000
10,000
1-1 2-1 3-1 3-2 3-3 3-4 3-5 3-6 4-1 4-2
Pike Hill Brook wetlands
* * * * *
Inde
xIn
dex
wetlands
**
PEC-based Hazard Index for SedimentHardness-Based Hazard Index for In Situ Pore WaterESB Index for sediment (µmol/gOC)
ESB uncertain effects range (µmol/gOC)
Hazard Index threshold of 1
EXPLANATION
**
In situ pore water not collectedAVS-SEM not determined
Figure 31.
Figure 31. Three indices of potential hazard from metals in stream sediments collected in October 2007 from the Pike Hill copper mine study area, Corinth, Vermont. The sediment hazard index based on the probable effects concentration (PEC) is the sums of the hazard quotients for Cd, Cu, Pb, Ni, and Zn. The hardness-based in situ pore water hazard index is the sum of the hazard quotients relative to the hardness-dependent chronic aquatic water-quality guideline for Cd, Cu, Pb, Ni, and Zn. The equilibrium-partitioning sediment benchmark (ESB) index is the difference between the sum of the concentration of the simultaneously extracted metals (SEM) and acid volatile sulfide (AVS) concentrations, both expressed as micromoles per kilogram of sediment, divided by the fraction of total organic carbon on a mass basis. The hazard index threshold value is 1.0, whereas the ESB index no-effects threshold is 130 micromoles per gram of organic carbon (µmol/gOC). Asterisks indicate locations at which in situ pore waters were not collected; asterisks within a circle indicate locations at which SEM-AVS was not determined.
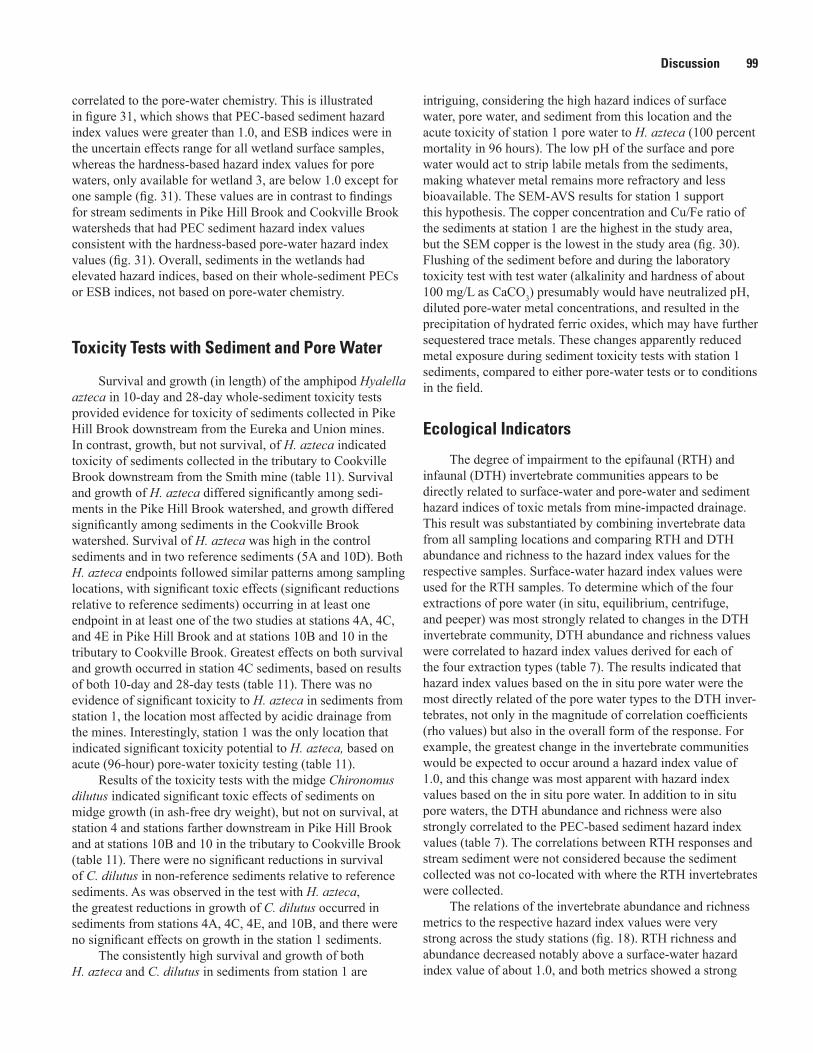
Discussion 99
correlated to the pore-water chemistry. This is illustrated in figure 31, which shows that PEC-based sediment hazard index values were greater than 1.0, and ESB indices were in the uncertain effects range for all wetland surface samples, whereas the hardness-based hazard index values for pore waters, only available for wetland 3, are below 1.0 except for one sample (fig. 31). These values are in contrast to findings for stream sediments in Pike Hill Brook and Cookville Brook watersheds that had PEC sediment hazard index values consistent with the hardness-based pore-water hazard index values (fig. 31). Overall, sediments in the wetlands had elevated hazard indices, based on their whole-sediment PECs or ESB indices, not based on pore-water chemistry.
Toxicity Tests with Sediment and Pore Water
Survival and growth (in length) of the amphipod Hyalella azteca in 10-day and 28-day whole-sediment toxicity tests provided evidence for toxicity of sediments collected in Pike Hill Brook downstream from the Eureka and Union mines. In contrast, growth, but not survival, of H. azteca indicated toxicity of sediments collected in the tributary to Cookville Brook downstream from the Smith mine (table 11). Survival and growth of H. azteca differed significantly among sedi-ments in the Pike Hill Brook watershed, and growth differed significantly among sediments in the Cookville Brook watershed. Survival of H. azteca was high in the control sediments and in two reference sediments (5A and 10D). Both H. azteca endpoints followed similar patterns among sampling locations, with significant toxic effects (significant reductions relative to reference sediments) occurring in at least one endpoint in at least one of the two studies at stations 4A, 4C, and 4E in Pike Hill Brook and at stations 10B and 10 in the tributary to Cookville Brook. Greatest effects on both survival and growth occurred in station 4C sediments, based on results of both 10-day and 28-day tests (table 11). There was no evidence of significant toxicity to H. azteca in sediments from station 1, the location most affected by acidic drainage from the mines. Interestingly, station 1 was the only location that indicated significant toxicity potential to H. azteca, based on acute (96-hour) pore-water toxicity testing (table 11).
Results of the toxicity tests with the midge Chironomus dilutus indicated significant toxic effects of sediments on midge growth (in ash-free dry weight), but not on survival, at station 4 and stations farther downstream in Pike Hill Brook and at stations 10B and 10 in the tributary to Cookville Brook (table 11). There were no significant reductions in survival of C. dilutus in non-reference sediments relative to reference sediments. As was observed in the test with H. azteca, the greatest reductions in growth of C. dilutus occurred in sediments from stations 4A, 4C, 4E, and 10B, and there were no significant effects on growth in the station 1 sediments.
The consistently high survival and growth of both H. azteca and C. dilutus in sediments from station 1 are
intriguing, considering the high hazard indices of surface water, pore water, and sediment from this location and the acute toxicity of station 1 pore water to H. azteca (100 percent mortality in 96 hours). The low pH of the surface and pore water would act to strip labile metals from the sediments, making whatever metal remains more refractory and less bioavailable. The SEM-AVS results for station 1 support this hypothesis. The copper concentration and Cu/Fe ratio of the sediments at station 1 are the highest in the study area, but the SEM copper is the lowest in the study area (fig. 30). Flushing of the sediment before and during the laboratory toxicity test with test water (alkalinity and hardness of about 100 mg/L as CaCO3) presumably would have neutralized pH, diluted pore-water metal concentrations, and resulted in the precipitation of hydrated ferric oxides, which may have further sequestered trace metals. These changes apparently reduced metal exposure during sediment toxicity tests with station 1 sediments, compared to either pore-water tests or to conditions in the field.
Ecological Indicators
The degree of impairment to the epifaunal (RTH) and infaunal (DTH) invertebrate communities appears to be directly related to surface-water and pore-water and sediment hazard indices of toxic metals from mine-impacted drainage. This result was substantiated by combining invertebrate data from all sampling locations and comparing RTH and DTH abundance and richness to the hazard index values for the respective samples. Surface-water hazard index values were used for the RTH samples. To determine which of the four extractions of pore water (in situ, equilibrium, centrifuge, and peeper) was most strongly related to changes in the DTH invertebrate community, DTH abundance and richness values were correlated to hazard index values derived for each of the four extraction types (table 7). The results indicated that hazard index values based on the in situ pore water were the most directly related of the pore water types to the DTH inver-tebrates, not only in the magnitude of correlation coefficients (rho values) but also in the overall form of the response. For example, the greatest change in the invertebrate communities would be expected to occur around a hazard index value of 1.0, and this change was most apparent with hazard index values based on the in situ pore water. In addition to in situ pore waters, the DTH abundance and richness were also strongly correlated to the PEC-based sediment hazard index values (table 7). The correlations between RTH responses and stream sediment were not considered because the sediment collected was not co-located with where the RTH invertebrates were collected.
The relations of the invertebrate abundance and richness metrics to the respective hazard index values were very strong across the study stations (fig. 18). RTH richness and abundance decreased notably above a surface-water hazard index value of about 1.0, and both metrics showed a strong
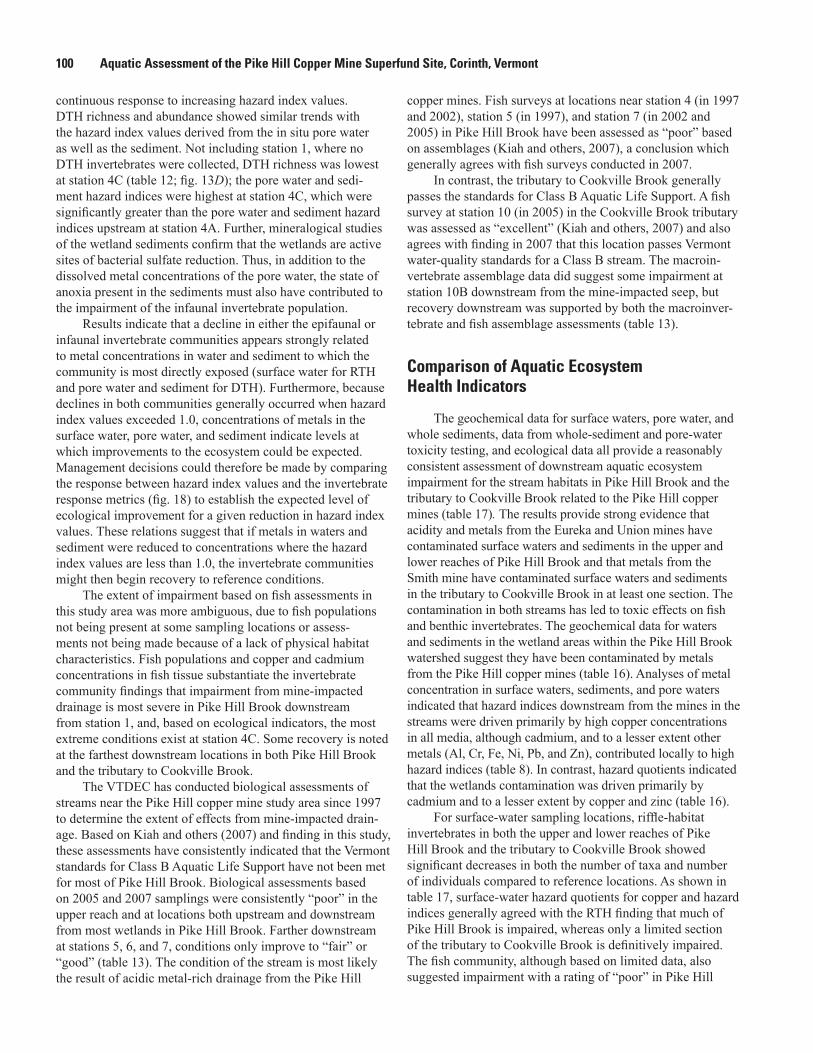
100 Aquatic Assessment of the Pike Hill Copper Mine Superfund Site, Corinth, Vermont
continuous response to increasing hazard index values. DTH richness and abundance showed similar trends with the hazard index values derived from the in situ pore water as well as the sediment. Not including station 1, where no DTH invertebrates were collected, DTH richness was lowest at station 4C (table 12; fig. 13D); the pore water and sedi-ment hazard indices were highest at station 4C, which were significantly greater than the pore water and sediment hazard indices upstream at station 4A. Further, mineralogical studies of the wetland sediments confirm that the wetlands are active sites of bacterial sulfate reduction. Thus, in addition to the dissolved metal concentrations of the pore water, the state of anoxia present in the sediments must also have contributed to the impairment of the infaunal invertebrate population.
Results indicate that a decline in either the epifaunal or infaunal invertebrate communities appears strongly related to metal concentrations in water and sediment to which the community is most directly exposed (surface water for RTH and pore water and sediment for DTH). Furthermore, because declines in both communities generally occurred when hazard index values exceeded 1.0, concentrations of metals in the surface water, pore water, and sediment indicate levels at which improvements to the ecosystem could be expected. Management decisions could therefore be made by comparing the response between hazard index values and the invertebrate response metrics (fig. 18) to establish the expected level of ecological improvement for a given reduction in hazard index values. These relations suggest that if metals in waters and sediment were reduced to concentrations where the hazard index values are less than 1.0, the invertebrate communities might then begin recovery to reference conditions.
The extent of impairment based on fish assessments in this study area was more ambiguous, due to fish populations not being present at some sampling locations or assess-ments not being made because of a lack of physical habitat characteristics. Fish populations and copper and cadmium concentrations in fish tissue substantiate the invertebrate community findings that impairment from mine-impacted drainage is most severe in Pike Hill Brook downstream from station 1, and, based on ecological indicators, the most extreme conditions exist at station 4C. Some recovery is noted at the farthest downstream locations in both Pike Hill Brook and the tributary to Cookville Brook.
The VTDEC has conducted biological assessments of streams near the Pike Hill copper mine study area since 1997 to determine the extent of effects from mine-impacted drain-age. Based on Kiah and others (2007) and finding in this study, these assessments have consistently indicated that the Vermont standards for Class B Aquatic Life Support have not been met for most of Pike Hill Brook. Biological assessments based on 2005 and 2007 samplings were consistently “poor” in the upper reach and at locations both upstream and downstream from most wetlands in Pike Hill Brook. Farther downstream at stations 5, 6, and 7, conditions only improve to “fair” or “good” (table 13). The condition of the stream is most likely the result of acidic metal-rich drainage from the Pike Hill
copper mines. Fish surveys at locations near station 4 (in 1997 and 2002), station 5 (in 1997), and station 7 (in 2002 and 2005) in Pike Hill Brook have been assessed as “poor” based on assemblages (Kiah and others, 2007), a conclusion which generally agrees with fish surveys conducted in 2007.
In contrast, the tributary to Cookville Brook generally passes the standards for Class B Aquatic Life Support. A fish survey at station 10 (in 2005) in the Cookville Brook tributary was assessed as “excellent” (Kiah and others, 2007) and also agrees with finding in 2007 that this location passes Vermont water-quality standards for a Class B stream. The macroin-vertebrate assemblage data did suggest some impairment at station 10B downstream from the mine-impacted seep, but recovery downstream was supported by both the macroinver-tebrate and fish assemblage assessments (table 13).
Comparison of Aquatic Ecosystem Health Indicators
The geochemical data for surface waters, pore water, and whole sediments, data from whole-sediment and pore-water toxicity testing, and ecological data all provide a reasonably consistent assessment of downstream aquatic ecosystem impairment for the stream habitats in Pike Hill Brook and the tributary to Cookville Brook related to the Pike Hill copper mines (table 17). The results provide strong evidence that acidity and metals from the Eureka and Union mines have contaminated surface waters and sediments in the upper and lower reaches of Pike Hill Brook and that metals from the Smith mine have contaminated surface waters and sediments in the tributary to Cookville Brook in at least one section. The contamination in both streams has led to toxic effects on fish and benthic invertebrates. The geochemical data for waters and sediments in the wetland areas within the Pike Hill Brook watershed suggest they have been contaminated by metals from the Pike Hill copper mines (table 16). Analyses of metal concentration in surface waters, sediments, and pore waters indicated that hazard indices downstream from the mines in the streams were driven primarily by high copper concentrations in all media, although cadmium, and to a lesser extent other metals (Al, Cr, Fe, Ni, Pb, and Zn), contributed locally to high hazard indices (table 8). In contrast, hazard quotients indicated that the wetlands contamination was driven primarily by cadmium and to a lesser extent by copper and zinc (table 16).
For surface-water sampling locations, riffle-habitat invertebrates in both the upper and lower reaches of Pike Hill Brook and the tributary to Cookville Brook showed significant decreases in both the number of taxa and number of individuals compared to reference locations. As shown in table 17, surface-water hazard quotients for copper and hazard indices generally agreed with the RTH finding that much of Pike Hill Brook is impaired, whereas only a limited section of the tributary to Cookville Brook is definitively impaired. The fish community, although based on limited data, also suggested impairment with a rating of “poor” in Pike Hill
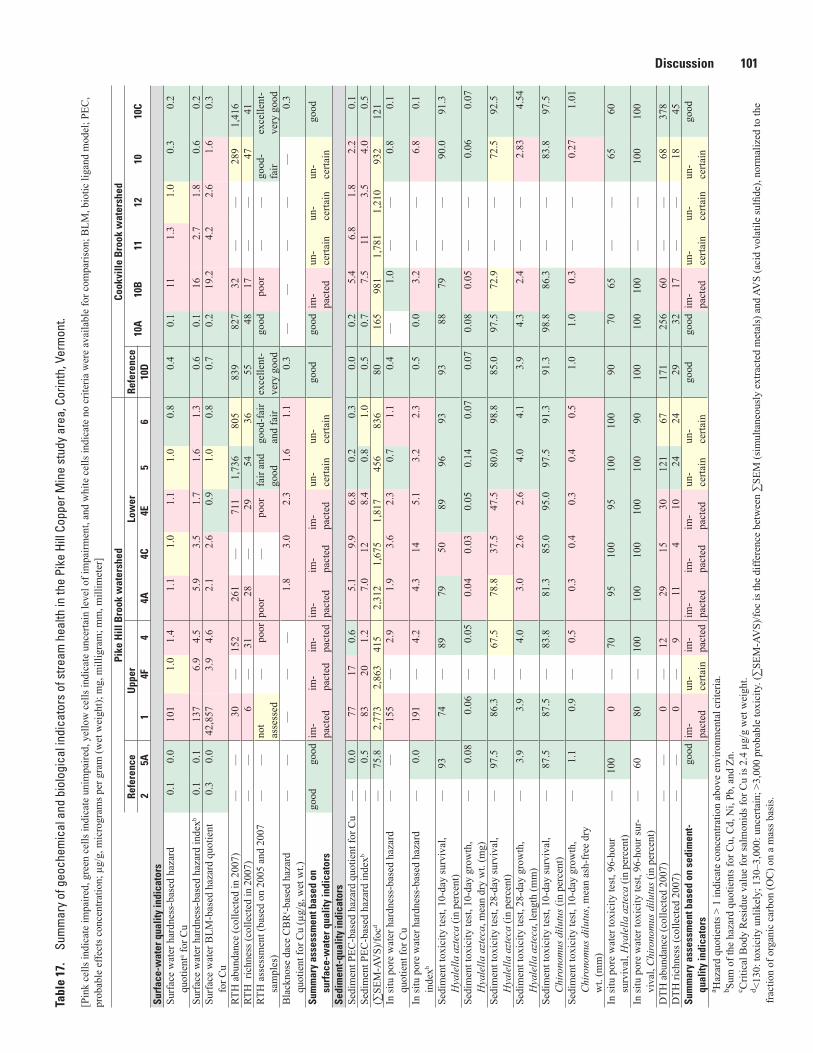
Discussion 101Ta
ble
17.
Sum
mar
y of
geo
chem
ical
and
bio
logi
cal i
ndic
ator
s of
stre
am h
ealth
in th
e Pi
ke H
ill C
oppe
r Min
e st
udy
area
, Cor
inth
, Ver
mon
t.
[Pin
k ce
lls in
dica
te im
paire
d, g
reen
cel
ls in
dica
te u
nim
paire
d, y
ello
w c
ells
indi
cate
unc
erta
in le
vel o
f im
pairm
ent,
and
whi
te c
ells
indi
cate
no
crite
ria w
ere
avai
labl
e fo
r com
paris
on; B
LM, b
iotic
liga
nd m
odel
; PEC
, pr
obab
le e
ffect
s con
cent
ratio
n; µ
g/g,
mic
rogr
ams p
er g
ram
(wet
wei
ght);
mg,
mill
igra
m; m
m, m
illim
eter
]
Pike
Hill
Bro
ok w
ater
shed
Cook
ville
Bro
ok w
ater
shed
Refe
renc
eU
pper
Low
erRe
fere
nce
10A
10B
1112
1010
C2
5A
14F
44A
4C4E
56
10D
Surf
ace-
wat
er q
ualit
y in
dica
tors
Surf
ace
wat
er h
ardn
ess-
base
d ha
zard
qu
otie
nta f
or C
u0.
10.
010
11.
01.
41.
11.
01.
11.
00.
80.
40.
111
1.3
1.0
0.3
0.2
Surf
ace
wat
er h
ardn
ess-
base
d ha
zard
inde
xb0.
10.
113
76.
94.
55.
93.
51.
71.
61.
30.
60.
116
2.7
1.8
0.6
0.2
Surf
ace
wat
er B
LM-b
ased
haz
ard
quot
ient
fo
r Cu
0.3
0.0
42,8
573.
94.
62.
12.
60.
91.
00.
80.
70.
219
.24.
22.
61.
60.
3
RTH
abu
ndan
ce (c
olle
cted
in 2
007)
——
30—
152
261
—71
11,
736
805
839
827
32—
—28
91,
416
RTH
ric
hnes
s (co
llect
ed in
200
7)—
—6
—31
28—
2954
3655
4817
——
4741
RTH
ass
essm
ent (
base
d on
200
5 an
d 20
07
sam
ples
)—
—no
t as
sess
ed—
poor
poor
—po
orfa
ir an
d go
odgo
od-f
air
and
fair
exce
llent
- ve
ry g
ood
good
po
or—
—go
od-
fair
ex
celle
nt-
very
goo
dB
lack
nose
dac
e C
BR
c -bas
ed h
azar
d
quot
ient
for C
u (µ
g/g,
wet
wt.)
——
——
—1.
83.
02.
31.
61.
10.
3—
——
——
0.3
Sum
mar
y as
sess
men
t bas
ed o
n
surf
ace-
wat
er q
ualit
y in
dica
tors
good
good
im-
pact
edim
-pa
cted
im-
pact
edim
-pa
cted
im-
pact
edim
-pa
cted
un-
certa
inun
- ce
rtain
good
good
im
-pa
cted
un-
certa
inun
-ce
rtain
un-
certa
ingo
od
Sedi
men
t-qu
ality
indi
cato
rsSe
dim
ent P
EC-b
ased
haz
ard
quot
ient
for C
u—
0.0
7717
0.6
5.1
9.9
6.8
0.2
0.3
0.0
0.2
5.4
6.8
1.8
2.2
0.1
Sedi
men
t PEC
-bas
ed h
azar
d in
dexb
—0.
583
201.
27.
012
8.4
0.8
1.0
0.5
0.7
7.5
113.
54.
00.
5(∑
SEM
-AV
S)/fo
cd—
75.8
2,77
32,
863
415
2,31
21,
675
1,81
745
683
680
165
981
1,78
11,
210
932
121
In si
tu p
ore
wat
er h
ardn
ess-
base
d ha
zard
qu
otie
nt fo
r Cu
——
155
—2.
91.
93.
62.
30.
71.
10.
4—
1.0
——
0.8
0.1
In si
tu p
ore
wat
er h
ardn
ess-
base
d ha
zard
in
dexb
—0.
019
1—
4.2
4.3
145.
13.
22.
30.
50.
03.
2—
—6.
80.
1
Sedi
men
t tox
icity
test
, 10-
day
surv
ival
, H
yale
lla a
ztec
a (in
per
cent
)—
9374
—89
7950
8996
9393
8879
——
90.0
91.3
Sedi
men
t tox
icity
test
, 10-
day
grow
th,
Hya
lella
azt
eca,
mea
n dr
y w
t. (m
g)—
0.08
0.06
—0.
050.
040.
030.
050.
140.
070.
070.
080.
05—
—0.
060.
07
Sedi
men
t tox
icity
test
, 28-
day
surv
ival
, H
yale
lla a
ztec
a (in
per
cent
)—
97.5
86.3
—67
.578
.837
.547
.580
.098
.885
.097
.572
.9—
—72
.592
.5
Sedi
men
t tox
icity
test
, 28-
day
grow
th,
Hya
lella
azt
eca,
leng
th (m
m)
—3.
93.
9—
4.0
3.0
2.6
2.6
4.0
4.1
3.9
4.3
2.4
——
2.83
4.54
Sedi
men
t tox
icity
test
, 10-
day
surv
ival
, C
hiro
nom
us d
ilutu
s (in
per
cent
)—
87.5
87.5
—83
.881
.385
.095
.097
.591
.391
.398
.886
.3—
—83
.897
.5
Sedi
men
t tox
icity
test
, 10-
day
grow
th,
Chi
rono
mus
dilu
tus,
mea
n as
h-fr
ee d
ry
wt.
(mm
)
—1.
10.
9—
0.5
0.3
0.4
0.3
0.4
0.5
1.0
1.0
0.3
——
0.27
1.01
In si
tu p
ore
wat
er to
xici
ty te
st, 9
6-ho
ur
surv
ival
, Hya
lella
azt
eca
(in p
erce
nt)
—10
00
—70
9510
095
100
100
9070
65—
—65
60
In si
tu p
ore
wat
er to
xici
ty te
st, 9
6-ho
ur su
r-vi
val,
Chi
rono
mus
dilu
tus (
in p
erce
nt)
—60
80—
100
100
100
100
100
9010
010
010
0—
—10
010
0
DTH
abu
ndan
ce (c
olle
cted
200
7)—
—0
—12
2915
3012
167
171
256
60—
—68
378
DTH
rich
ness
(col
lect
ed 2
007)
——
0—
911
410
2424
2932
17—
—18
45Su
mm
ary
asse
ssm
ent b
ased
on
sedi
men
t-qu
ality
indi
cato
rsgo
odim
-pa
cted
un-
certa
inim
-pa
cted
im-
pact
edim
-pa
cted
im-
pact
edun
- ce
rtain
un-
certa
ingo
odgo
odim
-pa
cted
un-
certa
inun
- ce
rtain
un-
certa
ingo
od
a Haz
ard
quot
ient
s > 1
indi
cate
con
cent
ratio
n ab
ove
envi
ronm
enta
l crit
eria
.b Su
m o
f the
haz
ard
quot
ient
s for
Cu,
Cd,
Ni,
Pb, a
nd Z
n.c C
ritic
al B
ody
Res
idue
val
ue fo
r sal
mon
ids f
or C
u is
2.4
µg/
g w
et w
eigh
t.d <1
30: t
oxic
ity u
nlik
ely;
130
–3,0
00: u
ncer
tain
; >3,
000
prob
able
toxi
city
. (∑
SEM
-AV
S)/fo
c is
the
diffe
renc
e be
twee
n ∑
SEM
(sim
ulta
neou
sly
extra
cted
met
als)
and
AV
S (a
cid
vola
tile
sulfi
de),
norm
aliz
ed to
the
frac
tion
of o
rgan
ic c
arbo
n (O
C) o
n a
mas
s bas
is.
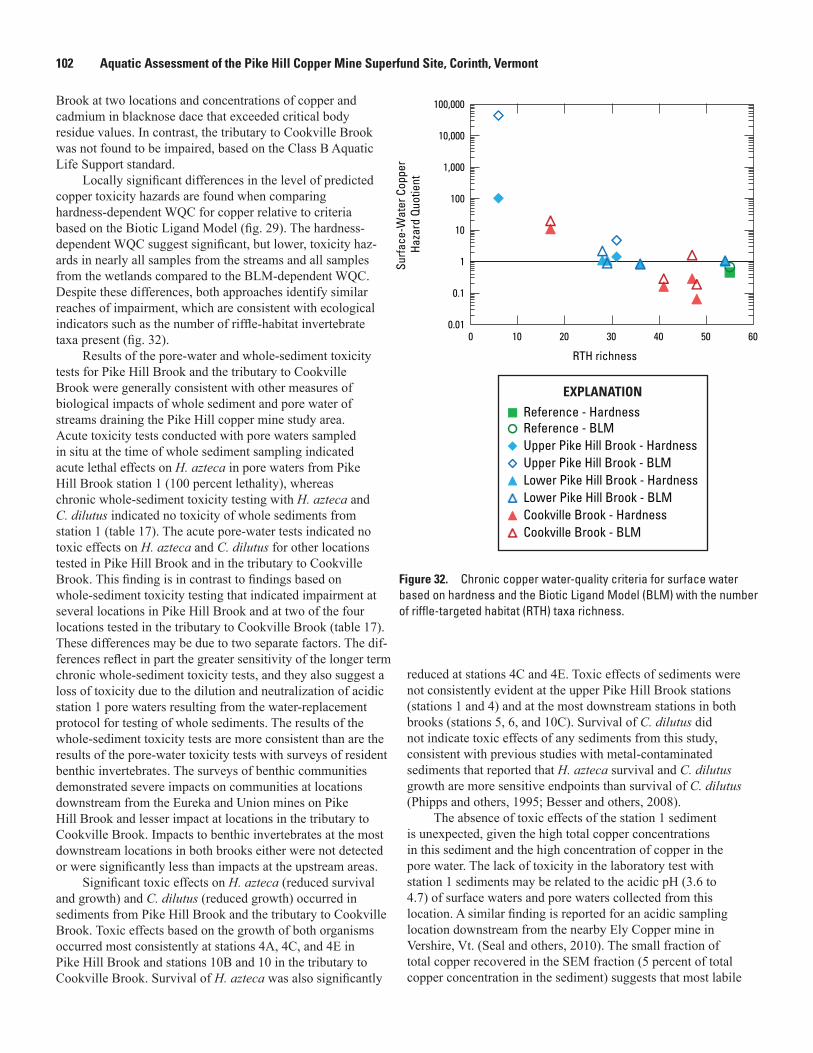
102 Aquatic Assessment of the Pike Hill Copper Mine Superfund Site, Corinth, Vermont
Brook at two locations and concentrations of copper and cadmium in blacknose dace that exceeded critical body residue values. In contrast, the tributary to Cookville Brook was not found to be impaired, based on the Class B Aquatic Life Support standard.
Locally significant differences in the level of predicted copper toxicity hazards are found when comparing hardness-dependent WQC for copper relative to criteria based on the Biotic Ligand Model (fig. 29). The hardness-dependent WQC suggest significant, but lower, toxicity haz-ards in nearly all samples from the streams and all samples from the wetlands compared to the BLM-dependent WQC. Despite these differences, both approaches identify similar reaches of impairment, which are consistent with ecological indicators such as the number of riffle-habitat invertebrate taxa present (fig. 32).
Results of the pore-water and whole-sediment toxicity tests for Pike Hill Brook and the tributary to Cookville Brook were generally consistent with other measures of biological impacts of whole sediment and pore water of streams draining the Pike Hill copper mine study area. Acute toxicity tests conducted with pore waters sampled in situ at the time of whole sediment sampling indicated acute lethal effects on H. azteca in pore waters from Pike Hill Brook station 1 (100 percent lethality), whereas chronic whole-sediment toxicity testing with H. azteca and C. dilutus indicated no toxicity of whole sediments from station 1 (table 17). The acute pore-water tests indicated no toxic effects on H. azteca and C. dilutus for other locations tested in Pike Hill Brook and in the tributary to Cookville Brook. This finding is in contrast to findings based on whole-sediment toxicity testing that indicated impairment at several locations in Pike Hill Brook and at two of the four locations tested in the tributary to Cookville Brook (table 17). These differences may be due to two separate factors. The dif-ferences reflect in part the greater sensitivity of the longer term chronic whole-sediment toxicity tests, and they also suggest a loss of toxicity due to the dilution and neutralization of acidic station 1 pore waters resulting from the water-replacement protocol for testing of whole sediments. The results of the whole-sediment toxicity tests are more consistent than are the results of the pore-water toxicity tests with surveys of resident benthic invertebrates. The surveys of benthic communities demonstrated severe impacts on communities at locations downstream from the Eureka and Union mines on Pike Hill Brook and lesser impact at locations in the tributary to Cookville Brook. Impacts to benthic invertebrates at the most downstream locations in both brooks either were not detected or were significantly less than impacts at the upstream areas.
Significant toxic effects on H. azteca (reduced survival and growth) and C. dilutus (reduced growth) occurred in sediments from Pike Hill Brook and the tributary to Cookville Brook. Toxic effects based on the growth of both organisms occurred most consistently at stations 4A, 4C, and 4E in Pike Hill Brook and stations 10B and 10 in the tributary to Cookville Brook. Survival of H. azteca was also significantly
0.01
0.1
1
10
100
1,000
10,000
100,000
0 10 20 30 40 50 60
Surfa
ce-W
ater
Cop
per
Haza
rd Q
uotie
nt
RTH richness
Reference - HardnessReference - BLMUpper Pike Hill Brook - HardnessUpper Pike Hill Brook - BLMLower Pike Hill Brook - HardnessLower Pike Hill Brook - BLMCookville Brook - HardnessCookville Brook - BLM
EXPLANATION
Figure 32.
Figure 32. Chronic copper water-quality criteria for surface water based on hardness and the Biotic Ligand Model (BLM) with the number of riffle-targeted habitat (RTH) taxa richness.
reduced at stations 4C and 4E. Toxic effects of sediments were not consistently evident at the upper Pike Hill Brook stations (stations 1 and 4) and at the most downstream stations in both brooks (stations 5, 6, and 10C). Survival of C. dilutus did not indicate toxic effects of any sediments from this study, consistent with previous studies with metal-contaminated sediments that reported that H. azteca survival and C. dilutus growth are more sensitive endpoints than survival of C. dilutus (Phipps and others, 1995; Besser and others, 2008).
The absence of toxic effects of the station 1 sediment is unexpected, given the high total copper concentrations in this sediment and the high concentration of copper in the pore water. The lack of toxicity in the laboratory test with station 1 sediments may be related to the acidic pH (3.6 to 4.7) of surface waters and pore waters collected from this location. A similar finding is reported for an acidic sampling location downstream from the nearby Ely Copper mine in Vershire, Vt. (Seal and others, 2010). The small fraction of total copper recovered in the SEM fraction (5 percent of total copper concentration in the sediment) suggests that most labile
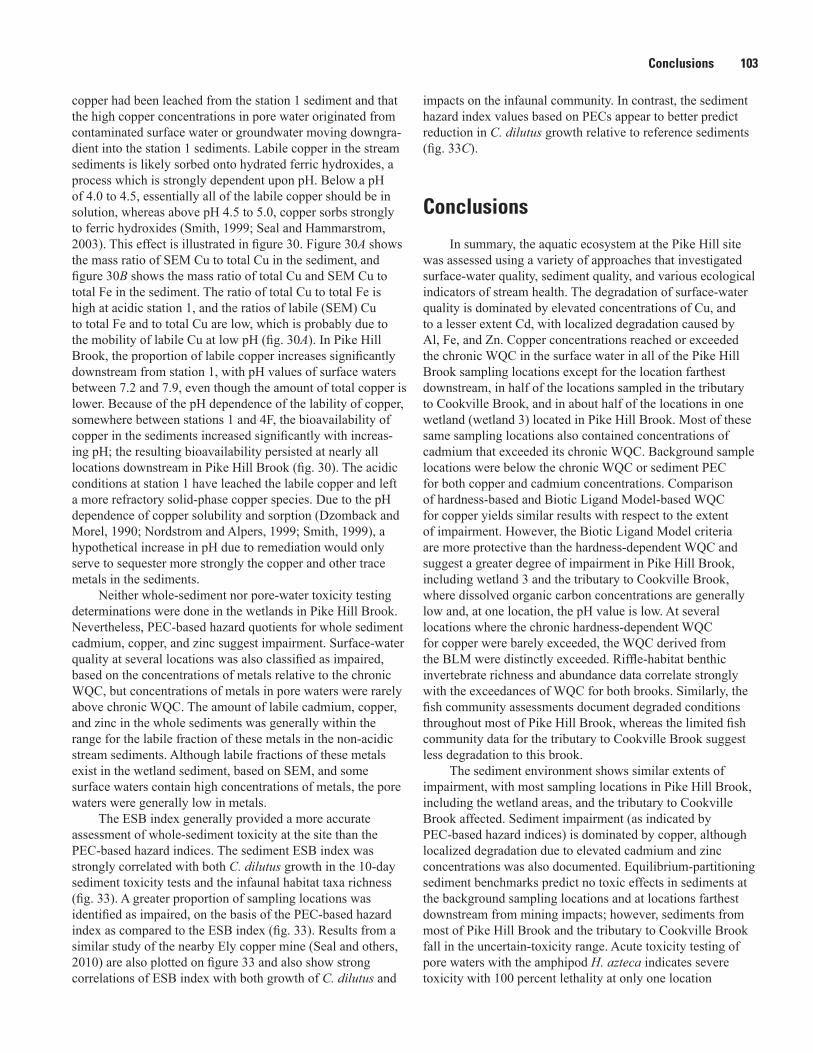
Conclusions 103
copper had been leached from the station 1 sediment and that the high copper concentrations in pore water originated from contaminated surface water or groundwater moving downgra-dient into the station 1 sediments. Labile copper in the stream sediments is likely sorbed onto hydrated ferric hydroxides, a process which is strongly dependent upon pH. Below a pH of 4.0 to 4.5, essentially all of the labile copper should be in solution, whereas above pH 4.5 to 5.0, copper sorbs strongly to ferric hydroxides (Smith, 1999; Seal and Hammarstrom, 2003). This effect is illustrated in figure 30. Figure 30A shows the mass ratio of SEM Cu to total Cu in the sediment, and figure 30B shows the mass ratio of total Cu and SEM Cu to total Fe in the sediment. The ratio of total Cu to total Fe is high at acidic station 1, and the ratios of labile (SEM) Cu to total Fe and to total Cu are low, which is probably due to the mobility of labile Cu at low pH (fig. 30A). In Pike Hill Brook, the proportion of labile copper increases significantly downstream from station 1, with pH values of surface waters between 7.2 and 7.9, even though the amount of total copper is lower. Because of the pH dependence of the lability of copper, somewhere between stations 1 and 4F, the bioavailability of copper in the sediments increased significantly with increas-ing pH; the resulting bioavailability persisted at nearly all locations downstream in Pike Hill Brook (fig. 30). The acidic conditions at station 1 have leached the labile copper and left a more refractory solid-phase copper species. Due to the pH dependence of copper solubility and sorption (Dzomback and Morel, 1990; Nordstrom and Alpers, 1999; Smith, 1999), a hypothetical increase in pH due to remediation would only serve to sequester more strongly the copper and other trace metals in the sediments.
Neither whole-sediment nor pore-water toxicity testing determinations were done in the wetlands in Pike Hill Brook. Nevertheless, PEC-based hazard quotients for whole sediment cadmium, copper, and zinc suggest impairment. Surface-water quality at several locations was also classified as impaired, based on the concentrations of metals relative to the chronic WQC, but concentrations of metals in pore waters were rarely above chronic WQC. The amount of labile cadmium, copper, and zinc in the whole sediments was generally within the range for the labile fraction of these metals in the non-acidic stream sediments. Although labile fractions of these metals exist in the wetland sediment, based on SEM, and some surface waters contain high concentrations of metals, the pore waters were generally low in metals.
The ESB index generally provided a more accurate assessment of whole-sediment toxicity at the site than the PEC-based hazard indices. The sediment ESB index was strongly correlated with both C. dilutus growth in the 10-day sediment toxicity tests and the infaunal habitat taxa richness (fig. 33). A greater proportion of sampling locations was identified as impaired, on the basis of the PEC-based hazard index as compared to the ESB index (fig. 33). Results from a similar study of the nearby Ely copper mine (Seal and others, 2010) are also plotted on figure 33 and also show strong correlations of ESB index with both growth of C. dilutus and
impacts on the infaunal community. In contrast, the sediment hazard index values based on PECs appear to better predict reduction in C. dilutus growth relative to reference sediments (fig. 33C).
Conclusions
In summary, the aquatic ecosystem at the Pike Hill site was assessed using a variety of approaches that investigated surface-water quality, sediment quality, and various ecological indicators of stream health. The degradation of surface-water quality is dominated by elevated concentrations of Cu, and to a lesser extent Cd, with localized degradation caused by Al, Fe, and Zn. Copper concentrations reached or exceeded the chronic WQC in the surface water in all of the Pike Hill Brook sampling locations except for the location farthest downstream, in half of the locations sampled in the tributary to Cookville Brook, and in about half of the locations in one wetland (wetland 3) located in Pike Hill Brook. Most of these same sampling locations also contained concentrations of cadmium that exceeded its chronic WQC. Background sample locations were below the chronic WQC or sediment PEC for both copper and cadmium concentrations. Comparison of hardness-based and Biotic Ligand Model-based WQC for copper yields similar results with respect to the extent of impairment. However, the Biotic Ligand Model criteria are more protective than the hardness-dependent WQC and suggest a greater degree of impairment in Pike Hill Brook, including wetland 3 and the tributary to Cookville Brook, where dissolved organic carbon concentrations are generally low and, at one location, the pH value is low. At several locations where the chronic hardness-dependent WQC for copper were barely exceeded, the WQC derived from the BLM were distinctly exceeded. Riffle-habitat benthic invertebrate richness and abundance data correlate strongly with the exceedances of WQC for both brooks. Similarly, the fish community assessments document degraded conditions throughout most of Pike Hill Brook, whereas the limited fish community data for the tributary to Cookville Brook suggest less degradation to this brook.
The sediment environment shows similar extents of impairment, with most sampling locations in Pike Hill Brook, including the wetland areas, and the tributary to Cookville Brook affected. Sediment impairment (as indicated by PEC-based hazard indices) is dominated by copper, although localized degradation due to elevated cadmium and zinc concentrations was also documented. Equilibrium-partitioning sediment benchmarks predict no toxic effects in sediments at the background sampling locations and at locations farthest downstream from mining impacts; however, sediments from most of Pike Hill Brook and the tributary to Cookville Brook fall in the uncertain-toxicity range. Acute toxicity testing of pore waters with the amphipod H. azteca indicates severe toxicity with 100 percent lethality at only one location
104 Aquatic Assessment of the Pike Hill Copper Mine Superfund Site, Corinth, Vermont
-1,000 1,000 3,000 5,000 7,000
C. d
ilutu
s gr
owth
, in
mill
igra
ms
ESB Index, in micromoles per gram of organic carbon
0
10
20
30
40
50
-1,000 1,000 3,000 5,000 7,000
DTH
taxa
rich
ness
0.1 1.0 10 100
Sediment PEC Hazard Index
0
10
20
30
40
50
0.1 1.0 10 100
DTH
taxa
rich
ness
Sediment PEC Hazard Index
A B
C D
predicted toxicity
uncertain toxicity
no toxicity
predicted toxicity
uncertain toxicity
no toxicity
ESB Index, in micromoles per gram of organic carbon
0.0
0.2
0.4
0.6
0.8
1.0
1.2
1.4
1.6
1.8
2.0
0
0.2
0.4
0.6
0.8
1
1.2
1.4
1.6
1.8
2
Figure 33.
Pike Hill study referenceUpper Pike Hill BrookLower Pike Hill BrookTributary to Cookville BrookEly mine study referenceEly mine study stream sites
EXPLANATION
Figure 33. Comparison of two sediment-quality hazard indices with two measures of sediment toxicity. The variation of (A) Chironomus dilutus average growth (expressed as ash-free dry weight) and (B) depositional targeted habitat (DTH) taxa richness with the equilibrium-partitioning sediment benchmark (ESB) index. The boundaries between ESB ranges for predicted no toxicity, uncertain toxicity, and toxicity are from USEPA (2005). Also shown is the variation of (C) C. dilutus growth and (D) depositional targeted habitat (DTH) taxa richness with the sediment hazard indices based on the sum of the hazard quotients of Cd, Cu, Ni, Pb, and Zn relative to the probable effects concentrations (PEC) from McDonald and others (2000). Data from this study and from a similar study of the nearby Ely copper mine in Vershire, Vermont (Seal and others 2010), are shown.
Selected References 105
(station 1), the station most impacted by acidic mine drainage; pore waters from all other stations were not acutely toxic. In contrast, whole-sediment chronic toxicity testing with both H. azteca and the midge C. dilutus indicated toxicity at several locations in the lower reach of Pike Hill Brook and at two locations in the tributary to Cookville Brook. Station 1 was not toxic in whole-sediment toxicity testing, likely due to the low lability of copper in that sediment, as indicated by a low proportion of extractable copper (5 percent). Toxicity testing was not conducted on the wetland waters or sediments. Depositional habitat invertebrate richness and abundance data generally agree with the extent of impact in the watersheds estimated, based on whole-sediment and pore-water hazard indices and toxicity tests.
In general, degraded surface-water quality, particularly from copper and, to a lesser extent, from cadmium, appears to be the dominant cause of toxicity at the site. Sediment quality is less uniformly impacted; however, copper is also the dominant contaminant of concern in this medium.
AcknowledgmentsAnn Chalmers (USGS), James Degnan (USGS), Bart
Hoskins (USEPA), Ken Munney (U.S. Fish and Wildlife Service, USFWS), and Xiaochun Xu (USGS) assisted with the field sampling program. Monique Adams, Todor Todorov, and Michael Anthony, all of the USGS, performed many of the water analyses. Larry Gough (USGS) identified the plants collected in the wetlands. Natalia Ainsfield (USGS) assisted in drafting figures and tables and proofing the manuscript. The project benefited from discussions with Edward Hathaway and Bart Hoskins of the USEPA, Linda Elliot, Steven Fiske, Richard Langdon, and John Schmeltzer of the Vermont Department of Environmental Conservation, Matt Kierstead (Public Archaeology Laboratory), Jason Clere (URS Corpora-tion), and Stan Pauwels (TechLaw, Inc.). The manuscript benefited from reviews by Edward Hathaway (USEPA) and Ken Munney (USFWS). The project was funded by USEPA (Region 1) and the Mineral Resources Program of the USGS.
Selected References
Abbott, Collamer, 1973, Green Mountain copper: The story of Vermont’s red metal: Thetford, Vt., Thetford Historical Society, 36 p.
American Society for Testing and Materials (ASTM), 2010, ASTM E1706-05 Standard test method for measuring the toxicity of sediment-associated contaminants with freshwa-ter invertebrates: Annual Book of ASTM Standards Volume 11.06, West Conshohocken, Pa., ASTM International, 118 p.
Arcement, G.J., Jr., and Schneider, V.R., 1989, Guide for selecting Manning’s roughness coefficients for natural chan-nels and flood plains: U.S. Geological Survey Water-Supply Paper 2339, 38 p.
Argue, D.M., Kiah, R.G., Piatak, N.M., Seal, R.R., II, Ham-marstrom, J.M., Hathaway, Edward, and Coles, J.F., 2008, Selected water- and sediment-quality, aquatic biology, and mine-waste data from the Ely Copper Mine Superfund site, Vershire, VT, 1998–2007: U.S. Geological Survey Data Series 378, available online only at http://pubs.usgs.gov/ds/378/.
Benoit, D., Leonard, E., Christensen, G., and Fiandt, J., 1976, Toxic effects of cadmium on three generations of brook trout (Salvelinus fontinalis): Transactions of the American Fisheries Society, v. 105, p. 550–560.
Besser, J.M., Brumbaugh, W.G., Ivey, C.D., Ingersoll, C., and Moran, P.W., 2008, Biological and chemical charac-terization of metal bioavailability in sediments from Lake Roosevelt, Columbia River, Washington, USA: Archives of Environmental Contamination and Toxicology, v. 54, no. 4, p. 557–570.
Brown, V., Shruben, D., Miller, W., and Crane, M., 1994, Cadmium toxicity to rainbow trout Oncorhynchus mykiss Walbaum and brown trout Salmo trutta L. over extended exposure periods: Ecotoxicology and Environmental Safety, v. 29, p. 38–46.
Brumbaugh, W.G., May, T.W., Besser, J.M., Allert, A.L., and Schmitt, C.J., 2007, Assessment of elemental concentrations in streams of the New Lead Belt in southeastern Missouri, 2002–05: U.S. Geological Survey Scientific Investigations Report 2007–5057, 57 p., available at http://pubs.usgs.gov/sir/2007/5057/.
Buchanan, T.J., and Somers, W.P., 1969, Discharge measure-ments at gaging stations: U.S. Geological Survey Tech-niques of Water-Resources Investigations, book 3, chap. A8, 65 p.
Buerger, N.W., 1935, The copper ores of Orange County, Ver-mont: Economic Geology, v. 30, no. 4, p. 434–443.
Calamari, D., Gaggino, G., and Pacchetti, G., 1982, Toxicoki-netics of low level of Cd, Cr, Ni and their mixture in long-term treatment of Salmo gairdneri Rich.: Chemosphere, v. 11, p. 59–70.
Conover, W.J., and Iman, R.L., 1981, Rank transformations as a bridge between parametric and nonparametric statistics: The American Statistician, v. 35, no. 3, p. 124–129.
Crawford, J.K., and Luoma, S.N., 1993, Guidelines for studies of contaminants in biological tissues for the National Water-Quality Assessment Program: U.S. Geological Survey Open-File Report 92–494, 69 p.
106 Aquatic Assessment of the Pike Hill Copper Mine Superfund Site, Corinth, Vermont
Di Toro, D.M., Allen, H., Bergman, H., Meyer, J., Paquin, P., and Santore, R., 2001, A biotic ligand model of the acute toxicity of metals; I. Technical basis: Environmental Toxi-cology and Chemistry, v. 20, no. 10, p. 2383–2396.
Di Toro, D.M., McGrath, J.M., Hansen, D.J., Berry, W.J., Paquin, P.R., Mathew, R., Wu, K.B., and Santore, R.C., 2005, Predicting sediment metal toxicity using a sediment biotic ligand model: Methodology and initial application: Environmental Toxicology and Chemistry, v. 24, no. 10, p. 2410–2427.
Dzombak, D.A., and Morel, F.M.M., 1990, Surface complex-ation modeling: Hydrous ferric oxide: New York, John Wiley and Sons, 393 p.
ESRI, 2009, USA Topo Maps, scale range 1:591,657,528 to 1:18,056, accessed August 23, 2012, at http://www.esri.com/software/arcgis/arcgis-online-map-and-geoservices/ map-services.
Farmer, G.J., Ashfield, D., and Samant, H.S., 1979, Effects of zinc on juvenile Atlantic salmon Salmo salar: Acute toxic-ity, food intake, growth and bioaccumulation: Environmen-tal Pollution, v. 19, p. 103–117.
Fitzpatrick, F.A., Waite, I.R., D’Arconte, P.J., Meador, M.R., Maupin, M.A., and Gurtz, M.E., 1998, Revised methods for characterizing stream habitat in the National Water-Quality Assessment Program: U.S. Geological Survey Water-Resources Investigations Report 98–4052, 67 p.
Fuller, C.C., and Harvey, J.W., 2000, Reactive uptake of trace metals in the hyporheic zone of a mining-contaminated stream, Pinal Creek, Arizona: Environmental Science and Technology, v. 34, no. 7, p. 1150–1155.
Gough, L.P., Shacklette, H.T., and Case, A.A., 1979, Element concentrations toxic to plants, animals, and man: U.S. Geo-logical Survey Bulletin 1466, 80 p.
Hamilton, S.J., Mehrle, P.M., and Jones, J.R., 1987a, Cadmium-saturation technique for measuring metallothio-nein in brook trout: Transactions of the American Fisheries Society, v. 116, p. 541–550.
Hamilton, S.J., Mehrle, P.M., and Jones, J.R., 1987b, Evalu-ation of metallothionein as a biological indicator of stress from cadmium in brook trout: Transactions of the American Fisheries Society, v. 116, p. 551–560.
Hammarstrom, J.M., Seal, R.R., II, Ouimette, A.P., and Foster, S.A., 2001, Sources of metals and acidity at the Elizabeth and Ely mines: Geochemistry and mineralogy of solid mine waste and the role of secondary minerals in metal recycling, in Hammarstrom, J.M., and Seal, R.R., II, eds., Environ-mental geochemistry and mining history of massive sulfide deposits in the Vermont Copper Belt: Society of Economic Geologists Guidebook Series, v. 35, p. 213–248.
Handy, R.D., 1992, The assessment of episodic metal pollu-tion. I. Uses and limitations of tissue contaminant analysis in rainbow trout (Oncorhynchus mykiss) after short water-borne exposure to cadmium or copper: Archives of Environ-mental Contamination and Toxicology, v. 22, p. 74–81.
Hansen, J.A., Welsh, P.,G., Lipton, J., and Cacela, D., 2002, Effects of copper exposure on growth and survival of juvenile bull trout: Transactions of the American Fisheries Society, v. 131, no. 4, p. 690–697.
Harvey, J.W., and Fuller, C.C., 1998, Effect of enhanced manganese oxidation in the hyporheic zone on basin-scale geochemical mass balance: Water Resources Research, v. 34, no. 4, p. 623–636.
Helsel, D.R., 2005, Nondetects and data analysis: Statistics for censored environmental data: New York, John Wiley and Sons, 268 p.
Helsel, D.R., and Hirsch, R.M., 1992, Statistical methods in water resources: New York, Elsevier Science Publishers, 522 p.
Holcombe, G.W., Benoit, D.A., and Leonard, E.N., 1979, Long-term effects of zinc exposures on Brook trout (Salve-linus fontinalis): Transactions of the American Fisheries Society, v. 108, p. 76–87.
Ingersoll, C.G., Brunson, E.L., Dwyer, F.J., Hardesty, D.K., and Kemble, N.E., 1998, Use of sublethal endpoints in sediment toxicity tests with the amphipod Hyalella azteca: Environmental Toxicology and Chemistry, v. 17, p. 1508–1523.
Kamunde, C.N., Niyogi, S., and Wood, C.M., 2005, Interac-tion of dietary sodium chloride and waterborne copper in rainbow trout (Oncorhynchus mykiss); copper toxicity and sodium and chloride homeostasis: Canadian Journal of Fish-eries and Aquatic Sciences, v. 62, no. 2, p. 390–399.
Kiah, R.G., Deacon, J.R., Piatak, N.M., Seal, R.R., II, Coles, J.F., and Hammarstrom, J.M., 2007, Surface-water hydrol-ogy and quality at the Pike Hill Superfund Site, Corinth, Vermont, October 2004 to December 2005: U.S. Geological Survey Scientific Investigations Report 2007–5003, 61 p., available at http://pubs.usgs.gov/sir/2007/5003/.
Kierstead, M.A., 2001, History and historical resources of the Vermont Copper Belt, in Hammarstrom, J.M., and Seal, R.R., II, eds., Environmental geochemistry and mining his-tory of massive sulfide deposits in the Vermont Copper Belt: Society of Economic Geologists Guidebook Series, v. 35, p. 165–191.
Kilpatrick, F.A., and Schneider, V.R., 1983, Use of flumes in measuring discharge: U.S. Geological Survey Techniques of Water-Resources Investigations, book 3, chap. A14, 46 p.
Selected References 107
Kumada, H., Kimura, S., Yokote, M., and Matida, Y., 1973, Acute and chronic toxicity, uptake and retention of cad-mium in freshwater organisms: Bulletin of Freshwater Fisheries Research Laboratory (Tokyo), v. 22, p. 157–165.
Lamothe, P.J., Meier, A.L., and Wilson, S.A., 2002, The determination of forty-four elements in aqueous sample by inductively coupled plasma—mass spectrometry, chap. H of Taggart, J.E., Jr., ed., Analytical methods for chemical analysis of geologic and other materials, U.S. Geological Survey: U.S. Geological Survey Open-File Report 02–0223, available at http://pubs.usgs.gov/of/2002/ofr-02-0223/.
Long, E.R., and Chapman, P.M., 1985, A sediment quality triad: Measures of sediment contamination, toxicity and infaunal community composition in Puget Sound: Marine Pollution Bulletin, v. 16, no. 10, p. 405–415.
MacDonald, D.D., Ingersoll, C.G., and Berger, T.A., 2000, Development and evaluation of consensus-based sediment quality guidelines for freshwater ecosystems: Archives of Environmental Contamination and Toxicology, v. 39, no.1, p. 20–31.
Moulton, S.R., Kennan, J.G., Goldstein, R.M., and Hambrook, J.A., 2002, Revised protocols for sampling algal, inverte-brate, and fish communities as part of the National Water-Quality Assessment Program: U.S. Geological Survey Open-File Report 02–150, 75 p.
Nobis Engineering, Inc. (Nobis), 2008, Draft conceptual site model technical memorandum Pike Hill Copper Mine Superfund Site, Corinth, Vermont: Remedial Investigation/Feasibility Study: EPA Task Order No. 0025–RI–CO–017J, Remedial action contract No. EP–S1–06–03.
Nordstrom, D.K., and Alpers, C.N., 1999, Geochemistry of acid mine waters, chap. 6, in Plumlee, G.S., and Logsdon, M.J. eds., The environmental geochemistry of mineral deposits, Part A. Processes, techniques, and health issues: Reviews in Economic Geology, 6A, p. 133–160.
Olson, S.A., Flynn, R.H., Johnston, C.M., and Tasker, G.D., 2005, The New Hampshire watershed tool: A geographic information system tool to estimate statistics and ground-water-recharge rates: U.S. Geological Survey Open-File Report 2005–1172, 20 p.
Paquin, P.R., Gorsuch, J.W., Apte, Simon, Batley, G.E., Bowles, K.C., Campbell, P.G.C., Delos, C.G., Di Toro, D.M., Dwyer, R.L., Galvez, Fernando, Gensemer, R.W., Goss, G.G., Hogstrand, Christer, Janssen, C.R., McGeer, J.C., Naddy, R.B., Playle, R.C., Santore, R.C., Schneider, Uwe, Stubblefield, W.A., Wood, C.M., and Wu, K.B., 2002, The biotic ligand model: A historical overview: Compara-tive Biochemistry and Physiology, v. 133, no. 1–2, p. 3–35.
Pascoe, D., Evans, S., and Woodworth, J., 1986, Heavy metal toxicity to fish and the influence of water hardness: Archives of Environmental Contamination and Toxicology, v. 15, p. 481–487.
Phipps, G.L., Mattson, V.R., and Ankley, G.T., 1995, Relative sensitivity of three freshwater benthic macroinvertebrates to ten contaminants: Archives of Environmental Contamina-tion and Toxicology, v. 28, no. 3, p. 281–286.
Piatak, N.M., Hammarstrom, J.M., and Seal, R.R., II, 2006a, Geochemical characterization of mine waste from the Pike Hill Superfund Site in Vermont, USA: ICARD 2006, Proceedings from the Seventh International Conference on Acid Rock Drainage, p. 1583–1602.
Piatak, N.M., Seal, R.R., II, Hammarstrom, J.M., Kiah, R.G., Deacon, J.R., Adams, Monique, Anthony, M.W., Briggs, P.H., and Jackson, J.C., 2006b, Geochemical characteriza-tion of mine waste, mine drainage, and stream sediments at the Pike Hill Copper Mine Superfund Site, Orange County, Vermont: U.S. Geological Survey Scientific Investigations Report 2006–5303, 131 p., available at http://pubs.usgs.gov/sir/2006/5303/.
Piatak, N.M., Seal, R.R., II, Sanzolone, R.F., Lamothe, P.J., and Brown, Z.A., 2006c, Preliminary results of sequential extraction experiments for selenium on mine waste and stream sediments from Vermont, Maine, and New Zealand: U.S. Geological Survey Open-File Report 2006–1184, 25 p., available online only at http://pubs.usgs.gov/of/2006/1184/.
Power, M.S., and Milton, N.M., 1990, Detection of geobotani-cal anomalies associated with mineralization in the Glens Falls 1° x 2° quadrangle, chap. I in Slack, J.F., ed., Sum-mary results of the Glens Falls CUSMAP project, New York, Vermont, and New Hampshire: U.S. Geological Sur-vey Bulletin 1887, p. I1–I8, available at http://pubs.er.usgs.gov/usgspubs/b/b1887.
Public Archaeological Laboratory (PAL), 2007, Draft historic/archaeological mapping and testing, Pike Hill Mines Site (VT–OR–27): Pawtucket, R.I., Public Archaeological Labo-ratory, October 2007.
Rantz, S.E., and others, 1982, Measurement and computation of streamflow, volume 1: Measurement of stage and dis-charge: U.S. Geological Survey Water-Supply Paper 2175, 284 p.
Reichman, S.M., 2002, The responses of plants to metal toxicity; a review focusing on copper, manganese, and zinc: Australian Minerals and Energy Environment Foundation, Occasional Paper No. 14, 54 p.
Rombough, P.J., and Garside, E.T., 1982, Cadmium toxicity and accumulation in eggs and alevins of Atlantic salmon, Salmo salar: Canadian Journal of Zoology, v. 60, p. 2006–2014.
108 Aquatic Assessment of the Pike Hill Copper Mine Superfund Site, Corinth, Vermont
Sangalang, G.B., and Freeman, H.C., 1979, Tissue uptake of cadmium in brook trout during chronic sublethal exposure: Archives of Environmental Contamination and Toxicology, v. 8, p. 77–84.
SAS Institute Inc., 1999, Statview user’s guide, version 5: Cary, N.C., SAS Institute Inc.
SAS Institute Inc., 2002, SAS/STAT user’s guide, version 8.02: Cary, N.C., SAS Institute Inc.
SAS Institute Inc., 2008, SAS OnlineDoc® 9.1.3: Cary, N.C., SAS Institute Inc.
Sauer, V.B., and Meyer, R.W., 1992, Determination of error in individual discharge measurements: U.S. Geological Survey Open-File Report 92–144, 21 p.
Seal, R.R., II, and Hammarstrom, J.M., 2003, Geoenviron-mental models of mineral deposits: Examples from massive sulfide and gold deposits, in Jambor, J.L., Blowes, D.W., and Ritchie, A.I.M., eds., Environmental aspects of mine wastes: Mineralogical Association of Canada Short Series, v. 31, p. 11–50.
Seal, R.R., II, Kiah, R.G., Piatak, N.M., Besser, J.M., Coles, J.F., Hammarstrom, J.M., Argue, D.M., Levitan, D.M., Deacon, J.R., and Ingersoll, C.G., 2010, Aquatic assess-ment of the Ely Copper Mine Superfund Site, Vershire, Vermont: U.S. Geological Survey Scientific Investigations Report 2010–5084, 150 p., available at http://pubs.usgs.gov/sir/2010/5084/pdf/2010-5084.pdf.
Seal, R.R., II, Kornfeld, J.M., Meier, A.L., and Hammarstrom, J.M., 2001, Geochemical settings of mine drainage in the Vermont Copper Belt, in Hammarstrom, J.M., and Seal, R.R., II, eds., Environmental geochemistry and mining his-tory of massive sulfide deposits in the Vermont Copper Belt: Society of Economic Geologists Guidebook Series, v. 35, p. 255–276.
Shelton, L.R., and Capel, P.D., 1994, Guidelines for collecting and processing samples of stream bed sediment for analysis of trace elements and organic contaminants for the National Water-Quality Assessment Program: U.S. Geological Sur-vey Open-File Report 94–0458, 20 p., available at http://pubs.er.usgs.gov/publication/ofr94458.
Slack, J.F., Atelsek, P.J., and Whitlow, J.W., 1990, Geochem-istry of stream sediments and heavy-mineral concentrates from the Orange County copper district, east-central Vermont, chap. Q, in Slack, J.F., ed., Summary results of the Glens Falls CUSMAP project, New York, Vermont, and New Hampshire: U.S. Geological Survey Bulletin 1887, p. Q1–Q21, available at http://pubs.er.usgs.gov/usgspubs/b/b1887.
Slack, J.F., Offield, T.W., Shanks, W.C., III, and Woodruff, L.G., 1993, Besshi-type massive sulfide deposits of the Vermont Copper Belt, in Slack, J.F., and Offield, T.W., eds., Besshi-type massive sulfide deposits of the Vermont Copper Belt: Society of Economic Geologists Field Trip Guidebook Series, v. 17, p. 32–73.
Slack, J.F., Offield, T.W., Woodruff, L.G., and Shanks, W.C., III, 2001, Geology and geochemistry of Besshi-type massive sulfide deposits of the Vermont Copper Belt, in Hammarstrom, J.M., and Seal, R.R., II, eds., Environmental geochemistry and mining history of massive sulfide deposits in the Vermont Copper Belt: Society of Economic Geolo-gists Field Trip Guidebook Series, v. 35, p. 193–211.
Slack, J.F., Whitlow, J.W., and Annis, M.P., 1984, Gold in stream sediments from the Orange County copper district, east-central Vermont: U.S. Geological Survey Open-File Report 84–889, 21 p., available at http://pubs.er.usgs.gov/usgspubs/ofr/ofr84889.
Smith, K.S., 1999, Metal sorption on mineral surfaces: An overview with examples relating to mineral deposits, chap. 7, in Plumlee, G.S., and Logsdon, M.J., eds., The environmental geochemistry of mineral deposits, Part A. Processes, techniques, and health issues: Reviews in Eco-nomic Geology, 6A, p. 161–182.
Spahr, N.E., and Boulger, R.W., 1997, Interim results of quality-control sampling of surface water for the upper Colorado River National Water-Quality Assessment Study Unit, water years 1995–96: U.S. Geological Survey Water-Resources Investigations Report 97–4227, 34 p.
Suter, G.W., II, 1996, Toxicological benchmarks for screening contaminants of potential concern for effects on freshwa-ter biota: Environmental Toxicology and Chemistry, v. 15, no. 7, p. 1232–1241.
Taggart, J.E., Jr., ed., 2002, Analytical methods for chemical analysis of geologic and other materials, U.S. Geological Survey: U.S. Geological Survey Open-File Report 2002–223 [variously paged], available at http://pubs.usgs.gov/of/2002/ofr-02-0223/OFR-02-0223.pdf.
Taylor, J.C., and Clapp, R.A., 1992, New features and advanced applications of Siroquant—A personal computer XRD full profile quantitative analysis software package: Advances in X-ray Analysis, v. 35, p. 49–55.
TechLaw, Inc., 2006, Toxicity testing results using surface-water samples collected from the Pike Hill Mine in Corinth, VT, and the Ely Mine in Vershire, VT: Environmental Ser-vices Assistance Team (ESAT) report submitted to the U.S. Environmental Protection Agency, Office of Environmental Measurement and Evaluation, August 10, 2006.
Selected References 109
TechLaw, Inc., 2008a, Toxicity testing results using sediment samples from Pike Hill Mine Corinth, Vermont: Environ-mental Services Assistance Team (ESAT) report submitted to the U.S. Environmental Protection Agency, Office of Environmental Measurement and Evaluation, January 17, 2008.
TechLaw, Inc., 2008b, Two-species, 96-hour, acute toxicity testing results using pore-water samples collected from the Pike Hill Mine in Corinth, VT: Environmental Services Assistance Team (ESAT) report submitted to the U.S. Environmental Protection Agency, Office of Environmental Measurement and Evaluation, January 17, 2008.
Tonkin, J.W., Balistrieri, L.S., and Murray, J.W., 2004, Model-ing sorption of divalent metal cations on hydrous manga-nese oxide using the diffuse double layer model: Applied Geochemistry, v. 19, no. 1, p. 29–53.
Totten, B., 1999, Analysis of iron oxide coating that have formed as a result of acid mine drainage from the Pike Hill copper mine in northeastern Vermont, in The Ver-mont Geological Society’s spring meeting, presentation of student papers: The Green Mountain Geologist, v. 26, no. 2, p. 13–14.
U.S. Environmental Protection Agency (USEPA), 1986, Guidelines for the health risk assessment of chemical mixtures: U.S. Environmental Protection Agency 630/R–98/002: Federal Register, v. 51, no. 185, p. 34014–34025.
U.S. Environmental Protection Agency (USEPA), 2000, Methods for measuring the toxicity and bioaccumulation of sediment-associated contaminants with freshwater inverte-brates (2d ed.): U.S. Environmental Protection Agency 600/R–99/064, 212 p.
U.S. Environmental Protection Agency, (USEPA) 2005, Procedures for the derivation of equilibrium partitioning sediment benchmarks (ESBs) for the protection of benthic organisms: Metal mixtures (cadmium copper, lead nickel, silver, and zinc): U.S. Environmental Protection Agency 600–R–O2–011 [variously paged].
U.S. Environmental Protection Agency (USEPA), 2007, Aquatic life ambient freshwater quality criteria—copper 2007 revision: U.S. Environmental Protection Agency 822–F–07–001, 49 p.
U.S. Environmental Protection Agency (USEPA), 2009, National recommended water quality criteria, accessed July 1, 2009, at http://www.epa.gov/waterscience/criteria/wqcriteria.html.
U.S. Environmental Protection Agency (USEPA), 2010, Pike Hill Copper Mine, online only at http://www.epa.gov/region1/superfund/sites/pikehill.
U.S. Geological Survey (USGS), 2006a, Annual water data reports: U.S. Geological Survey database, accessed May 25, 2011, at http://wdr.water.usgs.gov/.
U.S. Geological Survey (USGS), 2006b, Collection of water samples (ver. 2.0): U.S. Geological Survey Techniques of Water-Resources Investigations, book 9, chap. A4, available at http://pubs.water.usgs.gov/twri9A4/.
U.S. Geological Survey (USGS), 2011, Welcome to Stream-stats—State applications: U.S. Geological Survey, available at http://water.usgs.gov/osw/streamstats/ssonline.html.
Vermont Department of Environmental Conservation (VTDEC), 2004, Biocriteria for fish and macroinvertebrate assemblages in Vermont wadeable streams and rivers, April 2006, available at http://www.vtwaterquality.org/bass/docs/bs_wadeablestream2.pdf.
Vermont Department of Environmental Conservation (VTDEC), 2006, Water Quality Division field methods manual, available at http://www.anr.state.vt.us/dec/waterq/bass/docs/bs_fieldmethodsmanual.pdf.
Wheeler, H.A., 1883, The copper deposits of Vermont: School of Mines Quarterly, v. 4, no. 3, p. 219–224.
White, W.S., and Eric, J.H., 1944, Preliminary report on the geology of the Orange County copper district, Vermont: U.S. Geological Survey Open-File Report 44–19, 36 p.
Wiercinski, S., 1999, Geochemical and mineralogical analysis of the Pike Hill mine tailings, Corinth, Vermont, in The Vermont Geological Society’s spring meeting, presentation of student papers: The Green Mountain Geologist, v. 26, no. 2, p. 14–15.
Wilde, F.D., and Radtke, D.B., eds., 1998, Field measure-ments: U.S. Geological Survey Techniques of Water-Resources Investigations, book 9, chap. A6 [variously paged].
Wilde, F.D., Radtke, D.B., Gibs, J., and Iwatsubo, R.T., eds., 1999, Collection of water samples: U.S. Geological Survey Techniques of Water-Resources Investigations, book 9, chap. A4, 156 p.
Zimmerman, M.J., Massey, A.J., and Campo, K.W., 2005, Pushpoint sampling for defined spatial and temporal varia-tions in contaminant concentrations in sediment pore water near the ground water/surface water interface: U.S. Geo-logical Survey Scientific Investigations Report 2005–5036, 75 p.


Prepared by the Raleigh Publishing Service Center
For more information concerning this report contact
Nadine Piatak, Research GeologistU.S. Geological Survey12201 Sunrise Valley Drive, Mail Stop 954Reston, VA [email protected]

Piatak and others—A
quatic Assessm
ent of the Pike Hill Copper M
ine Superfund Site, Corinth, Vermont—
Scientific Investigations Report 2012–5288