Appendix A Superfund Risk Assessments and Public Health ...
420
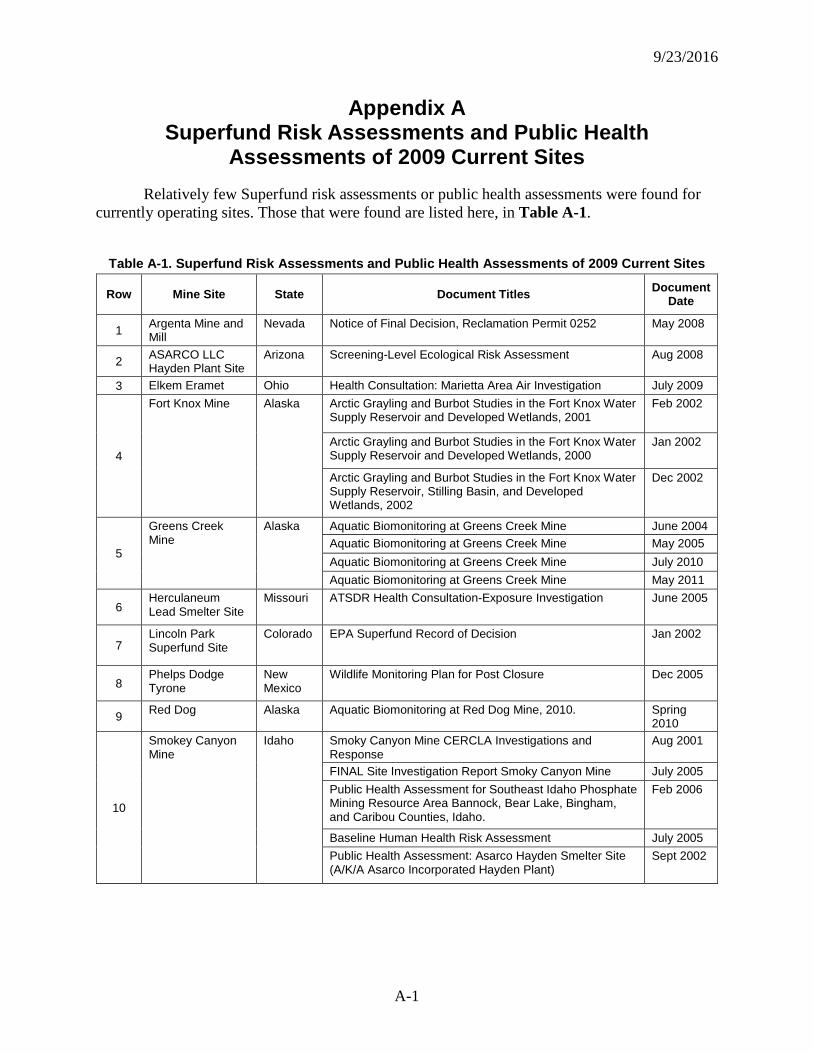
9/23/2016 A-1 Appendix A Superfund Risk Assessments and Public Health Assessments of 2009 Current Sites Relatively few Superfund risk assessments or public health assessments were found for currently operating sites. Those that were found are listed here, in Table A-1. Table A-1. Superfund Risk Assessments and Public Health Assessments of 2009 Current Sites Row Mine Site State Document Titles Document Date 1 Argenta Mine and Mill Nevada Notice of Final Decision, Reclamation Permit 0252 May 2008 2 ASARCO LLC Hayden Plant Site Arizona Screening-Level Ecological Risk Assessment Aug 2008 3 Elkem Eramet Ohio Health Consultation: Marietta Area Air Investigation July 2009 4 Fort Knox Mine Alaska Arctic Grayling and Burbot Studies in the Fort Knox Water Supply Reservoir and Developed Wetlands, 2001 Feb 2002 Arctic Grayling and Burbot Studies in the Fort Knox Water Supply Reservoir and Developed Wetlands, 2000 Jan 2002 Arctic Grayling and Burbot Studies in the Fort Knox Water Supply Reservoir, Stilling Basin, and Developed Wetlands, 2002 Dec 2002 5 Greens Creek Mine Alaska Aquatic Biomonitoring at Greens Creek Mine June 2004 Aquatic Biomonitoring at Greens Creek Mine May 2005 Aquatic Biomonitoring at Greens Creek Mine July 2010 Aquatic Biomonitoring at Greens Creek Mine May 2011 6 Herculaneum Lead Smelter Site Missouri ATSDR Health Consultation-Exposure Investigation June 2005 7 Lincoln Park Superfund Site Colorado EPA Superfund Record of Decision Jan 2002 8 Phelps Dodge Tyrone New Mexico Wildlife Monitoring Plan for Post Closure Dec 2005 9 Red Dog Alaska Aquatic Biomonitoring at Red Dog Mine, 2010. Spring 2010 10 Smokey Canyon Mine Idaho Smoky Canyon Mine CERCLA Investigations and Response Aug 2001 FINAL Site Investigation Report Smoky Canyon Mine July 2005 Public Health Assessment for Southeast Idaho Phosphate Mining Resource Area Bannock, Bear Lake, Bingham, and Caribou Counties, Idaho. Feb 2006 Baseline Human Health Risk Assessment July 2005 Public Health Assessment: Asarco Hayden Smelter Site (A/K/A Asarco Incorporated Hayden Plant) Sept 2002
-
Upload
khangminh22 -
Category
Documents
-
view
0 -
download
0
Transcript of Appendix A Superfund Risk Assessments and Public Health ...
9/23/2016
A-1
Appendix A Superfund Risk Assessments and Public Health
Assessments of 2009 Current Sites Relatively few Superfund risk assessments or public health assessments were found for
currently operating sites. Those that were found are listed here, in Table A-1.
Table A-1. Superfund Risk Assessments and Public Health Assessments of 2009 Current Sites
Row Mine Site State Document Titles Document Date
1 Argenta Mine and Mill
Nevada Notice of Final Decision, Reclamation Permit 0252 May 2008
2 ASARCO LLC Hayden Plant Site
Arizona Screening-Level Ecological Risk Assessment Aug 2008
3 Elkem Eramet Ohio Health Consultation: Marietta Area Air Investigation July 2009
4
Fort Knox Mine Alaska Arctic Grayling and Burbot Studies in the Fort Knox Water Supply Reservoir and Developed Wetlands, 2001
Feb 2002
Arctic Grayling and Burbot Studies in the Fort Knox Water Supply Reservoir and Developed Wetlands, 2000
Jan 2002
Arctic Grayling and Burbot Studies in the Fort Knox Water Supply Reservoir, Stilling Basin, and Developed Wetlands, 2002
Dec 2002
5
Greens Creek Mine
Alaska Aquatic Biomonitoring at Greens Creek Mine June 2004 Aquatic Biomonitoring at Greens Creek Mine May 2005 Aquatic Biomonitoring at Greens Creek Mine July 2010 Aquatic Biomonitoring at Greens Creek Mine May 2011
6 Herculaneum Lead Smelter Site
Missouri ATSDR Health Consultation-Exposure Investigation June 2005
7 Lincoln Park Superfund Site
Colorado EPA Superfund Record of Decision Jan 2002
8 Phelps Dodge Tyrone
New Mexico
Wildlife Monitoring Plan for Post Closure Dec 2005
9 Red Dog Alaska Aquatic Biomonitoring at Red Dog Mine, 2010. Spring 2010
10
Smokey Canyon Mine
Idaho Smoky Canyon Mine CERCLA Investigations and Response
Aug 2001
FINAL Site Investigation Report Smoky Canyon Mine July 2005 Public Health Assessment for Southeast Idaho Phosphate Mining Resource Area Bannock, Bear Lake, Bingham, and Caribou Counties, Idaho.
Feb 2006
Baseline Human Health Risk Assessment July 2005 Public Health Assessment: Asarco Hayden Smelter Site (A/K/A Asarco Incorporated Hayden Plant)
Sept 2002
9/23/2016
B-1
Appendix B Defining the Universes of 108(b) Historical CERCLA and 2009
Current Sites This appendix describes the data sources and methodologies that EPA used to define the
universes of 108(b) CERCLA Historical sites and 2009 Current sites. Section B.1 describes the data sources and methodology used to create the initial universe of 108(b) CERCLA Historical sites. Section B.1 also describes the randomized sampling that generated the 24 Case Study Historical sites for in-depth data gathering and evaluation. Section B.2 details the later expansion of the 108(b) CERCLA Historical Sites universe, as well as the supplemental site sellection and data collection. Section B.3 describes the data sources and selection criteria used to create the universe of 2009 Current sites are described, along with the methods for locating these sites. Section B.4 documents those sites found in both the 108(b) CERCLA Historical Sites universe and the 2009 Current Sites universe.
B.1 Initial List of 108(b) Historical CERCLA Sites EPA constructed a dataset of known mining and primary mineral processing sites that
have been cleaned up using Superfund (CERCLA) authority. These sites include CERCLA removal sites, National Priority List (NPL) sites, and sites cleaned up under CERCLA (sometimes in addition to other federal laws’) authority. The list includes sites of which EPA is aware that mining, and/or primary mineral processing occurred, although it also includes some sites at which other types of activities may have occurred at different times (e.g., secondary mineral processing) or that are part of the overall Superfund site (e.g., manufactured gas plant or chemical manufacturing).
B.1.1 Abandoned Mine Lands List as of 2002 EPA’s National Mining Team developed a list of 561 mining and mineral processing
sites that have been addressed using Superfund (CERCLA) cleanup authority or that are on the Comprehensive Environmental Response, Compensation, and Liability Information System (CERCLIS) inventory of sites that might at a future date be cleaned up under CERCLA cleanup authority. Some of the sites have not yet been assessed for cleanup needs. The National Mining Team defines the term “abandoned mine lands” for its purposes as “…those lands, waters, and surrounding watersheds contaminated or scarred by the extraction, beneficiation or processing of ores and minerals (excluding coal). Abandoned mine lands include areas where mining or processing activity is determined to be temporarily inactive” (U.S. EPA, 2004).
The scope of the National Mining Team’s efforts differs slightly from the scope and applicability of the proposed CERCLA 108(b) rule, which focusses on mines and processors of metal and non-fuel, non-metallic mineral resources identified in the July 2009 FR notice (74 FR 37213-37219). The CERCLA 108(b) rule also does not cover commodities excluded from the definition of “hardrock mining facilities” for the purposes of identifying the classes of facilities for which financial responsibility requirements would be first developed. The list of excluded commodities is based on an analysis of several factors published in the Priority Classes notice for the CERCLA 108(b) requirements (published July 28, 2009, in the Federal Register, 74 FR
9/23/2016
B-2
37213-37219). EPA staff analyzed the following factors in determining what mining sectors and commodities to exclude:
• Annual amounts of hazardous substances released to the environment • The number of facilities in active operation and production • The physical size of the operation • The extent of environmental contamination • The number of sites on the CERCLA site inventory (including both National Priority List
(NPL) sites and non-NPL sites) • Government expenditures • Projected clean-up expenditures; and • Corporate structure and bankruptcy potential.
A memorandum to the record (“Mining Classes Not Included in Identified Hardrock Mining Classes of Facilities” from Stephen Hoffman and Shahid Mahmud, June 29, 2009, document number EPA-HQ-SFUND-2009-0265-0003, U.S. EPA (2009a)) lists 59 MSHA commodities to be excluded.
To conduct this evaluation, therefore, EPA identified those mining and mineral processing sites on the Abandoned Mines List associated with metal and non-metallic, non-fuel mineral commodities identified in the July 2009 FR notice [74 FR 37213-37219], excluding those listed in U.S. EPA (2009a).
B.1.2 Filtering for 108(b) Historical CERCLA Sites Based on the list of abandoned mine lands sites, EPA used the following criteria to
identify relevant 108(b) Historical CERCLA sites:
• Mining or mineral processing occurred at the site (either alone, together, or in combination with other activities).
• For mineral processing, EPA documents describing site activities mention processing of primary (i.e., earthen) mineral resources rather than only secondary mineral resources (i.e., already circulating within the economy and returned for recovery).
• The site is or had been addressed by the EPA under CERCLA as an NPL site, a removal site, a site cleaned up as part of a CERCLA enforcement action, or some combination of these.
• Site contamination resulted at least in part from mining or mineral processing activities that occurred at the site, rather than solely from mining or mineral processing wastes transported to the site from a different location or from other non-mining, non-mineral processing activities.
• The commodity or commodities mined or processed at the sites fell within the scope of the July 2009 FR notice (74 FR 37213-37219).
• The site was not a member of a mining class excluded from the rule per EPA (2009a).
EPA identified 251 sites that have been cleaned up using Superfund (CERCLA) cleanup authority: as removal sites, NPL sites, or in some cases as part of a CERCLA enforcement
9/23/2016
B-3
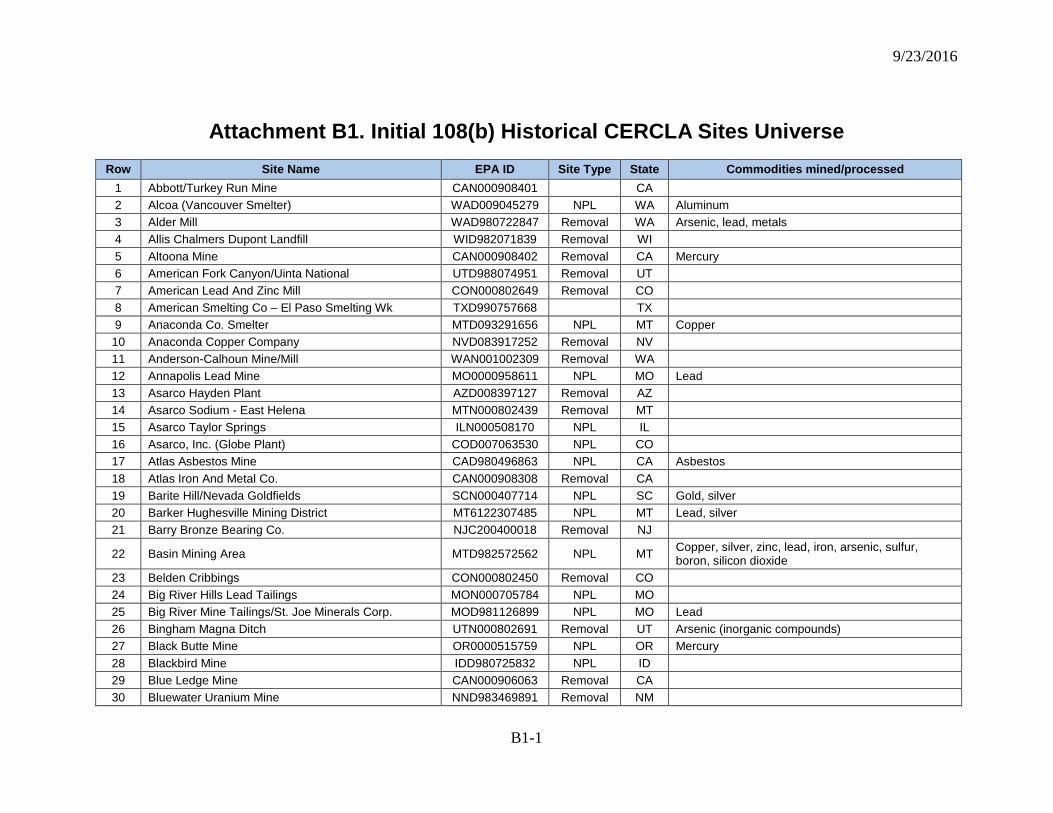
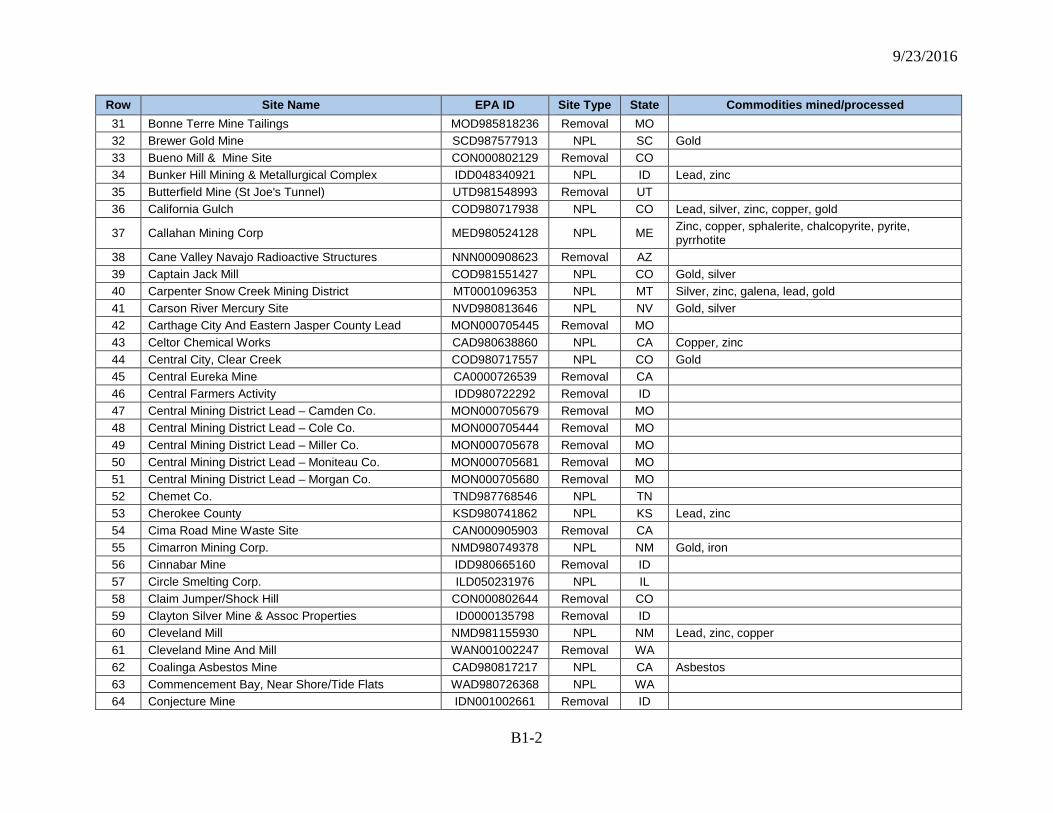
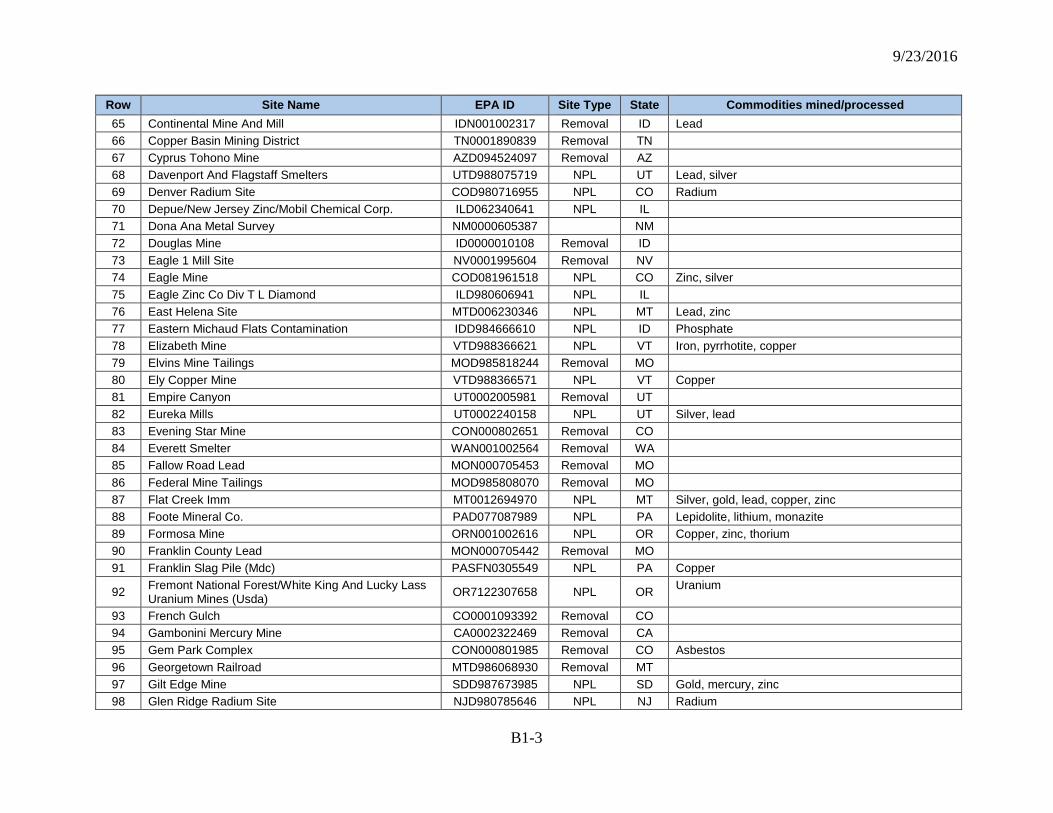
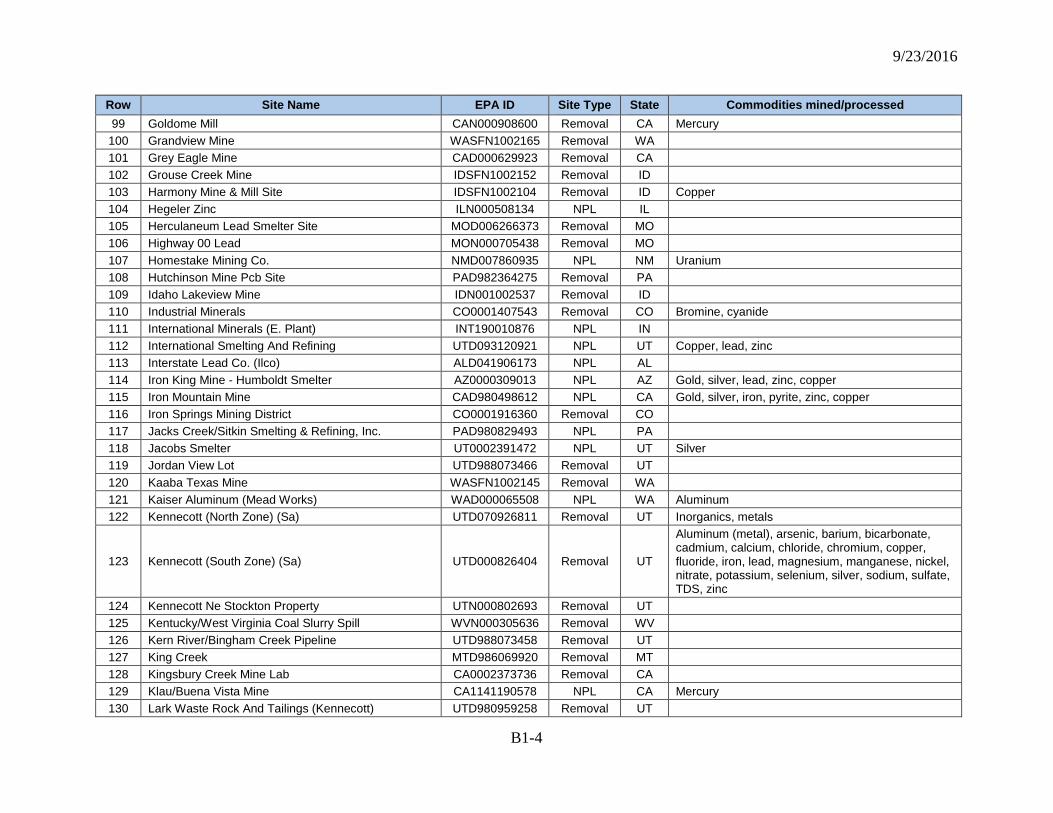
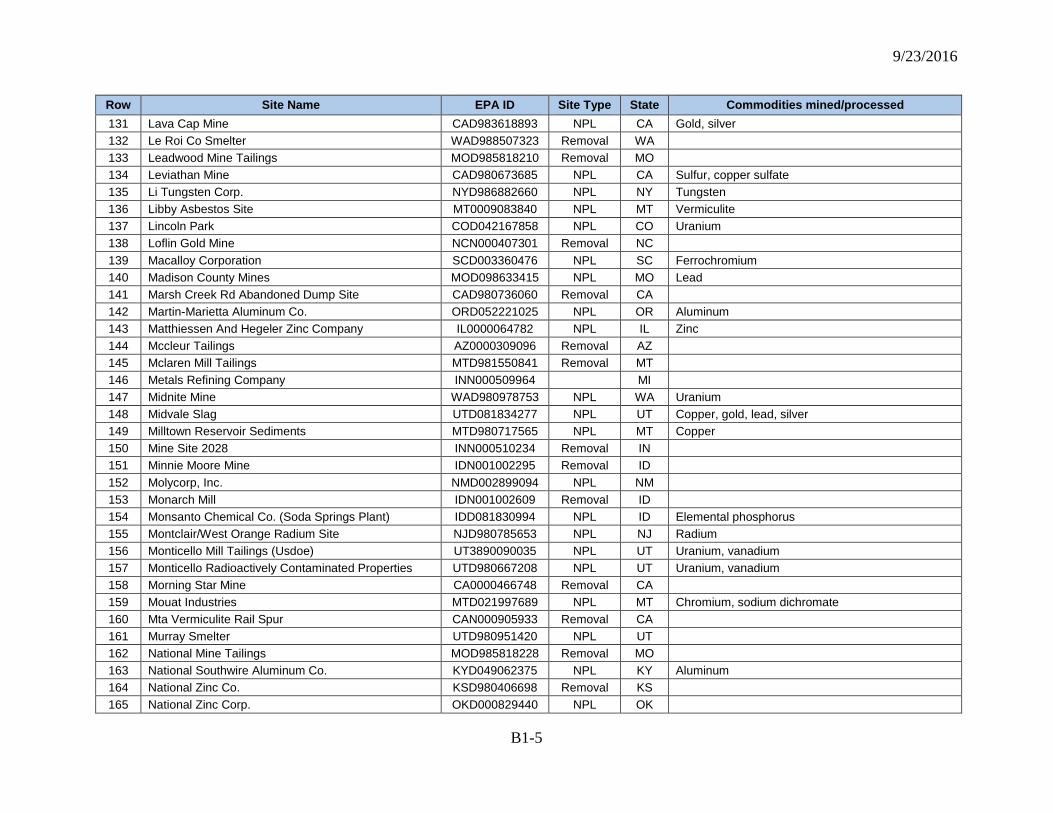
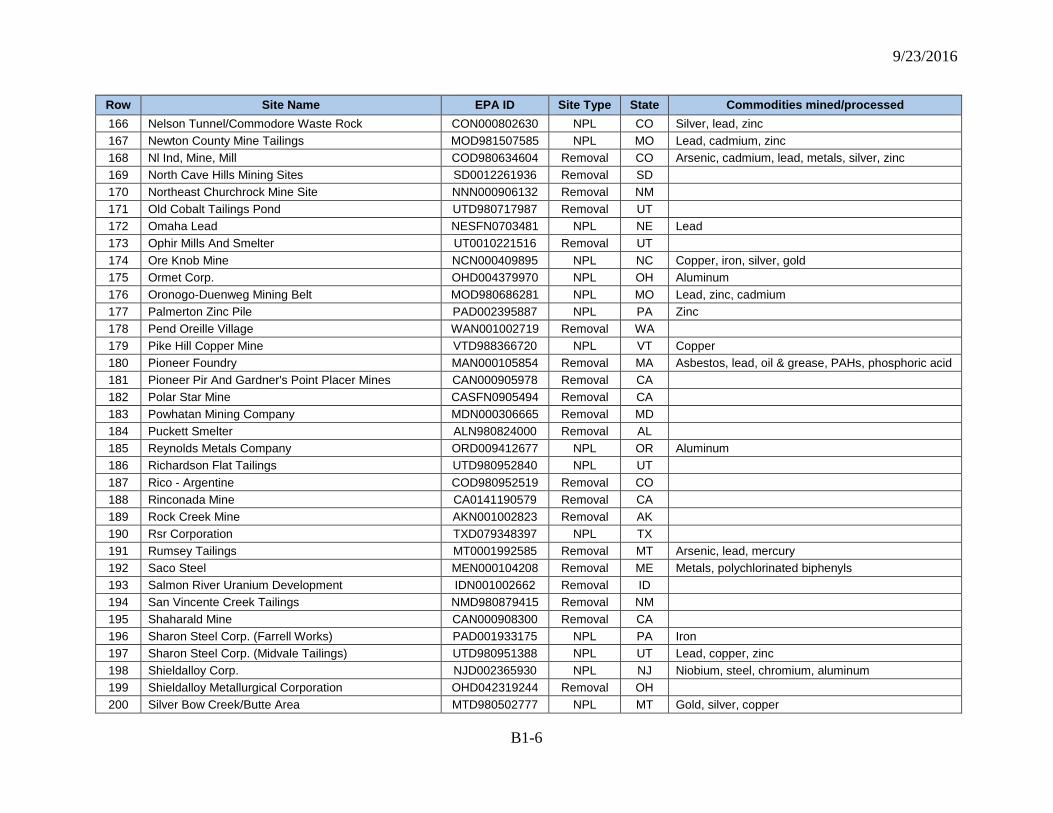
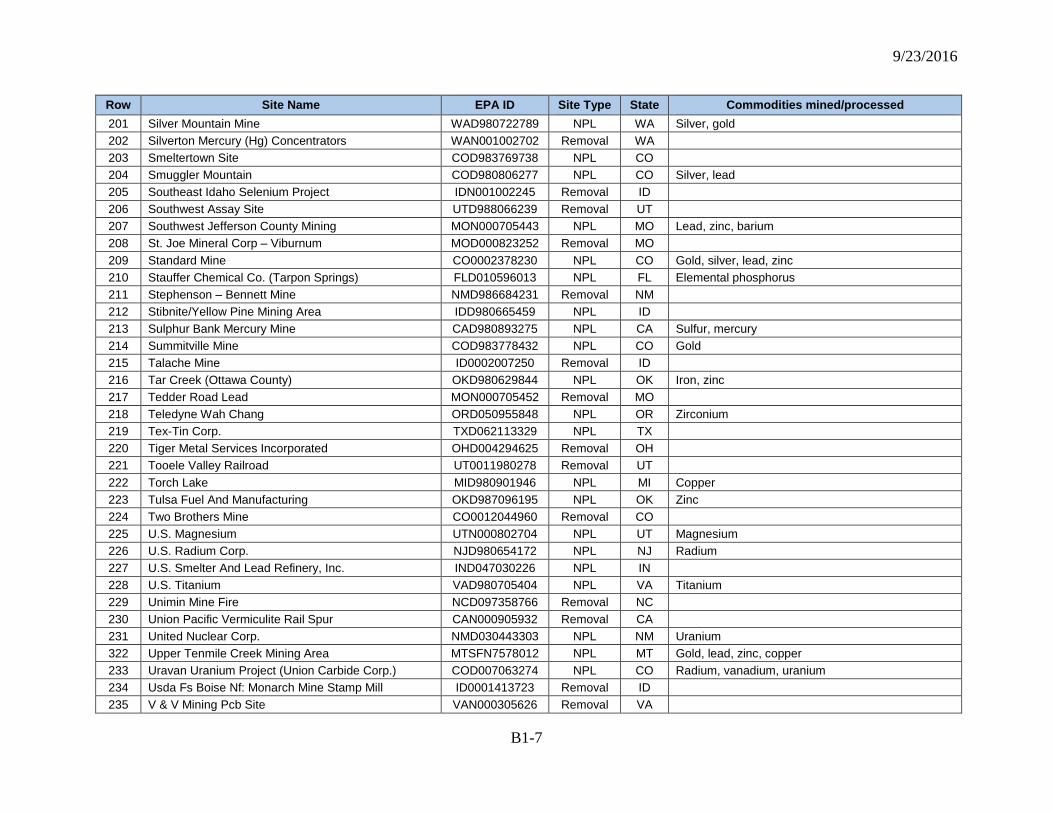
action. Attachment B1 presents the Historical CERCLA site names, identification numbers, locations, and commodities mined/processed.
B.1.3 Stratification into pre- and post-1980 sites A few of the Historical CERCLA Sites were included because of contamination from
mining operations conducted as far back in time as the 1700s and early to mid 1800s. In order to focus the analysis on the historical sites that use mining and mineral processing practices similar to those used at current or future mining and mineral processing sites, EPA divided the list of 251 sites into two groups: one in which site operations ended before 1980 and one in which the operations occurred after 1980.
B.1.4 Random Selection of Case Study Historical Sites A randomized selection process was used to sample a subset of the post-1980 historical
sites. A set of priority rules was implemented for the selection process that included (1) sites with readily available data, and (2) no legal negotiation was ongoing at a site.
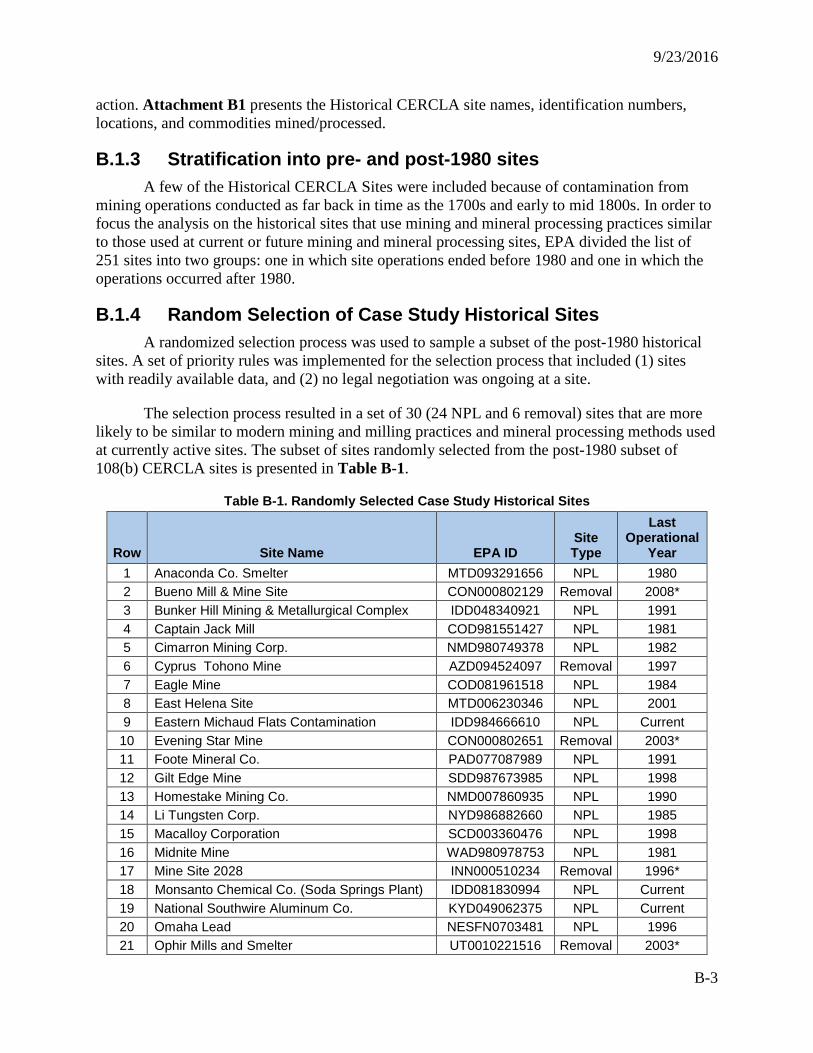
The selection process resulted in a set of 30 (24 NPL and 6 removal) sites that are more likely to be similar to modern mining and milling practices and mineral processing methods used at currently active sites. The subset of sites randomly selected from the post-1980 subset of 108(b) CERCLA sites is presented in Table B-1.
Table B-1. Randomly Selected Case Study Historical Sites
Row Site Name EPA ID Site Type
Last Operational
Year 1 Anaconda Co. Smelter MTD093291656 NPL 1980 2 Bueno Mill & Mine Site CON000802129 Removal 2008* 3 Bunker Hill Mining & Metallurgical Complex IDD048340921 NPL 1991 4 Captain Jack Mill COD981551427 NPL 1981 5 Cimarron Mining Corp. NMD980749378 NPL 1982 6 Cyprus Tohono Mine AZD094524097 Removal 1997 7 Eagle Mine COD081961518 NPL 1984 8 East Helena Site MTD006230346 NPL 2001 9 Eastern Michaud Flats Contamination IDD984666610 NPL Current
10 Evening Star Mine CON000802651 Removal 2003* 11 Foote Mineral Co. PAD077087989 NPL 1991 12 Gilt Edge Mine SDD987673985 NPL 1998 13 Homestake Mining Co. NMD007860935 NPL 1990 14 Li Tungsten Corp. NYD986882660 NPL 1985 15 Macalloy Corporation SCD003360476 NPL 1998 16 Midnite Mine WAD980978753 NPL 1981 17 Mine Site 2028 INN000510234 Removal 1996* 18 Monsanto Chemical Co. (Soda Springs Plant) IDD081830994 NPL Current 19 National Southwire Aluminum Co. KYD049062375 NPL Current 20 Omaha Lead NESFN0703481 NPL 1996 21 Ophir Mills and Smelter UT0010221516 Removal 2003*
9/23/2016
B-4
Row Site Name EPA ID Site Type
Last Operational
Year 22 Ormet Corp. OHD004379970 NPL Current 23 Palmerton Zinc Pile PAD002395887 NPL 1980 24 Reynolds Metals Company ORD009412677 NPL 2000 25 Silver Mountain Mine WAD980722789 NPL 1983 26 Silverton Mercury (HG) Concentrators WAN001002702 Removal 1983* 27 Stauffer Chemical Co. (Tarpon Springs) FLD010596013 NPL 1981 28 Summitville Mine COD983778432 NPL 1992 29 Teledyne Wah Chang ORD050955848 NPL Current 30 Tex-Tin Corp. TXD062113329 NPL 1991
* When a Removal site’s last operational year is unknown, the Last Non-NPL Status date was used
Note: A “current” listing in the Last Operational Year field indicates the site still had mining or mineral processing activities ongoing as of calendar year 2009. At the Bunker Hill site EPA has limited evidence that mining was occurring, but the mine became non-producing in 2009 and potentially should be classified as current. This limited evidence is the operating status information in the MSHA database at http://www.msha.gov/drs/drshome.htm, for the mine numbered as MSHA ID # 1000083.
B.1.5 Documents from Superfund Data Management System EPA extracted data on exposure to CERCLA hazardous substances associated with the
historical NPL sites, from the following source documents:
• Superfund human health risk assessments (HHRA) and ecological risk assessments (ERA)
• NPL site summary information previously developed by EPA that included synopses for the record of decision (ROD), contaminants of concern, site characteristics, and NPL mining/mineral processing methods
• Remedial Investigation/Feasibility Study (RI/FS) documents • RODs • Other CERCLA site documents such as comprehensive 5-year review and risk
assessments from CERCLIS and Regional Superfund web pages.
Data for the removal sites were extracted from the following CERCLA site documents:
• Action memos • Supplemental action memos • Pollution reports • Other removal-related documentation.
In the above lists of document sources, preference was generally given for data extraction in the order shown. Preference was based on accessibility of exposure and CERCLA hazardous
9/23/2016
B-5
substance information already summarized and then additional documents were referenced, as needed, that were expected to contain the required data elements. Information that emerges over a period of time, such as with more comprehensive site field sampling, can sometimes change the picture of site conditions, and thus information from many different site documents needed to be evaluated to infer which documents contained the most complete data for the purposes of this report. Ultimately, RODs, RI/FS documents, and Superfund risk assessments were found to most frequently contain the information that was of interest.
Narrative case studies were developed for the Case Study Historical sites. These case studies are included in Attachment B2. However, insufficient data were available for any of the Removal sites; as a result, only the NPL sites were used in the analysis. The documents reviewed for each of the NPL Case Study Historical sites is provided in Attachment B3.
B.2 Expanded List of 108(b) Historical CERCLA Sites and Supplemental Sampling
Ongoing QA/QC efforts identified issues which, in aggregate, suggested that EPA should continue developing the 108(b) Historical CERCLA Sites universe. For example, additional analysis of CERCLIS identified numerous additional sites that qualified to be on the list. Also, data collection efforts for the Cased Study Historical sites found that some sites on the list were not mines or mineral processors and should not have been on the list at all. EPA therefore decided to update the 108(b) Historical CERCLA Sites universe.
Also, EPA found that the Case Study Historical sites included a limited range of the commodities mined and/or processed when compared to the overall 108(b) Historical CERCLA Sites universe. EPA therefore conducted a supplemental selection of additional historical sites for in-depth data collection and study.
B.2.1 Using CERCLIS Data to Update the 108(b) Historical CERCLA Sites Universe
While collecting data for the initial Case Study Historical sites, EPA found that insufficient data were available for Removal and other non-NPL sites. EPA therefore decided to concentrate the updating on NPL sites.
To further clarify and update the list, EPA compared the initial 108(b) Historical CERCLA Sites universe to the following two reports generated by the CERCLIS Public Access Database:
• List 9 (Active CERCLIS Sites, available at http://www.epa.gov/superfund/list-9-active-cerclis-sites): Displays the sequence of activities undertaken at active CERCLIS sites. An active site is one at which site assessment, removal, remedial, enforcement, cost recovery, or oversight activities are being planned or conducted: and
• SCAP 12 (NPL Sites, available at http://www.epa.gov/superfund/scap-12-foia-nplnon-npl-site-summary-version-2401): Displays the sequence of activities undertaken at all NPL sites in CERCLIS. NPL sites include sites proposed to the NPL, sites currently on the final NPL and sites deleted from the final NPL.
9/23/2016
B-6
Similar to efforts described in Section B.1 above regarding filtering the AML list, EPA identified those mining and mineral processing sites on the List 9 and SCAP 12 reports associated with metal and non-metallic, non-fuel mineral commodities identified in the July 2009 FR notice [74 FR 37213-37219], excluding those listed in U.S. EPA (2009a). Based on the 108(b) Historical CERCLA Sites universe, as well as the List 9 and SCAP 12 reports, EPA developed a list of 448 sites that have been cleaned up using Superfund (CERCLA) authority: as NPL sites or, from the initial 108(b) Historical CERCLA Sites universe, as removal sites or as part of a CERCLA enforcement action. Attachment B4 presents the list of 448 sites comprising the updated 108(b) Historical CERCLA Sites universe, including site names, identification numbers, locations, and commodities mined/processed.
B.2.2 Supplemental Selection of Historical Sites In August 2012, while updating the 108(b) Historical CERCLA Sites universe, EPA took
another sample to supplement the original, random sample of Case Study Historical sites for in-depth data collection and study. The supplemental sampling differed from the original, random sampling in several respects:
• The list from which to sample excluded sites already on the original, randomly selected sites list;
• The list from which to sample excluded sites associated with commodities already represented in the original, randomly selected sites list; and
• The supplemental sampling was not restricted to post-1980 operating sites.
The list of sites selected during the supplemental sampling is presented in Table B-2 below.
Table B-2. Historical Sites in Supplemental Sample
Row
Site Name EPA ID Site Type
Last Operational
Year 1 ALCOA/Lavaca Bay TXD008123168 NPL 1979 2 Blackbird Mine IDD980725832 NPL 1982 3 Chemet Co. TND987768546 NPL 1987 4 Cleveland Mill NMD981155930 NPL 1950
5 E.I. du Pont de Nemours & Co., Inc. (Newport Pigment Plant Landfill) DED980555122 NPL Unknown
6 Fremont National Forest/White King and Lucky Lass Uranium Mines (USDA) OR7122307658 NPL 1964
7 Libby Asbestos Site MT0009083840 NPL 1990 8 Riverbank Army Ammunition Plant CA7210020759 NPL Unknown 9 Rockwool Industries Inc. TXD066379645 NPL 1987 10 Saltville Waste Disposal Ponds VAD003127578 NPL 1972 11 U.S. Radium Corp. NJD980654172 NPL 1926 12 Washington County Lead District - Old Mines MON000705027 NPL c. 1980
9/23/2016
B-7
B.2.3 Documents from Superfund Data Management System EPA extracted exposure and CERCLA hazardous substance data associated with the
supplemental sample of historical sites from the same types of source documents as those used for the original, random sample (see Section B.1.5).
As with the original data collection effort, preference of data source documents was based on accessibility of information already summarized and then additional documents were referenced as needed. Ultimately, RODs, RI/FS documents, baseline risk assessments (BRA), human health risk assessments (HHRA) and ecological risk assessments (ERA) were found to most frequently contain the information that was of interest.
Please note that, while data were collected for the suplementally selected sites, and for completeness of documentation they are included in this report, the data were not available in time to be included in the analyses, and any conclusions drawn by this report are not based on these data. These data are available, however, for any future analyses.
B.3 Currently Active Sites as of 2009 (2009 Current Sites) The list of 2009 Current sites was based on the mineral or metal commodity mined or
processed. The development of EPA’s list of applicable commodities is described in Section B.3.1 below. Section B.3.2 describes how EPA identified mines and mineral processors using the list of commodities, and information from sources such as the Mine Safety and Health Administration (MSHA) and the U.S. Geological Survey (USGS), along with the mine status. Section B.3.3 describes the list of 2009 Current sites and the processes used to locate each site.
B.3.1 Commodities Included in the Report Two federal agencies survey and/or regulate the mining/mineral processing industry: the
USGS, under the Department of the Interior, and the MSHA, under the Department of Labor. These two agencies use different categorization schemes and operate under different federal statutes. EPA is using data from both agencies to identify members of the hard rock mining industry that extract, beneficiate, or process metals and non-metallic, non-fuel minerals in the United States.
EPA began its efforts to identify members of the hard rock mining industry by setting a January 2010 target timeframe for operations to occur at the sites. The EPA identified a database maintained by MSHA, the Mine Data Retrieval System,1 and a set of reports published annually by USGS (Minerals Yearbooks).2
The Minerals Yearbooks (as well as Commodity Summaries for the few commodities without yearbooks) are published for approximately 86 groups of commodities. EPA excluded helium, nitrogen, and sulfur from further consideration because they are extracted from natural gas and/or petroleum (fuels). The EPA also excluded peat on the basis of its occasional use as a
1 Weekly updates are available at http://www.msha.gov/drs/drshome.htm. EPA used a version that MSHA staff
indicated represents MSHA's best-quality data for calendar year 2009, provided to Phuc Phan of EPA by Chad Hancher of MSHA in July 2010. EPA also periodically extracted data from the weekly updates.
2 Available at http://minerals.usgs.gov/minerals/pubs/commodity/ .
9/23/2016
B-8
fuel, leaving approximately 82 groups of commodities. EPA also excluded manufactured abrasives, reasoning that although minerals are used as feedstocks, the manufacturing process for abrasives is more akin to manufacturing than mineral processing.
Next, EPA arrayed the commodities listed by MSHA in its Mine Data Retrieval System database and removed the energy commodities (coal (anthracite); coal (bituminous); coal (lignite); oil mining; oil sand; oil shale) from that list, leaving approximately 98 groups of commodities.
There is significant overlap between the approximately 82 USGS commodities and approximately 98 MSHA commodities, and in many instances the commodity names are identical. Several that are tracked by USGS and not MSHA are likely to be ores/minerals that are imported from outside the United States and beneficiated/processed within the U.S.
EPA then merged the two lists of commodities to create a list of metal and non-metallic, non-fuel minerals that could be extracted, beneficiated, or processed in the United States. This list is not all-inclusive, because it represents ores and minerals mined and processed in the 2006 to 2009 timeframe; changes in market conditions and commodity prices over time could mean that additional ores/minerals not present on this list could begin to be mined or processed in the United States, while mining or processing of ores/minerals currently present on this list might be discontinued at some future point.
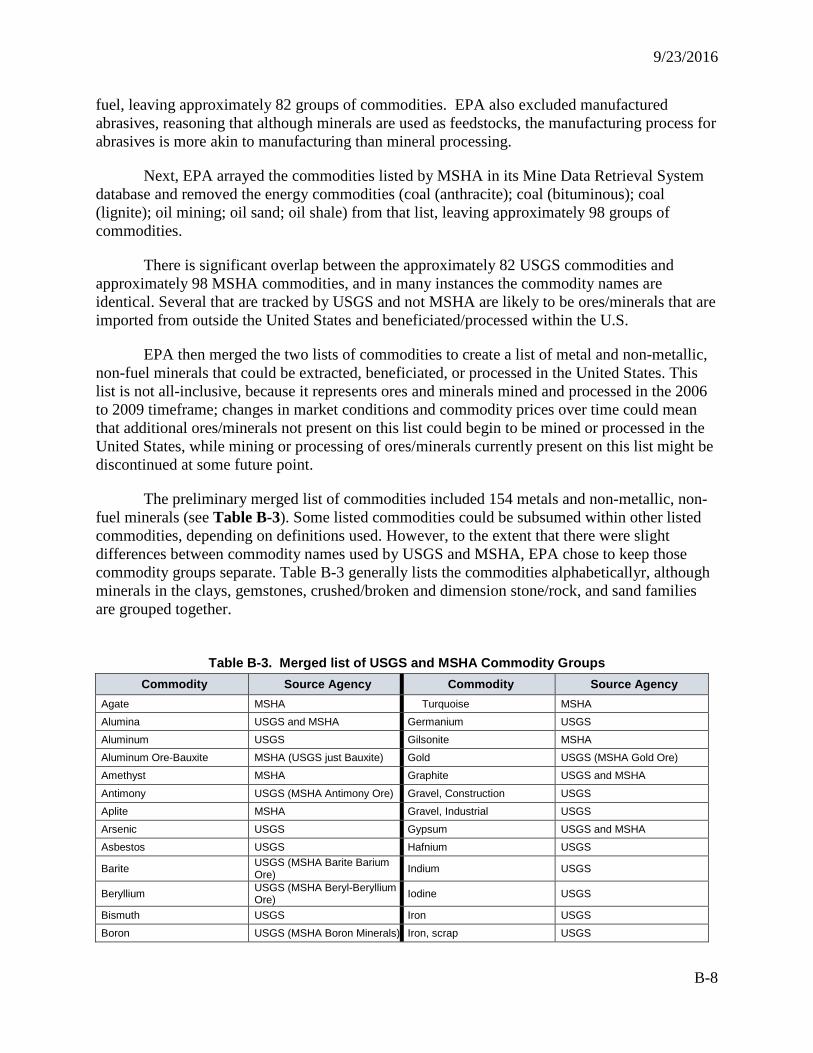
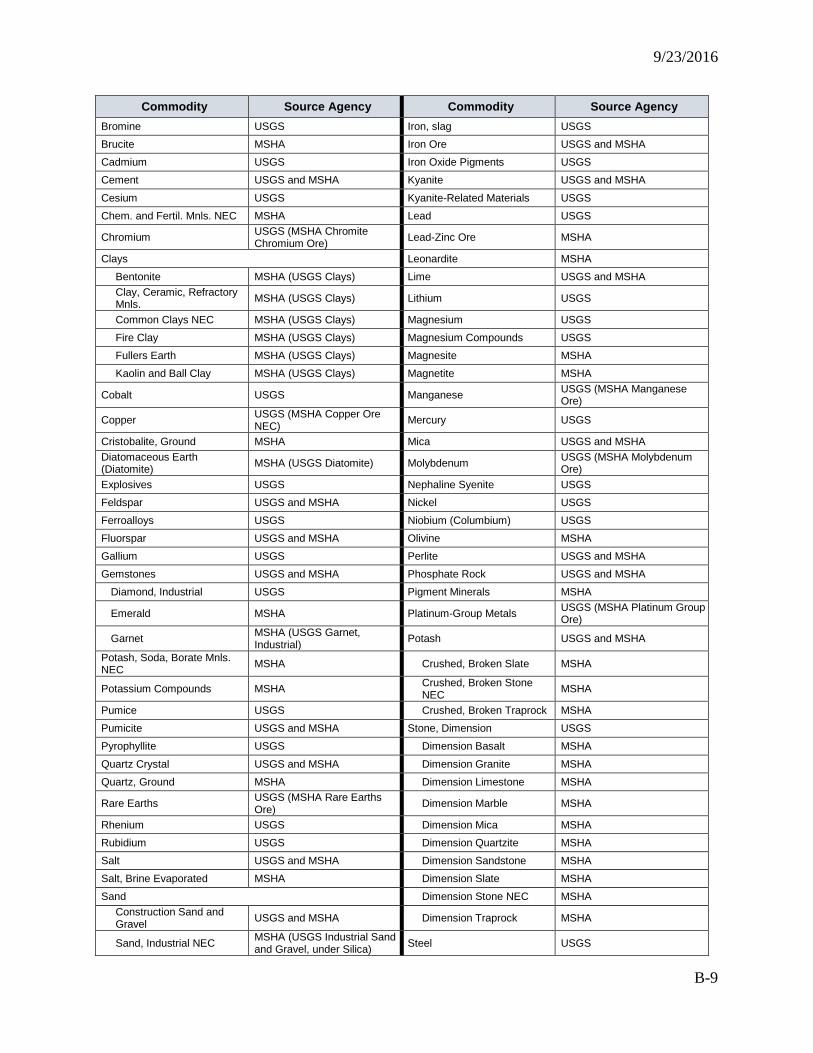
The preliminary merged list of commodities included 154 metals and non-metallic, non-fuel minerals (see Table B-3). Some listed commodities could be subsumed within other listed commodities, depending on definitions used. However, to the extent that there were slight differences between commodity names used by USGS and MSHA, EPA chose to keep those commodity groups separate. Table B-3 generally lists the commodities alphabeticallyr, although minerals in the clays, gemstones, crushed/broken and dimension stone/rock, and sand families are grouped together.
Table B-3. Merged list of USGS and MSHA Commodity Groups
Commodity Source Agency Commodity Source Agency Agate MSHA Turquoise MSHA
Alumina USGS and MSHA Germanium USGS
Aluminum USGS Gilsonite MSHA
Aluminum Ore-Bauxite MSHA (USGS just Bauxite) Gold USGS (MSHA Gold Ore)
Amethyst MSHA Graphite USGS and MSHA
Antimony USGS (MSHA Antimony Ore) Gravel, Construction USGS
Aplite MSHA Gravel, Industrial USGS
Arsenic USGS Gypsum USGS and MSHA
Asbestos USGS Hafnium USGS
Barite USGS (MSHA Barite Barium Ore) Indium USGS
Beryllium USGS (MSHA Beryl-Beryllium Ore) Iodine USGS
Bismuth USGS Iron USGS
Boron USGS (MSHA Boron Minerals) Iron, scrap USGS
9/23/2016
B-9
Commodity Source Agency Commodity Source Agency Bromine USGS Iron, slag USGS
Brucite MSHA Iron Ore USGS and MSHA
Cadmium USGS Iron Oxide Pigments USGS
Cement USGS and MSHA Kyanite USGS and MSHA
Cesium USGS Kyanite-Related Materials USGS
Chem. and Fertil. Mnls. NEC MSHA Lead USGS
Chromium USGS (MSHA Chromite Chromium Ore) Lead-Zinc Ore MSHA
Clays Leonardite MSHA
Bentonite MSHA (USGS Clays) Lime USGS and MSHA Clay, Ceramic, Refractory Mnls. MSHA (USGS Clays) Lithium USGS
Common Clays NEC MSHA (USGS Clays) Magnesium USGS
Fire Clay MSHA (USGS Clays) Magnesium Compounds USGS
Fullers Earth MSHA (USGS Clays) Magnesite MSHA
Kaolin and Ball Clay MSHA (USGS Clays) Magnetite MSHA
Cobalt USGS Manganese USGS (MSHA Manganese Ore)
Copper USGS (MSHA Copper Ore NEC) Mercury USGS
Cristobalite, Ground MSHA Mica USGS and MSHA Diatomaceous Earth (Diatomite) MSHA (USGS Diatomite) Molybdenum USGS (MSHA Molybdenum
Ore) Explosives USGS Nephaline Syenite USGS
Feldspar USGS and MSHA Nickel USGS
Ferroalloys USGS Niobium (Columbium) USGS
Fluorspar USGS and MSHA Olivine MSHA
Gallium USGS Perlite USGS and MSHA
Gemstones USGS and MSHA Phosphate Rock USGS and MSHA
Diamond, Industrial USGS Pigment Minerals MSHA
Emerald MSHA Platinum-Group Metals USGS (MSHA Platinum Group Ore)
Garnet MSHA (USGS Garnet, Industrial) Potash USGS and MSHA
Potash, Soda, Borate Mnls. NEC MSHA Crushed, Broken Slate MSHA
Potassium Compounds MSHA Crushed, Broken Stone NEC MSHA
Pumice USGS Crushed, Broken Traprock MSHA
Pumicite USGS and MSHA Stone, Dimension USGS
Pyrophyllite USGS Dimension Basalt MSHA
Quartz Crystal USGS and MSHA Dimension Granite MSHA
Quartz, Ground MSHA Dimension Limestone MSHA
Rare Earths USGS (MSHA Rare Earths Ore) Dimension Marble MSHA
Rhenium USGS Dimension Mica MSHA
Rubidium USGS Dimension Quartzite MSHA
Salt USGS and MSHA Dimension Sandstone MSHA
Salt, Brine Evaporated MSHA Dimension Slate MSHA
Sand Dimension Stone NEC MSHA Construction Sand and Gravel USGS and MSHA Dimension Traprock MSHA
Sand, Industrial NEC MSHA (USGS Industrial Sand and Gravel, under Silica) Steel USGS
9/23/2016
B-10
Commodity Source Agency Commodity Source Agency Sand, Common MSHA Steel Scrap USGS
Selenium USGS Steel Slag USGS
Shale USGS (MSHA Common Shale) Strontium USGS
Shell MSHA Talc USGS and MSHA
Silica USGS Tantalum USGS
Silica, Ground MSHA Tellurium USGS
Silica, Special USGS Thallium USGS
Silicon USGS Thorium USGS
Silver USGS (MSHA Silver Ore) Tin USGS
Soda Ash USGS Titanium USGS
Sodium Sulfate USGS Titanium Ore MSHA
Sodium Compounds MSHA Tripoli USGS and MSHA
Silica, Special USGS Trona MSHA
Silicon USGS Tungsten USGS
Silver USGS (MSHA Silver Ore) Uranium Ore MSHA
Soda Ash USGS Uranium-Vanadium Ore MSHA
Sodium Sulfate USGS Vanadium USGS
Sodium Compounds MSHA Vanadium Ore MSHA
Stone, Crushed USGS Vermiculite USGS and MSHA
Crushed, Broken Basalt MSHA Wollastonite USGS and MSHA
Crushed, Broken Granite MSHA Zeolites USGS and MSHA Crushed, Broken Limestone NEC MSHA Zinc USGS and MSHA
Crushed, Broken Marble MSHA Zirconium USGS
Crushed, Broken Mica MSHA Misc. Metal Ore NEC MSHA
Crushed, Broken Quartzite MSHA Misc. Nonmetallic Mnls. NEC MSHA Crushed, Broken Sandstone MSHA
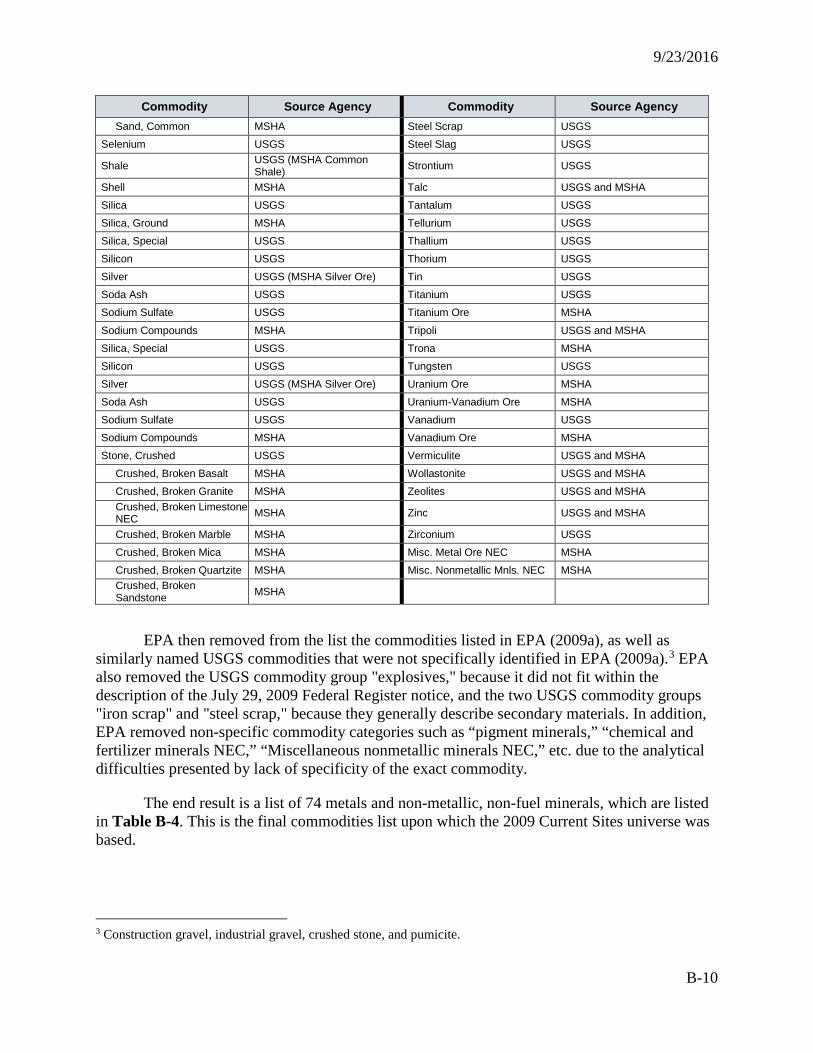
EPA then removed from the list the commodities listed in EPA (2009a), as well as similarly named USGS commodities that were not specifically identified in EPA (2009a).3 EPA also removed the USGS commodity group "explosives," because it did not fit within the description of the July 29, 2009 Federal Register notice, and the two USGS commodity groups "iron scrap" and "steel scrap," because they generally describe secondary materials. In addition, EPA removed non-specific commodity categories such as “pigment minerals,” “chemical and fertilizer minerals NEC,” “Miscellaneous nonmetallic minerals NEC,” etc. due to the analytical difficulties presented by lack of specificity of the exact commodity.
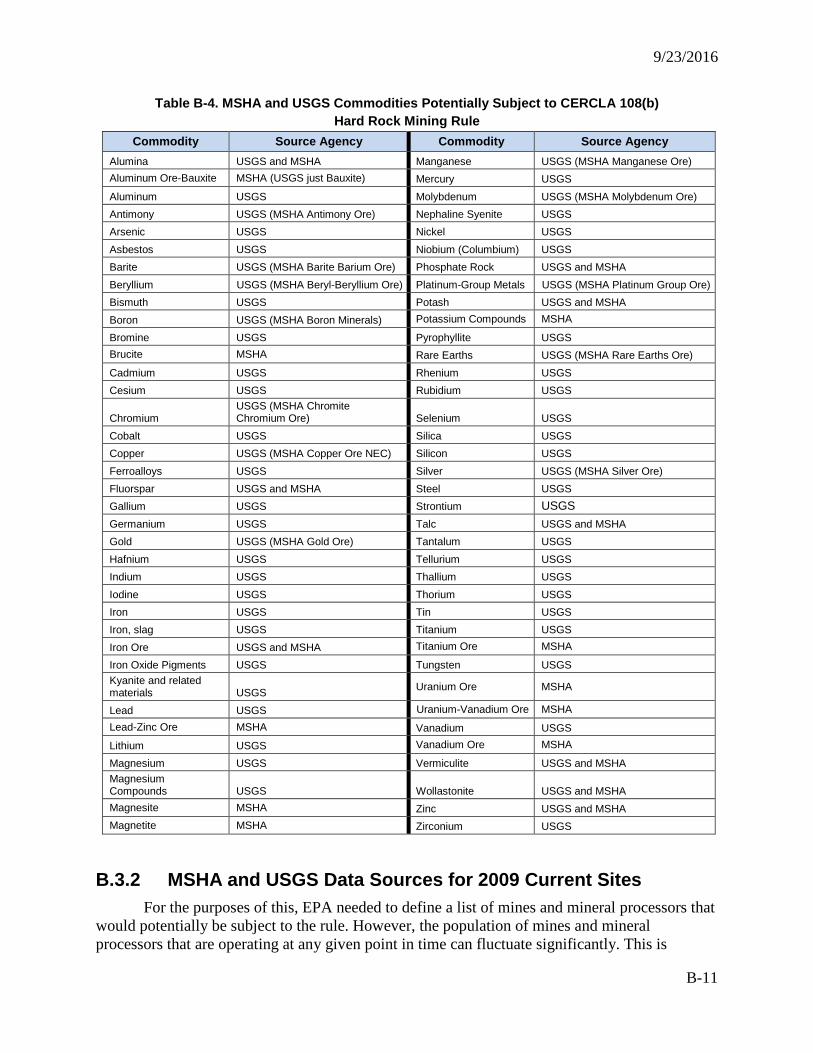
The end result is a list of 74 metals and non-metallic, non-fuel minerals, which are listed in Table B-4. This is the final commodities list upon which the 2009 Current Sites universe was based.
3 Construction gravel, industrial gravel, crushed stone, and pumicite.
9/23/2016
B-11
Table B-4. MSHA and USGS Commodities Potentially Subject to CERCLA 108(b) Hard Rock Mining Rule
Commodity Source Agency Commodity Source Agency Alumina USGS and MSHA Manganese USGS (MSHA Manganese Ore) Aluminum Ore-Bauxite MSHA (USGS just Bauxite) Mercury USGS Aluminum USGS Molybdenum USGS (MSHA Molybdenum Ore) Antimony USGS (MSHA Antimony Ore) Nephaline Syenite USGS Arsenic USGS Nickel USGS Asbestos USGS Niobium (Columbium) USGS Barite USGS (MSHA Barite Barium Ore) Phosphate Rock USGS and MSHA Beryllium USGS (MSHA Beryl-Beryllium Ore) Platinum-Group Metals USGS (MSHA Platinum Group Ore) Bismuth USGS Potash USGS and MSHA Boron USGS (MSHA Boron Minerals) Potassium Compounds MSHA
Bromine USGS Pyrophyllite USGS Brucite MSHA Rare Earths USGS (MSHA Rare Earths Ore) Cadmium USGS Rhenium USGS Cesium USGS Rubidium USGS
Chromium USGS (MSHA Chromite Chromium Ore) Selenium USGS
Cobalt USGS Silica USGS Copper USGS (MSHA Copper Ore NEC) Silicon USGS Ferroalloys USGS Silver USGS (MSHA Silver Ore) Fluorspar USGS and MSHA Steel USGS Gallium USGS Strontium USGS
Germanium USGS Talc USGS and MSHA Gold USGS (MSHA Gold Ore) Tantalum USGS Hafnium USGS Tellurium USGS Indium USGS Thallium USGS Iodine USGS Thorium USGS Iron USGS Tin USGS Iron, slag USGS Titanium USGS Iron Ore USGS and MSHA Titanium Ore MSHA
Iron Oxide Pigments USGS Tungsten USGS Kyanite and related materials USGS Uranium Ore MSHA
Lead USGS Uranium-Vanadium Ore MSHA Lead-Zinc Ore MSHA Vanadium USGS Lithium USGS Vanadium Ore MSHA
Magnesium USGS Vermiculite USGS and MSHA Magnesium Compounds USGS Wollastonite USGS and MSHA Magnesite MSHA Zinc USGS and MSHA Magnetite MSHA Zirconium USGS
B.3.2 MSHA and USGS Data Sources for 2009 Current Sites For the purposes of this, EPA needed to define a list of mines and mineral processors that
would potentially be subject to the rule. However, the population of mines and mineral processors that are operating at any given point in time can fluctuate significantly. This is
9/23/2016
B-12
because mines and mineral processors sometimes operate intermittently, due to fluctuating commodity prices, other business-related factors, mining and processing technical operations issues, and weather conditions. EPA chose to reflect the set of mines and mineral processors operating during calendar year 2009, the year in which the “priority classes” notice was published in the Federal Register.
EPA used two data sources to identify the mines and processors that handle the 108(b) mineral commodities:
MSHA’s Mine Data Retrieval System4 (MDRS) Minerals Yearbook reports published annually by the USGS.5
In early 2010, when EPA began developing the list of mines and mineral processors, many of the Minerals Yearbooks for 2009 were not yet available. It is therefore possible that some mines and mineral processors on EPA’s list were operational in 2007 and 2008 but not in 2009. Similarly, EPA did not obtain a quality-assured version of MSHA’s mines database (MDRS) that reflected mines operating in 2009 until mid-2010; this was MSHA’s 2009 annual close-out database and was used as the master source for comparison of all other mine and processor datasets as part of quality control and assurance protocols.
MSHA mines and processors site lists were compared to the USGS mine and processors site lists, to create the final list of 108(b) sites (i.e., mines or mineral processors of the metals and non-metallic, non-fuel minerals listed listed in Table B-4). The MSHA 2009 end-of-year dataset contains a total of 12,558 records for mines and mining facilities representing all commodity type groups (e.g., metals, industrial minerals, aggregates, dimension stone).
B.3.3 Compilation of the 2009 Current Site List and Site Locations The primary criteria used to identify 108(b) mines and processors from the original data
sources are commodity produced (see Table B-4 above for the list of commodities) and mine status. Spepcifically, EPA retained entries in MSHA’s database with a current status of “active,” “intermittent,” “nonproducing,” or “new,” but excluded entries with a current status of “abandoned.” MSHA’s data dictionary for its mines database6 does not provide definitions for these “current status” categories, so their meaning was inferred from general industry usage. The MSHA database included surface and underground mine types only. MSHA also identified mine “facilities” that were included, for the purposes of this work, as synonymous with mineral processing operations.
Next, records were removed when the detail in all data fields were identical to corresponding data fields of another data record(s) and determined to be a true duplicate. 4 Weekly updates are available at http://www.msha.gov/drs/drshome.htm; EPA used a version that MSHA staff had indicated represent MSHA’s best-quality data for calendar year 2009, provided to EPA by MSHA in July 2010. These data were compared to other MSHA datasets downloaded on May 12, 2010, in ASCII file format from the Open Government Initiative dataset link found on the MSHA website (http://www.msha.gov/Open GovernmentData /OGIMSHA.asp). EPA also periodically queried data from the weekly updates. 5 Available at http://minerals.usgs.gov/minerals/pubs/commodity/. 6 Reference: MSHA 2010. MSHA Data Warehouse Data Dictionary. U.S. Department of Labor, Mine Safety and Health Administration, Arlington, VA, 2010.
9/23/2016
B-13
However, any record with a minor difference compared with another was retained unless other information indicated that the record was a duplicate. All deletions were carefully documented in case additional site information was discovered at a later date. The resulting dataset included records on 564 currently active sites, including 293 mines and 271 processors.
As described in detail in Appendix E, the physical location of 2009 Current sites were identified using various techniques: address geocoding was used when an address or partial address was available; internet searches for location or other information on mines and processors; and consulting additional data sources to obtain information that could lead to the mine or processor location. ArcMap® aerial image software was used to evaluate the site locations found for each mine or processor. Mines were evaluated based on the ground-surface expression observed from the imagery as compared with information from the accompanying data either obtained with the MSHA data record attributes (e.g., aboveground mine, underground mine, processor type) or discovered from other information sources. If necessary, the coordinate location for a site was adjusted based on the information available as of the time the site location record was created. The address and latitude/longitude locations provided in the various sources were not always accurate or precise enough for the purpose of this study; the location provided for some records was the managing office for a site located in a nearby town or even a different state.
A numerical qualifier of 0, 1, or 2 was assigned to the point location for each mine and processor record to indicate EPA’s general confidence in the geographic coordinates determined for the site. The confidence level depended on the availability and inferred quality of the information sources used to develop the coordinate location; therefore, these codes principally represent professional judgment and may not accurately describe the actual mine/processor locations. The site location confidence values are defined as follows:
• Level “0” confidence indicates that – no location could be found, or – the location is likely to be inaccurate and no source could be found to substantiate
or improve it. • Level “1” confidence indicates that the location may or may not be accurate based on the
quality of available information. • Level “2” confidence indicates that the location seems to be accurate relative to results of
a visual comparison with known site attributes available in the data record and corroborating evidence from other sources (e.g., EPA reports).
In many cases, source data were available that allowed EPA to locate the mine with a high level of confidence; however, without contacting mine operators or accessing and reviewing land records data there is still the possibility of location errors. Thus all coordinate (i.e., latitude/longitude) data, regardless of the assigned confidence, should be considered unverified. The primary limitations in using the geolocated list of mines and processors include the uncertainty in the accuracy of some locations and in the limitations of representing very large mines with a single point. See Appendix E for a detailed description of the geocoding and location verification effort.
9/23/2016
B-14
Primarily based on proximity, site name, and owner or operator name, EPA determined that a number of the sites could be combined into single sites. Combining sites in this way would eliminate duplicate entries that were for regulatory purposes a single “site.” Therefore, mines and processors that were within 5 kilometers (approximately 3 miles) of each other and also shared a similar site name, owner name, or operator name were combined and represented by a single site record. When mines or processors were combined in this manner, EPA chose a new point location for the new site composed of the combined mine/processor sites, generally between the original locations or otherwise near the middle of the disturbed area evident in aerial imagery. The resulting dataset included individual mine sites, individual processor sites, and combinations of multiple mine sites, multiple processor sites, or mixtures of both mine and processor sites.
The combining exercise reduced the 2009 Current Sites universe to 491 sites. This dataset, listed in Attachment B5, retains the identity of the source dataset in case that information is needed later to evaluate a currently active site record, and uses a data variable called the Site ID to identify each combined site with a unique number. If an individual site (i.e., identified by a Mine ID or Processor ID) is part of a combined site, then a Site ID assigned to the group will be associated with that site and all other sites included in the grouping; sites that are not part of a combined site will have a unique Site ID.
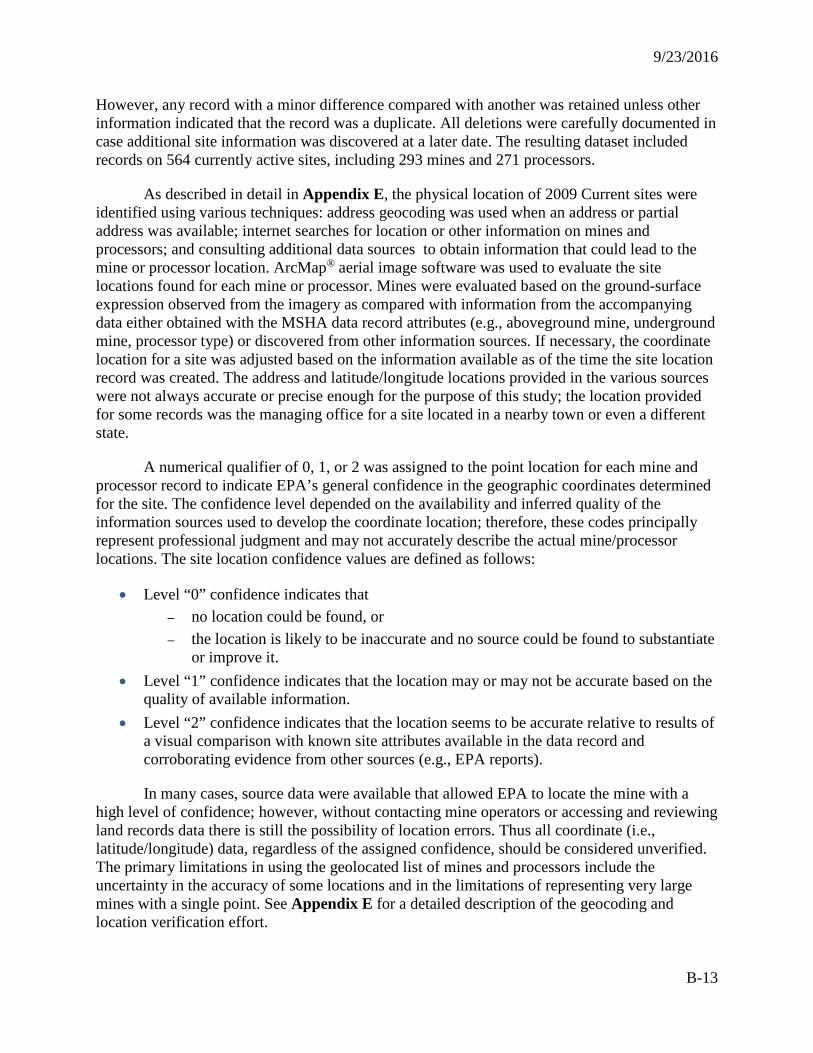
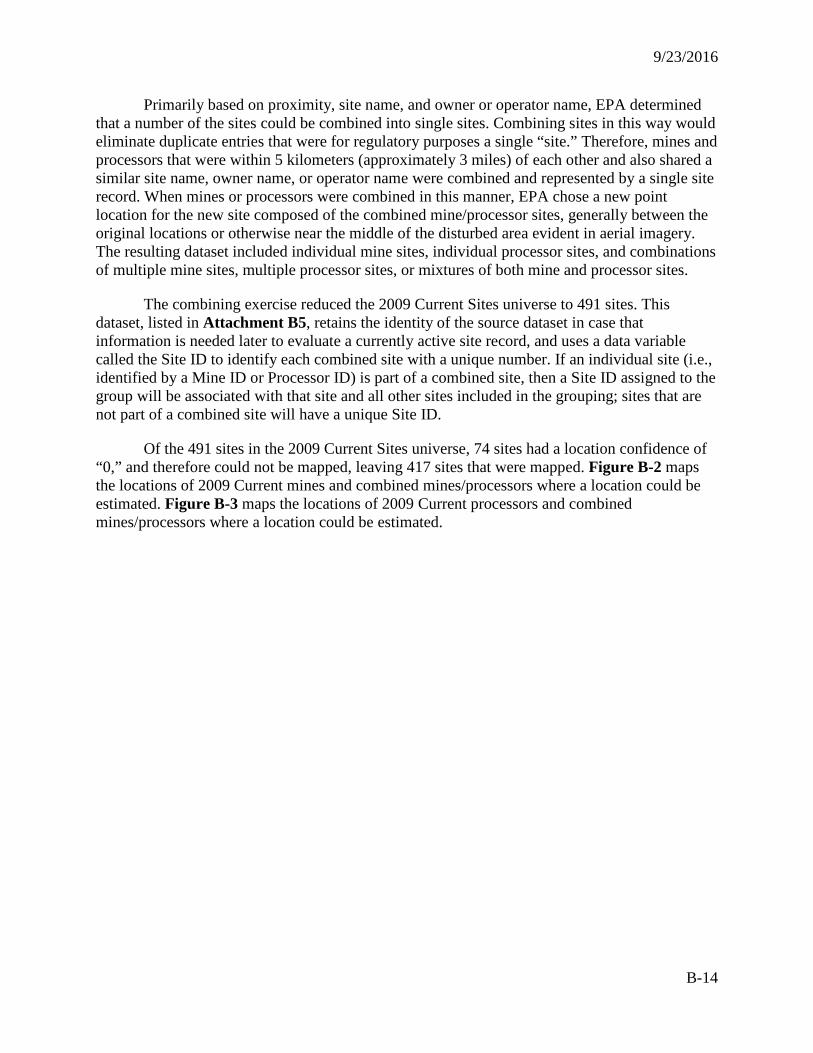
Of the 491 sites in the 2009 Current Sites universe, 74 sites had a location confidence of “0,” and therefore could not be mapped, leaving 417 sites that were mapped. Figure B-2 maps the locations of 2009 Current mines and combined mines/processors where a location could be estimated. Figure B-3 maps the locations of 2009 Current processors and combined mines/processors where a location could be estimated.
9/23/2016
B-15
Figure B-2. 2009 Current mines and combined mines/processors.
Figure B-3. 2009 Current processors and combined mines/processors.
9/23/2016
B-16
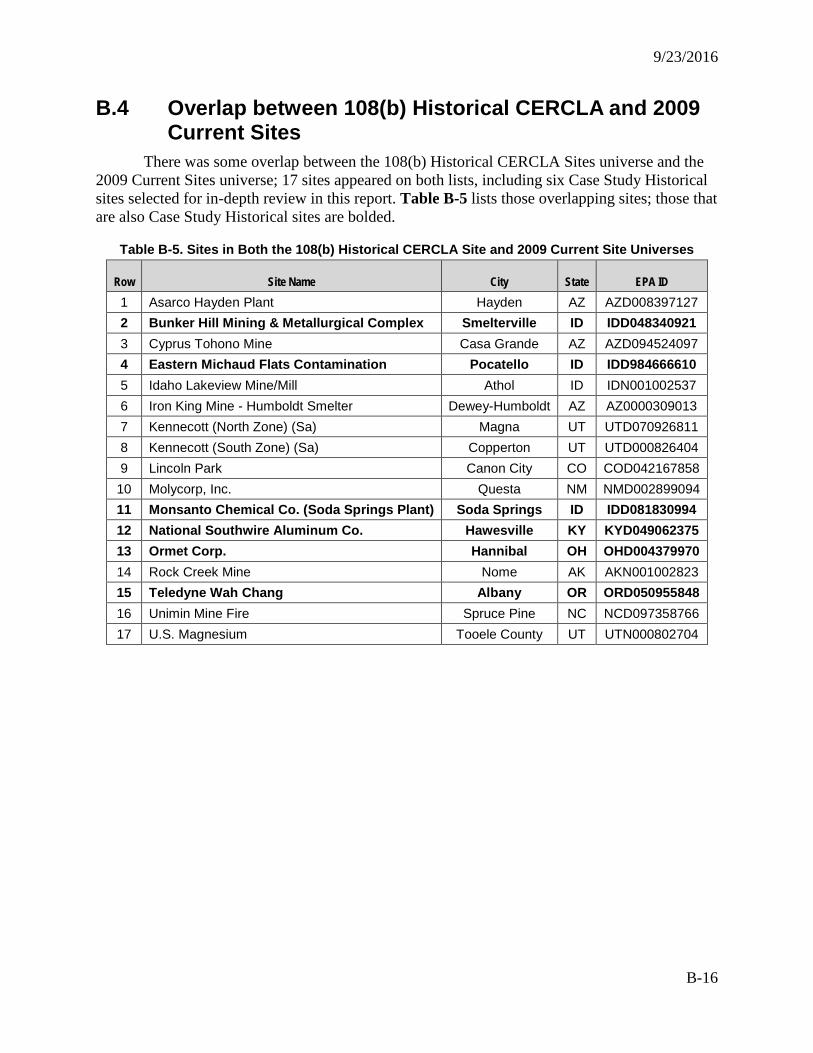
B.4 Overlap between 108(b) Historical CERCLA and 2009 Current Sites
There was some overlap between the 108(b) Historical CERCLA Sites universe and the 2009 Current Sites universe; 17 sites appeared on both lists, including six Case Study Historical sites selected for in-depth review in this report. Table B-5 lists those overlapping sites; those that are also Case Study Historical sites are bolded.
Table B-5. Sites in Both the 108(b) Historical CERCLA Site and 2009 Current Site Universes
Row Site Name City State EPA ID 1 Asarco Hayden Plant Hayden AZ AZD008397127 2 Bunker Hill Mining & Metallurgical Complex Smelterville ID IDD048340921 3 Cyprus Tohono Mine Casa Grande AZ AZD094524097 4 Eastern Michaud Flats Contamination Pocatello ID IDD984666610 5 Idaho Lakeview Mine/Mill Athol ID IDN001002537 6 Iron King Mine - Humboldt Smelter Dewey-Humboldt AZ AZ0000309013 7 Kennecott (North Zone) (Sa) Magna UT UTD070926811 8 Kennecott (South Zone) (Sa) Copperton UT UTD000826404 9 Lincoln Park Canon City CO COD042167858
10 Molycorp, Inc. Questa NM NMD002899094 11 Monsanto Chemical Co. (Soda Springs Plant) Soda Springs ID IDD081830994 12 National Southwire Aluminum Co. Hawesville KY KYD049062375 13 Ormet Corp. Hannibal OH OHD004379970 14 Rock Creek Mine Nome AK AKN001002823 15 Teledyne Wah Chang Albany OR ORD050955848 16 Unimin Mine Fire Spruce Pine NC NCD097358766 17 U.S. Magnesium Tooele County UT UTN000802704
9/23/2016
B1-1
Attachment B1. Initial 108(b) Historical CERCLA Sites Universe Row Site Name EPA ID Site Type State Commodities mined/processed
1 Abbott/Turkey Run Mine CAN000908401 CA 2 Alcoa (Vancouver Smelter) WAD009045279 NPL WA Aluminum 3 Alder Mill WAD980722847 Removal WA Arsenic, lead, metals 4 Allis Chalmers Dupont Landfill WID982071839 Removal WI 5 Altoona Mine CAN000908402 Removal CA Mercury 6 American Fork Canyon/Uinta National UTD988074951 Removal UT 7 American Lead And Zinc Mill CON000802649 Removal CO 8 American Smelting Co – El Paso Smelting Wk TXD990757668 TX 9 Anaconda Co. Smelter MTD093291656 NPL MT Copper 10 Anaconda Copper Company NVD083917252 Removal NV 11 Anderson-Calhoun Mine/Mill WAN001002309 Removal WA 12 Annapolis Lead Mine MO0000958611 NPL MO Lead 13 Asarco Hayden Plant AZD008397127 Removal AZ 14 Asarco Sodium - East Helena MTN000802439 Removal MT 15 Asarco Taylor Springs ILN000508170 NPL IL 16 Asarco, Inc. (Globe Plant) COD007063530 NPL CO 17 Atlas Asbestos Mine CAD980496863 NPL CA Asbestos 18 Atlas Iron And Metal Co. CAN000908308 Removal CA 19 Barite Hill/Nevada Goldfields SCN000407714 NPL SC Gold, silver 20 Barker Hughesville Mining District MT6122307485 NPL MT Lead, silver 21 Barry Bronze Bearing Co. NJC200400018 Removal NJ
22 Basin Mining Area MTD982572562 NPL MT Copper, silver, zinc, lead, iron, arsenic, sulfur, boron, silicon dioxide
23 Belden Cribbings CON000802450 Removal CO 24 Big River Hills Lead Tailings MON000705784 NPL MO 25 Big River Mine Tailings/St. Joe Minerals Corp. MOD981126899 NPL MO Lead 26 Bingham Magna Ditch UTN000802691 Removal UT Arsenic (inorganic compounds) 27 Black Butte Mine OR0000515759 NPL OR Mercury 28 Blackbird Mine IDD980725832 NPL ID 29 Blue Ledge Mine CAN000906063 Removal CA 30 Bluewater Uranium Mine NND983469891 Removal NM
9/23/2016
B1-2
Row Site Name EPA ID Site Type State Commodities mined/processed 31 Bonne Terre Mine Tailings MOD985818236 Removal MO 32 Brewer Gold Mine SCD987577913 NPL SC Gold 33 Bueno Mill & Mine Site CON000802129 Removal CO 34 Bunker Hill Mining & Metallurgical Complex IDD048340921 NPL ID Lead, zinc 35 Butterfield Mine (St Joe's Tunnel) UTD981548993 Removal UT 36 California Gulch COD980717938 NPL CO Lead, silver, zinc, copper, gold
37 Callahan Mining Corp MED980524128 NPL ME Zinc, copper, sphalerite, chalcopyrite, pyrite, pyrrhotite
38 Cane Valley Navajo Radioactive Structures NNN000908623 Removal AZ 39 Captain Jack Mill COD981551427 NPL CO Gold, silver 40 Carpenter Snow Creek Mining District MT0001096353 NPL MT Silver, zinc, galena, lead, gold 41 Carson River Mercury Site NVD980813646 NPL NV Gold, silver 42 Carthage City And Eastern Jasper County Lead MON000705445 Removal MO 43 Celtor Chemical Works CAD980638860 NPL CA Copper, zinc 44 Central City, Clear Creek COD980717557 NPL CO Gold 45 Central Eureka Mine CA0000726539 Removal CA 46 Central Farmers Activity IDD980722292 Removal ID 47 Central Mining District Lead – Camden Co. MON000705679 Removal MO 48 Central Mining District Lead – Cole Co. MON000705444 Removal MO 49 Central Mining District Lead – Miller Co. MON000705678 Removal MO 50 Central Mining District Lead – Moniteau Co. MON000705681 Removal MO 51 Central Mining District Lead – Morgan Co. MON000705680 Removal MO 52 Chemet Co. TND987768546 NPL TN 53 Cherokee County KSD980741862 NPL KS Lead, zinc 54 Cima Road Mine Waste Site CAN000905903 Removal CA 55 Cimarron Mining Corp. NMD980749378 NPL NM Gold, iron 56 Cinnabar Mine IDD980665160 Removal ID 57 Circle Smelting Corp. ILD050231976 NPL IL 58 Claim Jumper/Shock Hill CON000802644 Removal CO 59 Clayton Silver Mine & Assoc Properties ID0000135798 Removal ID 60 Cleveland Mill NMD981155930 NPL NM Lead, zinc, copper 61 Cleveland Mine And Mill WAN001002247 Removal WA 62 Coalinga Asbestos Mine CAD980817217 NPL CA Asbestos 63 Commencement Bay, Near Shore/Tide Flats WAD980726368 NPL WA 64 Conjecture Mine IDN001002661 Removal ID
9/23/2016
B1-3
Row Site Name EPA ID Site Type State Commodities mined/processed 65 Continental Mine And Mill IDN001002317 Removal ID Lead 66 Copper Basin Mining District TN0001890839 Removal TN 67 Cyprus Tohono Mine AZD094524097 Removal AZ 68 Davenport And Flagstaff Smelters UTD988075719 NPL UT Lead, silver 69 Denver Radium Site COD980716955 NPL CO Radium 70 Depue/New Jersey Zinc/Mobil Chemical Corp. ILD062340641 NPL IL 71 Dona Ana Metal Survey NM0000605387 NM 72 Douglas Mine ID0000010108 Removal ID 73 Eagle 1 Mill Site NV0001995604 Removal NV 74 Eagle Mine COD081961518 NPL CO Zinc, silver 75 Eagle Zinc Co Div T L Diamond ILD980606941 NPL IL 76 East Helena Site MTD006230346 NPL MT Lead, zinc 77 Eastern Michaud Flats Contamination IDD984666610 NPL ID Phosphate 78 Elizabeth Mine VTD988366621 NPL VT Iron, pyrrhotite, copper 79 Elvins Mine Tailings MOD985818244 Removal MO 80 Ely Copper Mine VTD988366571 NPL VT Copper 81 Empire Canyon UT0002005981 Removal UT 82 Eureka Mills UT0002240158 NPL UT Silver, lead 83 Evening Star Mine CON000802651 Removal CO 84 Everett Smelter WAN001002564 Removal WA 85 Fallow Road Lead MON000705453 Removal MO 86 Federal Mine Tailings MOD985808070 Removal MO 87 Flat Creek Imm MT0012694970 NPL MT Silver, gold, lead, copper, zinc 88 Foote Mineral Co. PAD077087989 NPL PA Lepidolite, lithium, monazite 89 Formosa Mine ORN001002616 NPL OR Copper, zinc, thorium 90 Franklin County Lead MON000705442 Removal MO 91 Franklin Slag Pile (Mdc) PASFN0305549 NPL PA Copper
92 Fremont National Forest/White King And Lucky Lass Uranium Mines (Usda) OR7122307658 NPL OR Uranium
93 French Gulch CO0001093392 Removal CO 94 Gambonini Mercury Mine CA0002322469 Removal CA 95 Gem Park Complex CON000801985 Removal CO Asbestos 96 Georgetown Railroad MTD986068930 Removal MT 97 Gilt Edge Mine SDD987673985 NPL SD Gold, mercury, zinc 98 Glen Ridge Radium Site NJD980785646 NPL NJ Radium
9/23/2016
B1-4
Row Site Name EPA ID Site Type State Commodities mined/processed 99 Goldome Mill CAN000908600 Removal CA Mercury
100 Grandview Mine WASFN1002165 Removal WA 101 Grey Eagle Mine CAD000629923 Removal CA 102 Grouse Creek Mine IDSFN1002152 Removal ID 103 Harmony Mine & Mill Site IDSFN1002104 Removal ID Copper 104 Hegeler Zinc ILN000508134 NPL IL 105 Herculaneum Lead Smelter Site MOD006266373 Removal MO 106 Highway 00 Lead MON000705438 Removal MO 107 Homestake Mining Co. NMD007860935 NPL NM Uranium 108 Hutchinson Mine Pcb Site PAD982364275 Removal PA 109 Idaho Lakeview Mine IDN001002537 Removal ID 110 Industrial Minerals CO0001407543 Removal CO Bromine, cyanide 111 International Minerals (E. Plant) INT190010876 NPL IN 112 International Smelting And Refining UTD093120921 NPL UT Copper, lead, zinc 113 Interstate Lead Co. (Ilco) ALD041906173 NPL AL 114 Iron King Mine - Humboldt Smelter AZ0000309013 NPL AZ Gold, silver, lead, zinc, copper 115 Iron Mountain Mine CAD980498612 NPL CA Gold, silver, iron, pyrite, zinc, copper 116 Iron Springs Mining District CO0001916360 Removal CO 117 Jacks Creek/Sitkin Smelting & Refining, Inc. PAD980829493 NPL PA 118 Jacobs Smelter UT0002391472 NPL UT Silver 119 Jordan View Lot UTD988073466 Removal UT 120 Kaaba Texas Mine WASFN1002145 Removal WA 121 Kaiser Aluminum (Mead Works) WAD000065508 NPL WA Aluminum 122 Kennecott (North Zone) (Sa) UTD070926811 Removal UT Inorganics, metals
123 Kennecott (South Zone) (Sa) UTD000826404 Removal UT
Aluminum (metal), arsenic, barium, bicarbonate, cadmium, calcium, chloride, chromium, copper, fluoride, iron, lead, magnesium, manganese, nickel, nitrate, potassium, selenium, silver, sodium, sulfate, TDS, zinc
124 Kennecott Ne Stockton Property UTN000802693 Removal UT 125 Kentucky/West Virginia Coal Slurry Spill WVN000305636 Removal WV 126 Kern River/Bingham Creek Pipeline UTD988073458 Removal UT 127 King Creek MTD986069920 Removal MT 128 Kingsbury Creek Mine Lab CA0002373736 Removal CA 129 Klau/Buena Vista Mine CA1141190578 NPL CA Mercury 130 Lark Waste Rock And Tailings (Kennecott) UTD980959258 Removal UT
9/23/2016
B1-5
Row Site Name EPA ID Site Type State Commodities mined/processed 131 Lava Cap Mine CAD983618893 NPL CA Gold, silver 132 Le Roi Co Smelter WAD988507323 Removal WA 133 Leadwood Mine Tailings MOD985818210 Removal MO 134 Leviathan Mine CAD980673685 NPL CA Sulfur, copper sulfate 135 Li Tungsten Corp. NYD986882660 NPL NY Tungsten 136 Libby Asbestos Site MT0009083840 NPL MT Vermiculite 137 Lincoln Park COD042167858 NPL CO Uranium 138 Loflin Gold Mine NCN000407301 Removal NC 139 Macalloy Corporation SCD003360476 NPL SC Ferrochromium 140 Madison County Mines MOD098633415 NPL MO Lead 141 Marsh Creek Rd Abandoned Dump Site CAD980736060 Removal CA 142 Martin-Marietta Aluminum Co. ORD052221025 NPL OR Aluminum 143 Matthiessen And Hegeler Zinc Company IL0000064782 NPL IL Zinc 144 Mccleur Tailings AZ0000309096 Removal AZ 145 Mclaren Mill Tailings MTD981550841 Removal MT 146 Metals Refining Company INN000509964 MI 147 Midnite Mine WAD980978753 NPL WA Uranium 148 Midvale Slag UTD081834277 NPL UT Copper, gold, lead, silver 149 Milltown Reservoir Sediments MTD980717565 NPL MT Copper 150 Mine Site 2028 INN000510234 Removal IN 151 Minnie Moore Mine IDN001002295 Removal ID 152 Molycorp, Inc. NMD002899094 NPL NM 153 Monarch Mill IDN001002609 Removal ID 154 Monsanto Chemical Co. (Soda Springs Plant) IDD081830994 NPL ID Elemental phosphorus 155 Montclair/West Orange Radium Site NJD980785653 NPL NJ Radium 156 Monticello Mill Tailings (Usdoe) UT3890090035 NPL UT Uranium, vanadium 157 Monticello Radioactively Contaminated Properties UTD980667208 NPL UT Uranium, vanadium 158 Morning Star Mine CA0000466748 Removal CA 159 Mouat Industries MTD021997689 NPL MT Chromium, sodium dichromate 160 Mta Vermiculite Rail Spur CAN000905933 Removal CA 161 Murray Smelter UTD980951420 NPL UT 162 National Mine Tailings MOD985818228 Removal MO 163 National Southwire Aluminum Co. KYD049062375 NPL KY Aluminum 164 National Zinc Co. KSD980406698 Removal KS 165 National Zinc Corp. OKD000829440 NPL OK
9/23/2016
B1-6
Row Site Name EPA ID Site Type State Commodities mined/processed 166 Nelson Tunnel/Commodore Waste Rock CON000802630 NPL CO Silver, lead, zinc 167 Newton County Mine Tailings MOD981507585 NPL MO Lead, cadmium, zinc 168 Nl Ind, Mine, Mill COD980634604 Removal CO Arsenic, cadmium, lead, metals, silver, zinc 169 North Cave Hills Mining Sites SD0012261936 Removal SD 170 Northeast Churchrock Mine Site NNN000906132 Removal NM 171 Old Cobalt Tailings Pond UTD980717987 Removal UT 172 Omaha Lead NESFN0703481 NPL NE Lead 173 Ophir Mills And Smelter UT0010221516 Removal UT 174 Ore Knob Mine NCN000409895 NPL NC Copper, iron, silver, gold 175 Ormet Corp. OHD004379970 NPL OH Aluminum 176 Oronogo-Duenweg Mining Belt MOD980686281 NPL MO Lead, zinc, cadmium 177 Palmerton Zinc Pile PAD002395887 NPL PA Zinc 178 Pend Oreille Village WAN001002719 Removal WA 179 Pike Hill Copper Mine VTD988366720 NPL VT Copper 180 Pioneer Foundry MAN000105854 Removal MA Asbestos, lead, oil & grease, PAHs, phosphoric acid 181 Pioneer Pir And Gardner's Point Placer Mines CAN000905978 Removal CA 182 Polar Star Mine CASFN0905494 Removal CA 183 Powhatan Mining Company MDN000306665 Removal MD 184 Puckett Smelter ALN980824000 Removal AL 185 Reynolds Metals Company ORD009412677 NPL OR Aluminum 186 Richardson Flat Tailings UTD980952840 NPL UT 187 Rico - Argentine COD980952519 Removal CO 188 Rinconada Mine CA0141190579 Removal CA 189 Rock Creek Mine AKN001002823 Removal AK 190 Rsr Corporation TXD079348397 NPL TX 191 Rumsey Tailings MT0001992585 Removal MT Arsenic, lead, mercury 192 Saco Steel MEN000104208 Removal ME Metals, polychlorinated biphenyls 193 Salmon River Uranium Development IDN001002662 Removal ID 194 San Vincente Creek Tailings NMD980879415 Removal NM 195 Shaharald Mine CAN000908300 Removal CA 196 Sharon Steel Corp. (Farrell Works) PAD001933175 NPL PA Iron 197 Sharon Steel Corp. (Midvale Tailings) UTD980951388 NPL UT Lead, copper, zinc 198 Shieldalloy Corp. NJD002365930 NPL NJ Niobium, steel, chromium, aluminum 199 Shieldalloy Metallurgical Corporation OHD042319244 Removal OH 200 Silver Bow Creek/Butte Area MTD980502777 NPL MT Gold, silver, copper
9/23/2016
B1-7
Row Site Name EPA ID Site Type State Commodities mined/processed 201 Silver Mountain Mine WAD980722789 NPL WA Silver, gold 202 Silverton Mercury (Hg) Concentrators WAN001002702 Removal WA 203 Smeltertown Site COD983769738 NPL CO 204 Smuggler Mountain COD980806277 NPL CO Silver, lead 205 Southeast Idaho Selenium Project IDN001002245 Removal ID 206 Southwest Assay Site UTD988066239 Removal UT 207 Southwest Jefferson County Mining MON000705443 NPL MO Lead, zinc, barium 208 St. Joe Mineral Corp – Viburnum MOD000823252 Removal MO 209 Standard Mine CO0002378230 NPL CO Gold, silver, lead, zinc 210 Stauffer Chemical Co. (Tarpon Springs) FLD010596013 NPL FL Elemental phosphorus 211 Stephenson – Bennett Mine NMD986684231 Removal NM 212 Stibnite/Yellow Pine Mining Area IDD980665459 NPL ID 213 Sulphur Bank Mercury Mine CAD980893275 NPL CA Sulfur, mercury 214 Summitville Mine COD983778432 NPL CO Gold 215 Talache Mine ID0002007250 Removal ID 216 Tar Creek (Ottawa County) OKD980629844 NPL OK Iron, zinc 217 Tedder Road Lead MON000705452 Removal MO 218 Teledyne Wah Chang ORD050955848 NPL OR Zirconium 219 Tex-Tin Corp. TXD062113329 NPL TX 220 Tiger Metal Services Incorporated OHD004294625 Removal OH 221 Tooele Valley Railroad UT0011980278 Removal UT 222 Torch Lake MID980901946 NPL MI Copper 223 Tulsa Fuel And Manufacturing OKD987096195 NPL OK Zinc 224 Two Brothers Mine CO0012044960 Removal CO 225 U.S. Magnesium UTN000802704 NPL UT Magnesium 226 U.S. Radium Corp. NJD980654172 NPL NJ Radium 227 U.S. Smelter And Lead Refinery, Inc. IND047030226 NPL IN 228 U.S. Titanium VAD980705404 NPL VA Titanium 229 Unimin Mine Fire NCD097358766 Removal NC 230 Union Pacific Vermiculite Rail Spur CAN000905932 Removal CA 231 United Nuclear Corp. NMD030443303 NPL NM Uranium 322 Upper Tenmile Creek Mining Area MTSFN7578012 NPL MT Gold, lead, zinc, copper 233 Uravan Uranium Project (Union Carbide Corp.) COD007063274 NPL CO Radium, vanadium, uranium 234 Usda Fs Boise Nf: Monarch Mine Stamp Mill ID0001413723 Removal ID 235 V & V Mining Pcb Site VAN000305626 Removal VA
9/23/2016
B1-8
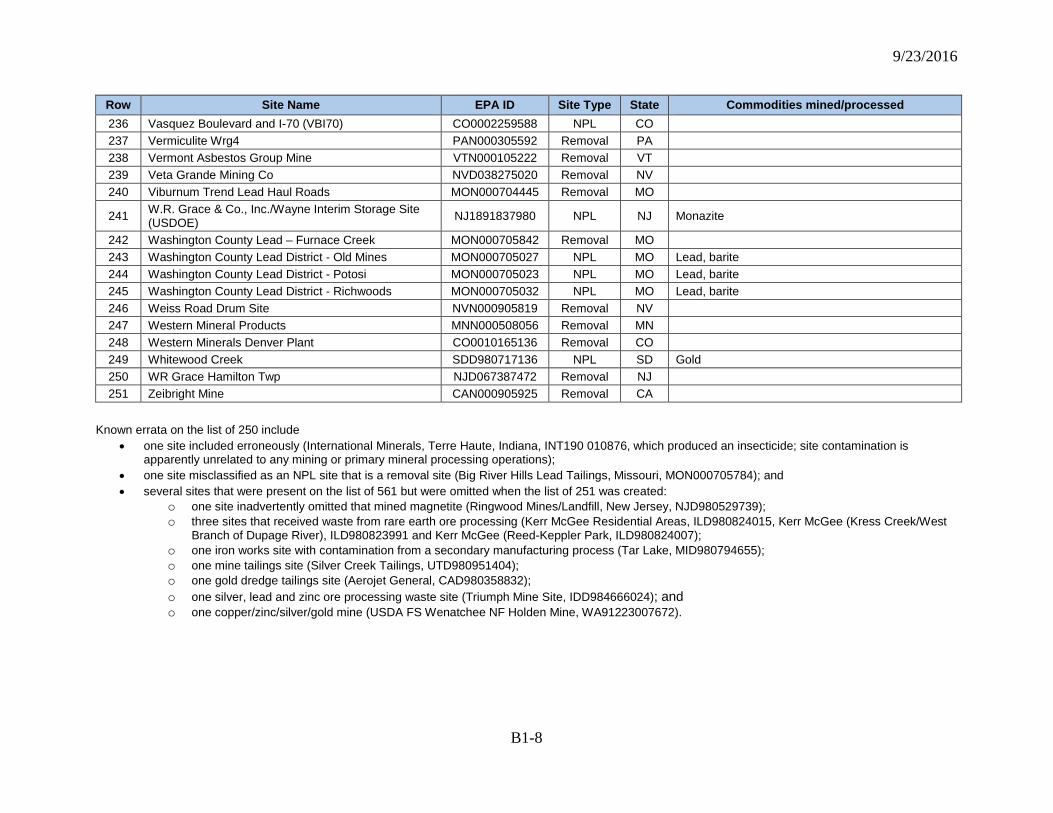
Row Site Name EPA ID Site Type State Commodities mined/processed 236 Vasquez Boulevard and I-70 (VBI70) CO0002259588 NPL CO 237 Vermiculite Wrg4 PAN000305592 Removal PA 238 Vermont Asbestos Group Mine VTN000105222 Removal VT 239 Veta Grande Mining Co NVD038275020 Removal NV 240 Viburnum Trend Lead Haul Roads MON000704445 Removal MO
241 W.R. Grace & Co., Inc./Wayne Interim Storage Site (USDOE) NJ1891837980 NPL NJ Monazite
242 Washington County Lead – Furnace Creek MON000705842 Removal MO 243 Washington County Lead District - Old Mines MON000705027 NPL MO Lead, barite 244 Washington County Lead District - Potosi MON000705023 NPL MO Lead, barite 245 Washington County Lead District - Richwoods MON000705032 NPL MO Lead, barite 246 Weiss Road Drum Site NVN000905819 Removal NV 247 Western Mineral Products MNN000508056 Removal MN 248 Western Minerals Denver Plant CO0010165136 Removal CO 249 Whitewood Creek SDD980717136 NPL SD Gold 250 WR Grace Hamilton Twp NJD067387472 Removal NJ 251 Zeibright Mine CAN000905925 Removal CA
Known errata on the list of 250 include • one site included erroneously (International Minerals, Terre Haute, Indiana, INT190 010876, which produced an insecticide; site contamination is
apparently unrelated to any mining or primary mineral processing operations); • one site misclassified as an NPL site that is a removal site (Big River Hills Lead Tailings, Missouri, MON000705784); and • several sites that were present on the list of 561 but were omitted when the list of 251 was created:
o one site inadvertently omitted that mined magnetite (Ringwood Mines/Landfill, New Jersey, NJD980529739); o three sites that received waste from rare earth ore processing (Kerr McGee Residential Areas, ILD980824015, Kerr McGee (Kress Creek/West
Branch of Dupage River), ILD980823991 and Kerr McGee (Reed-Keppler Park, ILD980824007); o one iron works site with contamination from a secondary manufacturing process (Tar Lake, MID980794655); o one mine tailings site (Silver Creek Tailings, UTD980951404); o one gold dredge tailings site (Aerojet General, CAD980358832); o one silver, lead and zinc ore processing waste site (Triumph Mine Site, IDD984666024); and o one copper/zinc/silver/gold mine (USDA FS Wenatchee NF Holden Mine, WA91223007672).
9/23/2016
B2-0
Attachment B2. Case Studies of Historical Sites
9/23/2016
B2-1
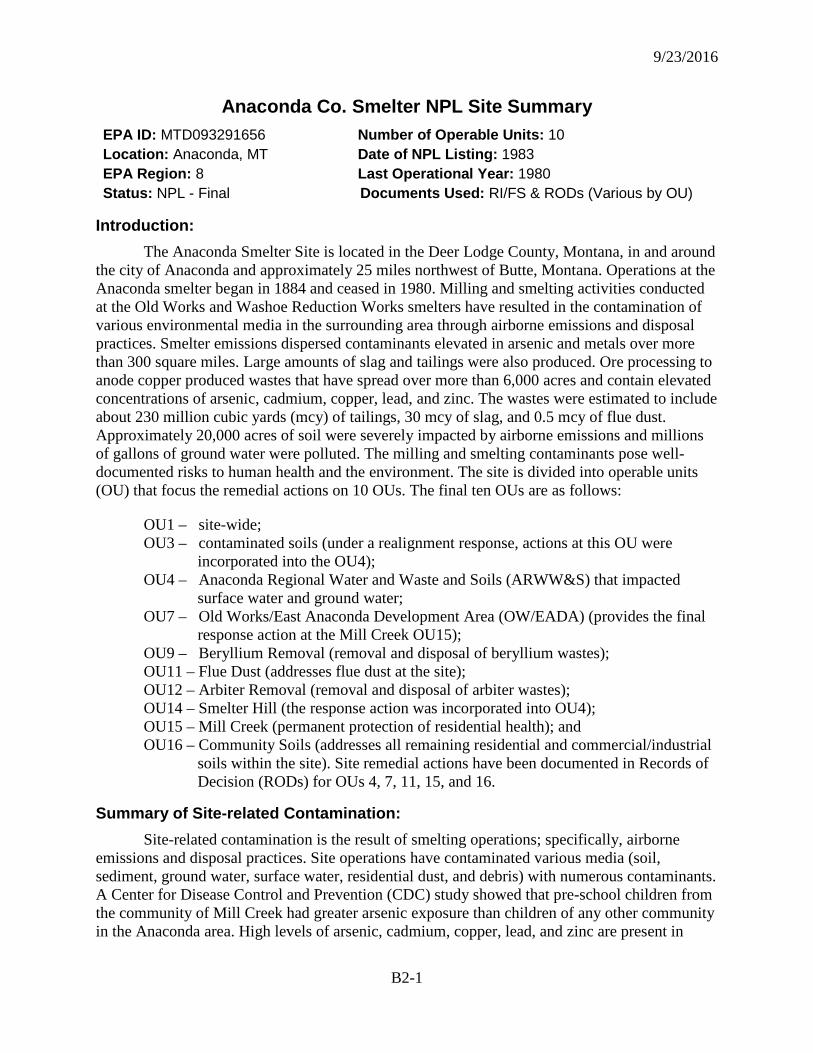
Anaconda Co. Smelter NPL Site Summary EPA ID: MTD093291656 Number of Operable Units: 10 Location: Anaconda, MT Date of NPL Listing: 1983 EPA Region: 8 Last Operational Year: 1980 Status: NPL - Final Documents Used: RI/FS & RODs (Various by OU)
Introduction: The Anaconda Smelter Site is located in the Deer Lodge County, Montana, in and around
the city of Anaconda and approximately 25 miles northwest of Butte, Montana. Operations at the Anaconda smelter began in 1884 and ceased in 1980. Milling and smelting activities conducted at the Old Works and Washoe Reduction Works smelters have resulted in the contamination of various environmental media in the surrounding area through airborne emissions and disposal practices. Smelter emissions dispersed contaminants elevated in arsenic and metals over more than 300 square miles. Large amounts of slag and tailings were also produced. Ore processing to anode copper produced wastes that have spread over more than 6,000 acres and contain elevated concentrations of arsenic, cadmium, copper, lead, and zinc. The wastes were estimated to include about 230 million cubic yards (mcy) of tailings, 30 mcy of slag, and 0.5 mcy of flue dust. Approximately 20,000 acres of soil were severely impacted by airborne emissions and millions of gallons of ground water were polluted. The milling and smelting contaminants pose well-documented risks to human health and the environment. The site is divided into operable units (OU) that focus the remedial actions on 10 OUs. The final ten OUs are as follows:
OU1 – site-wide; OU3 – contaminated soils (under a realignment response, actions at this OU were
incorporated into the OU4); OU4 – Anaconda Regional Water and Waste and Soils (ARWW&S) that impacted
surface water and ground water; OU7 – Old Works/East Anaconda Development Area (OW/EADA) (provides the final
response action at the Mill Creek OU15); OU9 – Beryllium Removal (removal and disposal of beryllium wastes); OU11 – Flue Dust (addresses flue dust at the site); OU12 – Arbiter Removal (removal and disposal of arbiter wastes); OU14 – Smelter Hill (the response action was incorporated into OU4); OU15 – Mill Creek (permanent protection of residential health); and OU16 – Community Soils (addresses all remaining residential and commercial/industrial
soils within the site). Site remedial actions have been documented in Records of Decision (RODs) for OUs 4, 7, 11, 15, and 16.
Summary of Site-related Contamination: Site-related contamination is the result of smelting operations; specifically, airborne
emissions and disposal practices. Site operations have contaminated various media (soil, sediment, ground water, surface water, residential dust, and debris) with numerous contaminants. A Center for Disease Control and Prevention (CDC) study showed that pre-school children from the community of Mill Creek had greater arsenic exposure than children of any other community in the Anaconda area. High levels of arsenic, cadmium, copper, lead, and zinc are present in
9/23/2016
B2-2
OU4 soil, sediment, tailings, slag, and other waste material. OU4 ground water contains elevated levels of arsenic, cadmium, copper, and zinc. Soils, slag, waste materials, and plant tissue in OU7 contain high levels of arsenic, cadmium, copper, lead, and zinc. OU11 also contains high levels of these contaminants in flue dust, tailings, slag, and sludge. These same contaminants are present at elevated levels in OU15 soils in extremely high levels. OU15 flue dust, tailings, and slag also contain high levels of arsenic, cadmium, and lead. OU16 also has high concentrations of arsenic and lead in soil and residential dust.
Conclusion of Site-related Risk: Human Health Risk: The primary threats contributing to human health, and the
contaminants ultimately driving the site’s remedial actions, are inorganic chemicals (arsenic, cadmium, copper, and lead). The two major media of concerns for human exposure to these contaminants are soil/dust and ground water. Residential, recreational, and occupational receptors exposed to these media potentially have unacceptable human health risks. The primary routes of human exposure to these media are ingestion (accidental or intentional) and inhalation.
Risks were not characterized for the ARWW&S OU (OU4), as data were relatively limited for some areas of the OU. Action levels were selected from Maximum Contaminant Levels (MCLs), non-zero Maximum Contaminant Level Goals (MCLGs), and State of Montana Numeric Water Quality Standards (Water Quality Bureau [WQB] standards) for comparison to site data to guide remedial activities. Consequently, risks for OU4 are not presented.
In OU7 (OW/EADA), the primary contributor to human health risk is arsenic [current cancer risks of 7E-03 and 4E-04 to occupational adult receptor from ingestion of contaminated ground water and soil, respectively, 3E-04 to recreational adult receptor from ingestion and inhalation of contaminated soil, and current non-cancer risk HQ of 30 to occupational adult from ingestion of contaminated ground water].
In OU 11 (Flue Dust), the primary contributors to human health risk are:
(1) arsenic [future cancer risks of 7E-02, 7E-02, and 5E-02 to residential adult receptors from ingestion of contaminated soil, inhalation of contaminated air and dust, and ingestion of contaminated ground water, respectively, and 4E-03 to recreational adult from ingestion of contaminated soil; current cancer risk of 9E-03 to recreational adult from ingestion of contaminated soil; future non-cancer risk HQ of 70 to residential adult receptors from ingestion of contaminated ground water; current non-cancer risk HQ of 10 to residential adult receptors from ingestion of contaminated soil];
(2) cadmium [future cancer risk of 5E-04 to residential adult receptors from inhalation of contaminated air and dust; future non-cancer risk HQ of 70 to residential adult receptors from ingestion of contaminated ground water; current non-cancer risk HQ of 2 to residential adult receptors from ingestion of contaminated soil];
(3) copper [future non-cancer risk HQs of 40 and 6 to residential child receptors from ingestion of contaminated soil and ground water, respectively, and 5 and 3 to residential adult receptors from ingestion of contaminated soil and ground water, respectively]; and
9/23/2016
B2-3
(4) lead [future on-site residential children’s estimated average blood lead levels were calculated at 73µg/dL; for current off-site children, the estimated average blood lead level is 2.6 µg/dL].
In OU15 (Mill Creek), the primary contributors to human health risk are
(1) arsenic [current cancer risk of 2.8E-03 to residential receptor from ingestion of soil, drinking water, and the non-respirable fraction from the inhalation route];
(2) arsenic and cadmium [current cancer risk of 1.6E-03 to residential receptor from inhalation of contaminated air and dust]; and
(3) cadmium and lead [current non-cancer risk HQ of 1.96 to residential receptor from ingestion of cadmium and lead, and inhalation of lead, through cumulative pathways].
In OU 16 (Community Soils), all cancer risks were below the EPA threshold of 1E-04, and no non-cancer risk HQs exceeded 1.0.
Ecological risks have been identified for a number of avian and mammalian species, plants, and aquatic organisms in OUs 4, 7, and 11 from exposure to inorganic chemicals (arsenic, cadmium, copper, lead, and zinc).
In OU4, the primary contributors to ecological risk are
(1) arsenic [current HQs of 189 and 171 for the Deer Mouse and Red Fox, respectively];
(2) cadmium [current HQs of 83.4, 12.1, and 11.1 for the American Robin, White-tailed Deer, and American Kestrel, respectively];
(3) copper [current HQs of 68.3, 60.1, 38.7, and 28.7 for the American Robin, American Kestrel, Red Fox, and White-tailed Deer, respectively]; and
(4) lead [current HQs of 158, 127, and 40 for the Red Fox, American Kestrel, and American Robin, respectively].
In OU7 (OW/EADA) and OU11 (Flue Dust), ecological risks were not quantified. However, in OU7, arsenic, cadmium, copper, lead, and zinc were qualitatively identified as contributors to ecological risk for terrestrial vegetation and wildlife from direct contact, ingestion, and inhalation of soil, plants, and surface water.
In OU11, flue dust was found to poses potential risk to aquatic organisms, contaminated soil poses potential risk to plants, and plants pose potential risks to herbivores.
Human Health Risk Driver(s): Operable Unit 7: Ground Water, Cancer
– Current Worker, Ingestion • Arsenic
Ground Water, Non-cancer – Current Worker, Ingestion
• Arsenic
Operable Unit 11 (cont’d): Ground Water, Non-cancer
– Future Adult Resident, Ingestion • Cadmium
Operable Unit 15: Soil, Drinking Water, and the Non-respirable Fraction from the Inhalation Route
9/23/2016
B2-4
Soil, Cancer – Current Worker, Ingestion
• Arsenic – Adult Resident and Adult Recreational User,
Ingestion & Inhalation • Arsenic
Operable Unit 11: Soil, Cancer
– Current & Future Adult Recreational User, Ingestion • Arsenic
– Future Adult Resident, Ingestion • Arsenic
Soil, Non-cancer – Current Adult & Child Resident, Ingestion
• Arsenic, Copper Air/Dust, Cancer
– Future Adult Resident, Inhalation • Arsenic, Cadmium
Ground Water, Cancer – Future Adult Resident, Ingestion
• Arsenic
– Current Resident, Ingestion • Arsenic
Air and Soil/Dust, Cancer – Current Residential Inhalation
• Arsenic, Cadmium
Ecological Risk Driver(s): Operable Unit 4:
– Current Avian, Combined Media/All Routes • Cadmium, Copper, Lead
– Current Mammalian, Combined Media/All Routes • Arsenic, Copper, Lead
Operable Unit 7: – Current Vegetation, Combined Media/All
Routes • Arsenic, Cadmium, copper, lead, zinc
– Current Wildlife, Combined Media/All Routes • Arsenic, Cadmium, Copper, Lead, Zinc
Operable Unit 11: Risk drivers not quantified or qualified.
Final Remedy: The selected remedial actions are as follows:
OU4 –
(1) reduce surficial arsenic concentrations to below the designated action levels of 250 parts per million (ppm), 500 ppm, and 1,000 ppm using soil cover or in situ treatment;
(2) reclamation of the soils and waste contamination via re-vegetation;
(3) partial removal of waste materials followed by soil cover and re-vegetation for areas adjacent to streams and place in designated waste management areas;
(4) for alluvial aquifers, clean up to applicable water quality standards by using soil covers, removing sources causing groundwater contamination and natural attenuation;
(5) for the bedrock aquifers and a portion of the alluvial aquifer, waive the applicable groundwater standard;
(6) for portions of the valley alluvial aquifers where ground water is underlying waste left in place, conduct point-of-compliance monitoring and institute treatment, where applicable;
(7) reclamation of contaminated soils and engineered storm water management;
(8) selective source removal and stream bank stabilization;
9/23/2016
B2-5
(9) institutional controls (ICs) and operations and maintenance to ensure monitoring, repair of implemented actions, and communication with local government and private citizens; and
(10) mitigation of impacts to wetlands from implementation of the remedy and communications with U.S. Fish and Wildlife Service will be coordinated.
OU7 (OW/EADA) –
(1) cap waste materials in recreational and potential commercial/industrial areas exceeding arsenic levels of 1,000 ppm;
(2) treat soils exceeding arsenic levels of 1,000 ppm in recreational and potential commercial/industrial areas using re-vegetation;
(3) cover or treat soils exceeding arsenic levels of 500 ppm in current commercial/industrial areas;
(4) provide for future soil remediation at the time of development;
(5) construct surface controls to manage surface water runoff;
(6) upgrade or repair levees adjacent to Warm Springs Creek to contain the 100-year peak flood event and prevent erosion;
(7) replace bridges or culverts, as necessary;
(8) implement ICs to protect engineering controls and manage future use;
(9) implement long-term monitoring; and
(10) preserve, to the extent practicable, historic features in the Old Works Historic District.
OU11 (Flue Dust) –
(1) removal and treatment via cement/silicate-based stabilization of approximately 316,500 cy of flue dust material;
(2) disposal of treatment residuals in an on-site repository; and
(3) implementation of ICs and monitoring of the disposal area.
OU15 (Mill Creek) –
(1) relocation of all residents;
(2) demolition of structures; and
(3) fencing the entire site.
OU16 (Community Soils) –
(1) clean up all current residential soils that exceed 250 ppm soil arsenic concentration, through removal, clean backfill, and protective barrier;
(2) where removal is not implementable, treatment or other measures will be taken to reduce arsenic concentrations to below the 250 ppm or to prevent exposure;
9/23/2016
B2-6
(3) clean up future residential soils at the time of development that exceed 250 ppm soil arsenic concentration;
(4) implement ICs to provide educational information to all residents;
(5) clean up all current commercial or industrial areas that exceed 500 ppm soil arsenic concentration using re-vegetative techniques and/or engineered covers;
(6) clean up all future commercial or industrial areas at the time of development that exceed the commercial/industrial action level of 500 ppm soil arsenic concentration;
(7) construct a cap over contaminated railroad bed material; and
(8) restrict access to the rail bed with a barrier and control surface runoff.
9/23/2016
B2-7
Bueno Mill and Mine Removal Site Summary EPA ID: CON000802129 Number of Operable Units: 1 Location: Jamestown, CO Date in CERCLIS: 2002
EPA Region: 8 Last Operational Year: Unknown, not currently in operation
Status: Removal – Time Critical Documents Used: Action Memorandum, Site Assessment Report, Pollution Report
Introduction: The site is located in the Jamestown Mining District, in Boulder County, Colorado. The
Jamestown Mining District extends across portions of the Lefthand Creek and South St. Vrain Creek watersheds. The contamination at the site is a result of mining and milling activity, starting in 1879, that produced gold, silver, and copper. The primary sources of contamination are tailings piles, mine waste dumps, and adits. The Bueno Tailings are located on a ridge northwest of Jamestown and approximately 3,800 feet southeast of the Bueno Mine. The site is owned by the Town of Jamestown, the U.S. Forest Service (USFS), and a private property owner. The second portion of the site is another tailings deposit near the floodplain of the Little James River and a large collection pond. These tailings are commonly referred to as the Streamside Tailings and comprise a large deposit in the creek channel, with the majority being impounded along the stream bank. The Bueno and Streamside tailings deposits combined are estimated to contain at least 40,000 cubic yards. This portion of the site is owned by a private landowner. The Town of Jamestown diverts water from James Creek for municipal use, including drinking water, just above the confluence with Little James Creek and along the stretch adjacent to the Bueno Tailings. In addition, flooding of Little James Creek is a significant concern for the long-term stability; the Streamside Tailings impoundment and routine flow continues to erode the tailings deposited in the creek and undermine the base of the impoundment due to their proximity to the creek. As a result, metals (primarily lead and zinc) have been found in the soil and surface water sediments.
Summary of Site-related Contamination: Site operations have contaminated various media (soil, surface water, and sediment) with
numerous inorganic chemicals. A watershed survey conducted by U.S. Environmental Protection Agency (EPA) Region 8 and the USFS identified several sources of heavy metals loadings to the James Creek and Little James Creek surface water. In addition, the Jamestown water treatment plant has reported impacts to the water supply during run-off events transporting tailings from the Bueno Tailings Site. Consequently, the USFS identified the site as a priority within the Left-Hand Watershed for a potential removal action. A Removal Assessment was initiated in May 2005 and found high levels of lead, as well as other contaminants, in tailings deposits. These contaminants in the tailings are released from the tailings impoundments into the environment, including nearby residences and drinking water supply. The primary contaminants ultimately driving the site’s remedial action are arsenic, copper, lead, and zinc.
9/23/2016
B2-8
Conclusion of Site-related Risk: The primary threats contributing to human health risks are inorganic chemicals (arsenic,
copper, lead, and zinc). The onsite media of concern for human health risk are soil and surface water to current on-site trespasser receptors through unidentified pathways. In addition, current offsite residents may be at risk in the future due to migration of contaminants from the tailings through surface water into the drinking water supply. Current residents also may be at risk from hazardous substances becoming airborne or migrating offsite through other unspecified mechanisms. No human health risks were quantified for individual or combined exposure routes.
The primary contributors to ecological risk, for fish and fauna, are copper, lead, and zinc through direct contact with surface water and sediment or ingestion of food; no ecological risks were calculated for individual or combined exposure routes.
Final Remedy: The selected remedy addressed surface water, soil, and tailings waste. The initial action
implemented was the installation of erosion-control fencing to reduce discharge of tailings into the Little James Creek prior to the spring runoff period. In addition, to address tailings waste and contaminated soil the following two options may be implemented that includes: (1) two tailings deposits will be relocated to one of the two onsite locations, and the tailings will be capped with geo-synthetic and soil cover and protected from run-off; or (2) this is not the preferred option but will be implemented if option 1 is not feasible, and entails consolidating tailings deposits at the existing Bueno Tailings location where the pile will be graded with a positive slope extending out from the center with a lined perimeter ditch constructed at the top margins of the pile and capped with a soil cover then re-vegetated.
To address surface water, the Streamside Tailings area will be stabilized and the channel restored. The tailings removal will be performed to the extent that the main impoundment is left in place. The uncontained tailings below the impoundment will be removed, and the dispersed deposits on the banks and in the channel of Little James Creek downstream from the impoundment area may not be removed to avoid creating further impacts to the streambed.
9/23/2016
B2-9
Bunker Hill Mining & Metallurgical Complex NPL Site Summary EPA ID: IDD048340921 Number of Operable Units: 3 Location: Smelterville, ID Date of NPL Listing: 1983 EPA Region: 10 Last Operational Year: 1998 Status: NPL - Final Documents Used: RI/FS & RODs (Various by OU)
Introduction: The Bunker Hill Mining & Metallurgical Complex is a former lead and zinc smelting
operation located in Smelterville, Idaho. The complex includes the Bunker Hill mine and mill, a lead and zinc smelter, and a phosphoric acid fertilizer plant. The facility includes mining-contaminated areas in the Coeur d’Alene River corridor, adjacent floodplains, downstream water bodies, tributaries, and fill areas, as well as the 21-square-mile Bunker Hill “Box,” located in the area surrounding the smelting operations (the cities of Kellogg, Page, Pinehurst, Smelterville, and Wardner in Shoshone County). Mining within the Coeur d’Alene Basin has resulted in millions of tons of mill tailings, mine waste rock, and ore concentrates spread across the site. Mining contamination has affected more than 166 river miles of the Coeur d’Alene River corridor, adjacent floodplains, downstream water bodies, tributaries, and fill areas. Since 1968, tailings produced have generally been impounded or placed back in the mines. Inorganic chemical contamination is present in soil, sediment, surface water, and ground water from commercial mining, milling, and smelting operations, and associated modes of transportation. The site is divided into three operable units (OUs): the populated areas of the Box (OU1), the non-populated areas of the Box (OU2), and mining-related contamination in the broader Coeur d’Alene Basin (OU3).
Summary of Site-related Contamination: Commercial mining, milling, and smelting operations, and associated modes of
transportation, have led to site-wide contamination. An estimated 62 million tons of tailings were discharged to streams within the Coeur d’Alene Basin prior to 1968, containing an estimated 880,000 tons of lead and more than 720,000 tons of zinc. All three of the site’s OUs are contaminated with inorganic chemicals (primarily antimony, arsenic, cadmium, copper, iron, lead, mercury, silver, and zinc) across multiple media (soils, surface water, ground water, sediment, waste piles, and dust). Land uses potentially affected by site contamination in all OUs include residential, occupational, and recreational.
Conclusion of Site-related Risk: In past years, children within a 2-mile radius of the industrial complex have been found
to have elevated levels of lead in their blood from exposure to contaminated community soils. The primary threats contributing to human health and ecological risks, and the contaminants ultimately driving the site’s remedial action, are inorganic chemicals.
The contaminants that pose a risk to human health include antimony, arsenic, cadmium, copper, iron, lead, mercury, and zinc. The media of concern for human exposure are soil/dust, particulates in the air, ground water, and food. The receptors with potentially unacceptable risk from these media are future occupational workers and current residential receptors (particularly child residents). The primary routes of exposure to these media are ingestion (accidental or
9/23/2016
B2-10
intentional), inhalation, or combined exposure routes. The primary contributors to human health risk were determined by adding the risk associated with potentially high-risk activities to the baseline estimate. The baseline estimate comprises the following activities: (1) ingestion of residential yards soil, (2) ingestion of house dust, (3) inhalation of particulates, (4) consumption of produce, and (5) ingestion of public water supplies. In OU1, the primary contributors to human health risk are (1) arsenic (current baseline cancer risk of 1.1E-03 to residential receptor; additive risk includes [a] 6.7E-04 for ingestion of contaminated local ground water, [b] 2.2E-04 for ingestion of soil and dust [child with pica], and [c] 3.1E-05 for ingestion of residential soil at 95th percentile concentration); (2) cadmium (current baseline cancer risk of 5.8E-05 to residential receptor [no additive risk potential]); and (3) lead (50% of children within a 2-mile radius, and 30% within 2- to 3-mile radius, of the industrial complex had blood levels above 10 µg/dL). In OU2, the primary contributors to human health risk are (1) arsenic (future cancer risk of 8.6E-04 to residential receptor from ingestion of contaminated food [market purchases]); and (2) combined inorganic chemicals (cadmium, lead, and mercury) (non-cancer HQ of 35.8 to future occupational receptor from baseline risk plus groundwater ingestion). In OU3, the primary contributors to human health risk are (1) arsenic (current cancer risk of 3E-04 to current residential receptors [adult and child] from combined exposure to yard soil and tap water); (2) cadmium (future HQ of 17 for future residential children ingestion of contaminated ground water); and (3) lead (11% of children surveyed were found to have blood lead levels above 10 µg/dL).
An ecological risk assessment was not conducted for OU1 due to the lack of sufficient/critical habitat. Ecological receptors in OU2 and OU3 include terrestrial biota, plants, soil invertebrates, microbial soil community viability, small- and medium-sized mammals, waterfowl, birds, benthic organisms, fish, aquatic plant species, and amphibians. The OU2 ecological risk assessment found inorganic chemicals (antimony, arsenic, copper, lead, manganese, mercury, silver, and zinc) to have qualitative risks for (1) benthic invertebrates, fish, and aquatic plants from surface water exposure; (2) terrestrial plants, soil invertebrates, and small mammals from soil; and (3) terrestrial plants from ground water and surface water. Qualitative risks included potentially adverse or toxic effects, possibly sub-lethal. The primary contributors to ecological risk in OU3 (for which pathways were not identified) are (1) lead (current HQ of 387 to Spotted Sandpipers); (2) zinc (current HQ of 35 and 25.5 to Song Sparrows and Masked Shrews, respectively); (3) mercury (current HQ of 7.5 to birds); and (4) cadmium (current HQ of 6.12 to Song Sparrows).
9/23/2016
B2-11
Human Health Risk Driver(s): Operable Unit 1: Baseline Cancer
– Current Resident, Combined Media and Exposure Routes • Arsenic, Cadmium
Percent Children with Blood Lead Levels >P10 • 50% (2-mile radius), 30% (2- to 3-mile
radius
Operable Unit 2: Food (Market Basket), Cancer
– Future Resident, Ingestion • Arsenic, Cadmium
Baseline Non-cancer – Future Worker, Groundwater Ingestion • Cadmium, Lead, Mercury
Operable Unit 3: Combined Soil & Tap Water, Cancer
– Current Resident, All Pathways • Arsenic
Ground water, Non-cancer – Future Child Resident, Ingestion • Cadmium
Percent Children with Blood Lead Levels >P10 • 11%
Ecological Risks Driver(s): Operable Unit 2: All risks were qualitative
Operable Unit 3: • Avian Risk: Cadmium, Copper, Lead,
Mercury, Zinc • Mammalian Risk: Arsenic, Copper, Zinc
Final Remedy: The selected remedial actions address soil/source materials, ground water, surface water,
and airborne dust. The selected remedial actions are as follows:
OU1 (Populated Areas) –
(1) Sampling of residential properties’ soils; removal, replacement, and re-vegetation of contaminated yard soil and sod; placement of a visual marker if lead in soil concentrations exceed 1,000 parts per million (ppm) below the depth of excavation; onsite disposal of contaminated materials;
(2) dust suppression measures; and
(3) institutional controls and monitoring.
OU2 (Non-populated Areas) –
(1) stabilization of hillsides and associated drainages, including the re-establishment of riparian habitat and stream corridor vegetation;
(2) drainage improvements to minimize contact between surface water and tailings and mine waste rock, and to reduce contaminant transport (i.e., sediment runoff) to the South Fork of the Coeur d’Alene River;
(3) closure and cover of onsite solid waste landfills;
(4) cap waste impoundment areas to minimize releases and infiltration through tailings and sludges;
(5) closure of onsite wells;
(6) road repair;
9/23/2016
B2-12
(7) removal of contaminated soil and materials from gulches; and
(8) demolition of stacks and buildings.
OU3 (Mining-related Contamination in the Broader Coeur d’Alene Basin) –
(1) No further actions beyond those taken under OUs 1 and 2 for the protection of human health in community and residential areas;
(2) for environmental protection in the Upper Basin and Lower Basin, an adaptive management strategy that consists of approximately 30 years of prioritized actions designed to achieve benchmarks for environmental protection;
(3) for Coeur d’Alene Lake, no remedial actions; state, tribal, federal, and local governments implemented a Lake Management Plan outside of the Superfund process using separate legal authorities; and
(4) for Spokane River, remedy includes all of the human health remedy upstream of Upriver Dam and all of the environmental remedy from the Idaho/Washington border to Upriver Dam; additional sampling to determine the need to address areas upstream of the state line for environmental protection and downstream of Upriver Dam for human health and environmental protection; and quantification of risks to persons, including Spokane tribal members and others who may practice a subsistence lifestyle in the Spokane River area and related appropriate future response actions, if any.

9/23/2016
B2-13
Captain Jack Mill NPL Site Summary EPA ID: COD981551427 Number of Operable Units: 1 Location: Ward, CO Date of NPL Listing: 2003 EPA Region: 8 Last Operational Year: 1992 Status: NPL – Final Documents Used: RI/FS & RODs (Varies by OU)
Introduction: The Captain Jack Mill site is a former mining operation located near Ward, Colorado, in
Boulder County, within the Left Hand Creek Watershed. The site occupies a narrow valley called California Gulch and extends from the Big Five Adit toward the southeast to just above the intersection of Left Hand Canyon and Sawmill Roads. The site and resulting contamination is a result of mining and milling operations that produced gold and silver from low-grade ores. The site contains three distinct mining areas, as well as numerous smaller workings that operated over a period of more than 100 years and ceased operations in 1992. Waste on the site as a result of these operations includes waste piles, settling ponds, lagoons used for settling tailings, waste rock from mine tunnels, and a mine/mill dump. Approximately 85,000 cubic yards (cy) of contaminated waste rock, tailings, and soils were identified, which include approximately 9,000 cy of the highest contaminant concentration materials considered principal threat waste. The site was added to the NPL in 2003 because of the threat to human health and the environment posed by surface and subsurface contamination. The site is evaluated as one Operational Unit (OU00) that includes site-wide contamination.
Summary of Site-related Contamination: Site-related contamination is the result of mining and milling operations; specifically,
waste piles, settling ponds, lagoons for settling tailings, waste rock from mine tunnels, and a mine/mill dump. Site operations have contaminated various media (food [fish and garden produce), ground water, mine water, surface water, sediment, subsurface soil, and surface soil) with numerous contaminants. Captain Jack Mill is contaminated with inorganic chemicals (primarily antimony, arsenic, cadmium, chromium, copper, iron, manganese, mercury, thallium, and zinc) and organic chemicals (primarily aroclor-1016, aroclor-1221, aroclor-1232, aroclor-1242, aroclor-1248, aroclor-1254, aroclor-1260, benzo(a)anthracene, benzo(a)pyrene, benzo(b)fluoranthene, and benzo(k)fluoranthene).
Conclusion of Site-related Risk: The primary threats contributing to human health risks, and the contaminants driving the
site’s remedial action, are inorganic chemicals (primarily arsenic and chromium) and organic chemicals (primarily benzo[a]pyrene). The major media concerns for human exposure to site-related contaminants are surface soil, subsurface soil, surface water, ground water, mine water, sediment, and food (fish and garden produce). The receptors with potentially unacceptable risk from these media are current and future residential, recreational, and occupational receptors. The primary routes of exposure to these media are dermal contact and ingestion.
The primary contributors to human health risk for current and future residents are (1) arsenic (cancer risk of 8.1E-03 and non-cancer hazard quotient [HQ] of 150 from surface soil ingestion); (2) benzo(a)pyrene (cancer risk of 4.7E-03 from dermal contact with ground water);
9/23/2016
B2-14
and (3) chromium (cancer risk of 3.2E-03 for mine water ingestion, 3.1E-03 for ground water ingestion, and 2.7E-03 for surface soil ingestion). The primary contributors to human health risk for current and future occupational receptors are: (1) arsenic (cancer risk of 6E-03, and non-cancer HQ of 37 from surface soil ingestion; cancer risk of 5.4E-04 for dermal contact with surface soil); and (2) chromium (cancer risk of 2E-03 for surface soil ingestion and 3.8E-04 for subsurface soil ingestion). The primary contributors to human health risk for current and future recreationalists are: (1) arsenic (cancer risk of 1.2E-03, and non-cancer HQ of 22 from surface soil ingestion, and cancer risk of 1.1E-04 from dermal contact with surface soil); and (2) chromium (cancer risk of 4.1E-04 for surface soil ingestion, 2.4E-04 for ingestion of fish, and 1.5E-04 for sediment ingestion).
The ecological receptors with risk from exposure to site-related contamination are avian and mammalian receptors, terrestrial plants and invertebrates, and aquatic life. The primary routes of exposure are direct contact with surface and subsurface soil, seeps, springs, and surface water; ingestion of surface soils, surface water, seeps, and springs; and ingestion of subsurface soil and aquatic life; and direct contact with seeps, springs, surface water, and sediments. The primary contributors to current environmental risk are (1) zinc (HQ of 5540 to Mountain Chickadee through ingestion of terrestrial invertebrates, and HQ of 488 to Red-tailed Hawk through ingestion of terrestrial invertebrates, birds and mammals); (2) aroclor-1221 (HQ of 2550 to Mountain Chickadee, and HQ of 1990 to American Dipper from all ingestion of benthic invertebrates); (3) lead (HQ of 2010 to Mountain Chickadee from ingestion of terrestrial invertebrates, and HQ of 419 to plants from direct contact with surface soil); (4) cadmium (HQ of 1540 to Mountain Chickadee from ingestion of terrestrial invertebrates); (5) copper (HQ of 1320 to Mountain Chickadee from ingestion of terrestrial invertebrates); and (6) aroclor (1016, 1232, 1242, 1248, 1254, and 1260) (each chemical has a non-cancer HQ of 1260 to Mountain Chickadee from ingestion of benthic invertebrates).
Human Health Risk Driver(s): Operable Unit 00 (site-wide): Surface Soil, Cancer
– Current & Future Resident, Ingestion • Arsenic, Chromium
– Current & Future Worker, Ingestion/Dermal • Arsenic
– Current & Future Recreational User, Ingestion/Dermal • Arsenic, Chromium
Surface Soil, Non-cancer – Current & Future Resident and Worker,
Ingestion • Arsenic
– Current & Future Recreational User, Ingestion • Arsenic
Subsurface Soil, Non-cancer – Current & Future Worker, Ingestion
• Chromium
Mine Water, Cancer
– Current and Future Resident, Ingestion • Chromium
Food, Cancer – Current and Future Recreational User,
Ingestion (Fish) • Chromium
Ecological Risk Driver(s): Operable Unit 00 (site wide): Food (Terrestrial Invertebrates)
– Current Mountain Chickadee, Ingestion • Lead
Food (Terrestrial Invertebrates) – Current Red-tailed Hawk, Ingestion • Zinc
Food (Benthic Invertebrates) – Current Avian (Mountain Chickadee,
American Dipper), Ingestion
9/23/2016
B2-15
Ground Water, Cancer – Current and Future Resident, Ingestion
• Chromium
• Aroclor-1016, 1221, 1232, 1242, 1248, 1254, 1260
Surface Soil – Current Plants, Direct Contact • Lead
Final Remedy: The following outlines the selected remedial actions address ground water, surface water,
and soil site-wide.
Surface Contamination Sources – (1) excavation and treatment of all contaminated materials and placement in constructed
consolidation cells;
(2) amendment of waste material by mixing lime into top 6 inches, cap with 6 inches of topsoil on top of 12 inches of select fill on top of a geo-synthetic clay liner, construction of consolidation cells;
(3) diversion of surface water runoff; and
(4) implementation of access controls.
Subsurface Contamination Sources – (1) installation of bulkhead in tunnel and monitor for underground leaks;
(2) use of injection wells to circulate NaOH or another pH-buffer into the mine pool;
(3) monitoring of surface water;
(4) if downstream RAOs are not being met, installation of a series of biochemical reactors outside the adit atop the waste dump; and
(5) use of microorganisms to biologically transfer hazardous contaminants into non-hazardous substances, and routing of treated waters to onsite wetlands or discharge them to a creek. Surface water diversion allows for the draining of 50 gallons per minute of metals-contaminated water. 33,972 cubic yards of waste rock, tailings, are being remediated.
9/23/2016
B2-16
Cimarron Mining Corporation NPL Site Summary EPA ID: NMD980749378 Number of Operable Units: 2 Location: Carrizozo, NM Date of CERCLA Regulation: 1989 EPA Region: 6 Last Operational Year: 1982 NPL Status: NPL - Final Documents Used: RI/FS & ROD (Various by OU)
Introduction: The Cimarron Mining Corporation is located in Carrizozo, Lincoln County, New Mexico.
The Site is divided into two operable units (OUs). OU1 is the Cimarron Mill Site, which is approximately 10.6 acres and is located on the north side of Highway 380. OU2 consists of the Sierra Blanca Mill Site, which is 7.5 acres in area and is located east of U.S. Highway 54. The mill sites operated from 1960 to July 1982, with some temporary shutdowns. OU1 is an inactive milling facility and was used to recover iron and precious metals from ores. In 1979, the site was sold to Southwest Mineral Corporation, and soon thereafter, cyanide was apparently used to extract precious metals from the ore. OU2 was used to recover a variety of metals from ore transported to the site, although cyanide was apparently not used at this location. The site utilized precious metal extraction processes, which resulted in the unpermitted discharge of contaminated liquids and the stockpiling of approximately 570 cubic yards of contaminated material piles and other waste sediment. In 1979, the Sierra Blanca Mill Site was leased to American Minerals Recovery Corporation. The milling operation at OU1 was relocated to OU2 in June 1982. Both sites are currently inactive. OU1 is currently used as an auto repair shop and salvage yard. OU2 is fenced and is currently owned by the Town of Carrizozo. OU2 is presently not being used for residential or commercial purposes.
Summary of Site-related Contamination: Site operations, primarily ore recovery and extraction processes, have contaminated
various media—mainly cyanide in OU1 and lead in OU2. OU1 is contaminated with approximately 30 inorganic chemicals, including arsenic, chromium VI, cyanide, and nitrate. In OU1, ground water is contaminated at levels up to 400 parts per billion (ppb), with cyanide due to poor well construction allowing waste from cyanide recovery to reach shallow ground water. OU2 is contaminated with inorganic chemicals, including arsenic, barium, beryllium, copper, lead, manganese, mercury, silver, sodium, and zinc. Within OU2, there are approximately 43 cubic yards of tank sediments, 182 cubic yards of material pile soils and rock, and 345 cubic yards of discharge pit sediment and site soils contaminated with lead levels above 500 ppm.
Conclusion of Site-related Risk: The primary threats contributing to human health risk, and the contaminants driving the
remedial action, are inorganic chemicals (primarily arsenic, barium, chromium VI, cyanide, lead, manganese, nitrate, and silver). The major media of concern for human exposure to inorganic chemicals are soil, sediment, ground water, dust, and material piles. Residents exposed to contaminated media via accidental or intentional ingestion, dermal contact, or inhalation may have elevated health risks.
In OU1, the pathways of concern are ingestion of soil, sediment, or ground water and dermal contact with sediment by future onsite residential receptors. The primary contributor to
9/23/2016
B2-17
cancer risk is arsenic [cancer risk of 2.6E-05, 8.7E-06, and 1.7E-06 to residential children from the ingestion of sediment, ingestion of soil, and dermal contact with sediment, respectively]. Non-cancer risks from site-related contamination are the result of ingesting contaminated ground water. Non-cancer risks to residential children range from HQ 1.9 (chromium VI) to 9.5 (cyanide); non-cancer risks to residential adults range from HQ 3.5 (nitrate) to 4.1 (cyanide). In OU2, the pathways of concern include ingestion of surface soil, material piles, or tank sediment; dermal contact with surface soil or tank sediment; and inhalation of dust by future onsite residential receptors. Cancer risks for the operable unit were calculated for exposure to all contaminants assuming a 30-year exposure, beginning at childhood; however, arsenic and lead were identified as the primary contributors to risk. The cancer risks range from 4.70E-06 (dermal contact with material piles) to 9.30E-04 (ingestion of surface soil). Non-cancer risks range from 1.4 (ingestion of surface soil contaminated with barium) to 4.4 (ingestion of tank sediments contaminated with silver).
Current environmental threats are associated with exposure to cyanide via contaminated food and soil. In OU1, the primary threat to ecological risk is from cyanide. The receptor identified in the calculation of ecological HQs was rabbits, and the pathway identified includes combined ingestion of food and soil [HQ of 9 to rabbits through ingestion of contaminated food items and soil]. Ecological risk information was not quantified for OU2; however, localized lead deposit posed concern.
Human Health Risk Driver(s): Operable Unit 1: Soil, Cancer
– Future Child Resident, Ingestion • Arsenic
Ground Water, Non-Cancer – Future Child Resident, Ingestion • Chromium (VI), Cyanide, Nitrate
Operable Unit 2: Soil, Cancer
– Future Resident, Ingestion • Arsenic, Lead
Operable Unit 2 (cont’d): Soils (Surface Soil, Material Piles, Tank Sediments), Non-Cancer
– Future Resident, Ingestion • Barium, Manganese, Silver
Ecological Risk Driver(s): Operable Unit 1: Soil, Food
– Current & Future Mammalian, Ingestion • Cyanide
Final Remedy: The selected remedial actions are summarized below.
OU1 –
(1) pump and discharge ground water to the Carrizozo Publically Owned Treatment Works (POTW);
(2) biological activity within the existing treatment lagoons, in addition to effluent chlorination and photodecomposition, will provide treatment to reduce the cyanide concentration to acceptable levels; and
(3) monitoring of the treatment plant effluent and sludge.
9/23/2016
B2-18
OU2 –
(1) solidification/stabilization of contaminated soils and waste piles exceeding 500 ppm lead and onsite disposal;
(2) site wide groundwater monitoring; removal to the process chemical drums, and decontamination of tanks and associated piping; filling in the discharge pit and cinder block trenches with onsite soils and waste pile materials and covering with clean fill; plugging of the onsite abandoned water supply well; and inspection and maintenance of the existing fence. Approximately 225 cubic yards of contaminated soil will be remediated using solidification/stabilization with onsite disposal.
9/23/2016
B2-19
Cyprus Tohono Mine Removal Site Summary EPA ID: AZD094524097 Number of Operable Units: 1 Location: Casa Grande, AZ Date in CERCLIS: 2002 EPA Region: 9 Last Operational Year: 1997 Status: Removal – Non-Time Critical Documents Used: Fact Sheet, PA/SI
Introduction: The Cyprus Tohono Corporation holds a mining lease of 4,180 acres with the Bureau of
Indian Affairs and the Tohono O'odham Nation and a business lease that includes an additional 6,325.5 acres for a total of 10,505.5 acres located in Casa Grande, Arizona. The Cyprus Tohono Mine site is located on the southwest flank of the Slate Mountains on the Tohono O'odham Nation. The site is located in an undeveloped rural area, approximately 1 mile east of the village of Gu Komelik. Copper mining at the site began in the 1880s. Copper remained the mine’s primary commodity as large-scale underground mining operated from 1970 to 1983. Copper leaching operations began in 1983 using a sulfuric acid solution (raffinate) pumped into over 500 injection wells. In-situ leaching operations were stopped in 1994 with the commencement of open pit mining, which continued until 1997. Through January 2005, extraction/electro-winning operations for processing heap solutions were conducted. Current contamination issues stem from mining operations, beginning with the large-scale mining in 1970. Major mine facilities remaining on site include a solvent extraction/electro-winning plant, offices, laboratories, and a lined heap-leach pad. Areas of mining-produced materials on site include (1) vat leach tailings (leached oxide ore material produced during vat leach operations from 1975 to 1983); (2) mill tailings (residual material from processing sulfide ore in a ball mill and flotation plant generated beginning in the mid-1970s; the mill tailings impoundment was also used for the placement of mine discharge waters, vat leach wash solutions, cementation copper bleed solution, roaster cooling solutions, direct precipitation rain water, and storm event run-on of rain waters from the plant area); (3) evaporation pond materials (from evaporation ponds constructed in 1973 of local alluvial material and lined with 3 to 8 feet of mill tailings; the ponds were used for placement of excess mill waters and in-situ leach solutions); (4) calcine leach residue ponds (calcine is a residue material generated as a result of roasting copper concentrate, and calcine leach residue is the solid residue material remaining after the calcine has been leached with raffinate solution to extract the copper values); and (5) overburden (unmineralized alluvium, fanglomerate, and other bedrocks of insignificant mineral value). Mining operations on site ceased in 1997.
Summary of Site-related Contamination: The contamination originates from onsite operations, including vat leach operations,
processing sulfide ore, roasting of copper, and other mining and milling operations. Ground water on site has been contaminated with inorganic chemicals (selenium, sulfate, and thallium) and radionuclides (uranium-234 and uranium-236). Onsite soil and source materials were found to have elevated levels of inorganic chemicals (aluminum, arsenic, beryllium, cadmium, chromium, cobalt, copper, iron, magnesium, manganese, mercury, nickel, potassium, selenium, silver, sodium, sulfate, thallium, and zinc) and radionuclides (radium-228, thorium-228, thorium-230, thorium-232, uranium-234, uranium-235, and uranium-238). In residences in the village of Gu Komelik, samples indicated elevated levels of sulfate and nitrate. Forty migratory shore birds
9/23/2016
B2-20
(including 37 Avocets, 1 Mallard Duck, 1 Egret, and 1 Cormorant) have died after contact with Pit Lake, an artificial surface water body on the site.
Conclusion of Significant Site-related Risk: The major media of concern for human exposure to inorganic chemicals and
radionuclides are soil, dust, and ground water. The primary routes of exposure to these media are ingestion, inhalation, and combined routes. The receptors with potential risk from these media are current residential receptors. Levels of uranium and sulfate in ground water (tested from onsite wells) exceeded health based benchmarks. Two wells approximately 1 mile west of the site, which residents use for drinking water, were also found to have elevated levels of sulfate (1500 mg/L) and uranium concentrations (uranium-234, 51.8 pCi/L) that exceed the U.S. Environmental Protection Agency’s Maximum Contaminant Limits (MCLs) for drinking water of 250 mg/L and 1.1 pCi/L, respectively. People who ingest this water may have an elevated health risk. Levels of sulfate and uranium in the ground water have been continually increasing over time. There have also been reports of dust blowing into residential areas from the mine site. Samples taken of residential soils indicate elevated levels of sulfate on one property. No quantitative health risks were calculated for individual or combined exposure routes.
The major media of concern for ecological receptors to contaminants is surface water and soil. Current ecological threats directly affect terrestrial organisms, migratory birds, and the biotic community. The primary contributors to ecological risk, to which no specific receptors were provided, include inorganic chemicals (selenium, sulfate, and thallium) and radionuclides (uranium-234 and uranium-236). Surface water from Pit Lake contains elevated levels of uranium (uranium 234 at 50.2 pCi/L, uranium 235 at 2.8 pCi/L, and uranium 238 at 46.6 pCi/L) and sulfate (3,880 mg/L) that exceed MCLs of 1.1 pCi/L and 250 mg/L, respectively. The artificial habitat at Pit Lake is used by migratory shore birds. The Cactus Ferrigunous Pygmy Owl has been observed near the site and may be affected by contaminated soils on site due to feeding habits. No quantitative ecological risks were calculated.
Final Remedy: The selected remedy addresses ground water, soil, and surface water media. To reduce
risk to residents from ground water,
(1) all residential wells were shut down,
(2) ground water monitoring was put in place, and
(3) residents were supplied with an alternative source of water.
To address risk in surface water,
(1) media were chemically treated and filtered,
(2) storm water sumps were excavated, and
(3) new contingency systems/ponds were installed to mitigate contaminant release.
In addition, to improve surface water flow and eliminate erosion, specific locations were re-vegetated and re-contoured. To help eliminate threats from contaminated airborne soil, a dust-control program was implemented.

9/23/2016
B2-21
Finally, to address overall site conditions,
(1) all historic processing facilities were dismantled and
(2) a habitat improvement plan was implemented, including a study and documentation of the Cactus Ferruginous Pygmy Owl, an endangered species.
The amount of each media remediated/removed was not documented.
9/23/2016
B2-22
Eagle Mine NPL Site Summary EPA ID: COD081961518 Number of Operable Units: 3 Location: Minturn, CO Date of NPL Listing: 1985 EPA Region: 8 Last Operational Year: 1984 Status: NPL - Final Documents Used: RI/FS & RODs (Varies by OU)
Introduction: The Eagle Mine and its tailings piles, previously owned by the New Jersey Zinc Co. and
Gulf and Western Industries, cover 110 acres in Eagle County, Colorado, between the towns of Minturn and Redcliff. About 1,300 people live within 3 miles of the tailings. The company's predecessors began purchasing mines in the area in 1912 and immediately began production. Zinc mining and milling operations ceased on December 30, 1977. Silver mining continued intermittently thereafter. The mine is now shut down completely and owned by Miller Enterprises. Two major tailings piles exist on the site. The old tailings pond was abandoned in 1946, when it reached capacity. A new tailings pond was constructed approximately 0.5 mile south where Cross Creek and Eagle River meet. Approximately 7 million tons of tailings remain in the disposal areas and are owned by Battlemountain Corp. Several other smaller tailings piles are located on National Forest land nearby, and tailings have been dumped in areas in the Eagle River floodplain. The site is divided into three Operable Units (OUs):
OU1 (Mine Site) – addresses principal sources of mine waste pollution impacting the Eagle River and ground water resources;
OU2 (Town of Gilman) – addresses contaminated soils in the Minturn Middle School area and in an approximate 2 square mile area in the south end of Minturn, the surface soils and waste rock piles in the Town of Gilman area, and private drinking water wells possibly being used in the Minturn area; and
OU3 (North Property) – addresses contamination of the North Property.
Summary of Site-related Contamination: Site-related contamination is the result of mining and milling operations; specifically,
tailing ponds and disposal practices. Site operations have contaminated various media (ground water, surface water, solid waste, soil, liquid waste, debris, and sediment) with numerous contaminants. OU1 contains high levels of inorganic chemicals (arsenic, cadmium, chromium, lead, manganese) and PCBs (not specified). OU2 contains high levels of arsenic, cadmium, chromium, iron, lead, manganese, nickel and zinc. Finally, OU3 contains elevated levels of inorganic chemicals (arsenic cadmium, calcium, cobalt, iron, magnesium, nickel, sulfate, thallium and zinc). Elevated levels of zinc have been also found in fish tissue in the North Property (OU3).
Conclusion of Site-related Risk: In past years, children in the town of Minturn have been found to have elevated levels of
lead in their blood from exposure to contaminated soils and dust. Specifically, the primary threats contributing to human health, and the contaminants ultimately driving the site’s remedial action, are inorganic chemicals (arsenic, cadmium, calcium, cobalt, iron, lead, manganese, magnesium, nickel, sulfate, thallium, and zinc). The two major media of concern for human
9/23/2016
B2-23
exposure to inorganic contaminants are soil/dust and ground water. The receptors with potentially unacceptable risk from these media are residential, recreational, and occupational workers. The primary routes of exposure to these media are ingestion (accidental or intentional), inhalation, and dermal contact.
In OUs 1 and 2, the primary contributor to human health risks are (1) arsenic (current cancer risks of 1.4E-04 and 1.1E-04 for residential adolescent and adult receptors, respectively, from ingestion of contaminated soil/dust; current non-cancer HQ of 4.5 for residential adolescents from ingestion of contaminated soil/dust); (2) combine exposure from arsenic and cadmium (current cancer risk of 7.32E-04 for residential adolescents from the ingestion and inhalation of contaminated air, soil, and dust); and (3) lead (16.5% of children in the town of Minturn were found to have blood lead levels exceeding P10 [10µg/dL] from the ingestion and inhalation of contaminated air, soil, and dust). OU2, additionally, had a primary contributor to human health risk not found in OU1: (1) combined exposure to arsenic, cadmium, chromium, iron, lead, and manganese (current cancer risk of 3E-04 for residential children from the ingestion of contaminated soil).
In OU3, the primary contributors to human health risk are (1) arsenic (future cancer risk for residential age averaged receptor from the ingestion of soil [2.54E-03], ingestion of ground water [1.76E-03], ingestion of boulder-chips [1.93E-04], and dermal contact with soil [1.67E-04]; and current and future risks to recreational hiker [2.52E-04; age averaged] and occupational adult [1.04E-04] receptors for ingestion of contaminated soil. Future non-cancer HQs ranging from 10.0, 12.7, and 23.4 for residential receptors [adult, age averaged, and child, respectively] for ingestion of contaminated ground water), and (2) inorganic chemicals (including future HQs ranging from 201 to 469 for iron, 54.8 to 128 for thallium, 49.3 to 115 for zinc, 38.8 to 90.6 for manganese, and 21.4 to 49.9 for cadmium, for residential receptors [adult and child, respectively] for ingestion of contaminated ground water).
Metals loading in the Eagle River pose ecological concerns; however, specific risk was not quantified. Specific ecological receptors and exposure routes have not been identified.
Human Health Risk Driver(s): Operable Units 1& 2: Soil/Dust, Cancer
– Current Adult and Adolescent Resident, Ingestion • Arsenic
Soil/Dust, Non-cancer – Current Adolescent Resident, Ingestion
• Arsenic Air and Soil/Dust, Cancer
– Current Adolescent Resident, Ingestion and Inhalation • Arsenic and Cadmium
Air and Soil/Dust, Non-cancer – Current Adolescent Resident, Ingestion and
Inhalation (Blood lead level) • Lead
Operable Unit 3 (cont’d): Soil, Cancer
– Future Age-Averaged Resident, Ingestion • Arsenic
Soil, Cancer – Current & Future Age-Averaged Recreational Hiker, Ingestion
• Arsenic – Current & Future Worker, Ingestion
• Arsenic – Future Age-Averaged Resident, Dermal Contact
• Arsenic Boulder-chips, Cancer – Future Age-Averaged Resident, Ingestion
• Arsenic Ground Water, Non-cancer
9/23/2016
B2-24
Operable Unit 2 (Only): Soil, Cancer
– Current Child Resident, Ingestion • Arsenic, Cadmium, Chromium, Iron,
Lead, Manganese
Operable Unit 3: Ground Water, Cancer
– Future Age-Averaged Resident, Ingestion • Arsenic
– Future Adult and Child Resident, Ingestion • Arsenic, Iron, Manganese, Thallium,
Zinc – Future Age-Averaged Resident, Ingestion
• Arsenic, Iron, Manganese, Thallium, Zinc
Ecological Risk Driver(s): Specific ecological risks (and receptors and exposure routes) have not been identified.
Final Remedy: The selected remedial actions for the Mine Site (OU1) address major environmental
threats to the Eagle River and human health threats from surface water, sediment, soil, ground water, and additional waste. To mitigate risk from soils and sediment, remedial actions include
(1) the excavation of contaminated soils and sediments from the Maloit Park Wetlands;
(2) control of seepage from the tailings; and
(3) rapid addition of topsoil and re-vegetation.
The remedial actions chosen to address surface water contamination include
(1) regular monitoring of surface water and biota, and
(2) draining and capping the historic pond and diversion of Rock Creek upgradient of contaminated mine seepage.
For ground water, the selected remedies include:
(1) ground water monitoring,
(2) leachability tests on waste rock,
(3) implementation of use restrictions for ground water at the Rex Flats and Old Tailings pile,
(4) accelerated re-vegetation at Rex Flats,
(5) ground water treatment,
(6) use restrictions,
(7) the construction of an up-gradient ground water diversion structure, and
(8) the relocation of the Town of Minturn drinking water wells.
Additional site waste remedial actions include:
(1) diverting and collecting contaminated mine seepage,
(2) capping the Consolidated Tailings Pile,
(3) continued treatment of mine seepage at the Water Treatment Plant, and

9/23/2016
B2-25
(4) re-vegetation in area of Roaster Pile 1.
For the Town of Gilman (OU2), current and potential human health risks posed by contaminated soil and waste rock will be remedied through the implementation of institutional controls to limit site access and provide long-term, local presence.
Remedial actions to address contamination in the North Property (OU3) have not been selected and are pending further evaluation.
9/23/2016
B2-26
East Helena NPL Site Summary EPA ID: MTD006230346 Number of Operable Units: 2 Location: East Helena, MT Date of NPL Listing: 1984 EPA Region: 8 Last Operational Year: 2001 Status: NPL - Final Documents Used: RI/FS & ROD (Various by OU)
Introduction: The East Helena Site is a former primary lead and zinc smelting operation located in
Lewis and Clark County, Montana, near, and including parts of, East Helena, Montana. The site and resulting contamination is the result of smelting operations at the site. The site consists of the smelter facility; all of the City of East Helena; nearby residential subdivisions; numerous rural developments such as farms and homes on small acreage plots; and surrounding undeveloped lands. The smelter adjacent to East Helena operated from 1888 until April 2001. ASARCO bought the property in 1895 from Helena and Livingston Lead Smelting and continued operations until the smelter was closed in 2001. During its operation, the smelter produced lead bullion, but also recovered copper, gold, silver, and platinum for refining at other ASARCO facilities. Over more than 100 years of operation contamination to air, soils, surface water, and ground water resulted from smelter stack emissions; fugitive emissions from plant processes, such as the blast furnace, dross plant, and sinter plant; ore storage area, particularly prior to 1990; slag pile (a minor source); process ponds and process fluids circuitry; and direct discharges to Prickly Pear Creek and East Helena water treatment facilities. The site was added to the NPL in 1984 due to findings of contaminated soils in East Helena residential areas, elevated blood-lead levels in area children, elevated metal levels in the air, and contaminated process ponds over shallow ground water near the plant. The site is divided into two Operable Units (OUs): OU1 (Process Ponds and Fluids) addresses contamination of soil, sediment, and underlying ground water in the process ponds, and OU2 (East Helena Residential Soils and Undeveloped Lands) consists of non-smelter property surface soils of residential areas, rural developments, and surrounding agricultural land.
Summary of Site-related Contamination: Site-related contamination is the result of smelter stack emissions; fugitive emissions
from plant processes such as the blast furnace, dross plant, and sinter plant; the ore storage area, particularly prior to 1990; the slag pile (a minor source); process ponds and process fluids circuitry; and direct discharges to Prickly Pear Creek and East Helena water treatment facilities. Site operations have contaminated various media (surface soil, subsurface soil, sediment, ground water, surface water, fish tissue, residential dust, and air). Inorganic chemicals (arsenic, lead, cadmium, copper and zinc) from former processes can be found site-wide in all the media listed above. OU1 (Process Ponds) has been identified as a source of contamination to ground water and surface water in Prickly Pear Creek. Surface soil, sediment, surface water, and ground water in residential and undeveloped lands (OU2) are contaminated with the inorganic chemicals listed above, as well as antimony, chromium, manganese, mercury, selenium, silver, and thallium, which may pose an elevated health risk to residential receptors.
9/23/2016
B2-27
Conclusion of Site-related Risk: Human health risks have been identified for residential receptors from exposure to
inorganic chemicals (arsenic and cadmium). The major pathways of concern are soil and food ingestion and inhalation of air. OU1 narratively states that although a human health on-site exposure pathway exists, it is incomplete since workers are protected from process pond contaminants under Occupational Safety and Health Administration (OSHA) regulations, and therefore, no specific worker risks were reported. The primary contributors to human health risks in OU2 to residential receptors are (1) arsenic (cancer risks ranging from 3E-04 from air inhalation to 4E-06 from food/vegetable ingestion); and (2) cadmium (cancer risk of 8E-05 from air inhalation to residential receptors).
Site-wide elevated soil lead poses a risk to insectivorous birds or small mammals. Site-wide ecological risks have been identified for a number of avian and mammalian receptors from exposure to inorganic chemicals (antimony, arsenic, cadmium, copper, lead, manganese, mercury, selenium, thallium, and zinc). The major pathways of concern are ingestion of sediment and various different food sources. The primary contributors to site-wide ecological risk are (1) lead (Hazard Quotient [HQ] of 130 to Cliff Swallow from ingestion of sediment, HQ of 37 through ingestion of aquatic invertebrates, and HQ of 29 to Mallard from ingestion of sediment); (2) cadmium and selenium (each with an HQ of 28 to Cliff Swallow through ingestion of sediment); and (3) copper (HQ of 19 and 17 to the Cliff Swallow for ingestion of aquatic invertebrates and sediment, respectively).
Human Health Site-Related Risks: Operable Unit 1: Only occupational receptors, regulated under OSHA.
Operable Unit 2: Air, Cancer
– Current Resident, Inhalation • Arsenic, Cadmium
Food (vegetable), Cancer – Current Adult Resident, Ingestion
• Arsenic Soil, Cancer
– Current Adult Resident, Ingestion • Arsenic
Ecological Site-Related Risks: Operable Unit 00 (site-wide): Sediment
– Current Avian and Mammalian Ingestion • Cadmium, Copper, and Selenium
Food (through aquatic invertebrates) – Current Avian Ingestion
• Lead and Copper
Final Remedy: The following outlines the elected remedial actions to address human health and
ecological risk from process water, soil, and sediments.
OU1 – (1) (Lower Lake) Replace Lower Lake with storage tanks, construct a lined pond for storm
water runoff, in-place co-precipitation of Lower Lake process waters; remove sediments
9/23/2016
B2-28
by dredge, dragline, or industrial vacuum; and dry sediments on drying pad; smelt sediments in the smelter process;
(2) (Speiss granulating pond and pit) replace existing pond with tank and secondary containment facility, replaceme existing pit with a new lined facility, excavate contaminated soils, and smelt soils in the smelting process;
(3) (Acid Plant Treatment facility) remove settling pond, dumpster system, and sediment drying area, and replace enclosed aboveground mechanical separation system; and
(4) (Thornock Lake) excavate bottom sediments, stockpiling, and smelting.
Remedial actions for OU2 are
(1) (residential areas) conduct selected soil removal (1,000/500 ppm lead) and community education and institutional controls; and
(2) (undeveloped areas) establish in-place treatment involving removal, capping, and treatment of undeveloped lands, and application of institutional controls and monitoring.
9/23/2016
B2-29
Eastern Michaud Flats NPL Site Summary EPA ID: IDD984666610 Number of Operable Units: 2 Location: Pocatello, ID Date of NPL Listing: 1990 EPA Region: 10 Last Operational Year: 2001 (FMC Plant) Status: NPL - Final Documents Used: RI/FS & ROD (Various by OU)
Introduction: The Eastern Michaud Flats Contamination Site is located on 2,475 acres in Power
County, Idaho, near Pocatello. Within the eastern part of the flats are two adjacent phosphate processing facilities. The FMC Corp. Elemental Phosphorus Plant produced elemental phosphorus from phosphate shale ore on ~1,450 acres from 1949 to its shutdown in 2001. The J.R. Simplot Co. Don Plant has produced a variety of fertilizer products from phosphate ore on ~1,025 acres since 1944. The site has been divided into two Operable Units (OUs): OU1 addresses the FMC Plant and related offsite areas, and OU2 addresses the Simplot Plant and related offsite areas.
Summary of Site-related Contamination: Site-related contamination is the result of phosphate ore processing operations and waste
handling practices; specifically, releases of ore constituents to the air, water, and soil. Site operations have contaminated various media, including soil, air, ground water, and food – milk, meat, and vegetables. The site is contaminated primarily with inorganic chemicals (antimony, arsenic, beryllium, boron, cadmium, chromium [VI], fluoride, manganese, mercury, vanadium, and zinc); volatile organic compounds (VOCs) (tetrachloroethene, trichloroethene); and radionuclides (lead 210, polonium 210, potassium 40, radium 226, radon 222, thorium 230, uranium 234, uranium 238). OU1 is also contaminated with polycyclic aromatic hydrocarbons (PAHs) and other fuel-related VOCs (benzene, toluene, ethylbenzene, and xylenes).
Conclusion of Site-related Risk: Receptors potentially affected by site contamination include residential and occupational
workers. The major media of concern for human exposure to contaminants are soil, ground water, food, air, and external radiation. The primary routes of exposure to these media are ingestion (accidental or intentional), dermal contact, external radiation, and inhalation.
The primary contributors to human health risks site-wide are (1) lead-210 (cancer risk of 1.06E-02 for ingestion of ground water to future residential receptors); (2) radium-226 (cancer risk of 4.35E-03 from external gamma radiation from soil to current residential receptors); (3) arsenic (cancer risk of 1.17E-03 from groundwater ingestion to future residential receptors); (4); cadmium (hazard quotient [HQ] values ranging from 40.41 to 41.66 for ingestion of vegetables and all exposure routes of soil to current residential receptors, respectively); and (5) fluoride (HQ values ranging from 24.71 [future] to 33.72 [current] for ingestion of meat and all exposure routes of soil to residential receptors, respectively). In OU1, the primary contributors to human health risks are (1) radon-222 (cancer risk of 5.71E-03 for inhalation of air to future occupational receptors); (2) combined radionuclides (cancer risks of 1.05E-03 and 1.41E-03 for external gamma exposure to current and future occupational receptors, respectively); and (3) arsenic (cancer risk of 6.83E-04 for ingestion of ground water by future occupational receptors). In OU2,
9/23/2016
B2-30
the primary contributors to human health risk are (1) radon-222 (cancer risk of 4.63E-03 for air inhalation by future occupational receptors); (2) arsenic (cancer risk of 1.68E-03 for ingestion of ground water by future occupational receptors); and (3) fluoride (HQ of 14.51 from ground water ingestion by future occupational receptors).
Potential ecological receptors include avian, mammalian, and plant species. Ecological receptors were found to be at risk due to exposure to fluoride through dietary ingestion (Red-Tailed Hawk, Horned Lark, and coyote) or incidental ingestion of soil (Horned Lark and Sage Grouse). Two state species of concern (Yellow-Billed Cuckoo and Wolverine) may be located on the site and have potential for risk; however, their presence on the site is unlikely. HQ values for fluoride range from 1.3 for the Horned Lark to 4.09 for the Sage Grouse.
Human Health Risk Driver(s): Operable Unit 00 (site-wide): Ground Water, Cancer
– Future Resident, Ingestion • Lead-210, Arsenic
Soil, Cancer – Current Resident, External Gamma
Radiation • Radium-226
Ground Water, Non-cancer – Future Resident, Ingestion
• Arsenic Food, Non-cancer
– Current Resident, Ingestion Soil, Non-cancer – Current Resident, Ingestion
• Cadmium, Fluoride
Operable Unit 1: Air, Cancer
– Future Worker, Inhalation • Radon-222
External Radiation, Cancer – Current & Future Worker, External Gamma
Exposure • Radionuclides
Operable Unit 1 (cont’d): Ground Water, Cancer
– Future Worker, Ingestion • Arsenic
Ground Water, Non-cancer – Future Worker, Ingestion
• Arsenic
Operable Unit 2: Air, Cancer
– Future Worker, Inhalation • Radon-222
Ground Water, Cancer – Future Worker, Ingestion
• Arsenic, Fluoride Ground Water, Non-cancer
– Future Worker, Ingestion • Arsenic
Ecological Risk Driver(s): Operable Unit 00 (site-wide): Combined Pathways/Multiple Routes
– Current Avian and Mammalian • Fluoride
Final Remedy: The following outlines selected remedial actions to address soil, ground water, air and
solids. OU1 (FMC Plant) –
(1) cap waste ponds and solids storage area;
(2) line Railroad Swale to reduce or eliminate infiltration of rainwater and prevent incidental exposure to contaminants;
9/23/2016
B2-31
(3) monitor ground water and implement controls to prevent use of contaminated ground water for drinking purposes under current and future ownership, prevent potential future residential use, and control potential worker exposures under future ownership;
(4) implement contingent groundwater extraction treatment system if contaminated ground water migrates beyond company owned property and into adjoining springs or the Portneuf River;
(5) contain contamination by hydrodynamic controls;
(6) treat and recycle extracted ground water within the plant to replace unaffected ground water that would have been extracted and used in plant operations; and
(7) conduct operation and maintenance on capped areas and ground water extraction system, if implemented.
OU2 –
(1) implement a groundwater extraction system to contain contaminants associated with the phosphogypsum stack and control potential worker exposures under current and future ownership;
(2) excavate contaminated soils from the dewatering pit and east overflow pond;
(3) monitor ground water and implement controls to prevent use of contaminated ground water for drinking purposes under current and future ownership;
(4) continue groundwater monitoring and controls until site contaminants of concern in ground water decline below MCLs or RBCs; and
(5) operate and maintain the groundwater extraction system.
OUs 1 and 2 (Off-Plant Areas, Actions Common to Both OUs) – (1) implement land-use controls and monitoring in the off-plant area to restrict property use
due to potential exposure to radionuclides in soils;
(2) inform future property owners of the potential human health risks associated with consumption of homegrown fruits and vegetables; and
(3) monitor fluoride levels around the site to determine the levels present and to evaluate the potential risk to ecological receptors; if measured levels indicate risk, conduct further evaluation followed by source control or other action, if necessary; and
(4) conduct groundwater monitoring in the off-plant area.
9/23/2016
B2-32
Evening Star Mine Removal Site Summary EPA ID: CON000802651 Number of Operable Units: 1 Location: Jamestown, CO Date in CERCLIS: 2006 EPA Region: 8 Last Operational Year: Unknown Status: Removal, Time Critical Documents Used: Action Memorandum
Introduction: In 2005, the U.S. Environmental Protection Agency (EPA) commissioned a feasibility
study to assess numerous mines in the James Creek Basin (Little James Creek Mine Site Draft Feasibility Assessment Report, April 2005). The study estimated that approximately 2,000 cubic yards of waste rock material was present at the Evening Star Mine. In February 2007, the EPA On-Scene Coordinator (OSC) visited the site to evaluate current conditions. It was observed that, although the spring melt had not yet begun, water was flowing from the mine's collapsed adit. The flow meandered across the top of the waste rock pile, ultimately flowing down the western edge of the pile. The OSC observed drainage patterns in the waste rock pile, indicating the routine presence of flows up to four times the volumetric flow rate present at the date of the OSC's site visit. These higher flows have obviously caused the adit drainage to flow across the top and down over the face of the pile in the past. On February 9, and again on March 19, under direction from the OSC, the Superfund Technical Assistance and Response Team (START) contractor mobilized to the site, collected soil and water samples, and conducted field measurements of water quality and flow rates. The first day that START was at the site, the flow from the adit was less than half what it had been on the day of the OSC's visit. It was measured to be 2 gallons per minute (GPM). On March 19, the OSC observed that the flow had decreased to approximately 0.5 GPM, that it entered the waste rock pile at a sinkhole, and that it flowed via subsurface to the confluence with Little James Creek. The formation of a sinkhole can be an indication that the pile is becoming unstable. Also, waste rock material was observed in the ephemeral drainage below the site, indicating that material has migrated offsite in the past. Site inspection results indicated elevated levels of inorganic chemicals in waste rock, soil, and surface water on site as a result of site operations.
Summary of Site-related Contamination: Mining operations have led to site-wide contamination, primarily with inorganic
chemicals (arsenic, copper, lead, aluminum, and zinc), via waste rock material and adit drainage. Current environmental threats from inorganic chemical exposure from contaminated soil and surface water threaten terrestrial mammals, plants, and aquatic organisms.
Conclusion of Site-related Risk: The primary current threats to human health and the environment, and the contaminants
driving the removal action, are heavy metals (primarily arsenic, copper, lead, aluminum, and zinc). Arsenic was identified as having unacceptable human health cancer risks, greater than 1E-04 for soil and waste rock combined inhalation, ingestion, and dermal exposure to onsite recreational receptors. Lead concentrations in the main pile exceed the level at which EPA toxicologists would expect a 5% probability of elevated blood levels in female recreational users at childbearing age from combined inhalation, ingestion, and dermal exposure to soil and waste rock on site. Copper, lead, aluminum, and zinc in surface water downgradient of the adit exceed
9/23/2016
B2-33
Ambient Water Quality Criteria and may pose a risk to aquatic communities. Arsenic, copper, and aluminum in soil and waste rock on the site also exceed Eco-Soil Screening Levels for both terrestrial mammals and plants, in many cases by 100 or 1,000 times. Potential heavy metal loading of the Little James Creek is also of concern.
Final Remedy: The selected remedy addresses contaminated soil and the migration of contaminants to
water. The overall approach for the removal action involves
(1) excavation/scraping of waste rock present upslope from the mine adit, if possible (if not possible due to extreme slope angles, these areas will be covered and re-vegetated to the extent practicable);
(2) consolidation of excavated waste rock with the existing main pile;
(3) grading/shaping the waste rock pile to promote slope stability and proper runoff;
(4) implementation of drainage controls to protect against runon and to armor the ephemeral drainage side of the re-graded waste rock pile against erosion from spring runoff/flash flooding;
(5) placement of 12 inches of alkaline clean cover material and 6 to 12 inches of soil amended with growth media over the re-graded waste rock pile; and
(6) re-vegetation of the covered waste rock pile and any areas disturbed during the course of the removal.
The study estimated that approximately 2,000 cubic yards of waste rock material was present at the site.
9/23/2016
B2-34
Foote Mineral Co. NPL Site Summary EPA ID: PAD077087989 Number of Operable Units: 2 Location: East Whiteland Township, PA Date of NPL Listing: 1992
EPA Region: 3 Last Operational Year: 1991 Status: NPL - Final Documents Used: RI/FS & RODs (Varies by OU)
Introduction: The Foote Mineral Co. site is located on a 79-acre property primarily in East Whiteland
Township, Pennsylvania. Starting in 1941, the Foote Company built and operated a variety of process buildings on the property for the manufacture of lithium metal and lithium chemicals and inorganic fluxes for the metal industry. Ores and minerals were also crushed and sized as part of site operations. When the plant closed in 1991, the site included two quarries, a pit used to burn solvents, a lined basin, and more than 50 buildings and process areas. There were also three unlined lagoons that had been leveled and backfilled, and an area where a small amount of neutralized lithium arsenite was buried and later removed. Because the various areas of the site differed in physical characteristics, the site was split into two Operable Units (OUs): OU1, Plant Area and North Quarry, and OU2, South Quarry and Contaminated ground water plume.
Summary of Site-related Contamination: Site-related contamination is the result of ore processing; specifically, a waste pit, lined
basin, and unlined lagoons. Site operations have contaminated various media (soil, sediment, surface water, and ground water) with numerous contaminants. Contaminants were reported on a site-wide (OU00) basis, rather than by OU. Site-wide contamination is primarily due to inorganic chemicals, (aluminum, antimony, arsenic, copper, hafnium, iron, lithium¸ manganese¸ mercury, thallium, vanadium); semi-volatile organic compounds SVOCs (benzo(b)fluoranthene, benzo(a)pyrene, dibenzo(a,h)anthracene, aroclor 1260); and volatile organic compounds (VOCs; e.g., bromoform, carbon tetrachloride, 1,2-dichloroethane, benzene, tetrachloroethene, trichloroethene).
Conclusion of Site-related Risk: The primary threats contributing to human health, and the contaminants ultimately
driving the site’s remedial action are inorganic chemicals, (antimony, arsenic, barium, boron, chromium, copper, hafnium, iron, lithium¸ manganese¸ mercury, thallium, vanadium); PCBs (aroclor-1260); SVOCs (benzo(b)fluoranthene, benzo(a)pyrene, and dibenzo(a,h)anthracene); and VOCs (1,2-dichloroethane benzene, bromoform, carbon tetrachloride, tetrachloroethene, and trichloroethene). The major media of concern for human exposure to inorganic and organic contaminants are soil, sediment, and ground water. The receptors with potentially unacceptable risk from these media are future trespassers, residential (child and adult), and occupational workers. The primary routes of exposure to these contaminated media are ingestion (accidental or intentional), inhalation, and dermal contact.
High risks from exposure to ground water, soil, and sediment are reported as resulting from multiple contaminants per media via several combined exposure routes (ingestion, inhalation, and dermal contact). Contaminants associated with sediment exposure risks include
9/23/2016
B2-35
cancer risks for arsenic, chromium, and benzo(a)pyrene; and non-cancer risks for antimony, arsenic, barium, chromium, copper, iron, lithium, manganese, thallium, vanadium, and benzo(a)pyrene. Contaminants associated with soil exposure pose both cancer risks (arsenic, aroclor-1260, benzo[a]pyrene, benzo[b]fluoranthene, and dibenzo[a,h]anthracene) and non-cancer risks (antimony, arsenic, hafnium, iron, lithium, manganese, mercury, thallium, and vanadium). Contaminants associated with groundwater exposure include cancer risks for arsenic, chromium, 1,2-dichloroethane, benzene, bromoform, carbon tetrachloride, tetrachloroethene, and trichloroethene; and non-cancer risks for boron, chromium, and lithium. The primary risk drivers for ground water are cancer risk of 2.4E-04 for future residential (adult and child) receptor; and non-cancer HQ values ranging from 660 for future residential adult to 1600 for a future residential child. The primary risk drivers from exposure to contaminated soil—with a range of cancer risk from 4.8E-05 to 3.8E-04 and non-cancer HQ values ranging from 2.9 to 50—are for future trespassers and residential children, respectively. The primary risk drivers from exposure to contaminated sediment include cancer risks that range from 2E-06 to 3.1E-05 and non-cancer HQ values ranging from 3.2 to 61 for future trespasser and residential children, respectively.
The ecological risk assessment determined that the two media most responsible for potential contamination and associated ecological risk were surface water and sediment. Additionally, the two ecological receptors most susceptible to surface water and sediment are the mink and Great Blue Heron. No ecological hazard quotients were found above 1 for either receptor (total HQ of 0.03 and 0.01 for the Great Blue Heron and mink, respectively). However, the sediments in the North Quarry were qualitatively stated to be a potential future risk to ecological receptors due to inorganic contaminants (cadmium, chromium, copper, lead, manganese, silver) and organic contaminants (benzo[b]fluoranthene, and indeno[l,2,3-c,d]pyrene). Additionally, boron and lithium in surface water may also pose future risks to ecological receptors.
Human Health Risk Driver(s): Operable Unit 00 (site-wide): Ground Water, Cancer
– Future Resident, Worker, and Trespasser, Ingestion, Inhalation, and Dermal Contact • Inorganic Chemicals and VOCs
Ground Water, Non-cancer – Future Resident, Worker, and Trespasser,
Ingestion, Inhalation, and Dermal Contact • Inorganic Chemicals and VOCs
Soil, Cancer – Future Resident, Worker, and Trespasser,
Ingestion, Inhalation, and Dermal Contact • Inorganic Chemicals and SVOCs
Soil, Non-cancer – Future Resident, Worker, and Trespasser,
Ingestion, Inhalation, and Dermal Contact • Inorganic Chemicals and SVOCs
Sediment, Cancer
– Future Resident, Worker, and Trespasser, Ingestion, Inhalation, and Dermal Contact • Inorganics and SVOCs
Sediment, Non-cancer – Future Resident, Worker, and Trespasser,
Ingestion, Inhalation, and Dermal Contact • Inorganic Chemicals and SVOCs
Ecological Risk Driver(s): Operable Unit 00 – Site-wide: No quantitative HQs above 1. Future qualitative risk may exist in the North Quarry from sediment and surface water exposure.
9/23/2016
B2-36
Final Remedy: The selected remedial actions address soil, ground water, and wastes site-wide rather than
by OU and are as following:
(1) excavation and offsite disposal of 904 cubic yards of radiation-contaminated soils at an appropriately permitted facility;
(2) in-situ soil stabilization of process tailing wastes located in the South Quarry;
(3) excavation and consolidation of contaminated soils, waste materials, and debris into the North and South quarries to prevent direct contact threats;
(4) capping of the North and South quarries with engineered, multilayered geo-synthetic caps;
(5) long-term ground water monitoring;
(6) removal of Light Non-Aqueous Phase Liquids (LNAPL) from ground water;
(7) use of institutional controls to prevent residential use of ground water and the capped areas; and
(8) implementation of a Ground water Management Zone in plume area.
9/23/2016
B2-37
Gilt Edge Mine NPL Site Summary EPA ID: SDD987673985 Number of Operable Units: 4 Location: Lead, SD Date of NPL Listing: 2000 EPA Region: 8 Last Operational Year: 1998 Status: NPL – Final Documents Used: RI/FS & RODs (Varies by OU)
Introduction: The Gilt Edge Superfund Site is located in the mining district in the Black Hills of South
Dakota. The site is located approximately 6 miles south-southeast of the towns of Lead and Deadwood and lies immediately adjacent to the upper reaches of Strawberry Creek. Mining operations for gold, copper, and tungsten were conducted in this small mining district starting in 1876. About a century ago, a series of small mines began dumping metals-laden mill tailing into Strawberry Creek and Bear Butte Creek. By 1986, when BMC began conducting larger-scale open-pit mining, off-site waters were already contaminated. Site operations ceased in 1998.The site is comprised of four operable units (OUs).
OU1 (Primary Mine Disturbance Area) – addresses existing contaminant sources within the primary mine disturbance area, such as waste rock, spent ore, exposed mineralized bedrock, and sludge;
OU2 (Water Treatment, Groundwater, and Lower Strawberry Creek) – addresses
(1) acid rock drainage (ARD) at the site;
(2) ground water contamination; and
(3) contaminant sources, surface water, and sediments in the Lower Strawberry Creek area; and
OU3 (Ruby Gulch Waste Rock Dump) – addresses contaminant sources located within the Ruby Gulch waste rock dump.
OU4 (Cyprus Phelps/Dodge) – has been added recently. The site has been extensively disturbed by mining and mineral processing operations.
Six specific types of site features have a significant impact on the site:
(1) open pits,
(2) underground mine workings,
(3) heap leach pad (HLP),
(4) waste rock dumps,
(5) surface water management systems, and
(6) Lower Strawberry Creek.
9/23/2016
B2-38
Summary of Site-related Contamination: Mining operations have led to site-wide contamination via waste rock, spent ore, exposed
mineralized bedrock, sludge, metals-laden mill tailings in on-site waters, and ARD. Site operations have produced contaminated various media (soils, sediment, surface water, ground water, and fish tissues) within Gilt Edge Mine’s OUs, with numerous inorganic chemicals that include aluminum, antimony, arsenic, barium, beryllium, boron, cadmium, calcium, chromium, cobalt, copper, iron, lead, magnesium, manganese, mercury, nickel, nitrate, nitrite, phosphorous, potassium, selenium, silver, sodium, strontium, thallium, vanadium, and zinc. The site has elevated exposure risks for residential (adult and child), occupational, and recreational receptors (current and future), as well as avian, mammalian, aquatic, and benthic ecological receptors.
Conclusion of Site-related Risk: The major pathway concerns for human exposure to inorganic chemicals are soil, ground
water, surface water, sediment, and food (fish). The receptors with potentially unacceptable risk from these media are offsite current residents, onsite future residents, offsite and onsite Current and Future recreationalists, and onsite future workers. The primary routes of exposure to these media are ingestion (accidental or intentional) and inhalation.
Risks for the site were quantified site-wide. The primary contaminants driving risk from soil include arsenic, manganese, and thallium; those driving risk from ground water include aluminum, antimony, arsenic, cadmium, chromium, copper, iron, lead, manganese, thallium, and zinc. The contributors to risk for future onsite residents are (1) total metals (cancer risk of 2E-02, and non-cancer risk Hazard Index [HI] of 800 from ingestion of ground water); and (2) dissolved metals (cancer risk of 1E-02 ,and HI of 700 from ingestion of ground water, cancer risk of 1E-03 and HI of 50 from soil ingestion). The contributors to Current and Future offsite adult residents are (1) total metals (cancer risk of 6E-03, and HI of 80 from ingestion of ground water); and (2) dissolved metals (cancer risk of 8E-04, and HI of 70 from ingestion of ground water). The contributors to Current and Future risk to offsite child residents are from combined contaminants through ingestion of sediment (cancer risk of 2E-05) and surface water (cancer risk of 2E-06). The contributors to future onsite workers are (1) total metals (cancer risk of 4E-03, and HI of 200 from ingestion of ground water); (2) dissolved metals (cancer risk of 3E-03, and HI of 200 from ingestion of ground water, cancer risk of 1E-04 and HI of 6 from soil ingestion); and (3) combined contaminants (primarily arsenic, manganese, and thallium) (cancer risk of 5E-05, and HI of 50 from ingestion/inhalation of soil). The contributors to Current and Future risk to on-site recreational receptors are from combined contaminants from ingestion of surface water (cancer risk of 9E-04) and combined ingestion and inhalation of soil (cancer risk of 2E-04).
The primary contributors to current ecological risk include inorganic chemicals (aluminum, antimony, arsenic, beryllium, cadmium, calcium, chromium, cobalt, copper, iron, lead, magnesium, manganese, mercury, nickel, selenium, silver, sodium, thallium, vanadium, and zinc). Aquatic organisms (from direct contact with surface water), benthic invertebrates (from direct contact with sediment), and plant and soil invertebrates (from direct contact with soil) all have HQ values listed as greater than 1 (qualitatively documented), with the most severe effects from cadmium, copper, lead, manganese, silver, and zinc. Within riparian areas, the greatest risks related to inorganic chemicals include ingestion of surface water, sediment/soil, and food (varies by receptor) as follows: (1) aluminum (HI of 10,000 for the Masked Shrew, and HI of 300 for the
9/23/2016
B2-39
Deer Mouse); (2) lead (HI of 400 for the Masked Shrew, and HI of 60 for the American Robin); and (3) cadmium (HI of 200 for the Masked Shrew).
Human Health Risk Driver(s): Operable Unit 00 (site-wide): Soil, Cancer
– Future Resident, Ingestion • Dissolved metals (primarily Arsenic,
Thallium) – Future Worker, Ingestion
• Dissolved metals (primarily Thallium) – Current & Future Worker, Ingestion and
Inhalation • Combined contaminants (primarily
Arsenic, Manganese, Thallium) – Current and Future Recreational User,
Ingestion and Inhalation • Combined contaminants (primarily
Arsenic, Manganese, Thallium) Soil, Non-cancer
– Future Resident, Ingestion • Dissolved metals (primarily Arsenic,
Thallium) – Future Worker, Ingestion
• Dissolved metals (primarily Thallium) – Future Worker, Ingestion and Inhalation
• Combined contaminants (primarily Arsenic, Thallium)
Ground Water, Cancer – Future Resident, Ingestion
• Total metals and Dissolved metals (Aluminum, Antimony, Arsenic, Cadmium, Chromium, Copper, Iron, Lead, Manganese, Thallium, Zinc)
– Current & Future Resident and Future Worker, Ingestion • Total metals and Dissolved metals
(Aluminum, Antimony, Arsenic, Cadmium, Chromium, Copper, Iron, Lead, Manganese, Thallium, Zinc)
Ground Water, Non-cancer – Current & Future Resident and Future
Worker, Ingestion • Total metals and Dissolved metals
(Aluminum, Antimony, Arsenic, Cadmium, Chromium, Copper, Iron, Lead, Manganese, Thallium, Zinc)
Surface Water, Cancer
– Current & Future Recreational User, Ingestion/Dermal Contact • Combined Contaminants (Not specified)
– Current & Future Child Resident, Ingestion • Combined Contaminants (Not specified)
Sediment – Current & Future Resident,
Ingestion/Dermal Contact • Arsenic
Ground Water, Non-cancer – Current & Future Resident and Future
Worker, Ingestion • Total metals and Dissolved metals
(Aluminum, Antimony, Arsenic, Cadmium, Chromium, Copper, Iron, Lead, Manganese, Thallium, Zinc)
Ecological Risk Driver(s): Operable Unit 00 (site-wide): Surface Water, Sediment, and Food (Varies )
– Current Masked Shrew, Ingestion • Aluminum, Cadmium, Lead
– Current Deer Mouse, Ingestion • Aluminum, Antimony, Thallium
– Current American Robin, Ingestion • Lead
Surface Water – Current Aquatic Organisms, Direct Contact
• Aluminum, Beryllium, Cadmium, Calcium, Chromium, Cobalt, Copper, Iron, Lead, Magnesium, Manganese, Nickel, Selenium, Sodium, Thallium, Zinc
Sediment – Current Benthic Organisms, Direct Contact
• Aluminum, Cadmium, Cobalt, Copper, Lead, Manganese, Silver, Zinc
Soil – Current Plants & Soil Invertebrates, Direct
Contact • Cobalt, Copper, Lead, Mercury, Nickel,
Selenium, Silver, Thallium, Zinc
9/23/2016
B2-40
Interim Remedy: Risk was quantified site-wide, and remedial actions by OU were based on this risk. OU3
required an interim remedy to address contamination associated with the largest ARD source on the site. The interim actions taken include
(1) re-grading of waste rock, including placement in the upper Ruby Gulch drainage;
(2) construction of a composite cap using a geo-membrane liner;
(3) installation of lateral drainage structures to limit erosion and convey runoff;
(4) construction of a protective layer for the liner and surface water controls using materials consisting of the Highway 385 project rock and growth materials from on-site sources; and
(5) construction of surface water run-on diversion channels.
Final Remedy: The selected remedy addresses ground water, surface water, waste rock, acid-generating
bedrock, wastewater, and sludge. The selected remedy helps achieve greater water quality and reduces the toxicity and volume of acid water and ARD. The overall remedial actions taken include those outlined in the following sentences.
OU1 – (1) ARD collection,
(2) upgrades to the water treatment plant (WTP),
(3) removal, consolidation, and containment of acid-generating waste rock and fills,
(4) sludge removal and disposal as a part of OU2, and
(5) land-use controls to protect human receptors.
OU2 – (1) maintain site control and operations infrastructures,
(2) collect metal-laden toxic waters and ARD for treatment in the WTP,
(3) upgrades to the WTP, and
(4) implement optimized on-site sludge management using on-site storage basins or sludge filtering. The amount of media remediated and/or removed was not specified.
OU4 is still being investigated.
9/23/2016
B2-41
Homestake Mining Co. NPL Site Summary EPA ID: NMD007860935 Number of Operable Units: 3 Location: Milan, NM Date of NPL Listing: 1983 EPA Region: 6 Last Operational Year: 1990 Status: NPL - Final Documents Used: RI/FS & RODs (Various by OU)
Introduction: The Homestake Mining Co. (HMC) Site is a former uranium milling operation located in
Cibola County, New Mexico, about 5.5 miles north of the town of Milan. The site and resulting contamination is the result of uranium milling operations that took place between 1958 and 1990. Uranium milling operations involved an alkaline leach-caustic precipitation process to extract and concentrate uranium oxide from uranium ores. Waste byproducts from the milling operations were either disposed above ground in the two tailings impoundments or recycled back into the milling process. The tailings are composed of a uranium-depleted sand fraction and a fine fraction (slimes). The sand fraction was used for building the sides and internal dikes of the impoundment, while the slimes were allowed to collect in the center of the impoundment. Seepage from two large tailings ponds on the site has contaminated a shallow aquifer that provides water to residents in several down-gradient subdivisions. The contamination of soil resulted from windblown tailings that were carried from the tailings impoundments and deposited mostly in the northeast of the tailings impoundments, the prominent downwind direction, on the surface soil surrounding the mill site. The water is unsafe for drinking and cooking. In addition, possible radon releases into residential subdivisions were investigated. The site is divided into three Operable Units (OUs):
OU1– addresses tailing seepage contamination of groundwater aquifers;
OU2– addresses long-term tailings stabilization, surface reclamation, and site closure; and
OU3– addresses radon concentrations in neighboring residential areas.
Summary of Site-related Contamination: Site-related contamination is the result of uranium milling operations, specifically slag
piles and dust/particulates emitted from smelting stacks. Site operations have contaminated various media (soil, air, and ground water). The contaminants present from site-related activities in (1) ground water include inorganic chemicals (chloride, chromium, molybdenum, nitrate, selenium, sulfate, and vanadium) and radionuclides (radium-226 and radium-228, thorium-230, and uranium); (2) soil (from windblown tailings) include radionuclides (radium-226 and thorium-230); and (3) indoor air includes one radionuclide (radon-222).
Conclusion of Significant Site-related Risk: The primary threats contributing to human health risks, and the contaminants ultimately
driving the site’s remedial action, are inorganic chemicals and radionuclide contaminants in ground water (particularly selenium) and radon-222 in air. The two major pathway concerns for human exposure to inorganic chemicals and radionuclides are ground water and air. The
9/23/2016
B2-42
receptors with potentially unacceptable risk from these media are current residents in nearby subdivisions. The primary routes of exposure to these media are ingestion and inhalation.
OU1 states that human health risks exist from selenium to current residents ingesting ground water due to contamination of the shallow aquifer in OU1; however, no quantitative risks were provided. OU2 is under the direction of the Nuclear Regulatory Commission (NRC), and neither quantitative nor qualitative risks were provided in accessible documents. In OU3, the primary contributor to human health risk is radon-222 (current cancer risk of 5.9E-04 to residential receptors from inhalation of contaminated air).
An ecological risk assessment was not conducted for the site.
Human Health Risk Driver(s): Operable Unit 00 (site-wide): Air, Cancer
– Current Resident, Inhalation • Radon-222
Ecological Risk Driver(s): An ecological risk assessment was not conducted for this site.
Final Remedy: The following outlines the selected remedial actions to address soil, ground water, and
surface water.
OU1 (Contamination of Ground Water from Tailings Seepage) – (1) previous actions taken by HMC in agreement with the state and the U.S. Environmental
Protection Agency (EPA) include providing an alternative water source for affected residents and funding of the alternate water costs for 10 years as well as injection of clean water; and
(2) collection, cleaning, and reinjection of contaminated ground water from the aquifer.
Nearly 4.5 billion gallons of ground water was removed, and 540 million gallons of treated water was injected through the OU1 remedy. NRC reasserted regulatory authority over uranium milling operations in New Mexico in 1986 and regulated ground water remedial activities.
OU2 (Stabilization of the Tailings) – 21 million tons of soil were remediated in the large tailing impoundment and 1.2 million tons in the small tailing impoundment. After milling operations ceased in 1990, the activities for mill decommissioning, surface reclamation and remediation, stabilization of the tailings impoundments, and site closure have been performed under the direction of the NRC. For addressing air in
OU3 (Radon Concentrations in Neighboring Subdivisions), EPA determined that it does not have the authority to address radon concentrations in the subdivisions; however, house-specific radon reduction methods were given as recommendations to homeowners, and a Memorandum of Understanding was signed by EPA and the NRC designating the NRC as the lead federal agency addressing the radon issue. EPA will continue to review outdoor radon
9/23/2016
B2-43
monitoring and particulates data collected at the facility boundary pursuant to NRC license requirements.
Li Tungsten Corp. NPL Site Summary EPA ID: NYD986882660 Number of Operable Units: 4 Location: Glen Cove, NY Date of NPL Listing: 1992 EPA Region: 2 Last Operational Year: 1985 Status: NPL - Final Documents Used: RI/FS & ROD (Various by OU)
Introduction: The Li Tungsten Corp. Site is a former primary smelting facility in an industrial area
along the north bank of Glen Cove Creek in Glen Cove, Nassau County, New York. From the 1940s to the early 1980s, tungsten ores imported from around the world were smelted at the facility to produce tungsten carbide powder, tungsten wire, and welding rods. The site consists of two tracts of land: the 26-acre property comprising the former Li Tungsten facility, and portions of the 23-acre former Captain’s Cove condominium development property. From the late 1950s to the late 1970s, the Captain’s Cove area was used as a dump site for the disposal of incinerator ash, sewage sludge, rubbish, household debris, dredged sediments from Glen Cove Creek, and industrial wastes. Typical operations in the extraction process included physical, chemical, and mechanical processes, such as sizing and crushing, gravity separation, magnetic and electrostatic separation, roasting, leaching, flotation, and fusion. These operations resulted in contaminated slag and radioactive ore residuals. The site is divided into four Operable Units (OUs):
OU1– addresses soils and ground water at the former facility;
OU2– addresses soils and ground water at the Captain's Cove property);
OU3– addresses radiological survey of Dice Complex (this OU was discontinued); and
OU4– addresses radioactive slag in Glen Cove Creek.
Summary of Site-related Contamination: Site-related contamination is the result of smelting operations; specifically, disposal
practices, slag, and radioactive ore residual. Site operations have contaminated various media (surface soil, sediment, dust/air, and ground water) with numerous contaminants. Li Tungsten operable units are contaminated with inorganic chemicals, radionuclides, pesticides, polyaromatic hydrocarbons (PAHs), polychlorinated biphenyls (PCBs), semi-volatile organic compounds (SVOCs), and volatile organic compounds (VOCs).
Conclusion of Site-related Risk: The primary threats contributing to human health and ecological risks, and the
contaminants driving the remedial action, are inorganic chemicals, pesticides, PAHs, PCBs, VOCs, and radionuclides. The major media of concern include soil, dust, ground water, sediment, and surface water. Expose individuals potentially experiencing unacceptable health risk from these media are residential, occupational, recreational, and trespassing receptors. The primary routes of exposure to these media are ingestion (accidental or intentional), inhalation, dermal contact, and external radiation.
9/23/2016
B2-44
In OU1, the primary contributors to human health risk are (1) arsenic (future cancer risk ranges from 1E-06 to occupational receptor from dermal exposure to contaminated ground water to 1E-02 to residential child receptor from ingestion of contaminated soil, and future non-cancer risk hazard quotient [HQ] of 300 to residential child receptor from ingestion of contaminated soil); (2) cadmium (future cancer risk of 9E-03 to residential adult receptor from ingestion of contaminated ground water); (3) thorium-228 (cancer risk ranges from 1E-06 to current trespasser adolescent receptor from external radiation from contaminated sediment to 5E-03 and 8E-03 to future residential and occupational receptors from external radiation from contaminated soil); (4) radium-226 (cancer risk ranges from 1E-06, each, for current trespasser adolescent receptor and future occupational receptor from external radiation from sediment and soil, respectively, to 2E-03 and 3E-03 for future residential and occupational external radiation from soil); (5) radium-228 (future cancer risk of 1E-06, each, for residential child and occupational receptors from external radiation from ground water and soil, respectively, to 3E-03 and 4E-03 for residential adult and occupational receptors, respectively, from external radiation from soil); (6) vinyl chloride (future cancer risk of 2E-06 to occupational receptor from dermal contact with ground water to 3E-03 to residential adult receptor from ingestion of ground water); and (7) 1,1-dichloroethene (future cancer risk of 1E-06 to occupational receptor from dermal contact with ground water to 7E-04 to residential adult receptor from ingestion of ground water). In OU2, the primary contributors to human health risk are (1) arsenic (cancer risk ranges from 1E-06 for current trespasser adolescent receptor from ingestion of sediment to 6E-02, 2E-01, and 9E-02 for future occupational, residential adult, and residential child, respectively, from ingestion of ground water, and with non-cancer risk HQs of 400, 1000, and 2000, respectively); (2) thorium-228 (cancer risk ranges from 2E-06 for current trespasser adolescent receptor from external radiation from soil to 7E-03 for future residential adult receptor from external radiation from soil); (3) radium-226 (cancer risk ranges from 5E-06 for current trespasser adolescent receptor from external radiation from soil to 3E-02 for future residential adult from external radiation from soil); (4) radium-228 (future cancer risk ranges from 2E-06 for residential child receptor from external radiation from ground water to 3E-03 residential adult receptor from external radiation from soil); (5) uranium-238 (future cancer risk ranges from 3E-06 to 1E-03 for occupational and residential adult receptor, respectively, from external radiation from soil); (6) vinyl chloride (future cancer risk ranges from 1E-06 to 4E-04 and 6E-04 for residential adult, occupational, and residential child receptors, respectively, from ingestion of ground water). In OU4, the primary contributors to human health risk are (1) radium-226 (future cancer risk ranges from 8.3E-04 to 3.3E-03 for occupational and residential child receptors, respectively, from external radiation from soil; additionally, occupational and residential adult receptors’ ingestion of ground water yields future cancer risks of 1.2E-04 and 3.3E-04, respectively); (2) radium-228 (future cancer risk ranges from: 1.7E-02 and 8.5E-03 for occupational and residential child receptors, respectively, from external radiation from soil; 1.3E-03 and 1.7E-02 for residential adult receptor from ingestion of soil and ground water, respectively; and 2.1E-03 for residential child receptor from ingestion of ground water); and (3) thorium-228 (current and future cancer risk of 1E-03 for recreational adolescent receptor from external radiation from sediment; cancer risk ranges from 1.4E-02 to 5.8E-02 for residential child and adult receptors, respectively, from external radiation from surface soil).
Terrestrial and aquatic birds and small mammals may also experience elevated exposure risks as a result of contact with contaminated soil, sediment, surface water, and food items. Ecological risks have been identified for a number of avian and mammalian species, as well as
9/23/2016
B2-45
terrestrial plants and invertebrates, and aquatic biota from exposure to inorganic chemicals, PAHs, pesticides, PCBs, VOCs, and radionuclides in OU1 and OU2. The pathways analyzed include ingestion of food items, soil, sediment, and surface water; direct uptake from soil; and combined exposure pathways. The primary contributors to risk to aquatic organisms from surface water are (1) pesticides (HQ 9100 from 4,4’-DDD; HQ 4600 from 4,4’-DDT); (2) PCBs (HQ of 1000 from all PCBs); and (3) metals (HQ of 2880 from cobalt; HQ of 905 from silver; HQ of 533 from iron). The primary contributors to ecological risk to avian receptors from ingestion of soil, sediment, surface water and food items include (1) zinc (HQ of 2380 to the American Robin and 1280 to the Mallard); (2) selenium (HQ of 2350 to the Mallard and 1510 to the American Robin); and (3) lead (HQ of 1600 to the American Robin and 422 to the Mallard). The primary contributors to ecological risk to mammalian receptors include (1) selenium (HQ of 39800 to the Raccoon, 9380 to the Red Fox, and 4740 to the Deer Mouse); (2) antimony (HQ of 14400 to the Red Fox, 7640 to the Deer Mouse, and 582 to the Raccoon); (3) arsenic (HQ of 12000 to the Red Fox, 11900 to the Raccoon, and 7660 to the Deer Mouse); and (4) aluminum (HQ of 7970 to the Red Fox, 6960 to the Raccoon, and 4270 to the Deer Mouse). The primary contributor to ecological risk to soil invertebrates from direct contact with soil and ingestion of food items and soil is (1) chromium (HQ of 4050). The primary contributors of risk to terrestrial plants from direct uptake from soil are (1) chromium (HQ of 1620); (2) aluminum (HQ of 1130); and (3) antimony (HQ of 1120).
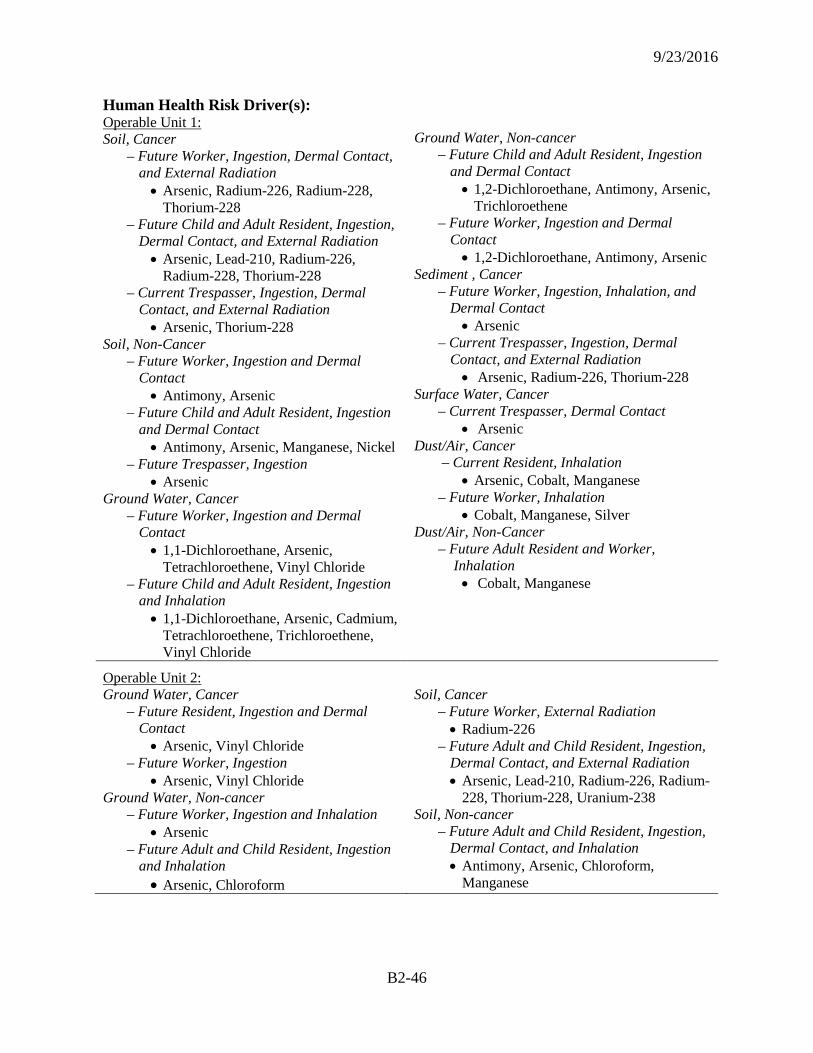
9/23/2016
B2-46
Human Health Risk Driver(s): Operable Unit 1: Soil, Cancer
– Future Worker, Ingestion, Dermal Contact, and External Radiation • Arsenic, Radium-226, Radium-228,
Thorium-228 – Future Child and Adult Resident, Ingestion,
Dermal Contact, and External Radiation • Arsenic, Lead-210, Radium-226,
Radium-228, Thorium-228 – Current Trespasser, Ingestion, Dermal
Contact, and External Radiation • Arsenic, Thorium-228
Soil, Non-Cancer – Future Worker, Ingestion and Dermal
Contact • Antimony, Arsenic
– Future Child and Adult Resident, Ingestion and Dermal Contact • Antimony, Arsenic, Manganese, Nickel
– Future Trespasser, Ingestion • Arsenic
Ground Water, Cancer – Future Worker, Ingestion and Dermal
Contact • 1,1-Dichloroethane, Arsenic,
Tetrachloroethene, Vinyl Chloride – Future Child and Adult Resident, Ingestion
and Inhalation • 1,1-Dichloroethane, Arsenic, Cadmium,
Tetrachloroethene, Trichloroethene, Vinyl Chloride
Ground Water, Non-cancer
– Future Child and Adult Resident, Ingestion and Dermal Contact • 1,2-Dichloroethane, Antimony, Arsenic,
Trichloroethene – Future Worker, Ingestion and Dermal
Contact • 1,2-Dichloroethane, Antimony, Arsenic
Sediment , Cancer – Future Worker, Ingestion, Inhalation, and
Dermal Contact • Arsenic
– Current Trespasser, Ingestion, Dermal Contact, and External Radiation • Arsenic, Radium-226, Thorium-228
Surface Water, Cancer – Current Trespasser, Dermal Contact
• Arsenic Dust/Air, Cancer
– Current Resident, Inhalation • Arsenic, Cobalt, Manganese
– Future Worker, Inhalation • Cobalt, Manganese, Silver
Dust/Air, Non-Cancer – Future Adult Resident and Worker,
Inhalation • Cobalt, Manganese
Operable Unit 2: Ground Water, Cancer
– Future Resident, Ingestion and Dermal Contact • Arsenic, Vinyl Chloride
– Future Worker, Ingestion • Arsenic, Vinyl Chloride
Ground Water, Non-cancer – Future Worker, Ingestion and Inhalation
• Arsenic – Future Adult and Child Resident, Ingestion
and Inhalation • Arsenic, Chloroform
Soil, Cancer
– Future Worker, External Radiation • Radium-226
– Future Adult and Child Resident, Ingestion, Dermal Contact, and External Radiation • Arsenic, Lead-210, Radium-226, Radium-
228, Thorium-228, Uranium-238 Soil, Non-cancer
– Future Adult and Child Resident, Ingestion, Dermal Contact, and Inhalation • Antimony, Arsenic, Chloroform,
Manganese
9/23/2016
B2-47
Human Health Risk Driver(s) (cont’d): Operable Unit 4: Ground Water, Cancer
– Future Worker, Ingestion • Radium-226
– Future Adult and Child Resident, Ingestion • Radium-226, Radium-228
Sediment, Cancer – Current & Future Worker, External
Radiation • Radium-228
– Current & Future Adult and Child Resident, Ingestion and External Radiation • Radium-228, Thorium-228
Soil , Cancer – Future Worker, Ingestion and External
Radiation • Radium-226 Radium-228, Thorium-228,
Thorium-232 – Future Adult and Child Resident, Ingestion
and External Radiation • Radium-226, Radium-228, Thorium-228,
Thorium-232
Ecological Risk Driver(s): Operable Units 1 and 2: Food, Soil, Sediment, Surface Water
– Avian, Ingestion • Lead, Selenium, Zinc
– Mammalian, Ingestion • Aluminum, Antimony, Arsenic, Zinc
Food and Soil – Soil Invertebrates, Ingestion and Direct
Contact • Chromium
Direct Uptake from Soil – Terrestrial Plants • Aluminum, Antimony, Chromium
Not specified, Aquatic Biota • Inorganic Chemicals, Pesticides, PCBs
Final Remedy: The following outlines the selected remedial actions to address soil, ground water and
sediment. OU1 and OU2 soils –
(1) excavation of soils and sediments contaminated above cleanup levels;
(2) separation of radionuclide-contaminated soil from non-radionuclide soil contaminated with heavy metals;
(3) offsite disposal of both radionuclide and metals contaminated soil at appropriately licensed facilities;
(4) offsite disposal of radioactive waste at an appropriately licensed facility;
(5) building demolition at the facility;
(6) storm sewer and sump cleanouts at the Li Tungsten facility;
(7) institutional controls governing the future use of the site; decommissioning of Industrial Well N1917 on Parcel A; and
(8) collection and offsite disposal of contaminated surface water from Parcels B and C.
OU 1 and OU2 ground water – (1) no action; and
9/23/2016
B2-48
(2) long-term groundwater monitoring program to assess the recovery of the Upper Glacial Aquifer after the soil remedy is implemented.
OU4 – (1) construction of a dewatering facility on the Li Tungsten property;
(2) two phases of Creek dredging to remove radioactive slag materials;
(3) dewatering of the dredged sediment followed by segregation of slag from the dewatered sediment; and
(4) off-site transportation and disposal of the radioactive slag at an appropriately licensed facility.
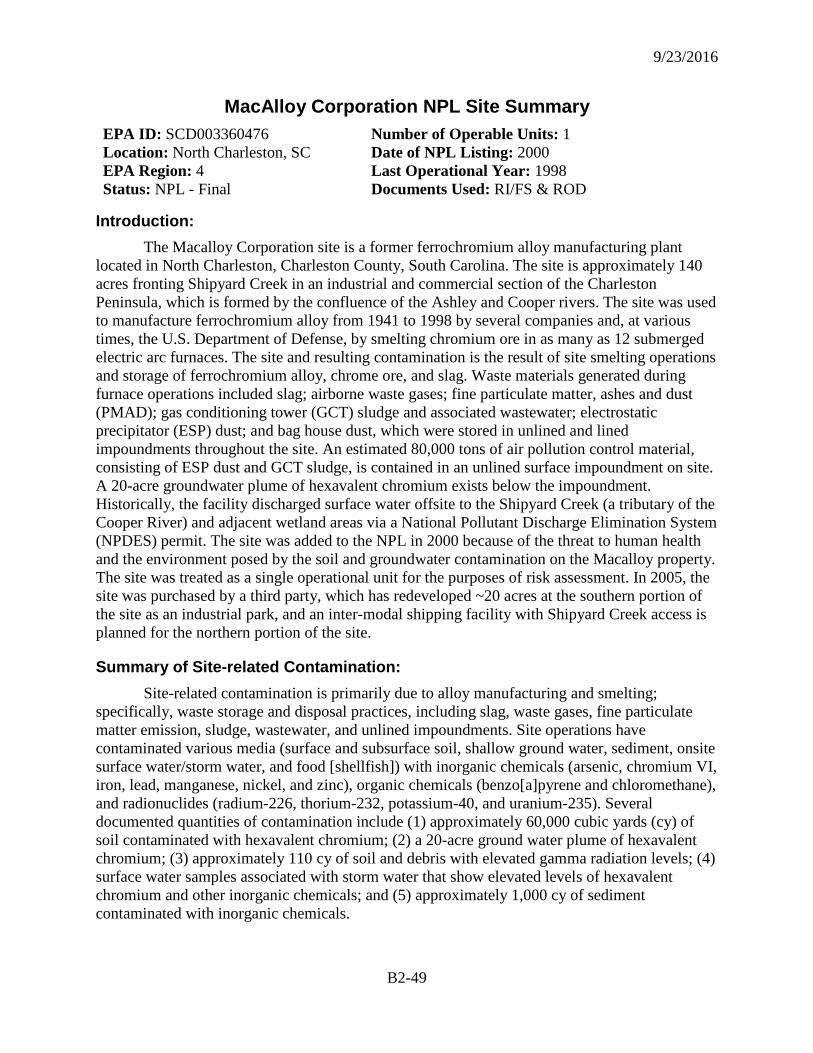
9/23/2016
B2-49
MacAlloy Corporation NPL Site Summary EPA ID: SCD003360476 Number of Operable Units: 1 Location: North Charleston, SC Date of NPL Listing: 2000 EPA Region: 4 Last Operational Year: 1998 Status: NPL - Final Documents Used: RI/FS & ROD
Introduction: The Macalloy Corporation site is a former ferrochromium alloy manufacturing plant
located in North Charleston, Charleston County, South Carolina. The site is approximately 140 acres fronting Shipyard Creek in an industrial and commercial section of the Charleston Peninsula, which is formed by the confluence of the Ashley and Cooper rivers. The site was used to manufacture ferrochromium alloy from 1941 to 1998 by several companies and, at various times, the U.S. Department of Defense, by smelting chromium ore in as many as 12 submerged electric arc furnaces. The site and resulting contamination is the result of site smelting operations and storage of ferrochromium alloy, chrome ore, and slag. Waste materials generated during furnace operations included slag; airborne waste gases; fine particulate matter, ashes and dust (PMAD); gas conditioning tower (GCT) sludge and associated wastewater; electrostatic precipitator (ESP) dust; and bag house dust, which were stored in unlined and lined impoundments throughout the site. An estimated 80,000 tons of air pollution control material, consisting of ESP dust and GCT sludge, is contained in an unlined surface impoundment on site. A 20-acre groundwater plume of hexavalent chromium exists below the impoundment. Historically, the facility discharged surface water offsite to the Shipyard Creek (a tributary of the Cooper River) and adjacent wetland areas via a National Pollutant Discharge Elimination System (NPDES) permit. The site was added to the NPL in 2000 because of the threat to human health and the environment posed by the soil and groundwater contamination on the Macalloy property. The site was treated as a single operational unit for the purposes of risk assessment. In 2005, the site was purchased by a third party, which has redeveloped ~20 acres at the southern portion of the site as an industrial park, and an inter-modal shipping facility with Shipyard Creek access is planned for the northern portion of the site.
Summary of Site-related Contamination: Site-related contamination is primarily due to alloy manufacturing and smelting;
specifically, waste storage and disposal practices, including slag, waste gases, fine particulate matter emission, sludge, wastewater, and unlined impoundments. Site operations have contaminated various media (surface and subsurface soil, shallow ground water, sediment, onsite surface water/storm water, and food [shellfish]) with inorganic chemicals (arsenic, chromium VI, iron, lead, manganese, nickel, and zinc), organic chemicals (benzo[a]pyrene and chloromethane), and radionuclides (radium-226, thorium-232, potassium-40, and uranium-235). Several documented quantities of contamination include (1) approximately 60,000 cubic yards (cy) of soil contaminated with hexavalent chromium; (2) a 20-acre ground water plume of hexavalent chromium; (3) approximately 110 cy of soil and debris with elevated gamma radiation levels; (4) surface water samples associated with storm water that show elevated levels of hexavalent chromium and other inorganic chemicals; and (5) approximately 1,000 cy of sediment contaminated with inorganic chemicals.
9/23/2016
B2-50
Conclusion of Site-related Risk: The site is currently unused; however, future industrial use is planned.
Site-wide human health risks have been identified from exposure to inorganic chemicals (antimony, arsenic, chromium VI, iron, and manganese) and organic chemicals (benzo[a]pyrene equivalents). The pathways of concern for human health risks are ingestion of ground water, soil, and food (shrimp). Receptors with potentially unacceptable risk from these media are residential, occupational, and recreational receptors. Elevated risks were identified under future land-use scenarios. The primary contributors of risk to residential receptors are (1) arsenic (lifetime weighted average cancer risks of 2E-04 and 2E-05 from groundwater ingestion and surface soil ingestion, respectively); (2) benzo(a)pyrene equivalent (lifetime weighted average cancer risks of 1E-05 and 5E-06 for soil ingestion and dermal contact, respectively); and, (3) hexavalent chromium (future non-cancer risk HQs of 203 [child] and 86.8 [adult] for residential groundwater ingestion). The primary contributor of risk to onsite occupational receptors is hexavalent chromium (non-cancer risk HQ of 31 from groundwater ingestion). The primary contributor of risk to onsite recreational fisher receptors is arsenic (cancer risk of 2.4E-04, and non-cancer HQ of 3.11 from ingestion of food [shrimp]).
The primary contributors to ecological risk are inorganic chemicals (chromium [total], lead, nickel, and zinc); however, risks were qualitatively stated as being acceptable to benthic organisms through ingestion and direct contact with contaminated sediment.
Human Health Risk Driver(s): Operable Unit 00 (site-wide): Soil, Cancer
– Future Adult and Child Resident, Ingestion and Dermal Contact • Arsenic, Benzo(a)pyrene Equivalent
Ground Water, Cancer – Future Adult and Child Resident, and
Worker, Ingestion • Arsenic
Ground Water, Non-cancer – Future Adult and Child Resident, and
Worker, Ingestion • Chromium (VI)
Food (Shrimp), Cancer – Future Recreational User, Ingestion
• Arsenic Food (Shrimp), Non-Cancer
– Future Recreational User, Ingestion • Arsenic
Ecological Risk Driver(s): Operable Unit 00 (site-wide): Sediment
– Current Benthic Organisms, Multiple Routes • No Risk Drivers • Shrimp contamination will be
monitored
Final Remedy: The selected remedial actions address sediment, ground water, soil, and surface
water/storm water are
(1) to prevent exposure to radiation levels greater than twice the measured background concentration, excavation of ~ 110 cy of radiological soil and debris, with off-site disposal;
9/23/2016
B2-51
(2) to eliminate exposure to benthic organisms from unacceptable concentrations of chromium, nickel, and zinc, dredging of contaminated sediment in area 001 Tidal Creek, with upland disposal, capping, and restoration;
(3) to monitor Zone C Shipyard Creek sediment until the preparation of the Five-Year Review Report;
(4) to prevent exposure to chromium (VI) concentrations in shallow ground water above the maximum contaminant level (MCL) specified by the Safe Drinking Water Act for total chromium (100 µg/L) and to minimize the migration of chromium (VI) from ground water to Shipyard Creek, enhanced in situ chemical reduction of contaminated ground water;
(5) to prevent the leaching of chromium (VI) from site soil to ground water at concentrations exceeding the groundwater cleanup level, on-site chemical reduction of ~ 115,000 cy of soil contaminated with chromium (VI), with stabilization/solidification, i.e., ex situ treatment with mechanical mixing;
(6) to mitigate discharge of contaminants into Shipyard Creek and address the substantive requirements of the Clean Water Act, a comprehensive storm water and sediment control management system; and
(7) to establish institutional controls and restrictive covenants to limit land use to commercial/industrial purposes and prohibit the use of ground water underlying the property.
9/23/2016
B2-52
Midnite Mine NPL Site Summary EPA ID: WAD980978753 Number of Operable Units: 2 Location: Wellpinit, WA Date of NPL Listing: 1983 EPA Region: 10 Last Operational Year: 1981 Status: NPL – Final Documents Used: OU1- ROD, RI/FS
Introduction: The Midnite Mine Superfund Site is located on the Spokane Indian Reservation in eastern
Washington State, approximately 45 miles northwest of Spokane. The site is located on federal government lands held in trust for the Spokane Tribe of Indians. Mining operations began in 1955 and continued until 1981, excluding a 4-year period in the late 1960s. The site includes an inactive open pit uranium mine as well as the areas impacted by mine-related contamination. About 2.4 million tons of ore and proto-ore were stockpiled on site. Waste rock was used to backfill a series of previously mined pits, construct roads, and grade the site, or was dumped in piles. Pit 3 and Pit 4 were not backfilled and remain open. The site is divided into two Operable Units (OUs): OU1 (Mined Area and Mining Affected Area) consists of the mined area, the gravel haul roads at and near the mine and areas of ground water, surface water, sediments, and soil affected by the environmental transport of mine-related contaminants; and OU2 (Midnite Mine Haul Route) consists of areas along the paved road where ore or waste spilled in transit to the mill or was dumped, leading to levels of gamma radiation that posed a risk to human health. Prior to the final remedy, a removal action was performed to excavate ore debris in OU2 and stage the debris in OU1.
Summary of Site-related Contamination: The site is contaminated primarily with inorganic chemicals (aluminum, antimony,
arsenic, barium, beryllium, cadmium, chromium, cobalt, copper, lead, manganese, molybdenum, nickel, selenium, thallium, vanadium, and zinc) as well as radionuclides (including lead-210, radium-226, radon-222, thorium-228, uranium-234, and uranium-238). These contaminants result from acid mine drainage, radioactive decay, and particulate migration.
Conclusion of Significant Site-related Risk: The contaminants ultimately driving the site’s remedial action are inorganic chemicals
(aluminum, antimony, arsenic, barium, beryllium, cadmium, chromium, cobalt, copper, lead, manganese, molybdenum, nickel, selenium, silver, thallium, vanadium, and zinc) and radionuclides (lead-210, radium-226, radon-222, thorium-228, uranium-234, and uranium-238). The major media of concern include soil, surface water, sediment, ground water, air, and contaminated food. All receptors for human health are from the local Indian tribes. The receptors with potentially unacceptable risk are future residents, and current and future non-residential and recreational receptors. The primary routes of exposure to these media include inhalation, ingestion, and external radiation.
Due to the removal action in OU2 and incorporation with OU1, specific risks are reported only for OU1. The primary contributors to human health cancer risk in OU1 include (1) uranium isotopes (risk to future residents from inhalation of ground water of 7E-01 [uranium-234] and 6E-01 [uranium-238]; and inhalation of surface water of 4E-01 [both uranium-234 and uranium-
9/23/2016
B2-53
238]); (2) lead-210 (risk to future residents from plant ingestion of 4E-01 and meat ingestion of 1E-01 and risk to current/future non-residential receptors from meat ingestion of 2E-01); and (3) airborne radon (risk to future residents from inhalation of 2E-01). The primary contributors to non-cancer risk include (1) all contaminants (HQ of 141,653 and 77,347 to future child and adult residents, respectively, from ingestion of plants; HQ of 15,309 from inhalation of ground water by future adult residents; and HQ of 9,767 from inhalation of surface water by future adult residents); and (2) uranium (HQ of 141,070 and 77,029 to future child and adult residents, respectively, from ingestion of plants).
Current ecological risks were identified for many receptors, including periphyton, benthic macroinvertebrates, fish, terrestrial soil community, terrestrial plants, amphibians, wetland plants, wetland invertebrates, mammals (with various feeding strategies), and birds (with various feeding strategies) from exposure to inorganic chemicals and radionuclides. The primary contributors to ecological risk in OU1 are (1) zinc (HQ of 1370 for direct contact with surface water by amphibians; HQ of 381 for terrestrial plants exposed to contaminated surface soil through unspecified routes), (2) uranium (HQ of 728 for wetland plant exposed to contaminated sediment through unspecified routes; HQ of 214.1 for wetland invertebrates exposed to contaminated sediment through unspecified routes), (3) copper (HQ of 116.7 for amphibians exposed to contaminated surface water through direct contact), and (4) chromium (HQ of 165 for the terrestrial soil community exposed to contaminated soil through unspecified routes).
Human Health Risk Driver(s): Operable Unit 1: Ground Water, Cancer
– Future Resident, Inhalation • Uranium-234, Uranium-238
Ground Water, Non-cancer – Future Adult Resident, Inhalation
• All Contaminants (Inorganic chemicals, Radionuclides)
Surface Water, Cancer – Future Resident, Inhalation
• Uranium-234, Uranium-238 Surface Water, Non-cancer
– Future Adult Resident, Inhalation • All Contaminants (Inorganic chemicals,
Radionuclides) Food (plants), Cancer
– Future Resident, Ingestion • Lead-210
Food (plants), Non-cancer – Future Child and Adult Resident, Ingestion
• All Contaminants (Inorganic chemicals, Radionuclides)
Food (meat), Cancer
– Current & Future Non-Resident, Ingestion • Lead-210
Indoor Air, Cancer –Future Resident, Inhalation
• Radon
Ecological Risk Driver(s): Operable Unit 1: Surface Water
– Current Amphibian, Direct Contact • Copper, Zinc
Surface Soil – Current Terrestrial Plant Community,
Unspecified Route • Chromium, Zinc
Sediment – Current Wetland Plant Community,
Unspecified Route • Uranium
– Current Wetland Invertebrates, Unspecified Route • Uranium
9/23/2016
B2-54
Final Remedy: Prior to the final remedy, a removal action was performed to excavate ore debris in OU2
and stage the debris in OU1. The final remedy addresses site-wide contamination in soil, ground water, surface water, and sediment. The remedy helps mitigate risks from direct contact with soil and radiation exposure as well as risks related to contaminated water. The remedial actions taken for the entire site include
(1) excavation and containment of mine wastes in pits,
(2) seep and pit water collection and treatment,
(3) residuals waste management,
(4) surface water and sediment management,
(5) monitored natural attenuation of ground water,
(6) institutional controls and access restrictions,
(7) long-term site management, and
(8) contingent actions for sediment cleanup and acid rock drainage reduction.
The amount of each media remediated/removed was not documented.
9/23/2016
B2-55
Mine Site 2028 Removal Site Summary EPA ID: INN000510234 Number of Operable Units: 1 Location: Brazil, IN Date in CERCLIS: 2007 EPA Region: 5 Last Operational Year: 1926 Status: Removal – Time Critical Documents Used: Action Memorandum & Site
Assessment Report
Introduction: Mine Site 2028 is located immediately west of 911 West Hendrix, in Brazil, Indiana
(which, as of July 2006, had a population of 8,212). The area around Brazil has hosted a large number of companies that produce ceramic products ranging from ceramic pumps to tiles and bricks. In addition, Brazil has large deposits of shale, clay, and coal. Mine Site 2028 contains two large ponds and former clay/coal pits. Mining operations were conducted from 1896 until 1926. Coal was located at a depth of 80 feet and was found in a seam 4 feet thick. Due to former underground mining on this property, there are numerous subsidence areas. Mine Site 2028 is bordered by a trucking company to the east, residential areas to the east and southeast, and mixed farmland/residential/light industrial to the west and north. Mining operations and drum disposal have led to site-wide contamination. It was estimated that approximately 1,000 cubic yards of soil were contaminated along with the presence of approximately 306 drums. In addition to the physical hazard represented by the compromised land surface, deteriorating drums containing potentially combustible materials could pose a fire and explosion hazard. For these reasons, the Agency for Toxic Substances and Disease Registry (ATSDR) concluded that site conditions posed a potential public health hazard and recommended removal of the drums to be protective of the health of area residents.
Summary of Site-related Contamination: Site-related contamination is the result of mining operations, specifically large waste
ponds and clay/coal pits. During the May 2007 site assessment, four drum and six soil samples were collected, of which, two drums were found to exceed 40 CFR §261.24, toxicity characteristic, which defines waste that is hazardous due to certain characteristics. Specifically, the 40 CFR §261.24 regulatory levels were exceeded for cadmium and lead, which are, respectively, 1 and 5 milligrams per liter (mg/L). The highest toxicity characteristic leaching procedure (TCLP) drum results are 11 mg/L for cadmium and 29 mg/L for lead. The highest total concentration in soil is 520 parts per million (ppm) for cadmium and 5,000 ppm for lead. Given that only four drums were sampled, and as many as 200 drums were counted in the area, there is a possibility that greater levels of contamination and other contaminants besides metals are present in the drums and in the soils around the drums. The site is contaminated with other inorganic chemicals (aluminum, antimony, arsenic, barium, beryllium, cadmium, calcium, cobalt, copper, hexavalent chromium, iron, lead, magnesium, manganese, mercury, nickel, potassium, selenium, silver, sodium, thallium, vanadium, and zinc).
Conclusion of Site-related Risk: The primary threats contributing to human health, and the contaminants found to exceed
the Indiana Department of Environmental Management’s (IDEM’s) Risk Integrated System of Closure (RISC) guidelines, are inorganic chemicals (antimony, arsenic, barium, cadmium,
9/23/2016
B2-56
hexavalent chromium, lead, and mercury). These contaminants are found in varying combinations in soil and deposited drums, with the potential threat to migrate to ground water. Although it is unlikely that chronic exposures would occur at the location of the drums, a residential area lies to the east and southeast of the site within half a mile. Because access to the site is not restricted, even intermittent exposures on the property are possible.
Due to the time-critical removal as a result of ATSDR site assessment, no human health or ecological risk assessments were conducted. According to the health consultation prepared by ATSDR, concentrations of antimony, cadmium, hexavalent chromium, and lead exceed ATSDR's risk-based health criterion by as much as 48 times for antimony, 20 times for lead, and 10 times for cadmium. Human health cancer and non-cancer risks were not specifically quantified for this site.
Although the primary contributors to ecological risk were not evaluated for this site, it is reported that the Indiana Bat, a federally endangered species, inhabits the area and may be impacted by site contamination.
Final Remedy: The selected remedy directly addresses contaminated soil and waste drums and indirectly
mitigates migration of contamination into ground water. The overall approach for the removal action involves
(1) cleaning and grubbing of vegetation,
(2) drum removal from sinkhole (306 drums),
(3) drum disposal, and
(4) backfilling of sinkholes with various rocks overlain with clay and re-vegetation of the area.
9/23/2016
B2-57
Monsanto Chemical Co. (Soda Springs Plant) NPL Site Summary EPA ID: IDD081830994 Number of Operable Units: 1 Location: Soda Springs, ID Date of NPL Listing: 1990 EPA Region: 10 Last Operational Year: Currently in operation Status: NPL - Final Documents Used: RI/FS & ROD (Various by OU)
Introduction: Since 1952, the Monsanto Chemical Company has produced elemental phosphorus from
locally mined phosphate ore in southeastern Idaho, 1 mile north of Soda Springs, Caribou County, Idaho. The 530-acre site is in a broad valley near the western base of the Aspen Range. Monsanto’s Soda Springs plant generates a number of process waste streams containing inorganic compounds. Most liquid and solid wastes are stored or treated in onsite ponds or piles. Slag constitutes the greatest quantity of waste. Molten slag is tapped from the base of the electric air furnaces and poured out to cool in piles. The piles cover a large portion of the site and are more than 150-feet high. Groundwater contamination sources at the site were identified as a leaky hydro-clarifier and several unlined ponds. Monsanto has discontinued use of the old ponds, installed new lined ponds, and replaced the old hydro-clarifier. Onsite monitoring wells and sediments in an old unlined pond, having received process wastewater, were shown to be contaminated with inorganic chemicals (arsenic, cadmium, and chromium). Within 3 miles of the site are public springs and private wells that provide drinking water to an estimated 3,000 people. Water discharging from an onsite pond to Soda Creek, 2,000 feet away, is contaminated with cadmium. Water withdrawn from Soda Canal, 1.2 miles downstream, is used to irrigate 4,040 acres. There is only one Operable Unit (OU 00) designated for site-wide contamination at the Soda Springs plant.
Summary of Site-related Contamination: Site-related contamination is the result of mining operations; specifically, liquid and solid
wastes stored and treated in onsite ponds and piles, including slag. In addition, leaking equipment, such as the hydro-clarifier, contributed to groundwater contamination. Site operations have contaminated various media (ground water, soil, surface water, sediment, and air) with inorganic chemicals (primarily arsenic, beryllium, cadmium, fluoride, and selenium) and radionuclides (primarily lead-210, radium-226, thorium-230, and uranium-238) for onsite industrial and residential receptors (children and adults).
Conclusion of Site-related Risk: The current exposure routes for residential receptors include external gamma radiation
and the ingestion or inhalation of soils/dust. Industrial receptors’ current exposure risks include external radiation and the ingestion or inhalation of source pile/waste materials. There is no current pathway for groundwater ingestion; however, if drinking water wells are installed in the future, groundwater ingestion may be a concern. Future exposure routes of concern for residential receptors include external gamma radiation and the ingestion or inhalation of soils, particulates, and ground water. Industrial receptors’ future exposure risks include external radiation and the ingestion or inhalation of source pile/waste materials. More specifically, the primary threats to human health and the environment, and the contaminants driving the remedial
9/23/2016
B2-58
action, are inorganic chemicals (arsenic, beryllium, cadmium, fluoride, and selenium) and radionuclides (lead-210, radium-226, thorium-230, and uranium-238).
Site-wide, the primary contributors to human health risks are (1) radionuclides (current cancer risk from 2E-03 [radium-226] for residential and industrial receptor external radiation with soil/source materials to 2E-06 for industrial receptor inhalation of source pile/waste material [thorium-230 and uranium-238, respectively]); (2) radium-226 (future cancer risk ranging from 2E-03 for residential and industrial receptor external radiation exposure to 1E-06 for industrial receptor ingestion of soil/source materials); (3) arsenic (future cancer risk ranging from 9E-05 for future residential ingestion of soil, particulates, and ground water to 1E-06 for current residential inhalation of soil/dust); and (4) total contaminant exposure (cancer risk ranging from 1E-04 [inorganic chemicals] for future residential exposure to soil, particulates, ground water, and gamma radiation via all exposure routes to 5E-04 [radionuclides] for future industrial exposure to source pile/waste materials via all exposure routes).
The site-wide ecological risks appeared to be minimal soil risks to mammals and plants outside the Monsanto plant boundaries; however, the discharge of contaminants into Soda Creek could lead to surface water and sediment risks for sensitive aquatic organisms. The primary contributors to ecological risk were not quantified, but may include inorganic chemicals: (1) cadmium, (2) fluoride, (3) selenium, and (4) zinc. The final ecological assessment concluded that ecological impacts were unlikely and that ecological risk-based target cleanup levels should not be used to set remediation goals.
Human Health Risk Driver(s): Operable Unit 00 (site-wide): Source Pile/Waste Materials
– Current & Future Worker • Arsenic and Radium-226
Soil/Particulate/Ground Water/Gamma – Current Resident
• Arsenic, Beryllium, Radionuclide (cumulative)
Soil/Particulate/Ground Water/Gamma – Future Resident
• Arsenic, Beryllium, Lead-210, Radium-226, Uranium-238
Ecological Risk Driver(s): Operable Unit 00 (site-wide):
– Combined Pathways, Multiple Routes • Cadmium, Fluoride, Selenium, Zinc
Interim Remedy: Actions taken by Monsanto in conjunction with EPA’s activities pursuant to CERCLA
have resulted in significant improvements to the plant and reduced emissions prior to the final remedy. Groundwater remedial actions included
(1) replacing the hydro-clarifier, (2) abandoning four wells in accordance with regulatory guidelines,
(3) taking the underflow solids ponds out of service,
9/23/2016
B2-59
(4) closing and excavating the northwest pond,
(5) installing a new plant drinking water well, and
(6) installing recovery wells to intercept contaminated ground water.
Emissions remedial actions included
(1) installation of a new dryer and dust collector,
(2) installation of four high-energy venture scrubbers, separators, fans, and stacks for additional scrubbing of kiln exhaust,
(3) improved handling procedures of crushed slag in the baghouse dust disposal,
(4) implementation of emissions controls in the nodule reclaim area, and
(5) use of dust suppressants for on-plant stockpiles.
Final Remedy: The selected remedy addresses ground water, industry property soils, and non-industrial
property soils and reduces risks to onsite workers and residents. The remedy addresses contaminated ground water by monitoring natural attenuation with institutional controls. The ground water is not being used as a direct source for drinking water, so natural attenuation should mitigate risk. The remedy addresses contaminated soils through
(1) institutional controls through land-use restrictions placed on plant property and
(2) giving residential property owners in contaminated areas the choice to have their property either
(a) cleaned up via evacuation, containment, and replacement of soils or
(b) rendered protective of human health and the environment via land-use restrictions in the form of environmental easement held by the responsible party.
Past remedial measures, including ongoing engineering and institutional controls and compliance with regulations, have reduced onsite worker exposure to risks posed by source piles and materials within the plant. No significant human health concerns or environmental impacts were found related to air, surface water, or Soda Creek sediments, so the selected remedy did not address these media.
9/23/2016
B2-60
National Southwire Aluminum Co. NPL Site Summary EPA ID: KYD049062375 Number of Operable Units: 1 Location: Hawesville, KY Date of NPL Listing: 1994 EPA Region: 4 Last Operational Year: Currently in Operation Status: NPL - Final Documents Used: Interim ROD, Final ROD, RI/FS
Introduction: The National Southwire Aluminum (NSW) facility is an active aluminum refining
operation and a subsidiary of the Southwire Company. The site is located on approximately 900 acres in Hancock County, Kentucky, and has been in use since 1969. The operation produces primary aluminum from alumina ore. The site includes a number of manufacturing and service buildings, three former waste disposal impoundments, one active wastewater impoundment, several former waste disposal landfills, a potliner accumulation building, and a drainage ditch. The production process and materials are responsible for contamination at the site. The primary mode of contamination is produced in the carbon linings of reduction vessels (pots) during the production of aluminum. The NSW facility currently generates approximately 3,000 tons/year of spent potliners. The NSW NPL site is evaluated under one Operable Unit (OU00), which includes site-wide contamination.
Summary of Site-related Contamination: Site-related contamination is the result of aluminum refining operations; specifically,
waste disposal impoundments, wastewater impoundments, landfills, spent potliners, and a drainage ditch. Site operations have contaminated various media (surface soil, subsurface soil, sediment, surface water, and ground water) with numerous contaminants. Contamination at the site consists of inorganic chemicals (aluminum, barium, beryllium, cadmium, chromium, copper, fluoride, iron, lead, manganese, nickel, vanadium, and zinc) and organic chemicals (1,2-dichloroethane, 2-methylnaphthalene, 2,4-dimethylphenol, 4-methylphenol, acenaphthene, acenaphthylene, aroclor 1242, aroclor 1248, benzo[a]anthracene, benzo[a]pyrene, benzo[b]fluoranthene, butylbenzylphthalate, chrysene, dibenzo[a,h]anthracene, and indeno[1,2,3-cd]pyrene). These contaminants appear to be migrating from the Old South Pond into the center of the North Plume.
Conclusion of Site Risk: The primary current threats to human health, and the contaminants driving the remedial
action, are one inorganic chemical (beryllium) and organic chemicals (aroclor 1242, aroclor 1248, benzo[a]anthracene, benzo[a] pyrene, benzo[b]fluoranthene, dibenzo[a,h]anthracene, and indeno[1,2,3-cd]pyrene). The major media of concern for human exposure to organic and inorganic contaminants are soil, surface water, and combined exposure from all media. Current receptors of contamination from these media are site visitors (adults and adolescents) and occupational workers. The primary routes of exposure to these media are ingestion, dermal contact, and inhalation.
The primary contributors to current human health risk at the site are (1) exposure to combined contaminants in soil from all routes to onsite visitor adolescent receptors (current cancer risk of 2E-05]); (2) exposure to combined contaminants in all media from all routes to
9/23/2016
B2-61
onsite site visitor adult and adolescent receptors (current cancer risk of 2.0E-05); (3) exposure to benzo(a)pyrene in soil through all routes to onsite site visitor adolescent and adult receptors (current cancer risk of 1.4E-05 and 1.3E-05, respectively); and (4) exposure to benzo(a)pyrene from soil ingestion to onsite adolescent receptors (current cancer risk of 1.0E-05).
Current pathways of concern for ecological risks include (1) ingestion, respiration, and direct contact with sediment (benthic organism receptors); (2) ingestion, respiration, and direct contact with surface water (fish receptors); (3) ingestion and direct contact with surface soil and subsurface soil (terrestrial invertebrate receptors); and (4) uptake of chemicals in surface soil and subsurface soil via roots (terrestrial plant receptors). The primary contributors to ecological risk, for which no specific receptors were quantitatively identified, are (1) beryllium (current HQ of 1410 from sediment exposure]); (2) acenaphthylene (current HQ of 920 from surface soil exposure); (3) butylbenzylphthalate (current HQ of 385 from surface soil exposure); (4) acenaphthene (current HQ of 280 from surface soil exposure); (5) iron (current HQ of 260.5 from surface soil exposure); (6) aroclor 1242 (current HQ of 123.3 from surface soil exposure); (7) combined PAH exposure (current HQ of 99.8 from surface soil exposure); (8) chrysene (current HQ of 97.3 from surface soil exposure); (9) 4-methylphenol (current HQ of 92 from surface soil exposure); and (10) benzo(a)anthracene (current HQ of 80.6 from surface soil exposure).
Human Health Site-related Risks: Operable Unit 00 (site-wide): Soil, Cancer
– Current Adolescent and Adult Site Visitor, Combined Routes • Combined Inorganic and Organic
Contaminants, Benzo(a)pyrene Combined Media, Cancer
– Current Adult Site Visitor, Combined Routes • Combined Inorganic and Organic
Contaminants All Media, Cancer
– Current Adolescent Site Visitor, Combined Routes • Combined Inorganic and Organic
Contaminants
Ecological Site-related Risks: Operable Unit 00 (site-wide): Sediment
– Current (receptor not specified) Combined Routes • Beryllium
Surface Soil – Current (receptor not specified) Combined
Routes • Acenaphthylene, Butylbenzylphthalate,
Benzo(a) pyrene, Acenaphthene, Iron, Aroclor-1242, Total PAHs, Chrysene, 4-Methylphenol, Benzo(a)anthracene
Interim Remedy: In response to evidence of cyanide- and fluoride-contaminated groundwater plumes,
interim remedial actions were sought. The Old North Pond was closed using a synthetic liner, clay, and soil in 1986. It was necessary to take action at the Old South Pond to prevent additional infiltration of rainwater, facilitating mobilization of contaminants from the Old South Pond into the North Plume. Remediation of the Old South Pond began in mid-1995, beginning with a removal action that significantly reduced the hydraulic loading of the area and mitigated the migration of contaminants into the local ground water. This was followed by a new pump-and-treat system, which was able to operate more efficiently due to the removal because it would not
9/23/2016
B2-62
be overly affected by Old South Pond contaminants. The volume of ground water treated was not documented.
Final Remedy: The selected remedy addresses ground water, soil, sediment, and surface water media and
reduces risks to onsite workers and site visitors from the surface soil and surface water. In addition, the remedy mitigates contaminant migration to ground water and surface water from source materials. The site was divided into contaminant areas to more effectively address the risk. The overall remedial actions taken include
(1) excavation of onsite soils with offsite disposal, deed restrictions, and installation of a physical barrier (fence), monitoring, and a cap and vegetative cover;
(2) excavation of sediment and onsite disposal (cap); and
(3) collection and treatment of leachate.
Approximately 850 cubic yards of PCB-contaminated soils, 4,200 cubic yards of other contaminated soils, and 2,000 cubic yards of contaminated sediment were excavated and disposed of.
9/23/2016
B2-63
Omaha Lead NPL Site Summary EPA ID: NESFN0703481 Number of Operable Units: 2 Location: Omaha, NE Date of NPL Listing: 2003 EPA Region: 7 Last Operational Year: 1997 Status: NPL - Final Documents Used: RI/FS & RODs (Various by OU)
Introduction: The Omaha Lead site, located in Douglas County, Nebraska, includes surface soils
present at residential properties, child care facilities, schools, and other residential-type properties in eastern Omaha that have been contaminated as a result of air emissions from lead smelting operations. The total area of the Omaha Lead site is approximately 8,840 acres. Multiple facilities were involved in activities contributing to lead contamination at the site. The ASARCO facility conducted lead refining operations from the early 1870s until 1996. The ASARCO facility is located on approximately 23 acres on the west bank of the Missouri River in downtown Omaha. During the operational period, lead and other heavy metals were emitted into the atmosphere through smoke stacks. The pollutants were transported downwind in various directions and deposited on the ground surface due to the combined process of turbulent diffusion and gravitational settling. In addition, Gould, Inc. operated as a lead battery recycling plant and was considered a secondary lead smelter in the area. The Gould, Inc. plant closed in 1982. Soil testing of approximately 35,000 residential properties has revealed widespread lead contamination over eastern Omaha. The lead contamination is found in surface soils that are accessible and pose a risk to children 6 years of age and younger. In addition, the Douglas County Health Department has been screening children for lead poisoning for approximately 25 years. This blood lead screening has shown that several ZIP codes in close proximity to the former lead refinery have a high occurrence of elevated blood lead levels in young children. Lead is classified by the U.S. Environmental Protection Agency (EPA) as a probable human carcinogen and a cumulative toxicant. Due to the extent of contamination, the site response was divided into two operable units (OUs). OU1 addresses high child impact properties and the most highly contaminated Omaha Lead Site properties, and OU2 addresses the remaining properties that exceed risk-based soil lead levels.
Summary of Site-related Contamination: Site-related contamination is the result of smelting operations; specifically, lead
particulates in air emissions from smelter stacks. Site operations have contaminated surface soil media and dust particulates with several inorganic contaminants (aluminum, antimony, arsenic, cadmium, chromium, cobalt, copper, iron, lead, manganese, mercury, thallium, vanadium, and zinc).
Conclusion of Site-related Risk: The primary threats contributing to human health risks, and the contaminants ultimately
driving the site’s remedial action, are inorganic chemicals (antimony, arsenic, lead, mercury, and thallium). The major medium of concern for human exposure to inorganic contaminants is soil. The receptors with potentially high risk from contaminated soil are current residential adults and children. The primary routes of exposure to contamination are ingestion (accidental or intentional) and dermal contact.
9/23/2016
B2-64
Site-wide, the primary contributors to human health risk are (1) arsenic [current cancer risks of 1E-03 to residential receptors from surface soil ingestion and dermal contact combined; non-cancer HQs values of 24 and 3 for ingestion and dermal contact of soil by residential children and adults, respectively]; (2) lead [32% of total properties analyzed for lead levels had elevated blood lead levels in current residential children (P10 values exceeded by 5%)]; (3) mercury [current HQs of 17 and 2 for ingestion and dermal contact of soil by residential children and adults, respectively]; and (4) thallium [current HQs of 11 and 1 for ingestion and dermal contact of soil by residential children and adults, respectively)].
No ecological risks are available for the Omaha Lead Site because an ecological risk assessment was deemed inappropriate due to site operations and a lack of sufficient habitat.
Site-Wide Human Health Risk Driver(s): Surface Soil
– Current Resident, Ingestion (Blood Lead Levels) • Lead
Surface Soil, Cancer – Current Adult and Child Resident, Ingestion
and Dermal Contact • Arsenic
Surface Soil, Non-cancer – Current Adult and Child Resident, Ingestion
and Dermal Contact • Antimony, Arsenic, Mercury, Thallium
Site-Wide Ecological Risk Driver(s): Ecological risk assessment was not conducted
Interim Remedy: A time-critical removal action was performed addressing OU1 (High Child Impact
Properties) are
(1) excavation, backfilling, and re-vegetation of lead-contaminated residential soils in an estimated 5,600 residential-type properties exceeding 800 parts per million (ppm) and properties exceeding 400 ppm considered high child impact areas or with a residing child exhibiting an elevated blood lead level;
(2) participation in a comprehensive remedy with other organizations and agencies to characterize and address all identified sources of lead exposure at the site;
(3) stabilization of exterior lead-based paint that threatens the long-term protectiveness achieved through excavation and replacement of lead-contaminated surface soils;
(4) removal of interior dust in instances where contaminated soils contribute to interior lead dust loadings; and
(5) health education for the Omaha community and medical professionals to support public awareness; exposure prevention programs; in-home assessments; blood-lead screening programs; and diagnosis, treatment, and surveillance programs.
9/23/2016
B2-65
Final Remedy: The selected remedial actions address soil for OU2 (Remaining Properties) are
(1) excavation, backfilling, and re-vegetation of lead-contaminated residential soils in an estimated 9,966 residential-type properties exceeding 400 ppm;
(2) participation in a comprehensive remedy with other organizations and agencies to characterize and address all identified sources of lead exposure at the site;
(3) stabilization of exterior lead-based paint that threatens the long-term protectiveness achieved through excavation and replacement of lead contaminated surface soils;
(4) response to interior dust involving a high efficiency particulate air vacuum program and health education at remediated properties with interior dust lead levels exceeding eligibility criteria; and
(5) health education for the Omaha community and medical professionals to support public awareness; exposure prevention programs; in-home assessments; blood lead screening programs; and diagnosis, treatment, and surveillance programs.
9/23/2016
B2-66
Ophir Mills and Smelter Removal Site Summary EPA ID: UT0010221516 Number of Operable Units: 1 Location: Ophir, UT Date in CERCLIS: 2001 EPA Region: 8 Last Operational Year: Unknown, not currently
operating Status: Removal – Time Critical Documents Used: Action Memorandum & Site
Assessment Report
Introduction: The Ophir Mills and Smelter site is located in Tooele County, south of Salt Lake City,
Utah. The town site is located along the intermittent flowing Ophir Creek and between steep mountains both to the north and south, with elevations more than 6,000 feet above sea level. Mining for gold, silver, lead, and zinc took place in an adjoining drainage northeast and southwest of Ophir. Most of the metals were produced between 1870 and the 1930s, and the area includes several mines, two mills, and a smelter. All past workings have been abandoned, leaving behind several old mines, waste rock and tailing piles, and mill foundations scattered throughout the town and surrounding areas. These workings were the source of wastes that have migrated to the residences, as well as to settling ponds along the drainage. These hazardous substances appear to have been released into the residential soils by site-related mining activities and spread in and around the City of Ophir by water drainage and manual and aerial deposition. Presently, the Town of Ophir has a population of 31 full-time residents. There are approximately 23 homes occupied year-round or seasonally. Additionally, there are campsites and vacant areas within the community with soil that contains metal contaminants that vary in degree but are generally high in concentrations of lead and arsenic. Mines and mine waste dumps may be located upgradient of or near the source protection area for Ophir's municipal water sources. These water sources, which include two municipal wells, provide 100 percent of the municipal water supply for Ophir's residents. The removal action was intended to take immediate steps to minimize direct exposure to individuals who come into contact with surficial soils/contaminated dust.
Summary of Site-related Contamination: Site-related contamination is the result of mining, milling, and smelter operations;
specifically, abandoned mines, waste rock and tailing piles, mill foundation debris, and settling ponds. Site operations have contaminated various media (surface soil, dust, sediment, and surface water). The site contaminants present at the site are inorganic chemicals (aluminum, antimony, arsenic, barium, beryllium, cadmium, calcium, chromium, cobalt, copper, iron, lead, magnesium, manganese, mercury, nickel, potassium, selenium, silver, sodium, thallium, vanadium, and zinc).
Conclusion of Site-related Risk: A soil screening assessment at the site focused on inorganic contaminant levels (primarily
arsenic, cadmium, and lead), in surficial and sub-surface soils at occupied and vacant residential lots, tailing piles, Ophir Creek, and other suspected areas of contamination associated with site-related mining operations. Sample analyses showed the presence of arsenic varying from 12 to 2300 parts per million (ppm) and lead from 20 to 54,000 ppm. Due to high levels of arsenic and
9/23/2016
B2-67
lead sampled, no human health or ecological risk assessments were conducted and an immediate, time critical, removal action was conducted to minimize the direct exposure to current residential receptors that come into contact with contaminated soil and dust. The primary routes of exposure to residential soils, increasing health risks, are the current combined exposure via ingestion, inhalation, and dermal contact.
Final Remedy: The selected remedy addresses soil and vegetation. The remedy includes the following
actions:
(1) contaminated soils will be removed and waste piles on designated residential lots with steep slopes will be stabilized;
(2) individual residences where soil is removed will be backfilled with clean material, usually sand, and top soil to the original grade and landscaped with sod or other plants, etc.;
(3) structures and fencing on the properties will be left in place or returned to their original locations if removal is necessary (if fencing cannot be reused, it will be replaced);
(4) contaminated soils may be consolidated at a staging area and secured in storage prior to disposal; contaminated soils may also be placed in an onsite repository if existing mining waste piles are available;
(5) existing shrubs and/or bushes (defined as low, densely branched plants that impede soil removal) will be removed and replaced with the same or other locally available species, standard nursery stock, and number of plants;
(6) existing perennial plants will be removed and replaced with the same (to the extent possible) or similar species, approximate size, and number of plants;
(7) existing landscape covers and borders will be removed and replaced with equivalent materials in areas requiring remediation; however, the original materials may also be used if soil is removed before replacement and materials are not damaged during removal or they are not contaminated;
(8) movable buildings and sheds will be temporarily relocated during remediation, if remediation is necessary at that location; and
(9) prevention of indoor dust will be accomplished by employing dust suppression measures during the Removal Action.
In addition, owners will be asked for permission to remediate their properties. If a property owners refuses to grant permission, that property will not be remediated. Detailed plans will be developed with the owners for each property, and owners will be provided copies. The removal schedule will also be provided to the owner. After the removal has been completed, each owner will review the action with the On-Scene Coordinator OSC and discuss any future activities.
9/23/2016
B2-68
Ormet Corporation NPL Site Summary EPA ID: OHD004379970 Number of Operable Units: 1 Location: Hannibal, OH Date of NPL Listing: 1987 EPA Region: 5 Last Operational Year: Presently in operation Status: NPL - Final Documents Used: RI/FS & ROD (Various by OU)
Introduction: The Ormet Corporation operates an active, primary aluminum smelter on approximately
245-acre tract of land on the Ohio River in Hannibal, Monroe County, Ohio. Since the facility began operations in 1958, its main process has been the reduction of alumina to produce aluminum metal. The site includes the remainder of a 10-acre former spent potliner storage area (FSPSA), five unlined former disposal ponds (FDPs) (totaling approximately18 acres), a construction material scrap dump (CMSD), and a carbon runoff and deposition area (CRDA). From 1958 to 1968, approximately 85,000 tons of spent potliner were placed in the unlined FSPSA. From 1968 to 1981, Ormet removed much of the potliner waste from the FSPSA and transported it to an onsite recovery plant that removed cryolite from the potliner. Approximately 370,000 cubic yards of waste slurry from the cryolite recovery plant was routed to the largest FDP, although the other FDPs may have received minor amounts of cryolite plant waste. The tailings are alkaline and consist primarily of carbonaceous material from the potliner, along with sodium and calcium-based salt. The four smaller FDPs received approximately 50,000 cubic yards of process waste from the air emissions wet-scrubbing system in the form of sludge. From about 1966 until mid-1979, Ormet deposited waste (e.g., construction materials and other miscellaneous plant debris, including capacitors and spent potliners) in the CMSD. In 1972, following the identification of high groundwater levels of fluoride coming from one of the FDPs, two extraction wells were installed to intercept the contaminated groundwater plume before it reaches the process water well on the reduction plant property; these wells have operated continuously through the present day. This contaminated ground water is sent to an onsite treatment plant. Since 1980, spent potliner material generated by the plant has been transported off site for disposal. The CRDA contains carbon deposits, probably carried there by stormwater runoff from an area of the Ormet plant where spent graphite anodes were crushed in a mill. The site has one operable unit (OU), which is addressed by the human health and ecological risks.
Summary of Site-related Contamination: Site-related contamination is the result of smelting operations and aluminum production;
specifically, a potliner storage area, unlined disposal pond impoundments, a scrap dump, and a carbon run-off and deposition area. Site operations have contaminated various media (soil, sediment, surface water, and ground water) with numerous contaminants. Ground water is contaminated with inorganic chemicals (arsenic, beryllium, fluoride, vanadium, and manganese) and also cyanide compounds and tetrachloroethene (PCE). Soils and sediments in a backwater area were contaminated with inorganic fluoride, cyanide, polyaromatic hydrocarbons (PAHs), and polychlorinated biphenyls (PCBs). In addition to defining the contamination found in the disposal areas, seeps were discovered during the Remedial Investigation near the Plant Recreational Area ball fields and along the western edge of the CMSD. The seeps contained cyanide ranging in concentrations from 79 to 950 parts per billion (ppb).
9/23/2016
B2-69
Conclusion of Site-related Risk: The primary threats contributing to human health risk, and the contaminants ultimately
driving the site’s remedial action, are inorganic chemicals (arsenic, beryllium, fluoride, manganese, and vanadium), PAHs (tetrachloroethene), and PCBs. The media of concern for human exposure to contaminants are soil, surface water, ground water, sediment, air, and contaminated fish. The receptors with potentially unacceptable risk from these media are current residential adults and trespassers, future residential children and adults, and occupational receptors. The primary routes of exposure to these media are ingestion (accidental or intentional), dermal contact, and inhalation.
In OU1, the primary contributors to human health risk are (1) carcinogenic contaminants (current cancer risk of 1E-01, 2E-04, and 2E-05 for residential adult ingestion of fish, trespasser ingestion of sediment [PCBs and PAHs], and trespasser dermal contact of sediment, respectively; future cancer risk for residential receptors ranging from 7E-06 to 7E-03 [arsenic, beryllium, vanadium, PAHs, and PCBs] for the inhalation of air and ingestion of soil, respectively; future occupational cancer risks of 1E-03 [arsenic, beryllium, fluoride, manganese, vanadium, cyanide, and PCE] for ingestion of ground water); and (2) non-carcinogenic contaminants (future non-cancer HQs of 600 [arsenic, beryllium, fluoride, manganese, vanadium, cyanide, and PCE], 100, and 30 [arsenic, beryllium, fluoride, manganese, vanadium, cyanide, and PCE] for residential child, residential adult, and occupational receptors ingestion of ground water, respectively).
In OU1, ecological risks have been identified from exposure to inorganic chemicals (antimony and lead) and organic chemicals, such as cyanide and semi-volatiles (PAHs and PCBs). The pathways of concern to ecological receptors are surface water and sediment. The ecological receptors with potentially unacceptable risk from these media are current aquatic organisms. Although not quantified, the potential ecological risks were reported as sub-lethal and adverse or other toxic effects. Additionally, two state endangered species are found in the general vicinity of the site: the Ohio Lamprey and Channel Darter.
Human Health Risk Driver(s): Operable Unit 1: Food-Fish, Cancer
– Current Adult Resident, Ingestion • Carcinogenic Contaminants
Air, Cancer – Future Resident, Inhalation • Carcinogenic Contaminants
Ground Water, Cancer – Future Resident and Worker, Ingestion • Arsenic, Beryllium, Fluoride, Manganese,
Vanadium, Cyanide, Tetrachloroethene Ground Water, Non-cancer
– Future Adult and Child Resident and Worker, Ingestion • Arsenic, Beryllium, Fluoride, Manganese,
Vanadium, Cyanide, Tetrachloroethene
Sediment, Cancer
– Current Trespasser, Ingestion • PAHs and PCBs
Soil, Cancer – Future Resident and Trespasser, Ingestion • Arsenic, Beryllium, Vanadium, PAHs,
and PCBs Surface Water, Cancer
– Future Resident, Ingestion and Dermal Contact • Carcinogenic Contaminants
Ecological Risk Driver(s): Operable Unit 1: Surface Water and Sediment
– Current Aquatic Organisms • Antimony, Lead, Cyanide, PCBs, and
PAHs
9/23/2016
B2-70
Final Remedy: The selected remedy addresses ground water, leachate, soil, and sediment and reduces
risks associated with exposure to contaminated media. Additionally, the remedy mitigates contaminant migration to surface water from ground water and source materials. The overall remedial actions taken include
(1) pumping of ground water, the use of interceptor wells to maintain the capture zone of contaminated ground water, and subsequent treatment, with discharge into the Ohio River;
(2) use of trench drains to intercept and extract seeping leachate, with subsequent treatment to National Pollution Discharge Elimination System discharge limits;
(3) soil excavation, recontouring, and covering, with a dual-barrier cap;
(4) soil treatment by in-situ flushing;
(5) sediment dredging, with solidification and capping for sediments with PCB concentrations below 50 ppm and offsite disposal in an EPA-approved disposal facility for those sediments that exceed 50 ppm PCBs; and
(6) use of institutional controls to limit ground water and land use.
9/23/2016
B2-71
Palmerton Zinc Pile NPL Site Summary EPA ID: PAD002395887 Number of Operable Units: 4 Location: Palmerton, PA Date of NPL Listing: 1983 EPA Region: 3 Last Operational Year: 1980 Status: NPL – Final Documents Used: RI/FS & ROD (Various by OU)
Introduction: The Palmerton Zinc Pile Site is a former primary zinc smelting operation located in
Carbon County, Pennsylvania, near the Lehigh Gap and ~15 miles north of Allentown, Pennsylvania. The site and resulting contamination originates from Palmerton smelting operations. Over 70 years, the New Jersey Zinc Company deposited 33 million tons of slag at the site, creating a cinder bank—a smoldering residue pile—that is approximately 2.5 miles long, 100 feet high, 500 to and 1,000 feet wide, and that covers approximately 200 acres. Smelting operations emitted large amounts of lead, cadmium, zinc, and arsenic as dust and particulate fallout from stack emissions. Primary zinc smelting was discontinued in December 1980. The West Plant is currently not active. The East Plant houses a current electric arc furnace dust processing operation. The site was added to the NPL in 1983 because of environmental risks posed by the cinder bank. Emissions from the former smelting operations have led to elevated levels of inorganic chemicals throughout the Palmerton area. As a result, approximately 2,000 acres on nearby Blue Mountain have been defoliated, leaving a barren mountainside. Soil on the defoliated area of the mountain has contaminated the runoff flowing across it, and erosion has carried contaminants into Aquashicola Creek and the Lehigh River. The site is divided into four Operable Units (OUs):
OU1– addresses re-vegetation of approximately 2,000 acres of non-residential land;
OU2– consists of remediation of the cinder bank;
OU3– consists of remediation of residential soils and interior house dust exhibiting elevated levels of lead; and
OU4– concerns an area-wide investigation of contamination in the ground and surface waters and includes an Ecological Risk Assessment.
Summary of Site-related Contamination: Site-related contamination is the result of smelting operations, specifically slag piles and
dust/particulates emitted from smelting stacks. Site operations have contaminated various media (surface soil, sediment, ground water, surface water, fish tissue, plant tissue, residential dust, and debris) with inorganic chemicals. OU1 (Blue Mountain) and OU2 (Cinder Bank Contamination) is primarily due to cadmium, lead, and zinc; OU3 (Community Soil Contamination) is primarily due to arsenic, cadmium, lead, and zinc and has elevated exposure risks for residential receptors; and OU4 (Ground Water, Surface Water, and Fish Tissue Contamination) is due to inorganic chemicals (arsenic, cadmium, chromium, copper, lead, manganese, nickel, and zinc) and has elevated exposure risks for residential (adult and child) and occupational receptors, as well as avian and mammalian ecological receptors.
9/23/2016
B2-72
Conclusion of Site-related Risk: The primary threats contributing to human health and ecological risks, and the
contaminants ultimately driving the site’s remedial action, are inorganic chemicals (arsenic, cadmium, lead, manganese, nickel, and zinc). The two major media of concern for human exposure to inorganic contaminants are soil/dust and ground water. The receptors with potentially unacceptable risk from these media are occupational workers and residential child and adult. The primary routes of exposure to these media are ingestion (accidental or intentional) and dermal contact. In past years, children in Palmerton have been found to have elevated levels of lead in their blood from exposure to contaminated community soils.
OU1 and OU2 narratively state that human health risks do exist from exposure to inorganic contaminants; however, no quantitative risks were provided. In OU3, the primary contributor to human health risks are (1) arsenic (current and future risk of 3E-04 to residential receptor from ingestion of contaminated soil/dust); and (2) lead (current probability of 5.9% that residential children exceed the blood lead level of 10 µg/dL from ingestion of soil/dust). In OU4, the primary contributors to human health risk are (1) manganese (future non-cancer risk – hazard quotient (HQ) of 204, 80.1, and 57.2 for residential children, residential adult, and occupational receptor’s ingestion of contaminated ground water, respectively), (2) nickel (future non-cancer risk – HQ of 19.7 and 7.74 for residential children and residential adult’s ingestion of contaminated ground water, respectively), and (3) zinc (future non-cancer risk – HQ of 154, 60.5, and 43.2 for residential children, residential adult, and occupational receptor’s ingestion of contaminated ground water, respectively).
Site-wide ecological risks have been identified for a number of avian and mammalian species from exposure to inorganic chemicals (arsenic, cadmium, chromium, copper, lead, and zinc). The receptor-specific scenarios of exposure were individually evaluated; however, the major pathways were not individually evaluated for each receptor. The pathways analyzed include ingestion of food items and surface water, as well as ingestion, dermal contact, and inhalation of soil and sediment. The greatest site-related risk is posed to two avian receptors (Woodcock and American Robin) from lead exposure. The primary contributors to site-wide ecological risk are (1) arsenic (current HQ of 16.9 for the Meadow Vole); (2) cadmium (current HQ of 77, 56, and 13.5 for the American Robin, Woodcock, and Meadow Vole, respectively); and (3) lead (current HQ of 1585.22, 1156.54, 85.36, and 35.1 for the American Robin, Woodcock, Barn Owl, and Northern Harrier, respectively); and (4) zinc (current HQ of 54.3, 39.6, 15.35, and 12.54 for the American Robin, Woodcock, King Fisher, and Barn Owl, respectively).
9/23/2016
B2-73
Human Health Risk Driver(s): Operable Unit 3: Soil, Cancer
– Current & Future Resident, Ingestion • Arsenic
Soil/Dust, Non-cancer – Current & Future Resident, Ingestion and
Dermal Contact • Arsenic
– Current Child Resident, Ingestion (Blood Lead Levels) • Lead
Operable Unit 4: Ground Water, Non-cancer
– Current Child Resident, Ingestion • Cadmium
– Future Adult and Child Resident, Ingestion • Manganese, Nickel, Zinc
Operable Unit 4 (cont’d):
– Future Worker, Ingestion • Manganese, Nickel, Zinc
– Future Worker, Dermal Contact • Manganese
Ecological Risk Driver(s): Operable Unit 00 (site-wide):
– Current Avian, Combined Pathways/ Multiple Routes • Cadmium, Lead, Zinc
– Current Mammalian, Combined Pathways/ Multiple Routes • Arsenic, Cadmium
Final Remedy: The selected remedial actions address soil, ground water, surface water, and indoor air
include:
OU1 (Denuded Land on Blue Mountain) – (1) Soil amendments and re-vegetation with deed restrictions, including the mixing of
sewage sludge with a lime and fly ash mixture; and
(2) grass cover has been established on approximately 1,000 acres of Blue Mountain, with approximately 1,000 acres remaining to be re-vegetated.
OU2 (Cinder Bank) – Installation of a cap and cover (about 200 acres to be capped), using soil amendments of sewage sludge with a lime and fly ash mixture, plus collection and treatment of all run-on and run-off water.
OU3 (Residential Soils and Dust) – Pre-amendment of soil with in-situ treatment, soil compaction, soil removal, and/or re-vegetation as a contingent remedy, specialized interior cleaning, including HEPA vacuuming, wet wiping of hard surfaces, and clearance sampling for floors. Finally,
OU4 (Area Wide Ground and Surface Water Contamination) is currently being studied for remedy selection.
9/23/2016
B2-74
Reynolds Metal Company NPL Site Summary EPA ID: ORD009412677 Number of Operable Units: 2 Location: Troutdale, OR Date of NPL Listing: 1994 EPA Region: 10 Last Operational Year: 2000 Status: NPL – Final Documents Used: RI/FS & RODs (Varies by OU)
Introduction: The Reynolds Metals Company (RMC) site is a former primary aluminum reduction
plant. The facility is located approximately 20 miles east of Portland, Oregon. The property borders the Columbia River to the north, the Sandy River to the east, and Salmon Creek to the west. Approximately 108 acres of the 800-acre site were occupied by the former plant area. A U.S. Army Corps of Engineers dike surrounds the plant on the northern and eastern sides and protects the plant from floods. The plant was constructed for the U.S. Government in 1941 to produce aluminum for wartime operations. RMC operated the plant until 2000, when the aluminum-reduction operations were permanently discontinued. Large quantities of wastes were produced at the Reynolds plant during the production of aluminum from electrical equipment. The Columbia and Sandy rivers are used for recreation and fishing, and people reach the rivers by traversing the Reynolds property. The site was divided into two Operable Units (OUs): OU1 addresses source area contamination, and OU2 addresses contaminated ground water. OUs 1 and 2 were remediated together, as documented in the interim remedial action ROD and final action ROD. The risks associated with the site were calculated in a site-wide RI/FS.
Summary of Site-related Contamination: Site-related contamination is the result of aluminum reduction and processing;
specifically, settling ponds, spent potliners, diesel spill areas, dewatering sumps, process residues, and a scrap yard. Site operations have contaminated various media (ground water, surface and subsurface soils, surface water, sediment, and plant tissues). The RMC OUs are contaminated with inorganic chemicals (aluminum, chromium, vanadium, zinc), halides (cyanide, fluoride), and organic polyaromatic hydrocarbons (PAHs) and polychlorinated biphenyls (PCBs).
Conclusion of Site-related Risks: The primary threats contributing to human health risk, and the contaminants ultimately
driving the site’s remedial action, are arsenic, fluoride, PAHs (principally benzo[a]pyrene, dibenz[a,h]anthracene, and benzo[b]fluoranthene), PCBs, and tetrachloroethene. The major media of concern for human exposure to contaminants are surface and subsurface soil, sediment, dredge spoils, and ground water. Potentially unacceptable risks from these media are for future occupational, trespasser, and residential adult receptors. The primary routes of exposure to these media are ingestion (accidental or intentional), inhalation, and dermal contact.
Site-wide, the primary contributors to human health risk are (1) PAHs (current and future risk of 1.01E-04 [benzo(a)pyrene] and 1.95E-05 [dibenzo(a,h)anthracene] for occupational ingestion of soil; 4.88E-05 [benzo(a)pyrene] and 8.91E-05 [benzo(a)pyrene] for trespasser ingestion of soil and sediment, respectively; 5.91E-06 [benzo(a)pyrene] to residential receptors from ingestion of soil); (2) arsenic (current and future risk of 1.39E-05, 9.16E-06, 3.53E-06 for
9/23/2016
B2-75
residential ingestion of soil, residential ingestion of dredge spoils, and occupational ingestion of soil, respectively); (3) combined PCB exposure (current and future risk of 2.17E-06 and 1.35E-06 for occupational ingestion of soil and residential ingestion of dredge spoils, respectively); (4) tetrachloroethene (future risk of 4.47E-06 for occupational inhalation of ground water); and (5) fluoride (future residential receptors, non-cancer HI of 3.3 from ingestion of fluoride in ground water).
The pathways of concern to ecological receptors are unspecified, but occur in the upland area and the open water/wetland area habitats. These habitats contain avian and mammalian ecological receptors with current elevated risks from all exposure routes. Avian and mammalian receptors, including the bald eagle and American peregrine falcon, have potential health risks from exposure to inorganic chemicals and halides and organic PAHs and PCBs. Site-wide ecological risks have been identified for a number of avian and mammalian species (coyote and mink) from exposure to site-contaminated media in the upland areas and open water/wetland areas habitats, primarily from inorganic chemicals (aluminum, chromium, fluoride, vanadium, zinc), PCBs, and PAHs. Only the American robin was found to have ecological risks greater than 1E+01 (HQ of 13.0 for aluminum from all pathways in upland areas via all exposure routes).
Human Health Risk Driver(s): Operable Unit 00 (site-wide): Soil, Cancer
– Current & Future Resident, Trespasser, and Worker, Ingestion • Arsenic, Benzo(a)pyrene, and
Dibenzo(a,h)anthracene Sediment, Cancer
– Current & Future Trespasser, Ingestion • Risk Driver(s) = Benzo(a)pyrene
Dredge Spoils, Cancer – Current & Future Resident and Worker,
Ingestion • Arsenic and Combined PCBs
Ground Water, Cancer – Future Worker, Inhalation
• Tetrachloroethene Ground Water, Non-cancer
– Future Resident, Ingestion • Fluoride
Ecological Risk Driver(s): Operable Unit 00 (site-wide): Upland Areas
– Current Avian, Unspecified Pathway/All Routes • Aluminum, Chromium, Zinc
– Current Mammalian (Coyote), Unspecified Pathway/All Routes • Aluminum
Open Water/Wetland Areas – Current Avian, Unspecified Pathway/All
Routes • Total PCBs, Fluoride
– Current Mammalian (Mink), Unspecified Pathway/All Routes • Total PBCs, Aluminum, Vanadium,
Total PAHs
Interim Remedy: Between 1995 and 2002, early actions resulting in excavation and off-site disposal of
170,401 tons of contaminated soil and waste material and the installation of rock and soil caps, including 283 tons of contaminated soil from sumps; 515 tons of PCB-contaminated dust, siding, soil, and concrete; 13,900 tons of cryolite; 2,650 tons of soil; 11,542 tons of spent potliner and soil; 1,193 tons of contaminated material; 150 tons of debris; 22,918 tons of waste and soil; 90 tons of PCB-contaminated process residue and soil; and 8,775 tons of process residue, soil, and
9/23/2016
B2-76
sediment. Groundwater remedial actions selected in the interim ROD and completed at the site include
(1) the previously described soil source removals;
(2) decommissioning of several production wells and sumps; and
(3) installation of a focused extraction and production well optimization (FE/PWO) system with groundwater monitoring.
Final Remedy: Following completion of the interim remedial action, no further soil remedial activity was
required. Demolition of the RMC plant occurred between 2003 and 2005, during which soil and debris contaminated with asbestos, PCBs, PAHs, and spent potliner was removed to permitted offsite disposal facilities. The selected final remedial actions address ground water with the following actions:
(1) institutional controls to protect future users of the site and ensure that future site uses and the associated ground water are compatible with the cleanup levels achieved;
(2) continued operation of the FE/PWO system until groundwater cleanup levels are achieved;
(3) maintenance and monitoring of capped areas to protect the integrity of the remedy, as well as human health and the environment; and
(4) groundwater monitoring to evaluate the effectiveness of the completed and ongoing cleanup actions.
9/23/2016
B2-77
Silver Mountain Mine NPL Site Summary EPA ID: WAD980722789 Number of Operable Units: 1 Location: Horse Springs Coulee, WA Date of NPL Listing: 1986 EPA Region: 10 Last Operational Year: 1982 Status: NPL - Deleted Documents Used: ROD
Introduction: The Silver Mountain Mine site is located on 5-acres in Okanogan County, Washington.
Silver Mountain Mine was originally opened as the Silver Star in 1902 by the Silver Star Mining Corporation, Tonasket, Washington. Silver, gold, and copper were all extracted from the mine. The main features of interest at the site include a heap of mined material (“leach heap”) and a trench remaining from an abandoned cyanide heap leaching operation (“leachate pond”). Directly west of the leach heap is a larger pile of unprocessed mined material (the “mine dump”). In 1980 and 1981, the mine used cyanide in its processing operations. Approximately 1,100 gallons of cyanide were poured over silver tailings, which had been placed on top of a plastic liner, in an effort to extract gold. The water running off the pile was collected in a plastic lined basin. The site contains more than 2,500 tons of contaminated tailings and 20,000 gallons of contaminated liquid. According to the state, at one time the site contained liquid cyanide at 1,100 parts per million (ppm). The leach heap operation was abandoned in late 1981 without cleanup of contaminated material. The site was kept as one Operable Unit (OU 00) that addresses site-wide contamination.
Summary of Site-related Contamination: Site-related contamination is the result of mining operations; specifically, leaching
operations and leaching ponds. Site operations have contaminated various media (surface soil, ground water, and surface water) with numerous inorganic chemicals, primarily aluminum, antimony, arsenic, copper, and lead. These contaminants originate from the leach heap operations that took place at the mining site.
Conclusion of Site-related Risk: The primary threat contributing to human health and ecological risks, and the
contaminant driving the site’s remedial action, is arsenic. Other inorganic chemicals that may pose an elevated health risk include aluminum, antimony, arsenic, copper, and lead. The media of concern for human exposure to inorganic contaminants are surface soil and ground water. Potentially unacceptable risks from exposure to these media are for future site visitors, industrial, and residential receptors. The primary routes of exposure to these media are ingestion (accidental or intentional) and dermal contact.
Site-wide, the primary contributors to future industrial receptors: arsenic (cancer risk of 2.3E-03 from the ingestion and dermal contact of soil and the ingestion of ground water; additionally, risks of 1.9E-03, 1.6E-03, and 2.3E-04 from dermal contact with soil, ingestion of ground water, and ingestion of soil).
Quantified ecological risk information was not available. However, qualitative descriptions of the possible ecological risk were provided. Ecological receptors are primarily
9/23/2016
B2-78
exposed to arsenic, aluminum, copper, and lead from soil and surface water. Receptors at greatest risk include vegetation and ruminant wildlife. The greatest documented risk to wildlife and plants is from the arsenic concentrations in the soils surrounding the leach heap. Surface water may continue to be a source of elevated arsenic impacting wildlife. There does not appear to be current risk to wildlife and plants from ground water, and future risk is not anticipated. The seep area may continue to be a source of elevated risk due to aluminum, copper, and lead.
Human Health Risk Driver(s): Operable Unit 00 (site-wide): For Industrial Receptors (Residential and site visitor receptors qualitatively stated to also be at risk): Soil, Cancer
– Future Ingestion & Dermal Contact • Arsenic
Ground Water, Cancer – Future Ingestion and Dermal Contact
• Arsenic
Ecological Risk Driver(s): Operable Unit 00 (site-wide): Soil and Surface Water – Current Exposure for Vegetation and Wildlife – Possible Risk
Interim Remedy: The Washington Department of Ecology stabilized the site in June 1985. This activity
included
(1) draining the leachate and removing it for off-site treatment;
(2) covering the site with a 3/4-inch cotton liner and a plastic liner;
(3) securing the liners with tires;
(4) removing drums that previously contained hazardous materials;
(5) removing a wooden structure that appeared insecure; and
(6) fencing the site with barbed wire. The life of the liner is estimated at 20 years.
Final Remedy: The selected remedy addresses ground water, soil, and contaminated mine dump
materials and reduces risks to onsite workers and site visitors from the surface soil and waste materials. Additionally, the remedy mitigates contaminant migration to ground water and surface water from source materials. The overall remedial actions taken include
(1) consolidating and grading approximately 5,740 cubic yards of contaminated materials;
(2) covering the materials with a soil/clay cap;
(3) fencing the site and sealing the entrance to the mine;
(4) disconnecting the mine drainage pipe from the existing stock tank and installing a new well in the Horse Springs Coulee aquifer to provide an alternate water supply for the cattle;
(5) placing a deed restriction to protect the cap; and
9/23/2016
B2-79
(6) monitoring the ground water to assure that it does not become contaminated. If groundwater analyses indicate contamination at a concentration in excess of the U.S. Environmental Protection Agency health-based levels, a contingent groundwater treatment program will be implemented.
During construction, conditions prevented the establishment of an alternative stock water supply. Additional risk assessment was conducted, and this element of the remedy was removed. Approximately 5,740 cubic yards of contaminated waste materials were excavated and removed for disposal. Construction has been completed, and the Silver Mountain Site was deleted from the NPL in 1997.
9/23/2016
B2-80
Silverton Mercury Condenser Removal Site Summary EPA ID: WAN001002702 Number of Operable Units: 1 Location: Silverton, WA Date in CERCLIS: 2007 EPA Region: 10 Last Operational Year: 1942 Status: Removal, Time Critical Documents Used: Action Memorandum
Introduction: The Silverton Mercury Condenser site is located 0.25 miles southwest of Silverton,
Washington. Mercury condensers were used on site to extract mercury from ore mined nearby. Currently, two of the original four mercury condensers are still standing, and two of them have been demolished, either intentionally or by age and weather, leaving only the foundation. The site is located on the north bank of Silver Gulch, a historically small, dry stream bed that in the winter of 2006 was widened by flooding. During the flood event, some amount of the north bank soils were eroded down the gulch. This erosion removed soil directly underneath two of the condensers, causing them to partially hang over the edge of the north bank. This site is located in the Mount Baker Snoqualmie National Forest, and there is low-density residential property in the surrounding area. Extraction of mercury in condensers occurs when the ore is placed in a furnace and heated to high temperatures. Potential sources of contamination at the site include the mercury condensers and onsite soils. The potential contaminants of concern at the site associated with these sources are Target Analyte List (TAL) metals. The mine’s last years of operation were between 1939 and 1942 when, by federal law, mines that were not producing large amounts of war-essential minerals were closed. Minerals mined or found in the mine include copper, silver, lead, gold, and mercury.
Summary of Site-related Contamination: Condenser operations have led to site-wide contamination via condenser waste and brick
material. Onsite surface soil was contaminated with elevated levels of inorganic chemicals, including arsenic, cadmium, lead, and mercury. Sediments in the Silver Gulch and South Fork Stillaguamish River contain levels of mercury above background concentrations.
Conclusion of Site-related Risk: The primary current threats to human health and the environment, and the contaminants
driving the removal action, are inorganic chemicals (primarily arsenic, cadmium, lead, and mercury). Elevated health risk is possible for human receptors exposed to arsenic, cadmium, lead, and mercury from ingestion of onsite soils. It is also possible that receptors exposed to elevated levels of mercury in downstream sediments may have potential elevated health risks. Migration of contaminants from onsite soils into surface water and ground water may be a problem in the future to residential receptors ingesting these media. Ecological threats may exist from exposure to contaminated surface water, primarily in the gully south of the Stillaguamish River due to elevated inorganic chemicals migrating from the site and elevated mercury in sediments. Specific risk information was not provided in available documentation.
Final Remedy: The selected remedy addresses soil and condenser structures as well as the migration of
contaminants to water. To reduce the risk to residents, the selected remedy includes

9/23/2016
B2-81
(1) the excavation and removal of remaining condenser structures,
(2) soil excavation and removal, and
(3) backfilling and topping of excavated areas. The quantity of media removed was not indicated.
9/23/2016
B2-82
Stauffer Chemical Co. (Tarpon Springs) NPL Site Summary EPA ID: FLD010596013 Number of Operable Units: 2 Location: Tarpon Springs, FL Date of NPL Listing: 1994 EPA Region: 4 Last Operational Year: 1981 Status: NPL - Final Documents Used: RI/FS & ROD
Introduction: The Stauffer Chemical Company Tarpon Springs site is situated on 130 acres along the
Anclote River in Tarpon Springs, Pinellas County, Florida. The facility was used to produce elemental phosphorous using phosphate ore mined from deposits in Florida. The plant began production in 1947 and continued to manufacture elemental phosphorous until the plant’s closure in 1981. While operating, the plant utilized a system of 17 waste ponds onsite; these unlined ponds no longer contain waste or water. During site operations, radioactive waste material, suspected to have originated from the phosphate ore (radium) processing plant, was disposed onsite. Land use in the surrounding area includes light industrial, commercial, and residential functions. The most significant surface water bodies near the Tarpon Springs site are the Anciote River, located along the site's southern and western boundaries, and the Gulf of Mexico, located approximately 2 miles from the site. Two primary aquifers underlie Pinellas County and the site: the surficial aquifer and the Floridan aquifer. The surficial aquifer ground water is relatively shallow, which limits its usefulness as a drinking water supply; however, the aquifer provides water for irrigation purposes. The Floridan aquifer, consisting of a thick sequence of carbonate (limestone) rocks that are hydraulically connected, provides most of the public water supply for Pinellas County. There are no active residential or commercial wells either onsite or between the site and the Anclote River; therefore, no ground water users exist onsite or down-gradient of the site. The decision to decommission and dismantle the plant permanently was made in 1983. The site is divided into two operable units (OUs): OU1 addresses contaminated soil and ground water affected by source material, and OU2 addresses contaminated ground water in the surficial aquifer. A remedial investigation of OU2 had not yet begun as of March 22, 2011.
Summary of Site-related Contamination: Site-related contamination is the result of mineral processing operations; specifically,
unlined waste ponds and radioactive waste material from phosphate ore processing. Site operations resulted in the contamination of soils, sediment, ground water, surface water, and plant and fish tissues. OU1 is primarily contaminated with inorganic chemicals (arsenic, beryllium, cadmium, and fluoride), polyaromatic hydrocarbons (PAHs), and radionuclides (lead-210, radium-226, radon-222, and radium-228).
Conclusion of Site-related Risk: The primary threats contributing to human health risk, and the contaminants ultimately
driving the site’s remedial action, are inorganic chemicals (arsenic, beryllium, cadmium, and fluoride) and radionuclides (lead-210, radium-226, radon-222, and radium-228). The two main media of concern for human exposure to inorganic contaminants are ground water and surface soil, while the media of concern for human exposure to radionuclides are surface soil, plant tissue, and road-bed material. The receptors with potentially unacceptable risk from exposures to these media are residential child and adult (future) and occupational worker (current and future).
9/23/2016
B2-83
The primary routes of exposure to these media are ingestion (accidental or intentional), inhalation, and external radiation.
In OU1 (contaminated soil and ground water), the primary contributors to human health risk are (1) combined radionuclide contaminants (current risks range from 4.5E-03 for occupational external radiation to 1.8E-06 for occupational ingestion of surface soil, while current residential risks are highest for adults inhaling radon-222 in outdoor air; future risks range from 2.2E-02 and 5.7E-03 to 2.5E-06 and 1.6E-04 for adult and child residential receptors, respectively, from ingestion of plant tissue; and future risks range from 1.2E-02 (non-cancer HQ of 200) and 4.5E-03 (non-cancer HQ of 90) to adult residential and both adult occupational receptor and residential child, respectively, from external radiation from surface soil)l (2) arsenic (future risks range from 2.0E-02 and 1.0E-2 for adult residential and child residential receptors, respectively, from ingestion of ground water to 1E-04 and 3E-04 for the ingestion of surface soil); and (3) beryllium (future cancer risk of 6.0E-03 for a child receptor from ingestion of surface soil). OU2, a remedial investigation of contaminated ground water in the surficial aquifer, has not been performed; therefore, health risks are unavailable.
Current and future ecological receptors with elevated risk are in the wetlands and in the deepwater habitats contaminated with inorganic chemicals and PAHs, although no individual species are named as receptors. OU1 ecological risks have been qualitatively captured for wetland and deep-water habitats as ranging from low to moderate risk. The pathways analyzed include current and future exposure via sediment and surface water, primarily contaminated from inorganic chemicals and PAHs. The ecological risk assessment identified 34 threatened species that inhabit the area in and around Stauffer Chemical Co., including avian, mammalian, and reptilian species. The ecological analysis was conducted on a site-wide, rather than OU-specific, basis.
Human Health Risk Driver(s): Operable Unit 00 (site-wide): Food-Plant Tissue, Cancer
– Future Adult & Child Resident, Ingestion • Lead-210, Radium-226, Radium-228
Ground Water, Cancer – Future Adult & Child Resident, Ingestion • Arsenic
Surface Soil, Cancer – Future Adult & Child Resident, Ingestion • Radium-226, Beryllium
Surface Soil/Roadbed Material, Cancer – Future Adult & Child Resident, and Worker,
External Radiation • Radium-226
Air (Indoor and Outdoor)
– Future Adult & Child Resident, and Worker, Inhalation • Radon-222
Ground Water, Non-cancer – Future Adult & Child Resident, Ingestion • Arsenic, Fluoride
Ecological Risk Driver(s): Operable Unit 00 (site-wide): Low to moderate qualitative risk for wetland and deep-water habitat
Final Remedy: The following lists outline the selected remedial actions address soil, waste material, and
ground water.
9/23/2016
B2-84
OU1 – (1) excavation of radiological and chemical contaminated material/soil exceeding Residential
Cleanup Standards;
(2) consolidation of the radiological and contaminated media (soil) in the main pond area and capping of the consolidation area;
(3) implementation of institutional controls, including deed restrictions, land-use ordinances, physical barriers, and water supply well permitting prohibitions to limit access to the site and prohibit the disturbance of the remedy; and
(4) in-situ solidification/stabilization of pond material and contaminated soil below the water table in the consolidation areas onsite.
OU2, the remedial investigation study, has not yet begun.
9/23/2016
B2-85
Summitville Mine NPL Site Summary EPA ID: COD983778432 Number of Operable Units: 5 Location: Rio Grande County, CO Date of NPL Listing: 1994 EPA Region: 8 Last Operational Year: 1992 Status: NPL - Final Documents Used: RI/FS & ROD (Various by OU)
Introduction: The Summitville Mine Site is a former open-pit mining operation located in the San Juan
Mountains near Del Norte in Rio Grande County, Colorado. Gold and silver mining began around 1870 at the site. The most recent operator, Summitville Consolidated Mining Corp., Inc. (SCMCI), began open-pit mining and gold recovery through heap leaching in 1986. SCMCI originally designed the mining operation as a non-discharging wastewater facility. Problems with discharges eventually required SCMCI to obtain a NPDES permit from the state to operate a wastewater treatment plant. Several releases of water contaminated with cyanide and metals have been documented at the mine. The state has issued Notices of Violation to SCMCI for unpermitted releases of contaminated water. Fish kills have been reported from Wightman Fork, approximately 20 miles downstream from the mine site. The site was added to the NPL in 1994 due to the threat to human health and the environment posed by contamination of soil, surface water, and ground water resulting from the mining and heap leaching operations. Due to the highly mineralized character of the site, almost all exposed earthen materials are capable of acid generation. The site is divided into five Operable Units (OUs):
OU1– addresses acid mine drainage (AMD) and cyanide contaminated waters from the Heap Leach Pad (HLP);
OU2– addresses acid mine drainage from the Cropsy Waste Pile (CWP), Summitville Dam Impoundment (SDI), Beaver Mud Dump (BMD), and Mine Pits;
OU3– (South Mountain Groundwater) was incorporated into the site-wide RI/FS in the late 1990s and moved into OU5;
OU4– (Mine Site Reclamation/Re-vegetation) includes grading and re-vegetation, rehabilitation of existing ditch systems, and construction of new ditches; and
OU5– (Final Site-wide Remedy) is a final action that will address the threats to the environment that remain at the site after completion of emergency and interim remedial actions.
Summary of Site-related Contamination: Site-related contamination is the result of mining operations; specifically, heap leaching
operations. Site operations have contaminated various media (surface soil, ground water, and surface water) with numerous contaminants; specifically, inorganic chemicals (aluminum, arsenic, cadmium, hexavalent chromium, copper, cyanide, iron, lead, mercury, manganese, silver, and zinc). All of these contaminants, except cyanide, occur naturally at the site, but are made soluble in the AMD generating chemical process, which is accelerated by the mining activities. AMD water contributes metal loads to Wightman Fork and the Alamosa River. This creates adverse conditions that prevent the growth and maintenance of a healthy aquatic
9/23/2016
B2-86
ecosystem. These adverse effects have been noted in various studies of water quality of Wightman Fork and the Alamosa River.
Conclusion of Site-related Risk: Human exposure to these site-related contaminants is limited, since no one lives onsite or
within 2 miles of the site, and site ground water is not used for drinking. For those risks present offsite, the primary threats contributing to human health risks, and the contaminants ultimately driving the site’s remedial action, are arsenic and manganese. The major media of concern for human exposure to these inorganic contaminants are surface water and ground water. The receptors with potentially unacceptable risk from these media are residential and recreational receptors. The primary routes of exposure to these media are ingestion (accidental or intentional) and dermal contact.
Due to limited potential exposure, human health risks were only captured for OU5. The primary contributors to human health risk are (1) arsenic (cancer risk of 2.0E-06 to current residential and recreational receptors from ingestion or dermal contact with surface water, respectively); and (2) total inorganic contaminants (primarily manganese) (current hazard quotient [HQ] values of 8 and 3 from groundwater ingestion to current residential child and adult receptors, respectively).
The primary contributors to ecological risk include inorganic chemicals (primarily copper). The receptors identified to have significant risk include rainbow trout and benthic macroinvertebrates, both of which had an HQ >1 associated with direct contact and ingestion of surface water and sediment and ingestion of food items.
Human Health Risk Driver(s): Operable Unit 5: Ground Water, Non-cancer
– Current Resident, Ingestion • Manganese
Surface Water, Cancer – Current Resident & Recreational Adult,
Ingestion and Dermal Contact • Arsenic
Ecological Risk Driver(s): Operable Unit 5: Surface Water, Sediment, Food Items
– Current Rainbow Trout and Macroinvertebrates, Ingestion and Direct Contact • Copper
Interim Remedy: The selected interim remedial actions addressing soil, ground water, and surface water
include the following for each OU.
OU1 – (1) development and implementation of HLP solution collection system consisting of
injection/extraction wells installed in the HLP;
(2) pumping and treating of the contaminated leachate;
(3) short-term bio-treatment of waters, in-situ bio-treatment of ore and leachate using cyanide-destroying bacteria;
9/23/2016
B2-87
(4) grading, re-contouring, capping, and re-vegetating the HLP to reduce the volume of water to be treated;
(5) installation of a lined surge pond and a bioreactor using sulfate-reducing bacteria to treat acid waters generated after the HLP is remediated; and
(6) periodic monitoring of ground water for cyanide and/or metal concentrations.
OU2 – (1) excavation of the Cropsy Waste Pile to an elevation of 11,620 feet;
(2) excavation of the Beaver Mud Dump and Summitville Dam Impoundment;
(3) lining of the Bottom of the Mine Pits with a layer of pH neutralizing material; and
(4) placement and capping of excavated material in the Mine Pits, comprising approximately 4.5 million cubic yards.
OU3 – OU 3 was incorporated into OU5.
OU4 – (1) reclamation of approximately 504 acres of disturbed land;
(2) rough grading of all areas to be reclaimed to a 33 percent or less grade;
(3) use of on-site topsoil that was previously stockpiles and stored;
(4) addition of an optimum amount of amendments needed to produce a topsoil capable of promoting and sustain plant growth;
(5) reconfiguration of the areas for slope stabilization, erosion control, and moisture retention;
(6) seeding with a seed mixture designed to establish a natural, self-sustaining vegetative cover; and
(7) provision of adequate weather protection for the severe site conditions.
Final Remedy: The selected remedial actions addressing soil, ground water, and surface water include
the following for each OU.
OU5 (Final Site-wide Remedy) – (1) on-site contaminated water impoundment upstream of the Wightman Fork-Cropsy Creek
confluence;
(2) construction of a new gravity-fed water treatment plant downstream of the contaminated water impoundment;
(3) possible breach and removal of the existing Summitville Dam Impoundment;
(4) construction of a sludge disposal repository;
(5) upgrade of Wightman Fork Diversion;
9/23/2016
B2-88
(6) upgrade of select site ditches;
(7) construction of groundwater interceptor drains;
(8) construction of a Highwall ditch;
(9) rehabilitation of Reynolds Adit;
(10) management of mine pool water;
(11) continued site maintenance, and ground water/surface water and geotechnical monitoring on-site; and
(12) surface water, sediment, and aquatic life monitoring in Alamosa River and Terrace Reservoir.
OU00 (site-wide) – continued treatment of the Cropsy Waste Pile drainage and the French Drain waters in the Cropsy Water Treatment Plant.
9/23/2016
B2-89
Teledyne Wah Chang NPL Site Summary EPA ID: ORD050955848 Number of Operable Units: 4 Location: Millersburg, OR Date of NPL Listing: 1983 EPA Region: 10 Last Operational Year: Currently in operation Status: NPL - Final Documents Used: RI/FS & RODs (Various by OU)
Introduction: The Oremet-Wah Chang (OWC) (formerly Teledyne Wah Chang) plant is a producer of
zirconium and other rare earth metals and alloys. The site is located in Millersburg, Oregon, and includes two areas: (1) a 110-acre plant and a 115-acre area made up of four ponds containing sludges from the plant's wastewater treatment facility, and (2) a 60-acre field where sludge containing radium was used as a soil amendment. Production at the site began in 1957. Solids generated from the process wastewater treatment system have been stored in a number of surface impoundments. Until 1980, sludge was taken to seven unlined storage ponds onsite. Due to the complexity of site contamination, the U.S. Environmental Protection Agency (EPA) divided the site into four Operable Units (OUs): (1)
OU1– addresses a sludge ponds unit, which is being dealt with separately due to the property owners' and the public's wish for an expeditious cleanup of the sludge materials, which may be contributing to ground water contamination at the site;
OU2– addresses ground water and sediments;
OU3– addresses surface and subsurface soils; and
OU4– addresses soils amendment area (recently listed, pending further study).
Summary of Site-related Contamination: Process wastes from site operations have contaminated various media (surface soil,
subsurface soil, sediment, surface water, ground water, and sludge) with numerous contaminants (primarily inorganic chemicals, organic chemicals including chlorinated solvents, and radionuclides). Onsite sludge has been contaminated with radionuclides (radium, thorium, and uranium), volatile organic compounds (VOCs; e.g., methylene chloride, TCE, PCE, 1,1,1 trichloroethane, hexachlorobenzene), metals (chromium, thorium, arsenic, barium, beryllium, copper, mercury, nickel, lead, antimony, selenium, zinc,, and zirconium) and cyanide compounds (unspecified). Creek sediments are contaminated with polychlorinated biphenyls (PCBs). Soil is contaminated with radionuclides, inorganic chemicals, PCBs, and VOCs. Shallow ground water is contaminated with radium, other inorganic chemicals, and VOCs. Radium-contaminated soil may produce radon gas emissions. The discharge of contaminated ground water into nearby creeks could pose ecological risks to aquatic organisms via contaminated surface water, sediment, and food items.
Conclusion of Site-related Risk: The primary current threats to human health and the environment, and the contaminants
driving the remedial action, are inorganic chemicals, organic chemicals (primarily VOCs and PCBs), and radionuclides, accounting for a total of approximately 50 contaminants.
9/23/2016
B2-90
The media of concern for human health include sludge, soil, and ground water exposure for residential, occupational, and trespassing receptors. Primary routes of exposure include ingestion, inhalation, and external radiation. Most human health cancer and non-cancer risks were calculated for contaminants grouped as radionuclides or non-radionuclides. The primary contributors to (future) residential receptor risk include:
OU1– combined ingestion and inhalation of sludge contaminated with radionuclides and non-radionuclides (cancer risk of 3E-03; non-cancer risk hazard quotient [HQ] of 16.5; risk drivers include radionuclides, arsenic, chromium VI, nickel, and hexachlorobenzene);
OU2– ingestion of ground water contaminated with all inorganic chemicals, organic chemicals, and radionuclides (cancer risk of 4E-04; HQ of 5.5; risk drivers for cancer: VOCs, arsenic; risk drivers for non-cancer: VOCs, inorganic constituents); and
OU3– inhalation of soil contaminated with radon (cancer risk of 1.4E-02).
The primary contributors to (future) trespasser receptor risk include combined ingestion and inhalation of sludge contaminated with radionuclides and non-radionuclides contaminants (cancer risk of 5E-06).
The primary contributors to occupational receptor risk include:
OU1– combined ingestion and inhalation of sludge contaminated with radionuclides or non-radionuclides (cancer risk of 1E-03; HQ of 5.2; future occupational receptors; risk drivers include radionuclides, arsenic, chromium VI, nickel, and hexachlorobenzene);
OU2– ingestion of ground water contaminated with inorganic chemicals, organic chemicals, and radionuclides (cancer risk of 6E-03; HQ of 84.75; current occupational receptors; risk drivers for cancer:VOCs, arsenic; risk drivers for non-cancer VOCs, inorganic constituents); and
OU3– inhalation of soil contaminated with radon (cancer risk of 2.9E-03; future occupational receptors).
Ecological risks have been identified for OU2 and include PCBs and hexachlorobenzene. The receptors identified include aquatic organisms and predatory fish. The pathways of concern include ingestion of sediment and fish tissue. The primary contributors to ecological risk are (1) PCBs (ingestion of sediment by aquatic organisms and fish tissue ingestion by predatory fish), and (2) hexachlorobenzene (ingestion of sediment by aquatic organisms and fish tissue ingestion by predatory fish). No ecological HQs were provided. Ecological risk information was not available for other OUs.
9/23/2016
B2-91
Human Health Site-Related Risks: Operable Unit 1: Sludge, Cancer
– Future Resident, Worker, and Trespasser, Ingestion and Inhalation • Radionuclides, Arsenic, Chromium VI,
Nickel, and Hexachlorobenzene Sludge, Non-cancer
– Future Resident and Worker, Ingestion and Inhalation • Radionuclides, Arsenic, Chromium VI,
Nickel, and Hexachlorobenzene
Operable Unit 2: Ground Water, Cancer
– Future Resident, Ingestion • VOCs and Arsenic
Ground Water, Cancer – Current Worker, Ingestion and Inhalation • VOCs and arsenic
Ground Water, Non-cancer – Future Resident and Worker, Ingestion • VOCs and inorganic constituent
Operable Unit 3: Soil, Cancer
– Future Resident and Worker, Inhalation • Risk Driver(s) = Radon
Ecological Site-Related Risks: Operable Unit 2: Sediment
– Aquatic Organisms, Direct Contact • PCBs and hexachlorobenzene
Food (Fish ) – Predatory Fish, Ingestion
• PCBs and hexachlorobenzene
Interim Remedy: The selected remedial actions addressing sludge include: OU1 –
(1) excavation and removal of 85,000 cubic yards sludge;
(2) a treatment plant that will be built to partial solidify sludge to improve handling and reduce gross mobility of the solid; and
(3) disposal in an offsite landfill.
Final Remedy: The following lists outline the selected remedy to address ground water and soils.
OU2 – (1) Extraction and remediation of ground water for areas with unacceptable cancer risk levels
until concentrations throughout the site are below Safe Drinking Water Act (SDWA) Maximum Contaminant Levels (MCLs), non-zero MCL goals, or cancer levels are no longer unacceptable;
(2) discharge of extracted ground water to Teledyne Wah Chang Albany's wastewater treatment plant;
(3) treatment or removal of subsurface source material near the Feed Makeup Building on the main plant;
9/23/2016
B2-92
(4) slope erosion protection consisting of a geotextile covered by riprap placed along the banks of Truax Creek to prevent contaminated fill material from entering the creek;
(5) removal of approximately 3,600 cubic yards of contaminated sediments from the surface water bodies adjacent to, or flowing through, the site (additional ecological characterization prior to removal to determine potential impacts of sediment removal to the local ecosystem and to provide mechanisms to mitigate those impacts);
(6) deed restrictions and institutional controls on land and ground water use for both the main plant and Farm Ponds area (the objective of this component of the remedy is to ensure that the property and ground water are used only for purposes appropriate to the cleanup levels achieved);
(7) environmental evaluations of currently uncharacterized potential contaminant source areas, as needed, to ensure achievement of ground water remedial action objectives RAOs; and
(8) long-term onsite and offsite ground water, surface water, and sediment monitoring, which shall include, at a minimum, the monitoring of onsite wells that are in exceedance of maximum contaminant levels (MCLs) and non-zero maximum contaminant level goals (MCLGs) cancer risk levels of 10[-6], and non-cancer risk Hazard Index (HI) > 1 for residential exposure.
OU3 – (1) Excavation of contaminated material exceeding the gamma radiation action level of 20
micro-rem/hour above background levels;
(2) transportation of the excavated material to an appropriate offsite facility for disposal;
(3) for areas of the site where modeling indicates that radon concentrations in future buildings could exceed 4 pCi/liter, institutional controls requiring that future buildings be constructed using radon-resistant construction methods;
(4) requirement that information on areas of subsurface PCB and radionuclide contamination, which do not pose a risk if they are not disturbed, be incorporated into the TWCA facilities maintenance plan and be made available to future site purchasers or regulatory agencies;
(5) because the determination that action is not required for certain areas of the site is based on scenarios that do not allow unrestricted use, should excavation occur as part of future development of the TWCA Main Plant or the Soil Amendment Area, excavated material must be properly handled and disposed of in accordance with federal and state laws; and
(6) institutional controls requiring that land use remain consistent with current industrial zoning.
9/23/2016
B2-93
Tex-Tin Corp. NPL Site Summary EPA ID: TXD06211332 Number of Operable Units: 4 Location: Texas City, TX Date of NPL Listing: 1990 EPA Region: 6 Last Operational Year: 1991 Status: NPL – Final Documents Used: RI/FS, ROD (Various by OU)
Introduction: The Tex-Tin site is located in a mixed industrial/petrochemical/residential area at the
intersection of State Highway 146 and farm Road FM 519 in Texas City, Galveston County, Texas. The site is approximately 10 miles north of Galveston, Texas, and the City of LaMarque is located about half a mile northwest of the site. The 170-acre Tex-Tin site is a former tin and copper smelter, constructed during World War II. The smelter produced Grade A tin ingots from 1941 to 1988. Annual production at the facility varied from 4,000 to more than 40,000 metric tons of Grade A tin. The waste products consisted primarily of an iron-rich acidic liquid (ferrous and ferric chloride) and slag. From 1988 to 1991, the facility operated as a secondary copper smelter. Tin-lead materials with a high lead content have been used at the facility. Bolivian ore, which was processed at the facility, contains high concentrations of arsenic and copper. Roasting was employed in the smelting process at Tex-Tin, and some of the arsenic and lead present in the materials was removed by volatilization. The site contained numerous waste piles, five wastewater treatment ponds, open and closed acid ponds, slag piles, a permitted low-level radioactive waste landfill, and an inactive hydrocarbon recovery facility. Industrial facilities are located north and west of the site, and marsh areas are located to the south. The site is divided into four Operable Units (OUs):
OU1– (Tex-Tin Facility) addresses the former tin and copper smelting facility and covers approximately 140 acres, including Ponds 22, 24, 25, and 26;
OU2– (Amoco Parcel H) addresses 27 acres of the former smelter facility owned by BP Amoco Corporation;
OU3– (Off-site Residential Area) addresses La Marque residential areas located northwest from the former smelter facility; and
OU4– (Swan Lake Salt Marsh) addresses the Swan Lake, associated salt marsh habitats, and the Wah Chang ditch east of Loop 197.
Summary of Site-related Contamination: Site operations have contaminated various media (soil, ground water, sediment, surface
water, waste ponds, drums, and additional debris) with numerous contaminants. The site is contaminated primarily with inorganic chemicals (aluminum, antimony, arsenic, asbestos, barium, beryllium, cadmium, chromium, cobalt, copper, iron, lead, manganese, mercury, molybdenum, nickel, selenium, silver, tin, vanadium, and zinc), poly-aromatic hydrocarbons (PAHs), and radionuclides (radium-226, radium-228, thorium-228, thorium-230, thorium-232, uranium-234, uranium-235, and uranium-238). Chemical analyses of the surface soil samples collected from 51 residential yards indicate metal contamination at levels greater than three times background levels. An estimated 25,000 people live within a three-mile radius of the site.
9/23/2016
B2-94
Conclusion of Significant Site-related Risk: The primary threats contributing to human health risk, and the contaminants ultimately
driving the site’s remedial action, are inorganic chemicals (primarily antimony, arsenic, beryllium, chromium, copper, lead, molybdenum, nickel, silver, tin, and zinc) and radionuclides (primarily radium-226, radium-228, thorium-228). The major media of concern include surface and subsurface soils, sediment, surface water, ground water, drums, waste piles, and homegrown produce. The receptors with potentially unacceptable risk are current and future residential, occupational, and trespassing receptors. The primary routes of exposure to these media include inhalation, ingestion, and external exposure.
The primary contributors to human health cancer risk include the following:
OU1–
(1) radionuclides (cancer risk of 2.30E-02, 1.90E-02, and 7.50E-03 from the inhalation/external radiation to future onsite industrial workers from surface and subsurface soils and waste piles contaminated with radium-226, radium-228, and thorium-228, respectively);
(2) arsenic (cancer risk ranging from 6.30E-03 to 1.6E-04 for current and future onsite occupational receptors from the ingestion of drum contents and sediment/surface water, respectively; the ingestion of arsenic contaminated drum contents also has a non-cancer risk for future onsite occupational receptors of 193.5);
(3) beryllium (cancer risk of 1.5E-03 for future onsite occupational receptors from the ingestion of ground water); and
(4) other inorganic chemicals (non-cancer HQs of 51.5, 39, 29.7, and 27.6 for future onsite occupational receptors ingesting ground water contaminated with cadmium, manganese, copper, and silver, respectively).
OU2: combined exposure to arsenic, chromium, and lead from soil to current and future receptors (cancer risk of 2.04E-04 to industrial workers, 3.33E-06 to construction workers, 6.43E-06 to residential receptors, and 8.45E-06 to trespassers; specific exposure routes were not present in the documents available).
OU3:
(1) arsenic (cancer risk of 8.50E-05 for residential adult ingestion of surface soil and homegrown produce; non-cancer risk of 1.2 and 2.6 for residential ingestion of surface soil to adults and children, respectively);
(2) beryllium (cancer risk of 5.50E-06 to current residential adults from ingestion of surface soil and homegrown produce).
The media of concern for ecological risk are sediment and surface water. The primary contributors to ecological risk are (1) chromium (current HQ of 14.3), (2) lead (current HQ of 8.7), (3) copper (current HQ of 5.2); and (4) zinc (current HQ of 4.3) to benthic macro invertebrates from exposure to sediment. In addition, the site is considered critical habitat for two threatened or endangered species: the White-Faced Ibis and the Reddish Egret.
9/23/2016
B2-95
Human Health Risk Driver(s): Operable Unit 1: Soils and Waste Piles, Cancer
– Future Worker, Inhalation and External Radiation • Radium-226, Radium-228, Thorium-
228 Drum Contents and Sediment/Surface Water, Cancer
– Current & Future Worker, Ingestion • Arsenic
Ground Water, Cancer – Future Worker, Ingestion
• Beryllium Drum Contents, Non-cancer
– Future Worker, Ingestion • Arsenic
Ground Water, Non-cancer – Future Worker, Ingestion
• Cadmium, Manganese, Copper, Silver
Operable Unit 2: Soil, Cancer
– Future Resident, Worker, and Trespasser (Exposure Route Not Documented) • Arsenic, chromium and lead.
Operable Unit 3: Surface Soil and Homegrown Produce, Cancer
– Current Adult and Child Resident, Ingestion • Arsenic, Beryllium
Ecological Risk Driver(s): Operable Unit 4: Sediment
– Current Benthic Macroinvertebrates • Chromium, Copper, Lead and Zinc
Interim Actions: Response Actions have already addressed exposure risk to industrial workers in OU2.
Response Actions included installation of a soil/vegetative cover, construction of a slurry cutoff wall, implementation of a long-term groundwater monitoring program, restricted use of site ground water, and limiting future site use to industrial purposes only. A Time-Critical Removal Action has already reduced risk to residents in OU3 by evacuating soil, backfilling, and re-vegetating affected areas.
Final Remedy: To address human health and ecological risk from contaminants the following remedial
actions were employed:
OU1–
(1) neutralization of acid ponds and disposal of acid liquid, neutralization of acidic sediments, excavation and disposal of sediments exceeding preliminary remediation goals, and capping of materials with clay soil cover;
(2) stabilization of drums and disposal of inorganic contents; offsite disposal of organic content and capping of stabilized materials with clay soil cover;
(3) onsite disposal and capping of naturally occurring radioactive material (NORM) slag, onsite disposal of hazardous non-NORM slag and covering with RCRA Type C or equivalent cap;
9/23/2016
B2-96
(4) covering of soils exceeding preliminary remediation goals (PRGs) with clay soil cover, including the low-level radioactive landfill area, stabilization and disposal of soils identified as principal threat materials, and treatment and disposal of hazardous soils;
(5) discharge of wastewater pond liquids, usage of Pond 2 as a consolidation cell for disposal of hazardous materials, covering of materials exceeding health-based levels with clay soil cover, and capping materials exceeding Toxicity Characteristic Leaching (not Leachate) Procedure (TCLP) levels with an RCRA Type C or equivalent cap;
(6) groundwater remedial actions, including installation of a slurry wall barrier, installation of an enhanced evapotranspiration system, cap and cover of Pond 7 with an impermeable layer, and long-term monitoring;
(7) offsite disposal of organic contents from above ground storage tanks;
(8) removal of dust and asbestos from buildings, building demolition and onsite disposal of debris, recycling of building structural components, and use of building foundations to function as part of cap/cover over surface contamination.
For OU2 and OU3, see interim actions above.
OU4–
(1) implementation of segmented wave barriers in Swan Lake totaling approximately 5,200 feet;
(2) operations and maintenance to ensure wave barrier integrity.
9/23/2016
B3-1
Attachment B3. References for Case Study Historical Sites Most Superfund documents are available for download at: https://www.epa.gov/superfund/search-superfund-documents Five-Year review documents are available for download at: https://www.epa.gov/superfund/search-superfund-five-year-reviews Decision documents are available for download at: https://www.epa.gov/superfund/search-superfund-decision-documents
Anaconda (MTD093291656) ARCO. 1996a. ARCO. Anaconda Regional Water and Waste Operable Unit, Final Remedial
Investigation Report, Volume 1 of 4, Text. ARCO, Anaconda, MT. February. Retrieved from http://anacondasuperfund.com/library/files/2.18.10.08A.pdf
ARCO. 1996b. ARCO. Anaconda Regional Water and Waste Operable Unit, Final Remedial Investigation Report, Volume 2 of 4, Text and Appendices. ARCO, Anaconda, MT. February. Retrieved from http://anacondasuperfund.com/library/files/2.18.10.08B.pdf
ARCO. 1996c. ARCO. Anaconda Regional Water and Waste Operable Unit, Final Remedial Investigation Report, Volume 3 of 4, Appendices. ARCO, Anaconda, MT. February. Retrieved from http://anacondasuperfund.com/library/files/2.18.10.08C.pdf
ARCO. 1996d. ARCO. Anaconda Regional Water and Waste Operable Unit, Final Remedial Investigation Report, Volume 4 of 4, Plates. ARCO, Anaconda, MT. February. Retrieved from http://anacondasuperfund.com/library/files/2.18.10.08D.pdf
ARCO. 1996e ARCO. Anaconda Smelter NPL Site, Anaconda Regional Spoils Operable Unit, Remedial Investigation Report, Volume 2 of 2, Figures. Prepared by Titan Environmental Corporation, Bozeman, MT, for ARCO, Anaconda, MT. October.
ARCO. 1996f ARCO. Anaconda Smelter NPL Site, Smelter Hill Operable Unit, Remedial Investigation Report, Volume I. ARCO, Anaconda, MT. December.
ARCO. 1996g. ARCO. Anaconda Smelter NPL Site, Smelter Hill Operable Unit, Remedial Investigation Report, Volume II: Plates. ARCO, Anaconda, MT. December. Retrieved at http://anacondasuperfund.com/library/files/2.13.05.05B.pdf
ARCO, 1996h. ARCO. Anaconda Smelter NPL Site, Smelter Hill Operable Unit, Remedial Investigation Report, Volume III: Appendices. ARCO, Anaconda, MT, December 1996. Retrieved at http://anacondasuperfund.com/library/files/2.13.05.05C.pdf
Tetra Tech. 1985. Background Wells at the Anaconda Smelter Site (Anaconda Smelter RI/FS, Technical Memorandum No. 1). Tetra Tech, Inc., Bellevue, WA. October. Retrieved at http://anacondasuperfund.com/library/files/2.01.09.09.pdf
9/23/2016
B3-2
U.S. EPA (Environmental Protection Agency). 1987. Record of Decision: Mill Creek, Montana, Anaconda Smelter Superfund Site, First Operable Unit, Volume I. U.S. Environmental Protection Agency, Region 8, Helena, MT. October.
U.S. EPA (Environmental Protection Agency). 1988a. EPA Superfund Record of Decision: Anaconda Co. Smelter, EPA ID: MTD093291656 OU 15 Anaconda, MT 10/02/1987. EPA/ROD/R08-88/018. U.S. Environmental Protection Agency, Region 8, Helena, MT.
U.S. EPA (Environmental Protection Agency). 1988b. EPA Superfund Record of Decision Amendment: Anaconda Co. Smelter EPA ID: MTD093291656 OU 15 Anaconda, MT 01/06/1988. EPA/AMD/R08-88/500. U.S. Environmental Protection Agency, Region 8, Helena, MT. January 6.
U.S. EPA (Environmental Protection Agency). 1991. EPA Superfund Record of Decision: Anaconda Co. Smelter EPA ID: MTD093291656 OU 11 Anaconda, MT 09/23/1991. EPA/ROD/R08-91/053. U.S. Environmental Protection Agency, Office of Emergency and Remedial Response, Washington, DC. September.
U.S. EPA (Environmental Protection Agency). 1996. Final Baseline Human Health Risk Assessment, Anaconda Smelter NPL Site, Anaconda, Montana. Prepared by CDM Federal Programs Corporation, Golden, CO, for U.S. Environmental Protection Agency, Region 8, Helena, MT. January 24.
U.S. EPA (Environmental Protection Agency). 2005. Third Five-Year Review Report for Anaconda Company Smelter Site, Anaconda, Deer Lodge County, Montana. U.S. Environmental Protection Agency, Region 8, Helena, MT. September 29. Retrieved from https://quicksilver.epa.gov/work/HQ/179170.pdf
U.S. EPA (Environmental Protection Agency). 2010. Fourth Five-Year Review Report, Anaconda Smelter Superfund Site, Anaconda, Montana. U.S. Environmental Protection Agency, Region 8, Helena, MT. September 30.
US EPA & Montana DEQ, 1995. U.S. Environmental Protection Agency and Montana Department of Environmental Quality. Explanation of Significant Differences: Anaconda Smelter Superfund Site, Old Works/East Anaconda Development Area, Operable Unit (OU 7), Anaconda, Deer Lodge County, Montana. EPA/ESD/R08-96/501. U.S. Environmental Protection Agency, Region 8, Helena, MT. October. Retrieved from http://www.mtech.edu/academics/clsps/ptc/sciencesocietysuperfund/pdfs/archival_materials/anaconda_archives/anaconda_rod/a_esd_anaconda.pdf
US EPA & Montana DEQ, 1996. U.S. Environmental Protection Agency & Montana Department of Environmental Quality. EPA Superfund Record of Decision: Anaconda Co. Smelter EPA ID: MTD093291656 OU 16 Anaconda, MT 09/30/1996. EPA/ROD/R08-96/127. U.S. Environmental Protection Agency, Region 8, Helena, MT. September 30.
US EPA & Montana DEQ, 1998. U.S. Environmental Protection Agency and Montana Department of Environmental Quality. EPA Superfund Record of Decision: Anaconda
9/23/2016
B3-3
Regional Water, Waste, and Soils Operable Unit, Anaconda Smelter NPL Site, Anaconda, MT. U.S. Environmental Protection Agency, Region 8, Helena, MT. September.
US EPA & Montana DEQ, 2011. U.S. Environmental Protection Agency and Montana Department of Environmental Quality. EPA Superfund Record of Decision Amendment: Anaconda Regional Water, Waste, and Soils Operable Unit, Anaconda Smelter NPL Site, Anaconda-Deer Lodge County, MT. U.S. Environmental Protection Agency, Region 8, Helena, MT. September.
US EPA & Montana DHES, 1994. U.S. Environmental Protection Agency and Montana Department of Health and Environmental Sciences. EPA Superfund Record of Decision: Old Works/East Anaconda Development Area, Operable Unit, Anaconda Smelter NPL Site, Anaconda, Montana. EPA/ROD/R08-94/083. U.S. Environmental Protection Agency, Region 8, Helena, MT. July.
Bunker Hill (IDD048340921) TerraGraphics. 2001. TerraGraphics Environmental Engineering. Final Human Health Risk
Assessment for the Coeur d’Alene Basin Extending from Harrison to Mullan on the Coeur d’Alene River and Tributaries Remedial, Investigation/Feasibility Study. Prepared by TerraGraphics Environmental Engineering for Idaho Department of Health and Welfare, Idaho Department of Environmental Quality, and U.S. Environmental Protection Agency, Region 10. Retrieved from https://www3.epa.gov/region10/pdf/sites/bunker_hill/hhra_080101.pdf
U.S. EPA (Environmental Protection Agency). 1991a. EPA Superfund Record of Decision: Bunker Hill Mining & Metallurgical Complex EPA ID: IDD048340921 OU 1 Smelterville, ID. EPA/ROD/R10-91/028. U.S. Environmental Protection Agency, Region 10, Seattle, WA. August 30.
U.S. EPA (Environmental Protection Agency). 1991b. EPA Superfund Record of Decision: Bunker Hill Mining & Metallurgical Complex, ID. EPA/ROD/R10-91/028. U.S. Environmental Protection Agency, Office of Emergency and Remedial Response, Washington, DC. August.
U.S. EPA (Environmental Protection Agency). 1992a. EPA Superfund Record of Decision: Bunker Hill Mining & Metallurgical Complex, EPA ID: IDD048340921 OU 02. EPA/ROD/R10-92/041. U.S. Environmental Protection Agency, Region 10, Seattle, WA. September 22.
U.S. EPA (Environmental Protection Agency). 1992b. EPA Superfund Record of Decision: Bunker Hill Mining & Metallurgical Complex, ID. EPA/ROD/R10-92/041. U.S. Environmental Protection Agency, Office of Emergency and Remedial Response, Washington, DC. September.
U.S. EPA (Environmental Protection Agency). 1996. EPA Superfund Record of Decision Amendment: Bunker Hill Mining & Metallurgical Complex EPA ID: IDD048340921 OU
9/23/2016
B3-4
2 Smelterville, ID 09/09/1996. EPA/AMD/R10-96/146. U.S. Environmental Protection Agency, Region 10, Seattle, WA. September 9.
U.S. EPA (Environmental Protection Agency). 1997. EPA Superfund Record of Decision Amendment: Bunker Hill Mining & Metallurgical Complex (Non-Populated Areas) Superfund Site Smelterville, ID 9/9/1996. EPA/AMD/R10-96/146. U.S. Environmental Protection Agency, Region 10, Seattle, WA., April.
U.S. EPA (Environmental Protection Agency). 1998a. EPA Superfund Explanation of Significant Difference for the Record of Decision: Bunker Hill Mining and Metallurgical Complex Smelterville, ID 4/18/1998. U.S. Environmental Protection Agency, Office of Emergency and Remedial Response, Washington, DC, PB98-963106. EPA 541-R98-037, September.
U.S. EPA (Environmental Protection Agency). 1998b. EPA Superfund Explanation of Significant Differences: Bunker Hill Mining and Metallurgical Complex EPA ID: IDD048340921 OU 02 Smelterville, ID 4/18/1998. U.S. Environmental Protection Agency, Region 10, Seattle, WA, EPA/ESD/R10-98/037. April 8.
U.S. EPA (Environmental Protection Agency). 1999. Superfund Cleanup at Bunker Hill: An Overview. EPA 910-R-99-09. U.S. Environmental Protection Agency, Region 10, Seattle, WA. April.
U.S. EPA (Environmental Protection Agency). 2000. First 5-Year Review of the Non-Populated Area Operable Unit Bunker Hill Mining and Metallurgical Complex Shoshone County, Idaho. U.S. Environmental Protection Agency, Region 10, Seattle, WA. September. Retrieved from https://www3.epa.gov/region10/pdf/sites/bunker_hill/bh_unpopulated_fyr_2000.pdf
U.S. EPA (Environmental Protection Agency). 2001a. Bunker Hill Mine Water Management Remedial Investigation/Feasibility Study. Prepared by URS Greiner, Inc., Seattle, WA, and CH2M HILL, Bellevue, WA, for U.S. Environmental Protection Agency, Region 10, Seattle, WA, April. Retrieved from https://www3.epa.gov/region10/pdf/sites/bunker_hill/mine_water_management_rifs_apr2001.pdf
U.S. EPA (Environmental Protection Agency). 2001b. EPA Superfund Record of Decision Amendment: Bunker Hill Mining & Metallurgical Complex EPA ID: IDD048340921 OU 2 Smelterville, ID 12/10/2001. EPA/AMD/R10-02/604. U.S. Environmental Protection Agency, Region 10, Seattle, WA. November.
U.S. EPA (Environmental Protection Agency). 2002. EPA Superfund Record of Decision: Bunker Hill Mining & Metallurgical Complex EPA ID: IDD048340921 OU 3 Smelterville, ID. EPA/ROD/R10-02/032. U.S. Environmental Protection Agency, Region 10, Seattle, WA. September 12.
U.S. EPA (Environmental Protection Agency). 2005. Second Five Year Review for the Bunker Hill Mining and Metallurgical Complex Superfund Site, Operable Units 1, 2, and 3,
9/23/2016
B3-5
Idaho and Washington. EPA 910-R-05-006. U.S. Environmental Protection Agency, Region 10, Seattle, WA. October. Retrieved from https://www3.epa.gov/region10/pdf/sites/bunker_hill/bh_2nd_fyr_102505.pdf
U.S. EPA (Environmental Protection Agency). 2008. Source Areas of Concern Report, Operable Unit 2, Bunker Hill Mining and Metallurgical Complex Superfund Site. Prepared by CH2M HILL, Bellevue, WA, for U.S. Environmental Protection Agency, Region 10, Seattle, WA. March 24. Retrieved from https://yosemite.epa.gov/R10/CLEANUP.NSF/box/Technical+Documents/$FILE/OU2+Source+Areas+of+Concern+Report.pdf
U.S. EPA (Environmental Protection Agency). 2010a. Hardrock Mine Site Data Summary – NPL or NPL Equivalent, Bunker Hill Mining & Metallurgical Complex, Smelterville, ID. U.S. Environmental Protection Agency, Washington, DC. July 12.
U.S. EPA (Environmental Protection Agency). 2010b. Draft Final, Focused Feasibility Study Report. Upper Basin of the Coeur d’Alene River, Bunker Hill Mining and Metallurgical Complex Superfund Site, Volume 1 – Executive Summary and Main Text. Prepared by CH2M HILL, Bellevue, WA, for U.S. Environmental Protection Agency, Region 10, Seattle, WA. July. Retrieved from https://www3.epa.gov/region10/pdf/sites/bunker_hill/cda_basin/final_ffs_report_volume_1.pdf
U.S. EPA (Environmental Protection Agency). 2010c. Draft Final, Focused Feasibility Study Report. Upper Basin of the Coeur d’Alene River, Bunker Hill Mining and Metallurgical Complex Superfund Site, Volume 4. Prepared by CH2M HILL, Bellevue, WA, for U.S. Environmental Protection Agency, Region 10, Seattle, WA. July. Retrieved from https://www3.epa.gov/region10/pdf/sites/bunker_hill/cda_basin/final_ffs_report_volume_4.pdf
Captain Jack Mill (COD981551427) Colorado DPHE (Department of Public Health and Environment). 2008a. Final Captain Jack
Superfund Site Feasibility Study Report. Prepared by Walsh Environmental Scientists and Engineers, Boulder, CO, for Colorado Department of Public Health and Environment, Denver, CO. May 22.
Colorado DPHE (Department of Public Health and Environment). 2008b. Final Captain Jack Superfund Site Remedial Investigation and Risk Assessment Report, Vol. 1. Prepared by Walsh Environmental Scientists and Engineers, Boulder, CO, for Colorado Department of Public Health and Environment, Denver, CO. May 22.
Colorado DPHE (Department of Public Health and Environment). 2008c. Final Captain Jack Superfund Site Remedial Investigation and Risk Assessment Report, Vol. 2. Prepared by Walsh Environmental Scientists and Engineers, Boulder, CO, for Colorado Department of Public Health and Environment, Denver, CO. May 22.
9/23/2016
B3-6
Colorado DPHE & US EPA, 2008. Colorado Department of Public Health and Environment & U.S. Environmental Protection Agency. Final Captain Jack Superfund Site Record of Decision. Prepared by Walsh Environmental Scientists and Engineers, Boulder, CO, for Colorado Department of Public Health and Environment, Denver, CO, and U.S. Environmental Protection Agency, Region 8, Denver, CO. September 23.
Cimarron (NMD980749378) Carrizozo, 2006. Carrizozo, NM. Prohibition Against Disturbance. Executed by Town of
Carrizozo, NM. April 25. Retrieved from https://quicksilver.epa.gov/work/06/209690.pdf
Means, 2006. Means, Timothy. Prohibition Against Disturbance. Executed by Timothy Means for Cimarron Mining Corporation Superfund Site, Carrizozo, NM. April 25. Retrieved From https://semspub.epa.gov/work/06/209691.pdf
U.S. EPA (Environmental Protection Agency). 1990a. EPA Superfund Record of Decision: Cimarron Mining Corp. EPA ID: NMD980749378 OU 01 Carrizozo, NM 09/21/1990. EPA/ROD/R06-90/060. U.S. Environmental Protection Agency, Region 6, Dallas, TX. September.
U.S. EPA (Environmental Protection Agency). 1990b. EPA Superfund Record of Decision: Cimarron Mining, NM: Decision Summary, Cimarron Mining Corporation Site, Operable Unit 1. EPA/ROD/R06-90/060. U.S. Environmental Protection Agency, Office of Emergency and Remedial Response, Washington, DC. September.
U.S. EPA (Environmental Protection Agency). 1991a. EPA Superfund Record of Decision, Cimarron Mining, NM: Decision Summary, Cimarron Mining Corporation Site, Operable Unit 2 (Sierra Blanca). EPA/ROD/R06-91/067. U.S. Environmental Protection Agency, Office of Emergency and Remedial Response, Washington, DC. September.
U.S. EPA (Environmental Protection Agency). 1991b. Decision Summary, Cimarron Mining Corporation Site, Operable Unit 2 (Sierra Blanca), Record of Decision. U.S. Environmental Protection Agency, Region 6, Dallas, TX. September. Retrieved from https://quicksilver.epa.gov/work/HQ/187893.pdf
U.S. EPA (Environmental Protection Agency). 1998. Cimarron Mining Corporation Superfund Site Ground Water Remedial Action Five-Year Review. U.S. Environmental Protection Agency, Region 6, Superfund Division, Dallas, TX. July.
U.S. EPA (Environmental Protection Agency). 2003. Second Five-Year Review Report for Cimarron Mining Corporation Superfund Site Operable Unit 1 and 2, Carrizozo, Lincoln County, New Mexico. U.S. Environmental Protection Agency, Region 6, Dallas, TX. June.
U.S. EPA (Environmental Protection Agency). 2008. Third Five-Year Review Report for Cimarron Mining Corporation Superfund Site Operable Unit 1 and 2, Carrizozo, Lincoln County, New Mexico. U.S. Environmental Protection Agency, Region 6, Dallas, TX. July.
9/23/2016
B3-7
Eagle Mine (COD081961518) Morrison Knudsen & ICF Kaiser, 1997. Final Eagle Mine Site, Task 5: Risk Assessment
Deliverables. Morrison Knudsen Corporation, Englewood, CO, and ICF Kaiser Engineers, Lakewood, CO. February 11.
U.S. EPA (Environmental Protection Agency). 1993a. Final Report on the Health Risk Assessments for the Eagle Mine Superfund Site, Minturn, Colorado. Prepared by John S. Reif for EREBA under a Technical Advisory Grant for U.S. Environmental Protection Agency, Region 8, Denver, CO. April 15.
U.S. EPA (Environmental Protection Agency). 1993b. EPA Superfund Record of Decision: Eagle Mine EPA ID: COD081961518 OU 01 Minturn/Redcliff, CO 03/29/1993. EPA/ROD/R08-93/068. U.S. Environmental Protection Agency, Region 8, Denver, CO. March 29.
U.S. EPA (Environmental Protection Agency). 1998. EPA Superfund Record of Decision: Eagle Mine, EPA ID: COD081961518 OU 02 Minturn/Redcliff, CO 09/03/1998. EPA/ROD/R08-98/079. U.S. Environmental Protection Agency, Region 8, Denver, CO. September 3.
U.S. EPA (Environmental Protection Agency). 2005. Second Five-Year Review Report for Eagle Mine Superfund Site, CERCLIS ID: COD081961518, Minturn, Eagle County, Colorado. Prepared by Colorado Department of Public Health and Environment, Denver, for U.S. Environmental Protection Agency, Region 8, Denver, CO. September.
U.S. EPA (Environmental Protection Agency). 2006. Remedial Investigation Report: Bolts Lake Area and Areas within OU-1 of Eagle Mine Site. Prepared by Environmental Resources Management, Greenwood Village, CO, for U.S. Environmental Protection Agency, Region 8, Denver, CO. September 15.
U.S. EPA (Environmental Protection Agency). 2007a. Human Health Risk Assessment: Bolts Lake Area and Areas within OU-1 of Eagle Mine Site. Prepared by Environmental Resources Management, Greenwood Village, CO, for U.S. Environmental Protection Agency, Region 8, Denver, CO. February 2.
U.S. EPA (Environmental Protection Agency). 2007b. Remediation Feasibility Study: Bolts Lake Area and Areas within OU-1 of Eagle Mine Site. Prepared by Environmental Resources Management, Greenwood Village, CO, for U.S. Environmental Protection Agency, Region 8, Denver, CO. February 16.
U.S. EPA (Environmental Protection Agency). 2008. Third Five-Year Review Report for Eagle Mine Superfund Site, CERCLIS ID: COD081961518, Minturn, Eagle County, Colorado. Prepared by U.S. Environmental Protection Agency, Region 8, Denver, CO. September.
9/23/2016
B3-8
East Helena (MTD006230346) U.S. EPA (Environmental Protection Agency). 1989. Record of Decision: East Helena Smelter
Site, Process Ponds Operable Unit, East Helena, Montana. U.S. Environmental Protection Agency, Region 8, Helena, MT. November.
U.S. EPA (Environmental Protection Agency). 1990a. Volume 5: Comprehensive Remedial Investigation/Feasibility Study – ASARCO, Inc., East Helena, Montana. Prepared by Hydrometrics, Inc., Helena, MT., for U.S. Environmental Protection Agency, Region 8, Helena, MT. March 30.
U.S. EPA (Environmental Protection Agency). 1990b. EPA Superfund Record of Decision: East Helena Site_ EPA ID_ MTD 006230346 OU 01 East Helena, MT 11/22/1989. EPA/ROD/R08-90/027. U.S. Environmental Protection Agency, Region 8, Denver, CO.
U.S. EPA (Environmental Protection Agency). 2005. Technical Memorandum: Supplemental Ecological Risk Assessment for the East Helena Smelter Site, Montana. U.S. Environmental Protection Agency, Region 8, Denver, CO. January 25.
U.S. EPA (Environmental Protection Agency). 2006. Second Five-Year Review Report for the East Helena Superfund Site, East Helena, Lewis and Clark County, Montana. Prepared by HDR One Company, for U.S. Environmental Protection Agency, Region 8, Helena, MT. March 31.
U.S. EPA (Environmental Protection Agency). 2009. East Helena Superfund Site, Operable Unit No. 2, Residential Soils and Undeveloped Lands, Final Record of Decision. U.S. Environmental Protection Agency, Washington, DC. September.
U.S. EPA (Environmental Protection Agency). 2011. Third Five-Year Review Report for the East Helena Superfund Site, East Helena, Lewis and Clark County, Montana. Prepared by Pacific Western Technologies, Ltd, for U.S. Environmental Protection Agency, Region 8, Helena, MT. September 20.
Eastern Michaud (IDD984666610) FMC. 2010a. FMC. Volume 1: Supplemental Remedial Investigation Report for the FMC Plant
Operable Unit. FMC Idaho LLC, Pocatello, ID. January.
FMC. 2010b. FMC. Volume 2 - Appendices: Supplemental Remedial Investigation Report for the FMC Plant Operable Unit. FMC Idaho LLC, Pocatello, ID. January.
U.S. EPA (Environmental Protection Agency). 1995a. Baseline Human Health Risk Assessment, Eastern Michaud Flats, Pocatello, Idaho. Prepared by Ecology and Environment, Inc., Lancaster, NY, for U.S. Environmental Protection Agency, Region 10, Seattle, WA. July.
U.S. EPA (Environmental Protection Agency). 1995b. Baseline Human Health Risk Assessment, Eastern Michaud Flats, Pocatello, Idaho: Appendices A – K. Prepared by Ecology and Environment, Inc., Lancaster, NY, for U.S. Environmental Protection Agency, Region 10, Seattle, WA. July.
9/23/2016
B3-9
U.S. EPA (Environmental Protection Agency). 1995c. Ecological Risk Assessment, Eastern Michaud Flats, Pocatello, Idaho. Prepared by Ecology and Environment, Inc., Lancaster, NY, for U.S. Environmental Protection Agency, Region 10, Seattle, WA. July.
U.S. EPA (Environmental Protection Agency). 1998. Record of Decision: Declaration, Decision Summary, and Responsiveness Summary for Eastern Michaud Flats Superfund Site, Pocatello, Idaho. U.S. Environmental Protection Agency, Region 10, Seattle, WA. June. Retrieved from https://quicksilver.epa.gov/work/10/100002719.pdf
Foote Mineral (PAD077087989) ATSDR (Toxic Substances and Disease Registry). 1994. Preliminary Public Health Assessment
for Foote Mineral Company, Frazer, Chester County, Pennsylvania, CERCLIS No. PAD077087989. Prepared by the Pennsylvania Department of Health for the Agency for Toxic Substances and Disease Registry, Division of Health Assessment and Consultation, Atlanta, GA. April 7. Available at http://www.atsdr.cdc.gov/HAC/pha/PHA.asp?docid=309&pg=0
ERM (Environmental Resources Management). 1999. Cyprus Foote Mineral Remedial Investigation/Risk Assessment Report Volume II, Appendices A to K, East Whiteland Township, Pennsylvania. Environmental Resources Management, Exton, PA. April 2.
ERM (Environmental Resources Management). 2000. Cyprus Foote Mineral Remedial Investigation/Risk Assessment Report Volume III, Appendices D to L, East Whiteland Township, Pennsylvania. Environmental Resources Management, Exton, PA. May 23.
ERM (Environmental Resources Management). 2000. Cyprus Foote Mineral Remedial Investigation/Risk Assessment Report Volume IV, Appendices M to R, East Whiteland Township, Pennsylvania. Environmental Resources Management, Exton, PA. May 23.
U.S. EPA (Environmental Protection Agency). 2006. Superfund Record of Decision: Foote Mineral Co. EPA ID: PAD077087989 OU 01 East Whiteland Township, PA. EPA/ROD/R2006030001596. U.S. Environmental Protection Agency, Region 3, Philadelphia, PA. March 31.
Gilt Edge (SDD987673985) U.S. EPA (Environmental Protection Agency). 2001a. Early Action – Interim Record of
Decision, OU2 – Water Treatment Operations, Gilt Edge Mine NPL Site, Lawrence County, South Dakota. EPA/ROD/R08-01/611. U.S. Environmental Protection Agency, Denver, CO. April 23.
U.S. EPA (Environmental Protection Agency). 2001b. Interim Record of Decision, Operable Unit 3, Ruby Gulch Waste Rock Dump, Gilt Edge Mine NPL Site, Lawrence County, South Dakota. EPA/ROD/R08-01/548. U.S. Environmental Protection Agency, Denver, CO. August 30.
9/23/2016
B3-10
U.S. EPA (Environmental Protection Agency). 2003. Baseline Ecological Risk Assessment for the Gilt Edge Mine, Lead, South Dakota, Final. U.S. Environmental Protection Agency, Region 8, Denver, CO. November.
U.S. EPA (Environmental Protection Agency). 2006. Final Baseline Human Health Risk Assessment for the Gilt Edge Mine Site, Lawrence County, South Dakota. U.S. Environmental Protection Agency, Region 8, Denver, CO. July.
U.S. EPA (Environmental Protection Agency). 2007. First Five-Year Review Report for Gilt Edge Mine Superfund Site Operable Units 2 and 3, Lawrence County, South Dakota. U.S. Environmental Protection Agency, Region 8, Denver, CO. April.
U.S. EPA (Environmental Protection Agency). 2008a. Final Feasibility Study Report for the Gilt Edge Superfund Site, Operable Unit 1 (OU1) Lawrence County, South Dakota. Prepared by CDM Federal Programs Corporation, Kansas City, MO, for U.S. Environmental Protection Agency, Region 8, Denver, CO. May.
U.S. EPA (Environmental Protection Agency). 2008b. Final Remedial Investigation Report for the Gilt Edge Superfund Site Lawrence County, South Dakota, Volume I – Text. Prepared by CDM Federal Programs Corporation, Denver, CO, for U.S. Environmental Protection Agency, Region 8, Denver, CO. February 1.
U.S. EPA (Environmental Protection Agency). 2008c. Final Remedial Investigation Report for the Gilt Edge Superfund Site Lawrence County, South Dakota, Volume II – Figures and Tables. Prepared by CDM Federal Programs Corporation, Denver, CO, for U.S. Environmental Protection Agency, Region 8, Denver, CO. February 1.
U.S. EPA (Environmental Protection Agency). 2008d. Record of Decision for Gilt Edge Mine Superfund Site Operable Unit 1, Lawrence County, South Dakota. U.S. Environmental Protection Agency, Region 8, Denver, CO. September.
Homestake (NMD007860935) U.S. EPA (Environmental Protection Agency). 1989a. Record of Decision: Homestake Mining
Company, Radon Operable Unit, Cibola County, New Mexico. U.S. Environmental Protection Agency, Region 6, Dallas, TX. September.
U.S. EPA (Environmental Protection Agency). 1989b. EPA Superfund Record of Decision: Homestake Mining Company, EPA ID: NMD007860935, OU 01, Milan, New Mexico. EPA/ROD/R06-89/050. U.S. Environmental Protection Agency, Region 6, Dallas, TX. September 27.
U.S. EPA (Environmental Protection Agency). 2001. First Five-Year Review Report for Homestake Mining Company Superfund Site, Cibola County, New Mexico. U.S. Environmental Protection Agency, Region 6, Dallas, TX. September.
9/23/2016
B3-11
U.S. EPA (Environmental Protection Agency). 2006. Second Five-Year Review Report for Homestake Mining Company Superfund Site, Cibola County, New Mexico. U.S. Environmental Protection Agency, Region 6, Dallas, TX. September.
Li Tungsten (NYD986882660) U.S. EPA (Environmental Protection Agency). 1998a. Li Tungsten, Glen Cove, New York, Draft
Final Remedial Investigation (Rl) Report, Volume I of IV. U.S. Environmental Protection Agency, Region 2, New York, NY. May.
U.S. EPA (Environmental Protection Agency). 1998b. Li Tungsten, Glen Cove, New York, Draft Final Remedial Investigation (Rl) Report, Volume II of IV (Tables, Figures, Plates). U.S. Environmental Protection Agency, Region 2, New York, NY. May.
U.S. EPA (Environmental Protection Agency). 1998c. Li Tungsten, Glen Cove, New York, Draft Final Remedial Investigation (Rl) Report, Volume III of IV. U.S. Environmental Protection Agency, Region 2, New York, NY. May.
U.S. EPA (Environmental Protection Agency). 1998d. Li Tungsten, Glen Cove, New York, Draft Final Remedial Investigation (Rl) Report, Volume IV of IV. U.S. Environmental Protection Agency, Region 2, New York, NY. May.
U.S. EPA (Environmental Protection Agency). 1999a. Draft Final Feasibility Study Report: Li Tungsten, Glen Cove, New York, Work Assignment No. 028-RICO-024, Volume I of II. U.S. Environmental Protection Agency, Region 2, New York, NY. July.
U.S. EPA (Environmental Protection Agency). 1999b. Draft Final Feasibility Study Report: Li Tungsten, Glen Cove, New York, Work Assignment No. 028-RICO-024, Volume II of II. U.S. Environmental Protection Agency, Region 2, New York, NY. July.
U.S. EPA (Environmental Protection Agency). 1999c. Record of Decision for OU1_Facility and OU2_Captains Cove for the Li Tungsten Corporation Site. U.S. Environmental Protection Agency, Region 2, New York, NY. September.
U.S. EPA (Environmental Protection Agency). 1999d. Record of Decision: Li Tungsten Corporation Superfund Site, EPA ID: NYD986882660, OU 01, 02, Glen Cove, Nassau County, New York. EPA/ROD/R02-99/158. U.S. Environmental Protection Agency, Region 2, New York, NY. September 30.
U.S. EPA (Environmental Protection Agency). 2005a. EPA Superfund, Explanation of Significant Differences: Li Tungsten Corp. EPA ID: NYD986882660 OU 02 Glen Cove, NY 05/02/2005. EPA/ESD/E2005020001615. U.S. Environmental Protection Agency, Region 2, New York, NY. May 2
U.S. EPA (Environmental Protection Agency). 2005b. Five-Year Review Report for Li Tungsten Superfund Site, Glen Cove, Nassau County, New York. U.S. Environmental Protection Agency, Region 2, New York, NY. August.
9/23/2016
B3-12
U.S. EPA (Environmental Protection Agency). 2005c. Record of Decision: Li Tungsten Corporation Superfund Site, Operable Unit Four - Glen Cove Creek, City of Glen Cove, Nassau County, New York.. EPA/ROD/R02-05/017. U.S. Environmental Protection Agency, Region 2, New York, NY. March 30.
Macalloy (SCD003360476) Macalloy. 1994. Macalloy Corporation. Human Health Risk Assessment for Macalloy
Corporation, Charleston, South Carolina. Prepared by ChemRisk Division, McLaren/Hart Environmental Engineering Corporation, Wexford, PA, for Macalloy Corporation, Charleston, SC. September.
Macalloy. 2001a. Macalloy Corporation. Final Phase I Remedial Investigation Report, Macalloy Corporation, Charleston, South Carolina, Volume I of V, Sections 1 to 10. Prepared by EnSafe Inc., Memphis, TN, for Macalloy Corporation, Charleston, SC. April 18.
Macalloy. 2001b. Macalloy Corporation. Final Phase I Remedial Investigation Report, Macalloy Corporation, Charleston, South Carolina, Volume II of V, Figures. Prepared by EnSafe Inc., Memphis, TN, for Macalloy Corporation, Charleston, SC. April 18.
Macalloy. 2001c. Macalloy Corporation. Final Phase I Remedial Investigation Report, Macalloy Corporation, Charleston, South Carolina, Volume III of V, Appendix 2.A to Appendix 4.A (Grid Soil Borings). Prepared by EnSafe Inc., Memphis, TN, for Macalloy Corporation, Charleston, SC. April 18.
Macalloy. 2001d. Macalloy Corporation. Final Phase I Remedial Investigation Report, Macalloy Corporation, Charleston, South Carolina, Volume IV of V, Appendix 4.A (Groundwater Monitoring Wells) to Appendix 8.A. Prepared by EnSafe Inc., Memphis, TN, for Macalloy Corporation, Charleston, SC. April 18.
Macalloy. 2001e. Macalloy Corporation. Final Phase I Remedial Investigation Report, Macalloy Corporation, Charleston, South Carolina, Volume V of V, Ecological Risk Assessment of the Macalloy Corporation and Shipyard Creek. Prepared by Breedlove, Dennis & Young, Inc., Franklin, TN, for Macalloy Corporation, Charleston, SC. April 18.
Macalloy. 2002a. Macalloy Corporation. Final Feasibility Study Report, Macalloy Corporation, Charleston, South Carolina. Prepared by EnSafe Inc., Memphis, TN, for Macalloy Corporation, Charleston, SC. March 29.
Macalloy. 2002b. Macalloy Corporation. Final Phase II Remedial Investigation Report, Macalloy Corporation, Charleston, South Carolina. Prepared by EnSafe Inc., Memphis, TN, and BDY Breedlove, Dennis, Young & Associates, Inc., for Macalloy Corporation, Charleston, SC. January 28.
Macalloy. 2002c. Macalloy Corporation. Final Phase II Remediation Report, Macalloy Corporation, Charleston, South Carolina. Prepared by EnSafe Inc., Memphis, TN, for Macalloy Corporation, Charleston, SC. January 28.
9/23/2016
B3-13
U.S. EPA (Environmental Protection Agency). 2002. Superfund Record of Decision: Macalloy Corporation, EPA ID: SCD003360476, OU 01, North Charleston, SC, 8/21/2002. EPA/ROD/R04-02/084. U.S. Environmental Protection Agency, Region 4, Atlanta, GA. August 21.
U.S. EPA (Environmental Protection Agency). 2010. First Five-Year Review Report, Macalloy Corporation National Priorities List Site Charleston, Charleston County, South Carolina. U.S. Environmental Protection Agency, Region 4, Atlanta, GA. June 24.
Midnite Mine (WAD980978753) U.S. EPA (Environmental Protection Agency). 2005a. Final Feasibility Study Report for Midnite
Mine Stevens County, Washington. Prepared by URS Corporation, Seattle, WA, for U.S. Environmental Protection Agency, Region 10, Seattle, WA. September 30.
U.S. EPA (Environmental Protection Agency). 2005b. Final Midnite Mine Human Health Risk Assessment Report. U.S. Environmental Protection Agency, Region 10, Seattle, WA. September.
U.S. EPA (Environmental Protection Agency). 2005c. Final Remedial Investigation Report for Midnite Mine Stevens County, Washington. Prepared by URS Corporation, Seattle, WA, for U.S. Environmental Protection Agency, Region 10, Seattle, WA. September 30.
U.S. EPA (Environmental Protection Agency). 2005d. Final Report, Midnite Mine Site, Ecological Risk Assessment, Wellpinit, Washington. Prepared by Lockheed Martin, Edison, NJ, for U.S. Environmental Protection Agency, Region 10, Seattle, WA. September.
U.S. EPA (Environmental Protection Agency). 2006. Midnite Mine Superfund Site, Spokane Indian Reservation, Washington, Record of Decision. U.S. Environmental Protection Agency Region 10, Seattle, WA. September.
Monsanto (IDD081830994) Monsanto. 1993. Monsanto Chemical Company. Phase II Remedial Investigation Report for the
Monsanto Soda Springs Elemental Phosphorus Plant, Volume IV. Prepared by Golder Associates, Redmond, WA, for Monsanto Chemical Company, Soda Springs, ID. October 6.
Monsanto. 1995. Monsanto Chemical Company. Phase II Remedial Investigation Report for the Monsanto Soda Springs Elemental Phosphorus Plant, Volume I. Prepared by Golder Associates, Redmond, WA, for Monsanto Chemical Company, Soda Springs, ID. November 21.
U.S. EPA (Environmental Protection Agency). 1997. Record of Decision, Monsanto Chemical Company Superfund Site, Caribou County, Idaho. U.S. Environmental Protection Agency Region 10, Seattle, WA. April.
9/23/2016
B3-14
U.S. EPA (Environmental Protection Agency). 2003. First Five-Year Review Report for Monsanto Chemical Co. (Soda Springs Plant), Caribou County, Idaho. U.S. Environmental Protection Agency Region 10, Seattle, WA. September.
U.S. EPA (Environmental Protection Agency). 2008. Second Five-Year Review Report for Monsanto Chemical Co. (Soda Springs Plant), EPA ID: IDD081830994, Caribou County, Idaho. U.S. Environmental Protection Agency Region 10, Seattle, WA. August.
National Southwire (KYD049062375) U.S. EPA (Environmental Protection Agency). 1993. EPA Superfund Record of Decision:
National Southwire Aluminum Co. EPA ID: KYD049062375 OU 01 Hawesville, KY 02/19/1993. EPA/ROD/R04-93/132. U.S. Environmental Protection Agency, Region 4, Atlanta, GA. February 19.
U.S. EPA (Environmental Protection Agency). 2000. EPA Superfund Record of Decision: National Southwire Aluminum Co. EPA ID: KYD049062375 OU 00 Hawesville, KY 07/06/2000. EPA/ROD/R04-00/079. U.S. Environmental Protection Agency, Region 4, Atlanta, GA. July.
U.S. EPA (Environmental Protection Agency). 2001. Superfund First Five-Year Review Report for National Southwire Aluminum Co., Hawesville, Hancock County, Kentucky. Prepared by U.S. Army Corps of Engineers, Louisville District, for U.S. Environmental Protection Agency, Region 4, Atlanta, GA. July.
U.S. EPA (Environmental Protection Agency). 2006. Superfund Second Five-Year Review Report, Final, National Southwire Aluminum Co., Hawesville, Kentucky. Prepared by U.S. Army Corps of Engineers, Louisville District, for U.S. Environmental Protection Agency, Region 4, Atlanta, GA. July.
Omaha Lead (NESFN0703481) U.S. EPA (Environmental Protection Agency). 2004. Omaha Lead Site, Operable Unit 01,
Interim Record of Decision. U.S. Environmental Protection Agency, Region 7, Kansas City, KS. December 15.
U.S. EPA (Environmental Protection Agency). 2008. Draft-Final Baseline Human Health Risk Assessment for the Omaha Lead Site, Omaha, Nebraska. Prepared by Syracuse Research Corporation, Denver, CO, for U.S. Environmental Protection Agency, Region 7, Kansas City, KS. October.
U.S. EPA (Environmental Protection Agency). 2009a. Final Omaha Lead Site Final Feasibility Study, Omaha, Nebraska. Prepared by Black & Veatch Special Projects Corp., Overland Park, KS, for U.S. Environmental Protection Agency, Region 7, Kansas City, KS. April.
U.S. EPA (Environmental Protection Agency). 2009b. Omaha Lead Site Final Remedial Investigation Report, Volume I, Omaha, Nebraska. Prepared by Black & Veatch Special
9/23/2016
B3-15
Projects Corp., Overland Park, KS, for U.S. Environmental Protection Agency, Region 7, Kansas City, KS. April.
U.S. EPA (Environmental Protection Agency). 2009c. Omaha Lead Site Final Remedial Investigation Report, Volume II, Appendices A through L, Omaha, Nebraska. Prepared by Black & Veatch Special Projects Corp., Overland Park, KS, for U.S. Environmental Protection Agency, Region 7, Kansas City, KS. April.
U.S. EPA (Environmental Protection Agency). 2009d. Omaha Lead Site Final Remedial Investigation Report, Volume III, Appendix M, Omaha, Nebraska. Prepared by Black & Veatch Special Projects Corp., Overland Park, KS, for U.S. Environmental Protection Agency, Region 7, Kansas City, KS. April.
U.S. EPA (Environmental Protection Agency). 2009e. Omaha Lead Site, Operable Unit 02, Final Record of Decision. U.S. Environmental Protection Agency, Region 7, Kansas City, KS. May 13.
Ormet (OHD004379970) U.S. EPA (Environmental Protection Agency). 1994. EPA Superfund Record of Decision: Ormet
Corp., EPA ID: OHD004379970, OU 01, Hannibal, OH, 09/12/1994. EPA/ROD/R05-94/259. U.S. Environmental Protection Agency, Region 5, Chicago, IL. September 12.
U.S. EPA (Environmental Protection Agency). 2002. First Five-Year Review Report for Ormet Corp. Superfund Site, Hannibal, Monroe County, Ohio. U.S. Environmental Protection Agency, Region 5, Chicago, IL. April.
U.S. EPA (Environmental Protection Agency). 2007. Second Five-Year Review Report for Ormet Corp. Superfund Site, Monroe County, Ohio. U.S. Environmental Protection Agency, Region 5, Chicago, IL. May.
Palmerton (PAD002395887) U.S. EPA (Environmental Protection Agency). 1987. EPA Superfund Record of Decision:
Palmerton Zinc Pile EPA ID: PAD002395887 OU 01 Palmerton, PA 09/04/1987. EPA/ROD/R03-87/036. U.S. Environmental Protection Agency, Region 3, Philadelphia, PA. September.
U.S. EPA (Environmental Protection Agency). 1988. EPA Superfund Record of Decision: Palmerton Zinc Pile EPA ID: PAD002395887 OU 02 Palmerton, PA 06/29/1988. EPA/ROD/R03-88/063. U.S. Environmental Protection Agency, Region 3, Philadelphia, PA. June.
U.S. EPA (Environmental Protection Agency). 1998. Final Risk Assessment Report for the Palmerton Zinc Site, Palmerton, Pennsylvania. Prepared by CDM Federal Programs Corporation, Wayne, PA, for U.S. Environmental Protection Agency, Region 3, Philadelphia, PA. May.
9/23/2016
B3-16
U.S. EPA (Environmental Protection Agency). 2000. Feasibility Study Report for the Palmerton Zinc Site Residential Soil and Household Dust, Operable Unit (OU 3), Palmerton, Pennsylvania. Prepared by Black and Veatch Special Projects, Corp., Philadelphia, PA, for U.S. Environmental Protection Agency, Region 3, Philadelphia, PA. May.
U.S. EPA (Environmental Protection Agency). 2001a. Final Draft, Palmerton Zinc Site Ecological Risk Assessment, Volume 1: Executive Summary and Problem Formulation. U.S. Environmental Protection Agency, Region 3, Philadelphia, PA. February.
U.S. EPA (Environmental Protection Agency). 2001b. Final Draft, Palmerton Zinc Site Ecological Risk Assessment, Volume 2: Aquatic Community Endpoints. U.S. Environmental Protection Agency, Region 3, Philadelphia, PA. February.
U.S. EPA (Environmental Protection Agency). 2001c. Final Draft, Palmerton Zinc Site Ecological Risk Assessment, Volume 3: Terrestrial Community Endpoints. U.S. Environmental Protection Agency, Region 3, Philadelphia, PA. February.
U.S. EPA (Environmental Protection Agency). 2001d. Final Draft, Palmerton Zinc Site Ecological Risk Assessment, Volume 4: Project Summary, Uncertainty and Wetland Community Endpoints. U.S. Environmental Protection Agency, Region 3, Philadelphia, PA. February.
U.S. EPA (Environmental Protection Agency). 2001e. Final Draft, Palmerton Zinc Site Ecological Risk Assessment, Volume 5: Appendices A and B. U.S. Environmental Protection Agency, Region 3, Philadelphia, PA. February.
U.S. EPA (Environmental Protection Agency). 2001f. Final Draft, Palmerton Zinc Site Ecological Risk Assessment, Volume 6: Appendix C. U.S. Environmental Protection Agency, Region 3, Philadelphia, PA. February.
U.S. EPA (Environmental Protection Agency). 2001g. Final Draft, Palmerton Zinc Site Ecological Risk Assessment, Volume 7: Appendices D through K. U.S. Environmental Protection Agency, Region 3, Philadelphia, PA. February.
U.S. EPA (Environmental Protection Agency). 2001h. Record of Decision: Palmerton Zinc Pile Superfund Site, Operable Unit #3, Community Soils, Palmerton, Carbon County, Pennsylvania. U.S. Environmental Protection Agency, Region 3, Philadelphia, PA. October.
U.S. EPA (Environmental Protection Agency). 2002a. Second Five-Year Review Report, Palmerton Zinc Pile Superfund Site, Palmerton, Carbon County, Pennsylvania. U.S. Environmental Protection Agency, Region 3, Philadelphia, PA. February.
U.S. EPA (Environmental Protection Agency). 2002b. EPA Superfund Explanation of Significant Differences: Palmerton Zinc Pile EPA ID: PAD002395887 OU 02 Palmerton, PA 08/27/2002. EPA/ESD/R03-02/058. U.S. Environmental Protection Agency, Region 3, Philadelphia, PA. February.
9/23/2016
B3-17
U.S. EPA (Environmental Protection Agency). 2002c. EPA Superfund Record of Decision: Palmerton Zinc Pile EPA ID: PAD002395887 OU 03 Palmerton, PA 10/09/2001. EPA/ROD/R03-88/063. U.S. Environmental Protection Agency, Region 3, Philadelphia, PA. October.
U.S. EPA (Environmental Protection Agency). 2007. Third Five-Year Review Report for Palmerton Zinc Pile Superfund Site, Palmerton, Carbon County, PA. U.S. Environmental Protection Agency, Region 3, Philadelphia, PA. September.
Reynolds (ORD009412677) RMC (Reynolds Metals Company). 2006a.. Post-Demolition Residual Remedial Investigation
Report. Reynolds Metals Company, Troutdale Facility. June.
RMC (Reynolds Metals Company). 2006b. Post-Demolition Residual Risk Assessment. Reynolds Metals Company, Troutdale Facility. June.
U.S. EPA (Environmental Protection Agency). 2002. Reynolds Metals Company (RMC) Superfund Site Troutdale, Oregon, Record of Decision for Interim Remedial Action. U.S. Environmental Protection Agency, Region 10, Seattle, WA. September 30.
U.S. EPA (Environmental Protection Agency). 2006. Reynolds Metals Company Superfund Site, Troutdale, Oregon, Record of Decision for Final Remedial Action. U.S. Environmental Protection Agency, Region 10, Seattle, WA. September 29.
U.S. EPA (Environmental Protection Agency). 2008. Five-Year Review Report, First Five-Year Review Report for Reynolds Metals Superfund Site, City of Troutdale Multnomah County, Oregon. U.S. Environmental Protection Agency, Region 10, Seattle, WA. July.
Silver Mountain (WAD980722789) U.S. EPA (Environmental Protection Agency). 1990a. Declaration for the Silver Mountain Mine
Superfund Site, Record of Decision, Silver Mountain Mine, Okanogan County, Washington. U.S. Environmental Protection Agency, Region 10, Seattle, WA. March.
U.S. EPA (Environmental Protection Agency). 1990b. EPA Superfund Record of Decision: Silver Mountain Mine, EPA ID: WAD980722789, OU 01, Loomis, WA, 03/27/1990. EPA/ROD/R10-90/022. U.S. Environmental Protection Agency, Region 10, Seattle, WA. March 27.
U.S. EPA (Environmental Protection Agency). 1995. EPA Superfund Explanation of Significant Differences: Silver Mountain Mine, EPA ID: WAD980722789, OU 01, Loomis, WA, 10/12/1994. EPA/ESD/R10-95/116. U.S. Environmental Protection Agency, Region 10, Seattle, WA.
U.S. EPA (Environmental Protection Agency). 2002. Second 5-Year Review of the Silver Mountain Mine, Okanogan County, Washington. U.S. Environmental Protection Agency, Region 10, Seattle, WA. September.
9/23/2016
B3-18
U.S. EPA (Environmental Protection Agency). 2007. Third Five-Year Review of the Silver Mountain Mine Superfund Site, Okanogan County, Washington. U.S. Environmental Protection Agency, Region 10, Seattle, WA. September.
Stauffer (FLD010596013) U.S. EPA (Environmental Protection Agency). 1995. Revised Final Baseline Risk Assessment
Part A and B for Stauffer Chemical Company, Tarpon Springs, Florida. Prepared by Black & Veatch Waste Science, Inc., Atlanta, GA, for U.S. Environmental Protection Agency, Region 4, Waste Management Division, Atlanta, GA. July 21.
U.S. EPA (Environmental Protection Agency). 1998. EPA Superfund Record of Decision: Stauffer Chemical Co. (Tarpon Springs), EPA ID: FLD010596013, OU 01, Tarpon Springs, FL, 07/02/1998. EPA/ROD/R04-98/103. U.S. Environmental Protection Agency, Region 4, Atlanta, GA.
Weston. 1993. Weston. Stauffer Management Company, Tarpon Springs, Florida, Final Site Remedial Investigation Report, Volume I of V. Roy F. Weston, Inc., West Chester, PA. December.
Summitville (COD983778432) Colorado DPHE (Department of Public Health and Environment). 2005. Second Five-Year
Review, Summitville Mine Superfund Site, Rio Grande County, Colorado. Colorado Department of Public Health and Environment, Hazardous Materials and Waste Management Division, Denver, CO. September.
Colorado DPHE (Department of Public Health and Environment). 2010. Third Five-Year Review Report, Summitville Mine Superfund Site, Rio Grande County, Colorado. Colorado Department of Public Health and Environment, Hazardous Materials and Waste Management Division, Denver, CO. September.
U.S. EPA (Environmental Protection Agency). 1995a. EPA Superfund Record of Decision: Summitville Mine EPA ID: COD983778432 OU 00 Rio Grande County, CO 12/15/1994. EPA/ROD/R08-95/095. U.S. Environmental Protection Agency, Region 8, Denver, CO. January.
U.S. EPA (Environmental Protection Agency). 1995b. EPA Superfund Record of Decision: Summitville Mine EPA ID: COD983778432 OU 01 Heap Leach Pad, Rio Grande County, CO 12/15/1994. EPA/ROD/R08-95/096. U.S. Environmental Protection Agency, Region 8, Denver, CO.
U.S. EPA (Environmental Protection Agency). 1995c. EPA Superfund Record of Decision: Summitville Mine, EPA ID: COD983778432, OU 02, Cropsy Waste Pile, Beaver Mud Dump/Summitville Dam Impoundment, and Mine Pits, Rio Grande County, CO, 12/15/1994. EPA/ROD/R08-95/097. U.S. Environmental Protection Agency, Region 8, Denver, CO. January.
9/23/2016
B3-19
U.S. EPA (Environmental Protection Agency). 1995d. EPA Superfund Record of Decision: Summitville Mine EPA ID: COD983778432 OU 04 Rio Grande County, CO 12/15/1994. EPA/ROD/R08-95/098. U.S. Environmental Protection Agency, Region 8, Denver, CO. January.
U.S. EPA (Environmental Protection Agency). 2001a. Record of Decision for Summitville Mine Final Site-Wide Remedy Operable Unit 5, Summitville Mine Superfund Site, Rio Grande County, Colorado. U.S. Environmental Protection Agency, Region 8, Denver, CO.
U.S. EPA (Environmental Protection Agency). 2001b. EPA Superfund Record of Decision: Summitville Mine EPA ID: COD983778432 OU 05 Rio Grande County, CO 09/28/2001. EPA/ROD/R08-01/538. U.S. Environmental Protection Agency, Region 8, Denver, CO.
Teledyne Wah Chang (ORD050955848) U.S. EPA (Environmental Protection Agency). 1989. Record of Decision, Decision Summary,
and Responsiveness Summary for Interim Response Action, Teledyne Wah Chang Albany Superfund Site, Operable Unit #1 (Sludge Ponds Unit), Albany, Oregon. EPA/ROD/R10-90/021. U.S. Environmental Protection Agency, Region 10, Seattle, WA. December.
U.S. EPA (Environmental Protection Agency). 1990. EPA Superfund Record of Decision: Teledyne Wah Chang EPA ID: ORD050955848 OU 02 Albany, OR 12/28/1989. EPA/ROD/R10-90/021.U.S. Environmental Protection Agency, Region 10, Seattle, WA.
U.S. EPA (Environmental Protection Agency). 1994. EPA Superfund Record of Decision: Teledyne Wah Chang EPA ID: ORD050955848 OU 02 Albany, OR 06/10/1994. EPA/ROD/R10-94/078. U.S. Environmental Protection Agency, Region 10, Seattle, WA.
U.S. EPA (Environmental Protection Agency). 1995. EPA Superfund Record of Decision: Teledyne Wah Chang EPA ID: ORD050955848 OU 03 Albany, OR 09/27/1995. EPA/ROD/R10-95/125. U.S. Environmental Protection Agency, Region 10, Seattle, WA.
U.S. EPA (Environmental Protection Agency). 1997. EPA Superfund Explanation of Significant Differences: Teledyne Wah Chang, EPA ID: ORD050955848, OU 01, Albany, OR, 10/08/1996. EPA/ESD/R10-97/082. U.S. Environmental Protection Agency, Seattle, WA.
U.S. EPA (Environmental Protection Agency). 1998. EPA Superfund Explanation of Significant Differences for the Record of Decision: Teledyne Wah Chang Superfund Site Albany, OR 10/8/1996. EPA/514/R-97/082. U.S. Environmental Protection Agency, Office of Environmental Cleanup, Seattle, WA. January.
U.S. EPA (Environmental Protection Agency). 2001. EPA Superfund Explanation of Significant Differences: Teledyne Wah Chang, EPA ID: ORD050955848, OU 03, Albany, OR, 09/28/2001. EPA/ESD/R10-01/550. U.S. Environmental Protection Agency, Office of Environmental Cleanup¸ Seattle, WA. September.
9/23/2016
B3-20
U.S. EPA (Environmental Protection Agency). 2003. Second Five-Year Review Report for Teledyne Wah Chang Albany Superfund Site, Millersburg, Oregon. U.S. Environmental Protection Agency, Environmental Cleanup Division, Region 10, Seattle, WA. January.
U.S. EPA (Environmental Protection Agency). 2008. Final Third Five-Year Review Report for the Teledyne Wah Chang Superfund Site. U.S. Environmental Protection Agency, Region 10, Environmental Cleanup Division, Seattle, WA. January.
U.S. EPA (Environmental Protection Agency). 2009. Second Explanation of Significant Differences for the June 10, 1994, Record of Decision for the Final Remedial Action of the Groundwater and Sediments Operable Unit Teledyne Wah Chang Superfund Site, Albany, Oregon. U.S. Environmental Protection Agency, Region 10, Seattle, WA. June.
Tex Tin (TXD06211332) U.S. EPA (Environmental Protection Agency). 1999. EPA Superfund Record of Decision: Tex
Tin Corp. EPA ID: TXD062113329, OU 01, Texas City, Texas, 05/17/1999. EPA/ROD/R06-99/093. U.S. Environmental Protection Agency, Region 6, Dallas, TX. May 17.
U.S. EPA (Environmental Protection Agency). 2000a. Amended Record of Decision, Tex Tin Corporation Superfund Site, Operable Unit No. 1, Texas City, Galveston County, Texas. U.S. Environmental Protection Agency, Region 6, Dallas, TX. September.
U.S. EPA (Environmental Protection Agency). 2000b. Record of Decision, Tex Tin Corporation Superfund Site, Operable Unit No. 3 – Residential Property, La Marque, Galveston County, Texas. U.S. Environmental Protection Agency, Region 6, Dallas, TX. September.
U.S. EPA (Environmental Protection Agency). 2001a. Record of Decision, Tex Tin Corporation Superfund Site, Operable Unit No. 2 – Amoco Property, Texas City, Texas. U.S. Environmental Protection Agency, Region 6, Dallas, TX. September.
U.S. EPA (Environmental Protection Agency). 2001b. Record of Decision, Tex Tin Corporation Superfund Site, Operable Unit No. 4, Galveston County, Texas City, Texas. U.S. Environmental Protection Agency, Region 6, Dallas, TX. September.
U.S. EPA (Environmental Protection Agency). 2003. Five-Year Review Report, Tex Tin Corporation Superfund Site, Operable Unit No. 2, Texas City, Texas, Galveston County. U.S. Environmental Protection Agency, Region 6, Dallas, TX. September.
U.S. EPA (Environmental Protection Agency). 2005. Second Five-Year Review Report for the Tex Tin Corporation Superfund Site, Texas City, Galveston County, Texas. U.S. Environmental Protection Agency, Region 6, Dallas, TX. August.
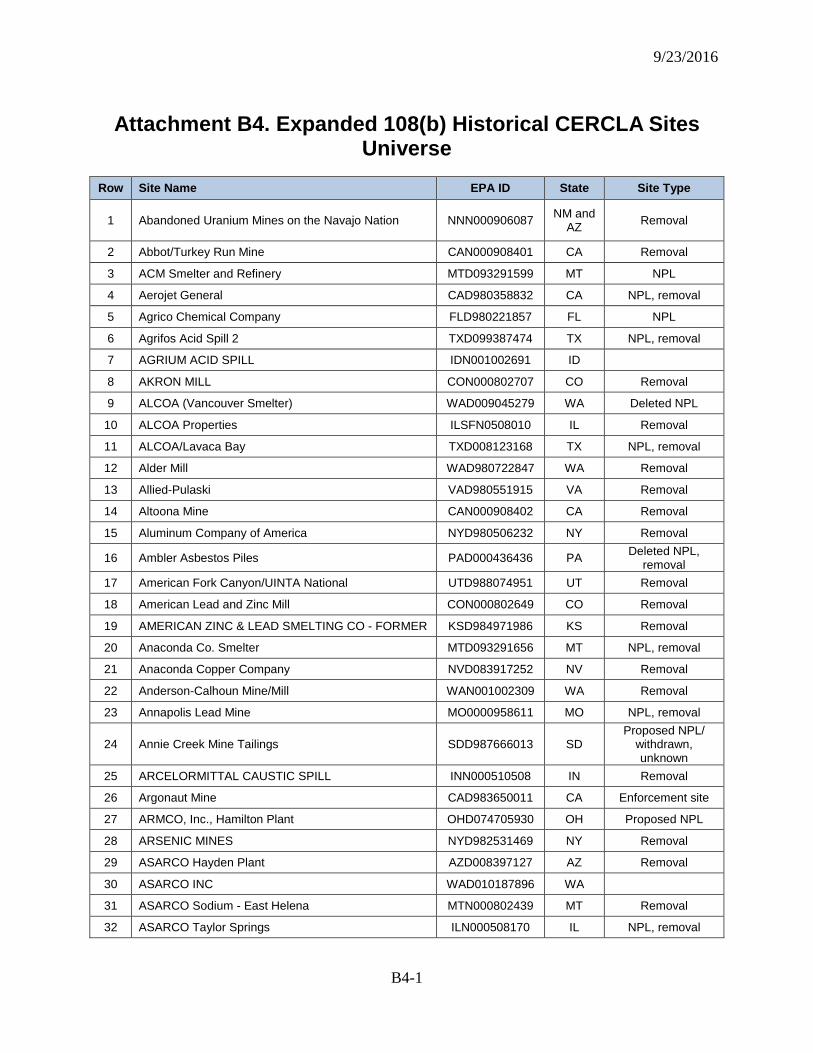
9/23/2016
B4-1
Attachment B4. Expanded 108(b) Historical CERCLA Sites Universe
Row Site Name EPA ID State Site Type
1 Abandoned Uranium Mines on the Navajo Nation NNN000906087 NM and AZ Removal
2 Abbot/Turkey Run Mine CAN000908401 CA Removal
3 ACM Smelter and Refinery MTD093291599 MT NPL
4 Aerojet General CAD980358832 CA NPL, removal
5 Agrico Chemical Company FLD980221857 FL NPL
6 Agrifos Acid Spill 2 TXD099387474 TX NPL, removal
7 AGRIUM ACID SPILL IDN001002691 ID
8 AKRON MILL CON000802707 CO Removal
9 ALCOA (Vancouver Smelter) WAD009045279 WA Deleted NPL
10 ALCOA Properties ILSFN0508010 IL Removal
11 ALCOA/Lavaca Bay TXD008123168 TX NPL, removal
12 Alder Mill WAD980722847 WA Removal
13 Allied-Pulaski VAD980551915 VA Removal
14 Altoona Mine CAN000908402 CA Removal
15 Aluminum Company of America NYD980506232 NY Removal
16 Ambler Asbestos Piles PAD000436436 PA Deleted NPL, removal
17 American Fork Canyon/UINTA National UTD988074951 UT Removal
18 American Lead and Zinc Mill CON000802649 CO Removal
19 AMERICAN ZINC & LEAD SMELTING CO - FORMER KSD984971986 KS Removal
20 Anaconda Co. Smelter MTD093291656 MT NPL, removal
21 Anaconda Copper Company NVD083917252 NV Removal
22 Anderson-Calhoun Mine/Mill WAN001002309 WA Removal
23 Annapolis Lead Mine MO0000958611 MO NPL, removal
24 Annie Creek Mine Tailings SDD987666013 SD Proposed NPL/
withdrawn, unknown
25 ARCELORMITTAL CAUSTIC SPILL INN000510508 IN Removal
26 Argonaut Mine CAD983650011 CA Enforcement site
27 ARMCO, Inc., Hamilton Plant OHD074705930 OH Proposed NPL
28 ARSENIC MINES NYD982531469 NY Removal
29 ASARCO Hayden Plant AZD008397127 AZ Removal
30 ASARCO INC WAD010187896 WA
31 ASARCO Sodium - East Helena MTN000802439 MT Removal
32 ASARCO Taylor Springs ILN000508170 IL NPL, removal
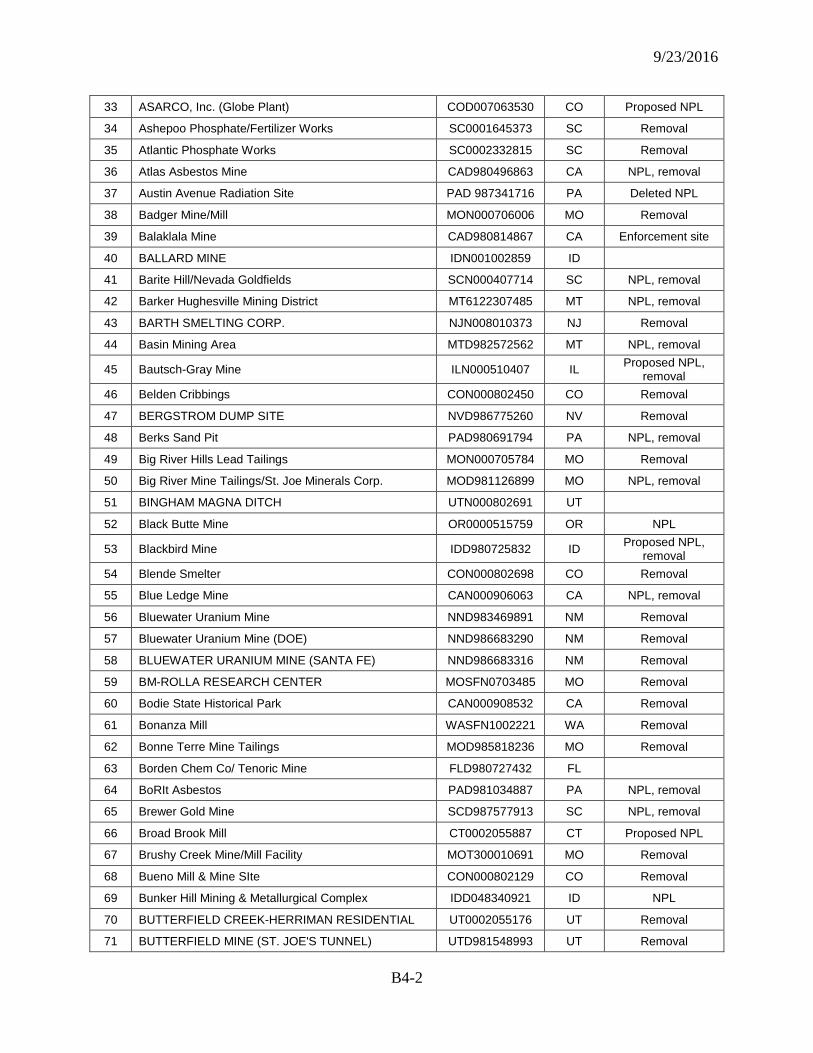
9/23/2016
B4-2
33 ASARCO, Inc. (Globe Plant) COD007063530 CO Proposed NPL
34 Ashepoo Phosphate/Fertilizer Works SC0001645373 SC Removal
35 Atlantic Phosphate Works SC0002332815 SC Removal
36 Atlas Asbestos Mine CAD980496863 CA NPL, removal
37 Austin Avenue Radiation Site PAD 987341716 PA Deleted NPL
38 Badger Mine/Mill MON000706006 MO Removal
39 Balaklala Mine CAD980814867 CA Enforcement site
40 BALLARD MINE IDN001002859 ID
41 Barite Hill/Nevada Goldfields SCN000407714 SC NPL, removal
42 Barker Hughesville Mining District MT6122307485 MT NPL, removal
43 BARTH SMELTING CORP. NJN008010373 NJ Removal
44 Basin Mining Area MTD982572562 MT NPL, removal
45 Bautsch-Gray Mine ILN000510407 IL Proposed NPL, removal
46 Belden Cribbings CON000802450 CO Removal
47 BERGSTROM DUMP SITE NVD986775260 NV Removal
48 Berks Sand Pit PAD980691794 PA NPL, removal
49 Big River Hills Lead Tailings MON000705784 MO Removal
50 Big River Mine Tailings/St. Joe Minerals Corp. MOD981126899 MO NPL, removal
51 BINGHAM MAGNA DITCH UTN000802691 UT
52 Black Butte Mine OR0000515759 OR NPL
53 Blackbird Mine IDD980725832 ID Proposed NPL, removal
54 Blende Smelter CON000802698 CO Removal
55 Blue Ledge Mine CAN000906063 CA NPL, removal
56 Bluewater Uranium Mine NND983469891 NM Removal
57 Bluewater Uranium Mine (DOE) NND986683290 NM Removal
58 BLUEWATER URANIUM MINE (SANTA FE) NND986683316 NM Removal
59 BM-ROLLA RESEARCH CENTER MOSFN0703485 MO Removal
60 Bodie State Historical Park CAN000908532 CA Removal
61 Bonanza Mill WASFN1002221 WA Removal
62 Bonne Terre Mine Tailings MOD985818236 MO Removal
63 Borden Chem Co/ Tenoric Mine FLD980727432 FL
64 BoRIt Asbestos PAD981034887 PA NPL, removal
65 Brewer Gold Mine SCD987577913 SC NPL, removal
66 Broad Brook Mill CT0002055887 CT Proposed NPL
67 Brushy Creek Mine/Mill Facility MOT300010691 MO Removal
68 Bueno Mill & Mine SIte CON000802129 CO Removal
69 Bunker Hill Mining & Metallurgical Complex IDD048340921 ID NPL
70 BUTTERFIELD CREEK-HERRIMAN RESIDENTIAL UT0002055176 UT Removal
71 BUTTERFIELD MINE (ST. JOE'S TUNNEL) UTD981548993 UT Removal
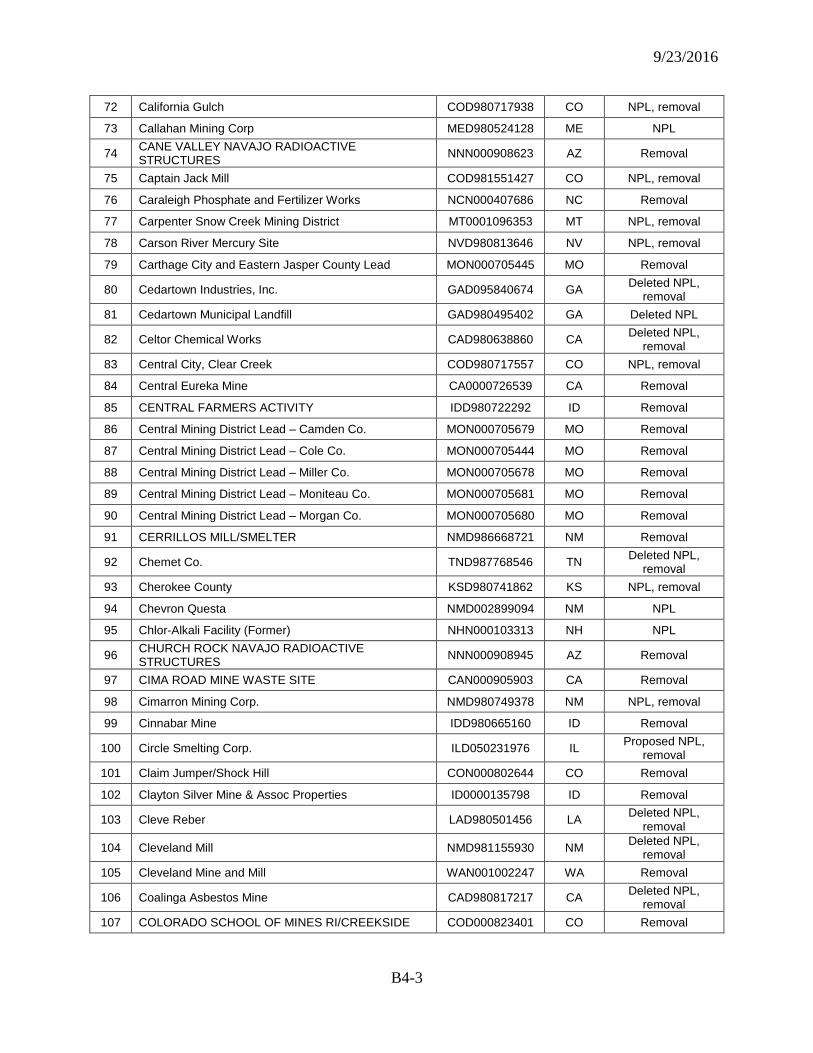
9/23/2016
B4-3
72 California Gulch COD980717938 CO NPL, removal
73 Callahan Mining Corp MED980524128 ME NPL
74 CANE VALLEY NAVAJO RADIOACTIVE STRUCTURES NNN000908623 AZ Removal
75 Captain Jack Mill COD981551427 CO NPL, removal
76 Caraleigh Phosphate and Fertilizer Works NCN000407686 NC Removal
77 Carpenter Snow Creek Mining District MT0001096353 MT NPL, removal
78 Carson River Mercury Site NVD980813646 NV NPL, removal
79 Carthage City and Eastern Jasper County Lead MON000705445 MO Removal
80 Cedartown Industries, Inc. GAD095840674 GA Deleted NPL, removal
81 Cedartown Municipal Landfill GAD980495402 GA Deleted NPL
82 Celtor Chemical Works CAD980638860 CA Deleted NPL, removal
83 Central City, Clear Creek COD980717557 CO NPL, removal
84 Central Eureka Mine CA0000726539 CA Removal
85 CENTRAL FARMERS ACTIVITY IDD980722292 ID Removal
86 Central Mining District Lead – Camden Co. MON000705679 MO Removal
87 Central Mining District Lead – Cole Co. MON000705444 MO Removal
88 Central Mining District Lead – Miller Co. MON000705678 MO Removal
89 Central Mining District Lead – Moniteau Co. MON000705681 MO Removal
90 Central Mining District Lead – Morgan Co. MON000705680 MO Removal
91 CERRILLOS MILL/SMELTER NMD986668721 NM Removal
92 Chemet Co. TND987768546 TN Deleted NPL, removal
93 Cherokee County KSD980741862 KS NPL, removal
94 Chevron Questa NMD002899094 NM NPL
95 Chlor-Alkali Facility (Former) NHN000103313 NH NPL
96 CHURCH ROCK NAVAJO RADIOACTIVE STRUCTURES NNN000908945 AZ Removal
97 CIMA ROAD MINE WASTE SITE CAN000905903 CA Removal
98 Cimarron Mining Corp. NMD980749378 NM NPL, removal
99 Cinnabar Mine IDD980665160 ID Removal
100 Circle Smelting Corp. ILD050231976 IL Proposed NPL, removal
101 Claim Jumper/Shock Hill CON000802644 CO Removal
102 Clayton Silver Mine & Assoc Properties ID0000135798 ID Removal
103 Cleve Reber LAD980501456 LA Deleted NPL, removal
104 Cleveland Mill NMD981155930 NM Deleted NPL, removal
105 Cleveland Mine and Mill WAN001002247 WA Removal
106 Coalinga Asbestos Mine CAD980817217 CA Deleted NPL, removal
107 COLORADO SCHOOL OF MINES RI/CREEKSIDE COD000823401 CO Removal
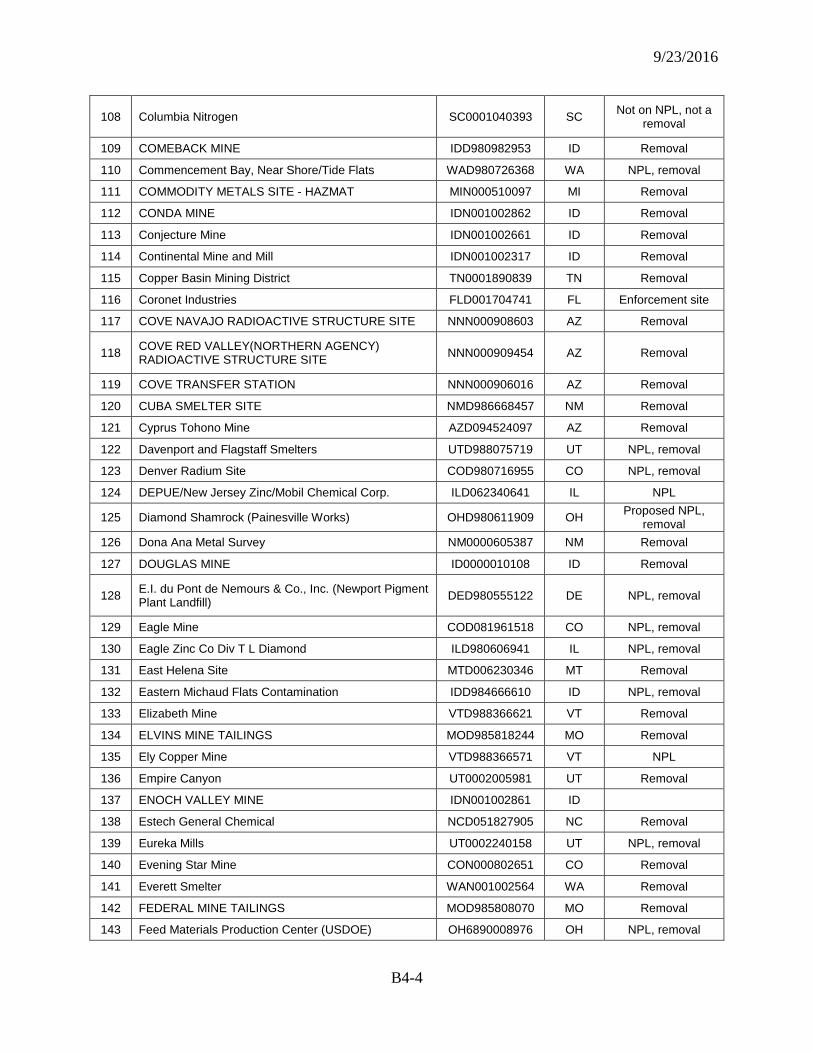
9/23/2016
B4-4
108 Columbia Nitrogen SC0001040393 SC Not on NPL, not a removal
109 COMEBACK MINE IDD980982953 ID Removal
110 Commencement Bay, Near Shore/Tide Flats WAD980726368 WA NPL, removal
111 COMMODITY METALS SITE - HAZMAT MIN000510097 MI Removal
112 CONDA MINE IDN001002862 ID Removal
113 Conjecture Mine IDN001002661 ID Removal
114 Continental Mine and Mill IDN001002317 ID Removal
115 Copper Basin Mining District TN0001890839 TN Removal
116 Coronet Industries FLD001704741 FL Enforcement site
117 COVE NAVAJO RADIOACTIVE STRUCTURE SITE NNN000908603 AZ Removal
118 COVE RED VALLEY(NORTHERN AGENCY) RADIOACTIVE STRUCTURE SITE NNN000909454 AZ Removal
119 COVE TRANSFER STATION NNN000906016 AZ Removal
120 CUBA SMELTER SITE NMD986668457 NM Removal
121 Cyprus Tohono Mine AZD094524097 AZ Removal
122 Davenport and Flagstaff Smelters UTD988075719 UT NPL, removal
123 Denver Radium Site COD980716955 CO NPL, removal
124 DEPUE/New Jersey Zinc/Mobil Chemical Corp. ILD062340641 IL NPL
125 Diamond Shamrock (Painesville Works) OHD980611909 OH Proposed NPL, removal
126 Dona Ana Metal Survey NM0000605387 NM Removal
127 DOUGLAS MINE ID0000010108 ID Removal
128 E.I. du Pont de Nemours & Co., Inc. (Newport Pigment Plant Landfill) DED980555122 DE NPL, removal
129 Eagle Mine COD081961518 CO NPL, removal
130 Eagle Zinc Co Div T L Diamond ILD980606941 IL NPL, removal
131 East Helena Site MTD006230346 MT Removal
132 Eastern Michaud Flats Contamination IDD984666610 ID NPL, removal
133 Elizabeth Mine VTD988366621 VT Removal
134 ELVINS MINE TAILINGS MOD985818244 MO Removal
135 Ely Copper Mine VTD988366571 VT NPL
136 Empire Canyon UT0002005981 UT Removal
137 ENOCH VALLEY MINE IDN001002861 ID
138 Estech General Chemical NCD051827905 NC Removal
139 Eureka Mills UT0002240158 UT NPL, removal
140 Evening Star Mine CON000802651 CO Removal
141 Everett Smelter WAN001002564 WA Removal
142 FEDERAL MINE TAILINGS MOD985808070 MO Removal
143 Feed Materials Production Center (USDOE) OH6890008976 OH NPL, removal
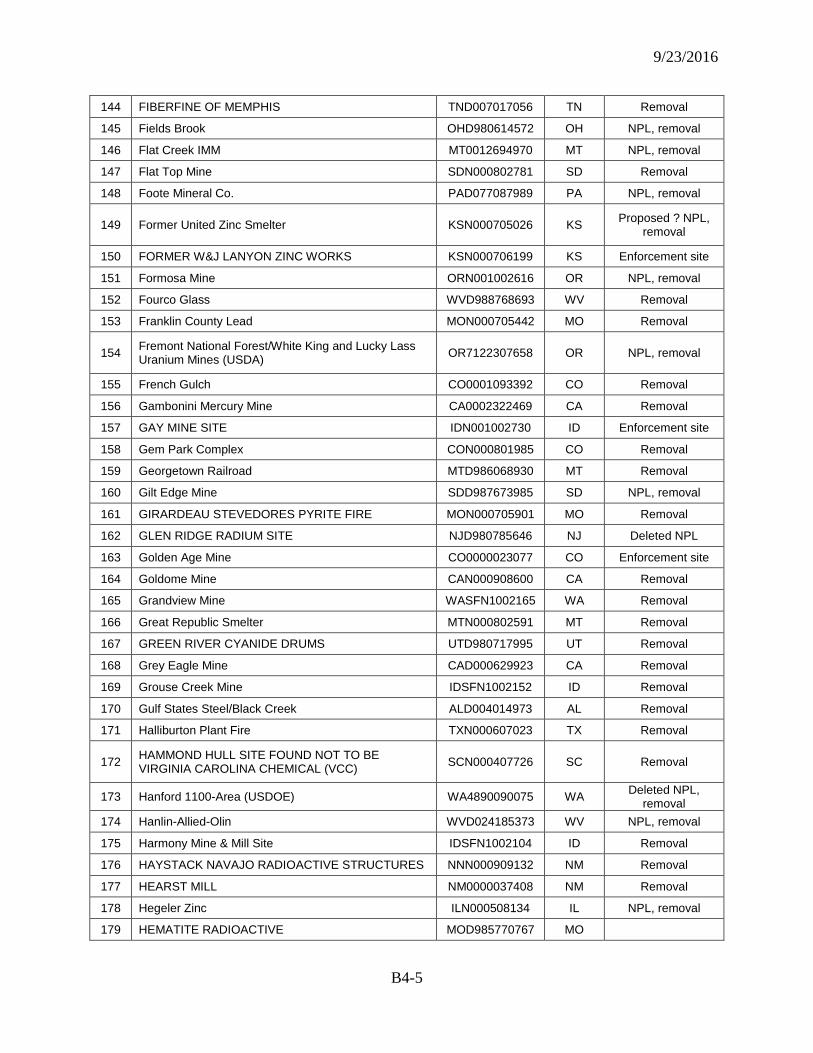
9/23/2016
B4-5
144 FIBERFINE OF MEMPHIS TND007017056 TN Removal
145 Fields Brook OHD980614572 OH NPL, removal
146 Flat Creek IMM MT0012694970 MT NPL, removal
147 Flat Top Mine SDN000802781 SD Removal
148 Foote Mineral Co. PAD077087989 PA NPL, removal
149 Former United Zinc Smelter KSN000705026 KS Proposed ? NPL, removal
150 FORMER W&J LANYON ZINC WORKS KSN000706199 KS Enforcement site
151 Formosa Mine ORN001002616 OR NPL, removal
152 Fourco Glass WVD988768693 WV Removal
153 Franklin County Lead MON000705442 MO Removal
154 Fremont National Forest/White King and Lucky Lass Uranium Mines (USDA) OR7122307658 OR NPL, removal
155 French Gulch CO0001093392 CO Removal
156 Gambonini Mercury Mine CA0002322469 CA Removal
157 GAY MINE SITE IDN001002730 ID Enforcement site
158 Gem Park Complex CON000801985 CO Removal
159 Georgetown Railroad MTD986068930 MT Removal
160 Gilt Edge Mine SDD987673985 SD NPL, removal
161 GIRARDEAU STEVEDORES PYRITE FIRE MON000705901 MO Removal
162 GLEN RIDGE RADIUM SITE NJD980785646 NJ Deleted NPL
163 Golden Age Mine CO0000023077 CO Enforcement site
164 Goldome Mine CAN000908600 CA Removal
165 Grandview Mine WASFN1002165 WA Removal
166 Great Republic Smelter MTN000802591 MT Removal
167 GREEN RIVER CYANIDE DRUMS UTD980717995 UT Removal
168 Grey Eagle Mine CAD000629923 CA Removal
169 Grouse Creek Mine IDSFN1002152 ID Removal
170 Gulf States Steel/Black Creek ALD004014973 AL Removal
171 Halliburton Plant Fire TXN000607023 TX Removal
172 HAMMOND HULL SITE FOUND NOT TO BE VIRGINIA CAROLINA CHEMICAL (VCC) SCN000407726 SC Removal
173 Hanford 1100-Area (USDOE) WA4890090075 WA Deleted NPL, removal
174 Hanlin-Allied-Olin WVD024185373 WV NPL, removal
175 Harmony Mine & Mill Site IDSFN1002104 ID Removal
176 HAYSTACK NAVAJO RADIOACTIVE STRUCTURES NNN000909132 NM Removal
177 HEARST MILL NM0000037408 NM Removal
178 Hegeler Zinc ILN000508134 IL NPL, removal
179 HEMATITE RADIOACTIVE MOD985770767 MO
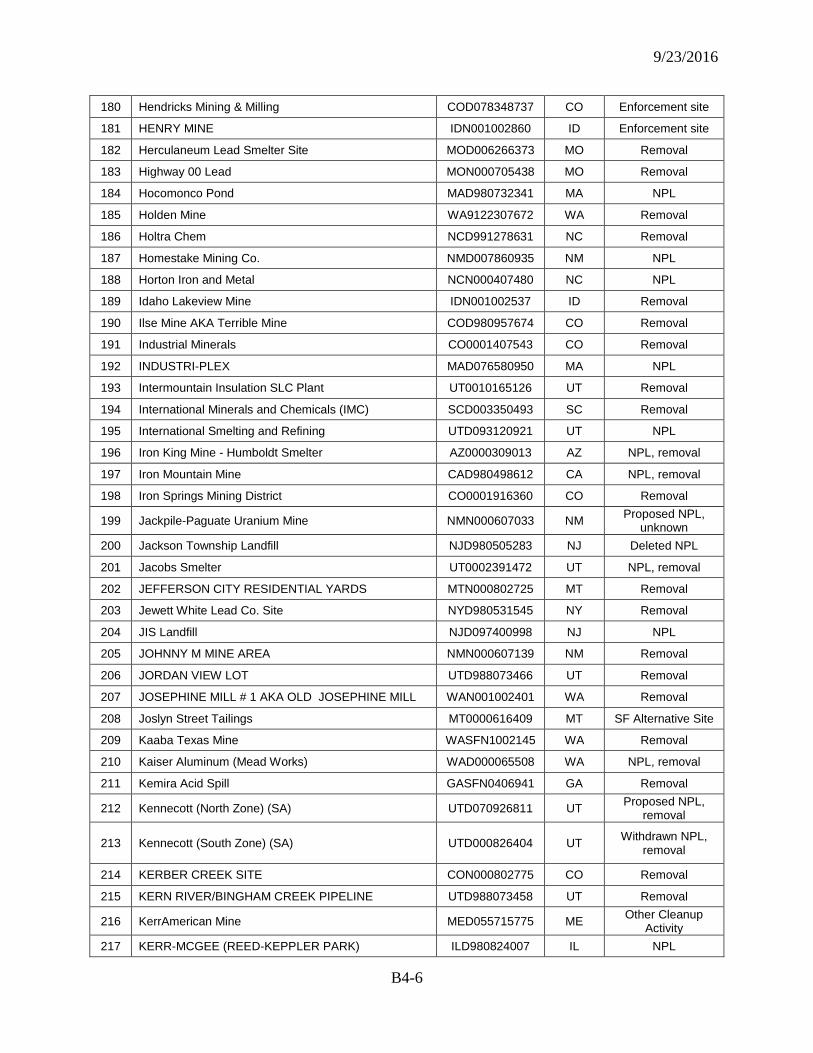
9/23/2016
B4-6
180 Hendricks Mining & Milling COD078348737 CO Enforcement site
181 HENRY MINE IDN001002860 ID Enforcement site
182 Herculaneum Lead Smelter Site MOD006266373 MO Removal
183 Highway 00 Lead MON000705438 MO Removal
184 Hocomonco Pond MAD980732341 MA NPL
185 Holden Mine WA9122307672 WA Removal
186 Holtra Chem NCD991278631 NC Removal
187 Homestake Mining Co. NMD007860935 NM NPL
188 Horton Iron and Metal NCN000407480 NC NPL
189 Idaho Lakeview Mine IDN001002537 ID Removal
190 Ilse Mine AKA Terrible Mine COD980957674 CO Removal
191 Industrial Minerals CO0001407543 CO Removal
192 INDUSTRI-PLEX MAD076580950 MA NPL
193 Intermountain Insulation SLC Plant UT0010165126 UT Removal
194 International Minerals and Chemicals (IMC) SCD003350493 SC Removal
195 International Smelting and Refining UTD093120921 UT NPL
196 Iron King Mine - Humboldt Smelter AZ0000309013 AZ NPL, removal
197 Iron Mountain Mine CAD980498612 CA NPL, removal
198 Iron Springs Mining District CO0001916360 CO Removal
199 Jackpile-Paguate Uranium Mine NMN000607033 NM Proposed NPL, unknown
200 Jackson Township Landfill NJD980505283 NJ Deleted NPL
201 Jacobs Smelter UT0002391472 UT NPL, removal
202 JEFFERSON CITY RESIDENTIAL YARDS MTN000802725 MT Removal
203 Jewett White Lead Co. Site NYD980531545 NY Removal
204 JIS Landfill NJD097400998 NJ NPL
205 JOHNNY M MINE AREA NMN000607139 NM Removal
206 JORDAN VIEW LOT UTD988073466 UT Removal
207 JOSEPHINE MILL # 1 AKA OLD JOSEPHINE MILL WAN001002401 WA Removal
208 Joslyn Street Tailings MT0000616409 MT SF Alternative Site
209 Kaaba Texas Mine WASFN1002145 WA Removal
210 Kaiser Aluminum (Mead Works) WAD000065508 WA NPL, removal
211 Kemira Acid Spill GASFN0406941 GA Removal
212 Kennecott (North Zone) (SA) UTD070926811 UT Proposed NPL, removal
213 Kennecott (South Zone) (SA) UTD000826404 UT Withdrawn NPL, removal
214 KERBER CREEK SITE CON000802775 CO Removal
215 KERN RIVER/BINGHAM CREEK PIPELINE UTD988073458 UT Removal
216 KerrAmerican Mine MED055715775 ME Other Cleanup Activity
217 KERR-MCGEE (REED-KEPPLER PARK) ILD980824007 IL NPL
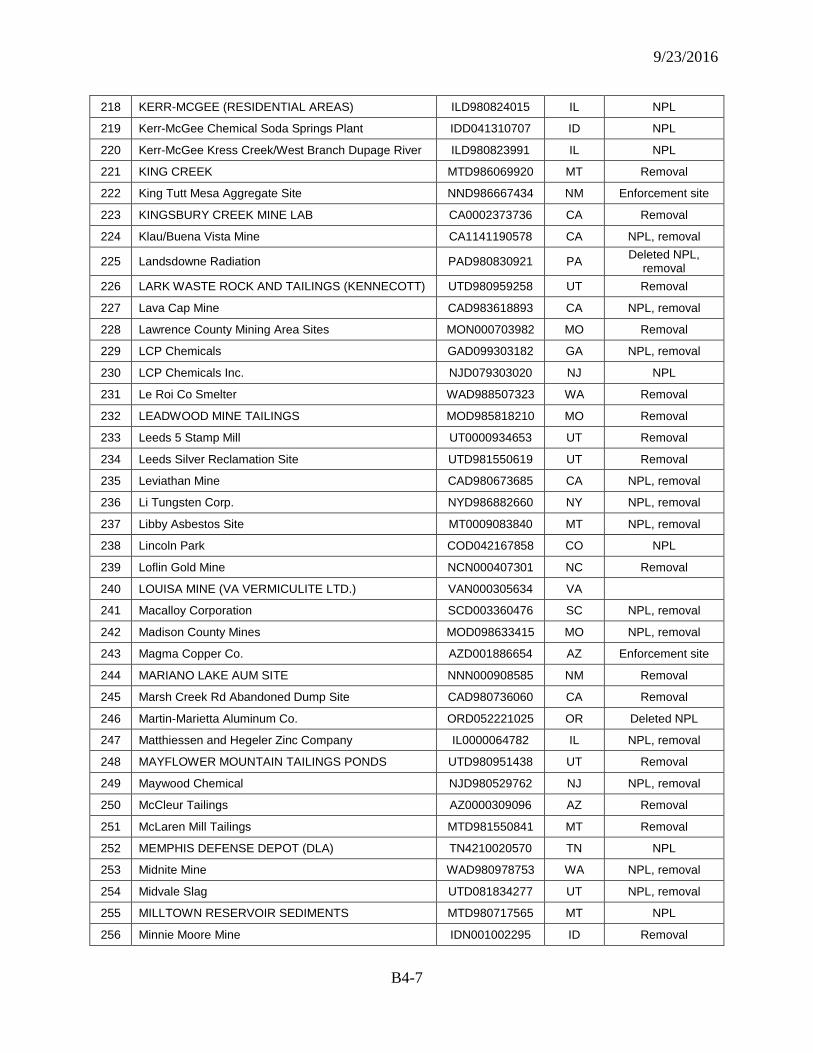
9/23/2016
B4-7
218 KERR-MCGEE (RESIDENTIAL AREAS) ILD980824015 IL NPL
219 Kerr-McGee Chemical Soda Springs Plant IDD041310707 ID NPL
220 Kerr-McGee Kress Creek/West Branch Dupage River ILD980823991 IL NPL
221 KING CREEK MTD986069920 MT Removal
222 King Tutt Mesa Aggregate Site NND986667434 NM Enforcement site
223 KINGSBURY CREEK MINE LAB CA0002373736 CA Removal
224 Klau/Buena Vista Mine CA1141190578 CA NPL, removal
225 Landsdowne Radiation PAD980830921 PA Deleted NPL, removal
226 LARK WASTE ROCK AND TAILINGS (KENNECOTT) UTD980959258 UT Removal
227 Lava Cap Mine CAD983618893 CA NPL, removal
228 Lawrence County Mining Area Sites MON000703982 MO Removal
229 LCP Chemicals GAD099303182 GA NPL, removal
230 LCP Chemicals Inc. NJD079303020 NJ NPL
231 Le Roi Co Smelter WAD988507323 WA Removal
232 LEADWOOD MINE TAILINGS MOD985818210 MO Removal
233 Leeds 5 Stamp Mill UT0000934653 UT Removal
234 Leeds Silver Reclamation Site UTD981550619 UT Removal
235 Leviathan Mine CAD980673685 CA NPL, removal
236 Li Tungsten Corp. NYD986882660 NY NPL, removal
237 Libby Asbestos Site MT0009083840 MT NPL, removal
238 Lincoln Park COD042167858 CO NPL
239 Loflin Gold Mine NCN000407301 NC Removal
240 LOUISA MINE (VA VERMICULITE LTD.) VAN000305634 VA
241 Macalloy Corporation SCD003360476 SC NPL, removal
242 Madison County Mines MOD098633415 MO NPL, removal
243 Magma Copper Co. AZD001886654 AZ Enforcement site
244 MARIANO LAKE AUM SITE NNN000908585 NM Removal
245 Marsh Creek Rd Abandoned Dump Site CAD980736060 CA Removal
246 Martin-Marietta Aluminum Co. ORD052221025 OR Deleted NPL
247 Matthiessen and Hegeler Zinc Company IL0000064782 IL NPL, removal
248 MAYFLOWER MOUNTAIN TAILINGS PONDS UTD980951438 UT Removal
249 Maywood Chemical NJD980529762 NJ NPL, removal
250 McCleur Tailings AZ0000309096 AZ Removal
251 McLaren Mill Tailings MTD981550841 MT Removal
252 MEMPHIS DEFENSE DEPOT (DLA) TN4210020570 TN NPL
253 Midnite Mine WAD980978753 WA NPL, removal
254 Midvale Slag UTD081834277 UT NPL, removal
255 MILLTOWN RESERVOIR SEDIMENTS MTD980717565 MT NPL
256 Minnie Moore Mine IDN001002295 ID Removal
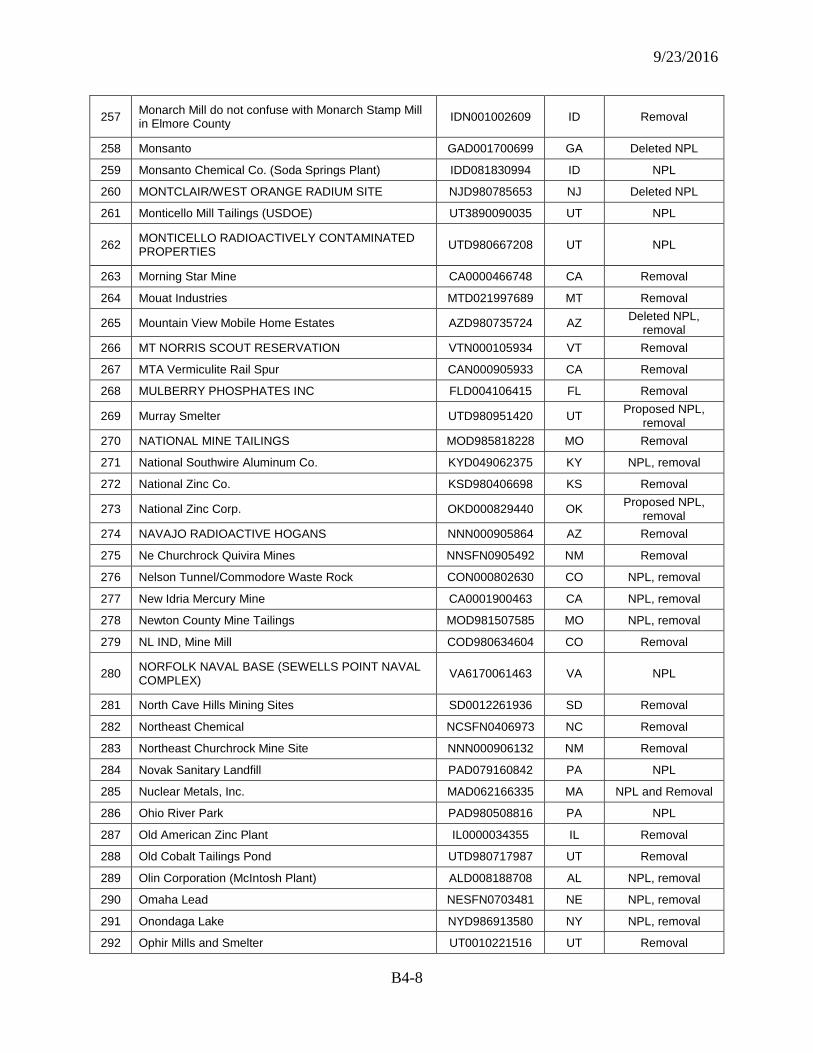
9/23/2016
B4-8
257 Monarch Mill do not confuse with Monarch Stamp Mill in Elmore County IDN001002609 ID Removal
258 Monsanto GAD001700699 GA Deleted NPL
259 Monsanto Chemical Co. (Soda Springs Plant) IDD081830994 ID NPL
260 MONTCLAIR/WEST ORANGE RADIUM SITE NJD980785653 NJ Deleted NPL
261 Monticello Mill Tailings (USDOE) UT3890090035 UT NPL
262 MONTICELLO RADIOACTIVELY CONTAMINATED PROPERTIES UTD980667208 UT NPL
263 Morning Star Mine CA0000466748 CA Removal
264 Mouat Industries MTD021997689 MT Removal
265 Mountain View Mobile Home Estates AZD980735724 AZ Deleted NPL, removal
266 MT NORRIS SCOUT RESERVATION VTN000105934 VT Removal
267 MTA Vermiculite Rail Spur CAN000905933 CA Removal
268 MULBERRY PHOSPHATES INC FLD004106415 FL Removal
269 Murray Smelter UTD980951420 UT Proposed NPL, removal
270 NATIONAL MINE TAILINGS MOD985818228 MO Removal
271 National Southwire Aluminum Co. KYD049062375 KY NPL, removal
272 National Zinc Co. KSD980406698 KS Removal
273 National Zinc Corp. OKD000829440 OK Proposed NPL, removal
274 NAVAJO RADIOACTIVE HOGANS NNN000905864 AZ Removal
275 Ne Churchrock Quivira Mines NNSFN0905492 NM Removal
276 Nelson Tunnel/Commodore Waste Rock CON000802630 CO NPL, removal
277 New Idria Mercury Mine CA0001900463 CA NPL, removal
278 Newton County Mine Tailings MOD981507585 MO NPL, removal
279 NL IND, Mine Mill COD980634604 CO Removal
280 NORFOLK NAVAL BASE (SEWELLS POINT NAVAL COMPLEX) VA6170061463 VA NPL
281 North Cave Hills Mining Sites SD0012261936 SD Removal
282 Northeast Chemical NCSFN0406973 NC Removal
283 Northeast Churchrock Mine Site NNN000906132 NM Removal
284 Novak Sanitary Landfill PAD079160842 PA NPL
285 Nuclear Metals, Inc. MAD062166335 MA NPL and Removal
286 Ohio River Park PAD980508816 PA NPL
287 Old American Zinc Plant IL0000034355 IL Removal
288 Old Cobalt Tailings Pond UTD980717987 UT Removal
289 Olin Corporation (McIntosh Plant) ALD008188708 AL NPL, removal
290 Omaha Lead NESFN0703481 NE NPL, removal
291 Onondaga Lake NYD986913580 NY NPL, removal
292 Ophir Mills and Smelter UT0010221516 UT Removal
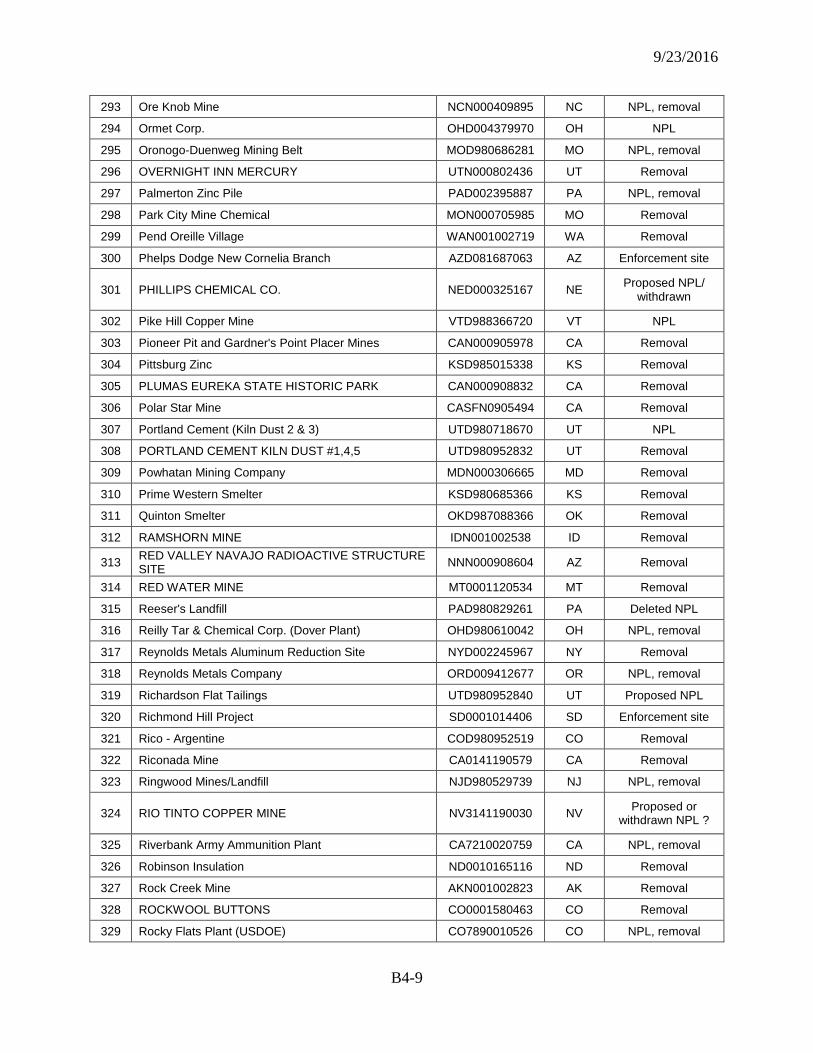
9/23/2016
B4-9
293 Ore Knob Mine NCN000409895 NC NPL, removal
294 Ormet Corp. OHD004379970 OH NPL
295 Oronogo-Duenweg Mining Belt MOD980686281 MO NPL, removal
296 OVERNIGHT INN MERCURY UTN000802436 UT Removal
297 Palmerton Zinc Pile PAD002395887 PA NPL, removal
298 Park City Mine Chemical MON000705985 MO Removal
299 Pend Oreille Village WAN001002719 WA Removal
300 Phelps Dodge New Cornelia Branch AZD081687063 AZ Enforcement site
301 PHILLIPS CHEMICAL CO. NED000325167 NE Proposed NPL/ withdrawn
302 Pike Hill Copper Mine VTD988366720 VT NPL
303 Pioneer Pit and Gardner's Point Placer Mines CAN000905978 CA Removal
304 Pittsburg Zinc KSD985015338 KS Removal
305 PLUMAS EUREKA STATE HISTORIC PARK CAN000908832 CA Removal
306 Polar Star Mine CASFN0905494 CA Removal
307 Portland Cement (Kiln Dust 2 & 3) UTD980718670 UT NPL
308 PORTLAND CEMENT KILN DUST #1,4,5 UTD980952832 UT Removal
309 Powhatan Mining Company MDN000306665 MD Removal
310 Prime Western Smelter KSD980685366 KS Removal
311 Quinton Smelter OKD987088366 OK Removal
312 RAMSHORN MINE IDN001002538 ID Removal
313 RED VALLEY NAVAJO RADIOACTIVE STRUCTURE SITE NNN000908604 AZ Removal
314 RED WATER MINE MT0001120534 MT Removal
315 Reeser's Landfill PAD980829261 PA Deleted NPL
316 Reilly Tar & Chemical Corp. (Dover Plant) OHD980610042 OH NPL, removal
317 Reynolds Metals Aluminum Reduction Site NYD002245967 NY Removal
318 Reynolds Metals Company ORD009412677 OR NPL, removal
319 Richardson Flat Tailings UTD980952840 UT Proposed NPL
320 Richmond Hill Project SD0001014406 SD Enforcement site
321 Rico - Argentine COD980952519 CO Removal
322 Riconada Mine CA0141190579 CA Removal
323 Ringwood Mines/Landfill NJD980529739 NJ NPL, removal
324 RIO TINTO COPPER MINE NV3141190030 NV Proposed or withdrawn NPL ?
325 Riverbank Army Ammunition Plant CA7210020759 CA NPL, removal
326 Robinson Insulation ND0010165116 ND Removal
327 Rock Creek Mine AKN001002823 AK Removal
328 ROCKWOOL BUTTONS CO0001580463 CO Removal
329 Rocky Flats Plant (USDOE) CO7890010526 CO NPL, removal
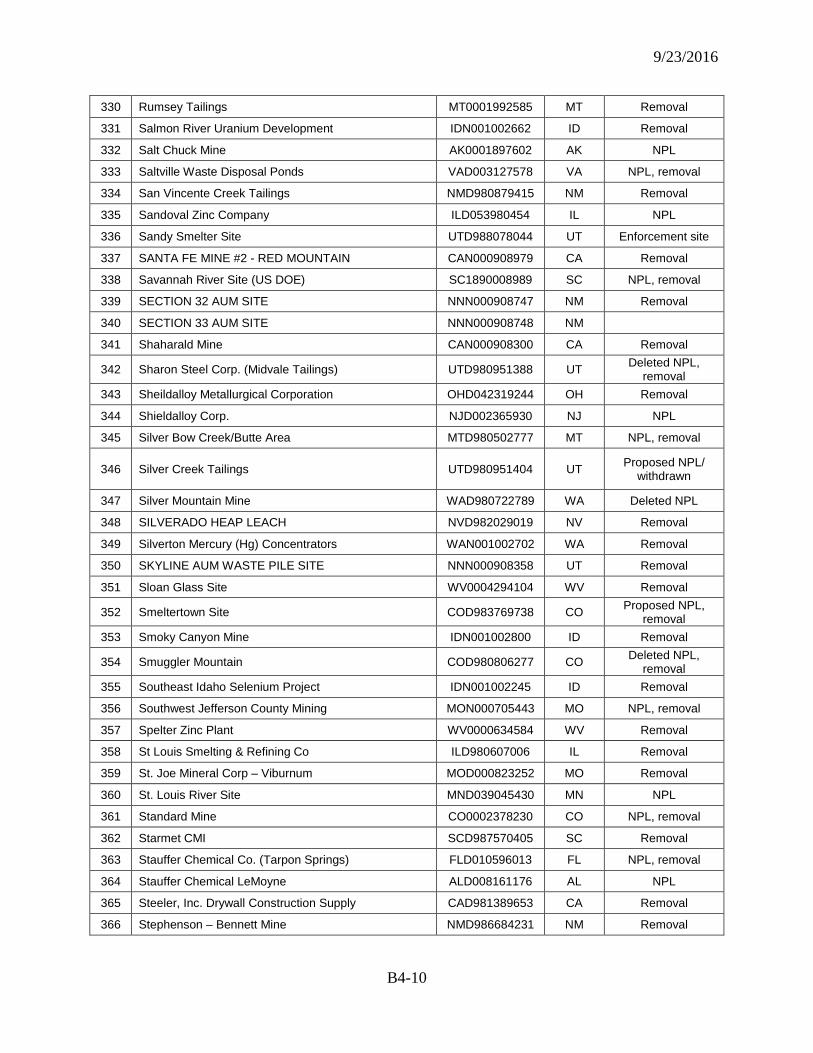
9/23/2016
B4-10
330 Rumsey Tailings MT0001992585 MT Removal
331 Salmon River Uranium Development IDN001002662 ID Removal
332 Salt Chuck Mine AK0001897602 AK NPL
333 Saltville Waste Disposal Ponds VAD003127578 VA NPL, removal
334 San Vincente Creek Tailings NMD980879415 NM Removal
335 Sandoval Zinc Company ILD053980454 IL NPL
336 Sandy Smelter Site UTD988078044 UT Enforcement site
337 SANTA FE MINE #2 - RED MOUNTAIN CAN000908979 CA Removal
338 Savannah River Site (US DOE) SC1890008989 SC NPL, removal
339 SECTION 32 AUM SITE NNN000908747 NM Removal
340 SECTION 33 AUM SITE NNN000908748 NM
341 Shaharald Mine CAN000908300 CA Removal
342 Sharon Steel Corp. (Midvale Tailings) UTD980951388 UT Deleted NPL, removal
343 Sheildalloy Metallurgical Corporation OHD042319244 OH Removal
344 Shieldalloy Corp. NJD002365930 NJ NPL
345 Silver Bow Creek/Butte Area MTD980502777 MT NPL, removal
346 Silver Creek Tailings UTD980951404 UT Proposed NPL/ withdrawn
347 Silver Mountain Mine WAD980722789 WA Deleted NPL
348 SILVERADO HEAP LEACH NVD982029019 NV Removal
349 Silverton Mercury (Hg) Concentrators WAN001002702 WA Removal
350 SKYLINE AUM WASTE PILE SITE NNN000908358 UT Removal
351 Sloan Glass Site WV0004294104 WV Removal
352 Smeltertown Site COD983769738 CO Proposed NPL, removal
353 Smoky Canyon Mine IDN001002800 ID Removal
354 Smuggler Mountain COD980806277 CO Deleted NPL, removal
355 Southeast Idaho Selenium Project IDN001002245 ID Removal
356 Southwest Jefferson County Mining MON000705443 MO NPL, removal
357 Spelter Zinc Plant WV0000634584 WV Removal
358 St Louis Smelting & Refining Co ILD980607006 IL Removal
359 St. Joe Mineral Corp – Viburnum MOD000823252 MO Removal
360 St. Louis River Site MND039045430 MN NPL
361 Standard Mine CO0002378230 CO NPL, removal
362 Starmet CMI SCD987570405 SC Removal
363 Stauffer Chemical Co. (Tarpon Springs) FLD010596013 FL NPL, removal
364 Stauffer Chemical LeMoyne ALD008161176 AL NPL
365 Steeler, Inc. Drywall Construction Supply CAD981389653 CA Removal
366 Stephenson – Bennett Mine NMD986684231 NM Removal
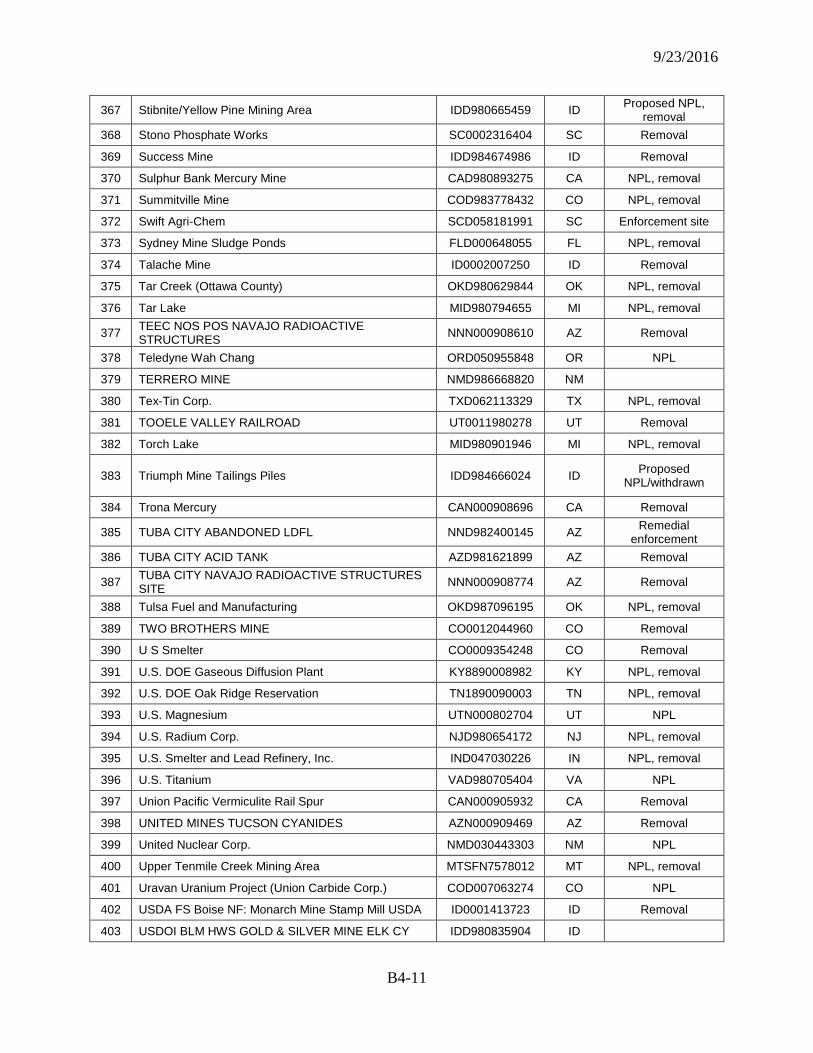
9/23/2016
B4-11
367 Stibnite/Yellow Pine Mining Area IDD980665459 ID Proposed NPL, removal
368 Stono Phosphate Works SC0002316404 SC Removal
369 Success Mine IDD984674986 ID Removal
370 Sulphur Bank Mercury Mine CAD980893275 CA NPL, removal
371 Summitville Mine COD983778432 CO NPL, removal
372 Swift Agri-Chem SCD058181991 SC Enforcement site
373 Sydney Mine Sludge Ponds FLD000648055 FL NPL, removal
374 Talache Mine ID0002007250 ID Removal
375 Tar Creek (Ottawa County) OKD980629844 OK NPL, removal
376 Tar Lake MID980794655 MI NPL, removal
377 TEEC NOS POS NAVAJO RADIOACTIVE STRUCTURES NNN000908610 AZ Removal
378 Teledyne Wah Chang ORD050955848 OR NPL
379 TERRERO MINE NMD986668820 NM
380 Tex-Tin Corp. TXD062113329 TX NPL, removal
381 TOOELE VALLEY RAILROAD UT0011980278 UT Removal
382 Torch Lake MID980901946 MI NPL, removal
383 Triumph Mine Tailings Piles IDD984666024 ID Proposed NPL/withdrawn
384 Trona Mercury CAN000908696 CA Removal
385 TUBA CITY ABANDONED LDFL NND982400145 AZ Remedial enforcement
386 TUBA CITY ACID TANK AZD981621899 AZ Removal
387 TUBA CITY NAVAJO RADIOACTIVE STRUCTURES SITE NNN000908774 AZ Removal
388 Tulsa Fuel and Manufacturing OKD987096195 OK NPL, removal
389 TWO BROTHERS MINE CO0012044960 CO Removal
390 U S Smelter CO0009354248 CO Removal
391 U.S. DOE Gaseous Diffusion Plant KY8890008982 KY NPL, removal
392 U.S. DOE Oak Ridge Reservation TN1890090003 TN NPL, removal
393 U.S. Magnesium UTN000802704 UT NPL
394 U.S. Radium Corp. NJD980654172 NJ NPL, removal
395 U.S. Smelter and Lead Refinery, Inc. IND047030226 IN NPL, removal
396 U.S. Titanium VAD980705404 VA NPL
397 Union Pacific Vermiculite Rail Spur CAN000905932 CA Removal
398 UNITED MINES TUCSON CYANIDES AZN000909469 AZ Removal
399 United Nuclear Corp. NMD030443303 NM NPL
400 Upper Tenmile Creek Mining Area MTSFN7578012 MT NPL, removal
401 Uravan Uranium Project (Union Carbide Corp.) COD007063274 CO NPL
402 USDA FS Boise NF: Monarch Mine Stamp Mill USDA ID0001413723 ID Removal
403 USDOI BLM HWS GOLD & SILVER MINE ELK CY IDD980835904 ID
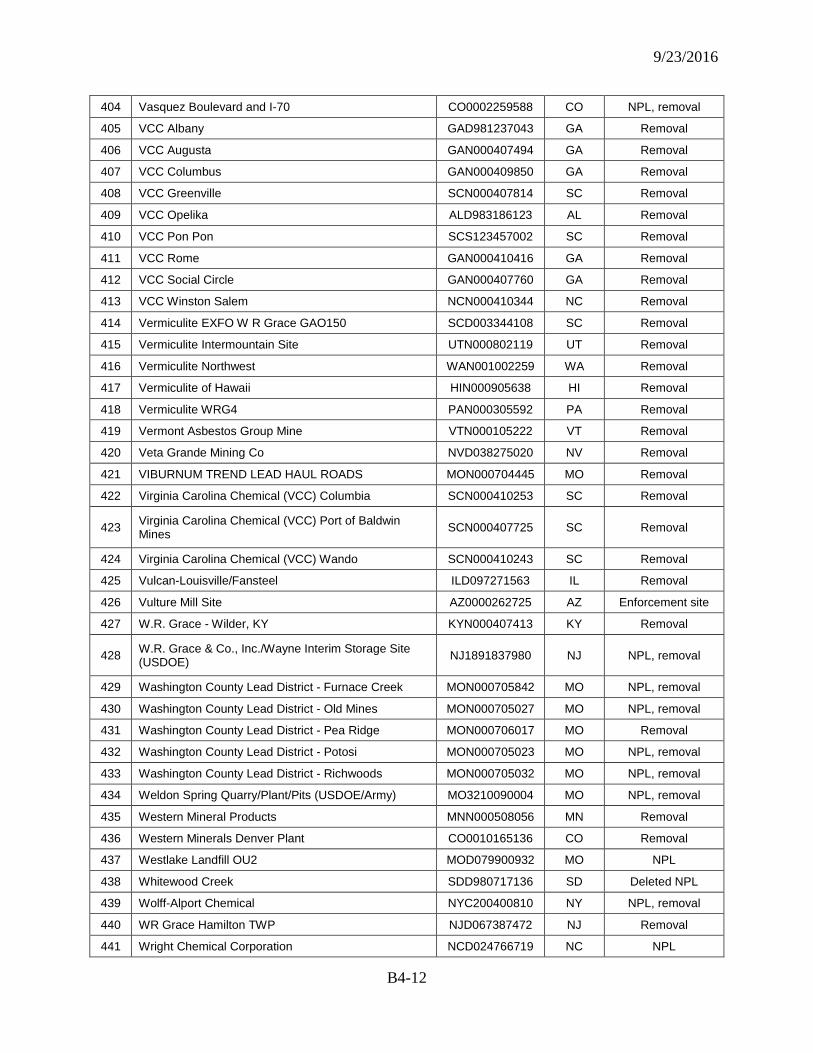
9/23/2016
B4-12
404 Vasquez Boulevard and I-70 CO0002259588 CO NPL, removal
405 VCC Albany GAD981237043 GA Removal
406 VCC Augusta GAN000407494 GA Removal
407 VCC Columbus GAN000409850 GA Removal
408 VCC Greenville SCN000407814 SC Removal
409 VCC Opelika ALD983186123 AL Removal
410 VCC Pon Pon SCS123457002 SC Removal
411 VCC Rome GAN000410416 GA Removal
412 VCC Social Circle GAN000407760 GA Removal
413 VCC Winston Salem NCN000410344 NC Removal
414 Vermiculite EXFO W R Grace GAO150 SCD003344108 SC Removal
415 Vermiculite Intermountain Site UTN000802119 UT Removal
416 Vermiculite Northwest WAN001002259 WA Removal
417 Vermiculite of Hawaii HIN000905638 HI Removal
418 Vermiculite WRG4 PAN000305592 PA Removal
419 Vermont Asbestos Group Mine VTN000105222 VT Removal
420 Veta Grande Mining Co NVD038275020 NV Removal
421 VIBURNUM TREND LEAD HAUL ROADS MON000704445 MO Removal
422 Virginia Carolina Chemical (VCC) Columbia SCN000410253 SC Removal
423 Virginia Carolina Chemical (VCC) Port of Baldwin Mines SCN000407725 SC Removal
424 Virginia Carolina Chemical (VCC) Wando SCN000410243 SC Removal
425 Vulcan-Louisville/Fansteel ILD097271563 IL Removal
426 Vulture Mill Site AZ0000262725 AZ Enforcement site
427 W.R. Grace - Wilder, KY KYN000407413 KY Removal
428 W.R. Grace & Co., Inc./Wayne Interim Storage Site (USDOE) NJ1891837980 NJ NPL, removal
429 Washington County Lead District - Furnace Creek MON000705842 MO NPL, removal
430 Washington County Lead District - Old Mines MON000705027 MO NPL, removal
431 Washington County Lead District - Pea Ridge MON000706017 MO Removal
432 Washington County Lead District - Potosi MON000705023 MO NPL, removal
433 Washington County Lead District - Richwoods MON000705032 MO NPL, removal
434 Weldon Spring Quarry/Plant/Pits (USDOE/Army) MO3210090004 MO NPL, removal
435 Western Mineral Products MNN000508056 MN Removal
436 Western Minerals Denver Plant CO0010165136 CO Removal
437 Westlake Landfill OU2 MOD079900932 MO NPL
438 Whitewood Creek SDD980717136 SD Deleted NPL
439 Wolff-Alport Chemical NYC200400810 NY NPL, removal
440 WR Grace Hamilton TWP NJD067387472 NJ Removal
441 Wright Chemical Corporation NCD024766719 NC NPL

9/23/2016
B4-13
442 Wrigley Charcoal Plant TND980844781 TN NPL, removal
443 YOUNG AMERICA MINE WASFN1002166 WA Removal
444 Yttrium Processing Plant WYD982587461 WY Removal
445 Zeibright Mine CAN000905925 CA Removal
446 Zonolite Road GAO 144 GAN000410399 GA Removal
447 Zonolite/W.R. Grace MASFN0103055 MA Removal
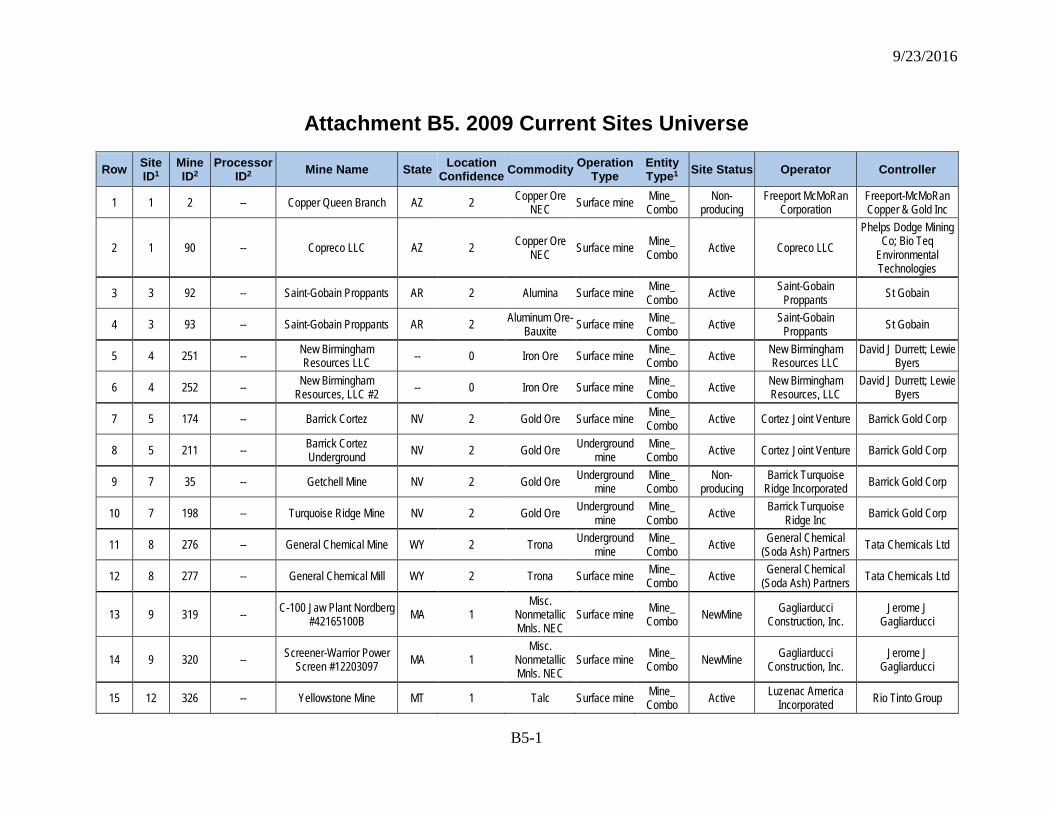
9/23/2016
B5-1
Attachment B5. 2009 Current Sites Universe
Row Site ID1
Mine ID2
Processor ID2 Mine Name State Location
Confidence Commodity Operation Type
Entity Type1 Site Status Operator Controller
1 1 2 -- Copper Queen Branch AZ 2 Copper Ore NEC Surface mine Mine_
Combo Non-
producing Freeport McMoRan
Corporation Freeport-McMoRan Copper & Gold Inc
2 1 90 -- Copreco LLC AZ 2 Copper Ore NEC Surface mine Mine_
Combo Active Copreco LLC Phelps Dodge Mining
Co; Bio Teq Environmental Technologies
3 3 92 -- Saint-Gobain Proppants AR 2 Alumina Surface mine Mine_ Combo Active Saint-Gobain
Proppants St Gobain
4 3 93 -- Saint-Gobain Proppants AR 2 Aluminum Ore-Bauxite Surface mine Mine_
Combo Active Saint-Gobain Proppants St Gobain
5 4 251 -- New Birmingham Resources LLC -- 0 Iron Ore Surface mine Mine_
Combo Active New Birmingham Resources LLC
David J Durrett; Lewie Byers
6 4 252 -- New Birmingham Resources, LLC #2 -- 0 Iron Ore Surface mine Mine_
Combo Active New Birmingham Resources, LLC
David J Durrett; Lewie Byers
7 5 174 -- Barrick Cortez NV 2 Gold Ore Surface mine Mine_ Combo Active Cortez Joint Venture Barrick Gold Corp
8 5 211 -- Barrick Cortez Underground NV 2 Gold Ore Underground
mine Mine_ Combo Active Cortez Joint Venture Barrick Gold Corp
9 7 35 -- Getchell Mine NV 2 Gold Ore Underground mine
Mine_ Combo
Non-producing
Barrick Turquoise Ridge Incorporated Barrick Gold Corp
10 7 198 -- Turquoise Ridge Mine NV 2 Gold Ore Underground mine
Mine_ Combo Active Barrick Turquoise
Ridge Inc Barrick Gold Corp
11 8 276 -- General Chemical Mine WY 2 Trona Underground mine
Mine_ Combo Active General Chemical
(Soda Ash) Partners Tata Chemicals Ltd
12 8 277 -- General Chemical Mill WY 2 Trona Surface mine Mine_ Combo Active General Chemical
(Soda Ash) Partners Tata Chemicals Ltd
13 9 319 -- C-100 Jaw Plant Nordberg #42165100B MA 1
Misc. Nonmetallic Mnls. NEC
Surface mine Mine_ Combo NewMine Gagliarducci
Construction, Inc. Jerome J
Gagliarducci
14 9 320 -- Screener-Warrior Power Screen #12203097 MA 1
Misc. Nonmetallic Mnls. NEC
Surface mine Mine_ Combo NewMine Gagliarducci
Construction, Inc. Jerome J
Gagliarducci
15 12 326 -- Yellowstone Mine MT 1 Talc Surface mine Mine_ Combo Active Luzenac America
Incorporated Rio Tinto Group
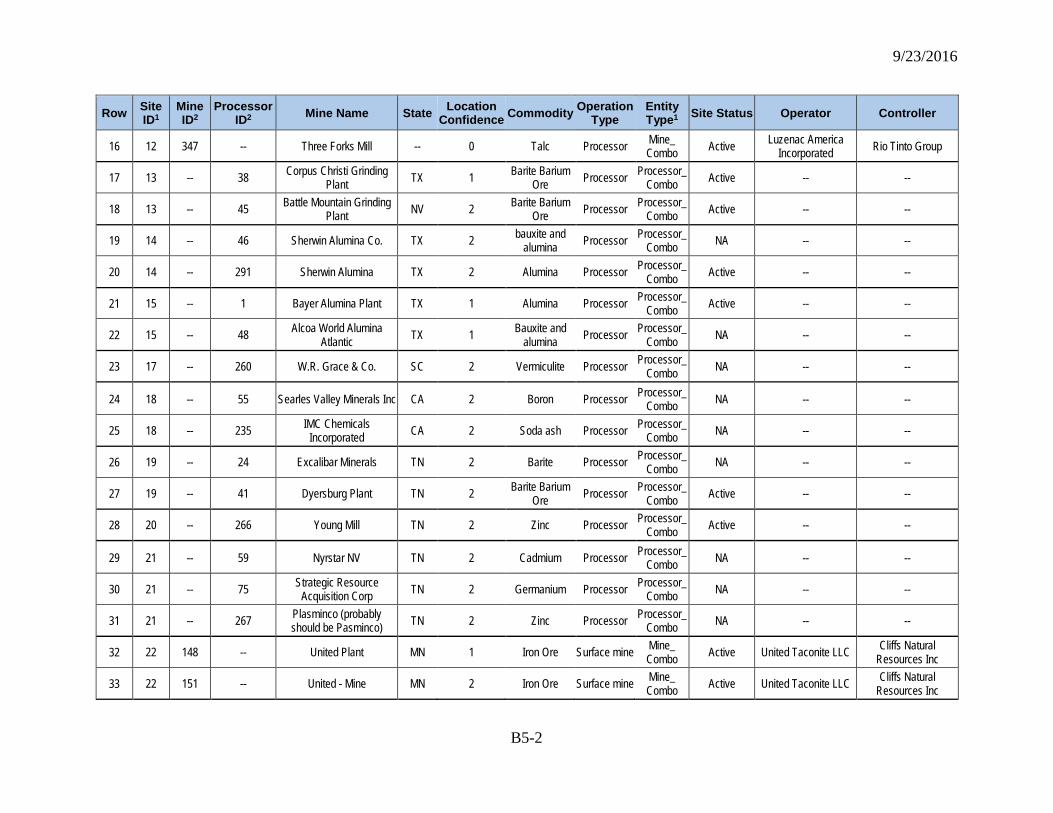
9/23/2016
B5-2
Row Site ID1
Mine ID2
Processor ID2 Mine Name State Location
Confidence Commodity Operation Type
Entity Type1 Site Status Operator Controller
16 12 347 -- Three Forks Mill -- 0 Talc Processor Mine_ Combo Active Luzenac America
Incorporated Rio Tinto Group
17 13 -- 38 Corpus Christi Grinding Plant TX 1 Barite Barium
Ore Processor Processor_Combo Active -- --
18 13 -- 45 Battle Mountain Grinding Plant NV 2 Barite Barium
Ore Processor Processor_Combo Active -- --
19 14 -- 46 Sherwin Alumina Co. TX 2 bauxite and alumina Processor Processor_
Combo NA -- --
20 14 -- 291 Sherwin Alumina TX 2 Alumina Processor Processor_Combo Active -- --
21 15 -- 1 Bayer Alumina Plant TX 1 Alumina Processor Processor_Combo Active -- --
22 15 -- 48 Alcoa World Alumina Atlantic TX 1 Bauxite and
alumina Processor Processor_Combo NA -- --
23 17 -- 260 W.R. Grace & Co. SC 2 Vermiculite Processor Processor_Combo NA -- --
24 18 -- 55 Searles Valley Minerals Inc CA 2 Boron Processor Processor_Combo NA -- --
25 18 -- 235 IMC Chemicals Incorporated CA 2 Soda ash Processor Processor_
Combo NA -- --
26 19 -- 24 Excalibar Minerals TN 2 Barite Processor Processor_Combo NA -- --
27 19 -- 41 Dyersburg Plant TN 2 Barite Barium Ore Processor Processor_
Combo Active -- --
28 20 -- 266 Young Mill TN 2 Zinc Processor Processor_Combo Active -- --
29 21 -- 59 Nyrstar NV TN 2 Cadmium Processor Processor_Combo NA -- --
30 21 -- 75 Strategic Resource Acquisition Corp TN 2 Germanium Processor Processor_
Combo NA -- --
31 21 -- 267 Plasminco (probably should be Pasminco) TN 2 Zinc Processor Processor_
Combo NA -- --
32 22 148 -- United Plant MN 1 Iron Ore Surface mine Mine_ Combo Active United Taconite LLC Cliffs Natural
Resources Inc
33 22 151 -- United - Mine MN 2 Iron Ore Surface mine Mine_ Combo Active United Taconite LLC Cliffs Natural
Resources Inc
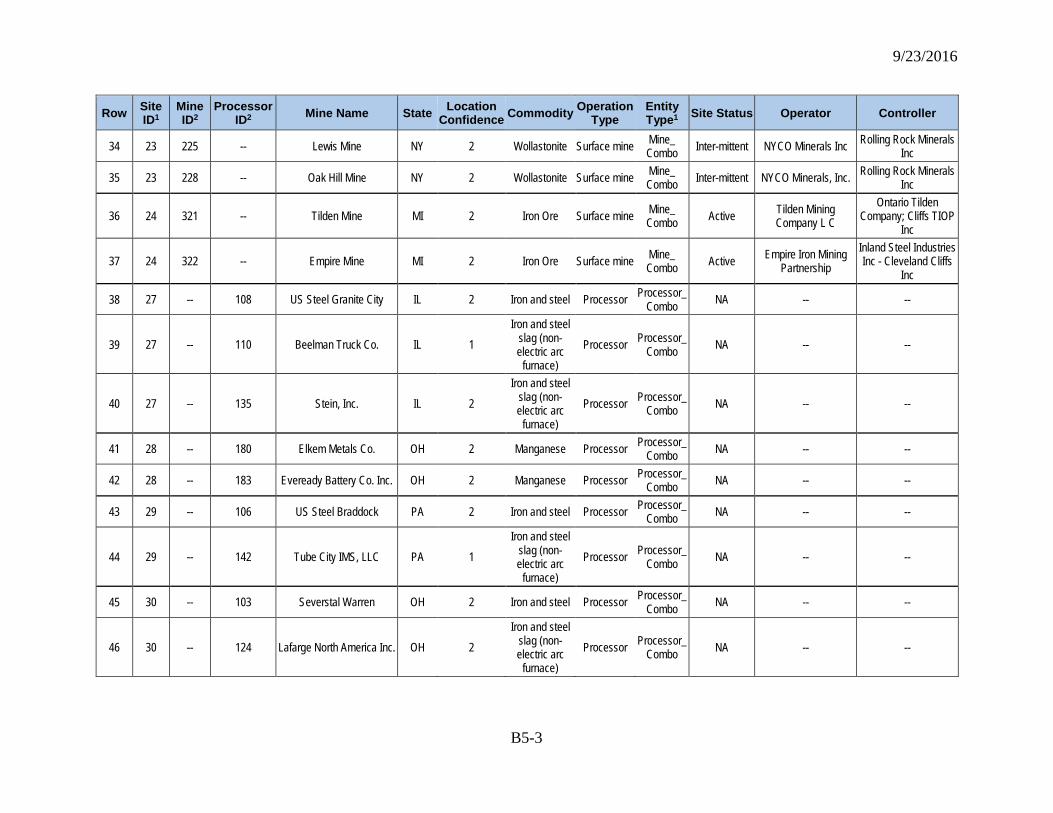
9/23/2016
B5-3
Row Site ID1
Mine ID2
Processor ID2 Mine Name State Location
Confidence Commodity Operation Type
Entity Type1 Site Status Operator Controller
34 23 225 -- Lewis Mine NY 2 Wollastonite Surface mine Mine_ Combo Inter-mittent NYCO Minerals Inc Rolling Rock Minerals
Inc
35 23 228 -- Oak Hill Mine NY 2 Wollastonite Surface mine Mine_ Combo Inter-mittent NYCO Minerals, Inc. Rolling Rock Minerals
Inc
36 24 321 -- Tilden Mine MI 2 Iron Ore Surface mine Mine_ Combo Active Tilden Mining
Company L C Ontario Tilden
Company; Cliffs TIOP Inc
37 24 322 -- Empire Mine MI 2 Iron Ore Surface mine Mine_ Combo Active Empire Iron Mining
Partnership Inland Steel Industries Inc - Cleveland Cliffs
Inc
38 27 -- 108 US Steel Granite City IL 2 Iron and steel Processor Processor_Combo NA -- --
39 27 -- 110 Beelman Truck Co. IL 1 Iron and steel
slag (non-electric arc
furnace) Processor Processor_
Combo NA -- --
40 27 -- 135 Stein, Inc. IL 2 Iron and steel
slag (non-electric arc
furnace) Processor Processor_
Combo NA -- --
41 28 -- 180 Elkem Metals Co. OH 2 Manganese Processor Processor_Combo NA -- --
42 28 -- 183 Eveready Battery Co. Inc. OH 2 Manganese Processor Processor_Combo NA -- --
43 29 -- 106 US Steel Braddock PA 2 Iron and steel Processor Processor_Combo NA -- --
44 29 -- 142 Tube City IMS, LLC PA 1 Iron and steel
slag (non-electric arc
furnace) Processor Processor_
Combo NA -- --
45 30 -- 103 Severstal Warren OH 2 Iron and steel Processor Processor_Combo NA -- --
46 30 -- 124 Lafarge North America Inc. OH 2 Iron and steel
slag (non-electric arc
furnace) Processor Processor_
Combo NA -- --
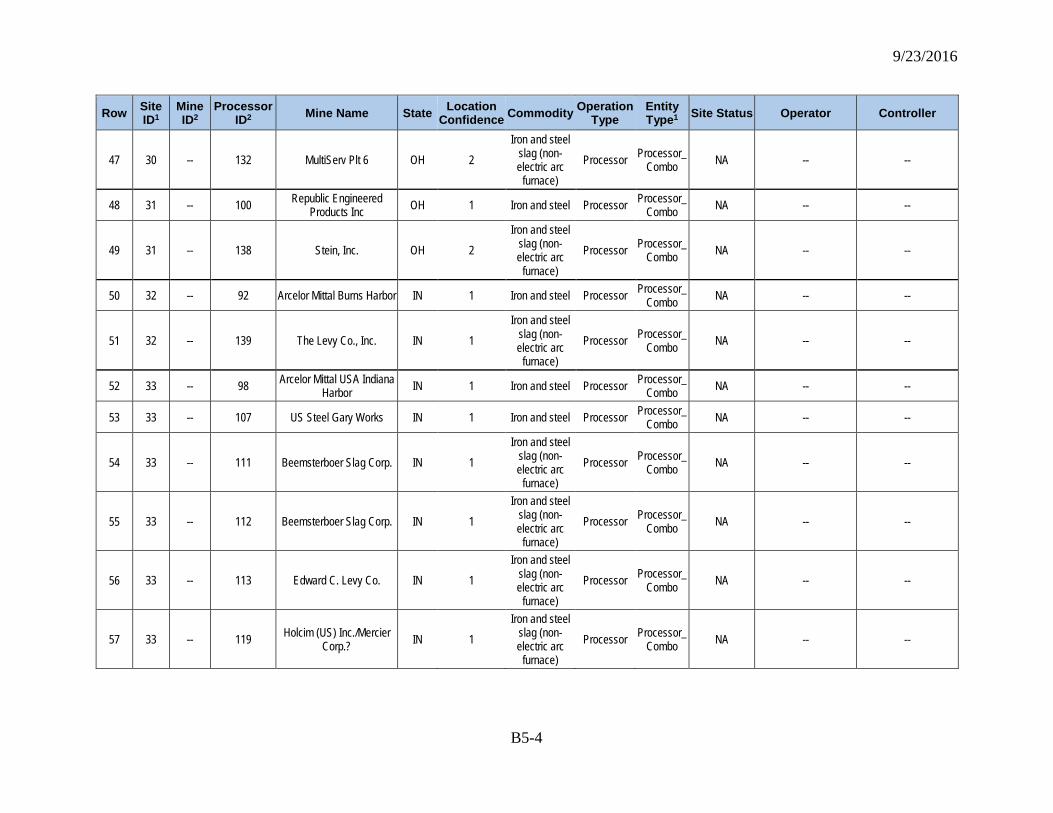
9/23/2016
B5-4
Row Site ID1
Mine ID2
Processor ID2 Mine Name State Location
Confidence Commodity Operation Type
Entity Type1 Site Status Operator Controller
47 30 -- 132 MultiServ Plt 6 OH 2 Iron and steel
slag (non-electric arc
furnace) Processor Processor_
Combo NA -- --
48 31 -- 100 Republic Engineered Products Inc OH 1 Iron and steel Processor Processor_
Combo NA -- --
49 31 -- 138 Stein, Inc. OH 2 Iron and steel
slag (non-electric arc
furnace) Processor Processor_
Combo NA -- --
50 32 -- 92 Arcelor Mittal Burns Harbor IN 1 Iron and steel Processor Processor_Combo NA -- --
51 32 -- 139 The Levy Co., Inc. IN 1 Iron and steel
slag (non-electric arc
furnace) Processor Processor_
Combo NA -- --
52 33 -- 98 Arcelor Mittal USA Indiana Harbor IN 1 Iron and steel Processor Processor_
Combo NA -- --
53 33 -- 107 US Steel Gary Works IN 1 Iron and steel Processor Processor_Combo NA -- --
54 33 -- 111 Beemsterboer Slag Corp. IN 1 Iron and steel
slag (non-electric arc
furnace) Processor Processor_
Combo NA -- --
55 33 -- 112 Beemsterboer Slag Corp. IN 1 Iron and steel
slag (non-electric arc
furnace) Processor Processor_
Combo NA -- --
56 33 -- 113 Edward C. Levy Co. IN 1 Iron and steel
slag (non-electric arc
furnace) Processor Processor_
Combo NA -- --
57 33 -- 119 Holcim (US) Inc./Mercier Corp.? IN 1
Iron and steel slag (non-electric arc
furnace) Processor Processor_
Combo NA -- --
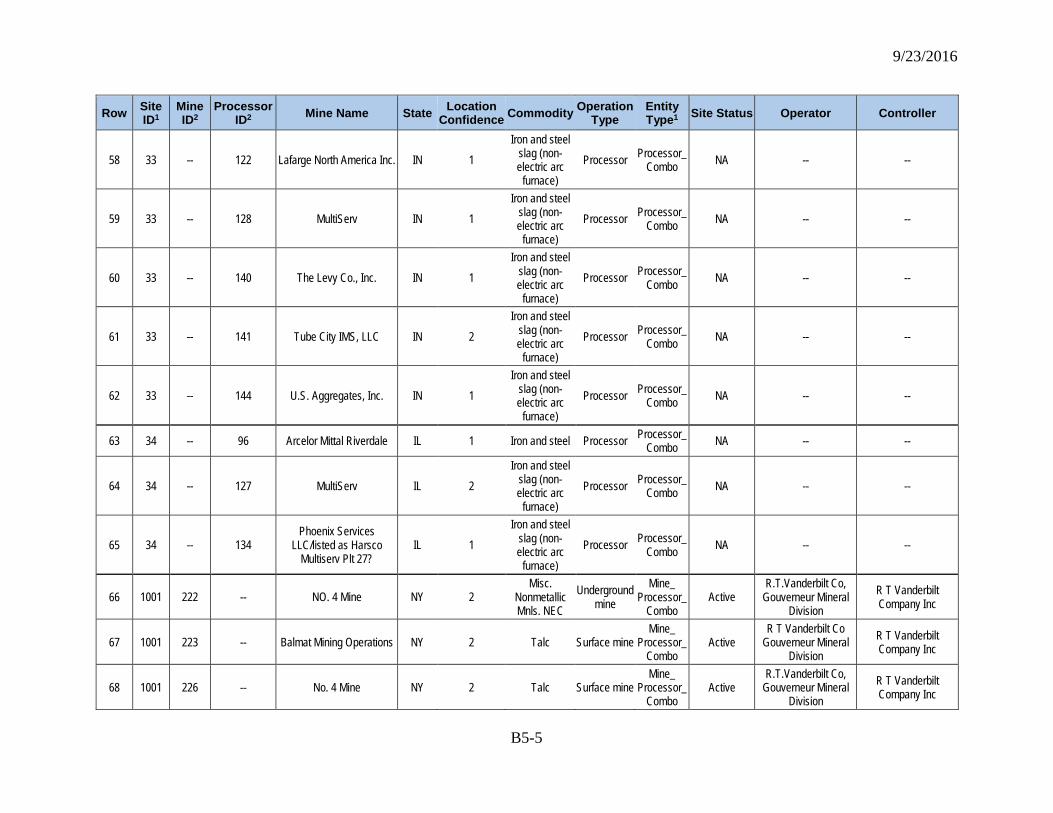
9/23/2016
B5-5
Row Site ID1
Mine ID2
Processor ID2 Mine Name State Location
Confidence Commodity Operation Type
Entity Type1 Site Status Operator Controller
58 33 -- 122 Lafarge North America Inc. IN 1 Iron and steel
slag (non-electric arc
furnace) Processor Processor_
Combo NA -- --
59 33 -- 128 MultiServ IN 1 Iron and steel
slag (non-electric arc
furnace) Processor Processor_
Combo NA -- --
60 33 -- 140 The Levy Co., Inc. IN 1 Iron and steel
slag (non-electric arc
furnace) Processor Processor_
Combo NA -- --
61 33 -- 141 Tube City IMS, LLC IN 2 Iron and steel
slag (non-electric arc
furnace) Processor Processor_
Combo NA -- --
62 33 -- 144 U.S. Aggregates, Inc. IN 1 Iron and steel
slag (non-electric arc
furnace) Processor Processor_
Combo NA -- --
63 34 -- 96 Arcelor Mittal Riverdale IL 1 Iron and steel Processor Processor_Combo NA -- --
64 34 -- 127 MultiServ IL 2 Iron and steel
slag (non-electric arc
furnace) Processor Processor_
Combo NA -- --
65 34 -- 134 Phoenix Services
LLC/listed as Harsco Multiserv Plt 27?
IL 1 Iron and steel
slag (non-electric arc
furnace) Processor Processor_
Combo NA -- --
66 1001 222 -- NO. 4 Mine NY 2 Misc.
Nonmetallic Mnls. NEC
Underground mine
Mine_ Processor_
Combo Active
R.T.Vanderbilt Co, Gouverneur Mineral
Division R T Vanderbilt Company Inc
67 1001 223 -- Balmat Mining Operations NY 2 Talc Surface mine Mine_
Processor_Combo
Active R T Vanderbilt Co
Gouverneur Mineral Division
R T Vanderbilt Company Inc
68 1001 226 -- No. 4 Mine NY 2 Talc Surface mine Mine_
Processor_Combo
Active R.T.Vanderbilt Co,
Gouverneur Mineral Division
R T Vanderbilt Company Inc
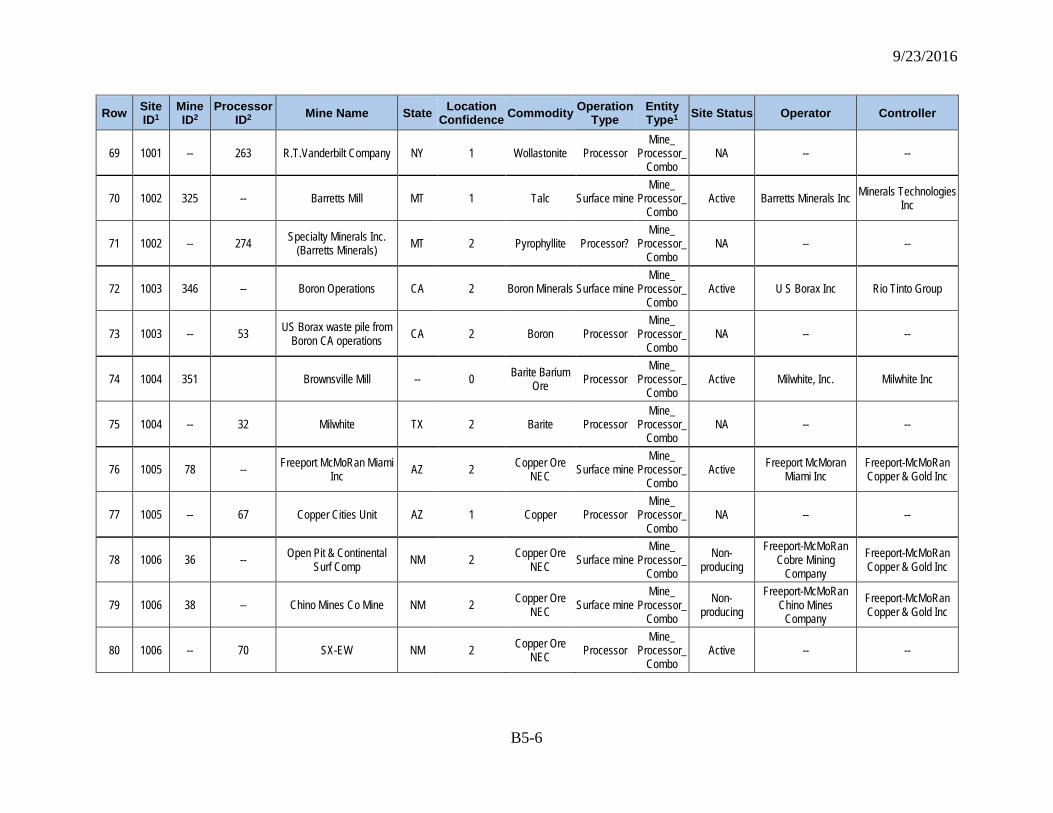
9/23/2016
B5-6
Row Site ID1
Mine ID2
Processor ID2 Mine Name State Location
Confidence Commodity Operation Type
Entity Type1 Site Status Operator Controller
69 1001 -- 263 R.T.Vanderbilt Company NY 1 Wollastonite Processor Mine_
Processor_Combo
NA -- --
70 1002 325 -- Barretts Mill MT 1 Talc Surface mine Mine_
Processor_Combo
Active Barretts Minerals Inc Minerals Technologies Inc
71 1002 -- 274 Specialty Minerals Inc. (Barretts Minerals) MT 2 Pyrophyllite Processor?
Mine_ Processor_
Combo NA -- --
72 1003 346 -- Boron Operations CA 2 Boron Minerals Surface mine Mine_
Processor_Combo
Active U S Borax Inc Rio Tinto Group
73 1003 -- 53 US Borax waste pile from Boron CA operations CA 2 Boron Processor
Mine_ Processor_
Combo NA -- --
74 1004 351 Brownsville Mill -- 0 Barite Barium Ore Processor
Mine_ Processor_
Combo Active Milwhite, Inc. Milwhite Inc
75 1004 -- 32 Milwhite TX 2 Barite Processor Mine_
Processor_Combo
NA -- --
76 1005 78 -- Freeport McMoRan Miami Inc AZ 2 Copper Ore
NEC Surface mine Mine_
Processor_Combo
Active Freeport McMoran Miami Inc
Freeport-McMoRan Copper & Gold Inc
77 1005 -- 67 Copper Cities Unit AZ 1 Copper Processor Mine_
Processor_Combo
NA -- --
78 1006 36 -- Open Pit & Continental Surf Comp NM 2 Copper Ore
NEC Surface mine Mine_
Processor_Combo
Non-producing
Freeport-McMoRan Cobre Mining
Company Freeport-McMoRan Copper & Gold Inc
79 1006 38 -- Chino Mines Co Mine NM 2 Copper Ore NEC Surface mine
Mine_ Processor_
Combo Non-
producing Freeport-McMoRan
Chino Mines Company
Freeport-McMoRan Copper & Gold Inc
80 1006 -- 70 SX-EW NM 2 Copper Ore NEC Processor
Mine_ Processor_
Combo Active -- --
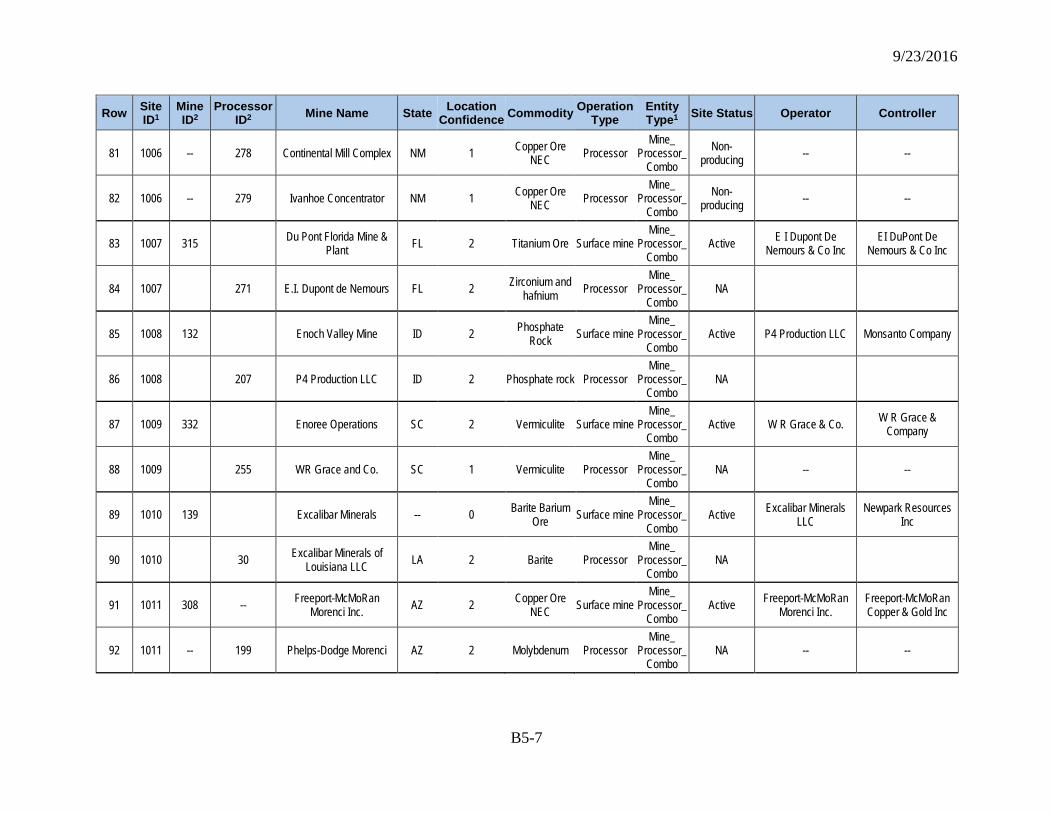
9/23/2016
B5-7
Row Site ID1
Mine ID2
Processor ID2 Mine Name State Location
Confidence Commodity Operation Type
Entity Type1 Site Status Operator Controller
81 1006 -- 278 Continental Mill Complex NM 1 Copper Ore NEC Processor
Mine_ Processor_
Combo Non-
producing -- --
82 1006 -- 279 Ivanhoe Concentrator NM 1 Copper Ore NEC Processor
Mine_ Processor_
Combo Non-
producing -- --
83 1007 315 Du Pont Florida Mine & Plant FL 2 Titanium Ore Surface mine
Mine_ Processor_
Combo Active E I Dupont De
Nemours & Co Inc EI DuPont De
Nemours & Co Inc
84 1007 271 E.I. Dupont de Nemours FL 2 Zirconium and hafnium Processor
Mine_ Processor_
Combo NA
85 1008 132 Enoch Valley Mine ID 2 Phosphate Rock Surface mine
Mine_ Processor_
Combo Active P4 Production LLC Monsanto Company
86 1008 207 P4 Production LLC ID 2 Phosphate rock Processor Mine_
Processor_Combo
NA
87 1009 332 Enoree Operations SC 2 Vermiculite Surface mine Mine_
Processor_Combo
Active W R Grace & Co. W R Grace & Company
88 1009 255 WR Grace and Co. SC 1 Vermiculite Processor Mine_
Processor_Combo
NA -- --
89 1010 139 Excalibar Minerals -- 0 Barite Barium Ore Surface mine
Mine_ Processor_
Combo Active Excalibar Minerals
LLC Newpark Resources
Inc
90 1010 30 Excalibar Minerals of Louisiana LLC LA 2 Barite Processor
Mine_ Processor_
Combo NA
91 1011 308 -- Freeport-McMoRan Morenci Inc. AZ 2 Copper Ore
NEC Surface mine Mine_
Processor_Combo
Active Freeport-McMoRan Morenci Inc.
Freeport-McMoRan Copper & Gold Inc
92 1011 -- 199 Phelps-Dodge Morenci AZ 2 Molybdenum Processor Mine_
Processor_Combo
NA -- --
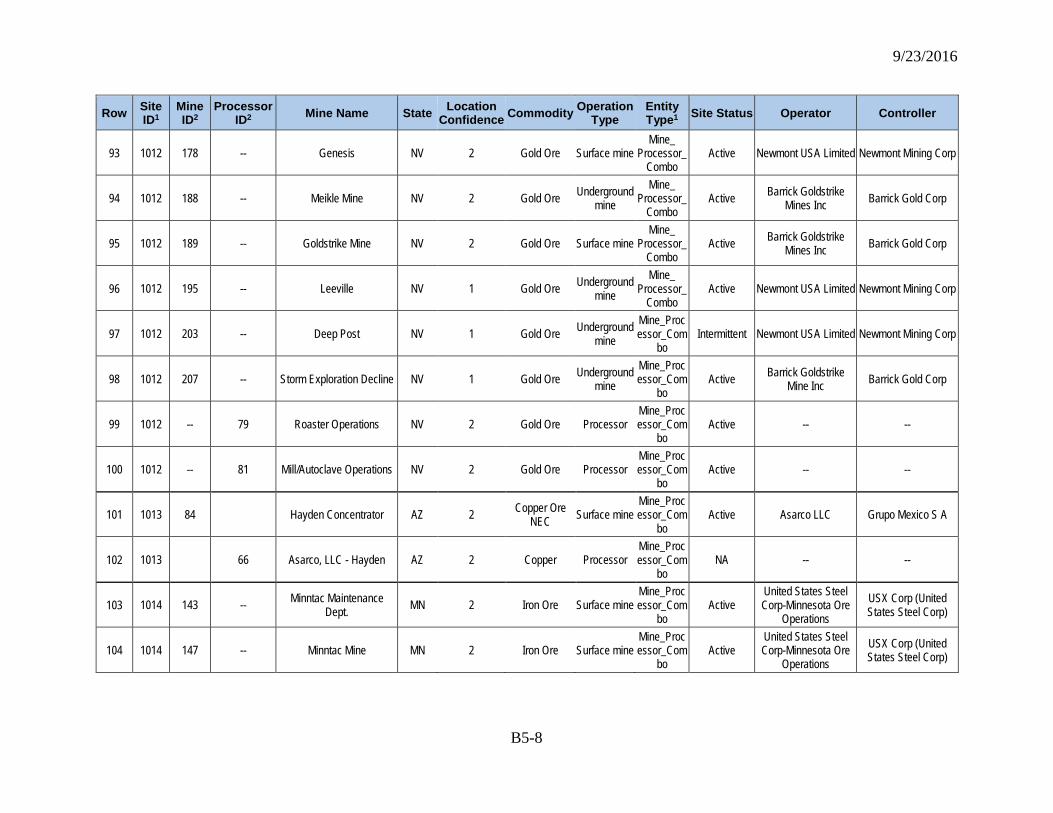
9/23/2016
B5-8
Row Site ID1
Mine ID2
Processor ID2 Mine Name State Location
Confidence Commodity Operation Type
Entity Type1 Site Status Operator Controller
93 1012 178 -- Genesis NV 2 Gold Ore Surface mine Mine_
Processor_Combo
Active Newmont USA Limited Newmont Mining Corp
94 1012 188 -- Meikle Mine NV 2 Gold Ore Underground mine
Mine_ Processor_
Combo Active Barrick Goldstrike
Mines Inc Barrick Gold Corp
95 1012 189 -- Goldstrike Mine NV 2 Gold Ore Surface mine Mine_
Processor_Combo
Active Barrick Goldstrike Mines Inc Barrick Gold Corp
96 1012 195 -- Leeville NV 1 Gold Ore Underground mine
Mine_ Processor_
Combo Active Newmont USA Limited Newmont Mining Corp
97 1012 203 -- Deep Post NV 1 Gold Ore Underground mine
Mine_Processor_Com
bo Intermittent Newmont USA Limited Newmont Mining Corp
98 1012 207 -- Storm Exploration Decline NV 1 Gold Ore Underground mine
Mine_Processor_Com
bo Active Barrick Goldstrike
Mine Inc Barrick Gold Corp
99 1012 -- 79 Roaster Operations NV 2 Gold Ore Processor Mine_Processor_Com
bo Active -- --
100 1012 -- 81 Mill/Autoclave Operations NV 2 Gold Ore Processor Mine_Processor_Com
bo Active -- --
101 1013 84 Hayden Concentrator AZ 2 Copper Ore NEC Surface mine
Mine_Processor_Com
bo Active Asarco LLC Grupo Mexico S A
102 1013 66 Asarco, LLC - Hayden AZ 2 Copper Processor Mine_Processor_Com
bo NA -- --
103 1014 143 -- Minntac Maintenance Dept. MN 2 Iron Ore Surface mine
Mine_Processor_Com
bo Active
United States Steel Corp-Minnesota Ore
Operations USX Corp (United States Steel Corp)
104 1014 147 -- Minntac Mine MN 2 Iron Ore Surface mine Mine_Processor_Com
bo Active
United States Steel Corp-Minnesota Ore
Operations USX Corp (United States Steel Corp)
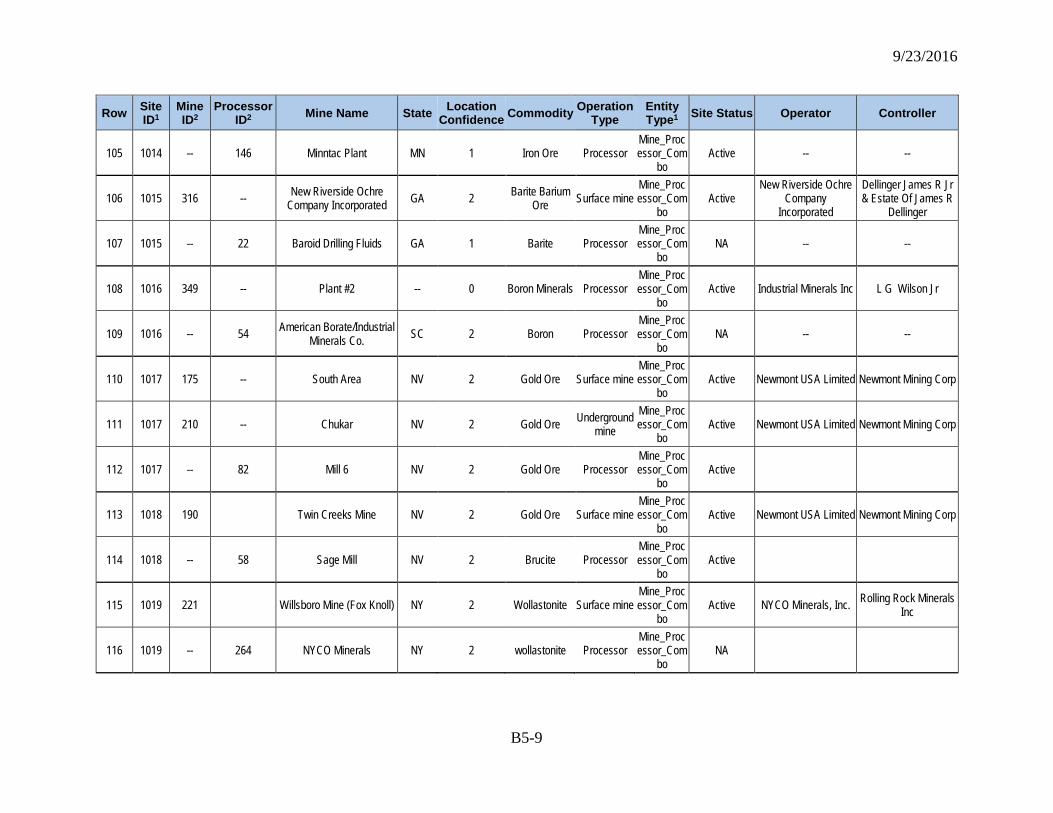
9/23/2016
B5-9
Row Site ID1
Mine ID2
Processor ID2 Mine Name State Location
Confidence Commodity Operation Type
Entity Type1 Site Status Operator Controller
105 1014 -- 146 Minntac Plant MN 1 Iron Ore Processor Mine_Processor_Com
bo Active -- --
106 1015 316 -- New Riverside Ochre Company Incorporated GA 2 Barite Barium
Ore Surface mine Mine_Processor_Com
bo Active
New Riverside Ochre Company
Incorporated
Dellinger James R Jr & Estate Of James R
Dellinger
107 1015 -- 22 Baroid Drilling Fluids GA 1 Barite Processor Mine_Processor_Com
bo NA -- --
108 1016 349 -- Plant #2 -- 0 Boron Minerals Processor Mine_Processor_Com
bo Active Industrial Minerals Inc L G Wilson Jr
109 1016 -- 54 American Borate/Industrial Minerals Co. SC 2 Boron Processor
Mine_Processor_Com
bo NA -- --
110 1017 175 -- South Area NV 2 Gold Ore Surface mine Mine_Processor_Com
bo Active Newmont USA Limited Newmont Mining Corp
111 1017 210 -- Chukar NV 2 Gold Ore Underground mine
Mine_Processor_Com
bo Active Newmont USA Limited Newmont Mining Corp
112 1017 -- 82 Mill 6 NV 2 Gold Ore Processor Mine_Processor_Com
bo Active
113 1018 190 Twin Creeks Mine NV 2 Gold Ore Surface mine Mine_Processor_Com
bo Active Newmont USA Limited Newmont Mining Corp
114 1018 -- 58 Sage Mill NV 2 Brucite Processor Mine_Processor_Com
bo Active
115 1019 221 Willsboro Mine (Fox Knoll) NY 2 Wollastonite Surface mine Mine_Processor_Com
bo Active NYCO Minerals, Inc. Rolling Rock Minerals
Inc
116 1019 -- 264 NYCO Minerals NY 2 wollastonite Processor Mine_Processor_Com
bo NA
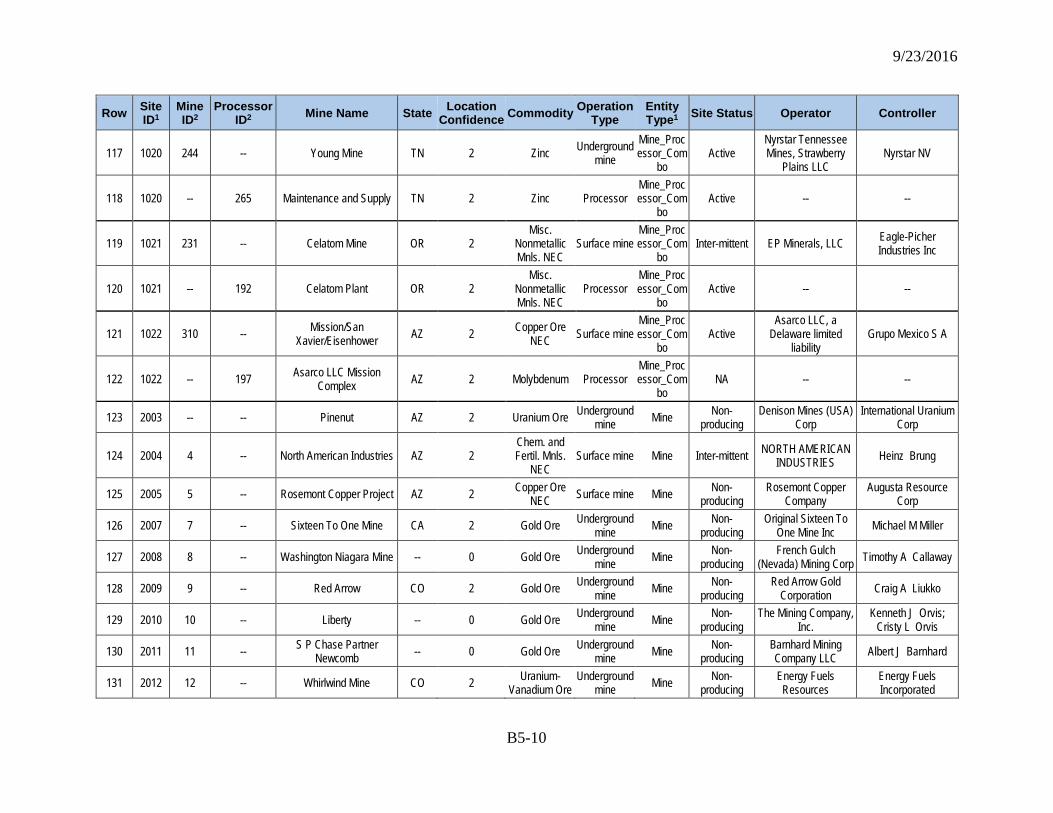
9/23/2016
B5-10
Row Site ID1
Mine ID2
Processor ID2 Mine Name State Location
Confidence Commodity Operation Type
Entity Type1 Site Status Operator Controller
117 1020 244 -- Young Mine TN 2 Zinc Underground mine
Mine_Processor_Com
bo Active
Nyrstar Tennessee Mines, Strawberry
Plains LLC Nyrstar NV
118 1020 -- 265 Maintenance and Supply TN 2 Zinc Processor Mine_Processor_Com
bo Active -- --
119 1021 231 -- Celatom Mine OR 2 Misc.
Nonmetallic Mnls. NEC
Surface mine Mine_Processor_Com
bo Inter-mittent EP Minerals, LLC Eagle-Picher
Industries Inc
120 1021 -- 192 Celatom Plant OR 2 Misc.
Nonmetallic Mnls. NEC
Processor Mine_Processor_Com
bo Active -- --
121 1022 310 -- Mission/San Xavier/Eisenhower AZ 2 Copper Ore
NEC Surface mine Mine_Processor_Com
bo Active
Asarco LLC, a Delaware limited
liability Grupo Mexico S A
122 1022 -- 197 Asarco LLC Mission Complex AZ 2 Molybdenum Processor
Mine_Processor_Com
bo NA -- --
123 2003 -- -- Pinenut AZ 2 Uranium Ore Underground mine Mine Non-
producing Denison Mines (USA)
Corp International Uranium
Corp
124 2004 4 -- North American Industries AZ 2 Chem. and Fertil. Mnls.
NEC Surface mine Mine Inter-mittent NORTH AMERICAN
INDUSTRIES Heinz Brung
125 2005 5 -- Rosemont Copper Project AZ 2 Copper Ore NEC Surface mine Mine Non-
producing Rosemont Copper
Company Augusta Resource
Corp
126 2007 7 -- Sixteen To One Mine CA 2 Gold Ore Underground mine Mine Non-
producing Original Sixteen To
One Mine Inc Michael M Miller
127 2008 8 -- Washington Niagara Mine -- 0 Gold Ore Underground mine Mine Non-
producing French Gulch
(Nevada) Mining Corp Timothy A Callaway
128 2009 9 -- Red Arrow CO 2 Gold Ore Underground mine Mine Non-
producing Red Arrow Gold
Corporation Craig A Liukko
129 2010 10 -- Liberty -- 0 Gold Ore Underground mine Mine Non-
producing The Mining Company,
Inc. Kenneth J Orvis;
Cristy L Orvis
130 2011 11 -- S P Chase Partner Newcomb -- 0 Gold Ore Underground
mine Mine Non-producing
Barnhard Mining Company LLC Albert J Barnhard
131 2012 12 -- Whirlwind Mine CO 2 Uranium-Vanadium Ore
Underground mine Mine Non-
producing Energy Fuels Resources
Energy Fuels Incorporated
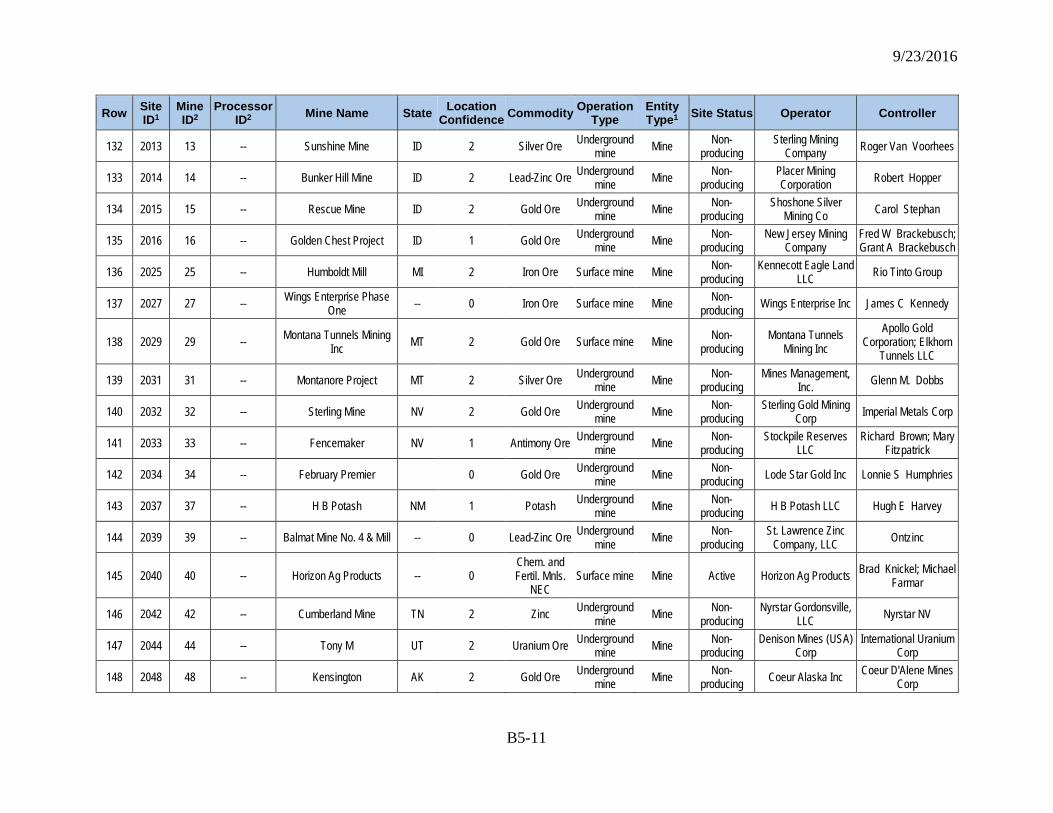
9/23/2016
B5-11
Row Site ID1
Mine ID2
Processor ID2 Mine Name State Location
Confidence Commodity Operation Type
Entity Type1 Site Status Operator Controller
132 2013 13 -- Sunshine Mine ID 2 Silver Ore Underground mine Mine Non-
producing Sterling Mining
Company Roger Van Voorhees
133 2014 14 -- Bunker Hill Mine ID 2 Lead-Zinc Ore Underground mine Mine Non-
producing Placer Mining Corporation Robert Hopper
134 2015 15 -- Rescue Mine ID 2 Gold Ore Underground mine Mine Non-
producing Shoshone Silver
Mining Co Carol Stephan
135 2016 16 -- Golden Chest Project ID 1 Gold Ore Underground mine Mine Non-
producing New Jersey Mining
Company Fred W Brackebusch; Grant A Brackebusch
136 2025 25 -- Humboldt Mill MI 2 Iron Ore Surface mine Mine Non-producing
Kennecott Eagle Land LLC Rio Tinto Group
137 2027 27 -- Wings Enterprise Phase One -- 0 Iron Ore Surface mine Mine Non-
producing Wings Enterprise Inc James C Kennedy
138 2029 29 -- Montana Tunnels Mining Inc MT 2 Gold Ore Surface mine Mine Non-
producing Montana Tunnels
Mining Inc Apollo Gold
Corporation; Elkhorn Tunnels LLC
139 2031 31 -- Montanore Project MT 2 Silver Ore Underground mine Mine Non-
producing Mines Management,
Inc. Glenn M. Dobbs
140 2032 32 -- Sterling Mine NV 2 Gold Ore Underground mine Mine Non-
producing Sterling Gold Mining
Corp Imperial Metals Corp
141 2033 33 -- Fencemaker NV 1 Antimony Ore Underground mine Mine Non-
producing Stockpile Reserves
LLC Richard Brown; Mary
Fitzpatrick
142 2034 34 -- February Premier 0 Gold Ore Underground mine Mine Non-
producing Lode Star Gold Inc Lonnie S Humphries
143 2037 37 -- H B Potash NM 1 Potash Underground mine Mine Non-
producing H B Potash LLC Hugh E Harvey
144 2039 39 -- Balmat Mine No. 4 & Mill -- 0 Lead-Zinc Ore Underground mine Mine Non-
producing St. Lawrence Zinc
Company, LLC Ontzinc
145 2040 40 -- Horizon Ag Products -- 0 Chem. and Fertil. Mnls.
NEC Surface mine Mine Active Horizon Ag Products Brad Knickel; Michael
Farmar
146 2042 42 -- Cumberland Mine TN 2 Zinc Underground mine Mine Non-
producing Nyrstar Gordonsville,
LLC Nyrstar NV
147 2044 44 -- Tony M UT 2 Uranium Ore Underground mine Mine Non-
producing Denison Mines (USA)
Corp International Uranium
Corp
148 2048 48 -- Kensington AK 2 Gold Ore Underground mine Mine Non-
producing Coeur Alaska Inc Coeur D'Alene Mines Corp

9/23/2016
B5-12
Row Site ID1
Mine ID2
Processor ID2 Mine Name State Location
Confidence Commodity Operation Type
Entity Type1 Site Status Operator Controller
149 2049 49 -- Cyprus Tohono Corporation AZ 2 Copper Ore
NEC Surface mine Mine Non-producing Cyprus Tohono Corp Freeport-McMoRan
Copper & Gold Inc
150 2050 50 -- Niblack Project LLC AK 2 Gold Ore Underground mine Mine Non-
producing Niblack Project LLC Heatherdale
Resources; CBR Gold Corporation
151 2052 52 -- Resolution Mine AZ 2 Copper Ore NEC
Underground mine Mine Non-
producing Resolution Copper
Mining LLC RTZ Corp PLC;
Broken Hill Proprietary Co Ltd
152 2068 68 -- Walla Walla Mine ID 2 Gold Ore Underground mine Mine Non-
producing F & H Mining James Johnston; Roy A Sternes
153 2077 77 -- Dudley Red #1 AL 2 Iron Ore Surface mine Mine Active Alabama Pigments Co LLC Gerald Cobern
154 2079 79 -- Freeport-McMoRan Bagdad Inc AZ 2 Copper Ore
NEC Surface mine Mine Active Freeport-McMoRan Bagdad Inc
Freeport-McMoRan Copper & Gold Inc
155 2080 80 -- Ray AZ 2 Copper Ore NEC Surface mine Mine Active Asarco LLC Grupo Mexico S A
156 2081 81 -- Mineral Park Inc AZ 2 Copper Ore NEC Surface mine Mine Active Mineral Park Inc Mercator Minerals Ltd
157 2082 82 -- Pinto Valley Operations AZ 2 Copper Ore NEC Surface mine Mine Active BHP Copper Inc Broken Hill Proprietary
Company Ltd
158 2083 83 -- Freeport-McMoRan Sierrita Inc AZ 2 Copper Ore
NEC Surface mine Mine Active Freeport-McMoRan Sierrita Inc
Freeport-McMoRan Copper & Gold Inc
159 2085 85 -- Arizona #1 AZ 2 Uranium Ore Underground mine Mine Active Denison Mines (USA)
Corp International Uranium
Corp
160 2086 86 -- Carlota Copper Company AZ 1 Copper Ore NEC Surface mine Mine Active Carlota Copper
Company Quadra Mining Ltd
161 2087 87 -- Gold Road Mine AZ 2 Gold Ore Underground mine Mine Intermittent Addwest Minerals Inc Addwest Minerals
International Ltd
162 2088 88 -- Johnson Camp Mine AZ 2 Copper Ore NEC Surface mine Mine Active Nord Resources
Corporation Nord Resources Corp
163 2089 89 -- The Old Wasp Mine AZ 2 Gold Ore Surface mine Mine Inter-mittent The Old Wasp Mine Clay Worst
164 2091 91 -- Freeport-McMoRan Safford Inc AZ 2 Copper Ore
NEC Surface mine Mine Active Freeport-McMoRan Safford Inc
Freeport-McMoRan Copper & Gold Inc
165 2095 95 -- Alabama Mine AR 2 Aluminum Ore-Bauxite Surface mine Mine Active McGeorge Contracting
Co., Inc. Haskell L Dickinson
II
166 2096 96 -- Section 27 -- 0 Aluminum Ore-Bauxite Surface mine Mine Inter-mittent Semcoa Ted Smith; Tom
Reed
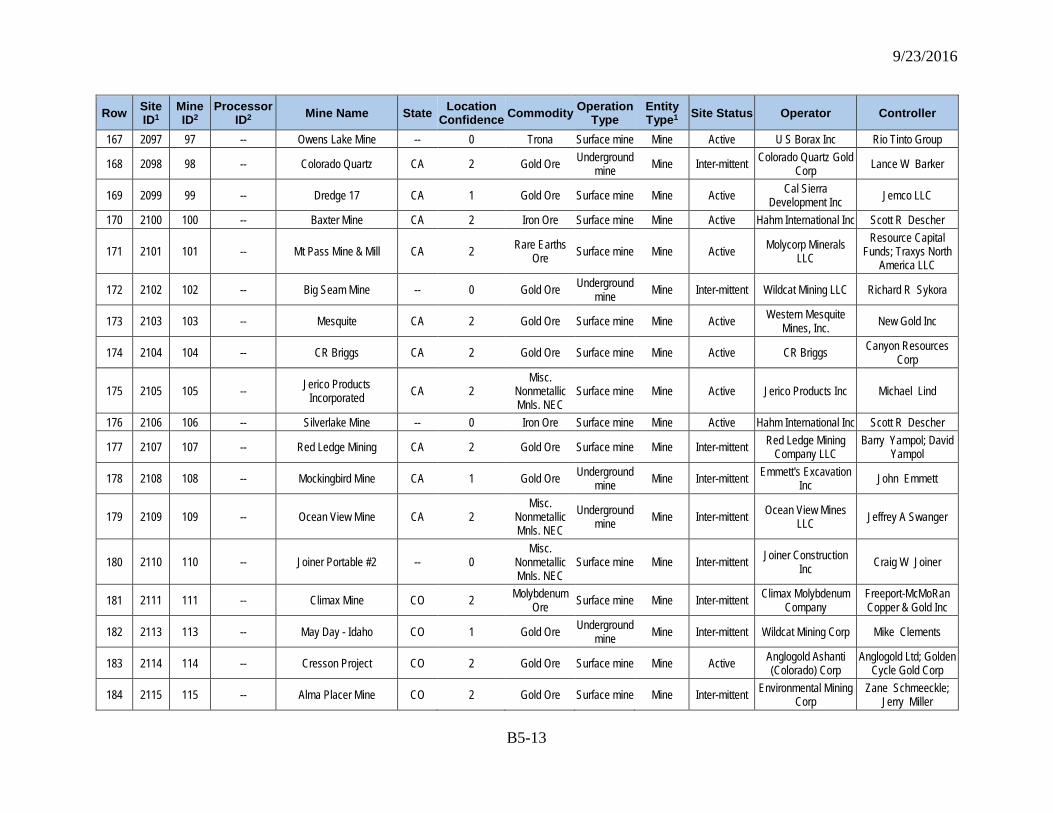
9/23/2016
B5-13
Row Site ID1
Mine ID2
Processor ID2 Mine Name State Location
Confidence Commodity Operation Type
Entity Type1 Site Status Operator Controller
167 2097 97 -- Owens Lake Mine -- 0 Trona Surface mine Mine Active U S Borax Inc Rio Tinto Group
168 2098 98 -- Colorado Quartz CA 2 Gold Ore Underground mine Mine Inter-mittent Colorado Quartz Gold
Corp Lance W Barker
169 2099 99 -- Dredge 17 CA 1 Gold Ore Surface mine Mine Active Cal Sierra Development Inc Jemco LLC
170 2100 100 -- Baxter Mine CA 2 Iron Ore Surface mine Mine Active Hahm International Inc Scott R Descher
171 2101 101 -- Mt Pass Mine & Mill CA 2 Rare Earths Ore Surface mine Mine Active Molycorp Minerals
LLC Resource Capital
Funds; Traxys North America LLC
172 2102 102 -- Big Seam Mine -- 0 Gold Ore Underground mine Mine Inter-mittent Wildcat Mining LLC Richard R Sykora
173 2103 103 -- Mesquite CA 2 Gold Ore Surface mine Mine Active Western Mesquite Mines, Inc. New Gold Inc
174 2104 104 -- CR Briggs CA 2 Gold Ore Surface mine Mine Active CR Briggs Canyon Resources Corp
175 2105 105 -- Jerico Products Incorporated CA 2
Misc. Nonmetallic Mnls. NEC
Surface mine Mine Active Jerico Products Inc Michael Lind
176 2106 106 -- Silverlake Mine -- 0 Iron Ore Surface mine Mine Active Hahm International Inc Scott R Descher
177 2107 107 -- Red Ledge Mining CA 2 Gold Ore Surface mine Mine Inter-mittent Red Ledge Mining Company LLC
Barry Yampol; David Yampol
178 2108 108 -- Mockingbird Mine CA 1 Gold Ore Underground mine Mine Inter-mittent Emmett's Excavation
Inc John Emmett
179 2109 109 -- Ocean View Mine CA 2 Misc.
Nonmetallic Mnls. NEC
Underground mine Mine Inter-mittent Ocean View Mines
LLC Jeffrey A Swanger
180 2110 110 -- Joiner Portable #2 -- 0 Misc.
Nonmetallic Mnls. NEC
Surface mine Mine Inter-mittent Joiner Construction Inc Craig W Joiner
181 2111 111 -- Climax Mine CO 2 Molybdenum Ore Surface mine Mine Inter-mittent Climax Molybdenum
Company Freeport-McMoRan Copper & Gold Inc
182 2113 113 -- May Day - Idaho CO 1 Gold Ore Underground mine Mine Inter-mittent Wildcat Mining Corp Mike Clements
183 2114 114 -- Cresson Project CO 2 Gold Ore Surface mine Mine Active Anglogold Ashanti (Colorado) Corp
Anglogold Ltd; Golden Cycle Gold Corp
184 2115 115 -- Alma Placer Mine CO 2 Gold Ore Surface mine Mine Inter-mittent Environmental Mining Corp
Zane Schmeeckle; Jerry Miller
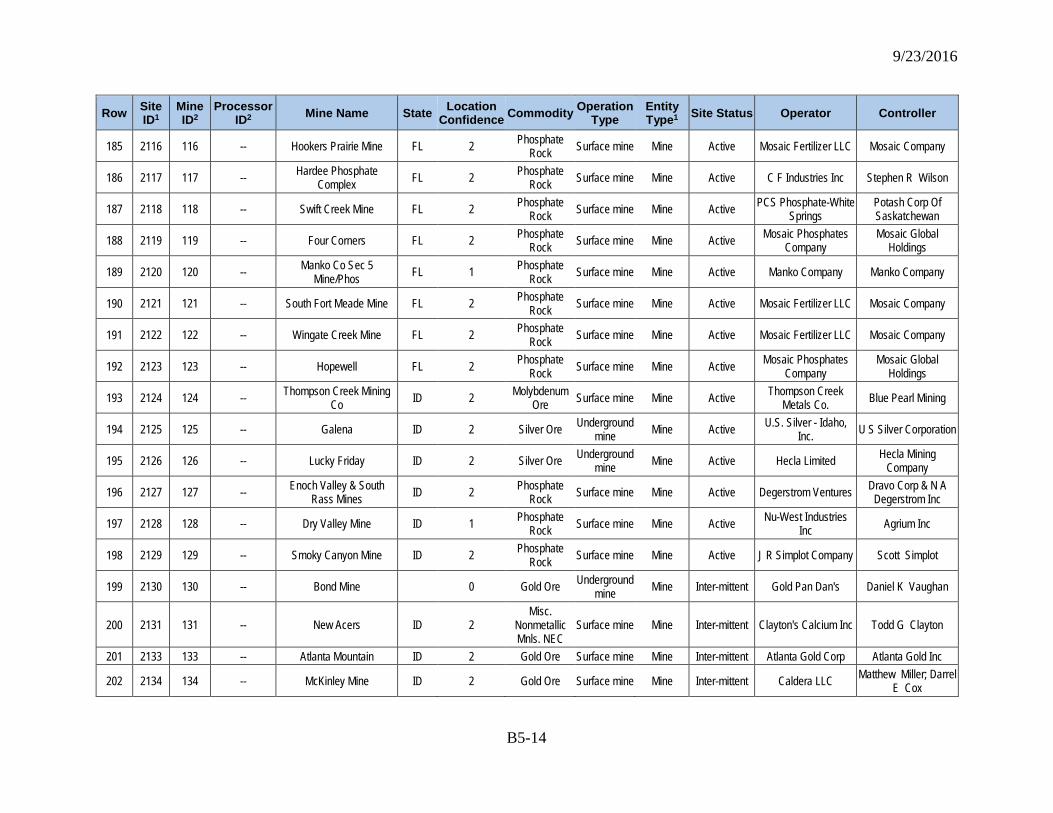
9/23/2016
B5-14
Row Site ID1
Mine ID2
Processor ID2 Mine Name State Location
Confidence Commodity Operation Type
Entity Type1 Site Status Operator Controller
185 2116 116 -- Hookers Prairie Mine FL 2 Phosphate Rock Surface mine Mine Active Mosaic Fertilizer LLC Mosaic Company
186 2117 117 -- Hardee Phosphate Complex FL 2 Phosphate
Rock Surface mine Mine Active C F Industries Inc Stephen R Wilson
187 2118 118 -- Swift Creek Mine FL 2 Phosphate Rock Surface mine Mine Active PCS Phosphate-White
Springs Potash Corp Of Saskatchewan
188 2119 119 -- Four Corners FL 2 Phosphate Rock Surface mine Mine Active Mosaic Phosphates
Company Mosaic Global
Holdings
189 2120 120 -- Manko Co Sec 5 Mine/Phos FL 1 Phosphate
Rock Surface mine Mine Active Manko Company Manko Company
190 2121 121 -- South Fort Meade Mine FL 2 Phosphate Rock Surface mine Mine Active Mosaic Fertilizer LLC Mosaic Company
191 2122 122 -- Wingate Creek Mine FL 2 Phosphate Rock Surface mine Mine Active Mosaic Fertilizer LLC Mosaic Company
192 2123 123 -- Hopewell FL 2 Phosphate Rock Surface mine Mine Active Mosaic Phosphates
Company Mosaic Global
Holdings
193 2124 124 -- Thompson Creek Mining Co ID 2 Molybdenum
Ore Surface mine Mine Active Thompson Creek Metals Co. Blue Pearl Mining
194 2125 125 -- Galena ID 2 Silver Ore Underground mine Mine Active U.S. Silver - Idaho,
Inc. U S Silver Corporation
195 2126 126 -- Lucky Friday ID 2 Silver Ore Underground mine Mine Active Hecla Limited Hecla Mining
Company
196 2127 127 -- Enoch Valley & South Rass Mines ID 2 Phosphate
Rock Surface mine Mine Active Degerstrom Ventures Dravo Corp & N A Degerstrom Inc
197 2128 128 -- Dry Valley Mine ID 1 Phosphate Rock Surface mine Mine Active Nu-West Industries
Inc Agrium Inc
198 2129 129 -- Smoky Canyon Mine ID 2 Phosphate Rock Surface mine Mine Active J R Simplot Company Scott Simplot
199 2130 130 -- Bond Mine 0 Gold Ore Underground mine Mine Inter-mittent Gold Pan Dan's Daniel K Vaughan
200 2131 131 -- New Acers ID 2 Misc.
Nonmetallic Mnls. NEC
Surface mine Mine Inter-mittent Clayton's Calcium Inc Todd G Clayton
201 2133 133 -- Atlanta Mountain ID 2 Gold Ore Surface mine Mine Inter-mittent Atlanta Gold Corp Atlanta Gold Inc
202 2134 134 -- McKinley Mine ID 2 Gold Ore Surface mine Mine Inter-mittent Caldera LLC Matthew Miller; Darrel E Cox
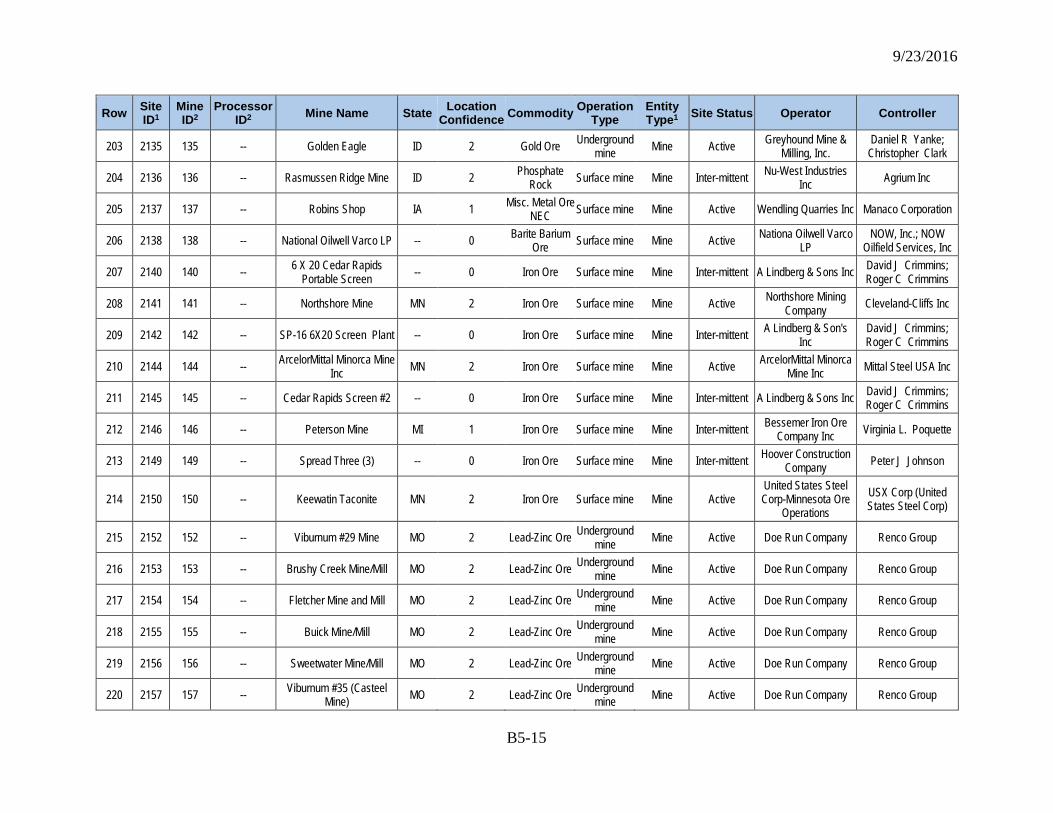
9/23/2016
B5-15
Row Site ID1
Mine ID2
Processor ID2 Mine Name State Location
Confidence Commodity Operation Type
Entity Type1 Site Status Operator Controller
203 2135 135 -- Golden Eagle ID 2 Gold Ore Underground mine Mine Active Greyhound Mine &
Milling, Inc. Daniel R Yanke;
Christopher Clark
204 2136 136 -- Rasmussen Ridge Mine ID 2 Phosphate Rock Surface mine Mine Inter-mittent Nu-West Industries
Inc Agrium Inc
205 2137 137 -- Robins Shop IA 1 Misc. Metal Ore NEC Surface mine Mine Active Wendling Quarries Inc Manaco Corporation
206 2138 138 -- National Oilwell Varco LP -- 0 Barite Barium Ore Surface mine Mine Active Nationa Oilwell Varco
LP NOW, Inc.; NOW
Oilfield Services, Inc
207 2140 140 -- 6 X 20 Cedar Rapids Portable Screen -- 0 Iron Ore Surface mine Mine Inter-mittent A Lindberg & Sons Inc David J Crimmins;
Roger C Crimmins
208 2141 141 -- Northshore Mine MN 2 Iron Ore Surface mine Mine Active Northshore Mining Company Cleveland-Cliffs Inc
209 2142 142 -- SP-16 6X20 Screen Plant -- 0 Iron Ore Surface mine Mine Inter-mittent A Lindberg & Son's Inc
David J Crimmins; Roger C Crimmins
210 2144 144 -- ArcelorMittal Minorca Mine Inc MN 2 Iron Ore Surface mine Mine Active ArcelorMittal Minorca
Mine Inc Mittal Steel USA Inc
211 2145 145 -- Cedar Rapids Screen #2 -- 0 Iron Ore Surface mine Mine Inter-mittent A Lindberg & Sons Inc David J Crimmins; Roger C Crimmins
212 2146 146 -- Peterson Mine MI 1 Iron Ore Surface mine Mine Inter-mittent Bessemer Iron Ore Company Inc Virginia L. Poquette
213 2149 149 -- Spread Three (3) -- 0 Iron Ore Surface mine Mine Inter-mittent Hoover Construction Company Peter J Johnson
214 2150 150 -- Keewatin Taconite MN 2 Iron Ore Surface mine Mine Active United States Steel Corp-Minnesota Ore
Operations USX Corp (United States Steel Corp)
215 2152 152 -- Viburnum #29 Mine MO 2 Lead-Zinc Ore Underground mine Mine Active Doe Run Company Renco Group
216 2153 153 -- Brushy Creek Mine/Mill MO 2 Lead-Zinc Ore Underground mine Mine Active Doe Run Company Renco Group
217 2154 154 -- Fletcher Mine and Mill MO 2 Lead-Zinc Ore Underground mine Mine Active Doe Run Company Renco Group
218 2155 155 -- Buick Mine/Mill MO 2 Lead-Zinc Ore Underground mine Mine Active Doe Run Company Renco Group
219 2156 156 -- Sweetwater Mine/Mill MO 2 Lead-Zinc Ore Underground mine Mine Active Doe Run Company Renco Group
220 2157 157 -- Viburnum #35 (Casteel Mine) MO 2 Lead-Zinc Ore Underground
mine Mine Active Doe Run Company Renco Group
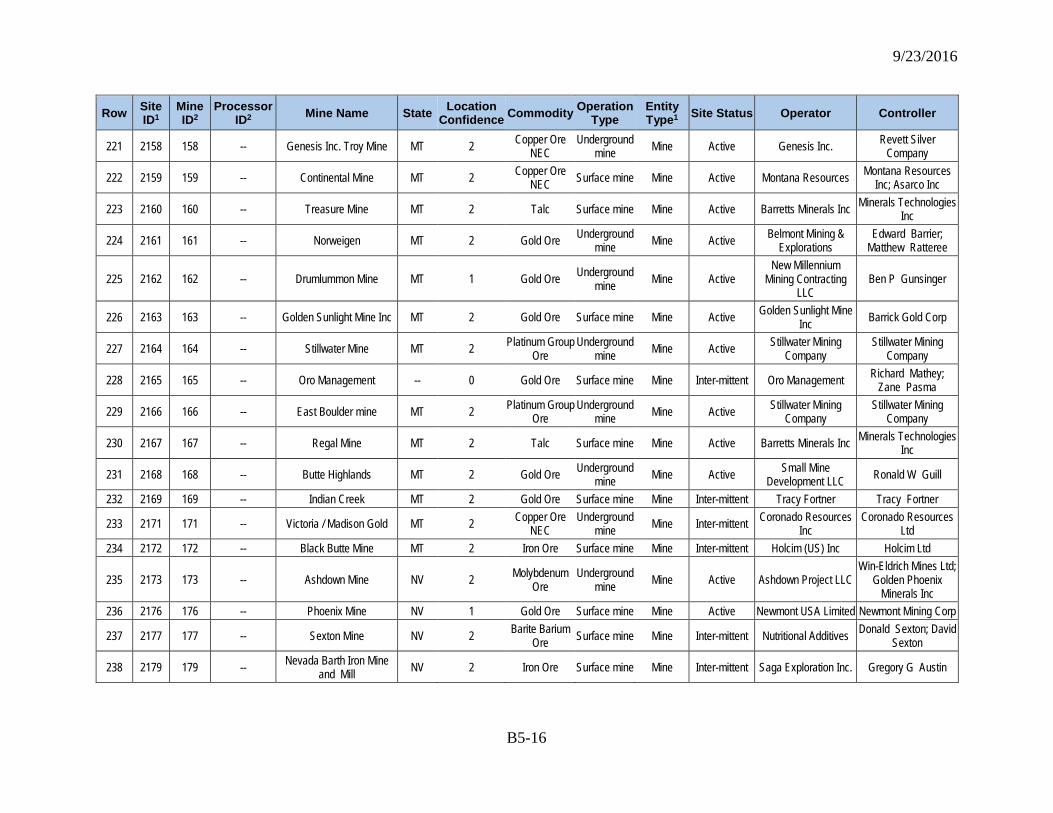
9/23/2016
B5-16
Row Site ID1
Mine ID2
Processor ID2 Mine Name State Location
Confidence Commodity Operation Type
Entity Type1 Site Status Operator Controller
221 2158 158 -- Genesis Inc. Troy Mine MT 2 Copper Ore NEC
Underground mine Mine Active Genesis Inc. Revett Silver
Company
222 2159 159 -- Continental Mine MT 2 Copper Ore NEC Surface mine Mine Active Montana Resources Montana Resources
Inc; Asarco Inc
223 2160 160 -- Treasure Mine MT 2 Talc Surface mine Mine Active Barretts Minerals Inc Minerals Technologies Inc
224 2161 161 -- Norweigen MT 2 Gold Ore Underground mine Mine Active Belmont Mining &
Explorations Edward Barrier;
Matthew Ratteree
225 2162 162 -- Drumlummon Mine MT 1 Gold Ore Underground mine Mine Active
New Millennium Mining Contracting
LLC Ben P Gunsinger
226 2163 163 -- Golden Sunlight Mine Inc MT 2 Gold Ore Surface mine Mine Active Golden Sunlight Mine Inc Barrick Gold Corp
227 2164 164 -- Stillwater Mine MT 2 Platinum Group Ore
Underground mine Mine Active Stillwater Mining
Company Stillwater Mining
Company
228 2165 165 -- Oro Management -- 0 Gold Ore Surface mine Mine Inter-mittent Oro Management Richard Mathey; Zane Pasma
229 2166 166 -- East Boulder mine MT 2 Platinum Group Ore
Underground mine Mine Active Stillwater Mining
Company Stillwater Mining
Company
230 2167 167 -- Regal Mine MT 2 Talc Surface mine Mine Active Barretts Minerals Inc Minerals Technologies Inc
231 2168 168 -- Butte Highlands MT 2 Gold Ore Underground mine Mine Active Small Mine
Development LLC Ronald W Guill
232 2169 169 -- Indian Creek MT 2 Gold Ore Surface mine Mine Inter-mittent Tracy Fortner Tracy Fortner
233 2171 171 -- Victoria / Madison Gold MT 2 Copper Ore NEC
Underground mine Mine Inter-mittent Coronado Resources
Inc Coronado Resources
Ltd 234 2172 172 -- Black Butte Mine MT 2 Iron Ore Surface mine Mine Inter-mittent Holcim (US) Inc Holcim Ltd
235 2173 173 -- Ashdown Mine NV 2 Molybdenum Ore
Underground mine Mine Active Ashdown Project LLC
Win-Eldrich Mines Ltd; Golden Phoenix
Minerals Inc 236 2176 176 -- Phoenix Mine NV 1 Gold Ore Surface mine Mine Active Newmont USA Limited Newmont Mining Corp
237 2177 177 -- Sexton Mine NV 2 Barite Barium Ore Surface mine Mine Inter-mittent Nutritional Additives Donald Sexton; David
Sexton
238 2179 179 -- Nevada Barth Iron Mine and Mill NV 2 Iron Ore Surface mine Mine Inter-mittent Saga Exploration Inc. Gregory G Austin
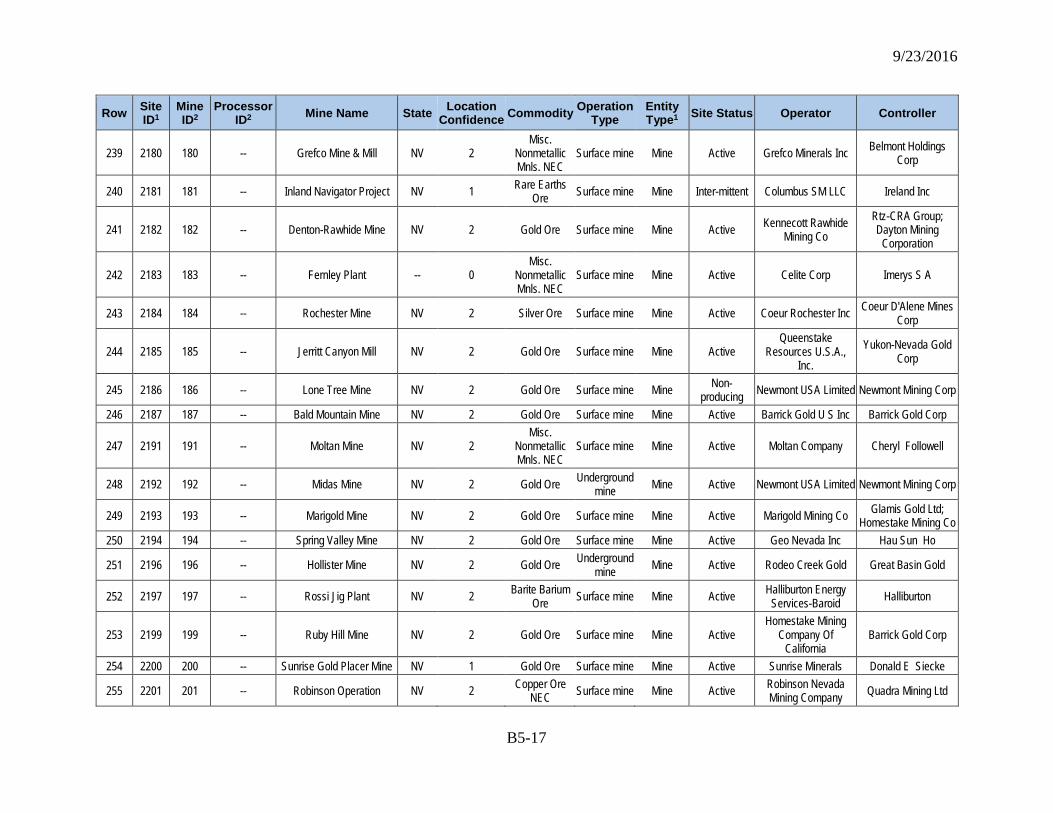
9/23/2016
B5-17
Row Site ID1
Mine ID2
Processor ID2 Mine Name State Location
Confidence Commodity Operation Type
Entity Type1 Site Status Operator Controller
239 2180 180 -- Grefco Mine & Mill NV 2 Misc.
Nonmetallic Mnls. NEC
Surface mine Mine Active Grefco Minerals Inc Belmont Holdings Corp
240 2181 181 -- Inland Navigator Project NV 1 Rare Earths Ore Surface mine Mine Inter-mittent Columbus SM LLC Ireland Inc
241 2182 182 -- Denton-Rawhide Mine NV 2 Gold Ore Surface mine Mine Active Kennecott Rawhide Mining Co
Rtz-CRA Group; Dayton Mining
Corporation
242 2183 183 -- Fernley Plant -- 0 Misc.
Nonmetallic Mnls. NEC
Surface mine Mine Active Celite Corp Imerys S A
243 2184 184 -- Rochester Mine NV 2 Silver Ore Surface mine Mine Active Coeur Rochester Inc Coeur D'Alene Mines Corp
244 2185 185 -- Jerritt Canyon Mill NV 2 Gold Ore Surface mine Mine Active Queenstake
Resources U.S.A., Inc.
Yukon-Nevada Gold Corp
245 2186 186 -- Lone Tree Mine NV 2 Gold Ore Surface mine Mine Non-producing Newmont USA Limited Newmont Mining Corp
246 2187 187 -- Bald Mountain Mine NV 2 Gold Ore Surface mine Mine Active Barrick Gold U S Inc Barrick Gold Corp
247 2191 191 -- Moltan Mine NV 2 Misc.
Nonmetallic Mnls. NEC
Surface mine Mine Active Moltan Company Cheryl Followell
248 2192 192 -- Midas Mine NV 2 Gold Ore Underground mine Mine Active Newmont USA Limited Newmont Mining Corp
249 2193 193 -- Marigold Mine NV 2 Gold Ore Surface mine Mine Active Marigold Mining Co Glamis Gold Ltd; Homestake Mining Co
250 2194 194 -- Spring Valley Mine NV 2 Gold Ore Surface mine Mine Active Geo Nevada Inc Hau Sun Ho
251 2196 196 -- Hollister Mine NV 2 Gold Ore Underground mine Mine Active Rodeo Creek Gold Great Basin Gold
252 2197 197 -- Rossi Jig Plant NV 2 Barite Barium Ore Surface mine Mine Active Halliburton Energy
Services-Baroid Halliburton
253 2199 199 -- Ruby Hill Mine NV 2 Gold Ore Surface mine Mine Active Homestake Mining
Company Of California
Barrick Gold Corp
254 2200 200 -- Sunrise Gold Placer Mine NV 1 Gold Ore Surface mine Mine Active Sunrise Minerals Donald E Siecke
255 2201 201 -- Robinson Operation NV 2 Copper Ore NEC Surface mine Mine Active Robinson Nevada
Mining Company Quadra Mining Ltd
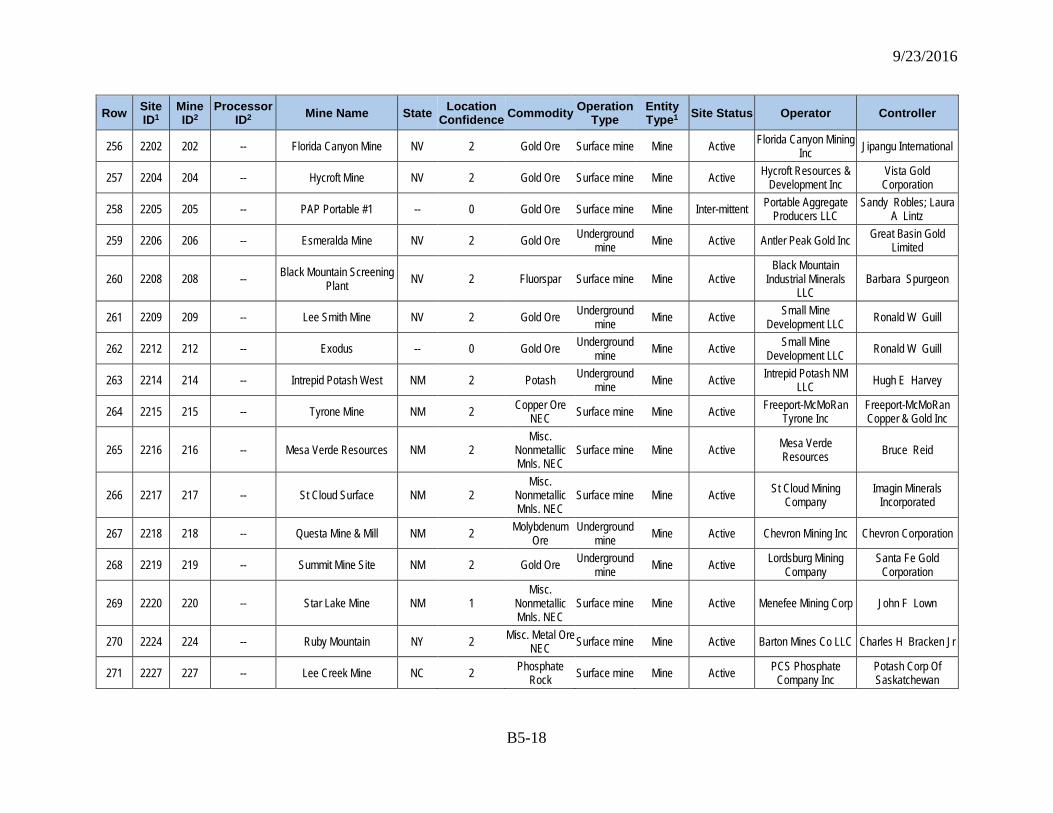
9/23/2016
B5-18
Row Site ID1
Mine ID2
Processor ID2 Mine Name State Location
Confidence Commodity Operation Type
Entity Type1 Site Status Operator Controller
256 2202 202 -- Florida Canyon Mine NV 2 Gold Ore Surface mine Mine Active Florida Canyon Mining Inc Jipangu International
257 2204 204 -- Hycroft Mine NV 2 Gold Ore Surface mine Mine Active Hycroft Resources & Development Inc
Vista Gold Corporation
258 2205 205 -- PAP Portable #1 -- 0 Gold Ore Surface mine Mine Inter-mittent Portable Aggregate Producers LLC
Sandy Robles; Laura A Lintz
259 2206 206 -- Esmeralda Mine NV 2 Gold Ore Underground mine Mine Active Antler Peak Gold Inc Great Basin Gold
Limited
260 2208 208 -- Black Mountain Screening Plant NV 2 Fluorspar Surface mine Mine Active
Black Mountain Industrial Minerals
LLC Barbara Spurgeon
261 2209 209 -- Lee Smith Mine NV 2 Gold Ore Underground mine Mine Active Small Mine
Development LLC Ronald W Guill
262 2212 212 -- Exodus -- 0 Gold Ore Underground mine Mine Active Small Mine
Development LLC Ronald W Guill
263 2214 214 -- Intrepid Potash West NM 2 Potash Underground mine Mine Active Intrepid Potash NM
LLC Hugh E Harvey
264 2215 215 -- Tyrone Mine NM 2 Copper Ore NEC Surface mine Mine Active Freeport-McMoRan
Tyrone Inc Freeport-McMoRan Copper & Gold Inc
265 2216 216 -- Mesa Verde Resources NM 2 Misc.
Nonmetallic Mnls. NEC
Surface mine Mine Active Mesa Verde Resources Bruce Reid
266 2217 217 -- St Cloud Surface NM 2 Misc.
Nonmetallic Mnls. NEC
Surface mine Mine Active St Cloud Mining Company
Imagin Minerals Incorporated
267 2218 218 -- Questa Mine & Mill NM 2 Molybdenum Ore
Underground mine Mine Active Chevron Mining Inc Chevron Corporation
268 2219 219 -- Summit Mine Site NM 2 Gold Ore Underground mine Mine Active Lordsburg Mining
Company Santa Fe Gold
Corporation
269 2220 220 -- Star Lake Mine NM 1 Misc.
Nonmetallic Mnls. NEC
Surface mine Mine Active Menefee Mining Corp John F Lown
270 2224 224 -- Ruby Mountain NY 2 Misc. Metal Ore NEC Surface mine Mine Active Barton Mines Co LLC Charles H Bracken Jr
271 2227 227 -- Lee Creek Mine NC 2 Phosphate Rock Surface mine Mine Active PCS Phosphate
Company Inc Potash Corp Of Saskatchewan
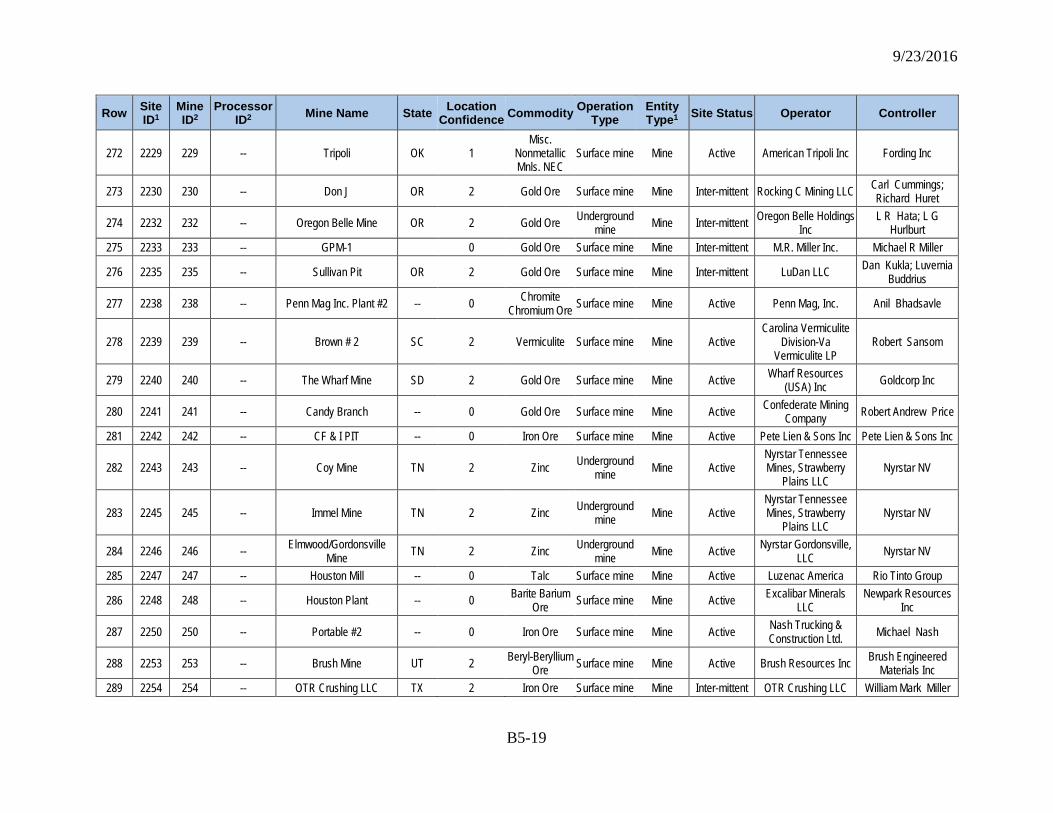
9/23/2016
B5-19
Row Site ID1
Mine ID2
Processor ID2 Mine Name State Location
Confidence Commodity Operation Type
Entity Type1 Site Status Operator Controller
272 2229 229 -- Tripoli OK 1 Misc.
Nonmetallic Mnls. NEC
Surface mine Mine Active American Tripoli Inc Fording Inc
273 2230 230 -- Don J OR 2 Gold Ore Surface mine Mine Inter-mittent Rocking C Mining LLC Carl Cummings; Richard Huret
274 2232 232 -- Oregon Belle Mine OR 2 Gold Ore Underground mine Mine Inter-mittent Oregon Belle Holdings
Inc L R Hata; L G
Hurlburt 275 2233 233 -- GPM-1 0 Gold Ore Surface mine Mine Inter-mittent M.R. Miller Inc. Michael R Miller
276 2235 235 -- Sullivan Pit OR 2 Gold Ore Surface mine Mine Inter-mittent LuDan LLC Dan Kukla; Luvernia Buddrius
277 2238 238 -- Penn Mag Inc. Plant #2 -- 0 Chromite Chromium Ore Surface mine Mine Active Penn Mag, Inc. Anil Bhadsavle
278 2239 239 -- Brown # 2 SC 2 Vermiculite Surface mine Mine Active Carolina Vermiculite
Division-Va Vermiculite LP
Robert Sansom
279 2240 240 -- The Wharf Mine SD 2 Gold Ore Surface mine Mine Active Wharf Resources (USA) Inc Goldcorp Inc
280 2241 241 -- Candy Branch -- 0 Gold Ore Surface mine Mine Active Confederate Mining Company Robert Andrew Price
281 2242 242 -- CF & I PIT -- 0 Iron Ore Surface mine Mine Active Pete Lien & Sons Inc Pete Lien & Sons Inc
282 2243 243 -- Coy Mine TN 2 Zinc Underground mine Mine Active
Nyrstar Tennessee Mines, Strawberry
Plains LLC Nyrstar NV
283 2245 245 -- Immel Mine TN 2 Zinc Underground mine Mine Active
Nyrstar Tennessee Mines, Strawberry
Plains LLC Nyrstar NV
284 2246 246 -- Elmwood/Gordonsville Mine TN 2 Zinc Underground
mine Mine Active Nyrstar Gordonsville, LLC Nyrstar NV
285 2247 247 -- Houston Mill -- 0 Talc Surface mine Mine Active Luzenac America Rio Tinto Group
286 2248 248 -- Houston Plant -- 0 Barite Barium Ore Surface mine Mine Active Excalibar Minerals
LLC Newpark Resources
Inc
287 2250 250 -- Portable #2 -- 0 Iron Ore Surface mine Mine Active Nash Trucking & Construction Ltd. Michael Nash
288 2253 253 -- Brush Mine UT 2 Beryl-Beryllium Ore Surface mine Mine Active Brush Resources Inc Brush Engineered
Materials Inc 289 2254 254 -- OTR Crushing LLC TX 2 Iron Ore Surface mine Mine Inter-mittent OTR Crushing LLC William Mark Miller
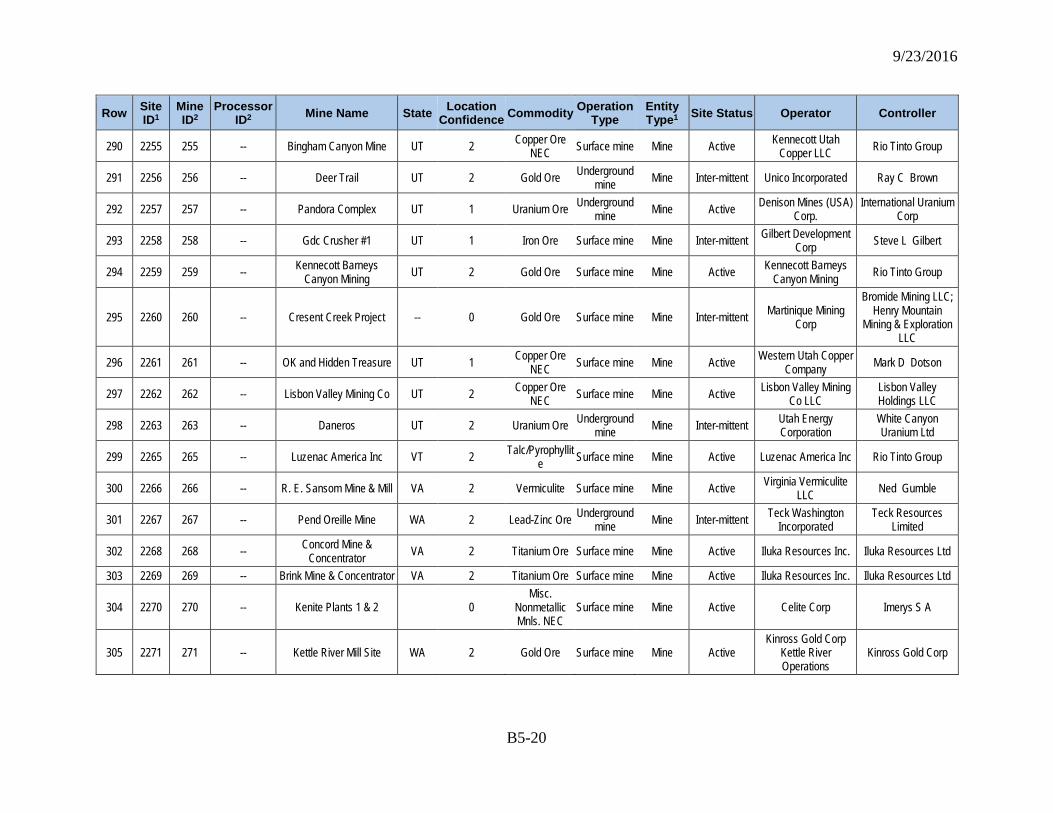
9/23/2016
B5-20
Row Site ID1
Mine ID2
Processor ID2 Mine Name State Location
Confidence Commodity Operation Type
Entity Type1 Site Status Operator Controller
290 2255 255 -- Bingham Canyon Mine UT 2 Copper Ore NEC Surface mine Mine Active Kennecott Utah
Copper LLC Rio Tinto Group
291 2256 256 -- Deer Trail UT 2 Gold Ore Underground mine Mine Inter-mittent Unico Incorporated Ray C Brown
292 2257 257 -- Pandora Complex UT 1 Uranium Ore Underground mine Mine Active Denison Mines (USA)
Corp. International Uranium
Corp
293 2258 258 -- Gdc Crusher #1 UT 1 Iron Ore Surface mine Mine Inter-mittent Gilbert Development Corp Steve L Gilbert
294 2259 259 -- Kennecott Barneys Canyon Mining UT 2 Gold Ore Surface mine Mine Active Kennecott Barneys
Canyon Mining Rio Tinto Group
295 2260 260 -- Cresent Creek Project -- 0 Gold Ore Surface mine Mine Inter-mittent Martinique Mining Corp
Bromide Mining LLC; Henry Mountain
Mining & Exploration LLC
296 2261 261 -- OK and Hidden Treasure UT 1 Copper Ore NEC Surface mine Mine Active Western Utah Copper
Company Mark D Dotson
297 2262 262 -- Lisbon Valley Mining Co UT 2 Copper Ore NEC Surface mine Mine Active Lisbon Valley Mining
Co LLC Lisbon Valley Holdings LLC
298 2263 263 -- Daneros UT 2 Uranium Ore Underground mine Mine Inter-mittent Utah Energy
Corporation White Canyon Uranium Ltd
299 2265 265 -- Luzenac America Inc VT 2 Talc/Pyrophyllite Surface mine Mine Active Luzenac America Inc Rio Tinto Group
300 2266 266 -- R. E. Sansom Mine & Mill VA 2 Vermiculite Surface mine Mine Active Virginia Vermiculite LLC Ned Gumble
301 2267 267 -- Pend Oreille Mine WA 2 Lead-Zinc Ore Underground mine Mine Inter-mittent Teck Washington
Incorporated Teck Resources
Limited
302 2268 268 -- Concord Mine & Concentrator VA 2 Titanium Ore Surface mine Mine Active Iluka Resources Inc. Iluka Resources Ltd
303 2269 269 -- Brink Mine & Concentrator VA 2 Titanium Ore Surface mine Mine Active Iluka Resources Inc. Iluka Resources Ltd
304 2270 270 -- Kenite Plants 1 & 2 0 Misc.
Nonmetallic Mnls. NEC
Surface mine Mine Active Celite Corp Imerys S A
305 2271 271 -- Kettle River Mill Site WA 2 Gold Ore Surface mine Mine Active Kinross Gold Corp
Kettle River Operations
Kinross Gold Corp
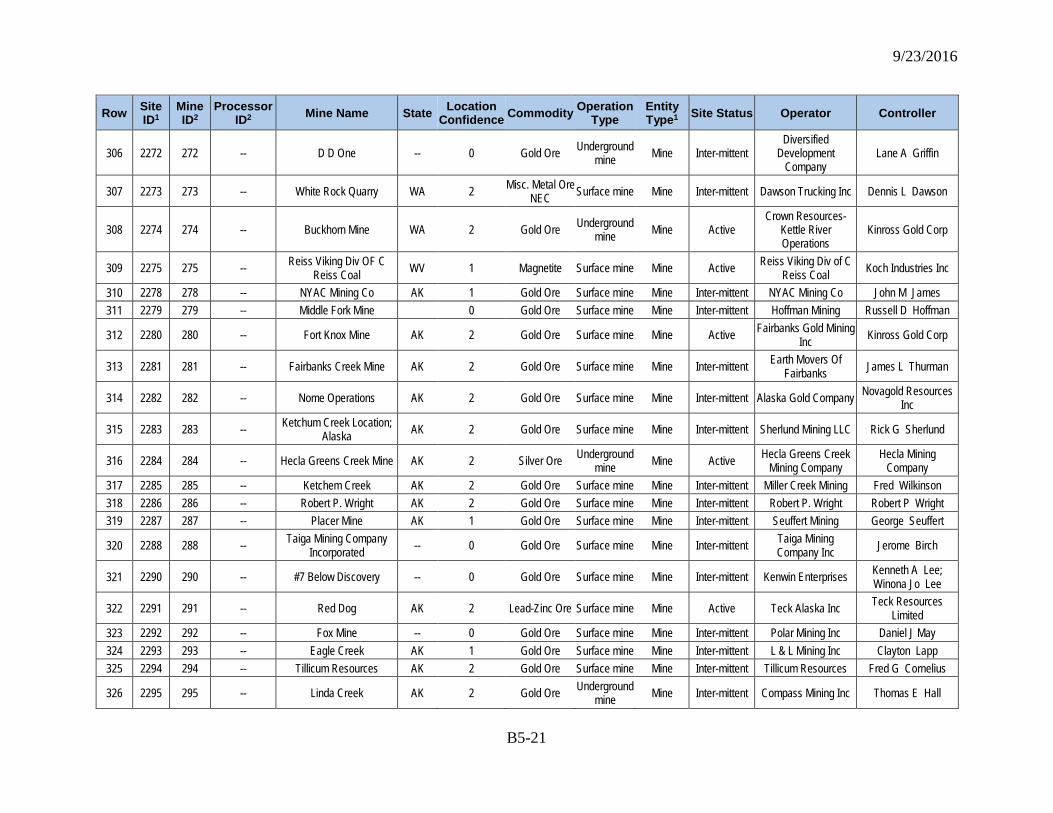
9/23/2016
B5-21
Row Site ID1
Mine ID2
Processor ID2 Mine Name State Location
Confidence Commodity Operation Type
Entity Type1 Site Status Operator Controller
306 2272 272 -- D D One -- 0 Gold Ore Underground mine Mine Inter-mittent
Diversified Development
Company Lane A Griffin
307 2273 273 -- White Rock Quarry WA 2 Misc. Metal Ore NEC Surface mine Mine Inter-mittent Dawson Trucking Inc Dennis L Dawson
308 2274 274 -- Buckhorn Mine WA 2 Gold Ore Underground mine Mine Active
Crown Resources-Kettle River Operations
Kinross Gold Corp
309 2275 275 -- Reiss Viking Div OF C Reiss Coal WV 1 Magnetite Surface mine Mine Active Reiss Viking Div of C
Reiss Coal Koch Industries Inc
310 2278 278 -- NYAC Mining Co AK 1 Gold Ore Surface mine Mine Inter-mittent NYAC Mining Co John M James 311 2279 279 -- Middle Fork Mine 0 Gold Ore Surface mine Mine Inter-mittent Hoffman Mining Russell D Hoffman
312 2280 280 -- Fort Knox Mine AK 2 Gold Ore Surface mine Mine Active Fairbanks Gold Mining Inc Kinross Gold Corp
313 2281 281 -- Fairbanks Creek Mine AK 2 Gold Ore Surface mine Mine Inter-mittent Earth Movers Of Fairbanks James L Thurman
314 2282 282 -- Nome Operations AK 2 Gold Ore Surface mine Mine Inter-mittent Alaska Gold Company Novagold Resources Inc
315 2283 283 -- Ketchum Creek Location; Alaska AK 2 Gold Ore Surface mine Mine Inter-mittent Sherlund Mining LLC Rick G Sherlund
316 2284 284 -- Hecla Greens Creek Mine AK 2 Silver Ore Underground mine Mine Active Hecla Greens Creek
Mining Company Hecla Mining
Company 317 2285 285 -- Ketchem Creek AK 2 Gold Ore Surface mine Mine Inter-mittent Miller Creek Mining Fred Wilkinson 318 2286 286 -- Robert P. Wright AK 2 Gold Ore Surface mine Mine Inter-mittent Robert P. Wright Robert P Wright 319 2287 287 -- Placer Mine AK 1 Gold Ore Surface mine Mine Inter-mittent Seuffert Mining George Seuffert
320 2288 288 -- Taiga Mining Company Incorporated -- 0 Gold Ore Surface mine Mine Inter-mittent Taiga Mining
Company Inc Jerome Birch
321 2290 290 -- #7 Below Discovery -- 0 Gold Ore Surface mine Mine Inter-mittent Kenwin Enterprises Kenneth A Lee; Winona Jo Lee
322 2291 291 -- Red Dog AK 2 Lead-Zinc Ore Surface mine Mine Active Teck Alaska Inc Teck Resources Limited
323 2292 292 -- Fox Mine -- 0 Gold Ore Surface mine Mine Inter-mittent Polar Mining Inc Daniel J May 324 2293 293 -- Eagle Creek AK 1 Gold Ore Surface mine Mine Inter-mittent L & L Mining Inc Clayton Lapp 325 2294 294 -- Tillicum Resources AK 2 Gold Ore Surface mine Mine Inter-mittent Tillicum Resources Fred G Cornelius
326 2295 295 -- Linda Creek AK 2 Gold Ore Underground mine Mine Inter-mittent Compass Mining Inc Thomas E Hall
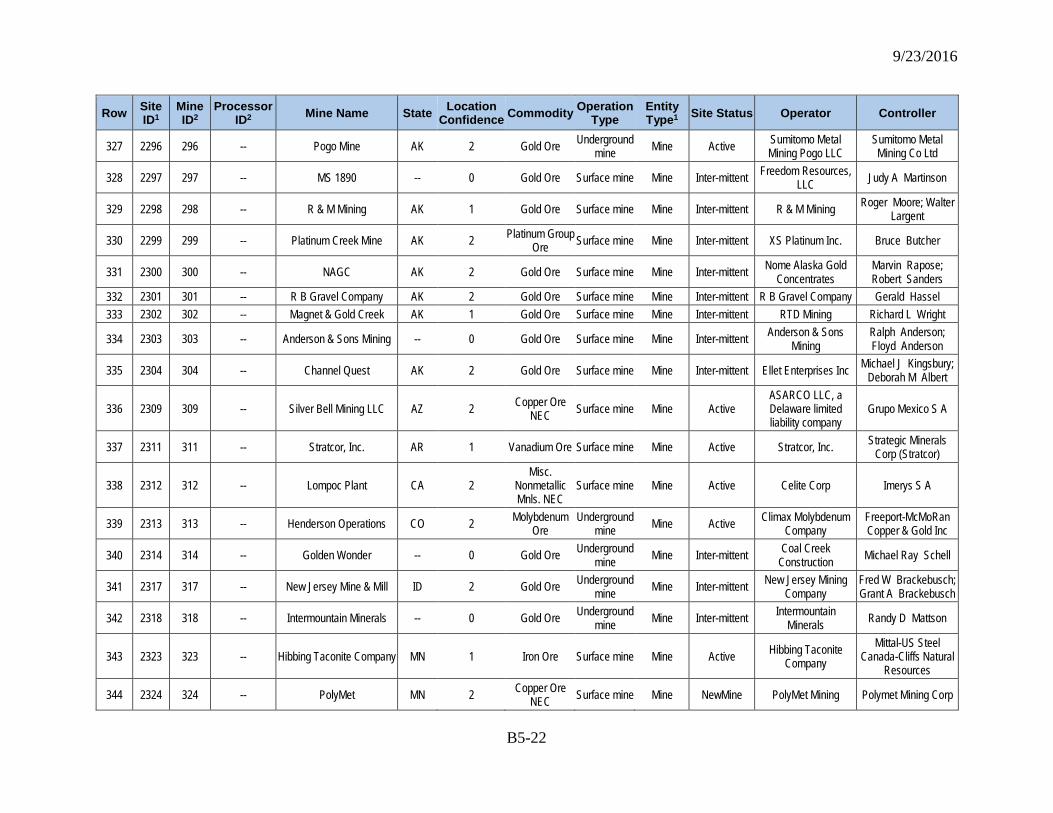
9/23/2016
B5-22
Row Site ID1
Mine ID2
Processor ID2 Mine Name State Location
Confidence Commodity Operation Type
Entity Type1 Site Status Operator Controller
327 2296 296 -- Pogo Mine AK 2 Gold Ore Underground mine Mine Active Sumitomo Metal
Mining Pogo LLC Sumitomo Metal Mining Co Ltd
328 2297 297 -- MS 1890 -- 0 Gold Ore Surface mine Mine Inter-mittent Freedom Resources, LLC Judy A Martinson
329 2298 298 -- R & M Mining AK 1 Gold Ore Surface mine Mine Inter-mittent R & M Mining Roger Moore; Walter Largent
330 2299 299 -- Platinum Creek Mine AK 2 Platinum Group Ore Surface mine Mine Inter-mittent XS Platinum Inc. Bruce Butcher
331 2300 300 -- NAGC AK 2 Gold Ore Surface mine Mine Inter-mittent Nome Alaska Gold Concentrates
Marvin Rapose; Robert Sanders
332 2301 301 -- R B Gravel Company AK 2 Gold Ore Surface mine Mine Inter-mittent R B Gravel Company Gerald Hassel 333 2302 302 -- Magnet & Gold Creek AK 1 Gold Ore Surface mine Mine Inter-mittent RTD Mining Richard L Wright
334 2303 303 -- Anderson & Sons Mining -- 0 Gold Ore Surface mine Mine Inter-mittent Anderson & Sons Mining
Ralph Anderson; Floyd Anderson
335 2304 304 -- Channel Quest AK 2 Gold Ore Surface mine Mine Inter-mittent Ellet Enterprises Inc Michael J Kingsbury; Deborah M Albert
336 2309 309 -- Silver Bell Mining LLC AZ 2 Copper Ore NEC Surface mine Mine Active
ASARCO LLC, a Delaware limited liability company
Grupo Mexico S A
337 2311 311 -- Stratcor, Inc. AR 1 Vanadium Ore Surface mine Mine Active Stratcor, Inc. Strategic Minerals Corp (Stratcor)
338 2312 312 -- Lompoc Plant CA 2 Misc.
Nonmetallic Mnls. NEC
Surface mine Mine Active Celite Corp Imerys S A
339 2313 313 -- Henderson Operations CO 2 Molybdenum Ore
Underground mine Mine Active Climax Molybdenum
Company Freeport-McMoRan Copper & Gold Inc
340 2314 314 -- Golden Wonder -- 0 Gold Ore Underground mine Mine Inter-mittent Coal Creek
Construction Michael Ray Schell
341 2317 317 -- New Jersey Mine & Mill ID 2 Gold Ore Underground mine Mine Inter-mittent New Jersey Mining
Company Fred W Brackebusch; Grant A Brackebusch
342 2318 318 -- Intermountain Minerals -- 0 Gold Ore Underground mine Mine Inter-mittent Intermountain
Minerals Randy D Mattson
343 2323 323 -- Hibbing Taconite Company MN 1 Iron Ore Surface mine Mine Active Hibbing Taconite Company
Mittal-US Steel Canada-Cliffs Natural
Resources
344 2324 324 -- PolyMet MN 2 Copper Ore NEC Surface mine Mine NewMine PolyMet Mining Polymet Mining Corp
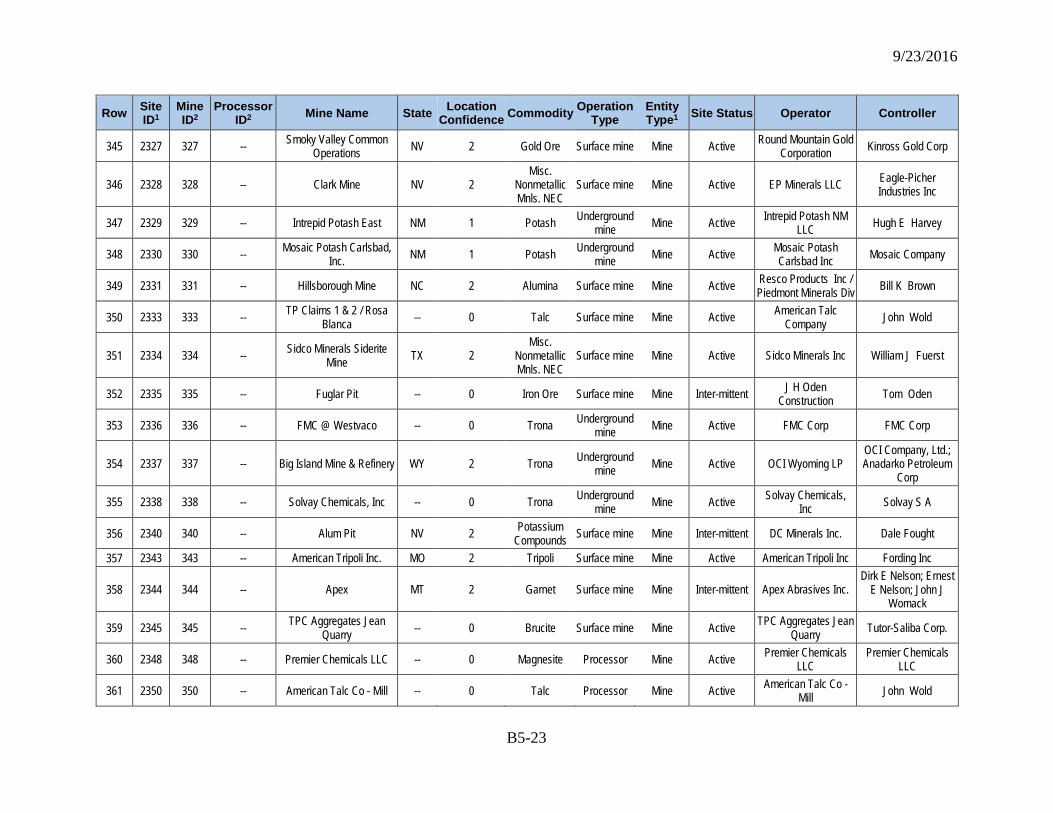
9/23/2016
B5-23
Row Site ID1
Mine ID2
Processor ID2 Mine Name State Location
Confidence Commodity Operation Type
Entity Type1 Site Status Operator Controller
345 2327 327 -- Smoky Valley Common Operations NV 2 Gold Ore Surface mine Mine Active Round Mountain Gold
Corporation Kinross Gold Corp
346 2328 328 -- Clark Mine NV 2 Misc.
Nonmetallic Mnls. NEC
Surface mine Mine Active EP Minerals LLC Eagle-Picher Industries Inc
347 2329 329 -- Intrepid Potash East NM 1 Potash Underground mine Mine Active Intrepid Potash NM
LLC Hugh E Harvey
348 2330 330 -- Mosaic Potash Carlsbad, Inc. NM 1 Potash Underground
mine Mine Active Mosaic Potash Carlsbad Inc Mosaic Company
349 2331 331 -- Hillsborough Mine NC 2 Alumina Surface mine Mine Active Resco Products Inc / Piedmont Minerals Div Bill K Brown
350 2333 333 -- TP Claims 1 & 2 / Rosa Blanca -- 0 Talc Surface mine Mine Active American Talc
Company John Wold
351 2334 334 -- Sidco Minerals Siderite Mine TX 2
Misc. Nonmetallic Mnls. NEC
Surface mine Mine Active Sidco Minerals Inc William J Fuerst
352 2335 335 -- Fuglar Pit -- 0 Iron Ore Surface mine Mine Inter-mittent J H Oden Construction Tom Oden
353 2336 336 -- FMC @ Westvaco -- 0 Trona Underground mine Mine Active FMC Corp FMC Corp
354 2337 337 -- Big Island Mine & Refinery WY 2 Trona Underground mine Mine Active OCI Wyoming LP
OCI Company, Ltd.; Anadarko Petroleum
Corp
355 2338 338 -- Solvay Chemicals, Inc -- 0 Trona Underground mine Mine Active Solvay Chemicals,
Inc Solvay S A
356 2340 340 -- Alum Pit NV 2 Potassium Compounds Surface mine Mine Inter-mittent DC Minerals Inc. Dale Fought
357 2343 343 -- American Tripoli Inc. MO 2 Tripoli Surface mine Mine Active American Tripoli Inc Fording Inc
358 2344 344 -- Apex MT 2 Garnet Surface mine Mine Inter-mittent Apex Abrasives Inc. Dirk E Nelson; Ernest
E Nelson; John J Womack
359 2345 345 -- TPC Aggregates Jean Quarry -- 0 Brucite Surface mine Mine Active TPC Aggregates Jean
Quarry Tutor-Saliba Corp.
360 2348 348 -- Premier Chemicals LLC -- 0 Magnesite Processor Mine Active Premier Chemicals LLC
Premier Chemicals LLC
361 2350 350 -- American Talc Co - Mill -- 0 Talc Processor Mine Active American Talc Co - Mill John Wold
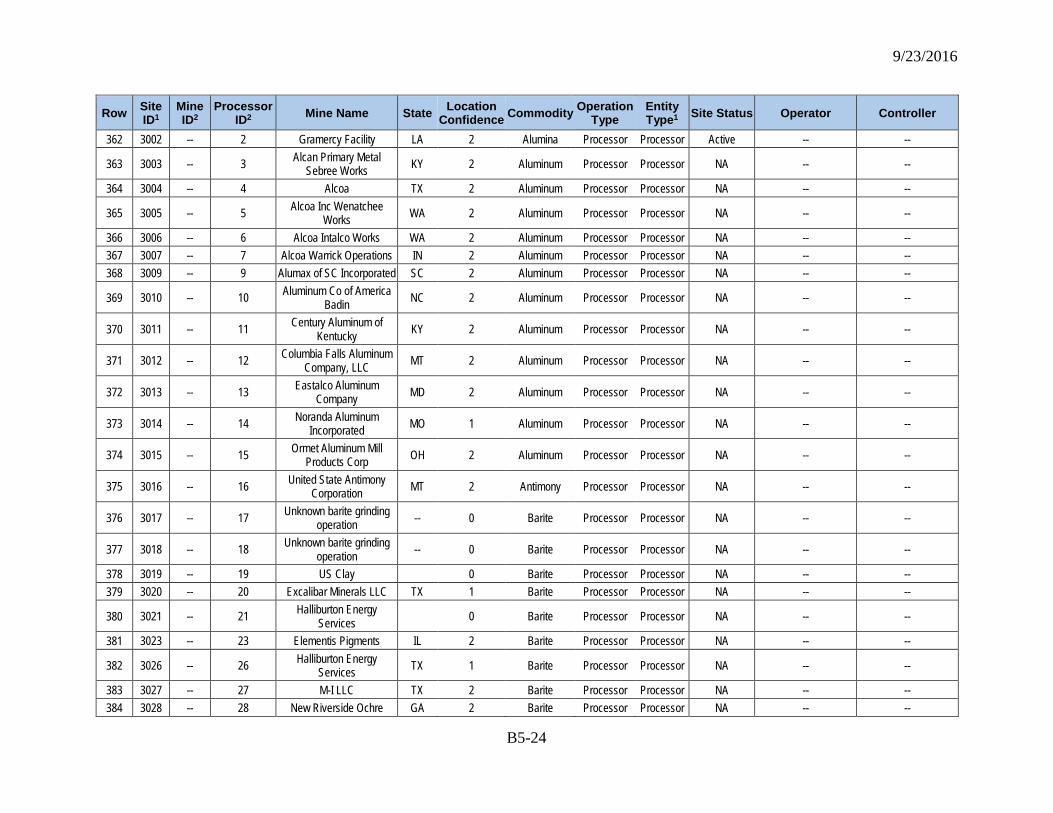
9/23/2016
B5-24
Row Site ID1
Mine ID2
Processor ID2 Mine Name State Location
Confidence Commodity Operation Type
Entity Type1 Site Status Operator Controller
362 3002 -- 2 Gramercy Facility LA 2 Alumina Processor Processor Active -- --
363 3003 -- 3 Alcan Primary Metal Sebree Works KY 2 Aluminum Processor Processor NA -- --
364 3004 -- 4 Alcoa TX 2 Aluminum Processor Processor NA -- --
365 3005 -- 5 Alcoa Inc Wenatchee Works WA 2 Aluminum Processor Processor NA -- --
366 3006 -- 6 Alcoa Intalco Works WA 2 Aluminum Processor Processor NA -- -- 367 3007 -- 7 Alcoa Warrick Operations IN 2 Aluminum Processor Processor NA -- -- 368 3009 -- 9 Alumax of SC Incorporated SC 2 Aluminum Processor Processor NA -- --
369 3010 -- 10 Aluminum Co of America Badin NC 2 Aluminum Processor Processor NA -- --
370 3011 -- 11 Century Aluminum of Kentucky KY 2 Aluminum Processor Processor NA -- --
371 3012 -- 12 Columbia Falls Aluminum Company, LLC MT 2 Aluminum Processor Processor NA -- --
372 3013 -- 13 Eastalco Aluminum Company MD 2 Aluminum Processor Processor NA -- --
373 3014 -- 14 Noranda Aluminum Incorporated MO 1 Aluminum Processor Processor NA -- --
374 3015 -- 15 Ormet Aluminum Mill Products Corp OH 2 Aluminum Processor Processor NA -- --
375 3016 -- 16 United State Antimony Corporation MT 2 Antimony Processor Processor NA -- --
376 3017 -- 17 Unknown barite grinding operation -- 0 Barite Processor Processor NA -- --
377 3018 -- 18 Unknown barite grinding operation -- 0 Barite Processor Processor NA -- --
378 3019 -- 19 US Clay 0 Barite Processor Processor NA -- -- 379 3020 -- 20 Excalibar Minerals LLC TX 1 Barite Processor Processor NA -- --
380 3021 -- 21 Halliburton Energy Services 0 Barite Processor Processor NA -- --
381 3023 -- 23 Elementis Pigments IL 2 Barite Processor Processor NA -- --
382 3026 -- 26 Halliburton Energy Services TX 1 Barite Processor Processor NA -- --
383 3027 -- 27 M-I LLC TX 2 Barite Processor Processor NA -- -- 384 3028 -- 28 New Riverside Ochre GA 2 Barite Processor Processor NA -- --
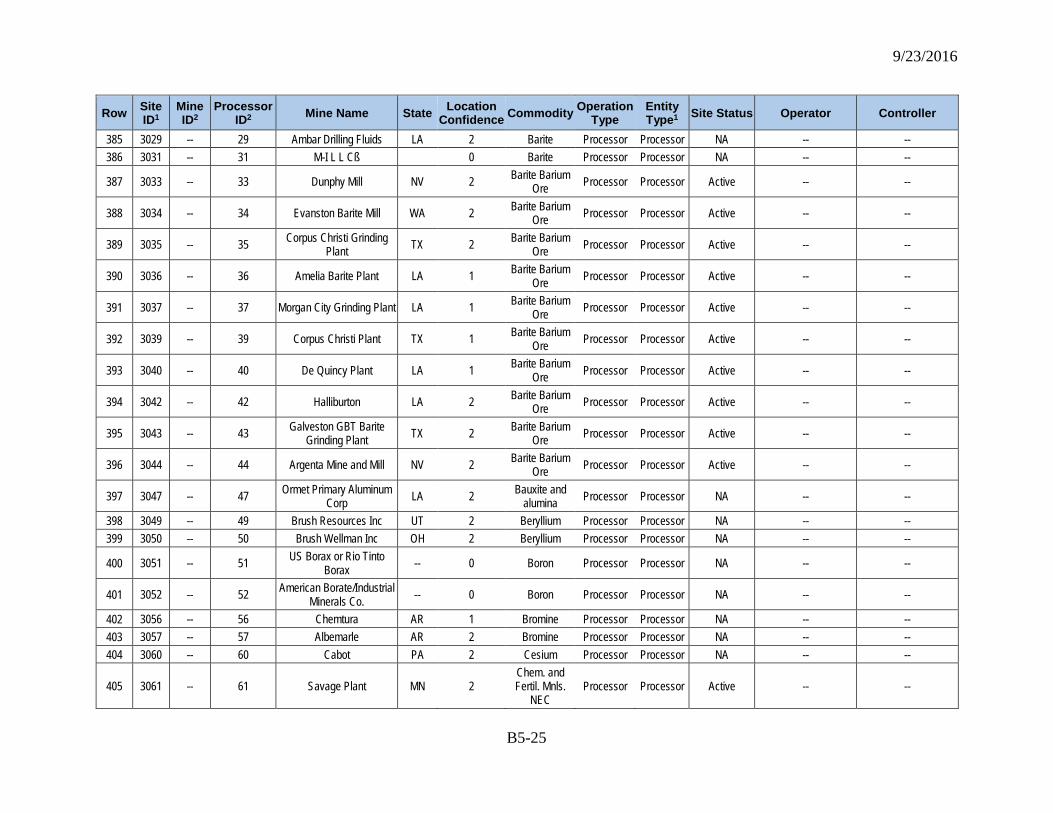
9/23/2016
B5-25
Row Site ID1
Mine ID2
Processor ID2 Mine Name State Location
Confidence Commodity Operation Type
Entity Type1 Site Status Operator Controller
385 3029 -- 29 Ambar Drilling Fluids LA 2 Barite Processor Processor NA -- -- 386 3031 -- 31 M-I L L Cß 0 Barite Processor Processor NA -- --
387 3033 -- 33 Dunphy Mill NV 2 Barite Barium Ore Processor Processor Active -- --
388 3034 -- 34 Evanston Barite Mill WA 2 Barite Barium Ore Processor Processor Active -- --
389 3035 -- 35 Corpus Christi Grinding Plant TX 2 Barite Barium
Ore Processor Processor Active -- --
390 3036 -- 36 Amelia Barite Plant LA 1 Barite Barium Ore Processor Processor Active -- --
391 3037 -- 37 Morgan City Grinding Plant LA 1 Barite Barium Ore Processor Processor Active -- --
392 3039 -- 39 Corpus Christi Plant TX 1 Barite Barium Ore Processor Processor Active -- --
393 3040 -- 40 De Quincy Plant LA 1 Barite Barium Ore Processor Processor Active -- --
394 3042 -- 42 Halliburton LA 2 Barite Barium Ore Processor Processor Active -- --
395 3043 -- 43 Galveston GBT Barite Grinding Plant TX 2 Barite Barium
Ore Processor Processor Active -- --
396 3044 -- 44 Argenta Mine and Mill NV 2 Barite Barium Ore Processor Processor Active -- --
397 3047 -- 47 Ormet Primary Aluminum Corp LA 2 Bauxite and
alumina Processor Processor NA -- --
398 3049 -- 49 Brush Resources Inc UT 2 Beryllium Processor Processor NA -- -- 399 3050 -- 50 Brush Wellman Inc OH 2 Beryllium Processor Processor NA -- --
400 3051 -- 51 US Borax or Rio Tinto Borax -- 0 Boron Processor Processor NA -- --
401 3052 -- 52 American Borate/Industrial Minerals Co. -- 0 Boron Processor Processor NA -- --
402 3056 -- 56 Chemtura AR 1 Bromine Processor Processor NA -- -- 403 3057 -- 57 Albemarle AR 2 Bromine Processor Processor NA -- -- 404 3060 -- 60 Cabot PA 2 Cesium Processor Processor NA -- --
405 3061 -- 61 Savage Plant MN 2 Chem. and Fertil. Mnls.
NEC Processor Processor Active -- --
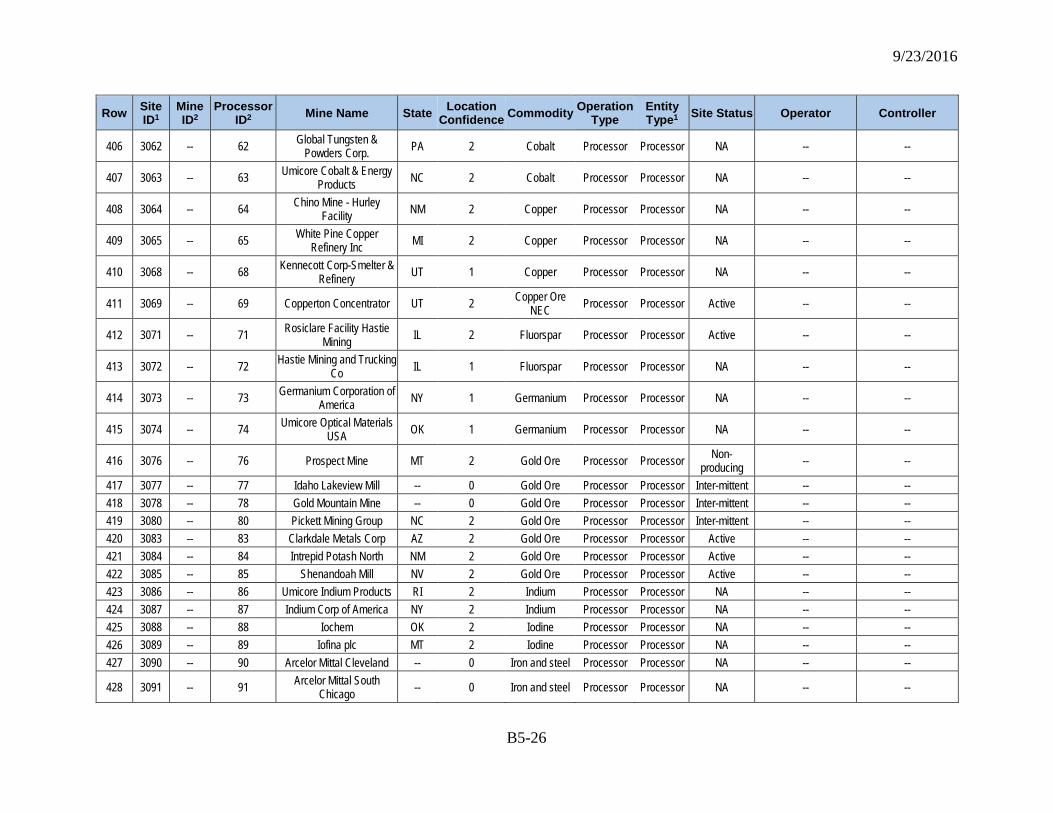
9/23/2016
B5-26
Row Site ID1
Mine ID2
Processor ID2 Mine Name State Location
Confidence Commodity Operation Type
Entity Type1 Site Status Operator Controller
406 3062 -- 62 Global Tungsten & Powders Corp. PA 2 Cobalt Processor Processor NA -- --
407 3063 -- 63 Umicore Cobalt & Energy Products NC 2 Cobalt Processor Processor NA -- --
408 3064 -- 64 Chino Mine - Hurley Facility NM 2 Copper Processor Processor NA -- --
409 3065 -- 65 White Pine Copper Refinery Inc MI 2 Copper Processor Processor NA -- --
410 3068 -- 68 Kennecott Corp-Smelter & Refinery UT 1 Copper Processor Processor NA -- --
411 3069 -- 69 Copperton Concentrator UT 2 Copper Ore NEC Processor Processor Active -- --
412 3071 -- 71 Rosiclare Facility Hastie Mining IL 2 Fluorspar Processor Processor Active -- --
413 3072 -- 72 Hastie Mining and Trucking Co IL 1 Fluorspar Processor Processor NA -- --
414 3073 -- 73 Germanium Corporation of America NY 1 Germanium Processor Processor NA -- --
415 3074 -- 74 Umicore Optical Materials USA OK 1 Germanium Processor Processor NA -- --
416 3076 -- 76 Prospect Mine MT 2 Gold Ore Processor Processor Non-producing -- --
417 3077 -- 77 Idaho Lakeview Mill -- 0 Gold Ore Processor Processor Inter-mittent -- -- 418 3078 -- 78 Gold Mountain Mine -- 0 Gold Ore Processor Processor Inter-mittent -- -- 419 3080 -- 80 Pickett Mining Group NC 2 Gold Ore Processor Processor Inter-mittent -- -- 420 3083 -- 83 Clarkdale Metals Corp AZ 2 Gold Ore Processor Processor Active -- -- 421 3084 -- 84 Intrepid Potash North NM 2 Gold Ore Processor Processor Active -- -- 422 3085 -- 85 Shenandoah Mill NV 2 Gold Ore Processor Processor Active -- -- 423 3086 -- 86 Umicore Indium Products RI 2 Indium Processor Processor NA -- -- 424 3087 -- 87 Indium Corp of America NY 2 Indium Processor Processor NA -- -- 425 3088 -- 88 Iochem OK 2 Iodine Processor Processor NA -- -- 426 3089 -- 89 Iofina plc MT 2 Iodine Processor Processor NA -- -- 427 3090 -- 90 Arcelor Mittal Cleveland -- 0 Iron and steel Processor Processor NA -- --
428 3091 -- 91 Arcelor Mittal South Chicago -- 0 Iron and steel Processor Processor NA -- --
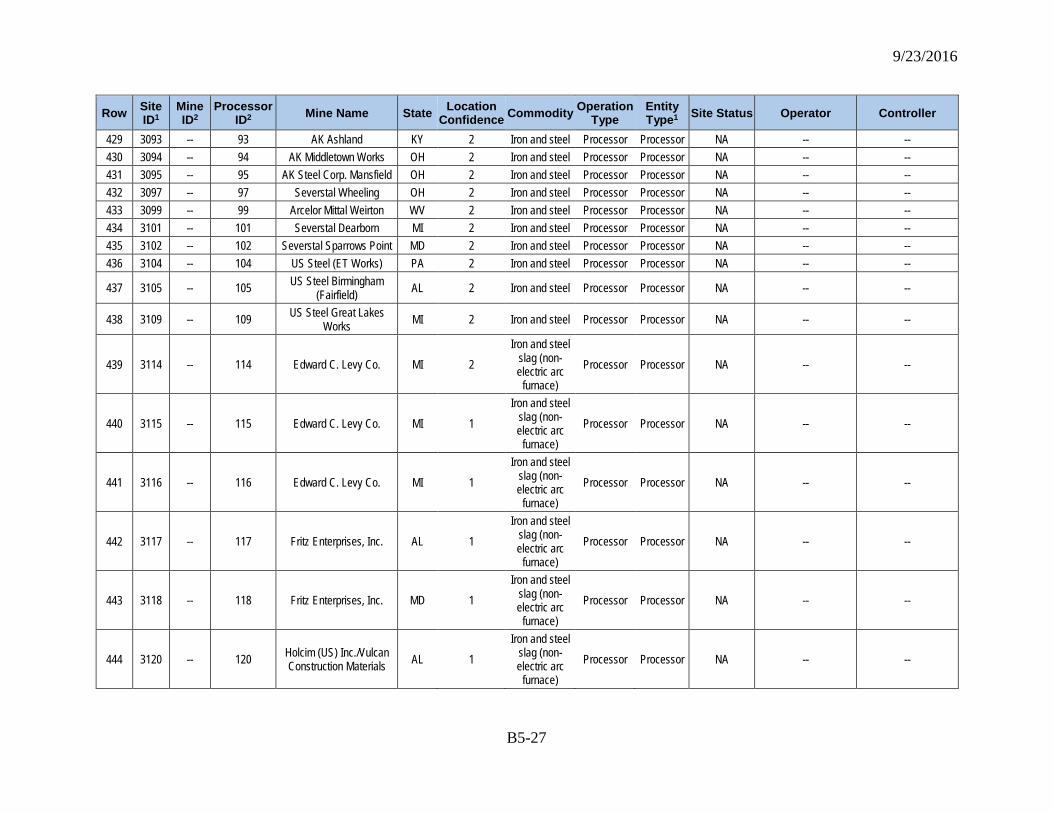
9/23/2016
B5-27
Row Site ID1
Mine ID2
Processor ID2 Mine Name State Location
Confidence Commodity Operation Type
Entity Type1 Site Status Operator Controller
429 3093 -- 93 AK Ashland KY 2 Iron and steel Processor Processor NA -- -- 430 3094 -- 94 AK Middletown Works OH 2 Iron and steel Processor Processor NA -- -- 431 3095 -- 95 AK Steel Corp. Mansfield OH 2 Iron and steel Processor Processor NA -- -- 432 3097 -- 97 Severstal Wheeling OH 2 Iron and steel Processor Processor NA -- -- 433 3099 -- 99 Arcelor Mittal Weirton WV 2 Iron and steel Processor Processor NA -- -- 434 3101 -- 101 Severstal Dearborn MI 2 Iron and steel Processor Processor NA -- -- 435 3102 -- 102 Severstal Sparrows Point MD 2 Iron and steel Processor Processor NA -- -- 436 3104 -- 104 US Steel (ET Works) PA 2 Iron and steel Processor Processor NA -- --
437 3105 -- 105 US Steel Birmingham (Fairfield) AL 2 Iron and steel Processor Processor NA -- --
438 3109 -- 109 US Steel Great Lakes Works MI 2 Iron and steel Processor Processor NA -- --
439 3114 -- 114 Edward C. Levy Co. MI 2 Iron and steel
slag (non-electric arc
furnace) Processor Processor NA -- --
440 3115 -- 115 Edward C. Levy Co. MI 1 Iron and steel
slag (non-electric arc
furnace) Processor Processor NA -- --
441 3116 -- 116 Edward C. Levy Co. MI 1 Iron and steel
slag (non-electric arc
furnace) Processor Processor NA -- --
442 3117 -- 117 Fritz Enterprises, Inc. AL 1 Iron and steel
slag (non-electric arc
furnace) Processor Processor NA -- --
443 3118 -- 118 Fritz Enterprises, Inc. MD 1 Iron and steel
slag (non-electric arc
furnace) Processor Processor NA -- --
444 3120 -- 120 Holcim (US) Inc./Vulcan Construction Materials AL 1
Iron and steel slag (non-electric arc
furnace) Processor Processor NA -- --
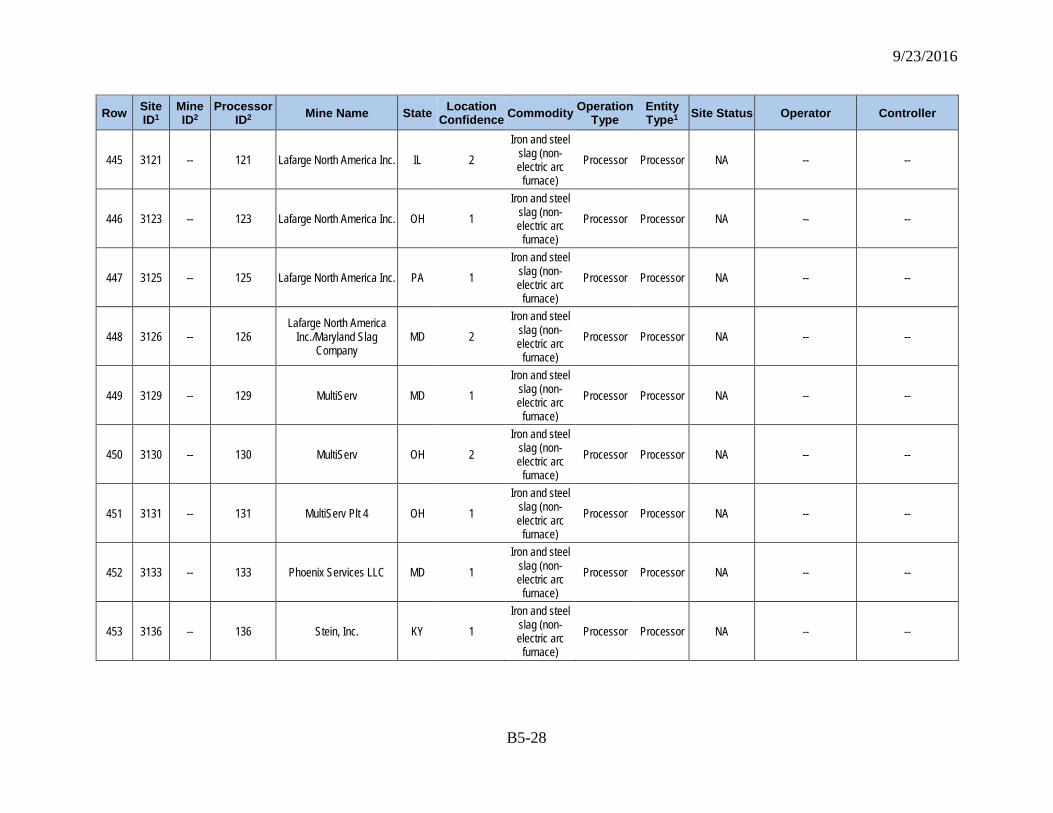
9/23/2016
B5-28
Row Site ID1
Mine ID2
Processor ID2 Mine Name State Location
Confidence Commodity Operation Type
Entity Type1 Site Status Operator Controller
445 3121 -- 121 Lafarge North America Inc. IL 2 Iron and steel
slag (non-electric arc
furnace) Processor Processor NA -- --
446 3123 -- 123 Lafarge North America Inc. OH 1 Iron and steel
slag (non-electric arc
furnace) Processor Processor NA -- --
447 3125 -- 125 Lafarge North America Inc. PA 1 Iron and steel
slag (non-electric arc
furnace) Processor Processor NA -- --
448 3126 -- 126 Lafarge North America
Inc./Maryland Slag Company
MD 2 Iron and steel
slag (non-electric arc
furnace) Processor Processor NA -- --
449 3129 -- 129 MultiServ MD 1 Iron and steel
slag (non-electric arc
furnace) Processor Processor NA -- --
450 3130 -- 130 MultiServ OH 2 Iron and steel
slag (non-electric arc
furnace) Processor Processor NA -- --
451 3131 -- 131 MultiServ Plt 4 OH 1 Iron and steel
slag (non-electric arc
furnace) Processor Processor NA -- --
452 3133 -- 133 Phoenix Services LLC MD 1 Iron and steel
slag (non-electric arc
furnace) Processor Processor NA -- --
453 3136 -- 136 Stein, Inc. KY 1 Iron and steel
slag (non-electric arc
furnace) Processor Processor NA -- --
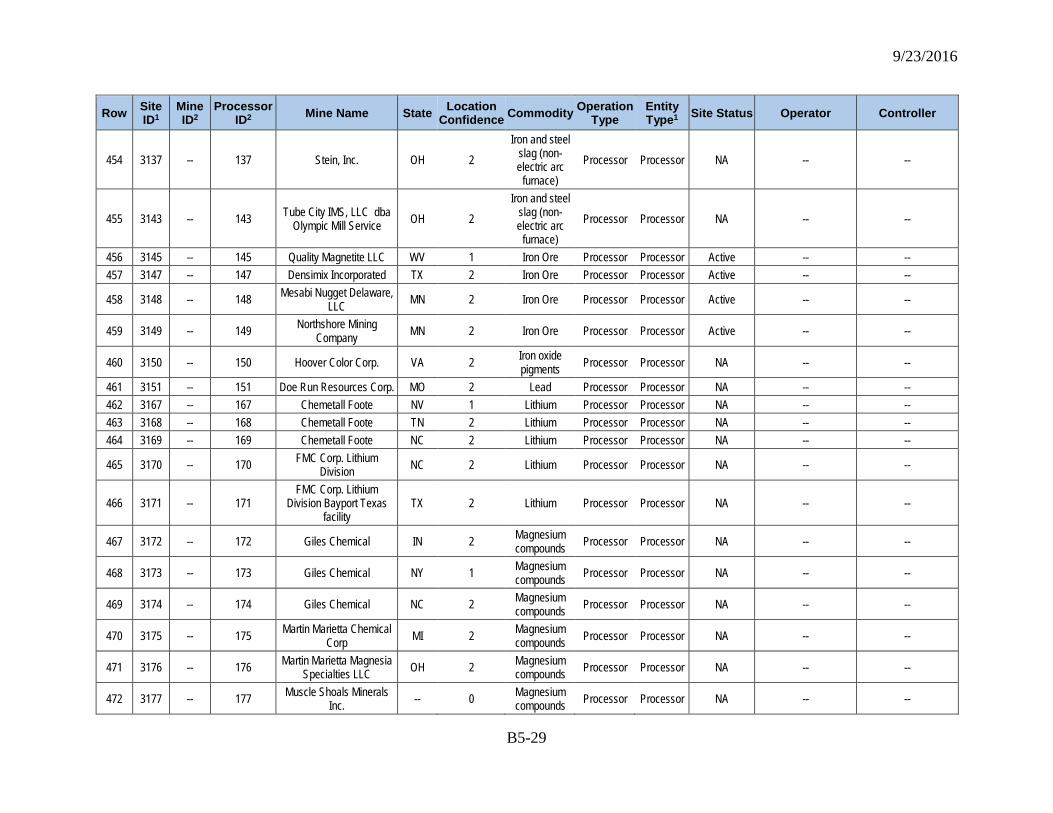
9/23/2016
B5-29
Row Site ID1
Mine ID2
Processor ID2 Mine Name State Location
Confidence Commodity Operation Type
Entity Type1 Site Status Operator Controller
454 3137 -- 137 Stein, Inc. OH 2 Iron and steel
slag (non-electric arc
furnace) Processor Processor NA -- --
455 3143 -- 143 Tube City IMS, LLC dba Olympic Mill Service OH 2
Iron and steel slag (non-electric arc
furnace) Processor Processor NA -- --
456 3145 -- 145 Quality Magnetite LLC WV 1 Iron Ore Processor Processor Active -- -- 457 3147 -- 147 Densimix Incorporated TX 2 Iron Ore Processor Processor Active -- --
458 3148 -- 148 Mesabi Nugget Delaware, LLC MN 2 Iron Ore Processor Processor Active -- --
459 3149 -- 149 Northshore Mining Company MN 2 Iron Ore Processor Processor Active -- --
460 3150 -- 150 Hoover Color Corp. VA 2 Iron oxide pigments Processor Processor NA -- --
461 3151 -- 151 Doe Run Resources Corp. MO 2 Lead Processor Processor NA -- -- 462 3167 -- 167 Chemetall Foote NV 1 Lithium Processor Processor NA -- -- 463 3168 -- 168 Chemetall Foote TN 2 Lithium Processor Processor NA -- -- 464 3169 -- 169 Chemetall Foote NC 2 Lithium Processor Processor NA -- --
465 3170 -- 170 FMC Corp. Lithium Division NC 2 Lithium Processor Processor NA -- --
466 3171 -- 171 FMC Corp. Lithium
Division Bayport Texas facility
TX 2 Lithium Processor Processor NA -- --
467 3172 -- 172 Giles Chemical IN 2 Magnesium compounds Processor Processor NA -- --
468 3173 -- 173 Giles Chemical NY 1 Magnesium compounds Processor Processor NA -- --
469 3174 -- 174 Giles Chemical NC 2 Magnesium compounds Processor Processor NA -- --
470 3175 -- 175 Martin Marietta Chemical Corp MI 2 Magnesium
compounds Processor Processor NA -- --
471 3176 -- 176 Martin Marietta Magnesia Specialties LLC OH 2 Magnesium
compounds Processor Processor NA -- --
472 3177 -- 177 Muscle Shoals Minerals Inc. -- 0 Magnesium
compounds Processor Processor NA -- --
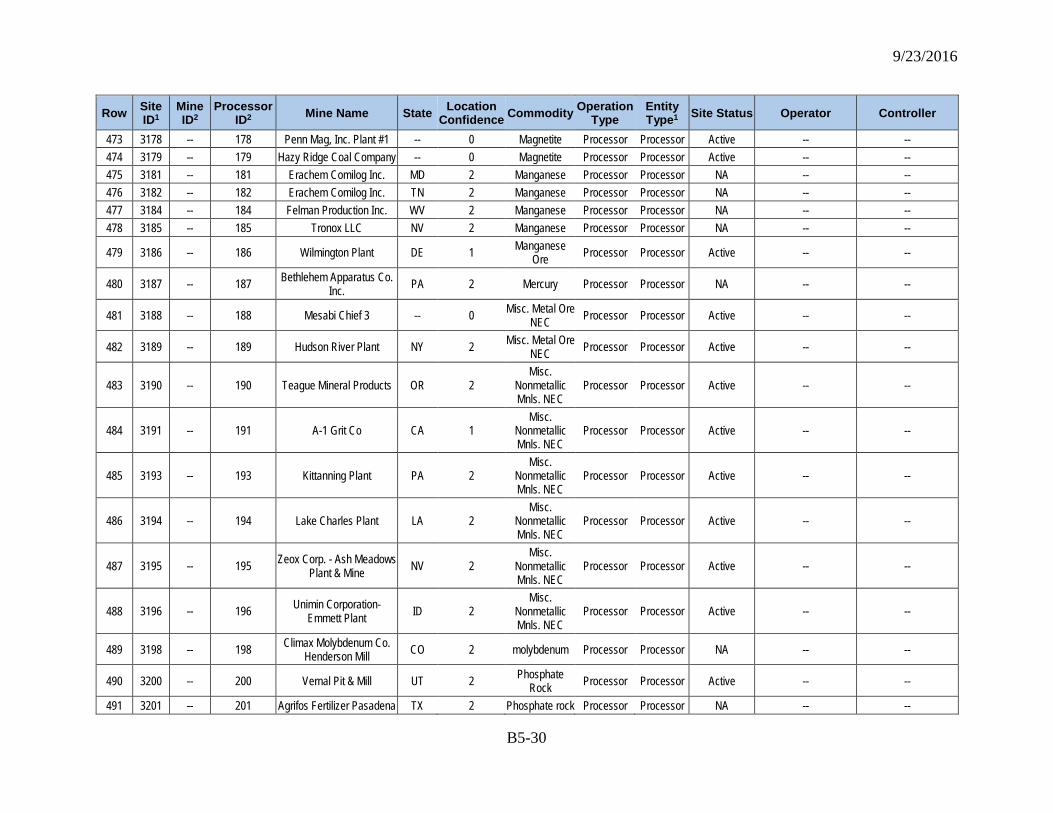
9/23/2016
B5-30
Row Site ID1
Mine ID2
Processor ID2 Mine Name State Location
Confidence Commodity Operation Type
Entity Type1 Site Status Operator Controller
473 3178 -- 178 Penn Mag, Inc. Plant #1 -- 0 Magnetite Processor Processor Active -- -- 474 3179 -- 179 Hazy Ridge Coal Company -- 0 Magnetite Processor Processor Active -- -- 475 3181 -- 181 Erachem Comilog Inc. MD 2 Manganese Processor Processor NA -- -- 476 3182 -- 182 Erachem Comilog Inc. TN 2 Manganese Processor Processor NA -- -- 477 3184 -- 184 Felman Production Inc. WV 2 Manganese Processor Processor NA -- -- 478 3185 -- 185 Tronox LLC NV 2 Manganese Processor Processor NA -- --
479 3186 -- 186 Wilmington Plant DE 1 Manganese Ore Processor Processor Active -- --
480 3187 -- 187 Bethlehem Apparatus Co. Inc. PA 2 Mercury Processor Processor NA -- --
481 3188 -- 188 Mesabi Chief 3 -- 0 Misc. Metal Ore NEC Processor Processor Active -- --
482 3189 -- 189 Hudson River Plant NY 2 Misc. Metal Ore NEC Processor Processor Active -- --
483 3190 -- 190 Teague Mineral Products OR 2 Misc.
Nonmetallic Mnls. NEC
Processor Processor Active -- --
484 3191 -- 191 A-1 Grit Co CA 1 Misc.
Nonmetallic Mnls. NEC
Processor Processor Active -- --
485 3193 -- 193 Kittanning Plant PA 2 Misc.
Nonmetallic Mnls. NEC
Processor Processor Active -- --
486 3194 -- 194 Lake Charles Plant LA 2 Misc.
Nonmetallic Mnls. NEC
Processor Processor Active -- --
487 3195 -- 195 Zeox Corp. - Ash Meadows Plant & Mine NV 2
Misc. Nonmetallic Mnls. NEC
Processor Processor Active -- --
488 3196 -- 196 Unimin Corporation-Emmett Plant ID 2
Misc. Nonmetallic Mnls. NEC
Processor Processor Active -- --
489 3198 -- 198 Climax Molybdenum Co. Henderson Mill CO 2 molybdenum Processor Processor NA -- --
490 3200 -- 200 Vernal Pit & Mill UT 2 Phosphate Rock Processor Processor Active -- --
491 3201 -- 201 Agrifos Fertilizer Pasadena TX 2 Phosphate rock Processor Processor NA -- --
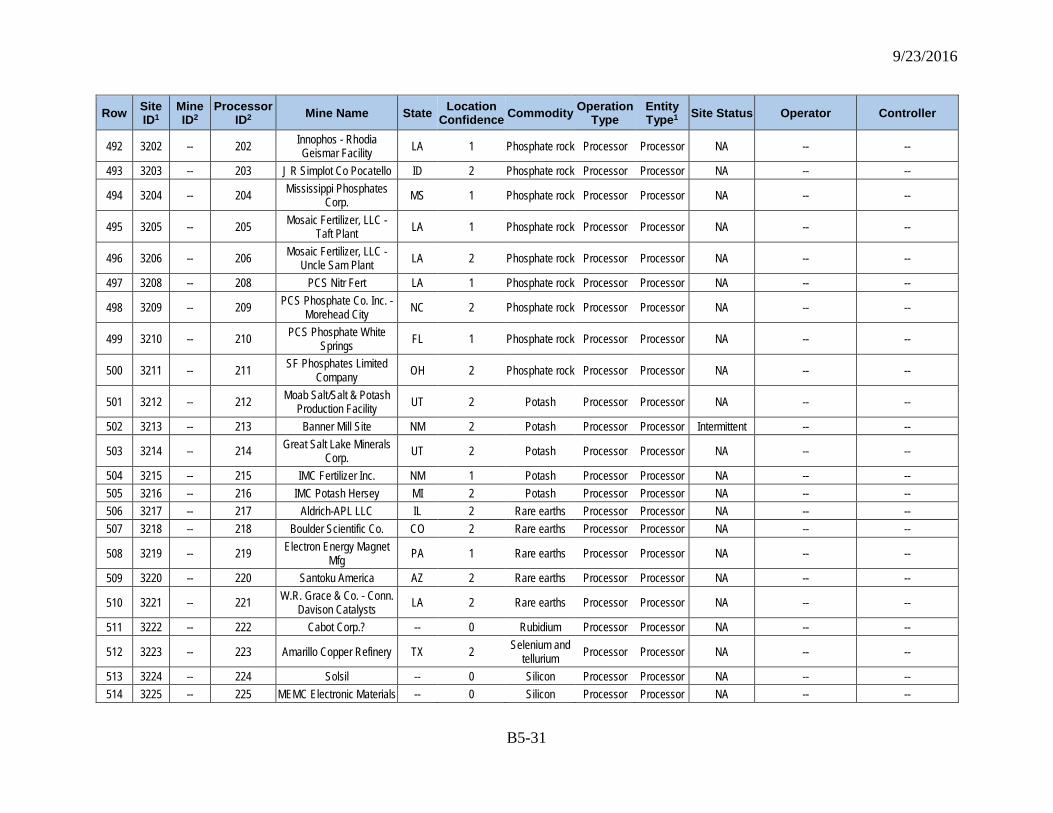
9/23/2016
B5-31
Row Site ID1
Mine ID2
Processor ID2 Mine Name State Location
Confidence Commodity Operation Type
Entity Type1 Site Status Operator Controller
492 3202 -- 202 Innophos - Rhodia Geismar Facility LA 1 Phosphate rock Processor Processor NA -- --
493 3203 -- 203 J R Simplot Co Pocatello ID 2 Phosphate rock Processor Processor NA -- --
494 3204 -- 204 Mississippi Phosphates Corp. MS 1 Phosphate rock Processor Processor NA -- --
495 3205 -- 205 Mosaic Fertilizer, LLC - Taft Plant LA 1 Phosphate rock Processor Processor NA -- --
496 3206 -- 206 Mosaic Fertilizer, LLC - Uncle Sam Plant LA 2 Phosphate rock Processor Processor NA -- --
497 3208 -- 208 PCS Nitr Fert LA 1 Phosphate rock Processor Processor NA -- --
498 3209 -- 209 PCS Phosphate Co. Inc. - Morehead City NC 2 Phosphate rock Processor Processor NA -- --
499 3210 -- 210 PCS Phosphate White Springs FL 1 Phosphate rock Processor Processor NA -- --
500 3211 -- 211 SF Phosphates Limited Company OH 2 Phosphate rock Processor Processor NA -- --
501 3212 -- 212 Moab Salt/Salt & Potash Production Facility UT 2 Potash Processor Processor NA -- --
502 3213 -- 213 Banner Mill Site NM 2 Potash Processor Processor Intermittent -- --
503 3214 -- 214 Great Salt Lake Minerals Corp. UT 2 Potash Processor Processor NA -- --
504 3215 -- 215 IMC Fertilizer Inc. NM 1 Potash Processor Processor NA -- -- 505 3216 -- 216 IMC Potash Hersey MI 2 Potash Processor Processor NA -- -- 506 3217 -- 217 Aldrich-APL LLC IL 2 Rare earths Processor Processor NA -- -- 507 3218 -- 218 Boulder Scientific Co. CO 2 Rare earths Processor Processor NA -- --
508 3219 -- 219 Electron Energy Magnet Mfg PA 1 Rare earths Processor Processor NA -- --
509 3220 -- 220 Santoku America AZ 2 Rare earths Processor Processor NA -- --
510 3221 -- 221 W.R. Grace & Co. - Conn. Davison Catalysts LA 2 Rare earths Processor Processor NA -- --
511 3222 -- 222 Cabot Corp.? -- 0 Rubidium Processor Processor NA -- --
512 3223 -- 223 Amarillo Copper Refinery TX 2 Selenium and tellurium Processor Processor NA -- --
513 3224 -- 224 Solsil -- 0 Silicon Processor Processor NA -- -- 514 3225 -- 225 MEMC Electronic Materials -- 0 Silicon Processor Processor NA -- --
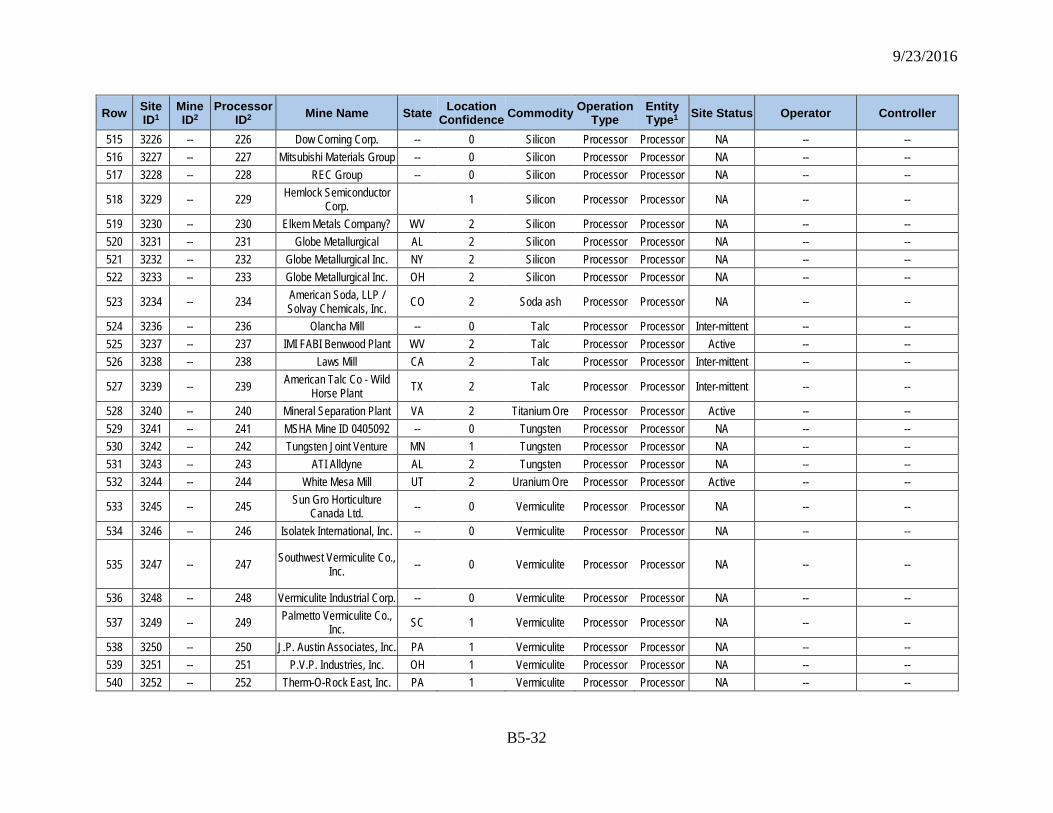
9/23/2016
B5-32
Row Site ID1
Mine ID2
Processor ID2 Mine Name State Location
Confidence Commodity Operation Type
Entity Type1 Site Status Operator Controller
515 3226 -- 226 Dow Corning Corp. -- 0 Silicon Processor Processor NA -- -- 516 3227 -- 227 Mitsubishi Materials Group -- 0 Silicon Processor Processor NA -- -- 517 3228 -- 228 REC Group -- 0 Silicon Processor Processor NA -- --
518 3229 -- 229 Hemlock Semiconductor Corp. 1 Silicon Processor Processor NA -- --
519 3230 -- 230 Elkem Metals Company? WV 2 Silicon Processor Processor NA -- -- 520 3231 -- 231 Globe Metallurgical AL 2 Silicon Processor Processor NA -- -- 521 3232 -- 232 Globe Metallurgical Inc. NY 2 Silicon Processor Processor NA -- -- 522 3233 -- 233 Globe Metallurgical Inc. OH 2 Silicon Processor Processor NA -- --
523 3234 -- 234 American Soda, LLP / Solvay Chemicals, Inc. CO 2 Soda ash Processor Processor NA -- --
524 3236 -- 236 Olancha Mill -- 0 Talc Processor Processor Inter-mittent -- -- 525 3237 -- 237 IMI FABI Benwood Plant WV 2 Talc Processor Processor Active -- -- 526 3238 -- 238 Laws Mill CA 2 Talc Processor Processor Inter-mittent -- --
527 3239 -- 239 American Talc Co - Wild Horse Plant TX 2 Talc Processor Processor Inter-mittent -- --
528 3240 -- 240 Mineral Separation Plant VA 2 Titanium Ore Processor Processor Active -- -- 529 3241 -- 241 MSHA Mine ID 0405092 -- 0 Tungsten Processor Processor NA -- -- 530 3242 -- 242 Tungsten Joint Venture MN 1 Tungsten Processor Processor NA -- -- 531 3243 -- 243 ATI Alldyne AL 2 Tungsten Processor Processor NA -- -- 532 3244 -- 244 White Mesa Mill UT 2 Uranium Ore Processor Processor Active -- --
533 3245 -- 245 Sun Gro Horticulture Canada Ltd. -- 0 Vermiculite Processor Processor NA -- --
534 3246 -- 246 Isolatek International, Inc. -- 0 Vermiculite Processor Processor NA -- --
535 3247 -- 247 Southwest Vermiculite Co., Inc. -- 0 Vermiculite Processor Processor NA -- --
536 3248 -- 248 Vermiculite Industrial Corp. -- 0 Vermiculite Processor Processor NA -- --
537 3249 -- 249 Palmetto Vermiculite Co., Inc. SC 1 Vermiculite Processor Processor NA -- --
538 3250 -- 250 J.P. Austin Associates, Inc. PA 1 Vermiculite Processor Processor NA -- -- 539 3251 -- 251 P.V.P. Industries, Inc. OH 1 Vermiculite Processor Processor NA -- -- 540 3252 -- 252 Therm-O-Rock East, Inc. PA 1 Vermiculite Processor Processor NA -- --
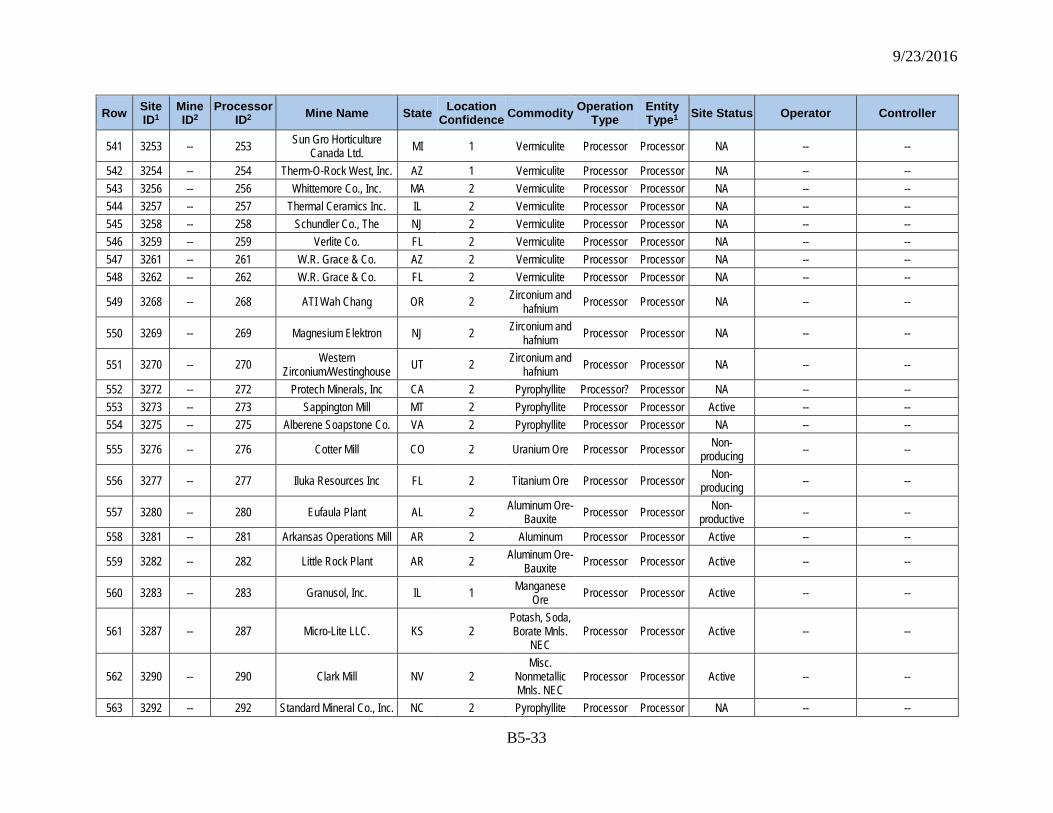
9/23/2016
B5-33
Row Site ID1
Mine ID2
Processor ID2 Mine Name State Location
Confidence Commodity Operation Type
Entity Type1 Site Status Operator Controller
541 3253 -- 253 Sun Gro Horticulture Canada Ltd. MI 1 Vermiculite Processor Processor NA -- --
542 3254 -- 254 Therm-O-Rock West, Inc. AZ 1 Vermiculite Processor Processor NA -- -- 543 3256 -- 256 Whittemore Co., Inc. MA 2 Vermiculite Processor Processor NA -- -- 544 3257 -- 257 Thermal Ceramics Inc. IL 2 Vermiculite Processor Processor NA -- -- 545 3258 -- 258 Schundler Co., The NJ 2 Vermiculite Processor Processor NA -- -- 546 3259 -- 259 Verlite Co. FL 2 Vermiculite Processor Processor NA -- -- 547 3261 -- 261 W.R. Grace & Co. AZ 2 Vermiculite Processor Processor NA -- -- 548 3262 -- 262 W.R. Grace & Co. FL 2 Vermiculite Processor Processor NA -- --
549 3268 -- 268 ATI Wah Chang OR 2 Zirconium and hafnium Processor Processor NA -- --
550 3269 -- 269 Magnesium Elektron NJ 2 Zirconium and hafnium Processor Processor NA -- --
551 3270 -- 270 Western Zirconium/Westinghouse UT 2 Zirconium and
hafnium Processor Processor NA -- --
552 3272 -- 272 Protech Minerals, Inc CA 2 Pyrophyllite Processor? Processor NA -- -- 553 3273 -- 273 Sappington Mill MT 2 Pyrophyllite Processor Processor Active -- -- 554 3275 -- 275 Alberene Soapstone Co. VA 2 Pyrophyllite Processor Processor NA -- --
555 3276 -- 276 Cotter Mill CO 2 Uranium Ore Processor Processor Non-producing -- --
556 3277 -- 277 Iluka Resources Inc FL 2 Titanium Ore Processor Processor Non-producing -- --
557 3280 -- 280 Eufaula Plant AL 2 Aluminum Ore-Bauxite Processor Processor Non-
productive -- --
558 3281 -- 281 Arkansas Operations Mill AR 2 Aluminum Processor Processor Active -- --
559 3282 -- 282 Little Rock Plant AR 2 Aluminum Ore-Bauxite Processor Processor Active -- --
560 3283 -- 283 Granusol, Inc. IL 1 Manganese Ore Processor Processor Active -- --
561 3287 -- 287 Micro-Lite LLC. KS 2 Potash, Soda, Borate Mnls.
NEC Processor Processor Active -- --
562 3290 -- 290 Clark Mill NV 2 Misc.
Nonmetallic Mnls. NEC
Processor Processor Active -- --
563 3292 -- 292 Standard Mineral Co., Inc. NC 2 Pyrophyllite Processor Processor NA -- --
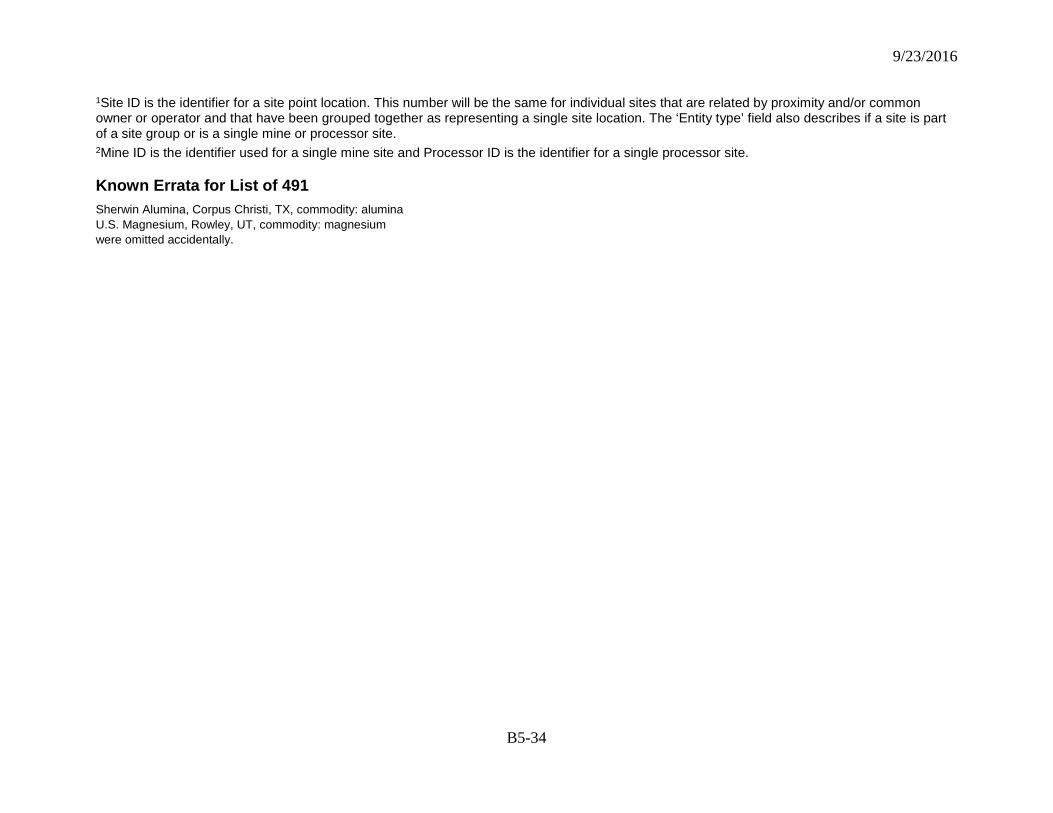
9/23/2016
B5-34
1Site ID is the identifier for a site point location. This number will be the same for individual sites that are related by proximity and/or common owner or operator and that have been grouped together as representing a single site location. The ‘Entity type’ field also describes if a site is part of a site group or is a single mine or processor site. 2Mine ID is the identifier used for a single mine site and Processor ID is the identifier for a single processor site.
Known Errata for List of 491 Sherwin Alumina, Corpus Christi, TX, commodity: alumina U.S. Magnesium, Rowley, UT, commodity: magnesium were omitted accidentally.
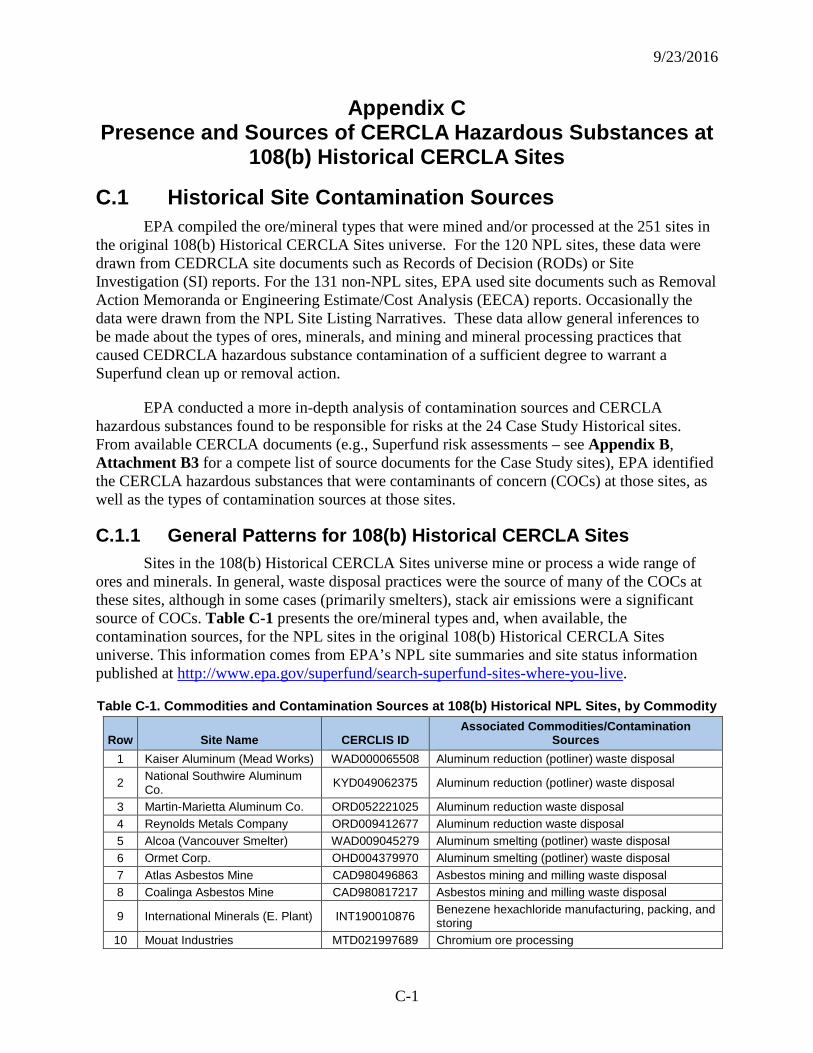
9/23/2016
C-1
Appendix C Presence and Sources of CERCLA Hazardous Substances at
108(b) Historical CERCLA Sites
C.1 Historical Site Contamination Sources EPA compiled the ore/mineral types that were mined and/or processed at the 251 sites in
the original 108(b) Historical CERCLA Sites universe. For the 120 NPL sites, these data were drawn from CEDRCLA site documents such as Records of Decision (RODs) or Site Investigation (SI) reports. For the 131 non-NPL sites, EPA used site documents such as Removal Action Memoranda or Engineering Estimate/Cost Analysis (EECA) reports. Occasionally the data were drawn from the NPL Site Listing Narratives. These data allow general inferences to be made about the types of ores, minerals, and mining and mineral processing practices that caused CEDRCLA hazardous substance contamination of a sufficient degree to warrant a Superfund clean up or removal action.
EPA conducted a more in-depth analysis of contamination sources and CERCLA hazardous substances found to be responsible for risks at the 24 Case Study Historical sites. From available CERCLA documents (e.g., Superfund risk assessments – see Appendix B, Attachment B3 for a compete list of source documents for the Case Study sites), EPA identified the CERCLA hazardous substances that were contaminants of concern (COCs) at those sites, as well as the types of contamination sources at those sites.
C.1.1 General Patterns for 108(b) Historical CERCLA Sites Sites in the 108(b) Historical CERCLA Sites universe mine or process a wide range of
ores and minerals. In general, waste disposal practices were the source of many of the COCs at these sites, although in some cases (primarily smelters), stack air emissions were a significant source of COCs. Table C-1 presents the ore/mineral types and, when available, the contamination sources, for the NPL sites in the original 108(b) Historical CERCLA Sites universe. This information comes from EPA’s NPL site summaries and site status information published at http://www.epa.gov/superfund/search-superfund-sites-where-you-live.
Table C-1. Commodities and Contamination Sources at 108(b) Historical NPL Sites, by Commodity
Row Site Name CERCLIS ID Associated Commodities/Contamination
Sources 1 Kaiser Aluminum (Mead Works) WAD000065508 Aluminum reduction (potliner) waste disposal
2 National Southwire Aluminum Co. KYD049062375 Aluminum reduction (potliner) waste disposal
3 Martin-Marietta Aluminum Co. ORD052221025 Aluminum reduction waste disposal 4 Reynolds Metals Company ORD009412677 Aluminum reduction waste disposal 5 Alcoa (Vancouver Smelter) WAD009045279 Aluminum smelting (potliner) waste disposal 6 Ormet Corp. OHD004379970 Aluminum smelting (potliner) waste disposal 7 Atlas Asbestos Mine CAD980496863 Asbestos mining and milling waste disposal 8 Coalinga Asbestos Mine CAD980817217 Asbestos mining and milling waste disposal
9 International Minerals (E. Plant) INT190010876 Benezene hexachloride manufacturing, packing, and storing
10 Mouat Industries MTD021997689 Chromium ore processing
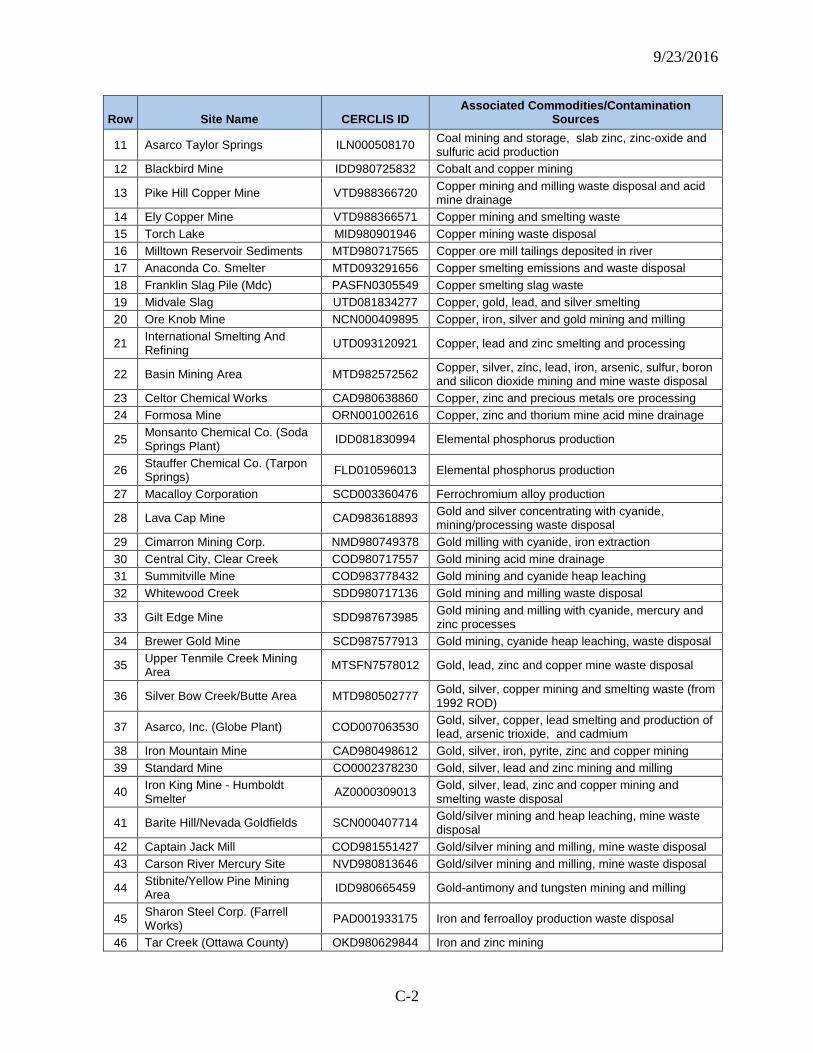
9/23/2016
C-2
Row Site Name CERCLIS ID Associated Commodities/Contamination
Sources
11 Asarco Taylor Springs ILN000508170 Coal mining and storage, slab zinc, zinc-oxide and sulfuric acid production
12 Blackbird Mine IDD980725832 Cobalt and copper mining
13 Pike Hill Copper Mine VTD988366720 Copper mining and milling waste disposal and acid mine drainage
14 Ely Copper Mine VTD988366571 Copper mining and smelting waste 15 Torch Lake MID980901946 Copper mining waste disposal 16 Milltown Reservoir Sediments MTD980717565 Copper ore mill tailings deposited in river 17 Anaconda Co. Smelter MTD093291656 Copper smelting emissions and waste disposal 18 Franklin Slag Pile (Mdc) PASFN0305549 Copper smelting slag waste 19 Midvale Slag UTD081834277 Copper, gold, lead, and silver smelting 20 Ore Knob Mine NCN000409895 Copper, iron, silver and gold mining and milling
21 International Smelting And Refining UTD093120921 Copper, lead and zinc smelting and processing
22 Basin Mining Area MTD982572562 Copper, silver, zinc, lead, iron, arsenic, sulfur, boron and silicon dioxide mining and mine waste disposal
23 Celtor Chemical Works CAD980638860 Copper, zinc and precious metals ore processing 24 Formosa Mine ORN001002616 Copper, zinc and thorium mine acid mine drainage
25 Monsanto Chemical Co. (Soda Springs Plant) IDD081830994 Elemental phosphorus production
26 Stauffer Chemical Co. (Tarpon Springs) FLD010596013 Elemental phosphorus production
27 Macalloy Corporation SCD003360476 Ferrochromium alloy production
28 Lava Cap Mine CAD983618893 Gold and silver concentrating with cyanide, mining/processing waste disposal
29 Cimarron Mining Corp. NMD980749378 Gold milling with cyanide, iron extraction 30 Central City, Clear Creek COD980717557 Gold mining acid mine drainage 31 Summitville Mine COD983778432 Gold mining and cyanide heap leaching 32 Whitewood Creek SDD980717136 Gold mining and milling waste disposal
33 Gilt Edge Mine SDD987673985 Gold mining and milling with cyanide, mercury and zinc processes
34 Brewer Gold Mine SCD987577913 Gold mining, cyanide heap leaching, waste disposal
35 Upper Tenmile Creek Mining Area MTSFN7578012 Gold, lead, zinc and copper mine waste disposal
36 Silver Bow Creek/Butte Area MTD980502777 Gold, silver, copper mining and smelting waste (from 1992 ROD)
37 Asarco, Inc. (Globe Plant) COD007063530 Gold, silver, copper, lead smelting and production of lead, arsenic trioxide, and cadmium
38 Iron Mountain Mine CAD980498612 Gold, silver, iron, pyrite, zinc and copper mining 39 Standard Mine CO0002378230 Gold, silver, lead and zinc mining and milling
40 Iron King Mine - Humboldt Smelter AZ0000309013 Gold, silver, lead, zinc and copper mining and
smelting waste disposal
41 Barite Hill/Nevada Goldfields SCN000407714 Gold/silver mining and heap leaching, mine waste disposal
42 Captain Jack Mill COD981551427 Gold/silver mining and milling, mine waste disposal 43 Carson River Mercury Site NVD980813646 Gold/silver mining and milling, mine waste disposal
44 Stibnite/Yellow Pine Mining Area IDD980665459 Gold-antimony and tungsten mining and milling
45 Sharon Steel Corp. (Farrell Works) PAD001933175 Iron and ferroalloy production waste disposal
46 Tar Creek (Ottawa County) OKD980629844 Iron and zinc mining
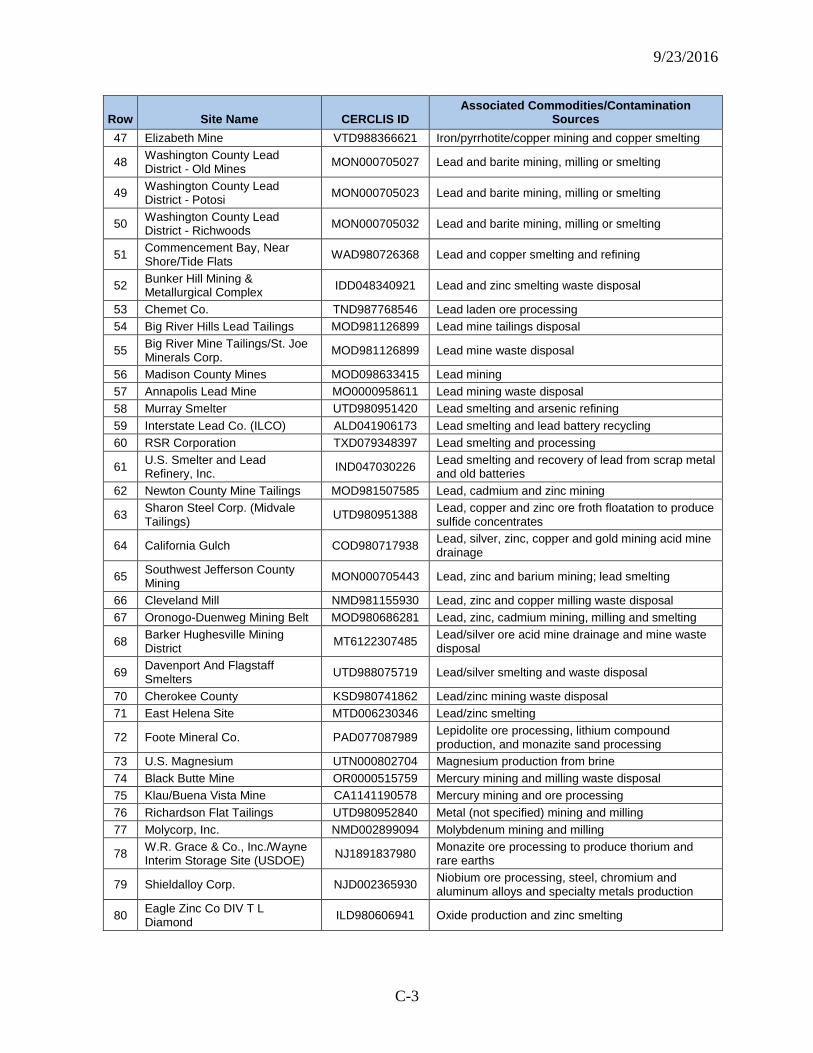
9/23/2016
C-3
Row Site Name CERCLIS ID Associated Commodities/Contamination
Sources 47 Elizabeth Mine VTD988366621 Iron/pyrrhotite/copper mining and copper smelting
48 Washington County Lead District - Old Mines MON000705027 Lead and barite mining, milling or smelting
49 Washington County Lead District - Potosi MON000705023 Lead and barite mining, milling or smelting
50 Washington County Lead District - Richwoods MON000705032 Lead and barite mining, milling or smelting
51 Commencement Bay, Near Shore/Tide Flats WAD980726368 Lead and copper smelting and refining
52 Bunker Hill Mining & Metallurgical Complex IDD048340921 Lead and zinc smelting waste disposal
53 Chemet Co. TND987768546 Lead laden ore processing 54 Big River Hills Lead Tailings MOD981126899 Lead mine tailings disposal
55 Big River Mine Tailings/St. Joe Minerals Corp. MOD981126899 Lead mine waste disposal
56 Madison County Mines MOD098633415 Lead mining 57 Annapolis Lead Mine MO0000958611 Lead mining waste disposal 58 Murray Smelter UTD980951420 Lead smelting and arsenic refining 59 Interstate Lead Co. (ILCO) ALD041906173 Lead smelting and lead battery recycling 60 RSR Corporation TXD079348397 Lead smelting and processing
61 U.S. Smelter and Lead Refinery, Inc. IND047030226 Lead smelting and recovery of lead from scrap metal
and old batteries 62 Newton County Mine Tailings MOD981507585 Lead, cadmium and zinc mining
63 Sharon Steel Corp. (Midvale Tailings) UTD980951388 Lead, copper and zinc ore froth floatation to produce
sulfide concentrates
64 California Gulch COD980717938 Lead, silver, zinc, copper and gold mining acid mine drainage
65 Southwest Jefferson County Mining MON000705443 Lead, zinc and barium mining; lead smelting
66 Cleveland Mill NMD981155930 Lead, zinc and copper milling waste disposal 67 Oronogo-Duenweg Mining Belt MOD980686281 Lead, zinc, cadmium mining, milling and smelting
68 Barker Hughesville Mining District MT6122307485 Lead/silver ore acid mine drainage and mine waste
disposal
69 Davenport And Flagstaff Smelters UTD988075719 Lead/silver smelting and waste disposal
70 Cherokee County KSD980741862 Lead/zinc mining waste disposal 71 East Helena Site MTD006230346 Lead/zinc smelting
72 Foote Mineral Co. PAD077087989 Lepidolite ore processing, lithium compound production, and monazite sand processing
73 U.S. Magnesium UTN000802704 Magnesium production from brine 74 Black Butte Mine OR0000515759 Mercury mining and milling waste disposal 75 Klau/Buena Vista Mine CA1141190578 Mercury mining and ore processing 76 Richardson Flat Tailings UTD980952840 Metal (not specified) mining and milling 77 Molycorp, Inc. NMD002899094 Molybdenum mining and milling
78 W.R. Grace & Co., Inc./Wayne Interim Storage Site (USDOE) NJ1891837980 Monazite ore processing to produce thorium and
rare earths
79 Shieldalloy Corp. NJD002365930 Niobium ore processing, steel, chromium and aluminum alloys and specialty metals production
80 Eagle Zinc Co DIV T L Diamond ILD980606941 Oxide production and zinc smelting
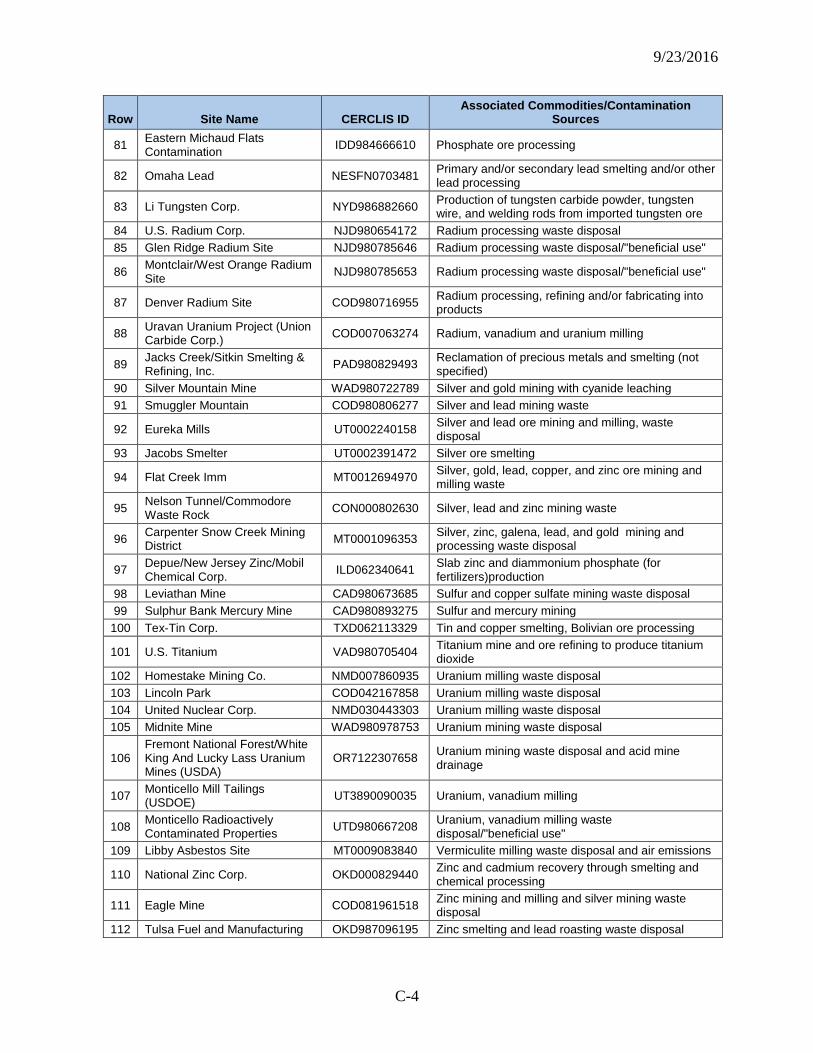
9/23/2016
C-4
Row Site Name CERCLIS ID Associated Commodities/Contamination
Sources
81 Eastern Michaud Flats Contamination IDD984666610 Phosphate ore processing
82 Omaha Lead NESFN0703481 Primary and/or secondary lead smelting and/or other lead processing
83 Li Tungsten Corp. NYD986882660 Production of tungsten carbide powder, tungsten wire, and welding rods from imported tungsten ore
84 U.S. Radium Corp. NJD980654172 Radium processing waste disposal 85 Glen Ridge Radium Site NJD980785646 Radium processing waste disposal/"beneficial use"
86 Montclair/West Orange Radium Site NJD980785653 Radium processing waste disposal/"beneficial use"
87 Denver Radium Site COD980716955 Radium processing, refining and/or fabricating into products
88 Uravan Uranium Project (Union Carbide Corp.) COD007063274 Radium, vanadium and uranium milling
89 Jacks Creek/Sitkin Smelting & Refining, Inc. PAD980829493 Reclamation of precious metals and smelting (not
specified) 90 Silver Mountain Mine WAD980722789 Silver and gold mining with cyanide leaching 91 Smuggler Mountain COD980806277 Silver and lead mining waste
92 Eureka Mills UT0002240158 Silver and lead ore mining and milling, waste disposal
93 Jacobs Smelter UT0002391472 Silver ore smelting
94 Flat Creek Imm MT0012694970 Silver, gold, lead, copper, and zinc ore mining and milling waste
95 Nelson Tunnel/Commodore Waste Rock CON000802630 Silver, lead and zinc mining waste
96 Carpenter Snow Creek Mining District MT0001096353 Silver, zinc, galena, lead, and gold mining and
processing waste disposal
97 Depue/New Jersey Zinc/Mobil Chemical Corp. ILD062340641 Slab zinc and diammonium phosphate (for
fertilizers)production 98 Leviathan Mine CAD980673685 Sulfur and copper sulfate mining waste disposal 99 Sulphur Bank Mercury Mine CAD980893275 Sulfur and mercury mining
100 Tex-Tin Corp. TXD062113329 Tin and copper smelting, Bolivian ore processing
101 U.S. Titanium VAD980705404 Titanium mine and ore refining to produce titanium dioxide
102 Homestake Mining Co. NMD007860935 Uranium milling waste disposal 103 Lincoln Park COD042167858 Uranium milling waste disposal 104 United Nuclear Corp. NMD030443303 Uranium milling waste disposal 105 Midnite Mine WAD980978753 Uranium mining waste disposal
106 Fremont National Forest/White King And Lucky Lass Uranium Mines (USDA)
OR7122307658 Uranium mining waste disposal and acid mine drainage
107 Monticello Mill Tailings (USDOE) UT3890090035 Uranium, vanadium milling
108 Monticello Radioactively Contaminated Properties UTD980667208 Uranium, vanadium milling waste
disposal/"beneficial use" 109 Libby Asbestos Site MT0009083840 Vermiculite milling waste disposal and air emissions
110 National Zinc Corp. OKD000829440 Zinc and cadmium recovery through smelting and chemical processing
111 Eagle Mine COD081961518 Zinc mining and milling and silver mining waste disposal
112 Tulsa Fuel and Manufacturing OKD987096195 Zinc smelting and lead roasting waste disposal
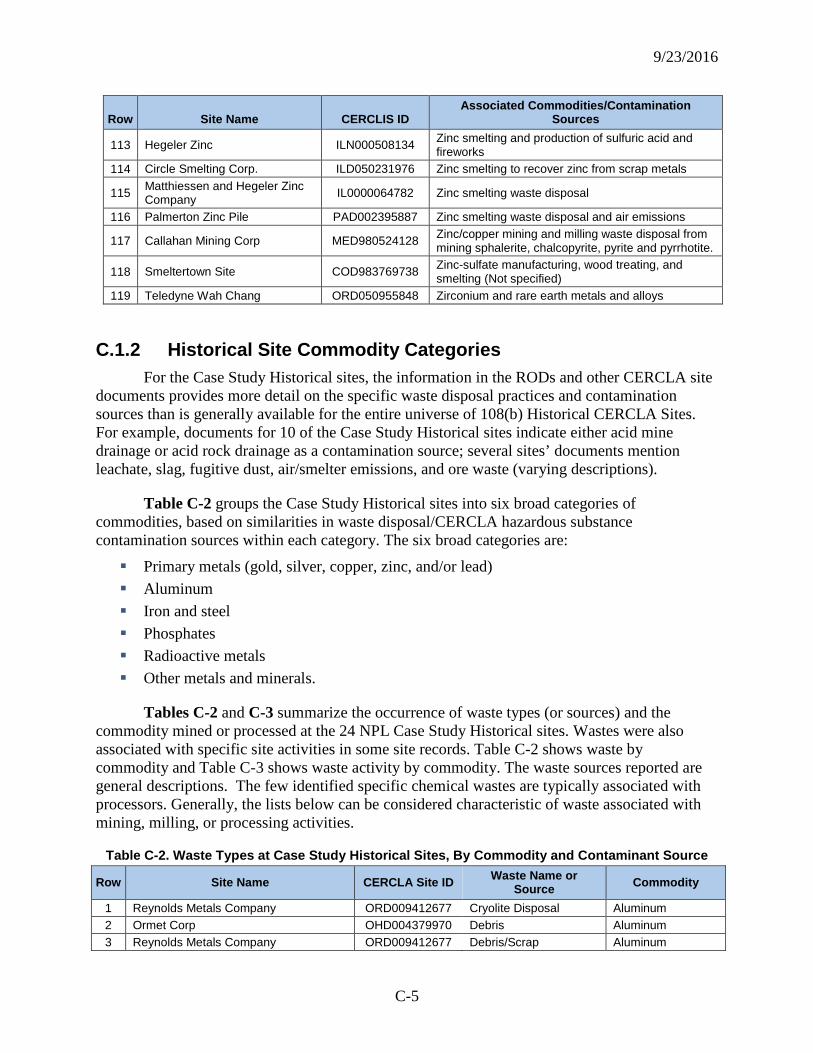
9/23/2016
C-5
Row Site Name CERCLIS ID Associated Commodities/Contamination
Sources
113 Hegeler Zinc ILN000508134 Zinc smelting and production of sulfuric acid and fireworks
114 Circle Smelting Corp. ILD050231976 Zinc smelting to recover zinc from scrap metals
115 Matthiessen and Hegeler Zinc Company IL0000064782 Zinc smelting waste disposal
116 Palmerton Zinc Pile PAD002395887 Zinc smelting waste disposal and air emissions
117 Callahan Mining Corp MED980524128 Zinc/copper mining and milling waste disposal from mining sphalerite, chalcopyrite, pyrite and pyrrhotite.
118 Smeltertown Site COD983769738 Zinc-sulfate manufacturing, wood treating, and smelting (Not specified)
119 Teledyne Wah Chang ORD050955848 Zirconium and rare earth metals and alloys
C.1.2 Historical Site Commodity Categories For the Case Study Historical sites, the information in the RODs and other CERCLA site
documents provides more detail on the specific waste disposal practices and contamination sources than is generally available for the entire universe of 108(b) Historical CERCLA Sites. For example, documents for 10 of the Case Study Historical sites indicate either acid mine drainage or acid rock drainage as a contamination source; several sites’ documents mention leachate, slag, fugitive dust, air/smelter emissions, and ore waste (varying descriptions).
Table C-2 groups the Case Study Historical sites into six broad categories of commodities, based on similarities in waste disposal/CERCLA hazardous substance contamination sources within each category. The six broad categories are:
Primary metals (gold, silver, copper, zinc, and/or lead) Aluminum Iron and steel Phosphates Radioactive metals Other metals and minerals.
Tables C-2 and C-3 summarize the occurrence of waste types (or sources) and the commodity mined or processed at the 24 NPL Case Study Historical sites. Wastes were also associated with specific site activities in some site records. Table C-2 shows waste by commodity and Table C-3 shows waste activity by commodity. The waste sources reported are general descriptions. The few identified specific chemical wastes are typically associated with processors. Generally, the lists below can be considered characteristic of waste associated with mining, milling, or processing activities.
Table C-2. Waste Types at Case Study Historical Sites, By Commodity and Contaminant Source
Row Site Name CERCLA Site ID Waste Name or Source Commodity
1 Reynolds Metals Company ORD009412677 Cryolite Disposal Aluminum 2 Ormet Corp OHD004379970 Debris Aluminum 3 Reynolds Metals Company ORD009412677 Debris/Scrap Aluminum
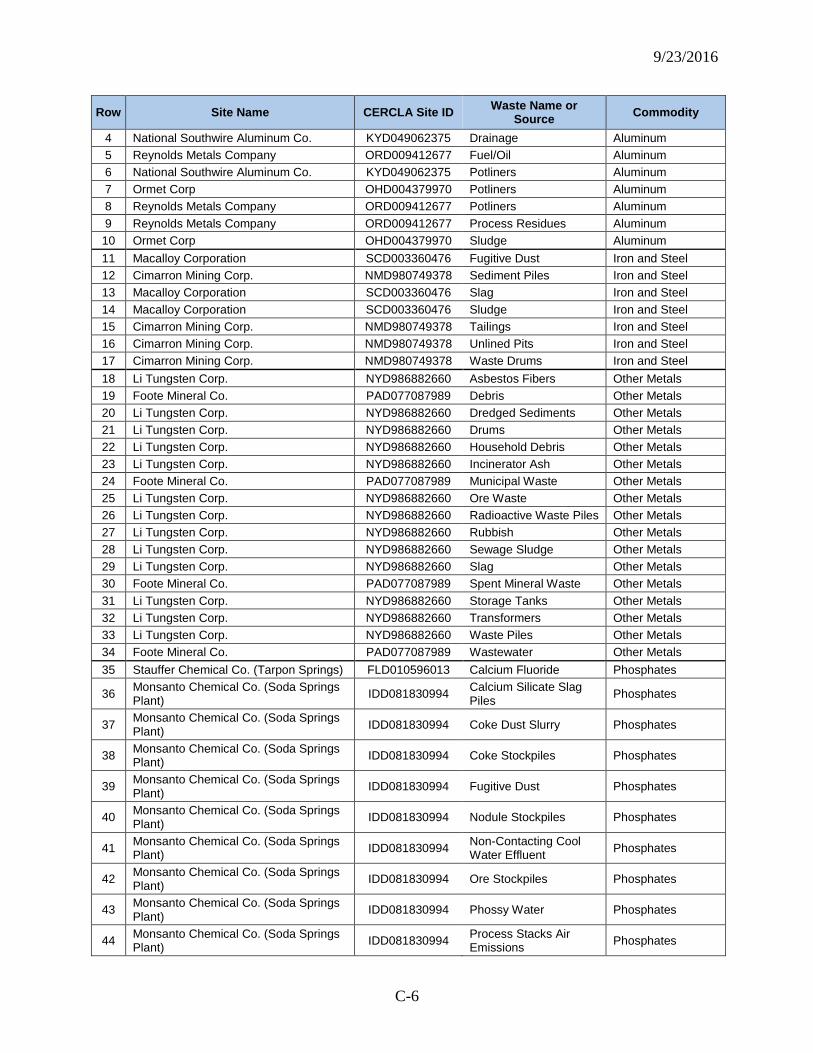
9/23/2016
C-6
Row Site Name CERCLA Site ID Waste Name or Source Commodity
4 National Southwire Aluminum Co. KYD049062375 Drainage Aluminum 5 Reynolds Metals Company ORD009412677 Fuel/Oil Aluminum 6 National Southwire Aluminum Co. KYD049062375 Potliners Aluminum 7 Ormet Corp OHD004379970 Potliners Aluminum 8 Reynolds Metals Company ORD009412677 Potliners Aluminum 9 Reynolds Metals Company ORD009412677 Process Residues Aluminum 10 Ormet Corp OHD004379970 Sludge Aluminum 11 Macalloy Corporation SCD003360476 Fugitive Dust Iron and Steel 12 Cimarron Mining Corp. NMD980749378 Sediment Piles Iron and Steel 13 Macalloy Corporation SCD003360476 Slag Iron and Steel 14 Macalloy Corporation SCD003360476 Sludge Iron and Steel 15 Cimarron Mining Corp. NMD980749378 Tailings Iron and Steel 16 Cimarron Mining Corp. NMD980749378 Unlined Pits Iron and Steel 17 Cimarron Mining Corp. NMD980749378 Waste Drums Iron and Steel 18 Li Tungsten Corp. NYD986882660 Asbestos Fibers Other Metals 19 Foote Mineral Co. PAD077087989 Debris Other Metals 20 Li Tungsten Corp. NYD986882660 Dredged Sediments Other Metals 21 Li Tungsten Corp. NYD986882660 Drums Other Metals 22 Li Tungsten Corp. NYD986882660 Household Debris Other Metals 23 Li Tungsten Corp. NYD986882660 Incinerator Ash Other Metals 24 Foote Mineral Co. PAD077087989 Municipal Waste Other Metals 25 Li Tungsten Corp. NYD986882660 Ore Waste Other Metals 26 Li Tungsten Corp. NYD986882660 Radioactive Waste Piles Other Metals 27 Li Tungsten Corp. NYD986882660 Rubbish Other Metals 28 Li Tungsten Corp. NYD986882660 Sewage Sludge Other Metals 29 Li Tungsten Corp. NYD986882660 Slag Other Metals 30 Foote Mineral Co. PAD077087989 Spent Mineral Waste Other Metals 31 Li Tungsten Corp. NYD986882660 Storage Tanks Other Metals 32 Li Tungsten Corp. NYD986882660 Transformers Other Metals 33 Li Tungsten Corp. NYD986882660 Waste Piles Other Metals 34 Foote Mineral Co. PAD077087989 Wastewater Other Metals 35 Stauffer Chemical Co. (Tarpon Springs) FLD010596013 Calcium Fluoride Phosphates
36 Monsanto Chemical Co. (Soda Springs Plant) IDD081830994 Calcium Silicate Slag
Piles Phosphates
37 Monsanto Chemical Co. (Soda Springs Plant) IDD081830994 Coke Dust Slurry Phosphates
38 Monsanto Chemical Co. (Soda Springs Plant) IDD081830994 Coke Stockpiles Phosphates
39 Monsanto Chemical Co. (Soda Springs Plant) IDD081830994 Fugitive Dust Phosphates
40 Monsanto Chemical Co. (Soda Springs Plant) IDD081830994 Nodule Stockpiles Phosphates
41 Monsanto Chemical Co. (Soda Springs Plant) IDD081830994 Non-Contacting Cool
Water Effluent Phosphates
42 Monsanto Chemical Co. (Soda Springs Plant) IDD081830994 Ore Stockpiles Phosphates
43 Monsanto Chemical Co. (Soda Springs Plant) IDD081830994 Phossy Water Phosphates
44 Monsanto Chemical Co. (Soda Springs Plant) IDD081830994 Process Stacks Air
Emissions Phosphates
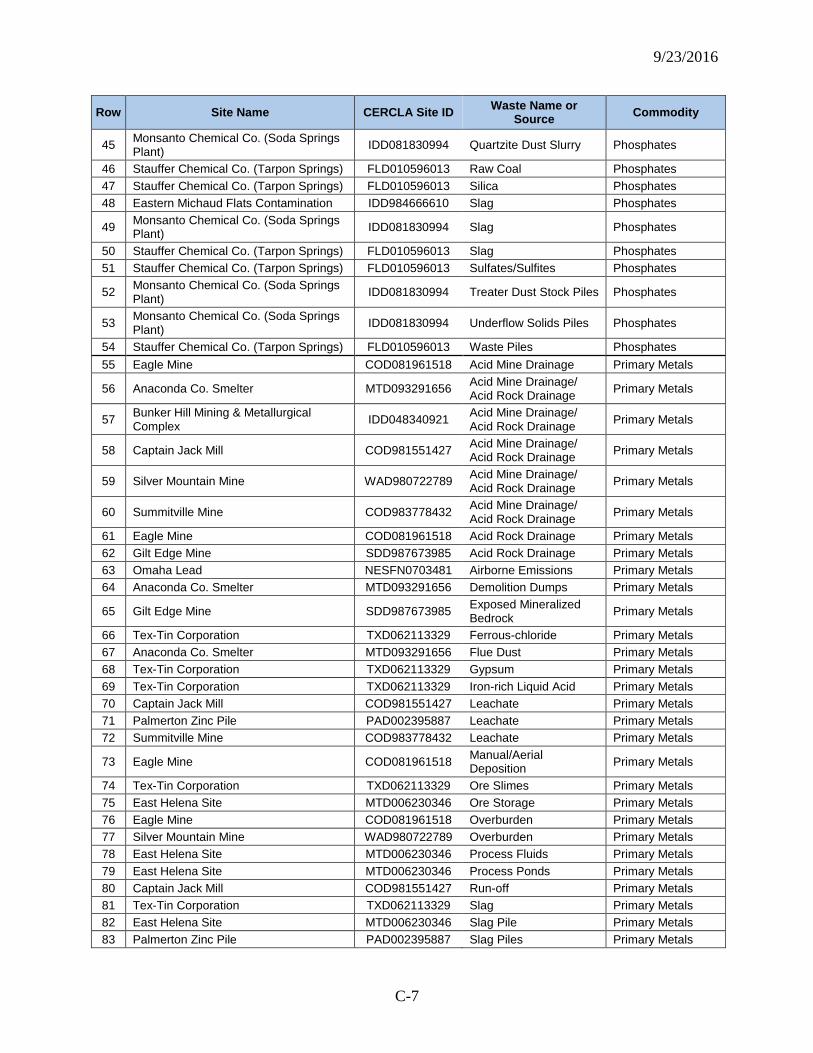
9/23/2016
C-7
Row Site Name CERCLA Site ID Waste Name or Source Commodity
45 Monsanto Chemical Co. (Soda Springs Plant) IDD081830994 Quartzite Dust Slurry Phosphates
46 Stauffer Chemical Co. (Tarpon Springs) FLD010596013 Raw Coal Phosphates 47 Stauffer Chemical Co. (Tarpon Springs) FLD010596013 Silica Phosphates 48 Eastern Michaud Flats Contamination IDD984666610 Slag Phosphates
49 Monsanto Chemical Co. (Soda Springs Plant) IDD081830994 Slag Phosphates
50 Stauffer Chemical Co. (Tarpon Springs) FLD010596013 Slag Phosphates 51 Stauffer Chemical Co. (Tarpon Springs) FLD010596013 Sulfates/Sulfites Phosphates
52 Monsanto Chemical Co. (Soda Springs Plant) IDD081830994 Treater Dust Stock Piles Phosphates
53 Monsanto Chemical Co. (Soda Springs Plant) IDD081830994 Underflow Solids Piles Phosphates
54 Stauffer Chemical Co. (Tarpon Springs) FLD010596013 Waste Piles Phosphates 55 Eagle Mine COD081961518 Acid Mine Drainage Primary Metals
56 Anaconda Co. Smelter MTD093291656 Acid Mine Drainage/ Acid Rock Drainage Primary Metals
57 Bunker Hill Mining & Metallurgical Complex IDD048340921 Acid Mine Drainage/
Acid Rock Drainage Primary Metals
58 Captain Jack Mill COD981551427 Acid Mine Drainage/ Acid Rock Drainage Primary Metals
59 Silver Mountain Mine WAD980722789 Acid Mine Drainage/ Acid Rock Drainage Primary Metals
60 Summitville Mine COD983778432 Acid Mine Drainage/ Acid Rock Drainage Primary Metals
61 Eagle Mine COD081961518 Acid Rock Drainage Primary Metals 62 Gilt Edge Mine SDD987673985 Acid Rock Drainage Primary Metals 63 Omaha Lead NESFN0703481 Airborne Emissions Primary Metals 64 Anaconda Co. Smelter MTD093291656 Demolition Dumps Primary Metals
65 Gilt Edge Mine SDD987673985 Exposed Mineralized Bedrock Primary Metals
66 Tex-Tin Corporation TXD062113329 Ferrous-chloride Primary Metals 67 Anaconda Co. Smelter MTD093291656 Flue Dust Primary Metals 68 Tex-Tin Corporation TXD062113329 Gypsum Primary Metals 69 Tex-Tin Corporation TXD062113329 Iron-rich Liquid Acid Primary Metals 70 Captain Jack Mill COD981551427 Leachate Primary Metals 71 Palmerton Zinc Pile PAD002395887 Leachate Primary Metals 72 Summitville Mine COD983778432 Leachate Primary Metals
73 Eagle Mine COD081961518 Manual/Aerial Deposition Primary Metals
74 Tex-Tin Corporation TXD062113329 Ore Slimes Primary Metals 75 East Helena Site MTD006230346 Ore Storage Primary Metals 76 Eagle Mine COD081961518 Overburden Primary Metals 77 Silver Mountain Mine WAD980722789 Overburden Primary Metals 78 East Helena Site MTD006230346 Process Fluids Primary Metals 79 East Helena Site MTD006230346 Process Ponds Primary Metals 80 Captain Jack Mill COD981551427 Run-off Primary Metals 81 Tex-Tin Corporation TXD062113329 Slag Primary Metals 82 East Helena Site MTD006230346 Slag Pile Primary Metals 83 Palmerton Zinc Pile PAD002395887 Slag Piles Primary Metals
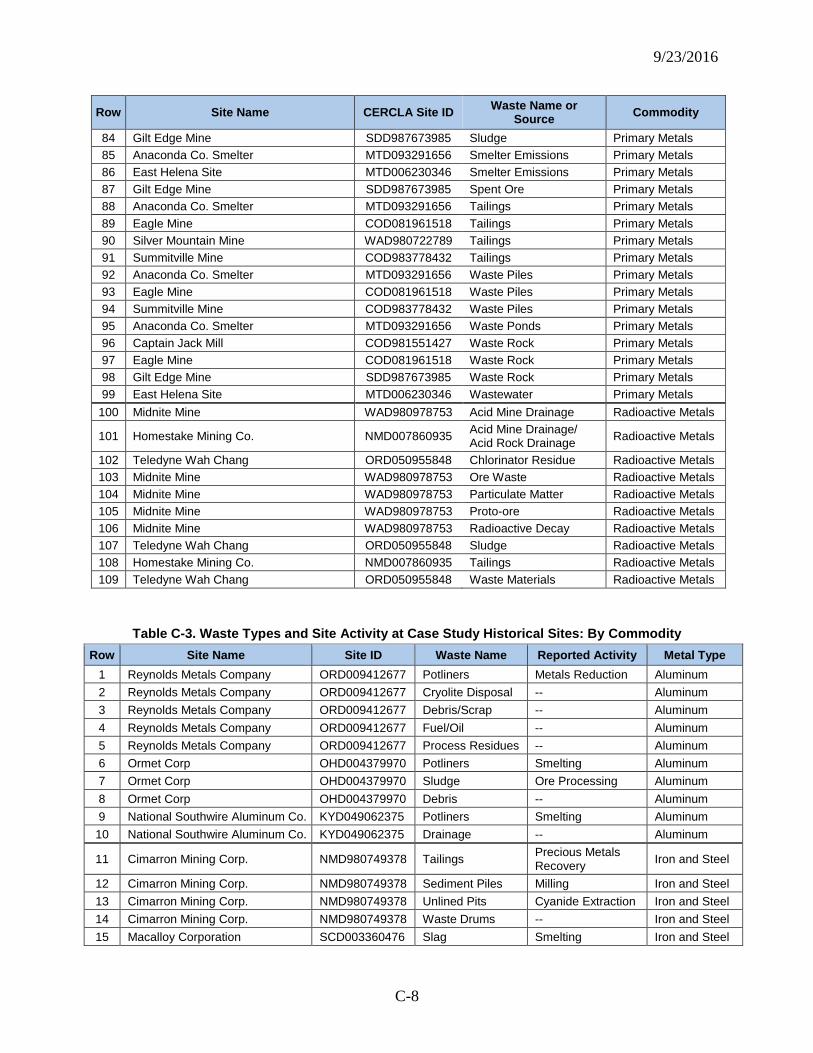
9/23/2016
C-8
Row Site Name CERCLA Site ID Waste Name or Source Commodity
84 Gilt Edge Mine SDD987673985 Sludge Primary Metals 85 Anaconda Co. Smelter MTD093291656 Smelter Emissions Primary Metals 86 East Helena Site MTD006230346 Smelter Emissions Primary Metals 87 Gilt Edge Mine SDD987673985 Spent Ore Primary Metals 88 Anaconda Co. Smelter MTD093291656 Tailings Primary Metals 89 Eagle Mine COD081961518 Tailings Primary Metals 90 Silver Mountain Mine WAD980722789 Tailings Primary Metals 91 Summitville Mine COD983778432 Tailings Primary Metals 92 Anaconda Co. Smelter MTD093291656 Waste Piles Primary Metals 93 Eagle Mine COD081961518 Waste Piles Primary Metals 94 Summitville Mine COD983778432 Waste Piles Primary Metals 95 Anaconda Co. Smelter MTD093291656 Waste Ponds Primary Metals 96 Captain Jack Mill COD981551427 Waste Rock Primary Metals 97 Eagle Mine COD081961518 Waste Rock Primary Metals 98 Gilt Edge Mine SDD987673985 Waste Rock Primary Metals 99 East Helena Site MTD006230346 Wastewater Primary Metals
100 Midnite Mine WAD980978753 Acid Mine Drainage Radioactive Metals
101 Homestake Mining Co. NMD007860935 Acid Mine Drainage/ Acid Rock Drainage Radioactive Metals
102 Teledyne Wah Chang ORD050955848 Chlorinator Residue Radioactive Metals 103 Midnite Mine WAD980978753 Ore Waste Radioactive Metals 104 Midnite Mine WAD980978753 Particulate Matter Radioactive Metals 105 Midnite Mine WAD980978753 Proto-ore Radioactive Metals 106 Midnite Mine WAD980978753 Radioactive Decay Radioactive Metals 107 Teledyne Wah Chang ORD050955848 Sludge Radioactive Metals 108 Homestake Mining Co. NMD007860935 Tailings Radioactive Metals 109 Teledyne Wah Chang ORD050955848 Waste Materials Radioactive Metals
Table C-3. Waste Types and Site Activity at Case Study Historical Sites: By Commodity
Row Site Name Site ID Waste Name Reported Activity Metal Type 1 Reynolds Metals Company ORD009412677 Potliners Metals Reduction Aluminum 2 Reynolds Metals Company ORD009412677 Cryolite Disposal -- Aluminum 3 Reynolds Metals Company ORD009412677 Debris/Scrap -- Aluminum 4 Reynolds Metals Company ORD009412677 Fuel/Oil -- Aluminum 5 Reynolds Metals Company ORD009412677 Process Residues -- Aluminum 6 Ormet Corp OHD004379970 Potliners Smelting Aluminum 7 Ormet Corp OHD004379970 Sludge Ore Processing Aluminum 8 Ormet Corp OHD004379970 Debris -- Aluminum 9 National Southwire Aluminum Co. KYD049062375 Potliners Smelting Aluminum 10 National Southwire Aluminum Co. KYD049062375 Drainage -- Aluminum
11 Cimarron Mining Corp. NMD980749378 Tailings Precious Metals Recovery Iron and Steel
12 Cimarron Mining Corp. NMD980749378 Sediment Piles Milling Iron and Steel 13 Cimarron Mining Corp. NMD980749378 Unlined Pits Cyanide Extraction Iron and Steel 14 Cimarron Mining Corp. NMD980749378 Waste Drums -- Iron and Steel 15 Macalloy Corporation SCD003360476 Slag Smelting Iron and Steel
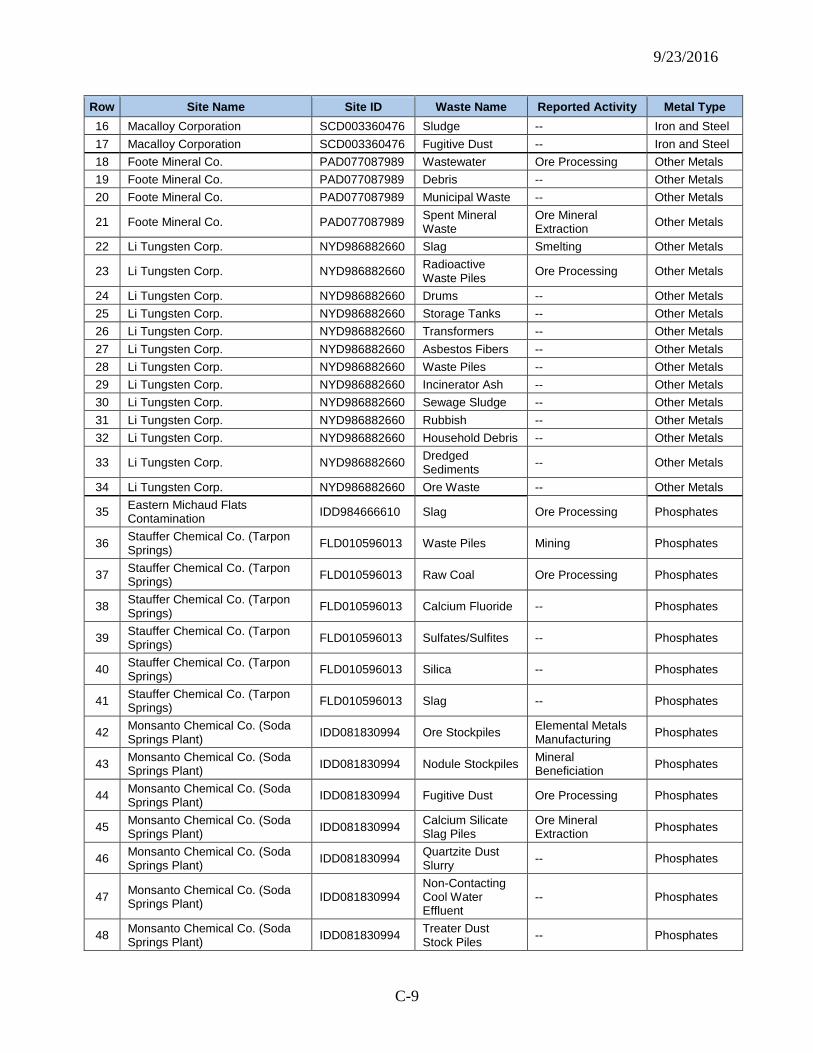
9/23/2016
C-9
Row Site Name Site ID Waste Name Reported Activity Metal Type 16 Macalloy Corporation SCD003360476 Sludge -- Iron and Steel 17 Macalloy Corporation SCD003360476 Fugitive Dust -- Iron and Steel 18 Foote Mineral Co. PAD077087989 Wastewater Ore Processing Other Metals 19 Foote Mineral Co. PAD077087989 Debris -- Other Metals 20 Foote Mineral Co. PAD077087989 Municipal Waste -- Other Metals
21 Foote Mineral Co. PAD077087989 Spent Mineral Waste
Ore Mineral Extraction Other Metals
22 Li Tungsten Corp. NYD986882660 Slag Smelting Other Metals
23 Li Tungsten Corp. NYD986882660 Radioactive Waste Piles Ore Processing Other Metals
24 Li Tungsten Corp. NYD986882660 Drums -- Other Metals 25 Li Tungsten Corp. NYD986882660 Storage Tanks -- Other Metals 26 Li Tungsten Corp. NYD986882660 Transformers -- Other Metals 27 Li Tungsten Corp. NYD986882660 Asbestos Fibers -- Other Metals 28 Li Tungsten Corp. NYD986882660 Waste Piles -- Other Metals 29 Li Tungsten Corp. NYD986882660 Incinerator Ash -- Other Metals 30 Li Tungsten Corp. NYD986882660 Sewage Sludge -- Other Metals 31 Li Tungsten Corp. NYD986882660 Rubbish -- Other Metals 32 Li Tungsten Corp. NYD986882660 Household Debris -- Other Metals
33 Li Tungsten Corp. NYD986882660 Dredged Sediments -- Other Metals
34 Li Tungsten Corp. NYD986882660 Ore Waste -- Other Metals
35 Eastern Michaud Flats Contamination IDD984666610 Slag Ore Processing Phosphates
36 Stauffer Chemical Co. (Tarpon Springs) FLD010596013 Waste Piles Mining Phosphates
37 Stauffer Chemical Co. (Tarpon Springs) FLD010596013 Raw Coal Ore Processing Phosphates
38 Stauffer Chemical Co. (Tarpon Springs) FLD010596013 Calcium Fluoride -- Phosphates
39 Stauffer Chemical Co. (Tarpon Springs) FLD010596013 Sulfates/Sulfites -- Phosphates
40 Stauffer Chemical Co. (Tarpon Springs) FLD010596013 Silica -- Phosphates
41 Stauffer Chemical Co. (Tarpon Springs) FLD010596013 Slag -- Phosphates
42 Monsanto Chemical Co. (Soda Springs Plant) IDD081830994 Ore Stockpiles Elemental Metals
Manufacturing Phosphates
43 Monsanto Chemical Co. (Soda Springs Plant) IDD081830994 Nodule Stockpiles Mineral
Beneficiation Phosphates
44 Monsanto Chemical Co. (Soda Springs Plant) IDD081830994 Fugitive Dust Ore Processing Phosphates
45 Monsanto Chemical Co. (Soda Springs Plant) IDD081830994 Calcium Silicate
Slag Piles Ore Mineral Extraction Phosphates
46 Monsanto Chemical Co. (Soda Springs Plant) IDD081830994 Quartzite Dust
Slurry -- Phosphates
47 Monsanto Chemical Co. (Soda Springs Plant) IDD081830994
Non-Contacting Cool Water Effluent
-- Phosphates
48 Monsanto Chemical Co. (Soda Springs Plant) IDD081830994 Treater Dust
Stock Piles -- Phosphates
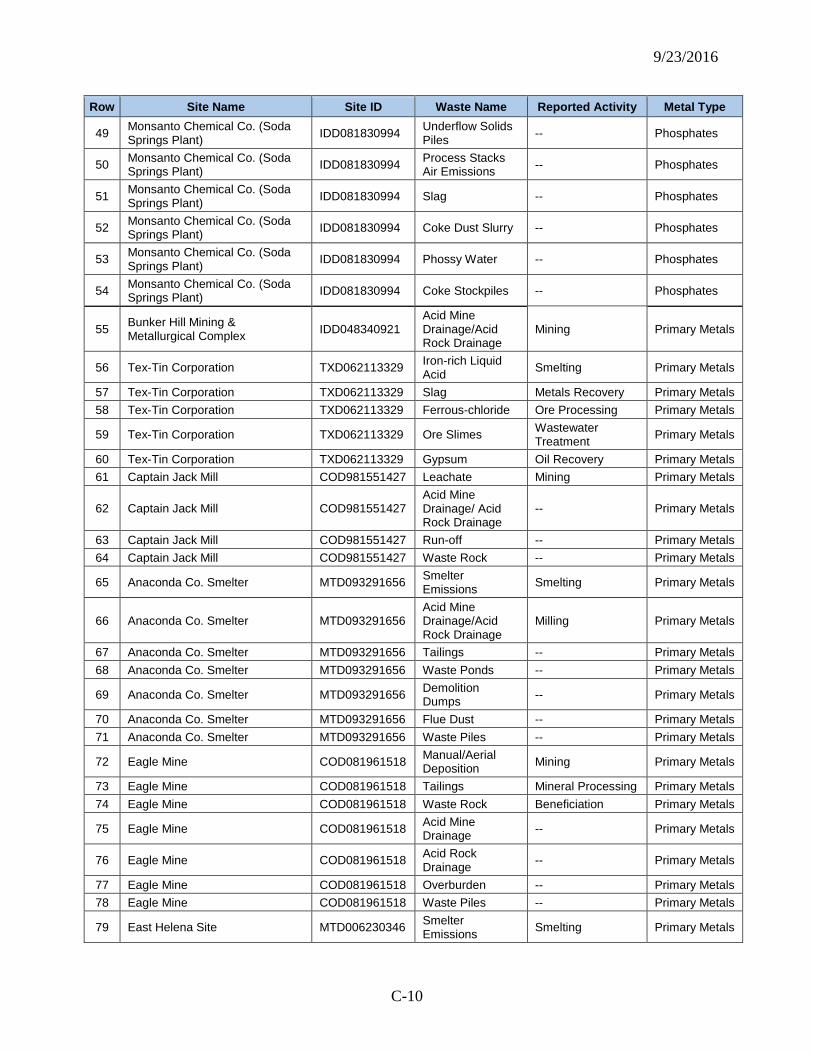
9/23/2016
C-10
Row Site Name Site ID Waste Name Reported Activity Metal Type
49 Monsanto Chemical Co. (Soda Springs Plant) IDD081830994 Underflow Solids
Piles -- Phosphates
50 Monsanto Chemical Co. (Soda Springs Plant) IDD081830994 Process Stacks
Air Emissions -- Phosphates
51 Monsanto Chemical Co. (Soda Springs Plant) IDD081830994 Slag -- Phosphates
52 Monsanto Chemical Co. (Soda Springs Plant) IDD081830994 Coke Dust Slurry -- Phosphates
53 Monsanto Chemical Co. (Soda Springs Plant) IDD081830994 Phossy Water -- Phosphates
54 Monsanto Chemical Co. (Soda Springs Plant) IDD081830994 Coke Stockpiles -- Phosphates
55 Bunker Hill Mining & Metallurgical Complex IDD048340921
Acid Mine Drainage/Acid Rock Drainage
Mining Primary Metals
56 Tex-Tin Corporation TXD062113329 Iron-rich Liquid Acid Smelting Primary Metals
57 Tex-Tin Corporation TXD062113329 Slag Metals Recovery Primary Metals 58 Tex-Tin Corporation TXD062113329 Ferrous-chloride Ore Processing Primary Metals
59 Tex-Tin Corporation TXD062113329 Ore Slimes Wastewater Treatment Primary Metals
60 Tex-Tin Corporation TXD062113329 Gypsum Oil Recovery Primary Metals 61 Captain Jack Mill COD981551427 Leachate Mining Primary Metals
62 Captain Jack Mill COD981551427 Acid Mine Drainage/ Acid Rock Drainage
-- Primary Metals
63 Captain Jack Mill COD981551427 Run-off -- Primary Metals 64 Captain Jack Mill COD981551427 Waste Rock -- Primary Metals
65 Anaconda Co. Smelter MTD093291656 Smelter Emissions Smelting Primary Metals
66 Anaconda Co. Smelter MTD093291656 Acid Mine Drainage/Acid Rock Drainage
Milling Primary Metals
67 Anaconda Co. Smelter MTD093291656 Tailings -- Primary Metals 68 Anaconda Co. Smelter MTD093291656 Waste Ponds -- Primary Metals
69 Anaconda Co. Smelter MTD093291656 Demolition Dumps -- Primary Metals
70 Anaconda Co. Smelter MTD093291656 Flue Dust -- Primary Metals 71 Anaconda Co. Smelter MTD093291656 Waste Piles -- Primary Metals
72 Eagle Mine COD081961518 Manual/Aerial Deposition Mining Primary Metals
73 Eagle Mine COD081961518 Tailings Mineral Processing Primary Metals 74 Eagle Mine COD081961518 Waste Rock Beneficiation Primary Metals
75 Eagle Mine COD081961518 Acid Mine Drainage -- Primary Metals
76 Eagle Mine COD081961518 Acid Rock Drainage -- Primary Metals
77 Eagle Mine COD081961518 Overburden -- Primary Metals 78 Eagle Mine COD081961518 Waste Piles -- Primary Metals
79 East Helena Site MTD006230346 Smelter Emissions Smelting Primary Metals
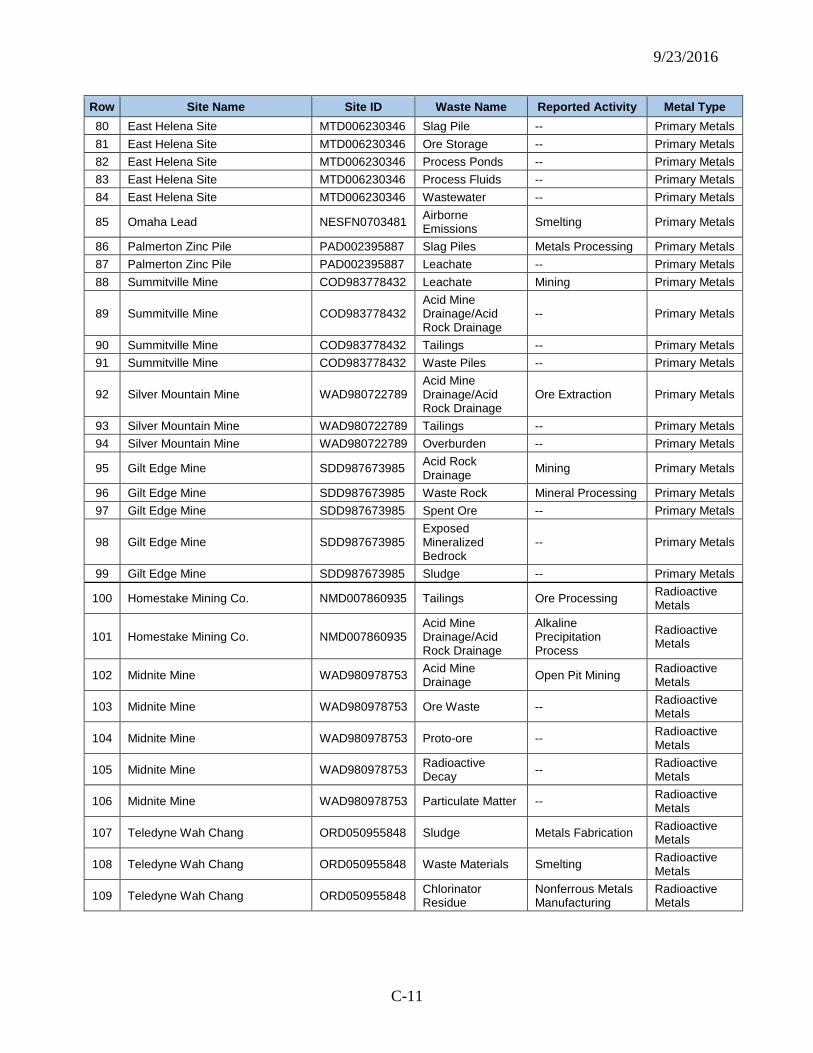
9/23/2016
C-11
Row Site Name Site ID Waste Name Reported Activity Metal Type 80 East Helena Site MTD006230346 Slag Pile -- Primary Metals 81 East Helena Site MTD006230346 Ore Storage -- Primary Metals 82 East Helena Site MTD006230346 Process Ponds -- Primary Metals 83 East Helena Site MTD006230346 Process Fluids -- Primary Metals 84 East Helena Site MTD006230346 Wastewater -- Primary Metals
85 Omaha Lead NESFN0703481 Airborne Emissions Smelting Primary Metals
86 Palmerton Zinc Pile PAD002395887 Slag Piles Metals Processing Primary Metals 87 Palmerton Zinc Pile PAD002395887 Leachate -- Primary Metals 88 Summitville Mine COD983778432 Leachate Mining Primary Metals
89 Summitville Mine COD983778432 Acid Mine Drainage/Acid Rock Drainage
-- Primary Metals
90 Summitville Mine COD983778432 Tailings -- Primary Metals 91 Summitville Mine COD983778432 Waste Piles -- Primary Metals
92 Silver Mountain Mine WAD980722789 Acid Mine Drainage/Acid Rock Drainage
Ore Extraction Primary Metals
93 Silver Mountain Mine WAD980722789 Tailings -- Primary Metals 94 Silver Mountain Mine WAD980722789 Overburden -- Primary Metals
95 Gilt Edge Mine SDD987673985 Acid Rock Drainage Mining Primary Metals
96 Gilt Edge Mine SDD987673985 Waste Rock Mineral Processing Primary Metals 97 Gilt Edge Mine SDD987673985 Spent Ore -- Primary Metals
98 Gilt Edge Mine SDD987673985 Exposed Mineralized Bedrock
-- Primary Metals
99 Gilt Edge Mine SDD987673985 Sludge -- Primary Metals
100 Homestake Mining Co. NMD007860935 Tailings Ore Processing Radioactive Metals
101 Homestake Mining Co. NMD007860935 Acid Mine Drainage/Acid Rock Drainage
Alkaline Precipitation Process
Radioactive Metals
102 Midnite Mine WAD980978753 Acid Mine Drainage Open Pit Mining Radioactive
Metals
103 Midnite Mine WAD980978753 Ore Waste -- Radioactive Metals
104 Midnite Mine WAD980978753 Proto-ore -- Radioactive Metals
105 Midnite Mine WAD980978753 Radioactive Decay -- Radioactive
Metals
106 Midnite Mine WAD980978753 Particulate Matter -- Radioactive Metals
107 Teledyne Wah Chang ORD050955848 Sludge Metals Fabrication Radioactive Metals
108 Teledyne Wah Chang ORD050955848 Waste Materials Smelting Radioactive Metals
109 Teledyne Wah Chang ORD050955848 Chlorinator Residue
Nonferrous Metals Manufacturing
Radioactive Metals
9/23/2016
D-1
Appendix D Identification of Contaminants of Concern and
Priority Contaminants of Concern at Case Study Historical Sites
This appendix describes how contaminants of concern (COCs) at Historical sites were identified, and how Priority COCs were selected from among the COCs.
CERCLA hazardous substances are defined by CERCLA Section 101(14) as certain substances, elements, compounds, mixtures, hazardous wastes, toxic pollutants, hazardous air pollutants or imminently hazardous chemical substances or mixtures designated under the major U.S. environmental laws. In all, the Superfund law designates more than 800 substances as hazardous substances. In addition, there are approximately 1,500 known radionuclides, approximately 760 of which are listed individually. The list of CERCLA hazardous substances (and reportable quantities) is located in 40 CFR 302.4.
Contaminants of potential concern (COPCs) are CERCLA hazardous substances which (a) are present at a site, (b) occur at concentrations which are or might be of health concern to exposed humans or ecological receptors, and (c) are or might be due to releases from a Superfund site. USEPA has derived a standard method for selecting COPCs at a site, as detailed in Risk Assessment Guidance for Superfund: Human Health Evaluation Manual (Part A) (USEPA 1989). In brief, EPA assumes that any chemical detected at a site is a candidate for selection as a COPC, but identifies a number of methods that may be used for determining when a chemical is not of concern and may be eliminated from further consideration. Each Superfund risk assessment may choose to apply some or all of the methods identified by EPA to select COPCs, as appropriate for the specific site. Those COPCs identified in the Superfund risk assessment as being present at or above a level of concern (under the National Contingency Plan, published at 40 CFR 300.430(e)(2)(i)) are generally identified as COCs.
For this report, EPA reviewed the Superfund risk assessments and other CERCLA site documents, for the Case Study Historical sites to identify which specific CERCLA hazardous substances were found to be COCs at those sites. The frequency of occurrence noted for COCs are provided in Section D.1.
D.1 Case Study Historical Site COCs Table D-1 presents the CERCLA hazardous substances (in alphabetical order) identified
in Superfund risk assessments performed at the 24 Case Study Historical sites in the original sample.1 The table indicates the frequency with which each substance is above levels of concern for each type of receptor (human or ecological). A total of 86 CERCLA hazardous substances were identified as COCs at the Case Study Historical sites.
1 As described in Appendix B (“Defining the Universes of 108(b) Historical CERCLA and 2009 Current Sites”), the 30 sites randomly selected in the original sampling included 24 NPL sites and 6 Removal sites. While data were collected for a supplemental sampling of the 108(b) Historical CERCLA sites universe, the data for the supplemental sites were not available in time and were not used in this analysis.
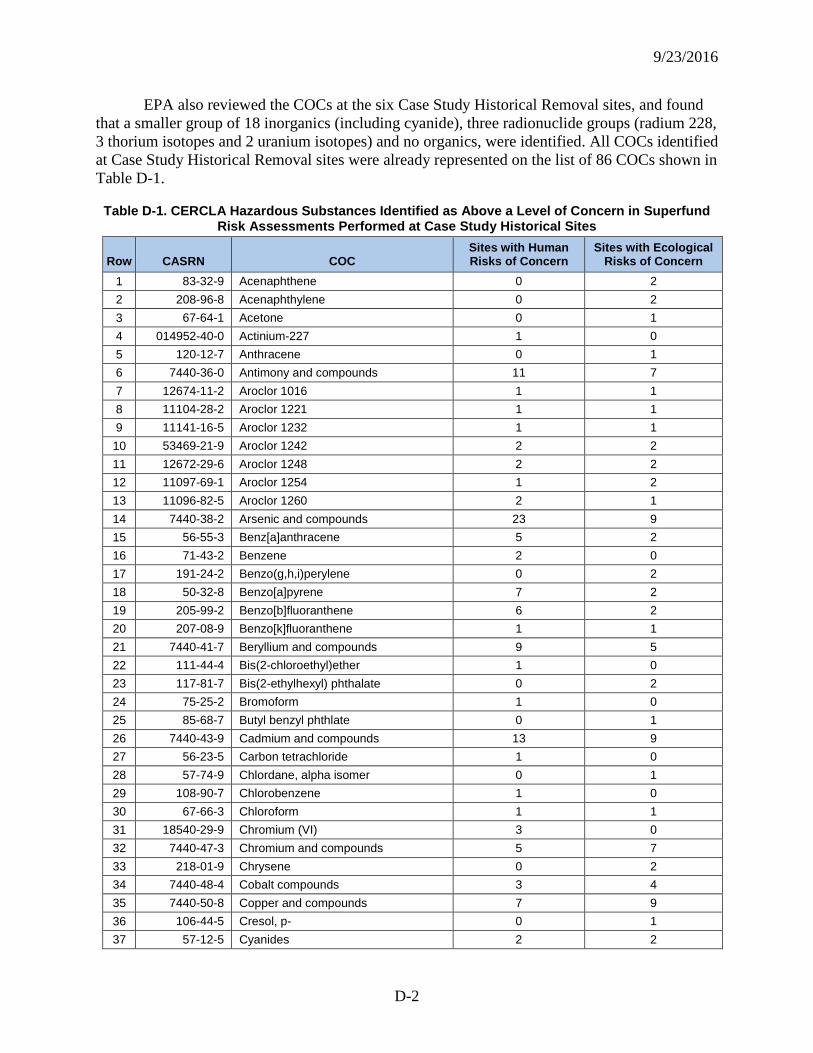
9/23/2016
D-2
EPA also reviewed the COCs at the six Case Study Historical Removal sites, and found that a smaller group of 18 inorganics (including cyanide), three radionuclide groups (radium 228, 3 thorium isotopes and 2 uranium isotopes) and no organics, were identified. All COCs identified at Case Study Historical Removal sites were already represented on the list of 86 COCs shown in Table D-1.
Table D-1. CERCLA Hazardous Substances Identified as Above a Level of Concern in Superfund Risk Assessments Performed at Case Study Historical Sites
Row CASRN COC Sites with Human Risks of Concern
Sites with Ecological Risks of Concern
1 83-32-9 Acenaphthene 0 2 2 208-96-8 Acenaphthylene 0 2 3 67-64-1 Acetone 0 1 4 014952-40-0 Actinium-227 1 0 5 120-12-7 Anthracene 0 1 6 7440-36-0 Antimony and compounds 11 7 7 12674-11-2 Aroclor 1016 1 1 8 11104-28-2 Aroclor 1221 1 1 9 11141-16-5 Aroclor 1232 1 1 10 53469-21-9 Aroclor 1242 2 2 11 12672-29-6 Aroclor 1248 2 2 12 11097-69-1 Aroclor 1254 1 2 13 11096-82-5 Aroclor 1260 2 1 14 7440-38-2 Arsenic and compounds 23 9 15 56-55-3 Benz[a]anthracene 5 2 16 71-43-2 Benzene 2 0 17 191-24-2 Benzo(g,h,i)perylene 0 2 18 50-32-8 Benzo[a]pyrene 7 2 19 205-99-2 Benzo[b]fluoranthene 6 2 20 207-08-9 Benzo[k]fluoranthene 1 1 21 7440-41-7 Beryllium and compounds 9 5 22 111-44-4 Bis(2-chloroethyl)ether 1 0 23 117-81-7 Bis(2-ethylhexyl) phthalate 0 2 24 75-25-2 Bromoform 1 0 25 85-68-7 Butyl benzyl phthlate 0 1 26 7440-43-9 Cadmium and compounds 13 9 27 56-23-5 Carbon tetrachloride 1 0 28 57-74-9 Chlordane, alpha isomer 0 1 29 108-90-7 Chlorobenzene 1 0 30 67-66-3 Chloroform 1 1 31 18540-29-9 Chromium (VI) 3 0 32 7440-47-3 Chromium and compounds 5 7 33 218-01-9 Chrysene 0 2 34 7440-48-4 Cobalt compounds 3 4 35 7440-50-8 Copper and compounds 7 9 36 106-44-5 Cresol, p- 0 1 37 57-12-5 Cyanides 2 2
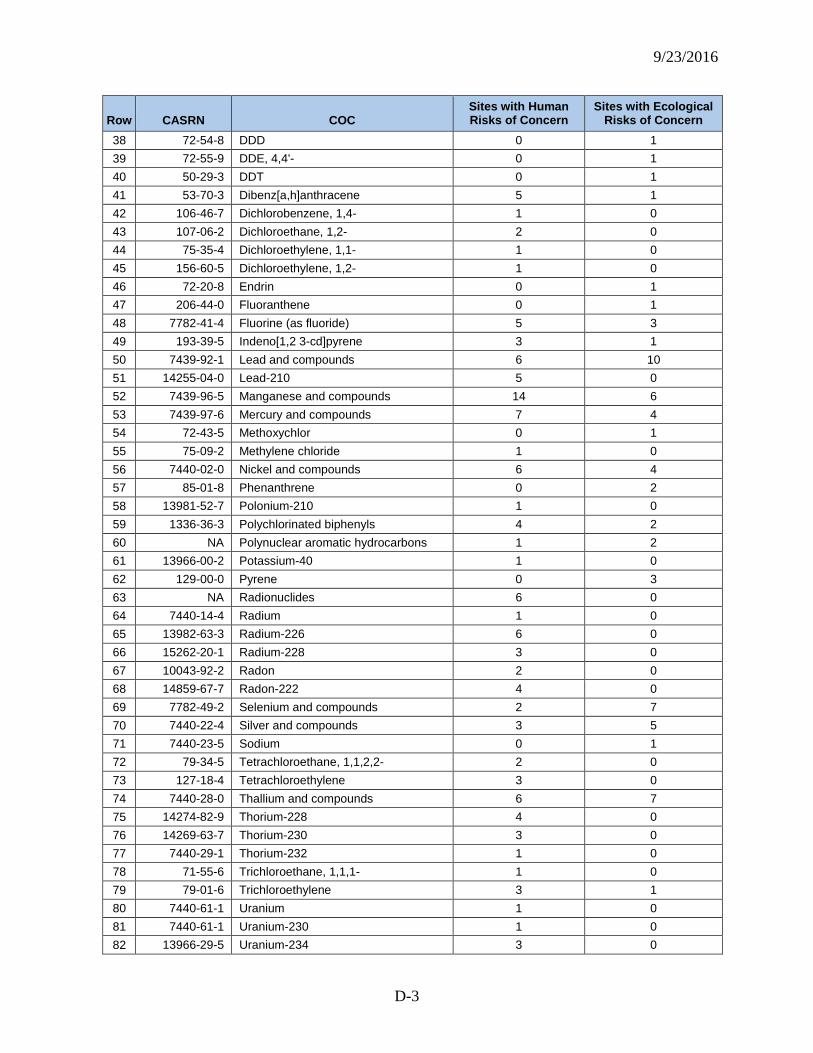
9/23/2016
D-3
Row CASRN COC Sites with Human Risks of Concern
Sites with Ecological Risks of Concern
38 72-54-8 DDD 0 1 39 72-55-9 DDE, 4,4'- 0 1 40 50-29-3 DDT 0 1 41 53-70-3 Dibenz[a,h]anthracene 5 1 42 106-46-7 Dichlorobenzene, 1,4- 1 0 43 107-06-2 Dichloroethane, 1,2- 2 0 44 75-35-4 Dichloroethylene, 1,1- 1 0 45 156-60-5 Dichloroethylene, 1,2- 1 0 46 72-20-8 Endrin 0 1 47 206-44-0 Fluoranthene 0 1 48 7782-41-4 Fluorine (as fluoride) 5 3 49 193-39-5 Indeno[1,2 3-cd]pyrene 3 1 50 7439-92-1 Lead and compounds 6 10 51 14255-04-0 Lead-210 5 0 52 7439-96-5 Manganese and compounds 14 6 53 7439-97-6 Mercury and compounds 7 4 54 72-43-5 Methoxychlor 0 1 55 75-09-2 Methylene chloride 1 0 56 7440-02-0 Nickel and compounds 6 4 57 85-01-8 Phenanthrene 0 2 58 13981-52-7 Polonium-210 1 0 59 1336-36-3 Polychlorinated biphenyls 4 2 60 NA Polynuclear aromatic hydrocarbons 1 2 61 13966-00-2 Potassium-40 1 0 62 129-00-0 Pyrene 0 3 63 NA Radionuclides 6 0 64 7440-14-4 Radium 1 0 65 13982-63-3 Radium-226 6 0 66 15262-20-1 Radium-228 3 0 67 10043-92-2 Radon 2 0 68 14859-67-7 Radon-222 4 0 69 7782-49-2 Selenium and compounds 2 7 70 7440-22-4 Silver and compounds 3 5 71 7440-23-5 Sodium 0 1 72 79-34-5 Tetrachloroethane, 1,1,2,2- 2 0 73 127-18-4 Tetrachloroethylene 3 0 74 7440-28-0 Thallium and compounds 6 7 75 14274-82-9 Thorium-228 4 0 76 14269-63-7 Thorium-230 3 0 77 7440-29-1 Thorium-232 1 0 78 71-55-6 Trichloroethane, 1,1,1- 1 0 79 79-01-6 Trichloroethylene 3 1 80 7440-61-1 Uranium 1 0 81 7440-61-1 Uranium-230 1 0 82 13966-29-5 Uranium-234 3 0
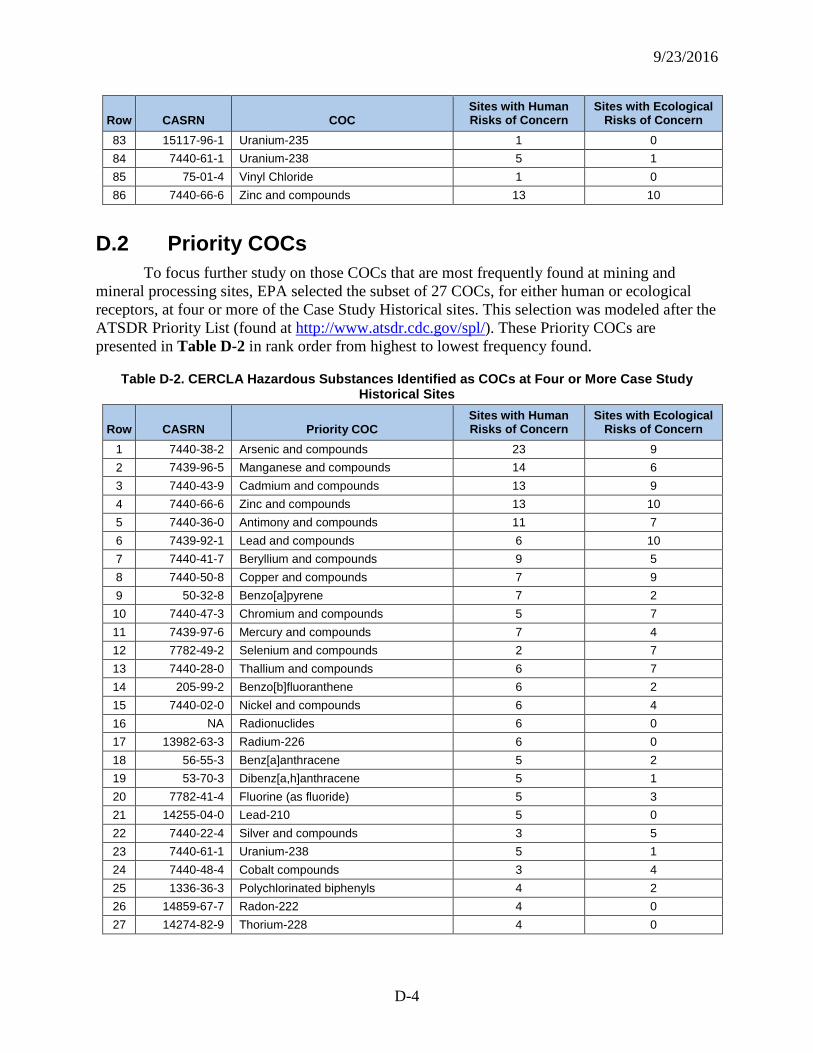
9/23/2016
D-4
Row CASRN COC Sites with Human Risks of Concern
Sites with Ecological Risks of Concern
83 15117-96-1 Uranium-235 1 0 84 7440-61-1 Uranium-238 5 1 85 75-01-4 Vinyl Chloride 1 0 86 7440-66-6 Zinc and compounds 13 10
D.2 Priority COCs To focus further study on those COCs that are most frequently found at mining and
mineral processing sites, EPA selected the subset of 27 COCs, for either human or ecological receptors, at four or more of the Case Study Historical sites. This selection was modeled after the ATSDR Priority List (found at http://www.atsdr.cdc.gov/spl/). These Priority COCs are presented in Table D-2 in rank order from highest to lowest frequency found.
Table D-2. CERCLA Hazardous Substances Identified as COCs at Four or More Case Study Historical Sites
Row CASRN Priority COC Sites with Human Risks of Concern
Sites with Ecological Risks of Concern
1 7440-38-2 Arsenic and compounds 23 9 2 7439-96-5 Manganese and compounds 14 6 3 7440-43-9 Cadmium and compounds 13 9 4 7440-66-6 Zinc and compounds 13 10 5 7440-36-0 Antimony and compounds 11 7 6 7439-92-1 Lead and compounds 6 10 7 7440-41-7 Beryllium and compounds 9 5 8 7440-50-8 Copper and compounds 7 9 9 50-32-8 Benzo[a]pyrene 7 2 10 7440-47-3 Chromium and compounds 5 7 11 7439-97-6 Mercury and compounds 7 4 12 7782-49-2 Selenium and compounds 2 7 13 7440-28-0 Thallium and compounds 6 7 14 205-99-2 Benzo[b]fluoranthene 6 2 15 7440-02-0 Nickel and compounds 6 4 16 NA Radionuclides 6 0 17 13982-63-3 Radium-226 6 0 18 56-55-3 Benz[a]anthracene 5 2 19 53-70-3 Dibenz[a,h]anthracene 5 1 20 7782-41-4 Fluorine (as fluoride) 5 3 21 14255-04-0 Lead-210 5 0 22 7440-22-4 Silver and compounds 3 5 23 7440-61-1 Uranium-238 5 1 24 7440-48-4 Cobalt compounds 3 4 25 1336-36-3 Polychlorinated biphenyls 4 2 26 14859-67-7 Radon-222 4 0 27 14274-82-9 Thorium-228 4 0
9/23/2016
E-1
Appendix E Geospatial Methodologies and Quality Assurance Protocol
for 2009 Current Site Analyses This appendix describes, in detail, the geospatial analysis’ original selection, assessment,
and documentation of secondary data sources. Section 6 discusses the issues, approaches, and quality assurance/quality control (QA/QC) procedures performed during the geospatial analysis itself. It includes references to a number of additional documents that provide more details regarding each of the primary data development and analysis tasks. The attachments (labeled E1, E2, E3, E4, and E5) reflect various refinements and additions to the original analysis.
This Quality Assurance Protocol originated as a Quality Assurance Project Plan (QAPP) formatted according to ‘QAPP Requirements for Secondary Data Research Projects’, dated 7/1/1999 and EPA’s Guidance for Geospatial Data Quality Assurance Project Plans (EPA QA/G-5G) (available at: http://www.epa.gov/quality) (March 2003).
E.1 Objectives The objective of this geospatial work is to allow examination of potential human and
ecological exposures to CERCLA hazardous substances from current and future CERCLA 108(b) mines and mineral processors (hereafter referred to as “2009 Current” sites), using national-scale secondary data. Existing data elements contained in data systems maintained by federal agencies, and other available potential sources, will be identified that can be used to characterize exposure potential. Geospatial data will also be used to evaluate the relative severity of the potential environmental impacts broadly associated with 2009 Current site activities.
The methodology uses an iterative process that integrates four subtasks:
• Subtask 1: Preliminary draft QAPP; • Subtask 2: Identifying, Evaluating, and Documenting Data Elements and Sources; • Subtask 3: Obtain and Process Datasets Meeting Quality Criteria; and • Subtask 4: Identification of Factors Related to Exposure to CERCLA Hazardous Substances
(Questions) and Data Analysis.
Each of the subtasks is described in greater detail in Section E.2 below.
E.2 Planned Evaluation Approach This section describes the general approach used to identify and evaluate secondary data
and describes the type of analytical and processing techniques.
E.2.1 Analytical Techniques This evaluation used specific analyses or statistical methods to characterize types of data
displays, and buffer zone queries regarding location proximity to specific features of interest. Existing federal data systems were explored to identify qualitative, semi-quantitative, and
9/23/2016
E-2
quantitative secondary data elements contained in these datasets and to evaluate the relevance of these data to examining the identified exposure factors or scenarios of interest. To the extent practicable, raw and processed data were compiled on a national scale.
E.2.2 Evaluation QAPP The primary objectives of the evaluation include:
• the identification of data sources and data elements, • the determination of data quality characterizing secondary data that EPA found
acceptable for use, and • the development of examination and evaluation processes and methods.
Attachment E3, Figure E3-1 illustrates the evaluation’s general process flow.
E.2.3 Subtask 2. Identifying, Evaluating, and Documenting Data Elements and Sources
Step1. Identification of data sources and data elements: If existing data layers were not available or known from past EPA projects then federal data repositories were explored as the principal sources to find appropriate and sufficient datasets with coverage in the continental United States, Hawaii, Alaska, Puerto Rico, the U.S. Virgin Islands, Guam, and the Commonwealth of the Northern Mariana Islands. EPA developed summaries of the data source(s) and the associated applicable data element(s), including a general description of the data element(s).
Step 2. Evaluation of data usability: EPA evaluated the usability of the data sources in terms of accessibility; completeness; scale; timeframe in which data were obtained and compiled, relative to timeframes for which data are needed; reliability; availability of metadata that describe how the data have been obtained, compiled, and subsequently managed, along with any other pertinent information that characterizes the data quality.
Attachment E3, Figure E3-2 illustrates the general process flow for Subtask 2.
E.2.4 Subtask 3. Obtain and Process Datasets Meeting Quality Criteria
EPA generally projected national level geospatial data to a standard North American map projection such as Lambert Conformal Conic, to limit distortion of distance and area so that buffer zones, areas, and lengths of geographic features were accurately calculated. EPA queried the federal data system to obtain the required datasets for specified site locations, regions, or the areas associated with the specified national-scale coverage. In many cases file geodatabases (i.e., GIS data layers for ArcMap version 9.3) had been created using the raw data elements; however, some datasets had been processed before a spatial data layer was created. When processing data, EPA prepared metadata documenting the processing steps. The geospatial analysis software generates metadata in automated format when data elements are mapped without any manipulation. EPA archived the raw datasets along with the spatial data layer and/or other associated data products generated from the original data.
9/23/2016
E-3
Attachment E3, Figure E3-3 illustrate the general process flow of Subtask 3.
E.2.5 Subtask 4. Identification of Factors Regarding Potential Exposure to CERCLA Hazardous Substances (Questions) and Data Analysis
Attachment E3, Figure E3-4 illustrates the integration of the exposure questions with the geospatial analyses performed.
Subtask 4, Part 1:
EPA reviewed the identified datasets for usability with respect to general questions regarding the proximity of human and ecological receptors to site features associated with release of CERCLA hazardous substances. U.S. Census Bureau data provided the best ability to measure human proximity to 2009 Current sites. Although EPA used Census 2000 data, and during the course of the project Census 2010 data became available, EPA decided that the geospatial analysis results likely would not change significantly with Census 2010 data due to the general pattern of 2009 Current site locations.
For ecological receptors, EPA distinguished between threatened and endangered species, which have special status under the Endangered Species Act, versus non-threatened and endangered species. For threatened and endangered species, the U.S. Fish and Wildlife Service data on critical habitat provided the best ability to estimate vulnerability (due to proximity) to 2009 Current sites. For other (non-threatened and endangered species) ecological receptors, a variety of federal geospatial data were used, both for assessing potential vulnerability (due to proximity) of those receptors to CERCLA hazardous substance releases at the 2009 Current sites, and for assessing impacts from low-probability, high-consequence events such as floods.
Subtask 4, Part 2: EPA used the Geographic Information System (GIS) to perform spatial analyses to answer the associated potential for exposure to CERCLA hazardous substance question or query, and documented the steps and processes included in developed algorithms.
E.3 Secondary Data Needs and Sources EPA did not to collect primary data for the geospatial analysis due to the large volume of
already-published data that could be used as secondary data in the analysis. In general, EPA used national level geospatial data to provide consistency in the analysis. National level geospatial data created by various Federal agencies are standard sources for EPA geospatial analyses. EPA generally used data covering the most recent timeframe of this report (approximately 2010-2011). Due to the complexity and cost of developing national geospatial data layers, the dates for these most recent geospatial data vary. For some subjects (e.g., surficial geology), the time period of the data is not of great importance since surficial geology generally does not change significantly over time. For other layers, such as landuse/landcover, various sources are available with dates ranging from the 1970s to the early 2000s.
National level geospatial data are available at different scales depending on the subject. National elevation data, for example, is available at 30-meter pixel resolution. National Hydrography Datasets are produced from maps at a scale of 1:100,000. Some geospatial data
9/23/2016
E-4
(such as census bureau TIGER line files) are produced from more than one scale of original maps and therefore are sometimes referred to as multi-scale themes. In general, EPA used geospatial data layers at the highest resolution (largest scale) available for each theme to produce analytical results at the best precision possible. This evaluation used Federal Geographic Data Committee (FGDC) metadata. The metadata fully document the source of the data, processing steps used to generate the data, any limitations or errors known to exist in the data, the structure of the data and source scale.
Secondary data were collected from a variety of sources and are described in Section 6 and in additional documents that are referenced in Section 6.
Attachment E5, Figures E5-1, E5-2, E5-3, and E5-4 list the types of secondary data used for this report. In general, EPA used data sources that were 1) recognized according to a national geospatial standard, 2) the most recent available, 3) at the largest scale (most precise), and 4) had Federal Geospatial Data Coordinating Committee (FGDC) metadata. Data documentation is reproduced in Attachments E1 and E2.
E.4 Quality of Secondary Data For this report, EPA assessed the quality of all secondary data for appropriateness for its
intended use, as described below.
E.4.1 Quality Requirements In general, EPA assumed that national geospatial data sources from other federal
agencies were of known and appropriate accuracy, completeness, and precision. In certain cases, for feature definitions and coded attributes, EPA also made some assumptions regarding feature definitions and coded attributes for standard national datasets. For example, the National Hydrography Dataset (NHD) contains features coded as ‘Swamp/Marsh’ features. EPA assumed that Swamp/Marsh features from NHD represent what one would normally think of as ‘wetlands’ even though no feature coded as ‘wetlands’ exists in the NHD. These assumptions are documented in Attachments E-1 and E-2.
For non-spatial secondary data from sources such as spreadsheets, reports, and other documents, EPA used various techniques to assess the quality and accuracy of the information, such as spot-checking a subset of the records and comparing against other data sources, as well as evaluating the data source (agency, organization, or person creating the data).
E.4.2 QA/QC Procedures EPA used a checklist to assess the general appropriateness and quality of each identified
secondary data source for use. The checklist included items such as, “Does the source provide national coverage?”; “Does the source contain FGDC metadata?”; and “What is the scale/resolution of the data source?” Data sources that did not meet the appropriateness check either were not used, or were used with a disclaimer (see section E.3.3 below) to note that its quality was not known. In addition, a second analyst reviewed specific analytical methods such as buffers and overlays, to ensure that those analyses were carried out correctly.
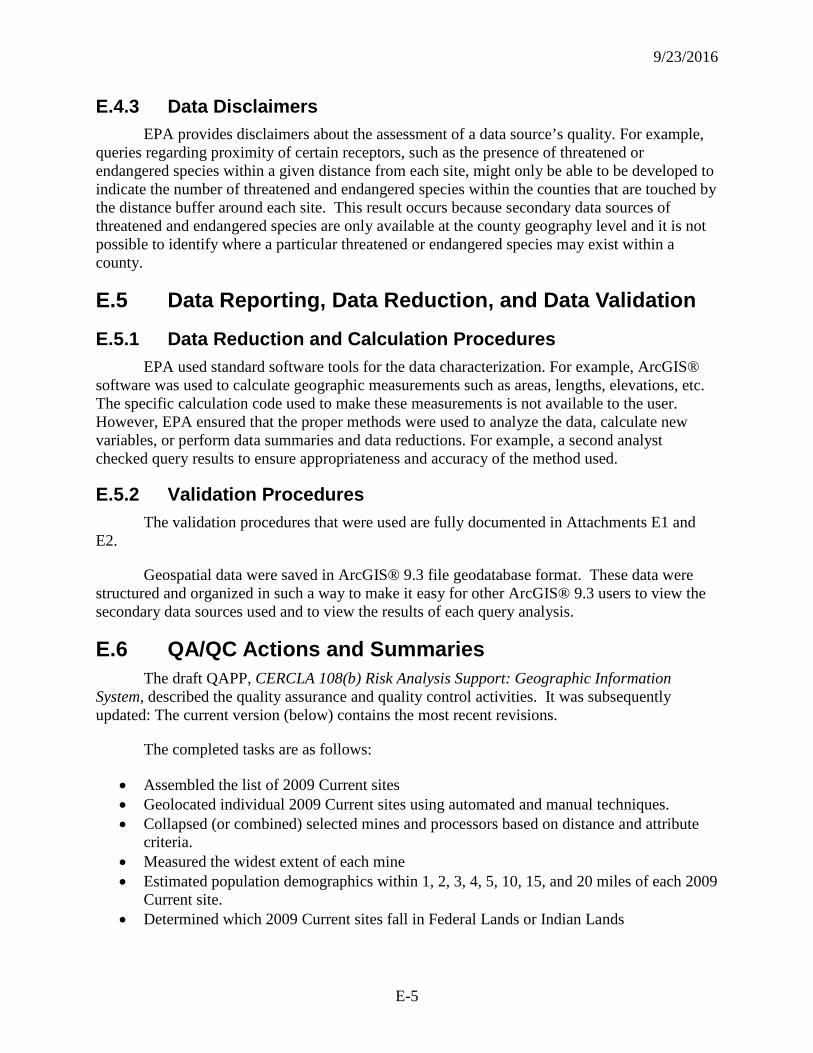
9/23/2016
E-5
E.4.3 Data Disclaimers EPA provides disclaimers about the assessment of a data source’s quality. For example,
queries regarding proximity of certain receptors, such as the presence of threatened or endangered species within a given distance from each site, might only be able to be developed to indicate the number of threatened and endangered species within the counties that are touched by the distance buffer around each site. This result occurs because secondary data sources of threatened and endangered species are only available at the county geography level and it is not possible to identify where a particular threatened or endangered species may exist within a county.
E.5 Data Reporting, Data Reduction, and Data Validation
E.5.1 Data Reduction and Calculation Procedures EPA used standard software tools for the data characterization. For example, ArcGIS®
software was used to calculate geographic measurements such as areas, lengths, elevations, etc. The specific calculation code used to make these measurements is not available to the user. However, EPA ensured that the proper methods were used to analyze the data, calculate new variables, or perform data summaries and data reductions. For example, a second analyst checked query results to ensure appropriateness and accuracy of the method used.
E.5.2 Validation Procedures The validation procedures that were used are fully documented in Attachments E1 and
E2.
Geospatial data were saved in ArcGIS® 9.3 file geodatabase format. These data were structured and organized in such a way to make it easy for other ArcGIS® 9.3 users to view the secondary data sources used and to view the results of each query analysis.
E.6 QA/QC Actions and Summaries The draft QAPP, CERCLA 108(b) Risk Analysis Support: Geographic Information
System, described the quality assurance and quality control activities. It was subsequently updated: The current version (below) contains the most recent revisions.
The completed tasks are as follows:
• Assembled the list of 2009 Current sites • Geolocated individual 2009 Current sites using automated and manual techniques. • Collapsed (or combined) selected mines and processors based on distance and attribute
criteria. • Measured the widest extent of each mine • Estimated population demographics within 1, 2, 3, 4, 5, 10, 15, and 20 miles of each 2009
Current site. • Determined which 2009 Current sites fall in Federal Lands or Indian Lands
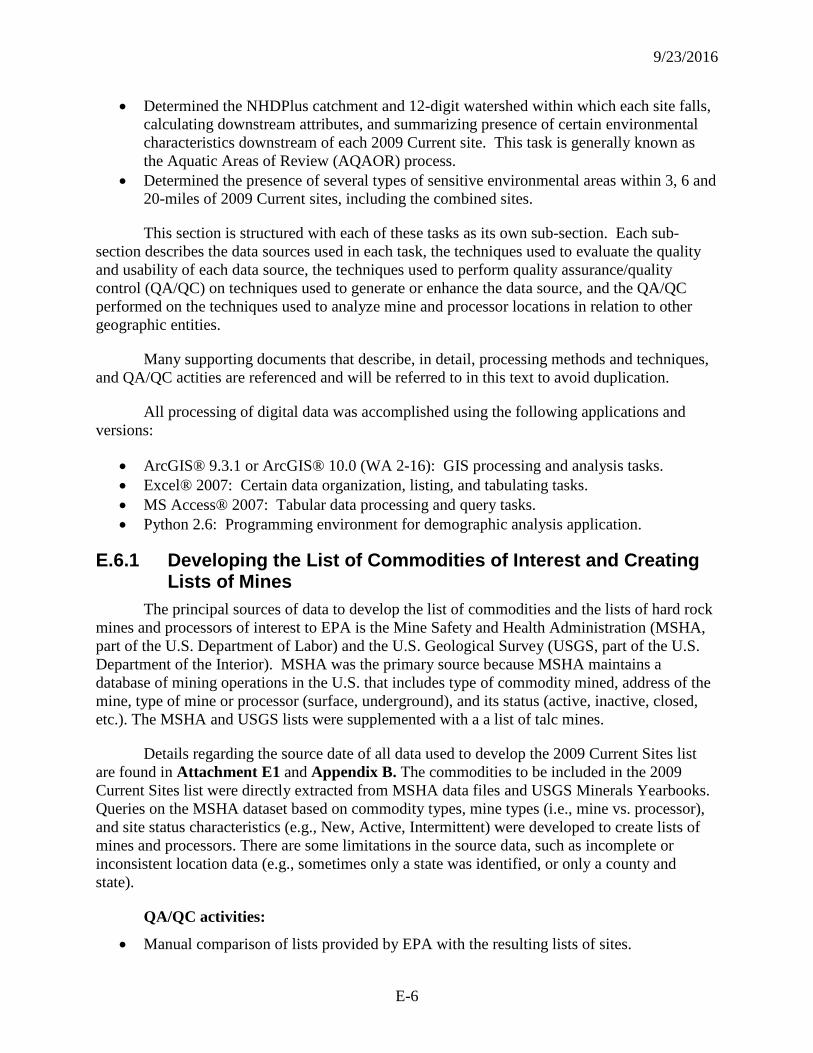
9/23/2016
E-6
• Determined the NHDPlus catchment and 12-digit watershed within which each site falls, calculating downstream attributes, and summarizing presence of certain environmental characteristics downstream of each 2009 Current site. This task is generally known as the Aquatic Areas of Review (AQAOR) process.
• Determined the presence of several types of sensitive environmental areas within 3, 6 and 20-miles of 2009 Current sites, including the combined sites.
This section is structured with each of these tasks as its own sub-section. Each sub-section describes the data sources used in each task, the techniques used to evaluate the quality and usability of each data source, the techniques used to perform quality assurance/quality control (QA/QC) on techniques used to generate or enhance the data source, and the QA/QC performed on the techniques used to analyze mine and processor locations in relation to other geographic entities.
Many supporting documents that describe, in detail, processing methods and techniques, and QA/QC actities are referenced and will be referred to in this text to avoid duplication.
All processing of digital data was accomplished using the following applications and versions:
• ArcGIS® 9.3.1 or ArcGIS® 10.0 (WA 2-16): GIS processing and analysis tasks. • Excel® 2007: Certain data organization, listing, and tabulating tasks. • MS Access® 2007: Tabular data processing and query tasks. • Python 2.6: Programming environment for demographic analysis application.
E.6.1 Developing the List of Commodities of Interest and Creating Lists of Mines
The principal sources of data to develop the list of commodities and the lists of hard rock mines and processors of interest to EPA is the Mine Safety and Health Administration (MSHA, part of the U.S. Department of Labor) and the U.S. Geological Survey (USGS, part of the U.S. Department of the Interior). MSHA was the primary source because MSHA maintains a database of mining operations in the U.S. that includes type of commodity mined, address of the mine, type of mine or processor (surface, underground), and its status (active, inactive, closed, etc.). The MSHA and USGS lists were supplemented with a a list of talc mines.
Details regarding the source date of all data used to develop the 2009 Current Sites list are found in Attachment E1 and Appendix B. The commodities to be included in the 2009 Current Sites list were directly extracted from MSHA data files and USGS Minerals Yearbooks. Queries on the MSHA dataset based on commodity types, mine types (i.e., mine vs. processor), and site status characteristics (e.g., New, Active, Intermittent) were developed to create lists of mines and processors. There are some limitations in the source data, such as incomplete or inconsistent location data (e.g., sometimes only a state was identified, or only a county and state).
QA/QC activities:
• Manual comparison of lists provided by EPA with the resulting lists of sites.
9/23/2016
E-7
• Extraction of actual text strings present in MSHA data to match 108(b) commodities. • Comparing resulting lists of mines and processors against various versions of MSHA data
bases and other data sources • Identification of sites that were duplicative between datasets
Final products include:
• List of Commodities (contained in Appendix B, Table B-4. “MSHA and USGS Commodities Potentially Subject to CERCLA 108(b) Hard Rock Mining Rule”)
• The list of 2009 Current sites, including the combined sites, is provided in Appendix B, Attachment B5 (“2009 Current Sites”).
E.6.2 Geolocating Mines and Processors A full description of the methods, sources, and procedures used to geolocate,
enhance/improve locations, and code all locations with a confidence level are provided in Attachment E2 (“Geospatial Database Development Process”). In general, the QA/QC activities that were undertaken to ensure accuracy and usability of the locations of 2009 Current sites was based on visual inspection of the locations provided in the MHSA, USGS, and EPA data sources that were used to construct the 2009 Current Sites list.
Some individual 2009 Current mines and processors were combined into new ‘sites’ depending on proximity, commodity, and name. The process of combining mines and processors is described in Section 6.4 below.
Data sources used for geolocating of mines and processors included:
• The mine or processor address provided by MHSA. GIS address geocoding procedures were used to create a latitude/longitude for each site for which an address was supplied.
• Internet searches based on mine and processor name or other information provided in source lists were used to attempt to map 2009 Current sites with no known address or location. A list of the web-sites accessed and the mine or processor relevant to the search is provided in the References section of Attachment E2.
QA/QC activities:
• Visual review of the geocoded location was conducted on 100% of the 2009 Current sites. The visual review was accomplished using Google Earth and ArcGIS software with the highest publically available satellite imagery at each 2009 Current site.
• Mines and processors were coded at the end of visual review to indicate the subjective confidence level for the accuracy of each location. The Loc_Conf attribute contains the following codes:
o 0 = no location could be found OR the location provided is likely to be inaccurate and no source could be found to improve it.
o 1 = the location may or may not be accurate; further information would be required to assign a higher confidence value.
o 2 = the location seems to be accurate based on the visual inspection of the location.
9/23/2016
E-8
Limitations in source data and QA/QC include:
• Google Earth imagery and imagery available via ArcGIS are of recent, but unknown date in most cases. It is possible that, in some cases, a 2009 Current site could not be located because it was created after the date of the imagery that was consulted.
• The locational accuracy of the imagery in Google Earth and ArcGIS cannot be directly verified, but EPA assumes it to be accurate for the purpose of locating 2009 Current sites. Imagery available from these tools is widely used by government and industry for mapping and geolocating entities.
• Assumptions were made about the actual boundaries of 2009 Current sites. In many cases, mines may have encompassed more than one pit, or the wrong mine (when multiple pits were visible) might have been chosen. There is no way to verify that the location chosen for any 2009 Current site reflects the actual location without contacting each mine or processor.
• EPA did not use a specific quality requirement for the 2009 Current Site locations except to identify the best locations available from the available datasets and internet searches. The Loc_Conf (location confidence code) assigned to each 2009 Current site is a subjective assessment of the quality of the location.
Final products include:
• ArcGIS shapefile V8_Final_list_2011_03_03.shp of the 2009 Current sites which included individual mines, individual processors, and those mines and processors that were aggregated into “combined sites.”
• MS Acccess database file (V8_Deliverable.mdb) that contains the latitude/longitude coordinatesfor the 2009 Current sites.
• A cross reference file (V8_UNIVERSAL_XREF) in the V8_Deliverable.mdb database that indicates each individual mine and processor, as well as a new site identifier (SITE_RNUM) for those mines and processors were aggregated into combined sites.
• A complete list of unique 2009 Current sites (V8_FINAL_LIST) in the V8_Deliverable.mdb database that contains a complete list of final sites along with their SITE_RNUM IDs and a flag indicating, for each site, if it is a mine, a processor, or a combination.
E.6.3 Measuring the Geographic Extent of Each Mine Because the sizes of mines vary greatly, EPA made a general estimate of the size of each
mine by measuring the length of the widest part of each mine disturbed area. These measurements are useful in determining the size of a mine and were performed relatively quickly by using existing measurement tools provided with the Google Earth applications.
The methodology employed was to visually examine Google Earth imagry of each mine, and use the interactive measurement tool to establish a rough estimate of the width of the widest part of the mine. The specific measurements are contained in two fields, Long_Site_Mile and Long_Mine_Mile.

9/23/2016
E-9
In general, the measurements were made using the following methodology: The measurement is based on a line that transects the mined pit area, within the mine property, connecting the farthest distant and opposite points along a discernable boundary around the mined or excavated area. Conceptually, the line drawn would encompass all of the mined or pit areas if pivoted on its mid-point. This value usually represents the distance across the surface mine excavation area unless otherwise noted. Process and storage areas that are located on the periphery of the mined area were not included in the distance measurement; however, these areas are often located within the pit or excavated area and would be included. This measure does not apply to underground mines unless it is thought that the mine entrance is located inside the pit and then the pit area is used to bound this location. Note that several mine sites have multiple pit locations situated across their site and values provided are for the distance across all mined areas. However, for sites 4300150, 2601842, 2600827, 200134, 301926, and 300715, several values are provided. These values represent a median value or the measurement for the significantly larger pit area as noted. The measurements for each individual pit is also given in the comments for reference. This value is only a longest axis distance measurement and not a 2-or 3-dimensional aspect ratio of the excavated area.
All values are recorded in miles.
Data sources used for measuring the widest part of each mine:
• The 2009 Current Mines shapefile converted to KMZ format. • Google Earth Version 5 and the imagery that is accessible via Google Earth.
QA/QC activities:
• Independent spot checks of 10% of the measurements were made to verify that the measurements were reasonable.
Limitations:
• The measurements are made interactively, using professional judgment. Different professionals may make different decisions as the shape and extent of the mines from the identical imagery.
E.6.4 Combining Selected Mines and Processors into Single ‘Sites’ EPA identified which 2009 Current sites were within five kilometers of each other and
also shared the same name, owner name, or operator name. The purpose of this procedure was to eliminate duplicate entities when these individual sites could reasonably be assumed to be in essence a single ‘site’ for regulatory purposes.
As described in detail in Attachment E2, EPA used a two-stage process. The first stage involved combining mines with other mines and combining processors with other processors. The second stage combined mines (or previously combined mines) with processors (or previously combined processors). When combined, a new location was chosen for the combined site that was generally between the original locations, or otherwise seemed to fall in the middle of the disturbed area encompassed by the combined sites.
9/23/2016
E-10
New site IDs (SITE_RNUM) were assigned to all remaining sites (individual mines, individual processors, and combinations). The SITE_RNUM identifiers were coded to aid in identifying which sites were the product of the combining process and which were not. The SITE_RNUMs were coded as follows:
< 1000: Mines combined with other mines or processors combined with other processors. None of which were subsequently re-combined. 1000 – 1999: Mines (or combined mines) and processors (or combined processors) that were combined with each other. In other words, these sites are the product of combining both mines and processors. 2000 – 2999: New identifiers for individual processors that were not combined. 3000-3999: New identifiers for individual mines that were not combined.
QA/QC activities:
• A new table was created to hold a cross-reference between the original mine ID (MINE_RNUMs), original processor IDs (FAC_RNUM) and the new site IDs (SITE_RNUM) based on which mines and processors were combined.
• The cross reference table was used to examine each decision regarding which mines and processors should be combined. An analyst visually examined aerial photography of each combined site to ensure that the individual sites were within five kilometers of each other and that the owner name, operator name, and/or controller name were the same (or substantially similar).
• Based on the above QA/QC procedure minor modifications were made to the cross reference list.
• The cross reference table also contains a code to indicate which mines and/or processors were combined twice. This can occur where two mines, for example, were combined based on the criteria and then were subsequently combined with one or more processors.
• It is important to note that in many cases subjective judgments were made regarding the similarity of names, owner names, and operator names. In addition, the geographic terrain (satellite imagery) played a role in decisions depending on the extent of disturbed areas and how these areas related to the site point locations. Final products include:
• A list of all 2009 Current sites, including individual mines, individual processors, and combined mines/processors. There are a total of 491 sites in the 2009 Current Sites list.
E.6.5 Estimating Population Demographics As described in detail in Attachment E1 (“Demographic Analysis Methods”), EPA
estimated counts of populations by various demographic characteristics within 1, 2, 3, 4, 5, 10, 15, and 20 miles of each 2009 Current site. This procedure was first run for individual sites, and subsequently for combined sites.
A total of 48 different demographic characteristics (e.g., population counts by age group, race/ethnic group, income, etc.) were estimated for each of the eight buffer distances for each site. Due to the volume of data to be used and the potential for errors if done manually, EPA
9/23/2016
E-11
developed an ArcGIS macro program to run the analysis and construct the output files. Complete documentation on the methods, techniques, application programs, queries, and results of the demographic analysis are provided in Attachment E1. Details regarding the specific source of each input database, any limitations of those data, assessment of the usability is included in that document. The following summarizes the sources, QA/QC activities, limitations and deliverables.
Data sources:
• 2009 Current Sites shapefile. • 2000 Census Block Group polygons provided in the ArcGIS 9.3 datasets. • Census demographic data from the U.S. Census Summary File 3 (SF3) files available
from the U.S. Census Bureau.
QA/QC activities:
• The queries that EPA developed to generate the demographic input data (for example, to combine gender-specific population data into a total for each 5-year age group) were independently checked by a second analyst to ensure that the variables selected, equations used, and calculation results for each query were correct.
• The application program developed to run the analysis was developed and tested to completion. A second GIS analyst performed a code review to ensure that the program was taking the appropriate actions and using appropriate methods to produce accurate results.
• Visual review of some output data identified a bug or error in the ArcGIS processing which resulted in the disappearance of some polygons in the output shapefiles. EPA decided to place a check on the outputs of each buffer zone to sum up the area of all output polygons for each mine and compare the sum to the area of the original buffer. This check would automatically identify cases where random polygons were dropped by ArcGIS. When problems were identified, EPA re-ran the demographic program until the check ran without identifying errors.
• Each buffer zone distance was output to its own database table. EPA checked each resulting table to ensure that each table contained the correct number of records the correct fields.
• Spot checks of demographic calculations were made on randomly selected files. • Mines or processors having poor or no locations (Loc_Conf = 0) were coded with a value
of ‘-99999’ for all demographic variables because any demographic results for these mines or processors would be incorrect since the input location of the mine or processor was most likely incorrect.
Final products include: Sixteen demographic analysis files were generated based on: eight buffer zone distances
to be analyzed; both mines and processors were run through each buffer zone analysis. The demographic analysis for Alaska was run separately because a different map projection had to be used to accurately handle buffer distances in Alaska as compared to the contiguous U.S. There are no demographics results for processors in Alaska because no processors are located in Alaska. A list of the demographics tables is provided below:
9/23/2016
E-12
• V8_Combined_20110412_1Mile_CONUS_final • V8_Combined_20110412_2Mile_CONUS_final • V8_Combined_20110412_3Mile_CONUS_final • V8_Combined_20110412_4Mile_CONUS_final • V8_Combined_20110412_5Mile_CONUS_final • V8_Combined_20110412_10Mile_CONUS_final • V8_Combined_20110412_15Mile_CONUS_final • V8_Combined_20110412_20Mile_CONUS_final
• V8_Combined_20110412_1Mile_AK_final • V8_Combined_20110412_2Mile_AK_final • V8_Combined_20110412_3Mile_AK_final • V8_Combined_20110412_4Mile_AK_final • V8_Combined_20110412_5Mile_AK_final • V8_Combined_20110412_10Mile_AK_final • V8_Combined_20110412_15Mile_AK_final • V8_Combined_20110412_20Mile_AK_final
E.6.6 Identifying Which Mines and Processors Fall on Indian Lands and Federal Lands
To determine which 2009 Current sites are located on Indian Lands and Federal Lands, EPA used a GIS overlay point-in-polygon technique to identify the Indian Land or Federal Land polygon in which each point falls.
Indian Lands The ArcGIS Identity tool was used to overlay mine and processor points into a GIS layer
of Indian Lands to identify whether or not each point falls on Indian Lands.
Data sources:
• 2009 Current Sites shapefile • Indian Lands boundary layer from the United States Department of the Interior, Bureau of Indian
Affairs (BIA), downloaded as a component of the USA Federal Lands layer package from https://www.arcgis.com/home/item.html?id=26c2a38f94c54ad880ff877f884ff931.
The definition of “Indian Lands” can differ, depending on the purpose for the definition. This analysis required a nationwide layer containing broad definitions of what constitutes Indian Lands produced by a U.S. agency that has the relevant knowledge to produce such a dataset. For this reason, EPA chose the data layer from the BIA. However, exact boundaries are sometimes disputed, and detailed maps are often not generated in order to avoid raising issues of jurisdiction or interpretation.
Because of the different definitions of what constitutes Indian Lands, the lack of consensus on on boundaries and considerations such as those listed above, EPA carefully
9/23/2016
E-13
examined the exact type of Indian Land that included a 2009 Current site, and used the results of this analysis with care.
QA/QC activities:
• EPA had no specific data requirements for data quality of the Indian Lands analysis. Based on this, and the lack of agreement on any particular nationwide layer, the quality of the data being used and the results are unknown.
• EPA ensured that all 2009 Current sites with location data were included in the outputs of the overlay analysis. For 2009 Current that did not fall on Indian Lands, all Indian Land attributes are blank.
Final data products inlcude:
• The Indianlands_V8.mdb file contains the results of the Indian Lands analysis. Specifically, the database query ‘ON_IndianLands’ was used to list the 2009 Current sites that are physically located on Indian lands.
Federal Lands
The ArcGIS Identity tool was used to overlay 2009 Current Site point locations with a GIS layer of Federal Lands to identify which sites fall on Federal Lands.
Data sources:
• 2009 Current Sites shapefile. • U.S. National Atlas Federal and Indian Land Areas layer. This layer was chosen because
it is national in scale and is a recognized and widely used source of polygon delineations of lands that are controlled by the U.S. Government.
QA/QC activities:
• EPA had no specific data requirements for data quality of the Federal Lands analysis. Based on this and the lack of an official government standard layer, the quality of the Federal Lands layer is unknown.
• EPA ensured that all 2009 Current sites with location points were included in the outputs of the overlay analysis. For 2009 Current sites that did not fall on Federal Lands, all Federal Land attributes are blank.
Final data products include:
• The Mines_V7_FedLands, and Processors_V7_FedLands data tables included in the V7_Deliverables.mdb file contains the results of the Federal Lands analysis.
E.6.7 Aquatic Areas of Review (AQAORs) This analysis was conducted to determine the hydrologic setting and potential
downstream areas that might be impacted by releases from 2009 Current sites. This procedure is described in detail in Appendix H (“Ecological Receptors”). The information that follows below is a summary of the data sources, analyses, and QA/QC procedures used on this task.
9/23/2016
E-14
The analytical method first identified the twelve digit hydrologic catalog unit (HUC-12) that each site falls in. All catchments within the HUC-12 were then identified, and downstream flow navigation was run to select all catchments downstream of the HUC12 catchments that were estimated to be within an estimated 24-hour downstream travel distance. These areas are known as the Aquatic Areas of Review (AQAORs). A series of overlay operations were then run to determine how the AQAORs intersected with a variety of additional layers (such as major dams of the U.S., Safe Drinking Water Source Protection Areas, etc.) to identify which AQAORs might have downstream areas with sensitive environmental conditions.
Because the 2009 Current Sites universe contains combined sites, the methodology involved evaluating individual mine and processor locations, and then combining and summarizing the results for the combined sites.
Data aources:
• 2009 Current Sites shapefile • NHDPlus surface hydrography database. • National Wild and Scenic Rivers System from http://www.rivers.gov/maps.html
The National Wild and Scenic Rivers System was created by Congress in 1968 (Public Law 90-542; 16 U.S.C. 1271 et seq.) to preserve certain rivers with outstanding natural, cultural, and recreational values in a free-flowing condition. These river systems are typically viewed as Outstanding Resource Waters (Tier 3 waters) in EPA-approved State Water Quality Standards under the Clean Water Act.
• Major Dams of the United States from the NID available from https://www2.usgs.gov/science/cite-view.php?cite=244
This map layer from the USGS National Atlas portrays major dams of the United States, including Puerto Rico and the U.S. Virgin Islands. The map layer was created by extracting dams 50 feet or more in height, or with a normal storage capacity of 5,000 acre-feet or more, or with a maximum storage capacity of 25,000 acre-feet or more, from the 79,777 dams in the U.S. Army Corps of Engineers National Inventory of Dams. Descriptive information includes the dam name and location, the risk level associated with the dam, and the purposes (beneficial uses) for which the dam was constructed. Purpose codes include the following "beneficial uses", which will correlate with CWA WQS designated uses: ’F’ Fish and Wildlife; ‘R’ Recreation; and ‘S’ Water Supply.
• FEMA Q3 Special Flood Hazard Areas selected for use from the EPA Drinking Water Mapping Application. Background and metadata is available at https://www.fema.gov/flood-map-definition
A vector polygon GIS layer showing Special Flood Hazard Area (SFHA) polygons in the FEMA Q3 flood data GIS layers. The land area covered by the floodwaters of the base flood is the Special Flood Hazard Area (SFHA) on official FEMA National Flood Insurance Program (NFIP) maps. The SFHA is the area where the NFIP's floodplain management regulations must be enforced and the area where the mandatory purchase of flood insurance applies. Flood hazard areas identified on the Flood Insurance Rate Map are identified as a Special Flood Hazard Area (SFHA). SFHA are defined as the area that will be inundated by the flood event having a 1-percent chance of being equaled or exceeded in any given year. The 1-percent annual chance of flood is also
9/23/2016
E-15
referred to as the base flood or 100-year flood. Q3 Flood Data is a digital representation of certain features of FEMA's Flood Insurance Rate Maps, intended for use with desktop mapping and Geographic Information Systems technology. The Q3 Flood Data are produced for counties that have flood risk impacts around 70% of the population of the Untied States. This means that FEMA Q3 GIS products are not available for all counties. Materials are available for the contiguous United States, Hawaii, Alaska, Puerto Rico, and the Virgin Islands. The separate county-level Q3 GIS layers are combined into a seamless national GIS layer for polygons that are within Special Flood Hazard Areas. FEMA 100 year floodplains are likely to contain important aquatic habitats, including riverine or other wetland types.
• Surface Drinking Water Source Protection Areas available via the EPA Drinking Water Mapping Application (available at https://www.epa.gov/sourcewaterprotection/dwmaps).
Data represent Source Protection Area (SPA) polygons for coastal and inland surface waters – based on NHDPlus catchments for the continental US (CONUS) and convex hulls for Alaska. In the CONUS, NHDPlus coastal catchments are used as SPAs for public water system facility surface sources on NHD coastal shorelines. For inland surface sources, 24 hour upstream time of travel navigation is applied to select NHDPlus catchments and define watershed-based SPAs. Information is available to identify community versus non-community public water systems related to these SPAs, but this information is not included with this dataset. The SPAs and other primary materials are EPA Sensitive Drinking Water Information. Only the “indicator” results of geospatial proximity checks with the AqAORs will be made publically available.
• Groundwater Source Protection Areas available via the EPA Drinking Water Mapping Application
Data represent Source Protection Area (SPA) polygons for groundwater. 1-mile circular buffers were created around groundwater well facilities to create the SPAs. Information is available to identify community versus non-community public water systems related to these SPAs, but this information is not included with this dataset. The SPAs and other primary materials are EPA Sensitive Drinking Water Information. Only the “indicator” results of geospatial proximity checks with the AqAORs will be made publically available.
• Tribal Drinking Water Sources available via the EPA Drinking Water Mapping Application
Data represent facility source points (predominantly groundwater wells) from SDWIS/FED latitude/longitude coordinates. Source Protection Areas (SPAs) have not been developed for the Drinking Water Mapping Application (DWMA) – so the coordinate points are used to determine proximity to Aq-AORs. Information is available to identify community versus non-community public water systems related to these facility points but this information is not included with this dataset. These tribal facility points and other primary materials are EPA Sensitive Drinking Water Information. Only the “indicator” results of geospatial proximity checks with the AqAORs will be made publically available.
• Federal Lands of the United States available from the National Atlas (from https://www.arcgis.com/home/item.html?id=26c2a38f94c54ad880ff877f884ff931.)
9/23/2016
E-16
This publicly available GIS layer provides polygons for various “agency or bureau” (AGBUR) federal public lands. Federally-owned and managed public lands include National Parks, National Forests, and National Wildlife Refuges. This layer is included in the EPA OW RAD ancillary National Atlas GIS layers.
• Clean Water Act Section 303(d) Impaired Waters available from EPA’s WATERS Expert Query Tool
A data table that documents “metals” impairments was taken from the WATERS ATTAINS database in a pull for October, 2010, for all waters showing impairments (EPA's Integrated Reporting categories 4a, 4b, 4c and 5). For GIS mapping, the most comprehensive and publicly available mapping layer is EPA’s “2002 Impaired Waters Baseline National Geospatial Dataset” (released in March, 2010).
• NPDES Major Permitted Processors available from EPA at www.epa.gov/enviro/geo_data.html
Information is from the EPA OEI Geospatial Data Download Service. At the time of this evaluation the GDDS had last been updated on January 30, 2011. NPDES “majors” selected from the full set of facility locations for numerous EPA programs. Information based on ICIS/PCS NAICS/SIC codes is provided to be able to tell WWTP (SIC code of 4952 for SEWERAGE SYSTEMS) from other industrial/commercial (IC) facilities.
• RCRA Large Quantity Generator Processors available from EPA at www.epa.gov/enviro/geo_data.html
Information is from the EPA OEI Geospatial Data Download Service. At the time of this evaluation the GDDS had last been updated on January 30, 2011. LQG facilities were selected from the full set of facility locations for numerous EPA programs where the contents of RCRA1_INT through RCRA6_INT contained the string "LQG."
• Alluvium Layer from USGS Generalized Geologic Map available from the National Atlas at https://pubs.usgs.gov/atlas/geologic/ (CONUS only)
Alluvium layer from USGS Generalized Geologic Map of the United States in the National Atlas. For parts of the CONUS not covered by the FEMA Q3 floodplain GIS layer, alluvial deposits (alluvium) provide a proxy to identify areas that may be flood prone.
• Indian/Tribal Lands for Native American Groups available from the National Atlas at http:/nationalatlas.gov/mld/indlanp.html (CONUS only)
From the USGS National Atlas layer on Indian (Tribal) Lands. • Anadromous Waters Catalog (Alaska only) available from
https://www.adfg.alaska.gov/sf/SARR/AWC/ • Alaska Native Village Statistical Area (ANVSA) (Alaska only) available from
http://www.epa.gov/waters/doc/auxiliary/tiger.html
These data layers were chosen because they are the only national (or Alaska-based) source of GIS data containing the types of information required for the analysis. All of these data sets and layers are either nationally recognized and readily available GIS data sources, or they are in use in official EPA data management systems and applications (for example, the layers available from within the Drinking Water Mapping Application.
9/23/2016
E-17
QA/QC activities: The specific data quality of each of these datasets is provided (if available) in the
metadata that is attached to each layer. For the most part, the data quality is unknown because of the lack of independent verification of these layers and because EPA had no specific data quality requirements for these layers.
Final products include: The output tables for the AQAOR analysis are provided in the V8_AQAORs.mdb
database in the following tables:
• V8_Mines_Catchments_withInfo_final • V8_Processors_Catchments_withinfo_final • V8_Mines_Processors_Catchments_withINFO • V8_Final_List • V8_Universal_Xref
E.6.8 Sensitive Environmental Lands EPA identified those 2009 Current sites that may affect sensitive ecological areas if
releases were to occur to land or water. EPA first identified a series of readily available, nationwide data layers that contain the boundaries of potentially sensitive areas.
Data sources:
• Coastal Barrier Resources System (CBRS) boundaries (contains areas designated as underveloped coastal barriers in accordance with the Coastal Barrier Resources Act)
• Critical Habitat boundaries (Areas where critical habitat exist for species listed as endangered or threatened. Produced by the FWS)
• Fish and Wildlife Service (FWS) Approved Areas (Areas approved for purchased by FWS)
• FWS Interest Areas (areas administered by the FWS) • FWS Special Designation Areas (areas on which ‘special designations’ have been
placed by FWS under the direction of the U.S. Congress) • Protected Areas Database (PAD) (Contains areas of publically-owned lands; private
conservation lands, and UNEP-World Conservation Monitoring Center’s World Database for Protected Areas.)
Detailed information on these layers was collected in a memo dated November 22, 2010.
The analytical process involved defining buffer zones around each 2009 Current site at 3-miles, 6-miles, and 20-miles and then overlaying each buffer zone onto each of the sensitive environmental lands layers noted above. The results show which 2009 Current sites touch sensitive lands for each buffer distance.
QA/QC activities:
9/23/2016
E-18
Visual spots checks using GIS were made to examine selected V8 sites, the buffer zones created around them and the locations of sensitive areas in relation to the buffers. Spot checks ensured that the procedure was working correctly and that the output layer and tables accurately reflected the overlay process. (Note, however, that EPA requested lists of those sites that had sensitive environmental areas and therefore, only those sites whose buffers interested sensitive environmental areas were included in the output table provided to EPA.)
All V8 sites, even those with a location confidence code of ‘0’ (meaning there is no location for the site or it is presumed to be incorrect) were included in the analysis.
9/23/2016
E1-1
Attachment E1. Demographic Analysis Methods
E1-1 Introduction This document describes the Geographic Information System (GIS) tools and methods
developed to calculate demographic summary information associated with 2009 Current sites. This document describes datasets and methods to characterize the demographics within eight buffer zone areas surrounding each location, including:
• background for this work, • data sources used in generating the demographic datasets, • inputs of spatial and supporting data, • process methods, and • data limitations.
EPA developed a series of demographic datasets for the 2009 Current sites, to assess the likelihood for potential impacts to human health from 2009 Current sites. The demographics data alone are not adequate for use in a Superfund risk assessment, and it is expected that other methods and data would be needed to further refine the data for that purpose.
E1-2 Background The 2009 Current Sites geodatabases used for this analysis were prepared for the
CERCLA 108(b) hardrock mining rulemaking. The point location data 2009 Current sites are described in Attachment E2 (“Geospatial Database Development Process”).
EPA developed a set of GIS queries about the demographic profile of human receptors near 2009 Current sites to estimate the following:
• The total population within zones extending out to a 1, 2, 3, 4, 5, 10, 15 and 20 mile distance from each identified site coordinate point;
• The number of children in the following age categories for each zone: <1 year old, 1 to <2 years old, 2 to <3 years old, 3 to <6 years old, 6 to <11 years old, 11 to <16 years old, and 16 to <21 years old;
• The number of residents in each of the narrowest household income ranges provided by the census for each zone;1
• The number of residents by race for each zone; • The number of residents by ethnicity for each zone.
E1-3 Data Sources EPA used the following data sources as inputs to the demographics analysis.
1 EPA used income by household, rather than by individual resident, because the census data doesn’t include income by resident.
9/23/2016
E1-2
Census demographic data: Source: Geolytics Inc. 2000 U.S. Census Long Form SF3 DVD.
Geolytics is a company that publishes U.S. Census data on CD-ROM, DVD, and Online (www.geolytics.com). The data from Geolytics is relatively easy to query and produces easy to use tables.
Census block group boundaries: Source: ESRI Block Groups for 2000 U.S. Census
Environmental Systems Research Institute (ESRI) is a Geographic Information Systems software company based in Redlands, CA. With each software release ESRI provides up-to-date spatial data on a ‘data disk’. EPA used version 9.3.1 and, specifically used the census block group boundary layer in the demographics analysis. Although census block polygons are smaller than census block group polygons, meaning more precise estimates of population counts could be determined from them, EPA chose to use census block groups because not all variables of interest in environmental justice analyses (such as income, poverty and educational attainment) are available at the census block level. Census block groups provide the smallest level of census geography for which all significant census demographic variables are available.
2009 Current Sites Locations: The 2009 Current Sites locations file used for this particular demographic study was
developed as described in Attachment E2. The list of mines and processors contained in this dataset was originally obtained from the Mine Safety and Health Administration (MSHA). Coordinate locations were determined from various sources and through a variety of methods with varying degrees of confidence.
Intermediate Datasets: During the demographics processing, the following two types of intermediate data layers
were generated:
• Buffer zones around each mine at 1, 2, 3, 4, 5, 10, 15, 20 mile distances (produced by ‘Buffer Tool’ in ArcMap as part of the analysis process)
• Intersected Block Groups and Buffer zones (produced by ‘Identity Tool’ in ArcMap as part of the analysis process)
E1-4 Processing Methods
Creation of Input Demographics Data Table EPA queried the Geolytics census DVD by census block group for the entire U.S. to
select the 87 variables needed for the analysis. The variables are listed in Appendix E1-2: 2000 SF3 Census Variables Used in Demographic Analysis. For total population, income, race and ethnicity, the census data were already organized sufficiently for the analysis. For age however, the demographic census data were separated by sex and individual years, so further queries were
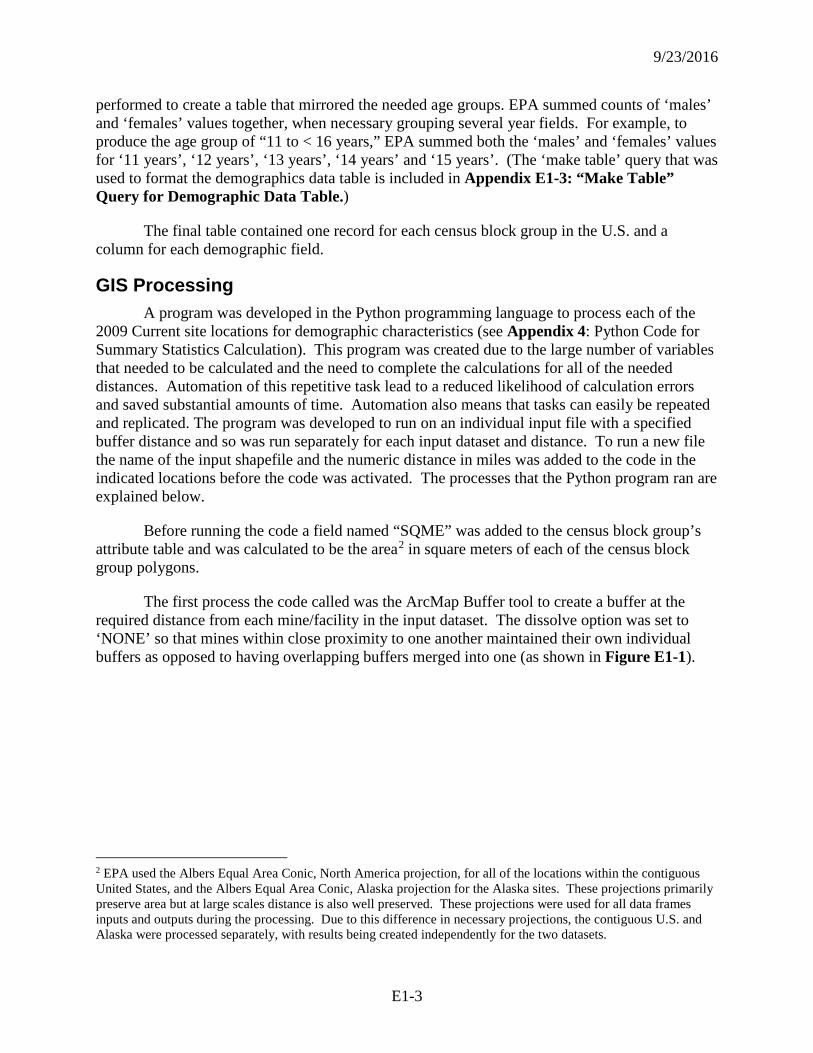
9/23/2016
E1-3
performed to create a table that mirrored the needed age groups. EPA summed counts of ‘males’ and ‘females’ values together, when necessary grouping several year fields. For example, to produce the age group of “11 to < 16 years,” EPA summed both the ‘males’ and ‘females’ values for ‘11 years’, ‘12 years’, ‘13 years’, ‘14 years’ and ‘15 years’. (The ‘make table’ query that was used to format the demographics data table is included in Appendix E1-3: “Make Table” Query for Demographic Data Table.)
The final table contained one record for each census block group in the U.S. and a column for each demographic field.
GIS Processing A program was developed in the Python programming language to process each of the
2009 Current site locations for demographic characteristics (see Appendix 4: Python Code for Summary Statistics Calculation). This program was created due to the large number of variables that needed to be calculated and the need to complete the calculations for all of the needed distances. Automation of this repetitive task lead to a reduced likelihood of calculation errors and saved substantial amounts of time. Automation also means that tasks can easily be repeated and replicated. The program was developed to run on an individual input file with a specified buffer distance and so was run separately for each input dataset and distance. To run a new file the name of the input shapefile and the numeric distance in miles was added to the code in the indicated locations before the code was activated. The processes that the Python program ran are explained below.
Before running the code a field named “SQME” was added to the census block group’s attribute table and was calculated to be the area2 in square meters of each of the census block group polygons.
The first process the code called was the ArcMap Buffer tool to create a buffer at the required distance from each mine/facility in the input dataset. The dissolve option was set to ‘NONE’ so that mines within close proximity to one another maintained their own individual buffers as opposed to having overlapping buffers merged into one (as shown in Figure E1-1).
2 EPA used the Albers Equal Area Conic, North America projection, for all of the locations within the contiguous United States, and the Albers Equal Area Conic, Alaska projection for the Alaska sites. These projections primarily preserve area but at large scales distance is also well preserved. These projections were used for all data frames inputs and outputs during the processing. Due to this difference in necessary projections, the contiguous U.S. and Alaska were processed separately, with results being created independently for the two datasets.
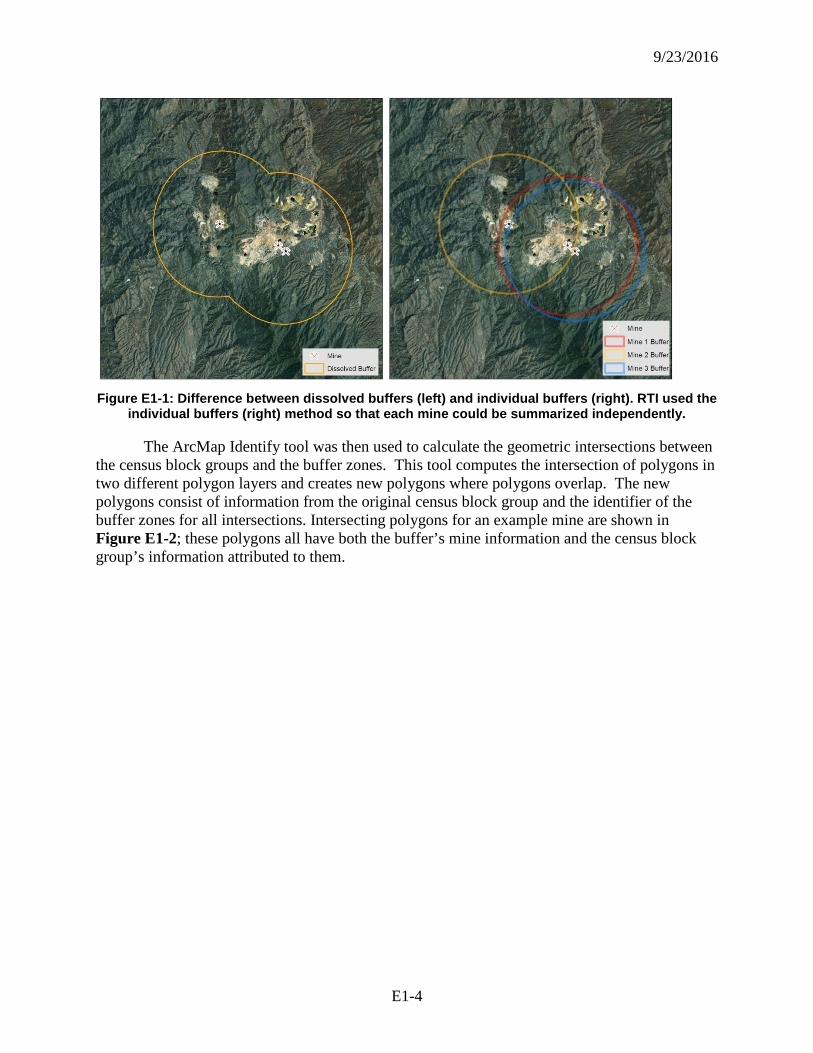
9/23/2016
E1-4
Figure E1-1: Difference between dissolved buffers (left) and individual buffers (right). RTI used the
individual buffers (right) method so that each mine could be summarized independently.
The ArcMap Identify tool was then used to calculate the geometric intersections between the census block groups and the buffer zones. This tool computes the intersection of polygons in two different polygon layers and creates new polygons where polygons overlap. The new polygons consist of information from the original census block group and the identifier of the buffer zones for all intersections. Intersecting polygons for an example mine are shown in Figure E1-2; these polygons all have both the buffer’s mine information and the census block group’s information attributed to them.
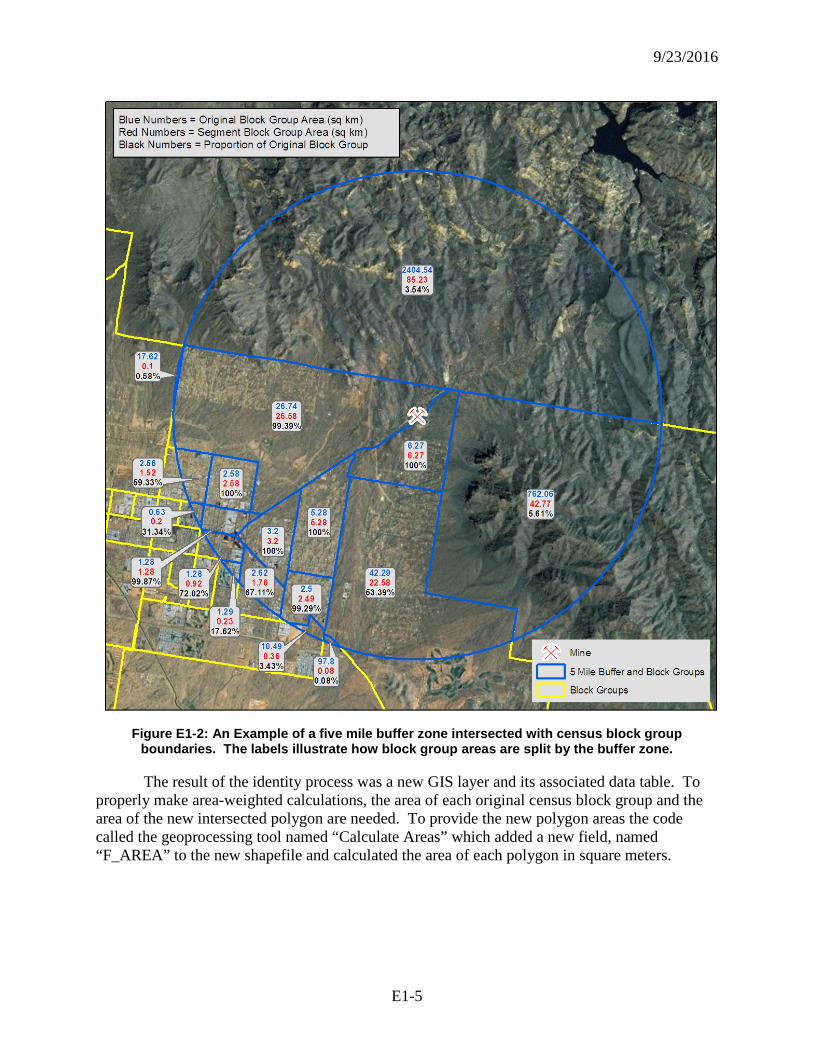
9/23/2016
E1-5
Figure E1-2: An Example of a five mile buffer zone intersected with census block group
boundaries. The labels illustrate how block group areas are split by the buffer zone.
The result of the identity process was a new GIS layer and its associated data table. To properly make area-weighted calculations, the area of each original census block group and the area of the new intersected polygon are needed. To provide the new polygon areas the code called the geoprocessing tool named “Calculate Areas” which added a new field, named “F_AREA” to the new shapefile and calculated the area of each polygon in square meters.
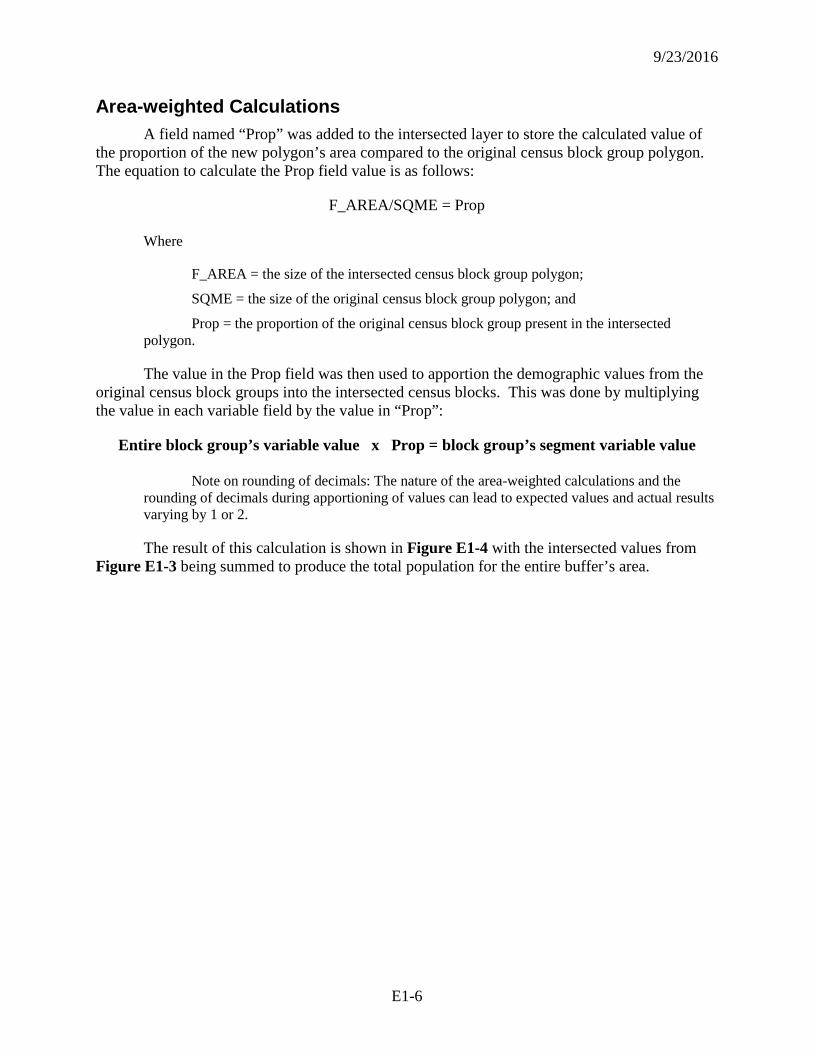
9/23/2016
E1-6
Area-weighted Calculations A field named “Prop” was added to the intersected layer to store the calculated value of
the proportion of the new polygon’s area compared to the original census block group polygon. The equation to calculate the Prop field value is as follows:
F_AREA/SQME = Prop
Where
F_AREA = the size of the intersected census block group polygon;
SQME = the size of the original census block group polygon; and
Prop = the proportion of the original census block group present in the intersected polygon.
The value in the Prop field was then used to apportion the demographic values from the original census block groups into the intersected census blocks. This was done by multiplying the value in each variable field by the value in “Prop”:
Entire block group’s variable value x Prop = block group’s segment variable value
Note on rounding of decimals: The nature of the area-weighted calculations and the rounding of decimals during apportioning of values can lead to expected values and actual results varying by 1 or 2.
The result of this calculation is shown in Figure E1-4 with the intersected values from Figure E1-3 being summed to produce the total population for the entire buffer’s area.
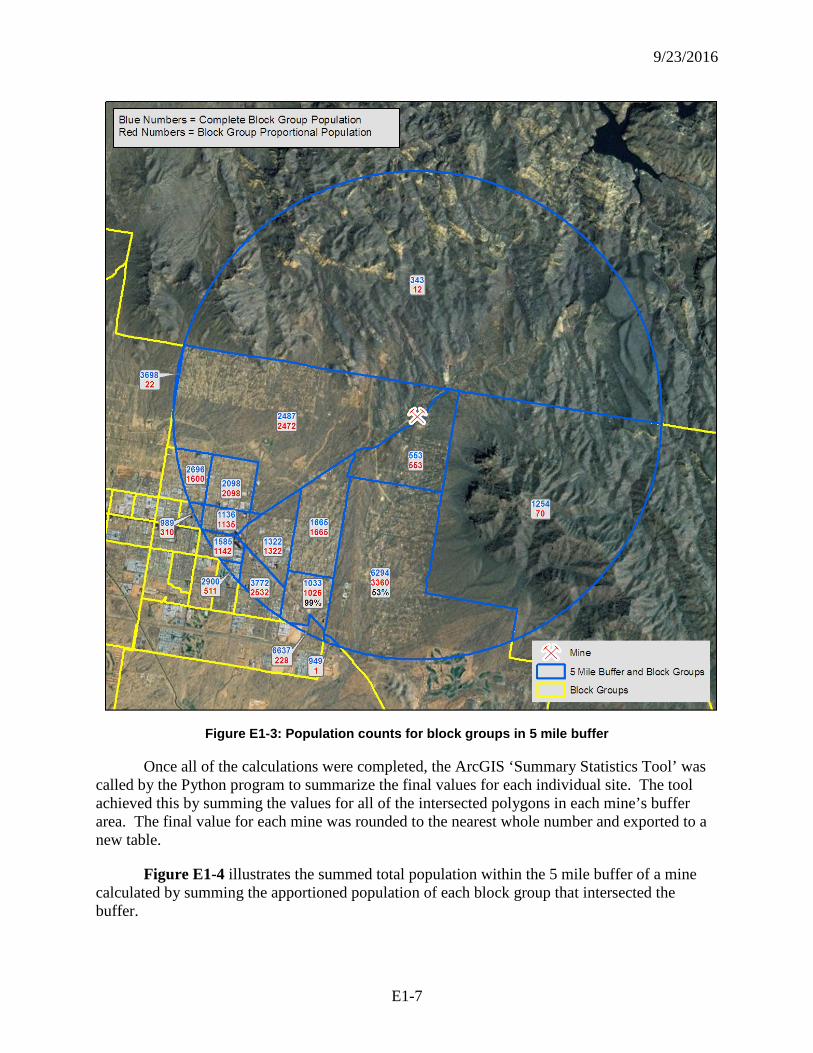
9/23/2016
E1-7
Figure E1-3: Population counts for block groups in 5 mile buffer
Once all of the calculations were completed, the ArcGIS ‘Summary Statistics Tool’ was called by the Python program to summarize the final values for each individual site. The tool achieved this by summing the values for all of the intersected polygons in each mine’s buffer area. The final value for each mine was rounded to the nearest whole number and exported to a new table.
Figure E1-4 illustrates the summed total population within the 5 mile buffer of a mine calculated by summing the apportioned population of each block group that intersected the buffer.
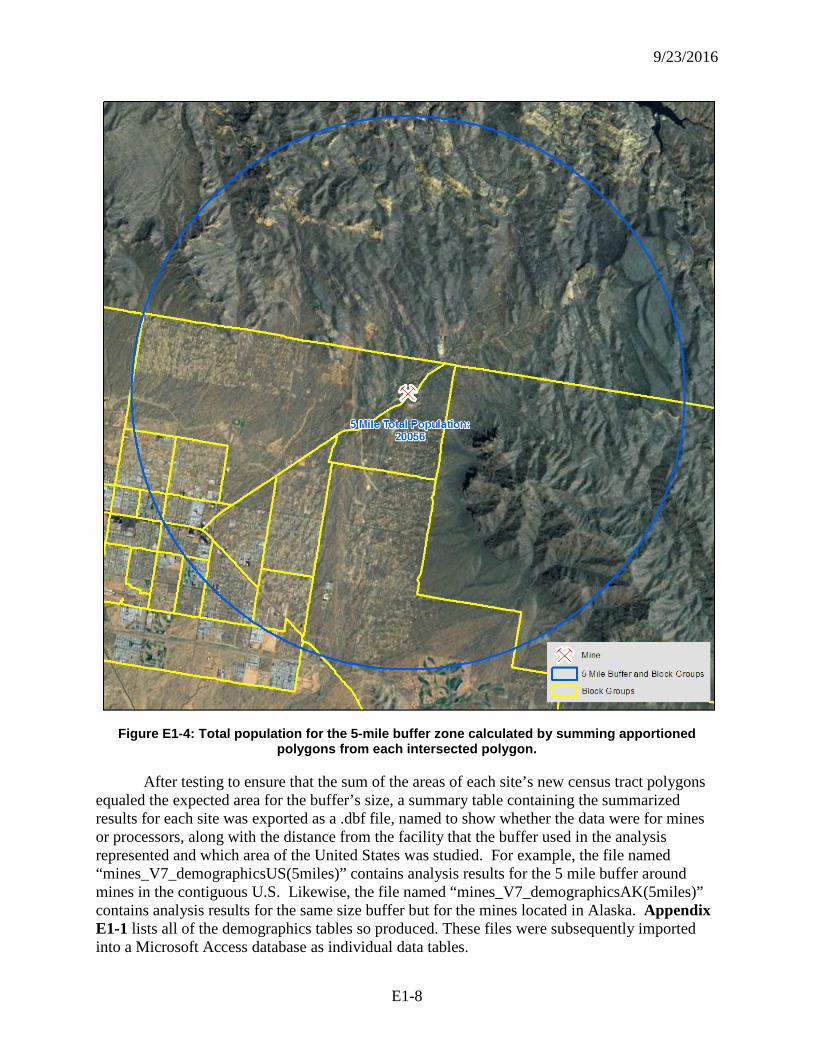
9/23/2016
E1-8
Figure E1-4: Total population for the 5-mile buffer zone calculated by summing apportioned
polygons from each intersected polygon.
After testing to ensure that the sum of the areas of each site’s new census tract polygons equaled the expected area for the buffer’s size, a summary table containing the summarized results for each site was exported as a .dbf file, named to show whether the data were for mines or processors, along with the distance from the facility that the buffer used in the analysis represented and which area of the United States was studied. For example, the file named “mines_V7_demographicsUS(5miles)” contains analysis results for the 5 mile buffer around mines in the contiguous U.S. Likewise, the file named “mines_V7_demographicsAK(5miles)” contains analysis results for the same size buffer but for the mines located in Alaska. Appendix E1-1 lists all of the demographics tables so produced. These files were subsequently imported into a Microsoft Access database as individual data tables.
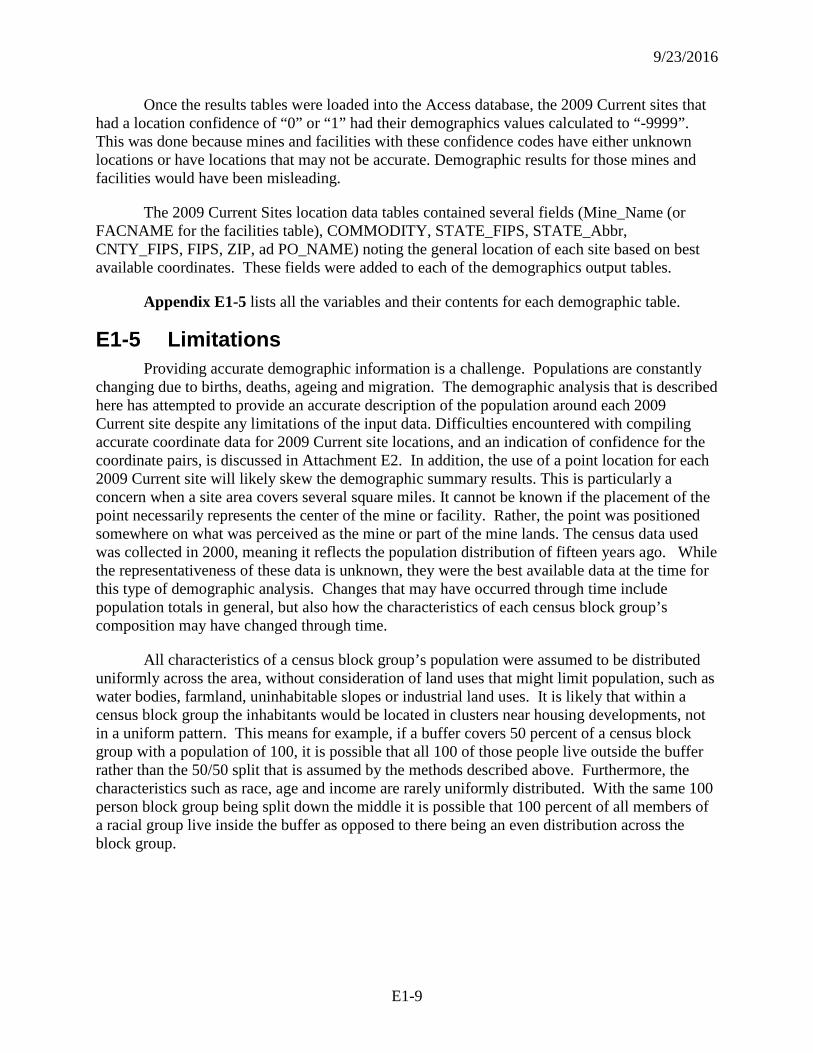
9/23/2016
E1-9
Once the results tables were loaded into the Access database, the 2009 Current sites that had a location confidence of “0” or “1” had their demographics values calculated to “-9999”. This was done because mines and facilities with these confidence codes have either unknown locations or have locations that may not be accurate. Demographic results for those mines and facilities would have been misleading.
The 2009 Current Sites location data tables contained several fields (Mine_Name (or FACNAME for the facilities table), COMMODITY, STATE_FIPS, STATE_Abbr, CNTY_FIPS, FIPS, ZIP, ad PO_NAME) noting the general location of each site based on best available coordinates. These fields were added to each of the demographics output tables.
Appendix E1-5 lists all the variables and their contents for each demographic table.
E1-5 Limitations Providing accurate demographic information is a challenge. Populations are constantly
changing due to births, deaths, ageing and migration. The demographic analysis that is described here has attempted to provide an accurate description of the population around each 2009 Current site despite any limitations of the input data. Difficulties encountered with compiling accurate coordinate data for 2009 Current site locations, and an indication of confidence for the coordinate pairs, is discussed in Attachment E2. In addition, the use of a point location for each 2009 Current site will likely skew the demographic summary results. This is particularly a concern when a site area covers several square miles. It cannot be known if the placement of the point necessarily represents the center of the mine or facility. Rather, the point was positioned somewhere on what was perceived as the mine or part of the mine lands. The census data used was collected in 2000, meaning it reflects the population distribution of fifteen years ago. While the representativeness of these data is unknown, they were the best available data at the time for this type of demographic analysis. Changes that may have occurred through time include population totals in general, but also how the characteristics of each census block group’s composition may have changed through time.
All characteristics of a census block group’s population were assumed to be distributed uniformly across the area, without consideration of land uses that might limit population, such as water bodies, farmland, uninhabitable slopes or industrial land uses. It is likely that within a census block group the inhabitants would be located in clusters near housing developments, not in a uniform pattern. This means for example, if a buffer covers 50 percent of a census block group with a population of 100, it is possible that all 100 of those people live outside the buffer rather than the 50/50 split that is assumed by the methods described above. Furthermore, the characteristics such as race, age and income are rarely uniformly distributed. With the same 100 person block group being split down the middle it is possible that 100 percent of all members of a racial group live inside the buffer as opposed to there being an even distribution across the block group.
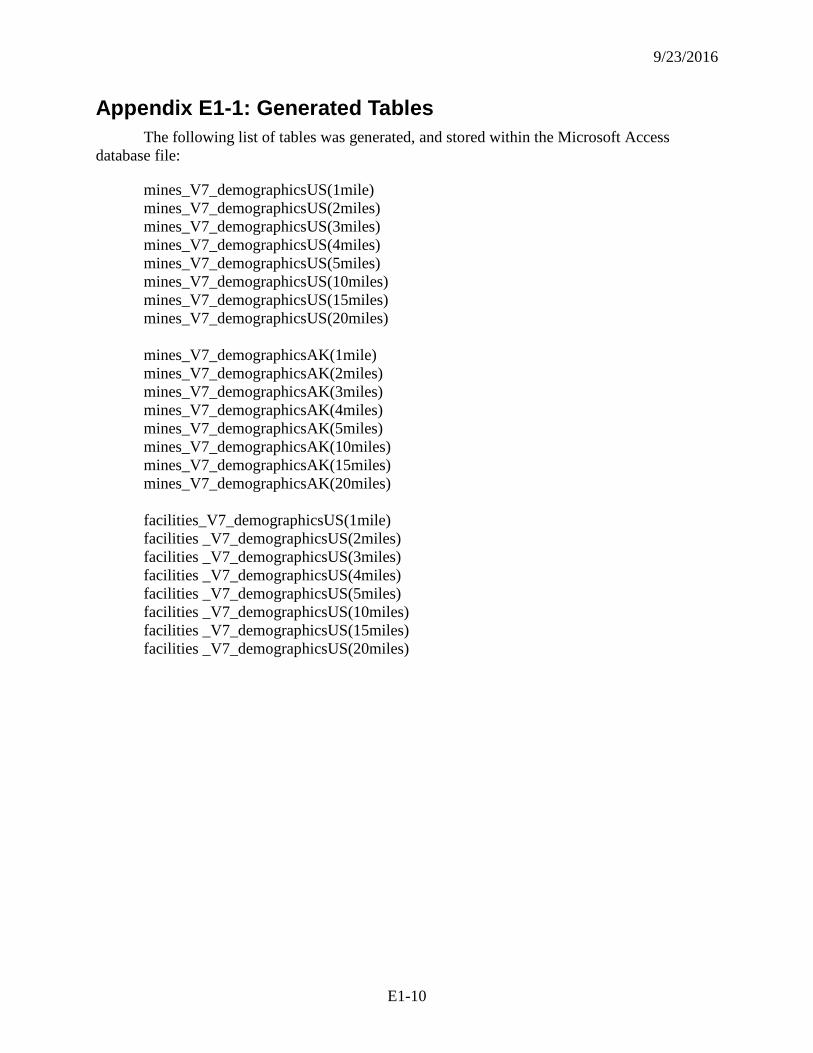
9/23/2016
E1-10
Appendix E1-1: Generated Tables The following list of tables was generated, and stored within the Microsoft Access
database file:
mines_V7_demographicsUS(1mile) mines_V7_demographicsUS(2miles) mines_V7_demographicsUS(3miles) mines_V7_demographicsUS(4miles) mines_V7_demographicsUS(5miles) mines_V7_demographicsUS(10miles) mines_V7_demographicsUS(15miles) mines_V7_demographicsUS(20miles) mines_V7_demographicsAK(1mile) mines_V7_demographicsAK(2miles) mines_V7_demographicsAK(3miles) mines_V7_demographicsAK(4miles) mines_V7_demographicsAK(5miles) mines_V7_demographicsAK(10miles) mines_V7_demographicsAK(15miles) mines_V7_demographicsAK(20miles) facilities_V7_demographicsUS(1mile) facilities _V7_demographicsUS(2miles) facilities _V7_demographicsUS(3miles) facilities _V7_demographicsUS(4miles) facilities _V7_demographicsUS(5miles) facilities _V7_demographicsUS(10miles) facilities _V7_demographicsUS(15miles) facilities _V7_demographicsUS(20miles)
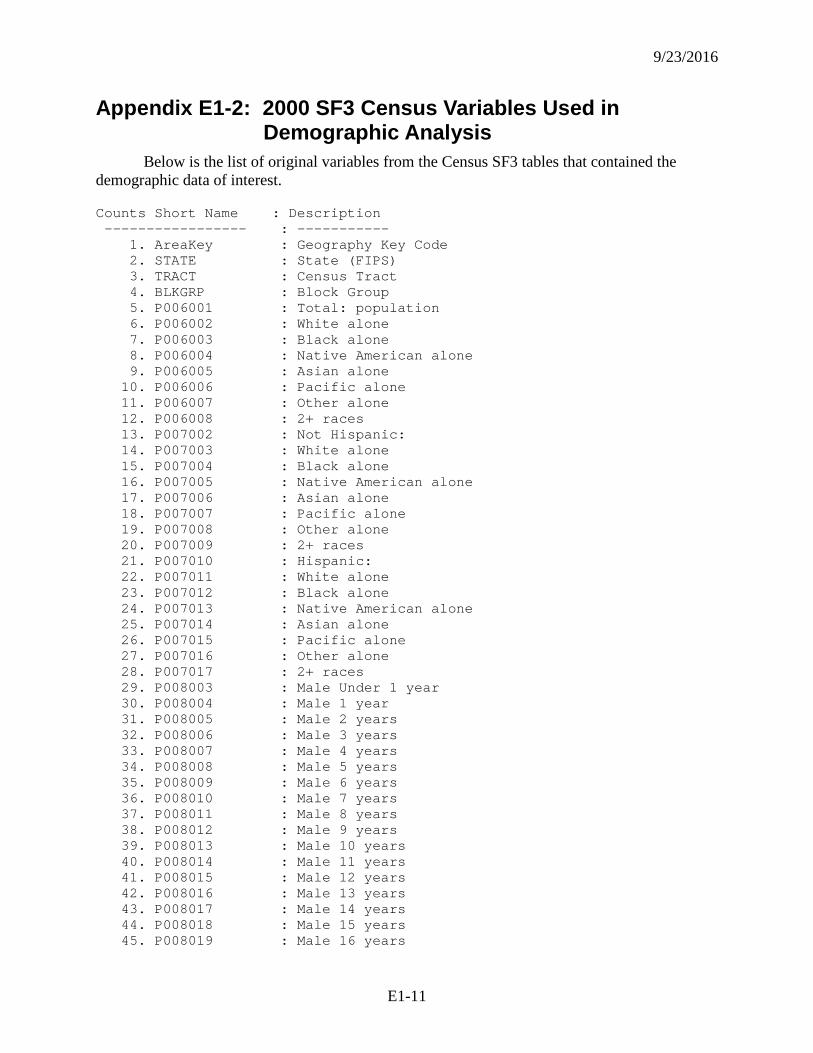
9/23/2016
E1-11
Appendix E1-2: 2000 SF3 Census Variables Used in Demographic Analysis
Below is the list of original variables from the Census SF3 tables that contained the demographic data of interest.
Counts Short Name : Description ----------------- : ----------- 1. AreaKey : Geography Key Code 2. STATE : State (FIPS) 3. TRACT : Census Tract 4. BLKGRP : Block Group 5. P006001 : Total: population 6. P006002 : White alone 7. P006003 : Black alone 8. P006004 : Native American alone 9. P006005 : Asian alone 10. P006006 : Pacific alone 11. P006007 : Other alone 12. P006008 : 2+ races 13. P007002 : Not Hispanic: 14. P007003 : White alone 15. P007004 : Black alone 16. P007005 : Native American alone 17. P007006 : Asian alone 18. P007007 : Pacific alone 19. P007008 : Other alone 20. P007009 : 2+ races 21. P007010 : Hispanic: 22. P007011 : White alone 23. P007012 : Black alone 24. P007013 : Native American alone 25. P007014 : Asian alone 26. P007015 : Pacific alone 27. P007016 : Other alone 28. P007017 : 2+ races 29. P008003 : Male Under 1 year 30. P008004 : Male 1 year 31. P008005 : Male 2 years 32. P008006 : Male 3 years 33. P008007 : Male 4 years 34. P008008 : Male 5 years 35. P008009 : Male 6 years 36. P008010 : Male 7 years 37. P008011 : Male 8 years 38. P008012 : Male 9 years 39. P008013 : Male 10 years 40. P008014 : Male 11 years 41. P008015 : Male 12 years 42. P008016 : Male 13 years 43. P008017 : Male 14 years 44. P008018 : Male 15 years 45. P008019 : Male 16 years
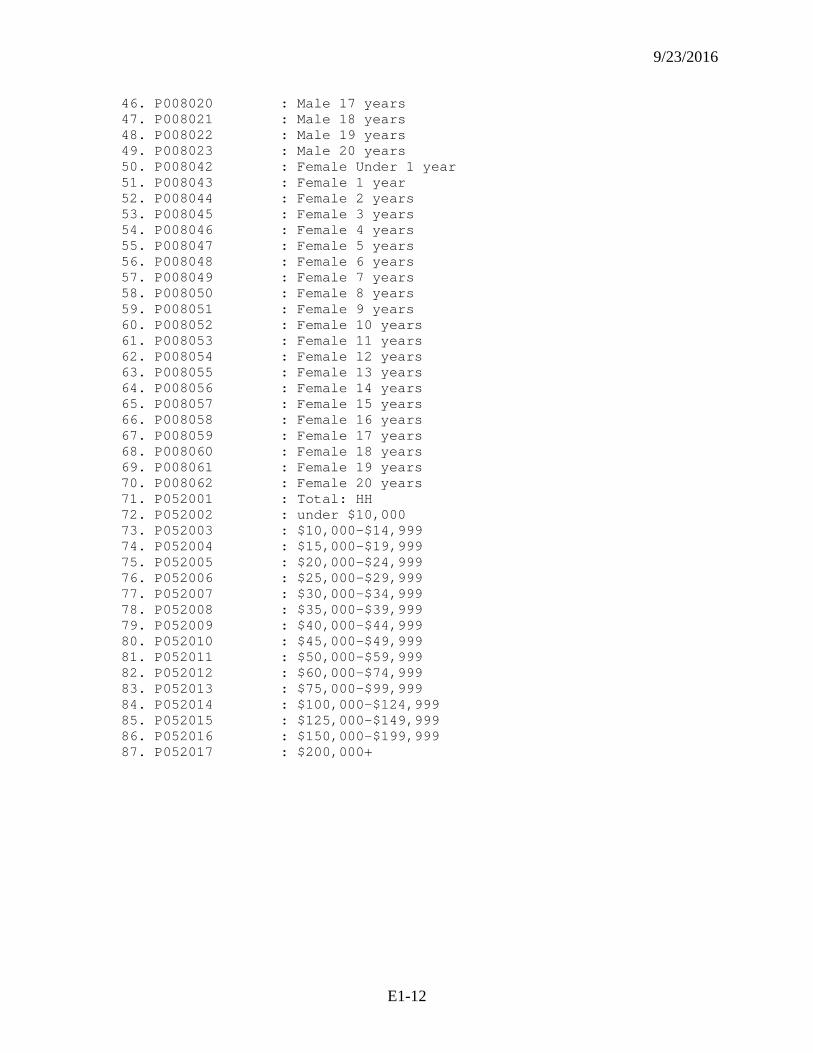
9/23/2016
E1-12
46. P008020 : Male 17 years 47. P008021 : Male 18 years 48. P008022 : Male 19 years 49. P008023 : Male 20 years 50. P008042 : Female Under 1 year 51. P008043 : Female 1 year 52. P008044 : Female 2 years 53. P008045 : Female 3 years 54. P008046 : Female 4 years 55. P008047 : Female 5 years 56. P008048 : Female 6 years 57. P008049 : Female 7 years 58. P008050 : Female 8 years 59. P008051 : Female 9 years 60. P008052 : Female 10 years 61. P008053 : Female 11 years 62. P008054 : Female 12 years 63. P008055 : Female 13 years 64. P008056 : Female 14 years 65. P008057 : Female 15 years 66. P008058 : Female 16 years 67. P008059 : Female 17 years 68. P008060 : Female 18 years 69. P008061 : Female 19 years 70. P008062 : Female 20 years 71. P052001 : Total: HH 72. P052002 : under $10,000 73. P052003 : $10,000-$14,999 74. P052004 : $15,000-$19,999 75. P052005 : $20,000-$24,999 76. P052006 : $25,000-$29,999 77. P052007 : $30,000-$34,999 78. P052008 : $35,000-$39,999 79. P052009 : $40,000-$44,999 80. P052010 : $45,000-$49,999 81. P052011 : $50,000-$59,999 82. P052012 : $60,000-$74,999 83. P052013 : $75,000-$99,999 84. P052014 : $100,000-$124,999 85. P052015 : $125,000-$149,999 86. P052016 : $150,000-$199,999 87. P052017 : $200,000+
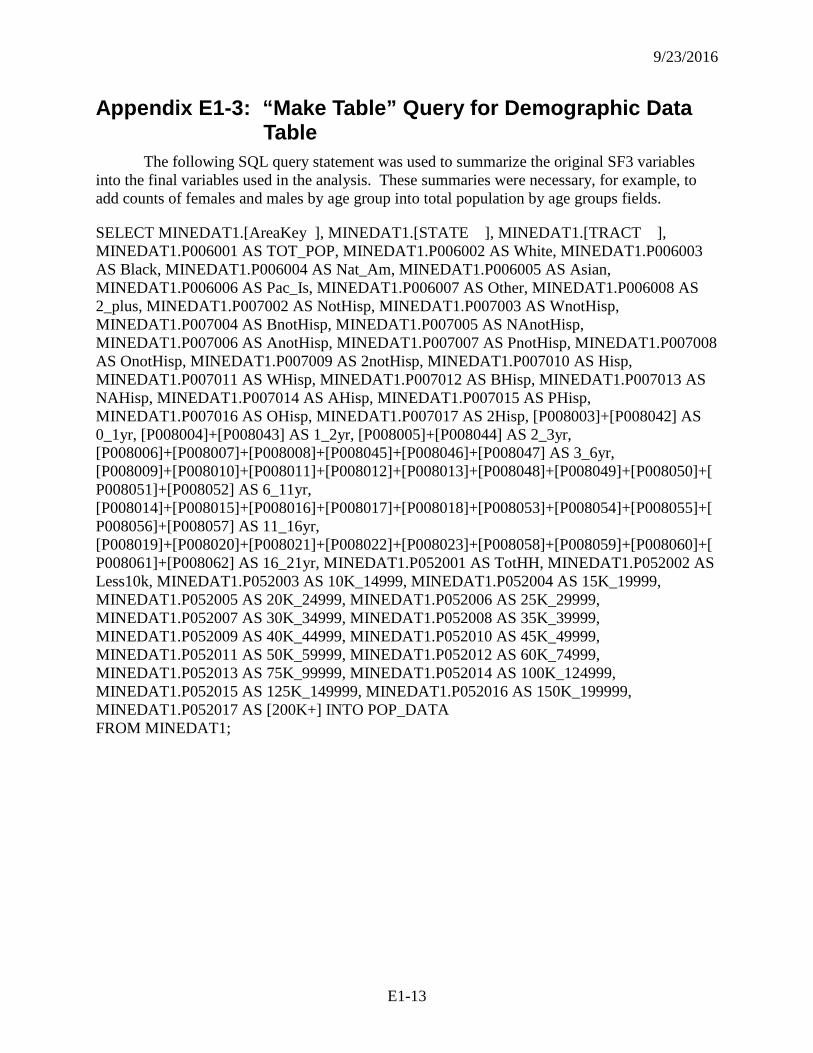
9/23/2016
E1-13
Appendix E1-3: “Make Table” Query for Demographic Data Table
The following SQL query statement was used to summarize the original SF3 variables into the final variables used in the analysis. These summaries were necessary, for example, to add counts of females and males by age group into total population by age groups fields.
SELECT MINEDAT1.[AreaKey ], MINEDAT1.[STATE ], MINEDAT1.[TRACT ], MINEDAT1.P006001 AS TOT_POP, MINEDAT1.P006002 AS White, MINEDAT1.P006003 AS Black, MINEDAT1.P006004 AS Nat_Am, MINEDAT1.P006005 AS Asian, MINEDAT1.P006006 AS Pac_Is, MINEDAT1.P006007 AS Other, MINEDAT1.P006008 AS 2_plus, MINEDAT1.P007002 AS NotHisp, MINEDAT1.P007003 AS WnotHisp, MINEDAT1.P007004 AS BnotHisp, MINEDAT1.P007005 AS NAnotHisp, MINEDAT1.P007006 AS AnotHisp, MINEDAT1.P007007 AS PnotHisp, MINEDAT1.P007008 AS OnotHisp, MINEDAT1.P007009 AS 2notHisp, MINEDAT1.P007010 AS Hisp, MINEDAT1.P007011 AS WHisp, MINEDAT1.P007012 AS BHisp, MINEDAT1.P007013 AS NAHisp, MINEDAT1.P007014 AS AHisp, MINEDAT1.P007015 AS PHisp, MINEDAT1.P007016 AS OHisp, MINEDAT1.P007017 AS 2Hisp, [P008003]+[P008042] AS 0_1yr, [P008004]+[P008043] AS 1_2yr, [P008005]+[P008044] AS 2_3yr, [P008006]+[P008007]+[P008008]+[P008045]+[P008046]+[P008047] AS 3_6yr, [P008009]+[P008010]+[P008011]+[P008012]+[P008013]+[P008048]+[P008049]+[P008050]+[P008051]+[P008052] AS 6_11yr, [P008014]+[P008015]+[P008016]+[P008017]+[P008018]+[P008053]+[P008054]+[P008055]+[P008056]+[P008057] AS 11_16yr, [P008019]+[P008020]+[P008021]+[P008022]+[P008023]+[P008058]+[P008059]+[P008060]+[P008061]+[P008062] AS 16_21yr, MINEDAT1.P052001 AS TotHH, MINEDAT1.P052002 AS Less10k, MINEDAT1.P052003 AS 10K_14999, MINEDAT1.P052004 AS 15K_19999, MINEDAT1.P052005 AS 20K_24999, MINEDAT1.P052006 AS 25K_29999, MINEDAT1.P052007 AS 30K_34999, MINEDAT1.P052008 AS 35K_39999, MINEDAT1.P052009 AS 40K_44999, MINEDAT1.P052010 AS 45K_49999, MINEDAT1.P052011 AS 50K_59999, MINEDAT1.P052012 AS 60K_74999, MINEDAT1.P052013 AS 75K_99999, MINEDAT1.P052014 AS 100K_124999, MINEDAT1.P052015 AS 125K_149999, MINEDAT1.P052016 AS 150K_199999, MINEDAT1.P052017 AS [200K+] INTO POP_DATA FROM MINEDAT1;
9/23/2016
E1-14
Appendix E1-4: Python Code for Summary Statistics Calculation
The following Python program code was used to generate all of the demographic statistics within each buffer zone around the mines.
# Import system modules import sys, string, os, arcgisscripting # Create the Geoprocessor object gp = arcgisscripting.create(9.3) # Set the necessary product code gp.SetProduct("ArcInfo") # Load required toolboxes... gp.AddToolbox("C:/Program Files/ArcGIS/ArcToolbox/Toolboxes/Spatial Statistics Tools.tbx") gp.AddToolbox("C:/Program Files/ArcGIS/ArcToolbox/Toolboxes/Data Management Tools.tbx") gp.AddToolbox("C:/Program Files/ArcGIS/ArcToolbox/Toolboxes/Analysis Tools.tbx") # Must have a directory on local drive called C:\\test workpath = "C:\\test\\" print "workpath is " + workpath gp.workspace = workpath # Need Input from User Distance = 10 # What number of miles to buffer? print "Distance is " + str(Distance) InputFile = "Facilities_V7_20101215_alb" # What is the input file name in the test directory (Do not include .shp)? print "Input File is called " + InputFile # Local variables... BufferedPoints = workpath + InputFile + str(Distance) + "_Buffer.shp" # Buffers from mines InputPoints = workpath + InputFile + ".shp" # Mines to be buffered IntBuffBlock = workpath + InputFile + str(Distance) + "_Buffer_Intersect.shp" # Output from intersect. BlockArea = workpath + InputFile + str(Distance) + "_demo.shp" # Output of Calculate Area BlockGroups = "bgp_al_meters.shp" DEMOGRAP = "\\\\RTIFILE02\\ehe\\Projects\\0212041-ERAS_(Opt_1)\\0212041.001.016-CERCLA108b\\Data_and_Tools\\GIS\\Mine_locations\\DEMOGRAP.dbf" BufDist = str(Distance) + " miles" AreaTestTable = workpath + InputFile + str(Distance) + "_AreaTest.dbf" # Process: Buffer... gp.Buffer_analysis(InputPoints, BufferedPoints, BufDist, "FULL", "ROUND", "NONE", "", "") print "Buffered" # Process: Identity... gp.identity_analysis(BufferedPoints, BlockGroups, IntBuffBlock, "ALL", "") print "Identified" # Process: Calculate Areas...
9/23/2016
E1-15
gp.CalculateAreas_stats(IntBuffBlock, BlockArea) print "Calculated" # Process: Add Field... gp.AddField_management(BlockArea, "Prop", "DOUBLE", "", "", "", "", "NULLABLE", "NON_REQUIRED", "") print "Field Added" # Process: Calculate Field... gp.CalculateField_management(BlockArea, "Prop", "[F_AREA] / [SQME]", "VB", "") print "Field Calculated" # Process: Join Field... gp.JoinField_management(BlockArea, "FIPS", DEMOGRAP, "AREAKEY__", "") print "Joined" BlockAreaTable = workpath + InputFile + str(Distance) + "_demo.dbf" Output_Table = workpath + InputFile + str(Distance) + "_demo_final.dbf" # Make a list of all fields that need to be calculated by area FieldList = gp.ListFields(BlockAreaTable, "*", "ALL") def get_fields(FieldList): """ return esri field list into python list for 9.3 """ return [x.name for x in FieldList] fields_list = get_fields(gp.listfields(BlockAreaTable)) print len(fields_list) print ",".join(fields_list) # Add Fields and calculate new demographic totals for Field in fields_list: print "Field is " + str(Field) if Field == "OID" or Field == "FID_Mines1" or Field == "FID_bgp_al" or Field == "FID_Mine_1" or Field == "F_AREA" or Field == "Mine_ID_2" or Field == "FAC_RNUM" or Field == "RNUM" or Field == "FID_" + InputFile[0:6] or Field == "FID" or Field == "FID_bgp_me" or Field == "FAC_ID" or Field == "FACNAME" or Field == "Comodity_M" or Field == "FID_Facili" or Field == "FID_Mines_" or Field == "OBJECTID" or Field == "FID_bgp_al" or Field == "Shape" or Field == "FID_Alaska" or Field == "Mine_ID" or Field == "Mine_Name" or Field == "FIPS" or Field == "SQMI" or Field == "OID_" or Field == "AREAKEY__" or Field == "STATE____" or Field == "Prop" or Field == "NEW_SQME" or Field == "BUFF_DIST" or Field == "SQME" or Field == "ObjectID" or Field == "FID_bgp_na" or Field == "MINE_RNUM" or Field == "MINE_ID": print "ignored" + Field else: # Process: Add Field... gp.AddField_management(BlockAreaTable, Field + "INT", "DOUBLE", "", "", "", "", "NULLABLE", "NON_REQUIRED", "") print "Added " + Field
9/23/2016
E1-16
#Calculate the proportion of the variable that is in the intersected polygon Calculation = "[" + Field + "] * [Prop]" print Calculation # Process: Calculate Field... gp.CalculateField_management(BlockAreaTable, Field + "INT", Calculation, "", "") #Make list of all fields to be used in the summary statistics table creation FieldString = "" for Field in fields_list: if Field == "OID" or Field == "FID_Mines1" or Field == "FID_bgp_al" or Field == "FID_Mine_1" or Field == "F_AREA" or Field == "Mine_ID_2" or Field == "RNUM" or Field == "FAC_RNUM" or Field == "FID" or Field == "FID_" + InputFile[0:6] or Field == "FID_Facili" or Field == "FID_bgp_me" or Field == "FAC_ID" or Field == "Comodity_M" or Field == "FACNAME" or Field == "FID_Mines_" or Field == "OBJECTID" or Field == "Shape" or Field == "FID_Alaska" or Field == "Mine_ID" or Field == "Mine_Name" or Field == "FIPS" or Field == "SQMI" or Field == "OID_" or Field == "AREAKEY__" or Field == "STATE____" or Field == "Prop" or Field == "NEW_SQME" or Field == "SQME" or Field == "BUFF_DIST" or Field == "ObjectID" or Field == "FID_al_bkg" or Field == "FID_bgp_na" or Field == "MINE_ID" or Field == "MINE_RNUM" : print "ignored" + Field else: FieldString = FieldString + Field + "INT sum;" print FieldString print FieldString gp.Statistics(BlockAreaTable, Output_Table, FieldString,"FAC_RNUM") # Made sure you are using the right unique identifier for the facilities/mines # Convert all fields in the summary table to int FieldList2 = gp.ListFields(Output_Table, "*", "ALL") def get_fields(FieldList): """ return esri field list into python list for 9.3 """ return [x.name for x in FieldList2] fields_as_python_list2 = get_fields(gp.listfields(Output_Table)) for Field2 in fields_as_python_list2: print "Field2 is " + str(Field2) if Field2 == "OID" or Field2 == "Mine_ID" or Field2 == "RNUM" or Field2 == "MINE_RNUM" or Field2 == "MINE_ID" or Field2 == "FAC_RNUM" or Field2 == "Mine_Name" or Field2 == "FREQUENCY" or Field2 == "FACNAME" or Field2 == "FAC_ID": print "ignored" + Field2 else: #Calculate the value in the field as an integer Calculation = "CLng([" + Field2 + "])" print Calculation # Process: Calculate Field... gp.CalculateField_management(Output_Table, Field2, Calculation, "", "") # !!!!Test the output to make sure the buffers and intersect have worked correctly!!!
9/23/2016
E1-17
gp.Statistics(BlockArea, AreaTestTable, "F_AREA sum" ,"FAC_RNUM") gp.AddField_management(AreaTestTable, "TEST", "TEXT", "", "", "10", "", "NULLABLE", "NON_REQUIRED", "") if Distance == 1: TrueArea = 8136046.95978 print "1TrueArea" if Distance == 2: TrueArea = 32545535.5312 print "2TrueArea" if Distance == 3: TrueArea = 73228466.4858 print "3TrueArea" if Distance == 4: TrueArea = 130184829.795 print "4TrueArea" if Distance == 5: TrueArea = 203414642.649 print "5TrueArea" if Distance == 10: TrueArea = 813665288.08 print "10TrueArea" if Distance == 15: TrueArea = 1830751935.91 print "15TrueArea" if Distance == 20: TrueArea = 3254674599.36 print "20TrueArea" print "Distance is " + str(Distance) print "TrueArea is " + str(TrueArea) AreaTestTable_View = "AreaTestTable_View" gp.AddField_management(AreaTestTable, "TESTAR", "DOUBLE", "", "", "", "", "NULLABLE", "NON_REQUIRED", "") gp.CalculateField_management(AreaTestTable, "TESTAR", TrueArea) gp.delete_management(BufferedPoints)
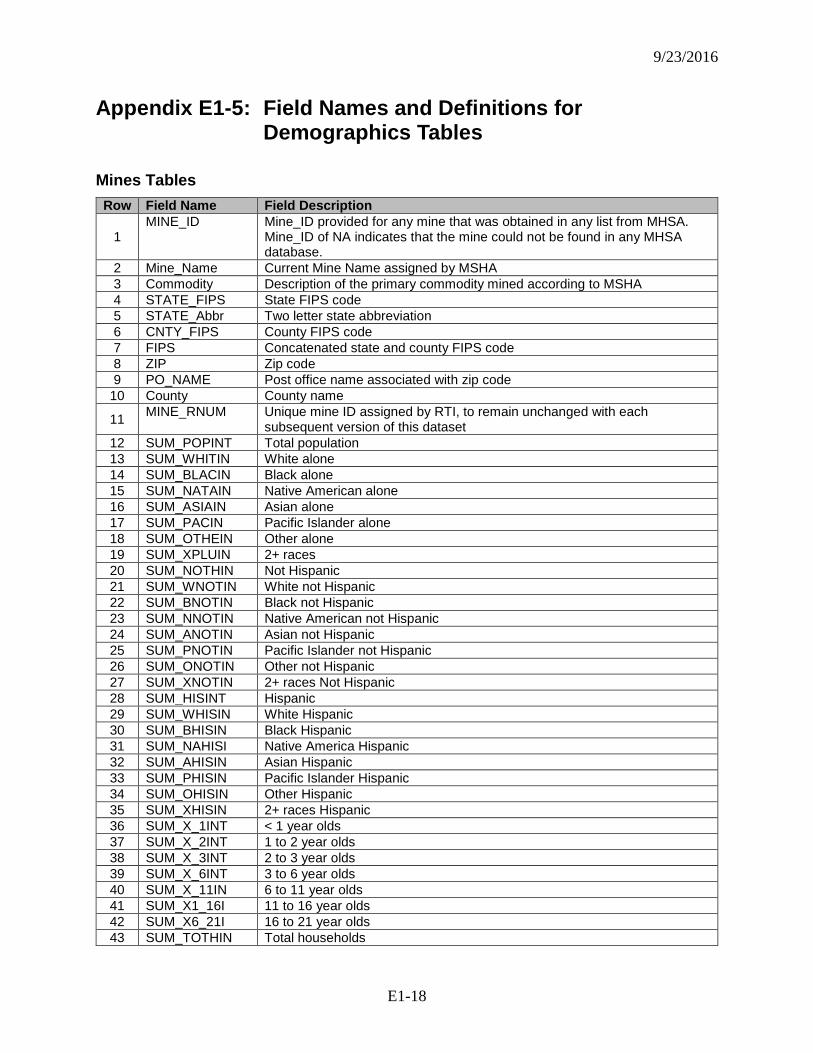
9/23/2016
E1-18
Appendix E1-5: Field Names and Definitions for Demographics Tables
Mines Tables
Row Field Name Field Description
1 MINE_ID Mine_ID provided for any mine that was obtained in any list from MHSA.
Mine_ID of NA indicates that the mine could not be found in any MHSA database.
2 Mine_Name Current Mine Name assigned by MSHA 3 Commodity Description of the primary commodity mined according to MSHA 4 STATE_FIPS State FIPS code 5 STATE_Abbr Two letter state abbreviation 6 CNTY_FIPS County FIPS code 7 FIPS Concatenated state and county FIPS code 8 ZIP Zip code 9 PO_NAME Post office name associated with zip code
10 County County name
11 MINE_RNUM Unique mine ID assigned by RTI, to remain unchanged with each subsequent version of this dataset
12 SUM_POPINT Total population 13 SUM_WHITIN White alone 14 SUM_BLACIN Black alone 15 SUM_NATAIN Native American alone 16 SUM_ASIAIN Asian alone 17 SUM_PACIN Pacific Islander alone 18 SUM_OTHEIN Other alone 19 SUM_XPLUIN 2+ races 20 SUM_NOTHIN Not Hispanic 21 SUM_WNOTIN White not Hispanic 22 SUM_BNOTIN Black not Hispanic 23 SUM_NNOTIN Native American not Hispanic 24 SUM_ANOTIN Asian not Hispanic 25 SUM_PNOTIN Pacific Islander not Hispanic 26 SUM_ONOTIN Other not Hispanic 27 SUM_XNOTIN 2+ races Not Hispanic 28 SUM_HISINT Hispanic 29 SUM_WHISIN White Hispanic 30 SUM_BHISIN Black Hispanic 31 SUM_NAHISI Native America Hispanic 32 SUM_AHISIN Asian Hispanic 33 SUM_PHISIN Pacific Islander Hispanic 34 SUM_OHISIN Other Hispanic 35 SUM_XHISIN 2+ races Hispanic 36 SUM_X_1INT < 1 year olds 37 SUM_X_2INT 1 to 2 year olds 38 SUM_X_3INT 2 to 3 year olds 39 SUM_X_6INT 3 to 6 year olds 40 SUM_X_11IN 6 to 11 year olds 41 SUM_X1_16I 11 to 16 year olds 42 SUM_X6_21I 16 to 21 year olds 43 SUM_TOTHIN Total households
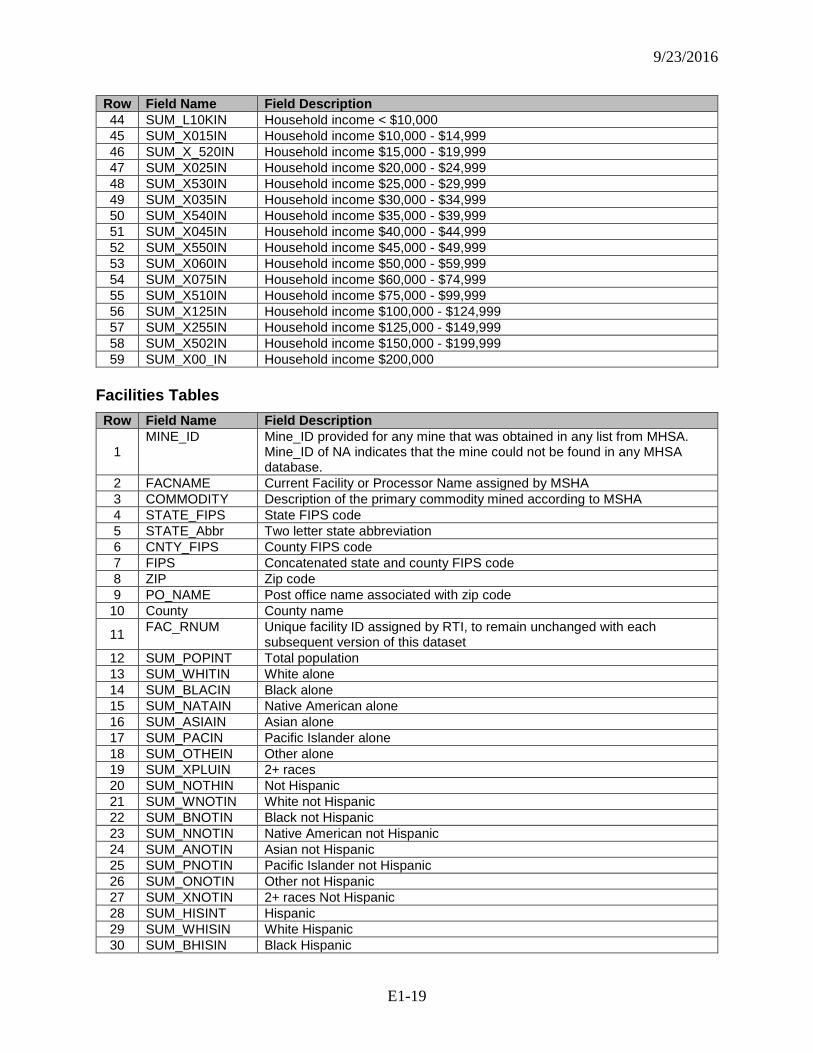
9/23/2016
E1-19
Row Field Name Field Description 44 SUM_L10KIN Household income < $10,000 45 SUM_X015IN Household income $10,000 - $14,999 46 SUM_X_520IN Household income $15,000 - $19,999 47 SUM_X025IN Household income $20,000 - $24,999 48 SUM_X530IN Household income $25,000 - $29,999 49 SUM_X035IN Household income $30,000 - $34,999 50 SUM_X540IN Household income $35,000 - $39,999 51 SUM_X045IN Household income $40,000 - $44,999 52 SUM_X550IN Household income $45,000 - $49,999 53 SUM_X060IN Household income $50,000 - $59,999 54 SUM_X075IN Household income $60,000 - $74,999 55 SUM_X510IN Household income $75,000 - $99,999 56 SUM_X125IN Household income $100,000 - $124,999 57 SUM_X255IN Household income $125,000 - $149,999 58 SUM_X502IN Household income $150,000 - $199,999 59 SUM_X00_IN Household income $200,000
Facilities Tables
Row Field Name Field Description
1 MINE_ID Mine_ID provided for any mine that was obtained in any list from MHSA.
Mine_ID of NA indicates that the mine could not be found in any MHSA database.
2 FACNAME Current Facility or Processor Name assigned by MSHA 3 COMMODITY Description of the primary commodity mined according to MSHA 4 STATE_FIPS State FIPS code 5 STATE_Abbr Two letter state abbreviation 6 CNTY_FIPS County FIPS code 7 FIPS Concatenated state and county FIPS code 8 ZIP Zip code 9 PO_NAME Post office name associated with zip code
10 County County name
11 FAC_RNUM Unique facility ID assigned by RTI, to remain unchanged with each subsequent version of this dataset
12 SUM_POPINT Total population 13 SUM_WHITIN White alone 14 SUM_BLACIN Black alone 15 SUM_NATAIN Native American alone 16 SUM_ASIAIN Asian alone 17 SUM_PACIN Pacific Islander alone 18 SUM_OTHEIN Other alone 19 SUM_XPLUIN 2+ races 20 SUM_NOTHIN Not Hispanic 21 SUM_WNOTIN White not Hispanic 22 SUM_BNOTIN Black not Hispanic 23 SUM_NNOTIN Native American not Hispanic 24 SUM_ANOTIN Asian not Hispanic 25 SUM_PNOTIN Pacific Islander not Hispanic 26 SUM_ONOTIN Other not Hispanic 27 SUM_XNOTIN 2+ races Not Hispanic 28 SUM_HISINT Hispanic 29 SUM_WHISIN White Hispanic 30 SUM_BHISIN Black Hispanic
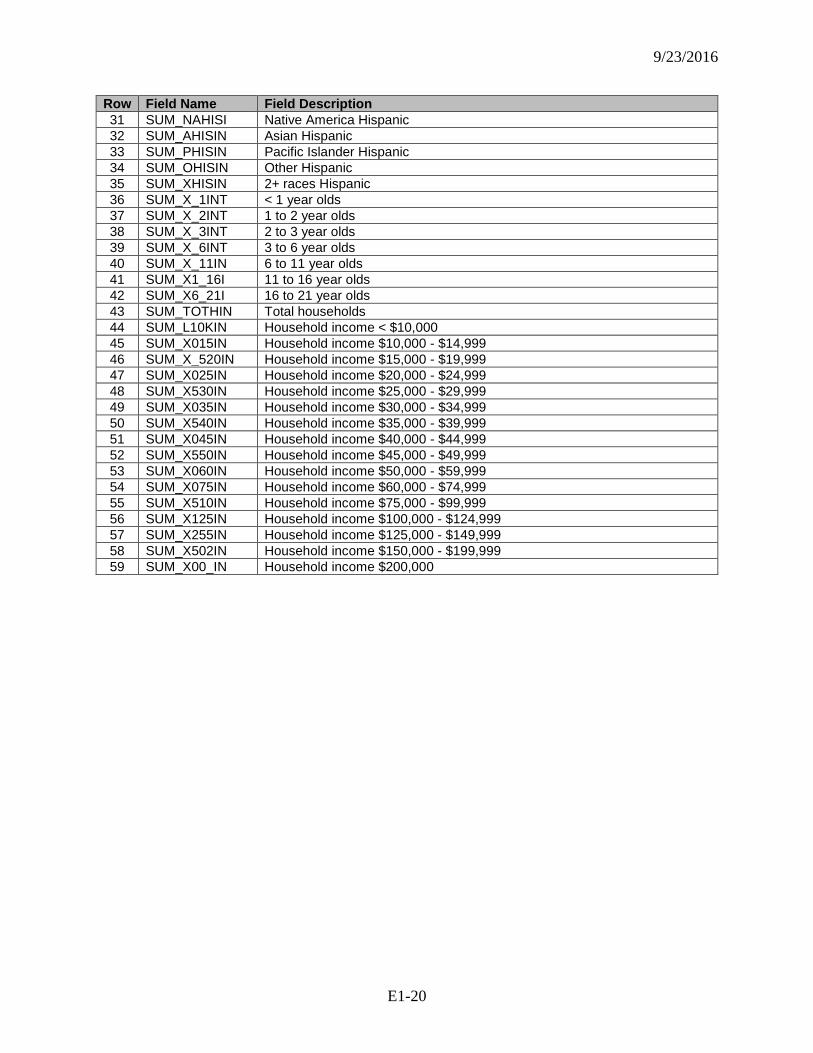
9/23/2016
E1-20
Row Field Name Field Description 31 SUM_NAHISI Native America Hispanic 32 SUM_AHISIN Asian Hispanic 33 SUM_PHISIN Pacific Islander Hispanic 34 SUM_OHISIN Other Hispanic 35 SUM_XHISIN 2+ races Hispanic 36 SUM_X_1INT < 1 year olds 37 SUM_X_2INT 1 to 2 year olds 38 SUM_X_3INT 2 to 3 year olds 39 SUM_X_6INT 3 to 6 year olds 40 SUM_X_11IN 6 to 11 year olds 41 SUM_X1_16I 11 to 16 year olds 42 SUM_X6_21I 16 to 21 year olds 43 SUM_TOTHIN Total households 44 SUM_L10KIN Household income < $10,000 45 SUM_X015IN Household income $10,000 - $14,999 46 SUM_X_520IN Household income $15,000 - $19,999 47 SUM_X025IN Household income $20,000 - $24,999 48 SUM_X530IN Household income $25,000 - $29,999 49 SUM_X035IN Household income $30,000 - $34,999 50 SUM_X540IN Household income $35,000 - $39,999 51 SUM_X045IN Household income $40,000 - $44,999 52 SUM_X550IN Household income $45,000 - $49,999 53 SUM_X060IN Household income $50,000 - $59,999 54 SUM_X075IN Household income $60,000 - $74,999 55 SUM_X510IN Household income $75,000 - $99,999 56 SUM_X125IN Household income $100,000 - $124,999 57 SUM_X255IN Household income $125,000 - $149,999 58 SUM_X502IN Household income $150,000 - $199,999 59 SUM_X00_IN Household income $200,000
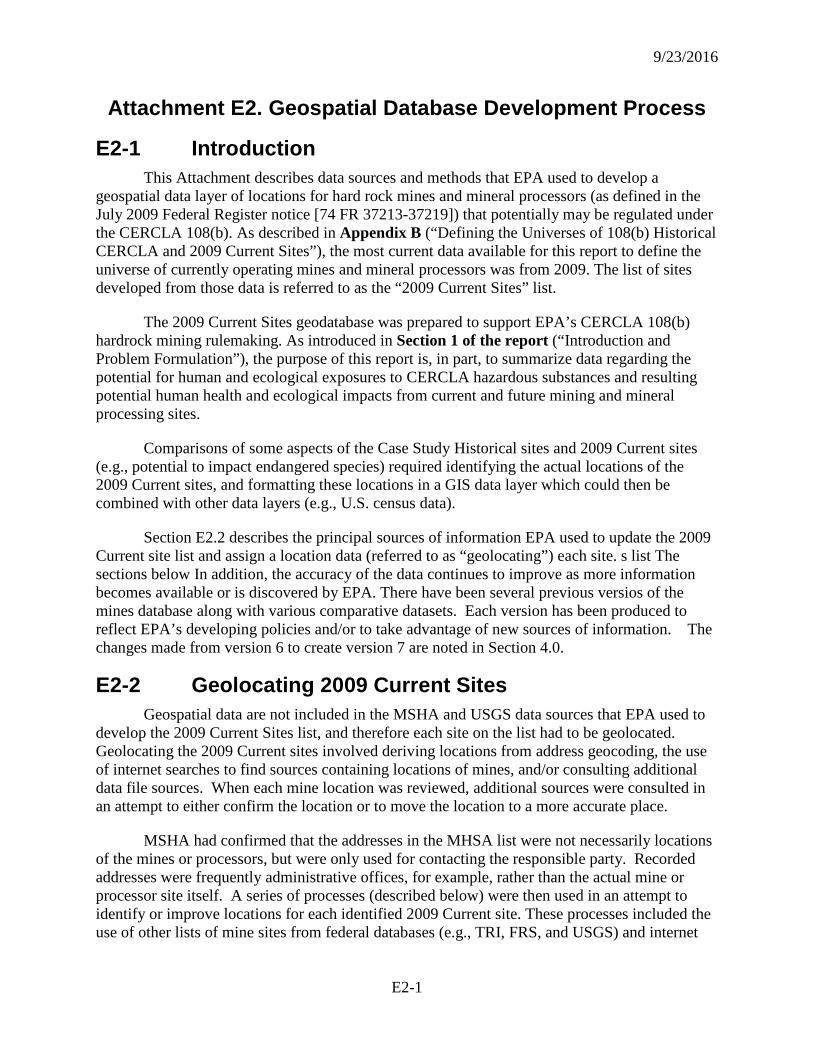
9/23/2016
E2-1
Attachment E2. Geospatial Database Development Process
E2-1 Introduction This Attachment describes data sources and methods that EPA used to develop a
geospatial data layer of locations for hard rock mines and mineral processors (as defined in the July 2009 Federal Register notice [74 FR 37213-37219]) that potentially may be regulated under the CERCLA 108(b). As described in Appendix B (“Defining the Universes of 108(b) Historical CERCLA and 2009 Current Sites”), the most current data available for this report to define the universe of currently operating mines and mineral processors was from 2009. The list of sites developed from those data is referred to as the “2009 Current Sites” list.
The 2009 Current Sites geodatabase was prepared to support EPA’s CERCLA 108(b) hardrock mining rulemaking. As introduced in Section 1 of the report (“Introduction and Problem Formulation”), the purpose of this report is, in part, to summarize data regarding the potential for human and ecological exposures to CERCLA hazardous substances and resulting potential human health and ecological impacts from current and future mining and mineral processing sites.
Comparisons of some aspects of the Case Study Historical sites and 2009 Current sites (e.g., potential to impact endangered species) required identifying the actual locations of the 2009 Current sites, and formatting these locations in a GIS data layer which could then be combined with other data layers (e.g., U.S. census data).
Section E2.2 describes the principal sources of information EPA used to update the 2009 Current site list and assign a location data (referred to as “geolocating”) each site. s list The sections below In addition, the accuracy of the data continues to improve as more information becomes available or is discovered by EPA. There have been several previous versios of the mines database along with various comparative datasets. Each version has been produced to reflect EPA’s developing policies and/or to take advantage of new sources of information. The changes made from version 6 to create version 7 are noted in Section 4.0.
E2-2 Geolocating 2009 Current Sites Geospatial data are not included in the MSHA and USGS data sources that EPA used to
develop the 2009 Current Sites list, and therefore each site on the list had to be geolocated. Geolocating the 2009 Current sites involved deriving locations from address geocoding, the use of internet searches to find sources containing locations of mines, and/or consulting additional data file sources. When each mine location was reviewed, additional sources were consulted in an attempt to either confirm the location or to move the location to a more accurate place.
MSHA had confirmed that the addresses in the MHSA list were not necessarily locations of the mines or processors, but were only used for contacting the responsible party. Recorded addresses were frequently administrative offices, for example, rather than the actual mine or processor site itself. A series of processes (described below) were then used in an attempt to identify or improve locations for each identified 2009 Current site. These processes included the use of other lists of mine sites from federal databases (e.g., TRI, FRS, and USGS) and internet
9/23/2016
E2-2
resources (e.g., company and industry web pages and online environmental documents). The source data used to locate each mine were documented to allow others to review the sources of each location. It should be noted that no information was copied directly from websites but only viewed for information that would lead to the location of the mine/processor site using the aerial imagery of the GIS. Once the mine/processor site was located then a GIS point was recorded on the site, based on best professional judgment that considered factors relevant to using these data for further geospatial analysis. An estimate for the level of confidence associated with each point location was indicated along with the coordinate pairs. Aerial photography from http://services.arcgisonline.com/v92 was used to aid in the identification of the mine.
E2-2.1 Data Sources Examined to Provide or Improve Locations EPA used several mine datasets to help identify the ground location for each site. These
datasets included coordinate data for some of the mine locations, but there was often a significant variance between the geospatial data contained in each of the datasets. The accuracy of point locations provided also varied significantly.
MSHA’s 2009 end-of-year dataset (a principal data source – see Appendix B, Section B.3.2) contains coordinate point location data. A comparison was made between these coordinate data and existing locations previously found for data records in the geospatial database. The comparison revealed some of the same problems found with the other datasets used and did not curtail the need for geolocating most of the mines that did not have coordinates, however, overall the MSHA 2009 end-of-year coordinate data was of better quality than other datasets used.
Used together, all the datasets narrowed the areas searched to locate a site. The other mining site data sources that were used to aid in locating mine, are listed and described below.
EPA Facility Registry System (FRS) Data EPA compared two sources of mine locations: a database of hard rock mine sites queried
from the FRS (05/17/10), and a spreadsheet (06/03/10) of mines that had been queried and downloaded from the MHSA database. The resulting combined spreadsheet table of mine locations with latitude/longitude was called “Matchup MSHA Facs to FRS Data_WIP Draft_060310.xls”. A subset (5 sites) of mines from the list was examined to determine confidence in the location of the mines from this source. Based on the sample of 5 mines, it was determined that the latitudes/longitudes from this source were reasonably accurate and so any of the mines that appeared in both the “Matchup MSHA Facs to FRS Data_WIP Draft_060310.xls” source and the MSHA data (identified by matching MSHA IDs) were given “ICF/FRS” as their source in the “LOC_SOURCE” field and the latitudes/longitudes from the “Matchup MSHA Facs to FRS Data_WIP Draft_060310.xls” file were used3. Where neither the MHSA list nor the FRS list had provided a reasonable or viable location then the master list of USGS mines dataset (see below) was used.
3 Even though the 5 mines in the sample from the FRS source were accurate, it was later determined that many of the FRS locations were not accurate and, therefore, RTI reviewed all of the FRS locations and in RTI’s final deliverable, only used those FRS-provided locations that appeared to be accurate were used.
9/23/2016
E2-3
Master List of USGS Mines A spreadsheet called “March 12 2010 ICF MASTER LIST OF MINES.xls” contains mine
sites compiled from various sources including USGS commodity reports and mineral year books. The spreadsheet included latitude/longitude coordinates.
This list was also based primarily on the U.S. Department of Labor’s Mine Safety and Health Administration (MSHA) data from January 2010, supplemented with data from the United States Geological Survey Minerals Yearbooks, and data from 19 state agencies with readily available information on mining operations. The data contained in the ‘March 12 2010 ICF MASTER LIST OF MINES.xls’ came from the following sources:
1) MSHA's Mine Data Retrieval System, found at http://www.msha.gov/drs/drshome.htm. The query retrieved records relating to 1,154 mines.
2) Data from 18 states and the U.S. Geological Survey (USGS 2008a; Alabama 2008; Arizona undated; California undated; Colorado 2010; Georgia 2009; Missouri undated; North Carolina undated; Nevada 2008; New Mexico 2001; New York, 2010; Oregon undated; South Carolina undated; South Dakota 2010; Utah 2009; Virginia 2005; Virginia 2008; Washington undated; Wyoming 2010).
3) When mining operations were found in both the MSHA list and data from a state source, the state source was used to provide data not provided by MSHA, such as latitude and longitude. Where EPA identified a mining operation in a state source which was not identified by MSHA, an additional entry was made for that mining activity. In some cases data from USGS 2005 were used for mining operations already identified by MSHA or a state source. Differences in company and operation names between data sources sometimes precluded integrating data from different data sources.
The latitude/longitude coordinates contained in the March 12 2010 ICF MASTER LIST OF MINES.xls spreadsheet were in a variety of formats. Inconsistencies were corrected and the latitude/longitude coordinates were standardized. Standardized coordinates were then converted to a shapefile called “ICF_Master.shp” using ArcMap. This shapefile was compared to the MSHA list. If the MSHA list contained a poor location or no location, the latitude/longitude was replaced with a more accurate location from the ICF_Master.shp file.
If the locations in the Master List of Mines were not useful, then the following references (listed in order of preference) were used in the same way:
Active Mines and Mineral Plants in the US (USGS) USGS (shapefile) – Downloaded from http://tin.er.usgs.gov/mineplant/ on 05/12/10
(mineplant.shp). The dataset contains an extensive list of mines and their locations.
Homeland Security Infrastructure Program (HSIP) Gold 2007 HSIP Gold (geodatabase) was compiled by the USGS Minerals Information Team (MIT)
and is comprised of various mining facility types including “FerrousMetalMines” and “MinesManufacturing.”
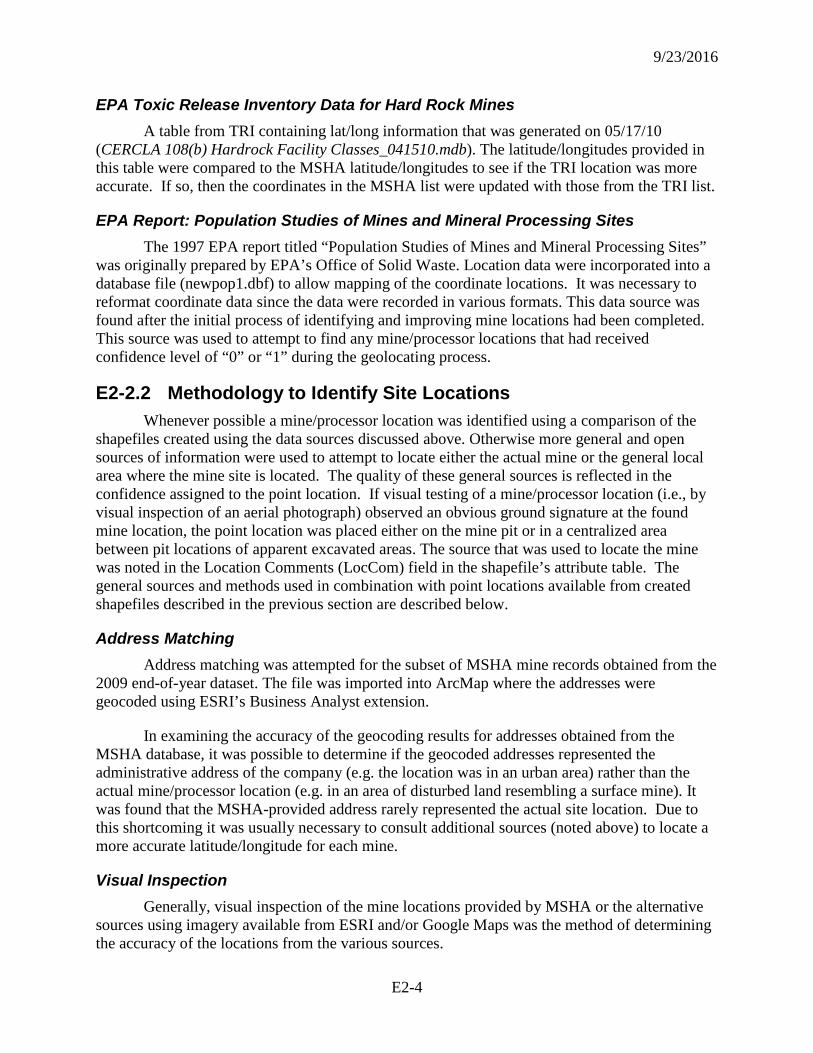
9/23/2016
E2-4
EPA Toxic Release Inventory Data for Hard Rock Mines A table from TRI containing lat/long information that was generated on 05/17/10
(CERCLA 108(b) Hardrock Facility Classes_041510.mdb). The latitude/longitudes provided in this table were compared to the MSHA latitude/longitudes to see if the TRI location was more accurate. If so, then the coordinates in the MSHA list were updated with those from the TRI list.
EPA Report: Population Studies of Mines and Mineral Processing Sites The 1997 EPA report titled “Population Studies of Mines and Mineral Processing Sites”
was originally prepared by EPA’s Office of Solid Waste. Location data were incorporated into a database file (newpop1.dbf) to allow mapping of the coordinate locations. It was necessary to reformat coordinate data since the data were recorded in various formats. This data source was found after the initial process of identifying and improving mine locations had been completed. This source was used to attempt to find any mine/processor locations that had received confidence level of “0” or “1” during the geolocating process.
E2-2.2 Methodology to Identify Site Locations Whenever possible a mine/processor location was identified using a comparison of the
shapefiles created using the data sources discussed above. Otherwise more general and open sources of information were used to attempt to locate either the actual mine or the general local area where the mine site is located. The quality of these general sources is reflected in the confidence assigned to the point location. If visual testing of a mine/processor location (i.e., by visual inspection of an aerial photograph) observed an obvious ground signature at the found mine location, the point location was placed either on the mine pit or in a centralized area between pit locations of apparent excavated areas. The source that was used to locate the mine was noted in the Location Comments (LocCom) field in the shapefile’s attribute table. The general sources and methods used in combination with point locations available from created shapefiles described in the previous section are described below.
Address Matching Address matching was attempted for the subset of MSHA mine records obtained from the
2009 end-of-year dataset. The file was imported into ArcMap where the addresses were geocoded using ESRI’s Business Analyst extension.
In examining the accuracy of the geocoding results for addresses obtained from the MSHA database, it was possible to determine if the geocoded addresses represented the administrative address of the company (e.g. the location was in an urban area) rather than the actual mine/processor location (e.g. in an area of disturbed land resembling a surface mine). It was found that the MSHA-provided address rarely represented the actual site location. Due to this shortcoming it was usually necessary to consult additional sources (noted above) to locate a more accurate latitude/longitude for each mine.
Visual Inspection Generally, visual inspection of the mine locations provided by MSHA or the alternative
sources using imagery available from ESRI and/or Google Maps was the method of determining the accuracy of the locations from the various sources.
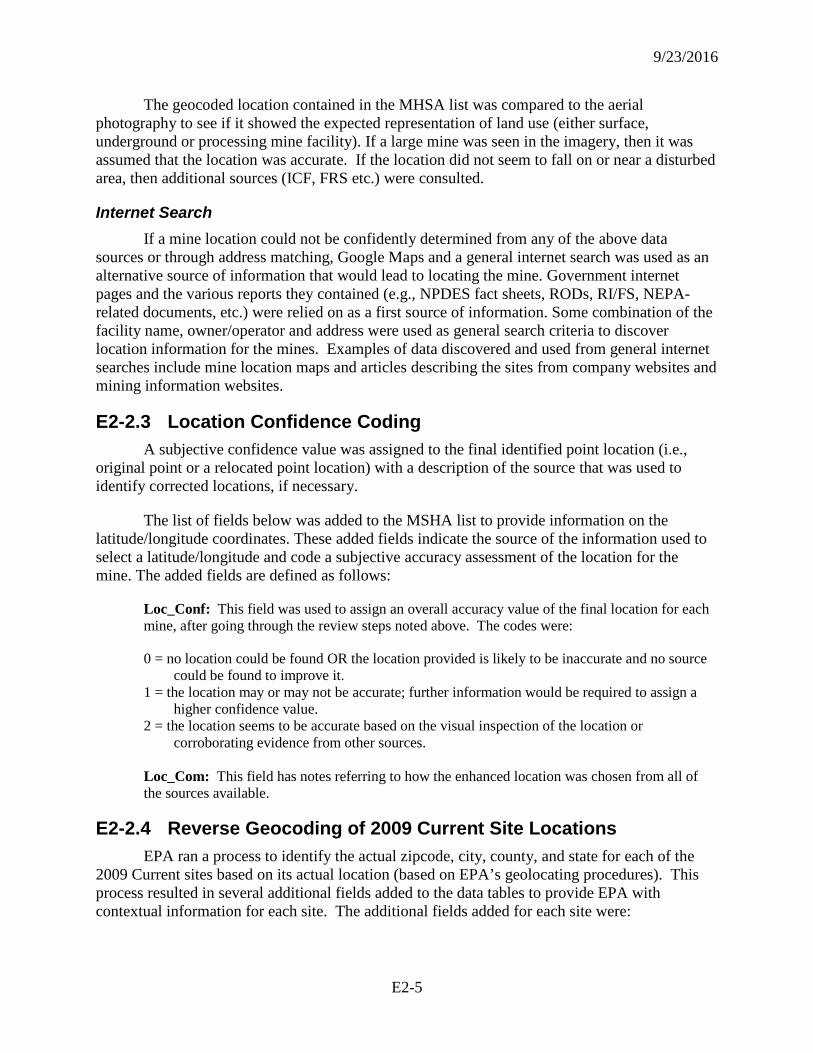
9/23/2016
E2-5
The geocoded location contained in the MHSA list was compared to the aerial photography to see if it showed the expected representation of land use (either surface, underground or processing mine facility). If a large mine was seen in the imagery, then it was assumed that the location was accurate. If the location did not seem to fall on or near a disturbed area, then additional sources (ICF, FRS etc.) were consulted.
Internet Search If a mine location could not be confidently determined from any of the above data
sources or through address matching, Google Maps and a general internet search was used as an alternative source of information that would lead to locating the mine. Government internet pages and the various reports they contained (e.g., NPDES fact sheets, RODs, RI/FS, NEPA-related documents, etc.) were relied on as a first source of information. Some combination of the facility name, owner/operator and address were used as general search criteria to discover location information for the mines. Examples of data discovered and used from general internet searches include mine location maps and articles describing the sites from company websites and mining information websites.
E2-2.3 Location Confidence Coding A subjective confidence value was assigned to the final identified point location (i.e.,
original point or a relocated point location) with a description of the source that was used to identify corrected locations, if necessary.
The list of fields below was added to the MSHA list to provide information on the latitude/longitude coordinates. These added fields indicate the source of the information used to select a latitude/longitude and code a subjective accuracy assessment of the location for the mine. The added fields are defined as follows:
Loc_Conf: This field was used to assign an overall accuracy value of the final location for each mine, after going through the review steps noted above. The codes were:
0 = no location could be found OR the location provided is likely to be inaccurate and no source could be found to improve it.
1 = the location may or may not be accurate; further information would be required to assign a higher confidence value.
2 = the location seems to be accurate based on the visual inspection of the location or corroborating evidence from other sources.
Loc_Com: This field has notes referring to how the enhanced location was chosen from all of the sources available.
E2-2.4 Reverse Geocoding of 2009 Current Site Locations EPA ran a process to identify the actual zipcode, city, county, and state for each of the
2009 Current sites based on its actual location (based on EPA’s geolocating procedures). This process resulted in several additional fields added to the data tables to provide EPA with contextual information for each site. The additional fields added for each site were:
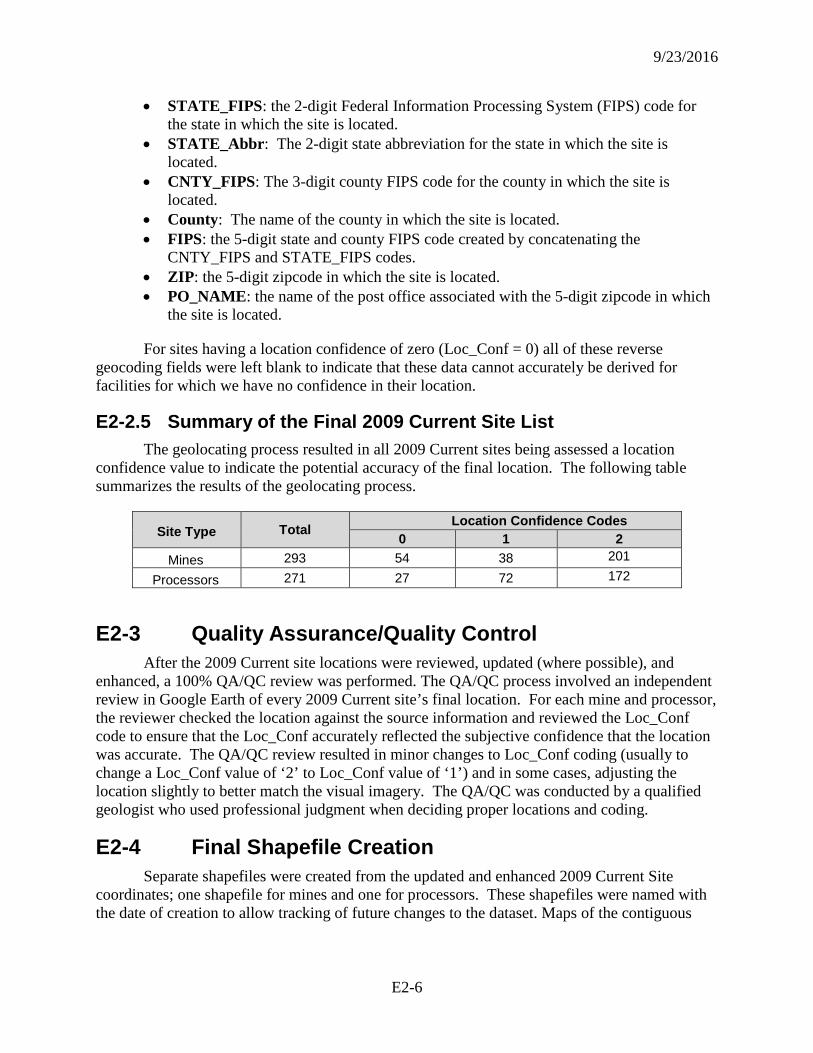
9/23/2016
E2-6
• STATE_FIPS: the 2-digit Federal Information Processing System (FIPS) code for the state in which the site is located.
• STATE_Abbr: The 2-digit state abbreviation for the state in which the site is located.
• CNTY_FIPS: The 3-digit county FIPS code for the county in which the site is located.
• County: The name of the county in which the site is located. • FIPS: the 5-digit state and county FIPS code created by concatenating the
CNTY_FIPS and STATE_FIPS codes. • ZIP: the 5-digit zipcode in which the site is located. • PO_NAME: the name of the post office associated with the 5-digit zipcode in which
the site is located.
For sites having a location confidence of zero (Loc_Conf = 0) all of these reverse geocoding fields were left blank to indicate that these data cannot accurately be derived for facilities for which we have no confidence in their location.
E2-2.5 Summary of the Final 2009 Current Site List The geolocating process resulted in all 2009 Current sites being assessed a location
confidence value to indicate the potential accuracy of the final location. The following table summarizes the results of the geolocating process.
Site Type Total Location Confidence Codes 0 1 2
Mines 293 54 38 201
Processors 271 27 72 172
E2-3 Quality Assurance/Quality Control After the 2009 Current site locations were reviewed, updated (where possible), and
enhanced, a 100% QA/QC review was performed. The QA/QC process involved an independent review in Google Earth of every 2009 Current site’s final location. For each mine and processor, the reviewer checked the location against the source information and reviewed the Loc_Conf code to ensure that the Loc_Conf accurately reflected the subjective confidence that the location was accurate. The QA/QC review resulted in minor changes to Loc_Conf coding (usually to change a Loc_Conf value of ‘2’ to Loc_Conf value of ‘1’) and in some cases, adjusting the location slightly to better match the visual imagery. The QA/QC was conducted by a qualified geologist who used professional judgment when deciding proper locations and coding.
E2-4 Final Shapefile Creation Separate shapefiles were created from the updated and enhanced 2009 Current Site
coordinates; one shapefile for mines and one for processors. These shapefiles were named with the date of creation to allow tracking of future changes to the dataset. Maps of the contiguous
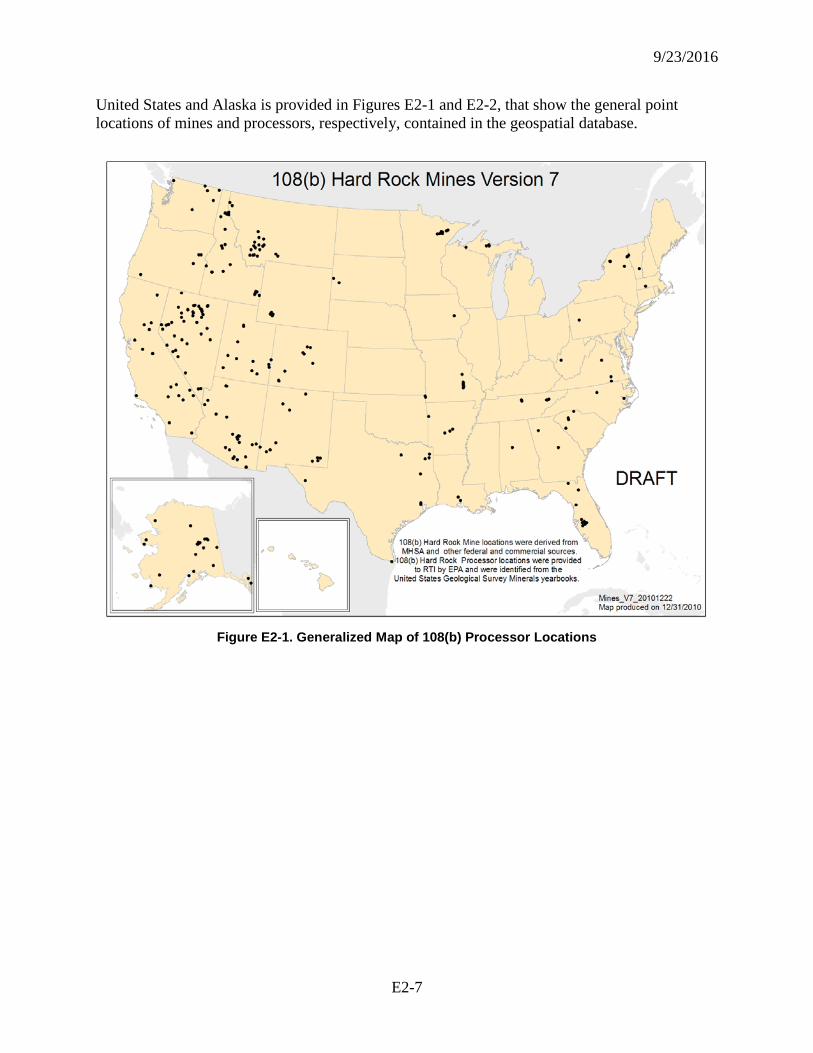
9/23/2016
E2-7
United States and Alaska is provided in Figures E2-1 and E2-2, that show the general point locations of mines and processors, respectively, contained in the geospatial database.
Figure E2-1. Generalized Map of 108(b) Processor Locations
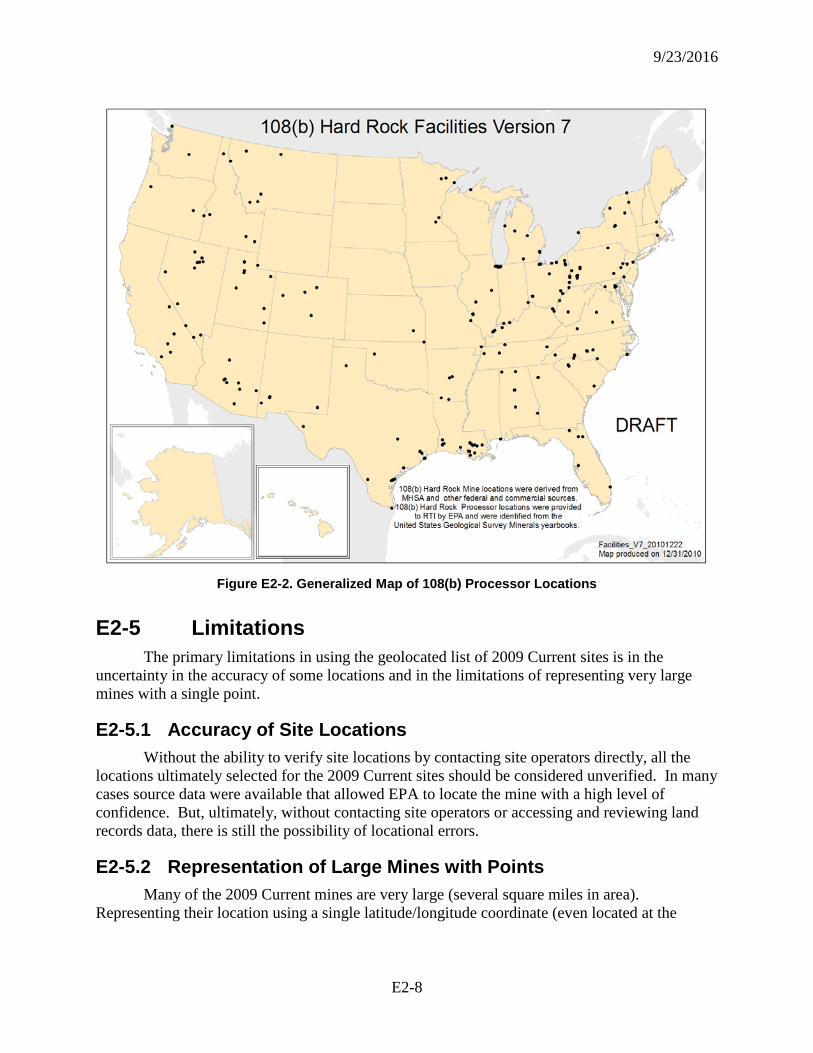
9/23/2016
E2-8
Figure E2-2. Generalized Map of 108(b) Processor Locations
E2-5 Limitations The primary limitations in using the geolocated list of 2009 Current sites is in the
uncertainty in the accuracy of some locations and in the limitations of representing very large mines with a single point.
E2-5.1 Accuracy of Site Locations Without the ability to verify site locations by contacting site operators directly, all the
locations ultimately selected for the 2009 Current sites should be considered unverified. In many cases source data were available that allowed EPA to locate the mine with a high level of confidence. But, ultimately, without contacting site operators or accessing and reviewing land records data, there is still the possibility of locational errors.
E2-5.2 Representation of Large Mines with Points Many of the 2009 Current mines are very large (several square miles in area).
Representing their location using a single latitude/longitude coordinate (even located at the
9/23/2016
E2-9
center of the mine) necessarily introduces some imprecision to further analyses, especially distance-based analyses of demographics and nearby environmental indicators.
E2-6 Data Dictionary The following is a list of the data columns in the final shapefile and description and
source of each column.
MINE_RNUM: Unique ID created by RTI. MINE_ID: Identification number assigned to the site by MSHA. The Mine_ID field is
blank for any site that was not contained in the MSHA database. Mine_Name: Current site Name assigned by MSHA Mine_Type: Facility, Surface or Underground according to MSHA Mine_Statu: Current Site Status (i.e; Active, Intermittent, NonProducing) according to
MSHA FRS_ID: Unique ID field assigned to processors by FRS (if applicable)
COMMODITY: Description of the primary commodity mined according to MSHA or FRS Arc_Address: Street Address of Record according to MSHA Arc_City: City of Record according to MSHA Arc_State: Standard state abbreviation code for MSHA location Arc_ZIP: Standard postal zip code according to MSHA USGS_Fac_N: Processor name as assigned by USGS (if applicable) Operator_N: Current Operator Name according to MSHA Controll_1: Current controlling company name according to MSHA Source: Where the initial site location information was acquired from. Lat: Latitude assigned by RTI to locate site after QA/QC Long: Longitude assigned by RTI to locate site after QA/QC Loc_Conf: Confidence in the new site location assigned by RTI Loc_Com: Notes describing how improved location was found Com_MNM: Notes describing how the MNM09 points differed from the rtiMSHA points
and whether they were used to improve the site location STATE_FIPS: The 2-digit Federal Information Processing System (FIPS) code for the state
in which the site is located. STATE_Abbr: The 2-digit state abbreviation for the state in which the site is located. CNTY_FIPS: The 3-digit county FIPS code for the county in which the site is located. FIPS: The 5-digit state and county FIPS code created by concatenating the
CNTY_FIPS and STATE_FIPS codes. ZIP: The 5-digit zipcode in which the site is located. PO_NAME The name of the post office associated with the 5-digit zipcode in which the
site is located. County: The name of the county in which the site is located.
9/23/2016
E2-10
E2-7 References The following list of references were those used to check and verify the locations of the
2009 Current sites. The identifier of the site that each reference supported is provided at the end of each reference.
Arizona Department of Environmental Quality (internet). c2010 [accessed November 2016]. Iron King Mine and Humboldt Smelter, EPA National Priorities List (NPL) Site, December, 2009; Available from: http://static.azdeq.gov/sup/ironkingmap.pdf [MSHA site 202445].
Atlanta Gold Inc. (Internet). Toronto, Ontario, Canada and Boise, Idaho, USA: [data last modified unknown. c.June 3, 2010; accessed November 2016]. Internet resource available from: http://www.atgoldinc.com/index.php/projects/atlanta-gold-property [for MSHA Site 1002144].
Augusta Resource Corporation (internet). Vancouver, BC, Canada; c2009 [accessed November 2016]. Rosemont Project, Claim Boundary Map, 2008; Available from: http://rosemonteis.us/files/references/westand-2007a.pdf [MSHA site 0203256].
Bureau of Land Management. 2005. Barrick Proposes the Storm Underground Mine. US Department of the Interior (Internet), Elko Field Office. April 22. [accessed November 2016]. Available from: http://www.blm.gov/nv/st/en/fo/elko_field_office/blm_information/newsroom/2005/Barrick_Proposes_Storm_Underground_Project.html [for MSHA Site 2602300].
Bureau of Land Management. 2010. US Department of the Interior, Henry Mountains Field Station, Hanksville, UT: Environmental Assessment to Commence Mining Operations at the Tony M Underground Uranium Mine; 35 pages, Appendix A (Internet); [revised July 9, 2007; accessed November 2016]. Available from: http://www.uraniumwatch.org/tonymmine/tonym_ph1EAblm070709.pdf [MSHA site 4202426].
Bureau of Land Management. 2011. US Department of the Interior, Monticell Field Office; Decision Record, Finding of No Significant Impact, and Environmental Assessment for Daneros Mine Project; Appendices A through M (Internet); Available from: https://www.blm.gov/ut/enbb/files/Daneros__EA_FONSI_DR_revised.pdf [MSHA Site 4202525].
Bureau of Land Management. 2012. HB In-Situ Project Environmental Impact Statement. US Department of the Interior (Internet). Santa Fe, NM; [accessed November 2016]. Available from: http://www.nm.blm.gov/cfo/HBIS/index.html [for MSHA Site 2900173].
9/23/2016
E2-11
Campbell, Jonathan (Internet). Roslindale, MA; [accessed November 2016]: New Mexico Superfund sites; Available from: http://www.cqs.com/super_nm.htm [MSHA Site 2902356].
Carmeuse Lime & Stone (Internet). Pittsburg, PA; c2010 [accessed November 2016]. Available from: http://www.carmeusena.com/locations/maysville-operation [MSHA sites 1509740 and 2000362].
Cheney Lime & Cement Company (Internet), Allgood, AL; [accessed November 2016]. Main Page, Quicklime and Hydrated Lime Products; Available from: http://www.cheneylime.com/ [MSHA site 100008]
Coeur (Internet). Coeur d'Alene, ID; c2008. [accessed November 2016]. United States, USA–Kensington; Available from: http://www.coeur.com/mines-projects/mines/kensington-alaska#.WDMyy000Pcs [MSHA site 5001544].
Colorado Department of Public Health and Environment (Internet). [Accessed November 2016]: Available from: http://www.cdphe.state.co.us/hm/cotter/index.htm [MSHA Site 501732].
Cooksley Geophysics Inc, Redding, CA. Ore Reserves of Heritage Mines, Inc., in the Knownothing Mining District Eight Miles South of Forks Salmon Siskiyou County, California (Internet); [November 1996; accessed November 2016]. Available from http://www.americansierragold.com/_resources/reports/DiscoveryDayReport1996.pdf [MSHA site 405222].
Coronado Resources Ltd (Internet). Vancouver, BC, Canada; cMarch 1, 2006 [accessed November 2016]: Projects: Madison Gold Property; Available from: http://www.coronadoresourcesltd.com/properties.htm [MSHA Site 2402467].
Davis, David A., 2002. Active Metal and Industrial Mineral Mines in Nevada – 2002 (Map), NBMG Open-File Report 03-30 (Internet); 1 page [accessed November 2016]: Nevada Bureau of Mines and Geology, University of Nevada, Reno; Available from: http://pubs.nbmg.unr.edu/Active-mines-NV-2002-color-p/of2003-30c.htm [MSHA Site 2600734].
Demand Media Sports, Trails.com, Inc. (Internet). Santa Monica, CA; c2009-2010 [accessed November 2016]; Available from: http://www.trails.com/ :
• Norwegian Mine – Madison County, MT USGS topographic map; Available from: http://www.trails.com/usgs-topo-norwegian-mine-topographic-map-804125.html [MSHA Site 12401784].
• Coy Mine USGS Jefferson City Quad, Tennessee, Topographic Map http://www.topozone.com/map.asp?lat=36.1225&lon=-83.4778&s=50&size=s [MSHA Site 4000166].
Denison Mines Corp. (Internet). Toronto, Ontario, Canada; c2007 [accessed November 2016]. U.S. Mining, Colorado Plateau; Available from: http://denisonmines.com/s/Home.asp [MSHA sites 202286 and 501197].
9/23/2016
E2-12
Department of Business & Industry, Division of Industrial Relations, State of Nevada, Carson City, NV: Directory of Nevada Mine Operations; 185 pages (Internet); [accessed November 2016]. Available from: http://epubs.nsla.nv.gov/statepubs/epubs/728580-2010.pdf [MSHA site 2602666]
Energy Fuels Inc. (Internet). Toronto, Ontario, Canada; c2010 [accessed November 2016]. Whirlwind Mine; Available from: http://www.energyfuels.com/operations/ [MSHA site 504816].
Findthedata.com. (Internet). [accessed November 2016]. Jerritt Canyon; Available from: http://mines.findthedata.com/l/8565/Mayday-Idaho-Mine [MSHA site 2602299]
Geody (Internet); [c2010]: Alum Mine, NV, USA Spot Image; [accessed November 2016]; Available from: http://www.geody.com/geospot.php?world=terra&map=col&ufi=100850238&alc=lmm [MSHA Site 2602599].
Gilbert Development Corporation (Internet). Hurricane UT; c2009 [accessed November 2016]. Available from: http://www.gilbertdevelopment.com/projects-3/ [MSHA Site 4201927].
Graymont Ltd. (Internet). Richmond, BC, Canada; c2010. [accessed November 2016]. Tacoma Plant (Tacoma, Washington); Available from: http://www.graymont.com/en/locations/lime-plants/western-us/lime-plant/tacoma [MSHA site 4503290] and http://www.graymont.com/en/locations/lime-plants/great-lakes/lime-plant/superior [MSHA site 4700587].
Heatherdale Resources Ltd. (Internet). Vancouver, BC, Canada; c2010. [accessed November 2016]. Location & Maps; Available from: http://www.heatherdaleresources.com/hdr/Location.asp [MSHA site 5001857].
Idaho Geological Survey (Internet): Search Results: The Idaho Geological Survey’s Mines and Prospects Database; [accessed November 2016]; Available from: http://www.idahogeology.org/Services/MinesAndMinerals/results.asp?switch=Reference&value=3560 [MSHA Site 1001918].
Kansas Geological Society (Internet). Lawrence, KS; cAugust 12, 2003 [accessed November 2016]. Industrial Mineral—Chase County; Both Active and Abandoned Quarries; Available from: http://chasm.kgs.ku.edu/ords/minerals.pqd3.mainCounty?cnty=17 [MSHA site 1400060].
JR Simplot Company, Smoky Canyon Phosphate Resources (Internet). Afton, WY; c2007-09 [accessed November 2016]; Available from: http://www.simplot.com/pdf/us_operations/SmokyCanyon.pdf [MSHA Site 1001590].
Macky School of Earth Sciences and Engineering, College of Sciences, University of Nevada, Reno; The Nevada Mineral Industry 2008: Metals, Industrial Minerals, Oil and Gas, Geothermal, Exploration, Development, Mining, and Processing; Nevada Bureau of Mines and Geology Special Publication MI-2008; 178 pages [accessed November 2016]:
9/23/2016
E2-13
NBMG, University of Nevada, Reno; Available from: http://pubs.nbmg.unr.edu/The-NV-mineral-industry-2008-p/mi2008.htm [MSHA Site 2602522].
Nash, J. Thomas, 2005. Hydrogeochemical Studies of Historical Mining Areas in the Humboldt River Basin and Adjacent Areas, Northern Nevada: Appendix 5. Location and description of mill and tailings sites, northern Nevada; 180 pages; United States Geological Survey Scientific Investigations Report 2004-5236; [page updated Monday November 7, 2005; accessed November 2016]; Available from: http://pubs.usgs.gov/sir/2004/5236/pdf/SIR_2004-5236.pdf [MSHA Site 2600078].
Nevada Commission on Mineral Resources (Internet), Nevada Division of Minerals (NDM) Home Page. Carson City, NV and Las Vegas, NV: [Updated 05/10/10]. Internet resource available from: http://minerals.state.nv.us/; The DVM; Major Mines of Nevada 1997: Mineral Industries in Nevada’s Economy; 1997 [accessed November 2016]. Available from: http://data.nbmg.unr.edu/public/freedownloads/p/p009.zip [MSHA Site 2602300].
New Jersey Mining Company (Internet). Kellogg, ID; c2005 [accessed November 2016]. Gold Properties, Golden Chest Mine (Gold); Available from: http://www.newjerseymining.com/golden_chest.html [MSHA site 1002050].
NV HomeTownLocator (internet). [accessed November 2016]. Available from: http://nevada.hometownlocator.com/maps/feature-map,ftc,2,fid,854059,n,fencemaker%20mine.cfm [MSHA site 2601650].
Oregon Water Resources Department (Internet); Well Log Query Results [accessed November 2016]; Available from: http://apps.wrd.state.or.us/apps/gw/well_log/ [MSHA Site 3503733].
Peraltra, Joe, The SingleCylinder Gazzette (Internet). c1999-2009; A New Life For A Mine With 9 Lives; [accessed November 2016]: Available from: http://www.gazette9.com/rt66/anewlife.htm [MSHA Site 202620].
Ralph, Jolyon and Ida Chau, Mindat.org (Internet); c1993-2010 [accessed November 2016]; Mineral and Locality Database; Available from: http://www.mindat.org/index.php :
• [MSHA Site 2602599]: http://www.mindat.org/index.php • [MSHA Site 3503237]: http://www.mindat.org/maps.php?id=147970 • [MSHA Site 4000166]: http://www.mindat.org/loc-10373.html • [MSHA Site 4000864] • [MSHA Site 403828]: http://www.mindat.org/loc-7768.html • [MSHA Site 5001571]: http://www.mindat.org/maps.php?id=197302 • [MSHA Site 5001754]: http://www.mindat.org/loc-197671.html
Rayle, Christopher E., Scott Solliday, and Victoria D. Vargas, Archeological Consulting Services, Ltd. (Internet); Tempe, AZ. 2008. A Cultural Resource and Historic Building Survey for a Remedial Investigation/Feasibility Study at the Iron King-Humbolt Smelter Superfund Site, Dewy Humbolt, Yavapai County, Arizona. November. Available from:
9/23/2016
E2-14
http://yosemite.epa.gov/r9/sfund/r9sfdocw.nsf/3dc283e6c5d6056f88257426007417a2/7be6add78caec55288257553007b557c/$FILE/08_151_02_Report.pdf [MSHA Site 202445].
Reti e Sistemi, Usa.indettaglio.it (Internet): c2010; Peterson Mine (Gogebic): [accessed November 2016]; Available from: http://usa.indettaglio.it/eng/26/053/634724.html [for MSHA Site 2003372].
Rosemont Cooper (Internet). Tucson, AZ; c2009 [accessed November 2016]: Available from: http://www.rosemontcopper.com/mpo.html [MSHA Site 203256].
Seattle Times (Internet); Seattle WA.: [accessed November 2016]. Available from: http://seattletimes.nwsource.com/ABPub/zoom/html/2004357396.html [MSHA Site 4503615].
Szumigala, D.J., R.C. Swainbank, M.W. Henning, and F.M. Pillifant; Alaska’s Mineral Industry 2000; [accessed November 2016]. Alaska Department of Natural Resources, Division of Geological & Geophysical Surveys (Internet). Fairbanks, AK: DGGS; c2009. Available from: http://www.dggs.alaska.gov/webpubs/dggs/sr/text/sr055.PDF [MSHA Site 5001837]
Timberline Resources Corporation (Internet). Coeur d'Alene, ID; c2010 [accessed November 2016]; Butte highlands Satellite Map; Available from: http://www.timberline-resources.com/main.php?page=84 [MSHA Site 2402563].
Topoquest (internet). [accessed November 2016]. Available from: http://www.topoquest.com/find/place.php?state=NV&search_type=start&name=fencemaker&class=mine [MSHA site 2601650].
U.S. Forest Service, Payette National Forest, McCall, ID: Walla Walla Mine Project Project Description Summary, 4 pages (Internet); [accessed November 2016]. Available from http://data.ecosystem-management.org/nepaweb/nepa_project_exp.php?project=27107 [MSHA site 100217]
Wade Agricultural Products, Inc. (Internet). La Cygne, KS; c2010. [accessed November 2016]. Available from: http://wadequarries.com/ [MSHA site 1401658]
Wikimapia (Internet). [accessed November 2016]: Available from: http://wikimapia.org/#lat=36.1104204&lon=-83.6904144&z=13&l=0&m=s&v=9 and http://wikimapia.org/#lat=36.0733835&lon=-83.6354828&z=14&l=0&m=s&v=9 [MSHA Site 4000168].
Zaidliez, Mike; May 14, 2008. Administrative Determination and Documentation of NEPA Adequacy Mining Operation, 43 CFR 3809; 12 pages (Internet); U.S Department of the Interior, Bureau of Land Management, Anchorage Field Office, Alaska. [accessed November 2016] Available from: https://www.blm.gov/style/medialib/blm/ak/afo/afo_nepa_docs/afo_fy2008_nepa_docs.Par.54506.File.dat/AK-010-08-DNA-025.pdf [MSHA Site 5001689].
9/23/2016
E3-1
Attachment E3. Evaluation Process Flow Diagrams Figure E3-1. Overview of Evaluation Process Flow Figure E3-2. Process Flow for Subtask 2: Identifying, Evaluating, and Documenting Data
Elements and Sources Figure E3-3. Process Flow for Subtask 3: Obtain and Process Datasets Meeting Quality Criteria Figure E3-4. Process Flow for Subtask 4: Identification of Factors Regarding Potential for
Expsoure to CERCLA Hazardous Substances (Questions) and Data Analysis
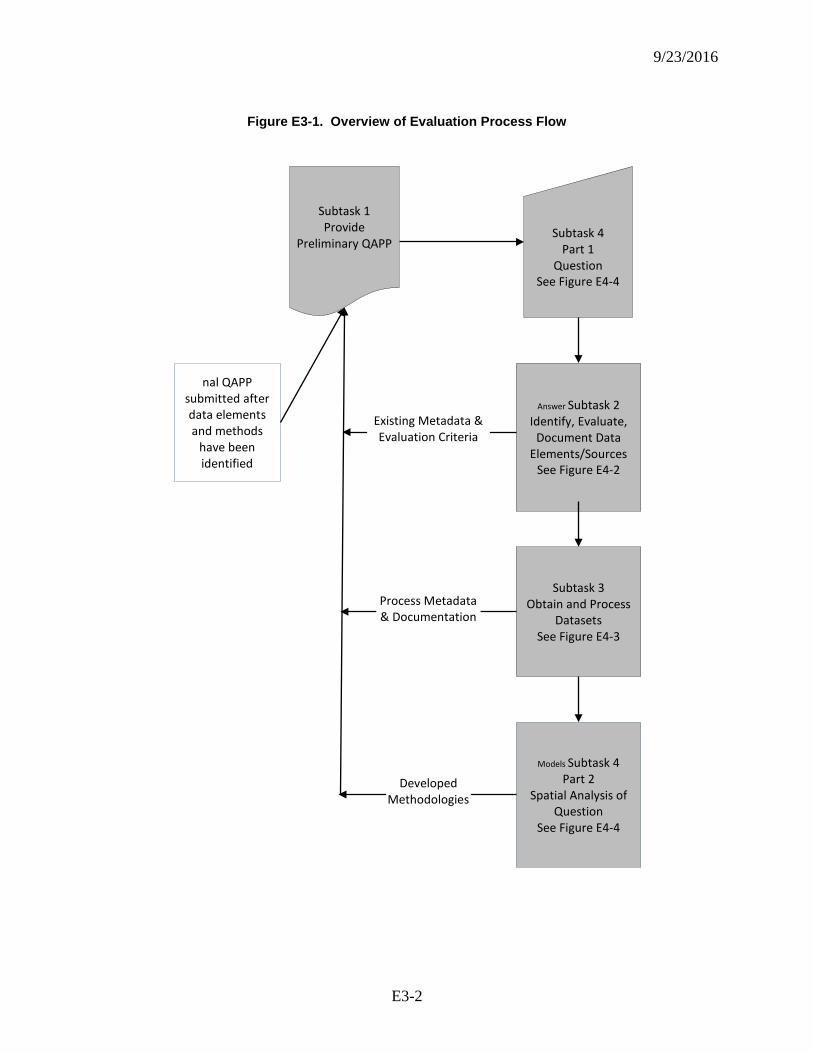
9/23/2016
E3-2
Figure E3-1. Overview of Evaluation Process Flow
Subtask 1 Provide
Preliminary QAPP Subtask 4
Part 1 Question
See Figure E4-4
Answer Subtask 2
Identify, Evaluate, Document Data
Elements/Sources See Figure E4-2
Subtask 3 Obtain and Process
Datasets See Figure E4-3
Models Subtask 4 Part 2
Spatial Analysis of Question
See Figure E4-4
nal QAPP submitted after data elements and methods
have been identified
Existing Metadata & Evaluation Criteria
Process Metadata & Documentation
Developed Methodologies
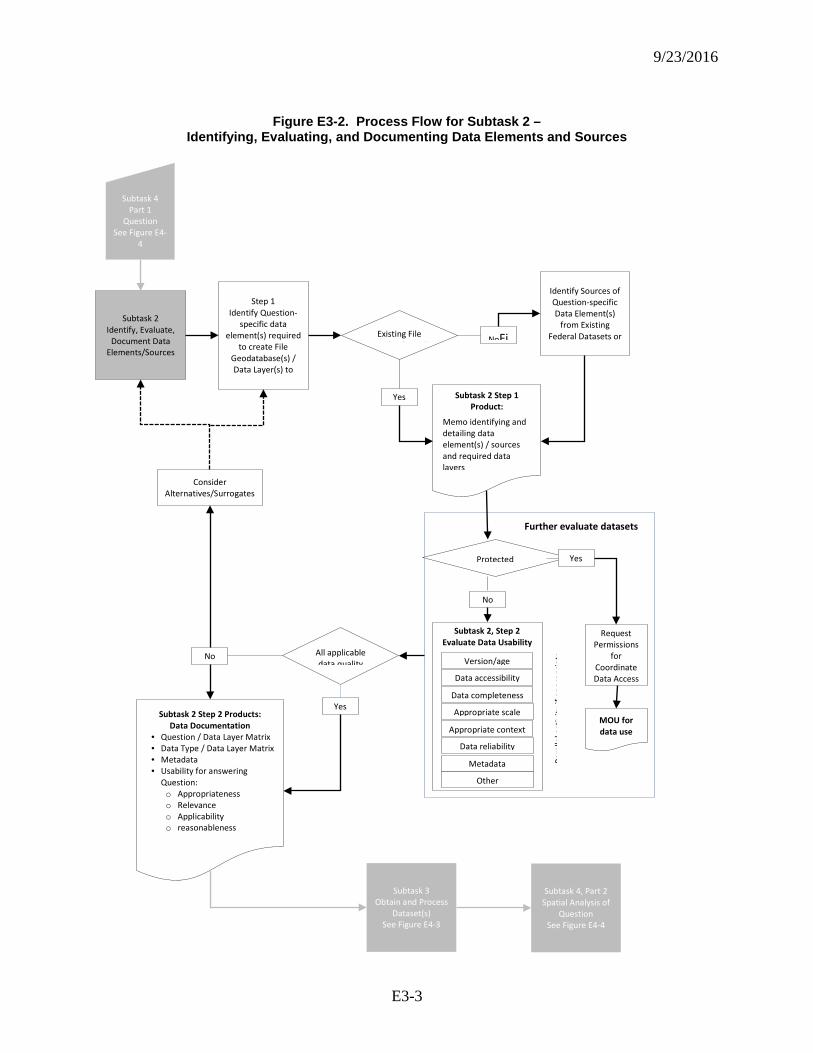
9/23/2016
E3-3
Figure E3-2. Process Flow for Subtask 2 –
Identifying, Evaluating, and Documenting Data Elements and Sources
Subtask 4 Part 1
Question See Figure E4-
4
Subtask 2 Identify, Evaluate,
Document Data Elements/Sources
Step 1 Identify Question-
specific data element(s) required
to create File Geodatabase(s) / Data Layer(s) to
Existing File G d b ?
Identify Sources of Question-specific Data Element(s)
from Existing Federal Datasets or NoFi
Subtask 2 Step 1 Product:
Memo identifying and detailing data element(s) / sources and required data layers
Yes
Protected
Yes
No
Request Permissions
for Coordinate Data Access
MOU for data use
Para
llel a
ctiv
ity if
app
ropr
iate
Version/age Data accessibility
Data completeness Appropriate scale
Appropriate context Data reliability
Metadata Other
Subtask 2, Step 2 Evaluate Data Usability
Further evaluate datasets
All applicable data quality
Yes
No
Consider Alternatives/Surrogates
Subtask 2 Step 2 Products: Data Documentation
• Question / Data Layer Matrix • Data Type / Data Layer Matrix • Metadata • Usability for answering
Question: o Appropriateness o Relevance o Applicability o reasonableness
Subtask 3 Obtain and Process
Dataset(s) See Figure E4-3
Subtask 4, Part 2 Spatial Analysis of
Question See Figure E4-4
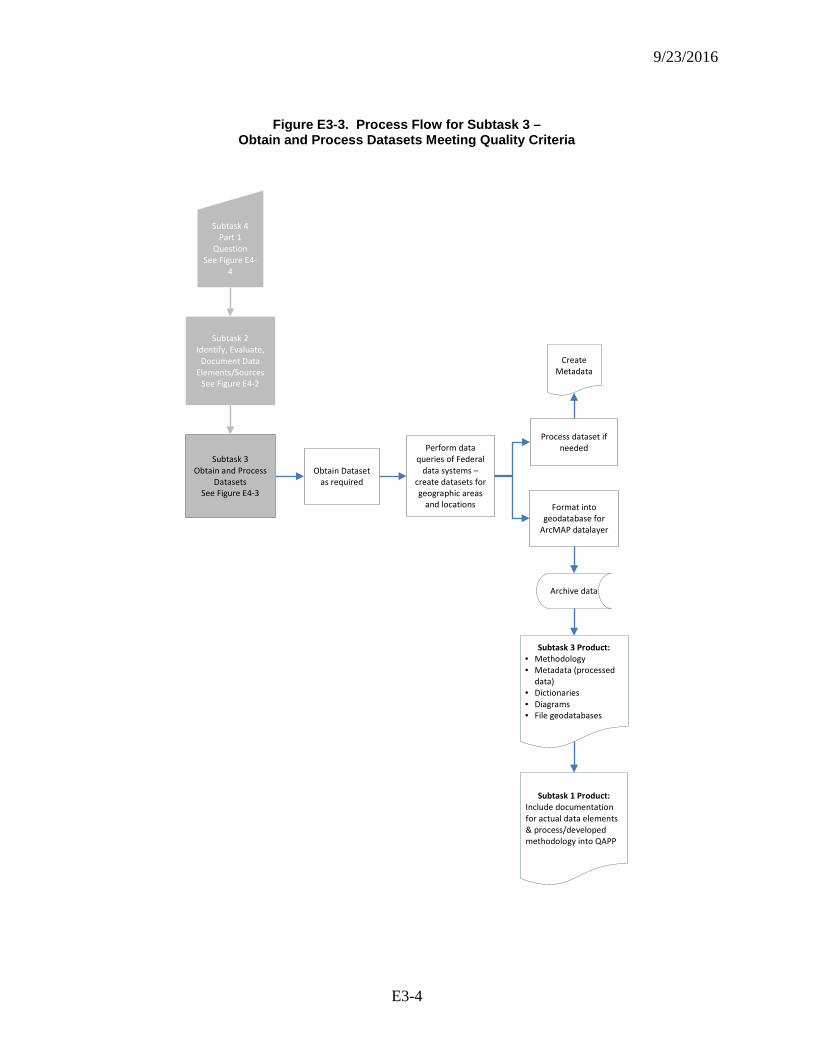
9/23/2016
E3-4
Figure E3-3. Process Flow for Subtask 3 –
Obtain and Process Datasets Meeting Quality Criteria Subtask 4
Part 1 Question
See Figure E4-4
Subtask 2 Identify, Evaluate,
Document Data Elements/Sources
See Figure E4-2
Subtask 3 Obtain and Process
Datasets See Figure E4-3
Obtain Dataset as required
Perform data queries of Federal
data systems – create datasets for geographic areas
and locations
Process dataset if needed
Format into geodatabase for
ArcMAP datalayer
Create Metadata
Archive data
Subtask 3 Product: • Methodology • Metadata (processed
data) • Dictionaries • Diagrams • File geodatabases
Subtask 1 Product: Include documentation for actual data elements & process/developed methodology into QAPP
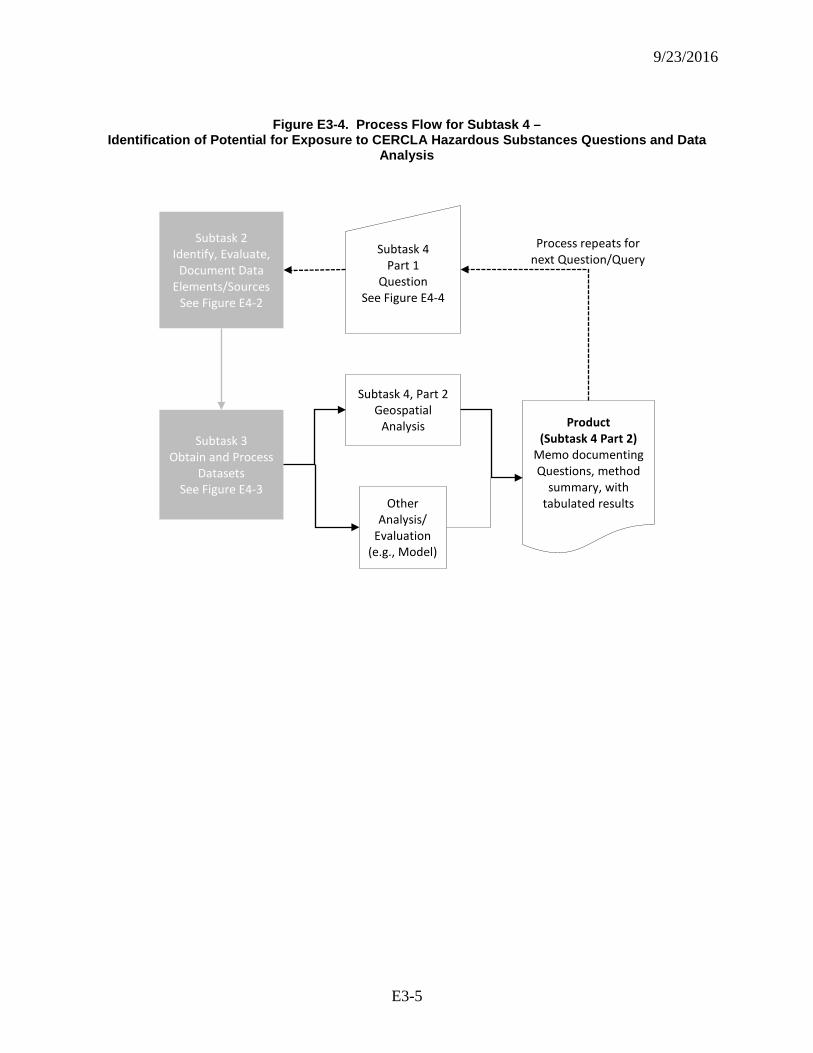
9/23/2016
E3-5
Figure E3-4. Process Flow for Subtask 4 –
Identification of Potential for Exposure to CERCLA Hazardous Substances Questions and Data Analysis
Subtask 2
Identify, Evaluate, Document Data
Elements/Sources See Figure E4-2
Subtask 3 Obtain and Process
Datasets See Figure E4-3
Subtask 4, Part 2 Geospatial
Analysis
Other Analysis/
Evaluation (e.g., Model)
Product (Subtask 4 Part 2)
Memo documenting Questions, method
summary, with tabulated results
Subtask 4 Part 1
Question See Figure E4-4
Process repeats for next Question/Query
9/23/2016
E4-1
Attachment E4. Example Exposure Scenario and Related Questions
Exposure Senario: Will mining activities in any way jeopardize the continued existence of species listed as threatened and endangered under the Endangered Species Act, or destroy or adversely modify critical habitat?
Exposure Factor and Exposure Factor Questions (rQ): Probability that endangered or threatened species will be exposed?
rQ1: Is the mine located in a county, or across county areas, where threatened and endangered species have been identified?
GIS Output: County-level data layer(s) showing the number of endangered and/or threatened species by type (e.g., bird, reptile, mammal, fish, and insect). rQ2: How many areas are designated as critical habitat on the mine site, within 1-mile of
the site boundary (or centroid), 5-miles of the site boundary (or centroid), 10-miles of the site boundary (or centroid), and 25-miles of the site boundary (or centroid)?
GIS Output: Data layer relating the delineation of critical (possibly sensitive) habitat on the mine site, within 1-mile of the site boundary (or centroid), 5-miles of the site boundary (or centroid), 10-miles of the site boundary (or centroid), and 25-miles of the site boundary (or centroid).
Severity Questions (sQ): sQ1: What mine type (e.g., underground or surface mine) exists or is proposed? A
surface mine might be expected to have more impact on threatened and endangered species than an underground mine?
sQ2: What type(s) of animal(s) are threatened and endangered; could they easily move to other habitat areas (e.g., birds versus amphibian)?
sQ3: What is the distance or buffer area between the mine site and the habitat? sQ4: What type of land cover lies within the buffer area between the habitat and the
mine? sQ5: Do any critical or sensitive habitat areas occur within the same drainage area as
watershed as the mine? sQ6: Do any critical or sensitive habitat areas occur downstream of the mine site?

9/23/2016
E4-2
[This page intentionally left blank.]
9/23/2016
E5-1
Attachment E5. Potential Data Sources
Figure E5-1. Potential Data Sources for Generalizing Environmental Baseline within Region / Watershed
Figure E5-2. Potential Data Sources for Terrestrial Ecosystem Services Used to Estimate
Exposure Figure E5-3. Potential Data Sources for Aquatic Ecosystem Services Used to Estimate Exposure Figure E5-4. Potential Environmental Impact of Existing Mines and Mine Plant Sites
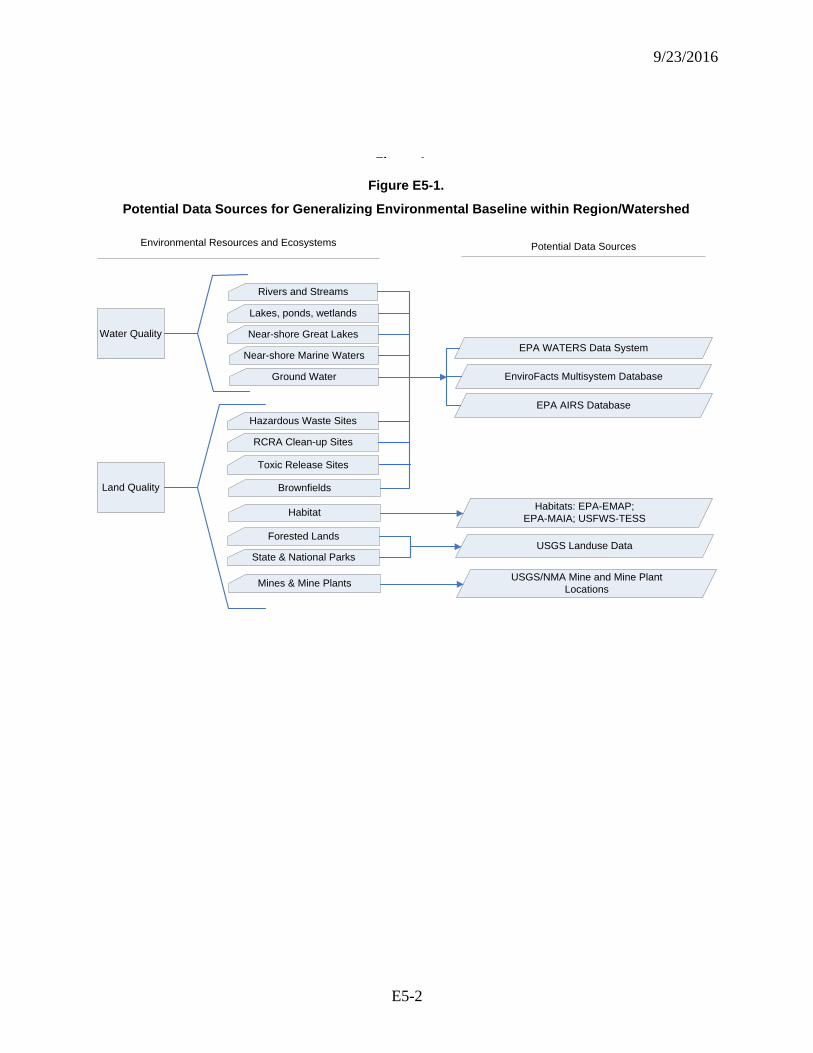
9/23/2016
E5-2
Hazardous Waste Sites
Brownfields
State & National Parks
EPA WATERS Data System
EnviroFacts Multisystem Database
Rivers and Streams
Water Quality
Land Quality
Environmental Resources and Ecosystems
Figure 1
Potential Data Sources for Generalizing Environmental BaselineWithin Region / Watershed
Forested Lands
Ground Water
Lakes, ponds, wetlands
Near-shore Marine Waters
Near-shore Great Lakes
RCRA Clean-up Sites
Toxic Release Sites
EPA AIRS Database
Habitats: EPA-EMAP; EPA-MAIA; USFWS-TESS
USGS Landuse Data
Potential Data Sources
Mines & Mine Plants USGS/NMA Mine and Mine Plant Locations
Habitat
Figure E5-1.
Potential Data Sources for Generalizing Environmental Baseline within Region/Watershed
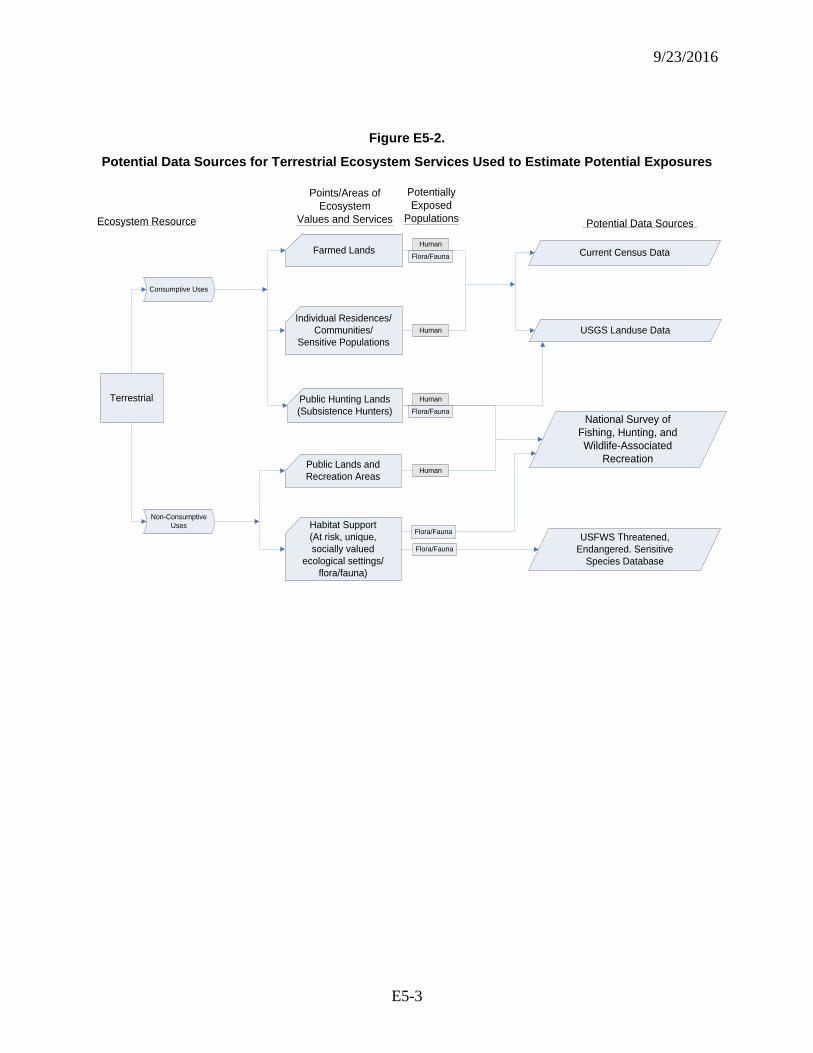
9/23/2016
E5-3
Figure 2
Potential Data Sources for Terrestrial Ecosystem Services Used to Relate Exposure/Risk
Current Census Data
USGS Landuse Data
Terrestrial
Farmed Lands
Individual Residences/Communities/
Sensitive Populations
USFWS Threatened, Endangered. Sensitive
Species Database
National Survey of Fishing, Hunting, and Wildlife-Associated
RecreationPublic Lands and Recreation Areas
Non-Consumptive Uses Habitat Support
(At risk, unique, socially valued
ecological settings/flora/fauna)
Consumptive Uses
Public Hunting Lands(Subsistence Hunters)
Human
Human
Human
Human
Flora/Fauna
Flora/Fauna
Flora/Fauna
Potential Data Sources Ecosystem Resource
Points/Areas of Ecosystem
Values and Services
Flora/Fauna
Potentially Exposed
Populations
Figure E5-2.
Potential Data Sources for Terrestrial Ecosystem Services Used to Estimate Potential Exposures
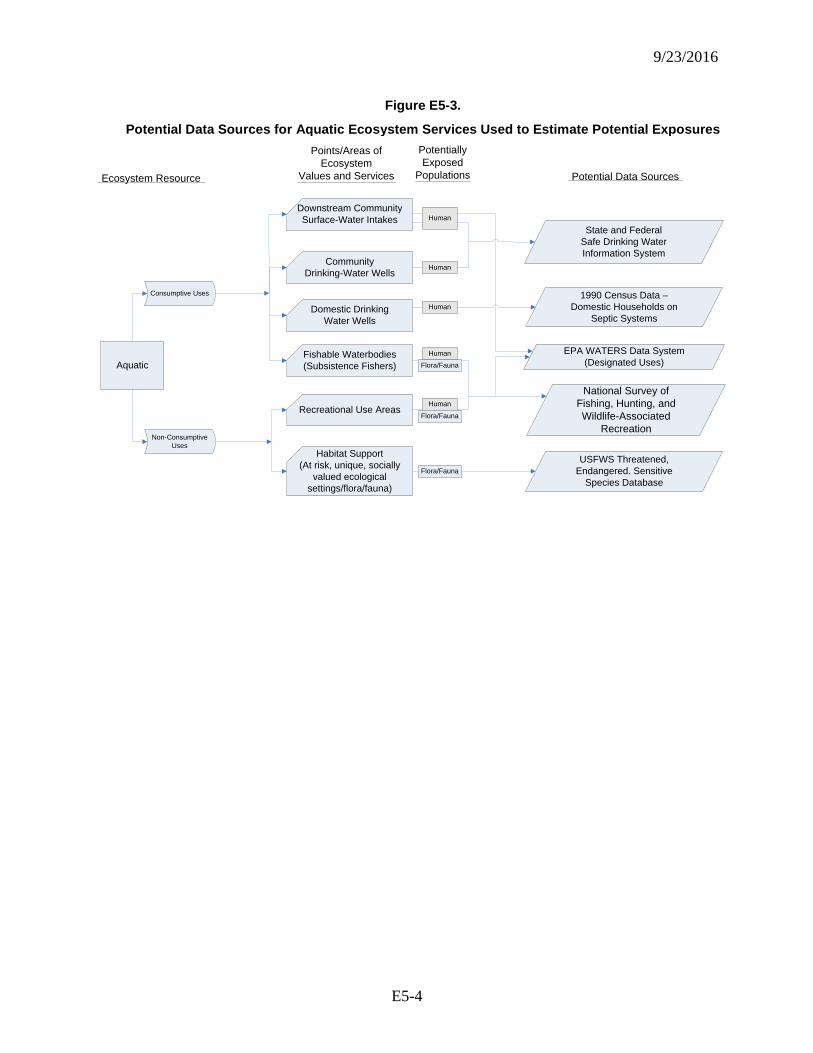
9/23/2016
E5-4
State and FederalSafe Drinking Water Information System
1990 Census Data – Domestic Households on
Septic Systems
USFWS Threatened, Endangered. Sensitive
Species Database
Aquatic
Ecosystem Resource
National Survey of Fishing, Hunting, and Wildlife-Associated
Recreation
Downstream CommunitySurface-Water Intakes
CommunityDrinking-Water Wells
Domestic DrinkingWater Wells
Recreational Use Areas
Consumptive Uses
Non-Consumptive Uses
Habitat Support(At risk, unique, socially
valued ecological settings/flora/fauna)
Fishable Waterbodies(Subsistence Fishers)
EPA WATERS Data System (Designated Uses)
Figure 3
Potential Data Sources for Aquatic Ecosystem Services Used to Relate Exposure/Risk
Potential Data Sources
Points/Areas of Ecosystem
Values and Services
Potentially Exposed
Populations
Human
Human
Human
Flora/Fauna
Flora/Fauna
Human
Human
Flora/Fauna
Figure E5-3.
Potential Data Sources for Aquatic Ecosystem Services Used to Estimate Potential Exposures
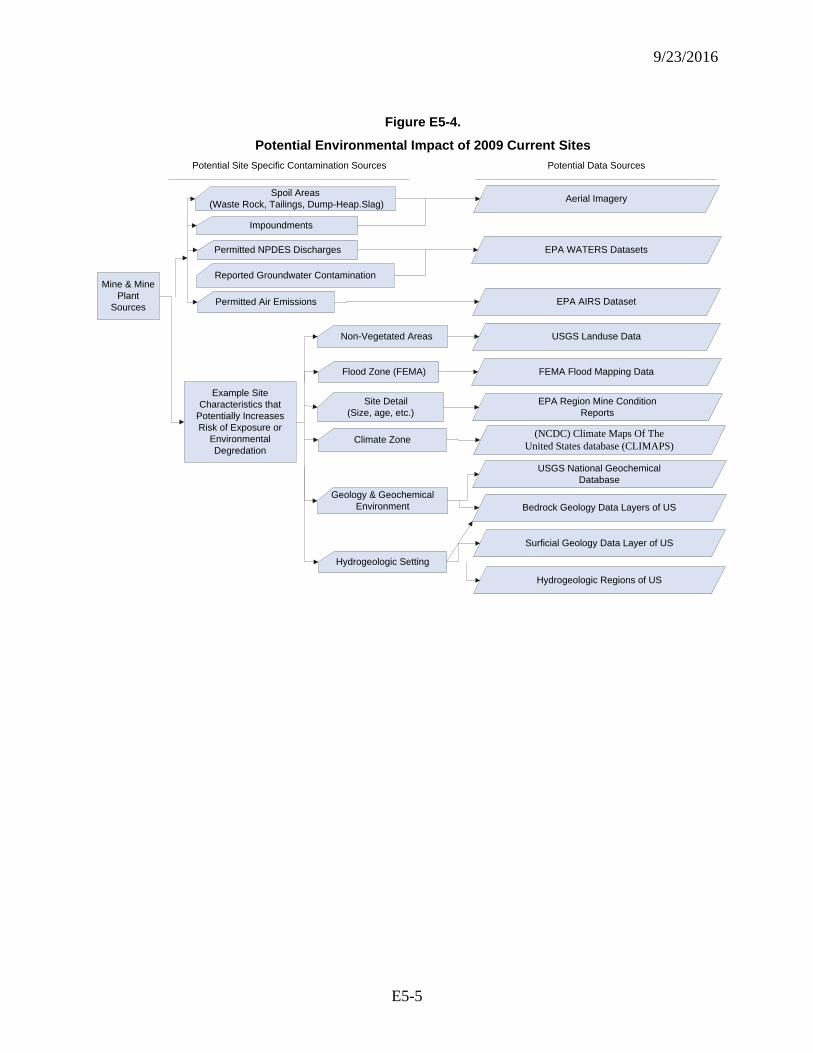
9/23/2016
E5-5
Spoil Areas (Waste Rock, Tailings, Dump-Heap.Slag)
Impoundments
Non-Vegetated Areas
Reported Groundwater Contamination
Permitted NPDES Discharges
Site Detail(Size, age, etc.)
Flood Zone (FEMA)
Permitted Air Emissions
Potential Data Sources
Figure 4Potential Environmental Impact of Existing Mines and Mine Plant Sites
Climate Zone
Geology & Geochemical Environment
Hydrogeologic Setting
Example Site Characteristics that
Potentially Increases Risk of Exposure or
Environmental Degredation
Mine & Mine Plant
Sources
Aerial Imagery
EPA WATERS Datasets
EPA AIRS Dataset
USGS Landuse Data
FEMA Flood Mapping Data
(NCDC) Climate Maps Of The United States database (CLIMAPS)
Hydrogeologic Regions of US
Surficial Geology Data Layer of US
Bedrock Geology Data Layers of US
USGS National Geochemical Database
EPA Region Mine Condition Reports
Potential Site Specific Contamination Sources
Figure E5-4.
Potential Environmental Impact of 2009 Current Sites

9/23/2016
E5-6
[This page intentionally left blank.]
9/23/2016
F-1
Appendix F Evidence of CERCLA Hazardous Substances at 2009 Current
Sites EPA collected available data from existing Federal government data sources pertaining to
the release of CERCLA hazardous substances from mines and mineral processors. The focus of the data collection for 2009 Current sites included the following four EPA data sources:
• Toxics Release Inventory (TRI) • Discharge Monitoring Reports (DMRs) from the National Pollutant Discharge
Elimination System (NPDES); includes the Integrated Compliance Information System (ICIS) and Permit Compliance System (PCS)—NPDES Majors
• National Emissions Inventory (NEI)
These data sources are generally described in this appendix. The TRI, DMR, and NEI data presented are limited to the priority contaminants of concern (Priority COCs) as defined in report Section 2.4 (“CERCLA Contaminants of Concern (COCs)”) and Appendix D.
F.1 TRI Data The TRI is administered under Section 313 of the Emergency Planning and Community
Right-to-Know Act (EPCRA) that was enacted in 1986. The TRI is primarily a public resource to inform citizens about releases of certain toxic chemicals to the air, water, and soils in their community. EPA and States are required by EPCRA to collect and publish data annually on releases and transfers of certain toxic chemicals from industrial facilities. In addition to reporting the release or transfer of chemicals, facilities are required to report on waste management and source reduction activities; these data are available after 1990 when required by the Pollution Prevention Act. In 1997, the TRI reporting was expanded to include seven additional industries including metal mining operations.
According to the TRI Program Guidance (U.S. EPA, 2011), in general a facility must report to TRI if it:
• Is in a specific industrial sector (e.g., manufacturing, mining, electric power generation) • Employs 10 or more full-time equivalent employees • Manufactures or processes more than 25,000 lbs of a TRI-listed chemical or otherwise
uses more than 10,000 lbs of a listed chemical in a given year.
Additionally, persistent, bioaccumulative, toxic chemicals (PBTs) listed under TRI have lower reporting thresholds for mass quantities manufactured or used annually than those specified above. For mines and mineral processors, such PBTs include lead, lead compounds, mercury, mercury compounds, polychlorinated biphenyls (PCBs), and dioxin and dioxin-like compounds.
If a facility meets these criteria, it must:
• Submit a TRI Form R (long form) or Form A (short form) for each TRI-listed chemical it manufactures, processes, or otherwise uses in quantities above the reporting threshold
9/23/2016
F-2
• Submit each TRI form to both EPA and the State in which the facility is located.
A facility is eligible to submit a Form A if:
• The chemical being reported is NOT a PBT chemical • The chemical has not been manufactured, processed, or otherwise used in excess of
1,000,000 lbs • The total annual waste management (i.e., releases including disposal, recycling, energy
recovery, and treatment) of the chemical does not exceed 500 lbs.
Mine processors use a wide variety of chemicals that require management. Mineral processors can also produce raw chemicals (e.g., sulfuric acid) for use in mineral recovery from the mined rock. Many gold, silver, and copper mine processors report to the TRI program because of the volume of chemicals used in the commonly employed metal leaching process to liberate metals from the ore rock and ore minerals. Although ore extraction processes typically do not use many chemicals, reporting may be required because metals and metal compounds accumulate from rock waste piles. TRI data extracted from EPA data systems are provided below for currently active mine and processor sites.
Linking the individual 2009 Current sites to facilities in the TRI reveals that 55 of the mines (10%) and 109 of the processors (19%) have reported releases in TRI for the period 2005 to 2009. These mining facilities engage in the removal of naturally occurring materials from the earth. EPA had considered naturally occurring materials to be manufactured by natural processes. A recent court order set aside EPA’s interpretation of manufacturing in the mining context, stating that naturally occurring ores in situ have not been manufactured within the meaning of EPCRA section 313. EPA is considering clarifying how the definitions of manufacturing and processing under EPCRA section 313 apply to the mining-sector processes of extraction and beneficiation.
Attachment F1 shows the cross-walk between the 2009 Current sites and the TRI reporting facilities.
Releases of COCs from 2009 Current sites total approximately 828,111 tons to the land surface, 3,894 tons emitted into air, and 16,774 tons discharged into waters, as estimated using available data. Dioxin and dioxin-like compounds released from 2009 Current sites totals approximately 69 grams emitted to air, 36 grams to land, and 0.32 grams discharged to waters. Attachment F2 shows TRI releases by year and COC for each 2009 Current site. Attachment F3 shows releases for the 2009 Current sites averaged over the years reported for air (Table F3-1), surface water (Table F3-2), and on-site releases to land (Table F3-3).
F.2 DMR Data The Clean Water Act (CWA) defines provisions for granting National Pollutant
Discharge Elimination System (NPDES) permits in programs administered either by EPA or by State agencies where NPDES authority has been delegated by EPA. The NPDES program was introduced in 1972, under Section 402 of the CWA for regulation of pollutant discharges from point sources to waters of the United States. Point source discharges are illegal unless authorized by an NPDES permit. A point source is defined by EPA’s NPDES Program as any discernible,
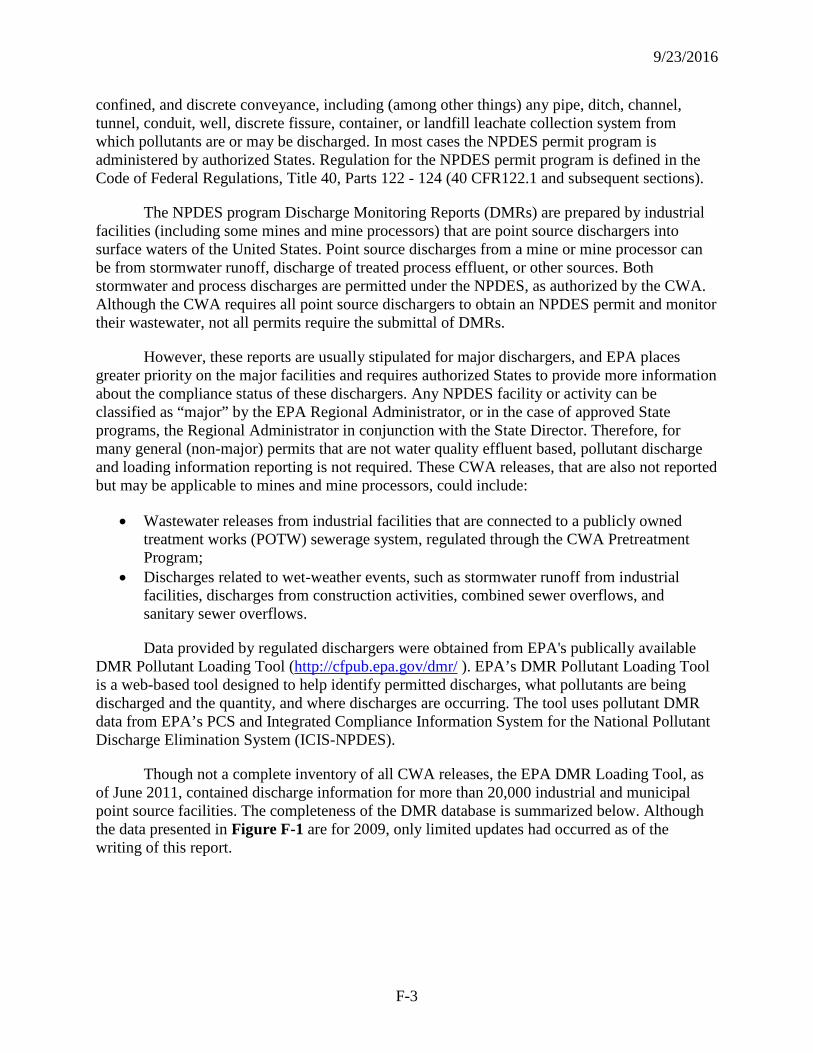
9/23/2016
F-3
confined, and discrete conveyance, including (among other things) any pipe, ditch, channel, tunnel, conduit, well, discrete fissure, container, or landfill leachate collection system from which pollutants are or may be discharged. In most cases the NPDES permit program is administered by authorized States. Regulation for the NPDES permit program is defined in the Code of Federal Regulations, Title 40, Parts 122 - 124 (40 CFR122.1 and subsequent sections).
The NPDES program Discharge Monitoring Reports (DMRs) are prepared by industrial facilities (including some mines and mine processors) that are point source dischargers into surface waters of the United States. Point source discharges from a mine or mine processor can be from stormwater runoff, discharge of treated process effluent, or other sources. Both stormwater and process discharges are permitted under the NPDES, as authorized by the CWA. Although the CWA requires all point source dischargers to obtain an NPDES permit and monitor their wastewater, not all permits require the submittal of DMRs.
However, these reports are usually stipulated for major dischargers, and EPA places greater priority on the major facilities and requires authorized States to provide more information about the compliance status of these dischargers. Any NPDES facility or activity can be classified as “major” by the EPA Regional Administrator, or in the case of approved State programs, the Regional Administrator in conjunction with the State Director. Therefore, for many general (non-major) permits that are not water quality effluent based, pollutant discharge and loading information reporting is not required. These CWA releases, that are also not reported but may be applicable to mines and mine processors, could include:
• Wastewater releases from industrial facilities that are connected to a publicly owned treatment works (POTW) sewerage system, regulated through the CWA Pretreatment Program;
• Discharges related to wet-weather events, such as stormwater runoff from industrial facilities, discharges from construction activities, combined sewer overflows, and sanitary sewer overflows.
Data provided by regulated dischargers were obtained from EPA's publically available DMR Pollutant Loading Tool (http://cfpub.epa.gov/dmr/ ). EPA’s DMR Pollutant Loading Tool is a web-based tool designed to help identify permitted discharges, what pollutants are being discharged and the quantity, and where discharges are occurring. The tool uses pollutant DMR data from EPA’s PCS and Integrated Compliance Information System for the National Pollutant Discharge Elimination System (ICIS-NPDES).
Though not a complete inventory of all CWA releases, the EPA DMR Loading Tool, as of June 2011, contained discharge information for more than 20,000 industrial and municipal point source facilities. The completeness of the DMR database is summarized below. Although the data presented in Figure F-1 are for 2009, only limited updates had occurred as of the writing of this report.
9/23/2016
F-4
From: http://cfpub.epa.gov/dmr/
Figure F-1. Completeness of CWA Discharge Monitoring Data by State
Mining or processing operations may have general permits related to retention ponds that in most cases do not require DMR tracking. Pollutant loadings are presented in the DMR as pounds per year where such reporting is required as part of an NPDES discharge permit. Data for reportable discharges associated with mining and mining processor sites was found to be limited.
The specific procedure used to identify data in the DMR that are linked to 2009 Current sites included first determining which of these had TRI identifiers, then determining which of these TRI facilities were linked with an NPDES identifier. For each 2009 Current site that has an NPDES ID, a query was entered into the DMR system to retrieve relevant data relating to the release of CERCLA hazardous substances. All other chemical releases were also noted. Those releases that included chemicals that are defined as CERCLA hazardous substances were then indicated by including the standardized name of the chemical and its CAS registry numbers.
An individual 2009 Current site may be associated with more than one TRI and NPDES identifier. Of the 2009 Current mines, 13 were linked with an NPDES ID. Of the 2009 Current processors, 44 were linked with one or more NPDES IDs; the total mine and processor counts reflects the number of ungrouped individual mines and processors. Table F-1 shows the crosswalk between the 2009 Current mines, their corresponding TRI ID#s and TRI reporting facility names, and the NPDES permit numbers and NPDES discharger name on record in either the PCS or ICIS database. Table F-2 shows the same crosswalk but for 2009 Current processors. Attachment F-4 shows the results, by 2009 Current site and COC, and for phosphorus, ammonia, and cyanide.
Table F-1. Crosswalk Between 2009 Current Mines and DMR/NPDES Sites Row Mine_ID TRI_ID NPDES_ID FRS_Facility
1 13 83837SNSHN1176B ID0000060 Essential Metals Corporation 2 124 83227THMPSSQUAW ID0025402 Thompson Creek Mining Co.
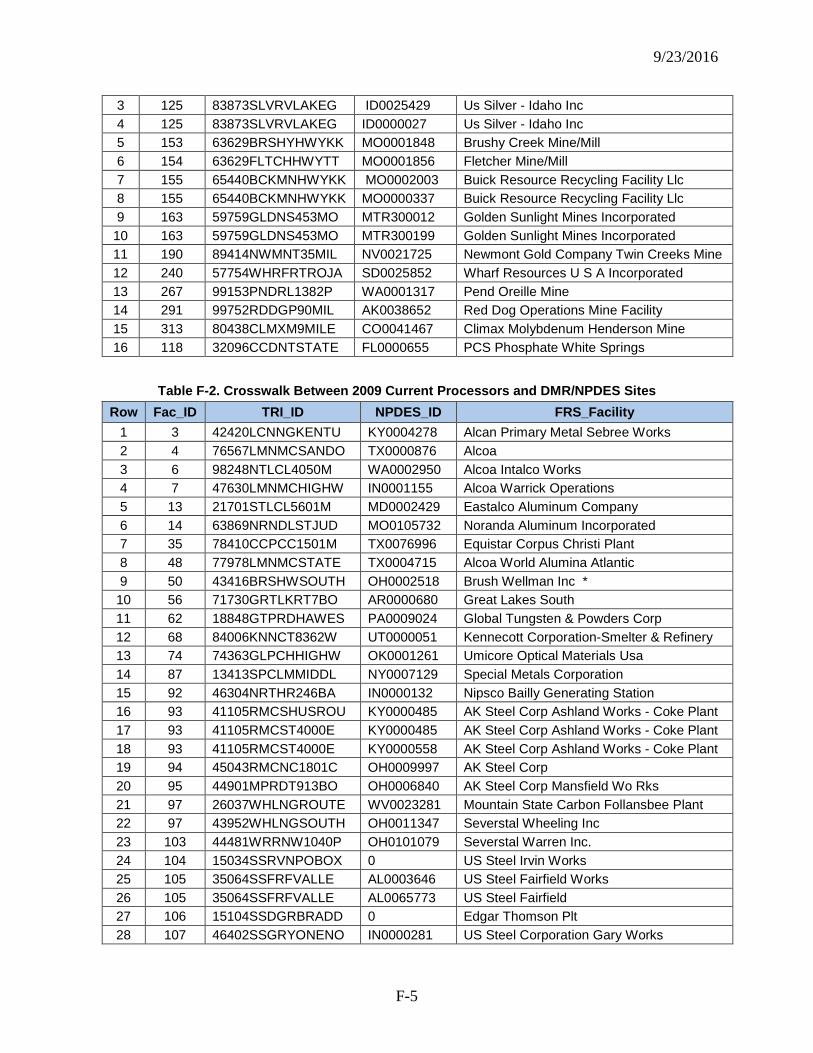
9/23/2016
F-5
3 125 83873SLVRVLAKEG ID0025429 Us Silver - Idaho Inc 4 125 83873SLVRVLAKEG ID0000027 Us Silver - Idaho Inc 5 153 63629BRSHYHWYKK MO0001848 Brushy Creek Mine/Mill 6 154 63629FLTCHHWYTT MO0001856 Fletcher Mine/Mill 7 155 65440BCKMNHWYKK MO0002003 Buick Resource Recycling Facility Llc 8 155 65440BCKMNHWYKK MO0000337 Buick Resource Recycling Facility Llc 9 163 59759GLDNS453MO MTR300012 Golden Sunlight Mines Incorporated
10 163 59759GLDNS453MO MTR300199 Golden Sunlight Mines Incorporated 11 190 89414NWMNT35MIL NV0021725 Newmont Gold Company Twin Creeks Mine 12 240 57754WHRFRTROJA SD0025852 Wharf Resources U S A Incorporated 13 267 99153PNDRL1382P WA0001317 Pend Oreille Mine 14 291 99752RDDGP90MIL AK0038652 Red Dog Operations Mine Facility 15 313 80438CLMXM9MILE CO0041467 Climax Molybdenum Henderson Mine 16 118 32096CCDNTSTATE FL0000655 PCS Phosphate White Springs
Table F-2. Crosswalk Between 2009 Current Processors and DMR/NPDES Sites
Row Fac_ID TRI_ID NPDES_ID FRS_Facility 1 3 42420LCNNGKENTU KY0004278 Alcan Primary Metal Sebree Works 2 4 76567LMNMCSANDO TX0000876 Alcoa 3 6 98248NTLCL4050M WA0002950 Alcoa Intalco Works 4 7 47630LMNMCHIGHW IN0001155 Alcoa Warrick Operations 5 13 21701STLCL5601M MD0002429 Eastalco Aluminum Company 6 14 63869NRNDLSTJUD MO0105732 Noranda Aluminum Incorporated 7 35 78410CCPCC1501M TX0076996 Equistar Corpus Christi Plant 8 48 77978LMNMCSTATE TX0004715 Alcoa World Alumina Atlantic 9 50 43416BRSHWSOUTH OH0002518 Brush Wellman Inc *
10 56 71730GRTLKRT7BO AR0000680 Great Lakes South 11 62 18848GTPRDHAWES PA0009024 Global Tungsten & Powders Corp 12 68 84006KNNCT8362W UT0000051 Kennecott Corporation-Smelter & Refinery 13 74 74363GLPCHHIGHW OK0001261 Umicore Optical Materials Usa 14 87 13413SPCLMMIDDL NY0007129 Special Metals Corporation 15 92 46304NRTHR246BA IN0000132 Nipsco Bailly Generating Station 16 93 41105RMCSHUSROU KY0000485 AK Steel Corp Ashland Works - Coke Plant 17 93 41105RMCST4000E KY0000485 AK Steel Corp Ashland Works - Coke Plant 18 93 41105RMCST4000E KY0000558 AK Steel Corp Ashland Works - Coke Plant 19 94 45043RMCNC1801C OH0009997 AK Steel Corp 20 95 44901MPRDT913BO OH0006840 AK Steel Corp Mansfield Wo Rks 21 97 26037WHLNGROUTE WV0023281 Mountain State Carbon Follansbee Plant 22 97 43952WHLNGSOUTH OH0011347 Severstal Wheeling Inc 23 103 44481WRRNW1040P OH0101079 Severstal Warren Inc. 24 104 15034SSRVNPOBOX 0 US Steel Irvin Works 25 105 35064SSFRFVALLE AL0003646 US Steel Fairfield Works 26 105 35064SSFRFVALLE AL0065773 US Steel Fairfield 27 106 15104SSDGRBRADD 0 Edgar Thomson Plt 28 107 46402SSGRYONENO IN0000281 US Steel Corporation Gary Works
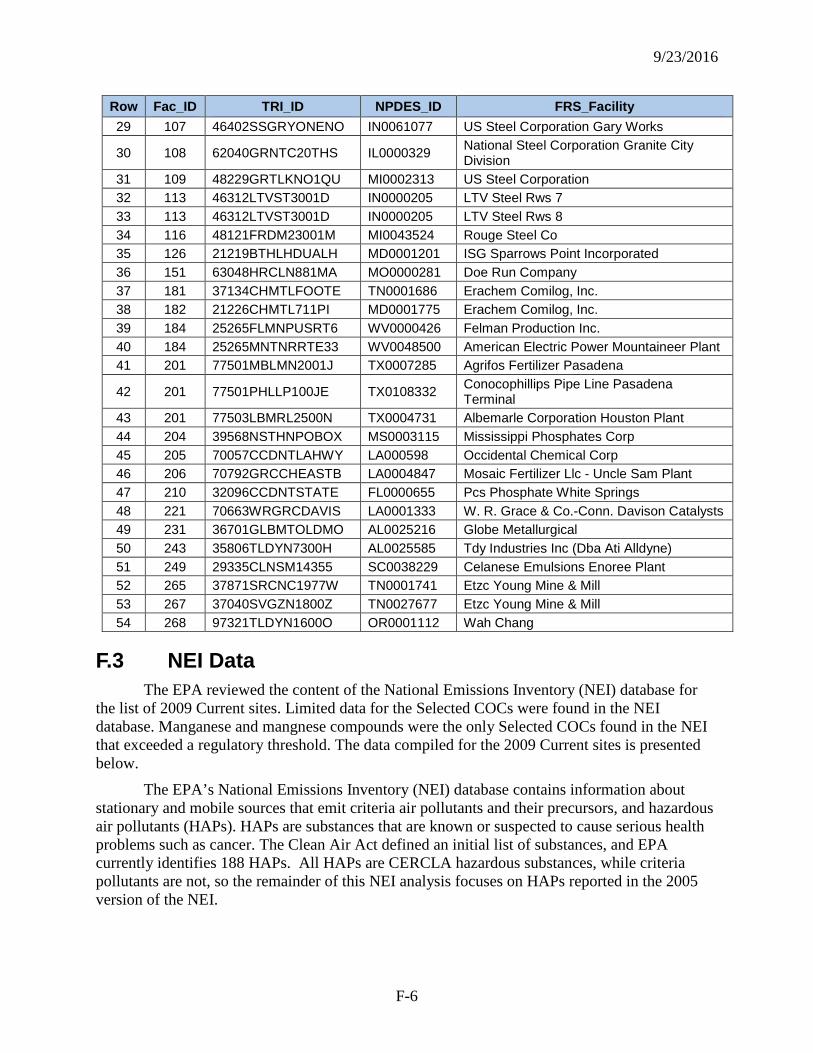
9/23/2016
F-6
Row Fac_ID TRI_ID NPDES_ID FRS_Facility 29 107 46402SSGRYONENO IN0061077 US Steel Corporation Gary Works
30 108 62040GRNTC20THS IL0000329 National Steel Corporation Granite City Division
31 109 48229GRTLKNO1QU MI0002313 US Steel Corporation 32 113 46312LTVST3001D IN0000205 LTV Steel Rws 7 33 113 46312LTVST3001D IN0000205 LTV Steel Rws 8 34 116 48121FRDM23001M MI0043524 Rouge Steel Co 35 126 21219BTHLHDUALH MD0001201 ISG Sparrows Point Incorporated 36 151 63048HRCLN881MA MO0000281 Doe Run Company 37 181 37134CHMTLFOOTE TN0001686 Erachem Comilog, Inc. 38 182 21226CHMTL711PI MD0001775 Erachem Comilog, Inc. 39 184 25265FLMNPUSRT6 WV0000426 Felman Production Inc. 40 184 25265MNTNRRTE33 WV0048500 American Electric Power Mountaineer Plant 41 201 77501MBLMN2001J TX0007285 Agrifos Fertilizer Pasadena
42 201 77501PHLLP100JE TX0108332 Conocophillips Pipe Line Pasadena Terminal
43 201 77503LBMRL2500N TX0004731 Albemarle Corporation Houston Plant 44 204 39568NSTHNPOBOX MS0003115 Mississippi Phosphates Corp 45 205 70057CCDNTLAHWY LA000598 Occidental Chemical Corp 46 206 70792GRCCHEASTB LA0004847 Mosaic Fertilizer Llc - Uncle Sam Plant 47 210 32096CCDNTSTATE FL0000655 Pcs Phosphate White Springs 48 221 70663WRGRCDAVIS LA0001333 W. R. Grace & Co.-Conn. Davison Catalysts 49 231 36701GLBMTOLDMO AL0025216 Globe Metallurgical 50 243 35806TLDYN7300H AL0025585 Tdy Industries Inc (Dba Ati Alldyne) 51 249 29335CLNSM14355 SC0038229 Celanese Emulsions Enoree Plant 52 265 37871SRCNC1977W TN0001741 Etzc Young Mine & Mill 53 267 37040SVGZN1800Z TN0027677 Etzc Young Mine & Mill 54 268 97321TLDYN1600O OR0001112 Wah Chang
F.3 NEI Data The EPA reviewed the content of the National Emissions Inventory (NEI) database for
the list of 2009 Current sites. Limited data for the Selected COCs were found in the NEI database. Manganese and mangnese compounds were the only Selected COCs found in the NEI that exceeded a regulatory threshold. The data compiled for the 2009 Current sites is presented below.
The EPA’s National Emissions Inventory (NEI) database contains information about stationary and mobile sources that emit criteria air pollutants and their precursors, and hazardous air pollutants (HAPs). HAPs are substances that are known or suspected to cause serious health problems such as cancer. The Clean Air Act defined an initial list of substances, and EPA currently identifies 188 HAPs. All HAPs are CERCLA hazardous substances, while criteria pollutants are not, so the remainder of this NEI analysis focuses on HAPs reported in the 2005 version of the NEI.
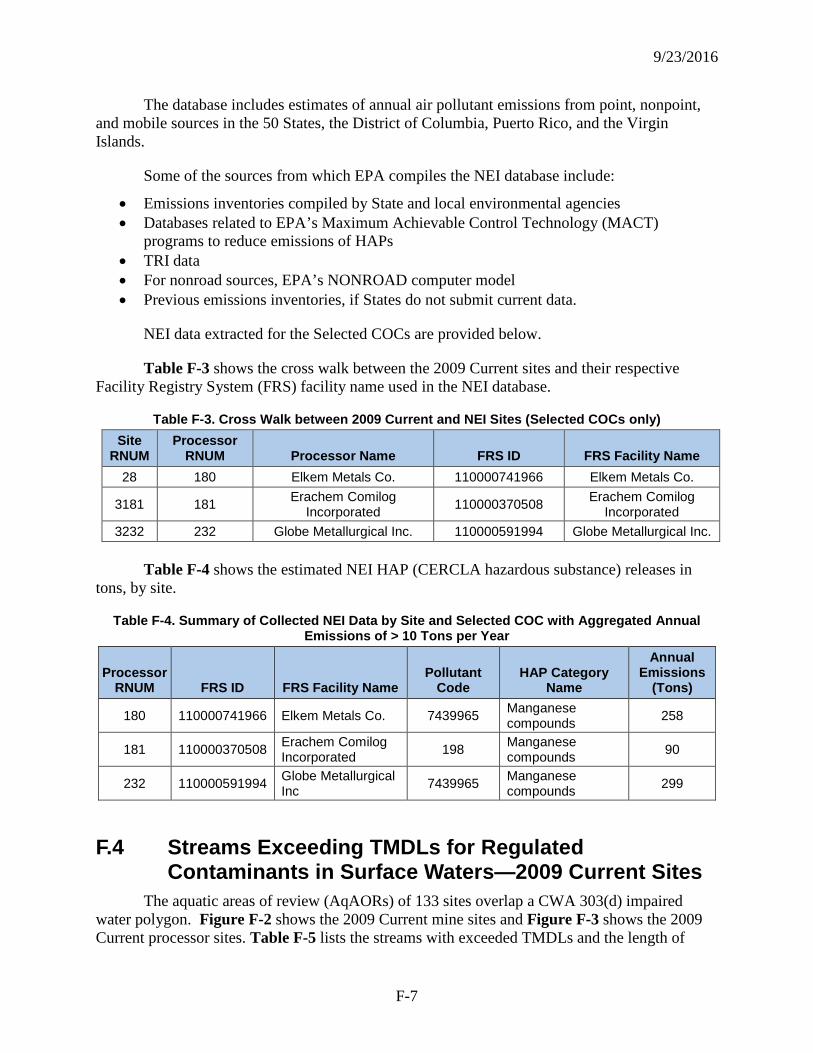
9/23/2016
F-7
The database includes estimates of annual air pollutant emissions from point, nonpoint, and mobile sources in the 50 States, the District of Columbia, Puerto Rico, and the Virgin Islands.
Some of the sources from which EPA compiles the NEI database include:
• Emissions inventories compiled by State and local environmental agencies • Databases related to EPA’s Maximum Achievable Control Technology (MACT)
programs to reduce emissions of HAPs • TRI data • For nonroad sources, EPA’s NONROAD computer model • Previous emissions inventories, if States do not submit current data.
NEI data extracted for the Selected COCs are provided below.
Table F-3 shows the cross walk between the 2009 Current sites and their respective Facility Registry System (FRS) facility name used in the NEI database.
Table F-3. Cross Walk between 2009 Current and NEI Sites (Selected COCs only) Site
RNUM Processor
RNUM Processor Name FRS ID FRS Facility Name 28 180 Elkem Metals Co. 110000741966 Elkem Metals Co.
3181 181 Erachem Comilog Incorporated 110000370508 Erachem Comilog
Incorporated 3232 232 Globe Metallurgical Inc. 110000591994 Globe Metallurgical Inc.
Table F-4 shows the estimated NEI HAP (CERCLA hazardous substance) releases in
tons, by site.
Table F-4. Summary of Collected NEI Data by Site and Selected COC with Aggregated Annual Emissions of > 10 Tons per Year
Processor RNUM FRS ID FRS Facility Name
Pollutant Code
HAP Category Name
Annual Emissions
(Tons)
180 110000741966 Elkem Metals Co. 7439965 Manganese compounds 258
181 110000370508 Erachem Comilog Incorporated 198 Manganese
compounds 90
232 110000591994 Globe Metallurgical Inc 7439965 Manganese
compounds 299
F.4 Streams Exceeding TMDLs for Regulated Contaminants in Surface Waters—2009 Current Sites
The aquatic areas of review (AqAORs) of 133 sites overlap a CWA 303(d) impaired water polygon. Figure F-2 shows the 2009 Current mine sites and Figure F-3 shows the 2009 Current processor sites. Table F-5 lists the streams with exceeded TMDLs and the length of
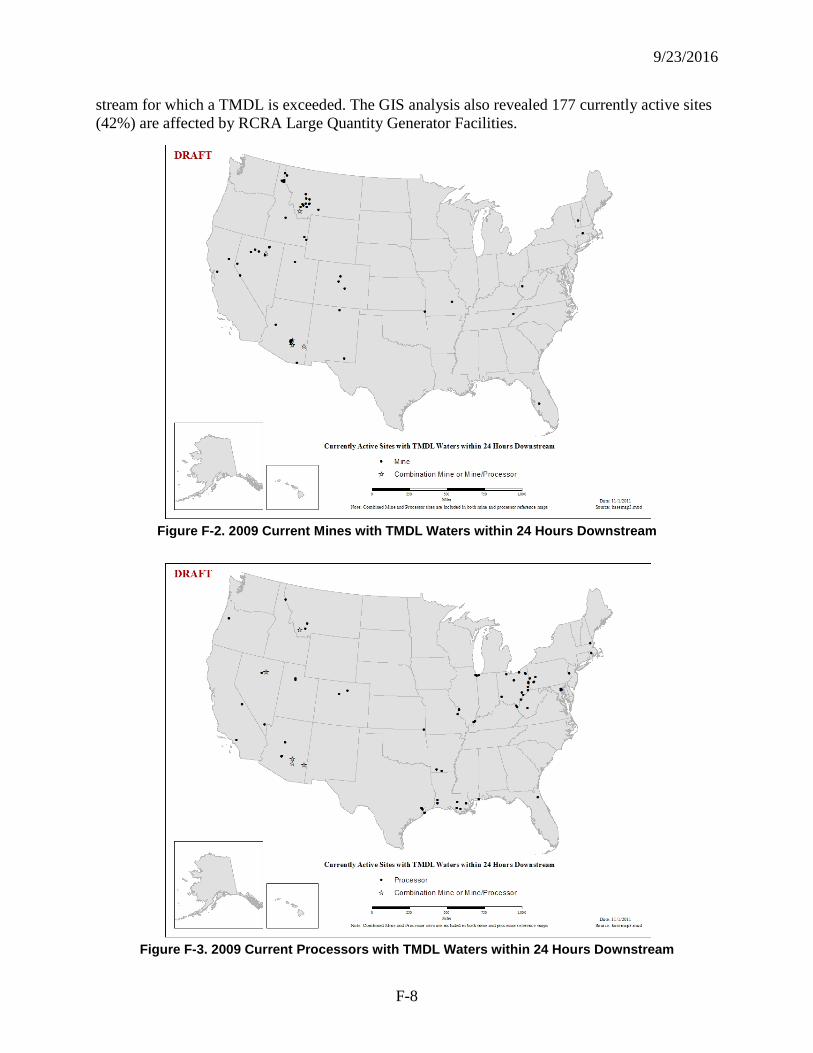
9/23/2016
F-8
stream for which a TMDL is exceeded. The GIS analysis also revealed 177 currently active sites (42%) are affected by RCRA Large Quantity Generator Facilities.
Figure F-2. 2009 Current Mines with TMDL Waters within 24 Hours Downstream
Figure F-3. 2009 Current Processors with TMDL Waters within 24 Hours Downstream
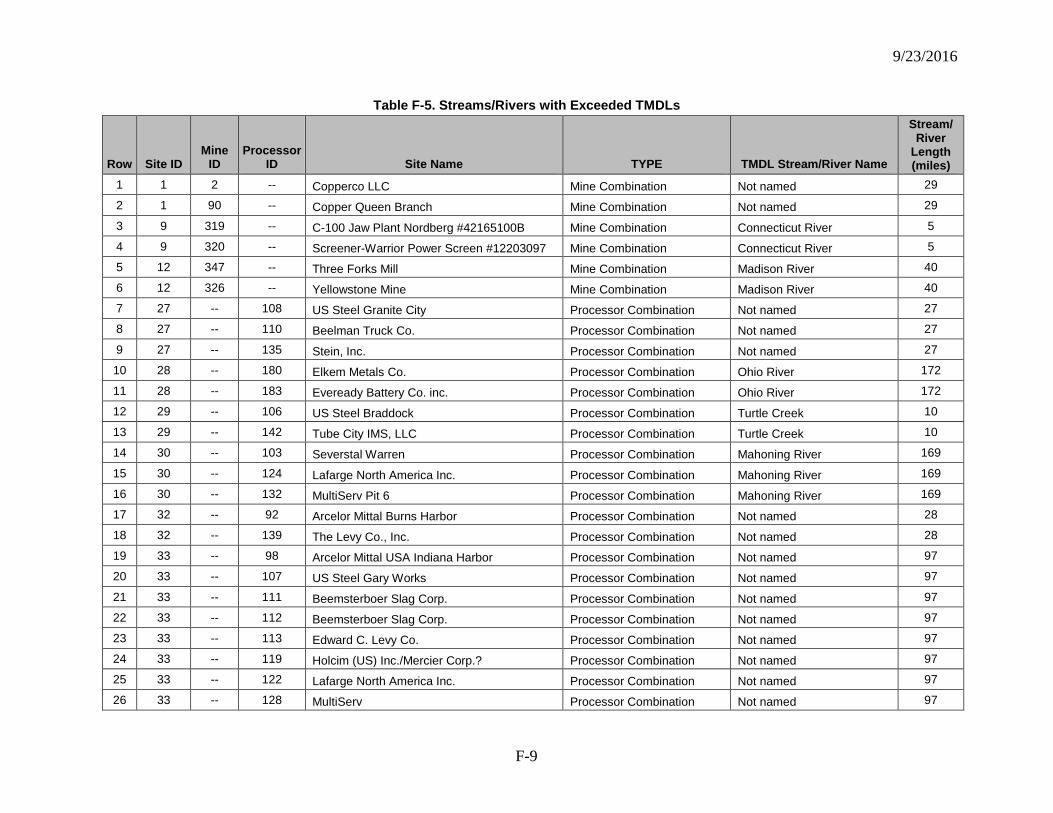
9/23/2016
F-9
Table F-5. Streams/Rivers with Exceeded TMDLs
Row Site ID Mine
ID Processor
ID Site Name TYPE TMDL Stream/River Name
Stream/ River
Length (miles)
1 1 2 -- Copperco LLC Mine Combination Not named 29
2 1 90 -- Copper Queen Branch Mine Combination Not named 29
3 9 319 -- C-100 Jaw Plant Nordberg #42165100B Mine Combination Connecticut River 5
4 9 320 -- Screener-Warrior Power Screen #12203097 Mine Combination Connecticut River 5
5 12 347 -- Three Forks Mill Mine Combination Madison River 40
6 12 326 -- Yellowstone Mine Mine Combination Madison River 40
7 27 -- 108 US Steel Granite City Processor Combination Not named 27
8 27 -- 110 Beelman Truck Co. Processor Combination Not named 27
9 27 -- 135 Stein, Inc. Processor Combination Not named 27
10 28 -- 180 Elkem Metals Co. Processor Combination Ohio River 172
11 28 -- 183 Eveready Battery Co. inc. Processor Combination Ohio River 172
12 29 -- 106 US Steel Braddock Processor Combination Turtle Creek 10
13 29 -- 142 Tube City IMS, LLC Processor Combination Turtle Creek 10
14 30 -- 103 Severstal Warren Processor Combination Mahoning River 169
15 30 -- 124 Lafarge North America Inc. Processor Combination Mahoning River 169
16 30 -- 132 MultiServ Pit 6 Processor Combination Mahoning River 169
17 32 -- 92 Arcelor Mittal Burns Harbor Processor Combination Not named 28
18 32 -- 139 The Levy Co., Inc. Processor Combination Not named 28
19 33 -- 98 Arcelor Mittal USA Indiana Harbor Processor Combination Not named 97
20 33 -- 107 US Steel Gary Works Processor Combination Not named 97
21 33 -- 111 Beemsterboer Slag Corp. Processor Combination Not named 97
22 33 -- 112 Beemsterboer Slag Corp. Processor Combination Not named 97
23 33 -- 113 Edward C. Levy Co. Processor Combination Not named 97
24 33 -- 119 Holcim (US) Inc./Mercier Corp.? Processor Combination Not named 97
25 33 -- 122 Lafarge North America Inc. Processor Combination Not named 97
26 33 -- 128 MultiServ Processor Combination Not named 97

9/23/2016
F-10
Row Site ID Mine
ID Processor
ID Site Name TYPE TMDL Stream/River Name
Stream/ River
Length (miles)
27 33 -- 140 The Levy Co., Inc. Processor Combination Not named 97
28 33 -- 141 Tube City IMS, LLC Processor Combination Not named 97
29 33 -- 144 U.S. Aggregates, Inc. Processor Combination Not named 97
30 34 -- 96 Arcelor Mittal Riverdale Processor Combination Calumet Sag Channel 70
31 34 -- 127 MultiServ Processor Combination Calumet Sag Channel 70
32 34 -- 134 Phoenix Services LLC/listed as Hasarco MultiServ Pit 27? Processor Combination Calumet Sag Channel 70
33 1002 325 -- Barretts Mill Mine Processor Combination Beaverhead River 116
34 1002 -- 274 Specialty Minerals Inc. (Barretts Minerals) Mine Processor Combination Beaverhead River 116
35 1005 78 -- Freeport-McMoRan Miami Inc. Mine Processor Combination Pinto Creek 54
36 1005 -- 67 Copper Cities Unit Mine Processor Combination Pinto Creek 54
37 1011 308 -- Freeport McMoRan Morenci Inc. Mine Processor Combination San Francisco River 36
38 1011 -- 199 Phelps-Dodge Morenci Mine Processor Combination San Francisco River 36
39 1013 84 -- Hayden Concentrator Mine Processor Combination Gila River 0.07
40 1013 -- 66 Asarco, LLC - Hayden Mine Processor Combination Gila River 0.07
41 1017 175 -- Chukar Mine Processor Combination Humboldt River 68
42 1017 210 -- SOUTH AREA Mine Processor Combination Humboldt River 68
43 1017 -- 82 Mill 6 Mine Processor Combination Humboldt River 68
44 2007 7 -- Sixteen To One Mine Mine Kanaka Creek 15
45 2013 13 -- Sunshine Mine Mine Big Creek 4
46 2014 14 -- BUNKER HILL MINE Mine Coeur d'Alene River 38
47 2016 16 -- Golden Chest Project Mine Prichard Creek 21
48 2029 29 -- Montana Tunnels Mining Inc Mine Prickly Pear Creek 36
49 2031 31 -- Montanore Project Mine Libby Creek 15
50 2052 52 -- Resolution Mine Mine Queen Creek 14
51 2079 79 -- Freeport-McMoRan Bagdad Inc Mine Boulder Creek 4
52 2080 80 -- Ray Mine Mineral Creek 14
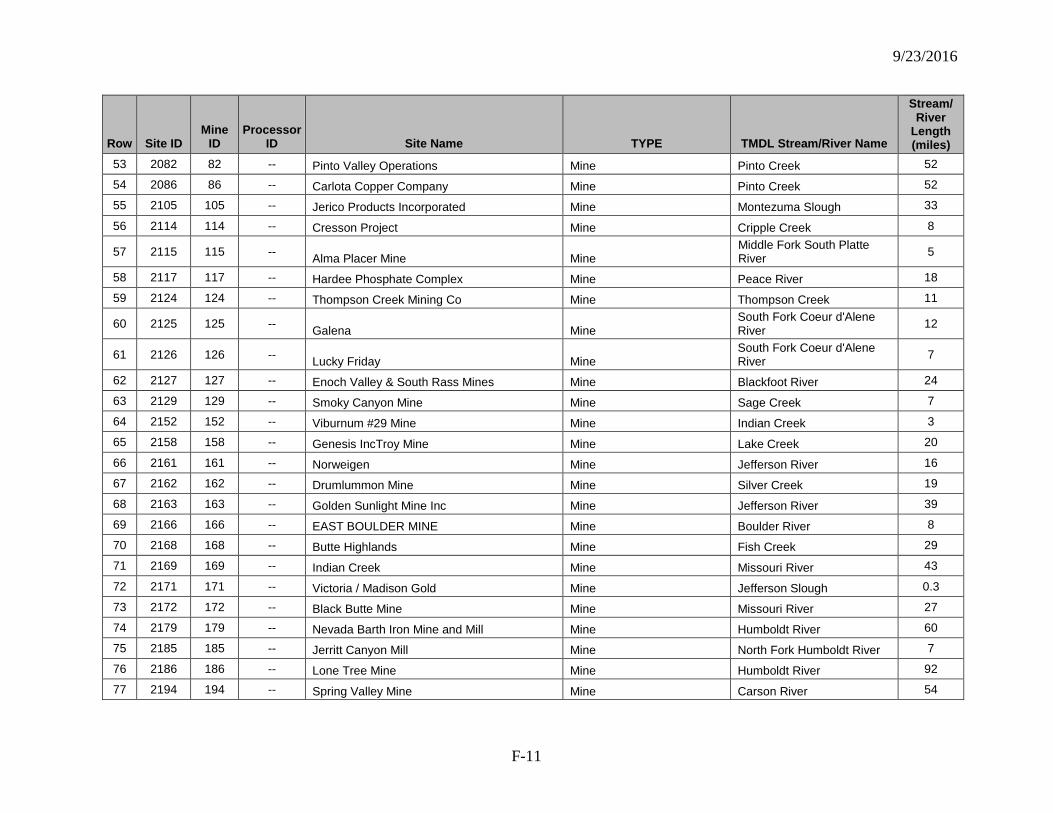
9/23/2016
F-11
Row Site ID Mine
ID Processor
ID Site Name TYPE TMDL Stream/River Name
Stream/ River
Length (miles)
53 2082 82 -- Pinto Valley Operations Mine Pinto Creek 52
54 2086 86 -- Carlota Copper Company Mine Pinto Creek 52
55 2105 105 -- Jerico Products Incorporated Mine Montezuma Slough 33
56 2114 114 -- Cresson Project Mine Cripple Creek 8
57 2115 115 -- Alma Placer Mine Mine Middle Fork South Platte River 5
58 2117 117 -- Hardee Phosphate Complex Mine Peace River 18
59 2124 124 -- Thompson Creek Mining Co Mine Thompson Creek 11
60 2125 125 -- Galena Mine South Fork Coeur d'Alene River 12
61 2126 126 -- Lucky Friday Mine South Fork Coeur d'Alene River 7
62 2127 127 -- Enoch Valley & South Rass Mines Mine Blackfoot River 24
63 2129 129 -- Smoky Canyon Mine Mine Sage Creek 7
64 2152 152 -- Viburnum #29 Mine Mine Indian Creek 3
65 2158 158 -- Genesis IncTroy Mine Mine Lake Creek 20
66 2161 161 -- Norweigen Mine Jefferson River 16
67 2162 162 -- Drumlummon Mine Mine Silver Creek 19
68 2163 163 -- Golden Sunlight Mine Inc Mine Jefferson River 39
69 2166 166 -- EAST BOULDER MINE Mine Boulder River 8
70 2168 168 -- Butte Highlands Mine Fish Creek 29
71 2169 169 -- Indian Creek Mine Missouri River 43
72 2171 171 -- Victoria / Madison Gold Mine Jefferson Slough 0.3
73 2172 172 -- Black Butte Mine Mine Missouri River 27
74 2179 179 -- Nevada Barth Iron Mine and Mill Mine Humboldt River 60
75 2185 185 -- Jerritt Canyon Mill Mine North Fork Humboldt River 7
76 2186 186 -- Lone Tree Mine Mine Humboldt River 92
77 2194 194 -- Spring Valley Mine Mine Carson River 54
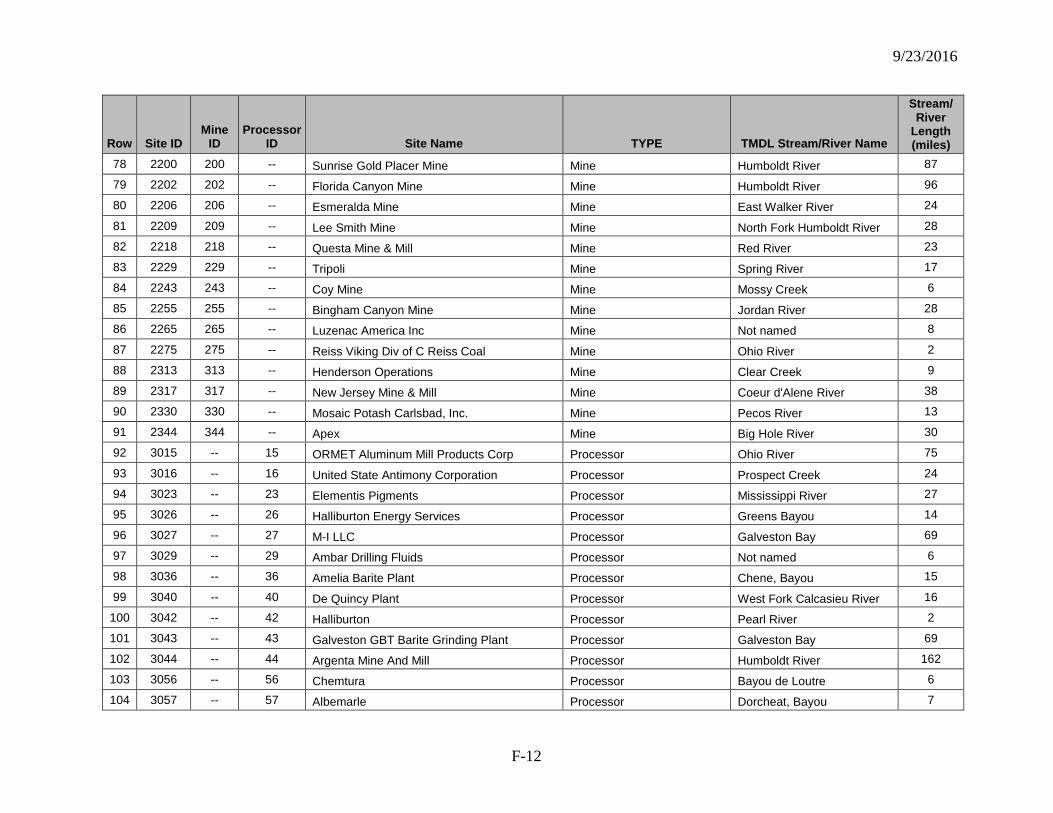
9/23/2016
F-12
Row Site ID Mine
ID Processor
ID Site Name TYPE TMDL Stream/River Name
Stream/ River
Length (miles)
78 2200 200 -- Sunrise Gold Placer Mine Mine Humboldt River 87
79 2202 202 -- Florida Canyon Mine Mine Humboldt River 96
80 2206 206 -- Esmeralda Mine Mine East Walker River 24
81 2209 209 -- Lee Smith Mine Mine North Fork Humboldt River 28
82 2218 218 -- Questa Mine & Mill Mine Red River 23
83 2229 229 -- Tripoli Mine Spring River 17
84 2243 243 -- Coy Mine Mine Mossy Creek 6
85 2255 255 -- Bingham Canyon Mine Mine Jordan River 28
86 2265 265 -- Luzenac America Inc Mine Not named 8
87 2275 275 -- Reiss Viking Div of C Reiss Coal Mine Ohio River 2
88 2313 313 -- Henderson Operations Mine Clear Creek 9
89 2317 317 -- New Jersey Mine & Mill Mine Coeur d'Alene River 38
90 2330 330 -- Mosaic Potash Carlsbad, Inc. Mine Pecos River 13
91 2344 344 -- Apex Mine Big Hole River 30
92 3015 -- 15 ORMET Aluminum Mill Products Corp Processor Ohio River 75
93 3016 -- 16 United State Antimony Corporation Processor Prospect Creek 24
94 3023 -- 23 Elementis Pigments Processor Mississippi River 27
95 3026 -- 26 Halliburton Energy Services Processor Greens Bayou 14
96 3027 -- 27 M-I LLC Processor Galveston Bay 69
97 3029 -- 29 Ambar Drilling Fluids Processor Not named 6
98 3036 -- 36 Amelia Barite Plant Processor Chene, Bayou 15
99 3040 -- 40 De Quincy Plant Processor West Fork Calcasieu River 16
100 3042 -- 42 Halliburton Processor Pearl River 2
101 3043 -- 43 Galveston GBT Barite Grinding Plant Processor Galveston Bay 69
102 3044 -- 44 Argenta Mine And Mill Processor Humboldt River 162
103 3056 -- 56 Chemtura Processor Bayou de Loutre 6
104 3057 -- 57 Albemarle Processor Dorcheat, Bayou 7
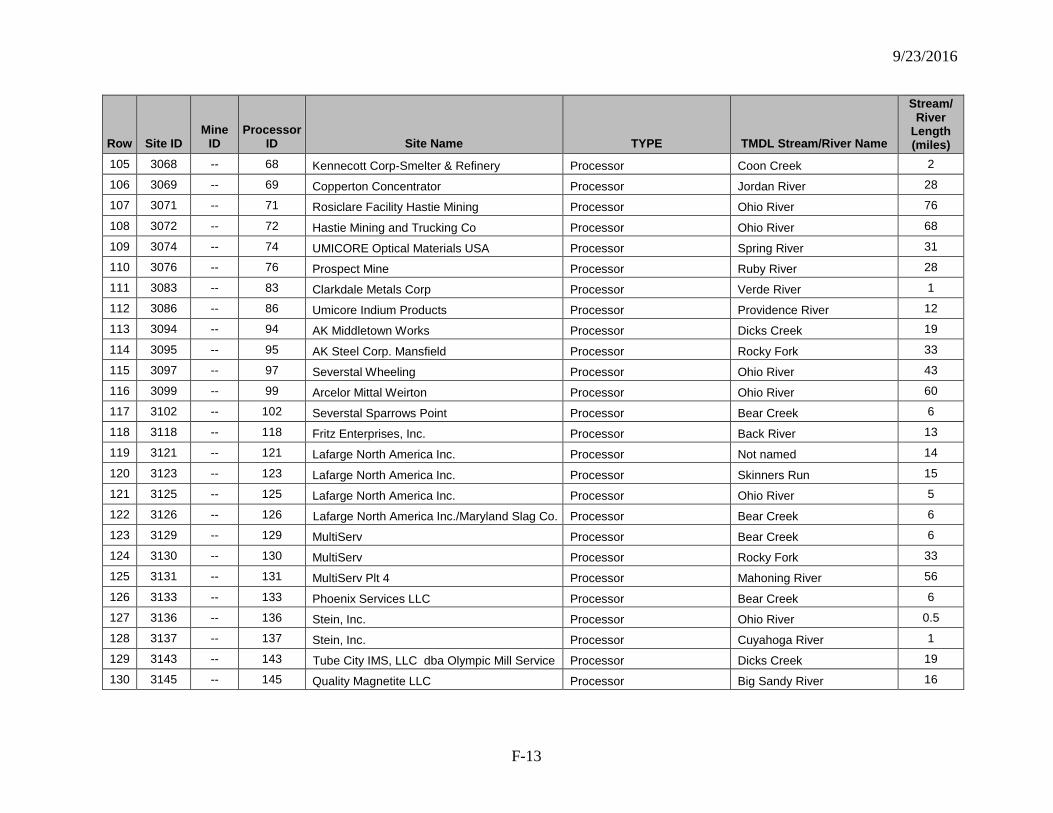
9/23/2016
F-13
Row Site ID Mine
ID Processor
ID Site Name TYPE TMDL Stream/River Name
Stream/ River
Length (miles)
105 3068 -- 68 Kennecott Corp-Smelter & Refinery Processor Coon Creek 2
106 3069 -- 69 Copperton Concentrator Processor Jordan River 28
107 3071 -- 71 Rosiclare Facility Hastie Mining Processor Ohio River 76
108 3072 -- 72 Hastie Mining and Trucking Co Processor Ohio River 68
109 3074 -- 74 UMICORE Optical Materials USA Processor Spring River 31
110 3076 -- 76 Prospect Mine Processor Ruby River 28
111 3083 -- 83 Clarkdale Metals Corp Processor Verde River 1
112 3086 -- 86 Umicore Indium Products Processor Providence River 12
113 3094 -- 94 AK Middletown Works Processor Dicks Creek 19
114 3095 -- 95 AK Steel Corp. Mansfield Processor Rocky Fork 33
115 3097 -- 97 Severstal Wheeling Processor Ohio River 43
116 3099 -- 99 Arcelor Mittal Weirton Processor Ohio River 60
117 3102 -- 102 Severstal Sparrows Point Processor Bear Creek 6
118 3118 -- 118 Fritz Enterprises, Inc. Processor Back River 13
119 3121 -- 121 Lafarge North America Inc. Processor Not named 14
120 3123 -- 123 Lafarge North America Inc. Processor Skinners Run 15
121 3125 -- 125 Lafarge North America Inc. Processor Ohio River 5
122 3126 -- 126 Lafarge North America Inc./Maryland Slag Co. Processor Bear Creek 6
123 3129 -- 129 MultiServ Processor Bear Creek 6
124 3130 -- 130 MultiServ Processor Rocky Fork 33
125 3131 -- 131 MultiServ Plt 4 Processor Mahoning River 56
126 3133 -- 133 Phoenix Services LLC Processor Bear Creek 6
127 3136 -- 136 Stein, Inc. Processor Ohio River 0.5
128 3137 -- 137 Stein, Inc. Processor Cuyahoga River 1
129 3143 -- 143 Tube City IMS, LLC dba Olympic Mill Service Processor Dicks Creek 19
130 3145 -- 145 Quality Magnetite LLC Processor Big Sandy River 16
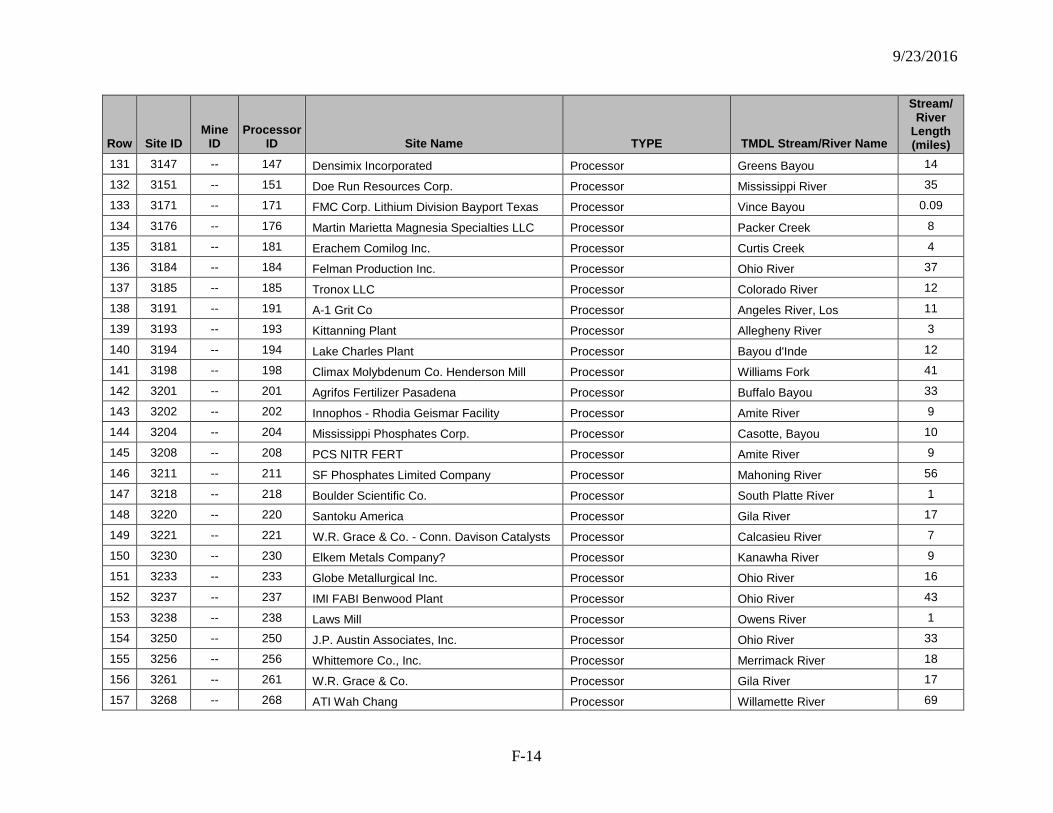
9/23/2016
F-14
Row Site ID Mine
ID Processor
ID Site Name TYPE TMDL Stream/River Name
Stream/ River
Length (miles)
131 3147 -- 147 Densimix Incorporated Processor Greens Bayou 14
132 3151 -- 151 Doe Run Resources Corp. Processor Mississippi River 35
133 3171 -- 171 FMC Corp. Lithium Division Bayport Texas Processor Vince Bayou 0.09
134 3176 -- 176 Martin Marietta Magnesia Specialties LLC Processor Packer Creek 8
135 3181 -- 181 Erachem Comilog Inc. Processor Curtis Creek 4
136 3184 -- 184 Felman Production Inc. Processor Ohio River 37
137 3185 -- 185 Tronox LLC Processor Colorado River 12
138 3191 -- 191 A-1 Grit Co Processor Angeles River, Los 11
139 3193 -- 193 Kittanning Plant Processor Allegheny River 3
140 3194 -- 194 Lake Charles Plant Processor Bayou d'Inde 12
141 3198 -- 198 Climax Molybdenum Co. Henderson Mill Processor Williams Fork 41
142 3201 -- 201 Agrifos Fertilizer Pasadena Processor Buffalo Bayou 33
143 3202 -- 202 Innophos - Rhodia Geismar Facility Processor Amite River 9
144 3204 -- 204 Mississippi Phosphates Corp. Processor Casotte, Bayou 10
145 3208 -- 208 PCS NITR FERT Processor Amite River 9
146 3211 -- 211 SF Phosphates Limited Company Processor Mahoning River 56
147 3218 -- 218 Boulder Scientific Co. Processor South Platte River 1
148 3220 -- 220 Santoku America Processor Gila River 17
149 3221 -- 221 W.R. Grace & Co. - Conn. Davison Catalysts Processor Calcasieu River 7
150 3230 -- 230 Elkem Metals Company? Processor Kanawha River 9
151 3233 -- 233 Globe Metallurgical Inc. Processor Ohio River 16
152 3237 -- 237 IMI FABI Benwood Plant Processor Ohio River 43
153 3238 -- 238 Laws Mill Processor Owens River 1
154 3250 -- 250 J.P. Austin Associates, Inc. Processor Ohio River 33
155 3256 -- 256 Whittemore Co., Inc. Processor Merrimack River 18
156 3261 -- 261 W.R. Grace & Co. Processor Gila River 17
157 3268 -- 268 ATI Wah Chang Processor Willamette River 69
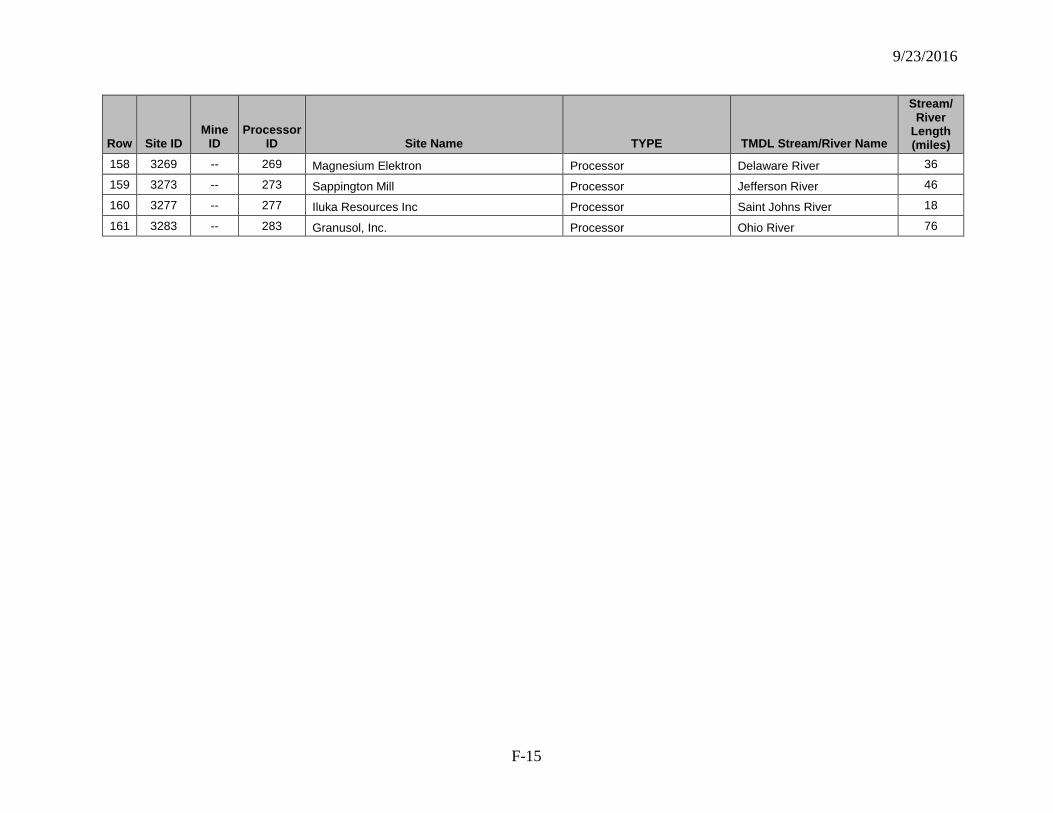
9/23/2016
F-15
Row Site ID Mine
ID Processor
ID Site Name TYPE TMDL Stream/River Name
Stream/ River
Length (miles)
158 3269 -- 269 Magnesium Elektron Processor Delaware River 36
159 3273 -- 273 Sappington Mill Processor Jefferson River 46
160 3277 -- 277 Iluka Resources Inc Processor Saint Johns River 18
161 3283 -- 283 Granusol, Inc. Processor Ohio River 76

9/23/2016
F-16
References U.S. EPA (U.S. Environmental Protection Agency). 2011. Toxics Release Inventory (TRI)
Program “Basic Information” Webpage: [Available at: https://www.epa.gov/toxics-release-inventory-tri-program]. Last updated: Wednesday, October 26, 2011.
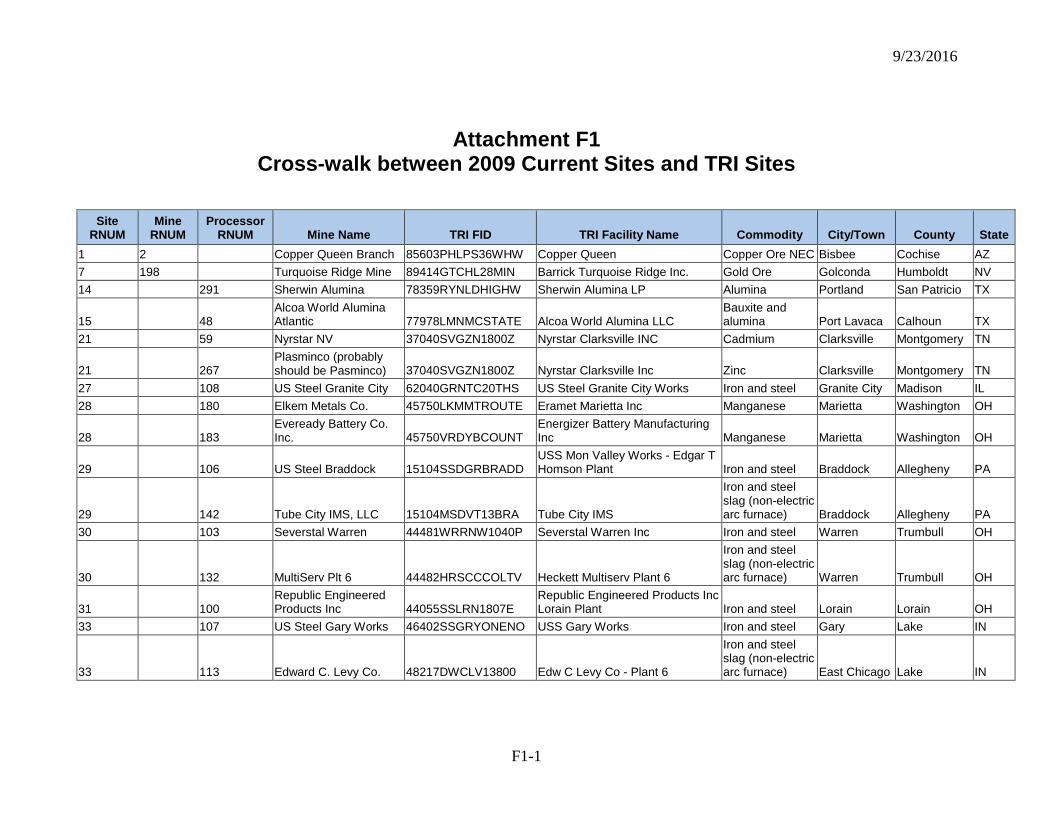
9/23/2016
F1-1
Attachment F1 Cross-walk between 2009 Current Sites and TRI Sites
Site
RNUM Mine
RNUM Processor
RNUM Mine Name TRI FID TRI Facility Name Commodity City/Town County State 1 2 Copper Queen Branch 85603PHLPS36WHW Copper Queen Copper Ore NEC Bisbee Cochise AZ 7 198 Turquoise Ridge Mine 89414GTCHL28MIN Barrick Turquoise Ridge Inc. Gold Ore Golconda Humboldt NV 14 291 Sherwin Alumina 78359RYNLDHIGHW Sherwin Alumina LP Alumina Portland San Patricio TX
15 48 Alcoa World Alumina Atlantic 77978LMNMCSTATE Alcoa World Alumina LLC
Bauxite and alumina Port Lavaca Calhoun TX
21 59 Nyrstar NV 37040SVGZN1800Z Nyrstar Clarksville INC Cadmium Clarksville Montgomery TN
21 267 Plasminco (probably should be Pasminco) 37040SVGZN1800Z Nyrstar Clarksville Inc Zinc Clarksville Montgomery TN
27 108 US Steel Granite City 62040GRNTC20THS US Steel Granite City Works Iron and steel Granite City Madison IL 28 180 Elkem Metals Co. 45750LKMMTROUTE Eramet Marietta Inc Manganese Marietta Washington OH
28 183 Eveready Battery Co. Inc. 45750VRDYBCOUNT
Energizer Battery Manufacturing Inc Manganese Marietta Washington OH
29 106 US Steel Braddock 15104SSDGRBRADD USS Mon Valley Works - Edgar T Homson Plant Iron and steel Braddock Allegheny PA
29 142 Tube City IMS, LLC 15104MSDVT13BRA Tube City IMS
Iron and steel slag (non-electric arc furnace) Braddock Allegheny PA
30 103 Severstal Warren 44481WRRNW1040P Severstal Warren Inc Iron and steel Warren Trumbull OH
30 132 MultiServ Plt 6 44482HRSCCCOLTV Heckett Multiserv Plant 6
Iron and steel slag (non-electric arc furnace) Warren Trumbull OH
31 100 Republic Engineered Products Inc 44055SSLRN1807E
Republic Engineered Products Inc Lorain Plant Iron and steel Lorain Lorain OH
33 107 US Steel Gary Works 46402SSGRYONENO USS Gary Works Iron and steel Gary Lake IN
33 113 Edward C. Levy Co. 48217DWCLV13800 Edw C Levy Co - Plant 6
Iron and steel slag (non-electric arc furnace) East Chicago Lake IN
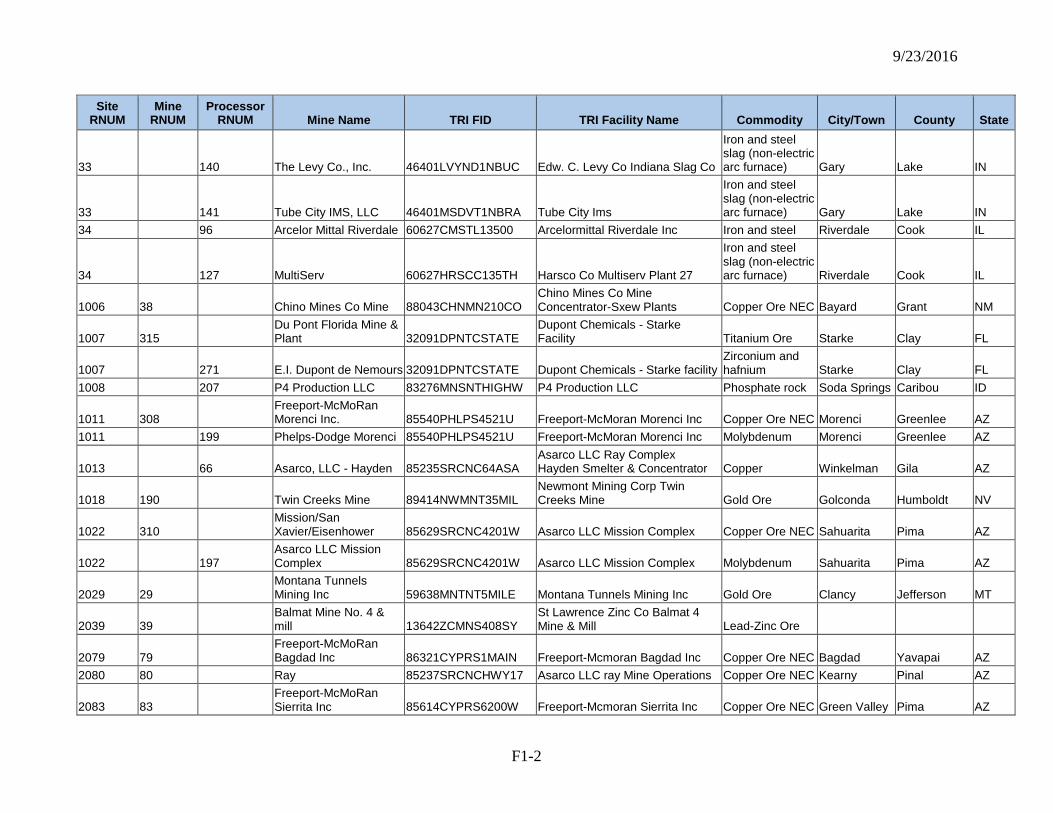
9/23/2016
F1-2
Site RNUM
Mine RNUM
Processor RNUM Mine Name TRI FID TRI Facility Name Commodity City/Town County State
33 140 The Levy Co., Inc. 46401LVYND1NBUC Edw. C. Levy Co Indiana Slag Co
Iron and steel slag (non-electric arc furnace) Gary Lake IN
33 141 Tube City IMS, LLC 46401MSDVT1NBRA Tube City Ims
Iron and steel slag (non-electric arc furnace) Gary Lake IN
34 96 Arcelor Mittal Riverdale 60627CMSTL13500 Arcelormittal Riverdale Inc Iron and steel Riverdale Cook IL
34 127 MultiServ 60627HRSCC135TH Harsco Co Multiserv Plant 27
Iron and steel slag (non-electric arc furnace) Riverdale Cook IL
1006 38 Chino Mines Co Mine 88043CHNMN210CO Chino Mines Co Mine Concentrator-Sxew Plants Copper Ore NEC Bayard Grant NM
1007 315 Du Pont Florida Mine & Plant 32091DPNTCSTATE
Dupont Chemicals - Starke Facility Titanium Ore Starke Clay FL
1007 271 E.I. Dupont de Nemours 32091DPNTCSTATE Dupont Chemicals - Starke facility Zirconium and hafnium Starke Clay FL
1008 207 P4 Production LLC 83276MNSNTHIGHW P4 Production LLC Phosphate rock Soda Springs Caribou ID
1011 308 Freeport-McMoRan Morenci Inc. 85540PHLPS4521U Freeport-McMoran Morenci Inc Copper Ore NEC Morenci Greenlee AZ
1011 199 Phelps-Dodge Morenci 85540PHLPS4521U Freeport-McMoran Morenci Inc Molybdenum Morenci Greenlee AZ
1013 66 Asarco, LLC - Hayden 85235SRCNC64ASA Asarco LLC Ray Complex Hayden Smelter & Concentrator Copper Winkelman Gila AZ
1018 190 Twin Creeks Mine 89414NWMNT35MIL Newmont Mining Corp Twin Creeks Mine Gold Ore Golconda Humboldt NV
1022 310 Mission/San Xavier/Eisenhower 85629SRCNC4201W Asarco LLC Mission Complex Copper Ore NEC Sahuarita Pima AZ
1022 197 Asarco LLC Mission Complex 85629SRCNC4201W Asarco LLC Mission Complex Molybdenum Sahuarita Pima AZ
2029 29 Montana Tunnels Mining Inc 59638MNTNT5MILE Montana Tunnels Mining Inc Gold Ore Clancy Jefferson MT
2039 39 Balmat Mine No. 4 & mill 13642ZCMNS408SY
St Lawrence Zinc Co Balmat 4 Mine & Mill Lead-Zinc Ore
2079 79 Freeport-McMoRan Bagdad Inc 86321CYPRS1MAIN Freeport-Mcmoran Bagdad Inc Copper Ore NEC Bagdad Yavapai AZ
2080 80 Ray 85237SRCNCHWY17 Asarco LLC ray Mine Operations Copper Ore NEC Kearny Pinal AZ
2083 83 Freeport-McMoRan Sierrita Inc 85614CYPRS6200W Freeport-Mcmoran Sierrita Inc Copper Ore NEC Green Valley Pima AZ
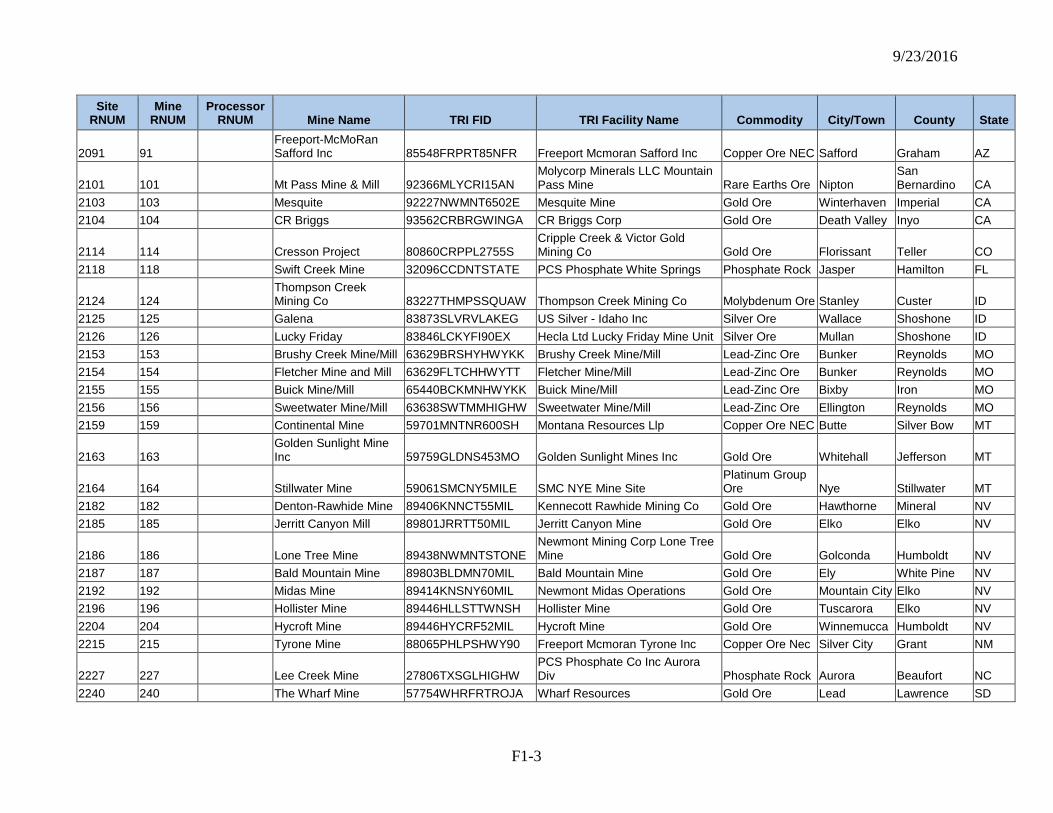
9/23/2016
F1-3
Site RNUM
Mine RNUM
Processor RNUM Mine Name TRI FID TRI Facility Name Commodity City/Town County State
2091 91 Freeport-McMoRan Safford Inc 85548FRPRT85NFR Freeport Mcmoran Safford Inc Copper Ore NEC Safford Graham AZ
2101 101 Mt Pass Mine & Mill 92366MLYCRI15AN Molycorp Minerals LLC Mountain Pass Mine Rare Earths Ore Nipton
San Bernardino CA
2103 103 Mesquite 92227NWMNT6502E Mesquite Mine Gold Ore Winterhaven Imperial CA 2104 104 CR Briggs 93562CRBRGWINGA CR Briggs Corp Gold Ore Death Valley Inyo CA
2114 114 Cresson Project 80860CRPPL2755S Cripple Creek & Victor Gold Mining Co Gold Ore Florissant Teller CO
2118 118 Swift Creek Mine 32096CCDNTSTATE PCS Phosphate White Springs Phosphate Rock Jasper Hamilton FL
2124 124 Thompson Creek Mining Co 83227THMPSSQUAW Thompson Creek Mining Co Molybdenum Ore Stanley Custer ID
2125 125 Galena 83873SLVRVLAKEG US Silver - Idaho Inc Silver Ore Wallace Shoshone ID 2126 126 Lucky Friday 83846LCKYFI90EX Hecla Ltd Lucky Friday Mine Unit Silver Ore Mullan Shoshone ID 2153 153 Brushy Creek Mine/Mill 63629BRSHYHWYKK Brushy Creek Mine/Mill Lead-Zinc Ore Bunker Reynolds MO 2154 154 Fletcher Mine and Mill 63629FLTCHHWYTT Fletcher Mine/Mill Lead-Zinc Ore Bunker Reynolds MO 2155 155 Buick Mine/Mill 65440BCKMNHWYKK Buick Mine/Mill Lead-Zinc Ore Bixby Iron MO 2156 156 Sweetwater Mine/Mill 63638SWTMMHIGHW Sweetwater Mine/Mill Lead-Zinc Ore Ellington Reynolds MO 2159 159 Continental Mine 59701MNTNR600SH Montana Resources Llp Copper Ore NEC Butte Silver Bow MT
2163 163 Golden Sunlight Mine Inc 59759GLDNS453MO Golden Sunlight Mines Inc Gold Ore Whitehall Jefferson MT
2164 164 Stillwater Mine 59061SMCNY5MILE SMC NYE Mine Site Platinum Group Ore Nye Stillwater MT
2182 182 Denton-Rawhide Mine 89406KNNCT55MIL Kennecott Rawhide Mining Co Gold Ore Hawthorne Mineral NV 2185 185 Jerritt Canyon Mill 89801JRRTT50MIL Jerritt Canyon Mine Gold Ore Elko Elko NV
2186 186 Lone Tree Mine 89438NWMNTSTONE Newmont Mining Corp Lone Tree Mine Gold Ore Golconda Humboldt NV
2187 187 Bald Mountain Mine 89803BLDMN70MIL Bald Mountain Mine Gold Ore Ely White Pine NV 2192 192 Midas Mine 89414KNSNY60MIL Newmont Midas Operations Gold Ore Mountain City Elko NV 2196 196 Hollister Mine 89446HLLSTTWNSH Hollister Mine Gold Ore Tuscarora Elko NV 2204 204 Hycroft Mine 89446HYCRF52MIL Hycroft Mine Gold Ore Winnemucca Humboldt NV 2215 215 Tyrone Mine 88065PHLPSHWY90 Freeport Mcmoran Tyrone Inc Copper Ore Nec Silver City Grant NM
2227 227 Lee Creek Mine 27806TXSGLHIGHW PCS Phosphate Co Inc Aurora Div Phosphate Rock Aurora Beaufort NC
2240 240 The Wharf Mine 57754WHRFRTROJA Wharf Resources Gold Ore Lead Lawrence SD
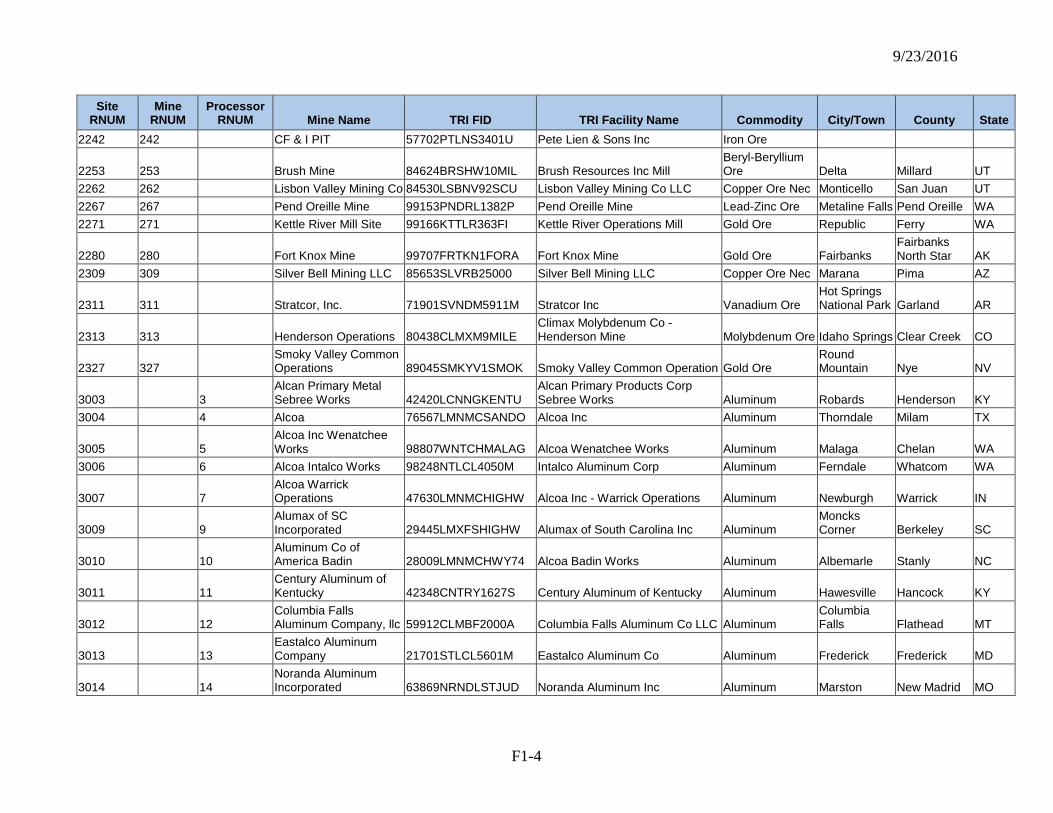
9/23/2016
F1-4
Site RNUM
Mine RNUM
Processor RNUM Mine Name TRI FID TRI Facility Name Commodity City/Town County State
2242 242 CF & I PIT 57702PTLNS3401U Pete Lien & Sons Inc Iron Ore
2253 253 Brush Mine 84624BRSHW10MIL Brush Resources Inc Mill Beryl-Beryllium Ore Delta Millard UT
2262 262 Lisbon Valley Mining Co 84530LSBNV92SCU Lisbon Valley Mining Co LLC Copper Ore Nec Monticello San Juan UT 2267 267 Pend Oreille Mine 99153PNDRL1382P Pend Oreille Mine Lead-Zinc Ore Metaline Falls Pend Oreille WA 2271 271 Kettle River Mill Site 99166KTTLR363FI Kettle River Operations Mill Gold Ore Republic Ferry WA
2280 280 Fort Knox Mine 99707FRTKN1FORA Fort Knox Mine Gold Ore Fairbanks Fairbanks North Star AK
2309 309 Silver Bell Mining LLC 85653SLVRB25000 Silver Bell Mining LLC Copper Ore Nec Marana Pima AZ
2311 311 Stratcor, Inc. 71901SVNDM5911M Stratcor Inc Vanadium Ore Hot Springs National Park Garland AR
2313 313 Henderson Operations 80438CLMXM9MILE Climax Molybdenum Co - Henderson Mine Molybdenum Ore Idaho Springs Clear Creek CO
2327 327 Smoky Valley Common Operations 89045SMKYV1SMOK Smoky Valley Common Operation Gold Ore
Round Mountain Nye NV
3003 3 Alcan Primary Metal Sebree Works 42420LCNNGKENTU
Alcan Primary Products Corp Sebree Works Aluminum Robards Henderson KY
3004 4 Alcoa 76567LMNMCSANDO Alcoa Inc Aluminum Thorndale Milam TX
3005 5 Alcoa Inc Wenatchee Works 98807WNTCHMALAG Alcoa Wenatchee Works Aluminum Malaga Chelan WA
3006 6 Alcoa Intalco Works 98248NTLCL4050M Intalco Aluminum Corp Aluminum Ferndale Whatcom WA
3007 7 Alcoa Warrick Operations 47630LMNMCHIGHW Alcoa Inc - Warrick Operations Aluminum Newburgh Warrick IN
3009 9 Alumax of SC Incorporated 29445LMXFSHIGHW Alumax of South Carolina Inc Aluminum
Moncks Corner Berkeley SC
3010 10 Aluminum Co of America Badin 28009LMNMCHWY74 Alcoa Badin Works Aluminum Albemarle Stanly NC
3011 11 Century Aluminum of Kentucky 42348CNTRY1627S Century Aluminum of Kentucky Aluminum Hawesville Hancock KY
3012 12 Columbia Falls Aluminum Company, llc 59912CLMBF2000A Columbia Falls Aluminum Co LLC Aluminum
Columbia Falls Flathead MT
3013 13 Eastalco Aluminum Company 21701STLCL5601M Eastalco Aluminum Co Aluminum Frederick Frederick MD
3014 14 Noranda Aluminum Incorporated 63869NRNDLSTJUD Noranda Aluminum Inc Aluminum Marston New Madrid MO
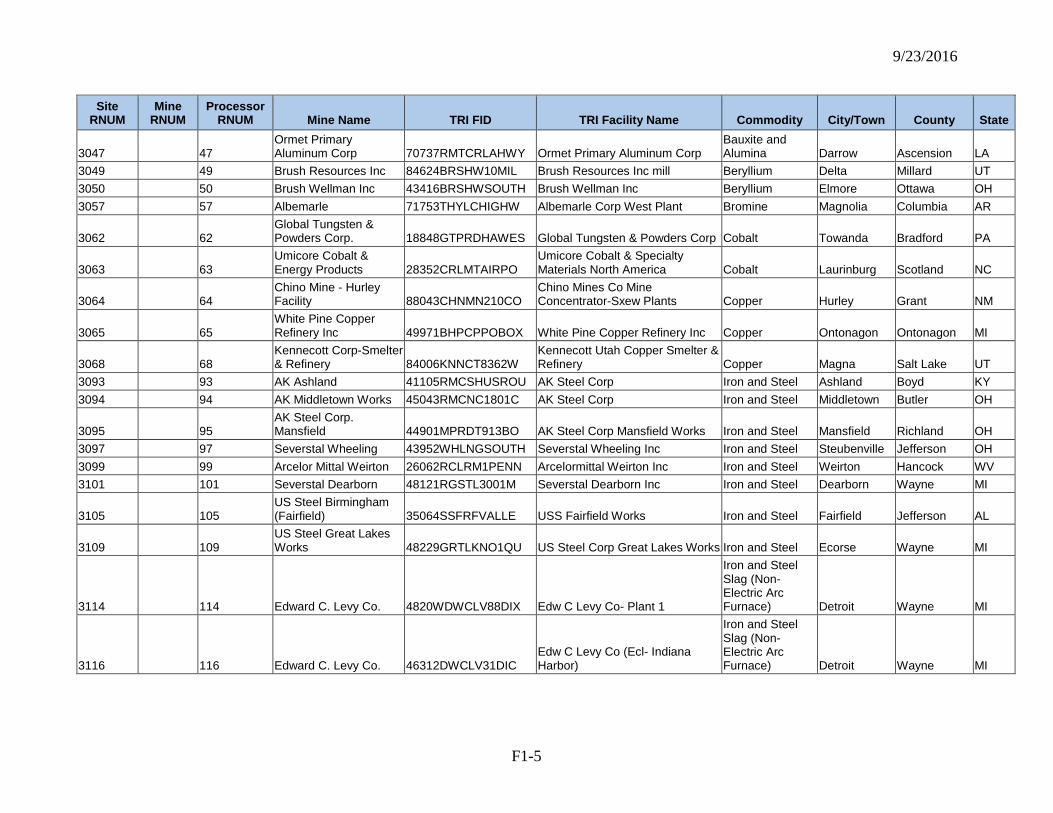
9/23/2016
F1-5
Site RNUM
Mine RNUM
Processor RNUM Mine Name TRI FID TRI Facility Name Commodity City/Town County State
3047 47 Ormet Primary Aluminum Corp 70737RMTCRLAHWY Ormet Primary Aluminum Corp
Bauxite and Alumina Darrow Ascension LA
3049 49 Brush Resources Inc 84624BRSHW10MIL Brush Resources Inc mill Beryllium Delta Millard UT 3050 50 Brush Wellman Inc 43416BRSHWSOUTH Brush Wellman Inc Beryllium Elmore Ottawa OH 3057 57 Albemarle 71753THYLCHIGHW Albemarle Corp West Plant Bromine Magnolia Columbia AR
3062 62 Global Tungsten & Powders Corp. 18848GTPRDHAWES Global Tungsten & Powders Corp Cobalt Towanda Bradford PA
3063 63 Umicore Cobalt & Energy Products 28352CRLMTAIRPO
Umicore Cobalt & Specialty Materials North America Cobalt Laurinburg Scotland NC
3064 64 Chino Mine - Hurley Facility 88043CHNMN210CO
Chino Mines Co Mine Concentrator-Sxew Plants Copper Hurley Grant NM
3065 65 White Pine Copper Refinery Inc 49971BHPCPPOBOX White Pine Copper Refinery Inc Copper Ontonagon Ontonagon MI
3068 68 Kennecott Corp-Smelter & Refinery 84006KNNCT8362W
Kennecott Utah Copper Smelter & Refinery Copper Magna Salt Lake UT
3093 93 AK Ashland 41105RMCSHUSROU AK Steel Corp Iron and Steel Ashland Boyd KY 3094 94 AK Middletown Works 45043RMCNC1801C AK Steel Corp Iron and Steel Middletown Butler OH
3095 95 AK Steel Corp. Mansfield 44901MPRDT913BO AK Steel Corp Mansfield Works Iron and Steel Mansfield Richland OH
3097 97 Severstal Wheeling 43952WHLNGSOUTH Severstal Wheeling Inc Iron and Steel Steubenville Jefferson OH 3099 99 Arcelor Mittal Weirton 26062RCLRM1PENN Arcelormittal Weirton Inc Iron and Steel Weirton Hancock WV 3101 101 Severstal Dearborn 48121RGSTL3001M Severstal Dearborn Inc Iron and Steel Dearborn Wayne MI
3105 105 US Steel Birmingham (Fairfield) 35064SSFRFVALLE USS Fairfield Works Iron and Steel Fairfield Jefferson AL
3109 109 US Steel Great Lakes Works 48229GRTLKNO1QU US Steel Corp Great Lakes Works Iron and Steel Ecorse Wayne MI
3114 114 Edward C. Levy Co. 4820WDWCLV88DIX Edw C Levy Co- Plant 1
Iron and Steel Slag (Non-Electric Arc Furnace) Detroit Wayne MI
3116 116 Edward C. Levy Co. 46312DWCLV31DIC Edw C Levy Co (Ecl- Indiana Harbor)
Iron and Steel Slag (Non-Electric Arc Furnace) Detroit Wayne MI
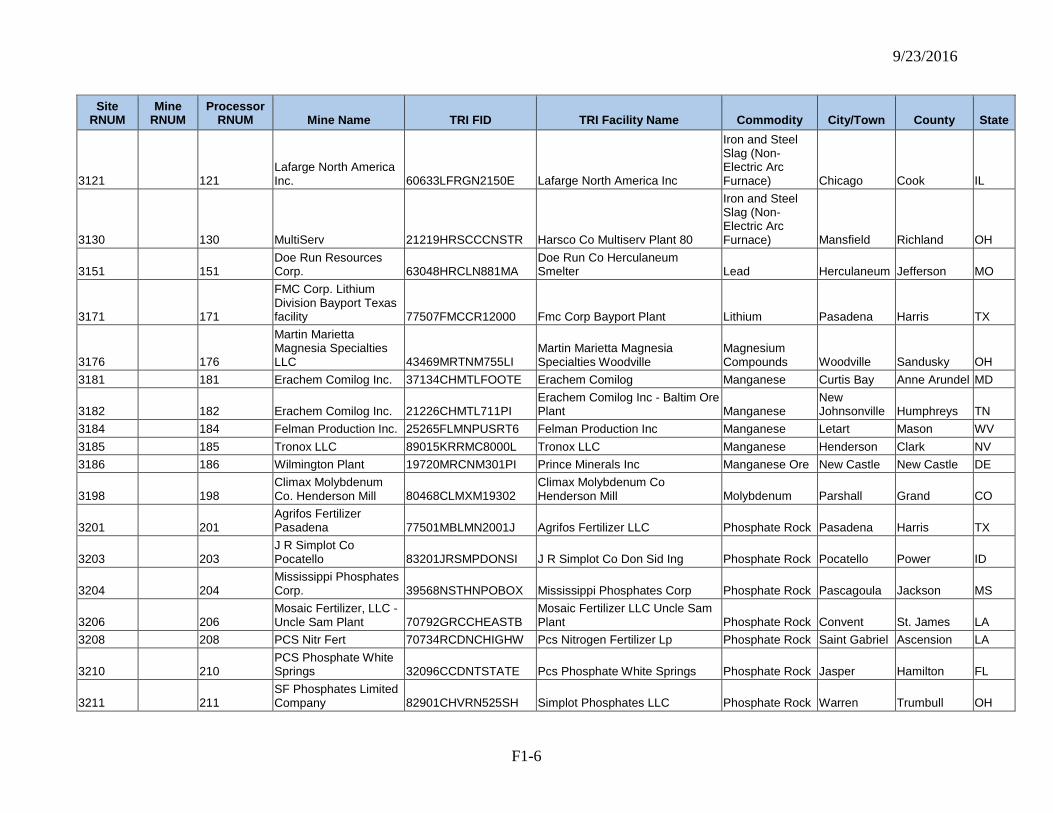
9/23/2016
F1-6
Site RNUM
Mine RNUM
Processor RNUM Mine Name TRI FID TRI Facility Name Commodity City/Town County State
3121 121 Lafarge North America Inc. 60633LFRGN2150E Lafarge North America Inc
Iron and Steel Slag (Non-Electric Arc Furnace) Chicago Cook IL
3130 130 MultiServ 21219HRSCCCNSTR Harsco Co Multiserv Plant 80
Iron and Steel Slag (Non-Electric Arc Furnace) Mansfield Richland OH
3151 151 Doe Run Resources Corp. 63048HRCLN881MA
Doe Run Co Herculaneum Smelter Lead Herculaneum Jefferson MO
3171 171
FMC Corp. Lithium Division Bayport Texas facility 77507FMCCR12000 Fmc Corp Bayport Plant Lithium Pasadena Harris TX
3176 176
Martin Marietta Magnesia Specialties LLC 43469MRTNM755LI
Martin Marietta Magnesia Specialties Woodville
Magnesium Compounds Woodville Sandusky OH
3181 181 Erachem Comilog Inc. 37134CHMTLFOOTE Erachem Comilog Manganese Curtis Bay Anne Arundel MD
3182 182 Erachem Comilog Inc. 21226CHMTL711PI Erachem Comilog Inc - Baltim Ore Plant Manganese
New Johnsonville Humphreys TN
3184 184 Felman Production Inc. 25265FLMNPUSRT6 Felman Production Inc Manganese Letart Mason WV 3185 185 Tronox LLC 89015KRRMC8000L Tronox LLC Manganese Henderson Clark NV 3186 186 Wilmington Plant 19720MRCNM301PI Prince Minerals Inc Manganese Ore New Castle New Castle DE
3198 198 Climax Molybdenum Co. Henderson Mill 80468CLMXM19302
Climax Molybdenum Co Henderson Mill Molybdenum Parshall Grand CO
3201 201 Agrifos Fertilizer Pasadena 77501MBLMN2001J Agrifos Fertilizer LLC Phosphate Rock Pasadena Harris TX
3203 203 J R Simplot Co Pocatello 83201JRSMPDONSI J R Simplot Co Don Sid Ing Phosphate Rock Pocatello Power ID
3204 204 Mississippi Phosphates Corp. 39568NSTHNPOBOX Mississippi Phosphates Corp Phosphate Rock Pascagoula Jackson MS
3206 206 Mosaic Fertilizer, LLC - Uncle Sam Plant 70792GRCCHEASTB
Mosaic Fertilizer LLC Uncle Sam Plant Phosphate Rock Convent St. James LA
3208 208 PCS Nitr Fert 70734RCDNCHIGHW Pcs Nitrogen Fertilizer Lp Phosphate Rock Saint Gabriel Ascension LA
3210 210 PCS Phosphate White Springs 32096CCDNTSTATE Pcs Phosphate White Springs Phosphate Rock Jasper Hamilton FL
3211 211 SF Phosphates Limited Company 82901CHVRN525SH Simplot Phosphates LLC Phosphate Rock Warren Trumbull OH
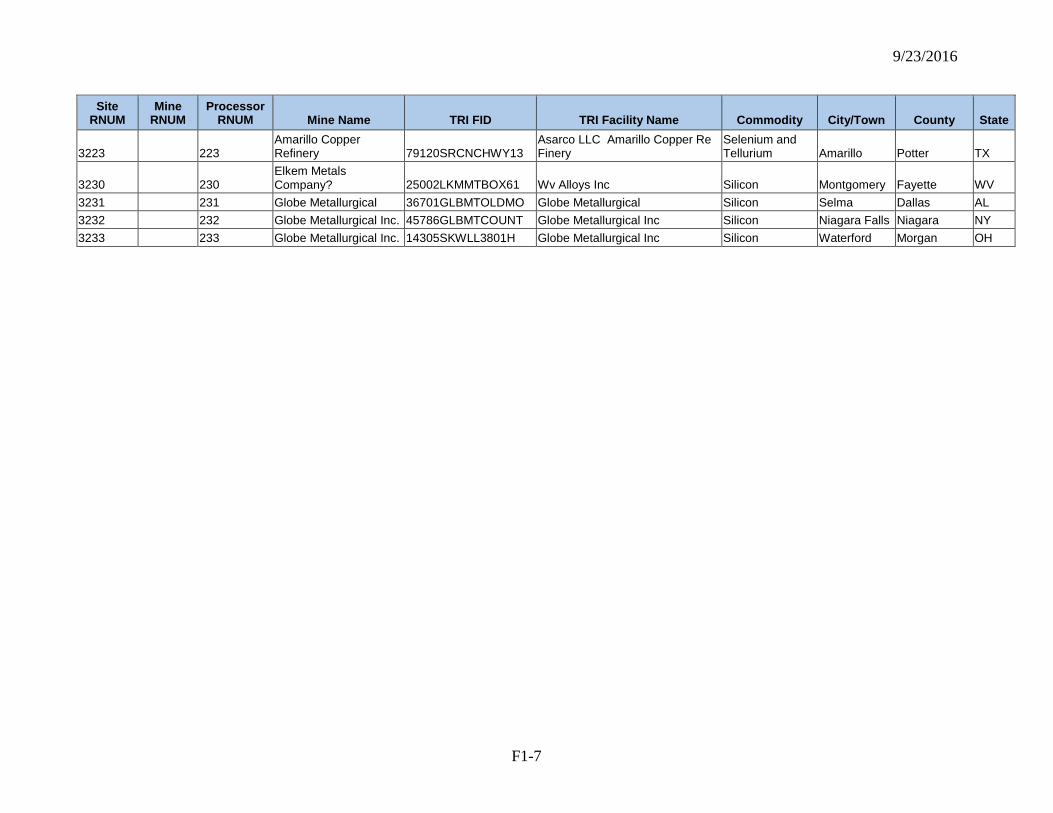
9/23/2016
F1-7
Site RNUM
Mine RNUM
Processor RNUM Mine Name TRI FID TRI Facility Name Commodity City/Town County State
3223 223 Amarillo Copper Refinery 79120SRCNCHWY13
Asarco LLC Amarillo Copper Re Finery
Selenium and Tellurium Amarillo Potter TX
3230 230 Elkem Metals Company? 25002LKMMTBOX61 Wv Alloys Inc Silicon Montgomery Fayette WV
3231 231 Globe Metallurgical 36701GLBMTOLDMO Globe Metallurgical Silicon Selma Dallas AL 3232 232 Globe Metallurgical Inc. 45786GLBMTCOUNT Globe Metallurgical Inc Silicon Niagara Falls Niagara NY 3233 233 Globe Metallurgical Inc. 14305SKWLL3801H Globe Metallurgical Inc Silicon Waterford Morgan OH
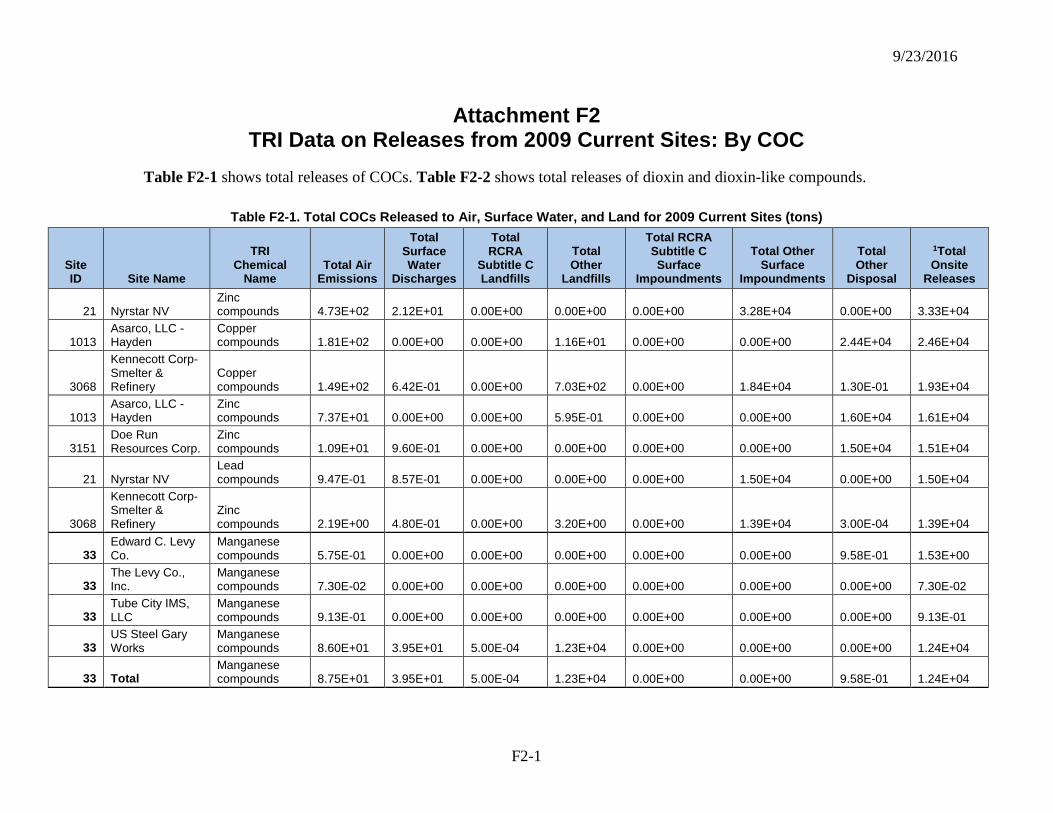
9/23/2016
F2-1
Attachment F2 TRI Data on Releases from 2009 Current Sites: By COC
Table F2-1 shows total releases of COCs. Table F2-2 shows total releases of dioxin and dioxin-like compounds.
Table F2-1. Total COCs Released to Air, Surface Water, and Land for 2009 Current Sites (tons)
Site ID Site Name
TRI Chemical
Name Total Air
Emissions
Total Surface Water
Discharges
Total RCRA
Subtitle C Landfills
Total Other
Landfills
Total RCRA Subtitle C Surface
Impoundments
Total Other Surface
Impoundments
Total Other
Disposal
1Total Onsite
Releases
21 Nyrstar NV Zinc compounds 4.73E+02 2.12E+01 0.00E+00 0.00E+00 0.00E+00 3.28E+04 0.00E+00 3.33E+04
1013 Asarco, LLC - Hayden
Copper compounds 1.81E+02 0.00E+00 0.00E+00 1.16E+01 0.00E+00 0.00E+00 2.44E+04 2.46E+04
3068
Kennecott Corp-Smelter & Refinery
Copper compounds 1.49E+02 6.42E-01 0.00E+00 7.03E+02 0.00E+00 1.84E+04 1.30E-01 1.93E+04
1013 Asarco, LLC - Hayden
Zinc compounds 7.37E+01 0.00E+00 0.00E+00 5.95E-01 0.00E+00 0.00E+00 1.60E+04 1.61E+04
3151 Doe Run Resources Corp.
Zinc compounds 1.09E+01 9.60E-01 0.00E+00 0.00E+00 0.00E+00 0.00E+00 1.50E+04 1.51E+04
21 Nyrstar NV Lead compounds 9.47E-01 8.57E-01 0.00E+00 0.00E+00 0.00E+00 1.50E+04 0.00E+00 1.50E+04
3068
Kennecott Corp-Smelter & Refinery
Zinc compounds 2.19E+00 4.80E-01 0.00E+00 3.20E+00 0.00E+00 1.39E+04 3.00E-04 1.39E+04
33 Edward C. Levy Co.
Manganese compounds 5.75E-01 0.00E+00 0.00E+00 0.00E+00 0.00E+00 0.00E+00 9.58E-01 1.53E+00
33 The Levy Co., Inc.
Manganese compounds 7.30E-02 0.00E+00 0.00E+00 0.00E+00 0.00E+00 0.00E+00 0.00E+00 7.30E-02
33 Tube City IMS, LLC
Manganese compounds 9.13E-01 0.00E+00 0.00E+00 0.00E+00 0.00E+00 0.00E+00 0.00E+00 9.13E-01
33 US Steel Gary Works
Manganese compounds 8.60E+01 3.95E+01 5.00E-04 1.23E+04 0.00E+00 0.00E+00 0.00E+00 1.24E+04
33 Total Manganese compounds 8.75E+01 3.95E+01 5.00E-04 1.23E+04 0.00E+00 0.00E+00 9.58E-01 1.24E+04
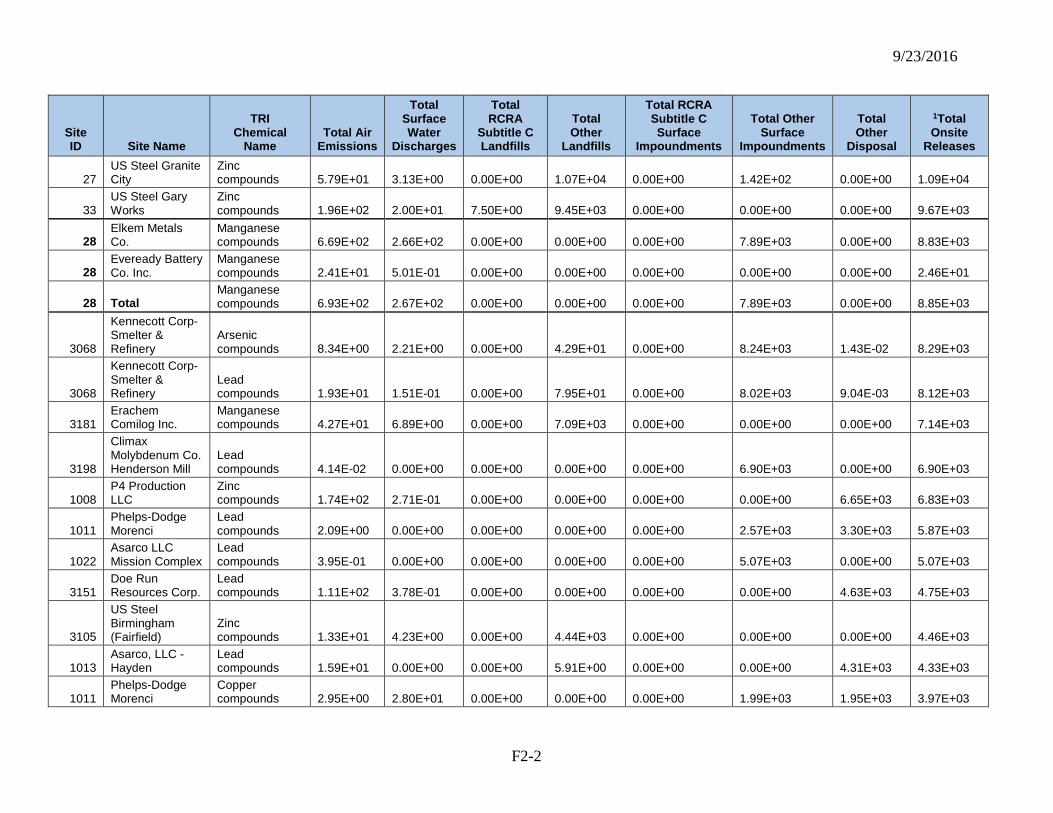
9/23/2016
F2-2
Site ID Site Name
TRI Chemical
Name Total Air
Emissions
Total Surface Water
Discharges
Total RCRA
Subtitle C Landfills
Total Other
Landfills
Total RCRA Subtitle C Surface
Impoundments
Total Other Surface
Impoundments
Total Other
Disposal
1Total Onsite
Releases
27 US Steel Granite City
Zinc compounds 5.79E+01 3.13E+00 0.00E+00 1.07E+04 0.00E+00 1.42E+02 0.00E+00 1.09E+04
33 US Steel Gary Works
Zinc compounds 1.96E+02 2.00E+01 7.50E+00 9.45E+03 0.00E+00 0.00E+00 0.00E+00 9.67E+03
28 Elkem Metals Co.
Manganese compounds 6.69E+02 2.66E+02 0.00E+00 0.00E+00 0.00E+00 7.89E+03 0.00E+00 8.83E+03
28 Eveready Battery Co. Inc.
Manganese compounds 2.41E+01 5.01E-01 0.00E+00 0.00E+00 0.00E+00 0.00E+00 0.00E+00 2.46E+01
28 Total Manganese compounds 6.93E+02 2.67E+02 0.00E+00 0.00E+00 0.00E+00 7.89E+03 0.00E+00 8.85E+03
3068
Kennecott Corp-Smelter & Refinery
Arsenic compounds 8.34E+00 2.21E+00 0.00E+00 4.29E+01 0.00E+00 8.24E+03 1.43E-02 8.29E+03
3068
Kennecott Corp-Smelter & Refinery
Lead compounds 1.93E+01 1.51E-01 0.00E+00 7.95E+01 0.00E+00 8.02E+03 9.04E-03 8.12E+03
3181 Erachem Comilog Inc.
Manganese compounds 4.27E+01 6.89E+00 0.00E+00 7.09E+03 0.00E+00 0.00E+00 0.00E+00 7.14E+03
3198
Climax Molybdenum Co. Henderson Mill
Lead compounds 4.14E-02 0.00E+00 0.00E+00 0.00E+00 0.00E+00 6.90E+03 0.00E+00 6.90E+03
1008 P4 Production LLC
Zinc compounds 1.74E+02 2.71E-01 0.00E+00 0.00E+00 0.00E+00 0.00E+00 6.65E+03 6.83E+03
1011 Phelps-Dodge Morenci
Lead compounds 2.09E+00 0.00E+00 0.00E+00 0.00E+00 0.00E+00 2.57E+03 3.30E+03 5.87E+03
1022 Asarco LLC Mission Complex
Lead compounds 3.95E-01 0.00E+00 0.00E+00 0.00E+00 0.00E+00 5.07E+03 0.00E+00 5.07E+03
3151 Doe Run Resources Corp.
Lead compounds 1.11E+02 3.78E-01 0.00E+00 0.00E+00 0.00E+00 0.00E+00 4.63E+03 4.75E+03
3105
US Steel Birmingham (Fairfield)
Zinc compounds 1.33E+01 4.23E+00 0.00E+00 4.44E+03 0.00E+00 0.00E+00 0.00E+00 4.46E+03
1013 Asarco, LLC - Hayden
Lead compounds 1.59E+01 0.00E+00 0.00E+00 5.91E+00 0.00E+00 0.00E+00 4.31E+03 4.33E+03
1011 Phelps-Dodge Morenci
Copper compounds 2.95E+00 2.80E+01 0.00E+00 0.00E+00 0.00E+00 1.99E+03 1.95E+03 3.97E+03
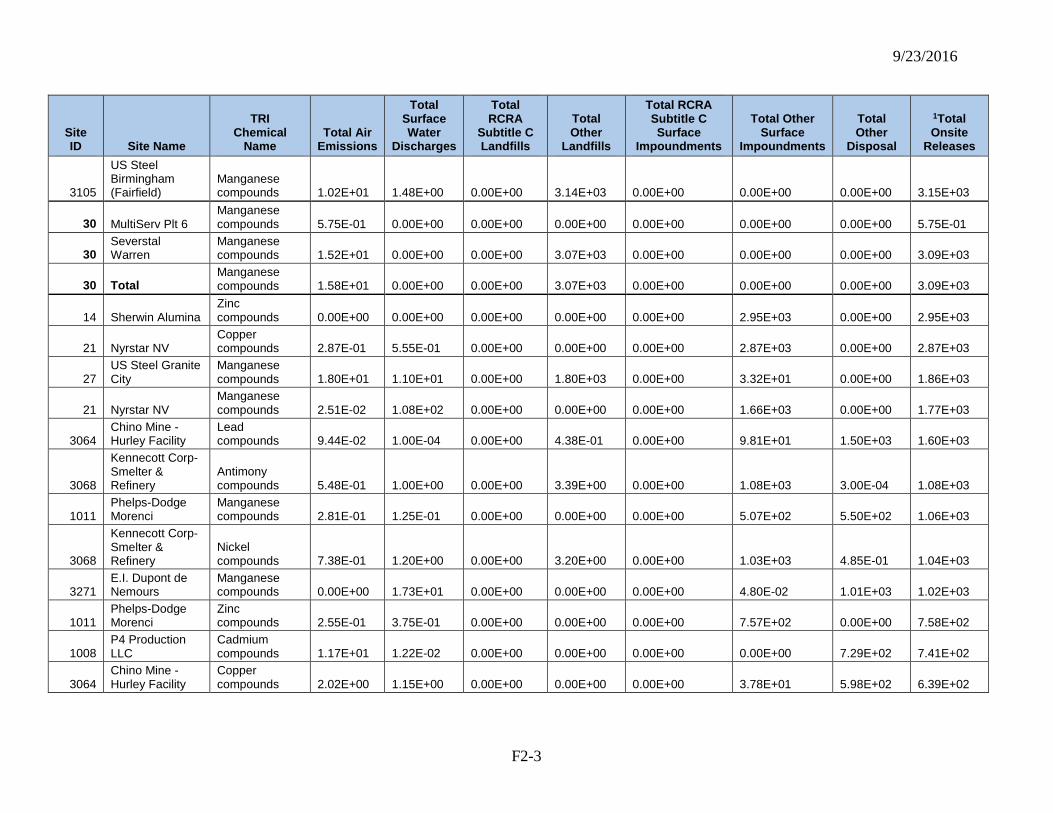
9/23/2016
F2-3
Site ID Site Name
TRI Chemical
Name Total Air
Emissions
Total Surface Water
Discharges
Total RCRA
Subtitle C Landfills
Total Other
Landfills
Total RCRA Subtitle C Surface
Impoundments
Total Other Surface
Impoundments
Total Other
Disposal
1Total Onsite
Releases
3105
US Steel Birmingham (Fairfield)
Manganese compounds 1.02E+01 1.48E+00 0.00E+00 3.14E+03 0.00E+00 0.00E+00 0.00E+00 3.15E+03
30 MultiServ Plt 6 Manganese compounds 5.75E-01 0.00E+00 0.00E+00 0.00E+00 0.00E+00 0.00E+00 0.00E+00 5.75E-01
30 Severstal Warren
Manganese compounds 1.52E+01 0.00E+00 0.00E+00 3.07E+03 0.00E+00 0.00E+00 0.00E+00 3.09E+03
30 Total Manganese compounds 1.58E+01 0.00E+00 0.00E+00 3.07E+03 0.00E+00 0.00E+00 0.00E+00 3.09E+03
14 Sherwin Alumina Zinc compounds 0.00E+00 0.00E+00 0.00E+00 0.00E+00 0.00E+00 2.95E+03 0.00E+00 2.95E+03
21 Nyrstar NV Copper compounds 2.87E-01 5.55E-01 0.00E+00 0.00E+00 0.00E+00 2.87E+03 0.00E+00 2.87E+03
27 US Steel Granite City
Manganese compounds 1.80E+01 1.10E+01 0.00E+00 1.80E+03 0.00E+00 3.32E+01 0.00E+00 1.86E+03
21 Nyrstar NV Manganese compounds 2.51E-02 1.08E+02 0.00E+00 0.00E+00 0.00E+00 1.66E+03 0.00E+00 1.77E+03
3064 Chino Mine - Hurley Facility
Lead compounds 9.44E-02 1.00E-04 0.00E+00 4.38E-01 0.00E+00 9.81E+01 1.50E+03 1.60E+03
3068
Kennecott Corp-Smelter & Refinery
Antimony compounds 5.48E-01 1.00E+00 0.00E+00 3.39E+00 0.00E+00 1.08E+03 3.00E-04 1.08E+03
1011 Phelps-Dodge Morenci
Manganese compounds 2.81E-01 1.25E-01 0.00E+00 0.00E+00 0.00E+00 5.07E+02 5.50E+02 1.06E+03
3068
Kennecott Corp-Smelter & Refinery
Nickel compounds 7.38E-01 1.20E+00 0.00E+00 3.20E+00 0.00E+00 1.03E+03 4.85E-01 1.04E+03
3271 E.I. Dupont de Nemours
Manganese compounds 0.00E+00 1.73E+01 0.00E+00 0.00E+00 0.00E+00 4.80E-02 1.01E+03 1.02E+03
1011 Phelps-Dodge Morenci
Zinc compounds 2.55E-01 3.75E-01 0.00E+00 0.00E+00 0.00E+00 7.57E+02 0.00E+00 7.58E+02
1008 P4 Production LLC
Cadmium compounds 1.17E+01 1.22E-02 0.00E+00 0.00E+00 0.00E+00 0.00E+00 7.29E+02 7.41E+02
3064 Chino Mine - Hurley Facility
Copper compounds 2.02E+00 1.15E+00 0.00E+00 0.00E+00 0.00E+00 3.78E+01 5.98E+02 6.39E+02
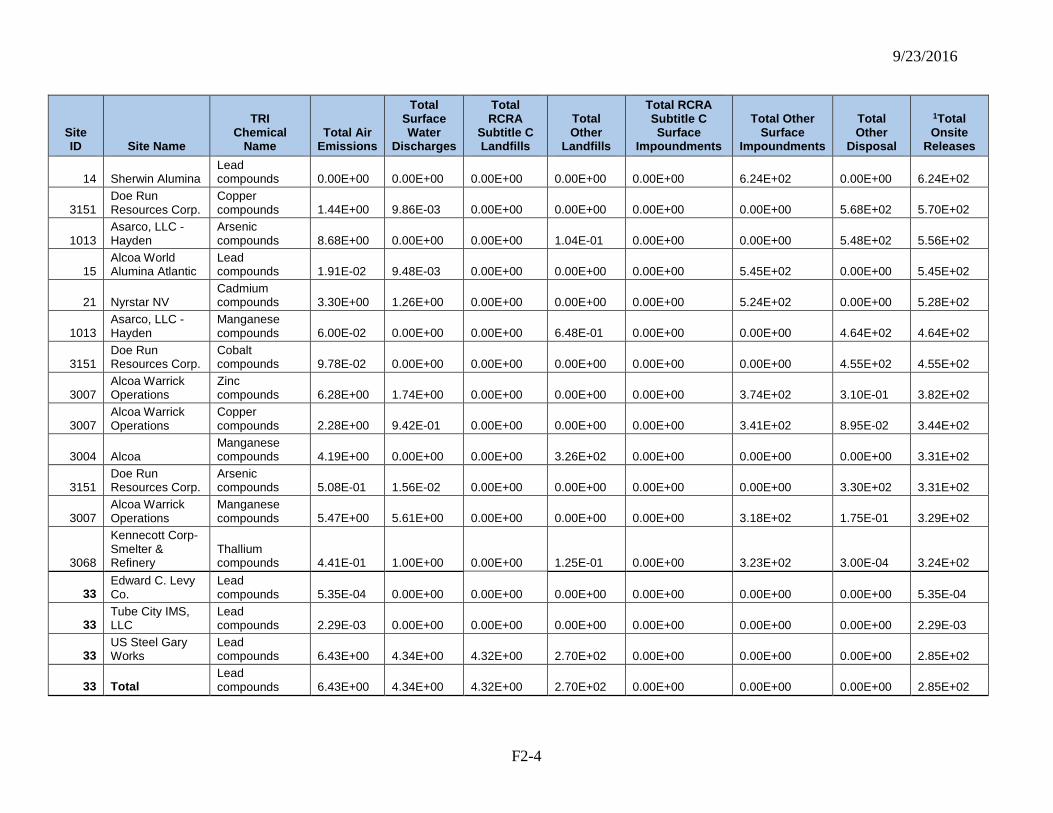
9/23/2016
F2-4
Site ID Site Name
TRI Chemical
Name Total Air
Emissions
Total Surface Water
Discharges
Total RCRA
Subtitle C Landfills
Total Other
Landfills
Total RCRA Subtitle C Surface
Impoundments
Total Other Surface
Impoundments
Total Other
Disposal
1Total Onsite
Releases
14 Sherwin Alumina Lead compounds 0.00E+00 0.00E+00 0.00E+00 0.00E+00 0.00E+00 6.24E+02 0.00E+00 6.24E+02
3151 Doe Run Resources Corp.
Copper compounds 1.44E+00 9.86E-03 0.00E+00 0.00E+00 0.00E+00 0.00E+00 5.68E+02 5.70E+02
1013 Asarco, LLC - Hayden
Arsenic compounds 8.68E+00 0.00E+00 0.00E+00 1.04E-01 0.00E+00 0.00E+00 5.48E+02 5.56E+02
15 Alcoa World Alumina Atlantic
Lead compounds 1.91E-02 9.48E-03 0.00E+00 0.00E+00 0.00E+00 5.45E+02 0.00E+00 5.45E+02
21 Nyrstar NV Cadmium compounds 3.30E+00 1.26E+00 0.00E+00 0.00E+00 0.00E+00 5.24E+02 0.00E+00 5.28E+02
1013 Asarco, LLC - Hayden
Manganese compounds 6.00E-02 0.00E+00 0.00E+00 6.48E-01 0.00E+00 0.00E+00 4.64E+02 4.64E+02
3151 Doe Run Resources Corp.
Cobalt compounds 9.78E-02 0.00E+00 0.00E+00 0.00E+00 0.00E+00 0.00E+00 4.55E+02 4.55E+02
3007 Alcoa Warrick Operations
Zinc compounds 6.28E+00 1.74E+00 0.00E+00 0.00E+00 0.00E+00 3.74E+02 3.10E-01 3.82E+02
3007 Alcoa Warrick Operations
Copper compounds 2.28E+00 9.42E-01 0.00E+00 0.00E+00 0.00E+00 3.41E+02 8.95E-02 3.44E+02
3004 Alcoa Manganese compounds 4.19E+00 0.00E+00 0.00E+00 3.26E+02 0.00E+00 0.00E+00 0.00E+00 3.31E+02
3151 Doe Run Resources Corp.
Arsenic compounds 5.08E-01 1.56E-02 0.00E+00 0.00E+00 0.00E+00 0.00E+00 3.30E+02 3.31E+02
3007 Alcoa Warrick Operations
Manganese compounds 5.47E+00 5.61E+00 0.00E+00 0.00E+00 0.00E+00 3.18E+02 1.75E-01 3.29E+02
3068
Kennecott Corp-Smelter & Refinery
Thallium compounds 4.41E-01 1.00E+00 0.00E+00 1.25E-01 0.00E+00 3.23E+02 3.00E-04 3.24E+02
33 Edward C. Levy Co.
Lead compounds 5.35E-04 0.00E+00 0.00E+00 0.00E+00 0.00E+00 0.00E+00 0.00E+00 5.35E-04
33 Tube City IMS, LLC
Lead compounds 2.29E-03 0.00E+00 0.00E+00 0.00E+00 0.00E+00 0.00E+00 0.00E+00 2.29E-03
33 US Steel Gary Works
Lead compounds 6.43E+00 4.34E+00 4.32E+00 2.70E+02 0.00E+00 0.00E+00 0.00E+00 2.85E+02
33 Total Lead compounds 6.43E+00 4.34E+00 4.32E+00 2.70E+02 0.00E+00 0.00E+00 0.00E+00 2.85E+02
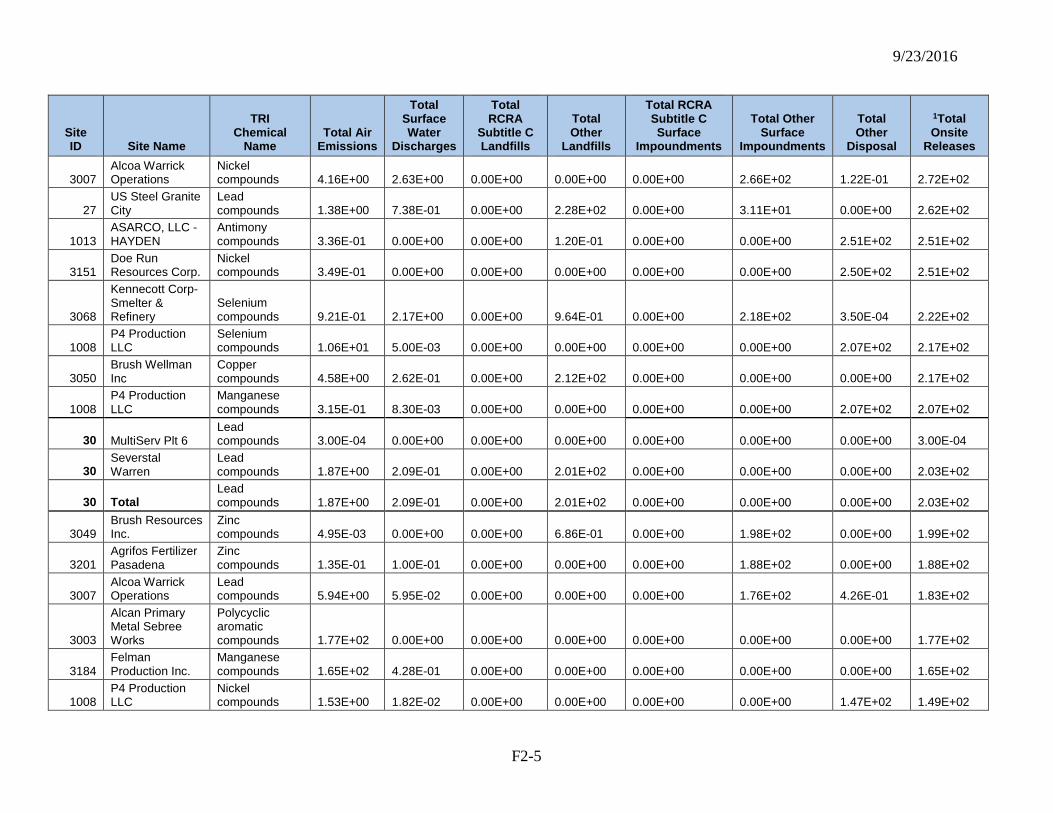
9/23/2016
F2-5
Site ID Site Name
TRI Chemical
Name Total Air
Emissions
Total Surface Water
Discharges
Total RCRA
Subtitle C Landfills
Total Other
Landfills
Total RCRA Subtitle C Surface
Impoundments
Total Other Surface
Impoundments
Total Other
Disposal
1Total Onsite
Releases
3007 Alcoa Warrick Operations
Nickel compounds 4.16E+00 2.63E+00 0.00E+00 0.00E+00 0.00E+00 2.66E+02 1.22E-01 2.72E+02
27 US Steel Granite City
Lead compounds 1.38E+00 7.38E-01 0.00E+00 2.28E+02 0.00E+00 3.11E+01 0.00E+00 2.62E+02
1013 ASARCO, LLC - HAYDEN
Antimony compounds 3.36E-01 0.00E+00 0.00E+00 1.20E-01 0.00E+00 0.00E+00 2.51E+02 2.51E+02
3151 Doe Run Resources Corp.
Nickel compounds 3.49E-01 0.00E+00 0.00E+00 0.00E+00 0.00E+00 0.00E+00 2.50E+02 2.51E+02
3068
Kennecott Corp-Smelter & Refinery
Selenium compounds 9.21E-01 2.17E+00 0.00E+00 9.64E-01 0.00E+00 2.18E+02 3.50E-04 2.22E+02
1008 P4 Production LLC
Selenium compounds 1.06E+01 5.00E-03 0.00E+00 0.00E+00 0.00E+00 0.00E+00 2.07E+02 2.17E+02
3050 Brush Wellman Inc
Copper compounds 4.58E+00 2.62E-01 0.00E+00 2.12E+02 0.00E+00 0.00E+00 0.00E+00 2.17E+02
1008 P4 Production LLC
Manganese compounds 3.15E-01 8.30E-03 0.00E+00 0.00E+00 0.00E+00 0.00E+00 2.07E+02 2.07E+02
30 MultiServ Plt 6 Lead compounds 3.00E-04 0.00E+00 0.00E+00 0.00E+00 0.00E+00 0.00E+00 0.00E+00 3.00E-04
30 Severstal Warren
Lead compounds 1.87E+00 2.09E-01 0.00E+00 2.01E+02 0.00E+00 0.00E+00 0.00E+00 2.03E+02
30 Total Lead compounds 1.87E+00 2.09E-01 0.00E+00 2.01E+02 0.00E+00 0.00E+00 0.00E+00 2.03E+02
3049 Brush Resources Inc.
Zinc compounds 4.95E-03 0.00E+00 0.00E+00 6.86E-01 0.00E+00 1.98E+02 0.00E+00 1.99E+02
3201 Agrifos Fertilizer Pasadena
Zinc compounds 1.35E-01 1.00E-01 0.00E+00 0.00E+00 0.00E+00 1.88E+02 0.00E+00 1.88E+02
3007 Alcoa Warrick Operations
Lead compounds 5.94E+00 5.95E-02 0.00E+00 0.00E+00 0.00E+00 1.76E+02 4.26E-01 1.83E+02
3003
Alcan Primary Metal Sebree Works
Polycyclic aromatic compounds 1.77E+02 0.00E+00 0.00E+00 0.00E+00 0.00E+00 0.00E+00 0.00E+00 1.77E+02
3184 Felman Production Inc.
Manganese compounds 1.65E+02 4.28E-01 0.00E+00 0.00E+00 0.00E+00 0.00E+00 0.00E+00 1.65E+02
1008 P4 Production LLC
Nickel compounds 1.53E+00 1.82E-02 0.00E+00 0.00E+00 0.00E+00 0.00E+00 1.47E+02 1.49E+02
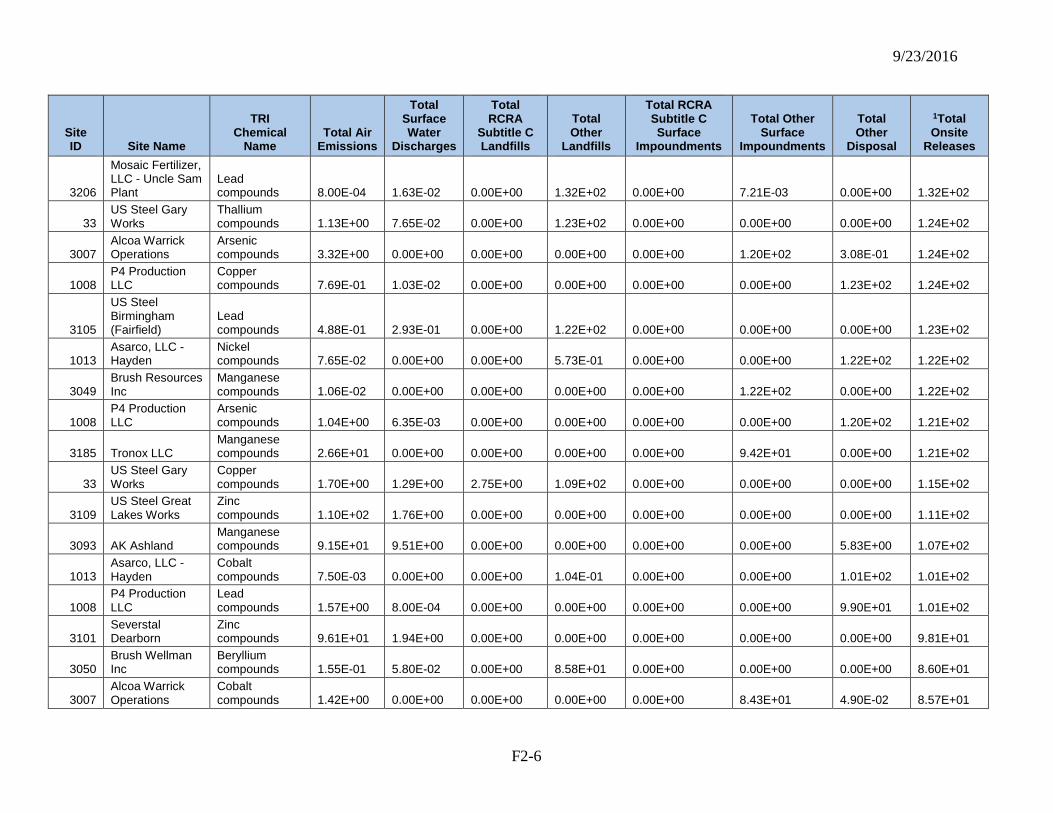
9/23/2016
F2-6
Site ID Site Name
TRI Chemical
Name Total Air
Emissions
Total Surface Water
Discharges
Total RCRA
Subtitle C Landfills
Total Other
Landfills
Total RCRA Subtitle C Surface
Impoundments
Total Other Surface
Impoundments
Total Other
Disposal
1Total Onsite
Releases
3206
Mosaic Fertilizer, LLC - Uncle Sam Plant
Lead compounds 8.00E-04 1.63E-02 0.00E+00 1.32E+02 0.00E+00 7.21E-03 0.00E+00 1.32E+02
33 US Steel Gary Works
Thallium compounds 1.13E+00 7.65E-02 0.00E+00 1.23E+02 0.00E+00 0.00E+00 0.00E+00 1.24E+02
3007 Alcoa Warrick Operations
Arsenic compounds 3.32E+00 0.00E+00 0.00E+00 0.00E+00 0.00E+00 1.20E+02 3.08E-01 1.24E+02
1008 P4 Production LLC
Copper compounds 7.69E-01 1.03E-02 0.00E+00 0.00E+00 0.00E+00 0.00E+00 1.23E+02 1.24E+02
3105
US Steel Birmingham (Fairfield)
Lead compounds 4.88E-01 2.93E-01 0.00E+00 1.22E+02 0.00E+00 0.00E+00 0.00E+00 1.23E+02
1013 Asarco, LLC - Hayden
Nickel compounds 7.65E-02 0.00E+00 0.00E+00 5.73E-01 0.00E+00 0.00E+00 1.22E+02 1.22E+02
3049 Brush Resources Inc
Manganese compounds 1.06E-02 0.00E+00 0.00E+00 0.00E+00 0.00E+00 1.22E+02 0.00E+00 1.22E+02
1008 P4 Production LLC
Arsenic compounds 1.04E+00 6.35E-03 0.00E+00 0.00E+00 0.00E+00 0.00E+00 1.20E+02 1.21E+02
3185 Tronox LLC Manganese compounds 2.66E+01 0.00E+00 0.00E+00 0.00E+00 0.00E+00 9.42E+01 0.00E+00 1.21E+02
33 US Steel Gary Works
Copper compounds 1.70E+00 1.29E+00 2.75E+00 1.09E+02 0.00E+00 0.00E+00 0.00E+00 1.15E+02
3109 US Steel Great Lakes Works
Zinc compounds 1.10E+02 1.76E+00 0.00E+00 0.00E+00 0.00E+00 0.00E+00 0.00E+00 1.11E+02
3093 AK Ashland Manganese compounds 9.15E+01 9.51E+00 0.00E+00 0.00E+00 0.00E+00 0.00E+00 5.83E+00 1.07E+02
1013 Asarco, LLC - Hayden
Cobalt compounds 7.50E-03 0.00E+00 0.00E+00 1.04E-01 0.00E+00 0.00E+00 1.01E+02 1.01E+02
1008 P4 Production LLC
Lead compounds 1.57E+00 8.00E-04 0.00E+00 0.00E+00 0.00E+00 0.00E+00 9.90E+01 1.01E+02
3101 Severstal Dearborn
Zinc compounds 9.61E+01 1.94E+00 0.00E+00 0.00E+00 0.00E+00 0.00E+00 0.00E+00 9.81E+01
3050 Brush Wellman Inc
Beryllium compounds 1.55E-01 5.80E-02 0.00E+00 8.58E+01 0.00E+00 0.00E+00 0.00E+00 8.60E+01
3007 Alcoa Warrick Operations
Cobalt compounds 1.42E+00 0.00E+00 0.00E+00 0.00E+00 0.00E+00 8.43E+01 4.90E-02 8.57E+01
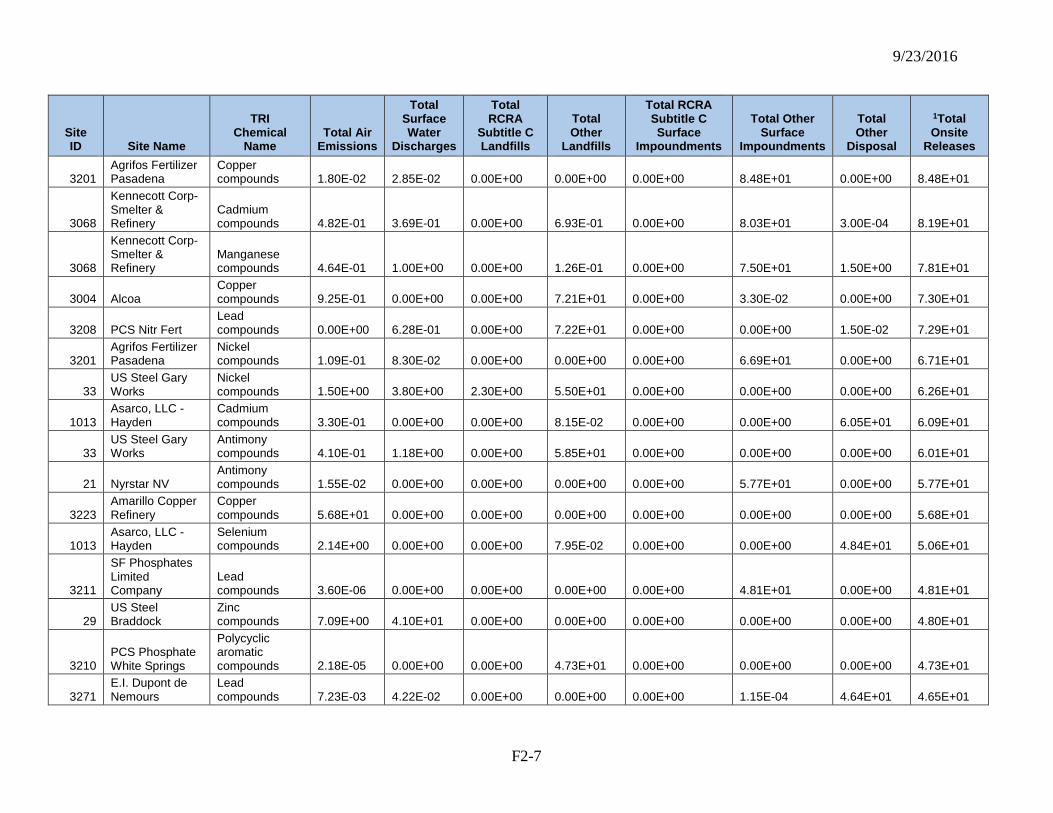
9/23/2016
F2-7
Site ID Site Name
TRI Chemical
Name Total Air
Emissions
Total Surface Water
Discharges
Total RCRA
Subtitle C Landfills
Total Other
Landfills
Total RCRA Subtitle C Surface
Impoundments
Total Other Surface
Impoundments
Total Other
Disposal
1Total Onsite
Releases
3201 Agrifos Fertilizer Pasadena
Copper compounds 1.80E-02 2.85E-02 0.00E+00 0.00E+00 0.00E+00 8.48E+01 0.00E+00 8.48E+01
3068
Kennecott Corp-Smelter & Refinery
Cadmium compounds 4.82E-01 3.69E-01 0.00E+00 6.93E-01 0.00E+00 8.03E+01 3.00E-04 8.19E+01
3068
Kennecott Corp-Smelter & Refinery
Manganese compounds 4.64E-01 1.00E+00 0.00E+00 1.26E-01 0.00E+00 7.50E+01 1.50E+00 7.81E+01
3004 Alcoa Copper compounds 9.25E-01 0.00E+00 0.00E+00 7.21E+01 0.00E+00 3.30E-02 0.00E+00 7.30E+01
3208 PCS Nitr Fert Lead compounds 0.00E+00 6.28E-01 0.00E+00 7.22E+01 0.00E+00 0.00E+00 1.50E-02 7.29E+01
3201 Agrifos Fertilizer Pasadena
Nickel compounds 1.09E-01 8.30E-02 0.00E+00 0.00E+00 0.00E+00 6.69E+01 0.00E+00 6.71E+01
33 US Steel Gary Works
Nickel compounds 1.50E+00 3.80E+00 2.30E+00 5.50E+01 0.00E+00 0.00E+00 0.00E+00 6.26E+01
1013 Asarco, LLC - Hayden
Cadmium compounds 3.30E-01 0.00E+00 0.00E+00 8.15E-02 0.00E+00 0.00E+00 6.05E+01 6.09E+01
33 US Steel Gary Works
Antimony compounds 4.10E-01 1.18E+00 0.00E+00 5.85E+01 0.00E+00 0.00E+00 0.00E+00 6.01E+01
21 Nyrstar NV Antimony compounds 1.55E-02 0.00E+00 0.00E+00 0.00E+00 0.00E+00 5.77E+01 0.00E+00 5.77E+01
3223 Amarillo Copper Refinery
Copper compounds 5.68E+01 0.00E+00 0.00E+00 0.00E+00 0.00E+00 0.00E+00 0.00E+00 5.68E+01
1013 Asarco, LLC - Hayden
Selenium compounds 2.14E+00 0.00E+00 0.00E+00 7.95E-02 0.00E+00 0.00E+00 4.84E+01 5.06E+01
3211
SF Phosphates Limited Company
Lead compounds 3.60E-06 0.00E+00 0.00E+00 0.00E+00 0.00E+00 4.81E+01 0.00E+00 4.81E+01
29 US Steel Braddock
Zinc compounds 7.09E+00 4.10E+01 0.00E+00 0.00E+00 0.00E+00 0.00E+00 0.00E+00 4.80E+01
3210 PCS Phosphate White Springs
Polycyclic aromatic compounds 2.18E-05 0.00E+00 0.00E+00 4.73E+01 0.00E+00 0.00E+00 0.00E+00 4.73E+01
3271 E.I. Dupont de Nemours
Lead compounds 7.23E-03 4.22E-02 0.00E+00 0.00E+00 0.00E+00 1.15E-04 4.64E+01 4.65E+01
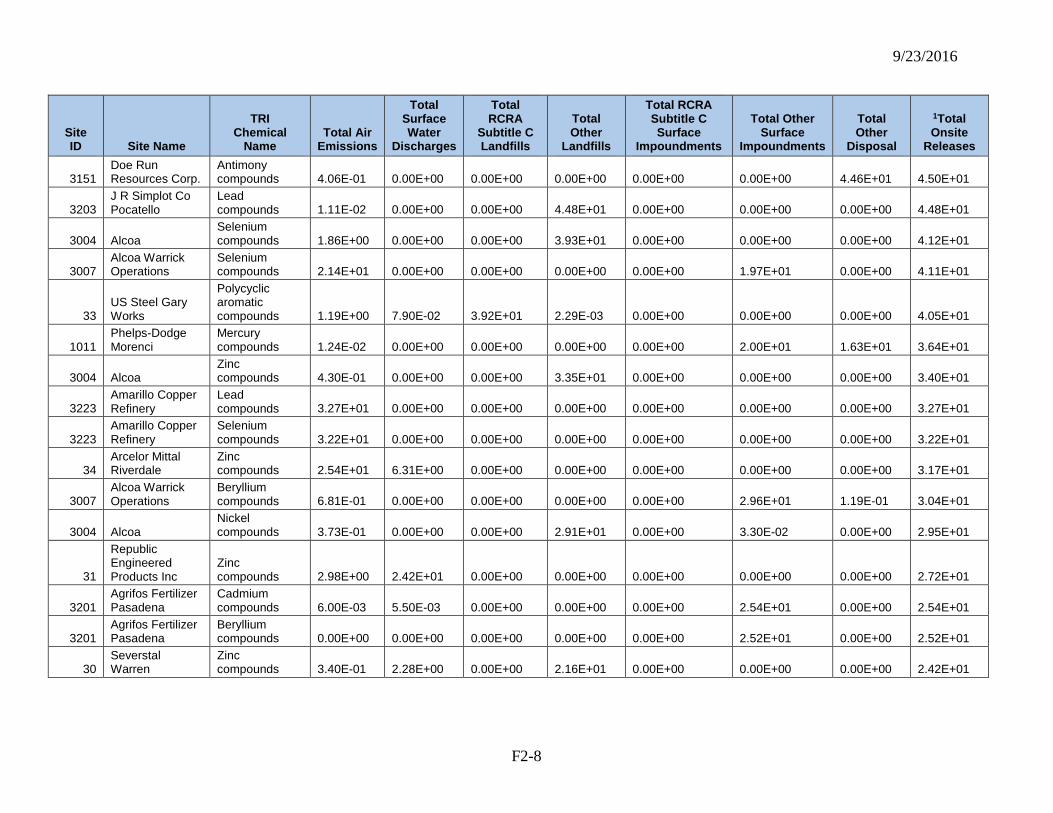
9/23/2016
F2-8
Site ID Site Name
TRI Chemical
Name Total Air
Emissions
Total Surface Water
Discharges
Total RCRA
Subtitle C Landfills
Total Other
Landfills
Total RCRA Subtitle C Surface
Impoundments
Total Other Surface
Impoundments
Total Other
Disposal
1Total Onsite
Releases
3151 Doe Run Resources Corp.
Antimony compounds 4.06E-01 0.00E+00 0.00E+00 0.00E+00 0.00E+00 0.00E+00 4.46E+01 4.50E+01
3203 J R Simplot Co Pocatello
Lead compounds 1.11E-02 0.00E+00 0.00E+00 4.48E+01 0.00E+00 0.00E+00 0.00E+00 4.48E+01
3004 Alcoa Selenium compounds 1.86E+00 0.00E+00 0.00E+00 3.93E+01 0.00E+00 0.00E+00 0.00E+00 4.12E+01
3007 Alcoa Warrick Operations
Selenium compounds 2.14E+01 0.00E+00 0.00E+00 0.00E+00 0.00E+00 1.97E+01 0.00E+00 4.11E+01
33 US Steel Gary Works
Polycyclic aromatic compounds 1.19E+00 7.90E-02 3.92E+01 2.29E-03 0.00E+00 0.00E+00 0.00E+00 4.05E+01
1011 Phelps-Dodge Morenci
Mercury compounds 1.24E-02 0.00E+00 0.00E+00 0.00E+00 0.00E+00 2.00E+01 1.63E+01 3.64E+01
3004 Alcoa Zinc compounds 4.30E-01 0.00E+00 0.00E+00 3.35E+01 0.00E+00 0.00E+00 0.00E+00 3.40E+01
3223 Amarillo Copper Refinery
Lead compounds 3.27E+01 0.00E+00 0.00E+00 0.00E+00 0.00E+00 0.00E+00 0.00E+00 3.27E+01
3223 Amarillo Copper Refinery
Selenium compounds 3.22E+01 0.00E+00 0.00E+00 0.00E+00 0.00E+00 0.00E+00 0.00E+00 3.22E+01
34 Arcelor Mittal Riverdale
Zinc compounds 2.54E+01 6.31E+00 0.00E+00 0.00E+00 0.00E+00 0.00E+00 0.00E+00 3.17E+01
3007 Alcoa Warrick Operations
Beryllium compounds 6.81E-01 0.00E+00 0.00E+00 0.00E+00 0.00E+00 2.96E+01 1.19E-01 3.04E+01
3004 Alcoa Nickel compounds 3.73E-01 0.00E+00 0.00E+00 2.91E+01 0.00E+00 3.30E-02 0.00E+00 2.95E+01
31
Republic Engineered Products Inc
Zinc compounds 2.98E+00 2.42E+01 0.00E+00 0.00E+00 0.00E+00 0.00E+00 0.00E+00 2.72E+01
3201 Agrifos Fertilizer Pasadena
Cadmium compounds 6.00E-03 5.50E-03 0.00E+00 0.00E+00 0.00E+00 2.54E+01 0.00E+00 2.54E+01
3201 Agrifos Fertilizer Pasadena
Beryllium compounds 0.00E+00 0.00E+00 0.00E+00 0.00E+00 0.00E+00 2.52E+01 0.00E+00 2.52E+01
30 Severstal Warren
Zinc compounds 3.40E-01 2.28E+00 0.00E+00 2.16E+01 0.00E+00 0.00E+00 0.00E+00 2.42E+01
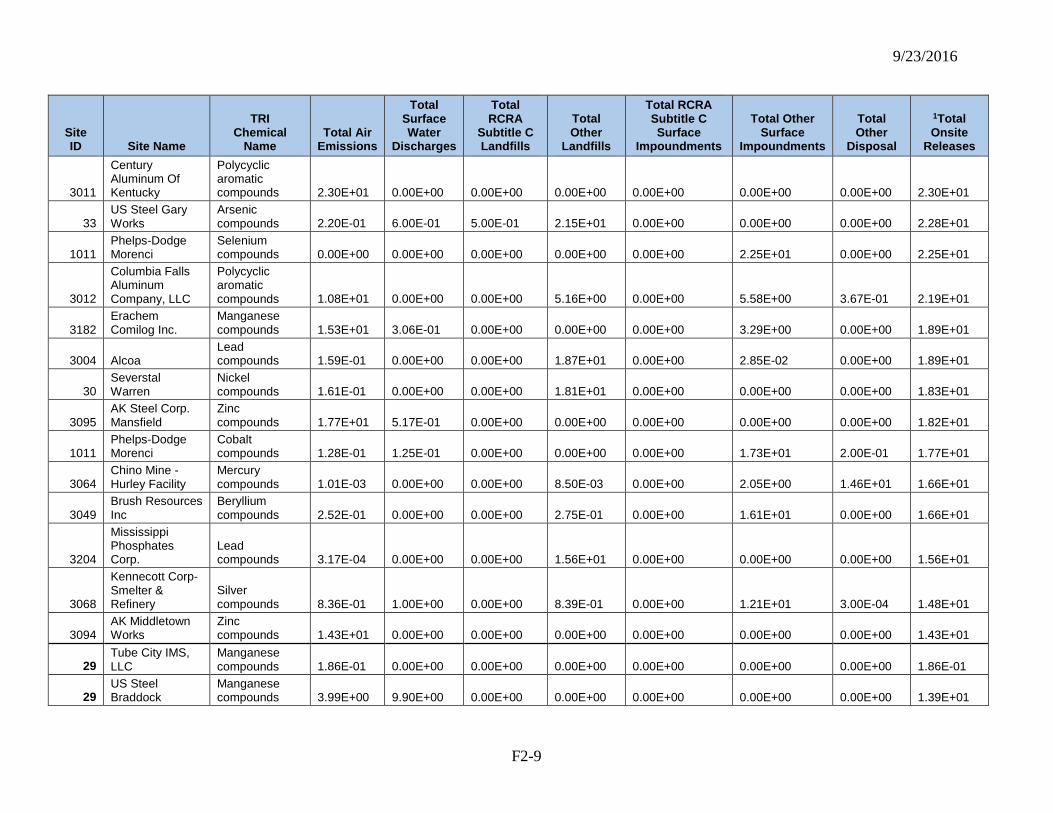
9/23/2016
F2-9
Site ID Site Name
TRI Chemical
Name Total Air
Emissions
Total Surface Water
Discharges
Total RCRA
Subtitle C Landfills
Total Other
Landfills
Total RCRA Subtitle C Surface
Impoundments
Total Other Surface
Impoundments
Total Other
Disposal
1Total Onsite
Releases
3011
Century Aluminum Of Kentucky
Polycyclic aromatic compounds 2.30E+01 0.00E+00 0.00E+00 0.00E+00 0.00E+00 0.00E+00 0.00E+00 2.30E+01
33 US Steel Gary Works
Arsenic compounds 2.20E-01 6.00E-01 5.00E-01 2.15E+01 0.00E+00 0.00E+00 0.00E+00 2.28E+01
1011 Phelps-Dodge Morenci
Selenium compounds 0.00E+00 0.00E+00 0.00E+00 0.00E+00 0.00E+00 2.25E+01 0.00E+00 2.25E+01
3012
Columbia Falls Aluminum Company, LLC
Polycyclic aromatic compounds 1.08E+01 0.00E+00 0.00E+00 5.16E+00 0.00E+00 5.58E+00 3.67E-01 2.19E+01
3182 Erachem Comilog Inc.
Manganese compounds 1.53E+01 3.06E-01 0.00E+00 0.00E+00 0.00E+00 3.29E+00 0.00E+00 1.89E+01
3004 Alcoa Lead compounds 1.59E-01 0.00E+00 0.00E+00 1.87E+01 0.00E+00 2.85E-02 0.00E+00 1.89E+01
30 Severstal Warren
Nickel compounds 1.61E-01 0.00E+00 0.00E+00 1.81E+01 0.00E+00 0.00E+00 0.00E+00 1.83E+01
3095 AK Steel Corp. Mansfield
Zinc compounds 1.77E+01 5.17E-01 0.00E+00 0.00E+00 0.00E+00 0.00E+00 0.00E+00 1.82E+01
1011 Phelps-Dodge Morenci
Cobalt compounds 1.28E-01 1.25E-01 0.00E+00 0.00E+00 0.00E+00 1.73E+01 2.00E-01 1.77E+01
3064 Chino Mine - Hurley Facility
Mercury compounds 1.01E-03 0.00E+00 0.00E+00 8.50E-03 0.00E+00 2.05E+00 1.46E+01 1.66E+01
3049 Brush Resources Inc
Beryllium compounds 2.52E-01 0.00E+00 0.00E+00 2.75E-01 0.00E+00 1.61E+01 0.00E+00 1.66E+01
3204
Mississippi Phosphates Corp.
Lead compounds 3.17E-04 0.00E+00 0.00E+00 1.56E+01 0.00E+00 0.00E+00 0.00E+00 1.56E+01
3068
Kennecott Corp-Smelter & Refinery
Silver compounds 8.36E-01 1.00E+00 0.00E+00 8.39E-01 0.00E+00 1.21E+01 3.00E-04 1.48E+01
3094 AK Middletown Works
Zinc compounds 1.43E+01 0.00E+00 0.00E+00 0.00E+00 0.00E+00 0.00E+00 0.00E+00 1.43E+01
29 Tube City IMS, LLC
Manganese compounds 1.86E-01 0.00E+00 0.00E+00 0.00E+00 0.00E+00 0.00E+00 0.00E+00 1.86E-01
29 US Steel Braddock
Manganese compounds 3.99E+00 9.90E+00 0.00E+00 0.00E+00 0.00E+00 0.00E+00 0.00E+00 1.39E+01

9/23/2016
F2-10
Site ID Site Name
TRI Chemical
Name Total Air
Emissions
Total Surface Water
Discharges
Total RCRA
Subtitle C Landfills
Total Other
Landfills
Total RCRA Subtitle C Surface
Impoundments
Total Other Surface
Impoundments
Total Other
Disposal
1Total Onsite
Releases
29 Total Manganese compounds 4.18E+00 9.90E+00 0.00E+00 0.00E+00 0.00E+00 0.00E+00 0.00E+00 1.41E+01
3009 Alumax Of Sc Incorporated
Polycyclic aromatic compounds 1.28E+01 0.00E+00 0.00E+00 0.00E+00 0.00E+00 0.00E+00 0.00E+00 1.28E+01
3151 Doe Run Resources Corp.
Cadmium compounds 2.18E+00 3.42E-01 0.00E+00 0.00E+00 0.00E+00 0.00E+00 1.02E+01 1.27E+01
1011 Phelps-Dodge Morenci
Cadmium compounds 2.50E-03 0.00E+00 0.00E+00 0.00E+00 0.00E+00 1.10E+01 0.00E+00 1.10E+01
3003
Alcan Primary Metal Sebree Works
Manganese compounds 1.05E+01 3.08E-01 0.00E+00 7.80E-04 0.00E+00 0.00E+00 0.00E+00 1.08E+01
3101 Severstal Dearborn
Manganese compounds 1.01E+01 0.00E+00 0.00E+00 0.00E+00 0.00E+00 0.00E+00 0.00E+00 1.01E+01
94 AK Middletown Works
Manganese compounds 9.67E+00 3.75E-01 0.00E+00 0.00E+00 0.00E+00 0.00E+00 0.00E+00 1.00E+01
34 Arcelor Mittal Riverdale
Manganese compounds 9.10E+00 6.54E-01 0.00E+00 0.00E+00 0.00E+00 0.00E+00 0.00E+00 9.76E+00
34 MultiServ Manganese compounds 1.72E-01 0.00E+00 0.00E+00 0.00E+00 0.00E+00 0.00E+00 0.00E+00 1.72E-01
34 Total Manganese compounds 9.28E+00 6.54E-01 0.00E+00 0.00E+00 0.00E+00 0.00E+00 0.00E+00 9.93E+00
3014
Noranda Aluminum Incorporated
Polycyclic aromatic compounds 9.67E+00 0.00E+00 0.00E+00 0.00E+00 0.00E+00 0.00E+00 0.00E+00 9.67E+00
95 AK Steel Corp. Mansfield
Manganese compounds 1.20E+00 8.24E+00 0.00E+00 0.00E+00 0.00E+00 0.00E+00 0.00E+00 9.44E+00
3223 Amarillo Copper Refinery
Arsenic compounds 9.08E+00 0.00E+00 0.00E+00 0.00E+00 0.00E+00 0.00E+00 0.00E+00 9.08E+00
1013 Asarco, LLC - Hayden
Silver compounds 4.30E-01 0.00E+00 0.00E+00 2.30E-02 0.00E+00 0.00E+00 8.22E+00 8.67E+00
3007 Alcoa Warrick Operations
Polycyclic aromatic compounds 8.46E+00 0.00E+00 0.00E+00 0.00E+00 0.00E+00 0.00E+00 0.00E+00 8.46E+00
3109 US Steel Great Lakes Works
Lead compounds 7.77E+00 6.50E-02 0.00E+00 0.00E+00 0.00E+00 0.00E+00 0.00E+00 7.84E+00
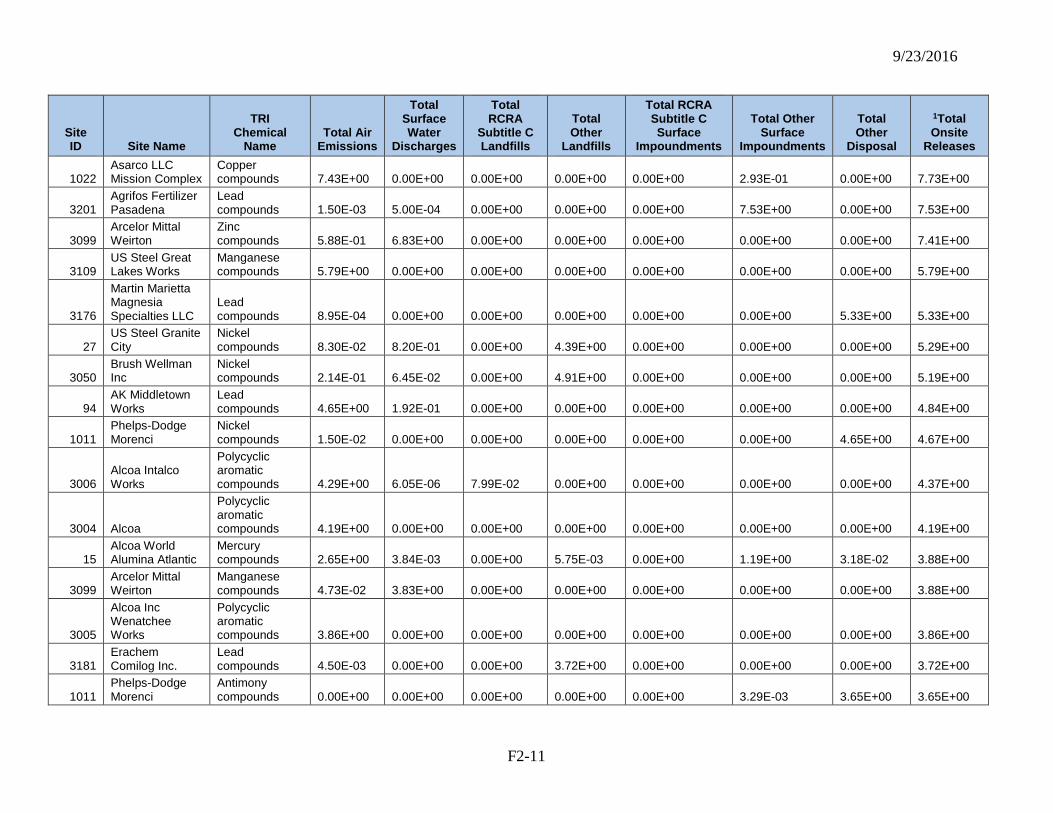
9/23/2016
F2-11
Site ID Site Name
TRI Chemical
Name Total Air
Emissions
Total Surface Water
Discharges
Total RCRA
Subtitle C Landfills
Total Other
Landfills
Total RCRA Subtitle C Surface
Impoundments
Total Other Surface
Impoundments
Total Other
Disposal
1Total Onsite
Releases
1022 Asarco LLC Mission Complex
Copper compounds 7.43E+00 0.00E+00 0.00E+00 0.00E+00 0.00E+00 2.93E-01 0.00E+00 7.73E+00
3201 Agrifos Fertilizer Pasadena
Lead compounds 1.50E-03 5.00E-04 0.00E+00 0.00E+00 0.00E+00 7.53E+00 0.00E+00 7.53E+00
3099 Arcelor Mittal Weirton
Zinc compounds 5.88E-01 6.83E+00 0.00E+00 0.00E+00 0.00E+00 0.00E+00 0.00E+00 7.41E+00
3109 US Steel Great Lakes Works
Manganese compounds 5.79E+00 0.00E+00 0.00E+00 0.00E+00 0.00E+00 0.00E+00 0.00E+00 5.79E+00
3176
Martin Marietta Magnesia Specialties LLC
Lead compounds 8.95E-04 0.00E+00 0.00E+00 0.00E+00 0.00E+00 0.00E+00 5.33E+00 5.33E+00
27 US Steel Granite City
Nickel compounds 8.30E-02 8.20E-01 0.00E+00 4.39E+00 0.00E+00 0.00E+00 0.00E+00 5.29E+00
3050 Brush Wellman Inc
Nickel compounds 2.14E-01 6.45E-02 0.00E+00 4.91E+00 0.00E+00 0.00E+00 0.00E+00 5.19E+00
94 AK Middletown Works
Lead compounds 4.65E+00 1.92E-01 0.00E+00 0.00E+00 0.00E+00 0.00E+00 0.00E+00 4.84E+00
1011 Phelps-Dodge Morenci
Nickel compounds 1.50E-02 0.00E+00 0.00E+00 0.00E+00 0.00E+00 0.00E+00 4.65E+00 4.67E+00
3006 Alcoa Intalco Works
Polycyclic aromatic compounds 4.29E+00 6.05E-06 7.99E-02 0.00E+00 0.00E+00 0.00E+00 0.00E+00 4.37E+00
3004 Alcoa
Polycyclic aromatic compounds 4.19E+00 0.00E+00 0.00E+00 0.00E+00 0.00E+00 0.00E+00 0.00E+00 4.19E+00
15 Alcoa World Alumina Atlantic
Mercury compounds 2.65E+00 3.84E-03 0.00E+00 5.75E-03 0.00E+00 1.19E+00 3.18E-02 3.88E+00
3099 Arcelor Mittal Weirton
Manganese compounds 4.73E-02 3.83E+00 0.00E+00 0.00E+00 0.00E+00 0.00E+00 0.00E+00 3.88E+00
3005
Alcoa Inc Wenatchee Works
Polycyclic aromatic compounds 3.86E+00 0.00E+00 0.00E+00 0.00E+00 0.00E+00 0.00E+00 0.00E+00 3.86E+00
3181 Erachem Comilog Inc.
Lead compounds 4.50E-03 0.00E+00 0.00E+00 3.72E+00 0.00E+00 0.00E+00 0.00E+00 3.72E+00
1011 Phelps-Dodge Morenci
Antimony compounds 0.00E+00 0.00E+00 0.00E+00 0.00E+00 0.00E+00 3.29E-03 3.65E+00 3.65E+00
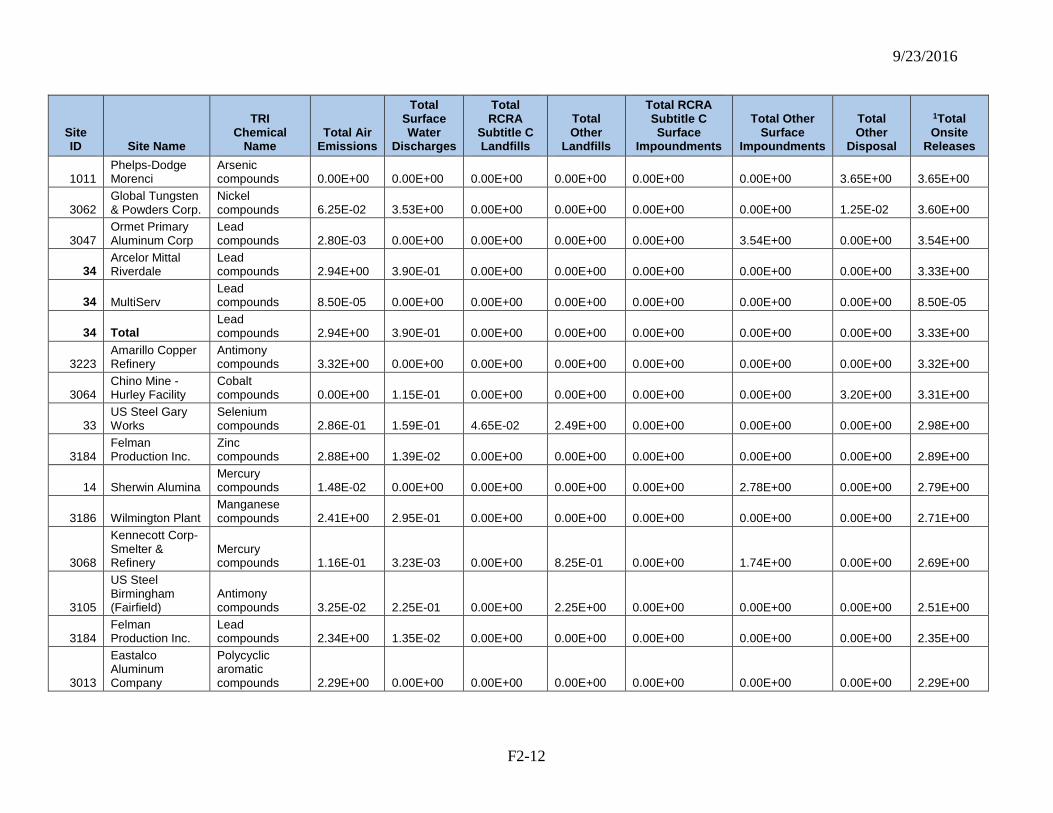
9/23/2016
F2-12
Site ID Site Name
TRI Chemical
Name Total Air
Emissions
Total Surface Water
Discharges
Total RCRA
Subtitle C Landfills
Total Other
Landfills
Total RCRA Subtitle C Surface
Impoundments
Total Other Surface
Impoundments
Total Other
Disposal
1Total Onsite
Releases
1011 Phelps-Dodge Morenci
Arsenic compounds 0.00E+00 0.00E+00 0.00E+00 0.00E+00 0.00E+00 0.00E+00 3.65E+00 3.65E+00
3062 Global Tungsten & Powders Corp.
Nickel compounds 6.25E-02 3.53E+00 0.00E+00 0.00E+00 0.00E+00 0.00E+00 1.25E-02 3.60E+00
3047 Ormet Primary Aluminum Corp
Lead compounds 2.80E-03 0.00E+00 0.00E+00 0.00E+00 0.00E+00 3.54E+00 0.00E+00 3.54E+00
34 Arcelor Mittal Riverdale
Lead compounds 2.94E+00 3.90E-01 0.00E+00 0.00E+00 0.00E+00 0.00E+00 0.00E+00 3.33E+00
34 MultiServ Lead compounds 8.50E-05 0.00E+00 0.00E+00 0.00E+00 0.00E+00 0.00E+00 0.00E+00 8.50E-05
34 Total Lead compounds 2.94E+00 3.90E-01 0.00E+00 0.00E+00 0.00E+00 0.00E+00 0.00E+00 3.33E+00
3223 Amarillo Copper Refinery
Antimony compounds 3.32E+00 0.00E+00 0.00E+00 0.00E+00 0.00E+00 0.00E+00 0.00E+00 3.32E+00
3064 Chino Mine - Hurley Facility
Cobalt compounds 0.00E+00 1.15E-01 0.00E+00 0.00E+00 0.00E+00 0.00E+00 3.20E+00 3.31E+00
33 US Steel Gary Works
Selenium compounds 2.86E-01 1.59E-01 4.65E-02 2.49E+00 0.00E+00 0.00E+00 0.00E+00 2.98E+00
3184 Felman Production Inc.
Zinc compounds 2.88E+00 1.39E-02 0.00E+00 0.00E+00 0.00E+00 0.00E+00 0.00E+00 2.89E+00
14 Sherwin Alumina Mercury compounds 1.48E-02 0.00E+00 0.00E+00 0.00E+00 0.00E+00 2.78E+00 0.00E+00 2.79E+00
3186 Wilmington Plant Manganese compounds 2.41E+00 2.95E-01 0.00E+00 0.00E+00 0.00E+00 0.00E+00 0.00E+00 2.71E+00
3068
Kennecott Corp-Smelter & Refinery
Mercury compounds 1.16E-01 3.23E-03 0.00E+00 8.25E-01 0.00E+00 1.74E+00 0.00E+00 2.69E+00
3105
US Steel Birmingham (Fairfield)
Antimony compounds 3.25E-02 2.25E-01 0.00E+00 2.25E+00 0.00E+00 0.00E+00 0.00E+00 2.51E+00
3184 Felman Production Inc.
Lead compounds 2.34E+00 1.35E-02 0.00E+00 0.00E+00 0.00E+00 0.00E+00 0.00E+00 2.35E+00
3013
Eastalco Aluminum Company
Polycyclic aromatic compounds 2.29E+00 0.00E+00 0.00E+00 0.00E+00 0.00E+00 0.00E+00 0.00E+00 2.29E+00
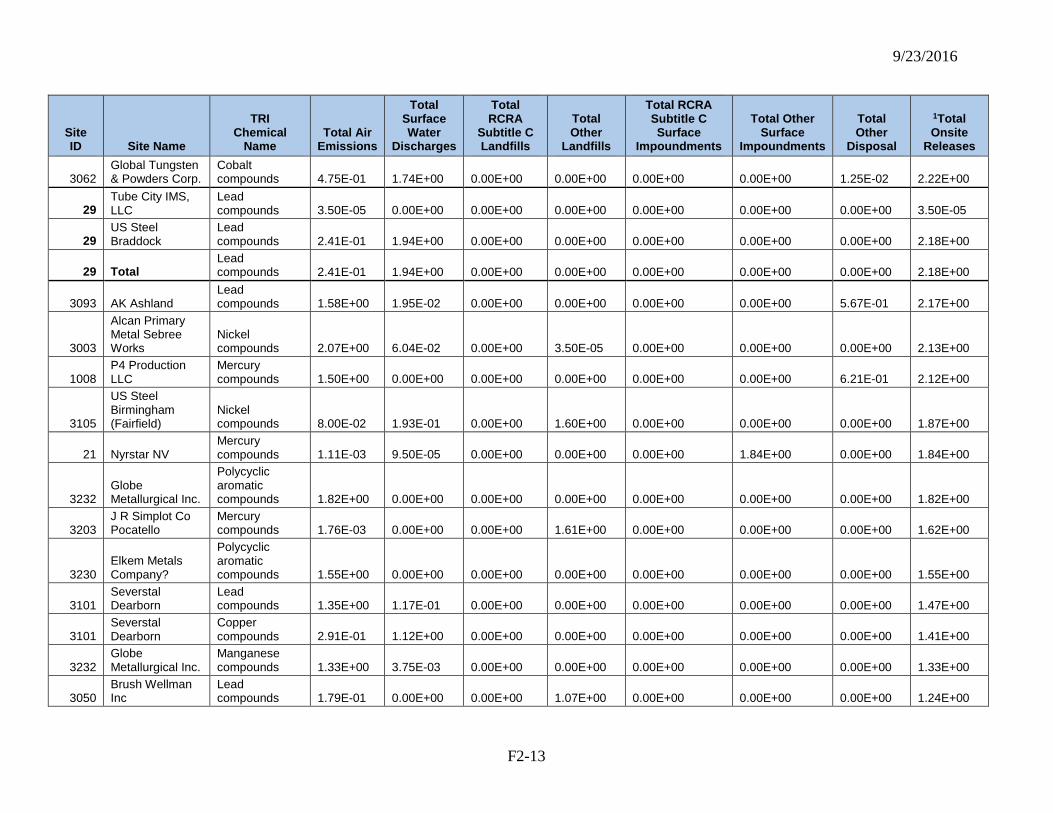
9/23/2016
F2-13
Site ID Site Name
TRI Chemical
Name Total Air
Emissions
Total Surface Water
Discharges
Total RCRA
Subtitle C Landfills
Total Other
Landfills
Total RCRA Subtitle C Surface
Impoundments
Total Other Surface
Impoundments
Total Other
Disposal
1Total Onsite
Releases
3062 Global Tungsten & Powders Corp.
Cobalt compounds 4.75E-01 1.74E+00 0.00E+00 0.00E+00 0.00E+00 0.00E+00 1.25E-02 2.22E+00
29 Tube City IMS, LLC
Lead compounds 3.50E-05 0.00E+00 0.00E+00 0.00E+00 0.00E+00 0.00E+00 0.00E+00 3.50E-05
29 US Steel Braddock
Lead compounds 2.41E-01 1.94E+00 0.00E+00 0.00E+00 0.00E+00 0.00E+00 0.00E+00 2.18E+00
29 Total Lead compounds 2.41E-01 1.94E+00 0.00E+00 0.00E+00 0.00E+00 0.00E+00 0.00E+00 2.18E+00
3093 AK Ashland Lead compounds 1.58E+00 1.95E-02 0.00E+00 0.00E+00 0.00E+00 0.00E+00 5.67E-01 2.17E+00
3003
Alcan Primary Metal Sebree Works
Nickel compounds 2.07E+00 6.04E-02 0.00E+00 3.50E-05 0.00E+00 0.00E+00 0.00E+00 2.13E+00
1008 P4 Production LLC
Mercury compounds 1.50E+00 0.00E+00 0.00E+00 0.00E+00 0.00E+00 0.00E+00 6.21E-01 2.12E+00
3105
US Steel Birmingham (Fairfield)
Nickel compounds 8.00E-02 1.93E-01 0.00E+00 1.60E+00 0.00E+00 0.00E+00 0.00E+00 1.87E+00
21 Nyrstar NV Mercury compounds 1.11E-03 9.50E-05 0.00E+00 0.00E+00 0.00E+00 1.84E+00 0.00E+00 1.84E+00
3232 Globe Metallurgical Inc.
Polycyclic aromatic compounds 1.82E+00 0.00E+00 0.00E+00 0.00E+00 0.00E+00 0.00E+00 0.00E+00 1.82E+00
3203 J R Simplot Co Pocatello
Mercury compounds 1.76E-03 0.00E+00 0.00E+00 1.61E+00 0.00E+00 0.00E+00 0.00E+00 1.62E+00
3230 Elkem Metals Company?
Polycyclic aromatic compounds 1.55E+00 0.00E+00 0.00E+00 0.00E+00 0.00E+00 0.00E+00 0.00E+00 1.55E+00
3101 Severstal Dearborn
Lead compounds 1.35E+00 1.17E-01 0.00E+00 0.00E+00 0.00E+00 0.00E+00 0.00E+00 1.47E+00
3101 Severstal Dearborn
Copper compounds 2.91E-01 1.12E+00 0.00E+00 0.00E+00 0.00E+00 0.00E+00 0.00E+00 1.41E+00
3232 Globe Metallurgical Inc.
Manganese compounds 1.33E+00 3.75E-03 0.00E+00 0.00E+00 0.00E+00 0.00E+00 0.00E+00 1.33E+00
3050 Brush Wellman Inc
Lead compounds 1.79E-01 0.00E+00 0.00E+00 1.07E+00 0.00E+00 0.00E+00 0.00E+00 1.24E+00
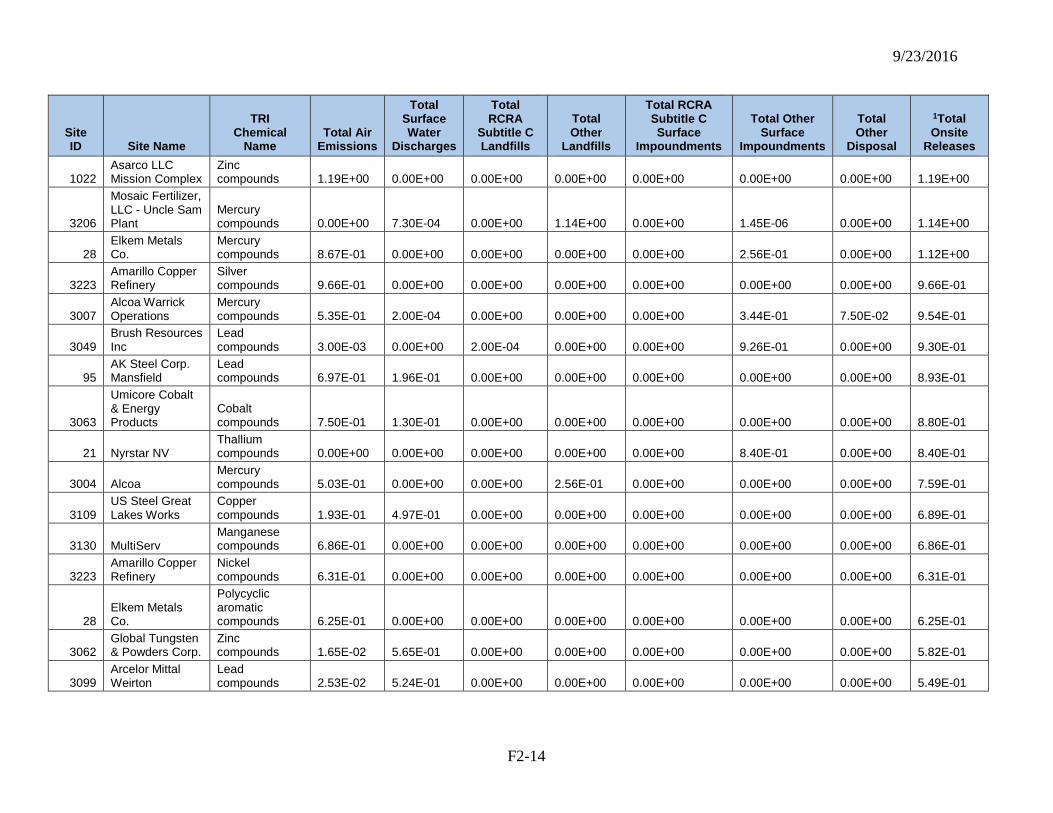
9/23/2016
F2-14
Site ID Site Name
TRI Chemical
Name Total Air
Emissions
Total Surface Water
Discharges
Total RCRA
Subtitle C Landfills
Total Other
Landfills
Total RCRA Subtitle C Surface
Impoundments
Total Other Surface
Impoundments
Total Other
Disposal
1Total Onsite
Releases
1022 Asarco LLC Mission Complex
Zinc compounds 1.19E+00 0.00E+00 0.00E+00 0.00E+00 0.00E+00 0.00E+00 0.00E+00 1.19E+00
3206
Mosaic Fertilizer, LLC - Uncle Sam Plant
Mercury compounds 0.00E+00 7.30E-04 0.00E+00 1.14E+00 0.00E+00 1.45E-06 0.00E+00 1.14E+00
28 Elkem Metals Co.
Mercury compounds 8.67E-01 0.00E+00 0.00E+00 0.00E+00 0.00E+00 2.56E-01 0.00E+00 1.12E+00
3223 Amarillo Copper Refinery
Silver compounds 9.66E-01 0.00E+00 0.00E+00 0.00E+00 0.00E+00 0.00E+00 0.00E+00 9.66E-01
3007 Alcoa Warrick Operations
Mercury compounds 5.35E-01 2.00E-04 0.00E+00 0.00E+00 0.00E+00 3.44E-01 7.50E-02 9.54E-01
3049 Brush Resources Inc
Lead compounds 3.00E-03 0.00E+00 2.00E-04 0.00E+00 0.00E+00 9.26E-01 0.00E+00 9.30E-01
95 AK Steel Corp. Mansfield
Lead compounds 6.97E-01 1.96E-01 0.00E+00 0.00E+00 0.00E+00 0.00E+00 0.00E+00 8.93E-01
3063
Umicore Cobalt & Energy Products
Cobalt compounds 7.50E-01 1.30E-01 0.00E+00 0.00E+00 0.00E+00 0.00E+00 0.00E+00 8.80E-01
21 Nyrstar NV Thallium compounds 0.00E+00 0.00E+00 0.00E+00 0.00E+00 0.00E+00 8.40E-01 0.00E+00 8.40E-01
3004 Alcoa Mercury compounds 5.03E-01 0.00E+00 0.00E+00 2.56E-01 0.00E+00 0.00E+00 0.00E+00 7.59E-01
3109 US Steel Great Lakes Works
Copper compounds 1.93E-01 4.97E-01 0.00E+00 0.00E+00 0.00E+00 0.00E+00 0.00E+00 6.89E-01
3130 MultiServ Manganese compounds 6.86E-01 0.00E+00 0.00E+00 0.00E+00 0.00E+00 0.00E+00 0.00E+00 6.86E-01
3223 Amarillo Copper Refinery
Nickel compounds 6.31E-01 0.00E+00 0.00E+00 0.00E+00 0.00E+00 0.00E+00 0.00E+00 6.31E-01
28 Elkem Metals Co.
Polycyclic aromatic compounds 6.25E-01 0.00E+00 0.00E+00 0.00E+00 0.00E+00 0.00E+00 0.00E+00 6.25E-01
3062 Global Tungsten & Powders Corp.
Zinc compounds 1.65E-02 5.65E-01 0.00E+00 0.00E+00 0.00E+00 0.00E+00 0.00E+00 5.82E-01
3099 Arcelor Mittal Weirton
Lead compounds 2.53E-02 5.24E-01 0.00E+00 0.00E+00 0.00E+00 0.00E+00 0.00E+00 5.49E-01
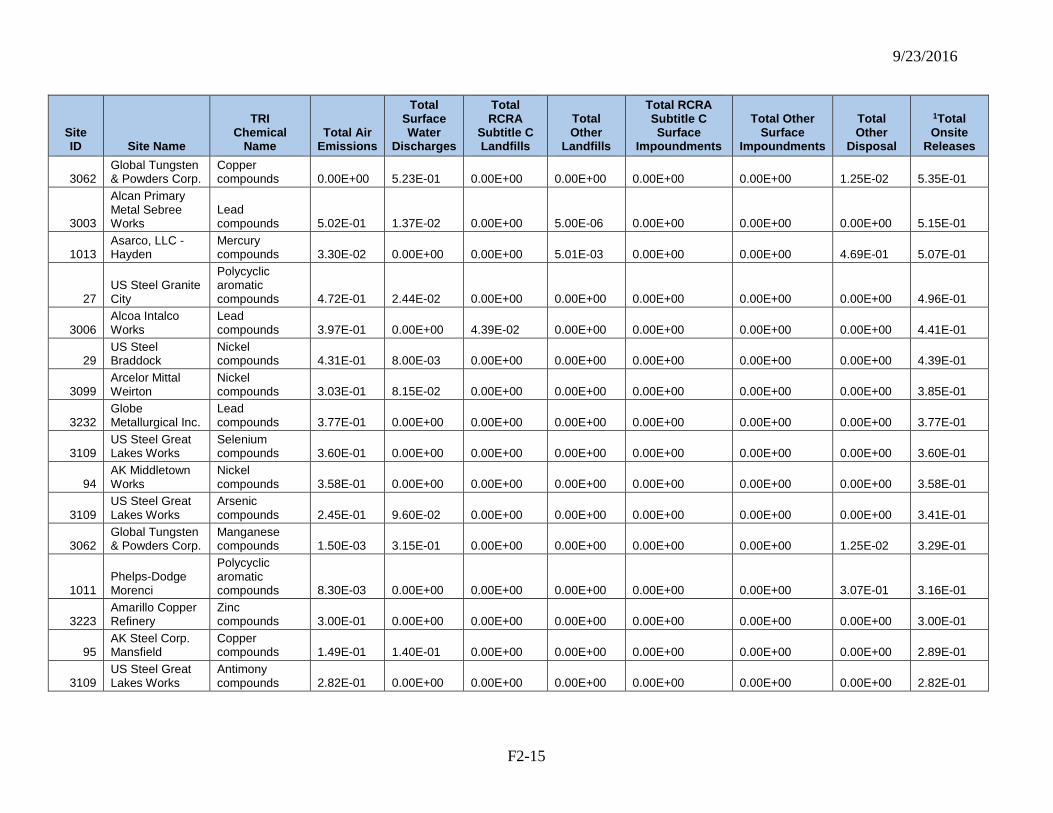
9/23/2016
F2-15
Site ID Site Name
TRI Chemical
Name Total Air
Emissions
Total Surface Water
Discharges
Total RCRA
Subtitle C Landfills
Total Other
Landfills
Total RCRA Subtitle C Surface
Impoundments
Total Other Surface
Impoundments
Total Other
Disposal
1Total Onsite
Releases
3062 Global Tungsten & Powders Corp.
Copper compounds 0.00E+00 5.23E-01 0.00E+00 0.00E+00 0.00E+00 0.00E+00 1.25E-02 5.35E-01
3003
Alcan Primary Metal Sebree Works
Lead compounds 5.02E-01 1.37E-02 0.00E+00 5.00E-06 0.00E+00 0.00E+00 0.00E+00 5.15E-01
1013 Asarco, LLC - Hayden
Mercury compounds 3.30E-02 0.00E+00 0.00E+00 5.01E-03 0.00E+00 0.00E+00 4.69E-01 5.07E-01
27 US Steel Granite City
Polycyclic aromatic compounds 4.72E-01 2.44E-02 0.00E+00 0.00E+00 0.00E+00 0.00E+00 0.00E+00 4.96E-01
3006 Alcoa Intalco Works
Lead compounds 3.97E-01 0.00E+00 4.39E-02 0.00E+00 0.00E+00 0.00E+00 0.00E+00 4.41E-01
29 US Steel Braddock
Nickel compounds 4.31E-01 8.00E-03 0.00E+00 0.00E+00 0.00E+00 0.00E+00 0.00E+00 4.39E-01
3099 Arcelor Mittal Weirton
Nickel compounds 3.03E-01 8.15E-02 0.00E+00 0.00E+00 0.00E+00 0.00E+00 0.00E+00 3.85E-01
3232 Globe Metallurgical Inc.
Lead compounds 3.77E-01 0.00E+00 0.00E+00 0.00E+00 0.00E+00 0.00E+00 0.00E+00 3.77E-01
3109 US Steel Great Lakes Works
Selenium compounds 3.60E-01 0.00E+00 0.00E+00 0.00E+00 0.00E+00 0.00E+00 0.00E+00 3.60E-01
94 AK Middletown Works
Nickel compounds 3.58E-01 0.00E+00 0.00E+00 0.00E+00 0.00E+00 0.00E+00 0.00E+00 3.58E-01
3109 US Steel Great Lakes Works
Arsenic compounds 2.45E-01 9.60E-02 0.00E+00 0.00E+00 0.00E+00 0.00E+00 0.00E+00 3.41E-01
3062 Global Tungsten & Powders Corp.
Manganese compounds 1.50E-03 3.15E-01 0.00E+00 0.00E+00 0.00E+00 0.00E+00 1.25E-02 3.29E-01
1011 Phelps-Dodge Morenci
Polycyclic aromatic compounds 8.30E-03 0.00E+00 0.00E+00 0.00E+00 0.00E+00 0.00E+00 3.07E-01 3.16E-01
3223 Amarillo Copper Refinery
Zinc compounds 3.00E-01 0.00E+00 0.00E+00 0.00E+00 0.00E+00 0.00E+00 0.00E+00 3.00E-01
95 AK Steel Corp. Mansfield
Copper compounds 1.49E-01 1.40E-01 0.00E+00 0.00E+00 0.00E+00 0.00E+00 0.00E+00 2.89E-01
3109 US Steel Great Lakes Works
Antimony compounds 2.82E-01 0.00E+00 0.00E+00 0.00E+00 0.00E+00 0.00E+00 0.00E+00 2.82E-01
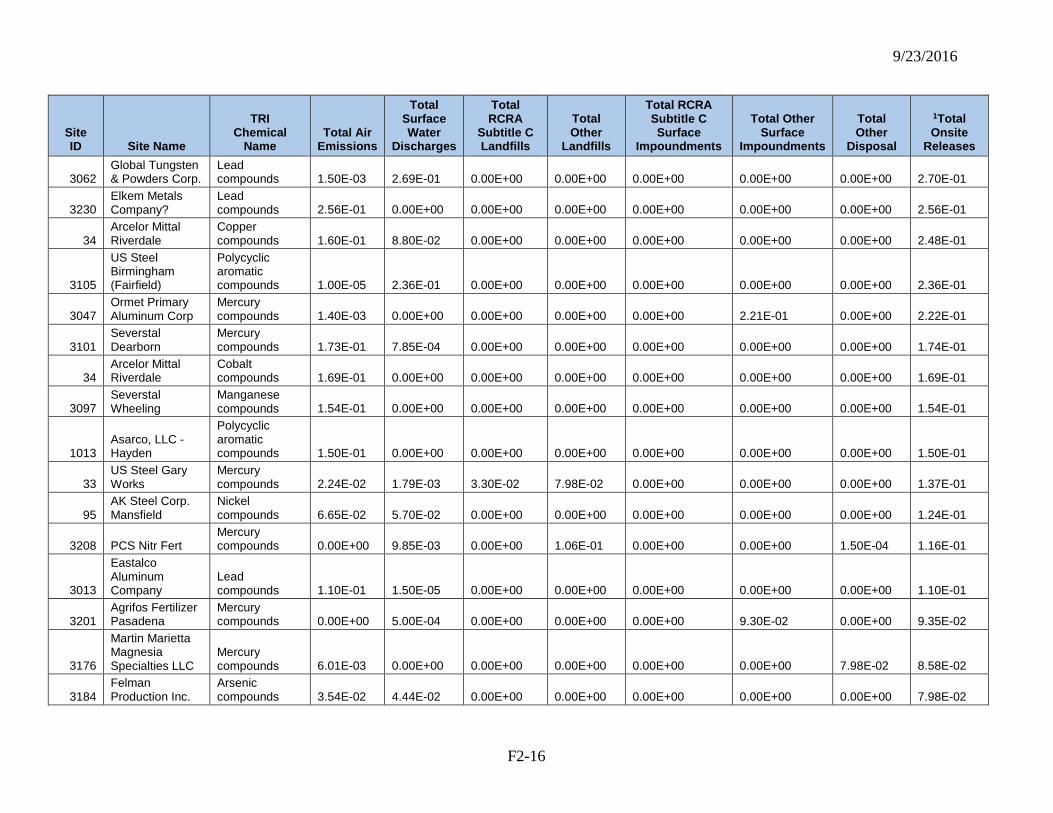
9/23/2016
F2-16
Site ID Site Name
TRI Chemical
Name Total Air
Emissions
Total Surface Water
Discharges
Total RCRA
Subtitle C Landfills
Total Other
Landfills
Total RCRA Subtitle C Surface
Impoundments
Total Other Surface
Impoundments
Total Other
Disposal
1Total Onsite
Releases
3062 Global Tungsten & Powders Corp.
Lead compounds 1.50E-03 2.69E-01 0.00E+00 0.00E+00 0.00E+00 0.00E+00 0.00E+00 2.70E-01
3230 Elkem Metals Company?
Lead compounds 2.56E-01 0.00E+00 0.00E+00 0.00E+00 0.00E+00 0.00E+00 0.00E+00 2.56E-01
34 Arcelor Mittal Riverdale
Copper compounds 1.60E-01 8.80E-02 0.00E+00 0.00E+00 0.00E+00 0.00E+00 0.00E+00 2.48E-01
3105
US Steel Birmingham (Fairfield)
Polycyclic aromatic compounds 1.00E-05 2.36E-01 0.00E+00 0.00E+00 0.00E+00 0.00E+00 0.00E+00 2.36E-01
3047 Ormet Primary Aluminum Corp
Mercury compounds 1.40E-03 0.00E+00 0.00E+00 0.00E+00 0.00E+00 2.21E-01 0.00E+00 2.22E-01
3101 Severstal Dearborn
Mercury compounds 1.73E-01 7.85E-04 0.00E+00 0.00E+00 0.00E+00 0.00E+00 0.00E+00 1.74E-01
34 Arcelor Mittal Riverdale
Cobalt compounds 1.69E-01 0.00E+00 0.00E+00 0.00E+00 0.00E+00 0.00E+00 0.00E+00 1.69E-01
3097 Severstal Wheeling
Manganese compounds 1.54E-01 0.00E+00 0.00E+00 0.00E+00 0.00E+00 0.00E+00 0.00E+00 1.54E-01
1013 Asarco, LLC - Hayden
Polycyclic aromatic compounds 1.50E-01 0.00E+00 0.00E+00 0.00E+00 0.00E+00 0.00E+00 0.00E+00 1.50E-01
33 US Steel Gary Works
Mercury compounds 2.24E-02 1.79E-03 3.30E-02 7.98E-02 0.00E+00 0.00E+00 0.00E+00 1.37E-01
95 AK Steel Corp. Mansfield
Nickel compounds 6.65E-02 5.70E-02 0.00E+00 0.00E+00 0.00E+00 0.00E+00 0.00E+00 1.24E-01
3208 PCS Nitr Fert Mercury compounds 0.00E+00 9.85E-03 0.00E+00 1.06E-01 0.00E+00 0.00E+00 1.50E-04 1.16E-01
3013
Eastalco Aluminum Company
Lead compounds 1.10E-01 1.50E-05 0.00E+00 0.00E+00 0.00E+00 0.00E+00 0.00E+00 1.10E-01
3201 Agrifos Fertilizer Pasadena
Mercury compounds 0.00E+00 5.00E-04 0.00E+00 0.00E+00 0.00E+00 9.30E-02 0.00E+00 9.35E-02
3176
Martin Marietta Magnesia Specialties LLC
Mercury compounds 6.01E-03 0.00E+00 0.00E+00 0.00E+00 0.00E+00 0.00E+00 7.98E-02 8.58E-02
3184 Felman Production Inc.
Arsenic compounds 3.54E-02 4.44E-02 0.00E+00 0.00E+00 0.00E+00 0.00E+00 0.00E+00 7.98E-02
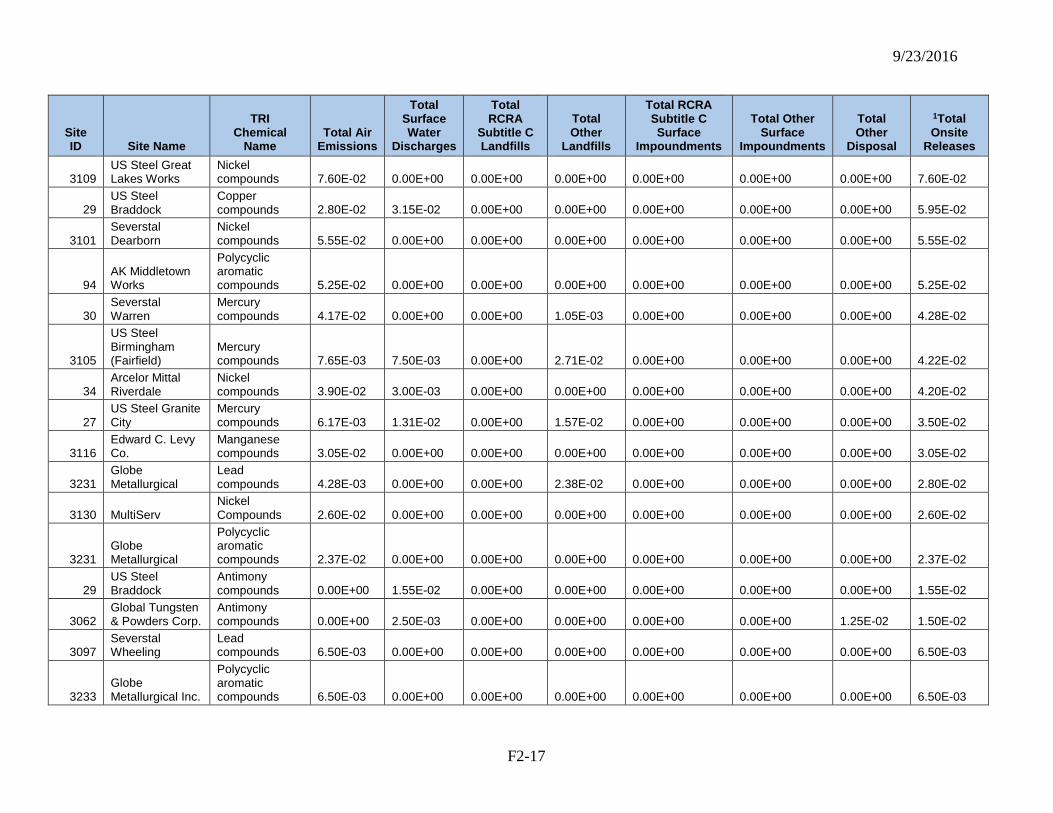
9/23/2016
F2-17
Site ID Site Name
TRI Chemical
Name Total Air
Emissions
Total Surface Water
Discharges
Total RCRA
Subtitle C Landfills
Total Other
Landfills
Total RCRA Subtitle C Surface
Impoundments
Total Other Surface
Impoundments
Total Other
Disposal
1Total Onsite
Releases
3109 US Steel Great Lakes Works
Nickel compounds 7.60E-02 0.00E+00 0.00E+00 0.00E+00 0.00E+00 0.00E+00 0.00E+00 7.60E-02
29 US Steel Braddock
Copper compounds 2.80E-02 3.15E-02 0.00E+00 0.00E+00 0.00E+00 0.00E+00 0.00E+00 5.95E-02
3101 Severstal Dearborn
Nickel compounds 5.55E-02 0.00E+00 0.00E+00 0.00E+00 0.00E+00 0.00E+00 0.00E+00 5.55E-02
94 AK Middletown Works
Polycyclic aromatic compounds 5.25E-02 0.00E+00 0.00E+00 0.00E+00 0.00E+00 0.00E+00 0.00E+00 5.25E-02
30 Severstal Warren
Mercury compounds 4.17E-02 0.00E+00 0.00E+00 1.05E-03 0.00E+00 0.00E+00 0.00E+00 4.28E-02
3105
US Steel Birmingham (Fairfield)
Mercury compounds 7.65E-03 7.50E-03 0.00E+00 2.71E-02 0.00E+00 0.00E+00 0.00E+00 4.22E-02
34 Arcelor Mittal Riverdale
Nickel compounds 3.90E-02 3.00E-03 0.00E+00 0.00E+00 0.00E+00 0.00E+00 0.00E+00 4.20E-02
27 US Steel Granite City
Mercury compounds 6.17E-03 1.31E-02 0.00E+00 1.57E-02 0.00E+00 0.00E+00 0.00E+00 3.50E-02
3116 Edward C. Levy Co.
Manganese compounds 3.05E-02 0.00E+00 0.00E+00 0.00E+00 0.00E+00 0.00E+00 0.00E+00 3.05E-02
3231 Globe Metallurgical
Lead compounds 4.28E-03 0.00E+00 0.00E+00 2.38E-02 0.00E+00 0.00E+00 0.00E+00 2.80E-02
3130 MultiServ Nickel Compounds 2.60E-02 0.00E+00 0.00E+00 0.00E+00 0.00E+00 0.00E+00 0.00E+00 2.60E-02
3231 Globe Metallurgical
Polycyclic aromatic compounds 2.37E-02 0.00E+00 0.00E+00 0.00E+00 0.00E+00 0.00E+00 0.00E+00 2.37E-02
29 US Steel Braddock
Antimony compounds 0.00E+00 1.55E-02 0.00E+00 0.00E+00 0.00E+00 0.00E+00 0.00E+00 1.55E-02
3062 Global Tungsten & Powders Corp.
Antimony compounds 0.00E+00 2.50E-03 0.00E+00 0.00E+00 0.00E+00 0.00E+00 1.25E-02 1.50E-02
3097 Severstal Wheeling
Lead compounds 6.50E-03 0.00E+00 0.00E+00 0.00E+00 0.00E+00 0.00E+00 0.00E+00 6.50E-03
3233 Globe Metallurgical Inc.
Polycyclic aromatic compounds 6.50E-03 0.00E+00 0.00E+00 0.00E+00 0.00E+00 0.00E+00 0.00E+00 6.50E-03
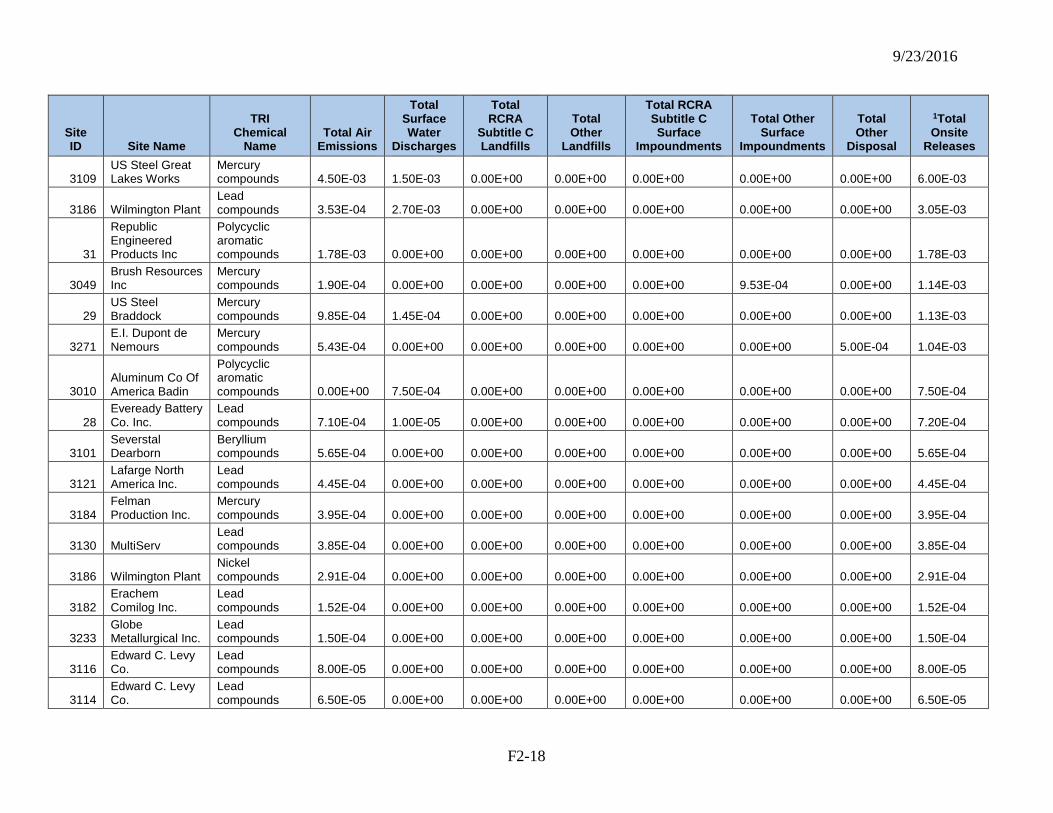
9/23/2016
F2-18
Site ID Site Name
TRI Chemical
Name Total Air
Emissions
Total Surface Water
Discharges
Total RCRA
Subtitle C Landfills
Total Other
Landfills
Total RCRA Subtitle C Surface
Impoundments
Total Other Surface
Impoundments
Total Other
Disposal
1Total Onsite
Releases
3109 US Steel Great Lakes Works
Mercury compounds 4.50E-03 1.50E-03 0.00E+00 0.00E+00 0.00E+00 0.00E+00 0.00E+00 6.00E-03
3186 Wilmington Plant Lead compounds 3.53E-04 2.70E-03 0.00E+00 0.00E+00 0.00E+00 0.00E+00 0.00E+00 3.05E-03
31
Republic Engineered Products Inc
Polycyclic aromatic compounds 1.78E-03 0.00E+00 0.00E+00 0.00E+00 0.00E+00 0.00E+00 0.00E+00 1.78E-03
3049 Brush Resources Inc
Mercury compounds 1.90E-04 0.00E+00 0.00E+00 0.00E+00 0.00E+00 9.53E-04 0.00E+00 1.14E-03
29 US Steel Braddock
Mercury compounds 9.85E-04 1.45E-04 0.00E+00 0.00E+00 0.00E+00 0.00E+00 0.00E+00 1.13E-03
3271 E.I. Dupont de Nemours
Mercury compounds 5.43E-04 0.00E+00 0.00E+00 0.00E+00 0.00E+00 0.00E+00 5.00E-04 1.04E-03
3010 Aluminum Co Of America Badin
Polycyclic aromatic compounds 0.00E+00 7.50E-04 0.00E+00 0.00E+00 0.00E+00 0.00E+00 0.00E+00 7.50E-04
28 Eveready Battery Co. Inc.
Lead compounds 7.10E-04 1.00E-05 0.00E+00 0.00E+00 0.00E+00 0.00E+00 0.00E+00 7.20E-04
3101 Severstal Dearborn
Beryllium compounds 5.65E-04 0.00E+00 0.00E+00 0.00E+00 0.00E+00 0.00E+00 0.00E+00 5.65E-04
3121 Lafarge North America Inc.
Lead compounds 4.45E-04 0.00E+00 0.00E+00 0.00E+00 0.00E+00 0.00E+00 0.00E+00 4.45E-04
3184 Felman Production Inc.
Mercury compounds 3.95E-04 0.00E+00 0.00E+00 0.00E+00 0.00E+00 0.00E+00 0.00E+00 3.95E-04
3130 MultiServ Lead compounds 3.85E-04 0.00E+00 0.00E+00 0.00E+00 0.00E+00 0.00E+00 0.00E+00 3.85E-04
3186 Wilmington Plant Nickel compounds 2.91E-04 0.00E+00 0.00E+00 0.00E+00 0.00E+00 0.00E+00 0.00E+00 2.91E-04
3182 Erachem Comilog Inc.
Lead compounds 1.52E-04 0.00E+00 0.00E+00 0.00E+00 0.00E+00 0.00E+00 0.00E+00 1.52E-04
3233 Globe Metallurgical Inc.
Lead compounds 1.50E-04 0.00E+00 0.00E+00 0.00E+00 0.00E+00 0.00E+00 0.00E+00 1.50E-04
3116 Edward C. Levy Co.
Lead compounds 8.00E-05 0.00E+00 0.00E+00 0.00E+00 0.00E+00 0.00E+00 0.00E+00 8.00E-05
3114 Edward C. Levy Co.
Lead compounds 6.50E-05 0.00E+00 0.00E+00 0.00E+00 0.00E+00 0.00E+00 0.00E+00 6.50E-05
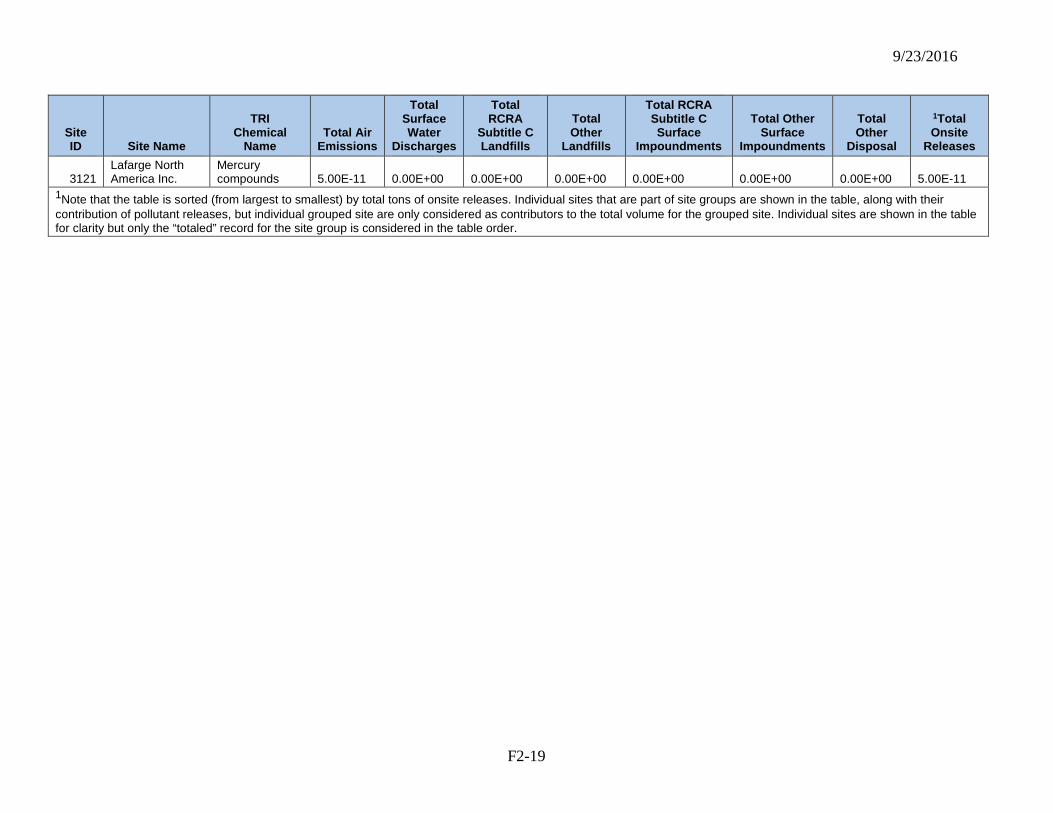
9/23/2016
F2-19
Site ID Site Name
TRI Chemical
Name Total Air
Emissions
Total Surface Water
Discharges
Total RCRA
Subtitle C Landfills
Total Other
Landfills
Total RCRA Subtitle C Surface
Impoundments
Total Other Surface
Impoundments
Total Other
Disposal
1Total Onsite
Releases
3121 Lafarge North America Inc.
Mercury compounds 5.00E-11 0.00E+00 0.00E+00 0.00E+00 0.00E+00 0.00E+00 0.00E+00 5.00E-11
1Note that the table is sorted (from largest to smallest) by total tons of onsite releases. Individual sites that are part of site groups are shown in the table, along with their contribution of pollutant releases, but individual grouped site are only considered as contributors to the total volume for the grouped site. Individual sites are shown in the table for clarity but only the “totaled” record for the site group is considered in the table order.
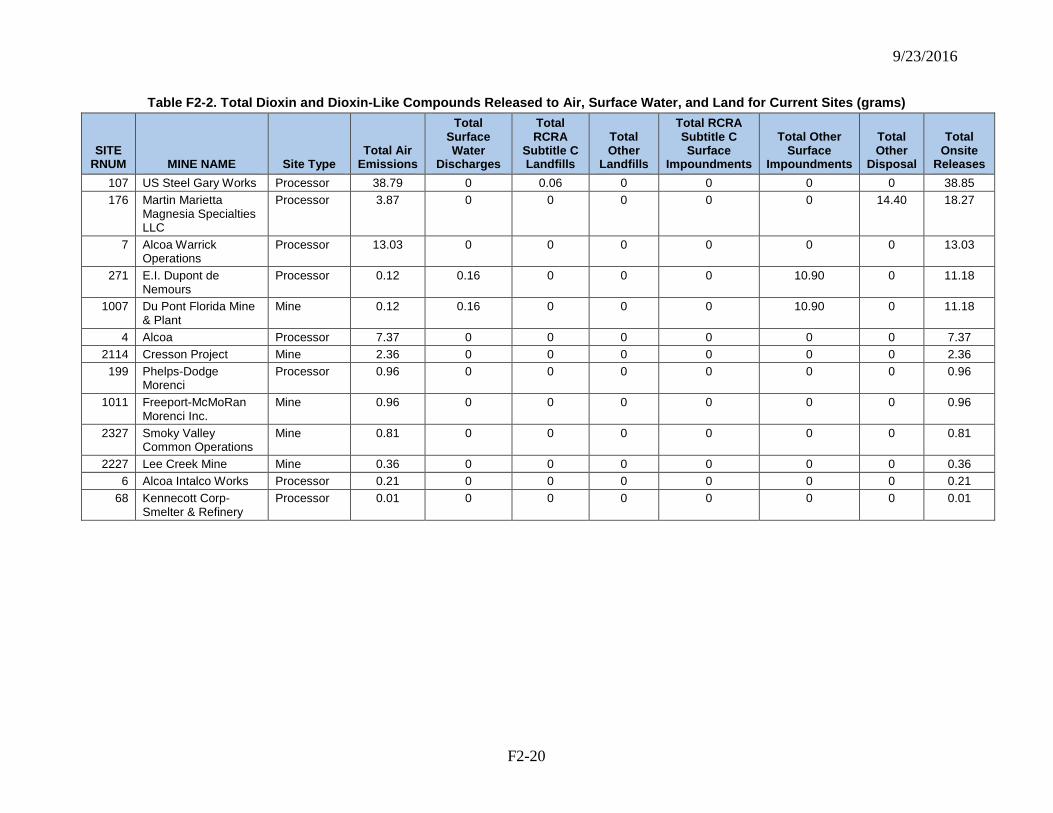
9/23/2016
F2-20
Table F2-2. Total Dioxin and Dioxin-Like Compounds Released to Air, Surface Water, and Land for Current Sites (grams)
SITE RNUM MINE NAME Site Type
Total Air Emissions
Total Surface Water
Discharges
Total RCRA
Subtitle C Landfills
Total Other
Landfills
Total RCRA Subtitle C Surface
Impoundments
Total Other Surface
Impoundments
Total Other
Disposal
Total Onsite
Releases 107 US Steel Gary Works Processor 38.79 0 0.06 0 0 0 0 38.85 176 Martin Marietta
Magnesia Specialties LLC
Processor 3.87 0 0 0 0 0 14.40 18.27
7 Alcoa Warrick Operations
Processor 13.03 0 0 0 0 0 0 13.03
271 E.I. Dupont de Nemours
Processor 0.12 0.16 0 0 0 10.90 0 11.18
1007 Du Pont Florida Mine & Plant
Mine 0.12 0.16 0 0 0 10.90 0 11.18
4 Alcoa Processor 7.37 0 0 0 0 0 0 7.37 2114 Cresson Project Mine 2.36 0 0 0 0 0 0 2.36
199 Phelps-Dodge Morenci
Processor 0.96 0 0 0 0 0 0 0.96
1011 Freeport-McMoRan Morenci Inc.
Mine 0.96 0 0 0 0 0 0 0.96
2327 Smoky Valley Common Operations
Mine 0.81 0 0 0 0 0 0 0.81
2227 Lee Creek Mine Mine 0.36 0 0 0 0 0 0 0.36 6 Alcoa Intalco Works Processor 0.21 0 0 0 0 0 0 0.21
68 Kennecott Corp-Smelter & Refinery
Processor 0.01 0 0 0 0 0 0 0.01
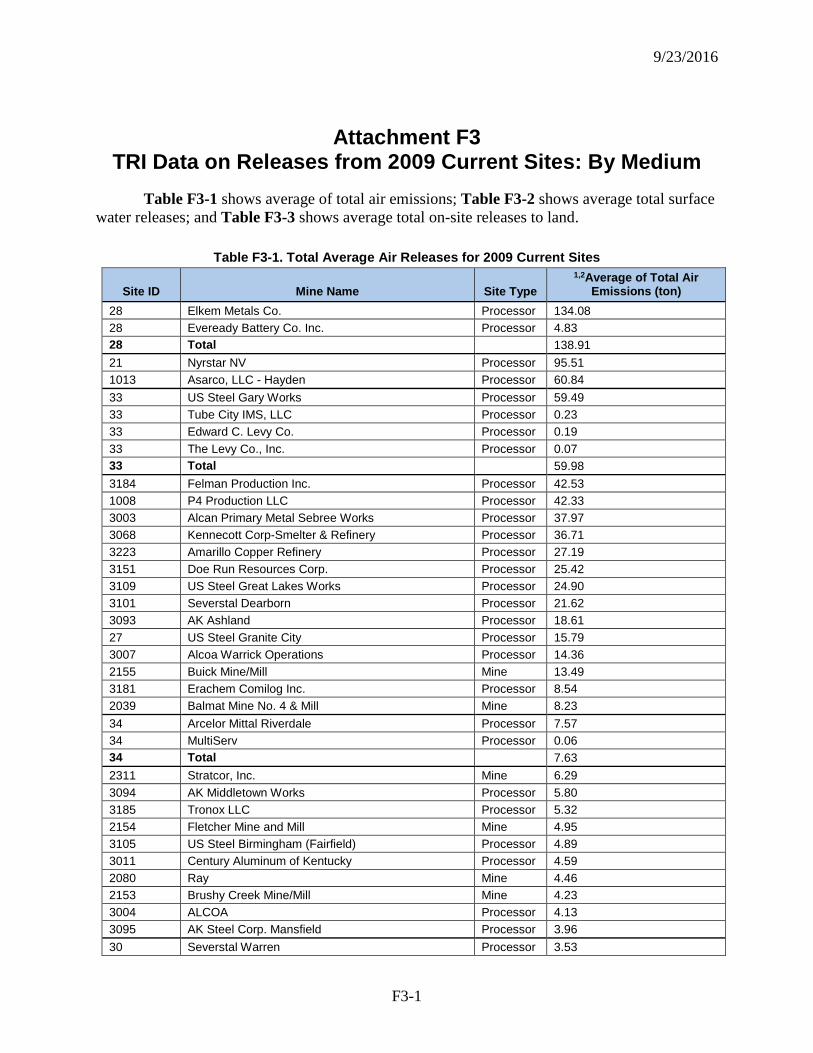
9/23/2016
F3-1
Attachment F3 TRI Data on Releases from 2009 Current Sites: By Medium
Table F3-1 shows average of total air emissions; Table F3-2 shows average total surface water releases; and Table F3-3 shows average total on-site releases to land.
Table F3-1. Total Average Air Releases for 2009 Current Sites
Site ID Mine Name Site Type 1,2Average of Total Air
Emissions (ton) 28 Elkem Metals Co. Processor 134.08 28 Eveready Battery Co. Inc. Processor 4.83 28 Total 138.91 21 Nyrstar NV Processor 95.51 1013 Asarco, LLC - Hayden Processor 60.84 33 US Steel Gary Works Processor 59.49 33 Tube City IMS, LLC Processor 0.23 33 Edward C. Levy Co. Processor 0.19 33 The Levy Co., Inc. Processor 0.07 33 Total 59.98 3184 Felman Production Inc. Processor 42.53 1008 P4 Production LLC Processor 42.33 3003 Alcan Primary Metal Sebree Works Processor 37.97 3068 Kennecott Corp-Smelter & Refinery Processor 36.71 3223 Amarillo Copper Refinery Processor 27.19 3151 Doe Run Resources Corp. Processor 25.42 3109 US Steel Great Lakes Works Processor 24.90 3101 Severstal Dearborn Processor 21.62 3093 AK Ashland Processor 18.61 27 US Steel Granite City Processor 15.79 3007 Alcoa Warrick Operations Processor 14.36 2155 Buick Mine/Mill Mine 13.49 3181 Erachem Comilog Inc. Processor 8.54 2039 Balmat Mine No. 4 & Mill Mine 8.23 34 Arcelor Mittal Riverdale Processor 7.57 34 MultiServ Processor 0.06 34 Total 7.63 2311 Stratcor, Inc. Mine 6.29 3094 AK Middletown Works Processor 5.80 3185 Tronox LLC Processor 5.32 2154 Fletcher Mine and Mill Mine 4.95 3105 US Steel Birmingham (Fairfield) Processor 4.89 3011 Century Aluminum of Kentucky Processor 4.59 2080 Ray Mine 4.46 2153 Brushy Creek Mine/Mill Mine 4.23 3004 ALCOA Processor 4.13 3095 AK Steel Corp. Mansfield Processor 3.96 30 Severstal Warren Processor 3.53
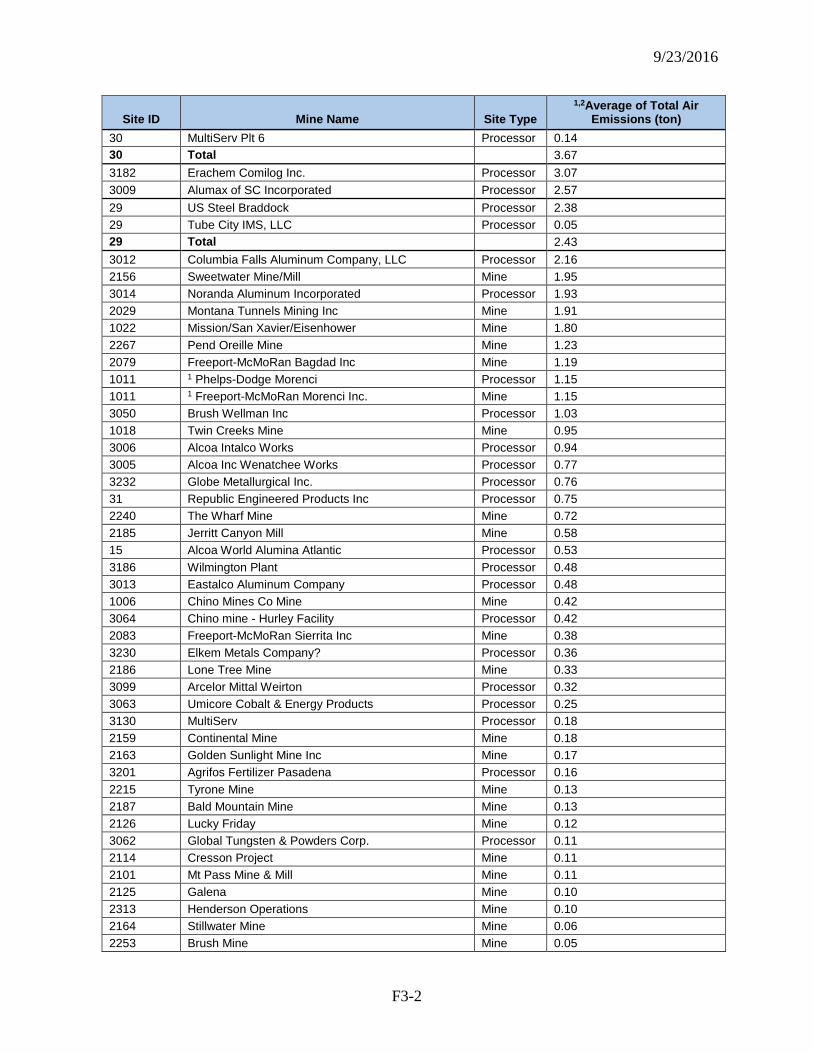
9/23/2016
F3-2
Site ID Mine Name Site Type 1,2Average of Total Air
Emissions (ton) 30 MultiServ Plt 6 Processor 0.14 30 Total 3.67 3182 Erachem Comilog Inc. Processor 3.07 3009 Alumax of SC Incorporated Processor 2.57 29 US Steel Braddock Processor 2.38 29 Tube City IMS, LLC Processor 0.05 29 Total 2.43 3012 Columbia Falls Aluminum Company, LLC Processor 2.16 2156 Sweetwater Mine/Mill Mine 1.95 3014 Noranda Aluminum Incorporated Processor 1.93 2029 Montana Tunnels Mining Inc Mine 1.91 1022 Mission/San Xavier/Eisenhower Mine 1.80 2267 Pend Oreille Mine Mine 1.23 2079 Freeport-McMoRan Bagdad Inc Mine 1.19 1011 1 Phelps-Dodge Morenci Processor 1.15 1011 1 Freeport-McMoRan Morenci Inc. Mine 1.15 3050 Brush Wellman Inc Processor 1.03 1018 Twin Creeks Mine Mine 0.95 3006 Alcoa Intalco Works Processor 0.94 3005 Alcoa Inc Wenatchee Works Processor 0.77 3232 Globe Metallurgical Inc. Processor 0.76 31 Republic Engineered Products Inc Processor 0.75 2240 The Wharf Mine Mine 0.72 2185 Jerritt Canyon Mill Mine 0.58 15 Alcoa World Alumina Atlantic Processor 0.53 3186 Wilmington Plant Processor 0.48 3013 Eastalco Aluminum Company Processor 0.48 1006 Chino Mines Co Mine Mine 0.42 3064 Chino mine - Hurley Facility Processor 0.42 2083 Freeport-McMoRan Sierrita Inc Mine 0.38 3230 Elkem Metals Company? Processor 0.36 2186 Lone Tree Mine Mine 0.33 3099 Arcelor Mittal Weirton Processor 0.32 3063 Umicore Cobalt & Energy Products Processor 0.25 3130 MultiServ Processor 0.18 2159 Continental Mine Mine 0.18 2163 Golden Sunlight Mine Inc Mine 0.17 3201 Agrifos Fertilizer Pasadena Processor 0.16 2215 Tyrone Mine Mine 0.13 2187 Bald Mountain Mine Mine 0.13 2126 Lucky Friday Mine 0.12 3062 Global Tungsten & Powders Corp. Processor 0.11 2114 Cresson Project Mine 0.11 2101 Mt Pass Mine & Mill Mine 0.11 2125 Galena Mine 0.10 2313 Henderson Operations Mine 0.10 2164 Stillwater Mine Mine 0.06 2253 Brush Mine Mine 0.05

9/23/2016
F3-3
Site ID Mine Name Site Type 1,2Average of Total Air
Emissions (ton) 3049 Brush Resources Inc Processor 0.05 3097 Severstal Wheeling Processor 0.05 2227 Lee Creek Mine Mine 0.05 2182 Denton-Rawhide Mine Mine 0.04 2262 Lisbon Valley Mining Co Mine 0.03 2204 Hycroft Mine Mine 0.03 2091 Freeport-McMoRan Safford Inc Mine 0.03 2309 Silver Bell Mining LLC Mine 0.03 7 Turquoise Ridge Mine Mine 0.02 2327 Smoky Valley Common Operations Mine 0.02 2192 Midas Mine Mine 0.02 2280 Fort Knox Mine Mine 0.02 3116 Edward C. Levy Co. Processor 0.01 3198 Climax Molybdenum Co. Henderson Mill Processor 0.008 1007 Du Pont Florida Mine & Plant Mine 0.004 1007 E.I. Dupont de Nemours Processor 0.004 31007 Total 0.008 3233 Globe Metallurgical Inc. Processor 0.007 3231 Globe Metallurgical Processor 0.006 2103 Mesquite Mine 0.003 14 Sherwin Alumina Processor 0.003 3203 J R Simplot Co Pocatello Processor 0.003 2124 Thompson Creek Mining Co Mine 0.003 2242 CF & I PIT Mine 0.002 2271 Kettle River Mill Site Mine 0.002 3047 Ormet Primary Aluminum Corp Processor 0.002 3176 Martin Marietta Magnesia Specialties LLC Processor 0.001 3206 Mosaic Fertilizer, LLC - Uncle Sam Plant Processor 0.0007 2104 CR Briggs Mine 0.0002 3121 Lafarge North America Inc. Processor 0.00009 3204 Mississippi Phosphates Corp. Processor 0.00006 3114 Edward C. Levy Co. Processor 0.00003 2118 Swift Creek Mine Mine 0.000004 3210 PCS Phosphate White Springs Processor 0.000004 3211 SF Phosphates Limited Company Processor 0.0000007
1TRI data for total air releases at currently active sites averaged from 2005-2009; Note that some sites did not have recorded values for the full five year period 2Note that table is sorted (from largest to smallest) by total tons of onsite releases. Individual sites that are part of site groups are shown in the table, along with their contribution of pollutant releases, but individual grouped site are only considered as contributors to the total volume for the grouped site. Individual sites are shown in the table for clarity but only the “totaled” record for the site group is considered in the table order.
3The two sites in SITE ID 1007 are listed as both a mine and a processor; the average total air emissions values are identical
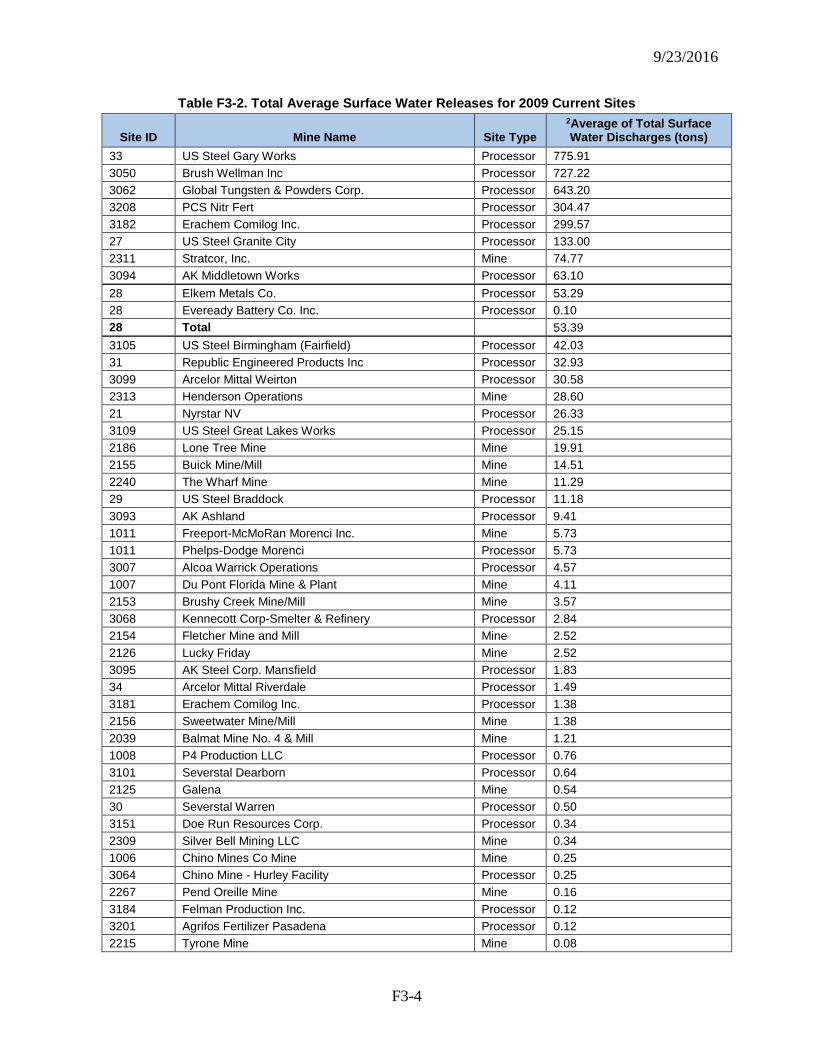
9/23/2016
F3-4
Table F3-2. Total Average Surface Water Releases for 2009 Current Sites
Site ID Mine Name Site Type 2Average of Total Surface Water Discharges (tons)
33 US Steel Gary Works Processor 775.91 3050 Brush Wellman Inc Processor 727.22 3062 Global Tungsten & Powders Corp. Processor 643.20 3208 PCS Nitr Fert Processor 304.47 3182 Erachem Comilog Inc. Processor 299.57 27 US Steel Granite City Processor 133.00 2311 Stratcor, Inc. Mine 74.77 3094 AK Middletown Works Processor 63.10 28 Elkem Metals Co. Processor 53.29 28 Eveready Battery Co. Inc. Processor 0.10 28 Total 53.39 3105 US Steel Birmingham (Fairfield) Processor 42.03 31 Republic Engineered Products Inc Processor 32.93 3099 Arcelor Mittal Weirton Processor 30.58 2313 Henderson Operations Mine 28.60 21 Nyrstar NV Processor 26.33 3109 US Steel Great Lakes Works Processor 25.15 2186 Lone Tree Mine Mine 19.91 2155 Buick Mine/Mill Mine 14.51 2240 The Wharf Mine Mine 11.29 29 US Steel Braddock Processor 11.18 3093 AK Ashland Processor 9.41 1011 Freeport-McMoRan Morenci Inc. Mine 5.73 1011 Phelps-Dodge Morenci Processor 5.73 3007 Alcoa Warrick Operations Processor 4.57 1007 Du Pont Florida Mine & Plant Mine 4.11 2153 Brushy Creek Mine/Mill Mine 3.57 3068 Kennecott Corp-Smelter & Refinery Processor 2.84 2154 Fletcher Mine and Mill Mine 2.52 2126 Lucky Friday Mine 2.52 3095 AK Steel Corp. Mansfield Processor 1.83 34 Arcelor Mittal Riverdale Processor 1.49 3181 Erachem Comilog Inc. Processor 1.38 2156 Sweetwater Mine/Mill Mine 1.38 2039 Balmat Mine No. 4 & Mill Mine 1.21 1008 P4 Production LLC Processor 0.76 3101 Severstal Dearborn Processor 0.64 2125 Galena Mine 0.54 30 Severstal Warren Processor 0.50 3151 Doe Run Resources Corp. Processor 0.34 2309 Silver Bell Mining LLC Mine 0.34 1006 Chino Mines Co Mine Mine 0.25 3064 Chino Mine - Hurley Facility Processor 0.25 2267 Pend Oreille Mine Mine 0.16 3184 Felman Production Inc. Processor 0.12 3201 Agrifos Fertilizer Pasadena Processor 0.12 2215 Tyrone Mine Mine 0.08
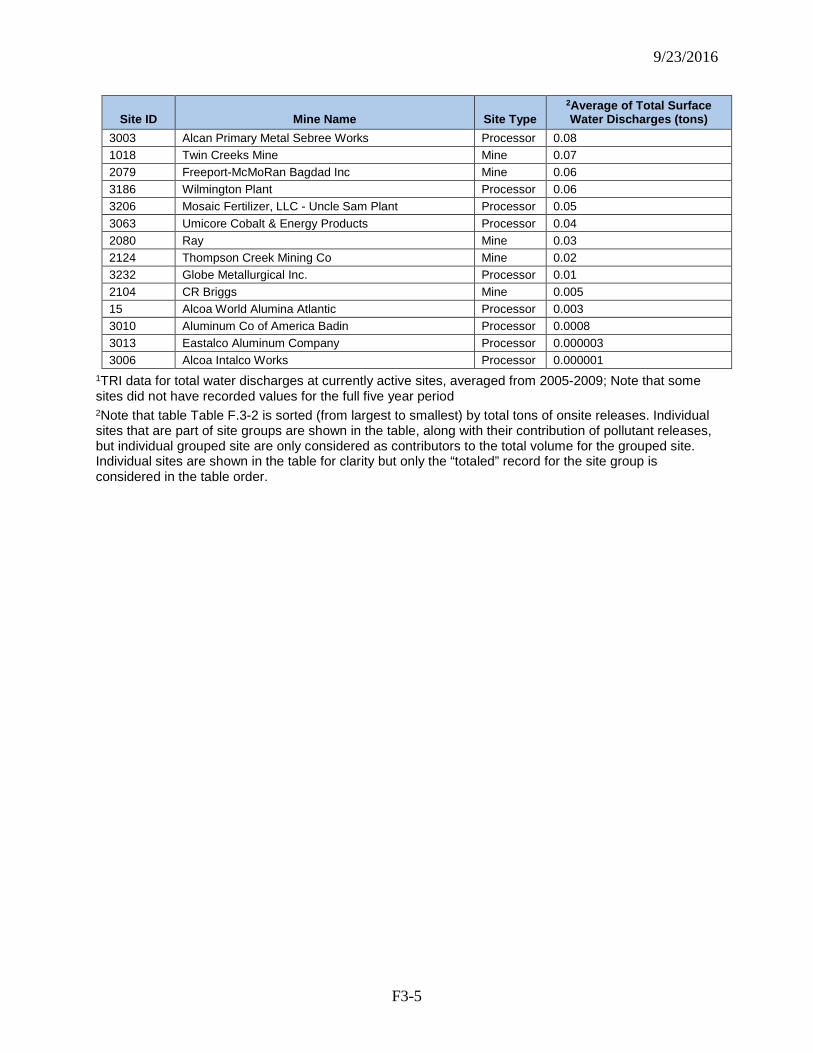
9/23/2016
F3-5
Site ID Mine Name Site Type 2Average of Total Surface Water Discharges (tons)
3003 Alcan Primary Metal Sebree Works Processor 0.08 1018 Twin Creeks Mine Mine 0.07 2079 Freeport-McMoRan Bagdad Inc Mine 0.06 3186 Wilmington Plant Processor 0.06 3206 Mosaic Fertilizer, LLC - Uncle Sam Plant Processor 0.05 3063 Umicore Cobalt & Energy Products Processor 0.04 2080 Ray Mine 0.03 2124 Thompson Creek Mining Co Mine 0.02 3232 Globe Metallurgical Inc. Processor 0.01 2104 CR Briggs Mine 0.005 15 Alcoa World Alumina Atlantic Processor 0.003 3010 Aluminum Co of America Badin Processor 0.0008 3013 Eastalco Aluminum Company Processor 0.000003 3006 Alcoa Intalco Works Processor 0.000001
1TRI data for total water discharges at currently active sites, averaged from 2005-2009; Note that some sites did not have recorded values for the full five year period 2Note that table Table F.3-2 is sorted (from largest to smallest) by total tons of onsite releases. Individual sites that are part of site groups are shown in the table, along with their contribution of pollutant releases, but individual grouped site are only considered as contributors to the total volume for the grouped site. Individual sites are shown in the table for clarity but only the “totaled” record for the site group is considered in the table order.
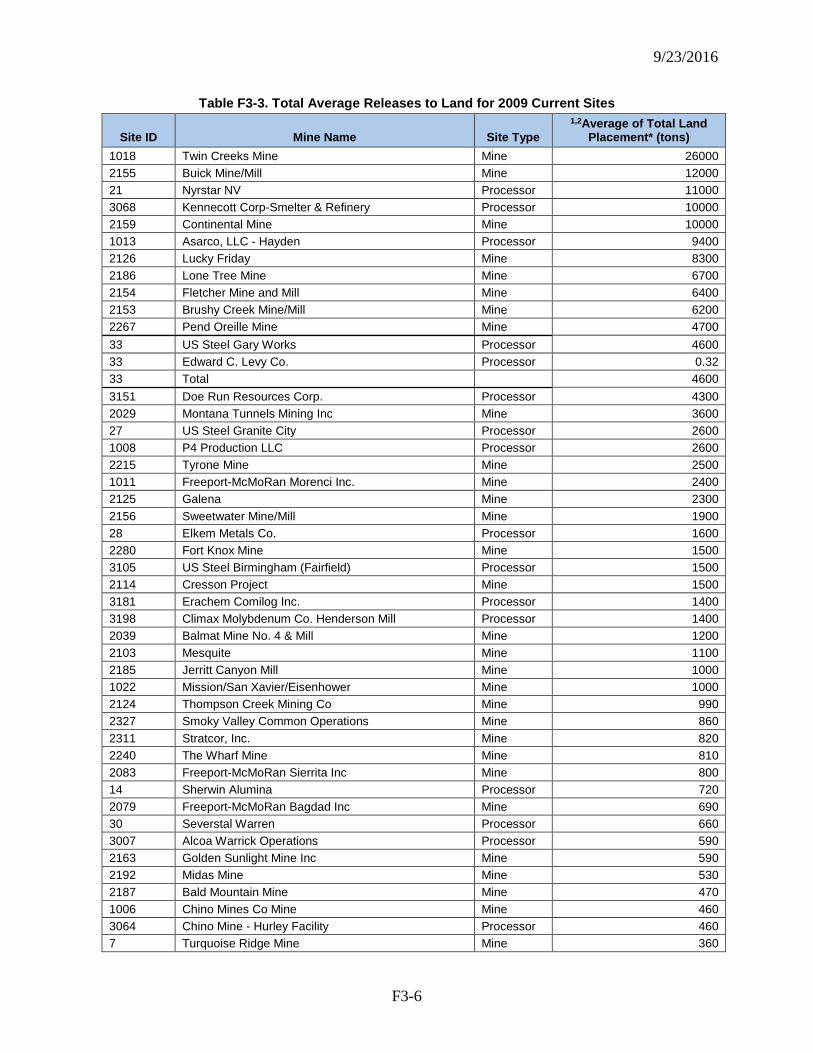
9/23/2016
F3-6
Table F3-3. Total Average Releases to Land for 2009 Current Sites
Site ID Mine Name Site Type 1,2Average of Total Land
Placement* (tons) 1018 Twin Creeks Mine Mine 26000 2155 Buick Mine/Mill Mine 12000 21 Nyrstar NV Processor 11000 3068 Kennecott Corp-Smelter & Refinery Processor 10000 2159 Continental Mine Mine 10000 1013 Asarco, LLC - Hayden Processor 9400 2126 Lucky Friday Mine 8300 2186 Lone Tree Mine Mine 6700 2154 Fletcher Mine and Mill Mine 6400 2153 Brushy Creek Mine/Mill Mine 6200 2267 Pend Oreille Mine Mine 4700 33 US Steel Gary Works Processor 4600 33 Edward C. Levy Co. Processor 0.32 33 Total 4600 3151 Doe Run Resources Corp. Processor 4300 2029 Montana Tunnels Mining Inc Mine 3600 27 US Steel Granite City Processor 2600 1008 P4 Production LLC Processor 2600 2215 Tyrone Mine Mine 2500 1011 Freeport-McMoRan Morenci Inc. Mine 2400 2125 Galena Mine 2300 2156 Sweetwater Mine/Mill Mine 1900 28 Elkem Metals Co. Processor 1600 2280 Fort Knox Mine Mine 1500 3105 US Steel Birmingham (Fairfield) Processor 1500 2114 Cresson Project Mine 1500 3181 Erachem Comilog Inc. Processor 1400 3198 Climax Molybdenum Co. Henderson Mill Processor 1400 2039 Balmat Mine No. 4 & Mill Mine 1200 2103 Mesquite Mine 1100 2185 Jerritt Canyon Mill Mine 1000 1022 Mission/San Xavier/Eisenhower Mine 1000 2124 Thompson Creek Mining Co Mine 990 2327 Smoky Valley Common Operations Mine 860 2311 Stratcor, Inc. Mine 820 2240 The Wharf Mine Mine 810 2083 Freeport-McMoRan Sierrita Inc Mine 800 14 Sherwin Alumina Processor 720 2079 Freeport-McMoRan Bagdad Inc Mine 690 30 Severstal Warren Processor 660 3007 Alcoa Warrick Operations Processor 590 2163 Golden Sunlight Mine Inc Mine 590 2192 Midas Mine Mine 530 2187 Bald Mountain Mine Mine 470 1006 Chino Mines Co Mine Mine 460 3064 Chino Mine - Hurley Facility Processor 460 7 Turquoise Ridge Mine Mine 360
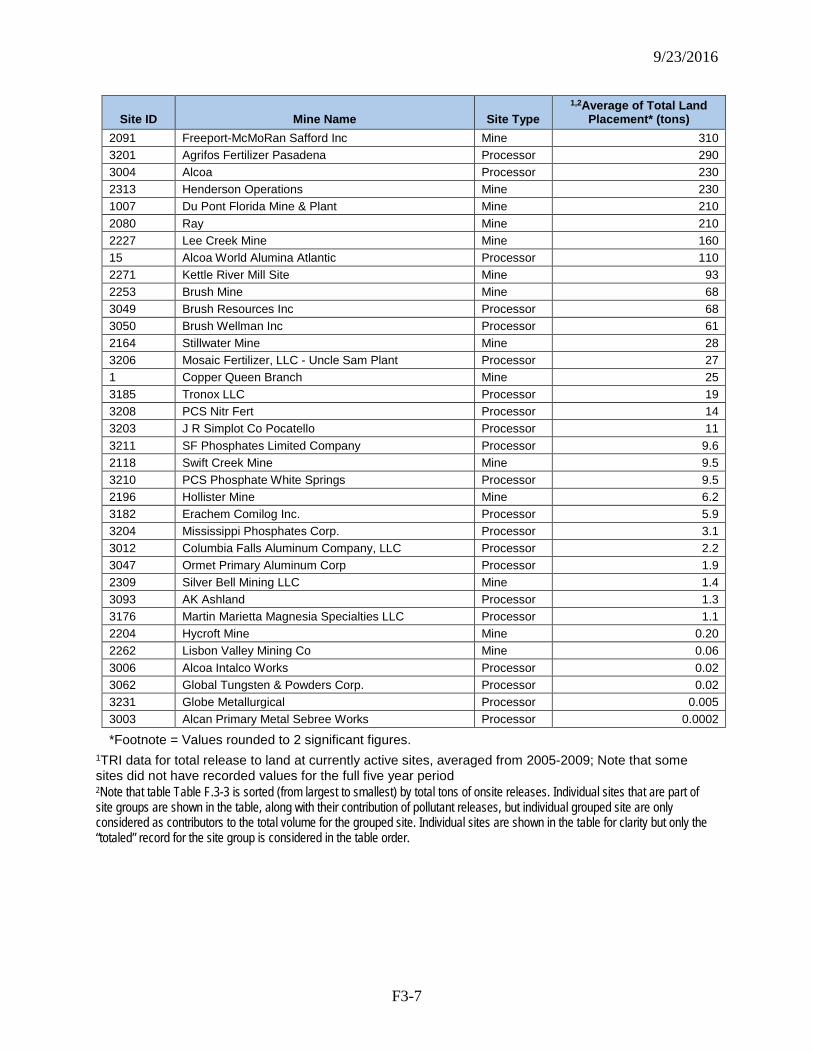
9/23/2016
F3-7
Site ID Mine Name Site Type 1,2Average of Total Land
Placement* (tons) 2091 Freeport-McMoRan Safford Inc Mine 310 3201 Agrifos Fertilizer Pasadena Processor 290 3004 Alcoa Processor 230 2313 Henderson Operations Mine 230 1007 Du Pont Florida Mine & Plant Mine 210 2080 Ray Mine 210 2227 Lee Creek Mine Mine 160 15 Alcoa World Alumina Atlantic Processor 110 2271 Kettle River Mill Site Mine 93 2253 Brush Mine Mine 68 3049 Brush Resources Inc Processor 68 3050 Brush Wellman Inc Processor 61 2164 Stillwater Mine Mine 28 3206 Mosaic Fertilizer, LLC - Uncle Sam Plant Processor 27 1 Copper Queen Branch Mine 25 3185 Tronox LLC Processor 19 3208 PCS Nitr Fert Processor 14 3203 J R Simplot Co Pocatello Processor 11 3211 SF Phosphates Limited Company Processor 9.6 2118 Swift Creek Mine Mine 9.5 3210 PCS Phosphate White Springs Processor 9.5 2196 Hollister Mine Mine 6.2 3182 Erachem Comilog Inc. Processor 5.9 3204 Mississippi Phosphates Corp. Processor 3.1 3012 Columbia Falls Aluminum Company, LLC Processor 2.2 3047 Ormet Primary Aluminum Corp Processor 1.9 2309 Silver Bell Mining LLC Mine 1.4 3093 AK Ashland Processor 1.3 3176 Martin Marietta Magnesia Specialties LLC Processor 1.1 2204 Hycroft Mine Mine 0.20 2262 Lisbon Valley Mining Co Mine 0.06 3006 Alcoa Intalco Works Processor 0.02 3062 Global Tungsten & Powders Corp. Processor 0.02 3231 Globe Metallurgical Processor 0.005 3003 Alcan Primary Metal Sebree Works Processor 0.0002
*Footnote = Values rounded to 2 significant figures. 1TRI data for total release to land at currently active sites, averaged from 2005-2009; Note that some sites did not have recorded values for the full five year period 2Note that table Table F.3-3 is sorted (from largest to smallest) by total tons of onsite releases. Individual sites that are part of site groups are shown in the table, along with their contribution of pollutant releases, but individual grouped site are only considered as contributors to the total volume for the grouped site. Individual sites are shown in the table for clarity but only the “totaled” record for the site group is considered in the table order.
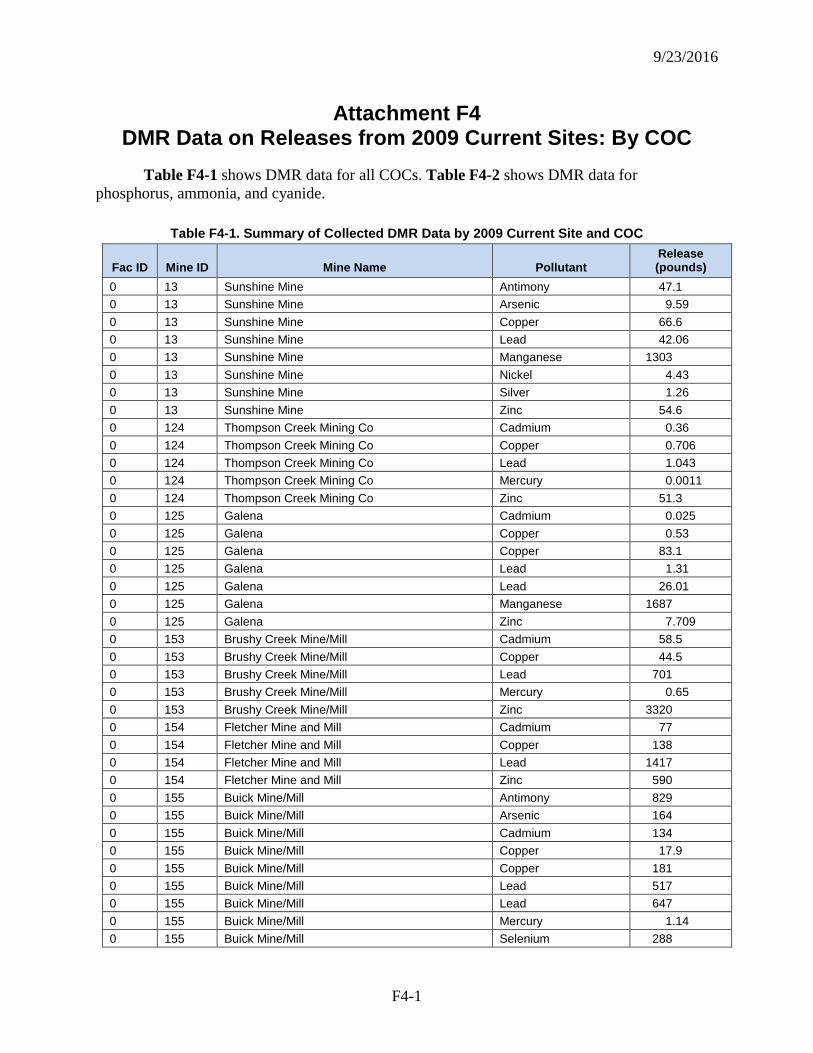
9/23/2016
F4-1
Attachment F4 DMR Data on Releases from 2009 Current Sites: By COC
Table F4-1 shows DMR data for all COCs. Table F4-2 shows DMR data for phosphorus, ammonia, and cyanide.
Table F4-1. Summary of Collected DMR Data by 2009 Current Site and COC
Fac ID Mine ID Mine Name Pollutant Release (pounds)
0 13 Sunshine Mine Antimony 47.1 0 13 Sunshine Mine Arsenic 9.59 0 13 Sunshine Mine Copper 66.6 0 13 Sunshine Mine Lead 42.06 0 13 Sunshine Mine Manganese 1303 0 13 Sunshine Mine Nickel 4.43 0 13 Sunshine Mine Silver 1.26 0 13 Sunshine Mine Zinc 54.6 0 124 Thompson Creek Mining Co Cadmium 0.36 0 124 Thompson Creek Mining Co Copper 0.706 0 124 Thompson Creek Mining Co Lead 1.043 0 124 Thompson Creek Mining Co Mercury 0.0011 0 124 Thompson Creek Mining Co Zinc 51.3 0 125 Galena Cadmium 0.025 0 125 Galena Copper 0.53 0 125 Galena Copper 83.1 0 125 Galena Lead 1.31 0 125 Galena Lead 26.01 0 125 Galena Manganese 1687 0 125 Galena Zinc 7.709 0 153 Brushy Creek Mine/Mill Cadmium 58.5 0 153 Brushy Creek Mine/Mill Copper 44.5 0 153 Brushy Creek Mine/Mill Lead 701 0 153 Brushy Creek Mine/Mill Mercury 0.65 0 153 Brushy Creek Mine/Mill Zinc 3320 0 154 Fletcher Mine and Mill Cadmium 77 0 154 Fletcher Mine and Mill Copper 138 0 154 Fletcher Mine and Mill Lead 1417 0 154 Fletcher Mine and Mill Zinc 590 0 155 Buick Mine/Mill Antimony 829 0 155 Buick Mine/Mill Arsenic 164 0 155 Buick Mine/Mill Cadmium 134 0 155 Buick Mine/Mill Copper 17.9 0 155 Buick Mine/Mill Copper 181 0 155 Buick Mine/Mill Lead 517 0 155 Buick Mine/Mill Lead 647 0 155 Buick Mine/Mill Mercury 1.14 0 155 Buick Mine/Mill Selenium 288
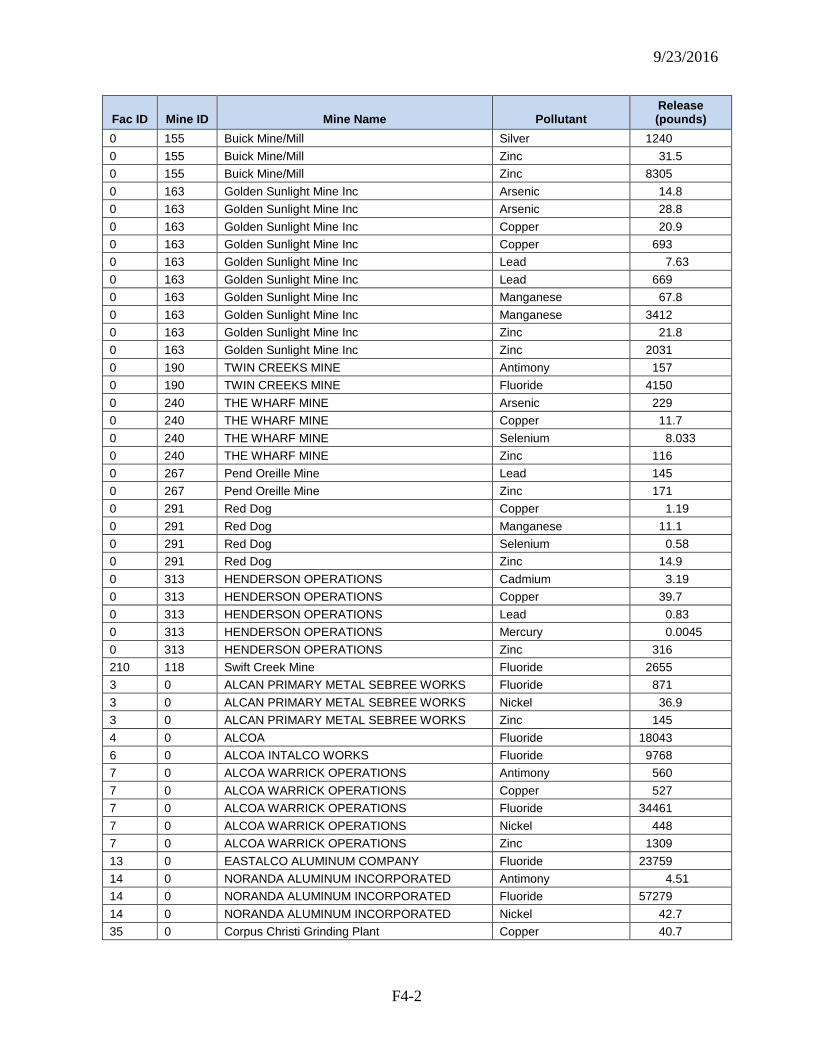
9/23/2016
F4-2
Fac ID Mine ID Mine Name Pollutant Release (pounds)
0 155 Buick Mine/Mill Silver 1240 0 155 Buick Mine/Mill Zinc 31.5 0 155 Buick Mine/Mill Zinc 8305 0 163 Golden Sunlight Mine Inc Arsenic 14.8 0 163 Golden Sunlight Mine Inc Arsenic 28.8 0 163 Golden Sunlight Mine Inc Copper 20.9 0 163 Golden Sunlight Mine Inc Copper 693 0 163 Golden Sunlight Mine Inc Lead 7.63 0 163 Golden Sunlight Mine Inc Lead 669 0 163 Golden Sunlight Mine Inc Manganese 67.8 0 163 Golden Sunlight Mine Inc Manganese 3412 0 163 Golden Sunlight Mine Inc Zinc 21.8 0 163 Golden Sunlight Mine Inc Zinc 2031 0 190 TWIN CREEKS MINE Antimony 157 0 190 TWIN CREEKS MINE Fluoride 4150 0 240 THE WHARF MINE Arsenic 229 0 240 THE WHARF MINE Copper 11.7 0 240 THE WHARF MINE Selenium 8.033 0 240 THE WHARF MINE Zinc 116 0 267 Pend Oreille Mine Lead 145 0 267 Pend Oreille Mine Zinc 171 0 291 Red Dog Copper 1.19 0 291 Red Dog Manganese 11.1 0 291 Red Dog Selenium 0.58 0 291 Red Dog Zinc 14.9 0 313 HENDERSON OPERATIONS Cadmium 3.19 0 313 HENDERSON OPERATIONS Copper 39.7 0 313 HENDERSON OPERATIONS Lead 0.83 0 313 HENDERSON OPERATIONS Mercury 0.0045 0 313 HENDERSON OPERATIONS Zinc 316 210 118 Swift Creek Mine Fluoride 2655 3 0 ALCAN PRIMARY METAL SEBREE WORKS Fluoride 871 3 0 ALCAN PRIMARY METAL SEBREE WORKS Nickel 36.9 3 0 ALCAN PRIMARY METAL SEBREE WORKS Zinc 145 4 0 ALCOA Fluoride 18043 6 0 ALCOA INTALCO WORKS Fluoride 9768 7 0 ALCOA WARRICK OPERATIONS Antimony 560 7 0 ALCOA WARRICK OPERATIONS Copper 527 7 0 ALCOA WARRICK OPERATIONS Fluoride 34461 7 0 ALCOA WARRICK OPERATIONS Nickel 448 7 0 ALCOA WARRICK OPERATIONS Zinc 1309 13 0 EASTALCO ALUMINUM COMPANY Fluoride 23759 14 0 NORANDA ALUMINUM INCORPORATED Antimony 4.51 14 0 NORANDA ALUMINUM INCORPORATED Fluoride 57279 14 0 NORANDA ALUMINUM INCORPORATED Nickel 42.7 35 0 Corpus Christi Grinding Plant Copper 40.7
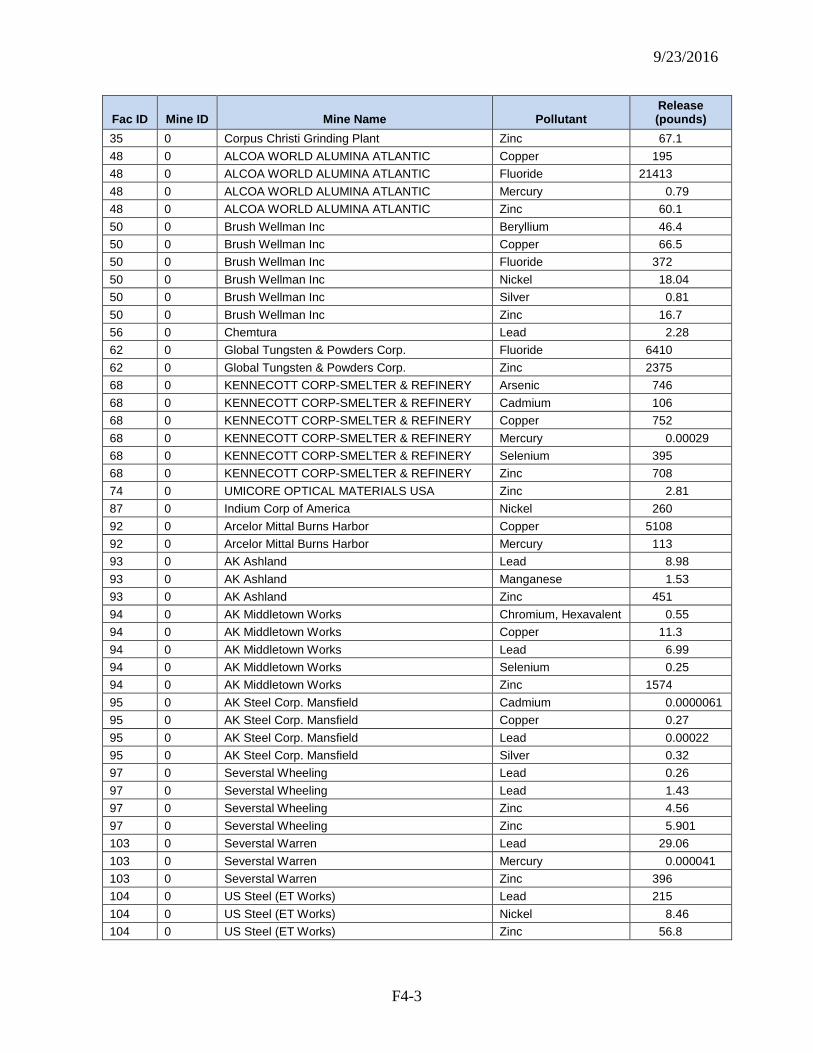
9/23/2016
F4-3
Fac ID Mine ID Mine Name Pollutant Release (pounds)
35 0 Corpus Christi Grinding Plant Zinc 67.1 48 0 ALCOA WORLD ALUMINA ATLANTIC Copper 195 48 0 ALCOA WORLD ALUMINA ATLANTIC Fluoride 21413 48 0 ALCOA WORLD ALUMINA ATLANTIC Mercury 0.79 48 0 ALCOA WORLD ALUMINA ATLANTIC Zinc 60.1 50 0 Brush Wellman Inc Beryllium 46.4 50 0 Brush Wellman Inc Copper 66.5 50 0 Brush Wellman Inc Fluoride 372 50 0 Brush Wellman Inc Nickel 18.04 50 0 Brush Wellman Inc Silver 0.81 50 0 Brush Wellman Inc Zinc 16.7 56 0 Chemtura Lead 2.28 62 0 Global Tungsten & Powders Corp. Fluoride 6410 62 0 Global Tungsten & Powders Corp. Zinc 2375 68 0 KENNECOTT CORP-SMELTER & REFINERY Arsenic 746 68 0 KENNECOTT CORP-SMELTER & REFINERY Cadmium 106 68 0 KENNECOTT CORP-SMELTER & REFINERY Copper 752 68 0 KENNECOTT CORP-SMELTER & REFINERY Mercury 0.00029 68 0 KENNECOTT CORP-SMELTER & REFINERY Selenium 395 68 0 KENNECOTT CORP-SMELTER & REFINERY Zinc 708 74 0 UMICORE OPTICAL MATERIALS USA Zinc 2.81 87 0 Indium Corp of America Nickel 260 92 0 Arcelor Mittal Burns Harbor Copper 5108 92 0 Arcelor Mittal Burns Harbor Mercury 113 93 0 AK Ashland Lead 8.98 93 0 AK Ashland Manganese 1.53 93 0 AK Ashland Zinc 451 94 0 AK Middletown Works Chromium, Hexavalent 0.55 94 0 AK Middletown Works Copper 11.3 94 0 AK Middletown Works Lead 6.99 94 0 AK Middletown Works Selenium 0.25 94 0 AK Middletown Works Zinc 1574 95 0 AK Steel Corp. Mansfield Cadmium 0.0000061 95 0 AK Steel Corp. Mansfield Copper 0.27 95 0 AK Steel Corp. Mansfield Lead 0.00022 95 0 AK Steel Corp. Mansfield Silver 0.32 97 0 Severstal Wheeling Lead 0.26 97 0 Severstal Wheeling Lead 1.43 97 0 Severstal Wheeling Zinc 4.56 97 0 Severstal Wheeling Zinc 5.901 103 0 Severstal Warren Lead 29.06 103 0 Severstal Warren Mercury 0.000041 103 0 Severstal Warren Zinc 396 104 0 US Steel (ET Works) Lead 215 104 0 US Steel (ET Works) Nickel 8.46 104 0 US Steel (ET Works) Zinc 56.8
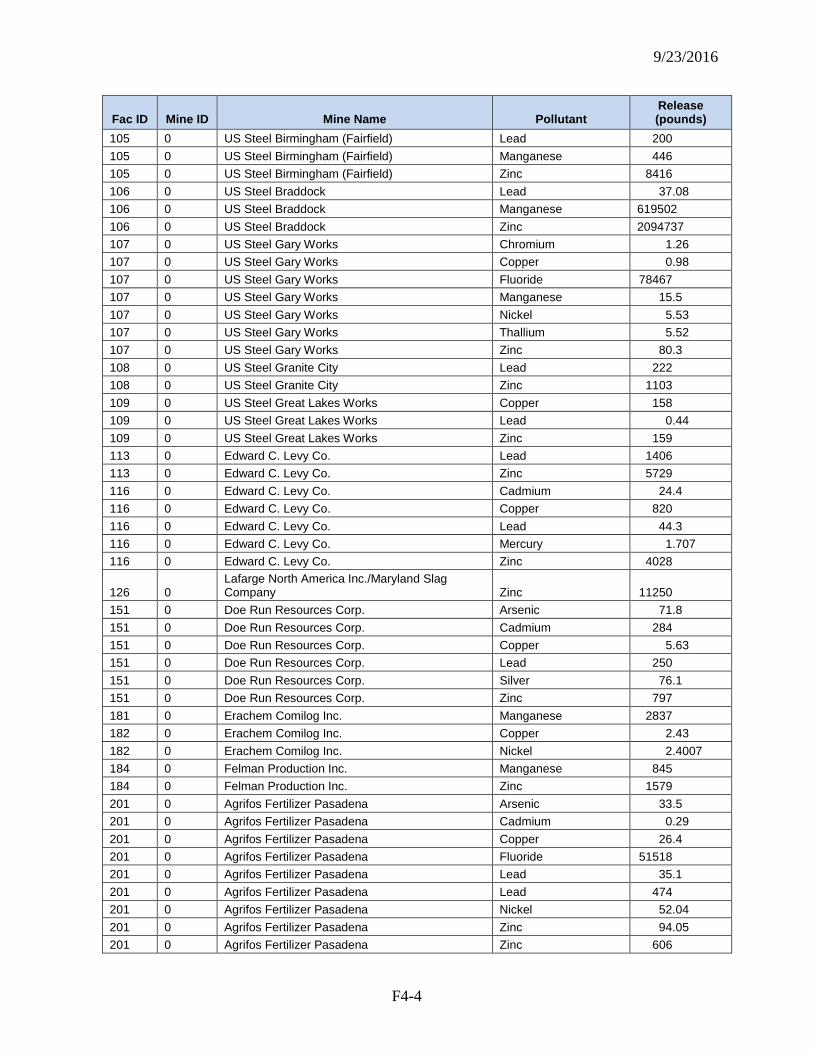
9/23/2016
F4-4
Fac ID Mine ID Mine Name Pollutant Release (pounds)
105 0 US Steel Birmingham (Fairfield) Lead 200 105 0 US Steel Birmingham (Fairfield) Manganese 446 105 0 US Steel Birmingham (Fairfield) Zinc 8416 106 0 US Steel Braddock Lead 37.08 106 0 US Steel Braddock Manganese 619502 106 0 US Steel Braddock Zinc 2094737 107 0 US Steel Gary Works Chromium 1.26 107 0 US Steel Gary Works Copper 0.98 107 0 US Steel Gary Works Fluoride 78467 107 0 US Steel Gary Works Manganese 15.5 107 0 US Steel Gary Works Nickel 5.53 107 0 US Steel Gary Works Thallium 5.52 107 0 US Steel Gary Works Zinc 80.3 108 0 US Steel Granite City Lead 222 108 0 US Steel Granite City Zinc 1103 109 0 US Steel Great Lakes Works Copper 158 109 0 US Steel Great Lakes Works Lead 0.44 109 0 US Steel Great Lakes Works Zinc 159 113 0 Edward C. Levy Co. Lead 1406 113 0 Edward C. Levy Co. Zinc 5729 116 0 Edward C. Levy Co. Cadmium 24.4 116 0 Edward C. Levy Co. Copper 820 116 0 Edward C. Levy Co. Lead 44.3 116 0 Edward C. Levy Co. Mercury 1.707 116 0 Edward C. Levy Co. Zinc 4028
126 0 Lafarge North America Inc./Maryland Slag Company Zinc 11250
151 0 Doe Run Resources Corp. Arsenic 71.8 151 0 Doe Run Resources Corp. Cadmium 284 151 0 Doe Run Resources Corp. Copper 5.63 151 0 Doe Run Resources Corp. Lead 250 151 0 Doe Run Resources Corp. Silver 76.1 151 0 Doe Run Resources Corp. Zinc 797 181 0 Erachem Comilog Inc. Manganese 2837 182 0 Erachem Comilog Inc. Copper 2.43 182 0 Erachem Comilog Inc. Nickel 2.4007 184 0 Felman Production Inc. Manganese 845 184 0 Felman Production Inc. Zinc 1579 201 0 Agrifos Fertilizer Pasadena Arsenic 33.5 201 0 Agrifos Fertilizer Pasadena Cadmium 0.29 201 0 Agrifos Fertilizer Pasadena Copper 26.4 201 0 Agrifos Fertilizer Pasadena Fluoride 51518 201 0 Agrifos Fertilizer Pasadena Lead 35.1 201 0 Agrifos Fertilizer Pasadena Lead 474 201 0 Agrifos Fertilizer Pasadena Nickel 52.04 201 0 Agrifos Fertilizer Pasadena Zinc 94.05 201 0 Agrifos Fertilizer Pasadena Zinc 606
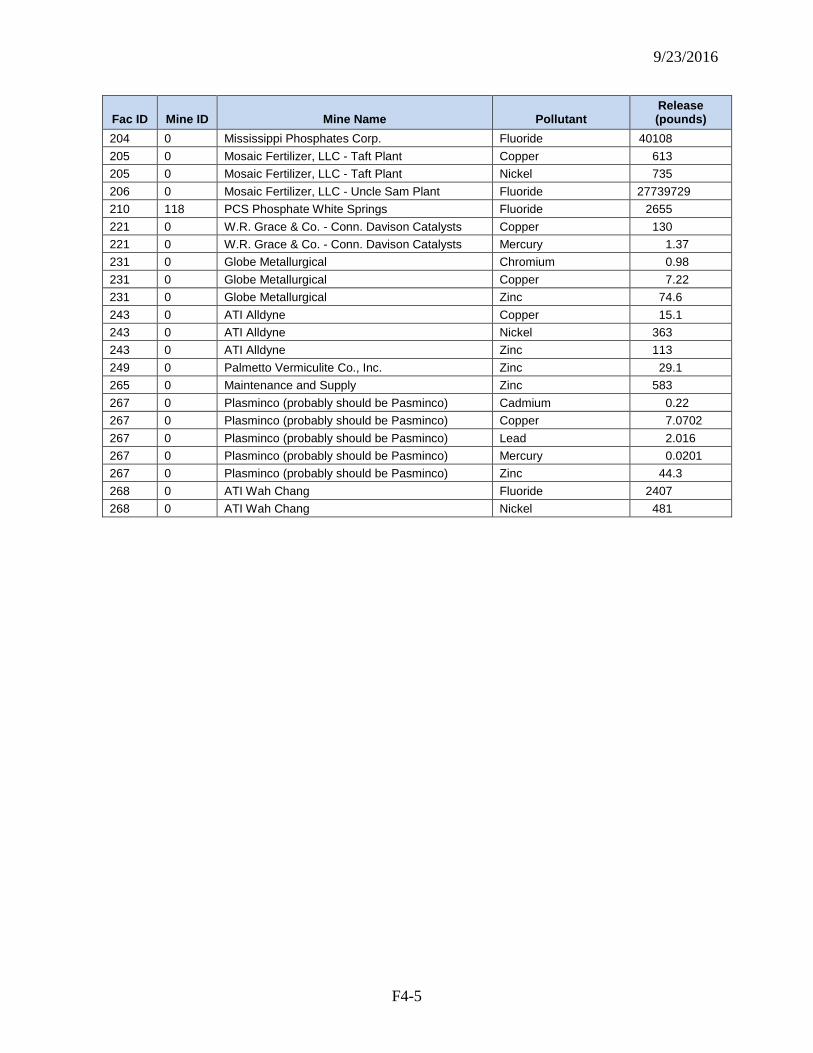
9/23/2016
F4-5
Fac ID Mine ID Mine Name Pollutant Release (pounds)
204 0 Mississippi Phosphates Corp. Fluoride 40108 205 0 Mosaic Fertilizer, LLC - Taft Plant Copper 613 205 0 Mosaic Fertilizer, LLC - Taft Plant Nickel 735 206 0 Mosaic Fertilizer, LLC - Uncle Sam Plant Fluoride 27739729 210 118 PCS Phosphate White Springs Fluoride 2655 221 0 W.R. Grace & Co. - Conn. Davison Catalysts Copper 130 221 0 W.R. Grace & Co. - Conn. Davison Catalysts Mercury 1.37 231 0 Globe Metallurgical Chromium 0.98 231 0 Globe Metallurgical Copper 7.22 231 0 Globe Metallurgical Zinc 74.6 243 0 ATI Alldyne Copper 15.1 243 0 ATI Alldyne Nickel 363 243 0 ATI Alldyne Zinc 113 249 0 Palmetto Vermiculite Co., Inc. Zinc 29.1 265 0 Maintenance and Supply Zinc 583 267 0 Plasminco (probably should be Pasminco) Cadmium 0.22 267 0 Plasminco (probably should be Pasminco) Copper 7.0702 267 0 Plasminco (probably should be Pasminco) Lead 2.016 267 0 Plasminco (probably should be Pasminco) Mercury 0.0201 267 0 Plasminco (probably should be Pasminco) Zinc 44.3 268 0 ATI Wah Chang Fluoride 2407 268 0 ATI Wah Chang Nickel 481
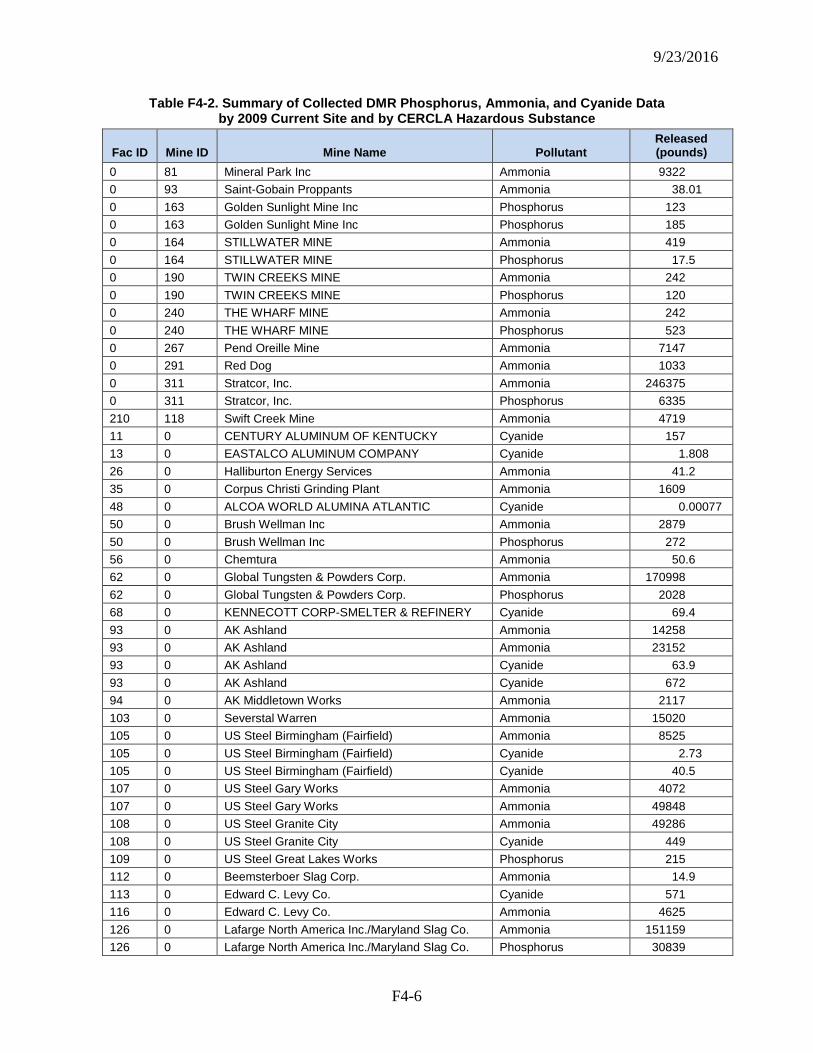
9/23/2016
F4-6
Table F4-2. Summary of Collected DMR Phosphorus, Ammonia, and Cyanide Data by 2009 Current Site and by CERCLA Hazardous Substance
Fac ID Mine ID Mine Name Pollutant Released (pounds)
0 81 Mineral Park Inc Ammonia 9322 0 93 Saint-Gobain Proppants Ammonia 38.01 0 163 Golden Sunlight Mine Inc Phosphorus 123 0 163 Golden Sunlight Mine Inc Phosphorus 185 0 164 STILLWATER MINE Ammonia 419 0 164 STILLWATER MINE Phosphorus 17.5 0 190 TWIN CREEKS MINE Ammonia 242 0 190 TWIN CREEKS MINE Phosphorus 120 0 240 THE WHARF MINE Ammonia 242 0 240 THE WHARF MINE Phosphorus 523 0 267 Pend Oreille Mine Ammonia 7147 0 291 Red Dog Ammonia 1033 0 311 Stratcor, Inc. Ammonia 246375 0 311 Stratcor, Inc. Phosphorus 6335 210 118 Swift Creek Mine Ammonia 4719 11 0 CENTURY ALUMINUM OF KENTUCKY Cyanide 157 13 0 EASTALCO ALUMINUM COMPANY Cyanide 1.808 26 0 Halliburton Energy Services Ammonia 41.2 35 0 Corpus Christi Grinding Plant Ammonia 1609 48 0 ALCOA WORLD ALUMINA ATLANTIC Cyanide 0.00077 50 0 Brush Wellman Inc Ammonia 2879 50 0 Brush Wellman Inc Phosphorus 272 56 0 Chemtura Ammonia 50.6 62 0 Global Tungsten & Powders Corp. Ammonia 170998 62 0 Global Tungsten & Powders Corp. Phosphorus 2028 68 0 KENNECOTT CORP-SMELTER & REFINERY Cyanide 69.4 93 0 AK Ashland Ammonia 14258 93 0 AK Ashland Ammonia 23152 93 0 AK Ashland Cyanide 63.9 93 0 AK Ashland Cyanide 672 94 0 AK Middletown Works Ammonia 2117 103 0 Severstal Warren Ammonia 15020 105 0 US Steel Birmingham (Fairfield) Ammonia 8525 105 0 US Steel Birmingham (Fairfield) Cyanide 2.73 105 0 US Steel Birmingham (Fairfield) Cyanide 40.5 107 0 US Steel Gary Works Ammonia 4072 107 0 US Steel Gary Works Ammonia 49848 108 0 US Steel Granite City Ammonia 49286 108 0 US Steel Granite City Cyanide 449 109 0 US Steel Great Lakes Works Phosphorus 215 112 0 Beemsterboer Slag Corp. Ammonia 14.9 113 0 Edward C. Levy Co. Cyanide 571 116 0 Edward C. Levy Co. Ammonia 4625 126 0 Lafarge North America Inc./Maryland Slag Co. Ammonia 151159 126 0 Lafarge North America Inc./Maryland Slag Co. Phosphorus 30839
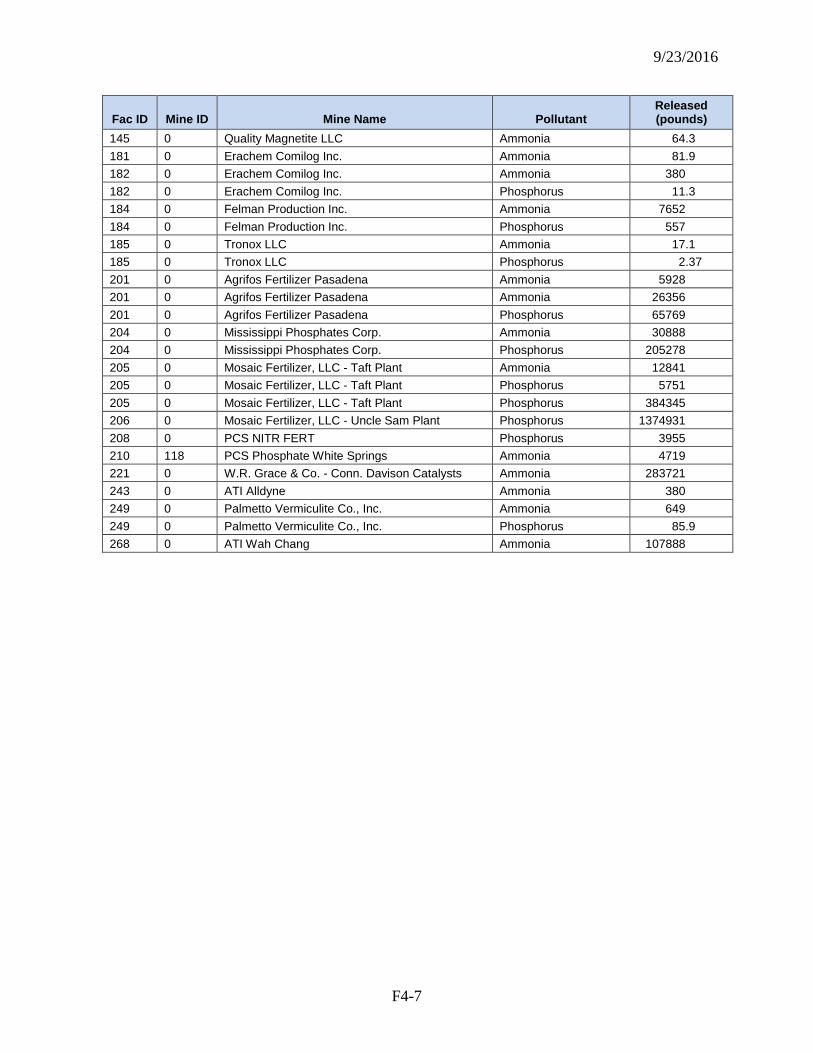
9/23/2016
F4-7
Fac ID Mine ID Mine Name Pollutant Released (pounds)
145 0 Quality Magnetite LLC Ammonia 64.3 181 0 Erachem Comilog Inc. Ammonia 81.9 182 0 Erachem Comilog Inc. Ammonia 380 182 0 Erachem Comilog Inc. Phosphorus 11.3 184 0 Felman Production Inc. Ammonia 7652 184 0 Felman Production Inc. Phosphorus 557 185 0 Tronox LLC Ammonia 17.1 185 0 Tronox LLC Phosphorus 2.37 201 0 Agrifos Fertilizer Pasadena Ammonia 5928 201 0 Agrifos Fertilizer Pasadena Ammonia 26356 201 0 Agrifos Fertilizer Pasadena Phosphorus 65769 204 0 Mississippi Phosphates Corp. Ammonia 30888 204 0 Mississippi Phosphates Corp. Phosphorus 205278 205 0 Mosaic Fertilizer, LLC - Taft Plant Ammonia 12841 205 0 Mosaic Fertilizer, LLC - Taft Plant Phosphorus 5751 205 0 Mosaic Fertilizer, LLC - Taft Plant Phosphorus 384345 206 0 Mosaic Fertilizer, LLC - Uncle Sam Plant Phosphorus 1374931 208 0 PCS NITR FERT Phosphorus 3955 210 118 PCS Phosphate White Springs Ammonia 4719 221 0 W.R. Grace & Co. - Conn. Davison Catalysts Ammonia 283721 243 0 ATI Alldyne Ammonia 380 249 0 Palmetto Vermiculite Co., Inc. Ammonia 649 249 0 Palmetto Vermiculite Co., Inc. Phosphorus 85.9 268 0 ATI Wah Chang Ammonia 107888
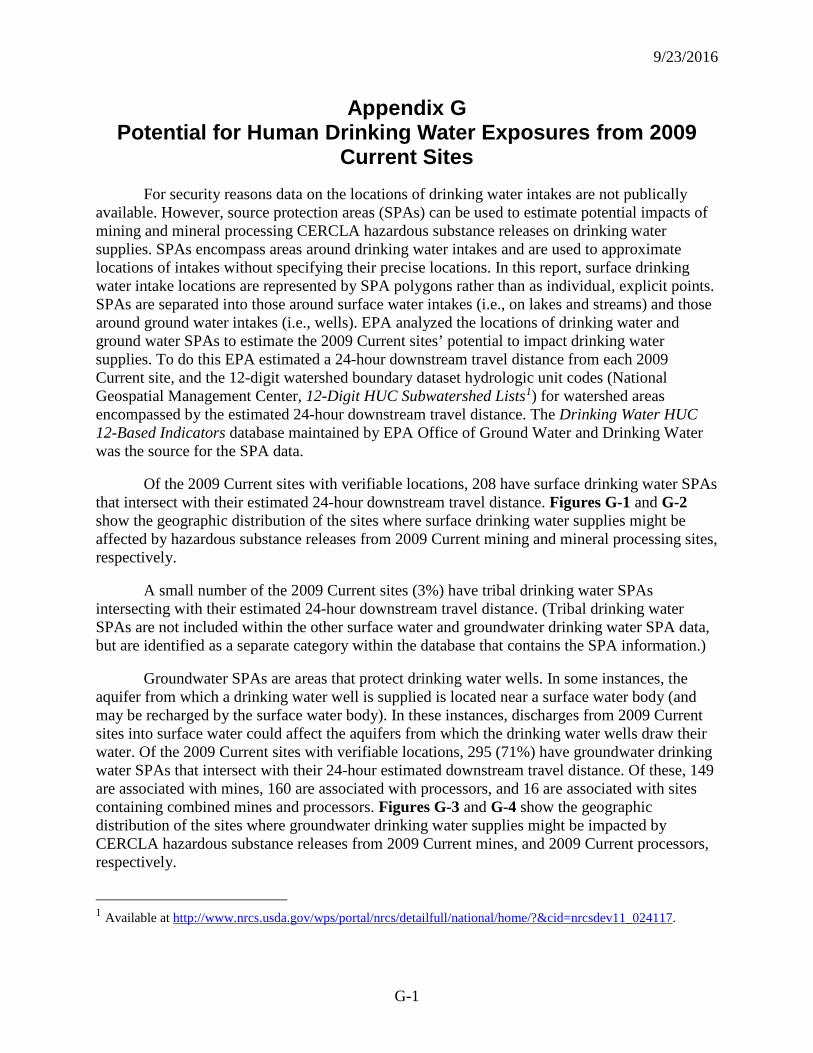
9/23/2016
G-1
Appendix G Potential for Human Drinking Water Exposures from 2009
Current Sites For security reasons data on the locations of drinking water intakes are not publically
available. However, source protection areas (SPAs) can be used to estimate potential impacts of mining and mineral processing CERCLA hazardous substance releases on drinking water supplies. SPAs encompass areas around drinking water intakes and are used to approximate locations of intakes without specifying their precise locations. In this report, surface drinking water intake locations are represented by SPA polygons rather than as individual, explicit points. SPAs are separated into those around surface water intakes (i.e., on lakes and streams) and those around ground water intakes (i.e., wells). EPA analyzed the locations of drinking water and ground water SPAs to estimate the 2009 Current sites’ potential to impact drinking water supplies. To do this EPA estimated a 24-hour downstream travel distance from each 2009 Current site, and the 12-digit watershed boundary dataset hydrologic unit codes (National Geospatial Management Center, 12-Digit HUC Subwatershed Lists1) for watershed areas encompassed by the estimated 24-hour downstream travel distance. The Drinking Water HUC 12-Based Indicators database maintained by EPA Office of Ground Water and Drinking Water was the source for the SPA data.
Of the 2009 Current sites with verifiable locations, 208 have surface drinking water SPAs that intersect with their estimated 24-hour downstream travel distance. Figures G-1 and G-2 show the geographic distribution of the sites where surface drinking water supplies might be affected by hazardous substance releases from 2009 Current mining and mineral processing sites, respectively.
A small number of the 2009 Current sites (3%) have tribal drinking water SPAs intersecting with their estimated 24-hour downstream travel distance. (Tribal drinking water SPAs are not included within the other surface water and groundwater drinking water SPA data, but are identified as a separate category within the database that contains the SPA information.)
Groundwater SPAs are areas that protect drinking water wells. In some instances, the aquifer from which a drinking water well is supplied is located near a surface water body (and may be recharged by the surface water body). In these instances, discharges from 2009 Current sites into surface water could affect the aquifers from which the drinking water wells draw their water. Of the 2009 Current sites with verifiable locations, 295 (71%) have groundwater drinking water SPAs that intersect with their 24-hour estimated downstream travel distance. Of these, 149 are associated with mines, 160 are associated with processors, and 16 are associated with sites containing combined mines and processors. Figures G-3 and G-4 show the geographic distribution of the sites where groundwater drinking water supplies might be impacted by CERCLA hazardous substance releases from 2009 Current mines, and 2009 Current processors, respectively.
1 Available at http://www.nrcs.usda.gov/wps/portal/nrcs/detailfull/national/home/?&cid=nrcsdev11_024117.
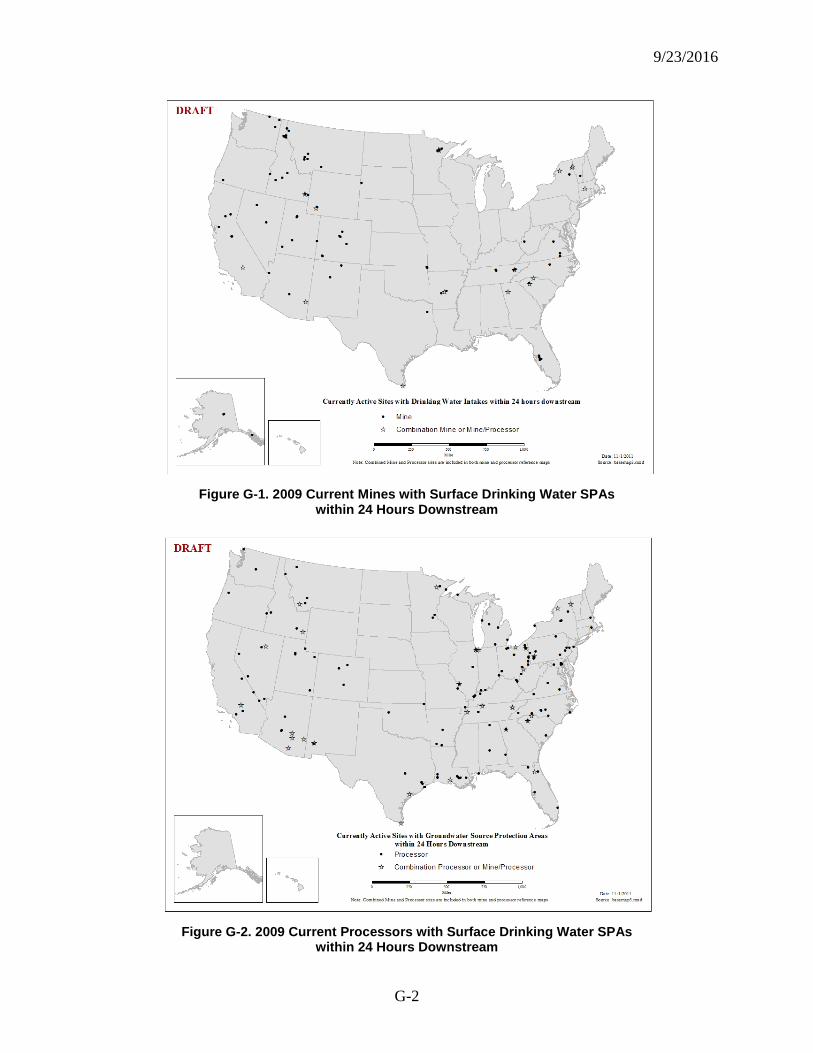
9/23/2016
G-2
Figure G-1. 2009 Current Mines with Surface Drinking Water SPAs
within 24 Hours Downstream
Figure G-2. 2009 Current Processors with Surface Drinking Water SPAs
within 24 Hours Downstream
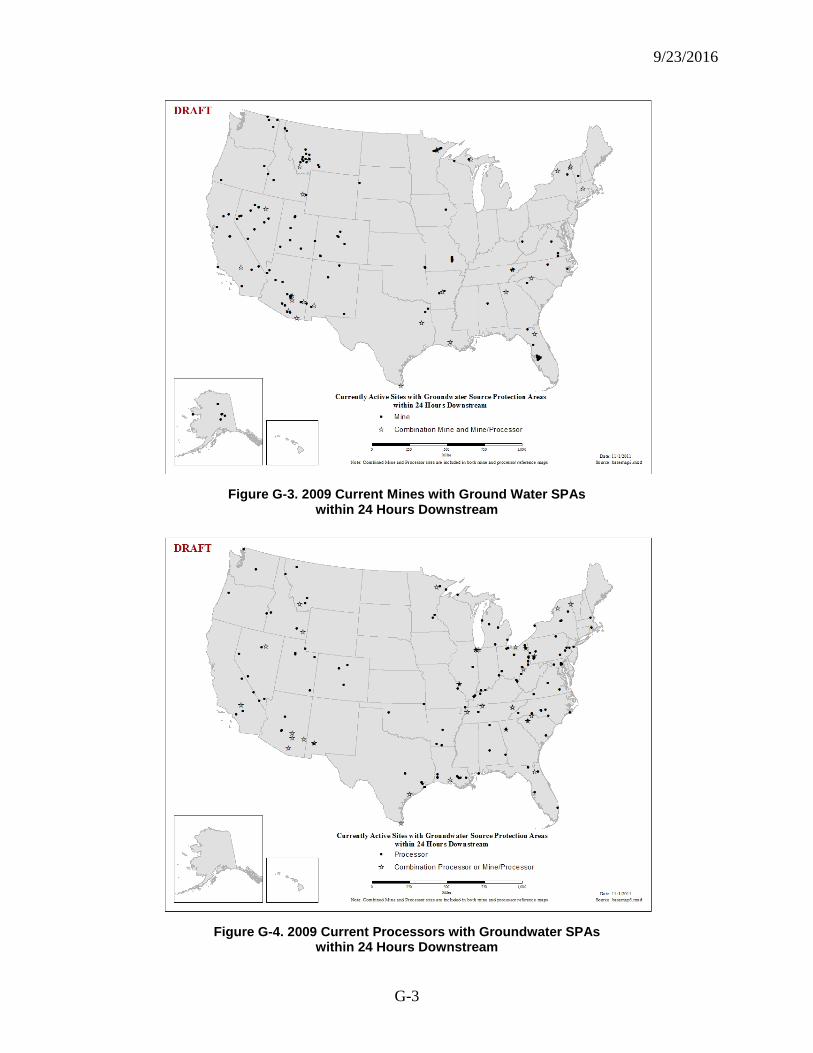
9/23/2016
G-3
Figure G-3. 2009 Current Mines with Ground Water SPAs
within 24 Hours Downstream
Figure G-4. 2009 Current Processors with Groundwater SPAs
within 24 Hours Downstream
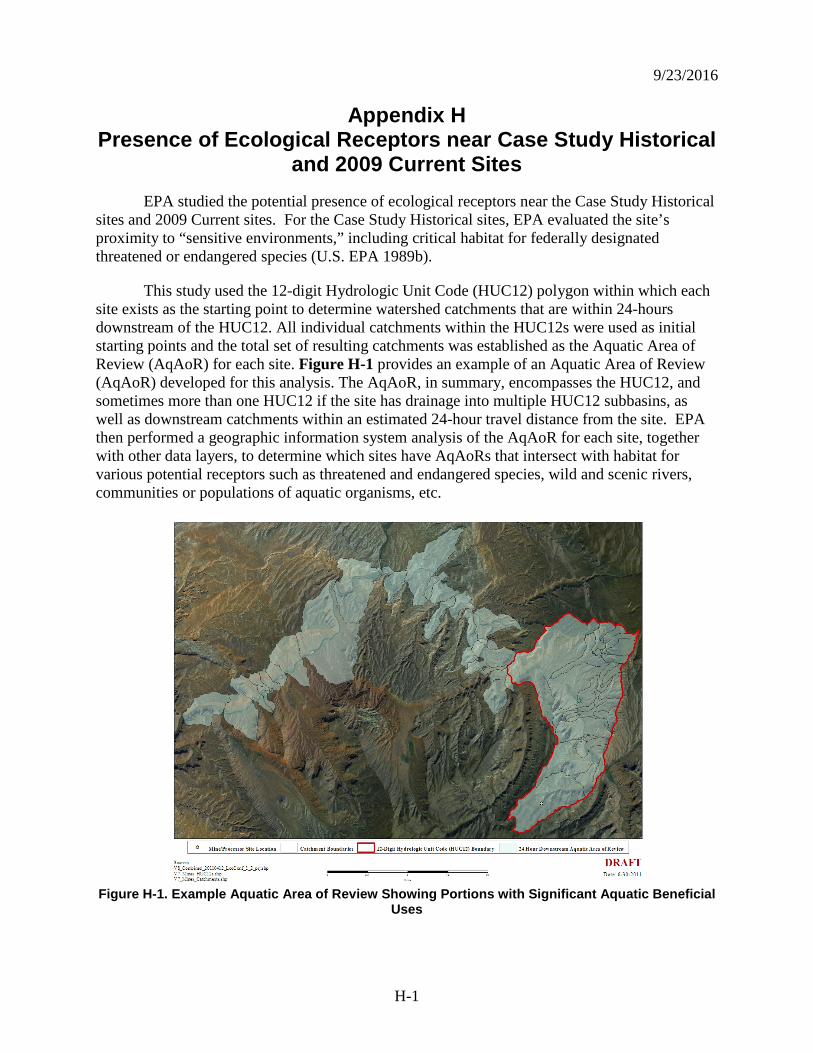
9/23/2016
H-1
Appendix H Presence of Ecological Receptors near Case Study Historical
and 2009 Current Sites EPA studied the potential presence of ecological receptors near the Case Study Historical
sites and 2009 Current sites. For the Case Study Historical sites, EPA evaluated the site’s proximity to “sensitive environments,” including critical habitat for federally designated threatened or endangered species (U.S. EPA 1989b).
This study used the 12-digit Hydrologic Unit Code (HUC12) polygon within which each site exists as the starting point to determine watershed catchments that are within 24-hours downstream of the HUC12. All individual catchments within the HUC12s were used as initial starting points and the total set of resulting catchments was established as the Aquatic Area of Review (AqAoR) for each site. Figure H-1 provides an example of an Aquatic Area of Review (AqAoR) developed for this analysis. The AqAoR, in summary, encompasses the HUC12, and sometimes more than one HUC12 if the site has drainage into multiple HUC12 subbasins, as well as downstream catchments within an estimated 24-hour travel distance from the site. EPA then performed a geographic information system analysis of the AqAoR for each site, together with other data layers, to determine which sites have AqAoRs that intersect with habitat for various potential receptors such as threatened and endangered species, wild and scenic rivers, communities or populations of aquatic organisms, etc.
Figure H-1. Example Aquatic Area of Review Showing Portions with Significant Aquatic Beneficial
Uses
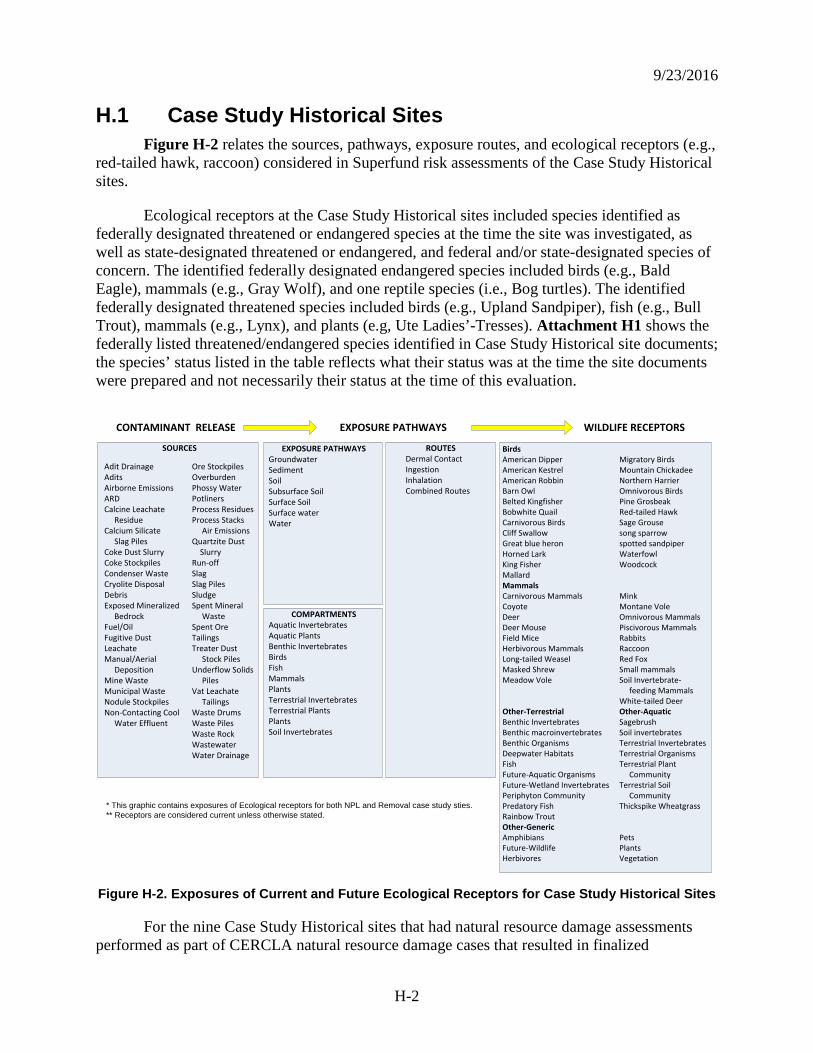
9/23/2016
H-2
H.1 Case Study Historical Sites Figure H-2 relates the sources, pathways, exposure routes, and ecological receptors (e.g.,
red-tailed hawk, raccoon) considered in Superfund risk assessments of the Case Study Historical sites.
Ecological receptors at the Case Study Historical sites included species identified as federally designated threatened or endangered species at the time the site was investigated, as well as state-designated threatened or endangered, and federal and/or state-designated species of concern. The identified federally designated endangered species included birds (e.g., Bald Eagle), mammals (e.g., Gray Wolf), and one reptile species (i.e., Bog turtles). The identified federally designated threatened species included birds (e.g., Upland Sandpiper), fish (e.g., Bull Trout), mammals (e.g., Lynx), and plants (e.g, Ute Ladies’-Tresses). Attachment H1 shows the federally listed threatened/endangered species identified in Case Study Historical site documents; the species’ status listed in the table reflects what their status was at the time the site documents were prepared and not necessarily their status at the time of this evaluation.
SOURCES
Adit Drainage Ore StockpilesAdits OverburdenAirborne Emissions Phossy WaterARD PotlinersCalcine Leachate Process Residues Residue Process Stacks Calcium Silicate Air Emissions Slag Piles Quartzite Dust Coke Dust Slurry SlurryCoke Stockpiles Run-offCondenser Waste SlagCryolite Disposal Slag Piles Debris SludgeExposed Mineralized Spent Mineral Bedrock WasteFuel/Oil Spent OreFugitive Dust TailingsLeachate Treater Dust Manual/Aerial Stock Piles Deposition Underflow Solids Mine Waste PilesMunicipal Waste Vat Leachate Nodule Stockpiles TailingsNon-Contacting Cool Waste Drums Water Effluent Waste Piles
Waste RockWastewaterWater Drainage
EXPOSURE PATHWAYSGroundwaterSedimentSoil Subsurface SoilSurface SoilSurface waterWater
ROUTESDermal ContactIngestionInhalationCombined Routes
CONTAMINANT RELEASE EXPOSURE PATHWAYS WILDLIFE RECEPTORS
BirdsAmerican Dipper Migratory BirdsAmerican Kestrel Mountain ChickadeeAmerican Robbin Northern HarrierBarn Owl Omnivorous BirdsBelted Kingfisher Pine GrosbeakBobwhite Quail Red-tailed HawkCarnivorous Birds Sage GrouseCliff Swallow song sparrowGreat blue heron spotted sandpiperHorned Lark WaterfowlKing Fisher WoodcockMallardMammalsCarnivorous Mammals MinkCoyote Montane VoleDeer Omnivorous MammalsDeer Mouse Piscivorous MammalsField Mice RabbitsHerbivorous Mammals RaccoonLong-tailed Weasel Red FoxMasked Shrew Small mammalsMeadow Vole Soil Invertebrate-
feeding MammalsWhite-tailed Deer
Other-Terrestrial Other-AquaticBenthic Invertebrates SagebrushBenthic macroinvertebrates Soil invertebratesBenthic Organisms Terrestrial InvertebratesDeepwater Habitats Terrestrial OrganismsFish Terrestrial PlantFuture-Aquatic Organisms CommunityFuture-Wetland Invertebrates Terrestrial SoilPeriphyton Community CommunityPredatory Fish Thickspike WheatgrassRainbow TroutOther-GenericAmphibians Pets Future-Wildlife PlantsHerbivores Vegetation
* This graphic contains exposures of Ecological receptors for both NPL and Removal case study sties.** Receptors are considered current unless otherwise stated.
COMPARTMENTSAquatic InvertebratesAquatic PlantsBenthic InvertebratesBirdsFishMammalsPlantsTerrestrial InvertebratesTerrestrial PlantsPlantsSoil Invertebrates
Figure H-2. Exposures of Current and Future Ecological Receptors for Case Study Historical Sites
For the nine Case Study Historical sites that had natural resource damage assessments performed as part of CERCLA natural resource damage cases that resulted in finalized
9/23/2016
H-3
settlements as of 2013, there were various types of ecological receptors and natural resource injuries. Attachment H2 indicates the specific injuries.
H.2 2009 Current Sites To understand the relationship between the locations of 2009 Current sites and sensitive
environmental areas, EPA analyzed the 2009 Current sites’ proximity to various kinds of sensitive environments. These data are in the form of GIS layers and were used to assess the spatial relationships (proximity and overlap) between the 2009 Current sites and potentially sensitive environmental areas. Descriptions of the data used in identifying potential ecological receptors are presented below, as well as in Appendix E:
1. Major Dams: This geospatial datalayer from the USGS National Atlas portrays major dams of the United States, including Puerto Rico and the U.S. Virgin Islands. The map layer was created by extracting dams 50 feet or more in height, or with a normal storage capacity of 5,000 acre-feet or more, or with a maximum storage capacity of 25,000 acre-feet or more, from the 79,777 dams in the U.S. Army Corps of Engineers National Inventory of Dams. Descriptive information includes the dam name and location, the risk level associated with the dam, the purposes (beneficial uses) for which the dam was constructed. Purpose codes include the following "beneficial uses" which will correlate with Clean Water Act Water Quality Standards designated uses: ’F’ Fish and Wildlife; ‘R’ Recreation; and ‘S’ Water Supply. Data are available from https://www2.usgs.gov/science/cite-view.php?cite=244
2. Federal Lands of the United States: a publicly available GIS layer providing polygons for various federally-owned and managed public lands. These lands include National Parks, National Forests, and National Wildlife Refuges. This layer is included in the EPA Office of Water’s Reach Address Database ancillary National Atlas GIS layers. Data are available from https://www.arcgis.com/home/item.html?id=26c2a38f94c54ad880ff877f884ff931.
3. Indian/Tribal Lands for Native American Groups: From the USGS National Atlas layer on Indian (Tribal) Lands. Suggests areas where habitat may be relied upon for tribal lifeways.
4. Critical Habitat Polygons: These data identify, in general, the areas where final critical habitat exist for species listed as endangered or threatened. Data are available from https://www.fws.gov/gis/data/national/index.html
5. Marine Sanctuaries: The National Marine Sanctuary Program manages a system of sanctuaries and other managed areas around the country. The legal boundaries of these sanctuaries are defined within the Code of Federal Regulations, at 15 C.F.R. Part 922 and the subparts for each national marine sanctuary. The GIS compatible digital boundary files for each national marine sanctuary are representations of those legal boundaries and are based on the best available data. Data are available from http://sanctuaries.noaa.gov/library/imast_gis.html
9/23/2016
H-4
6. Coastal Barrier Resources System: This data set contains areas designated as undeveloped coastal barriers in accordance with the Coastal Barrier Resources Act, as amended. This boundary data set was digitized between 04/01/2007 and 04/01/2010 from the official John H. Chafee Coastal Barrier Resources System (CBRS) maps enacted by law. This data set complies with the National Spatial Data Infrastructure (NSDI) and other standards established by the Federal Geographic Data Committee (FGDC). The U.S. Fish and Wildlife Service (FWS) endorses this data set as having been compiled to meet forty feet horizontal accuracy at the ninety-five percent confidence level relative to the boundaries shown on the official CBRS maps. However, these digital boundaries are only representations of the official CBRS boundaries and are not to be considered authoritative.
7. Fish and Wildlife Service (FWS) Areas: There are three individual datasets that comprise the designated Fish and Wildlife Service Areas (FWS Approved areas, FWS Interest areas and FWS Special Designation areas). Some examples of lands that fall under these three FWS Areas designations include National Wildlife Refuges, National Fish Hatcheries, Wildlife Management Areas and Waterfowl Production Areas. A brief description of the information included in each of these datasets is included here:
− FWS Approved: This data layer depicts the external boundaries of lands and waters that are approved for acquisition by the U.S. Fish and Wildlife Service (USFWS) in North America, U.S. Trust Territories and Possessions. The primary source for this information is the USFWS Realty program.
− Interest: This data layer depicts lands and waters administered by the U.S. Fish and Wildlife Service (USFWS) in North America, U.S. Trust Territories and Possessions. It may also include inholdings that are not administered by USFWS.
− Special Designation This data layer depicts the Special Designations that have been placed upon the lands and waters administered by the U.S. Fish and Wildlife Service (USFWS) in North America, U.S. Trust Territories and Possessions. These special areas, such as wilderness, are primarily designated by the U.S. Congress.
• Protected Areas Database of the United States (version 1): The Protected Areas Database of the United States (PAD-US) is a digital map of steward boundaries that combines attributes of ownership, management, and a measure of intent to manage for biodiversity. The map includes (1) Geographic boundaries of public land ownership and voluntarily provided private conservation lands (e.g., Nature Conservancy Preserves); (2) Combination of land owner/ manager, management designation descriptor, parcel name, and source of geographic information of each mapped land unit; (3) GAP Status Code conservation measure of each parcel based on USGS National Gap Analysis Program (GAP) protection level categories which are intended to provide a measurement of management commitment for long-term biodiversity conservation derived from land management plans or land manager interviews; (4) IUCN category for a protected area's inclusion into UNEP-World Conservation Monitoring Centre's World Database for Protected Areas. IUCN protected areas are defined as, "A clearly defined geographical space, recognized, dedicated and managed, through legal or other effective means, to achieve the long-term conservation of nature with associated ecosystem services and
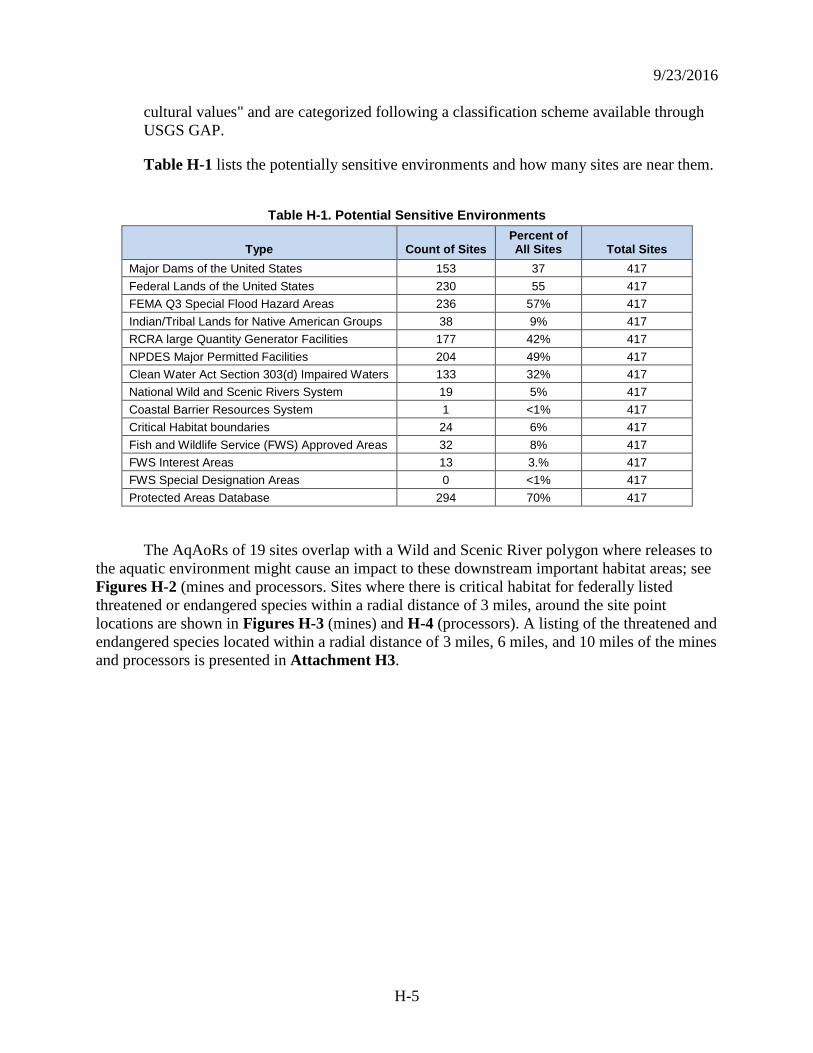
9/23/2016
H-5
cultural values" and are categorized following a classification scheme available through USGS GAP.
Table H-1 lists the potentially sensitive environments and how many sites are near them.
Table H-1. Potential Sensitive Environments
Type Count of Sites Percent of All Sites Total Sites
Major Dams of the United States 153 37 417 Federal Lands of the United States 230 55 417 FEMA Q3 Special Flood Hazard Areas 236 57% 417 Indian/Tribal Lands for Native American Groups 38 9% 417 RCRA large Quantity Generator Facilities 177 42% 417 NPDES Major Permitted Facilities 204 49% 417 Clean Water Act Section 303(d) Impaired Waters 133 32% 417 National Wild and Scenic Rivers System 19 5% 417 Coastal Barrier Resources System 1 <1% 417 Critical Habitat boundaries 24 6% 417 Fish and Wildlife Service (FWS) Approved Areas 32 8% 417 FWS Interest Areas 13 3.% 417 FWS Special Designation Areas 0 <1% 417 Protected Areas Database 294 70% 417
The AqAoRs of 19 sites overlap with a Wild and Scenic River polygon where releases to the aquatic environment might cause an impact to these downstream important habitat areas; see Figures H-2 (mines and processors. Sites where there is critical habitat for federally listed threatened or endangered species within a radial distance of 3 miles, around the site point locations are shown in Figures H-3 (mines) and H-4 (processors). A listing of the threatened and endangered species located within a radial distance of 3 miles, 6 miles, and 10 miles of the mines and processors is presented in Attachment H3.
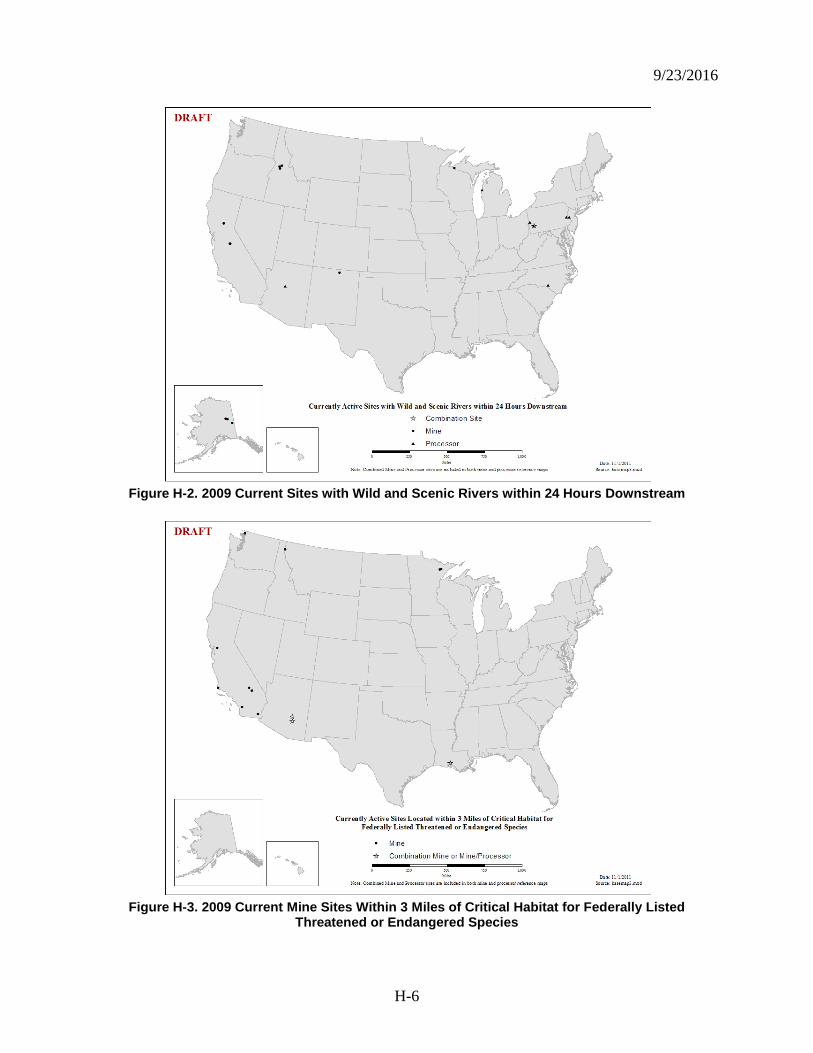
9/23/2016
H-6
Figure H-2. 2009 Current Sites with Wild and Scenic Rivers within 24 Hours Downstream
Figure H-3. 2009 Current Mine Sites Within 3 Miles of Critical Habitat for Federally Listed
Threatened or Endangered Species
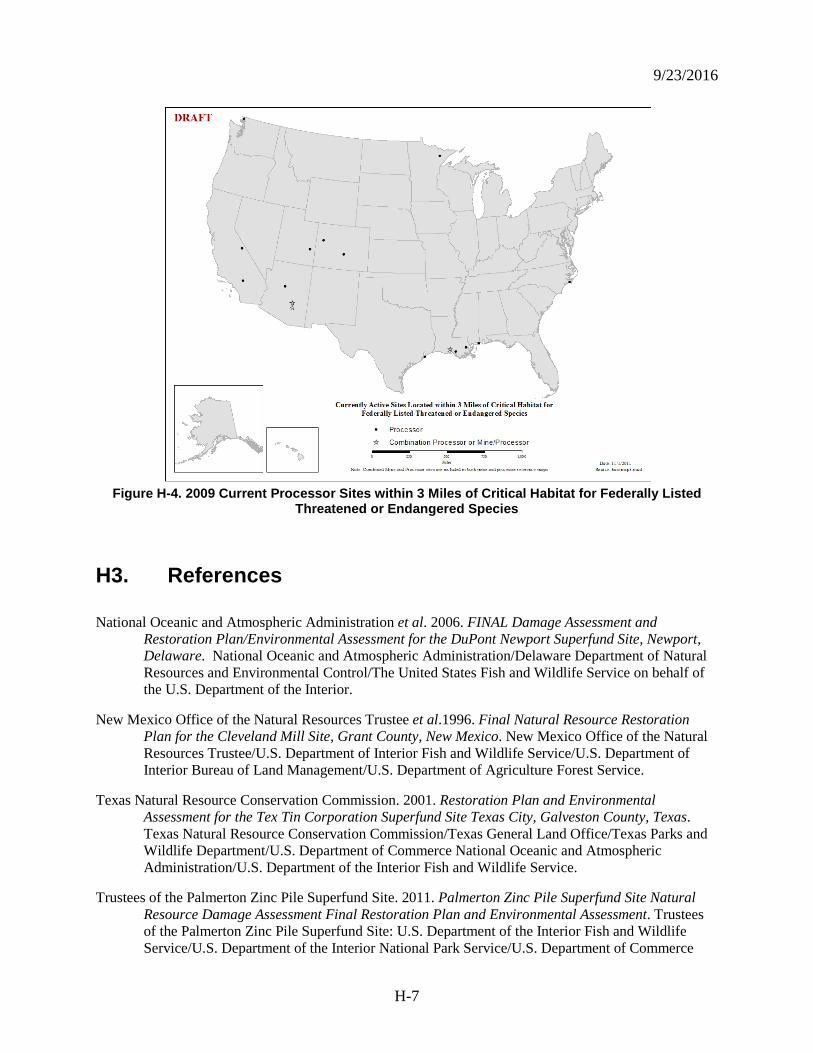
9/23/2016
H-7
Figure H-4. 2009 Current Processor Sites within 3 Miles of Critical Habitat for Federally Listed
Threatened or Endangered Species
H3. References National Oceanic and Atmospheric Administration et al. 2006. FINAL Damage Assessment and
Restoration Plan/Environmental Assessment for the DuPont Newport Superfund Site, Newport, Delaware. National Oceanic and Atmospheric Administration/Delaware Department of Natural Resources and Environmental Control/The United States Fish and Wildlife Service on behalf of the U.S. Department of the Interior.
New Mexico Office of the Natural Resources Trustee et al.1996. Final Natural Resource Restoration Plan for the Cleveland Mill Site, Grant County, New Mexico. New Mexico Office of the Natural Resources Trustee/U.S. Department of Interior Fish and Wildlife Service/U.S. Department of Interior Bureau of Land Management/U.S. Department of Agriculture Forest Service.
Texas Natural Resource Conservation Commission. 2001. Restoration Plan and Environmental Assessment for the Tex Tin Corporation Superfund Site Texas City, Galveston County, Texas. Texas Natural Resource Conservation Commission/Texas General Land Office/Texas Parks and Wildlife Department/U.S. Department of Commerce National Oceanic and Atmospheric Administration/U.S. Department of the Interior Fish and Wildlife Service.
Trustees of the Palmerton Zinc Pile Superfund Site. 2011. Palmerton Zinc Pile Superfund Site Natural Resource Damage Assessment Final Restoration Plan and Environmental Assessment. Trustees of the Palmerton Zinc Pile Superfund Site: U.S. Department of the Interior Fish and Wildlife Service/U.S. Department of the Interior National Park Service/U.S. Department of Commerce
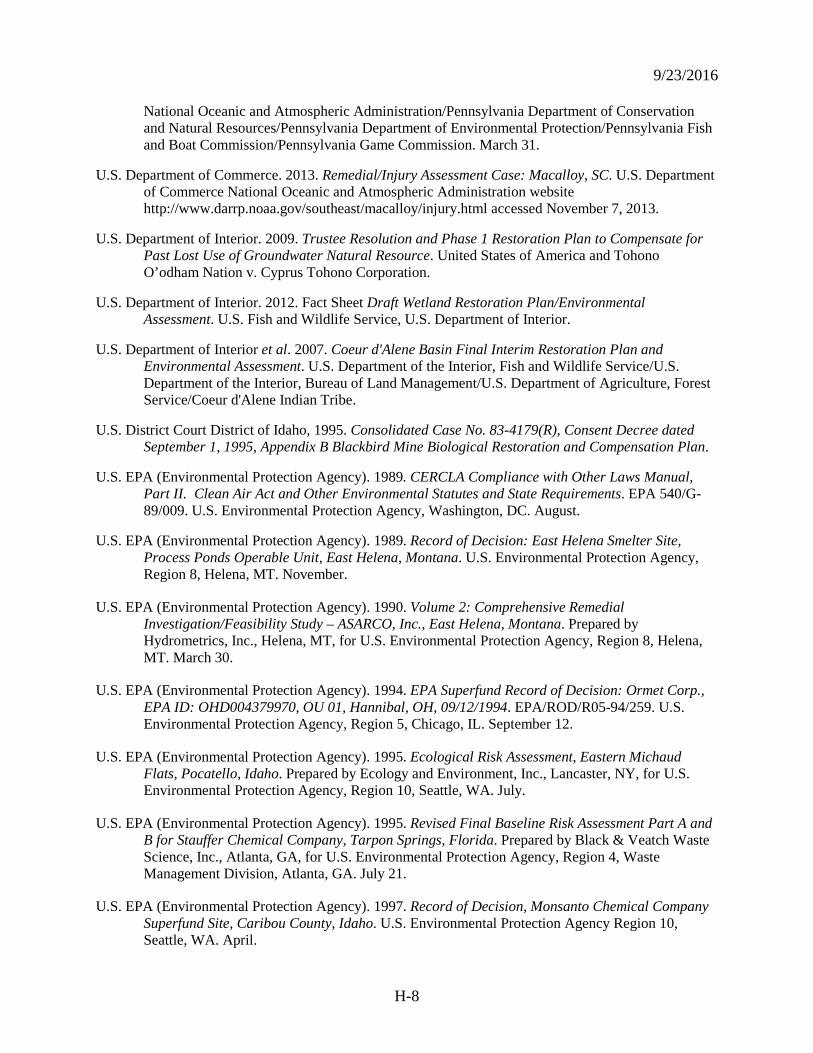
9/23/2016
H-8
National Oceanic and Atmospheric Administration/Pennsylvania Department of Conservation and Natural Resources/Pennsylvania Department of Environmental Protection/Pennsylvania Fish and Boat Commission/Pennsylvania Game Commission. March 31.
U.S. Department of Commerce. 2013. Remedial/Injury Assessment Case: Macalloy, SC. U.S. Department of Commerce National Oceanic and Atmospheric Administration website http://www.darrp.noaa.gov/southeast/macalloy/injury.html accessed November 7, 2013.
U.S. Department of Interior. 2009. Trustee Resolution and Phase 1 Restoration Plan to Compensate for Past Lost Use of Groundwater Natural Resource. United States of America and Tohono O’odham Nation v. Cyprus Tohono Corporation.
U.S. Department of Interior. 2012. Fact Sheet Draft Wetland Restoration Plan/Environmental Assessment. U.S. Fish and Wildlife Service, U.S. Department of Interior.
U.S. Department of Interior et al. 2007. Coeur d'Alene Basin Final Interim Restoration Plan and Environmental Assessment. U.S. Department of the Interior, Fish and Wildlife Service/U.S. Department of the Interior, Bureau of Land Management/U.S. Department of Agriculture, Forest Service/Coeur d'Alene Indian Tribe.
U.S. District Court District of Idaho, 1995. Consolidated Case No. 83-4179(R), Consent Decree dated September 1, 1995, Appendix B Blackbird Mine Biological Restoration and Compensation Plan.
U.S. EPA (Environmental Protection Agency). 1989. CERCLA Compliance with Other Laws Manual, Part II. Clean Air Act and Other Environmental Statutes and State Requirements. EPA 540/G-89/009. U.S. Environmental Protection Agency, Washington, DC. August.
U.S. EPA (Environmental Protection Agency). 1989. Record of Decision: East Helena Smelter Site, Process Ponds Operable Unit, East Helena, Montana. U.S. Environmental Protection Agency, Region 8, Helena, MT. November.
U.S. EPA (Environmental Protection Agency). 1990. Volume 2: Comprehensive Remedial Investigation/Feasibility Study – ASARCO, Inc., East Helena, Montana. Prepared by Hydrometrics, Inc., Helena, MT, for U.S. Environmental Protection Agency, Region 8, Helena, MT. March 30.
U.S. EPA (Environmental Protection Agency). 1994. EPA Superfund Record of Decision: Ormet Corp., EPA ID: OHD004379970, OU 01, Hannibal, OH, 09/12/1994. EPA/ROD/R05-94/259. U.S. Environmental Protection Agency, Region 5, Chicago, IL. September 12.
U.S. EPA (Environmental Protection Agency). 1995. Ecological Risk Assessment, Eastern Michaud Flats, Pocatello, Idaho. Prepared by Ecology and Environment, Inc., Lancaster, NY, for U.S. Environmental Protection Agency, Region 10, Seattle, WA. July.
U.S. EPA (Environmental Protection Agency). 1995. Revised Final Baseline Risk Assessment Part A and B for Stauffer Chemical Company, Tarpon Springs, Florida. Prepared by Black & Veatch Waste Science, Inc., Atlanta, GA, for U.S. Environmental Protection Agency, Region 4, Waste Management Division, Atlanta, GA. July 21.
U.S. EPA (Environmental Protection Agency). 1997. Record of Decision, Monsanto Chemical Company Superfund Site, Caribou County, Idaho. U.S. Environmental Protection Agency Region 10, Seattle, WA. April.
9/23/2016
H-9
U.S. EPA (Environmental Protection Agency). 1998. Li Tungsten, Glen Cove, New York, Draft Final Remedial Investigation (Rl) Report, Volume II of IV (Tables, Figures, Plates). U.S. Environmental Protection Agency, Region 2, New York, NY. May.
U.S. EPA (Environmental Protection Agency). 1998. Record of Decision: Declaration, Decision Summary, and Responsiveness Summary for Eastern Michaud Flats Superfund Site, Pocatello, Idaho. U.S. Environmental Protection Agency, Region 10, Seattle, WA. June.
U.S. EPA (Environmental Protection Agency). 1999. Record of Decision: Li Tungsten Corporation Superfund Site, EPA ID: NYD986882660, OU 01, 02, Glen Cove, Nassau County, New York. EPA/ROD/R02-99/158. U.S. Environmental Protection Agency, Region 2, New York, NY. September 30.
U.S. EPA (Environmental Protection Agency). 2000. EPA Superfund Record of Decision: National Southwire Aluminum Co. EPA ID: KYD049062375 OU 00 Hawesville, KY 07/06/2000. EPA/ROD/R04-00/079. U.S. Environmental Protection Agency, Region 4, Atlanta, GA. July.
U.S. EPA (Environmental Protection Agency). 2001. Early Action – Interim Record of Decision, OU2 – Water Treatment Operations, Gilt Edge Mine NPL Site, Lawrence County, South Dakota. EPA/ROD/R08-01/611. U.S. Environmental Protection Agency, Denver, CO. April 23.
U.S. EPA (Environmental Protection Agency). 2001. Final Ecological Risk Assessment, Volume 1, Coeur d’Alene Basin Remedial Investigation/Feasibility Study. Prepared by CH2M HILL, Bellevue, WA, for U.S. Environmental Protection Agency, Region 10, Seattle, WA. May 18.
U.S. EPA (Environmental Protection Agency). 2002. EPA Superfund Record of Decision: Bunker Hill Mining & Metallurgical Complex EPA ID: IDD048340921 OU 3 Smelterville, ID. EPA/ROD/R10-02/032. U.S. Environmental Protection Agency, Region 10, Seattle, WA. September 12.
U.S. EPA (Environmental Protection Agency). 2002. Superfund Record of Decision: Macalloy Corporation, EPA ID: SCD003360476, OU 01, North Charleston, SC, 8/21/2002. EPA/ROD/R04-02/084. U.S. Environmental Protection Agency, Region 4, Atlanta, GA. August 21.
U.S. EPA (Environmental Protection Agency). 2004. EPA Superfund Record of Decision: Omaha Lead Site, EPA ID: NESFN0703481, OU 01, Omaha, NE, 12/15/2004. EPA/ROD/R07-05/053. U.S. Environmental Protection Agency, Region 7, Kansas City, KS. December 15.
U.S. EPA (Environmental Protection Agency). 2005. Final Remedial Investigation Report for Midnite Mine Stevens County, Washington. Prepared by URS Corporation, Seattle, WA, for U.S. Environmental Protection Agency, Region 10, Seattle, WA. September 30.
U.S. EPA (Environmental Protection Agency). 2006. Reynolds Metals Company Superfund Site, Troutdale, Oregon, Record of Decision for Final Remedial Action. U.S. Environmental Protection Agency, Region 10, Seattle, WA. September 29.
U.S. EPA (Environmental Protection Agency). 2009. Omaha Lead Site, Operable Unit 02, Final Record of Decision. U.S. Environmental Protection Agency, Region 7, Kansas City, KS. May 13.

9/23/2016
H-10
US EPA & Montana DEQ. 1998. U.S. Environmental Protection Agency and Montana Department of Environmental Quality. EPA Superfund Record of Decision: Anaconda Regional Water, Waste, and Soils Operable Unit, Anaconda Smelter NPL Site, Anaconda, MT. U.S. Environmental Protection Agency, Region 8, Helena, MT, and Montana Department of Environmental Quality, Helena, MT. September.
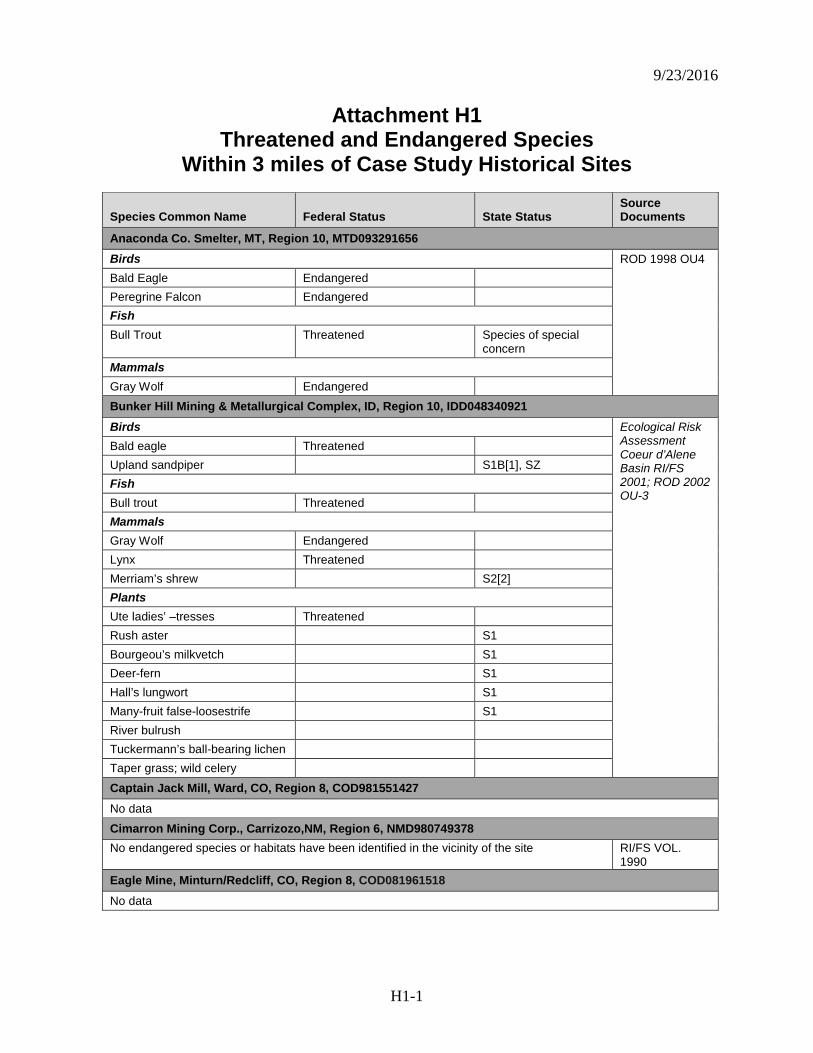
9/23/2016
H1-1
Attachment H1 Threatened and Endangered Species
Within 3 miles of Case Study Historical Sites
Species Common Name Federal Status State Status Source Documents
Anaconda Co. Smelter, MT, Region 10, MTD093291656 Birds ROD 1998 OU4 Bald Eagle Endangered Peregrine Falcon Endangered Fish Bull Trout Threatened Species of special
concern Mammals Gray Wolf Endangered Bunker Hill Mining & Metallurgical Complex, ID, Region 10, IDD048340921 Birds Ecological Risk
Assessment Coeur d’Alene Basin RI/FS 2001; ROD 2002 OU-3
Bald eagle Threatened Upland sandpiper S1B[1], SZ Fish Bull trout Threatened Mammals Gray Wolf Endangered Lynx Threatened Merriam’s shrew S2[2] Plants Ute ladies’ –tresses Threatened Rush aster S1 Bourgeou’s milkvetch S1 Deer-fern S1 Hall’s lungwort S1 Many-fruit false-loosestrife S1 River bulrush Tuckermann’s ball-bearing lichen Taper grass; wild celery
Captain Jack Mill, Ward, CO, Region 8, COD981551427 No data
Cimarron Mining Corp., Carrizozo,NM, Region 6, NMD980749378 No endangered species or habitats have been identified in the vicinity of the site RI/FS VOL.
1990 Eagle Mine, Minturn/Redcliff, CO, Region 8, COD081961518 No data
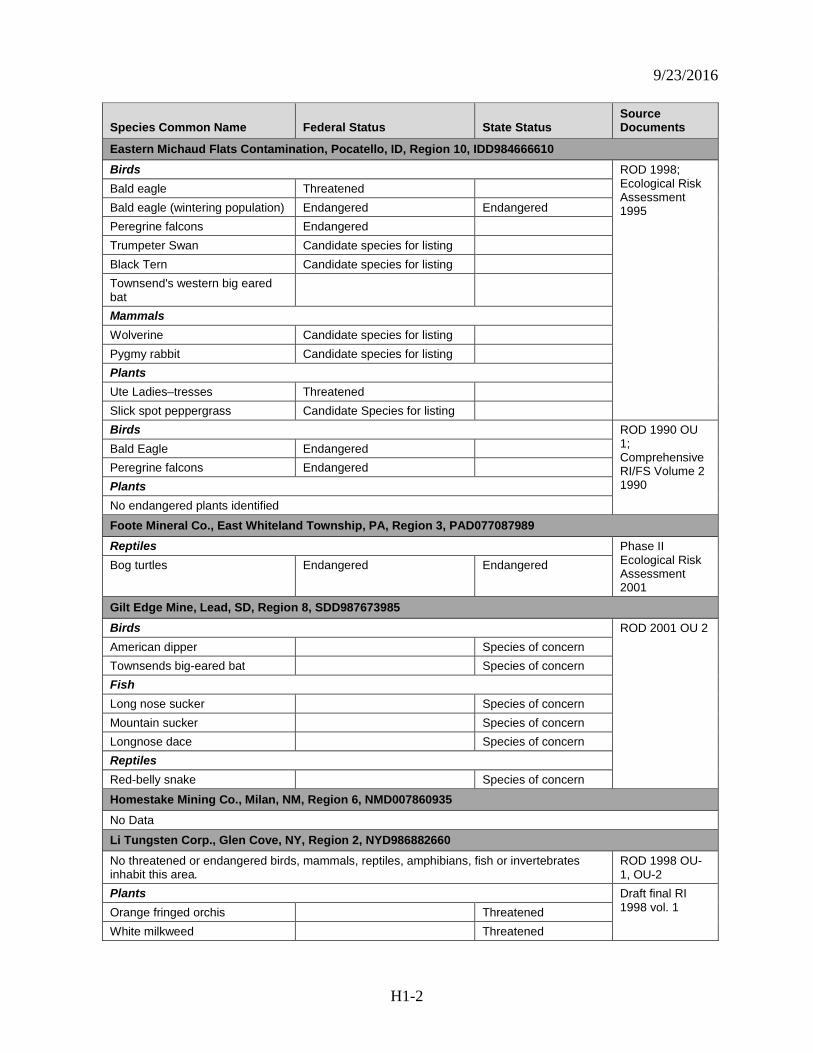
9/23/2016
H1-2
Species Common Name Federal Status State Status Source Documents
Eastern Michaud Flats Contamination, Pocatello, ID, Region 10, IDD984666610 Birds ROD 1998;
Ecological Risk Assessment 1995
Bald eagle Threatened Bald eagle (wintering population) Endangered Endangered Peregrine falcons Endangered Trumpeter Swan Candidate species for listing Black Tern Candidate species for listing Townsend's western big eared bat
Mammals Wolverine Candidate species for listing Pygmy rabbit Candidate species for listing Plants Ute Ladies–tresses Threatened Slick spot peppergrass Candidate Species for listing Birds ROD 1990 OU
1; Comprehensive RI/FS Volume 2 1990
Bald Eagle Endangered Peregrine falcons Endangered Plants No endangered plants identified
Foote Mineral Co., East Whiteland Township, PA, Region 3, PAD077087989 Reptiles Phase II
Ecological Risk Assessment 2001
Bog turtles Endangered Endangered
Gilt Edge Mine, Lead, SD, Region 8, SDD987673985 Birds ROD 2001 OU 2 American dipper Species of concern Townsends big-eared bat Species of concern Fish Long nose sucker Species of concern Mountain sucker Species of concern Longnose dace Species of concern Reptiles Red-belly snake Species of concern
Homestake Mining Co., Milan, NM, Region 6, NMD007860935 No Data
Li Tungsten Corp., Glen Cove, NY, Region 2, NYD986882660 No threatened or endangered birds, mammals, reptiles, amphibians, fish or invertebrates inhabit this area.
ROD 1998 OU-1, OU-2
Plants Draft final RI 1998 vol. 1 Orange fringed orchis Threatened
White milkweed Threatened
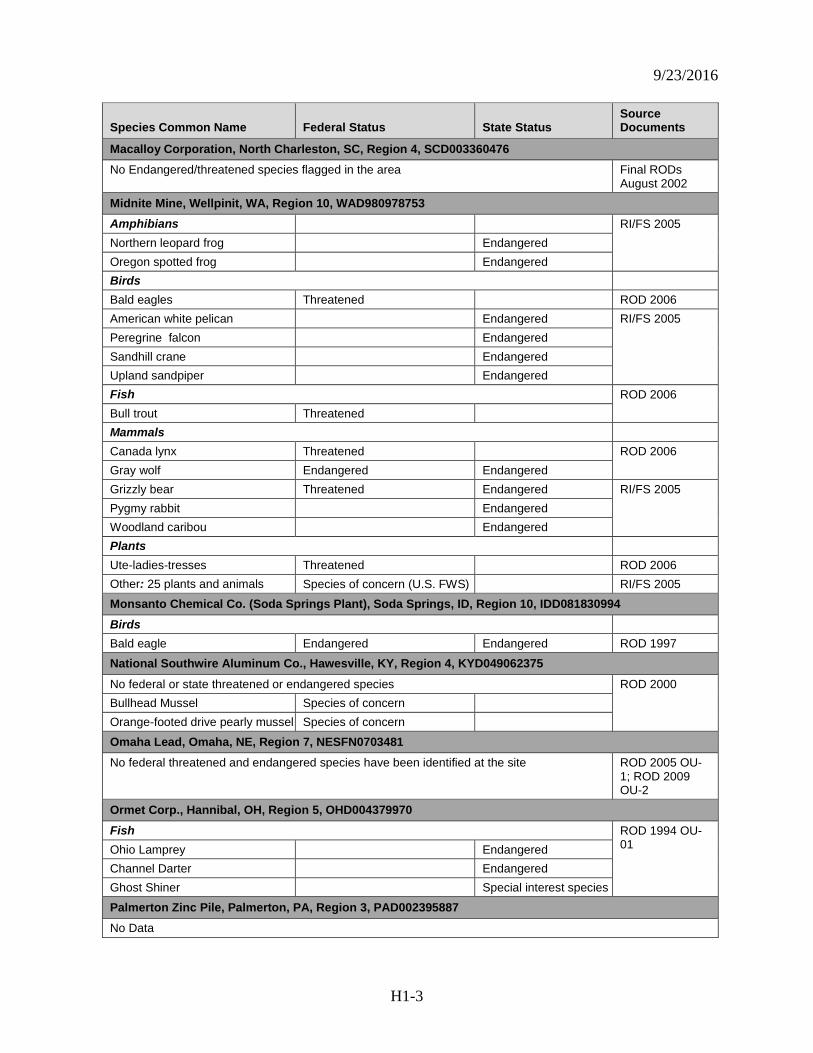
9/23/2016
H1-3
Species Common Name Federal Status State Status Source Documents
Macalloy Corporation, North Charleston, SC, Region 4, SCD003360476 No Endangered/threatened species flagged in the area Final RODs
August 2002 Midnite Mine, Wellpinit, WA, Region 10, WAD980978753 Amphibians RI/FS 2005 Northern leopard frog Endangered Oregon spotted frog Endangered Birds Bald eagles Threatened ROD 2006 American white pelican Endangered RI/FS 2005 Peregrine falcon Endangered Sandhill crane Endangered Upland sandpiper Endangered Fish ROD 2006 Bull trout Threatened Mammals Canada lynx Threatened ROD 2006 Gray wolf Endangered Endangered Grizzly bear Threatened Endangered RI/FS 2005 Pygmy rabbit Endangered Woodland caribou Endangered Plants Ute-ladies-tresses Threatened ROD 2006 Other: 25 plants and animals Species of concern (U.S. FWS) RI/FS 2005 Monsanto Chemical Co. (Soda Springs Plant), Soda Springs, ID, Region 10, IDD081830994 Birds Bald eagle Endangered Endangered ROD 1997
National Southwire Aluminum Co., Hawesville, KY, Region 4, KYD049062375 No federal or state threatened or endangered species ROD 2000 Bullhead Mussel Species of concern Orange-footed drive pearly mussel Species of concern
Omaha Lead, Omaha, NE, Region 7, NESFN0703481 No federal threatened and endangered species have been identified at the site ROD 2005 OU-
1; ROD 2009 OU-2
Ormet Corp., Hannibal, OH, Region 5, OHD004379970 Fish ROD 1994 OU-
01 Ohio Lamprey Endangered Channel Darter Endangered Ghost Shiner Special interest species
Palmerton Zinc Pile, Palmerton, PA, Region 3, PAD002395887 No Data
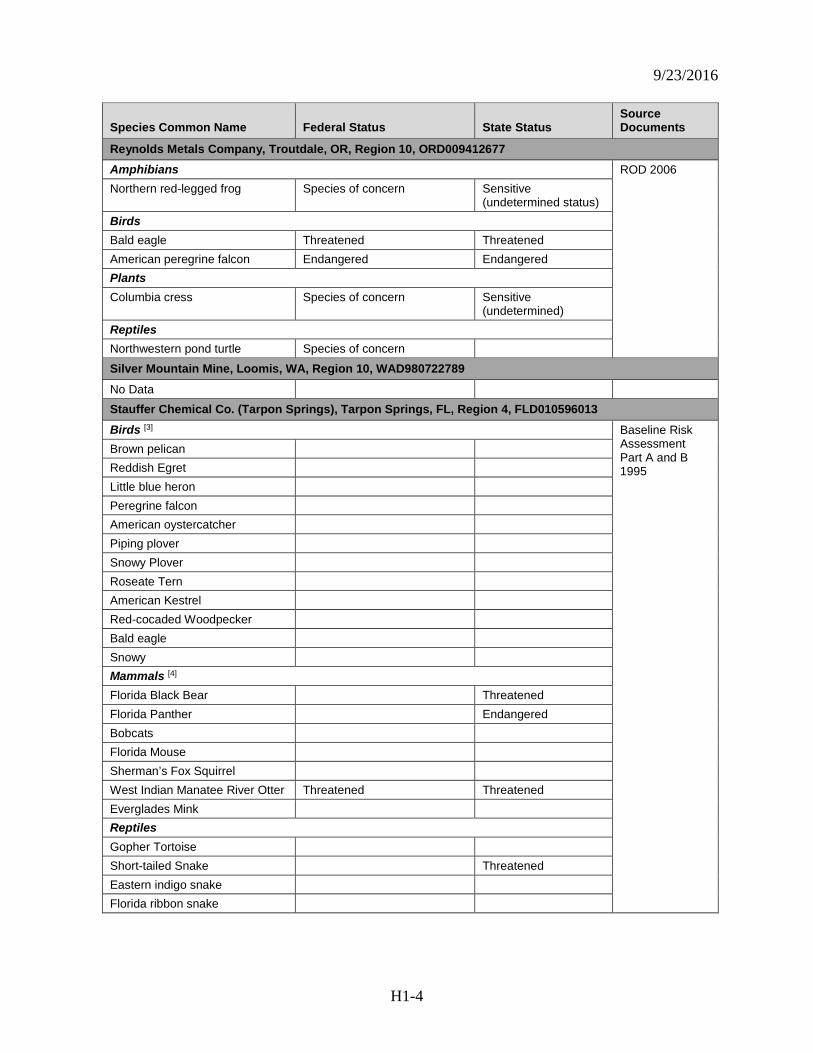
9/23/2016
H1-4
Species Common Name Federal Status State Status Source Documents
Reynolds Metals Company, Troutdale, OR, Region 10, ORD009412677 Amphibians ROD 2006 Northern red-legged frog Species of concern Sensitive
(undetermined status) Birds Bald eagle Threatened Threatened American peregrine falcon Endangered Endangered Plants Columbia cress Species of concern Sensitive
(undetermined) Reptiles Northwestern pond turtle Species of concern
Silver Mountain Mine, Loomis, WA, Region 10, WAD980722789 No Data Stauffer Chemical Co. (Tarpon Springs), Tarpon Springs, FL, Region 4, FLD010596013 Birds [3] Baseline Risk
Assessment Part A and B 1995
Brown pelican Reddish Egret Little blue heron Peregrine falcon American oystercatcher Piping plover Snowy Plover Roseate Tern American Kestrel Red-cocaded Woodpecker Bald eagle Snowy Mammals [4] Florida Black Bear Threatened Florida Panther Endangered Bobcats Florida Mouse Sherman’s Fox Squirrel West Indian Manatee River Otter Threatened Threatened Everglades Mink Reptiles Gopher Tortoise Short-tailed Snake Threatened Eastern indigo snake Florida ribbon snake
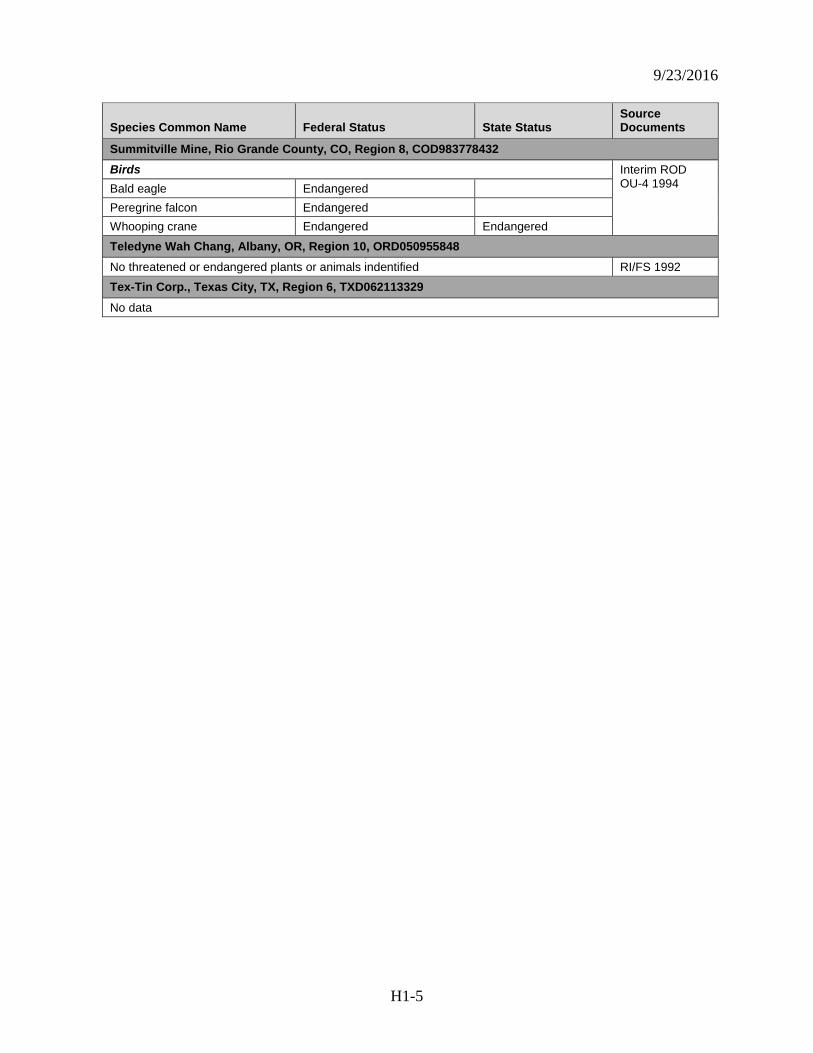
9/23/2016
H1-5
Species Common Name Federal Status State Status Source Documents
Summitville Mine, Rio Grande County, CO, Region 8, COD983778432 Birds Interim ROD
OU-4 1994 Bald eagle Endangered Peregrine falcon Endangered Whooping crane Endangered Endangered
Teledyne Wah Chang, Albany, OR, Region 10, ORD050955848 No threatened or endangered plants or animals indentified RI/FS 1992
Tex-Tin Corp., Texas City, TX, Region 6, TXD062113329 No data
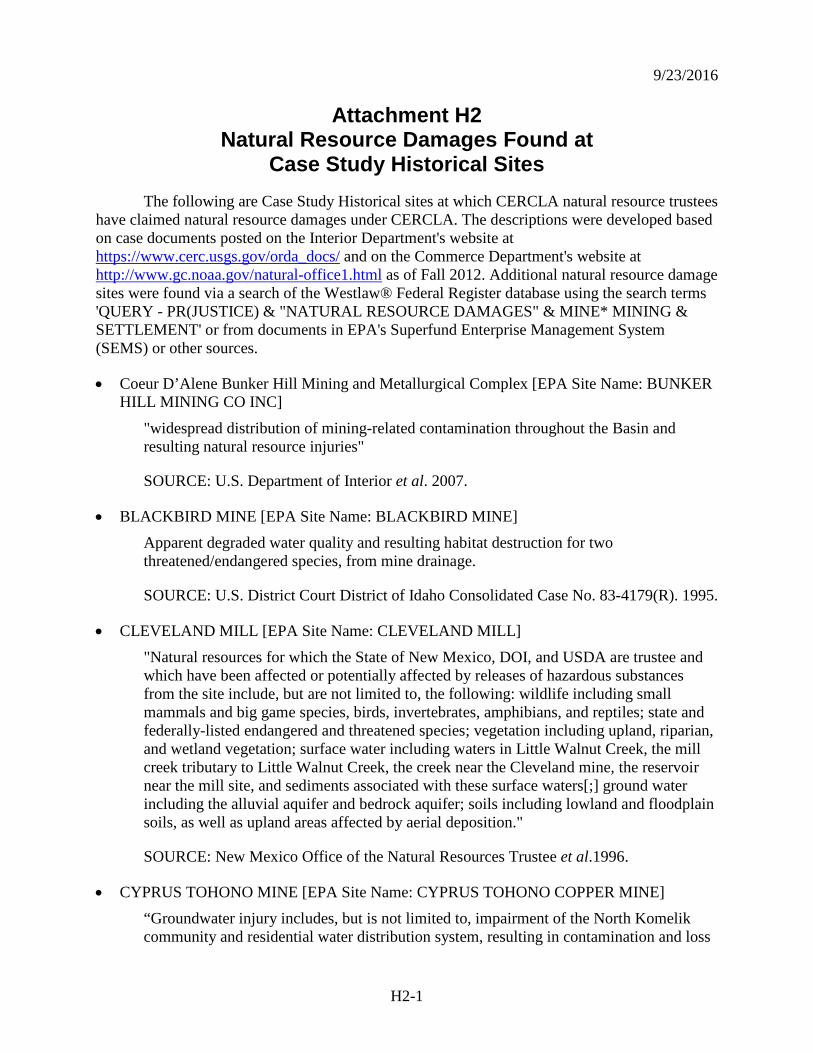
9/23/2016
H2-1
Attachment H2 Natural Resource Damages Found at
Case Study Historical Sites The following are Case Study Historical sites at which CERCLA natural resource trustees
have claimed natural resource damages under CERCLA. The descriptions were developed based on case documents posted on the Interior Department's website at https://www.cerc.usgs.gov/orda_docs/ and on the Commerce Department's website at http://www.gc.noaa.gov/natural-office1.html as of Fall 2012. Additional natural resource damage sites were found via a search of the Westlaw® Federal Register database using the search terms 'QUERY - PR(JUSTICE) & "NATURAL RESOURCE DAMAGES" & MINE* MINING & SETTLEMENT' or from documents in EPA's Superfund Enterprise Management System (SEMS) or other sources.
• Coeur D’Alene Bunker Hill Mining and Metallurgical Complex [EPA Site Name: BUNKER HILL MINING CO INC]
"widespread distribution of mining-related contamination throughout the Basin and resulting natural resource injuries"
SOURCE: U.S. Department of Interior et al. 2007.
• BLACKBIRD MINE [EPA Site Name: BLACKBIRD MINE] Apparent degraded water quality and resulting habitat destruction for two threatened/endangered species, from mine drainage.
SOURCE: U.S. District Court District of Idaho Consolidated Case No. 83-4179(R). 1995.
• CLEVELAND MILL [EPA Site Name: CLEVELAND MILL] "Natural resources for which the State of New Mexico, DOI, and USDA are trustee and which have been affected or potentially affected by releases of hazardous substances from the site include, but are not limited to, the following: wildlife including small mammals and big game species, birds, invertebrates, amphibians, and reptiles; state and federally-listed endangered and threatened species; vegetation including upland, riparian, and wetland vegetation; surface water including waters in Little Walnut Creek, the mill creek tributary to Little Walnut Creek, the creek near the Cleveland mine, the reservoir near the mill site, and sediments associated with these surface waters[;] ground water including the alluvial aquifer and bedrock aquifer; soils including lowland and floodplain soils, as well as upland areas affected by aerial deposition."
SOURCE: New Mexico Office of the Natural Resources Trustee et al.1996.
• CYPRUS TOHONO MINE [EPA Site Name: CYPRUS TOHONO COPPER MINE] “Groundwater injury includes, but is not limited to, impairment of the North Komelik community and residential water distribution system, resulting in contamination and loss
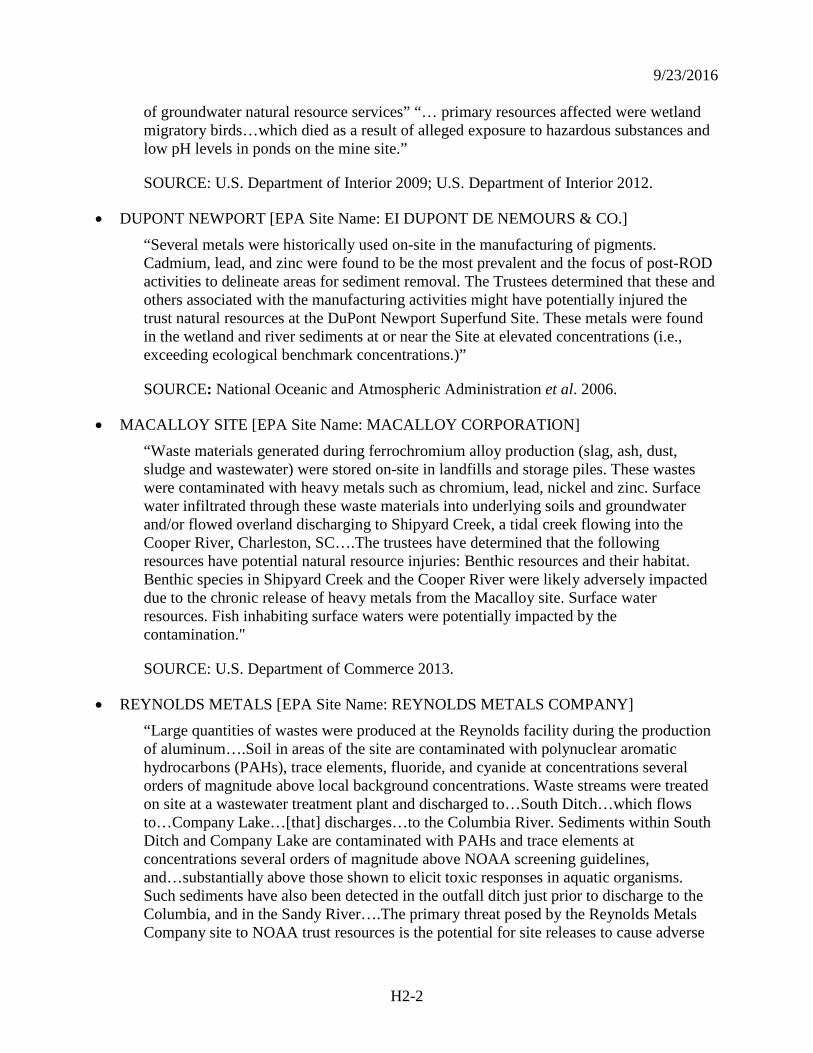
9/23/2016
H2-2
of groundwater natural resource services” “… primary resources affected were wetland migratory birds…which died as a result of alleged exposure to hazardous substances and low pH levels in ponds on the mine site.”
SOURCE: U.S. Department of Interior 2009; U.S. Department of Interior 2012.
• DUPONT NEWPORT [EPA Site Name: EI DUPONT DE NEMOURS & CO.] “Several metals were historically used on-site in the manufacturing of pigments. Cadmium, lead, and zinc were found to be the most prevalent and the focus of post-ROD activities to delineate areas for sediment removal. The Trustees determined that these and others associated with the manufacturing activities might have potentially injured the trust natural resources at the DuPont Newport Superfund Site. These metals were found in the wetland and river sediments at or near the Site at elevated concentrations (i.e., exceeding ecological benchmark concentrations.)”
SOURCE: National Oceanic and Atmospheric Administration et al. 2006.
• MACALLOY SITE [EPA Site Name: MACALLOY CORPORATION] “Waste materials generated during ferrochromium alloy production (slag, ash, dust, sludge and wastewater) were stored on-site in landfills and storage piles. These wastes were contaminated with heavy metals such as chromium, lead, nickel and zinc. Surface water infiltrated through these waste materials into underlying soils and groundwater and/or flowed overland discharging to Shipyard Creek, a tidal creek flowing into the Cooper River, Charleston, SC….The trustees have determined that the following resources have potential natural resource injuries: Benthic resources and their habitat. Benthic species in Shipyard Creek and the Cooper River were likely adversely impacted due to the chronic release of heavy metals from the Macalloy site. Surface water resources. Fish inhabiting surface waters were potentially impacted by the contamination."
SOURCE: U.S. Department of Commerce 2013.
• REYNOLDS METALS [EPA Site Name: REYNOLDS METALS COMPANY] “Large quantities of wastes were produced at the Reynolds facility during the production of aluminum….Soil in areas of the site are contaminated with polynuclear aromatic hydrocarbons (PAHs), trace elements, fluoride, and cyanide at concentrations several orders of magnitude above local background concentrations. Waste streams were treated on site at a wastewater treatment plant and discharged to…South Ditch…which flows to…Company Lake…[that] discharges…to the Columbia River. Sediments within South Ditch and Company Lake are contaminated with PAHs and trace elements at concentrations several orders of magnitude above NOAA screening guidelines, and…substantially above those shown to elicit toxic responses in aquatic organisms. Such sediments have also been detected in the outfall ditch just prior to discharge to the Columbia, and in the Sandy River….The primary threat posed by the Reynolds Metals Company site to NOAA trust resources is the potential for site releases to cause adverse
9/23/2016
H2-3
ecological impacts to anadromous species that utilize the Columbia and Sandy Rivers and to their supporting habitat. The Columbia River watershed is the most important anadromous salmonid basin on the west coast of the United States. The Columbia and Sandy Rivers near the site provide nursery and foraging habitat as well as a migratory corridor for five anadromous salmonid species (including three runs which are threatened and/or endangered), plus American shad and white sturgeon.”
SOURCE: U.S. Department of Commerce 1996.
• TEX-TIN [EPA Site Name: TEX-TIN CORP] “The trace metals aluminum, antimony, arsenic, barium, beryllium, cadmium, chromium, cobalt, copper, iron, lead, manganese, mercury, nickel, silver, tin, vanadium, and zinc and polycyclic aromatic hydrocarbons (PAHs) detected at the Site are hazardous substances covered by…CERCLA….[C]ontamination, originating from the Site, has been detected or is predicted to occur in [local surface water bodies]. Subsequent to construction of the HPL, Site contaminants only reach the Swan Lake system by aerial deposition and through storm events, floods, and extreme tidal excursions. Existing data indicate that trace metals are the primary contaminants at this Site. PAHs were frequently encountered; however, the levels of PAHs were not as high relative to levels of concern as the trace metals….1.2 Natural Resource Injuries Trace metals, particularly chromium, copper, lead, tin, and zinc, are the primary contaminants of concern at the Site…..The Swan Lake ecosystem, part of the greater Galveston Bay ecosystem, is an important habitat for numerous recreational and commercial fish and shellfish species….Trustees were able to identify the types of habitats, their component resources, and the habitat or resources services with the greatest potential to have been injured by historic and ongoing releases of metals from the Site. These include subtidal unvegetated soft-bottom benthic habitats….Some animals living in these habitats, such as shellfish, fish, and birds, may have suffered lethal effects (increased mortality) or sublethal effects (reduced growth, reduced fecundity, etc.) as a result of exposure to metals.”
SOURCE: Texas Natural Resource Conservation Commission 2001.
• PALMERTON ZINC [EPA Site Name: ZINC CORPORATION OF AMERICA] “The East and West Plants of the former New Jersey Zinc Company, a primary zinc smelting facility, discharged metals to the surrounding environment via air emissions and through the release of liquid and solid wastes. A secondary metals processing and reclamation facility has operated in the East Plant area since the shutdown of the primary zinc smelting facility in 1980. Metals, including arsenic, cadmium, chromium, copper, lead, manganese, and zinc were released to the environment from these facilities, adversely affecting Aquashicola Creek, the Lehigh River, Blue Mountain, and Stony Ridge.”
SOURCE: Trustees of the Palmerton Zinc Pile Superfund Site 2011.
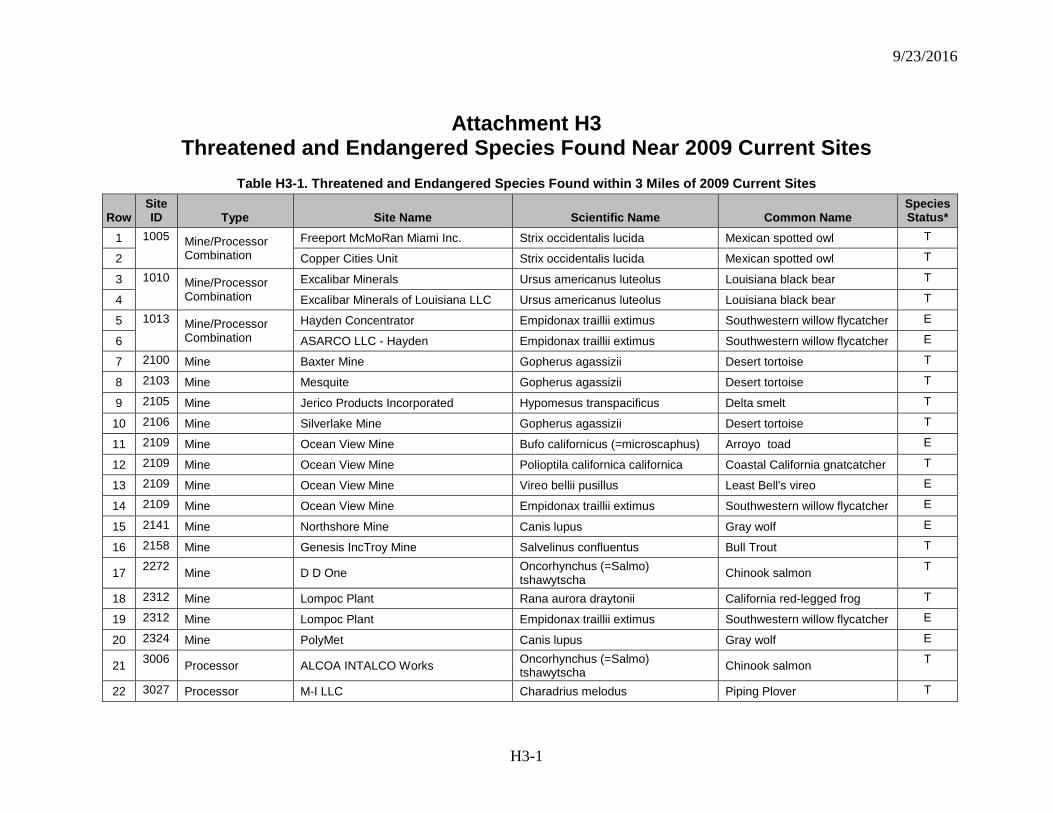
9/23/2016
H3-1
Attachment H3 Threatened and Endangered Species Found Near 2009 Current Sites
Table H3-1. Threatened and Endangered Species Found within 3 Miles of 2009 Current Sites
Row Site ID Type Site Name Scientific Name Common Name
Species Status*
1 1005 Mine/Processor Combination
Freeport McMoRan Miami Inc. Strix occidentalis lucida Mexican spotted owl T
2 Copper Cities Unit Strix occidentalis lucida Mexican spotted owl T
3 1010 Mine/Processor Combination
Excalibar Minerals Ursus americanus luteolus Louisiana black bear T
4 Excalibar Minerals of Louisiana LLC Ursus americanus luteolus Louisiana black bear T
5 1013 Mine/Processor Combination
Hayden Concentrator Empidonax traillii extimus Southwestern willow flycatcher E
6 ASARCO LLC - Hayden Empidonax traillii extimus Southwestern willow flycatcher E
7 2100 Mine Baxter Mine Gopherus agassizii Desert tortoise T
8 2103 Mine Mesquite Gopherus agassizii Desert tortoise T
9 2105 Mine Jerico Products Incorporated Hypomesus transpacificus Delta smelt T
10 2106 Mine Silverlake Mine Gopherus agassizii Desert tortoise T
11 2109 Mine Ocean View Mine Bufo californicus (=microscaphus) Arroyo toad E
12 2109 Mine Ocean View Mine Polioptila californica californica Coastal California gnatcatcher T
13 2109 Mine Ocean View Mine Vireo bellii pusillus Least Bell's vireo E
14 2109 Mine Ocean View Mine Empidonax traillii extimus Southwestern willow flycatcher E
15 2141 Mine Northshore Mine Canis lupus Gray wolf E
16 2158 Mine Genesis IncTroy Mine Salvelinus confluentus Bull Trout T
17 2272 Mine D D One Oncorhynchus (=Salmo) tshawytscha Chinook salmon T
18 2312 Mine Lompoc Plant Rana aurora draytonii California red-legged frog T
19 2312 Mine Lompoc Plant Empidonax traillii extimus Southwestern willow flycatcher E
20 2324 Mine PolyMet Canis lupus Gray wolf E
21 3006 Processor ALCOA INTALCO Works Oncorhynchus (=Salmo) tshawytscha Chinook salmon T
22 3027 Processor M-I LLC Charadrius melodus Piping Plover T
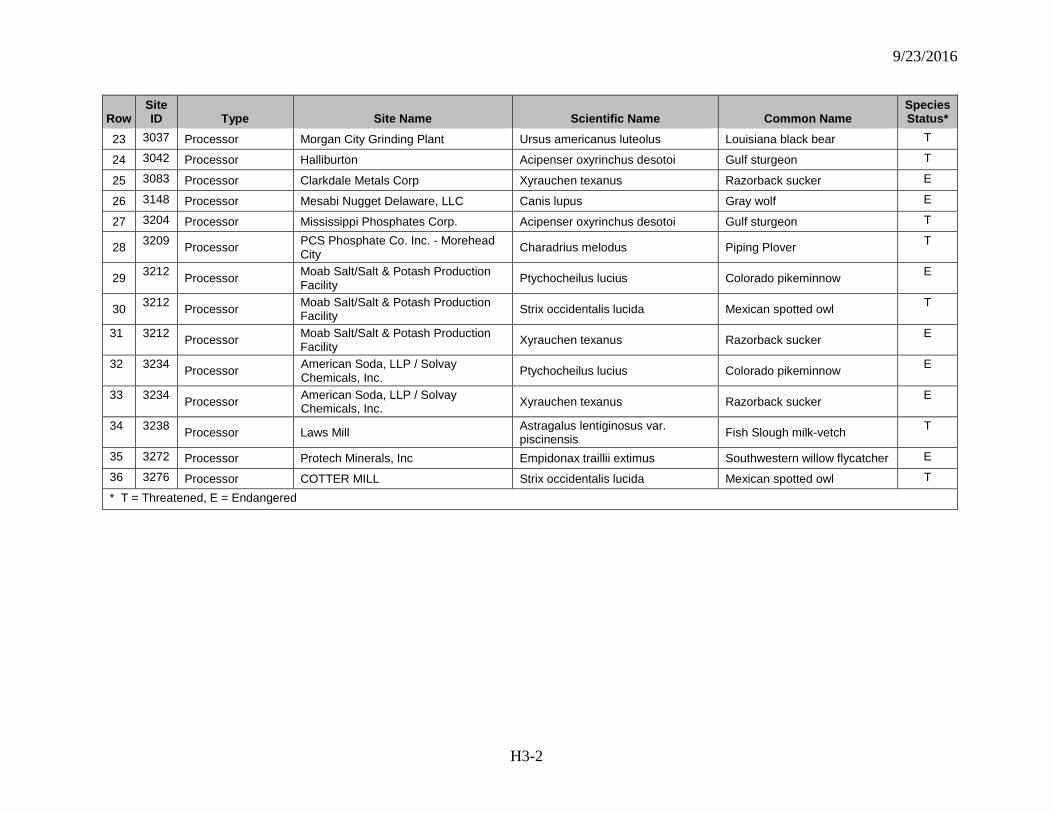
9/23/2016
H3-2
Row Site ID Type Site Name Scientific Name Common Name
Species Status*
23 3037 Processor Morgan City Grinding Plant Ursus americanus luteolus Louisiana black bear T
24 3042 Processor Halliburton Acipenser oxyrinchus desotoi Gulf sturgeon T
25 3083 Processor Clarkdale Metals Corp Xyrauchen texanus Razorback sucker E
26 3148 Processor Mesabi Nugget Delaware, LLC Canis lupus Gray wolf E
27 3204 Processor Mississippi Phosphates Corp. Acipenser oxyrinchus desotoi Gulf sturgeon T
28 3209 Processor PCS Phosphate Co. Inc. - Morehead City Charadrius melodus Piping Plover T
29 3212 Processor Moab Salt/Salt & Potash Production Facility Ptychocheilus lucius Colorado pikeminnow E
30 3212 Processor Moab Salt/Salt & Potash Production Facility Strix occidentalis lucida Mexican spotted owl T
31 3212 Processor Moab Salt/Salt & Potash Production Facility Xyrauchen texanus Razorback sucker E
32 3234 Processor American Soda, LLP / Solvay Chemicals, Inc. Ptychocheilus lucius Colorado pikeminnow E
33 3234 Processor American Soda, LLP / Solvay Chemicals, Inc. Xyrauchen texanus Razorback sucker E
34 3238 Processor Laws Mill Astragalus lentiginosus var. piscinensis Fish Slough milk-vetch T
35 3272 Processor Protech Minerals, Inc Empidonax traillii extimus Southwestern willow flycatcher E
36 3276 Processor COTTER MILL Strix occidentalis lucida Mexican spotted owl T
* T = Threatened, E = Endangered
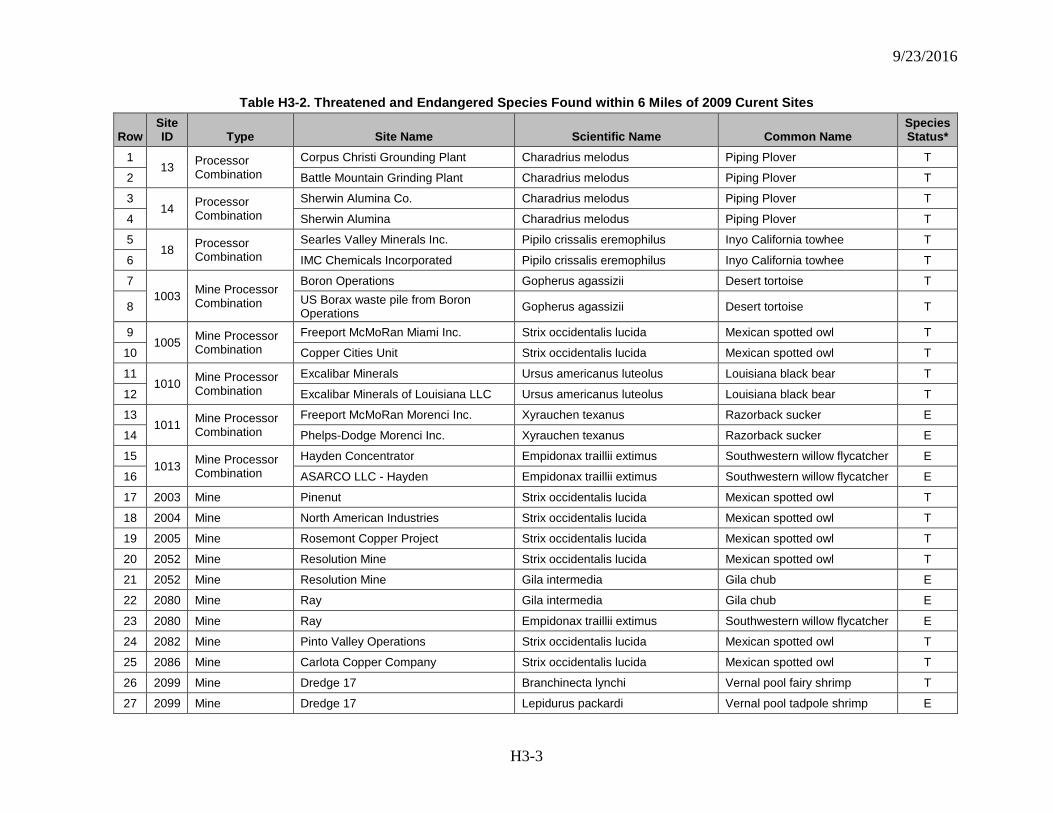
9/23/2016
H3-3
Table H3-2. Threatened and Endangered Species Found within 6 Miles of 2009 Curent Sites
Row Site ID Type Site Name Scientific Name Common Name
Species Status*
1 13 Processor
Combination Corpus Christi Grounding Plant Charadrius melodus Piping Plover T
2 Battle Mountain Grinding Plant Charadrius melodus Piping Plover T
3 14 Processor
Combination Sherwin Alumina Co. Charadrius melodus Piping Plover T
4 Sherwin Alumina Charadrius melodus Piping Plover T
5 18 Processor
Combination Searles Valley Minerals Inc. Pipilo crissalis eremophilus Inyo California towhee T
6 IMC Chemicals Incorporated Pipilo crissalis eremophilus Inyo California towhee T
7 1003 Mine Processor
Combination
Boron Operations Gopherus agassizii Desert tortoise T
8 US Borax waste pile from Boron Operations Gopherus agassizii Desert tortoise T
9 1005 Mine Processor
Combination Freeport McMoRan Miami Inc. Strix occidentalis lucida Mexican spotted owl T
10 Copper Cities Unit Strix occidentalis lucida Mexican spotted owl T
11 1010 Mine Processor
Combination Excalibar Minerals Ursus americanus luteolus Louisiana black bear T
12 Excalibar Minerals of Louisiana LLC Ursus americanus luteolus Louisiana black bear T
13 1011 Mine Processor
Combination Freeport McMoRan Morenci Inc. Xyrauchen texanus Razorback sucker E
14 Phelps-Dodge Morenci Inc. Xyrauchen texanus Razorback sucker E
15 1013 Mine Processor
Combination Hayden Concentrator Empidonax traillii extimus Southwestern willow flycatcher E
16 ASARCO LLC - Hayden Empidonax traillii extimus Southwestern willow flycatcher E
17 2003 Mine Pinenut Strix occidentalis lucida Mexican spotted owl T
18 2004 Mine North American Industries Strix occidentalis lucida Mexican spotted owl T
19 2005 Mine Rosemont Copper Project Strix occidentalis lucida Mexican spotted owl T
20 2052 Mine Resolution Mine Strix occidentalis lucida Mexican spotted owl T
21 2052 Mine Resolution Mine Gila intermedia Gila chub E
22 2080 Mine Ray Gila intermedia Gila chub E
23 2080 Mine Ray Empidonax traillii extimus Southwestern willow flycatcher E
24 2082 Mine Pinto Valley Operations Strix occidentalis lucida Mexican spotted owl T
25 2086 Mine Carlota Copper Company Strix occidentalis lucida Mexican spotted owl T
26 2099 Mine Dredge 17 Branchinecta lynchi Vernal pool fairy shrimp T
27 2099 Mine Dredge 17 Lepidurus packardi Vernal pool tadpole shrimp E
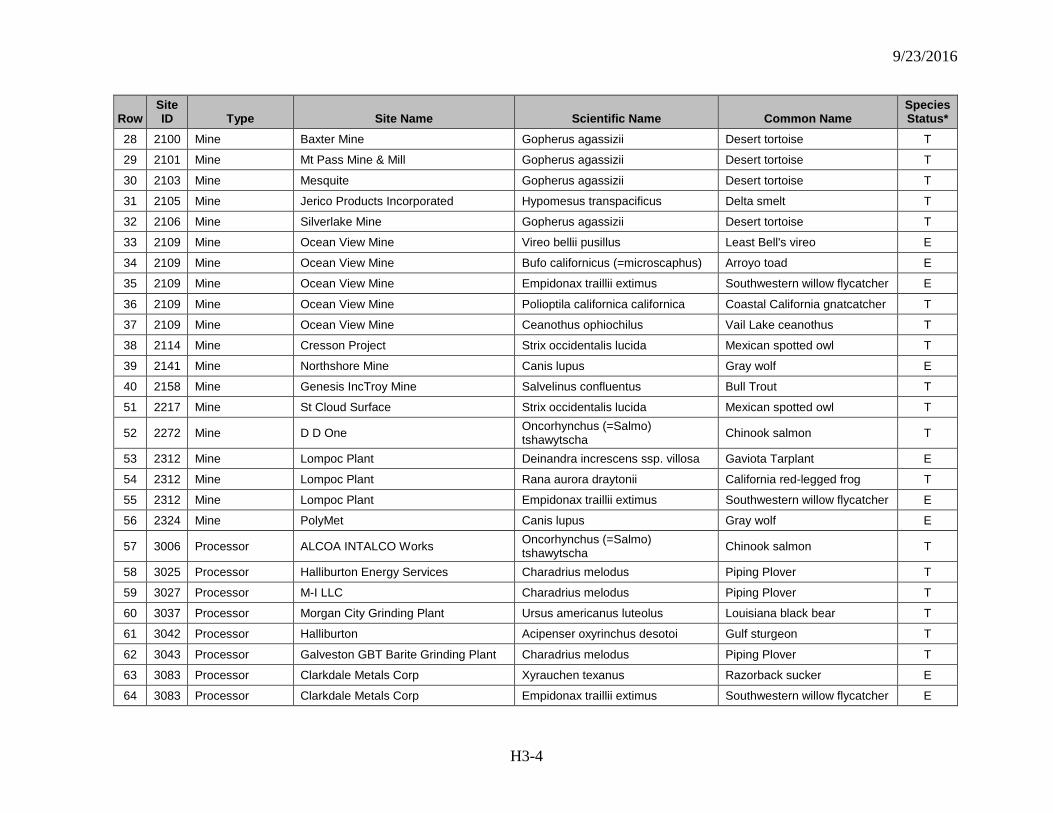
9/23/2016
H3-4
Row Site ID Type Site Name Scientific Name Common Name
Species Status*
28 2100 Mine Baxter Mine Gopherus agassizii Desert tortoise T
29 2101 Mine Mt Pass Mine & Mill Gopherus agassizii Desert tortoise T
30 2103 Mine Mesquite Gopherus agassizii Desert tortoise T
31 2105 Mine Jerico Products Incorporated Hypomesus transpacificus Delta smelt T
32 2106 Mine Silverlake Mine Gopherus agassizii Desert tortoise T
33 2109 Mine Ocean View Mine Vireo bellii pusillus Least Bell's vireo E
34 2109 Mine Ocean View Mine Bufo californicus (=microscaphus) Arroyo toad E
35 2109 Mine Ocean View Mine Empidonax traillii extimus Southwestern willow flycatcher E
36 2109 Mine Ocean View Mine Polioptila californica californica Coastal California gnatcatcher T
37 2109 Mine Ocean View Mine Ceanothus ophiochilus Vail Lake ceanothus T
38 2114 Mine Cresson Project Strix occidentalis lucida Mexican spotted owl T
39 2141 Mine Northshore Mine Canis lupus Gray wolf E
40 2158 Mine Genesis IncTroy Mine Salvelinus confluentus Bull Trout T
51 2217 Mine St Cloud Surface Strix occidentalis lucida Mexican spotted owl T
52 2272 Mine D D One Oncorhynchus (=Salmo) tshawytscha Chinook salmon T
53 2312 Mine Lompoc Plant Deinandra increscens ssp. villosa Gaviota Tarplant E
54 2312 Mine Lompoc Plant Rana aurora draytonii California red-legged frog T
55 2312 Mine Lompoc Plant Empidonax traillii extimus Southwestern willow flycatcher E
56 2324 Mine PolyMet Canis lupus Gray wolf E
57 3006 Processor ALCOA INTALCO Works Oncorhynchus (=Salmo) tshawytscha Chinook salmon T
58 3025 Processor Halliburton Energy Services Charadrius melodus Piping Plover T
59 3027 Processor M-I LLC Charadrius melodus Piping Plover T
60 3037 Processor Morgan City Grinding Plant Ursus americanus luteolus Louisiana black bear T
61 3042 Processor Halliburton Acipenser oxyrinchus desotoi Gulf sturgeon T
62 3043 Processor Galveston GBT Barite Grinding Plant Charadrius melodus Piping Plover T
63 3083 Processor Clarkdale Metals Corp Xyrauchen texanus Razorback sucker E
64 3083 Processor Clarkdale Metals Corp Empidonax traillii extimus Southwestern willow flycatcher E

9/23/2016
H3-5
Row Site ID Type Site Name Scientific Name Common Name
Species Status*
65 3148 Processor Mesabi Nugget Delaware, LLC Canis lupus Gray wolf E
66 3149 Processor Northshore Mining Company Canis lupus Gray wolf E
67 3174 Processor Giles Chemical Alasmidonta raveneliana Appalachian elktoe E
68 3191 Processor A-1 Grit Co Astragalus brauntonii Braunton's milk-vetch E
69 3195 Processor ZEOX Corp. - Ash Meadows Plant & Mine Grindelia fraxino-pratensis Ash Meadows gumplant T
70 3195 Processor ZEOX Corp. - Ash Meadows Plant & Mine Centaurium namophilum Spring-loving centaury T
71 3204 Processor Mississippi Phosphates Corp. Charadrius melodus Piping Plover T
72 3204 Processor Mississippi Phosphates Corp. Acipenser oxyrinchus desotoi Gulf sturgeon T
73 3209 Processor PCS Phosphate Co. Inc. - Morehead City Charadrius melodus Piping Plover T
74 3212 Processor Moab Salt/Salt & Potash Production Facility Strix occidentalis lucida Mexican spotted owl T
75 3212 Processor Moab Salt/Salt & Potash Production Facility Ptychocheilus lucius Colorado pikeminnow E
76 3212 Processor Moab Salt/Salt & Potash Production Facility Xyrauchen texanus Razorback sucker E
77 3234 Processor AMERICAN SODA, LLP / SOLVAY CHEMICALS, INC. Ptychocheilus lucius Colorado pikeminnow E
78 3234 Processor AMERICAN SODA, LLP / SOLVAY CHEMICALS, INC. Xyrauchen texanus Razorback sucker E
79 3238 Processor Laws Mill Astragalus lentiginosus var. piscinensis Fish Slough milk-vetch T
80 3272 Processor Protech Minerals, Inc Empidonax traillii extimus Southwestern willow flycatcher E
81 3276 Processor COTTER MILL Strix occidentalis lucida Mexican spotted owl T
82 3292 Processor Standard Mineral Co., Inc. Notropis mekistocholas Cape Fear shiner E
* T = Threatened, E = Endangered
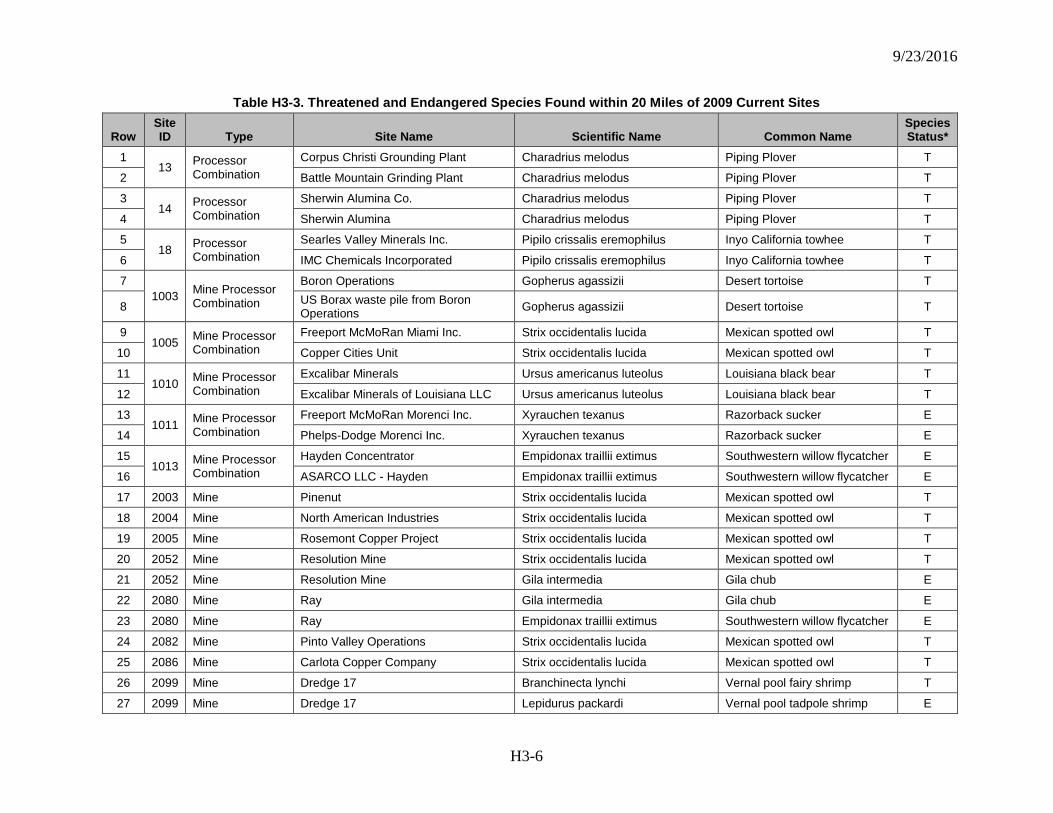
9/23/2016
H3-6
Table H3-3. Threatened and Endangered Species Found within 20 Miles of 2009 Current Sites
Row Site ID Type Site Name Scientific Name Common Name
Species Status*
1 13 Processor
Combination Corpus Christi Grounding Plant Charadrius melodus Piping Plover T
2 Battle Mountain Grinding Plant Charadrius melodus Piping Plover T
3 14 Processor
Combination Sherwin Alumina Co. Charadrius melodus Piping Plover T
4 Sherwin Alumina Charadrius melodus Piping Plover T
5 18 Processor
Combination Searles Valley Minerals Inc. Pipilo crissalis eremophilus Inyo California towhee T
6 IMC Chemicals Incorporated Pipilo crissalis eremophilus Inyo California towhee T
7 1003 Mine Processor
Combination
Boron Operations Gopherus agassizii Desert tortoise T
8 US Borax waste pile from Boron Operations Gopherus agassizii Desert tortoise T
9 1005 Mine Processor
Combination Freeport McMoRan Miami Inc. Strix occidentalis lucida Mexican spotted owl T
10 Copper Cities Unit Strix occidentalis lucida Mexican spotted owl T
11 1010 Mine Processor
Combination Excalibar Minerals Ursus americanus luteolus Louisiana black bear T
12 Excalibar Minerals of Louisiana LLC Ursus americanus luteolus Louisiana black bear T
13 1011 Mine Processor
Combination Freeport McMoRan Morenci Inc. Xyrauchen texanus Razorback sucker E
14 Phelps-Dodge Morenci Inc. Xyrauchen texanus Razorback sucker E
15 1013 Mine Processor
Combination Hayden Concentrator Empidonax traillii extimus Southwestern willow flycatcher E
16 ASARCO LLC - Hayden Empidonax traillii extimus Southwestern willow flycatcher E
17 2003 Mine Pinenut Strix occidentalis lucida Mexican spotted owl T
18 2004 Mine North American Industries Strix occidentalis lucida Mexican spotted owl T
19 2005 Mine Rosemont Copper Project Strix occidentalis lucida Mexican spotted owl T
20 2052 Mine Resolution Mine Strix occidentalis lucida Mexican spotted owl T
21 2052 Mine Resolution Mine Gila intermedia Gila chub E
22 2080 Mine Ray Gila intermedia Gila chub E
23 2080 Mine Ray Empidonax traillii extimus Southwestern willow flycatcher E
24 2082 Mine Pinto Valley Operations Strix occidentalis lucida Mexican spotted owl T
25 2086 Mine Carlota Copper Company Strix occidentalis lucida Mexican spotted owl T
26 2099 Mine Dredge 17 Branchinecta lynchi Vernal pool fairy shrimp T
27 2099 Mine Dredge 17 Lepidurus packardi Vernal pool tadpole shrimp E
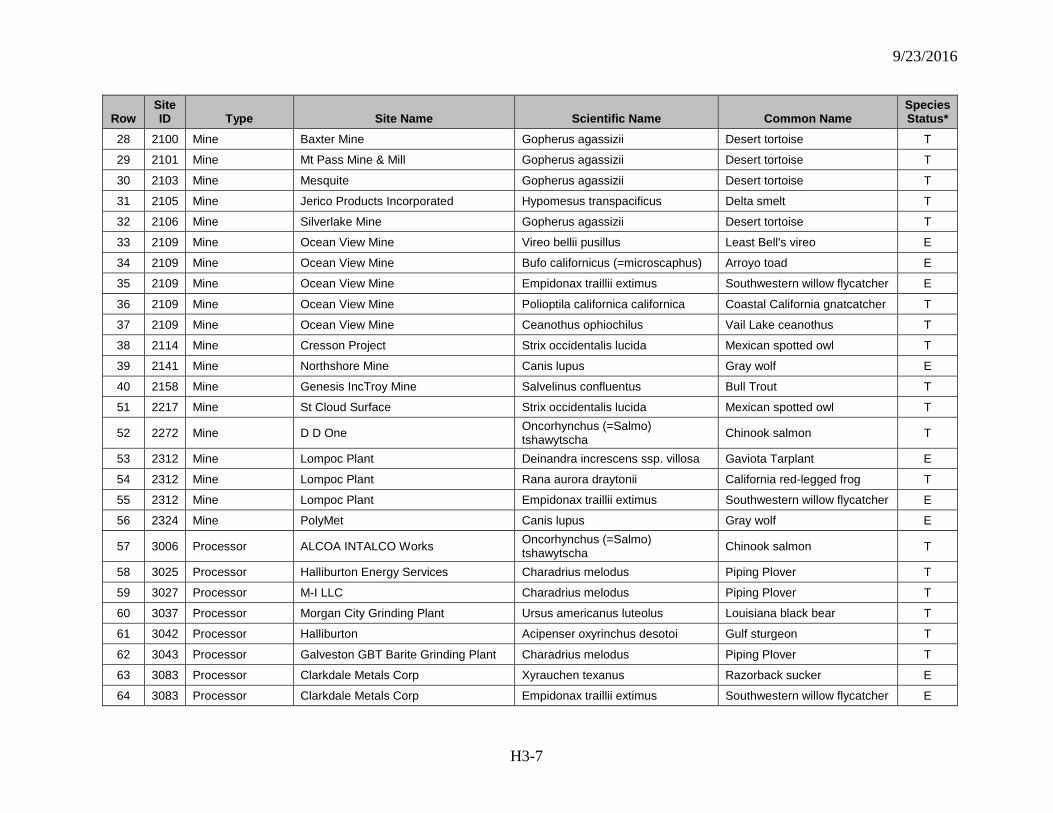
9/23/2016
H3-7
Row Site ID Type Site Name Scientific Name Common Name
Species Status*
28 2100 Mine Baxter Mine Gopherus agassizii Desert tortoise T
29 2101 Mine Mt Pass Mine & Mill Gopherus agassizii Desert tortoise T
30 2103 Mine Mesquite Gopherus agassizii Desert tortoise T
31 2105 Mine Jerico Products Incorporated Hypomesus transpacificus Delta smelt T
32 2106 Mine Silverlake Mine Gopherus agassizii Desert tortoise T
33 2109 Mine Ocean View Mine Vireo bellii pusillus Least Bell's vireo E
34 2109 Mine Ocean View Mine Bufo californicus (=microscaphus) Arroyo toad E
35 2109 Mine Ocean View Mine Empidonax traillii extimus Southwestern willow flycatcher E
36 2109 Mine Ocean View Mine Polioptila californica californica Coastal California gnatcatcher T
37 2109 Mine Ocean View Mine Ceanothus ophiochilus Vail Lake ceanothus T
38 2114 Mine Cresson Project Strix occidentalis lucida Mexican spotted owl T
39 2141 Mine Northshore Mine Canis lupus Gray wolf E
40 2158 Mine Genesis IncTroy Mine Salvelinus confluentus Bull Trout T
51 2217 Mine St Cloud Surface Strix occidentalis lucida Mexican spotted owl T
52 2272 Mine D D One Oncorhynchus (=Salmo) tshawytscha Chinook salmon T
53 2312 Mine Lompoc Plant Deinandra increscens ssp. villosa Gaviota Tarplant E
54 2312 Mine Lompoc Plant Rana aurora draytonii California red-legged frog T
55 2312 Mine Lompoc Plant Empidonax traillii extimus Southwestern willow flycatcher E
56 2324 Mine PolyMet Canis lupus Gray wolf E
57 3006 Processor ALCOA INTALCO Works Oncorhynchus (=Salmo) tshawytscha Chinook salmon T
58 3025 Processor Halliburton Energy Services Charadrius melodus Piping Plover T
59 3027 Processor M-I LLC Charadrius melodus Piping Plover T
60 3037 Processor Morgan City Grinding Plant Ursus americanus luteolus Louisiana black bear T
61 3042 Processor Halliburton Acipenser oxyrinchus desotoi Gulf sturgeon T
62 3043 Processor Galveston GBT Barite Grinding Plant Charadrius melodus Piping Plover T
63 3083 Processor Clarkdale Metals Corp Xyrauchen texanus Razorback sucker E
64 3083 Processor Clarkdale Metals Corp Empidonax traillii extimus Southwestern willow flycatcher E
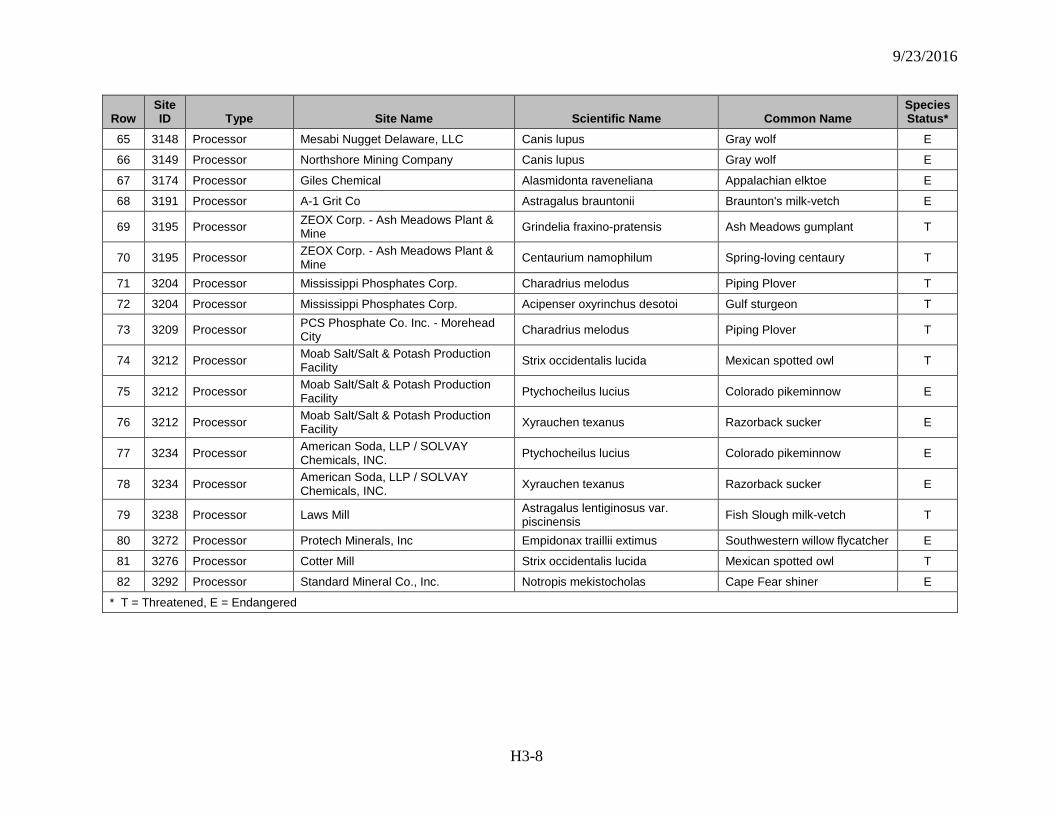
9/23/2016
H3-8
Row Site ID Type Site Name Scientific Name Common Name
Species Status*
65 3148 Processor Mesabi Nugget Delaware, LLC Canis lupus Gray wolf E
66 3149 Processor Northshore Mining Company Canis lupus Gray wolf E
67 3174 Processor Giles Chemical Alasmidonta raveneliana Appalachian elktoe E
68 3191 Processor A-1 Grit Co Astragalus brauntonii Braunton's milk-vetch E
69 3195 Processor ZEOX Corp. - Ash Meadows Plant & Mine Grindelia fraxino-pratensis Ash Meadows gumplant T
70 3195 Processor ZEOX Corp. - Ash Meadows Plant & Mine Centaurium namophilum Spring-loving centaury T
71 3204 Processor Mississippi Phosphates Corp. Charadrius melodus Piping Plover T
72 3204 Processor Mississippi Phosphates Corp. Acipenser oxyrinchus desotoi Gulf sturgeon T
73 3209 Processor PCS Phosphate Co. Inc. - Morehead City Charadrius melodus Piping Plover T
74 3212 Processor Moab Salt/Salt & Potash Production Facility Strix occidentalis lucida Mexican spotted owl T
75 3212 Processor Moab Salt/Salt & Potash Production Facility Ptychocheilus lucius Colorado pikeminnow E
76 3212 Processor Moab Salt/Salt & Potash Production Facility Xyrauchen texanus Razorback sucker E
77 3234 Processor American Soda, LLP / SOLVAY Chemicals, INC. Ptychocheilus lucius Colorado pikeminnow E
78 3234 Processor American Soda, LLP / SOLVAY Chemicals, INC. Xyrauchen texanus Razorback sucker E
79 3238 Processor Laws Mill Astragalus lentiginosus var. piscinensis Fish Slough milk-vetch T
80 3272 Processor Protech Minerals, Inc Empidonax traillii extimus Southwestern willow flycatcher E
81 3276 Processor Cotter Mill Strix occidentalis lucida Mexican spotted owl T
82 3292 Processor Standard Mineral Co., Inc. Notropis mekistocholas Cape Fear shiner E
* T = Threatened, E = Endangered
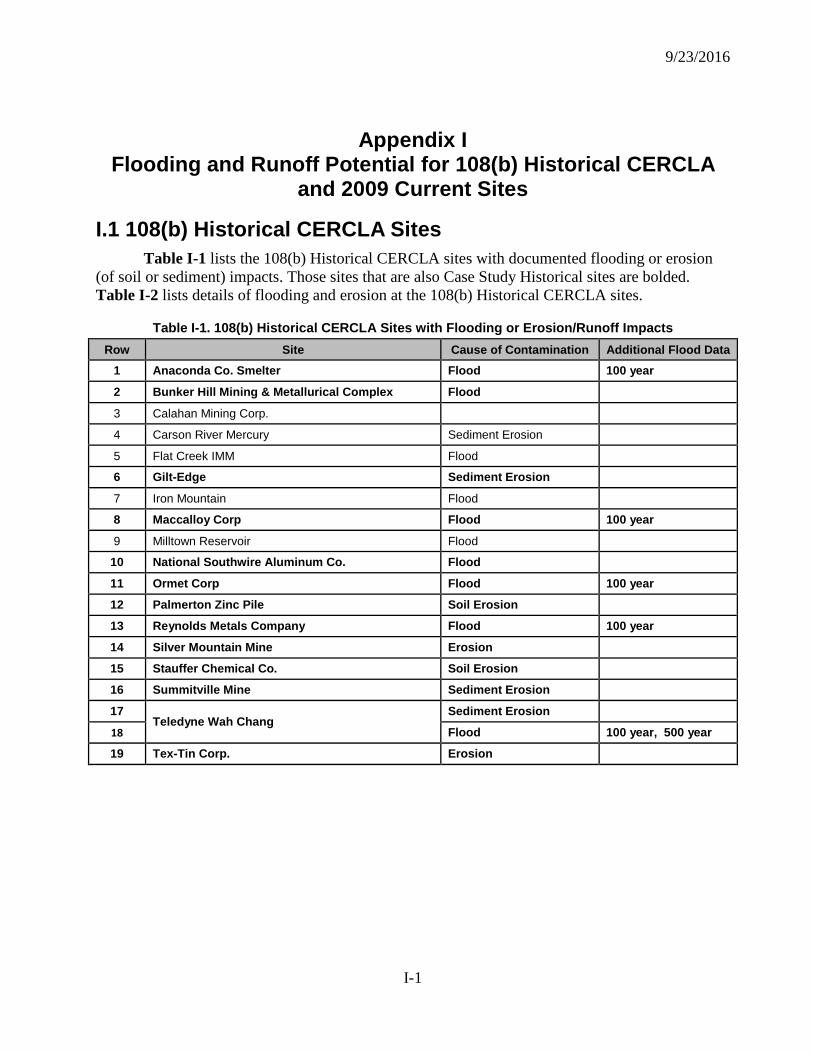
9/23/2016
I-1
Appendix I Flooding and Runoff Potential for 108(b) Historical CERCLA
and 2009 Current Sites
I.1 108(b) Historical CERCLA Sites Table I-1 lists the 108(b) Historical CERCLA sites with documented flooding or erosion
(of soil or sediment) impacts. Those sites that are also Case Study Historical sites are bolded. Table I-2 lists details of flooding and erosion at the 108(b) Historical CERCLA sites.
Table I-1. 108(b) Historical CERCLA Sites with Flooding or Erosion/Runoff Impacts Row Site Cause of Contamination Additional Flood Data
1 Anaconda Co. Smelter Flood 100 year
2 Bunker Hill Mining & Metallurical Complex Flood
3 Calahan Mining Corp.
4 Carson River Mercury Sediment Erosion
5 Flat Creek IMM Flood
6 Gilt-Edge Sediment Erosion
7 Iron Mountain Flood
8 Maccalloy Corp Flood 100 year
9 Milltown Reservoir Flood
10 National Southwire Aluminum Co. Flood
11 Ormet Corp Flood 100 year
12 Palmerton Zinc Pile Soil Erosion
13 Reynolds Metals Company Flood 100 year
14 Silver Mountain Mine Erosion
15 Stauffer Chemical Co. Soil Erosion
16 Summitville Mine Sediment Erosion
17 Teledyne Wah Chang
Sediment Erosion
18 Flood 100 year, 500 year
19 Tex-Tin Corp. Erosion
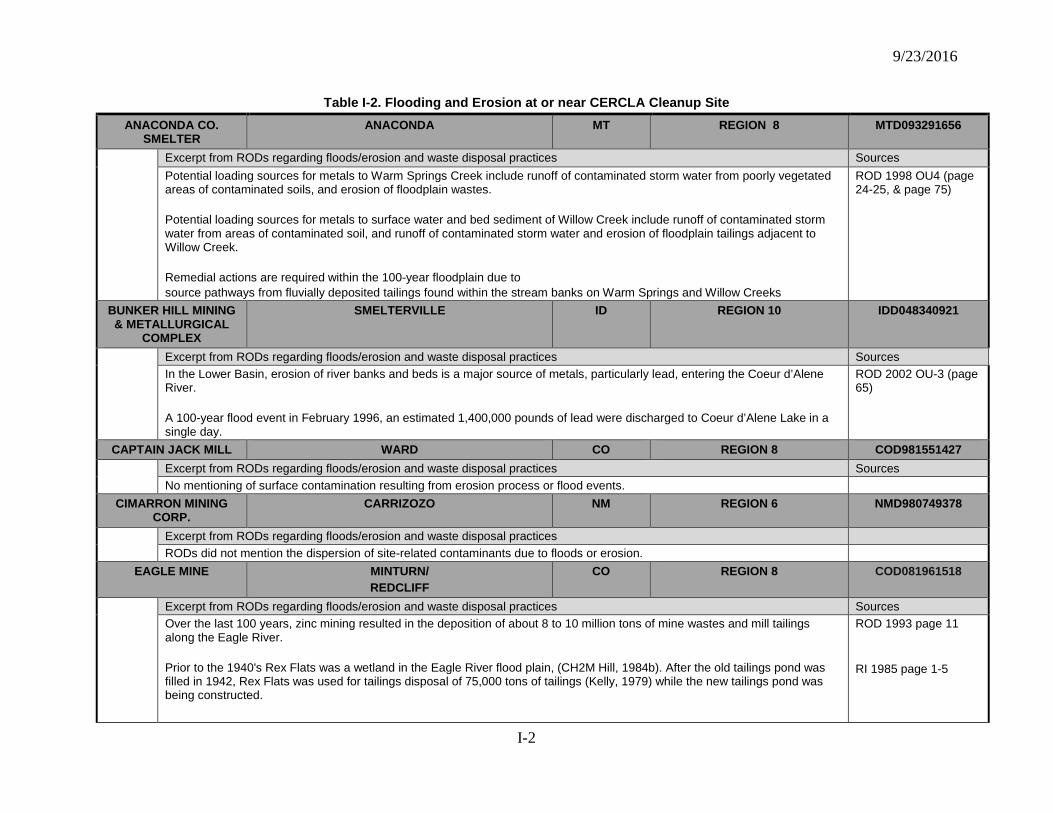
9/23/2016
I-2
Table I-2. Flooding and Erosion at or near CERCLA Cleanup Site ANACONDA CO.
SMELTER ANACONDA MT REGION 8 MTD093291656
Excerpt from RODs regarding floods/erosion and waste disposal practices Sources Potential loading sources for metals to Warm Springs Creek include runoff of contaminated storm water from poorly vegetated areas of contaminated soils, and erosion of floodplain wastes. Potential loading sources for metals to surface water and bed sediment of Willow Creek include runoff of contaminated storm water from areas of contaminated soil, and runoff of contaminated storm water and erosion of floodplain tailings adjacent to Willow Creek. Remedial actions are required within the 100-year floodplain due to source pathways from fluvially deposited tailings found within the stream banks on Warm Springs and Willow Creeks
ROD 1998 OU4 (page 24-25, & page 75)
BUNKER HILL MINING & METALLURGICAL
COMPLEX
SMELTERVILLE
ID REGION 10 IDD048340921
Excerpt from RODs regarding floods/erosion and waste disposal practices Sources In the Lower Basin, erosion of river banks and beds is a major source of metals, particularly lead, entering the Coeur d’Alene River. A 100-year flood event in February 1996, an estimated 1,400,000 pounds of lead were discharged to Coeur d’Alene Lake in a single day.
ROD 2002 OU-3 (page 65)
CAPTAIN JACK MILL WARD CO REGION 8 COD981551427
Excerpt from RODs regarding floods/erosion and waste disposal practices Sources No mentioning of surface contamination resulting from erosion process or flood events.
CIMARRON MINING CORP.
CARRIZOZO NM REGION 6 NMD980749378
Excerpt from RODs regarding floods/erosion and waste disposal practices RODs did not mention the dispersion of site-related contaminants due to floods or erosion.
EAGLE MINE MINTURN/ REDCLIFF
CO REGION 8 COD081961518
Excerpt from RODs regarding floods/erosion and waste disposal practices Sources Over the last 100 years, zinc mining resulted in the deposition of about 8 to 10 million tons of mine wastes and mill tailings along the Eagle River. Prior to the 1940's Rex Flats was a wetland in the Eagle River flood plain, (CH2M Hill, 1984b). After the old tailings pond was filled in 1942, Rex Flats was used for tailings disposal of 75,000 tons of tailings (Kelly, 1979) while the new tailings pond was being constructed.
ROD 1993 page 11 RI 1985 page 1-5
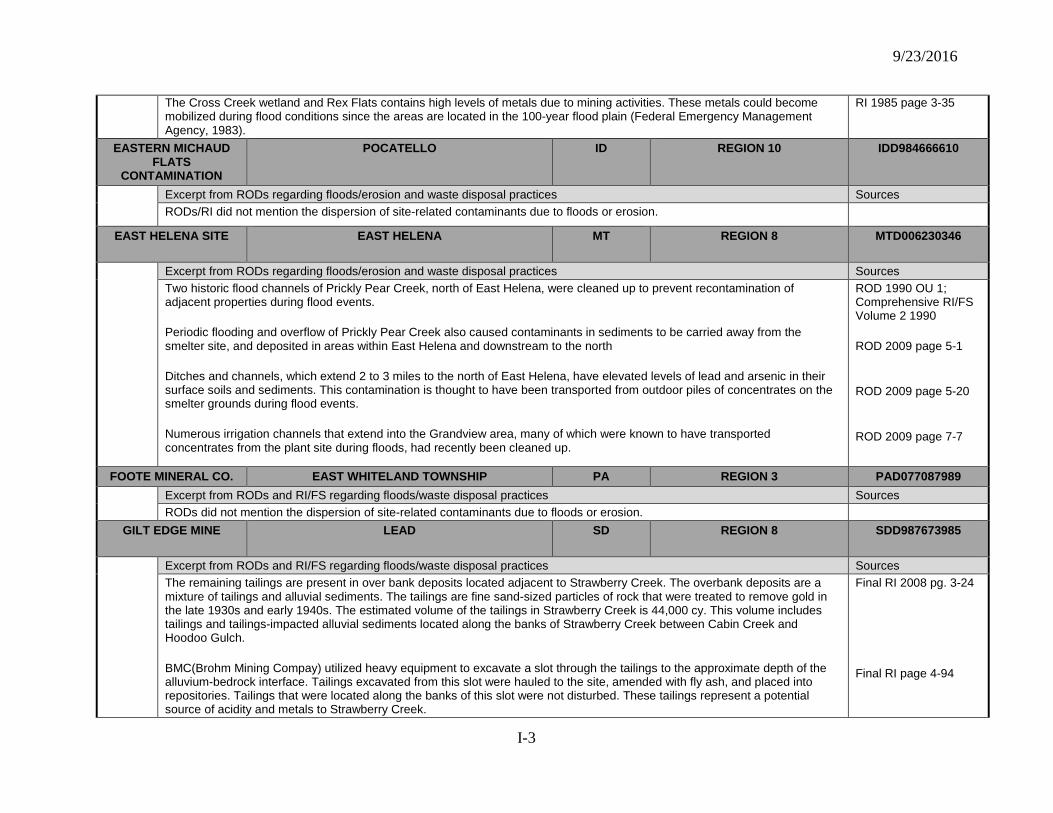
9/23/2016
I-3
The Cross Creek wetland and Rex Flats contains high levels of metals due to mining activities. These metals could become mobilized during flood conditions since the areas are located in the 100-year flood plain (Federal Emergency Management Agency, 1983).
RI 1985 page 3-35
EASTERN MICHAUD FLATS
CONTAMINATION
POCATELLO ID REGION 10 IDD984666610
Excerpt from RODs regarding floods/erosion and waste disposal practices Sources RODs/RI did not mention the dispersion of site-related contaminants due to floods or erosion.
EAST HELENA SITE
EAST HELENA MT REGION 8 MTD006230346
Excerpt from RODs regarding floods/erosion and waste disposal practices Sources Two historic flood channels of Prickly Pear Creek, north of East Helena, were cleaned up to prevent recontamination of adjacent properties during flood events. Periodic flooding and overflow of Prickly Pear Creek also caused contaminants in sediments to be carried away from the smelter site, and deposited in areas within East Helena and downstream to the north Ditches and channels, which extend 2 to 3 miles to the north of East Helena, have elevated levels of lead and arsenic in their surface soils and sediments. This contamination is thought to have been transported from outdoor piles of concentrates on the smelter grounds during flood events. Numerous irrigation channels that extend into the Grandview area, many of which were known to have transported concentrates from the plant site during floods, had recently been cleaned up.
ROD 1990 OU 1; Comprehensive RI/FS Volume 2 1990 ROD 2009 page 5-1 ROD 2009 page 5-20 ROD 2009 page 7-7
FOOTE MINERAL CO. EAST WHITELAND TOWNSHIP PA REGION 3 PAD077087989 Excerpt from RODs and RI/FS regarding floods/waste disposal practices Sources
RODs did not mention the dispersion of site-related contaminants due to floods or erosion. GILT EDGE MINE
LEAD SD REGION 8 SDD987673985
Excerpt from RODs and RI/FS regarding floods/waste disposal practices Sources The remaining tailings are present in over bank deposits located adjacent to Strawberry Creek. The overbank deposits are a mixture of tailings and alluvial sediments. The tailings are fine sand-sized particles of rock that were treated to remove gold in the late 1930s and early 1940s. The estimated volume of the tailings in Strawberry Creek is 44,000 cy. This volume includes tailings and tailings-impacted alluvial sediments located along the banks of Strawberry Creek between Cabin Creek and Hoodoo Gulch. BMC(Brohm Mining Compay) utilized heavy equipment to excavate a slot through the tailings to the approximate depth of the alluvium-bedrock interface. Tailings excavated from this slot were hauled to the site, amended with fly ash, and placed into repositories. Tailings that were located along the banks of this slot were not disturbed. These tailings represent a potential source of acidity and metals to Strawberry Creek.
Final RI 2008 pg. 3-24 Final RI page 4-94
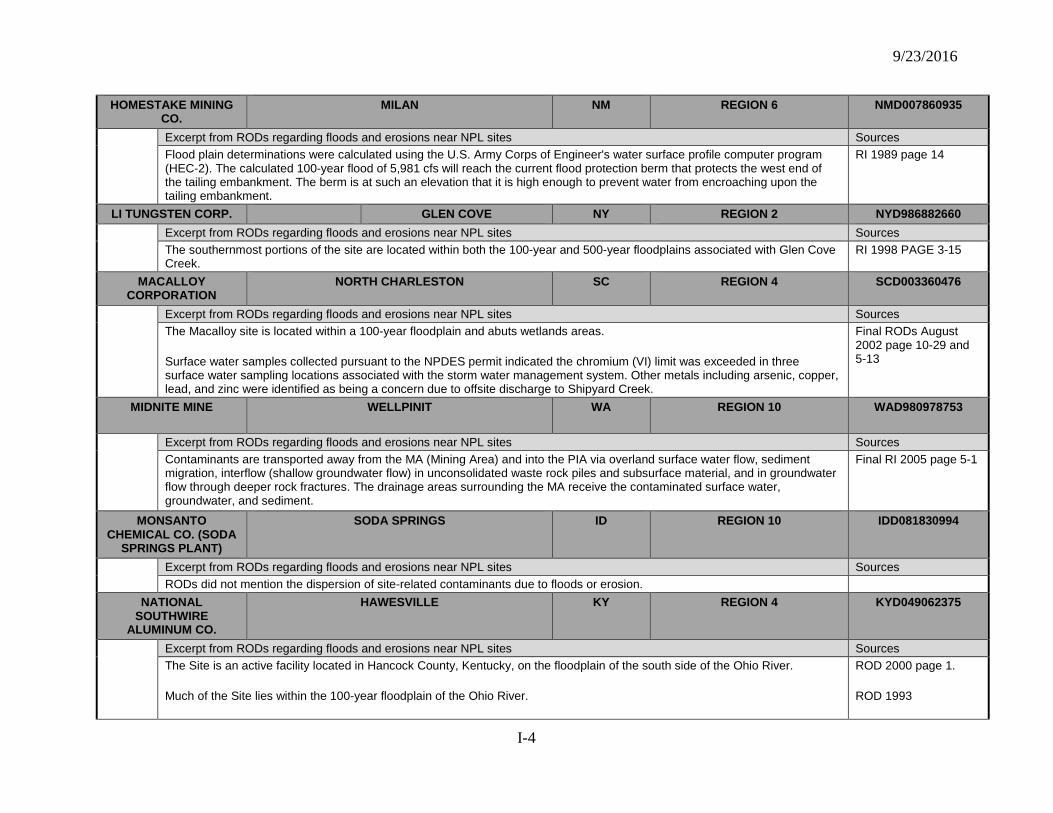
9/23/2016
I-4
HOMESTAKE MINING CO.
MILAN NM REGION 6 NMD007860935
Excerpt from RODs regarding floods and erosions near NPL sites Sources Flood plain determinations were calculated using the U.S. Army Corps of Engineer's water surface profile computer program (HEC-2). The calculated 100-year flood of 5,981 cfs will reach the current flood protection berm that protects the west end of the tailing embankment. The berm is at such an elevation that it is high enough to prevent water from encroaching upon the tailing embankment.
RI 1989 page 14
LI TUNGSTEN CORP. GLEN COVE NY REGION 2 NYD986882660 Excerpt from RODs regarding floods and erosions near NPL sites Sources
The southernmost portions of the site are located within both the 100-year and 500-year floodplains associated with Glen Cove Creek.
RI 1998 PAGE 3-15
MACALLOY CORPORATION
NORTH CHARLESTON SC REGION 4 SCD003360476
Excerpt from RODs regarding floods and erosions near NPL sites Sources The Macalloy site is located within a 100-year floodplain and abuts wetlands areas. Surface water samples collected pursuant to the NPDES permit indicated the chromium (VI) limit was exceeded in three surface water sampling locations associated with the storm water management system. Other metals including arsenic, copper, lead, and zinc were identified as being a concern due to offsite discharge to Shipyard Creek.
Final RODs August 2002 page 10-29 and 5-13
MIDNITE MINE
WELLPINIT WA REGION 10 WAD980978753
Excerpt from RODs regarding floods and erosions near NPL sites Sources Contaminants are transported away from the MA (Mining Area) and into the PIA via overland surface water flow, sediment migration, interflow (shallow groundwater flow) in unconsolidated waste rock piles and subsurface material, and in groundwater flow through deeper rock fractures. The drainage areas surrounding the MA receive the contaminated surface water, groundwater, and sediment.
Final RI 2005 page 5-1
MONSANTO CHEMICAL CO. (SODA
SPRINGS PLANT)
SODA SPRINGS ID REGION 10 IDD081830994
Excerpt from RODs regarding floods and erosions near NPL sites Sources RODs did not mention the dispersion of site-related contaminants due to floods or erosion.
NATIONAL SOUTHWIRE
ALUMINUM CO.
HAWESVILLE KY REGION 4 KYD049062375
Excerpt from RODs regarding floods and erosions near NPL sites Sources The Site is an active facility located in Hancock County, Kentucky, on the floodplain of the south side of the Ohio River. Much of the Site lies within the 100-year floodplain of the Ohio River.
ROD 2000 page 1. ROD 1993
9/23/2016
I-5
Flooding up to the predicted level of the 100 year flood, would affect low-lying areas of the site, particularly the Refractory Brick Disposal Area. However, the ground surface elevations of waste disposal units are generally above flood level. An exception to this is the eastern portions of Taylors Wash, outside of the clay barrier, which would be exposed to fast moving waters in the floodway.
RI 1994 – page 6-4
OMAHA LEAD OMAHA NE REGION 7 NESFN0703481 Excerpt from RODs regarding floods and erosions near NPL sites Sources
The Omaha Lead Site is located outside the 500-year flood plain of the Missouri River Modification of residential yards resulting from filling, grading, or other activities can either cover or dilute surface lead contamination. Erosion of surface soils during rain events can relocate lead-contaminated soils. Flood events can cover surface contamination with silt or transport contaminated material downstream. It is likely that a combination of factors has resulted in the observed distribution of contamination at the site. Historic events such as flooding or earth working could have covered or transported contaminants at the Site.
RI 2009 PAGE 3-1 ROD 2004 OU-1 page 9 and page 38
ORMET CORP. HANNIBAL
OH REGION 5 OHD004379970
Excerpt from RODs regarding floods and erosions near NPL sites Sources The Ormet Site is located in an area known as Buck Hill Bottom, a portion of the Ohio River Floodplain that formed as river sediments were deposited on the inside of a meander bend. From about 1966 until mid-1979, Ormet deposited waste construction materials and other miscellaneous plant debris, including capacitors and spent potliner, in the southeastern corner of the Site, adjacent to Pond 5 and the Ohio River. This 4 to 5 acre area is designated as the Construction Material Scrap Dump (CMSD). The CMSD shall be re-contoured to remove as much wasteas possible from below the 100-year flood level. Although RCRASubtitle C does not require a dual-barrier cap a priori, a dualbarrier cap shall be installed over the CMSD to ensure maximum protection from the effects of inundation in the event of a 100-year flood. Because a portion of the CMSD is located within a 100-year floodplain, design and construction of the final cover pursuant to OAC 3745-57-10 must include measures sufficient to meet the above requirements, and prevent transport of hazardous materials away from the landfill, during a 100-year flood.
ROD 1994 OU-01
PALMERTON ZINC PILE
PALMERTON PA REGION 3 PAD002395887
Excerpt from RODs regarding floods and erosions near NPL sites Sources The Palmerton Zinc Site is located within a floodplain and contains several wetland area. Water flowing across the defoliated portions of blue mountain has eroded the surface and become contaminated with metals contained in the soil. The runoff and erosion has carried the metal laden soil into Aquashicola creek.
ROD 0U2 1988-page 5 ROD OU1 1987 PAGE 3
REYNOLDS METALS COMPANY
TROUTDALE OR REGION 10 ORD009412677
Excerpt from RODs regarding floods and erosions near NPL sites Sources
9/23/2016
I-6
The area Outside the Dike refers to the portion of the RMC site that is to the north and east outside of the US Army Corps of Engineers dike. This area is within the flood plain of the Columbia River, and includes Company Lake, East Lake and the western portion of the north landfill. The areas north and east of the COE dike are within the 100 year floodplain of the Columbia and Sandy Rivers North landfill is located in a wooded area north of the U.S. Army Corps of Engineers dike... Most of the landfill lies within the 10-year floodplain of the Columbia River. For north landfill and Company Lake there would be a greater likelihood of washout of contaminants during severe flooding events The Preferred Alternative adds another measure of long-term protectiveness by removing additional north landfill waste material from the floodplain of the Columbia and Sandy Rivers.
ROD 2006 page 2 RI 2006 page 2-1 Interim ROD Remedial action 2002 page 18 Interim ROD Remedial action 2002 page 18
SILVER MOUNTAIN MINE
LOOMIS WA REGION 10 WAD980722789
Excerpt from RODs regarding floods and erosions near NPL sites Sources Prevention of erosion mentioned during a discussion of remedial action required the placement of contaminated material in one designated location.
STAUFFER CHEMICAL CO. (TARPON
SPRINGS)
TARPON SPRINGS
FL
REGION 4 FLD010596013
Excerpt from RODs regarding floods and erosions near NPL sites Sources Potential Migration Pathway---Once in the surface soils, these constituents are mobilized by several primary release mechanisms including rainwater infiltration and percolation, surface water runoff and erosion, as well as the tidal action from the Anclote River.
Final RI 1993 page 6-3
SUMMITVILLE MINE RIO GRANDE COUNTY CO REGION 8 COD983778432 Excerpt from RODs/RI regarding floods and erosions near NPL sites Sources
RODs/RI did not mention the dispersion of site-related contaminants due to floods or erosion. TELEDYNE WAH
CHANG ALBANY OR REGION 10 ORD050955848
Excerpt from RODs regarding floods and erosions near NPL sites Sources Portions of the TWCA site, including the sludge ponds, are in the 100-year and 500-year flood plains of the Willamette River. The ground surface in the vicinity of TWCA slopes westward towards the river with agradient of approximately 11 feet per mile. (sludge is within floodplain) The LRSP and Schmidt Lake are unlined impoundments constructed on native soils in the Willamette River flood plain; thus, flooding is one potential cause of contaminant migration. Because the ponds are unlined, they could also be a source of groundwater contamination.
ROD 1989 Page 1 ROD 1989 Page 13
9/23/2016
I-7
According to an investigation by a THCA contractor (Dames and Moore) in1981, the existing LRSP dikes would be unstable during a major flood. Therefore, this alternative incorporates measures for stabilizing the dikes. This work would be accomplished by conventional earth-moving and compacting equipment… Dike stabilization will reduce the risk of contaminant dispersal by flooding.
ROD 1989 Page 21-22
TEX-TIN CORP. TEXAS CITY TX REGION 6 TXD062113329 Excerpt from RODs regarding floods and erosions near NPL sites Sources
Past incidents of flood or the presence of waste materials in a floodplain were not mentioned in the ROD documents.
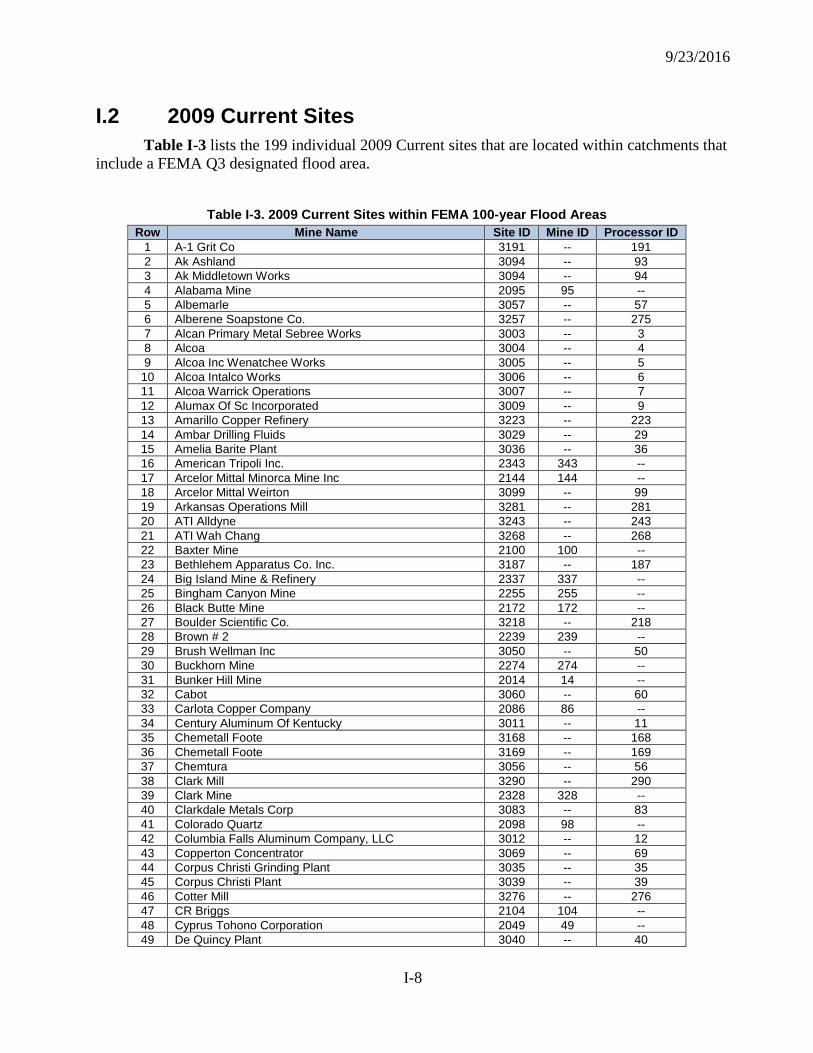
9/23/2016
I-8
I.2 2009 Current Sites Table I-3 lists the 199 individual 2009 Current sites that are located within catchments that
include a FEMA Q3 designated flood area.
Table I-3. 2009 Current Sites within FEMA 100-year Flood Areas
Row Mine Name Site ID Mine ID Processor ID 1 A-1 Grit Co 3191 -- 191 2 Ak Ashland 3094 -- 93 3 Ak Middletown Works 3094 -- 94 4 Alabama Mine 2095 95 -- 5 Albemarle 3057 -- 57 6 Alberene Soapstone Co. 3257 -- 275 7 Alcan Primary Metal Sebree Works 3003 -- 3 8 Alcoa 3004 -- 4 9 Alcoa Inc Wenatchee Works 3005 -- 5
10 Alcoa Intalco Works 3006 -- 6 11 Alcoa Warrick Operations 3007 -- 7 12 Alumax Of Sc Incorporated 3009 -- 9 13 Amarillo Copper Refinery 3223 -- 223 14 Ambar Drilling Fluids 3029 -- 29 15 Amelia Barite Plant 3036 -- 36 16 American Tripoli Inc. 2343 343 -- 17 Arcelor Mittal Minorca Mine Inc 2144 144 -- 18 Arcelor Mittal Weirton 3099 -- 99 19 Arkansas Operations Mill 3281 -- 281 20 ATI Alldyne 3243 -- 243 21 ATI Wah Chang 3268 -- 268 22 Baxter Mine 2100 100 -- 23 Bethlehem Apparatus Co. Inc. 3187 -- 187 24 Big Island Mine & Refinery 2337 337 -- 25 Bingham Canyon Mine 2255 255 -- 26 Black Butte Mine 2172 172 -- 27 Boulder Scientific Co. 3218 -- 218 28 Brown # 2 2239 239 -- 29 Brush Wellman Inc 3050 -- 50 30 Buckhorn Mine 2274 274 -- 31 Bunker Hill Mine 2014 14 -- 32 Cabot 3060 -- 60 33 Carlota Copper Company 2086 86 -- 34 Century Aluminum Of Kentucky 3011 -- 11 35 Chemetall Foote 3168 -- 168 36 Chemetall Foote 3169 -- 169 37 Chemtura 3056 -- 56 38 Clark Mill 3290 -- 290 39 Clark Mine 2328 328 -- 40 Clarkdale Metals Corp 3083 -- 83 41 Colorado Quartz 2098 98 -- 42 Columbia Falls Aluminum Company, LLC 3012 -- 12 43 Copperton Concentrator 3069 -- 69 44 Corpus Christi Grinding Plant 3035 -- 35 45 Corpus Christi Plant 3039 -- 39 46 Cotter Mill 3276 -- 276 47 CR Briggs 2104 104 -- 48 Cyprus Tohono Corporation 2049 49 -- 49 De Quincy Plant 3040 -- 40
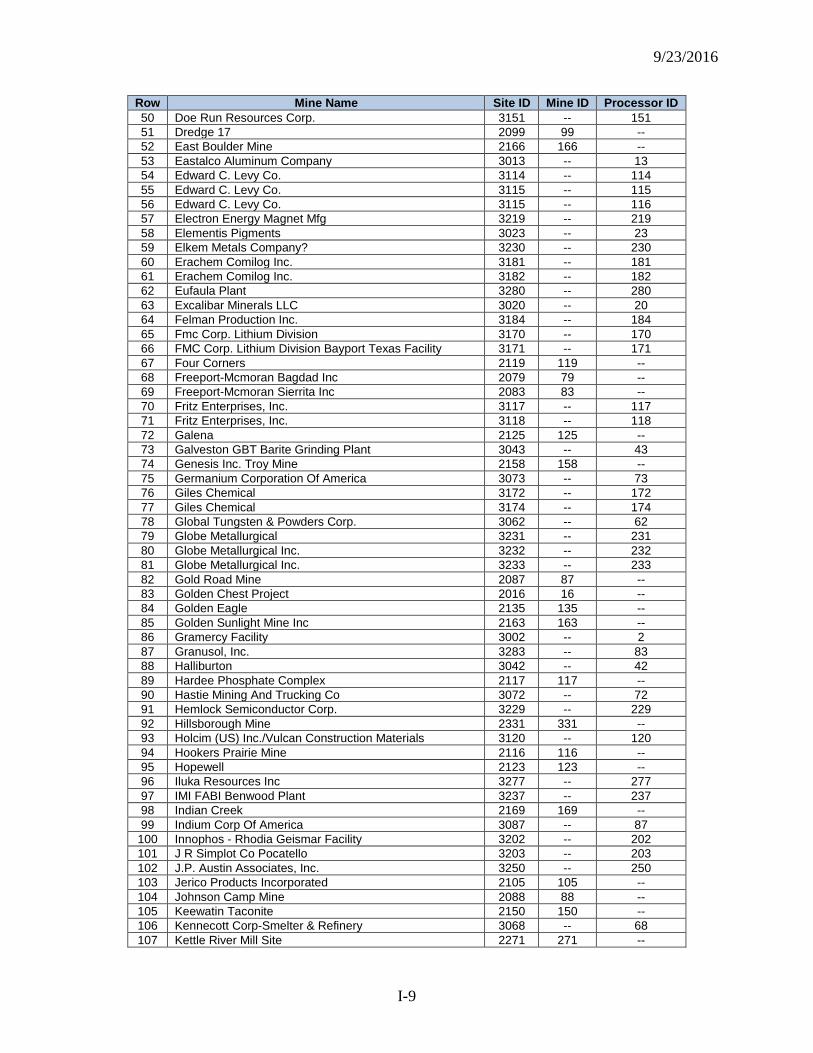
9/23/2016
I-9
Row Mine Name Site ID Mine ID Processor ID 50 Doe Run Resources Corp. 3151 -- 151 51 Dredge 17 2099 99 -- 52 East Boulder Mine 2166 166 -- 53 Eastalco Aluminum Company 3013 -- 13 54 Edward C. Levy Co. 3114 -- 114 55 Edward C. Levy Co. 3115 -- 115 56 Edward C. Levy Co. 3115 -- 116 57 Electron Energy Magnet Mfg 3219 -- 219 58 Elementis Pigments 3023 -- 23 59 Elkem Metals Company? 3230 -- 230 60 Erachem Comilog Inc. 3181 -- 181 61 Erachem Comilog Inc. 3182 -- 182 62 Eufaula Plant 3280 -- 280 63 Excalibar Minerals LLC 3020 -- 20 64 Felman Production Inc. 3184 -- 184 65 Fmc Corp. Lithium Division 3170 -- 170 66 FMC Corp. Lithium Division Bayport Texas Facility 3171 -- 171 67 Four Corners 2119 119 -- 68 Freeport-Mcmoran Bagdad Inc 2079 79 -- 69 Freeport-Mcmoran Sierrita Inc 2083 83 -- 70 Fritz Enterprises, Inc. 3117 -- 117 71 Fritz Enterprises, Inc. 3118 -- 118 72 Galena 2125 125 -- 73 Galveston GBT Barite Grinding Plant 3043 -- 43 74 Genesis Inc. Troy Mine 2158 158 -- 75 Germanium Corporation Of America 3073 -- 73 76 Giles Chemical 3172 -- 172 77 Giles Chemical 3174 -- 174 78 Global Tungsten & Powders Corp. 3062 -- 62 79 Globe Metallurgical 3231 -- 231 80 Globe Metallurgical Inc. 3232 -- 232 81 Globe Metallurgical Inc. 3233 -- 233 82 Gold Road Mine 2087 87 -- 83 Golden Chest Project 2016 16 -- 84 Golden Eagle 2135 135 -- 85 Golden Sunlight Mine Inc 2163 163 -- 86 Gramercy Facility 3002 -- 2 87 Granusol, Inc. 3283 -- 83 88 Halliburton 3042 -- 42 89 Hardee Phosphate Complex 2117 117 -- 90 Hastie Mining And Trucking Co 3072 -- 72 91 Hemlock Semiconductor Corp. 3229 -- 229 92 Hillsborough Mine 2331 331 -- 93 Holcim (US) Inc./Vulcan Construction Materials 3120 -- 120 94 Hookers Prairie Mine 2116 116 -- 95 Hopewell 2123 123 -- 96 Iluka Resources Inc 3277 -- 277 97 IMI FABI Benwood Plant 3237 -- 237 98 Indian Creek 2169 169 -- 99 Indium Corp Of America 3087 -- 87
100 Innophos - Rhodia Geismar Facility 3202 -- 202 101 J R Simplot Co Pocatello 3203 -- 203 102 J.P. Austin Associates, Inc. 3250 -- 250 103 Jerico Products Incorporated 2105 105 -- 104 Johnson Camp Mine 2088 88 -- 105 Keewatin Taconite 2150 150 -- 106 Kennecott Corp-Smelter & Refinery 3068 -- 68 107 Kettle River Mill Site 2271 271 --
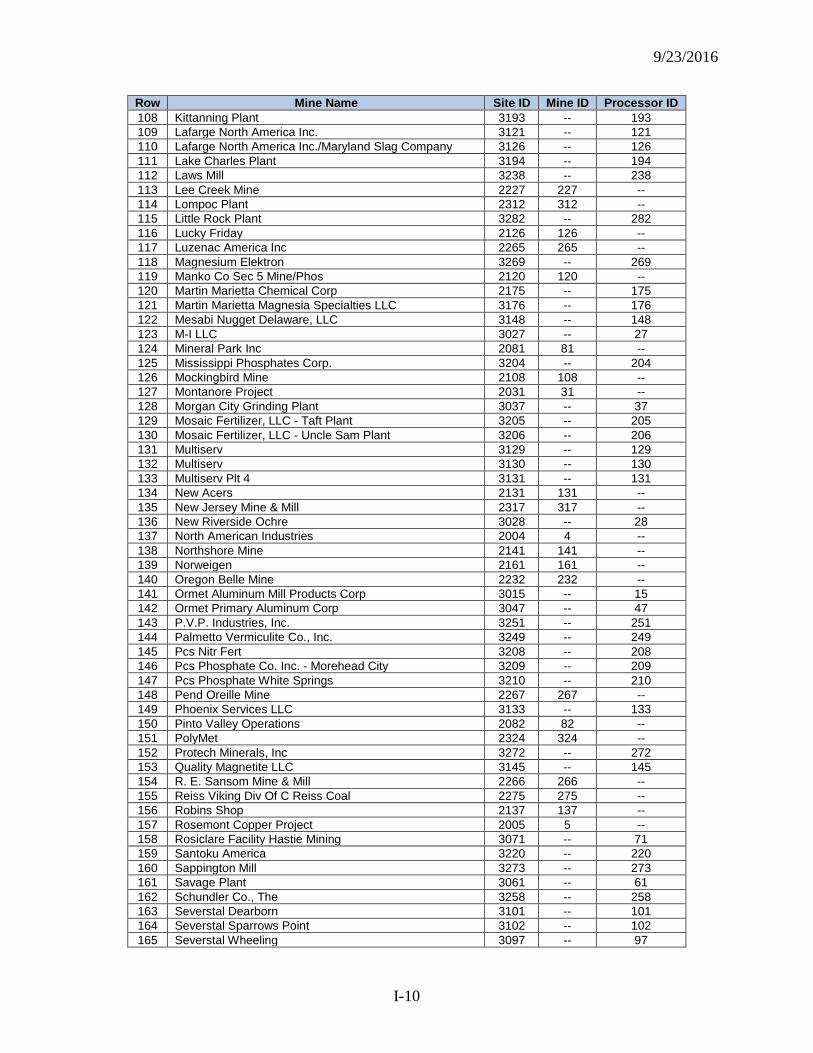
9/23/2016
I-10
Row Mine Name Site ID Mine ID Processor ID 108 Kittanning Plant 3193 -- 193 109 Lafarge North America Inc. 3121 -- 121 110 Lafarge North America Inc./Maryland Slag Company 3126 -- 126 111 Lake Charles Plant 3194 -- 194 112 Laws Mill 3238 -- 238 113 Lee Creek Mine 2227 227 -- 114 Lompoc Plant 2312 312 -- 115 Little Rock Plant 3282 -- 282 116 Lucky Friday 2126 126 -- 117 Luzenac America Inc 2265 265 -- 118 Magnesium Elektron 3269 -- 269 119 Manko Co Sec 5 Mine/Phos 2120 120 -- 120 Martin Marietta Chemical Corp 2175 -- 175 121 Martin Marietta Magnesia Specialties LLC 3176 -- 176 122 Mesabi Nugget Delaware, LLC 3148 -- 148 123 M-I LLC 3027 -- 27 124 Mineral Park Inc 2081 81 -- 125 Mississippi Phosphates Corp. 3204 -- 204 126 Mockingbird Mine 2108 108 -- 127 Montanore Project 2031 31 -- 128 Morgan City Grinding Plant 3037 -- 37 129 Mosaic Fertilizer, LLC - Taft Plant 3205 -- 205 130 Mosaic Fertilizer, LLC - Uncle Sam Plant 3206 -- 206 131 Multiserv 3129 -- 129 132 Multiserv 3130 -- 130 133 Multiserv Plt 4 3131 -- 131 134 New Acers 2131 131 -- 135 New Jersey Mine & Mill 2317 317 -- 136 New Riverside Ochre 3028 -- 28 137 North American Industries 2004 4 -- 138 Northshore Mine 2141 141 -- 139 Norweigen 2161 161 -- 140 Oregon Belle Mine 2232 232 -- 141 Ormet Aluminum Mill Products Corp 3015 -- 15 142 Ormet Primary Aluminum Corp 3047 -- 47 143 P.V.P. Industries, Inc. 3251 -- 251 144 Palmetto Vermiculite Co., Inc. 3249 -- 249 145 Pcs Nitr Fert 3208 -- 208 146 Pcs Phosphate Co. Inc. - Morehead City 3209 -- 209 147 Pcs Phosphate White Springs 3210 -- 210 148 Pend Oreille Mine 2267 267 -- 149 Phoenix Services LLC 3133 -- 133 150 Pinto Valley Operations 2082 82 -- 151 PolyMet 2324 324 -- 152 Protech Minerals, Inc 3272 -- 272 153 Quality Magnetite LLC 3145 -- 145 154 R. E. Sansom Mine & Mill 2266 266 -- 155 Reiss Viking Div Of C Reiss Coal 2275 275 -- 156 Robins Shop 2137 137 -- 157 Rosemont Copper Project 2005 5 -- 158 Rosiclare Facility Hastie Mining 3071 -- 71 159 Santoku America 3220 -- 220 160 Sappington Mill 3273 -- 273 161 Savage Plant 3061 -- 61 162 Schundler Co., The 3258 -- 258 163 Severstal Dearborn 3101 -- 101 164 Severstal Sparrows Point 3102 -- 102 165 Severstal Wheeling 3097 -- 97
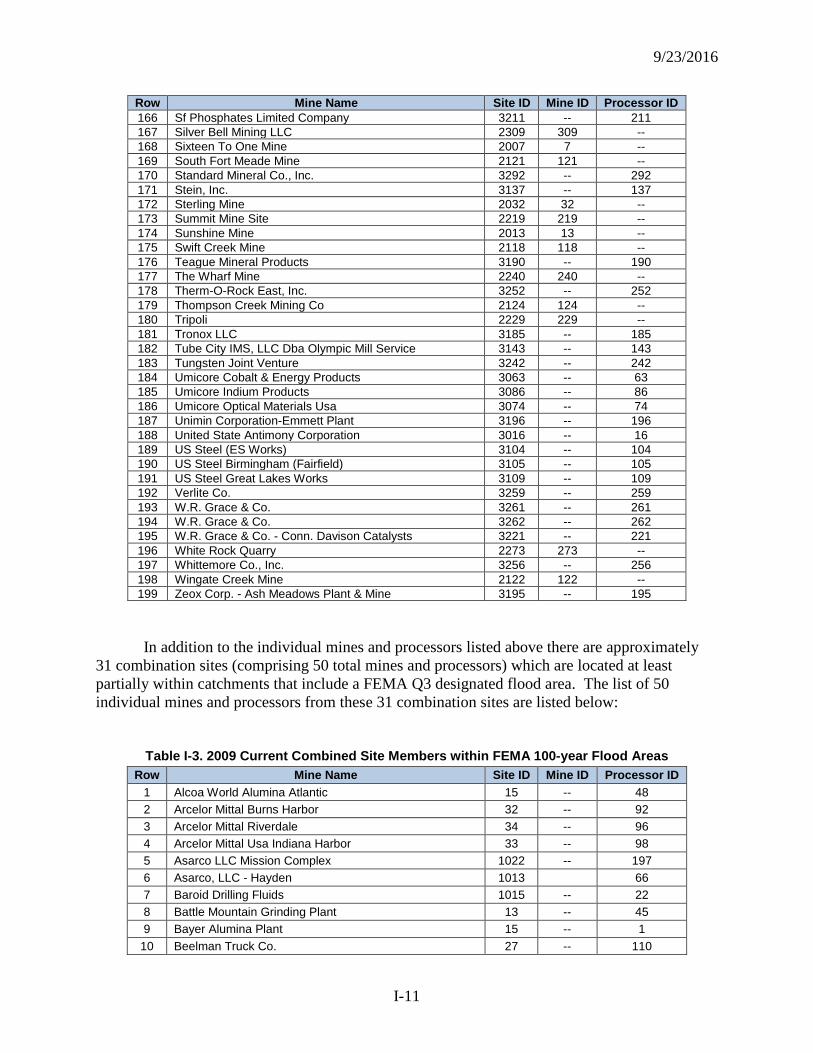
9/23/2016
I-11
Row Mine Name Site ID Mine ID Processor ID 166 Sf Phosphates Limited Company 3211 -- 211 167 Silver Bell Mining LLC 2309 309 -- 168 Sixteen To One Mine 2007 7 -- 169 South Fort Meade Mine 2121 121 -- 170 Standard Mineral Co., Inc. 3292 -- 292 171 Stein, Inc. 3137 -- 137 172 Sterling Mine 2032 32 -- 173 Summit Mine Site 2219 219 -- 174 Sunshine Mine 2013 13 -- 175 Swift Creek Mine 2118 118 -- 176 Teague Mineral Products 3190 -- 190 177 The Wharf Mine 2240 240 -- 178 Therm-O-Rock East, Inc. 3252 -- 252 179 Thompson Creek Mining Co 2124 124 -- 180 Tripoli 2229 229 -- 181 Tronox LLC 3185 -- 185 182 Tube City IMS, LLC Dba Olympic Mill Service 3143 -- 143 183 Tungsten Joint Venture 3242 -- 242 184 Umicore Cobalt & Energy Products 3063 -- 63 185 Umicore Indium Products 3086 -- 86 186 Umicore Optical Materials Usa 3074 -- 74 187 Unimin Corporation-Emmett Plant 3196 -- 196 188 United State Antimony Corporation 3016 -- 16 189 US Steel (ES Works) 3104 -- 104 190 US Steel Birmingham (Fairfield) 3105 -- 105 191 US Steel Great Lakes Works 3109 -- 109 192 Verlite Co. 3259 -- 259 193 W.R. Grace & Co. 3261 -- 261 194 W.R. Grace & Co. 3262 -- 262 195 W.R. Grace & Co. - Conn. Davison Catalysts 3221 -- 221 196 White Rock Quarry 2273 273 -- 197 Whittemore Co., Inc. 3256 -- 256 198 Wingate Creek Mine 2122 122 -- 199 Zeox Corp. - Ash Meadows Plant & Mine 3195 -- 195
In addition to the individual mines and processors listed above there are approximately
31 combination sites (comprising 50 total mines and processors) which are located at least partially within catchments that include a FEMA Q3 designated flood area. The list of 50 individual mines and processors from these 31 combination sites are listed below:
Table I-3. 2009 Current Combined Site Members within FEMA 100-year Flood Areas
Row Mine Name Site ID Mine ID Processor ID 1 Alcoa World Alumina Atlantic 15 -- 48 2 Arcelor Mittal Burns Harbor 32 -- 92 3 Arcelor Mittal Riverdale 34 -- 96 4 Arcelor Mittal Usa Indiana Harbor 33 -- 98 5 Asarco LLC Mission Complex 1022 -- 197 6 Asarco, LLC - Hayden 1013 66 7 Baroid Drilling Fluids 1015 -- 22 8 Battle Mountain Grinding Plant 13 -- 45 9 Bayer Alumina Plant 15 -- 1
10 Beelman Truck Co. 27 -- 110
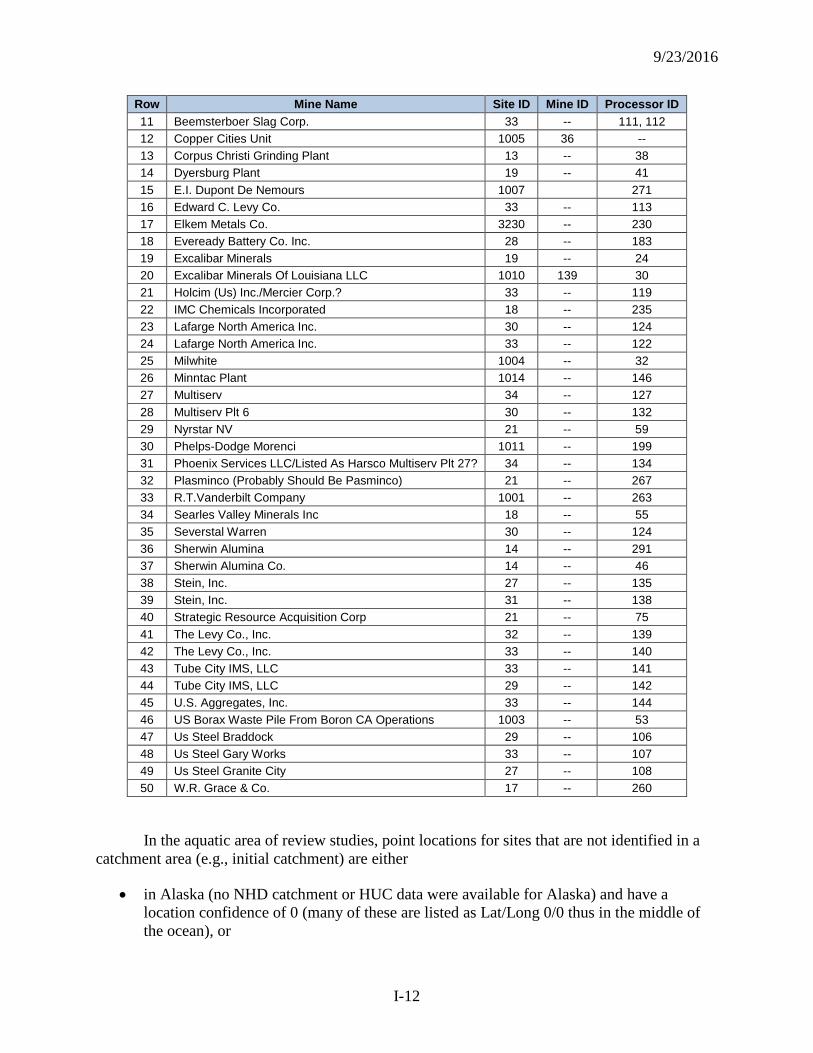
9/23/2016
I-12
Row Mine Name Site ID Mine ID Processor ID 11 Beemsterboer Slag Corp. 33 -- 111, 112 12 Copper Cities Unit 1005 36 -- 13 Corpus Christi Grinding Plant 13 -- 38 14 Dyersburg Plant 19 -- 41 15 E.I. Dupont De Nemours 1007 271 16 Edward C. Levy Co. 33 -- 113 17 Elkem Metals Co. 3230 -- 230 18 Eveready Battery Co. Inc. 28 -- 183 19 Excalibar Minerals 19 -- 24 20 Excalibar Minerals Of Louisiana LLC 1010 139 30 21 Holcim (Us) Inc./Mercier Corp.? 33 -- 119 22 IMC Chemicals Incorporated 18 -- 235 23 Lafarge North America Inc. 30 -- 124 24 Lafarge North America Inc. 33 -- 122 25 Milwhite 1004 -- 32 26 Minntac Plant 1014 -- 146 27 Multiserv 34 -- 127 28 Multiserv Plt 6 30 -- 132 29 Nyrstar NV 21 -- 59 30 Phelps-Dodge Morenci 1011 -- 199 31 Phoenix Services LLC/Listed As Harsco Multiserv Plt 27? 34 -- 134 32 Plasminco (Probably Should Be Pasminco) 21 -- 267 33 R.T.Vanderbilt Company 1001 -- 263 34 Searles Valley Minerals Inc 18 -- 55 35 Severstal Warren 30 -- 124 36 Sherwin Alumina 14 -- 291 37 Sherwin Alumina Co. 14 -- 46 38 Stein, Inc. 27 -- 135 39 Stein, Inc. 31 -- 138 40 Strategic Resource Acquisition Corp 21 -- 75 41 The Levy Co., Inc. 32 -- 139 42 The Levy Co., Inc. 33 -- 140 43 Tube City IMS, LLC 33 -- 141 44 Tube City IMS, LLC 29 -- 142 45 U.S. Aggregates, Inc. 33 -- 144 46 US Borax Waste Pile From Boron CA Operations 1003 -- 53 47 Us Steel Braddock 29 -- 106 48 Us Steel Gary Works 33 -- 107 49 Us Steel Granite City 27 -- 108 50 W.R. Grace & Co. 17 -- 260
In the aquatic area of review studies, point locations for sites that are not identified in a catchment area (e.g., initial catchment) are either
• in Alaska (no NHD catchment or HUC data were available for Alaska) and have a location confidence of 0 (many of these are listed as Lat/Long 0/0 thus in the middle of the ocean), or
9/23/2016
I-13
• are located in a catchment that has no flow direction associated with it.
For catchments that have no flow direction associated with them, the following conditions were assumed: (1) there are no flow lines running in or out of the catchment and it is considered to be a topographic basin or ‘contained’ catchment; (2) in some very arid regions, no water associated with the catchment (e.g., streams, irrigation ditches and any rain water) would leave the catchment area; (3) all drainage in many of these areas is channeled to irrigation, resulting in no downstream flow lines; or (4) the catchments are located along a Coastline and since these flowlines merge with a large waterbody within a short distance there is no associated downstream flow.
9/23/2016
J-1
Appendix J Toxicity of Priority Contaminants of Concern (COCs) This appendix presents the estimated magnitudes of the toxic effects for those COCs for
which toxicity data are available. Human health benchmarks are used to quantify and characterize potential hazards and risks resulting from exposures to chemical substances. Superfund risk assessments use reference doses (RfDs) and reference concentrations (RfCs) to evaluate noncancer risk from oral and inhalation exposures, respectively. Oral cancer slope factors (CSFos) and inhalation unit risk factors (URFs) are used to evaluate risk for carcinogens.
RfDs and RfCs are the primary benchmarks used to evaluate noncarcinogenic hazards posed by environmental exposures to chemical constituents. RfDs and RfCs are estimates (with uncertainty spanning perhaps an order of magnitude) of a daily exposure to the human population (including sensitive subgroups) that is likely to be without appreciable risk of deleterious noncancer effects during a lifetime. However, an average lifetime exposure above the RfD (or RfC) does not imply that an adverse health effect would necessarily occur.
The CSF is an upper bound estimate (approximating a 95 percent confidence limit) of the increased human cancer risk from a lifetime exposure to an agent. This estimate is usually expressed in units of proportion (of a population) affected per milligram of agent per kilogram body weight per day (mg/kg-d). The URF is the preferred cancer benchmark for inhalation exposures, where the air concentrations inhaled are used as the measure of dose. The unit risk is the upper bound lifetime excess cancer risk estimated to result from continuous exposure to an agent at a concentration of 1 μg/m3 in air. That is, if the unit risk = 1.5 × 10⁻⁶ per μg/m3, then 1.5 excess cancer cases would be expected to develop per 1,000,000 people if exposed daily to a concentration of 1 μg of the chemical agent in 1 m3 of air for a lifetime. Unlike RfDs and RfCs, CSFs and URFs do not represent “safe” exposure levels; rather, they relate levels of exposure to a probability of developing cancer.
To identify human health benchmarks, Superfund risk assessments use the hierarchy of sources as described in the Office of Solid Waste and Emergency Response 2003 Directive 9285.7-53. This heirarchy encourages priority to those sources that are most current, those for which the basis is transparent and publicly available, and those that have been peer reviewed. To make best use of the currently available health benchmark data, this report used the following order of preference for sources of human health benchmarks:
• EPA’s Integrated Risk Information System (IRIS) • Superfund Provisional Peer-Reviewed Toxicity Values (PPRTVs) • Agency for Toxic Substances and Disease Registry (ATSDR) Minimal Risk Levels
(MRLs) • California EPA (CalEPA) reference exposure levels (RELs) and cancer potency factors • Various other health benchmark sources (e.g., other State sources) • EPA’s 1997 Health Effects Assessment Summary Tables (HEAST).
The highest priority chronic human health benchmarks available for the Selected COCs are summarized in Table J-1, which provides the constituent name, CASRN, CSFo, inhalation
9/23/2016
J-2
URF, reference for each benchmark, RfD, and RfC. These human health benchmarks represent the highest quality benchmark currently available (2011). However, these values may or may not differ from those used in Superfund risk assessments at NPL sites for two main reasons. Human health benchmarks may be revised over time as new toxicological data become available. Also, the Superfund risk assessor may have used a different source hierarchy (e.g., HEAST instead of ATSDR).
Radionuclide slope factors were obtained from the HEAST—Radionuclides Table (formerly Table 4). EPA, other Federal agencies, States, and contractors who are responsible for identifying, characterizing, and remediating sites contaminated with radioactive materials use radionuclide slope factors in risk assessments to calculate potential risks to the general public. EPA calculates radionuclide slope factors to assist risk assessors with risk-related evaluations and decision making at various stages of the remediation process. Table J-2 presents the ingestion, inhalation, and external exposure cancer slope factors for radionuclide Priority COCs predominantly in units of picocuries (pCi). The cancer slope factors may differ from those used to assess risk at NPL sites because this table has changed over time; it was most recently updated in 2001.
Soil, water, and sediment ecological benchmarks are used to assess risks to ecological receptors. Ecological soil screening levels (Eco-SSLs) for avian, mammalian, plant, and soil invertebrate receptors and acute and chronic freshwater Ambient Water Quality Criteria (AWQC) are presented in Table J-3 for Priority COCs. These ecological benchmarks represent the highest quality benchmark currently available (2011). However, these values may or may not differ from those used to assess ecological hazard at NPL sites because values may have changed since the Superfund risk assessment or the Superfund risk assessor may have used an alternative source.
References ATSDR (Agency for Toxic Substances and Disease Registry). 2011. Minimal Risk Levels. Agency for
Toxic Substances and Disease Registry. Atlanta, Georgia. Available at https://www.atsdr.cdc.gov/mrls/pdfs/atsdr_mrls.pdf. Last updated March 3, 2011, and accessed July 2011.
CalEPA (California Environmental Protection Agency). 2011. Air Toxics Hot Spots Program Risk Assessment Guidelines: OEHHA Acute, 8-hour, and Chronic Reference Exposure Levels (RELs). Office of Environmental Health Hazard Assessment, Berkeley, CA. Available at http://oehha.ca.gov/air/allrels.html. Accessed July 2011.
NOAA (National Oceanic and Atmospheric Administration). 2008. Screening Quick Reference Tables. National Oceanic and Atmospheric Administration, Office of Response and Restoration. Silver Spring, Maryland. Available at http://response.restoration.noaa.gov/sites/default/files/SQuiRTs.pdf updated November 13, 2008 and accessed July 2011.
NJDEP (New Jersey Department of Environmental Protection). 2009. Derivation of Ingestion-Based Soil Remediation Criterion for Cr+6 Based on the NTP Chronic Bioassay Data for Sodium Dichromate Dihydrate. New Jersey Department of Environmental Protection, Trenton, NJ. Available online at www.state.nj.us/dep/dsr/chromium/soil-cleanupderivation.pdf.
9/23/2016
J-3
U.S. EPA, 2011a. US EPA. Integrated Risk Information System. U.S. Environmental Protection Agency, Office of Research and Development. Washington, D.C. Available at https://www.epa.gov/iris last updated July 26, 2011 and accessed July 2011.
• 2011a1- IRIS Chemical Assessment Summary - Antimony • 2011a2- IRIS Chemical Assessment Summary - Arsenic • 2011a3- IRIS Chemical Assessment Summary - Benz[a]anthracene • 2011a4- IRIS Chemical Assessment Summary - Benzo[a]pyrene • 2011a5- IRIS Chemical Assessment Summary - Benzo[b]fluoranthene • 2011a6- IRIS Chemical Assessment Summary - Beryllium • 2011a7- IRIS Chemical Assessment Summary - Cadmium • 2011a8- IRIS Chemical Assessment Summary – Chromium III • 2011a9- IRIS Chemical Assessment Summary – Chromium VI • 2011a10- IRIS Chemical Assessment Summary - Dibenz[a,h]anthracene • 2011a11- IRIS Chemical Assessment Summary - Fluorine • 2011a12- IRIS Chemical Assessment Summary - Manganese • 2011a13- IRIS Chemical Assessment Summary - Mercury • 2011a14- IRIS Chemical Assessment Summary - Nickel • 2011a15- IRIS Chemical Assessment Summary - Polychlorinated Biphenyls (PCBs) • 2011a16- IRIS Chemical Assessment Summary - Selenium • 2011a17- IRIS Chemical Assessment Summary - Silver • 2011a18- IRIS Chemical Assessment Summary - Uranium • 2011a19- IRIS Chemical Assessment Summary - Zinc
U.S. EPA, 2011b. US EPA. Interim Ecological Soil Screening Levels. U.S. Environmental Protection Agency, Office of Research and Development. Washington, D.C. Available at https://www.epa.gov/chemical-research/interim-ecological-soil-screening-level-documents.
• 2011b1- Eco Soil Screening Levels – Antimony • 2011b2- Eco Soil Screening Levels - Arsenic • 2011b3- Eco Soil Screening Levels - Beryllium • 2011b4- Eco Soil Screening Levels - Cadmium • 2011b5- Eco Soil Screening Levels – Chromium III and VI • 2011b6- Eco Soil Screening Levels - Cobalt • 2011b7- Eco Soil Screening Levels - Copper • 2011b8- Eco Soil Screening Levels - Lead • 2011b9- Eco Soil Screening Levels - Manganese • 2011b10- Eco Soil Screening Levels - Nickel • 2011b11- Eco Soil Screening Levels - Polycyclic Aromatic Hydrocarbons (PAHs) • 2011b12- Eco Soil Screening Levels - Selenium • 2011b13- Eco Soil Screening Levels - Silver • 2011b14- Eco Soil Screening Levels - Zinc
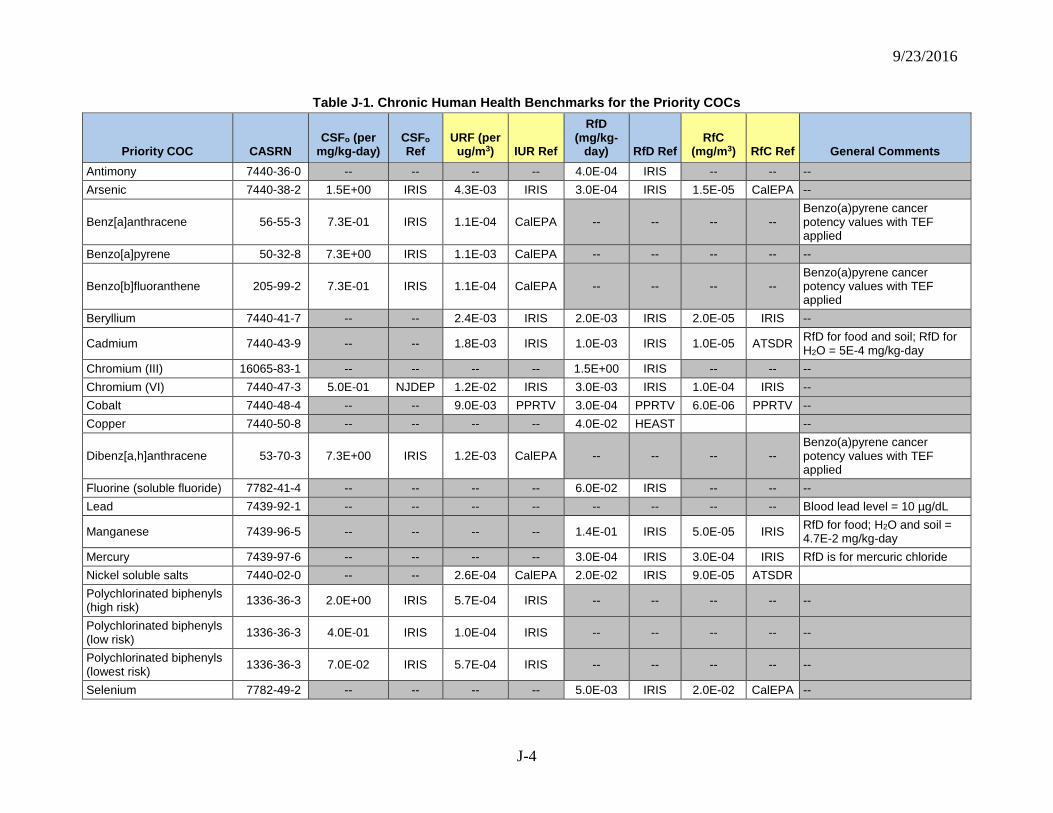
9/23/2016
J-4
Table J-1. Chronic Human Health Benchmarks for the Priority COCs
Priority COC CASRN CSFo (per
mg/kg-day) CSFo Ref
URF (per ug/m3) IUR Ref
RfD (mg/kg-
day) RfD Ref RfC
(mg/m3) RfC Ref General Comments Antimony 7440-36-0 -- -- -- -- 4.0E-04 IRIS -- -- -- Arsenic 7440-38-2 1.5E+00 IRIS 4.3E-03 IRIS 3.0E-04 IRIS 1.5E-05 CalEPA --
Benz[a]anthracene 56-55-3 7.3E-01 IRIS 1.1E-04 CalEPA -- -- -- -- Benzo(a)pyrene cancer potency values with TEF applied
Benzo[a]pyrene 50-32-8 7.3E+00 IRIS 1.1E-03 CalEPA -- -- -- -- --
Benzo[b]fluoranthene 205-99-2 7.3E-01 IRIS 1.1E-04 CalEPA -- -- -- -- Benzo(a)pyrene cancer potency values with TEF applied
Beryllium 7440-41-7 -- -- 2.4E-03 IRIS 2.0E-03 IRIS 2.0E-05 IRIS --
Cadmium 7440-43-9 -- -- 1.8E-03 IRIS 1.0E-03 IRIS 1.0E-05 ATSDR RfD for food and soil; RfD for H2O = 5E-4 mg/kg-day
Chromium (III) 16065-83-1 -- -- -- -- 1.5E+00 IRIS -- -- -- Chromium (VI) 7440-47-3 5.0E-01 NJDEP 1.2E-02 IRIS 3.0E-03 IRIS 1.0E-04 IRIS -- Cobalt 7440-48-4 -- -- 9.0E-03 PPRTV 3.0E-04 PPRTV 6.0E-06 PPRTV -- Copper 7440-50-8 -- -- -- -- 4.0E-02 HEAST --
Dibenz[a,h]anthracene 53-70-3 7.3E+00 IRIS 1.2E-03 CalEPA -- -- -- -- Benzo(a)pyrene cancer potency values with TEF applied
Fluorine (soluble fluoride) 7782-41-4 -- -- -- -- 6.0E-02 IRIS -- -- -- Lead 7439-92-1 -- -- -- -- -- -- -- -- Blood lead level = 10 µg/dL
Manganese 7439-96-5 -- -- -- -- 1.4E-01 IRIS 5.0E-05 IRIS RfD for food; H2O and soil = 4.7E-2 mg/kg-day
Mercury 7439-97-6 -- -- -- -- 3.0E-04 IRIS 3.0E-04 IRIS RfD is for mercuric chloride Nickel soluble salts 7440-02-0 -- -- 2.6E-04 CalEPA 2.0E-02 IRIS 9.0E-05 ATSDR Polychlorinated biphenyls (high risk) 1336-36-3 2.0E+00 IRIS 5.7E-04 IRIS -- -- -- -- --
Polychlorinated biphenyls (low risk) 1336-36-3 4.0E-01 IRIS 1.0E-04 IRIS -- -- -- -- --
Polychlorinated biphenyls (lowest risk) 1336-36-3 7.0E-02 IRIS 5.7E-04 IRIS -- -- -- -- --
Selenium 7782-49-2 -- -- -- -- 5.0E-03 IRIS 2.0E-02 CalEPA --
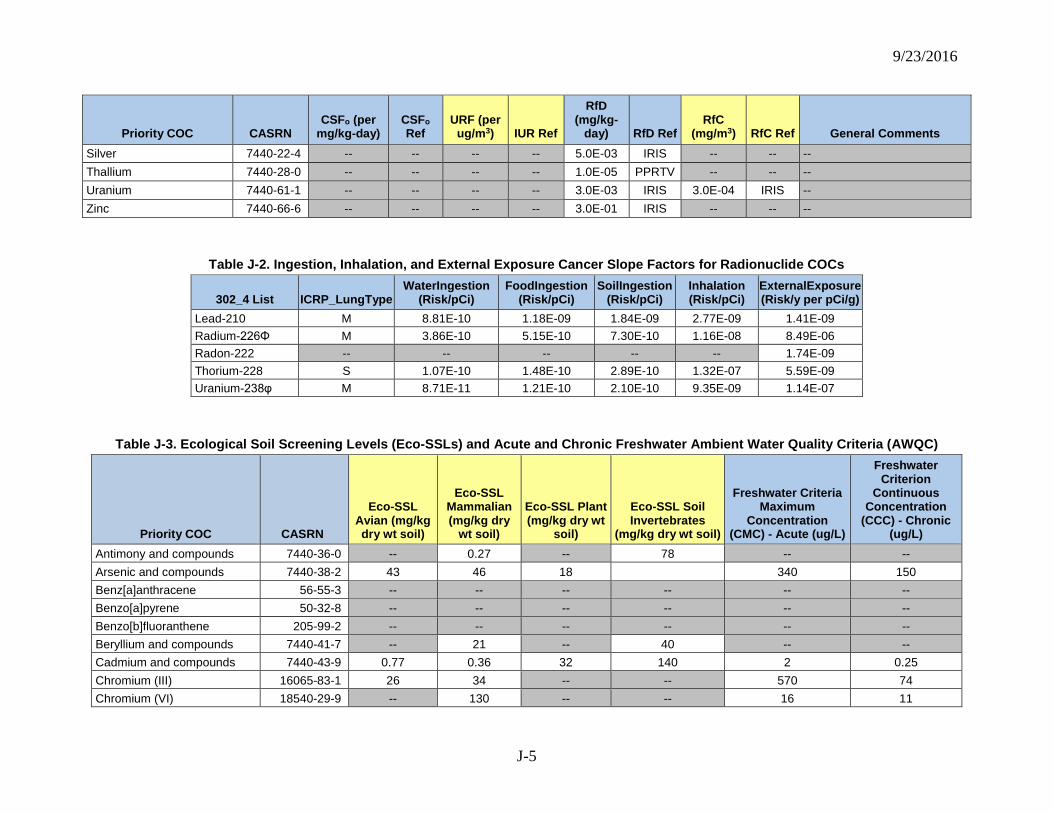
9/23/2016
J-5
Priority COC CASRN CSFo (per
mg/kg-day) CSFo Ref
URF (per ug/m3) IUR Ref
RfD (mg/kg-
day) RfD Ref RfC
(mg/m3) RfC Ref General Comments Silver 7440-22-4 -- -- -- -- 5.0E-03 IRIS -- -- -- Thallium 7440-28-0 -- -- -- -- 1.0E-05 PPRTV -- -- -- Uranium 7440-61-1 -- -- -- -- 3.0E-03 IRIS 3.0E-04 IRIS -- Zinc 7440-66-6 -- -- -- -- 3.0E-01 IRIS -- -- --
Table J-2. Ingestion, Inhalation, and External Exposure Cancer Slope Factors for Radionuclide COCs
302_4 List ICRP_LungType WaterIngestion
(Risk/pCi) FoodIngestion
(Risk/pCi) SoilIngestion
(Risk/pCi) Inhalation (Risk/pCi)
ExternalExposure (Risk/y per pCi/g)
Lead-210 M 8.81E-10 1.18E-09 1.84E-09 2.77E-09 1.41E-09 Radium-226Φ M 3.86E-10 5.15E-10 7.30E-10 1.16E-08 8.49E-06 Radon-222 -- -- -- -- -- 1.74E-09 Thorium-228 S 1.07E-10 1.48E-10 2.89E-10 1.32E-07 5.59E-09 Uranium-238φ M 8.71E-11 1.21E-10 2.10E-10 9.35E-09 1.14E-07
Table J-3. Ecological Soil Screening Levels (Eco-SSLs) and Acute and Chronic Freshwater Ambient Water Quality Criteria (AWQC)
Priority COC CASRN
Eco-SSL Avian (mg/kg dry wt soil)
Eco-SSL Mammalian (mg/kg dry
wt soil)
Eco-SSL Plant (mg/kg dry wt
soil)
Eco-SSL Soil Invertebrates
(mg/kg dry wt soil)
Freshwater Criteria Maximum
Concentration (CMC) - Acute (ug/L)
Freshwater Criterion
Continuous Concentration
(CCC) - Chronic (ug/L)
Antimony and compounds 7440-36-0 -- 0.27 -- 78 -- -- Arsenic and compounds 7440-38-2 43 46 18 340 150 Benz[a]anthracene 56-55-3 -- -- -- -- -- -- Benzo[a]pyrene 50-32-8 -- -- -- -- -- -- Benzo[b]fluoranthene 205-99-2 -- -- -- -- -- -- Beryllium and compounds 7440-41-7 -- 21 -- 40 -- -- Cadmium and compounds 7440-43-9 0.77 0.36 32 140 2 0.25 Chromium (III) 16065-83-1 26 34 -- -- 570 74 Chromium (VI) 18540-29-9 -- 130 -- -- 16 11
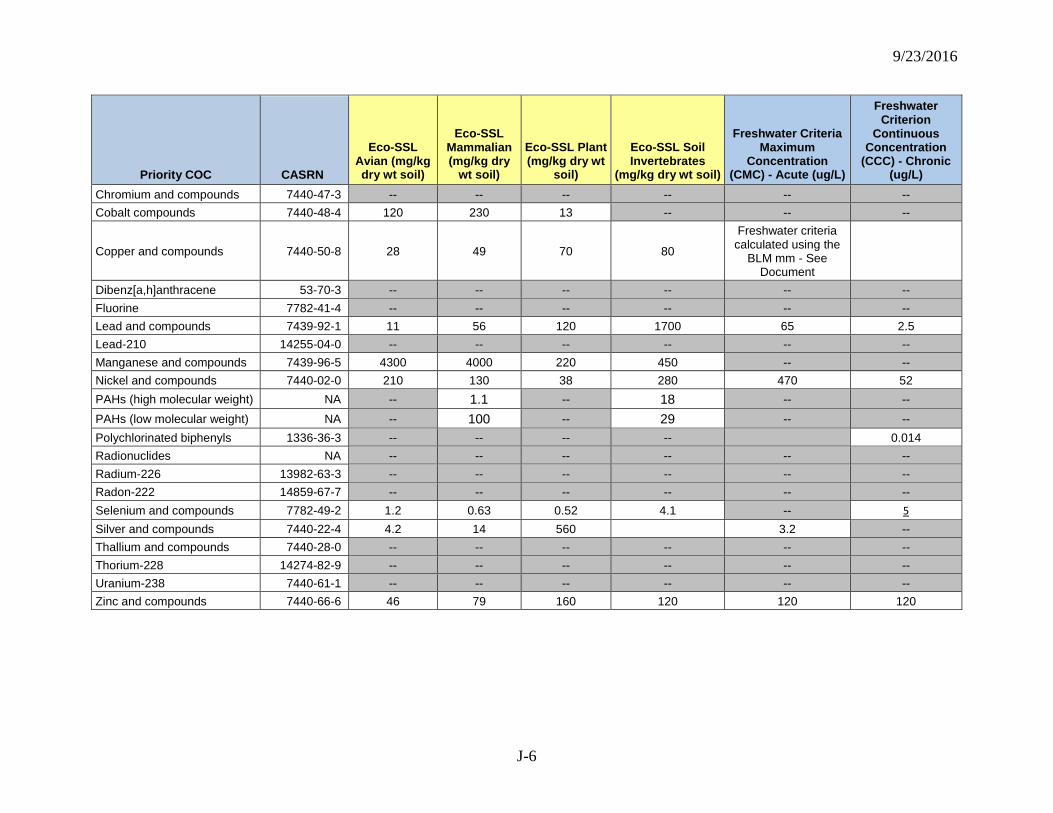
9/23/2016
J-6
Priority COC CASRN
Eco-SSL Avian (mg/kg dry wt soil)
Eco-SSL Mammalian (mg/kg dry
wt soil)
Eco-SSL Plant (mg/kg dry wt
soil)
Eco-SSL Soil Invertebrates
(mg/kg dry wt soil)
Freshwater Criteria Maximum
Concentration (CMC) - Acute (ug/L)
Freshwater Criterion
Continuous Concentration
(CCC) - Chronic (ug/L)
Chromium and compounds 7440-47-3 -- -- -- -- -- -- Cobalt compounds 7440-48-4 120 230 13 -- -- --
Copper and compounds 7440-50-8 28 49 70 80
Freshwater criteria calculated using the
BLM mm - See Document
Dibenz[a,h]anthracene 53-70-3 -- -- -- -- -- -- Fluorine 7782-41-4 -- -- -- -- -- -- Lead and compounds 7439-92-1 11 56 120 1700 65 2.5 Lead-210 14255-04-0 -- -- -- -- -- -- Manganese and compounds 7439-96-5 4300 4000 220 450 -- -- Nickel and compounds 7440-02-0 210 130 38 280 470 52 PAHs (high molecular weight) NA -- 1.1 -- 18 -- -- PAHs (low molecular weight) NA -- 100 -- 29 -- -- Polychlorinated biphenyls 1336-36-3 -- -- -- -- 0.014 Radionuclides NA -- -- -- -- -- -- Radium-226 13982-63-3 -- -- -- -- -- -- Radon-222 14859-67-7 -- -- -- -- -- -- Selenium and compounds 7782-49-2 1.2 0.63 0.52 4.1 -- 5 Silver and compounds 7440-22-4 4.2 14 560 3.2 -- Thallium and compounds 7440-28-0 -- -- -- -- -- -- Thorium-228 14274-82-9 -- -- -- -- -- -- Uranium-238 7440-61-1 -- -- -- -- -- -- Zinc and compounds 7440-66-6 46 79 160 120 120 120
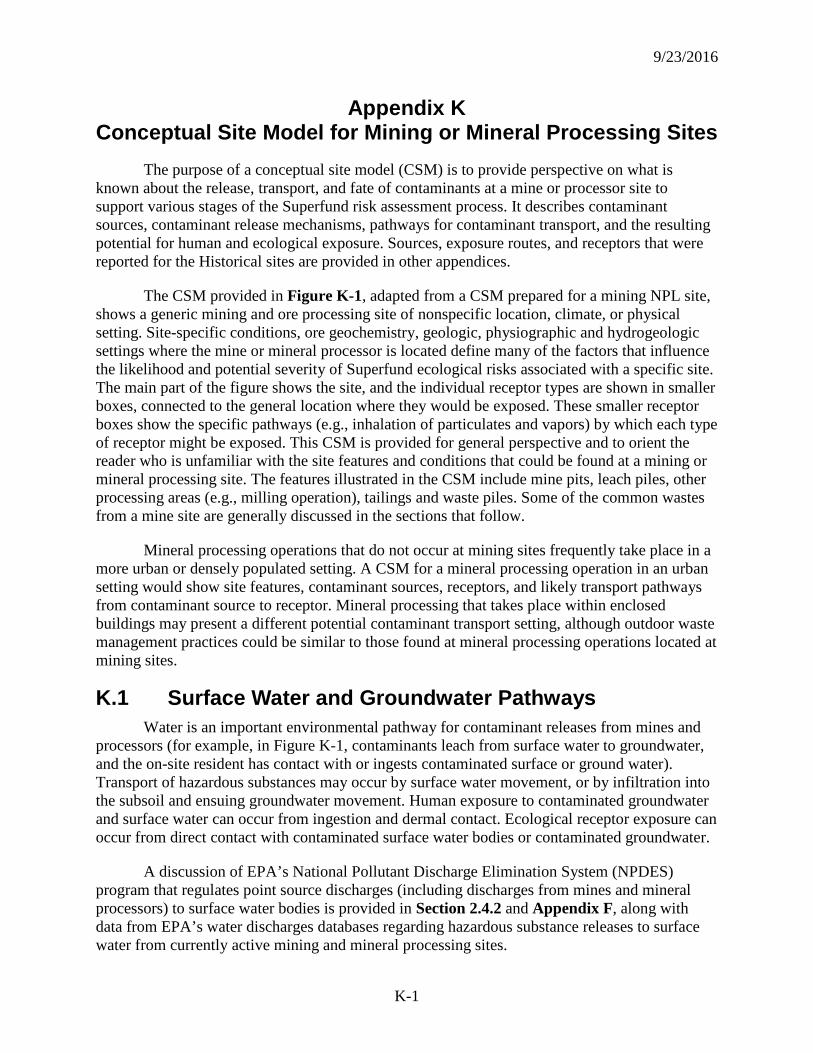
9/23/2016
K-1
Appendix K Conceptual Site Model for Mining or Mineral Processing Sites
The purpose of a conceptual site model (CSM) is to provide perspective on what is known about the release, transport, and fate of contaminants at a mine or processor site to support various stages of the Superfund risk assessment process. It describes contaminant sources, contaminant release mechanisms, pathways for contaminant transport, and the resulting potential for human and ecological exposure. Sources, exposure routes, and receptors that were reported for the Historical sites are provided in other appendices.
The CSM provided in Figure K-1, adapted from a CSM prepared for a mining NPL site, shows a generic mining and ore processing site of nonspecific location, climate, or physical setting. Site-specific conditions, ore geochemistry, geologic, physiographic and hydrogeologic settings where the mine or mineral processor is located define many of the factors that influence the likelihood and potential severity of Superfund ecological risks associated with a specific site. The main part of the figure shows the site, and the individual receptor types are shown in smaller boxes, connected to the general location where they would be exposed. These smaller receptor boxes show the specific pathways (e.g., inhalation of particulates and vapors) by which each type of receptor might be exposed. This CSM is provided for general perspective and to orient the reader who is unfamiliar with the site features and conditions that could be found at a mining or mineral processing site. The features illustrated in the CSM include mine pits, leach piles, other processing areas (e.g., milling operation), tailings and waste piles. Some of the common wastes from a mine site are generally discussed in the sections that follow.
Mineral processing operations that do not occur at mining sites frequently take place in a more urban or densely populated setting. A CSM for a mineral processing operation in an urban setting would show site features, contaminant sources, receptors, and likely transport pathways from contaminant source to receptor. Mineral processing that takes place within enclosed buildings may present a different potential contaminant transport setting, although outdoor waste management practices could be similar to those found at mineral processing operations located at mining sites.
K.1 Surface Water and Groundwater Pathways Water is an important environmental pathway for contaminant releases from mines and
processors (for example, in Figure K-1, contaminants leach from surface water to groundwater, and the on-site resident has contact with or ingests contaminated surface or ground water). Transport of hazardous substances may occur by surface water movement, or by infiltration into the subsoil and ensuing groundwater movement. Human exposure to contaminated groundwater and surface water can occur from ingestion and dermal contact. Ecological receptor exposure can occur from direct contact with contaminated surface water bodies or contaminated groundwater.
A discussion of EPA’s National Pollutant Discharge Elimination System (NPDES) program that regulates point source discharges (including discharges from mines and mineral processors) to surface water bodies is provided in Section 2.4.2 and Appendix F, along with data from EPA’s water discharges databases regarding hazardous substance releases to surface water from currently active mining and mineral processing sites.
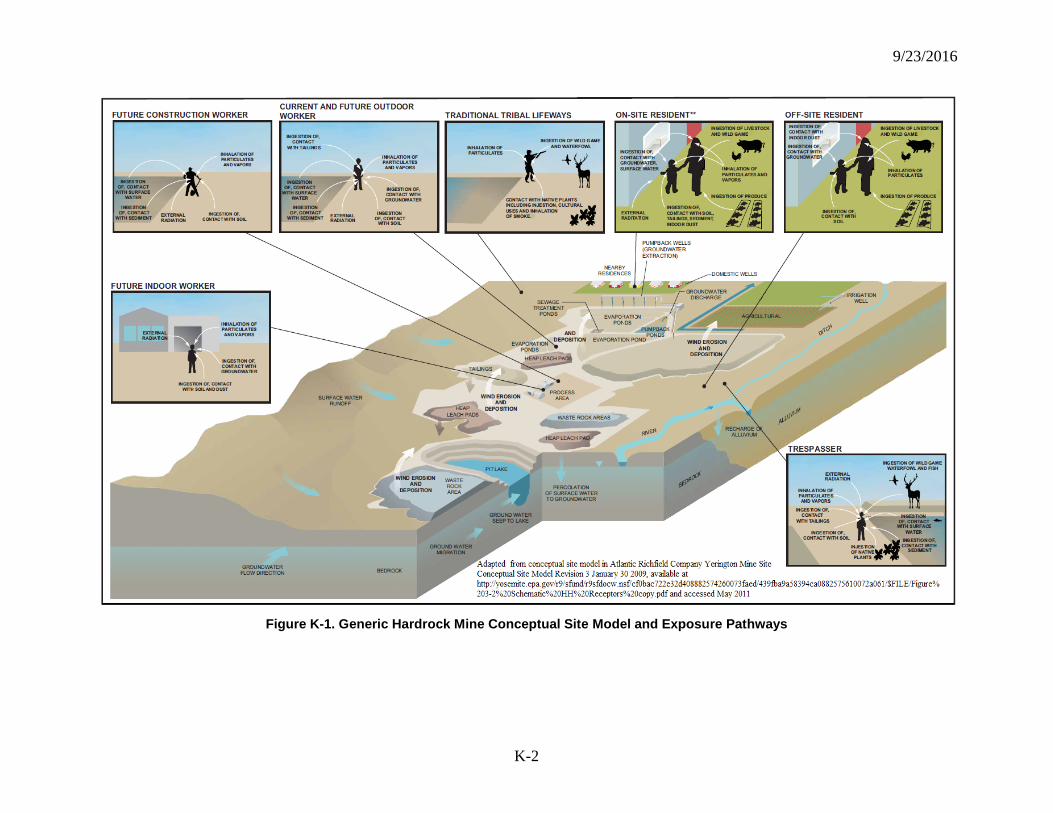
9/23/2016
K-2
Figure K-1. Generic Hardrock Mine Conceptual Site Model and Exposure Pathways
9/23/2016
K-3
K.2 Stormwater Runoff Hazardous substances released directly to surface soils may be transported by surface
water runoff to other areas of a site. Erosion of surface mine units (e.g., stockpiles, leach piles, waste rock piles, mine slope, etc.) by surface water runoff may result in transfer and deposition of acidic water, metals, and other chemicals onto exposed surface soil in down-gradient areas (see, for example, runoff in Figure K-1 from hills on left onto site and then back off to surface water). Organic chemicals and other hazardous substances that are used in maintenance and process areas at the mine site can also be transported by precipitation runoff. Local anthropogenic topographic features such as steep slopes in waste rock or tailings piles may cause increased rates of stormwater runoff and therefore increase the amounts of material transported. However, the presence of berms or ditches around mine units or interior collection areas such as ponds and topographically low areas will reduce the potential for stormwater to leave a site. Stormwater runoff control is generally required to prevent direct discharge of contaminants from mine sites into creeks and streams where aquatic habitat or downstream drinking water quality can be impacted.
K.3 Groundwater Groundwater can flow into mining pit lakes or evaporation ponds, or recharge from
surface mine units (see, for example, percolation of surface water to groundwater in Figure K-1). Pit water is generally removed to evaporation ponds or treated and discharged to surface waters or injected into the aquifer. It is often used in milling processes. Water may flow out of, and transport chemicals from, pit lakes into alluvial and bedrock groundwater flow systems, particularly during periods of high precipitation. Groundwater inflow to pit lakes, streams, buried trenches, or surface ditches may also result in the transport of chemicals from subsurface environments to surface waters, including the transfer of chemicals into sediments.
Pumpback Well Systems (PWS) are sometimes used to extract a portion of mineralized groundwater or pit seepage water that could migrate off-site and impact neighboring or nearby human or ecological receptors. The effluent is then pumped and released to evaporation ponds, resulting in an accumulation of potentially contaminated sediment as the water evaporates. Chemical precipitate accumulations can also occur in active PWS and evaporation ponds. Losses of dewatering effluent from leaking pipelines carrying water from mine pits, holding ponds, or from PWS can also be a potential source of soil and groundwater contamination.
K.4 Air Pathway
K.4.1 Fugitive Dust Direct human exposure can occur from inhalation of fine dusts (i.e., particulates) or by
ingestion or dermal contact of contaminated dusts (see, for example, wind erosion and exposure to on-site worker in Figure K-1). Particulates or fugitive dust from waste rock or tailings piles, conveyor systems, site roads, or other areas can be transported by wind and deposited and accumulated in downwind areas including surface soils, surface water bodies (e.g., ponds, pit lakes), or be inhaled by site workers and nearby residents. Dust can be an irritant, toxic, or a carcinogen depending on the particle’s properties. However, the presence of physical barriers,
9/23/2016
K-4
such as vegetation or structural foundations, may reduce wind-blown transport of particles. Accumulated mine sediments or dust may become secondary sources of chemicals transported to groundwater via leaching and percolation.
K.4.2 Aerosols and Chemical Vapors Mine workers can be exposed to aerosols from numerous processes including
comminution, re-entrainment, and combustion sources. Aerosols are airborne mixtures of dust and/or chemicals sometimes referred to as gases, mists or vapors. Cutting, drilling, and blasting of the parent rock, and ore crushing and beneficiation processes creates aerosols with a composition similar to the parent rock, particularly if comminuting the ore underground is practiced for efficient transport out of the mine. Aeration ponds are sometimes used to treat waste waters on a mine site, and the aerators used to disturb the surface of the water can create aerosols; the problem can become worse if surfactants are used and not managed properly.
K.5 Radioactivity Naturally occurring radioactive materials (NORMs) such as thorium and uranium can be
present in ore materials. As target commodities are removed from ores, and waste rock or gangue materials are produced, NORMs can concentrate in dusts and sediments. Transport of NORMs may occur by any of the transport pathways described above. Acidic groundwater and surface water and low concentrations of organic material in soils can contribute to the mobility and transport of radioactive materials. Accumulations of sediments deposited by runoff and dusts can also concentrate radioactive materials. External exposure to naturally occurring radiation is often limited to soil or waste materials that are within several inches of the ground or pile surface; radioactive materials found deeper in the soil column or accumulated sediments are generally shielded by the top layer of soil. Geometric attenuation generally limits the external radiation from unshielded NORMs to within a few meters (i.e., less than 5 meters and often less than 1 to 2 meters from the source). Radioactivity can become concentrated in mineral scales that develop in PWS, holding tanks, aeration ponds, and milling process areas. Inhalation of contaminated dusts is generally of greatest concern for NORMs.
EPA’s NEI data is described in Appendix F. Data on hazardous substance releases to air from the 2009 Current sites is provided in Section 2.4.2 and Appendix F; data for historical sites is provided in Section 2.4.1.
K.6 Direct Exposure Direct exposure can occur as a result of direct contact with solid phase mine or process
wastes (see, for example, the on-site worker in Figure K-1). It can also occur under a future residential use scenario where housing is built directly on top of waste rock piles (as has been documented at one site in Colorado). In that scenario, direct exposure may be both to direct contact with or ingestion of soil, or to radiation if the waste rock had elevated radionuclide levels (see, for example, the on-site resident in Figure K-1).
9/23/2016
K-5
K.7 Indirect Exposure Indirect exposure to humans encompasses a variety of pathways that can occur when
contaminants are transported off the site before exposure occurs. Transport may be via air (e.g., particulates may become airborne and disperse off site, where they then redeposit on agricultural or residential land, or via runoff and soil erosion to either land or surface water. Contaminants that reach surface water can bioaccumulate in the aquatic foodchain, or leach to groundwater. Once off-site, whether in water or on land, contaminants may accumulate in the food chain, either in vegetables or grazing farm animals used for food (e.g., meat, dairy products). Residents may then ingest contaminated soil or food products. Other food chain examples include consumption of contaminated fish, shellfish, and wild game (see on- and off-site resident receptors in Figure K-1).
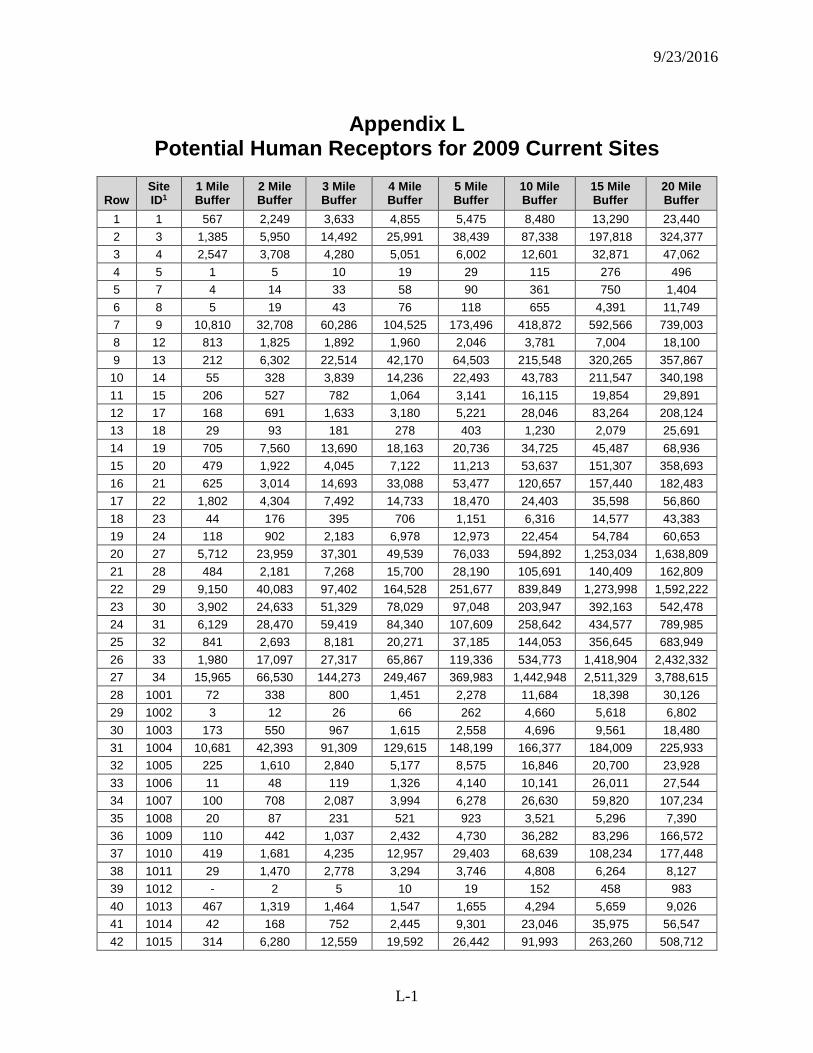
9/23/2016
L-1
Appendix L Potential Human Receptors for 2009 Current Sites
Row Site ID1
1 Mile Buffer
2 Mile Buffer
3 Mile Buffer
4 Mile Buffer
5 Mile Buffer
10 Mile Buffer
15 Mile Buffer
20 Mile Buffer
1 1 567 2,249 3,633 4,855 5,475 8,480 13,290 23,440 2 3 1,385 5,950 14,492 25,991 38,439 87,338 197,818 324,377 3 4 2,547 3,708 4,280 5,051 6,002 12,601 32,871 47,062 4 5 1 5 10 19 29 115 276 496 5 7 4 14 33 58 90 361 750 1,404 6 8 5 19 43 76 118 655 4,391 11,749 7 9 10,810 32,708 60,286 104,525 173,496 418,872 592,566 739,003 8 12 813 1,825 1,892 1,960 2,046 3,781 7,004 18,100 9 13 212 6,302 22,514 42,170 64,503 215,548 320,265 357,867 10 14 55 328 3,839 14,236 22,493 43,783 211,547 340,198 11 15 206 527 782 1,064 3,141 16,115 19,854 29,891 12 17 168 691 1,633 3,180 5,221 28,046 83,264 208,124 13 18 29 93 181 278 403 1,230 2,079 25,691 14 19 705 7,560 13,690 18,163 20,736 34,725 45,487 68,936 15 20 479 1,922 4,045 7,122 11,213 53,637 151,307 358,693 16 21 625 3,014 14,693 33,088 53,477 120,657 157,440 182,483 17 22 1,802 4,304 7,492 14,733 18,470 24,403 35,598 56,860 18 23 44 176 395 706 1,151 6,316 14,577 43,383 19 24 118 902 2,183 6,978 12,973 22,454 54,784 60,653 20 27 5,712 23,959 37,301 49,539 76,033 594,892 1,253,034 1,638,809 21 28 484 2,181 7,268 15,700 28,190 105,691 140,409 162,809 22 29 9,150 40,083 97,402 164,528 251,677 839,849 1,273,998 1,592,222 23 30 3,902 24,633 51,329 78,029 97,048 203,947 392,163 542,478 24 31 6,129 28,470 59,419 84,340 107,609 258,642 434,577 789,985 25 32 841 2,693 8,181 20,271 37,185 144,053 356,645 683,949 26 33 1,980 17,097 27,317 65,867 119,336 534,773 1,418,904 2,432,332 27 34 15,965 66,530 144,273 249,467 369,983 1,442,948 2,511,329 3,788,615 28 1001 72 338 800 1,451 2,278 11,684 18,398 30,126 29 1002 3 12 26 66 262 4,660 5,618 6,802 30 1003 173 550 967 1,615 2,558 4,696 9,561 18,480 31 1004 10,681 42,393 91,309 129,615 148,199 166,377 184,009 225,933 32 1005 225 1,610 2,840 5,177 8,575 16,846 20,700 23,928 33 1006 11 48 119 1,326 4,140 10,141 26,011 27,544 34 1007 100 708 2,087 3,994 6,278 26,630 59,820 107,234 35 1008 20 87 231 521 923 3,521 5,296 7,390 36 1009 110 442 1,037 2,432 4,730 36,282 83,296 166,572 37 1010 419 1,681 4,235 12,957 29,403 68,639 108,234 177,448 38 1011 29 1,470 2,778 3,294 3,746 4,808 6,264 8,127 39 1012 - 2 5 10 19 152 458 983 40 1013 467 1,319 1,464 1,547 1,655 4,294 5,659 9,026 41 1014 42 168 752 2,445 9,301 23,046 35,975 56,547 42 1015 314 6,280 12,559 19,592 26,442 91,993 263,260 508,712
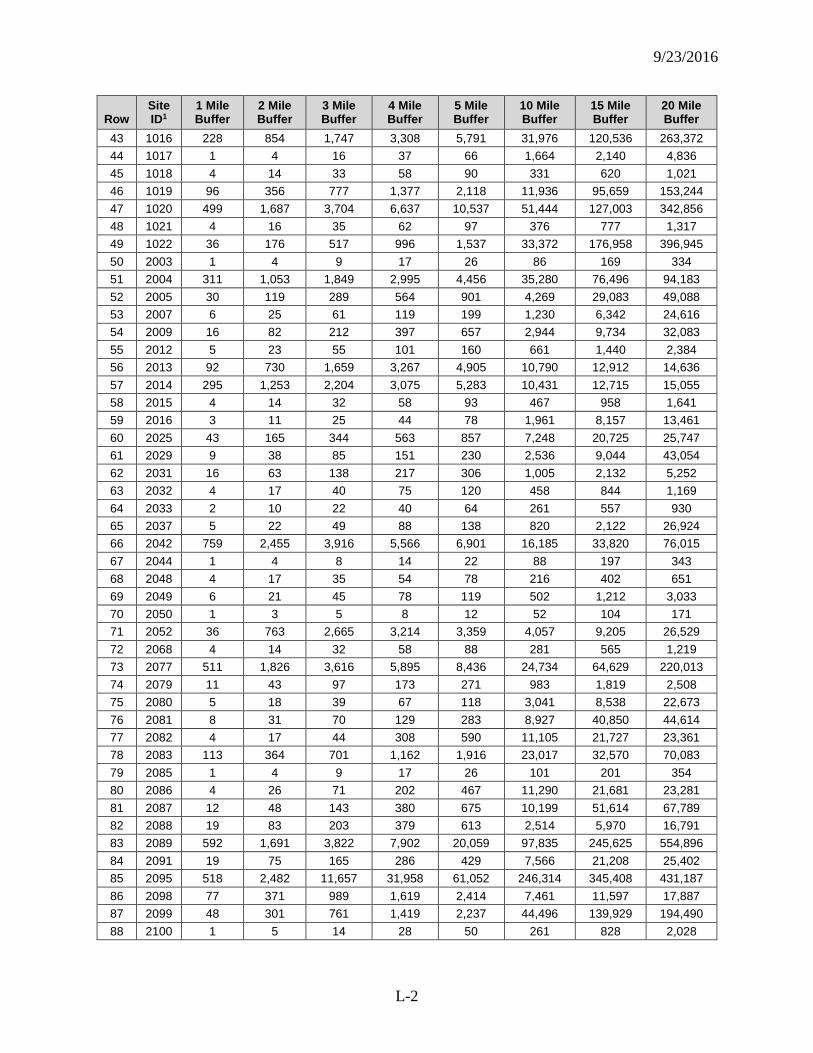
9/23/2016
L-2
Row Site ID1
1 Mile Buffer
2 Mile Buffer
3 Mile Buffer
4 Mile Buffer
5 Mile Buffer
10 Mile Buffer
15 Mile Buffer
20 Mile Buffer
43 1016 228 854 1,747 3,308 5,791 31,976 120,536 263,372 44 1017 1 4 16 37 66 1,664 2,140 4,836 45 1018 4 14 33 58 90 331 620 1,021 46 1019 96 356 777 1,377 2,118 11,936 95,659 153,244 47 1020 499 1,687 3,704 6,637 10,537 51,444 127,003 342,856 48 1021 4 16 35 62 97 376 777 1,317 49 1022 36 176 517 996 1,537 33,372 176,958 396,945 50 2003 1 4 9 17 26 86 169 334 51 2004 311 1,053 1,849 2,995 4,456 35,280 76,496 94,183 52 2005 30 119 289 564 901 4,269 29,083 49,088 53 2007 6 25 61 119 199 1,230 6,342 24,616 54 2009 16 82 212 397 657 2,944 9,734 32,083 55 2012 5 23 55 101 160 661 1,440 2,384 56 2013 92 730 1,659 3,267 4,905 10,790 12,912 14,636 57 2014 295 1,253 2,204 3,075 5,283 10,431 12,715 15,055 58 2015 4 14 32 58 93 467 958 1,641 59 2016 3 11 25 44 78 1,961 8,157 13,461 60 2025 43 165 344 563 857 7,248 20,725 25,747 61 2029 9 38 85 151 230 2,536 9,044 43,054 62 2031 16 63 138 217 306 1,005 2,132 5,252 63 2032 4 17 40 75 120 458 844 1,169 64 2033 2 10 22 40 64 261 557 930 65 2037 5 22 49 88 138 820 2,122 26,924 66 2042 759 2,455 3,916 5,566 6,901 16,185 33,820 76,015 67 2044 1 4 8 14 22 88 197 343 68 2048 4 17 35 54 78 216 402 651 69 2049 6 21 45 78 119 502 1,212 3,033 70 2050 1 3 5 8 12 52 104 171 71 2052 36 763 2,665 3,214 3,359 4,057 9,205 26,529 72 2068 4 14 32 58 88 281 565 1,219 73 2077 511 1,826 3,616 5,895 8,436 24,734 64,629 220,013 74 2079 11 43 97 173 271 983 1,819 2,508 75 2080 5 18 39 67 118 3,041 8,538 22,673 76 2081 8 31 70 129 283 8,927 40,850 44,614 77 2082 4 17 44 308 590 11,105 21,727 23,361 78 2083 113 364 701 1,162 1,916 23,017 32,570 70,083 79 2085 1 4 9 17 26 101 201 354 80 2086 4 26 71 202 467 11,290 21,681 23,281 81 2087 12 48 143 380 675 10,199 51,614 67,789 82 2088 19 83 203 379 613 2,514 5,970 16,791 83 2089 592 1,691 3,822 7,902 20,059 97,835 245,625 554,896 84 2091 19 75 165 286 429 7,566 21,208 25,402 85 2095 518 2,482 11,657 31,958 61,052 246,314 345,408 431,187 86 2098 77 371 989 1,619 2,414 7,461 11,597 17,887 87 2099 48 301 761 1,419 2,237 44,496 139,929 194,490 88 2100 1 5 14 28 50 261 828 2,028
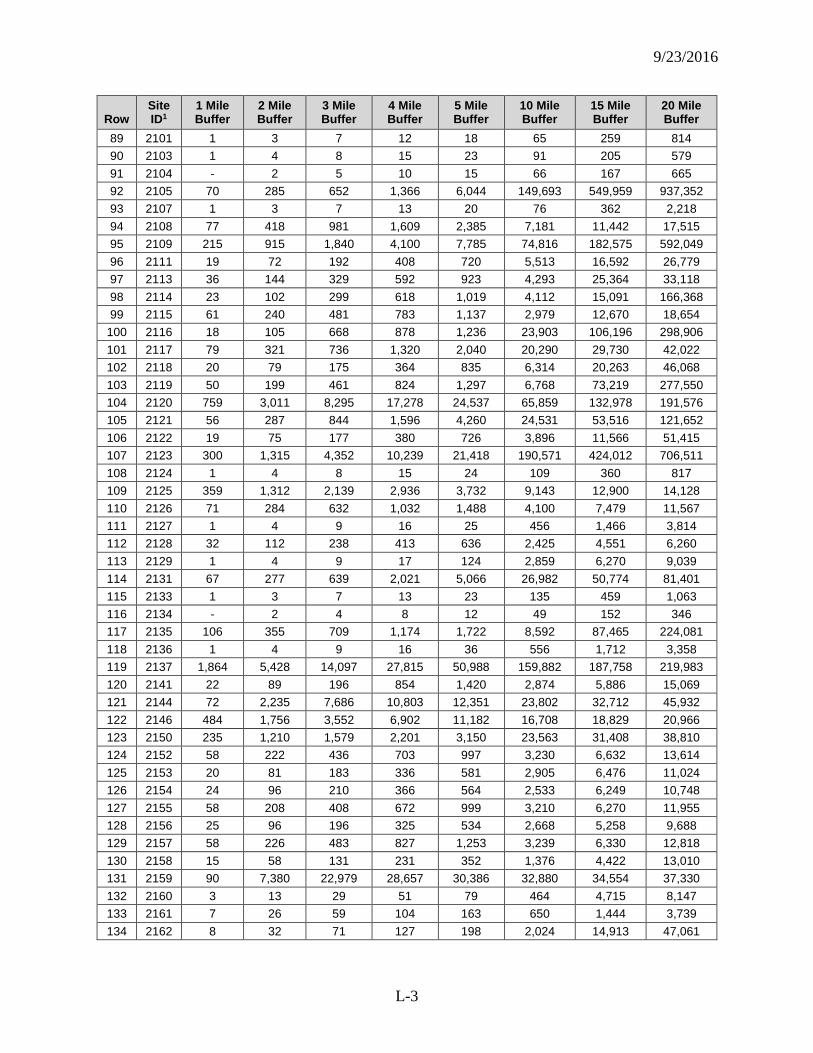
9/23/2016
L-3
Row Site ID1
1 Mile Buffer
2 Mile Buffer
3 Mile Buffer
4 Mile Buffer
5 Mile Buffer
10 Mile Buffer
15 Mile Buffer
20 Mile Buffer
89 2101 1 3 7 12 18 65 259 814 90 2103 1 4 8 15 23 91 205 579 91 2104 - 2 5 10 15 66 167 665 92 2105 70 285 652 1,366 6,044 149,693 549,959 937,352 93 2107 1 3 7 13 20 76 362 2,218 94 2108 77 418 981 1,609 2,385 7,181 11,442 17,515 95 2109 215 915 1,840 4,100 7,785 74,816 182,575 592,049 96 2111 19 72 192 408 720 5,513 16,592 26,779 97 2113 36 144 329 592 923 4,293 25,364 33,118 98 2114 23 102 299 618 1,019 4,112 15,091 166,368 99 2115 61 240 481 783 1,137 2,979 12,670 18,654
100 2116 18 105 668 878 1,236 23,903 106,196 298,906 101 2117 79 321 736 1,320 2,040 20,290 29,730 42,022 102 2118 20 79 175 364 835 6,314 20,263 46,068 103 2119 50 199 461 824 1,297 6,768 73,219 277,550 104 2120 759 3,011 8,295 17,278 24,537 65,859 132,978 191,576 105 2121 56 287 844 1,596 4,260 24,531 53,516 121,652 106 2122 19 75 177 380 726 3,896 11,566 51,415 107 2123 300 1,315 4,352 10,239 21,418 190,571 424,012 706,511 108 2124 1 4 8 15 24 109 360 817 109 2125 359 1,312 2,139 2,936 3,732 9,143 12,900 14,128 110 2126 71 284 632 1,032 1,488 4,100 7,479 11,567 111 2127 1 4 9 16 25 456 1,466 3,814 112 2128 32 112 238 413 636 2,425 4,551 6,260 113 2129 1 4 9 17 124 2,859 6,270 9,039 114 2131 67 277 639 2,021 5,066 26,982 50,774 81,401 115 2133 1 3 7 13 23 135 459 1,063 116 2134 - 2 4 8 12 49 152 346 117 2135 106 355 709 1,174 1,722 8,592 87,465 224,081 118 2136 1 4 9 16 36 556 1,712 3,358 119 2137 1,864 5,428 14,097 27,815 50,988 159,882 187,758 219,983 120 2141 22 89 196 854 1,420 2,874 5,886 15,069 121 2144 72 2,235 7,686 10,803 12,351 23,802 32,712 45,932 122 2146 484 1,756 3,552 6,902 11,182 16,708 18,829 20,966 123 2150 235 1,210 1,579 2,201 3,150 23,563 31,408 38,810 124 2152 58 222 436 703 997 3,230 6,632 13,614 125 2153 20 81 183 336 581 2,905 6,476 11,024 126 2154 24 96 210 366 564 2,533 6,249 10,748 127 2155 58 208 408 672 999 3,210 6,270 11,955 128 2156 25 96 196 325 534 2,668 5,258 9,688 129 2157 58 226 483 827 1,253 3,239 6,330 12,818 130 2158 15 58 131 231 352 1,376 4,422 13,010 131 2159 90 7,380 22,979 28,657 30,386 32,880 34,554 37,330 132 2160 3 13 29 51 79 464 4,715 8,147 133 2161 7 26 59 104 163 650 1,444 3,739 134 2162 8 32 71 127 198 2,024 14,913 47,061
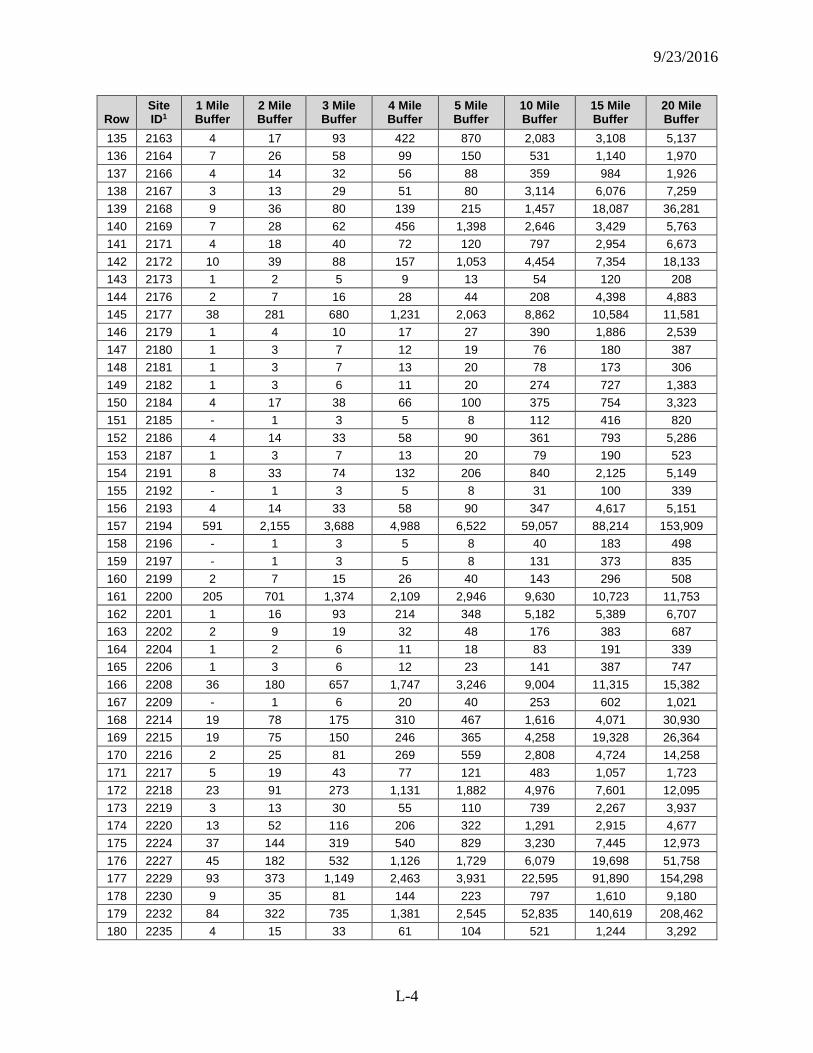
9/23/2016
L-4
Row Site ID1
1 Mile Buffer
2 Mile Buffer
3 Mile Buffer
4 Mile Buffer
5 Mile Buffer
10 Mile Buffer
15 Mile Buffer
20 Mile Buffer
135 2163 4 17 93 422 870 2,083 3,108 5,137 136 2164 7 26 58 99 150 531 1,140 1,970 137 2166 4 14 32 56 88 359 984 1,926 138 2167 3 13 29 51 80 3,114 6,076 7,259 139 2168 9 36 80 139 215 1,457 18,087 36,281 140 2169 7 28 62 456 1,398 2,646 3,429 5,763 141 2171 4 18 40 72 120 797 2,954 6,673 142 2172 10 39 88 157 1,053 4,454 7,354 18,133 143 2173 1 2 5 9 13 54 120 208 144 2176 2 7 16 28 44 208 4,398 4,883 145 2177 38 281 680 1,231 2,063 8,862 10,584 11,581 146 2179 1 4 10 17 27 390 1,886 2,539 147 2180 1 3 7 12 19 76 180 387 148 2181 1 3 7 13 20 78 173 306 149 2182 1 3 6 11 20 274 727 1,383 150 2184 4 17 38 66 100 375 754 3,323 151 2185 - 1 3 5 8 112 416 820 152 2186 4 14 33 58 90 361 793 5,286 153 2187 1 3 7 13 20 79 190 523 154 2191 8 33 74 132 206 840 2,125 5,149 155 2192 - 1 3 5 8 31 100 339 156 2193 4 14 33 58 90 347 4,617 5,151 157 2194 591 2,155 3,688 4,988 6,522 59,057 88,214 153,909 158 2196 - 1 3 5 8 40 183 498 159 2197 - 1 3 5 8 131 373 835 160 2199 2 7 15 26 40 143 296 508 161 2200 205 701 1,374 2,109 2,946 9,630 10,723 11,753 162 2201 1 16 93 214 348 5,182 5,389 6,707 163 2202 2 9 19 32 48 176 383 687 164 2204 1 2 6 11 18 83 191 339 165 2206 1 3 6 12 23 141 387 747 166 2208 36 180 657 1,747 3,246 9,004 11,315 15,382 167 2209 - 1 6 20 40 253 602 1,021 168 2214 19 78 175 310 467 1,616 4,071 30,930 169 2215 19 75 150 246 365 4,258 19,328 26,364 170 2216 2 25 81 269 559 2,808 4,724 14,258 171 2217 5 19 43 77 121 483 1,057 1,723 172 2218 23 91 273 1,131 1,882 4,976 7,601 12,095 173 2219 3 13 30 55 110 739 2,267 3,937 174 2220 13 52 116 206 322 1,291 2,915 4,677 175 2224 37 144 319 540 829 3,230 7,445 12,973 176 2227 45 182 532 1,126 1,729 6,079 19,698 51,758 177 2229 93 373 1,149 2,463 3,931 22,595 91,890 154,298 178 2230 9 35 81 144 223 797 1,610 9,180 179 2232 84 322 735 1,381 2,545 52,835 140,619 208,462 180 2235 4 15 33 61 104 521 1,244 3,292
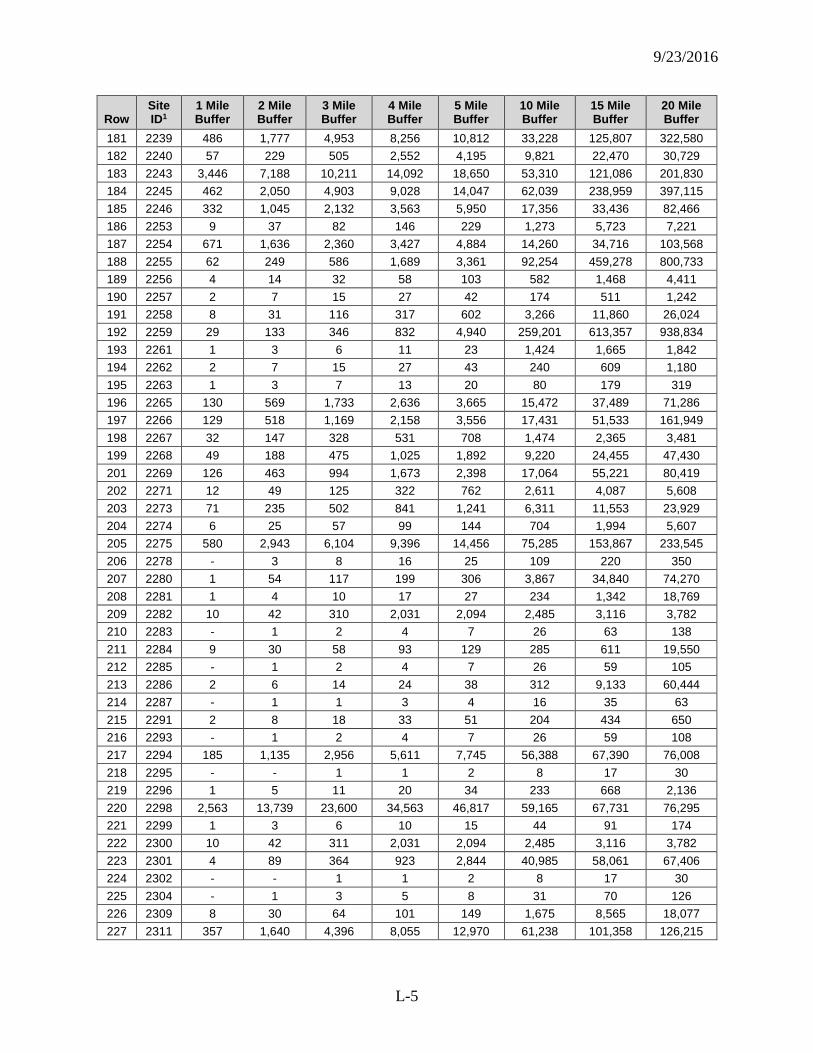
9/23/2016
L-5
Row Site ID1
1 Mile Buffer
2 Mile Buffer
3 Mile Buffer
4 Mile Buffer
5 Mile Buffer
10 Mile Buffer
15 Mile Buffer
20 Mile Buffer
181 2239 486 1,777 4,953 8,256 10,812 33,228 125,807 322,580 182 2240 57 229 505 2,552 4,195 9,821 22,470 30,729 183 2243 3,446 7,188 10,211 14,092 18,650 53,310 121,086 201,830 184 2245 462 2,050 4,903 9,028 14,047 62,039 238,959 397,115 185 2246 332 1,045 2,132 3,563 5,950 17,356 33,436 82,466 186 2253 9 37 82 146 229 1,273 5,723 7,221 187 2254 671 1,636 2,360 3,427 4,884 14,260 34,716 103,568 188 2255 62 249 586 1,689 3,361 92,254 459,278 800,733 189 2256 4 14 32 58 103 582 1,468 4,411 190 2257 2 7 15 27 42 174 511 1,242 191 2258 8 31 116 317 602 3,266 11,860 26,024 192 2259 29 133 346 832 4,940 259,201 613,357 938,834 193 2261 1 3 6 11 23 1,424 1,665 1,842 194 2262 2 7 15 27 43 240 609 1,180 195 2263 1 3 7 13 20 80 179 319 196 2265 130 569 1,733 2,636 3,665 15,472 37,489 71,286 197 2266 129 518 1,169 2,158 3,556 17,431 51,533 161,949 198 2267 32 147 328 531 708 1,474 2,365 3,481 199 2268 49 188 475 1,025 1,892 9,220 24,455 47,430 201 2269 126 463 994 1,673 2,398 17,064 55,221 80,419 202 2271 12 49 125 322 762 2,611 4,087 5,608 203 2273 71 235 502 841 1,241 6,311 11,553 23,929 204 2274 6 25 57 99 144 704 1,994 5,607 205 2275 580 2,943 6,104 9,396 14,456 75,285 153,867 233,545 206 2278 - 3 8 16 25 109 220 350 207 2280 1 54 117 199 306 3,867 34,840 74,270 208 2281 1 4 10 17 27 234 1,342 18,769 209 2282 10 42 310 2,031 2,094 2,485 3,116 3,782 210 2283 - 1 2 4 7 26 63 138 211 2284 9 30 58 93 129 285 611 19,550 212 2285 - 1 2 4 7 26 59 105 213 2286 2 6 14 24 38 312 9,133 60,444 214 2287 - 1 1 3 4 16 35 63 215 2291 2 8 18 33 51 204 434 650 216 2293 - 1 2 4 7 26 59 108 217 2294 185 1,135 2,956 5,611 7,745 56,388 67,390 76,008 218 2295 - - 1 1 2 8 17 30 219 2296 1 5 11 20 34 233 668 2,136 220 2298 2,563 13,739 23,600 34,563 46,817 59,165 67,731 76,295 221 2299 1 3 6 10 15 44 91 174 222 2300 10 42 311 2,031 2,094 2,485 3,116 3,782 223 2301 4 89 364 923 2,844 40,985 58,061 67,406 224 2302 - - 1 1 2 8 17 30 225 2304 - 1 3 5 8 31 70 126 226 2309 8 30 64 101 149 1,675 8,565 18,077 227 2311 357 1,640 4,396 8,055 12,970 61,238 101,358 126,215
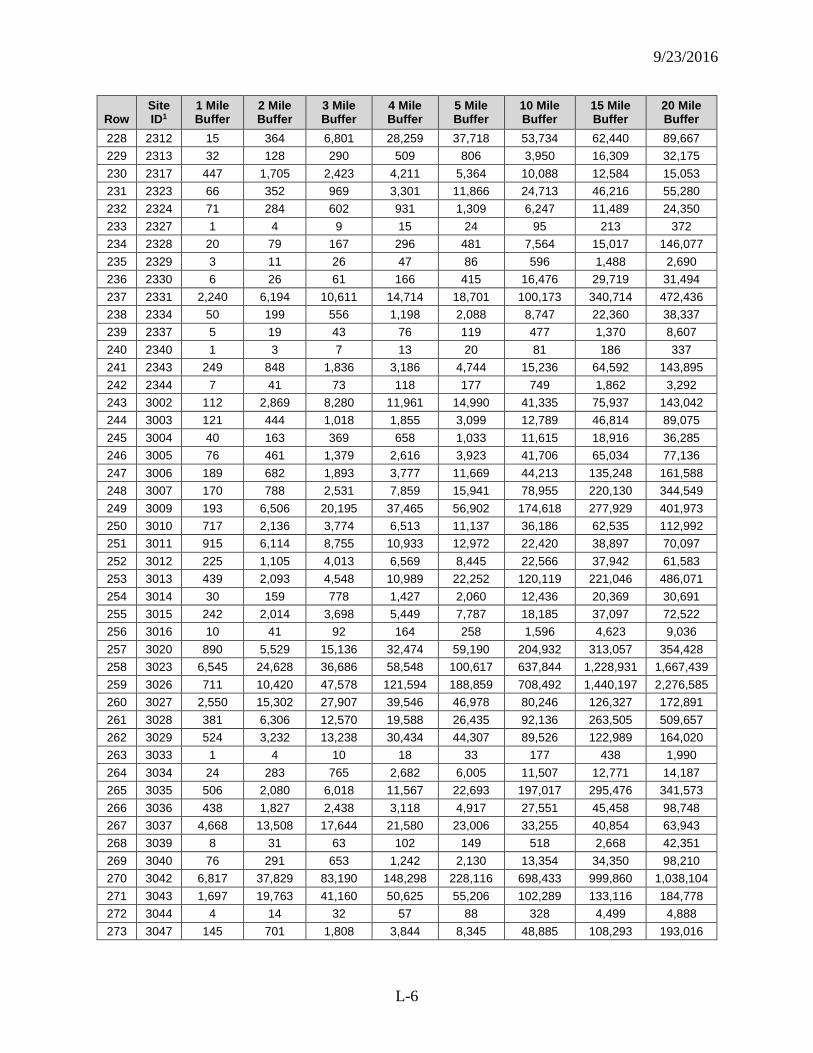
9/23/2016
L-6
Row Site ID1
1 Mile Buffer
2 Mile Buffer
3 Mile Buffer
4 Mile Buffer
5 Mile Buffer
10 Mile Buffer
15 Mile Buffer
20 Mile Buffer
228 2312 15 364 6,801 28,259 37,718 53,734 62,440 89,667 229 2313 32 128 290 509 806 3,950 16,309 32,175 230 2317 447 1,705 2,423 4,211 5,364 10,088 12,584 15,053 231 2323 66 352 969 3,301 11,866 24,713 46,216 55,280 232 2324 71 284 602 931 1,309 6,247 11,489 24,350 233 2327 1 4 9 15 24 95 213 372 234 2328 20 79 167 296 481 7,564 15,017 146,077 235 2329 3 11 26 47 86 596 1,488 2,690 236 2330 6 26 61 166 415 16,476 29,719 31,494 237 2331 2,240 6,194 10,611 14,714 18,701 100,173 340,714 472,436 238 2334 50 199 556 1,198 2,088 8,747 22,360 38,337 239 2337 5 19 43 76 119 477 1,370 8,607 240 2340 1 3 7 13 20 81 186 337 241 2343 249 848 1,836 3,186 4,744 15,236 64,592 143,895 242 2344 7 41 73 118 177 749 1,862 3,292 243 3002 112 2,869 8,280 11,961 14,990 41,335 75,937 143,042 244 3003 121 444 1,018 1,855 3,099 12,789 46,814 89,075 245 3004 40 163 369 658 1,033 11,615 18,916 36,285 246 3005 76 461 1,379 2,616 3,923 41,706 65,034 77,136 247 3006 189 682 1,893 3,777 11,669 44,213 135,248 161,588 248 3007 170 788 2,531 7,859 15,941 78,955 220,130 344,549 249 3009 193 6,506 20,195 37,465 56,902 174,618 277,929 401,973 250 3010 717 2,136 3,774 6,513 11,137 36,186 62,535 112,992 251 3011 915 6,114 8,755 10,933 12,972 22,420 38,897 70,097 252 3012 225 1,105 4,013 6,569 8,445 22,566 37,942 61,583 253 3013 439 2,093 4,548 10,989 22,252 120,119 221,046 486,071 254 3014 30 159 778 1,427 2,060 12,436 20,369 30,691 255 3015 242 2,014 3,698 5,449 7,787 18,185 37,097 72,522 256 3016 10 41 92 164 258 1,596 4,623 9,036 257 3020 890 5,529 15,136 32,474 59,190 204,932 313,057 354,428 258 3023 6,545 24,628 36,686 58,548 100,617 637,844 1,228,931 1,667,439 259 3026 711 10,420 47,578 121,594 188,859 708,492 1,440,197 2,276,585 260 3027 2,550 15,302 27,907 39,546 46,978 80,246 126,327 172,891 261 3028 381 6,306 12,570 19,588 26,435 92,136 263,505 509,657 262 3029 524 3,232 13,238 30,434 44,307 89,526 122,989 164,020 263 3033 1 4 10 18 33 177 438 1,990 264 3034 24 283 765 2,682 6,005 11,507 12,771 14,187 265 3035 506 2,080 6,018 11,567 22,693 197,017 295,476 341,573 266 3036 438 1,827 2,438 3,118 4,917 27,551 45,458 98,748 267 3037 4,668 13,508 17,644 21,580 23,006 33,255 40,854 63,943 268 3039 8 31 63 102 149 518 2,668 42,351 269 3040 76 291 653 1,242 2,130 13,354 34,350 98,210 270 3042 6,817 37,829 83,190 148,298 228,116 698,433 999,860 1,038,104 271 3043 1,697 19,763 41,160 50,625 55,206 102,289 133,116 184,778 272 3044 4 14 32 57 88 328 4,499 4,888 273 3047 145 701 1,808 3,844 8,345 48,885 108,293 193,016
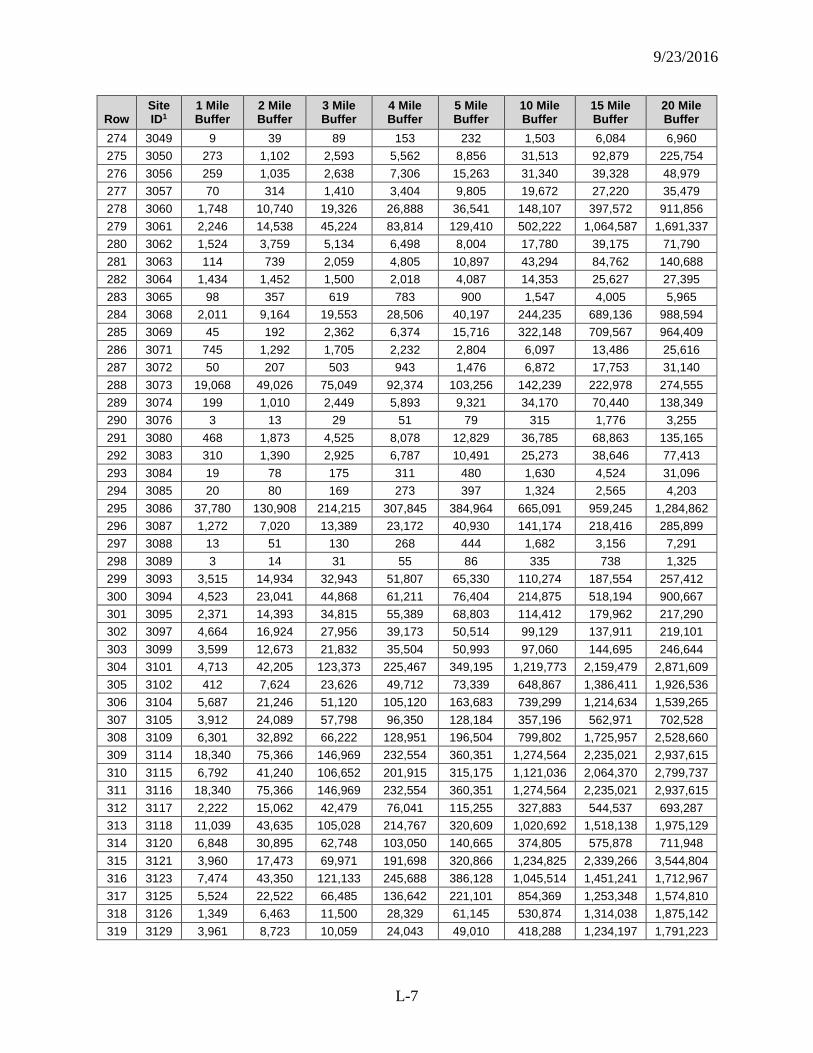
9/23/2016
L-7
Row Site ID1
1 Mile Buffer
2 Mile Buffer
3 Mile Buffer
4 Mile Buffer
5 Mile Buffer
10 Mile Buffer
15 Mile Buffer
20 Mile Buffer
274 3049 9 39 89 153 232 1,503 6,084 6,960 275 3050 273 1,102 2,593 5,562 8,856 31,513 92,879 225,754 276 3056 259 1,035 2,638 7,306 15,263 31,340 39,328 48,979 277 3057 70 314 1,410 3,404 9,805 19,672 27,220 35,479 278 3060 1,748 10,740 19,326 26,888 36,541 148,107 397,572 911,856 279 3061 2,246 14,538 45,224 83,814 129,410 502,222 1,064,587 1,691,337 280 3062 1,524 3,759 5,134 6,498 8,004 17,780 39,175 71,790 281 3063 114 739 2,059 4,805 10,897 43,294 84,762 140,688 282 3064 1,434 1,452 1,500 2,018 4,087 14,353 25,627 27,395 283 3065 98 357 619 783 900 1,547 4,005 5,965 284 3068 2,011 9,164 19,553 28,506 40,197 244,235 689,136 988,594 285 3069 45 192 2,362 6,374 15,716 322,148 709,567 964,409 286 3071 745 1,292 1,705 2,232 2,804 6,097 13,486 25,616 287 3072 50 207 503 943 1,476 6,872 17,753 31,140 288 3073 19,068 49,026 75,049 92,374 103,256 142,239 222,978 274,555 289 3074 199 1,010 2,449 5,893 9,321 34,170 70,440 138,349 290 3076 3 13 29 51 79 315 1,776 3,255 291 3080 468 1,873 4,525 8,078 12,829 36,785 68,863 135,165 292 3083 310 1,390 2,925 6,787 10,491 25,273 38,646 77,413 293 3084 19 78 175 311 480 1,630 4,524 31,096 294 3085 20 80 169 273 397 1,324 2,565 4,203 295 3086 37,780 130,908 214,215 307,845 384,964 665,091 959,245 1,284,862 296 3087 1,272 7,020 13,389 23,172 40,930 141,174 218,416 285,899 297 3088 13 51 130 268 444 1,682 3,156 7,291 298 3089 3 14 31 55 86 335 738 1,325 299 3093 3,515 14,934 32,943 51,807 65,330 110,274 187,554 257,412 300 3094 4,523 23,041 44,868 61,211 76,404 214,875 518,194 900,667 301 3095 2,371 14,393 34,815 55,389 68,803 114,412 179,962 217,290 302 3097 4,664 16,924 27,956 39,173 50,514 99,129 137,911 219,101 303 3099 3,599 12,673 21,832 35,504 50,993 97,060 144,695 246,644 304 3101 4,713 42,205 123,373 225,467 349,195 1,219,773 2,159,479 2,871,609 305 3102 412 7,624 23,626 49,712 73,339 648,867 1,386,411 1,926,536 306 3104 5,687 21,246 51,120 105,120 163,683 739,299 1,214,634 1,539,265 307 3105 3,912 24,089 57,798 96,350 128,184 357,196 562,971 702,528 308 3109 6,301 32,892 66,222 128,951 196,504 799,802 1,725,957 2,528,660 309 3114 18,340 75,366 146,969 232,554 360,351 1,274,564 2,235,021 2,937,615 310 3115 6,792 41,240 106,652 201,915 315,175 1,121,036 2,064,370 2,799,737 311 3116 18,340 75,366 146,969 232,554 360,351 1,274,564 2,235,021 2,937,615 312 3117 2,222 15,062 42,479 76,041 115,255 327,883 544,537 693,287 313 3118 11,039 43,635 105,028 214,767 320,609 1,020,692 1,518,138 1,975,129 314 3120 6,848 30,895 62,748 103,050 140,665 374,805 575,878 711,948 315 3121 3,960 17,473 69,971 191,698 320,866 1,234,825 2,339,266 3,544,804 316 3123 7,474 43,350 121,133 245,688 386,128 1,045,514 1,451,241 1,712,967 317 3125 5,524 22,522 66,485 136,642 221,101 854,369 1,253,348 1,574,810 318 3126 1,349 6,463 11,500 28,329 61,145 530,874 1,314,038 1,875,142 319 3129 3,961 8,723 10,059 24,043 49,010 418,288 1,234,197 1,791,223
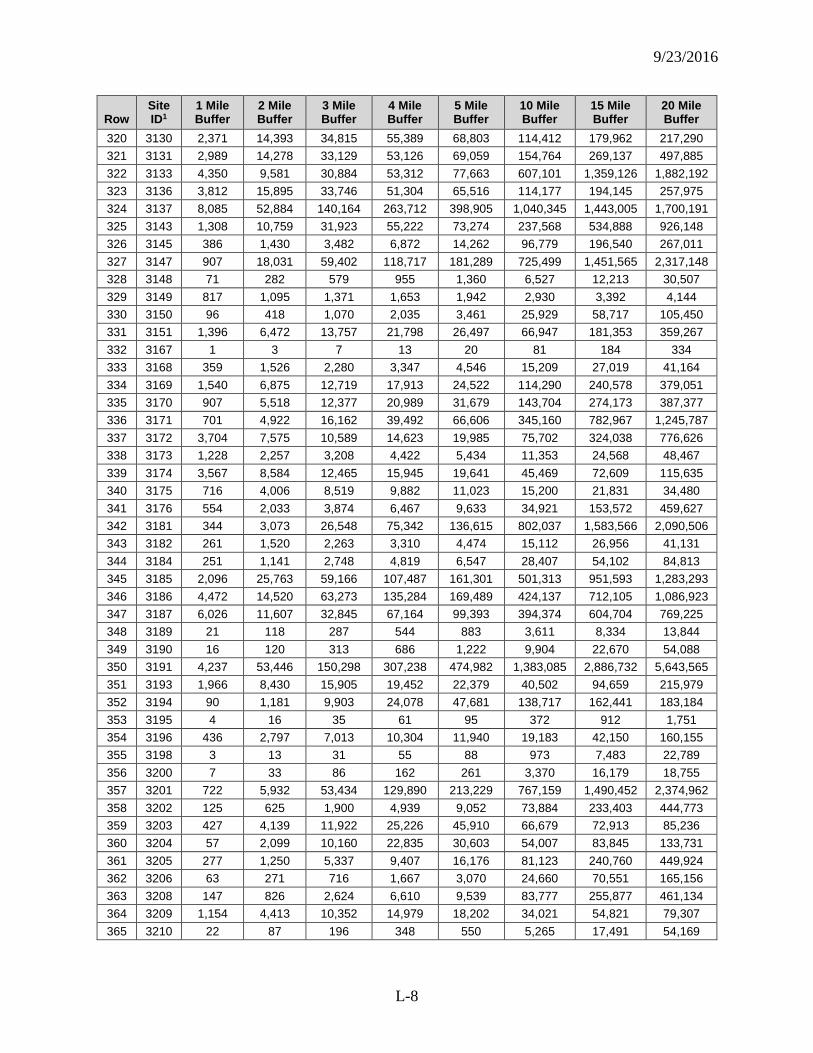
9/23/2016
L-8
Row Site ID1
1 Mile Buffer
2 Mile Buffer
3 Mile Buffer
4 Mile Buffer
5 Mile Buffer
10 Mile Buffer
15 Mile Buffer
20 Mile Buffer
320 3130 2,371 14,393 34,815 55,389 68,803 114,412 179,962 217,290 321 3131 2,989 14,278 33,129 53,126 69,059 154,764 269,137 497,885 322 3133 4,350 9,581 30,884 53,312 77,663 607,101 1,359,126 1,882,192 323 3136 3,812 15,895 33,746 51,304 65,516 114,177 194,145 257,975 324 3137 8,085 52,884 140,164 263,712 398,905 1,040,345 1,443,005 1,700,191 325 3143 1,308 10,759 31,923 55,222 73,274 237,568 534,888 926,148 326 3145 386 1,430 3,482 6,872 14,262 96,779 196,540 267,011 327 3147 907 18,031 59,402 118,717 181,289 725,499 1,451,565 2,317,148 328 3148 71 282 579 955 1,360 6,527 12,213 30,507 329 3149 817 1,095 1,371 1,653 1,942 2,930 3,392 4,144 330 3150 96 418 1,070 2,035 3,461 25,929 58,717 105,450 331 3151 1,396 6,472 13,757 21,798 26,497 66,947 181,353 359,267 332 3167 1 3 7 13 20 81 184 334 333 3168 359 1,526 2,280 3,347 4,546 15,209 27,019 41,164 334 3169 1,540 6,875 12,719 17,913 24,522 114,290 240,578 379,051 335 3170 907 5,518 12,377 20,989 31,679 143,704 274,173 387,377 336 3171 701 4,922 16,162 39,492 66,606 345,160 782,967 1,245,787 337 3172 3,704 7,575 10,589 14,623 19,985 75,702 324,038 776,626 338 3173 1,228 2,257 3,208 4,422 5,434 11,353 24,568 48,467 339 3174 3,567 8,584 12,465 15,945 19,641 45,469 72,609 115,635 340 3175 716 4,006 8,519 9,882 11,023 15,200 21,831 34,480 341 3176 554 2,033 3,874 6,467 9,633 34,921 153,572 459,627 342 3181 344 3,073 26,548 75,342 136,615 802,037 1,583,566 2,090,506 343 3182 261 1,520 2,263 3,310 4,474 15,112 26,956 41,131 344 3184 251 1,141 2,748 4,819 6,547 28,407 54,102 84,813 345 3185 2,096 25,763 59,166 107,487 161,301 501,313 951,593 1,283,293 346 3186 4,472 14,520 63,273 135,284 169,489 424,137 712,105 1,086,923 347 3187 6,026 11,607 32,845 67,164 99,393 394,374 604,704 769,225 348 3189 21 118 287 544 883 3,611 8,334 13,844 349 3190 16 120 313 686 1,222 9,904 22,670 54,088 350 3191 4,237 53,446 150,298 307,238 474,982 1,383,085 2,886,732 5,643,565 351 3193 1,966 8,430 15,905 19,452 22,379 40,502 94,659 215,979 352 3194 90 1,181 9,903 24,078 47,681 138,717 162,441 183,184 353 3195 4 16 35 61 95 372 912 1,751 354 3196 436 2,797 7,013 10,304 11,940 19,183 42,150 160,155 355 3198 3 13 31 55 88 973 7,483 22,789 356 3200 7 33 86 162 261 3,370 16,179 18,755 357 3201 722 5,932 53,434 129,890 213,229 767,159 1,490,452 2,374,962 358 3202 125 625 1,900 4,939 9,052 73,884 233,403 444,773 359 3203 427 4,139 11,922 25,226 45,910 66,679 72,913 85,236 360 3204 57 2,099 10,160 22,835 30,603 54,007 83,845 133,731 361 3205 277 1,250 5,337 9,407 16,176 81,123 240,760 449,924 362 3206 63 271 716 1,667 3,070 24,660 70,551 165,156 363 3208 147 826 2,624 6,610 9,539 83,777 255,877 461,134 364 3209 1,154 4,413 10,352 14,979 18,202 34,021 54,821 79,307 365 3210 22 87 196 348 550 5,265 17,491 54,169
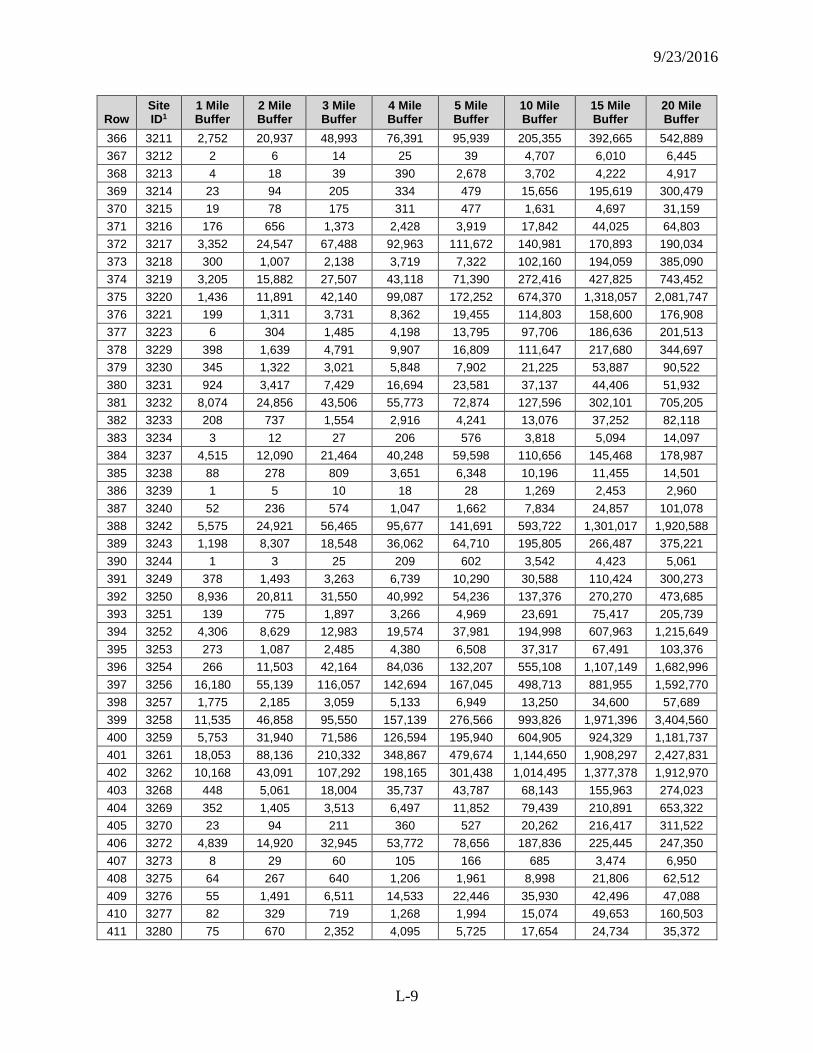
9/23/2016
L-9
Row Site ID1
1 Mile Buffer
2 Mile Buffer
3 Mile Buffer
4 Mile Buffer
5 Mile Buffer
10 Mile Buffer
15 Mile Buffer
20 Mile Buffer
366 3211 2,752 20,937 48,993 76,391 95,939 205,355 392,665 542,889 367 3212 2 6 14 25 39 4,707 6,010 6,445 368 3213 4 18 39 390 2,678 3,702 4,222 4,917 369 3214 23 94 205 334 479 15,656 195,619 300,479 370 3215 19 78 175 311 477 1,631 4,697 31,159 371 3216 176 656 1,373 2,428 3,919 17,842 44,025 64,803 372 3217 3,352 24,547 67,488 92,963 111,672 140,981 170,893 190,034 373 3218 300 1,007 2,138 3,719 7,322 102,160 194,059 385,090 374 3219 3,205 15,882 27,507 43,118 71,390 272,416 427,825 743,452 375 3220 1,436 11,891 42,140 99,087 172,252 674,370 1,318,057 2,081,747 376 3221 199 1,311 3,731 8,362 19,455 114,803 158,600 176,908 377 3223 6 304 1,485 4,198 13,795 97,706 186,636 201,513 378 3229 398 1,639 4,791 9,907 16,809 111,647 217,680 344,697 379 3230 345 1,322 3,021 5,848 7,902 21,225 53,887 90,522 380 3231 924 3,417 7,429 16,694 23,581 37,137 44,406 51,932 381 3232 8,074 24,856 43,506 55,773 72,874 127,596 302,101 705,205 382 3233 208 737 1,554 2,916 4,241 13,076 37,252 82,118 383 3234 3 12 27 206 576 3,818 5,094 14,097 384 3237 4,515 12,090 21,464 40,248 59,598 110,656 145,468 178,987 385 3238 88 278 809 3,651 6,348 10,196 11,455 14,501 386 3239 1 5 10 18 28 1,269 2,453 2,960 387 3240 52 236 574 1,047 1,662 7,834 24,857 101,078 388 3242 5,575 24,921 56,465 95,677 141,691 593,722 1,301,017 1,920,588 389 3243 1,198 8,307 18,548 36,062 64,710 195,805 266,487 375,221 390 3244 1 3 25 209 602 3,542 4,423 5,061 391 3249 378 1,493 3,263 6,739 10,290 30,588 110,424 300,273 392 3250 8,936 20,811 31,550 40,992 54,236 137,376 270,270 473,685 393 3251 139 775 1,897 3,266 4,969 23,691 75,417 205,739 394 3252 4,306 8,629 12,983 19,574 37,981 194,998 607,963 1,215,649 395 3253 273 1,087 2,485 4,380 6,508 37,317 67,491 103,376 396 3254 266 11,503 42,164 84,036 132,207 555,108 1,107,149 1,682,996 397 3256 16,180 55,139 116,057 142,694 167,045 498,713 881,955 1,592,770 398 3257 1,775 2,185 3,059 5,133 6,949 13,250 34,600 57,689 399 3258 11,535 46,858 95,550 157,139 276,566 993,826 1,971,396 3,404,560 400 3259 5,753 31,940 71,586 126,594 195,940 604,905 924,329 1,181,737 401 3261 18,053 88,136 210,332 348,867 479,674 1,144,650 1,908,297 2,427,831 402 3262 10,168 43,091 107,292 198,165 301,438 1,014,495 1,377,378 1,912,970 403 3268 448 5,061 18,004 35,737 43,787 68,143 155,963 274,023 404 3269 352 1,405 3,513 6,497 11,852 79,439 210,891 653,322 405 3270 23 94 211 360 527 20,262 216,417 311,522 406 3272 4,839 14,920 32,945 53,772 78,656 187,836 225,445 247,350 407 3273 8 29 60 105 166 685 3,474 6,950 408 3275 64 267 640 1,206 1,961 8,998 21,806 62,512 409 3276 55 1,491 6,511 14,533 22,446 35,930 42,496 47,088 410 3277 82 329 719 1,268 1,994 15,074 49,653 160,503 411 3280 75 670 2,352 4,095 5,725 17,654 24,734 35,372
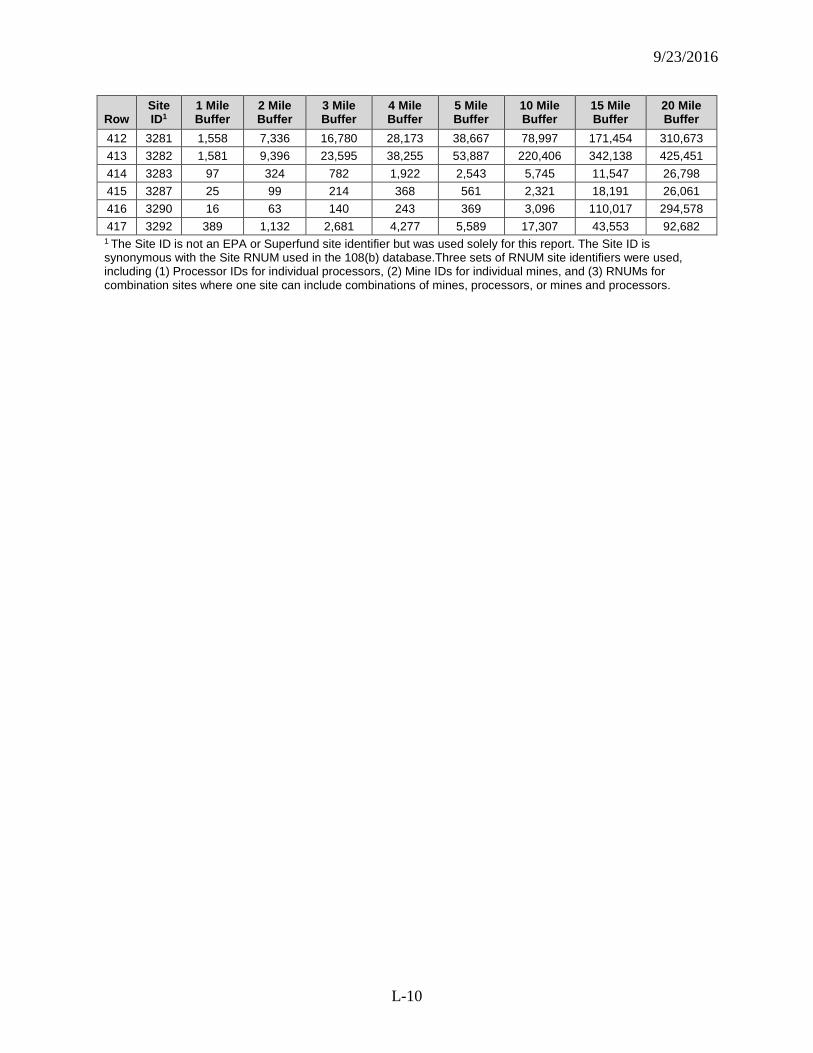
9/23/2016
L-10
Row Site ID1
1 Mile Buffer
2 Mile Buffer
3 Mile Buffer
4 Mile Buffer
5 Mile Buffer
10 Mile Buffer
15 Mile Buffer
20 Mile Buffer
412 3281 1,558 7,336 16,780 28,173 38,667 78,997 171,454 310,673 413 3282 1,581 9,396 23,595 38,255 53,887 220,406 342,138 425,451 414 3283 97 324 782 1,922 2,543 5,745 11,547 26,798 415 3287 25 99 214 368 561 2,321 18,191 26,061 416 3290 16 63 140 243 369 3,096 110,017 294,578 417 3292 389 1,132 2,681 4,277 5,589 17,307 43,553 92,682
1 The Site ID is not an EPA or Superfund site identifier but was used solely for this report. The Site ID is synonymous with the Site RNUM used in the 108(b) database.Three sets of RNUM site identifiers were used, including (1) Processor IDs for individual processors, (2) Mine IDs for individual mines, and (3) RNUMs for combination sites where one site can include combinations of mines, processors, or mines and processors.
9/23/2016
M-1
Appendix M ATSDR Public Health Findings for 108(b) Historical CERCLA
Sites
M.1 Introduction Because little information is available on currently active mining and mineral processing
sites, this section will use public health-related information associated with 108(b) Historical CERCLA sites to illustrate that the 2009 Current sites might pose adverse health effects.
M.2 Data Sources Public health-related information was obtained from the Agency for Toxic Substances
and Disease Registry (ATSDR) for historical mining and mineral processing sites that would fit into the scope of the 108(b) mining and mineral processing sector. Created by the 1980 CERCLA statute, ATSDR is mandated to conduct Public Health Assessment (PHA) for every site on or proposed for the NPL. The documentation of ATSDR Public Health Assessments began about 1986-87. An ATSDR Public Health Assessment reviews available information about hazardous substances at a site and evaluates if exposure to them might adversely affect human health.
Upon request from concerned citizens and/or organizations, ATSDR also conducts and issues other types of public health evaluations. For example, a Public Health Advisory (PHA) allows ATSDR to respond quickly when CERCLA hazardous substances released into the environment pose an immediate and significant danger to human health. A PHA notice is sent directly from the ATSDR Administrator to EPA's Administrator, which alerts EPA to a public health threat. A PHA reports information available about a release of toxic material, if people might be exposed to it, and what harm exposure might cause. A Health Consultation (HC) provides advice on a specific public health issue related to actual or potential human exposure to a toxic material. Anyone can request a HC. ATSDR receives the most requests from EPA and state and local health and environmental departments, and provides about 1,000 HCs per year.
Upon completion of a PHA or a HC for a site, ATSDR makes a public health determination using the following five public health hazard categories:1
1. Urgent Public Health Hazard
Applies to sites that have certain physical hazards or evidence of short-term (less than 1 year), site-related exposure to hazardous substances that could result in adverse health effects and require quick intervention to stop people from being exposed.
1 SOURCE: ATSDR Public Health Assessment Guidance Manual, Table 9-1 (“Summary of Conclusion Categories”), available at http://www.atsdr.cdc.gov/HAC/PHAManual/ch9.html.

9/23/2016
M-2
2. Public Health Hazard
Applies to sites that have certain physical hazards or evidence of chronic (more than 1 year), site-related exposure to hazardous substances that could result in adverse health effects.
3. Indeterminate Public Health Hazard
Applies to sites where critical information is lacking (missing or has not yet been gathered) to support a judgment regarding the level of public health hazard.
4. No Apparent Public Health Hazard
Applies to sites where exposure to site-related chemicals might have occurred in the past or is still occurring, but the exposures are not at levels likely to cause adverse health effects.
5. No Public Health Hazard
Applies to sites where no exposure to site-related hazardous substances exists.
M.3 Methodology for ATSDR Public Health Finding Analysis of 108(b) Historical CERCLA Sites
M.3.1 Initial Inquiry to ATSDR In order to access the ATSDR public health determinations related to the historical
mining and mineral processing site, EPA requested that ATSDR conduct a query of its HazDat and Sequoia databases for any findings by ATSDR that a site may have posed a public health hazard to humans. Specifically, the EPA asked ATSDR to query using the following criteria:
a) Any PHAs or HCs that concluded either a public health hazard or an urgent public health hazard, or
b) A public health advisory was issued.
On April 12, 2010, ATSDR responded to EPA with the query results, including 1,317 records having either a public health hazard or urgent public health hazard associated with them. The results included mines and mineral processors as well as other sectors. The results were sorted manually to find ATSDR findings for the 251 sites in the 108(b) Historical Sites universe. Attachment M1 lists the 108(b) Historical CERCLA sites that ATSDR classified as a public health hazard or an urgent public health hazard.
M.3.2 Additional Inquiry for Missing NPL Sites A comparison of ATSDR’s April, 2010 query results (as listed in Attachment M1) to the
universe of 108(b) Historical CERCLA sites (as listed in Appendix B, Attachment B1) identified 59 NPL sites from the 108(b) Historical CERCLA Sites universe that were not included in ATSDR’s April 2010 query results.
9/23/2016
M-3
EPA conducted a web search of ATSDR’s website to find any information on these 108(b) Historical NPL sites. EPA also requested that ATSDR query their databases specifically for information on the 59 missing 108(b) Historical NPL sites. In this second query ATSDR used EPA’s site identification number for each 108(b) Historical NPL site. EPA recieved the query results on September 2, 2010. Attachment M2 lists the 108(b) Historical NPL sites missing from the April 2010 query results, as well as the results from EPA’s web search and ATSDR’s September 2010 query. The additional inquiry identified ATSDR public health findings for an additional 44 sites.
The two inquiries (i.e., ATSDR’s April 2010 and September 2010 database queries, and EPA’s web search) identified ATSDR public health findings for a total of 115 sites in the 108(b) Historical CERCLA Sites universe.
M.3.3 ATSDR Public Health Findings for Historical Case Study Sites
In addition to the public health hazard findings information received from ATSDR, available ATSDR documents (i.e. PHAs and HCs) for the subset of randomly selected 24 Case Study sites were closely reviewed. Attachment M3 includes more detailed information about each site from ATSDR reports, including information about contaminants of concern, exposure pathways, potential receptors and potential health effects.
M.3.4 Additional Mining and Mineral Processing Sites from ATSDR Databases (HazDat and Sequoia)
Further examination of the ATSDR’s April 2010 query results identified nine additional mining and mineral processing sites that were not included in, but may qualify for, the 108(b) Historical CERCLA Sites universe. These nine sites were identified based on the North America Industrial Classification System (NAICS) code for the mining and processing sector. These additional sites were included in this analysis to illustrate that mining and mineral processing sites that are not listed as NPL sites may also present a public health hazard. Table M-1 shows the nine additional sites from April 2010 query and the corresponding ATSDR findings. To further investigate the relevance of these sites to 108(b) rule making, available ATSDR (e.g., PHAs and HC) and EPA documents were reviewed and findings were summarized in Attachment M4.
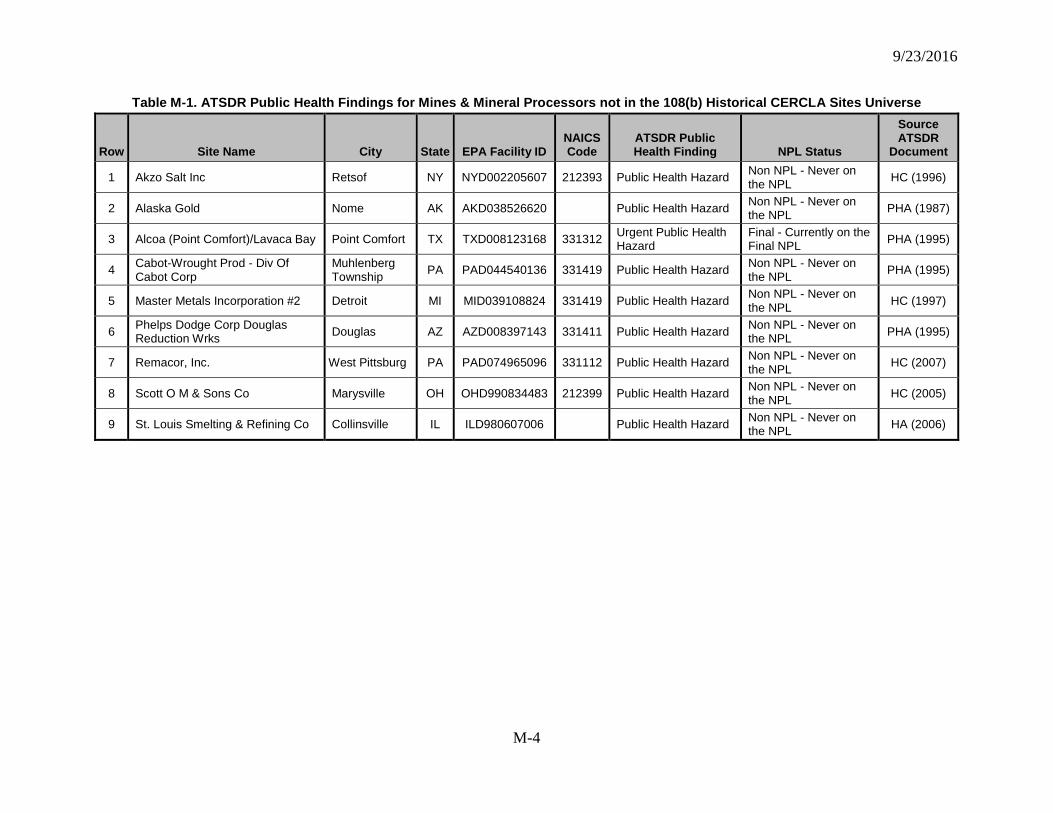
9/23/2016
M-4
Table M-1. ATSDR Public Health Findings for Mines & Mineral Processors not in the 108(b) Historical CERCLA Sites Universe
Row Site Name City State EPA Facility ID NAICS Code
ATSDR Public Health Finding NPL Status
Source ATSDR
Document
1 Akzo Salt Inc Retsof NY NYD002205607 212393 Public Health Hazard Non NPL - Never on the NPL HC (1996)
2 Alaska Gold Nome AK AKD038526620 Public Health Hazard Non NPL - Never on the NPL PHA (1987)
3 Alcoa (Point Comfort)/Lavaca Bay Point Comfort TX TXD008123168 331312 Urgent Public Health Hazard
Final - Currently on the Final NPL PHA (1995)
4 Cabot-Wrought Prod - Div Of Cabot Corp
Muhlenberg Township PA PAD044540136 331419 Public Health Hazard Non NPL - Never on
the NPL PHA (1995)
5 Master Metals Incorporation #2 Detroit MI MID039108824 331419 Public Health Hazard Non NPL - Never on the NPL HC (1997)
6 Phelps Dodge Corp Douglas Reduction Wrks Douglas AZ AZD008397143 331411 Public Health Hazard Non NPL - Never on
the NPL PHA (1995)
7 Remacor, Inc. West Pittsburg PA PAD074965096 331112 Public Health Hazard Non NPL - Never on the NPL HC (2007)
8 Scott O M & Sons Co Marysville OH OHD990834483 212399 Public Health Hazard Non NPL - Never on the NPL HC (2005)
9 St. Louis Smelting & Refining Co Collinsville IL ILD980607006 Public Health Hazard Non NPL - Never on the NPL HA (2006)
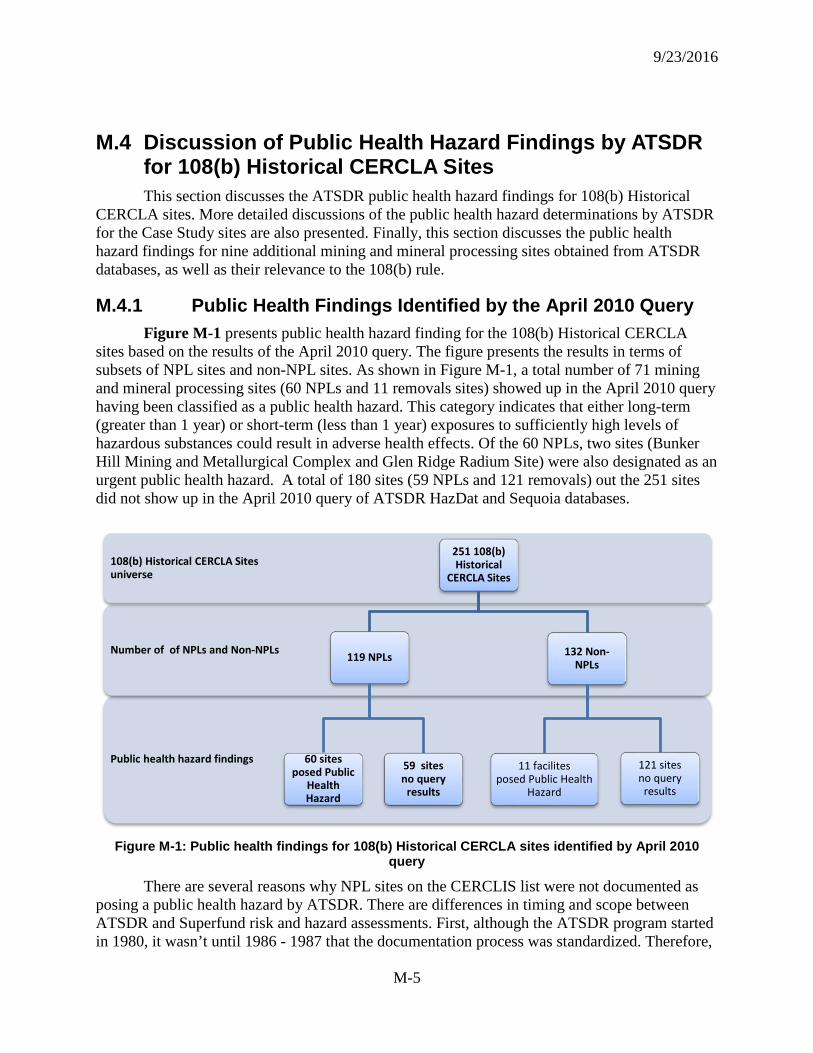
9/23/2016
M-5
M.4 Discussion of Public Health Hazard Findings by ATSDR for 108(b) Historical CERCLA Sites This section discusses the ATSDR public health hazard findings for 108(b) Historical
CERCLA sites. More detailed discussions of the public health hazard determinations by ATSDR for the Case Study sites are also presented. Finally, this section discusses the public health hazard findings for nine additional mining and mineral processing sites obtained from ATSDR databases, as well as their relevance to the 108(b) rule.
M.4.1 Public Health Findings Identified by the April 2010 Query Figure M-1 presents public health hazard finding for the 108(b) Historical CERCLA
sites based on the results of the April 2010 query. The figure presents the results in terms of subsets of NPL sites and non-NPL sites. As shown in Figure M-1, a total number of 71 mining and mineral processing sites (60 NPLs and 11 removals sites) showed up in the April 2010 query having been classified as a public health hazard. This category indicates that either long-term (greater than 1 year) or short-term (less than 1 year) exposures to sufficiently high levels of hazardous substances could result in adverse health effects. Of the 60 NPLs, two sites (Bunker Hill Mining and Metallurgical Complex and Glen Ridge Radium Site) were also designated as an urgent public health hazard. A total of 180 sites (59 NPLs and 121 removals) out the 251 sites did not show up in the April 2010 query of ATSDR HazDat and Sequoia databases.
Figure M-1: Public health findings for 108(b) Historical CERCLA sites identified by April 2010 query
There are several reasons why NPL sites on the CERCLIS list were not documented as posing a public health hazard by ATSDR. There are differences in timing and scope between ATSDR and Superfund risk and hazard assessments. First, although the ATSDR program started in 1980, it wasn’t until 1986 - 1987 that the documentation process was standardized. Therefore,
Public health hazard findings
Number of of NPLs and Non-NPLs
108(b) Historical CERCLA Sites universe
251 108(b) Historical
CERCLA Sites
119 NPLs
60 sites posed Public
Health Hazard
59 sites no query
results
132 Non-NPLs
11 facilites posed Public Health
Hazard
121 sites no query
results
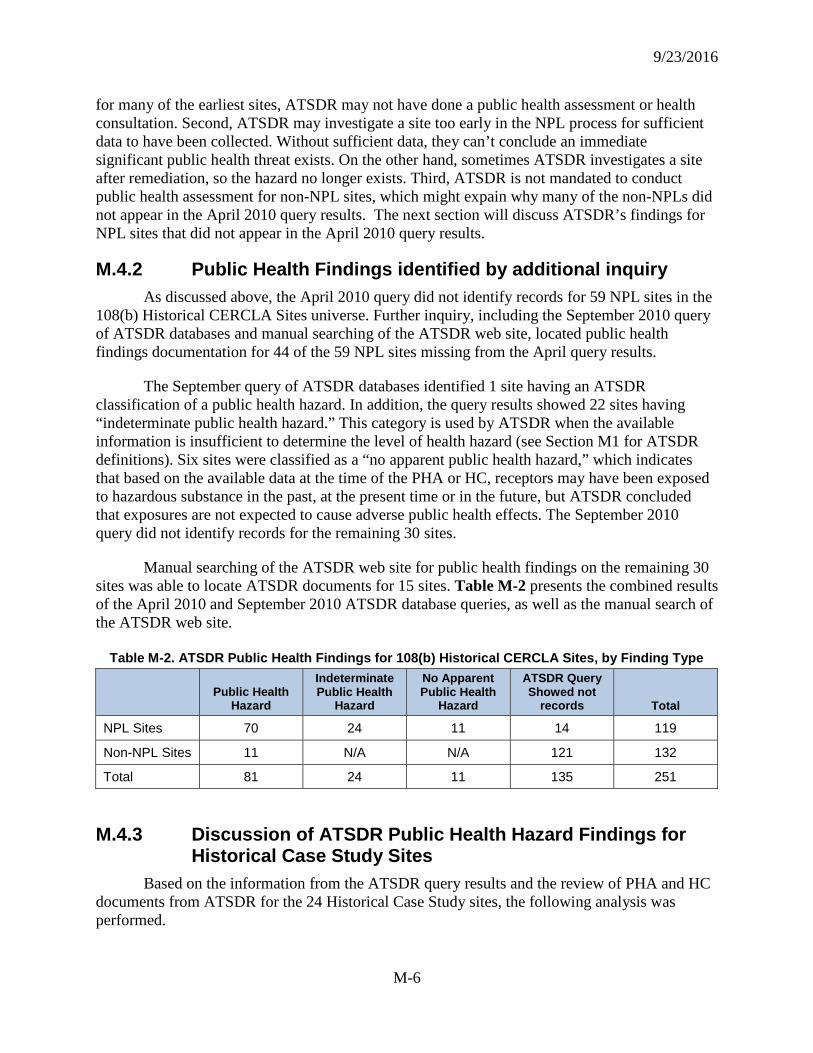
9/23/2016
M-6
for many of the earliest sites, ATSDR may not have done a public health assessment or health consultation. Second, ATSDR may investigate a site too early in the NPL process for sufficient data to have been collected. Without sufficient data, they can’t conclude an immediate significant public health threat exists. On the other hand, sometimes ATSDR investigates a site after remediation, so the hazard no longer exists. Third, ATSDR is not mandated to conduct public health assessment for non-NPL sites, which might expain why many of the non-NPLs did not appear in the April 2010 query results. The next section will discuss ATSDR’s findings for NPL sites that did not appear in the April 2010 query results.
M.4.2 Public Health Findings identified by additional inquiry As discussed above, the April 2010 query did not identify records for 59 NPL sites in the
108(b) Historical CERCLA Sites universe. Further inquiry, including the September 2010 query of ATSDR databases and manual searching of the ATSDR web site, located public health findings documentation for 44 of the 59 NPL sites missing from the April query results.
The September query of ATSDR databases identified 1 site having an ATSDR classification of a public health hazard. In addition, the query results showed 22 sites having “indeterminate public health hazard.” This category is used by ATSDR when the available information is insufficient to determine the level of health hazard (see Section M1 for ATSDR definitions). Six sites were classified as a “no apparent public health hazard,” which indicates that based on the available data at the time of the PHA or HC, receptors may have been exposed to hazardous substance in the past, at the present time or in the future, but ATSDR concluded that exposures are not expected to cause adverse public health effects. The September 2010 query did not identify records for the remaining 30 sites.
Manual searching of the ATSDR web site for public health findings on the remaining 30 sites was able to locate ATSDR documents for 15 sites. Table M-2 presents the combined results of the April 2010 and September 2010 ATSDR database queries, as well as the manual search of the ATSDR web site.
Table M-2. ATSDR Public Health Findings for 108(b) Historical CERCLA Sites, by Finding Type
Public Health
Hazard
Indeterminate Public Health
Hazard
No Apparent Public Health
Hazard
ATSDR Query Showed not
records Total
NPL Sites 70 24 11 14 119
Non-NPL Sites 11 N/A N/A 121 132
Total 81 24 11 135 251
M.4.3 Discussion of ATSDR Public Health Hazard Findings for Historical Case Study Sites
Based on the information from the ATSDR query results and the review of PHA and HC documents from ATSDR for the 24 Historical Case Study sites, the following analysis was performed.
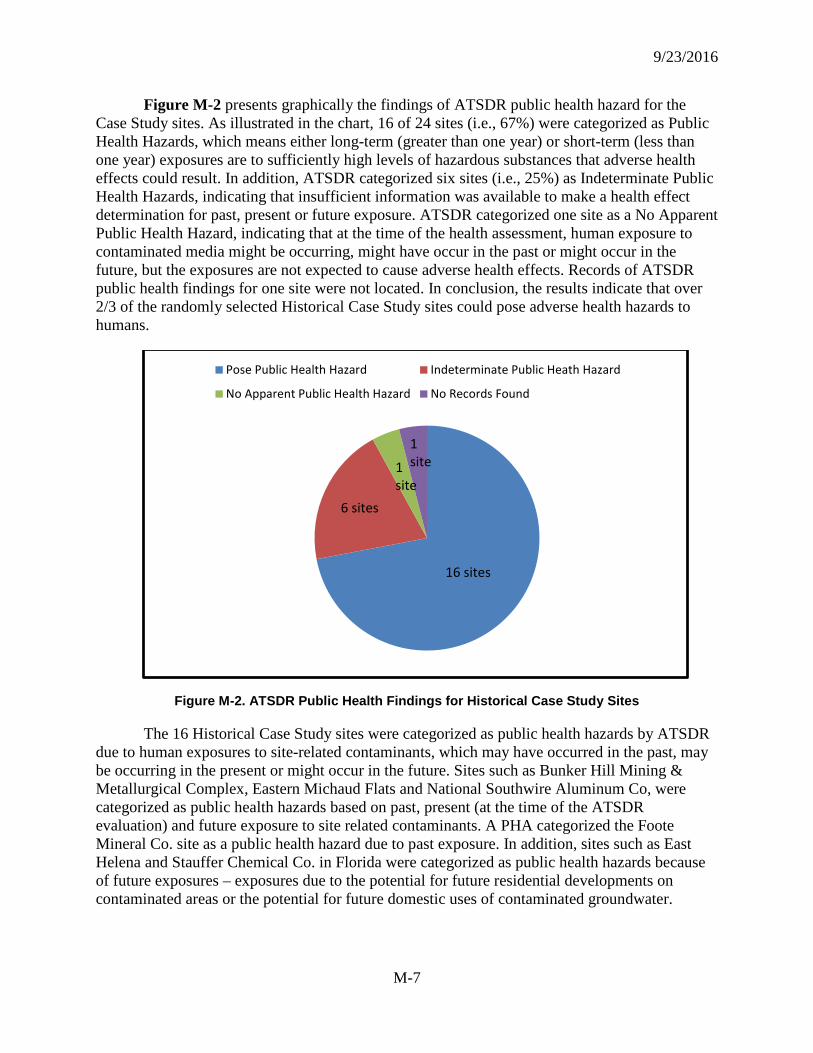
9/23/2016
M-7
Figure M-2 presents graphically the findings of ATSDR public health hazard for the Case Study sites. As illustrated in the chart, 16 of 24 sites (i.e., 67%) were categorized as Public Health Hazards, which means either long-term (greater than one year) or short-term (less than one year) exposures are to sufficiently high levels of hazardous substances that adverse health effects could result. In addition, ATSDR categorized six sites (i.e., 25%) as Indeterminate Public Health Hazards, indicating that insufficient information was available to make a health effect determination for past, present or future exposure. ATSDR categorized one site as a No Apparent Public Health Hazard, indicating that at the time of the health assessment, human exposure to contaminated media might be occurring, might have occur in the past or might occur in the future, but the exposures are not expected to cause adverse health effects. Records of ATSDR public health findings for one site were not located. In conclusion, the results indicate that over 2/3 of the randomly selected Historical Case Study sites could pose adverse health hazards to humans.
Figure M-2. ATSDR Public Health Findings for Historical Case Study Sites
The 16 Historical Case Study sites were categorized as public health hazards by ATSDR due to human exposures to site-related contaminants, which may have occurred in the past, may be occurring in the present or might occur in the future. Sites such as Bunker Hill Mining & Metallurgical Complex, Eastern Michaud Flats and National Southwire Aluminum Co, were categorized as public health hazards based on past, present (at the time of the ATSDR evaluation) and future exposure to site related contaminants. A PHA categorized the Foote Mineral Co. site as a public health hazard due to past exposure. In addition, sites such as East Helena and Stauffer Chemical Co. in Florida were categorized as public health hazards because of future exposures – exposures due to the potential for future residential developments on contaminated areas or the potential for future domestic uses of contaminated groundwater.
Pose Public Health Hazard Indeterminate Public Heath Hazard
No Apparent Public Health Hazard No Records Found
16 sites
6 sites
1site
1site
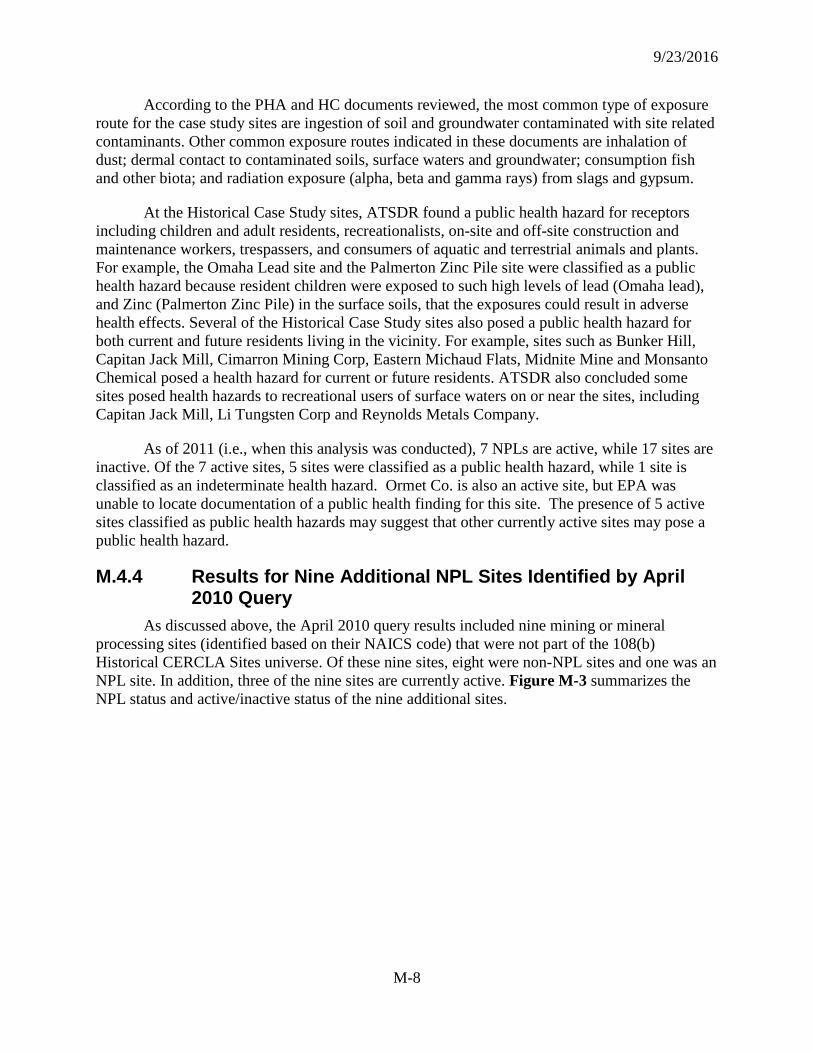
9/23/2016
M-8
According to the PHA and HC documents reviewed, the most common type of exposure route for the case study sites are ingestion of soil and groundwater contaminated with site related contaminants. Other common exposure routes indicated in these documents are inhalation of dust; dermal contact to contaminated soils, surface waters and groundwater; consumption fish and other biota; and radiation exposure (alpha, beta and gamma rays) from slags and gypsum.
At the Historical Case Study sites, ATSDR found a public health hazard for receptors including children and adult residents, recreationalists, on-site and off-site construction and maintenance workers, trespassers, and consumers of aquatic and terrestrial animals and plants. For example, the Omaha Lead site and the Palmerton Zinc Pile site were classified as a public health hazard because resident children were exposed to such high levels of lead (Omaha lead), and Zinc (Palmerton Zinc Pile) in the surface soils, that the exposures could result in adverse health effects. Several of the Historical Case Study sites also posed a public health hazard for both current and future residents living in the vicinity. For example, sites such as Bunker Hill, Capitan Jack Mill, Cimarron Mining Corp, Eastern Michaud Flats, Midnite Mine and Monsanto Chemical posed a health hazard for current or future residents. ATSDR also concluded some sites posed health hazards to recreational users of surface waters on or near the sites, including Capitan Jack Mill, Li Tungsten Corp and Reynolds Metals Company.
As of 2011 (i.e., when this analysis was conducted), 7 NPLs are active, while 17 sites are inactive. Of the 7 active sites, 5 sites were classified as a public health hazard, while 1 site is classified as an indeterminate health hazard. Ormet Co. is also an active site, but EPA was unable to locate documentation of a public health finding for this site. The presence of 5 active sites classified as public health hazards may suggest that other currently active sites may pose a public health hazard.
M.4.4 Results for Nine Additional NPL Sites Identified by April 2010 Query
As discussed above, the April 2010 query results included nine mining or mineral processing sites (identified based on their NAICS code) that were not part of the 108(b) Historical CERCLA Sites universe. Of these nine sites, eight were non-NPL sites and one was an NPL site. In addition, three of the nine sites are currently active. Figure M-3 summarizes the NPL status and active/inactive status of the nine additional sites.
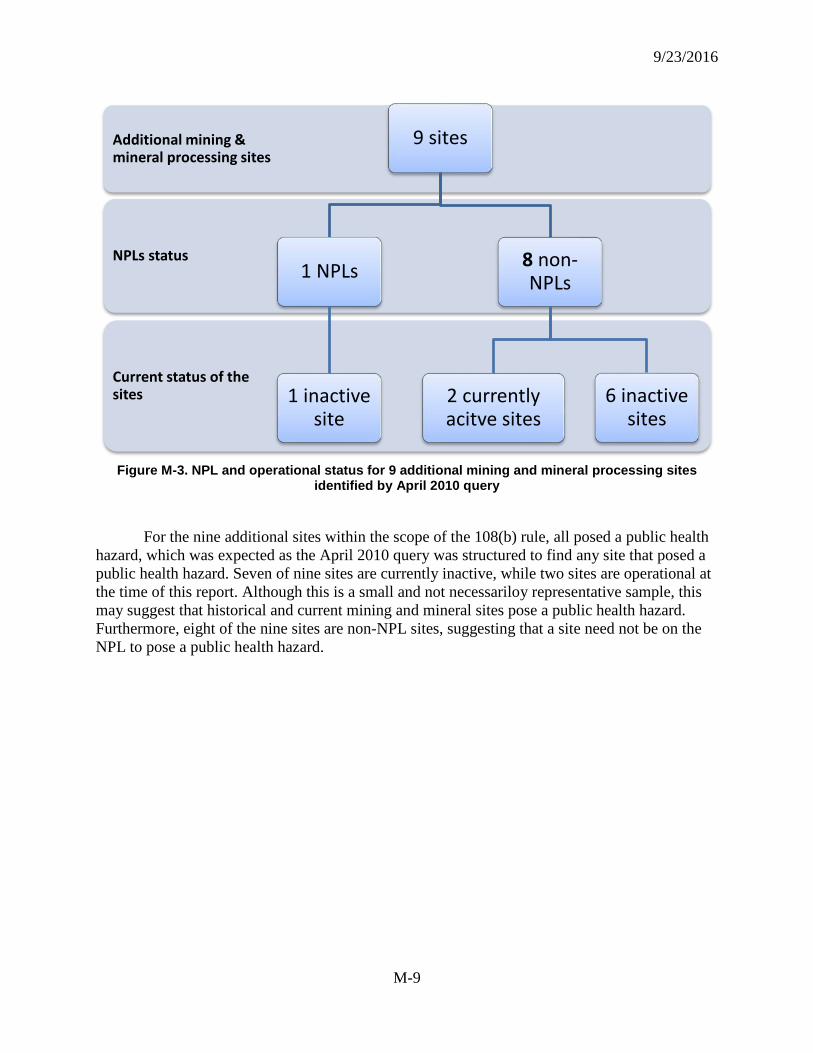
9/23/2016
M-9
Figure M-3. NPL and operational status for 9 additional mining and mineral processing sites identified by April 2010 query
For the nine additional sites within the scope of the 108(b) rule, all posed a public health hazard, which was expected as the April 2010 query was structured to find any site that posed a public health hazard. Seven of nine sites are currently inactive, while two sites are operational at the time of this report. Although this is a small and not necessariloy representative sample, this may suggest that historical and current mining and mineral sites pose a public health hazard. Furthermore, eight of the nine sites are non-NPL sites, suggesting that a site need not be on the NPL to pose a public health hazard.
Current status of the sites
NPLs status
Additional mining & mineral processing sites
9 sites
1 NPLs
1 inactive site
8 non-NPLs
2 currently acitve sites
6 inactive sites
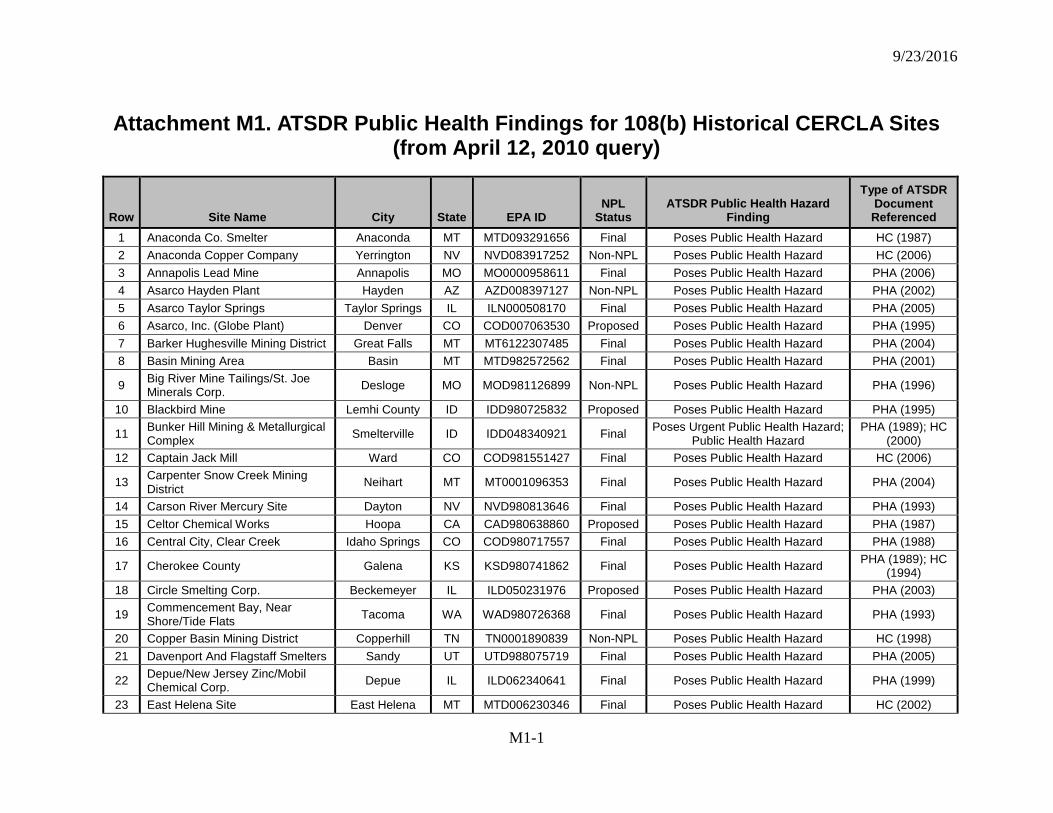
9/23/2016
M1-1
Attachment M1. ATSDR Public Health Findings for 108(b) Historical CERCLA Sites (from April 12, 2010 query)
Row Site Name City State EPA ID
NPL
Status ATSDR Public Health Hazard
Finding
Type of ATSDR Document Referenced
1 Anaconda Co. Smelter Anaconda MT MTD093291656 Final Poses Public Health Hazard HC (1987) 2 Anaconda Copper Company Yerrington NV NVD083917252 Non-NPL Poses Public Health Hazard HC (2006) 3 Annapolis Lead Mine Annapolis MO MO0000958611 Final Poses Public Health Hazard PHA (2006) 4 Asarco Hayden Plant Hayden AZ AZD008397127 Non-NPL Poses Public Health Hazard PHA (2002) 5 Asarco Taylor Springs Taylor Springs IL ILN000508170 Final Poses Public Health Hazard PHA (2005) 6 Asarco, Inc. (Globe Plant) Denver CO COD007063530 Proposed Poses Public Health Hazard PHA (1995) 7 Barker Hughesville Mining District Great Falls MT MT6122307485 Final Poses Public Health Hazard PHA (2004) 8 Basin Mining Area Basin MT MTD982572562 Final Poses Public Health Hazard PHA (2001)
9 Big River Mine Tailings/St. Joe Minerals Corp. Desloge MO MOD981126899 Non-NPL Poses Public Health Hazard PHA (1996)
10 Blackbird Mine Lemhi County ID IDD980725832 Proposed Poses Public Health Hazard PHA (1995)
11 Bunker Hill Mining & Metallurgical Complex Smelterville ID IDD048340921 Final Poses Urgent Public Health Hazard;
Public Health Hazard PHA (1989); HC
(2000) 12 Captain Jack Mill Ward CO COD981551427 Final Poses Public Health Hazard HC (2006)
13 Carpenter Snow Creek Mining District Neihart MT MT0001096353 Final Poses Public Health Hazard PHA (2004)
14 Carson River Mercury Site Dayton NV NVD980813646 Final Poses Public Health Hazard PHA (1993) 15 Celtor Chemical Works Hoopa CA CAD980638860 Proposed Poses Public Health Hazard PHA (1987) 16 Central City, Clear Creek Idaho Springs CO COD980717557 Final Poses Public Health Hazard PHA (1988)
17 Cherokee County Galena KS KSD980741862 Final Poses Public Health Hazard PHA (1989); HC (1994)
18 Circle Smelting Corp. Beckemeyer IL ILD050231976 Proposed Poses Public Health Hazard PHA (2003)
19 Commencement Bay, Near Shore/Tide Flats Tacoma WA WAD980726368 Final Poses Public Health Hazard PHA (1993)
20 Copper Basin Mining District Copperhill TN TN0001890839 Non-NPL Poses Public Health Hazard HC (1998) 21 Davenport And Flagstaff Smelters Sandy UT UTD988075719 Final Poses Public Health Hazard PHA (2005)
22 Depue/New Jersey Zinc/Mobil Chemical Corp. Depue IL ILD062340641 Final Poses Public Health Hazard PHA (1999)
23 East Helena Site East Helena MT MTD006230346 Final Poses Public Health Hazard HC (2002)
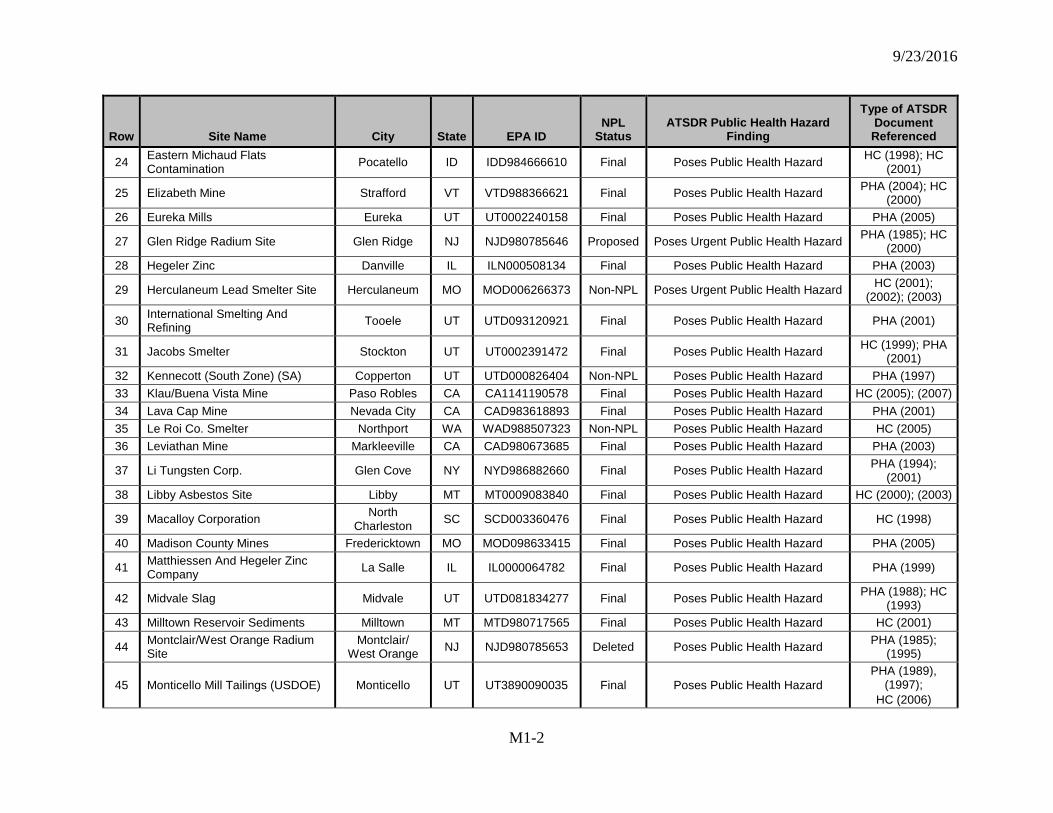
9/23/2016
M1-2
Row Site Name City State EPA ID
NPL
Status ATSDR Public Health Hazard
Finding
Type of ATSDR Document Referenced
24 Eastern Michaud Flats Contamination Pocatello ID IDD984666610 Final Poses Public Health Hazard HC (1998); HC
(2001)
25 Elizabeth Mine Strafford VT VTD988366621 Final Poses Public Health Hazard PHA (2004); HC (2000)
26 Eureka Mills Eureka UT UT0002240158 Final Poses Public Health Hazard PHA (2005)
27 Glen Ridge Radium Site Glen Ridge NJ NJD980785646 Proposed Poses Urgent Public Health Hazard PHA (1985); HC (2000)
28 Hegeler Zinc Danville IL ILN000508134 Final Poses Public Health Hazard PHA (2003)
29 Herculaneum Lead Smelter Site Herculaneum MO MOD006266373 Non-NPL Poses Urgent Public Health Hazard HC (2001); (2002); (2003)
30 International Smelting And Refining Tooele UT UTD093120921 Final Poses Public Health Hazard PHA (2001)
31 Jacobs Smelter Stockton UT UT0002391472 Final Poses Public Health Hazard HC (1999); PHA (2001)
32 Kennecott (South Zone) (SA) Copperton UT UTD000826404 Non-NPL Poses Public Health Hazard PHA (1997) 33 Klau/Buena Vista Mine Paso Robles CA CA1141190578 Final Poses Public Health Hazard HC (2005); (2007) 34 Lava Cap Mine Nevada City CA CAD983618893 Final Poses Public Health Hazard PHA (2001) 35 Le Roi Co. Smelter Northport WA WAD988507323 Non-NPL Poses Public Health Hazard HC (2005) 36 Leviathan Mine Markleeville CA CAD980673685 Final Poses Public Health Hazard PHA (2003)
37 Li Tungsten Corp. Glen Cove NY NYD986882660 Final Poses Public Health Hazard PHA (1994); (2001)
38 Libby Asbestos Site Libby MT MT0009083840 Final Poses Public Health Hazard HC (2000); (2003)
39 Macalloy Corporation North Charleston SC SCD003360476 Final Poses Public Health Hazard HC (1998)
40 Madison County Mines Fredericktown MO MOD098633415 Final Poses Public Health Hazard PHA (2005)
41 Matthiessen And Hegeler Zinc Company La Salle IL IL0000064782 Final Poses Public Health Hazard PHA (1999)
42 Midvale Slag Midvale UT UTD081834277 Final Poses Public Health Hazard PHA (1988); HC (1993)
43 Milltown Reservoir Sediments Milltown MT MTD980717565 Final Poses Public Health Hazard HC (2001)
44 Montclair/West Orange Radium Site
Montclair/ West Orange NJ NJD980785653 Deleted Poses Public Health Hazard PHA (1985);
(1995)
45 Monticello Mill Tailings (USDOE) Monticello UT UT3890090035 Final Poses Public Health Hazard PHA (1989),
(1997); HC (2006)
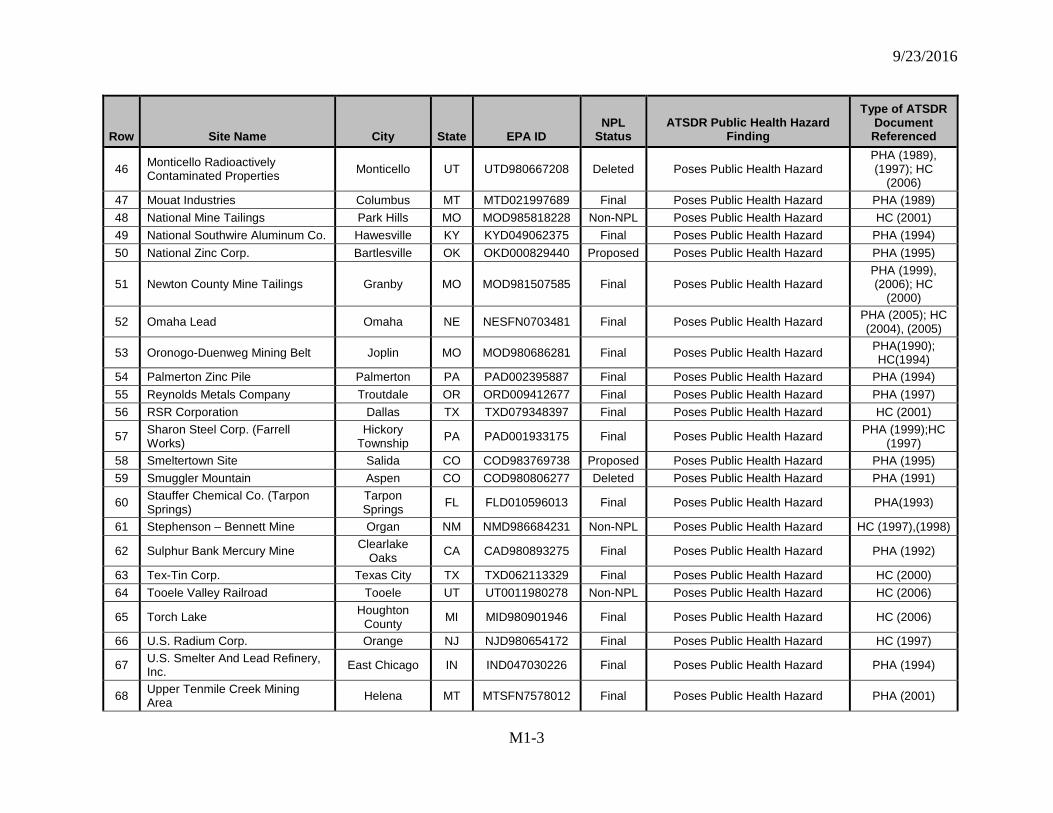
9/23/2016
M1-3
Row Site Name City State EPA ID
NPL
Status ATSDR Public Health Hazard
Finding
Type of ATSDR Document Referenced
46 Monticello Radioactively Contaminated Properties Monticello UT UTD980667208 Deleted Poses Public Health Hazard
PHA (1989), (1997); HC
(2006) 47 Mouat Industries Columbus MT MTD021997689 Final Poses Public Health Hazard PHA (1989) 48 National Mine Tailings Park Hills MO MOD985818228 Non-NPL Poses Public Health Hazard HC (2001) 49 National Southwire Aluminum Co. Hawesville KY KYD049062375 Final Poses Public Health Hazard PHA (1994) 50 National Zinc Corp. Bartlesville OK OKD000829440 Proposed Poses Public Health Hazard PHA (1995)
51 Newton County Mine Tailings Granby MO MOD981507585 Final Poses Public Health Hazard PHA (1999), (2006); HC
(2000)
52 Omaha Lead Omaha NE NESFN0703481 Final Poses Public Health Hazard PHA (2005); HC (2004), (2005)
53 Oronogo-Duenweg Mining Belt Joplin MO MOD980686281 Final Poses Public Health Hazard PHA(1990); HC(1994)
54 Palmerton Zinc Pile Palmerton PA PAD002395887 Final Poses Public Health Hazard PHA (1994) 55 Reynolds Metals Company Troutdale OR ORD009412677 Final Poses Public Health Hazard PHA (1997) 56 RSR Corporation Dallas TX TXD079348397 Final Poses Public Health Hazard HC (2001)
57 Sharon Steel Corp. (Farrell Works)
Hickory Township PA PAD001933175 Final Poses Public Health Hazard PHA (1999);HC
(1997) 58 Smeltertown Site Salida CO COD983769738 Proposed Poses Public Health Hazard PHA (1995) 59 Smuggler Mountain Aspen CO COD980806277 Deleted Poses Public Health Hazard PHA (1991)
60 Stauffer Chemical Co. (Tarpon Springs)
Tarpon Springs FL FLD010596013 Final Poses Public Health Hazard PHA(1993)
61 Stephenson – Bennett Mine Organ NM NMD986684231 Non-NPL Poses Public Health Hazard HC (1997),(1998)
62 Sulphur Bank Mercury Mine Clearlake Oaks CA CAD980893275 Final Poses Public Health Hazard PHA (1992)
63 Tex-Tin Corp. Texas City TX TXD062113329 Final Poses Public Health Hazard HC (2000) 64 Tooele Valley Railroad Tooele UT UT0011980278 Non-NPL Poses Public Health Hazard HC (2006)
65 Torch Lake Houghton County MI MID980901946 Final Poses Public Health Hazard HC (2006)
66 U.S. Radium Corp. Orange NJ NJD980654172 Final Poses Public Health Hazard HC (1997)
67 U.S. Smelter And Lead Refinery, Inc. East Chicago IN IND047030226 Final Poses Public Health Hazard PHA (1994)
68 Upper Tenmile Creek Mining Area Helena MT MTSFN7578012 Final Poses Public Health Hazard PHA (2001)
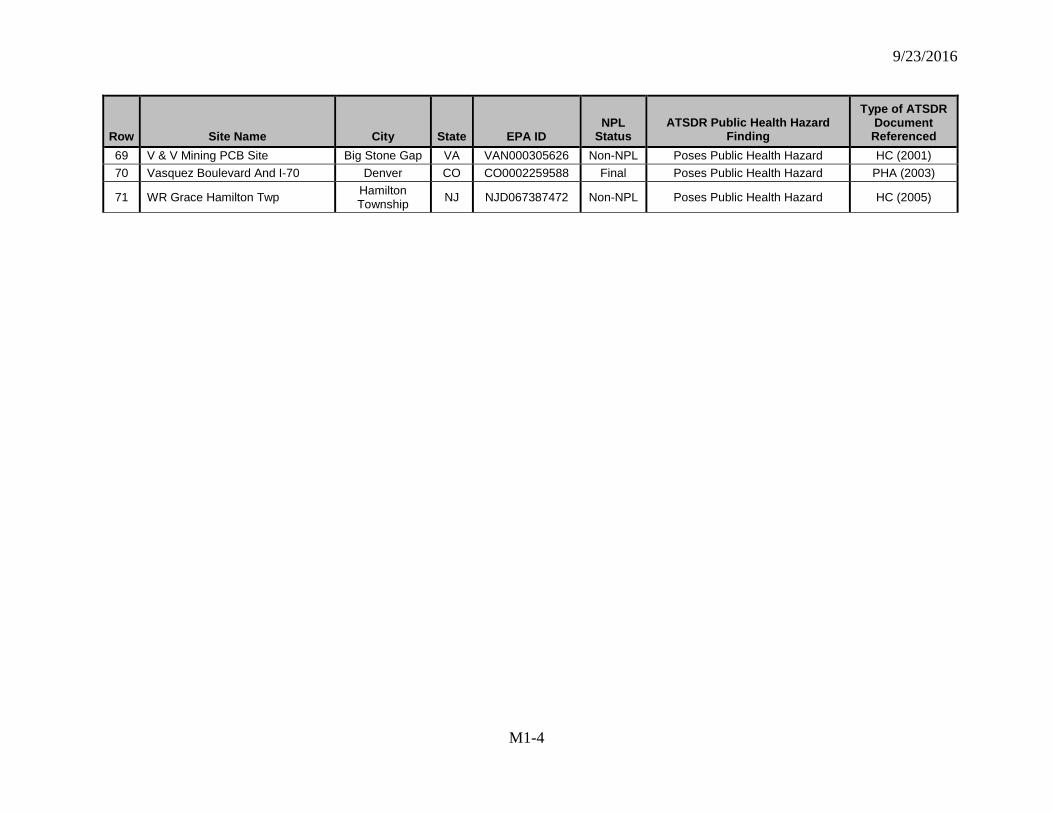
9/23/2016
M1-4
Row Site Name City State EPA ID
NPL
Status ATSDR Public Health Hazard
Finding
Type of ATSDR Document Referenced
69 V & V Mining PCB Site Big Stone Gap VA VAN000305626 Non-NPL Poses Public Health Hazard HC (2001) 70 Vasquez Boulevard And I-70 Denver CO CO0002259588 Final Poses Public Health Hazard PHA (2003)
71 WR Grace Hamilton Twp Hamilton Township NJ NJD067387472 Non-NPL Poses Public Health Hazard HC (2005)
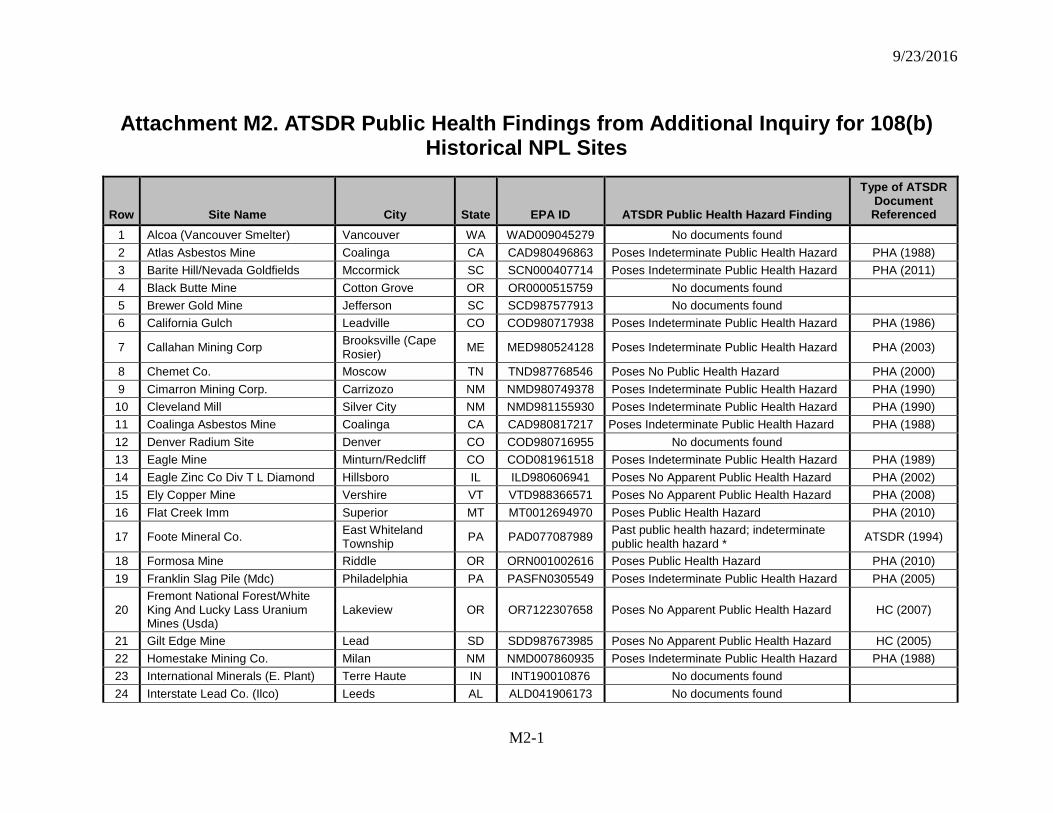
9/23/2016
M2-1
Attachment M2. ATSDR Public Health Findings from Additional Inquiry for 108(b) Historical NPL Sites
Row Site Name City State EPA ID ATSDR Public Health Hazard Finding
Type of ATSDR Document Referenced
1 Alcoa (Vancouver Smelter) Vancouver WA WAD009045279 No documents found 2 Atlas Asbestos Mine Coalinga CA CAD980496863 Poses Indeterminate Public Health Hazard PHA (1988) 3 Barite Hill/Nevada Goldfields Mccormick SC SCN000407714 Poses Indeterminate Public Health Hazard PHA (2011) 4 Black Butte Mine Cotton Grove OR OR0000515759 No documents found 5 Brewer Gold Mine Jefferson SC SCD987577913 No documents found 6 California Gulch Leadville CO COD980717938 Poses Indeterminate Public Health Hazard PHA (1986)
7 Callahan Mining Corp Brooksville (Cape Rosier) ME MED980524128 Poses Indeterminate Public Health Hazard PHA (2003)
8 Chemet Co. Moscow TN TND987768546 Poses No Public Health Hazard PHA (2000) 9 Cimarron Mining Corp. Carrizozo NM NMD980749378 Poses Indeterminate Public Health Hazard PHA (1990) 10 Cleveland Mill Silver City NM NMD981155930 Poses Indeterminate Public Health Hazard PHA (1990) 11 Coalinga Asbestos Mine Coalinga CA CAD980817217 Poses Indeterminate Public Health Hazard PHA (1988) 12 Denver Radium Site Denver CO COD980716955 No documents found 13 Eagle Mine Minturn/Redcliff CO COD081961518 Poses Indeterminate Public Health Hazard PHA (1989) 14 Eagle Zinc Co Div T L Diamond Hillsboro IL ILD980606941 Poses No Apparent Public Health Hazard PHA (2002) 15 Ely Copper Mine Vershire VT VTD988366571 Poses No Apparent Public Health Hazard PHA (2008) 16 Flat Creek Imm Superior MT MT0012694970 Poses Public Health Hazard PHA (2010)
17 Foote Mineral Co. East Whiteland Township PA PAD077087989 Past public health hazard; indeterminate
public health hazard * ATSDR (1994)
18 Formosa Mine Riddle OR ORN001002616 Poses Public Health Hazard PHA (2010) 19 Franklin Slag Pile (Mdc) Philadelphia PA PASFN0305549 Poses Indeterminate Public Health Hazard PHA (2005)
20 Fremont National Forest/White King And Lucky Lass Uranium Mines (Usda)
Lakeview OR OR7122307658 Poses No Apparent Public Health Hazard HC (2007)
21 Gilt Edge Mine Lead SD SDD987673985 Poses No Apparent Public Health Hazard HC (2005) 22 Homestake Mining Co. Milan NM NMD007860935 Poses Indeterminate Public Health Hazard PHA (1988) 23 International Minerals (E. Plant) Terre Haute IN INT190010876 No documents found 24 Interstate Lead Co. (Ilco) Leeds AL ALD041906173 No documents found
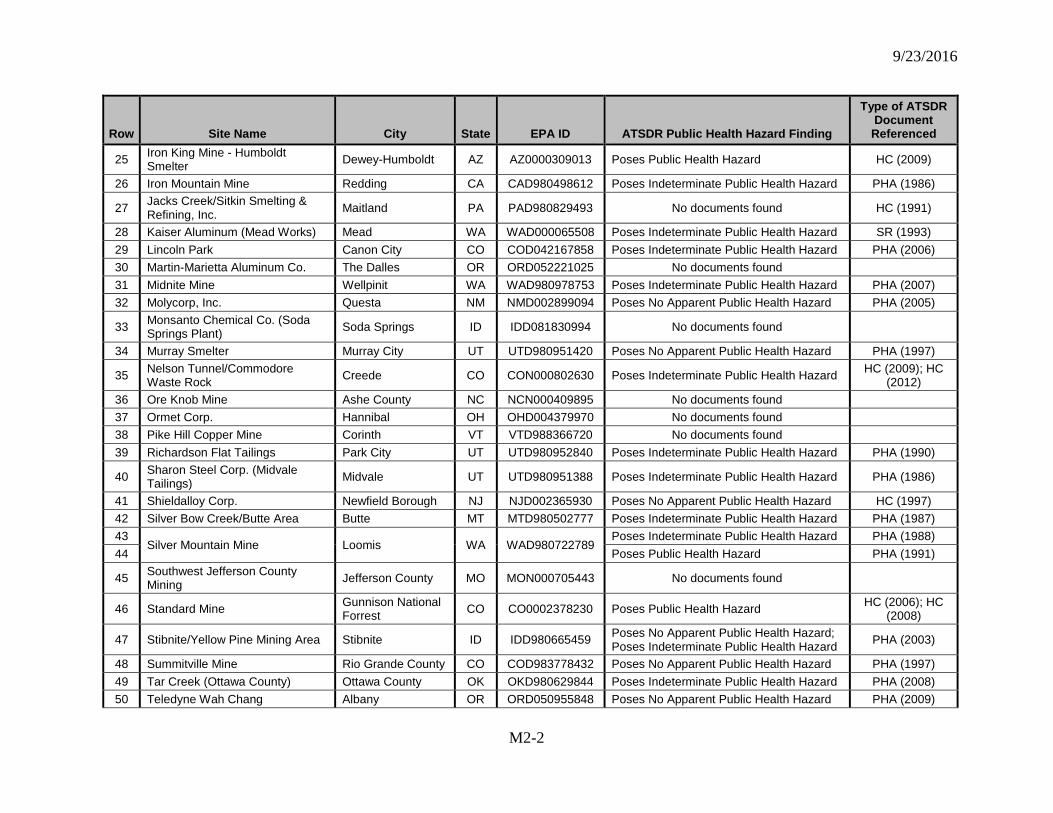
9/23/2016
M2-2
Row Site Name City State EPA ID ATSDR Public Health Hazard Finding
Type of ATSDR Document Referenced
25 Iron King Mine - Humboldt Smelter Dewey-Humboldt AZ AZ0000309013 Poses Public Health Hazard HC (2009)
26 Iron Mountain Mine Redding CA CAD980498612 Poses Indeterminate Public Health Hazard PHA (1986)
27 Jacks Creek/Sitkin Smelting & Refining, Inc. Maitland PA PAD980829493 No documents found HC (1991)
28 Kaiser Aluminum (Mead Works) Mead WA WAD000065508 Poses Indeterminate Public Health Hazard SR (1993) 29 Lincoln Park Canon City CO COD042167858 Poses Indeterminate Public Health Hazard PHA (2006) 30 Martin-Marietta Aluminum Co. The Dalles OR ORD052221025 No documents found 31 Midnite Mine Wellpinit WA WAD980978753 Poses Indeterminate Public Health Hazard PHA (2007) 32 Molycorp, Inc. Questa NM NMD002899094 Poses No Apparent Public Health Hazard PHA (2005)
33 Monsanto Chemical Co. (Soda Springs Plant) Soda Springs ID IDD081830994 No documents found
34 Murray Smelter Murray City UT UTD980951420 Poses No Apparent Public Health Hazard PHA (1997)
35 Nelson Tunnel/Commodore Waste Rock Creede CO CON000802630 Poses Indeterminate Public Health Hazard HC (2009); HC
(2012) 36 Ore Knob Mine Ashe County NC NCN000409895 No documents found 37 Ormet Corp. Hannibal OH OHD004379970 No documents found 38 Pike Hill Copper Mine Corinth VT VTD988366720 No documents found 39 Richardson Flat Tailings Park City UT UTD980952840 Poses Indeterminate Public Health Hazard PHA (1990)
40 Sharon Steel Corp. (Midvale Tailings) Midvale UT UTD980951388 Poses Indeterminate Public Health Hazard PHA (1986)
41 Shieldalloy Corp. Newfield Borough NJ NJD002365930 Poses No Apparent Public Health Hazard HC (1997) 42 Silver Bow Creek/Butte Area Butte MT MTD980502777 Poses Indeterminate Public Health Hazard PHA (1987) 43
Silver Mountain Mine Loomis WA WAD980722789 Poses Indeterminate Public Health Hazard PHA (1988)
44 Poses Public Health Hazard PHA (1991)
45 Southwest Jefferson County Mining Jefferson County MO MON000705443 No documents found
46 Standard Mine Gunnison National Forrest CO CO0002378230 Poses Public Health Hazard HC (2006); HC
(2008)
47 Stibnite/Yellow Pine Mining Area Stibnite ID IDD980665459 Poses No Apparent Public Health Hazard; Poses Indeterminate Public Health Hazard PHA (2003)
48 Summitville Mine Rio Grande County CO COD983778432 Poses No Apparent Public Health Hazard PHA (1997) 49 Tar Creek (Ottawa County) Ottawa County OK OKD980629844 Poses Indeterminate Public Health Hazard PHA (2008) 50 Teledyne Wah Chang Albany OR ORD050955848 Poses No Apparent Public Health Hazard PHA (2009)
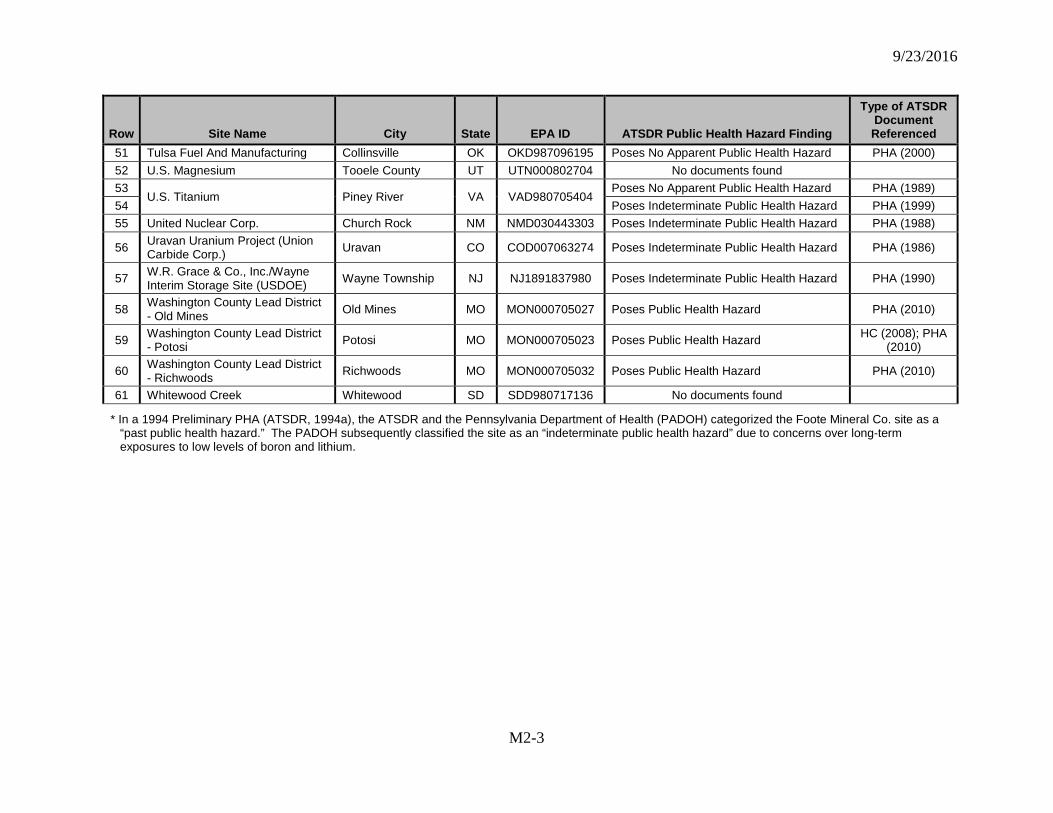
9/23/2016
M2-3
Row Site Name City State EPA ID ATSDR Public Health Hazard Finding
Type of ATSDR Document Referenced
51 Tulsa Fuel And Manufacturing Collinsville OK OKD987096195 Poses No Apparent Public Health Hazard PHA (2000) 52 U.S. Magnesium Tooele County UT UTN000802704 No documents found 53
U.S. Titanium Piney River VA VAD980705404 Poses No Apparent Public Health Hazard PHA (1989)
54 Poses Indeterminate Public Health Hazard PHA (1999) 55 United Nuclear Corp. Church Rock NM NMD030443303 Poses Indeterminate Public Health Hazard PHA (1988)
56 Uravan Uranium Project (Union Carbide Corp.) Uravan CO COD007063274 Poses Indeterminate Public Health Hazard PHA (1986)
57 W.R. Grace & Co., Inc./Wayne Interim Storage Site (USDOE) Wayne Township NJ NJ1891837980 Poses Indeterminate Public Health Hazard PHA (1990)
58 Washington County Lead District - Old Mines Old Mines MO MON000705027 Poses Public Health Hazard PHA (2010)
59 Washington County Lead District - Potosi Potosi MO MON000705023 Poses Public Health Hazard HC (2008); PHA
(2010)
60 Washington County Lead District - Richwoods Richwoods MO MON000705032 Poses Public Health Hazard PHA (2010)
61 Whitewood Creek Whitewood SD SDD980717136 No documents found
* In a 1994 Preliminary PHA (ATSDR, 1994a), the ATSDR and the Pennsylvania Department of Health (PADOH) categorized the Foote Mineral Co. site as a “past public health hazard.” The PADOH subsequently classified the site as an “indeterminate public health hazard” due to concerns over long-term exposures to low levels of boron and lithium.
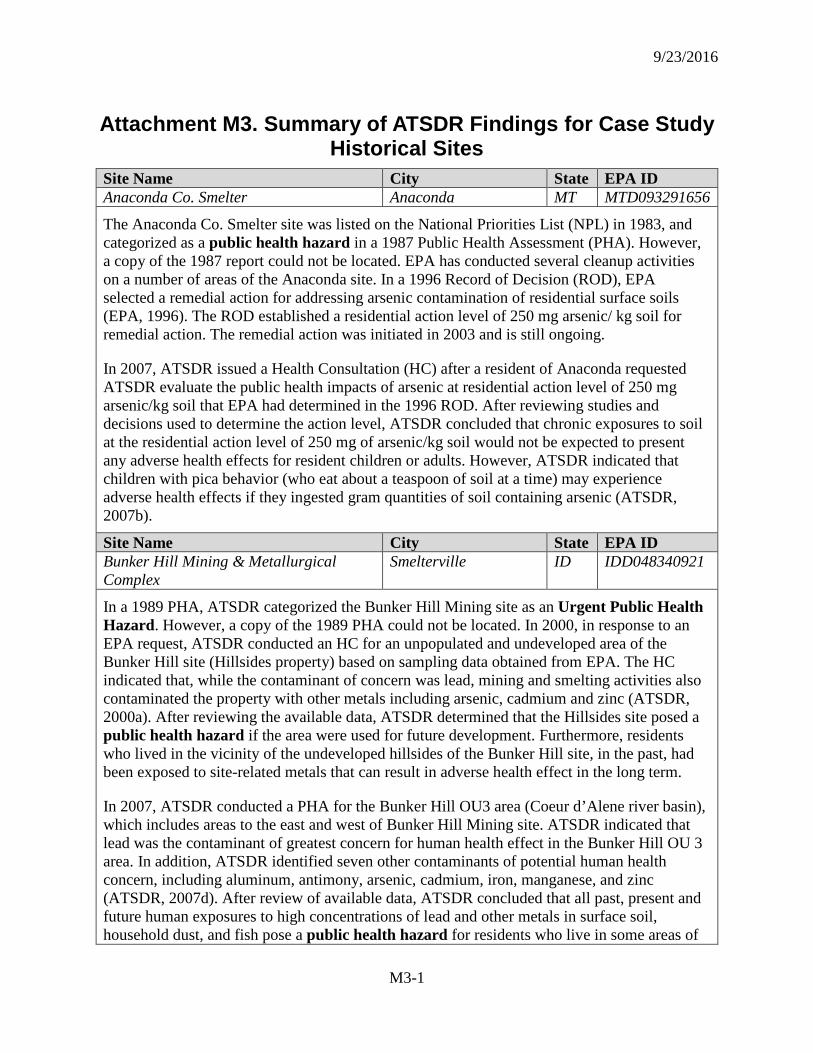
9/23/2016
M3-1
Attachment M3. Summary of ATSDR Findings for Case Study Historical Sites
Site Name City State EPA ID Anaconda Co. Smelter Anaconda MT MTD093291656
The Anaconda Co. Smelter site was listed on the National Priorities List (NPL) in 1983, and categorized as a public health hazard in a 1987 Public Health Assessment (PHA). However, a copy of the 1987 report could not be located. EPA has conducted several cleanup activities on a number of areas of the Anaconda site. In a 1996 Record of Decision (ROD), EPA selected a remedial action for addressing arsenic contamination of residential surface soils (EPA, 1996). The ROD established a residential action level of 250 mg arsenic/ kg soil for remedial action. The remedial action was initiated in 2003 and is still ongoing.
In 2007, ATSDR issued a Health Consultation (HC) after a resident of Anaconda requested ATSDR evaluate the public health impacts of arsenic at residential action level of 250 mg arsenic/kg soil that EPA had determined in the 1996 ROD. After reviewing studies and decisions used to determine the action level, ATSDR concluded that chronic exposures to soil at the residential action level of 250 mg of arsenic/kg soil would not be expected to present any adverse health effects for resident children or adults. However, ATSDR indicated that children with pica behavior (who eat about a teaspoon of soil at a time) may experience adverse health effects if they ingested gram quantities of soil containing arsenic (ATSDR, 2007b).
Site Name City State EPA ID Bunker Hill Mining & Metallurgical Complex
Smelterville
ID IDD048340921
In a 1989 PHA, ATSDR categorized the Bunker Hill Mining site as an Urgent Public Health Hazard. However, a copy of the 1989 PHA could not be located. In 2000, in response to an EPA request, ATSDR conducted an HC for an unpopulated and undeveloped area of the Bunker Hill site (Hillsides property) based on sampling data obtained from EPA. The HC indicated that, while the contaminant of concern was lead, mining and smelting activities also contaminated the property with other metals including arsenic, cadmium and zinc (ATSDR, 2000a). After reviewing the available data, ATSDR determined that the Hillsides site posed a public health hazard if the area were used for future development. Furthermore, residents who lived in the vicinity of the undeveloped hillsides of the Bunker Hill site, in the past, had been exposed to site-related metals that can result in adverse health effect in the long term.
In 2007, ATSDR conducted a PHA for the Bunker Hill OU3 area (Coeur d’Alene river basin), which includes areas to the east and west of Bunker Hill Mining site. ATSDR indicated that lead was the contaminant of greatest concern for human health effect in the Bunker Hill OU 3 area. In addition, ATSDR identified seven other contaminants of potential human health concern, including aluminum, antimony, arsenic, cadmium, iron, manganese, and zinc (ATSDR, 2007d). After review of available data, ATSDR concluded that all past, present and future human exposures to high concentrations of lead and other metals in surface soil, household dust, and fish pose a public health hazard for residents who live in some areas of
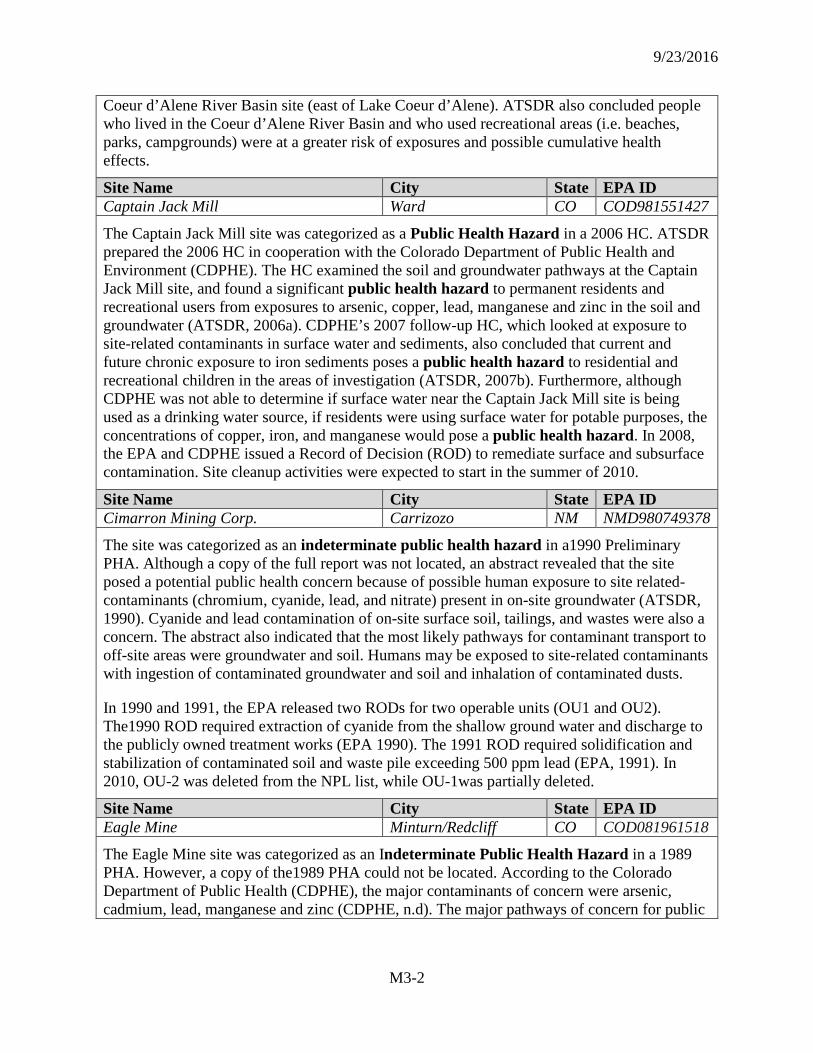
9/23/2016
M3-2
Coeur d’Alene River Basin site (east of Lake Coeur d’Alene). ATSDR also concluded people who lived in the Coeur d’Alene River Basin and who used recreational areas (i.e. beaches, parks, campgrounds) were at a greater risk of exposures and possible cumulative health effects.
Site Name City State EPA ID Captain Jack Mill Ward CO COD981551427
The Captain Jack Mill site was categorized as a Public Health Hazard in a 2006 HC. ATSDR prepared the 2006 HC in cooperation with the Colorado Department of Public Health and Environment (CDPHE). The HC examined the soil and groundwater pathways at the Captain Jack Mill site, and found a significant public health hazard to permanent residents and recreational users from exposures to arsenic, copper, lead, manganese and zinc in the soil and groundwater (ATSDR, 2006a). CDPHE’s 2007 follow-up HC, which looked at exposure to site-related contaminants in surface water and sediments, also concluded that current and future chronic exposure to iron sediments poses a public health hazard to residential and recreational children in the areas of investigation (ATSDR, 2007b). Furthermore, although CDPHE was not able to determine if surface water near the Captain Jack Mill site is being used as a drinking water source, if residents were using surface water for potable purposes, the concentrations of copper, iron, and manganese would pose a public health hazard. In 2008, the EPA and CDPHE issued a Record of Decision (ROD) to remediate surface and subsurface contamination. Site cleanup activities were expected to start in the summer of 2010.
Site Name City State EPA ID Cimarron Mining Corp. Carrizozo NM NMD980749378
The site was categorized as an indeterminate public health hazard in a1990 Preliminary PHA. Although a copy of the full report was not located, an abstract revealed that the site posed a potential public health concern because of possible human exposure to site related-contaminants (chromium, cyanide, lead, and nitrate) present in on-site groundwater (ATSDR, 1990). Cyanide and lead contamination of on-site surface soil, tailings, and wastes were also a concern. The abstract also indicated that the most likely pathways for contaminant transport to off-site areas were groundwater and soil. Humans may be exposed to site-related contaminants with ingestion of contaminated groundwater and soil and inhalation of contaminated dusts.
In 1990 and 1991, the EPA released two RODs for two operable units (OU1 and OU2). The1990 ROD required extraction of cyanide from the shallow ground water and discharge to the publicly owned treatment works (EPA 1990). The 1991 ROD required solidification and stabilization of contaminated soil and waste pile exceeding 500 ppm lead (EPA, 1991). In 2010, OU-2 was deleted from the NPL list, while OU-1was partially deleted.
Site Name City State EPA ID Eagle Mine Minturn/Redcliff CO COD081961518
The Eagle Mine site was categorized as an Indeterminate Public Health Hazard in a 1989 PHA. However, a copy of the1989 PHA could not be located. According to the Colorado Department of Public Health (CDPHE), the major contaminants of concern were arsenic, cadmium, lead, manganese and zinc (CDPHE, n.d). The major pathways of concern for public
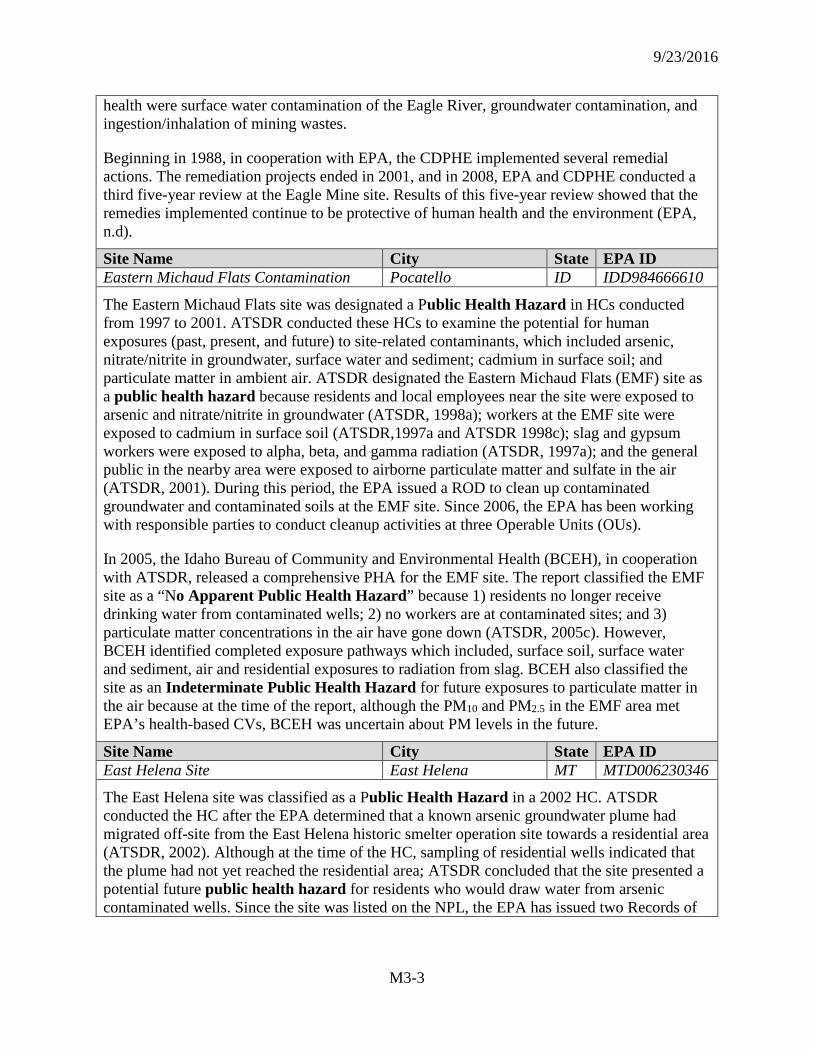
9/23/2016
M3-3
health were surface water contamination of the Eagle River, groundwater contamination, and ingestion/inhalation of mining wastes.
Beginning in 1988, in cooperation with EPA, the CDPHE implemented several remedial actions. The remediation projects ended in 2001, and in 2008, EPA and CDPHE conducted a third five-year review at the Eagle Mine site. Results of this five-year review showed that the remedies implemented continue to be protective of human health and the environment (EPA, n.d).
Site Name City State EPA ID Eastern Michaud Flats Contamination Pocatello ID IDD984666610
The Eastern Michaud Flats site was designated a Public Health Hazard in HCs conducted from 1997 to 2001. ATSDR conducted these HCs to examine the potential for human exposures (past, present, and future) to site-related contaminants, which included arsenic, nitrate/nitrite in groundwater, surface water and sediment; cadmium in surface soil; and particulate matter in ambient air. ATSDR designated the Eastern Michaud Flats (EMF) site as a public health hazard because residents and local employees near the site were exposed to arsenic and nitrate/nitrite in groundwater (ATSDR, 1998a); workers at the EMF site were exposed to cadmium in surface soil (ATSDR,1997a and ATSDR 1998c); slag and gypsum workers were exposed to alpha, beta, and gamma radiation (ATSDR, 1997a); and the general public in the nearby area were exposed to airborne particulate matter and sulfate in the air (ATSDR, 2001). During this period, the EPA issued a ROD to clean up contaminated groundwater and contaminated soils at the EMF site. Since 2006, the EPA has been working with responsible parties to conduct cleanup activities at three Operable Units (OUs).
In 2005, the Idaho Bureau of Community and Environmental Health (BCEH), in cooperation with ATSDR, released a comprehensive PHA for the EMF site. The report classified the EMF site as a “No Apparent Public Health Hazard” because 1) residents no longer receive drinking water from contaminated wells; 2) no workers are at contaminated sites; and 3) particulate matter concentrations in the air have gone down (ATSDR, 2005c). However, BCEH identified completed exposure pathways which included, surface soil, surface water and sediment, air and residential exposures to radiation from slag. BCEH also classified the site as an Indeterminate Public Health Hazard for future exposures to particulate matter in the air because at the time of the report, although the PM10 and PM2.5 in the EMF area met EPA’s health-based CVs, BCEH was uncertain about PM levels in the future.
Site Name City State EPA ID East Helena Site East Helena MT MTD006230346
The East Helena site was classified as a Public Health Hazard in a 2002 HC. ATSDR conducted the HC after the EPA determined that a known arsenic groundwater plume had migrated off-site from the East Helena historic smelter operation site towards a residential area (ATSDR, 2002). Although at the time of the HC, sampling of residential wells indicated that the plume had not yet reached the residential area; ATSDR concluded that the site presented a potential future public health hazard for residents who would draw water from arsenic contaminated wells. Since the site was listed on the NPL, the EPA has issued two Records of
9/23/2016
M3-4
Decision: 1) to reduce groundwater pollution from process ponds at the site (EPA, 1989); and 2) to clean up East Helena residential soils and undeveloped lands (EPA, 2009).
Site Name City State EPA ID Foote Mineral Co. East Whiteland
Township PA PAD077087989
A 1994 Preliminary PHA, prepared by the Pennsylvania Department of Health (PADOH) in cooperation with ATSDR, classified the site as a Past Public Health Hazard. The PADOH reached that conclusion based on past human exposures to elevated levels of boron and lithium through the use of off-site contaminated groundwater (ATSDR, 1994a). Since then, residents who had drawn water from contaminated private wells were connected to public water supply systems. In addition, contaminated water in the public water supply systems were connected to uncontaminated sources. These measures helped reduce the levels of boron and lithium in drinking water, but at the time of the report, PADOH categorized the site as Indeterminate Public Health Hazard due concerns of long-term exposures to low levels of boron and lithium. PADOH indicated that there was no toxicological information in the literature regarding adverse health effects to long-term exposures of low levels of boron and lithium.
Site Name City State EPA ID Gilt Edge Mine Lead SD SDD987673985
The site was categorized as a No Apparent Public Health Hazard in a 2005 HC. ATSDR found that levels of arsenic, cadmium, copper and manganese exceeded environmental comparison values for on-site soil and off-site stream sediments (ATSDR, 2005a). ATSDR also found cadmium levels exceeding environment comparisons values in off-site surface water. The Gilt Edge Mine site was nevertheless classified as a “no apparent public health hazard” because ATSDR did not find complete exposures to on-site soil and on-site surface water: public access to the area was restricted, and on-site surface water was not used for drinking water. In addition, although ATSDR found complete exposure pathways to off-site surface water and stream sediment, ATSDR determined “no apparent public health hazard” based on reasonably expected recreational activities. The Gilt Edge Mine site was classified as an Indeterminate Public Health Hazard for future exposures, as ATSDR was unable to determine what future human activities (e.g., residential, agricultural, recreational) could occur at the site, and the final outcome of site remediation.
Site Name City State EPA ID Homestake Mining Co. Milan NM NMD007860935
The site was categorized as an Indeterminate Public Health Hazard in a 1988 PHA. In a 2009 HC, ATSDR reviewed the data from private well sampling conducted between September 2005 and May 2007 near the Homestake site. Although, “sampling results indicated several wells had uranium and/or selenium concentration above the Maximum Contaminant Level (MCL), ATSDR concluded no apparent public health hazard.” ATSDR made this determination after calculating exposure doses for the contaminants above ATSDR health comparison values and MCLs in well samples, and determined that the concentrations were not at levels to cause adverse health effects (ATSDR, 2009a). However, ATSDR advised owners of residential wells that have selenium or uranim concentrations above the MCL to refrain from using the wells for potable purposes. Furthermore, results of the well sampling
9/23/2016
M3-5
showed that sulfates and total dissolved solids levels exceeded USEPA’s drinking water advisory. ATSDR indicated that they may present health problems to the very young, very old and those that are already ill.
Site Name City State EPA ID Li Tungsten Corp. Glen Cove NY NYD986882660 The Li Tungsten site posed a Public Health Hazard according to a 1994 Preliminary PHA and a 2001 HC. The 1994 Preliminary PHA stated that trespassing onto site properties was occurring, and trespassers may be exposed to on-site surface soils, surface water, and sediments contaminated with elevated levels of site-related contaminants, including PCBs (Aroclors), metals (antimony, arsenic, cadmium, chromium, lead, manganese, mercury, nickel, iron) and gamma radiation from on-site drums and piles of low level radioactive slag/ore (ATSDR, 1994b). In addition, ATSDR indicated off-site surface water (Glen Cove Creek) was contaminated with volatile organic compounds such as tetrachlorethene and metals (iron and manganese) at levels exceeding surface water or drinking water standards. Therefore, people who used nearby surface water (Glen Cove Creek) for recreational purposes may also be exposed to these volatile organic compounds and metals. Sediment in off-site surface water was also contaminated with nickel and zinc at levels of concern for potential exposure pathways. A copy of the 2001 HC could not be located. Site Name City State EPA ID Macalloy Corporation North Charleston SC SCD003360476
The Macalloy Corporation site was categorized a Public Health Hazard in a 1998 HC. This HC reviewed EPA’s analytical data of contaminated shellfish (i.e., clams, oysters, shrimp and crabs) samples obtained from Shipyard Creek, North Charleston, South Carolina (ATSDR, 1998b). In the report, ATSDR indicated that the Macalloy Corporation facility situated at the headwaters of Shipyard Creek may have been the source of contamination through surface water runoff from the facility. Wastes generated by the facility during the ferro-chrome manufacturing process included arsenic, barium, chromium, lead, manganese, mercury, and zinc. ATSDR found that chromium concentrations detected in shrimp from Shipyard Creek presented a public health hazard if people consumed the contaminated shrimp on a frequent basis.
Site Name City State EPA ID Midnite Mine Wellpinit WA WAD980978753
A 2010 PHA categorized the Midnite Mine site as a Public Health Hazard. According to the report, the Midnite Mine site was comprised of a mined area and a mine-affected area. The mined area contained more than 33 million tons of waste rock, unprocessed ore, and low-grade ore. Mine-affected environmental media include sediment, surface water (Blue Creek), soil, and groundwater. According to the report, past site investigations showed that contaminants such as arsenic, cadmium, manganese, uranium, and radioactive isotopes and decay products related to uranium, migrated from mining areas into local groundwater and surface waters as a result of mining activities and environmental processes. ATSDR classified the Midnite Mine site as a public health hazard based on exposures to site-related contaminants (metals and radionuclides) for people who use the mining-affected areas for traditional and subsistence activities (i.e. drinking water from drainage and seeps; breathing water vapor by heating water from drainage and seeps; accidentally ingesting sediments; eating terrestrial plants and roots
9/23/2016
M3-6
from mine-affected areas; eating fish from Blue Creek). In addition, ATSDR categorized the site as an Indeterminate Public Health Hazard for exposure to site–related contaminants through consumption of meat from big game (i.e. deer, elk) that graze or live in mined or mine-affected areas. ATSDR also classified the site as an indeterminate public health hazard for future exposure to contaminated groundwater from private drinking water wells and to radon in indoor air because at the time of the report ATSDR was unable to determine if there would be a residential development in the mining-affected area or if future residences would use contaminated private wells as a source of drinking water (ATSDR, 2010).
Site Name City State EPA ID Monsanto Chemical Co. (Soda Springs Plant)
Soda Springs ID IDD081830994
In 1992, ATSDR released a Preliminary PHA for the Monsanto Chemical Co. site. A copy of this document could not be located. However, according to an ATSDR Ombudsman report, the 1992 Preliminary PHA classified the Monsanto site as a public health hazard because of public exposure to hazardous substances (radioactive slags) produced as a result of Monsanto phosphate ore processes, which were used as aggregate in building and roadbeds (ATSDR, 2000b). The Ombudsman’s summary of the Preliminary PHA also indicated that exposure to inorganic compounds (not specified) may have also occurred or may still be occurring through ingestion and inhalation of or dermal contact with contaminated groundwater or plant air/site fugitive dust emissions. But due to limited exposure data, ATSDR did not make health effect determination.
Site Name City State EPA ID National Southwire Aluminum Co. Hawesville KY KYD049062375
The National Southwire Aluminum Co. site was classified as a public health hazard in a 1994 Preliminary PHA. ATSDR reached that conclusion based on evidence that past, present and likely future exposures of on-site maintenance workers and workers at waste areas to elevated concentrations of aluminum, arsenic, cobalt, cyanide, fluoride manganese, and nickel (ATSDR, 1994c). The report also indicated that other on-site workers and nearby residents were exposed to these site-related contaminants, though the concentrations were not at levels to cause adverse health effects.
Site Name City State EPA ID Omaha Lead Omaha NE NESFN0703481
The Omaha lead site was classified as a public health hazard in a 2004 HC and 2005 PHA. Acording to the 2005 PHA, the site included residential properties, child care sites, and school contaminated with lead from air emissions from lead refining and other sources. ATSDR found that there was an ongoing exposure to lead which put children 6 years old and younger in or near the Omaha Lead site at risk of lead-related health problems. ATSDR indicated children were exposed to surface soil contaminated with lead emitted from the operation of the ASARCO refinery and lead-based paint. In the report, ATSDR indicated that more than 1600 children in the area had elevated blood lead levels, defined as10 ug/dL or greater from blood sampling conducted from July 2000 through 2003. ATSDR concluded that these exposure levels would result in adverse health effects to children. ATSDR therefore classified the Omaha Lead site as a public health hazard (ATSDR, 2005d).
9/23/2016
M3-7
Site Name City State EPA ID Ormet Corp. Hannibal OH OHD004379970
The ATSDR databases did not include any records for the Ormet Corp. site. In addition, at this time, no HC or PHA document by ATSDR could be located. According to EPA’s Record of Decision (ROD) published in 1994, groundwater beneath the site was contaminated in excess of MCLs for contaminants including antimony, arsenic, beryllium, cyanide, fluoride, and teterachloroethene (TCE) (EPA, 1994a). Furthermore, soils and sediments in a backwater area were contaminated with cyanide, fluoride and PCBs.
Site Name City State EPA ID Palmerton Zinc Pile Palmerton PA PAD002395887
A 1994 PHA classified the site as a public health hazard. However, a copy of this document could not be located. In a 1987 PHA by Pennsylvania Department of Health, in cooperation with ATSDR, concluded that the Palmerton area presented a public health hazard because people were exposed to site-related contaminates (arsenic, cadmium, lead, and zinc) at levels that may cause adverse health effects (ATSDR, 1987). Particularly, children with pica behavior may be exposed to zinc, if they came in contact to an area with high concentration of zinc. Exposure pathways included ingestion of contaminated surface soils, swallowing of particulates in the air, ingestion of contaminated surface water, groundwater, fish, game animals, and local vegetables.
Site Name City State EPA ID Reynalds Metals Company Troutdale OR ORD009412677
The Reynolds Metals site posed a public health hazard according to a 1997 PHA. ATSDR concluded that the Reynolds Metals site posed a public health hazard to on-site workers due to exposures to fluoride in surface soils and sediments (ATSDR, 1997b). In addition to fluoride, the report also indicated the presence of metal contaminants such as aluminum, arsenic, and mercury, and organic contaminants such as PAHs and PCBs in on-site surface soils, sediments and shallow groundwater beneath the Reynolds Metals site. People who used nearby surface waters (Columbia river and Sandy river) for recreation purposes as well as those who entered the area near the site to pick blackberries may be exposed to contaminated sediments and soils. However, ATSDR indicated no adverse health effects to recreational users because of the infrequency of their visits.
Site Name City State EPA ID Silver Mountain Mine Loomis WA WAD980722789
The site was classified as an indeterminate public health hazard in a 1988 PHA, and as a public health hazard in a 1991 PHA. However, copies of neither of these documents could be located. The Silver Mountain Mine site is abandoned silver and gold mine located in Horse Springs Coulee, Washington. According to EPA, during the early part of the 1980s, a sodium cyanide solution was used to extract metal from mine tailings. By 1983, the site was abandoned, and the mine tailings and holding basin containing cyanide contaminated water were left behind. EPA also indicated the presence of arsenic and cyanide in a leachate collection trench associated with ore extraction. Within three miles of this mining site, EPA reported the presence of private wells used for domestic purposes, irrigation and livestock watering. According to EPA, the contaminants of concerns were arsenic and cyanide and
9/23/2016
M3-8
exposure pathways included, on-site soils, on-site surface water, on-site shallower groundwater, and off-site groundwater (EPA, 2010). The site was deleted from NPL in 1997 after EPA completed remedial activities in 1992.
Site Name City State EPA ID Stauffer Chemical Co. (Tarpon Springs) Tarpon Springs FL FLD01059601
The Stauffer Chemical Co. posed a public health hazard in a 1993 Preliminary PHA. In 1993, ATSDR classified the Stauffer Chemical Co. as a public health hazard because on-site workers in the past and on-site workers at the time of report were exposed to arsenic in surface soils, sediments and dust at levels above ATSDR comparison values. Other contaminants of concern at this site were antimony, beryllium, boron, cadmium, chromium, fluoride, lead, radium, radon, sulfur dioxide, thallium, and vanadium. In addition, arsenic concentrations were also detected above EPA’s reference dose (RfD) in one off-site drinking water well, in off-site shallow and deep groundwater and in a nearby river. Contaminants known or suspected to cause cancer (arsenic beryllium, cadmium and chromium were also detected in on-site soils and sediments, groundwater (on-site and off-site) and off-site surface water at levels above ATSDR comparison values (ATSDR, 1993).
From 1993 to 2005, ATSDR issued a number of PHAs and HCs for the Stauffer Chemical Co. site. Following a Final Site Remedial Investigation for the Stauffer site in 1998, EPA requested ATSDR conduct a HC to determine if the contamination at the site posed “imminent and substantial endangerment.” ATSDR issued the HC in 1999 and after reviewing the data, ATSDR found no acute health hazard despite elevated levels of arsenic and radionuclide were found in the surface soil samples taken from the site. However, ATSDR concluded public health hazard for long-term exposures to site-related arsenic and radionuclides (ATSDR, 1999).
In 2005, ATSDR issued a final comprehensive PHA for the Stauffer site. At the time of the report, ATSDR classified the site as a “no apparent public health hazard”. ATSDR made this determination because the Stauffer plant had not been in operation since 1981, and access to the site was restricted. In addition, ATSDR indicated buildings, process equipment and chemicals at the site – that posed a health and safety hazard – had been removed from the site. However, because of elevated levels of arsenic in on-site surface soils and gamma radiation from on-site slags, ATSDR concluded that the Stauffer site could pose a future public health hazard if the site is used for future residential developments (ATSDR, 2005e).
Site Name City State EPA ID Summitville Mine Rio Grande County CO COD983778432
The site was classified as an indeterminate public health hazard in a 1997 PHA.
The Summitville Mine site was listed on the NPL in 1994. Since its listing, EPA and CDPHE have conducted several removal and remedial actions, which are still ongoing. In 1994, EPA and CDPHE conducted remedial actions for reducing or eliminating acid mine drainage and water containing cyanide from different areas of the site (EPA 1994b, EPA1994c, and EPA 1994d). In 2001, EPA issued a Record of Decision for site-wide remedial action (OU5)
9/23/2016
M3-9
designed to address the threats to the environment that remain at the site after completion of emergency and interim remedial actions (EPA, 2001).
The 1997 PHA did not find any ongoing exposures which would result in adverse health effects; therefore, ATSDR classified the Summitville Mine site as “no apparent public health hazard.” However, the PHA reported that cyanide, metals (aluminum, arsenic, cadmium, copper, iron, lead, manganese, and zinc), and sulfate leached into local surface waters from acid mine drainage and release of heap leachate (ATSDR, 1997a). The report indicated potential human exposure to contaminants from the Summitville site could occur through surface water/sediment, groundwater, soil, crops, fish, livestock, and wild game. ATSDR recommended further studies be conducted to identify human exposure pathways.
Site Name City State EPA ID Teledyne Wah Chang Albany OR ORD050955848
A 2009 PHA for the Teledyne Wah Chang site concluded that the site posed “no apparent public health hazard.” The report noted, however, that the surface soils and groundwater at the site were contaminated with volatile organic compounds, PAHs, PCBs and metals (arsenic, beryllium, cadmium, chromium, and nickel) (ATSDR, 2009b). In addition, solid sludges dumped in an unlined area of the plant were highly contaminated. The conclusion of “no public health hazard” was based on the assessment that the public would not have access to contaminated groundwater or surface water used as drinking water sources, and the public would not come in contact with contaminated media which included, surface water, surface soils and sediments. Since 1990, EPA has taken several cleanup actions, including removal of contaminated sludge from the site (completed1993); pumping and treating contaminated groundwater (ongoing); excavating and disposing contaminated creek sediments(completed 1999); and excavations of radium-contaminated soil which was completed in 1999. (EPA, 2010b)
Site Name City State EPA ID Tex-Tin Corp. Texas City TX TXD062113329
The Tex-Tin Corp site posed a public health hazard based on a 2000 HC. A copy of this document could not be located. However, a copy of a 1998 HC prepared by the Texas Department of Health (TDH), in cooperation with ATSDR, was located. This HC evaluated the public health threat based on fish data from two off-site ponds near Tex-Tin Corporation site. Fish data included tests for semi-volatile organic compounds such as PCBs and metals which included aluminum, arsenic, barium, copper, lead, manganese, mercury, selenium and zinc. Based on the review of the available data, TDH concluded an indeterminate public health hazard from ingestion of fish from two ponds (ATSDR, 1998d). Although TDH concluded there is an indeterminate public health hazard, TDH expressed concerns with the concentrations of mercury found in fish, particularly in larger predator species.
9/23/2016
M4-1
Attachment M4. Summary of ATSDR Findings for Nine Additional Sites
Site Name City State EPA ID AKZO Salt Inc Retsof NY NYD002205607 Summary: No report found Site Name City State EPA ID Alaska Gold Nome AK AKD038526620 Background The Alaska Gold Company site is located in Nome County, Alaska, approximately 1.5 miles north of the city of Nome. Since 1899, gold placer deposits have been mined around Nome, Alaska. Placer processing produced concentrated arsenic-bearing minerals, and generated arsenic and mercury containing dredge tailings, which were widely used for building foundations, fill, and roadways. In 1986, an EPA Technical Assessment Team conducted sampling of air, water, soil and sediment in the Alaska Gold Mine site area. Results of the sampling indicated that arsenic and mercury were found in air, water, soil and sediments which were directly linked to mining and gold extraction activities.
Summary of ATSDR findings EPA requested that ATSDR conduct a PHA based on data obtained from sampling of air, water, soil and sediments in the Alaska Gold Mine site area. The resulting PHA reported potential exposure routes for arsenic and mercury contaminants associated with Alaska Gold Site for residents in the area included, drinking of water from contaminated groundwater and surface water; ingestion of contaminated sediments and soils; direct contact with contaminated sediments, soil, groundwater, and surface water; consumption of contaminated fish and other aquatic food species; and inhalation of contaminated vapors and particulate matters.
After reviewing a number of reports and available data, ATSDR concluded exposure to site-related contaminants in drinking water sources pose minimal impact on human health because arsenic and mercury levels in drinking water were below Maximum Contaminant Levels. However, concentration of arsenic and mercury in surface soil were at elevated levels and exposures to soil, particularly, ingestion by small children may pose health risks. In addition, ATSDR also indicated mercury levels in particulate samples were high enough to pose a health risk to local residents.
Site Name City State EPA ID ALCOA (Point Comfort) Point Comfort TX TXD008123168 Background The ALCOA (Point Comfort)/ Lavaca Bay Plant is located near the city of Point Comfort, in Calhoun County, Texas. The site covers 3,500 acres, and includes the ALCOA Plant, a dredge spoil island associated with ALCOA, and portions of Lavaca Bay, Cox Bay, Cox Creek, Cox Lake and western Matagorda Bay. The site is surrounded by surface water bodies, agricultural area and industrial complex. According to 1990 census figures, approximately 1,100 people lived in the city of Point Comfort. Currently, the site operates as a bauxite refinery. In the past,
9/23/2016
M4-2
ALCOA had operated an aluminum smelter at this site from 1948 until 1980. From 1965 to 1979, operations at the site also included a chlor-alkali production plant that produced chlorine gas and sodium hydroxide through an electrolytic process that used mercury. Operations associated with the chlor-alkali production process were responsible for mercury contamination of on-site surface soil, groundwater, air, sediments, fish and crabs. The contamination occurred as a result of mercury-containing wastewater (67 pounds of mercury per day) that was discharged into Lavaca Bay, and the disposing of dredge spoils contaminated with mercury in several areas of the site. Other contaminants of potential concern identified by EPA were volatile organic compounds and lead in shallow groundwater; polychlorinated biphenyls and polycyclic aromatic hydrocarbons in sediment fish and oysters. In April 1988, Texas Department of Health closed the area of Lavaca Bay contaminated with high levels of mercury for fishing. In April 2001, the EPA issued Record of Decision to conduct remedial actions.
Summary of ATSDR Finding In 1995, the Texas Department of Health (TDH) published a PHA for the ALCOA (Point Comfort) site. Based on the elevated levels of mercury found in fish, TDH classified the site as an Urgent Public Health Hazard due to the potential health effects on women of childbearing age and developing fetuses (ATSDR, 1995c). The report also indicated that people who consumed fish and crabs from the portion of Lavaca Bay contaminated with mercury may have been exposed to excessive amounts of mercury.
Site Name City State EPA ID Cabot-Wrought Prop - Div of Cabot Cor, aka NGK Metal Site
Muhlenberg Township PA PAD044540136
Background The NGK Metal site is located in Muhlenberg Township, Berks County, Pennsylvania. The 65-acre complex is surrounded by several light industries and residential land uses. From 1936 to 1965, manufacturing activities at the site included extraction of beryllium hydroxide from beryl ore, and production of beryllium salts and various types of beryllium metal and alloys. In 1965, the extraction of beryllium hydroxide from beryl ore was discontinued. From 1965 to 1992, the plant engaged in operations that included production of beryllium/aluminum, beryllium/copper, and beryllium/nickel alloys; casting, heat treatment, and rolling of beryllium alloys; and chemical and mechanical cleaning of beryllium alloys. During this period, the facility used a series of unlined ponds for sludge settling and wastewater treatment. More specifically, fluoride waste, spent acids, and acidic rinse waters were neutralized by a lime treatment process and allowed to settle in the pond. As the plant grew, a wastewater treatment facility was constructed, ending the use of the ponds for sludge settling and wastewater treatment. According to the 1990 census, a population of 4,927 lived within 1 mile of the site.
Summary of ATSDR Findings According to a 1995 PHA, petitioned by communities surrounding the site, ATSDR found elevated concentrations in various environmental media, on-site and off-site, for contaminants including antimony, arsenic, barium, cadmium, copper, lead, manganese, nickel, nitrate, selenium, thallium, vanadium, and 1,1,1-trichloroethane (ATSDR, 1995a). However, ATSDR could not establish complete exposure pathways for these contaminants. ATSDR also found elevated levels of beryllium, chromium, and 1, 1 dichloroethene with completed exposure
9/23/2016
M4-3
pathways. ATSDR reviewed the available environmental and exposure data, and determined that concentrations detected in the air, water, soil and sediment classified the NGK site as an indeterminate public health hazard.
Site Name City State EPA ID Master Metals Incorporation #2 Detroit MI MID039108824 Background The Master Metals site is located at 4700 and 4740 East Nevada Street, Detroit, Wayne County, Michigan. The facility operated under several company names as lead smelters from 1955 to 1983. In 1984, Synergy Production Group, Inc. processed ferrous sulfate hyptahydrate on the site. The site is currently abandoned and owned by the state of Michigan. The land use surrounding the site includes industrial, commercial and residential use. The closest residential area is located 100 feet from the site. According a 1997 EPA action Memorandum (as cited in HC, 2005), within a 1-mile radius of the site, 86% of the population were minorities and the median income was $17,621.
Beginning in 1996, the EPA conducted Site Assessments, which showed levels of lead, antimony and arsenic exceeding the Michigan Department of Environmental Quality generic criteria for industrial, commercial and residential use. The EPA also discovered laboratory chemical and other hazardous waste on-site in marked containers.
Summary of ATSDR Findings In 1997, EPA asked the Michigan Department of Community Health (MDCH) to evaluate the associated health risks. In a 1997 HC, MDCH and ATSDR indicated that the abandoned lead smelting site lacked effective restriction from trespassers. Therefore, the (MDCH) and ATSDR concluded the Master Metals site posed a public health hazard based on the high concentrations of lead found in the surface soil of the property (ATSDR, 1997). In addition, the report indicated that abandoned buildings on the property posed physical hazards from deterioration and partial collapse and from laboratory chemicals left when they were vacated. A follow-up HC published in 2005 concluded that the site poses no apparent public health hazard (ATSDR, 2005). MDCH reached that conclusion based on remedial actions taken by responsible parties working under an Administrative Order on Consent with EPA, which removed the lead contaminated soil from the residential properties and from the plant site.
Site Name City State EPA ID Phelps Dodge Corp Douglas Reduction Works (non-NPL)
Douglas AZ AZD008397143
Background The Phelps-Dodge Corporation Douglas Reduction Works site is located in Cochise County, Arizona, about 1 mile west of Douglas. The site occupies approximately 2,000 acres of land. The site consisted of two copper smelters: The Calumet and Arizona Company smelter, built in 1902; and the Copper Queen smelter, which had operated from 1904 until 1931. The Calumet and Arizona Company was later purchased by Phelps-Dodge Corporation and operated as the Douglas Reduction Works until 1987. During its operation, copper and other metals were smelted at the facility. As a result of this process sulfur dioxide and particulate matter were released through two 600-foot stacks. Air quality monitoring done by the Arizona Department of Environmental Quality from 1967 to 1987, found elevate levels of sulfates,
9/23/2016
M4-4
arsenic and lead particulate in outdoor air in Douglas. Due to the continued violations of EPA’s National Ambient Air Quality Standards (NAAQS), the smelting operation was finally ceased in 1987.
Summary of ATSDR findings This site contributed to lead-contaminated surface soils in residential areas of Douglas. ATSDR classified the Phelps Dodge Corp site as a public health hazard because of past and present long-term exposure of children to site-related lead contaminated soils (ATSDR, 1995b). Furthermore, ATSDR indicated chronic exposure to lead in the air was an additional source of lead exposure for children and may have resulted in respiratory problems in sensitive sub-populations, such as children and adults with respiratory ailments. The report also indicated that the site may have been responsible for past emissions of contaminants including arsenic, sulfur dioxide, inhalable particulate matter and other heavy metals. (ATSDR, 1995)
Site Name City State EPA ID REMACOR, INC. West Pittsburg PA PAD074965096 Background The Remacor site is located in West Pittsburg, Lawrence County, PA. The closest residential area is located 1/3 mile east of the site. Within a 1 mile radius of the site, the population is about 1,054. Currently the company uses magnesium scrap to produce powders and granules for the steel industry. As a result of this process, the plant generated magnesium and lime waste, magnesium oxide waste, and process wastewater. In 2005, magnesium materials at the plant ignited causing a fire which destroyed a building and processing equipment at the facility. Since then, the company was found in contempt of a court order for failing to perform remedial action outlined in a state consent decree.
In March 2006, results of an EPA site inspection demonstrated the presence of public and site-specific hazards, which include unsecured facility from trespassers, debris and spills widely dispersed on site, unsecured stored magnesium materials in drums or large super sack containers, chemical storage warehouses with leaky roofs or lacking doors, placarding of hazardous material storage areas was not evident, mislabeled drums, chemical runoff was observed in several locations, and surface runoff was openly entering storm drains. Further site inspection also identified the presence of radioactive materials cesium-137 and thorium-232 on site. EPA conducted removal actions and related actions including securing the Site with 24-hour security services, repairing the perimeter fence, establishing runoff controls, marking and covering or excavating areas of elevated radiation, and conducting limited excavations in spill areas.
Summary of ATSDR Findings In a 2007 HC, ATSDR indicated that the Remacor site was unsecured, and trespasser or workers at facility would be exposed to radiation beyond the ATSDR Minimum Risk Level of 100 millirem per year in as few as 200 hours (ATSDR, 2007c). In addition to radiation exposures, ATSDR also identified other public hazards, including high potential for fire related to magnesium, potential inhalation of smoke containing radioactive material, contaminations of the stream with radioactive materials. Because the site is unsecured and the
9/23/2016
M4-5
radiation levels exceed estimated background by as much 25 times, ATSDR concluded that the site posed a health hazard to the surrounding community.
Site Name City State EPA ID Scott OM & Sons Co Marysville OH OHD99083448 Background The Scotts Company (formerly O.M. Scott and Sons Company) was a Vermiculite beneficiation facility, which used an exfoliation process using vermiculite to produces consumer products. The site is located at Marysville, Union County, Ohio. The facility occupies 830 acres, which includes corporate offices, warehouses and an operating facility that manufactures fertilizers and pesticides. The facility began operation in1957. The area surrounding the facility includes open fields, wooded area, highways and residential area. According to the 1990 census, there were 58 housing units and a total population of 185 people within 1 mile of the site.
According to EPA records, from 1967 to 1980, the Scotts Company facility was the single largest consumer of vermiculite ore from the Libby mines in Montana. During this period receiver and exfoliated over 430,000 tons of Vermiculite from Libby. Vermiculite from Libby was found to contain several types of asbestos fibers, including the amphibole asbestos varieties tremolite and actinolite. After 1980 the facility switched from using Libby ore to using ore from Africa, South Carolina and Virginia, until the company phased-out the use of vermiculite from its products in 2001.
Summary of ATSDR Findings According to a 2005 HC, ATSDR classified this site as a public health hazard because workers at the site were exposed to airborne levels of Libby asbestos above the existing occupational standard (OSHA PEL) at the time of the report (ATSDR, 2005). In addition, household members of former workers may have been exposed to elevated levels of Libby asbestos through asbestos carried home on workers’ hair and clothing. Under these conditions ATDSR concluded public health hazard for households of former workers. Current workers at the site are not being exposed to Libby asbestos; therefore, it poses no public health hazard. However, current workers may be exposed to asbestos if future disturbances of on-site landfills that may contain asbestos occur.
Site Name City State EPA ID St. Louis Smelting & Refining Co Collinsville IL ILD980607006 Background The St. Louis Smelting and Refining site is located in a residential area of Collinsville, in Madison County, Illinois. The plant covered as many as 482 acres, with the primary operations covering approximately 40 acres. The Smelter and Refining Company operated a lead smelter at the site from 1904 to 1933. After the facility closed, all of the smelting and refining equipment was shipped to South America and the buildings were razed. The remaining slag and waste piles were either recycled for lead or otherwise moved off the site, with the remainder spread across the site. Residential areas (Pine Lake developments) were built on or near the site in the 1950s, and additional residential developments (Collinwoods subdivision) were built on the site in the 1970s and 1980s, where slags were still visible on the soil surface. Surface soil sample taken from Collinwoods division indicated the presence of contaminants
9/23/2016
M4-6
including lead, cadmium, and antimony. Nearby surface water (Pine Lake), which was used by the smelting operations and its sediments, were also contaminated with lead.
Summary of ATSDR findings After a request by Illinois Environmental Protection Agency, ATSDR conducted a PHA in 2006. The PHA concluded that the St. Louis Smelting and Refining site posed a public health hazard based on exposure to lead in residential soils. Although the public health hazard was only issued for lead contamination, the report indicated residential surfaces soils were also contaminated with elevated concentrations of arsenic, cadmium, and antimony. In addition, the report indicated that residents may be exposed to lead in sediments in nearby surface water (Pine lake), which was used by the smelting operation. (ATSDR, 2006b)