Appraisal of the Tin and Tungsten Expansion Project - World ...
185
Report No. 1351-BA Burma Appraisal of the Tin and Tungsten Expansion Project February 8, 1977 Industrial ProjectsDepartment FOR OFFICIALUSE ONLY Document of the World Bank This document hasa restricteddistribution and may be used by recipients only in the performance of their officialduties. Its contentsmay not otherwisebe disclosed without World Bank authorization. Public Disclosure Authorized Public Disclosure Authorized Public Disclosure Authorized Public Disclosure Authorized Public Disclosure Authorized Public Disclosure Authorized Public Disclosure Authorized Public Disclosure Authorized
-
Upload
khangminh22 -
Category
Documents
-
view
1 -
download
0
Transcript of Appraisal of the Tin and Tungsten Expansion Project - World ...
Report No. 1351-BA
BurmaAppraisal of the Tin andTungsten Expansion ProjectFebruary 8, 1977
Industrial Projects Department
FOR OFFICIAL USE ONLY
Document of the World Bank
This document has a restricted distribution and may be used by recipientsonly in the performance of their official duties. Its contents may nototherwise be disclosed without World Bank authorization.
Pub
lic D
iscl
osur
e A
utho
rized
Pub
lic D
iscl
osur
e A
utho
rized
Pub
lic D
iscl
osur
e A
utho
rized
Pub
lic D
iscl
osur
e A
utho
rized
Pub
lic D
iscl
osur
e A
utho
rized
Pub
lic D
iscl
osur
e A
utho
rized
Pub
lic D
iscl
osur
e A
utho
rized
Pub
lic D
iscl
osur
e A
utho
rized
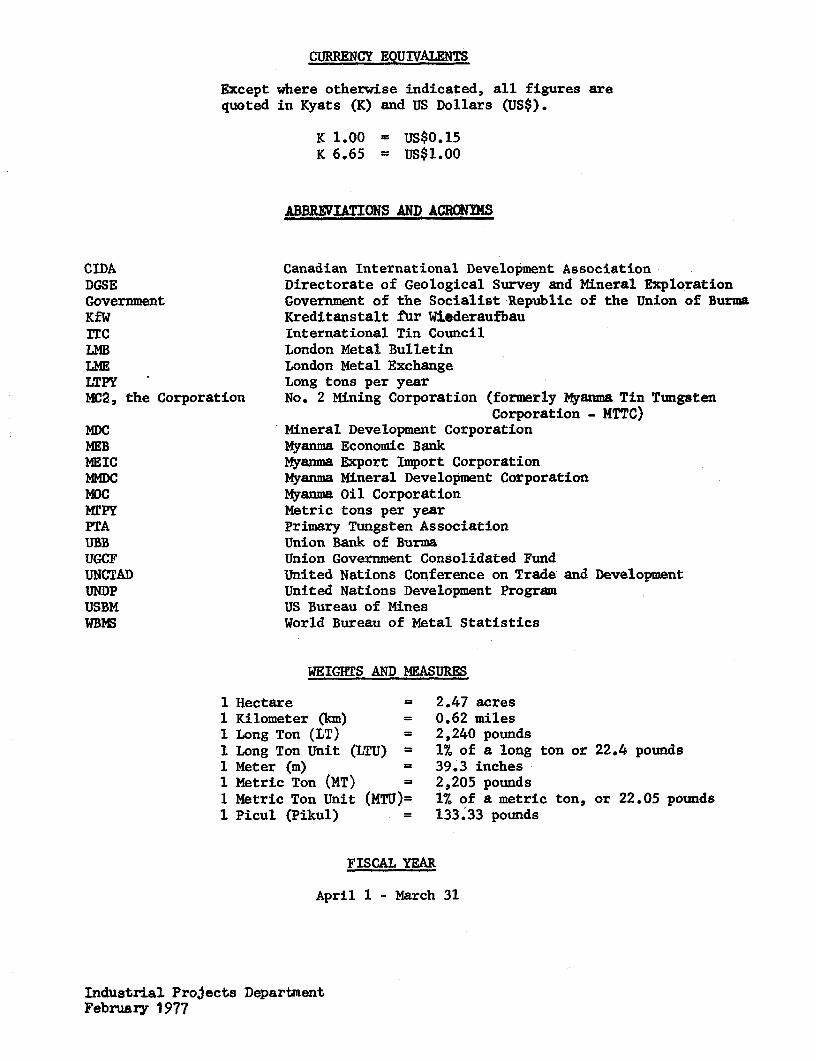
CURRENCY EQUIVALENTS
Except where otherwise indicated, all figures arequoted in Kyats (K) and US Dollars (US$).
K 1.00 = US$0.15K 6.65 = US$1.00
ABBRIVIATIONS AND ACRONYMS
CIDA Canadian International Development AssociationDGSE Directorate of Geological Survey and Mineral ExplorationGovernment Government of the Socialist Republic of the Union of BurmaKfW Kreditanstalt fur WiederaufbauITC International Tin CouncilLMB London Metal BulletinLME London Metal ExchangeLTPY Long tons per yearMC2, the Corporation No. 2 Mining Corporation (formerly Myanma Tin Tungsten
Corporation - MTTC)MDC Mineral Development CorporationMEB Myanma Economic BankIMEIC Myanma Export Import CorporationMMDC Myanma Mineral Development CorporationHOC Myanma Oil Corporation1'PY Metric tons per yearPTA Primary Tungsten AssociationUBB Union Bank of BurmaUGCF Union Government Consolidated FundUNCTAD United Nations Conference on Trade and DevelopmentUNDP United Nations Development ProgramUSBM US Bureau of MinesWBMS World Bureau of Metal Statistics
WEIGHTS AND MEASURES
1 Hectare = 2.47 acres1 Kilometer (km) = 0.62 miles1 Long Ton (LT) = 2,240 pounds1 Long Ton Unit (LTU) = 1% of a long ton or 22.4 pounds1 Meter (m) = 39.3 inches1 Metric Ton (MT) = 2,205 pounds1 Metric Ton Unit (MTU)= 1% of a metric ton, or 22.05 pounds1 Picul (Pikul) = 133.33 pounds
FISCAL YEAR
April 1 - March 31
Industrial Projects DepartmentFebruary 1977
FOR OFFICIAL USE ONLYBURMA
APPRAISAL OF THE TIN AND TUNGSTEN EXPANSION PROJECT
TABLE OF CONTENTS
Page No.
SUMMARY AND CONCLUSIONS . ........................... . . . . . i-iii
I. INTRODUCTION ........................................ ............... 1
II. THE MINERAL SECTOR .. * * * * * * * ................................... ... 1
A. Present Position and Recent Trends ................ . 1B. Impact on the Economy .......oe .... o........ ....... 2C. Structure .. .. *......... ....... o ............ ....... 3D. Legislation and Operational Guidelines
for the Sector ...... ....................... 3E. Mineral Potential and Exploration 4........... a... 4F. Planned Sector Investment and Needs ............... 4
III. THE MARKET .................. o.o. ..................... 6
A. The International Tin Market ....................... 6
1. International Demand and Supply ......0 ........ 62. International Tin Agreements .................. 73. Price Structure and Projections 8............. 84. Marketing Arrangements ..... ................... 8
B. The International Tungsten Market ... .. ........... 9
1. International Demand and Supply ............... 92. Price Structure and Projections ............... 103. Marketing Arrangements ...... ..............
IV. THE CORPORATION ........................................... 1
A. Operations ......... o ......................................... .o. 11
1. Mining Facilities and Output .................. 112. Production Costs ... ............................. 12
B. Past Performance and Financial Condition ........... 12C. Organization and Management .................... *.... 15D. Accounts and Audit ..... . ............................ 16E. Ore Reserves ... ............... ............ ..... ... 16
This report was prepared by Messrs. H.E. Wackman, R. Rodger, and S. Greigof the Industrial Projects Department and Mr. A. Freyman (Consultant).
This document has a restricted distribution and may be used by recipients only in the performanceof their official duties. Its contents may not otherwise be disclosed without World Bank authorization.
-2-
Page No.
V. THE PROJECT ............... .... ......**. **.......... 16
A. Technical Description . ..................... 17
1. Heinze Basin Dredging Project and Concentrator. 172. Central Concentrator at Tavoy ................. 183. Gravel Pump Mining Project .................. 194. Technical Assistance ................. *...... 195. Other Expansion Plans.. 206. Sector Study ......... 20
B. Environmental Aspects ......... .. . ..... .......... 20C. Capital Costs........ 20D. Financing Plan . ... 22
VI. PROJECT IMPLEMENTATION... .o. ...... 23
A. Project Organization and Management 23B. Project Schedule ... ............. .............. 23C. Procurement ... o ......... ............ ...... .. 23D. Allocation and Disbursement of IDA Credit .......... 24
VII. FINANCIAL ANALYSIS ... ....... ...... ...... ... 24
A. Project Operating Costs and Revenues .24
B. Financial Rate of Return 24C. Break-Even Point ........ . 25D. Overall Profitability .......... 25E. Financial Position and Covenants ...... 26F. Major Risks ....... ........................... 28
VIII. ECONOMIC JUSTIFICATION ......... . ........ ............... 28
A. Economic Rate of Return ............................ 28B. Foreign Exchange and Other Benefits .... o .......... 29
IX. AGREEMENTS...... ......... 29
ANNEXES
1 Glossary of Technical Terms
2 The Burmese Mineral Sector
3-1 The Tin Market3-2 The Tungsten Market

- 3-
4-1 Description of Operations4-2 Historical Financial Statements4-3 Organization and Management
5-1 Description of the Project5-2 Capital Costs
6-1 Project Organization and Management6-2 Terms of Reference for Consultants6-3 Project Schedule6-4 Allocation of IDA Credit6-5 Disbursement Schedule
7-1 Detailed Operating Costs7-2 Breakeven Point7-3 Financial Rate of Return and Sensitivity Analysis7-4 Assumptions Used in Financial Projections7-5 Projected Income Statements7-6 Projected Sales7-7 Projected Production Costs7-8 Projected Output by Mine7-9 Projected Balance Sheets7-10 Projected Sources and Applications of Funds7-11 Capital Cost Estimates7-12 Working Capital Requirements7-13 Depreciation Schedule7-14 Debt Repayment Schedule
8-1 Economic Rate of Return and Sensitivity Analysis8-2 Estimated Foreign Exchange Savings
MAPS
IBRD 12322 - Main Mining Centers and DepositsIBRD 12524 - Tenasserim Division

BURMA
APPRAISAL OF THE TIN AND TUNGSTEN EXPANSION PROJECT
SUMMARY AND CONCLUSIONS
i. The Government of Burma and the No. 2 Mining Corporation (formerlythe Myanma Tin Tungsten Corporation) have requested a US$16 million creditfor a project to reintroduce dredging to the tin mining industry of Burma.The project would include a dredge and associated beneficiation and infra-structural facilities, gravel pump mining equipment, and a central concen-trating plant designed to upgrade tin and tungsten ores from various mines.The project is located about 300 km south east of Rangoon in the TenasserimDivision of Burma. Output of tin concentrates (about 75% tin) would be ex-panded by about 800 long tons per year (LTPY) and the improved upgradingfacilities would produce better quality, higher grade tin and tungsten con-centrates than are presently produced, thus making them more marketableand able to bring higher prices. Also included in the project is a study ofthe future development of the mineral sector, with a view to the identifica-tion of further projects. Financing requirements for the project are estimatedat about US$28 million.
ii. Burma's mineral sector has considerable potential for expansion,but it has experienced a long period of decline due to war damaged facili-ties, nationalization of private mining interests, a lack of technical ex-pertise and investment capital, and the smuggling of mineral products, anactivity made attractive by the distorted exchange rate for the Burmesekyat. Nearly all of the sector's output is exported, and although foreignexchange revenue for minerals presently constitutes only about 7% of totalexport earnings, it has significant potential for expansion, particularlyin tin, tungsten, copper, lead, zinc, gems, jade and antimony.
iii. At present, no foreign investment is allowed in mining. Therehas, however, been increased sector activity in recent years, particular-ly with technical assistance from Germany, Japan and the UNDP. Numerousstudies have been done but few projects have as yet entered the executionstage. The best prospects include the proposed tin and tungsten expansion,and development of the existing Bawdwin lead/zinc/silver mine, which isthe country's largest mining operation, but which has serious operatingand financial difficulties. Large projects are difficult to put togetherdue to the lack of project preparation experience in the country, the prob-lem of obtaining sufficient funds given the shortage of domestic resources,and the reluctance of the Government to come to firm agreements on projectpriorities, financing sources, and the extent and nature of foreign partici-pation. Otler problems affecting investment in the sector are insurgencyactivities in certain parts of the country, the above-noted distorted ex-change rate for the kyat, and the high tax levels which have recently beenintroduced on imported equipment and production. Projects which may have veryattractive returns to the economy tend to be somewhat marginal financially, asituation which could act against stimulating the interest of prospective

- ii -
financing institutions, and which could lead to a misallocation of resourcesin the economy.
iv. There are five mining corporations; they are all Government ownedand operate under a system of highly centralized financial and managerialcontrol, with all policy decisions being made at the level of the Ministerof Mines or the Economic Committee of the Council of Ministers. There havebeen some recent measures to extend more autonomy and responsibility to thecorporations but steps to put these intentions into practice will likely beslow and cautious, since both the Government and the corporations are soaccustomed to close control that it will likely be some time before muchautonomous behavior results.
v. The No. 2 Mining Corporation is the best prospect for IDA partici-pation in the mining sector at this time. Its senior staff are technicallycompetent and experienced in tin mining. The Corporation has adequateproven reserves for further expansion and it is in a financially sound posi-tion. Furthermore, its operating costs are in the lower range of inter-national tin and tungsten mining costs and should continue to be at a competi-tive level even after some capital intensive mechanization, which is a pre-requisite for obtaining a higher value product. The technology being used inthe project represents a degree of modernization appropriate to the Burmesesituation, and will be introduced in conjunction with a reasonable level ofoutside technical assistance. With the start-up during 1977 of a KfW-financed expansion of one of its major tin mines, the Corporation is expectedto be in a strong position to continue its expansion with the IDA-financedproject.
vi. It is expected that tin demand will show modest growth, supply/demand will be in reasonable balance, and that there will be continuanceof a modest long term upward trend in real tin prices. International TinCouncil buffer stock operations should also, in the future, moderate interna-tional price fluctuations, especially on the downside. Demand for tungstenis expected to continue strong and the price outlook is good. Prices maywell be more stable in the future, with some prospects for producer coopera-tion on stabilizing prices. Even with the proposed expansion, Burma willstill be a very minor supplier to the international markets for both tin andtungsten. With the improved product quality that will result from the project,the country should be able to market its concentrates readily.
vii. The project is not overly complex, and is based on feasibilitystudies which incorporate Malaysian experience under very similar operatingconditions and with very similar ores. Although the Corporation is inex-perienced in dredging and the operation of more modern facilities, theinvolvement of experienced consultants throughout the project, and opera-tional supervision for a minimum of two years after start-up should mini-mize the technical risk. Also included in the project will be overseastraining of the key Burmese technicians. Ore reserve estimates are conser-vative, and operating assumptions make due allowance for Burmese conditions.
- iii -
The project execution time is fairly short (about 3 years with the gravel pumpmining components perhaps coming on-stream sooner), and all facilities areexpected to be in operation by early 1980.
viii. The project will be financed by the proposed IDA credit (US$16.0million), the Corporation's internal cash generation (US$5.8 million), andGovernment funds (US$6.0 million) to be provided either in the form of equityor debt. The credit will finance the c.i.f. value of imported equipment andmachinery and the foreign exchange costs of the consultancy assistance, butno local expenditures, which will all be covered by Government/Corporationresources. All imported goods will be subjected to international competi-tive bidding, except for some small items of highly specialized equipment,estimated to total about US$1.0 million, for which international shoppingwill be used.
ix. The financial situation of the Corporation is projected to be soundboth during and after project execution, although the financial rate of re-turn is expected to be only 10% after the commodity tax on production value(13.7% before the tax). These low returns are due to the very high taxburden, the distorted exchange rate, and lower grade reserves which will beencountered by the dredge in the later years of operation. Nevertheless, theeconomic rate of return is estimated at 21%. Net foreign exchange benefits tothe economy are projected to average US$4.6 annually (in real terms) over theproject life and substantial additional revenues will accrue to the Governmentthrough import and production taxes and from interest on the on-lending of thecredit proceeds. Wider economic benefits will result through some increasedemployment, the technical training involved, and the inclusion of infrastruc-tural facilities in the project. Overall, the project will represent asubstantial forward step in the rehabilitation of Burma's tin industry, andmake a valuable contribution towards reversing the long downward trend in thesector, which has the potential for a greatly expanded contribution to Burma'seconomic development.
x. The risks of this project are basically threefold and acceptable.First, the Corporation is inexperienced in dredging and the more modernconcentrating operations to be introduced and certain weaknesses exist inproject implementation management; these are intended to be overcome by theprovision of experienced assistance in these areas. Secondly, tin and tungstenprices could be lower than projected. Offsetting this risk is the influenceof the International Tin Council, the prospects of increased cooperationamong tungsten producers, and the important fact that the Corporation isa producer of both tin and tungsten whose prices do not necessarily followidentical trends and have good long term prospects. Thirdly, potentialinsurgency activities present some risk, but these have been kept undercontrol in the area and the nearby KfW project has not been affected adversely.
xi. Based on the agreements summarized in Chapter IX of this report, theproject is suitable for an IDA credit to the Government of Burma of US$16million equivalent, with onlending to the No. 2 Mining Corporation of US$15.8million equivalent for a period of 15 years, including 5 years grace, at 10%interest per annum, and US$0.2 million equivalent used by the Government tofinance the mineral sector study.

I. INTRODUCTION
1.01 The Government of Burma and No. 2 Mining Corporation (MC2), theGovernment-owned tin and tungsten mining company, have asked IDA for a creditof US$16 million equivalent, US$15.8 million equivalent of which would financethe foreign exchange costs of a project to expand production of tin concen-trates by 800 long tons per year (LTPY). The remaining US$0.2 million is fora study of the future development of the mineral sector. The tin/tungstenproject, which is estimated to require financing of US$27.6 million equivalent,is located in the Tenasserim Division of Burma (Map IBRD 12322) about 300km. south east of Rangoon.
1.02 The project was appraised in Burma in March and August 1976 bymissions consisting respectively of Messrs. H.E. Wackman (Chief) andR. Rodger of the Industrial Projects Department and Mr. A. Freyman (Con-sultant), and Messrs. Wackman and Greig (Industrial Projects). A glossaryof technical terms is contained in Annex 1.
II. THE MINERAL SECTOR
A. Present Position and Recent Trends
2.01 Based on official statistics (below and Annex 2), Burma's mineralproduction is presently less than one-tenth of pre-World War II levels. Whileinclusion of smuggling activities in the figures would increase reported pro-duction in recent years by perhaps as much as 40%, the long-term sectoraldecline is obvious.
Production of Major Minerals in Burma
(000's long tons)
FY 1939 FY 1962 FY 1971 FY 1975 FY 1976
Tin Concentrates 5.4 0.9 0.5 0.5 0.6Tungsten Concentrates N/A /a 1.5 0.3 0.6 0.5Tin/Tungsten MixedConcentrates 5.6 N/A /a 0.4 0.4 0.4
Silver (million ounces) 6.2 1.4 0.8 0.4 0.2Refined Lead 77.0 16.6 8.7 4.9 2.4Zinc Concentrates 61.7 14.2 7.0 5.1 4.4
/a Not available.
2.02 Burma holds a very minor position in the world production andtrade of mineral products although nearly all of its non-fuel mineral outputis exported. It currently accounts for less than 1% of world tin production,about 1.5% of world tungsten production, and under 0.2% for zinc, lead andsilver.
-2-
2.03 Despite considerable potential for development, much of the mineralsector remains in the decimated state which resulted from the War. No signi-ficant new mines have been opened for 40 years, reflecting the progressiveGovernment take-over of private activities (especially during the 1950'sand 60's), which are now limited to illegal mining and tribute mining 1/ oftin and tungsten by small groups of individuals. Overall, the Governmenthas emphasized investment in other sectors which, combined with the shortageof foreign exchange, has left the mining sector with poor and outmoded plantand spare parts shortages which hamper operations. Other factors contributingto the decline of mining in Burma include: the lack of experience in projectpreparation and execution; extensive insurgency activities in large areas ofthe country where minerals can be produced; labor shortages at some mines dueto low wages and more attractive alternatives including illegal mining andtrade; and a distorted exchange rate for the kyat which is partly responsiblefor the financial weakness of mining corporations, results in marginal finan-cial returns for most new projects, and encourages diversion of a significantproportion of sector output into illegal trading. The Bank is discussing withthe Burmese authorities steps, including price adjustment, by which theillegal flow of tin and tungsten can be directed to official purchasers.
2.04 Government policy does not allow direct foreign or private partici-pation in development of the sector -- an exception has been the recent adventof joint ventures in petroleum exploration involving foreign oil companies.In the non-petroleum mining sector, however, foreign participation has beenlimited to bilateral and multilateral technical assistance and financial aid.This has picked up in recent years and should result in a reversal of mining'slong-term downtrend. Agencies which have been particularly active are: KfWof Germany, Metals Mining Agency of Japan, UNDP, Canadian International De-velopment Association (CIDA) and, with the proposed project, IDA. While areasonable degree of technical competence exists at various levels in thesector's institutions, management abilities are limited by a lack of innova-tion and initiative. Substantial projects in the sector could not be ade-quately prepared and implemented without extensive outside technical assis-tance in addition to the essential outside financial resources.
B. Impact on the Economy
2.05 While the mineral sector in Burma contributes slightly over 1% ofGDP and less than 1% of official employment, mineral exports average about7% of total export value. Domestic consumption of the metallic mineralsproduced is negligible. There are no substantial smelting, refining orother value-adding facilities other than an antiquated lead/zinc smelter.Despite the relatively low level of employment (about 28,000 workers), thesector provides employment opportunities in areas of the country where theseare often limited. Although there is little scope to increase the relativeimpact of the sector on employment, the opportunity for increased foreignexchange earnings from expanded sector output is substantial (para 2.15).
1/ Tribute miners are independent individuals who work tin/tungsten depositsunder the loose supervision of MC2's staff, and sell their production tothe Corporation. Part of their output is undoubtedly smuggled out, however.
-3-
C. Structure
2.06 A small number of government corporations, which are essentiallypart of the Ministry of Mines, are responsible for all official productionof minerals. These include: the Myanma Bawdwin Corporation (now No. 1 MiningCorporation or MCI) responsible for lead, zinc and silver production, with.50%-60% of sector output; the Myanma Tin Tungsten Corporation (No. 2 MiningCorporation), responsible for tin and tungsten production with 30%-40% ofsector output; the Myanma Mineral Development Corporation (No. 3 MiningCorporation), responsible for production of antimony and coal and the de-velopment of copper deposits; the Industrial Minerals Corporation (No. 4Mining Corporation), responsible for production of limestone, gypsum andother non-metallic products; and the Gem and Jade Corporation, responsiblefor production and marketing of jade, rubies, pearls and other gems.
2.07 There are two main supporting entities within the Ministry: TheDepartment of Geological Survey and Mineral Exploration (DGSE), responsiblefor exploration and geological studies; and the Department of Planning andWorks Inspection, responsible for mine inspection, safety, planning andstatistics. The Myanma Oil Corporation (MOC) is charged with oil and gasexploration and production. The Myanma Export Import Corporation (MEIC), apart of the Ministry of Trade, was responsible for all export sales ofmetallic products until late 1976, but this function has now been vested in aMinerals Marketing Committee which is jointly administered by the threemetal producing corporations; i.e. Mining Corporations Nos. 1, 2, and 3.
2.08 Although called corporations, their status as separate legal enti-ties is vague and they have extremely limited autonomous power. There areno shares or similar instruments, ownership is by the people, and effectivelycontrol is vested in the State. In the past, all revenues have gone to theUnion Government Consolidated Fund (UGCF), with operating and capital expendi-tures being drawn from the Fund under extremely rigid budgets approved by theGovernment. Overall, the corporations have had little effective control overtheir financial resources and the UGCF has been the sole source of financeother than a few bilateral credits on-lent through the Union Bank of Burma.The responsibilities and powers of the mining corporations have been purelyoperational and all policy decisions have been taken by the Minister of Minesor the Economic Committee of the Council of Ministers. Some liberalization ofthis highly centralized management and financial control is envisaged undernew guidelines described below.
D. Legislation and Operational Guidelines for the Sector
2.09 When the agency formerly responsible for all mining activities inBurma (the Mineral Development Corporation) was subdivided in 1972, legisla-tion was approved for each new corporation, outlining its powers and respon-sibilities. In MC2's case (the entity responsible for executing the proposedproject), this was contained in the Myanma Tin Tungsten Corporation Act of1974. In May 1975, "Standard Guidelines for the Operation of State EconomicEnterprisest' were issued by the Ministry of Planning and Finance. Underthese guidelines, more autonomy and financial responsibility is intended torest with the corporations and new fiscal and financial measures are being

-4-
introduced. While the system of annual budgets is to be maintained, the UGCFfund has been discontinued. Corporations now have their own bank accountsand will meet operating expenditures out of their own receipts.
2.10 Part of net cash generation can now remain with the corporations tooffset a portion of fixed and working capital needs. Capital expenditureswill no longer be met through interest-free budgetary allocations; necessaryfunds must be borrowed from the newly-formed Myanma Economic Bank. Eachenterprise is set an annual operating ratio target (defined as the ratio ofoperating expenditures to revenues) to be used as one of the bases for the newemployees' bonus system. Producing corporations also now have more influenceover their own marketing (para 4.15). There will also supposedly be morerecognition of foreign exchange earners in the allocation of the country'sscarce foreign exchange resources. The changes are being introduced cautiously.Although implementation commenced in April 1976, the Government and theCorporations are so accustomed to close control that it will likely be sometime before much autonomous behavior results.
E. Mineral Potential and Exploration
2.11 Burma has a highly varied and favorable mineral endowment whichjustifies a strong effort in mapping and exploration. There have beennumerous foreign technical assistance missions in this respect adding tothe resources assessment from the pre-War Geological Survey of India workand post-War work by the DGSE and forerunner organizations.
2.12 Due to insurgency problems, however, large tracts of the countuyhave not been geologically mapped or prospected in any detail, and geologicalmissions are assigned only "secure" areas for exploration. A systematic in-ventory of mineral reserves which would certainly aid sector developmentstrategy thus has not been developed. The priorities for exploration aretin/tungsten, lead/zinc, copper and nickel, a ranking consistent with theexploitable potential of Burma's known mineralization. Known reserves alonehave an estimated potential export value of some US$1.5 billion at presentmineral prices.
F. Planned Sector Investment and Needs
2.13 Given mining's potential for augmenting Burma's foreign exchangeearnings, the Government has given high priority to the sector and recentpolicy has opened the way for external technical assistance and finance.Significant contributions have come from the Federal Republic of Germany(Heinda Tin Mine Expansion, exploration and geological work in tin and lead/zinc, and appraisal of a project at the Bawdwin mine); Japan (appraisal of acopper mining and concentrator project at Monywa); and the UNDP (a number ofprojects in exploration, feasibility studies and training). A number of othercountries have also provided technical assistance, but apart from the Heindaexpansion, no significant new development has resulted so far.
2.14 The Government's near-term development strategy is to: rehabili-tate old tin tungsten mines and the Bawdwin lead/zinc/silver mine; exploit

-5-
the Monywa copper deposit; commence tin dredging at Heinze Basin (the projecthere considered) and carry out a number of smaller projects in antimony,gemstones and tin/tungsten. These priorities are sound but realization islikely to be slow due to shortcomings in project preparation and executionabilities, the limited foreign exchange resources that can be attracted, andthe limited local funds available. The distorted exchange rate for the kyatcompounds the above difficulties. For example, following a recent appraisal,a bilateral institution decided to scale down drastically its financing of alimited modernization project at Bawdwin, partly for security reasons, butalso due to its poor financial return. In addition, both Monywa and HeinzeBasin are financially marginal projects even though reasonable shadow-pricingof foreign exchange costs and benefits produces very attractive economicreturns. For significant redevelopment of the sector to take place some meansof augmenting the foreign exchange revenues of export-oriented projects andinstitutions may have to be found.
2.15 Despite the above-mentioned difficulties, the sector has the poten-tial t6 approach an export level of US$35 million (1976 prices) by FY 1981,from US$19 million in FY1974, assuming the envisaged expansion and productquality improvement in tin/tungsten, tighter security over gem production,improved gem marketing procedures, and some expansion in antimony. By themid-80's, exports could approach US$100 million annually assuming two majorprojects like Monywa or Bawdwin are executed, or one of these is done inparallel with minor improvements in, for example, tin/tungsten, gem stones,jade, or antimony. Growth of this latter magnitude is not conditional onnew mineral discoveries but would require sector investment of at leastUS$200 million (1976 prices) over the next 5-10 years combined with tech-nical assistance for project preparation, execution and early operation.Potential would be substantially greater if illegal exports could be broughtinto the official sector and more active foreign participation were allowed.
2.16 While the development impact of larger sized projects is greater,execution could overtax Burma's limited financial, technical and managerialresources and require a level of outside technical participation which wouldbe unacceptable to the Government. The Government intends to push for imple-mentation of a number of projects, both large and small, but the limitationsoutlined may force it to be very selective in those chosen for advancement.Also, despite the expressed interest of certain bilateral financing sources,the Government has been slow in pushing potential projects to the executionstage.
2.17 The Bank's role in sectoral development could be threefold. Firstpriority should be in financing specific projects such as the proposed tin/tungsten expansion, thereby establishing a record of successful experience inthe sector. Second, the Bank can, through consultants, help to identify andselect development priorities from the longer term alternatives. Part(US$200,000 equivalent) of the proposed credit will be used for this purpose(para. 5.16). Third, the Bank could act as a catalyst for other sources offinance to enable larger projects to be undertaken, quite possibly underjoint/parallel financing arrangements. The newly-formed Aid Group for Burmais expected to serve as a useful coordinating mechanism in this respect.
-6-
III. THE MARKFT
3.01 The international markets -or tin and tungsten, including mineralreserves, uses, and past and future trends in production, consumption andprices are described in detail in AunL-xes 3-1 and 3-2 respectively.
A. The International Tin Market
1. International Demand and Supply
3.02 Demand: Tin is a malleable and ductile white metal primarilyused in improving the properties of other materials. About 95% of tin con-sumed is in metallic form, with developed countries accounting for 75Z ofworld consumption. Tinplate and solders are the most important outletsfor tin metals, accounting for about 47% and 23% of all tin consumed inindustrialized countries. Between 1955 and 1972-74, consumption of tin grewat 1.7% per annum. This low rate of growth reflects, in part, the substi-tution of tinplate in cans by tin-free steel and aluminum. Also, technicalinnovations have reduced the amount of tin contained in tinplate. Of theother important end-uses, solder expanded quite slowly in the post-war period,while the use of tin in bronze and brass declined sharply.
3.03 Future demand will continue to depend to a large extent on tinplatefor containers. In developed countries, it is expected that the containerindustry will continue to grow steadily, but technological substitutionwill allow only a modest growth in tin use. In developing and centrallyplanned economies, the substitution effect will be more moderate and tindemand growth should be proportionately greater. Overall, world demandis projected to increase at only 1.5% per annum between 1972-74 and 1985,and will likely be below this trend rate until the late 1970's. There-after, the effect of lower real prices (para 3.06) should stimulate demandgrowth.
3.04 Supply: Tin is mainly found in placer or alluvial deposits, derivedfrom the weathering and erosion of primary tin ores. Over 90% of global re-serves are concentrated in developing countries, which account for about 75%of world production. Malaysia has remained the dominant producer, with 37% ofworld mine production of 173,000 tons in 1975 (excluding centrally plannedeconomies). Bolivia, Indonesia and Thailand are the other major producers,with 17%, 14% and 10% of mine production respectively in 1975. South-EastAsian production is almost entirely from alluvial mines, employing dredging,gravel pump mining and other hydraulic mining methods, but Bolivian produc-tion is mostly from high-cost hard rock underground mines. In the past, tinsupply has been affected by sales from the U.S. Government stockpile, whichis presently equivalent to about one year's world consumption. In addition,scrap represents a significant portion of supply, especially in the U.S.where old scrap accounts for 15% of tin supply.
3.05 As Malaysian reserves are gradually being depleted, that country'soutput is expected to decline as a proportion of world production, withThailand, Indonesia, Australia and Brazil increasing their share accord-ingly. As for Burma, even with the planned increase in official output
-7-
over the next five years, it will still account for only 1% of world supply.Moreover, the output associated with the project will amount to only 1/4 of1% of world supply and 10% of the annual incremental world' consumption atthe time the project comes on stream.
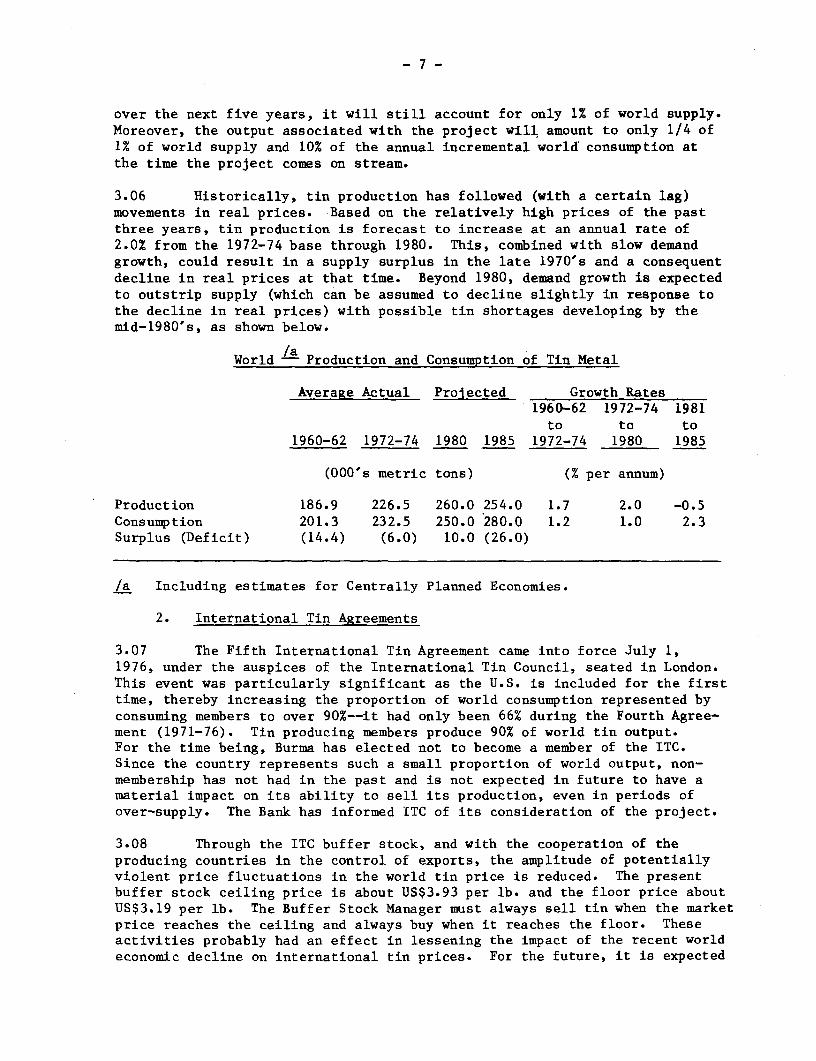
3.06 Historically, tin production has followed (with a certain lag)movements in real prices. Based on the relatively high prices of the pastthree years, tin production is forecast to increase at an annual rate of2.0% from the 1972-74 base through 1980. This, combined with slow demandgrowth, could result in a supply surplus in the late 1970's and a consequentdecline in real prices at that time. Beyond 1980, demand growth is expectedto outstrip supply (which can be assumed to decline slightly in response tothe decline in real prices) with possible tin shortages developing by themid-1980's, as shown below.
World /a Production and Consumption of Tin Metal
Average Actual Projected Growth Rates1960-62 1972-74 1981to to to
1960-62 1972-74 1980 1985 1972-74 1980 1985
(000's metric tons) (% per annum)
Production 186.9 226.5 260.0 254.0 1.7 2.0 -0.5Consumption 201.3 232.5 250.0 280.0 1.2 1.0 2.3Surplus (Deficit) (14.4) (6.0) 10.0 (26.0)
/a Including estimates for Centrally Planned Economies.
2. International Tin Agreements
3.07 The Fifth International Tin Agreement came into force July 1,1976, under the auspices of the International Tin Council, seated in London.This event was particularly significant as the U.S. is included for the firsttime, thereby increasing the proportion of world consumption represented byconsuming members to over 90%--it had only been 66% during the Fourth Agree-ment (1971-76). Tin producing members produce 90% of world tin output.For the time being, Burma has elected not to become a member of the ITC.Since the country represents such a small proportion of world output, non-membership has not had in the past and is not expected in future to have amaterial impact on its ability to sell its production, even in periods ofover-supply. The Bank has informed ITC of its consideration of the project.
3.08 Through the ITC buffer stock, and with the cooperation of theproducing countries in the control of exports, the amplitude of potentiallyviolent price fluctuations in the world tin price is reduced. The presentbuffer stock ceiling price is about US$3.93 per lb. and the floor price aboutUS$3.19 per lb. The Buffer Stock Manager must always sell tin when the marketprice reaches the ceiling and always buy when it reaches the floor. Theseactivities probably had an effect in lessening the impact of the recent worldeconomic decline on international tin prices. For the future, it is expected
-8-
that ITC buffer stock and export control operations will continue to have amoderating influence on tin price fluctuations, and, particularly in downmarkets, in defending floor prices.
3. Price Structure and Projections
3.09 Tin is traded in variously processed forms on the Penang or StraitsMarket (Malaysia), the London Metal Exchange (LME), and the New York CommodityExchange (COMEX). Concentrate prices are based on the traded prices forcontained metal, less adjustments for smelting charges, shipping, impurities,and assay costs.
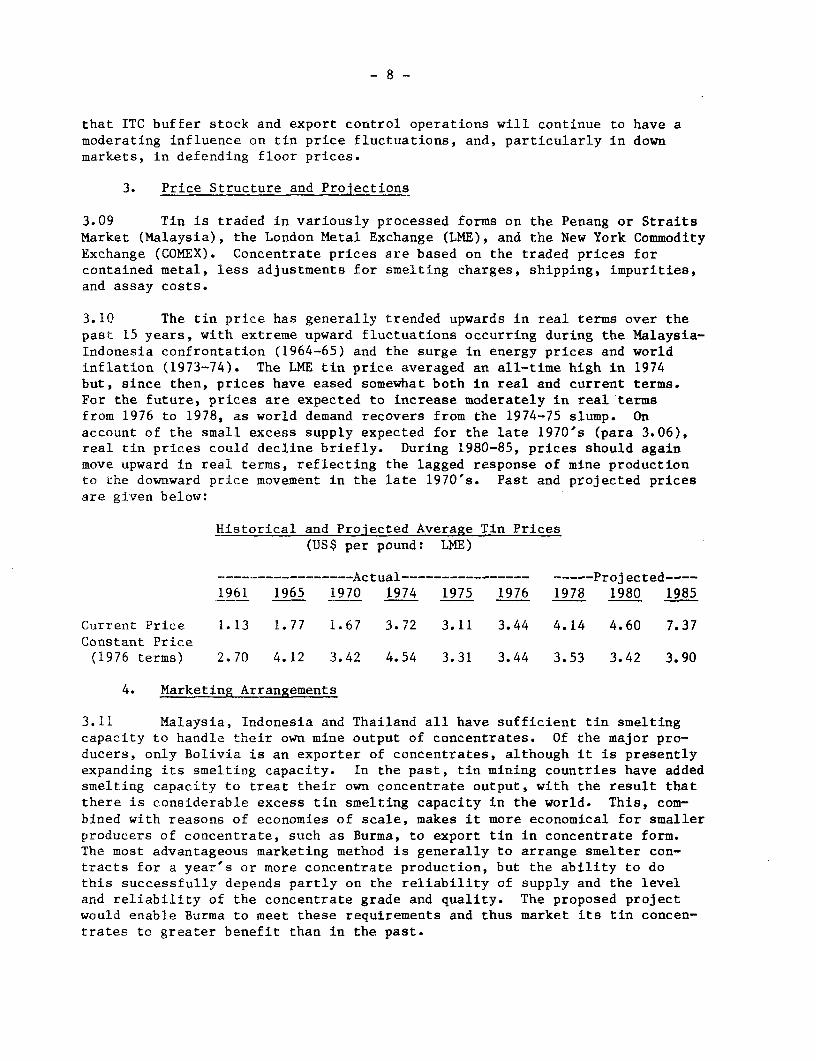
3.10 The tin price has generally trended upwards in real terms over thepast 15 years, with extreme upward fluctuations occurring during the Malaysia-Indonesia confrontation (1964-65) and the surge in energy prices and worldinflation (1973-74). The LME tin price averaged an all-time high in 1974but, since then, prices have eased somewhat both in real and current terms.For the future, prices are expected to increase moderately in real termsfrom 1976 to 1978, as world demand recovers from the 1974-75 slump. Onaccount of the small excess supply expected for the late 1970's (para 3.06),real tin prices could decline briefly. During 1980-85, prices should againmove upward in real terms, reflecting the lagged response of mine productionto the downward price movement in the late 1970's. Past and projected pricesare given below:
Historical and Projected Average Tin Prices(US$ per pound: LME)
…-------------…Actual---------------- ---- Projected----1961 1965 1970 1974 1975 1976 1978 1980 1985
Current Price 1.13 1.77 1.67 3.72 3.11 3.44 4.14 4.60 7.37Constant Price(1976 terms) 2.70 4.12 3.42 4.54 3.31 3.44 3.53 3.42 3.90
4. Marketing Arrangements
3.11 Malaysia, Indonesia and Thailand all have sufficient tin smeltingcapacity to handle their own mine output of concentrates. Of the major pro-ducers, only Bolivia is an exporter of concentrates, although it is presentlyexpanding its smelting capacity. In the past, tin mining countries have addedsmelting capacity to treat their own concentrate output, with the result thatthere is considerable excess tin smelting capacity in the world. This, com-bined with reasons of economies of scale, makes it more economical for smallerproducers of concentrate, such as Burma, to export tin in concentrate form.The most advantageous marketing method is generally to arrange smelter con-tracts for a year's or more concentrate production, but the ability to dothis successfully depends partly on the reliability of supply and the leveland reliability of the concentrate grade and quality. The proposed projectwould enable Burma to meet these requirements and thus market its tin concen-trates to greater benefit than in the past.
-9
B. The International TunRsten Market
1. International Demand and Supply
3.12 Demand: Tungsten is a heavy, hard, heat and corrosion resistantmetal, with the highest melting point and tensile strength of all metals.It also has good electrical and thermal conductivity and a low thermal ex-pansion coefficient. Tungsten's major uses are in carbide form (e.g. 45%of U.S. consumption) for machine tool cutting edges, dies, rock bits, ballpoint pen tips, gas turbine blades, and tire studs. In steel alloy form (25%of U.S. consumption), it is used primarily in metal working (drilling andcutting), grader blades, rock crusher jaws, and teeth for excavators. Otherapplications include: tungsten alloys for incandescent lamp filaments andelectrical contact points, and tungsten chemicals for textile dyes, paintsand pigments, and glass manufacture.
3.13 Demand is closely linked to levels of activity in the steel andmachine tool industries. The U.S., Japan, and Western Europe account for80% to 90% of tungsten consumption outside the centrally-planned economies.Despite wide fluctuations (e.g. a 23% decline in 1975 consumption) withchanges in economic activity, world consumption has grown at about 4% perannum from 1966 to 1974. Demand is expected to recover over the nextcouple of years, with the 4% growth rate to resume, given the low substi-tutability of the metal in its major applications, even at higher prices.
3.14 SupPly: Tungsten mainly occurs in nature as wolframite or schee-lite, and is commonly found in association with other metals such as tin,molybdenum, copper, and bismuth. Most of it is mined in hard rock under-ground mines, but some is also obtained by alluvial methods in conjunctionwith tin mining, as is the case in Burma.
3.15 The centrally-planned economies account for about half of worldtungsten production of 38,000 tons and hold about 70% of known reserves.The People's Republic of China accounts for about half of world reservesand produces about 25% of world supply. Among the non-centrally plannedeconomies, the leading producers are the U.S., South Korea, Bolivia,Thailand, Portugal, Canada and Australia.
3.16 Production in market-economy countries, together with importsfrom China, has not been sufficient to meet demand in recent years. Theshortfall has largely been met by sales from the U.S. Government stockpile,where disposals over the past ten years, though fluctuating widely, haveaveraged 12% of annual world production with a peak of 53% in 1969. Underthese circumstances, fluctuations in supply from China can and have had amajor impact on price. Recently, price levels have stabilized at fairly highlevels, partly due to some attempts at increased cooperation between producers,with China's support. Expansion of mine production should result. New orexpanded mines are being developed in the U.S., Australia and Turkey, andthere are possibilities in other countries, including Bolivia, Canada, and inthe longer term, in Burma. While data is incomplete, old scrap probablyaccounts for 15% of annual tungsten supply.
3.17 Producers' Association: In recent years, an ad hoc committeeon tungsten under the United Nations Conference on Trade and Development

- 10 -
(UNCTAD) has become more active, with some movement toward an internationalagreement aimed at stabilizing prices. To this end, the Primary TungstenAssociation (PTA) was formed in 1975, involving producing companies fromPeru, Portugal, Australia, France and Bolivia. Significantly, China was aparticipant in multilateral government meetings on tungsten held in Boliviain 1975 and is participating on the UNCTAD tungsten committee, which last metin Geneva in November, 1976. The UNCTAD commitee members hold disparate viewson the approach to stabilization measures. Obstacles to some form of finalagreement revolve around the fact that tungsten is traded in several forms, aswell as the need to achieve consensus between market and centrally-plannedeconomies.
2. Price Structure and Projections
3.18 International trade is often on the basis of prices quoted in theLondon Metal Bulletin (LMB). The LMB publishes a tungsten ore-users indexwhich is a weighted average of the prices of all purchases made by a groupof European tungsten carbide manufacturers. The LMB quotations are givenfor wolfram and scheelite (65% W03 and 70% W03 respectively). It also pub-lishes price ranges based on surveys of representative sales usually throughmetal trading companies. This is widely used as a basis for spot sales orlonger-term contracts. Production is commonly sold in pounds sterling permetric ton unit (MTU) or U.S. dollars per short ton unit (STU) of 65% W03content. The approximate value of a ton of ore or concentrate is obtainedby multiplying the price per ton unit by the percent W03 content (or grade).A ton unit is one hundredth of a ton.
3.19 Prices historically have shown erratic movements with fluctua-tions of 100% or more in a year not uncommon. Overall, however, the trendin real prices has been upwards reaching a peak in 1970 (see below). Withhigh prices and poor economic conditions in the latter part of 1974, con-sumers of tungsten reduced their inventory levels. In response, China cutback exports sharply thereby maintaining prices. Even at present levels,real prices are well below those reached in 1970 and equivalent to thoseprevailing in 1967-69.
3.20 With recovery in world economic activity in 1976, tungsten demandhas been increasing during the year. As a result, prices can be expected tomaintain their level of the last two years, or increase slightly. Over thelonger term, the prospects of increased Chinese cooperation with other pro-ducers look favorable, and would serve to attenuate the violent price fluc-tuations of the past. This assumes that sales from U.S. Government stock-piles will roughly reflect market requirements. The long term price trendis thus projected to be slightly upward in real terms as illustrated below:
Historical and Projected Average Tungsten Prices(US$ per MTU: LMB)
Actual Projected1961 1965 1967 1970 1972 1975 1976 1978 1980 1985
Current Price 16.9 28.8 49.6 74.3 35.9 91.3 102.0 121.0 146.3 213.2Constant Price(1976 terms) 40.3 67.0 112.0 151.9 63.5 97.2 102.0 103.3 108.6 112.9

- 11 -
3. Marketing Arrangements
3.21 The volume of trade in tungsten is small, and there is no univer-sally acknowledged marketing system as there is for many other metals. Fur-thermore, there is no real trade in tungsten metal itself but rather invarious forms such as concentrates or carbides. Concentrates are mainlybought and sold through brokers or metal trading firms, and small supplierssuch as Burma generally market their concentrates on a negotiated basis foreach sale to metal trading companies. Even Chinese sales and purchases bymajor consumers are done substantially through traders. However, providedthat reliable supply, quality and grade can be maintained, there is somescope for longer-term contract sales of tungsten concentrate, as for tin.
IV. THE CORPORATION
A. Operations
1. Mining Facilities and Output
4.01 No. 2 Mining Corporation (MC2) conducts mining operations in twoseparate parts of the country -- the Tenasserim Division in extreme south-eastern Burma (major mines: Heinda, Hermyingyi, and Kanbauk), and the Mawchiarea northeast of Rangoon (Mawchi Mine). Overall, MC2 operates 7 mines witha number of scattered smaller sites being worked exclusively by tributeminers. Primitive concentrating facilities exist at 6 mines and additionalupgrading plants are located at Rangoon and Tavoy (Annex 4-1). Over 75% ofthe concentrates produced by MC2 are purchased from tributers. These concen-trates generally contain a minimum 65% tin-ore/wolfram and are further upgradedby MC2 before sale.
4.02 Production is well below what it was many years ago and has beendeclining further in recent years. The causes have been the same as for therest of the mineral sector (para 2.03), i.e. war damage, ousting of privateoperations, deterioration of plant and infrastructure, shortage of spares andcapital, and increased leakage of tributor output through smuggling. Thetable below illustrates the trend in recent years:
MC2: Historical Production of Concentrates(Long Tons)
FY 1972 FY 1973 FY 1974/- FY 1975 FY 1976
Tin Concentrates 643 514 230 529 608Tungsten Concentrates 815 817 335 603 492Mixed Concentrates 652 635 168 387 402
Total 2,110 1,966 733 1,519 1,502
Of which tribute production 1,668 1,633 578 1,258 1,136
/a Six months, due to change in year-end from September 30 to March 31.
- 12 -
4.03 Mining methods vary from location to location and comprise gravelpumping, underground, and ground sluicing operations. Most of the mines arein alluvial-type deposits, the main exceptions being the hard rock under-ground operations at Mawchi and Hermyingyi, which are the principal sourcesof the tungsten ores. Concentrating facilities are generally primitiveand in poor running order, both at the mine sites and at two small upgradingplants in Tavoy and Rangoon. As a result, most of MC2's concentrates arelow grade, and contain high levels of impurities, thus reducing their salesvalue. Mixed tin/tungsten ores, such as those from Mawchi, are not separatedand recoveries are poor. Outmoded facilities also contribute to MC2's highproduct inventories. Products often flow from mines to concentrators inTavoy and back to utilize available wet and dry upgrading facilities and thusbring the products to a more marketable state.
4.04 Mines in the Tenasserim Division are connected to Tavoy by road.In the wet season, sections become impassable for days due to flooding,and even during favorable weather, delays arise due to the necessity oforganizing military escorts for security reasons. Concentrates are shippedfrom Tavoy to Rangoon by boat and then exported. Mawchi and Rangoon, on theother hand, are connected by both rail and road but because of the securitysituation, the most direct route cannot be taken.
4.05 Infrastructural facilities, such as power and water supply at themines, are generally poor and unreliable. Water shortages in the dry seasonand frequent power shut-downs hamper production, with generating and pumpingfacilities both suffering from shortages of spare parts and maintenance mate-rials.
2. Production Costs
4.06 Production costs for tin and tungsten concentrate vary by mine, butare generally somewhat below levels in other countries, reflecting the highlylabor intensive low-wage aspects of Burmese mining, with depreciation andfinancial charges well below those of more modern or mechanized operationselsewhere. Moderately more capital intensive production methods are warran-ted, even if total costs per ton mined are increased, in order to ensure thatoutput can be more closely controlled, and to prevent deposits from beinginefficiently and harmfully exploited by the haphazard high-grading operationsof the tribute miners.
B. Past Performance and Financial Condition
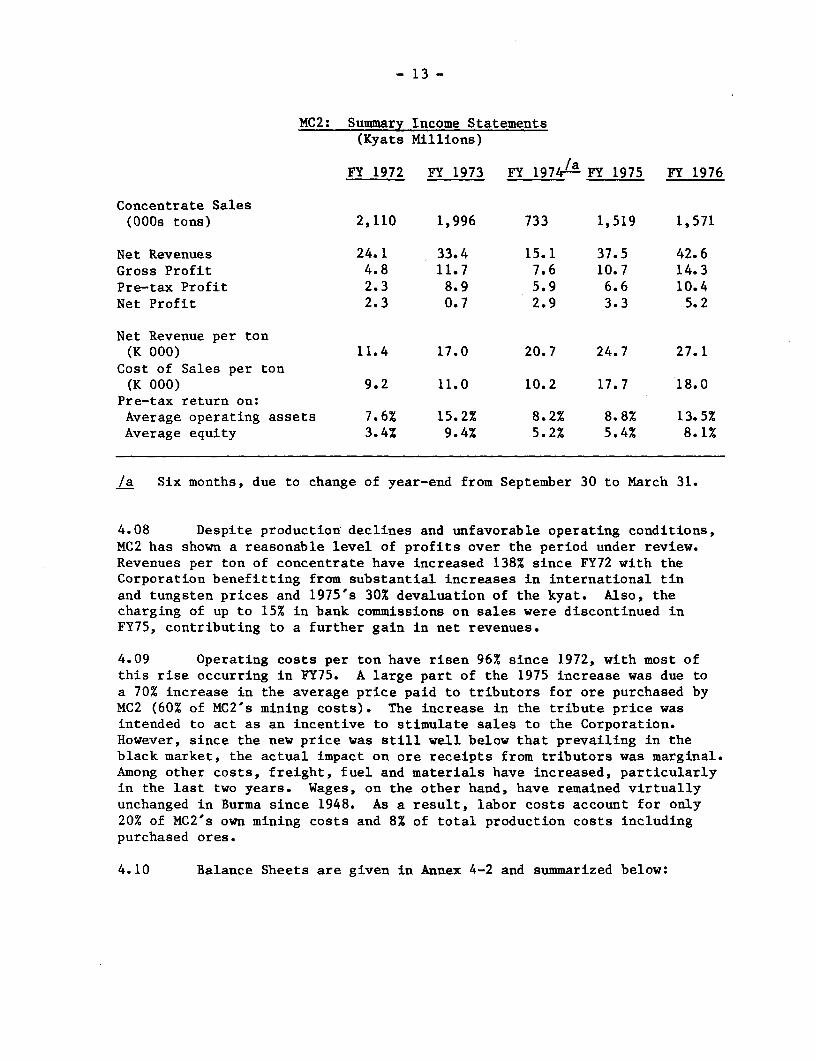
4.07 MC2's income statements for 1972-1976 are summarized below fromAnnex 4-2:
- 13 -
MC2: Summary Income Statements(Kyats Millions)
/aFY 1972 FY 1973 FY 1974/- FY 1975 FY 1976
Concentrate Sales(000s tons) 2,110 1,996 733 1,519 1,571
Net Revenues 24.1 33.4 15.1 37.5 42.6Gross Profit 4.8 11.7 7.6 10.7 14.3Pre-tax Profit 2.3 8.9 5.9 6.6 10.4Net Profit 2.3 0.7 2.9 3.3 5.2
Net Revenue per ton(K 000) 11.4 17.0 20.7 24.7 27.1
Cost of Sales per ton(K 000) 9.2 11.0 10.2 17.7 18.0
Pre-tax return on:Average operating assets 7.6% 15.2% 8.2% 8.8% 13.5%Average equity 3.4% 9.4% 5.2% 5.4% 8.1%
/a Six months, due to change of year-end from September 30 to March 31.
4.08 Despite production declines and unfavorable operating conditions,MC2 has shown a reasonable level of profits over the period under review.Revenues per ton of concentrate have increased 138% since FY72 with theCorporation benefitting from substantial increases in international tinand tungsten prices and 1975's 30% devaluation of the kyat. Also, thecharging of up to 15% in bank commissions on sales were discontinued inFY75, contributing to a further gain in net revenues.
4.09 Operating costs per ton have risen 96% since 1972, with most ofthis rise occurring in FY75. A large part of the 1975 increase was due toa 70% increase in the average price paid to tributors for ore purchased byMC2 (60% of MC2's mining costs). The increase in the tribute price wasintended to act as an incentive to stimulate sales to the Corporation.However, since the new price was still well below that prevailing in theblack market, the actual impact on ore receipts from tributors was marginal.Among other costs, freight, fuel and materials have increased, particularlyin the last two years. Wages, on the other hand, have remained virtuallyunchanged in Burma since 1948. As a result, labor costs account for only20% of MC2's own mining costs and 8% of total production costs includingpurchased ores.
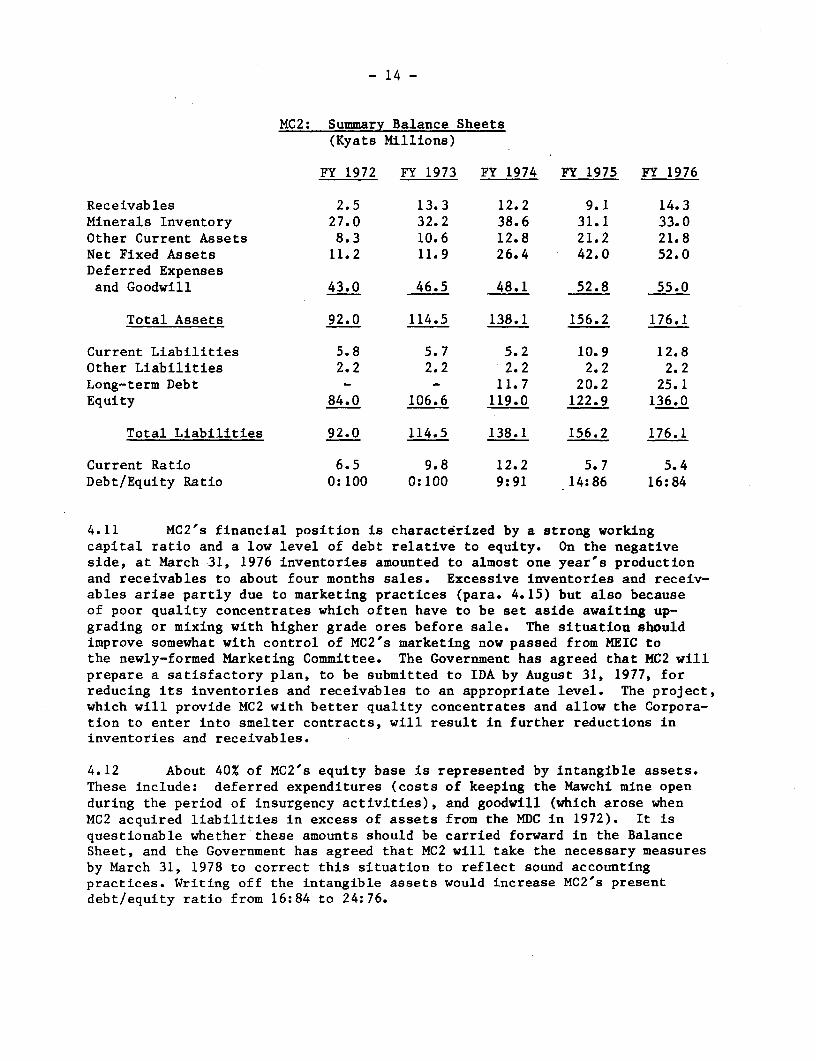
4.10 Balance Sheets are given in Annex 4-2 and summarized below:
- 14 -
MC2: Summary Balance Sheets(Kyats Millions)
FY 1972 FY 1973 FY 1974 FY 1975 FY 1976
Receivables 2.5 13.3 12.2 9.1 14.3Minerals Inventory 27.0 32.2 38.6 31.1 33.0Other Current Assets 8.3 10.6 12.8 21.2 21.8Net Fixed Assets 11.2 11.9 26.4 42.0 52.0Deferred Expensesand Goodwill 43.0 46.5 48.1 52.8 55.0
Total Assets 92.0 114.5 138.1 156.2 176.1
Current Liabilities 5.8 5.7 5.2 10.9 12.8Other Liabilities 2.2 2.2 2.2 2.2 2.2Long-term Debt - - 11.7 20.2 25.1Equity 84.0 106.6 119.0 122.9 136.0
Total Liabilities 92.0 114.5 138.1 156.2 176.1
Current Ratio 6.5 9.8 12.2 5.7 5.4Debt/Equity Ratio 0:100 0:100 9:91 14:86 16:84
4.11 MC2's financial position is characterized by a strong workingcapital ratio and a low level of debt relative to equity. On the negativeside, at March 31, 1976 inventories amounted to almost one year's productionand receivables to about four months sales. Excessive inventories and receiv-ables arise partly due to marketing practices (para. 4.15) but also becauseof poor quality concentrates which often have to be set aside awaiting up-grading or mixing with higher grade ores before sale. The situation shouldimprove somewhat with control of MC2's marketing now passed from MEIC tothe newly-formed Marketing Committee. The Government has agreed that MC2 willprepare a satisfactory plan, to be submitted to IDA by August 31, 1977, forreducing its inventories and receivables to an appropriate level. The project,which will provide MC2 with better quality concentrates and allow the Corpora-tion to enter into smelter contracts, will result in further reductions ininventories and receivables.
4.12 About 40% of MC2's equity base is represented by intangible assets.These include: deferred expenditures (costs of keeping the Mawchi mine openduring the period of insurgency activities), and goodwill (which arose whenMC2 acquired liabilities in excess of assets from the MDC in 1972). It isquestionable whether these amounts should be carried forward in the BalanceSheet, and the Government has agreed that MC2 will take the necessary measuresby March 31, 1978 to correct this situation to reflect sound accountingpractices. Writing off the intangible assets would increase MC2's presentdebt/equity ratio from 16:84 to 24:76.

- 15 -
C. Organization and Management
4.13 Like other state organizations in Burma, all policy decisionsand many managerial functions have been outside MC2's immediate control.Decisions on production plans, marketing, investment, employment, wages,and financing are decided mainly at the level of the Minister or the EconomicCommittee of the Council of Ministers. The Managing Director of MC2 isappointed by the Government to carry out plans set by the Ministry of Minesand to supervise the day-to-day operations of the Corporation. Reportingto him are four Directors (Administration, Production, Planning and Projecting,and Engineering) and a Chief Accounts Officer (Annex 4-3). It is the Gov-ernment's intention to transfer more managerial and financial autonomy tothe various state economic enterprises through newly-formed ManagementCommittees. This, however, will be a gradual, cautious process. In MC2'scase, the Committee includes: the Managing Director, the Director of Produc-tion, the Chief Accounts Officer and two members representing the work-ers, one of whom is the Director of Administration. All are competent people,with good technical qualifications and many years experience in the industry,but with little management experience other than in a highly centralizeddecision-making environment.
4.14 MC2 employs about 2,700 persons, including 73 officers. Wagelevels are low, being equivalent to US$15 per month for laborers, US$70-150per month for engineers and geologists, and US$200 per month for top manage-ment. In some cases, inadequate wages have resulted in high rates of turnoverand absenteeism at MC2's mine sites, especially where other opportunities suchas tribute mining or illegal trade exist. A recently-established bonussystem and a cost-of-living allowance may help to relieve growing dissatis-faction in the face of rising prices. Overstaffing exists at some locations,largely due to output declines not being fully reflected in a reduction orrelocation of manpower, e.g. at Mawchi mine. The Government has agreed thatMC2 will prepare a manpower plan, with the assistance of the project consul-tants, which will include steps to establish employee levels consistent withchanges in output and profitability at its various operating locations. Alsoincluded in the plan, to be submitted to IDA by December 31, 1977, willbe a system of bonuses, incentive schemes and special allowances to augmentwages where appropriate.
4.15 As noted above, MC2's activities are presently limited to produc-tion; exploration, geological work, and, until recently, marketing, beingcarried out by other agencies within the Ministry of Mines. MC2 has nowgained closer control over marketing operations with this function transferredfrom the MEIC to the Minerals Marketing Committee in late 1976. The Committeeis jointly administered by representatives from the three metal producingcorporations. Also, with respect to tin/tungsten, MEIC's Sales Manager forthese metals (a highly competent individual) has assumed a key role in themanagement of the Committee. Principal advantages of the new arrangementsare: elimination of the excessive 2-1/2% MEIC sales commission; and scope toreduce MC2's high inventories and receivables, which have been partly causedby inefficient MEIC practices and the problems of inter-Ministry communi-cations. The marketing policies of the Committee have yet to be finalized,but the Government has agreed that the Committee will be granted authority totake appropriate measures to improve marketing efficiency, including entering
- 16 -
into long-term smelter contracts where appropriate. This should be facilitatedby the proposed project, with production expanded and quality and quantity ofsupply more reliable.
D. Accounts and Audit
4.16 MC2's accounting records are well maintained and contain reason-able detail on the Corporation's costs, revenues, production, inventories,and other financial and operational data. Apart from the annual accountsand monthly statements of production, cash receipts and expenditures, how-ever, management does not receive adequate information for effective opera-tional or financial control. The terms of reference for the consultantsretained for the project (para. 5.14) will include assistance in improvingthe Corporation's management information systems and its financial planningcapabilities.
4.17 The State Audit Office is the only official audit service availablein Burma, and has been used satisfactorily in other IDA projects in thecountry. In MC2's case (like that of many other state corporations in Burma),audits have been several years behind, but at the request of IDA, MC2 hassubmitted audited financial statements for FY76. The Government has agreedthat MC2 will submit audited accounts to IDA within five months of the closeof each fiscal year, and quarterly financial statements within 60 days.
E. Ore Reserves
4.18 Sufficient ore reserves exist in the present areas of operationto produce at least 67,000 tons of tin concentrates and 30,000 tons of tungstenconcentrates. Of these 97,000 tons, only about 22,000 have been proved --sufficient for 15 years' production at present mining rates. These totals areunderstated, however, as they do not reflect recent real price increases,particularly for tungsten. For those mining sites scheduled for developmentas part of the proposed project (Heinze Basin, Kanbauk and various gravel pumpreserves), there are sufficient proved reserves for at least 15 years operationat the expanded rates of production. Proven reserves at the Heinda mine,where increased output will commence during 1977 following completion ofthe KfW-financed project, are only sufficient for 11 years. Conversion ofprobable and possible reserves to proved status, for these and other tin!tungsten deposits in Burma, is expected to be easily accomplished with modestamounts of further exploration and expenditures.
V. THE PROJECT
5.01 The project consists of the following components: (a) dredgingand related concentrating and infrastructural facilities (including a townshipwith housing and community facilities) at Heinze Basin (300 km S.E. of Rangoon)to produce about 650 LTPY of tin concentrate by FY81 (Map IBRD 12524), andimprovements to gravel pump operations at Kanbauk close to the Heinze Basin,increasing tin concentrate production by about 100 LTPY by FY81; (b) a newtin/tungsten concentrating and upgrading plant at Tavoy, 80 km south of Heinze
- 17 -
Bas., to separate mixed concentrates and improve the grade and quality of tinand tungsten concentrates produced by the Corporation; (c) equipment for newgravel pump mining operations near Tavoy to produce about 150 LTPY of tinconcentrates by FY81; and (d) technical assistance for training of key tech-nicians, engineering,project management, procurement, start-up, and theinitial operation of the project, plus assistance in improving the Corporation'soperating and financial controls, preparing a manpower plan (para. 4.14) andpreparing a study of exporting concentrates directly from Tavoy. In particular,the provision of consultants experienced in dredging and concentration oftin/ tungsten ores is to compensate for MC2's unfamiliarity in these areas.A more detailed description of the tin/tungsten project is given in Annex5-1. In addition, US$200,000 equivalent of the proposd credit will be used fora study of the future development of the mineral sector (para. 5.16).
A. Technical Description
1. Heinze Basin Dredging Project and Concentrator
5.02 The dredging would take place in a 25 km long southern sectionof the Heinze Basin, access to which is by sea or by surfaced road fromTavoy or Ye (both within 60 km of the project area). Sea access is limitedduring the monsoon season, and road access is also somewhat limited due to5-ton load limits on bridges and 13 km of unsurfaced road between the Basinand Tavoy. The project can be planned around these restrictions and theGovernment has agreed that the unsurfaced road will be improved to an all-weather condition no later than December 31, 1979, i.e., before projectstart-up.
5.03 A portion of the Basin was dredged prior to World War II and inter-mittent dredging was carried out west of the Basin up to 1952. A UNDP-fi-nanced program (1972-75) undertook extensive borings in the Basin and afeasibility study was completed by the Malaysian consulting firm, Osborneand Chappel, in mid-1975. Recoverable concentrate is conservatively esti-mated at 6,640 tons, sufficient for 19 years at the proposed rate of mining.In the initial years, production will average 550 tons of concentrate perannum, and after the tenth year will decline to about 250 tons per annum,as lower grade ores are worked.
5.04 Careful study was done by the consultants to determine the optimumdredge size based on both operational and economic factors. The dredge se-lected will be a conventional bucket ladder dredge with a jig treatmentplant on board. The dredge would be capable of digging to a depth of 16m. during the first 8 years of operation. Its pontoon and ladder wouldthen be extended to increase digging depth to 27 m. The dredging sequencehas been selected to maximize the present value of the cash flow. Annualproduction is estimated at 1.4 million cu. m. of ore in the early years(reflecting operator inexperience and dredging conditions), increasing to2.0 million cu. m. after the tenth year. These production estimates are51% and 74% of theoretical dredge capacity, respectively.
5.05 The dredge's jig plant would produce a concentrate grading 20-40%tin which would then be transported by barge to the nearby shore-based mill.After upgrading there, concentrate grading 65% tin would be transported byroad or sea to Tavoy for further processing.
- 18 -
5.06 The flowsheet for the Heinze Basin mill would include screening,magnetic scalping, classifying, and Wilfey table treatment. The concen-trate would pass through a fresh water wash and, after drying, be treated onhigh-intensity magnetic separators to separate refractory minerals. Themill flowsheet has been thoroughly tested by the consultants. The ore typeis quite common in south-east Asia, the flowsheet is conventional, and theequipment proposed is standard and widely used in alluvial tin concentrators.
5.07 Due to the remote location of the Heinze Basin and the lack ofexisting infrastructure, the project will require extensive support facili-ties including: water craft (tugboat, work boat, personnel boats, barges);power (diesel generators for the dredge and shore complex); wells for watersupply; and workshops, offices, and a warehouse. Social infrastructure wouldinclude: a 237-home townsite, school, community hall/cinema, hospital, mar-ket, playfield, and electrical, water, and sanitary facilities.
5.08 Production of tin concentrates at the nearby Kanbauk gravel pumpmines is expected to increase by about 100 LTPY (from the current 200 LTPY)as a result of better maintenance and operational supervision associated withthe Heinze dredging and concentrating complex and improved power and watersupply. Only a very small amount of additional direct investment at Kanbaukwould be involved. Concentrates from Kanbauk would be further upgraded at theHeinze Basin mill and the Tavoy concentrator. Recoverable ore reserves atKanbauk are estimated at 3,400 tons, sufficient for 10 years operation at theprojected rate of output.
2. Central Concentrator at Tavoy
5.09 As a result of antiquated and inefficient concentrating facilities(Annex 4-1), much of MC2's output is of a low and unreliable grade (averagingabout 69% for tin concentrates and 64% for tungsten), high in impurities andsells at a substantial discount below standard prices. Based on a proposalby the Corporation, IDA commissioned a study of various alternative new con-centrating facilities to determine the best location and a preliminary flowsheet for the selected alternative. This was carried out by Osborne andChappel of Malaysia and their final report was produced in July 1976.
5.10 The selection of a large centralized concentrator located in Tavoyis based on its favorable economic return, and the ability of a Tavoy loca-tion to provide the focus for improved operational control of the Corpora-tion's mines in the Tenasserim Division. As the concentrator would treata variety of ores, including mixed concentrates from Mawchi, the flowsheetinvolves a number of circuits including: crushing, screening, electrostaticprecipitation, wet gravity separation on tables, cleaning in Willoughby boxes,drying and high intensity magnetic separation. In addition to producing highquality wolfram and tin concentrates, the concentrator would produce a numberof byproducts, but incremental revenues from these will be small. Testingdone by the consultants was sufficient to determine the basic flowsheet butfurther metallurgical testing will be required to finalize concentratordesign. A preliminary study has been conducted by the Corporation to identifyspecific possible sites for the concentrator. The final site will be chosenwith the assistance of the project consultants and the site acquired as acondition of credit effectiveness.
- 19 -
5.11 Overall, the concentrator will produce 3,000 - 4,000 LTPY of concen-trates (grading 75% for tin concentrates and 67% for tungsten) on a single-shift basis, with ample flexibility for increasing its capacity and modifyingits flowsheet as other mines are developed in the area. Infrastructuralfacilities for the concentrator include: water supply from nearby wells orthe Tavoy river, electric power (two 345 kw diesel generators), and transport(five six-ton trucks - concentrates from various mines in the area are presentlydelivered to Tavoy by local buses).
5.12 The Government has agreed that the terms of reference of the projectconsultants will include assistance to MC2 in the improvement of the export ofconcentrates. This will include study of the feasibility and desirability ofdirect export of the Corporation's products from Tavoy to smelters in Malaysiaor Thailand, without the inefficient and time-consuming process of shipment toRangoon as presently practised. The expanded output of concentrates in thearea should provide sufficient incentive for vessels to stop at Tavoy, and,since concentrates would be trans-shipped from lighter vessels, minimalinfrastructure would be required.
3. Gravel Pump Mining Project
5.13 Although knowledge of reserves is patchy, there are a number oftin and tungsten-rich deposits in the Tenasserim Division which are idealfor gravel pump operations. This process consists of monitors (water jets)to wash down sand and gravel to a sump. From the sump, the slurry of liqui-fied material is pumped to a palong (sluice box) for treatment. Equipmentwould be acquired to establish gravel pump operations at one or two loca-tions. Since major production preparation, such as extensive stripping, wouldnot be necessary, this component of the project could be implemented relativelyquickly. Equipment needed (drills, hydraulic monitors, pumps, diesel generator,and jig plants) is highly mobile and expensive infrastructural facilities arenot required. In addition to yielding about 150 LTPY of tin concentrates, theproject, under consultant supervision, will provide valuable training.
4. Technical Assistance
5.14 MC2's inexperience in the operation of other than simple miningand concentrating activities necessitates fairly extensive outside technicalassistance by consultants experienced in the design and operation of dredg-ing, mining, and concentrating facilities. The Government has agreed that theCorporation will retain consultants, to be financed from the proposed credit,and on terms of reference satisfactory to IDA, to assist with project engineer-ing, project management, overseas training of key technicians, procurement,and to supervise and assist during the start-up of the facilities and duringat least the first two years of their operation (with IDA to be consultedbefore the termination or reduction of this operational assistance). Theconsultants will also assist in the development of physical, cost, and finan-cial control systems to improve MC2's overall operational effectiveness,assist with export improvements (para. 5.12), and help prepare a manpower plan(para. 4.14). Draft terms of reference (Annex 6-2) have been discussed withthe Corporation. Osborne and Chappel, the Malaysian consulting firm which didthe project feasibility studies, has been selected for this assistance. Theemployment of the consultants is a condition of credit effectiveness. The
- 20 -
estimated cost for engineering services and other consulting assistance isUS$1.9 million, of which about US$0.5 million would be technical assistance,spread over a five-year period. The average cost per man-year is estimated tobe US$84,000 including all travel, overhead, and associated expenses.
5. Other Expansion Plans
5.15 Significant future expansion of production is envisaged by MC2and three major mine rehabilitation programs, in addition to the project, arein the pipeline. The Heinda mine is being expanded with the help of KfWfinancing through a new open-pit system and a new concentrating mill whichshould increase annual production by 800 LTPY of tin concentrates, withproduction scheduled to start during 1977. At Hermyingyi, explorationwork assisted by German technical aid is being carried out with a view toproving adequate reserves on which to base a project. This could add another500 LTPY of tin/tungsten concentrates by the early to mid-eighties. AtMawchi, a USSR-financed rehabiltation program to increase output by 1,000 LTPYof tin was suspended in 1973. This could be resumed if insurgency problemswere brought under control and new financing found. The timing of this isuncertain, but there have been recent indications that the security situationmay be inproving. In order to ensure sufficient managerial attention is givento the proposed IDA project, the Government has agreed that the Corporationwill not embark on any major new investments (over US$1 million equivalent peryear) without prior IDA approval.
6. Sector Study
5.16 The Government has agreed that it will employ consultants acceptableto the Association with satisfactory terms of reference, to assist in carryingout a study of the future development of the mineral sector. This would helpthe Government to establish sector priorities and to identify suitable develop-ment projects. The scope of the study should be agreed by June 30, 1977. TheGovernment has agreed to employ the consultants by December 31, 1977, and tocommence the study within three months. The study's recommendations willbe reviewed with IDA and implementation steps agreed. Part of the credit(US$200,000 equivalent) will be used to finance the work, with the Ministry ofMines as executing agency.
B. Environmental Aspects
5.17 As the project operations involve physical, rather than chemicalprocesses, no harmful pollutants will result. Dredge tailings will be deposi-ted back into the Basin, but in the same form as the naturally occurringmaterials. Concentrator tailings will be disposed of on land and shou'ld notraise any environmental problems. Dredging operations will create some minordisruption of fishing activities in the Basin, but these are not economicallysignificant to the local population. Moreover, the area affected at any onetime will be confined to a small part of the Basin.
C. Capital Costs
5.18 Project cost, excluding interest during construction and incrementalworking capital, is estimated at US$26.0 million equivalent, of which US$18.9

- 21 -
million would be for the dredging, concentrating and related facilities atHeinze Basin (including Kanbauk); US$3.7 million for the central concentratorat Tavoy, US$2.7 million for the gravel pump mining pilot project, US$0.5million for technical assistance additional to the engineering and projectmanagement included in other project components, and US$0.2 million for thesector study. Total financing requirements are estimated at US$27.8 million;these costs are detailed in Annex 5-2 and summarized below:
Summary of Capital Costs
Local Foreign Total Local Foreign Total %---- Kyats Millions ----- ------US$ Millions-----
Equipment /a 28.8 60.8 89.6 4.4 9.1 13.5 52Construction andCivil Works /a 12.6 3.4 16.0 1.9 0.5 2.4 9Engineering andProject Management 0.8 11.6 12.4 0.1 1.8 1.9 7
Training - 1.9 1.9 - 0.3 0.3 1Administration andPre-Production 2.3 - 2.3 0.3 - 0.3 1Sector Study - 1.3 1.3 - 0.2 0.2 1
Total Base Cost 44.5 79.0 123.5 6.7 11.9 18.6 71PhysicalContingencies 4.0 5.7 9.7 0.6 0.9 1.5 6Price Contingencies 18.0 21.7 39.7 2.7 3.2 5.9 23
Project Cost 66.5 106.4 172.9 10.0 16.0 26.0 100Incremental Work-ing Capital /b - - - - - -
Interest DuringConstruction 12.1 - 12.1 1.8 - 1.8Total Financ-ing Required 78.6 106.4 185.0 11.8 16.0 27.8
Taxes and Dutiesin Project Costs (39.8) (-) (39.8) (6.0) () (6.0) (23)
/a Includes freight, insurance, duties and commodity taxes. Spares for equip-ment are included in equipment costs.
/b No incremental working capital needs are shown for the project since im-provements in product quality and marketing efficiency will permit a re-duction in receivables and inventories sufficient to offset the addi-tional requirements that would otherwise result from increased output.
5.19 All base costs reflect March 31, 1976 prices. Estimates have been pre-pared in great detail by the consultants, based on their extensive experiencein Malaysia, and supplemented by budget quotations from suppliers. Estimatesfor civil construction and infrastructure are based on quotations from theConstruction Corporation of the Burmese Ministry of Works, and were foundby the consultants to be reasonably in line with their Malaysian experience.Duties and taxes amount to 23% of capital costs. In addition to normal
- 22 -
import duties averaging 15%, they include a newly-instituted 30% commoditytax on the C.I.F. value of imported machinery and equipment. Physical contin-gencies reflect varying firmness in design and engineering, and range from5% to 20% of the base estimate categories, and average about 10%. Priceescalation was applied to project cost components as follows: local andforeign equipment costs - 9% in 1976, 8% in 1977-79, 7% thereafter; localcivil works 20% per annum (reflecting recent cost trends in major locally-supplied construction materials such as cement and timber of at least 20%annually, which trends are expected to continue into the project constructionperiod); engineering, training and administration costs - 7% per annum forboth local and foreign costs. Overall, the capital cost estimates, andprovisions for physical and price contingencies, are felt to be realistic.The consultants have re-checked major project items in late 1976, includingconsultation with a leading tin dredge design firm, and have found both thebase estimates and the 1976 escalation allowance to be adequate.
D. Financing Plan
5.20 The proposed financing of the estimated requirements of US$27.8million equivalent for the project is shown below (Annex 5-3):
Financing Plan
US$ Millions Equivalent
Foreign Exchange Sources:IDA Credit 16.0
Local Currency Sources:Cash Generation 5.8Debt and Share Capital 6.0
Total Financing 27.8
The IDA credit will be made to the Government of Burma to cover all estimateddirect foreign exchange expenditures, with US$15.8 million equivalent to beonlent to the Corporation over 15 years, including 5 years grace, at 10% perannum, and other conditions satisfactory to IDA. The foreign exchange risk ofthe credit will be borne by the Corporation. The execution of the subsidiaryloan agreement between the Government and MC2 is a condition of credit effec-tiveness.
5.21 Local costs include construction and civil works and duties.The Government has agreed to allow the Corporation to retain its entire cashgeneration to finance a portion of the local costs of the project (US$5.8million) and, at the same time, maintain an adequate liquidity for its existingoperations. The Government has also agreed to the timely provision of funds, onterms and conditions satisfactory to IDA, to meet the estimated US$6.0 millionlocal currency requirements, and also to meet any shortfall in the Corporation'scash generation and any project cost overruns. Sufficient funds will be inthe form of equity so as to prevent MC2's long term debt to equity ratio fromexceeding 60:40, and its projected long-term debt service coverage from beingless than two times.
- 23 -
VI. PROJECT IMPLEMENTATION
A. Project Organization and Management
6.01 Project management will be based on: (a) recent MC2 experiencein executing the Heinda mine expansion and (b) engineering and project man-agement support from outside consultants (para 5.14). In some respects, theproject should face fewer problems than the Heinda expansion, where lack ofreliable water transport and the logistics of moving heavy equipment to thesite presented numerous problems and delays. The project will include itsown water transport facilities, and the only heavy equipment item (the dredge)will be constructed outside the country and floated to the Heinze Basin site.
6.02 The project organization (Annex 6-1) will be headed by a ProjectManager (the Director of Planning of MC2, who was responsible for the Heindaproject). He will be responsible to MC2's Management Committee. The consul-tants' terms of reference (Annex 6-2) will include assistance in detailedplanning and scheduling, procurement, supervision of construction and start-upof the facilities and their operation for a minimum of two years after projectcompletion. In addition to the managerial and technical assistance resultingfrom the consultants' involvement, some 34 personnel will receive a total ofabout 65 man-years of overseas training, probably in Malaysia, under super-vision of the consultants, in the operation of facilities virtually the sameas those of the project. The costs of this are included in the project (Annex5-2).
B. Project Schedule
6.03 The consultants are expected to start work by the end of the firstquarter of 1977, so that the first specifications and tender documents can beissued during the second quarter, and first orders placed following inter-national competitive bidding within the last quarter (Annex 6-3). Certainitems procured by international shopping (para. 6.04) may be ordered evenearlier. The dredge is scheduled for delivery in the last quarter of 1-979, bywhich time the on-shore project facilities should also be complete, withproduction commencing from all project components by the end of 1979.
C. Procurement
6.04 The packages of equipment and supplies for the project will beprepared and specified by the consultants and be subjected to internationalcompetitive bidding with the exception of some small items of highly special-ized equipment for which there are very few eligible suppliers; for theseinternational shopping procedures will be used. These small items would eachbe under US$75,000 equivalent in value and total about US$1 million. The onlygoods expected to be procured locally will be certain construction supplies,e.g., cement, timber. Under Burmese regulations, all local construction willbe done by the Government Construction Corporation. This work is relativelysmall-scale and will be under the general supervision of the project con-sultants.
- 24 -
6.05 Contract awards may have to be approved on an interministerialbasis. The Government has agreed to take any steps necessary to ensure promptreview of and decisions on all project procurement matters.
D. Allocation and Disbursement of IDA Credit
6.06 The allocation of the proceeds of the credit is shown in Annex 6-4.Disbursements would be made against 100% of foreign expenditures for (i)directly imported materials, equipment and machinery, and (ii) consultants'services, technical assistance and training. There would be no local currencyfinancing from the credit. The disbursement schedule (Annex 6-5) is based onestimates of order placements, payment schedules, and expected constructionand equipment delivery times in line with the construction schedule (Annex6-3). The credit is expected to be fully disbursed by the end of 1981. Anyuncommitted funds remaining would be used to finance other project components,if found justified, or otherwise would be cancelled.
VII. FINANCIAL ANALYSIS
7.01 Assumptions used in the financial analysis, forecast income state-ments, balance sheets, statements of sources and application of funds, to-gether with supporting data, are contained in Annexes 7-1 through 7-14.
A. Project Operating Costs and Revenues
7.02 Operating costs for the project (Annex 7-1) are based on the con-sultants' knowledge of Malaysian conditions, with adjustment to allow forthe limited operating experience in Burma. Production costs for dredgingand concentrating, including depreciation and interest charges, will beabout US$1.80 per lb. of concentrate (1976 prices) for the first eightyears of operation. This is in the lower range of dredging costs in othercountries and lower than typical costs for gravel pump and underground tinmining. As the grade of ore mined declines in the later years (para. 5.03),costs per ton of concentrate will rise such that, even with the loan repaidand no financial charges, they will be on the high side for dredging, andcomparable with typical present-day gravel pump mining costs.
7.03 Project revenues arise both from incremental production and theachievement of a higher grade on existing production, thereby reducing dis-counts and penalty charges (Annex 7-6).
B. Financial Rate of Return
7.04 The after-tax financial rate of return for the project is 10.0% and13.7% if the commodity tax or production value is excluded (Annex 7-3). Theserelatively low returns are due to: high import taxes and duties which raisecapital and operating costs for the project, and the distorted exchange ratefor the kyat. It is questionable how meaningful the financial return is in a
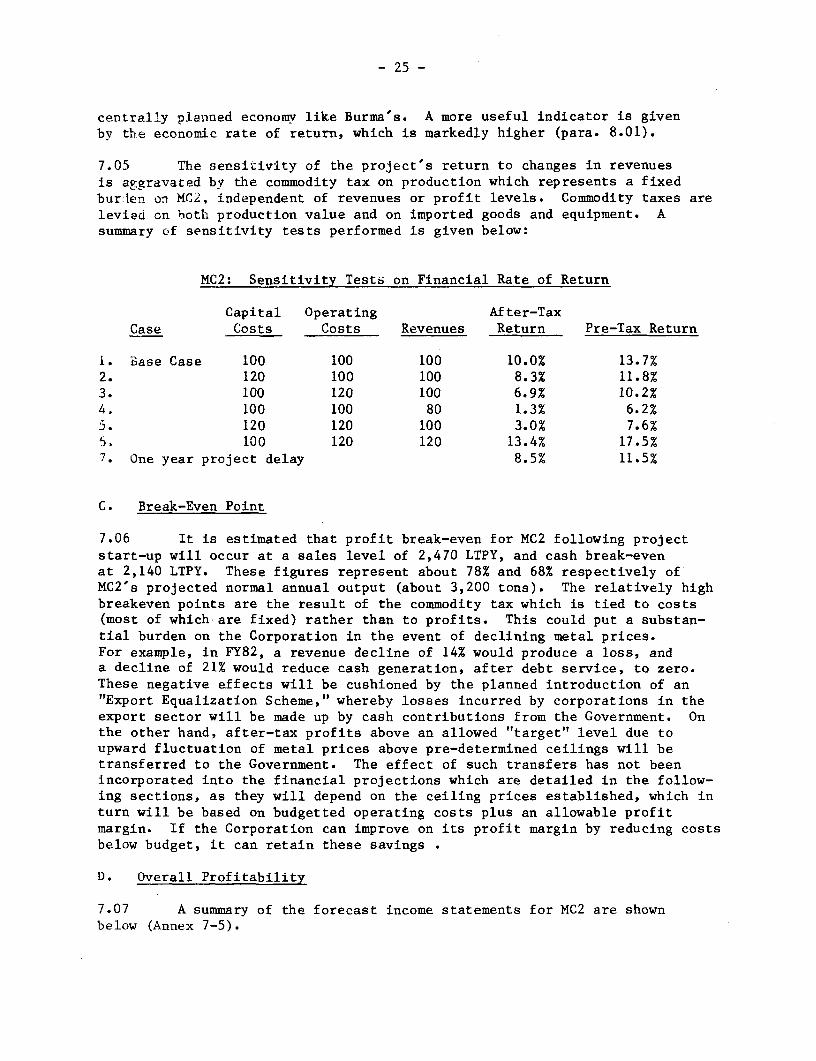
- 25 -
centrally planned economv like Burma's. A more useful indicator is givenby the economic rate of return, which is markedly higher (para. 8.01).
7.05 The sersizivity of the project's return to changes in revenuesis aggravated by the commodity tax on production which represents a fixedburslen on MC2, independent of revenues or profit levels. Commodity taxes arelevied on both production value and on imported goods and equipment. Asummary of sensitivity tests performed is given below:
MC2: Sensitivity Tests on Financial Rate of Return
Capital Operating After-TaxCase Costs Costs Revenues Return Pre-Tax Return
i. Base Case 100 100 100 10.0% 13.7%2. 120 100 100 8.3% 11.8%3. 100 120 100 6.9% 10.2%4. 100 100 80 1.3% 6.2%5. 120 120 100 3.0% 7.6%S. 100 120 120 13.4% 17.5%7. One year project delay 8.5% 11.5%
C. Break-Even Point
7.06 It is estimated that profit break-even for MC2 following projectstart-up will occur at a sales level of 2,470 LTPY, and cash break-evenat 2,140 LTPY. These figures represent about 78% and 68% respectively ofMC2's projected normal annual output (about 3,200 tons). The relatively highbreakeven points are the result of the commodity tax which is tied to costs(most of which are fixed) rather than to profits. This could put a substan-tial burden on the Corporation in the event of declining metal prices.For example, in FY82, a revenue decline of 14% would produce a loss, anda decline of 21% would reduce cash generation, after debt service, to zero.These negative effects will be cushioned by the planned introduction of an"Export Equalization Scheme," whereby losses incurred by corporations in theexport sector will be made up by cash contributions from the Government. Onthe other hand, after-tax profits above an allowed "target" level due toupward fluctuation of metal prices above pre-determined ceilings will betransferred to the Government. The effect of such transfers has not beenincorporated into the financial projections which are detailed in the follow-ing sections, as they will depend on the ceiling prices established, which inturn will be based on budgetted operating costs plus an allowable profitmargin. If the Corporation can improve on its profit margin by reducing costsbelow budget, it can retain these savings
D. Overall Profitability
7.07 A summary of the forecast income statements for MC2 are shownbelow (Annex 7-5).

- 26 -
MC2: Summary of Prolected Income Statements(Kyats Millions)
FY 1976 FY 1977 FY 1978 FY 1979 FY 1980 FY 1981 FY 1986(Actual)
Concentrate Sales (tons)Total Sales 1,571 1,880 1,990 2,820 2,745 3,775 3,280Project-Related Sales - - - - 115 1,140 645
Net Revenues 42.6 63.5 72.7 107.7 114.3 196.1 261.0Gross Profit 14.3 20.1 28.4 44.8 40.5 91.2 135.7Pre-tax Profit 10.4 12.8 16.7 32.4 25.8 66.3 95.1Net Profit 5.2 3.9 6.7 19.0 10.1 43.8 66.3
Cash Generation 6.8 8.2 14.3 26.6 19.4 65.5 90.1Net Revenue per ton(K 000) 27.1 33.8 36.6 38.2 41.6 52.0 79.6
Cost of Sales per ton(K 000) 18.0 24.0 24.0 23.1 24.3 25.8 38.2
7.08 After project start-up in FY80-81, sales volume is projected to in-crease 140% from FY76 levels. In addition to some gains in output at exist-ing mines, the bulk of the increase in sales volume arises from the project(900 LTPY) and expansion of the Heinda mine (800 LTPY). Also in FY81, withthe start-up of the Tavoy concentrator, the sale of MC2's output throughsmelter contracts will allow a reduction in inventory levels (para 4.11),giving sales a one-time boost. Production and sales volumes decline some-what in later years as the Heinze Basin dredge encounters lower grade oresand the effect of the one-time inventory reduction is absorbed.
7.09 Revenues increase at an even faster rate than sales volume (up360% in current terms from FY76 to FY81). This reflects higher tin andtungsten prices forecast over the period, together with the realization ofbetter prices for MC2's output once the Tavoy concentrator comes on stream.
7.10 Costs per ton jump considerably in FY77 reflecting wage increases,implementation of bonus and social security schemes, and the institutionof the commodity tax on imported materials (averaging 30%). Beyond 1977,costs per ton remain relatively steady as output gains offset total costincreases and as lower cost facilities (Heinda and Heinze Basin) begin produc-tion.
7.11 Pre-tax profits increase strongly over the forecast period - up465% by FY81. Net profits follow a somewhat different trend. Declinesfrom FY76 levels occur in FY77 and 78 as a result of replacement of theincome tax by the commodity tax on production and overhead costs (15% on costsplus a 12% nominal profit - equivalent to 16.8% on costs). Once sales volumesand margins pick up in FY79 and beyond, the burden of the commodity taxbecomes progressively less and net profits show a sharp recovery.
E. Financial Position and Covenants
7.12 Forecast balance sheets for MC2 are summarized below (Annex 7-9):
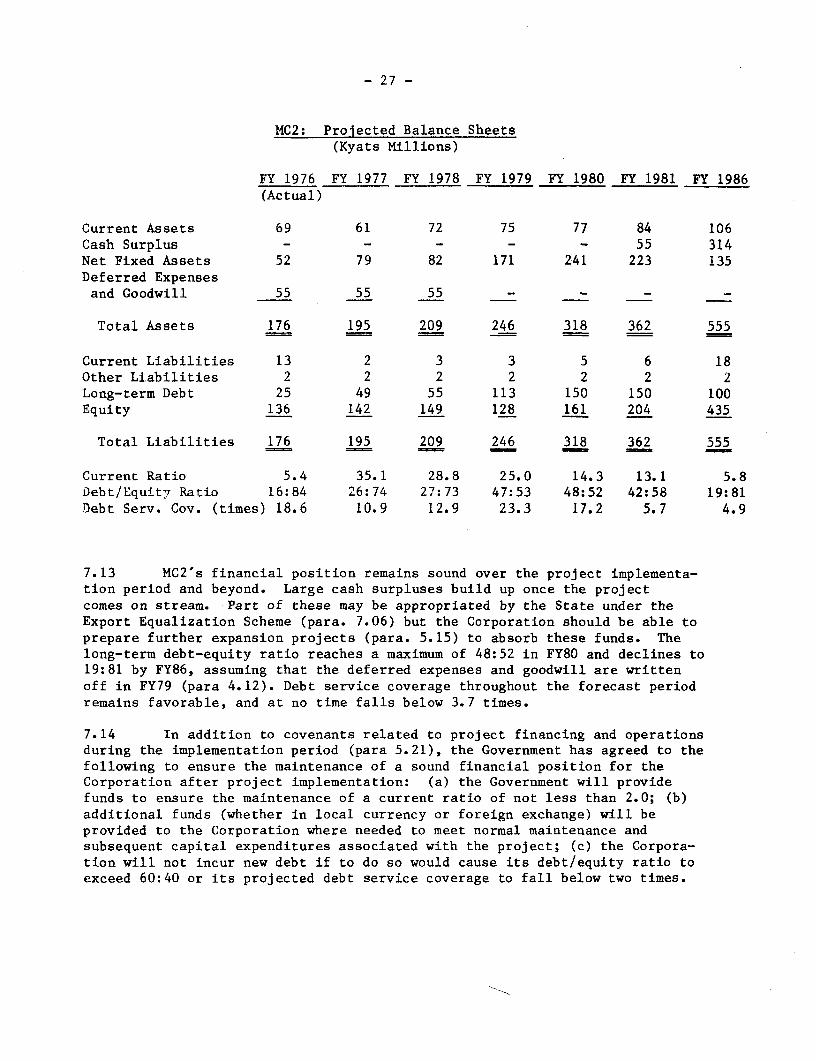
- 27 -
MC2: Prolected Balance Sheets(Kyats Millions)
FY 1976 FY 1977 FY 1978 FY 1979 FY 1980 FY 1981 FY 1986(Actual)
Current Assets 69 61 72 75 77 84 106Cash Surplus - - - - - 55 314Net Fixed Assets 52 79 82 171 241 223 135Deferred Expensesand Goodwill 55 55 55 - - - -
Total Assets 176 195 209 246 318 362 555
Current Liabilities 13 2 3 3 5 6 18Other Liabilities 2 2 2 2 2 2 2Long-term Debt 25 49 55 113 150 150 100Equity 136 142 149 128 161 204 435
Total Liabilities 176 195 209 246 318 362 555
Current Ratio 5.4 35.1 28.8 25.0 14.3 13.1 5.8Debt/Equity7 Ratio 16:84 26:74 27:73 47:53 48:52 42:58 19:81Debt Serv. Cov. (times) 18.6 10.9 12.9 23.3 17.2 5.7 4.9
7.13 MC2's financial position remains sound over the project implementa-tion period and beyond. Large cash surpluses build up once the projectcomes on stream. Part of these may be appropriated by the State under theExport Equalization Scheme (para. 7.06) but the Corporation should be able toprepare further expansion projects (para. 5.15) to absorb these funds. Thelong-term debt-equity ratio reaches a maximum of 48:52 in FY80 and declines to19:81 by FY86, assuming that the deferred expenses and goodwill are writtenoff in FY79 (para 4.12). Debt service coverage throughout the forecast periodremains favorable, and at no time falls below 3.7 times.
7.14 In addition to covenants related to project financing and operationsduring the implementation period (para 5.21), the Government has agreed to thefollowing to ensure the maintenance of a sound financial position for theCorporation after project implementation: (a) the Government will providefunds to ensure the maintenance of a current ratio of not less than 2.0; (b)additional funds (whether in local currency or foreign exchange) will beprovided to the Corporation where needed to meet normal maintenance andsubsequent capital expenditures associated with the project; (c) the Corpora-tion will not incur new debt if to do so would cause its debt/equity ratio toexceed 60:40 or its projected debt service coverage to fall below two times.
- 28 -
F. Major Risks
7.15 Major risks associated with the project are threefold. First,management is inexperienced in dredging and in more modern concentratingoperations and present managerial and financial control over the Corporation'sactivities needs improvement. This problem should be alleviated by theproposed overseas training of key technicians and the provision of extensivetechnical assistance and supervision by consultants during project implemen-tation and for two years following startup. The consultants will also assistin implementing a more effective management control system for the Corporation.In addition, the current expansion of the Heinda mine has added to MC2'sexpertise in the supervision of expansion projects.
7.16 Second, there have been some insurgency activities in the projectarea in the past, and recurrence of these could adversely affect projectimplementation. On the other hand, no security problems arose with the KFW-financed project at nearby Heinda, and the general area appears to be underreasonable control.
7.17 A third risk relates to the possibility of prices for tin and tungs-ten being lower than projected. Offsetting this, the influence of the Inter-national Tin Council in moderating downward price pressures through its bufferstock operations, and the prospect of increased cooperation among tungstenproducers should act to lessen the downside risk of future price fluctuations.Also, if the Government's new Export Equalization Scheme can work effectively,the financial risk to the Corporation due to metal price fluctuations will beminimized. Most importantly, the Corporation is expected to remain a lowcost producer of tin/tungsten while the project will help to improve productquality and therefore its saleability.
VIII. ECONOMIC JUSTIFICATION
A. Economic Rate of Return
8.01 The economic rate of return for the project is estimated at 21.0%at the official rate of exchange for the kyat (Annex 8-1). The differencebetween the economic and financial rates of return is due to import duties andcommodity taxes, which affect both capital and operating costs significantly.Using a shadow-priced rate of US$1 = K 13, versus the 6.65 official rate, theeconomic rate of return becomes 28.5%. The official exchange rate is main-tained by very stringent exchange and trade restrictions. Black market ratesare at least 18 to 20 Kyats per US dollar, but the 13.0 shadow rate wascalculated as the rate that would prevail with free trade, reflecting theopportunity cost of a marginal unit of foreign exchange. Sensitivity testsshow that the project's contribution to the economy will remain favorable evenunder adverse conditions. For example, with a 20% drop in revenues, theproject's economic rate of return remains above 20% on a fully shadow-pricedbasis.
- 29 -
B. Foreign Exchange and Other Benefits
8.02 The Burmese Government gives high priority to expansion of themineral sector. By strengthening local management and operational exper-tise, the project will provide a foundation from which further projects canbe developed and successfully implemented. More directly, the project com-ponents will create employment for about 300 persons in remote areas of thecountry where existing opportunities are limited. In addition, social ser-vices will be provided in the form of a townsite, hospital, school, waterand sanitation facilities associated with the project.
8.03 Export earnings over the 19-year project life are expected to aver-age the equivalent of US$6.0 million annually in 1976 terms (Annex 8-2).This represents about 3% of the value of Burma's average 1973-75 exportsand almost one third of those presently generated by the mineral sector. Netforeign exchange benefits (after outflows for capital, operating and debtservice costs) are forecast at US$4.6 million annually (1976 terms). Thesegains will have a positive impact on the country's foreign exchange situation,which must be improved if Burma is to start to realize its full developmentpotential.
IX. AGREEMENTS
9.01 The following commitments have been agreed to by the Government:
(i) A study on MC2's inventory and receivables policy and a plan forreducing these to an appropriate level will be submitted to IDAby August 31, 1977 (para. 4.11).
(ii) Measures reflecting sound accounting practices will be takenregarding MC2's intangible assets by March 31, 1978 (para 4.12).
(iii) MC2 will prepare a manpower plan with consulting assistance, in-cluding the establishment of staffing levels and appropriatebonus systems, to submit to IDA by December 31, 1977 (para. 4.14).
(iv) The Minerals Marketing Committee will be given the authority totake appropriate measures to improve marketing efficiency(para. 4.15).
(v) Audited financial statements will be presented to IDA within fivemonths of the close of each fiscal year and quarterly financialstatements within 60 days (para. 4.17).
(vi) The unsurfaced road between Tavoy and Heinze Basin will beupgraded before December 31, 1979 (para. 5.02).
(vii) The project consultants will assist MC2 in improvement of theexport of concentrates (para. 5.12).
- 30 -
(viii) MC2 will retain suitable consultants to assist with engineering,project execution, general management and early operation of theproject (para. 5.14).
(ix) The Corporation will not embark on any major new investments(over US$1 million equivalent per year) without prior IDAapproval (para. 5.15).
(x) The Government will employ consultants to assist with a studyof the future development of the mineral sector (para. 5.16).
(xi) The Corporation will be permited to retain its entire cashgeneration during project implementation, and the Governmentwill provide US$6.0 million equivalent in local currency onterms satisfactory to IDA, plus additional funds to meet anyshortfall, to meet any cost overruns and to maintain theCorporation's debt-to-equity ratio below 60:40 (para. 5.21).
(xii) The Government will take steps to ensure prompt review of anddecisions on all procurement matters (para. 6.05).
(xiii) The Government and the Corporation will meet certain financialcovenants (para. 7.14).
9.02 Conditions of credit effectiveness are as follows:
(i) A suitable site for the Tavoy concentrator will be acquired(para. 5.10).
(ii) The project consultants will be employed (para. 5.14).
(iii) An onlending agreement, satisfactory to IDA, will be concludedbetween the Government and the Corporation (para. 5.20).
9.03 Subject to the foregoing conditions and commitments, the projectprovides a sound basis for an IDA credit to the Government of Burma of US$16million equivalent, with onlending of US$15.8 million equivalent to theNo. 2 Mining Corporation for a period of 15 years, including 5 years of grace,at 10% interest per annum.
Industrial Projects DepartmentFebruary 1977
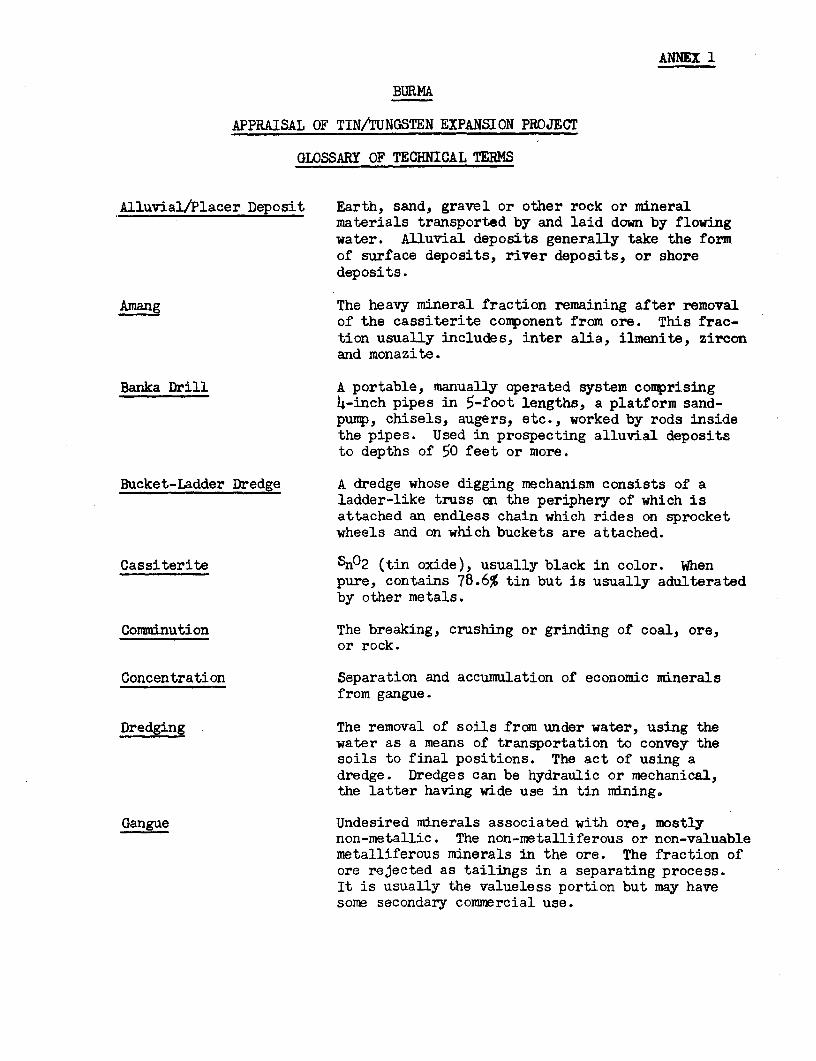
ANNEX 1
BURMA
APPRAISAL OF TIN/TUNGSTEN EXPANSION PROJECT
GLOSSARY OF TECHNICAL TERMS
Alluvial/Placer Deposit Earth, sand, gravel or other rock or mineralmaterials transported by and laid down by flowingwater. Alluvial deposits generally take the formof surface deposits, river deposits, or shoredeposits.
Amang The heavy mineral fraction remaining after removalof the cassiterite component from ore. This frac-tion usually includes, inter alia, ilmenite, zirconand monazite.
Banka Drill A portable, manually operated system comprising4-inch pipes in 5-foot lengths, a platform sand-pump, chisels, augers, etc., worked by rods insidethe pipes. Used in prospecting alluvial depositsto depths of 50 feet or more.
Bucket-Ladder Dredge A dredge whose digging mechanism consists of aladder-like truss on the periphery of which isattached an endless chain which rides on sprocketwheels and on which buckets are attached.
Cassiterite Sn02 (tin oxide), usually black in color. Whenpure, contains 78.6% tin but is usually adulteratedby other metals.
Comminution The breaking, crushing or grinding of coal, ore,or rock.
Concentration Separation and accumulation of economic mineralsfrom gangue.
Dredging The removal of soils from under water, using thewater as a means of transportation to convey thesoils to final positions. The act of using adredge. Dredges can be hydraulic or mechanical,the latter having wide use in tin mining.
Gangue Undesired minerals associated with ore, mostlynon-metallic. The non-metalliferous or non-valuablemetalliferous minerals in the ore. The fraction ofore rejected as tailings in a separating process.It is usually the valueless portion but may havesome secondary commercial use.

ANNEX 1Page 2
Gravel Pump Mining This method of alluvial mining consists of (1)excavating and breaking up the gravel bank,usually by using monitors; (2) washing the dis-integrated material into a sump, excavated in thebedrock; (3) elevating the mixture from the sumpto an elevated line of sluices by means of a gravelpump; and (4) sluicing the gravel for the recoveryof its mineral content.
Gravity Separation Treatment of mineral particles which exploits dif-ferences between their specific gravities, theirsizes and shapes also playing a minor part in separa-tion, performed by means of jigs, classifiers,hydrocyclones, dense media, shaking tables, Humphrey'sspirals, sluices, vanners, buddles.
Ground Sluicing Moving earth, sand, gravel, or other rock or mineralmaterials by flowing water.
High-tension Separation In mineral processing, the use of high-voltagedirect current at between 18,000 and 80,000 voltsto charge small particles of dry ore as they fallthrough its field (emanating as a spray or a pointdischarge). These are then sorted into relativelycharge-retaining and charge-losing minerals inaccordance with their conducting power, e.g., separa-tion of cassiterite and heavy minerals such asilmenite, xenotime. Also called electrostaticseparation.
Ilmenite An iron-black mineral, FeO-TiO2; sometimes withsome replacement of iron by magnesium or manganese.Used in making ceramic products.
Jig A machine in which the feed is stratified in waterby means of a pulsating motion and from which thestratified products, e.g. cassiterite, gangue, areseparately removed, the pulsating motion beingusually obtained by alternate upward and downwardcurrents of the water. Also called washbox.
Lanchute A coffin-shaped sluice box, about 5 meters inlength, used for the manual second-stage concentra-tion of tin-ore.
Lode Strictly, a rock fissure filled with mineral;usually applied to metalliferous lodes. In generalminers' usage, a lode vein, or ledge is a depositof valuable mineral between definite boundaries.The word should not be used for a flat or stratified

ANNEX 1Page 3
mass. A lode consists of several veins spacedclosely enough so that all of them, together withthe intervening rock, can be mined as a unit.
Magnetic Separator A device in which medium solids are caused toadhere, by magnetic means, to a conveying belt ordrum, while a current of water removes non-magneticparticles which contaminate the medium, e.g., theremoval of gangue from cassiterite ore.
Magnetite, Magnetic Natural black oxide of iron, Fe3 04. As black sand,Iron Ore magnetite occurs in placer deposits and also as
lenticular bands. Magnetite is used widely as asuspension solid in dense medium washing of coaland ores.
Middlings That part of the product of washery, concentrationor preparation plant which is neither mineral norreject (tailings). It consists of fragments ofmineral and gangue. The material is often sentback for crushing and retreatment.
Mixed Concentrate Concentrate with various mineral components, morethan one of which is present, in commercial quanti-ties, e.g., values of tin and tungsten.
M4onazite A phosphate of the cerium metals and the principalore of the rare earths and thorium. One of thechief sources of thorium, used in the manufactureof gas mantles.
Monitor Jet used to direct high-pressure water on uncon-solidated gravels and sands in alluvial mining tobreak down, wash and transport them.
Palong A form of sluice box, usually between 60 and 100meters in length and fitted with riffles, commonlyused as the primary concentrating device in recover-ing alluvial tin-ore by hydraulic open-cast methods.
Panning Washing earth or crushed rock in a pan, by agita-tion with water, to obtain the particles of greatestspecific gravity which it contains. Used only forhigh value minerals.
Refractory A material of very high melting point with proper-ties that make it suitable for such uses as furnacelinings and kiln construction.

ANNEX 1Page 4
Sand Wash Bed of water-worn gravels, boulders and sand inalluvial deposits and containing concentrationsof the metal or mineral sought.
Scalping The removal, by screen or grizzly, of undesirablefine material from broken ore, stone, or gravel.(Also,a milling term for the removing of a mineralduring closed-circuit grinding of the ore.)
Scheelite Calcium tungstate, CaWO4; one of the major sourcesof tungsten. Typically,, scheelite concentrate wouldcontain 70% Wi3 (tungsten tri-oxide).
Shaking Table Used in concentration of finely crushed ores, e.g.tin, by gravity. A rectangular deck with longitu-dinal riffles, it is shaken rapidly in a compoundedto-and-fro motion by a vibrator in such a way asto move the sands along while they are exposed tothe sweeping action of a stream of water flowingacross the deck, which is tilted about its longaxis.
Tribute Mining System under which a syndicate of miners deliversore at the pithead at an agreed price. It mayalso operate where ore deposits are too small andscattered for normal mining activities. Thetributors work and deliver their ore to the ownerand receive payment calculated upon agreed termsfrom its ascertained valuable content. Also,working on a sharing basis.
Trommel A revolving cylindrical screen used in gradingcoarsely crushed ore. The material to be screenedis delivered inside the trommel at one end. Thefine material drops through the holes; the coarseis delivered at the other end.
Wilfey Table Long-established and widely-used form of shakingtable. Plane rectangle is mounted horizontallyand can be sloped about its long axis. It has ahard cover, e.g., linoleum with longitudinalriffles diminishing at discharge end to a smoothcleaning area, triangular in upper corner. A oompoundeccentric is used to create gentle and rapid throwingmotion on table, longitudinally. Sands, usuallyclassified for size range, are fed continuously andworked along table with aid of feedwater and acrossriffles downslope by gravity tilt adjustment, andadded washwater.
ANNEX 1Page 5
Willoughby Box Washing box unit used for wet separation ofcassiterite.
Wolframite A mineral series, (Fe, Mn) WO, ranging from FeWO4(feberite) to MnWO4 (heubnerite). Occurs asbrownish-black monoclinic crystals, columnaraggregates, or granular masses in association withtin ores. An important ore of tungsten.
lenotime Anyttrium phosphate, YPO4, an important source forthe rare elements, cerium, erbium, and thorium,which have uses in various alloys. Thorium couldbe used as a nuclear fuel.
Zircon A mineral, ZrSiO4, which has a number of industrialuses in retallurgical, electrical, nuclear energyand chemical fields.
Industrial Projects DepartmentOctober 1976

ANNEX 2Page 1
BURMA
APPRAISAL OF TIN/TUNGSTEN EXPANSION PROJECT
THE BURMESE MINERAL SECTOR
A. PRESENT POSITION AND RECENT TRENDS
1. Role in the Economy
1. The mineral industry in Burma contributed about 1.4% to the GDP in1974 and this proportion has not changed significantly in recent years. Thevalue of mineral exports in 1974 was K 89 million (US$18.5 million), 9.5% ofthe total value of exports 1/. This value has increased from K 39 million(US$8.2 million) in 1970 2/ (when minerals made up 7% of the total value ofexports). However, the only significant development appears to be the in-crease in the export value of precious stones from K 7 million (US$1.5 mil-lion) in 1970 to K 42 million (US$8.7 million) in 1974. Other positivedevelopments are the increase in the production of antimony (1970 - nil;1974 - 1,050 tons) and an increase in the production of tin concentrates(1970 - 450 tons; 1974 - 719 tons). This additional output of antimonyand tin is equivalent to an increase of about US$1 million in the netrealized value of mineral exports.
2. Since domestic consumption of metallic minerals is negligible,the production figures are indicative of export volumes. By the officialstatistics, which of course do not include illegal production and trade,production of minerals for export is about 10% of pre-War levels (1938-39)and is basically static. No significant new mines have come into operationfor nearly 40 years. There are no substantial smelting, refining or othervalue-adding facilities other than an antiquated lead/zinc smelter.
3. An unknown but not insignificant value of minerals is smuggledout of the country and constitutes an important barter good. Gemstones,tin/tungsten and jade are the principal commodities in this trade. Someestimates place such uncontrolled movement as high as about 60% of thegemstones and between 1,000 and 2,000 tons of tin and tungsten con-centrates. If such estimates are correct then this illegal trade isworth about US$7 million, or somewhat in excess of one-third of theofficial value of mineral exports. Providing some evidence of this un-controlled trade is the fact that about 3,000 illegal workers were re-cently driven off the gemstone workings by the army. Also, apparently
1/ Including base metals, silver and precious stones (IBRD Report No.565a-BA, statistical appendix). The 1974 export figure is themid-year forecast.
2/ 1970 US$1 = K 4.76; 1974 US$1 = K 4.81.

ANNEX 2Page 2
several gravel pump operations were recently discovered within Burmeseterritory funded by Thai capital. Since patrolling of the Thai borderis difficult it is likely that while some operations were intercepted,others have started up. Furthermore, the price paid by the Government fortin concentrates from the tributors is much less than what they canobtain across the border in Thailand (largely due to the artificial Kyatexchange rate). As a result, it is very likely that official tributorsales are merely token sales to maintain good relations with the Govern-ment.
4. The mining industry provides employment for about 18,000 (exclud-ing the Myanma Oil Corporation) or less than 1% of total employment measuredby official figures. An estimated 8,000 work in mines only during the wetseason when water conditions permit alluvial mining of tin. The largestemployers are the Myanma Bawdwin Corporation, employing about 6,000, and theMyanma Tin Tugsten Corporation, employing about 3,000.
2. Government Policy and Development Assistance
5. With the implementation of the First Four-Year Plan (1971/72 -1974/75), the Government identified the minerals sector as one of thedevelopment sectors. The sectoral policy pronounced in the First Planwas "To work all chemical and mineral enterprises, except those specificallypermitted to be worked on cooperative basis, as State-owned enterprises."
6. The most tangible evidence of the Government's serious intentionsto develop the sector are the numerous technical appraisal missions whichhave been invited to examine the sector and the several development andtechnical assistance contracts which have been implemented. In general,Government implementation policy has been to identify potential projectsand to assign them for development through bilateral and multilateraltechnical assistance programs and through bilateral credit agreements.
7. Since nearly all projects are still in initial stages of prepara-tion, it is not clear to what extent Government intends to rely on foreigntechnical and managerial ability to ensure successful operations. It wouldappear that "turnkey" projects are favored, delivered with trained domesticteams and meeting guaranteed performance criteria. The Government isapparently not considering operating under any form of contract managementor participatory agreements.
8. The main thrust of the Government's development policy forthe sector is to invest in modernization and reopening of mines whichwere operational before the War and are now either operating at reducedcapacity (e.g. Bawdwin lead-zinc mine) or on a tribute basis (e.g.,several tin placers) or have closed down (e.g., tin dredging operationsin the Heinze basin). The only major departure from this pattern is theexploration work conducted on the Monywa copper deposit. On a commodity
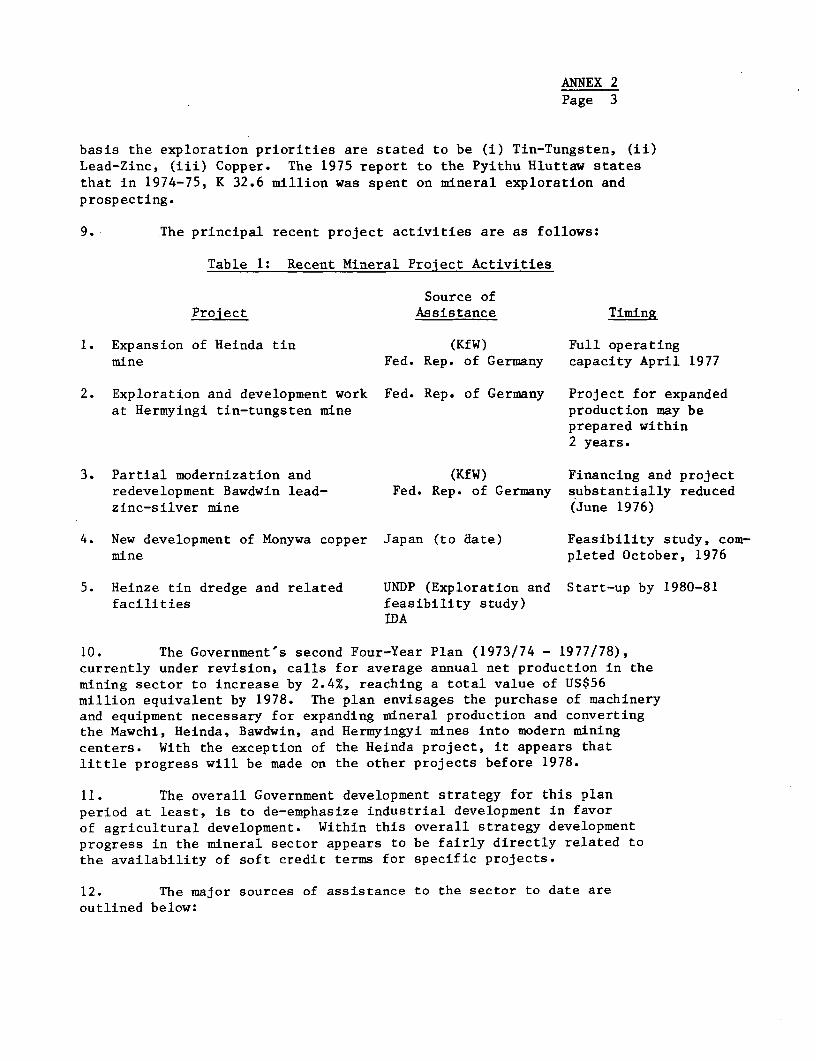
ANNEX 2Page 3
basis the exploration priorities are stated to be (i) Tin-Tungsten, (ii)Lead-Zinc, (iii) Copper. The 1975 report to the Pyithu Hluttaw statesthat in 1974-75, K 32.6 million was spent on mineral exploration andprospecting.
9. The principal recent project activities are as follows:
Table 1: Recent Mineral Project Activities
Source ofProject Assistance Timing
1. Expansion of Heinda tin (KfW) Full operatingmine Fed. Rep. of Germany capacity April 1977
2. Exploration and development work Fed. Rep. of Germany Project for expandedat Hermyingi tin-tungsten mine production may be
prepared within2 years.
3. Partial modernization and (KfW) Financing and projectredevelopment Bawdwin lead- Fed. Rep. of Germany substantially reducedzinc-silver mine (June 1976)
4. New development of Monywa copper Japan (to date) Feasibility study, com-mine pleted October, 1976
5. Heinze tin dredge and related UNDP (Exploration and Start-up by 1980-81facilities feasibility study)
IDA
10. The Government's second Four-Year Plan (1973/74 - 1977/78),currently under revision, calls for average annual net production in themining sector to increase by 2.4%, reaching a total value of US$56million equivalent by 1978. The plan envisages the purchase of machineryand equipment necessary for expanding mineral production and convertingthe Mawchi, Heinda, Bawdwin, and Hermyingyi mines into modern miningcenters. With the exception of the Heinda project, it appears thatlittle progress will be made on the other projects before 1978.
11. The overall Government development strategy for this planperiod at least, is to de-emphasize industrial development in favorof agricultural development. Within this overall strategy developmentprogress in the mineral sector appears to be fairly directly related tothe availability of soft credit terms for specific projects.
12. The major sources of assistance to the sector to date areoutlined below:
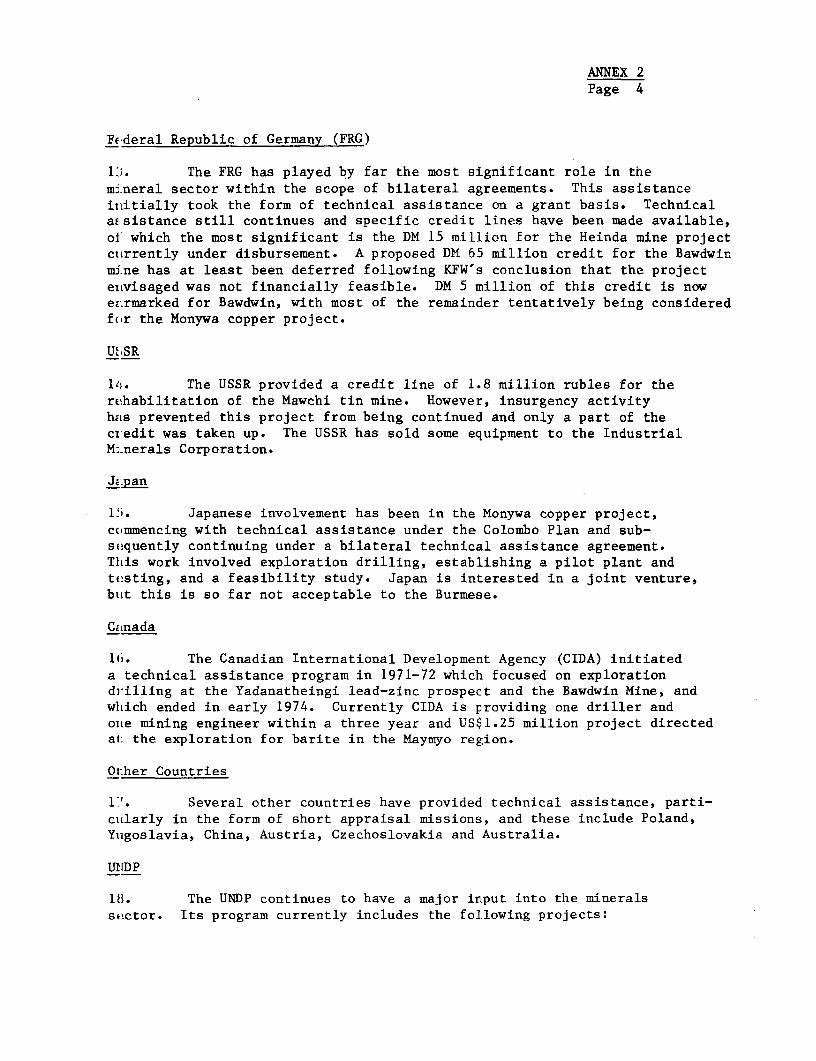
ANNEX 2Page 4
FEderal Republic of Germany (FRG)
1:i. The FRG has played by far the most significant role in them:neral sector within the scope of bilateral agreements. This assistanceinitially took the form of technical assistance on a grant basis. Technicalassistance still continues and specific credit lines have been made available,of which the most significant is the DM 15 million for the Heinda mine projectcturrently under disbursement. A proposed DM 65 million credit for the Bawdwinmine has at least been deferred following KFW's conclusion that the projectentvisaged was not financially feasible. DM 5 million of this credit is nowearmarked for Bawdwin, with most of the remainder tentatively being consideredfor the Monywa copper project.
U_SR
1's. The USSR provided a credit line of 1.8 million rubles for therehabilitation of the Mawchi tin mine. However, insurgency activityhas prevented this project from being continued and only a part of thecredit was taken up. The USSR has sold some equipment to the IndustrialM:nerals Corporation.
Jiapan
1li. Japanese involvement has been in the Monywa copper project,commencing with technical assistance under the Colombo Plan and sub-sequently continuing under a bilateral technical assistance agreement.This work involved exploration drilling, establishing a pilot plant andtesting, and a feasibility study. Japan is interested in a joint venture,but this is so far not acceptable to the Burmese.
Canada
16. The Canadian International Development Agency (CIDA) initiateda technical assistance program in 1971-72 which focused on explorationdrilling at the Yadanatheingi lead-zinc prospect and the Bawdwin Mine, andwhich ended in early 1974. Currently CIDA is providing one driller andone mining engineer within a three year and US$1.25 million project directedat: the exploration for barite in the Maymyo region.
01:her Countries
17. Several other countries have provided technical assistance, parti-ciularly in the form of short appraisal missions, and these include Poland,Yugoslavia, China, Austria, Czechoslovakia and Australia.
UIDP
18. The UNDP continues to have a major input into the mineralssector. Its program currently includes the following projects:
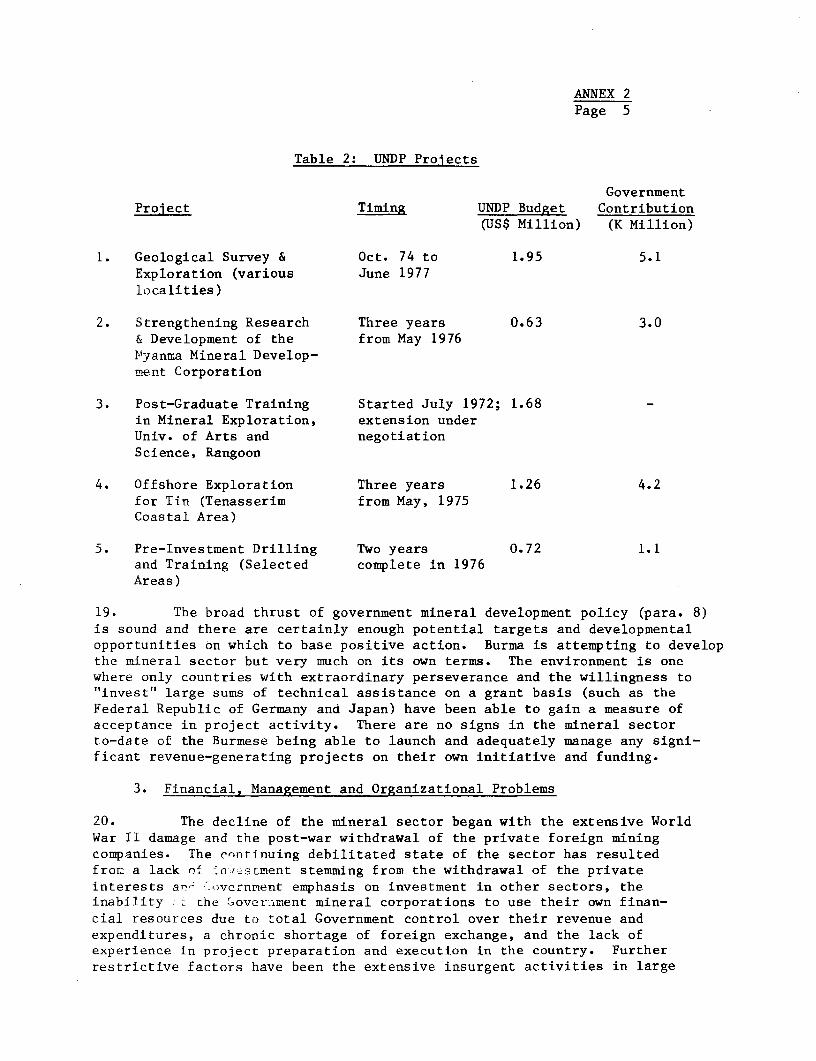
ANNEX 2Page 5
Table 2: UNDP Projects
GovernmentProject Timing UNDP Budget Contribution
(US$ Million) (K Million)
1. Geological Survey & Oct. 74 to 1.95 5.1Exploration (various June 1977localities)
2. Strengthening Research Three years 0.63 3.0& Development of the from May 19761Ayanma Mineral Develop-ment Corporation
3. Post-Graduate Training Started July 1972; 1.68in Mineral Exploration, extension underUniv. of Arts and negotiationScience, Rangoon
4. Offshore Exploration Three years 1.26 4.2for Tin (Tenasserim from May, 1975Coastal Area)
5. Pre-Investment Drilling Two years 0.72 1.1and Training (Selected complete in 1976Areas)
19. The broad thrust of government mineral development policy (para. 8)is sound and there are certainly enough potential targets and developmentalopportunities on which to base positive action. Burma is attempting to developthe mineral sector but very much on its own terms. The environment is onewhere only countries with extraordinary perseverance and the willingness to"invest" large sums of technical assistance on a grant basis (such as theFederal Republic of Germany and Japan) have been able to gain a measure ofacceptance in project activity. There are no signs in the mineral sectorto-date of the Burmese being able to launch and adequately manage any signi-ficant revenue-generating projects on their own initiative and funding.
3. Financial, Management and Organizational Problems
20. The decline of the mineral sector began with the extensive WorldWar II damage and the post-war withdrawal of the private foreign miningcompanies. The continuing debilitated state of the sector has resultedfrom a lack of inv=stment stemming from the withdrawal of the privateinterests arn overnment emphasis on investment in other sectors, theinability ;. che ½overament mineral corporations to use their own finan-cial resources due to total Government control over their revenue andexpenditures, a chronic shortage of foreign exchange, and the lack ofexperience in project preparation and execution in the country. Furtherrestrictive factors have been the extensive insurgent activities in large

ANNEX 2Page 6
areas of the country where minerals can be produced and the Governmentpolicy of not allowing foreign or private participation in the developmentof the sector. A recent exception to this latter policy has been the adventof joint ventures in petroleum exploration involving private oil companiesbut foreign participation in the non-petroleum sector has been limited tobi-lateral and multilateral technical assistance and financial aid, asoutlined above.
21. The major problems confronting the sector are poor and outmodedplant, a lack of planning experience and commercial orientation, shortagesof foreign exchange and the related shortage of spare parts, a fragmentedorganizational structure, a weak financial situation for most of the sector'scorporations, over-employment and reluctance to rationalize, and the dis-torted exchange rate of the kyat, which contributes substantially to thefinancial weakness of the mining corporations and results in marginalfinancial returns for most substantial projects and a diversion of asignificant proportion of sector output into illegal trading.
22. There are some signs that the long term sectoral decline iscoming to an end. Government policies over the last few years have resultedin increased activities by various agencies in the sector, as described inthe previous section.
23. A reasonable degree of technical competence exists at variouslevels in the sector's institutions but management abilities are limitedand there is a lack of innovation and initiative. In certain areas thereare labor shortages (para. 32) but this has not been a major limitingfactor. It is not likely that substantial projects in the sector couldbe adequately prepared and implemented without fairly extensive outsidetechnical assistance in addition to the essential outside financialresources.
24. Although most of the sector institutions are called corporations,their separate legal identity is vague and they have extremely limited auto-nomous power. There are no shares or similar instruments and ownership is bythe people and vested in the State. All revenues have gone to the UnionGovernment Consolidated Fund (UGCF) and operating and capital expenditures havebeen drawn from the Fund under rigid and restricted budgets approved by theGovernment. There has been some modification of this financial system with theintroduction a few years ago of limited "borrowing" at no interest under theWorking Capital System but the corporations have had little effective controlover their financial resources and there have been no charges for funds drawnfrom the UGCF, which has been the sole source of finance other than a fewbi-lateral credits on-lent through the central Bank.
25. The responsibilities and powers of the mining corporations havebeen purely operational and all policy decisions have been taken by theMinister of Mines or the Economic Committee of the Council of Ministers.Some liberalization of this highly centralized control is envisaged under newguidelines, described under the section on the structure of the sector.
ANNEX 2Page 7
26. The entire minerals sector in the country is equivalent tothe output of a fairly small mining company elsewhere which could operate witha central office staff of about 50 professionals and support personnel,a geological staff of about 20 and several district offices employing anadditional managerial and office staff of about 100 (down to the mine or plantsuperintendent level). In contrast, mining operations in Burma are dividedbetween four operating corporations and supervisory and support staff run intothe hundreds. There is not one good managerial group but several fairlymediocre ones. The argument for this "decentralization" is that one singleorganization would be too unwieldy, given the size and operational methods ofthe bureaucracies involved. The appraisal mission did not examine in detailthe degree of duplication of common services in such a system (such as account-ing, stores, marketing, geology and planning) which generally benefit con-siderably through centralization and computerization of the more routineelements. The scope for improvement of management systems is substantial.There is some evidence that reorganization and shuffling of units is a never-ending process in search of "efficiency". For example, the geological unit,which was with the Myanma Mineral Development Corporation for a few years, ismoving back to the Directorate of Geological Surveys and Exploration. It nowappears that all geological expertise will be in the latter unit and thatgeology will be split away from the operating units.
27. There has been little action to improve effectiveness. Thus,although shortcomings are perceived, little is done to rectify them. Theindividual who is tempted to introduce change balks at the enormity of theproblem. An example of this is the lack of cost accounting and auditingsystems. Accounting students are taught all the latest approaches, but asyoung and "inexperienced" juniors in an organization, they are virtuallypowerless to effect change.
28. Entrepreneurship, as it relates to business acumen and innovation,is probably largely confined in the mineral sector to those who can produceand sell illegally. Ideally, these entrepreneurs should somehow be in-corporated into the system. In theory this would appear to be possible,since the operations could be termed cooperatives and thus meet socialisticgoals. But practically speaking, the pricing and marketing system is notlikely to be able to adjust sufficiently to divert anything but a smallproportion of such entrepreneurial activities to the official trading chan-nels. Despite the apparent shortcomings within the system as a whole, certainState enterprises are profitable and a sincere attempt is being made to focusincreasingly on profitability. It is likely that great progress could be madeif the Burmese were willing to purchase contract management for projects, as abold step to the rapid acquisition of managerial skills. To some extent theconsulting assistance for the proposed IDA project is a step in this direc-tion. But a very specific situation prevails at this time which is boundto have a bearing on project implementation.
ANNEX 2Page 8
4. Education
29. Higher education is currently affected by student unrest,particularly in Rangoon, which is countered by the authorities by closureof the University. Over the 18 months to March 1976, when it was closedagain, the university had been open for only 3 1/2 months. The onlyadvantage of such events is that it decreases the numbers of graduatespressing on limited job opportunities. For example, there are approximately1,000 students studying geology with about 250 graduating each year. Sincethe State is the sole employer, it clearly is unrealistic to expect thevarious mineral organizations to be able to absorb such numbers.
30. The quality of the graduates apparently leaves much to be desiredand is far below "western" standards. Also, it is difficult for Burmese toreceive permits to go abroad for studies and the UNDP has difficulties ingetting the fellowship positions filled in its programs.
31. A quantum jump has to be taken in upgrading the standard of pro-fessionals in geology, mining, mineral dressing and extractive metallurgy,through exchange lectureships, specialized courses (both in Burma and abroad)and study abroad. It would appear that the most useful strategy would be toattempt to upgrade the graduates of the existing system in the disciplinesalready taught and to send overseas candidates for training in disciplines notyet being taught in Burma. Attempting to reform the present structure ofeducation for the sector should be a long-term objective, but one which islikely to be particularly difficult to effect.
5. Labor
32. Most of the mine labor before the War, both in surface and under-ground operations, was expatriate (Chinese, Malay, Ghurka, Indian, etc.) andreflected the feeling at that time that expatriate workers were far moreproductive than nationals. Although this was probably an unduly biasedattitude, it is still today difficult to attract Burmese labor to miningoperations in some areas. It is particularly difficult to obtain recruits forthe underground operations at Bawdwin. Labor turnover is such that about 600new recruits are required annually (for the whole mine) and the undergroundoperations are continually understaffed. At the Yadanatheingi Mine, allunderground labor reportedly consists of convicts. Surface mining operationsfare better but there is also considerable seasonal movement in and out fromfarming activity and some areas of the country where a sparse populationresults in scarce labor. There is much current discussion on incentive schemes(para. 33) and how to make them sufficiently attractive. At the Bawdwinoperation one of the most attractive features for labor is the adequateavailability of basic foodstuffs at somewhat subsidized prices.
33. The naturally peaceful disposition of the people coupled with acentrally planned economy results in a remarkably tranquil labor force. Tradeunions and strikes are illegal and apparently the mines have not been troubledby any spontaneous labor disturbances. However, continued tranquility
ANNEX 2Page 9
of the industrial labor force in the future is likely to depend much onwage and price levels and the ability of individuals to exercise a choiceto return to agriculture should inflationary trends (currently at least20% per annum) and regulated wage structures (public sector wages have re-mained essentially unchanged in Burma since 1948, with only minor cost ofliving adjustments in 1972 and 1976) erode any advantages of industrialemployment. Steps are being taken under the new commercial guidelines(para. 46-49) to introduce bonus systems linked to performance which shouldoffer scope for workers to improve their income levels.
6. Security and Insurgency
34. The problem of insurgency is one of major importance to the futuredevelopment of the sector and officials are vague in their discussion of thematter. Basically, only about 30% of the country is completely free from anyform of insurgency activity. The rest of the country can be divided intoheavy insurgency activity and sporadic activity. It would appear that in themore intense areas the Government can not guarantee safe conduct or safeoperations.
35. From the point of view of mineral development, it is thereforenecessary to superimpose an "insurgency activity" map over a map of geo-logical potential and potential projects, and to assess the degree of overlap.At this time, it would appear that operations such as Monywa, Heinda, andthe Heinze Basin are areas where safe conduct can be assured with adequatemilitary effort. The Mawchi operation is clearly a problem, and the issue isat what cost the area could be neutralized. Bank staff have not been allowedto visit the area. Also, the Bawdwin operation and vicinity is an example ofa particularly difficult situation clearly bordering on an intensive insurgencyfront, and the issue of insurgency becomes critical to any rehabilitationplans for the mine. It is clear that, should mining activity become a specifictarget of the insurgents, the sector is particularly vulnerable and it wouldrequire a major effort by the Government to assure safe conduct. In someareas, illegal mining and smuggling operations are apparently related toinsurgent activity.
B. STRUCTURE
1. Background
36. Prior to World War II, mineral production was entirely in the handsof the private sector, dominated by British owned companies. During the War,much of the mining plant was severely damaged and neglected. In the post-War period, there was considerable reluctance by the former companies to re-invest in rehabilitation and in new plants in the newly independent Burma.The smaller mines which were still in operation were gradually nationalized.In 1951, the Government took a 50% interest in the Bawdwin mine through
ANNEX 2Page 10
Burma Corporation (1951) Limited, and in 1965 the Burma Corporation was national-ized. The only private legal activity in the mining sector at the present timeis small scale mining, particularly of tin and tungsten and antimony. The"official" part of this production is bought from the "tributors" by No. 2Mining Corporation (tin and tungsten), and No. 3 Mining Corporation (antimony).
2. Major Institutions
37. A small number of government corporations, which are essentiallypart of the Ministry of Mines, are responsible for all official productionof minerals. The producing corporations, with the exception of the Jade andGem Corporation, have until recently been required to supply all of theiroutput to the government-owned Myanma Export Import Corporation (MEIC), a partof the Ministry of Trade, for export sales. There have been various organiza-tional changes in the sector over the years, and since the sub-division of theMineral Development Corporation in 1972 (para. 46) the main sector institutionshave been as follows: The Myanma Bawdwin Corporation (now No. 1 MiningCorporation) responsible for lead, zinc and silver production, with 50%-60% ofnon-petroleum sector output and 40% of employment; the Myanma Tin TungstenCorporation (now No. 2 Mining Corporation), responsible for tin/tungstenproduction with 30%-40% of sector output and 15% of employment; the MyanmaMineral Development Corporation (No. 3 Mining Corporation) responsible forproduction of antimony and coal and the development of copper production; theIndustrial Minerals Corporation (No. 4 Mining Corporation) responsible forproduction of limestone, gypsum, and other non-metallic products; the Gem andJade Corporation, responsible for production and marketing of jade, rubies andother gems and pearls; and two main supporting entities within the Ministry,the Directorate of Geological Survey and Mineral Exploration (DGSE), responsi-ble for exploration and geological studies, and the Department of Planning andWorks Inspection, responsible for mine inspection, safety, planning andstatistics. The Myanma Oil Corporation (MOC) is responsible for oil and gasexploration and production.
38. The Minister of Mines has three advisory committees, made up ofadvisors from other ministries and the directors of the operating Corpora-tions. These committees are Technical, Projects and Executive (largely admin-istrative matters.) The development priorities are set out by the ProjectsCommittee which would appear to be the senior decision making body within theMinistry.

ANNEX 2Page 11
39. The major producing mines at the present time are as follows:
Table 3: Major Producing Mines
MainCorcporation Mines Annual Production Levels
No. 1 Mining Bawdwin 6,000 tons zinc concentrateCorporation 9,000 tons refined lead
500 ounces silverplus four other products
No. 2 Mining Hermyingyi 200 tons tin/tungsten concentrateCorporaton Mawchi 400 tons tin/tungsten concentrate
Kanbauk 300 tons tin/tungsten concentrateHeinda 200 tons tin concentrate
No. 3 Mining Kalewa and 30,000 tons coalCorporation Nama
Gem and Jade Mogok Precious StonesCorporation
3. Mineral Marketing
40. Burma holds a very minor positon in the world production and exportof mineral products even though it exports nearly all of its non-fuel mineraloutput. It currently provides less than 1% of world tin production, about1.5% of world tungsten production, and under 0.2% for zinc, lead and silver.
41. Mineral marketing is a particularly weak aspect of State operationsin the mineral sector. Export marketing has been handled by the MEIC with theexception of gemstones which are put up for auction by Trade Corporation No.19. Under the decentralization policy, commercial enterprises falling underone Ministry will be able to handle their own commercialization if they sodesire. The Mining Ministry has recently set up a new metals marketingorganization in the form of a Minerals Marketing Committee. This Committeewas formed in late 1976 and is managed by representatives from the threemetal producing corporations. In addition, the former sales manager formetals with the MEIC (a well-regarded and competent individual) and theonly person on the Committee who has any long-term experience with foreignbuyers has been made Secretary of the Committee. Beyond this, however, itis not yet clear how broader expertize in marketing will be acquired.
42. Marketing is presently virtually divorced from the productionfunction (although this should change with the above mentioned MarketingCommittee). The role of the marketing agency has been basically to sell whatis produced and apparently the only direct communication between productionand marketing was a seminar held once a year. And so, whether in tin-tungstenor in zinc concentrates, there has been almost no liaison between marketingand production to better adapt the products to market requirements, thereby
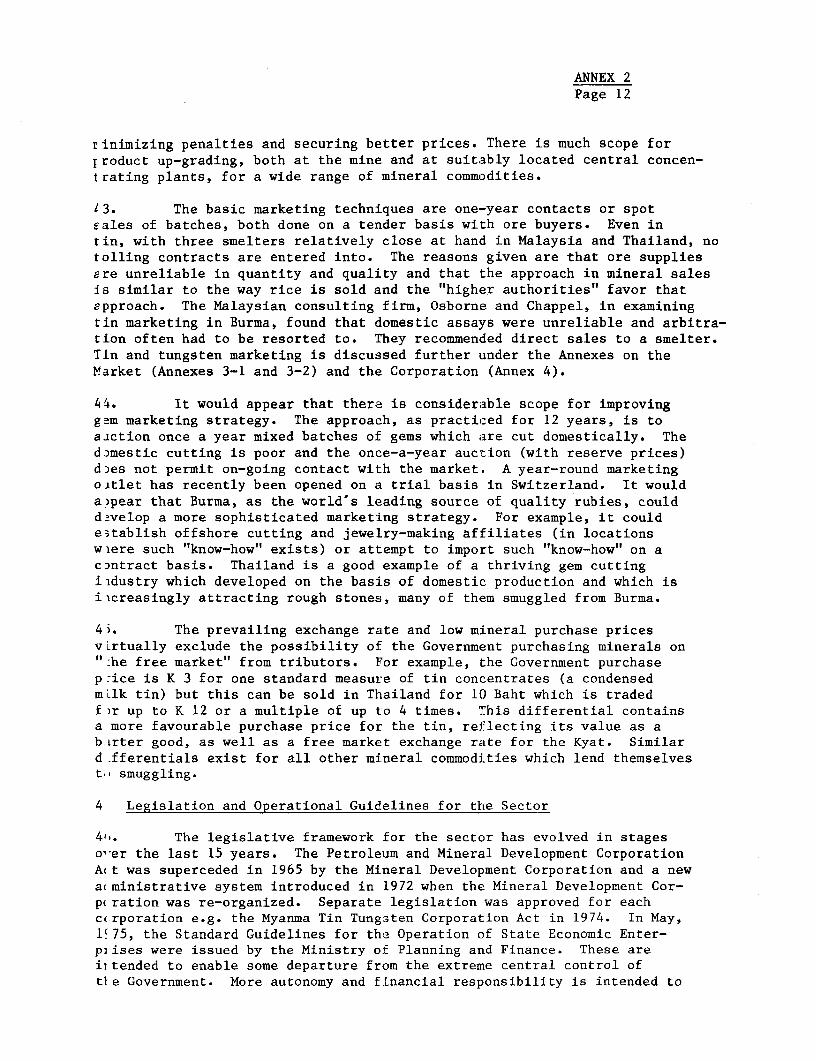
ANNEX 2Page 12
rinimizing penalties and securing better prices. There is much scope forIroduct up-grading, both at the mine and at suitably located central concen-trating plants, for a wide range of mineral commodities.
13. The basic marketing techniques are one-year contacts or spotEales of batches, both done on a tender basis with ore buyers. Even intin, with three smelters relatively close at hand in Malaysia and Thailand, notolling contracts are entered into. The reasons given are that ore suppliesere unreliable in quantity and quality and that the approach in mineral salesis similar to the way rice is sold and the "higher authorities" favor thatapproach. The Malaysian consulting firm, Osborne and Chappel, in examiningtin marketing in Burma, found that domestic assays were unreliable and arbitra-tion often had to be resorted to. They recommended direct sales to a smelter.Tin and tungsten marketing is discussed further under the Annexes on theMarket (Annexes 3-1 and 3-2) and the Corporation (Annex 4).
4X. It would appear that there is considerable scope for improvinggem marketing strategy. The approach, as practiced for 12 years, is toaiction once a year mixed batches of gems which are cut domestically. ThedDmestic cutting is poor and the once-a-year auction (with reserve prices)d3es not permit on-going contact with the market. A year-round marketingoitlet has recently been opened on a trial basis in Switzerland. It woulda)pear that Burma, as the world's leading source of quality rubies, couldd3velop a more sophisticated marketing strategy. For example, it coulde3tablish offshore cutting and jewelry-making affiliates (in locationswiere such "know-how" exists) or attempt to import such "know-how" on ac)ntract basis. Thailand is a good example of a thriving gem cuttingiidustry which developed on the basis of domestic production and which isiicreasingly attracting rough stones, many of them smuggled from Burma.
4i. The prevailing exchange rate and low mineral purchase pricesvLrtually exclude the possibility of the Government purchasing minerals on":he free market" from tributors. For example, the Government purchasep-ice is K 3 for one standard measure of tin concentrates (a condensedmLlk tin) but this can be sold in Thailand for 10 Baht which is tradedf)r up to K 12 or a multiple of up to 4 times. This differential containsa more favourable purchase price for the tin, reflecting its value as abirter good, as well as a free market exchange rate for the Kyat. Similard fferentials exist for all other mineral commodities which lend themselvesti? smuggling.
4 Legislation and Operational Guidelines for the Sector
41,. The legislative framework for the sector has evolved in stageso'-er the last 15 years. The Petroleum and Mineral Development CorporationA(t was superceded in 1965 by the Mineral Development Corporation and a newa(ministrative system introduced in 1972 when the Mineral Development Cor-p ration was re-organized. Separate legislation was approved for eachc(rporation e.g. the Myanma Tin Tung3ten Corporation Act in 1974. In May,1!75, the Standard Guidelines for the Operation cf State Economic Enter-plises were issued by the Ministry of Planning and Finance. These areiTtended to enable some departure from the extreme central control oftle Government. More autonomy and financial responsibility is intended to

ANNEX 2Page 13
rest with the corporations and new fiscal and financial measures (e.g.new taxes, a system of debt financing with accompanying financial charges)are being introduced. Implementation of this new system commenced inApril 1976, and although this represents a fairly significant change inpolicy, the system and the people are so accustomed to close control thatit will likely be some time before much innovative and autonomous behaviorresults. The rank and file manager is extremely reluctant within thesystem to take a major decision, or, for that matter, to commit himselfto writing. Decision making will, in all likelihood, continue to be madeslowly and by senior committee.
47. Interest charges on debt are to be introduced progressively.The producing corporations will be permitted to take over their ownmarketing (para. 41) and will have more freedom to retain their own cashgeneration. There will also supposedly be some recognition of foreign exchangeearners in the allocation of the country's scarce foreign exchange resources.Auditing will still be done exclusively by the Government Audit Office andit is difficult to see how badly needed improvements in the accounting areacan be made sufficiently quickly to enable accounting and auditing staffand systems to cope with the new demands which are inevitable if the newcommerical orientation is to function effectively.
48. Wage policy will still be controlled centrally but under thecommerical re-orientation, bonus systems are being introduced. These areto be related to the financial and production performance of the corporationsand will be structured so that lower paid workers will receive proportionatelyhigher rates of bonuses.
49. The changes are being introduced cautiously and the Government willcertainly remain dominant in the sector. Indeed, if implemented ineffectivelythe new guidelines could act as yet another set of restrictive controls inaddition to the system which already existed.
C. MINERAL POTENTIAL AND EXPLORATION
50. The country is comprised of three physiographic regions. The WesternHills in the West, the Central Belt, and the Shan Plateau in the East with aSouthward continuation of the highland in the Tenasserim Strip. Geologicalfeatures include a great variety of rock types, ages and structures and eachphysiographic region has its characteristic geological features. The mainmetallic mineral deposits of Burma are found in Eastern Burma, in the ShanPlateau area, the Tenasserim Strip, in northern Burma, or near the easternedge of the Western Hills. Within these areas, specific types of depositstend to be grouped in northerly-trending belts (commonly referred to asmetallogenic provinces). The well known Burma tin-tungsten province containsnumerous deposits of cassiterite and wolframite either separately or in com-bination and extends throughout the Tenasserim Strip and northerly to aboutlatitude 21°15'. These deposits comprise both alluvial and lode occurences.Another province, characterized by deposits of lead, zinc and silver, known asthe lead belt, lies immediately north of the tin-tungsten province and extendsnorth-north-easterly for some 300 miles through the Southern and NorthernShan States. Barite deposits occur in the same province. Scattered antimony
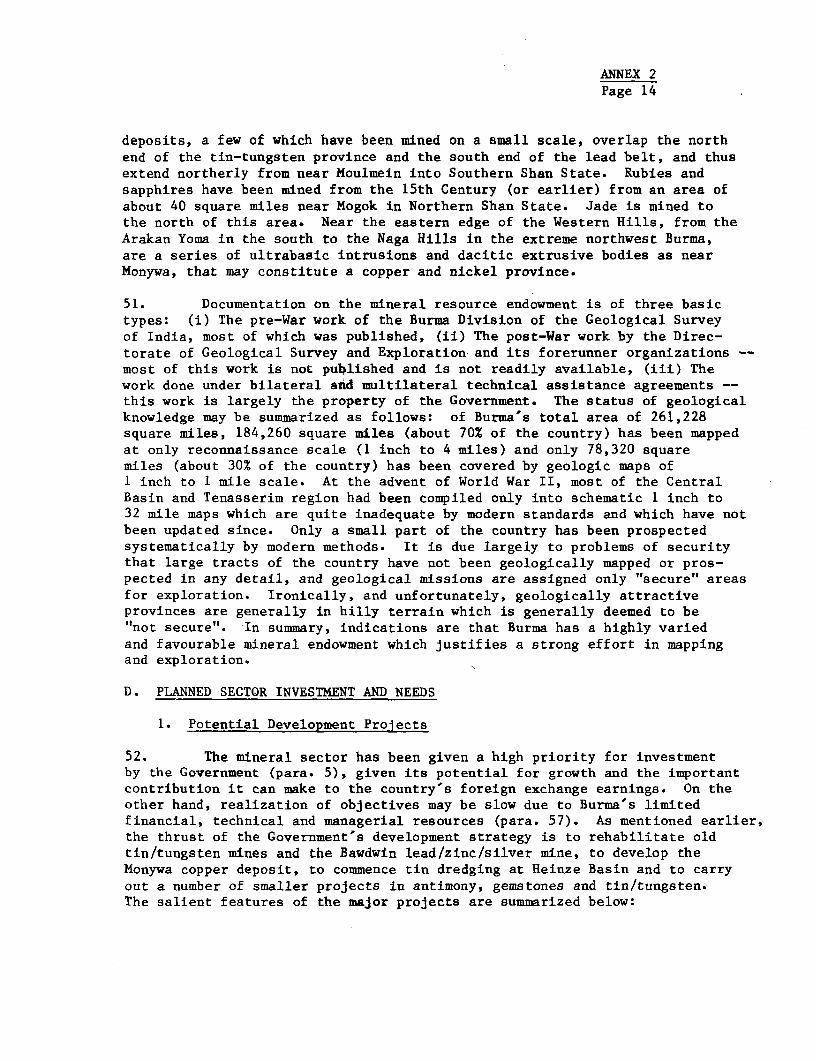
ANNEX 2Page 14
deposits, a few of which have been mined on a small scale, overlap the northend of the tin-tungsten province and the south end of the lead belt, and thusextend northerly from near Moulmein into Southern Shan State. Rubies andsapphires have been mined from the 15th Century (or earlier) from an area ofabout 40 square miles near Mogok in Northern Shan State. Jade is mined tothe north of this area. Near the eastern edge of the Western Hills, from theArakan Yoma in the south to the Naga Hills in the extreme northwest Burma,are a series of ultrabasic intrusions and dacitic extrusive bodies as nearMonywa, that may constitute a copper and nickel province.
51. Documentation on the mineral resource endowment is of three basictypes: (i) The pre-War work of the Burma Division of the Geological Surveyof India, most of which was published, (ii) The post-War work by the Direc-torate of Geological Survey and Exploration and its forerunner organizations --most of this work is not published and is not readily available, (iii) Thework done under bilateral and multilateral technical assistance agreements --this work is largely the property of the Government. The status of geologicalknowledge may be summarized as follows: of Burma's total area of 261,228square miles, 184,260 square miles (about 70% of the country) has been mappedat only reconnaissance scale (1 inch to 4 miles) and only 78,320 squaremiles (about 30% of the country) has been covered by geologic maps of1 inch to 1 mile scale. At the advent of World War II, most of the CentralBasin and Tenasserim region had been compiled only into schematic 1 inch to32 mile maps which are quite inadequate by modern standards and which have notbeen updated since. Only a small part of the country has been prospectedsystematically by modern methods. It is due largely to problems of securitythat large tracts of the country have not been geologically mapped or pros-pected in any detail, and geological missions are assigned only "secure" areasfor exploration. Ironically, and unfortunately, geologically attractiveprovinces are generally in hilly terrain which is generally deemed to be"not secure". In summary, indications are that Burma has a highly variedand favourable mineral endowment which justifies a strong effort in mappingand exploration.
D. PLANNED SECTOR INVESTMENT AND NEEDS
1. Potential Development Projects
52. The mineral sector has been given a high priority for investmentby the Government (para. 5), given its potential for growth and the importantcontribution it can make to the country's foreign exchange earnings. On theother hand, realization of objectives may be slow due to Burma's limitedfinancial, technical and managerial resources (para. 57). As mentioned earlier,the thrust of the Government's development strategy is to rehabilitate oldtin/tungsten mines and the Bawdwin lead/zinc/silver mine, to develop theMonywa copper deposit, to commence tin dredging at Heinze Basin and to carryout a number of smaller projects in antimony, gemstones and tin/tungsten.The salient features of the major projects are summarized below:
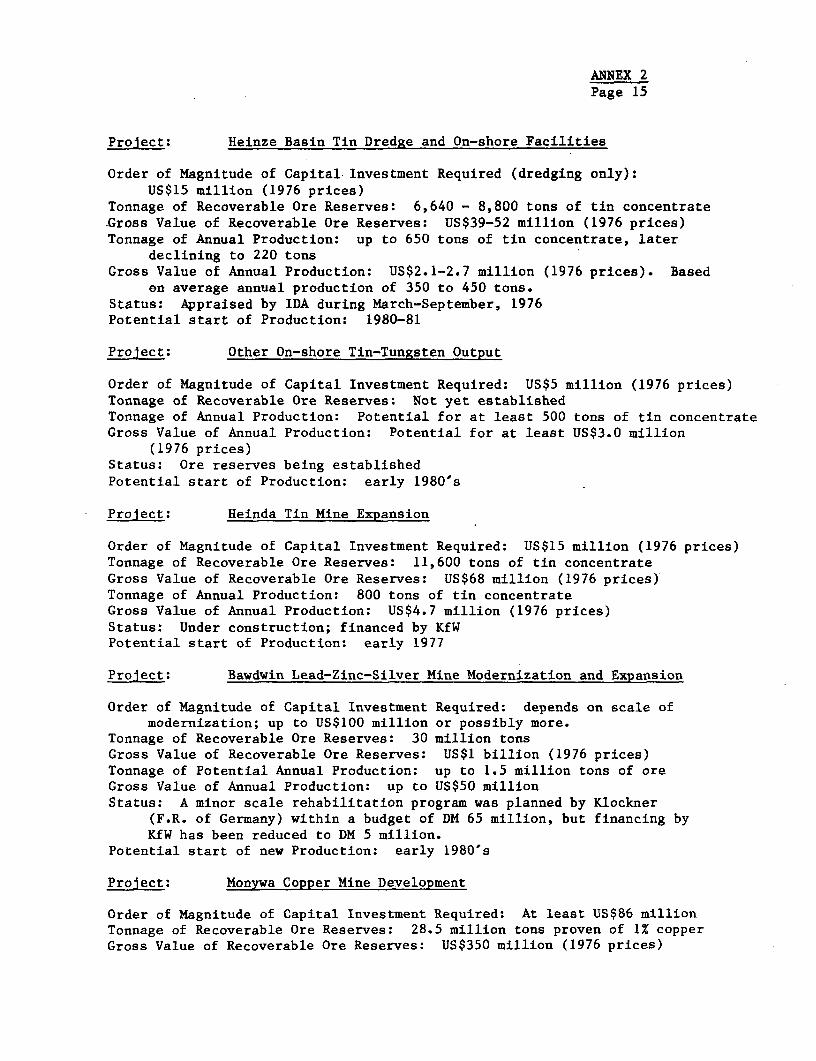
ANNEX 2Page 15
ProJect: Heinze Basin Tin Dredge and On-shore Facilities
Order of Magnitude of Capital Investment Required (dredging only):US$15 million (1976 prices)
Tonnage of Recoverable Ore Reserves: 6,640 - 8,800 tons of tin concentrateGross Value of Recoverable Ore Reserves: US$39-52 million (1976 prices)Tonnage of Annual Production: up to 650 tons of tin concentrate, later
declining to 220 tonsGross Value of Annual Production: US$2.1-2.7 million (1976 prices). Based
en average annual production of 350 to 450 tons.Status: Appraised by IDA during March-September, 1976Potential start of Production: 1980-81
Project: Other On-shore Tin-Tungsten Output
Order of Magnitude of Capital Investment Required: US$5 million (1976 prices)Tonnage of Recoverable Ore Reserves: Not yet establishedTonnage of Annual Production: Potential for at least 500 tons of tin concentrateGross Value of Annual Production: Potential for at least US$3.0 million
(1976 prices)Status: Ore reserves being establishedPotential start of Production: early 1980's
Project: Heinda Tin Mine Expansion
Order of Magnitude of Capital Investment Required: US$15 million (1976 prices)Tonnage of Recoverable Ore Reserves: 11,600 tons of tin concentrateGross Value of Recoverable Ore Reserves: US$68 million (1976 prices)Tonnage of Annual Production: 800 tons of tin concentrateGross Value of Annual Production: US$4.7 million (1976 prices)Status: Under construction; financed by KfWPotential start of Production: early 1977
Project: Bawdwin Lead-Zinc-Silver Mine Modernization and Expansion
Order of Magnitude of Capital Investment Required: depends on scale ofmodernization; up to US$100 million or possibly more.
Tonnage of Recoverable Ore Reserves: 30 million tonsGross Value of Recoverable Ore Reserves: US$1 billion (1976 prices)Tonnage of Potential Annual Production: up to 1.5 million tons of oreGross Value of Annual Production: up to US$50 millionStatus: A minor scale rehabilitation program was planned by Klockner
(F.R. of Germany) within a budget of DM 65 million, but financing byKfW has been reduced to DM 5 million.
Potential start of new Production: early 1980's
ProJect: Monywa Copper Mine Development
Order of Magnitude of Capital Investment Required: At least US$86 millionTonnage of Recoverable Ore Reserves: 28.5 million tons proven of 1% copperGross Value of Recoverable Ore Reserves: US$350 million (1976 prices)

ANNEX 2Page 16
Tonnage of Potential Annual Production: 3 million (minimum)Gross Value of Annual Production: US$36 millionPotential of area: 200 million tons at 0.7% recoverable copper, say, at
US$0.70 per pound = $2 billionStatus: Japanese government completed feasibilty study in late 1976Potential start of new production: early 1980's
Project: Antimony, Gold, Gemstones
Order of Magnitude of Capital Investment Required: US$10-15 millionPotential Gross Value of Annual Production (order of Magnitude)
US$ 5 - 10 millionStatus: Government is in initial planning phasesPotential start of new production: could be operational by 1980
53. The three substantial potential projects, excluding Heinda whichis nearing completion, are Heinze Basin (the IDA project), Bawdwin andMonywa. The Heinze Basin project and its related components are discussedin detail in Annex 5-1.
54. The Monywa Copper project has the potential of being a valuableundertaking and may possibly expand to be a major copper venture. Atthis stage, and basing judgment on the Japanese findings, it appearsdifficult to consider anything but the export of concentrates,i.e., not establishing a smelter. The additional benefits which theproject offers is an industrial undertaking in an underdeveloped regionand the opportunity for upgrading railway track and adding new rollingstock. The project does not appear to present security problems and hasan interested sponsor-the Mitsui Mining Company of Japan.
55. The Bawdwin mining and smelting complex poses a particularlydifficult developmental challenge from the point of view of technicalcomplexity, infrastructural shortcomings, and insurgent activity. Themine and plant rehabilitation plan, as recently developed by Klockner andK.f.W., appeared to be of rather limited scale and only a partial solution,and was recently judged unsuitable for financing by KfW and the Germangovernment.
56. From the point of view of profitability and relative ease ofimplementation, there are a large number of projects which are likely tooffer very interesting returns with a considerable "cushion" for poormanagement. Tin gravel pump mining, modernization of gemstone productionand marketing, and promotion of antimony production are examples of poten-tially highly attractive projects. The problem with these projects, fromthe point of view of Bank action, is that they are all relatively smalland therefore difficult to handle as individual projects. At the same time,they require considerable assistance in preparation and implementation. Astart on improving tin output by gravel pump mining is being made a part ofthe IDA project. The antimony and gemstone projects have had very littlepreparation work done as yet.
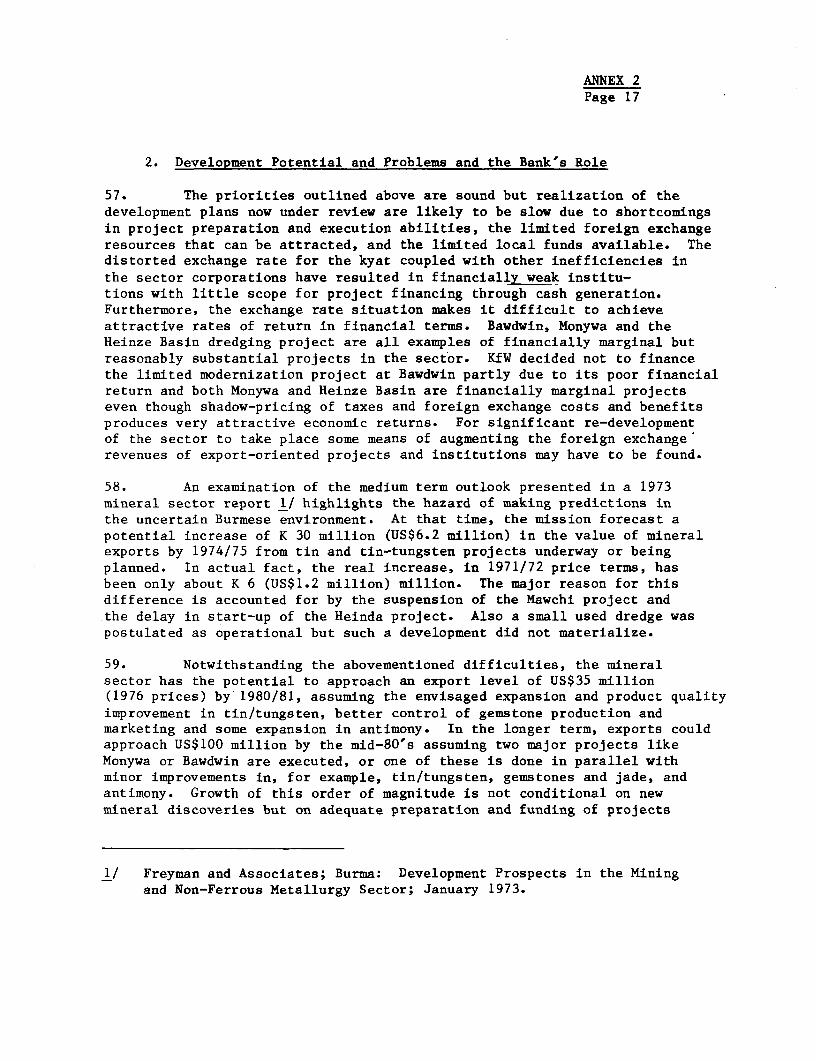
ANNEX 2Page 17
2. Development Potential and Problems and the Bank's Role
57. The priorities outlined above are sound but realization of thedevelopment plans now under review are likely to be slow due to shortcomingsin project preparation and execution abilities, the limited foreign exchangeresources that can be attracted, and the limited local funds available. Thedistorted exchange rate for the kyat coupled with other inefficiencies inthe sector corporations have resulted in financiallyweak institu-tions with little scope for project financing through cash generation.Furthermore, the exchange rate situation makes it difficult to achieveattractive rates of return in financial terms. Bawdwin, Monywa and theHeinze Basin dredging project are all examples of financially marginal butreasonably substantial projects in the sector. KfW decided not to financethe limited modernization project at Bawdwin partly due to its poor financialreturn and both Monywa and Heinze Basin are financially marginal projectseven though shadow-pricing of taxes and foreign exchange costs and benefitsproduces very attractive economic returns. For significant re-developmentof the sector to take place some means of augmenting the foreign exchangerevenues of export-oriented projects and institutions may have to be found.
58. An examination of the medium term outlook presented in a 1973mineral sector report 1/ highlights the hazard of making predictions inthe uncertain Burmese environment. At that time, the mission forecast apotential increase of K 30 million (US$6.2 million) in the value of mineralexports by 1974/75 from tin and tin-tungsten projects underway or beingplanned. In actual fact, the real increase, in 1971/72 price terms, hasbeen only about K 6 (US$1.2 million) million. The major reason for thisdifference is accounted for by the suspension of the Mawchi project andthe delay in start-up of the Heinda project. Also a small used dredge waspostulated as operational but such a development did not materialize.
59. Notwithstanding the abovementioned difficulties, the mineralsector has the potential to approach an export level of US$35 million(1976 prices) by 1980/81, assuming the envisaged expansion and product qualityimprovement in tin/tungsten, better control of gemstone production andmarketing and some expansion in antimony. In the longer term, exports couldapproach US$100 million by the mid-80's assuming two major projects likeMonywa or Bawdwin are executed, or one of these is done in parallel withminor improvements in, for example, tin/tungsten, gemstones and jade, andantimony. Growth of this order of magnitude is not conditional on newmineral discoveries but on adequate preparation and funding of projects
1/ Freyman and Associates; Burma: Development Prospects in the Miningand Non-Ferrous Metallurgy Sector; January 1973.

ANNEX 2Page 18
to develop known mineralization. Achieving such a level by themid-80's would require sector investment of at least US$200 million (1976prices) over the next 5-10 years and project preparation, execution andearly operation would need extensive outside technical assistance. Sectorpotential is substantially greater if illegal exports could be brought intothe official sector and if government policy were to allow more activeforeign participation.
60. A major strategic question for the development of Burmese mineralpotential is the relative emphasis which should be placed on more modestprojects in tin/tungsten, gemstones or antimony versus major capital intensiveundertakings such as Bawdwin or Monywa. The impact of the latter type ofproject in contributing urgently needed foreign exchange would be much greaterbut execution could overtax Burma's limited financial, technical and managerialresources. Furthermore, it may be impossible to execute such large andcomplex projects effectively without a level of outside technical participationwhich might be unacceptable to the Government. The Government intends to pushfor implementation of a number of projects, both large and small, but thenumerous limitations already outlined may force it to be very selective inthose projects chosen for advancement.
61. The Bank's role in sectoral development could be three-fold.First priority should be in financing specific projects such as the proposedtin/tungsten expansion, thereby establishing some record of successful experi-ence in the sector. Secondly, the Bank can, through consultants, helptoidentify and select development priorities from the longer term alternatives.Third the Bank could act as a catalyst for other sources of finance to enablelarger projects to be undertaken.
Industrial Projects DepartmentJanuary, 1977
ANNEX 3-1Page 1
BURMA
APPRAISAL OF TIN/TUNGSTEN EXPANSION PROJECT
THE TIN MARKET
A. INTRODUCTION
1. The value of tin sales represents some US$1.2 billion annually,and therefore plays a comparatively modest role in international trade.However it is one of the few metals where a large proportion of theproduction comes from the developing countries (about 75% of mine andrefinery production). As such, tin has a significant role in the economyof a few developing countries - Bolivia, and Malaysia for example. Anotherdistinct feature of the tin market has been the long history of producerand consumer cooperation.
2. The tin market has been characterized by low growth in consump-
tion, and this is not expected to change in the future. On the other hand,the grade of proven reserves has shown a decline over the past couple ofdecades. In spite of improved mining and concentrating methods, costsof production and therefore prices, have shown a real increase over time.
B. PROPERTIES
3. Tin metal is white in color, has a brilliant lustre, and a highlight reflectivity when polished. It is normally malleable and ductile.Tin metal is soft enough to be cut with a knife. However, above 2000C,it becomes quite brittle. Tin's malleability is utilized in collapsibletubes and foil - one of the few uses where tin is directly consumed.Sheets as thin as 0.0014 to 0.0002 cm. can be rolled. Chemically,the most outstanding property of tin is its ability to resist corrosion byair and many acidic liquids. Because of this property, tin in the formof tinplate, is used as a container for foods and beverages and in collapsibletubes for toothpaste and various other products. Tin-bearing solutions usedin plating are more conductive than other plating solutions. As a result,the tin covering on iron or steel is more continuous, decreasing the possi-bility of corrosion of the coated material. Thinner coats can be appliedwith tin than other substances. Another important property of tin is itsability to impart desirable properties to other metals when used as an alloy.The best example of this is the use of tin to harden copper in bronze - firstused in 3200 B.C. This was one of man's first metallurgical experiments andlaid the foundation for the Bronze Age.
4. Although there are several tin minerals, cassiterite (a tin oxide -SnO ) is by far the most common. Cassiterite has a high specific gravity
(6.A - 7.1), and is quite hard. Because of its hardness and greater resistanceto weathering than other minerals, it is found in placer deposits quite freeof impurities. Initial treatment by gravity separation yields a concentrate

ANNEX 3-1Page 2
which is relatively pure cassiterite - about 77% tin. Smelting and refiningyields relatively pure tin metal. "Grade A" or "Straits" tin has a minimumtin content of 99.95%.
C. USES
5. Tin is generally used in improving the properties and character-istics of other materials. Although tin is essential to an industrialeconomy, society is not overly conscious of the role played by tin. Thetable below shows the major end uses of tin in selected industrializedcountries.
Table 1: End Uses of Tin in Selected Industrialized Countries(Percent)
United UnitedFrance Germany Japan Kingdom States
Tinplate 45 41 41 39 34Solder 20 14 37 7 26Bearing Alloys 5 4 4 n.a. 10Bronze and Brass 5 3 5 12 14Tinning 6 4 2 8 4Chemicals 3 6 n.a. 8 7Other 16 28 11 26 5
Total 100 100 100 100 100
Sources: World Bureau of Metal Statistics (WBMS)International Tin Council (ITC), 1975 Data
6. Some 40% to 45% of world tin consumption is as a coating intinplate. The bulk of tinplate goes into the fabrication of metal containersfor food, beverages, and other commodities. In the USA, tinplate representsless than 35% of tin consumption. Elsewhere in the world this use is somewhatmore than 40% of total consumption. Only primary tin is utilized in tin plate.
7. The use of tin plate has trended downwards, mainly because ofdevelopment of rust-free steel and aluminum in containers, particularlyfor those products with short shelf life such as beer and soft drinks. Thistrend is more pronounced in the USA than elsewhere in the world. Inaddition, thinner tin coats and differential plating have also decreasedthe use of tin.
8. On the other hand, a technique introduced in the manufacture ofaluminum cans known as "drawn and wall-ironed" cans has been applied totin cans. This technique permits the production of two piece seamlesscans. First manufactured in 1971, these cans are in strong competitionwith aluminum cans. Tin cans offer a number of advantages includingcost, strength, magnetic handling, and better consistency in filling.
ANNEX 3-1Page 3
9. Other uses for tinplate include: bottle caps, closures, andkitchen utensils. These uses account for less than 10% of tinplate con-sumption.
10. Solder represents the second most important use of tin, whereit is used in various alloys with antimony, silver, and lead. Solderaccounts for some 25% of tin consumption. Most of the solder is usedin joining electrical and electronic circuits, and joining in plumbing,and heat radiation and air conditioning equipment. A small amount isused in the sealing of tin cans.
11. The outlook for tin in these applications is closely tied to
the future of copper. Heat exchanging equipment in automotiv'e applica-tions is an important use. If the trend develops to smaller automobiles,a decrease in automobile production growth, or substitution of aluminumfor copper in radiators, demand for tin could be affected.
12. In other areas, such as commercial and domestic air conditioning,and electrical and electronic circuits, the outlook seems favorable. Useof epoxy resins for joining, or a trend away from copper heat exchangerscould materialize. However, the prospects for continued use of tin aregood. In electrical and electronic applications, solder seems likely toremain a favored component.
13. Another important use of tin is in bearings. Babbitt alloys arethe most common. These alloys range from 80 to 90% tin, together withantimony and copper. There are also lead base babbitt metals which containI to 10% tin. These bearings enjoy wide use in most automobile and otherengines, farm, construction, and other machinery. Use of plastic, air,low tin, or other bearings could lower demand.
14. Bronze and brass represent some 8% of tin consumption. Bronzes arecopper base alloys which may or may not contain tin. The most important tinalloys are phosphor bronze containing 10 to 12% tin with small amounts ofphosphorus and gun-metal-tin bronze casting alloys. An important use of tinbronzes is in plumbing fixtures. Other uses include bearings, fittings andcastings.
15. The bulk of the tin used in tinning is as a coating on othermetals. Its use as a coating on copper wire to prevent corrosion is themost common example. Many small machinery parts are tin coated.
16. The most promising use of tin is in the chemical field. Althoughdemand is small, the potential for growth is large. Organotin compoundsare used as stabilizers in polyvinyl chlorides (PVC), and fungicides andbiocides. Inorganic tin chemicals are widely used as perfume and soapstabilizers, and as reducing agents in dye manufacture. The most visibleuse of tin chemicals is stanous fluoride in toothpastes.
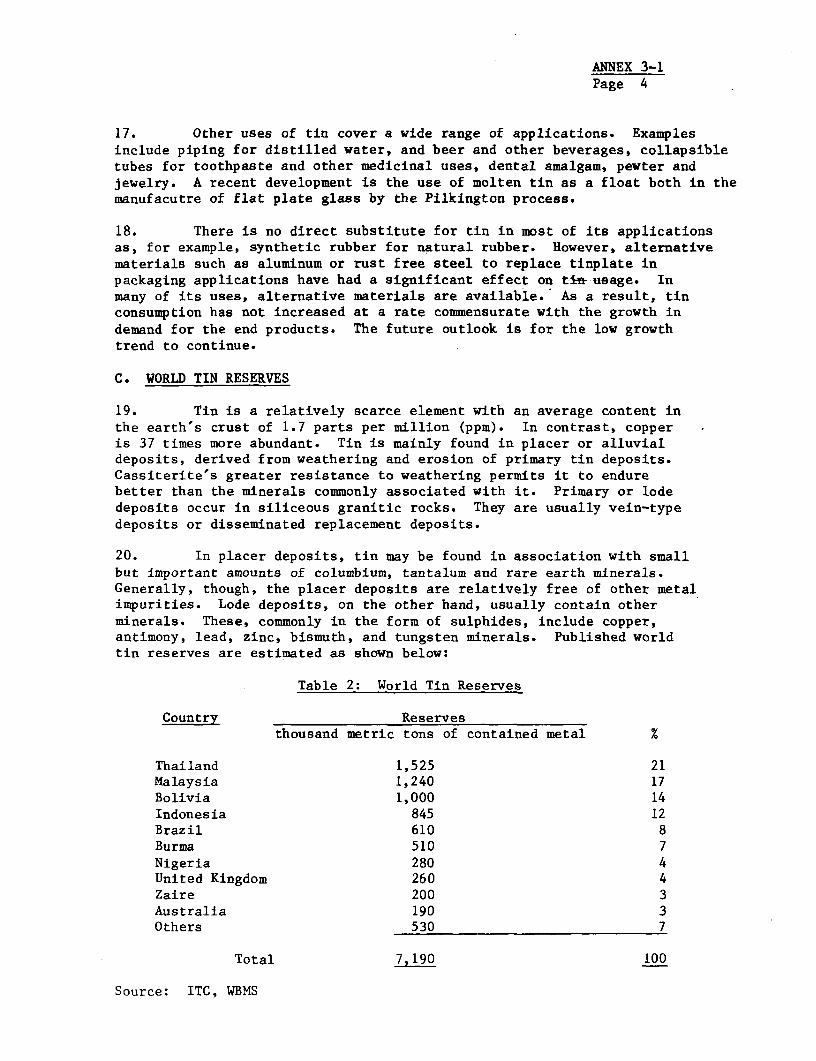
ANNEX 3-1Page 4
17. Other uses of tin cover a wide range of applications. Examplesinclude piping for distilled water, and beer and other beverages, collapsibletubes for toothpaste and other medicinal uses, dental amalgam, pewter andjewelry. A recent development is the use of molten tin as a float both in themanufacutre of flat plate glass by the Pilkington process.
18. There is no direct substitute for tin in most of its applicationsas, for example, synthetic rubber for natural rubber. However, alternativematerials such as aluminum or rust free steel to replace tinplate inpackaging applications have had a significant effect on ti-fl usage. Inmany of its uses, alternative materials are available. As a result, tinconsumption has not increased at a rate commensurate with the growth indemand for the end products. The future outlook is for the low growthtrend to continue.
C. WORLD TIN RESERVES
19. Tin is a relatively scarce element with an average content inthe earth's crust of 1.7 parts per million (ppm). In contrast, copperis 37 times more abundant. Tin is mainly found in placer or alluvialdeposits, derived from weathering and erosion of primary tin deposits.Cassiterite's greater resistance to weathering permits it to endurebetter than the minerals commonly associated with it. Primary or lodedeposits occur in siliceous granitic rocks. They are usually vein-typedeposits or disseminated replacement deposits.
20. In placer deposits, tin may be found in association with smallbut important amounts of columbium, tantalum and rare earth minerals.Generally, though, the placer deposits are relatively free of other metalimpurities. Lode deposits, on the other hand, usually contain otherminerals. These, commonly in the form of sulphides, include copper,antimony, lead, zinc, bismuth, and tungsten minerals. Published worldtin reserves are estimated as shown below:
Table 2: World Tin Reserves
Country Reservesthousand metric tons of contained metal %
Thailand 1,525 21Malaysia 1,240 17Bolivia 1,000 14Indonesia 845 12Brazil 610 8Burma 510 7Nigeria 280 4United Kingdom 260 4Zaire 200 3Australia 190 3Others 530 7
Total 7,190 100
Source: ITC, WBMS
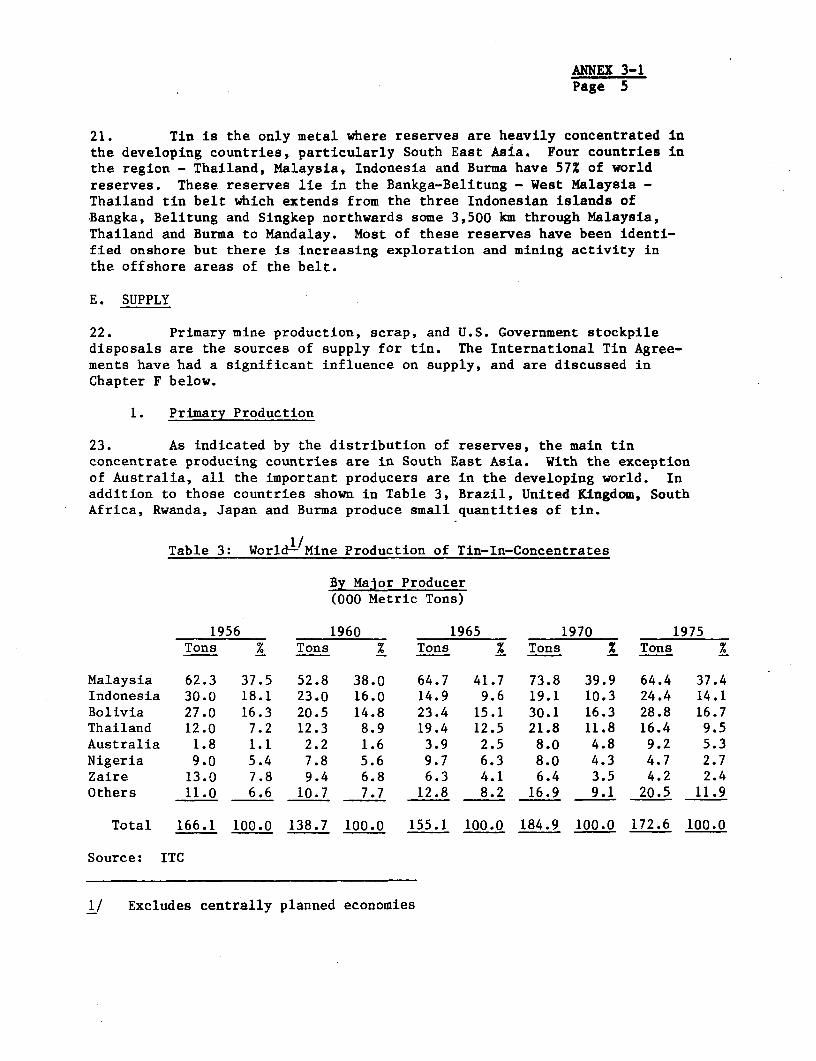
ANNEX 3-1Page 5
21. Tin is the only metal where reserves are heavily concentrated inthe developing countries, particularly South East Asia. Four countries inthe region - Thailand, Malaysia, Indonesia and Burma have 57Z of worldreserves. These reserves lie in the Bankga-Belitung - West Malaysia -Thailand tin belt which extends from the three Indonesian islands ofBangka, Belitung and Singkep northwards some 3,500 km through Malaysia,Thailand and Burma to Mandalay. Most of these reserves have been identi-fied onshore but there is increasing exploration and mining activity inthe offshore areas of the belt.
E. SUPPLY
22. Primary mine production, scrap, and U.S. Government stockpiledisposals are the sources of supply for tin. The International Tin Agree-ments have had a significant influence on supply, and are discussed inChapter F below.
1. Primary Production
23. As indicated by the distribution of reserves, the main tinconcentrate producing countries are in South East Asia. With the exceptionof Australia, all the important producers are in the developing world. Inaddition to those countries shown in Table 3, Brazil, United Kingdom, SouthAfrica, Rwanda, Japan and Burma produce small quantities of tin.
Table 3: World-/Mine Production of Tin-In-Concentrates
By Major Producer(000 Metric Tons)
1956 1960 1965 1970 1975Tons % Tons % Tons % Tons Z Tons %
Malaysia 62.3 37.5 52.8 38.0 64.7 41.7 73.8 39.9 64.4 37.4Indonesia 30.0 18.1 23.0 16.0 14.9 9.6 19.1 10.3 24.4 14.1Bolivia 27.0 16.3 20.5 14.8 23.4 15.1 30.1 16.3 28.8 16.7Thailand 12.0 7.2 12.3 8.9 19.4 12.5 21.8 11.8 16.4 9.5Australia 1.8 1.1 2.2 1.6 3.9 2.5 8.0 4.8 9.2 5.3Nigeria 9.0 5.4 7.8 5.6 9.7 6.3 8.0 4.3 4.7 2.7Zaire 13.0 7.8 9.4 6.8 6.3 4.1 6.4 3.5 4.2 2.4Others 11.0 6.6 10.7 7.7 12.8 8.2 16.9 9.1 20.5 11.9
Total 166.1 100.0 138.7 100.0 155.1 100.0 184.9 100.0 172.6 100.0
Source: ITC
1/ Excludes centrally planned economies
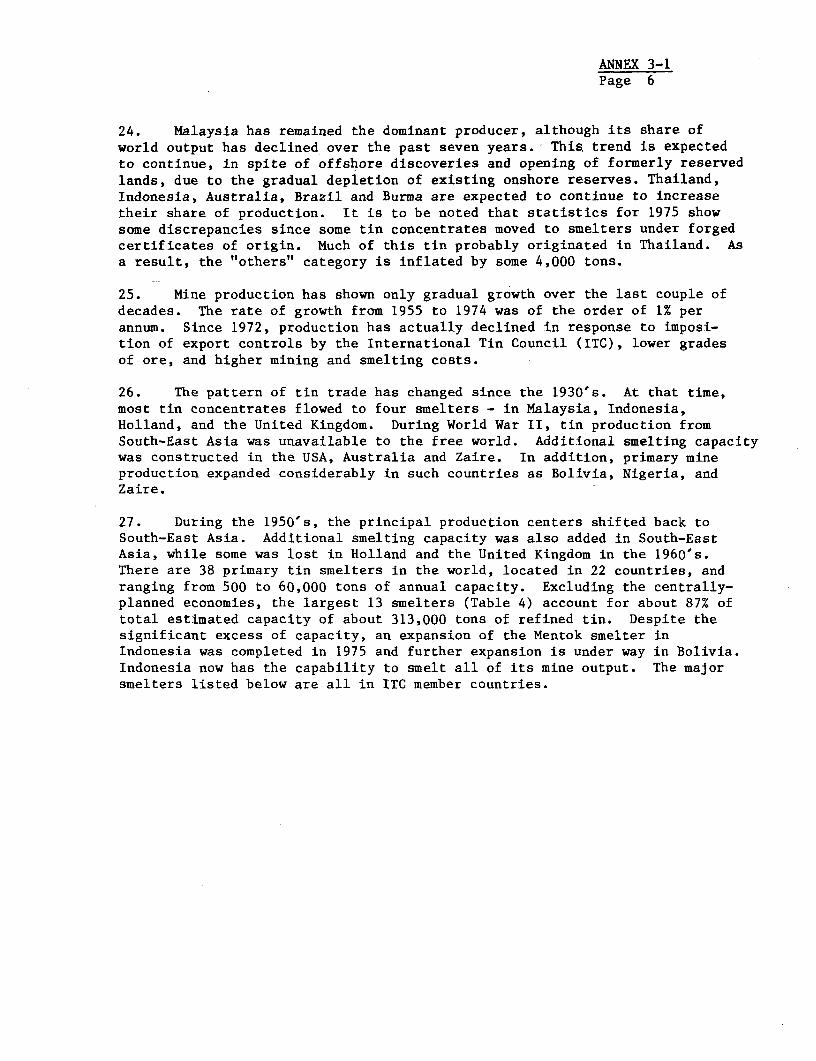
ANNEX 3-1Page 6
24. Malaysia has remained the dominant producer, although its share ofworld output has declined over the past seven years. This trend is expectedto continue, in spite of offshore discoveries and opening of formerly reservedlands, due to the gradual depletion of existing onshore reserves. Thailand,Indonesia, Australia, Brazil and Burma are expected to continue to increasetheir share of production. It is to be noted that statistics for 1975 showsome discrepancies since some tin concentrates moved to smelters under forgedcertificates of origin. Much of this tin probably originated in Thailand. Asa result, the "others" category is inflated by some 4,000 tons.
25. Mine production has shown only gradual growth over the last couple ofdecades. The rate of growth from 1955 to 1974 was of the order of 1% perannum. Since 1972, production has actually declined in response to imposi-tion of export controls by the International Tin Council (ITC), lower gradesof ore, and higher mining and smelting costs.
26. The pattern of tin trade has changed since the 1930's. At that time,most tin concentrates flowed to four smelters - in Malaysia, Indonesia,Holland, and the United Kingdom. During World War II, tin production fromSouth-East Asia was unavailable to the free world. Additional smelting capacitywas constructed in the USA, Australia and Zaire. In addition, primary mineproduction expanded considerably in such countries as Bolivia, Nigeria, andZaire.
27. During the 1950's, the principal production centers shifted back toSouth-East Asia. Additional smelting capacity was also added in South-EastAsia, while some was lost in Holland and the United Kingdom in the 1960's.There are 38 primary tin smelters in the world, located in 22 countries, andranging from 500 to 60,000 tons of annual capacity. Excluding the centrally-planned economies, the largest 13 smelters (Table 4) account for about 87% oftotal estimated capacity of about 313,000 tons of refined tin. Despite thesignificant excess of capacity, an expansion of the Mentok smelter inIndonesia was completed in 1975 and further expansion is under way in Bolivia.Indonesia now has the capability to smelt all of its mine output. The majorsmelters listed below are all in ITC member countries.
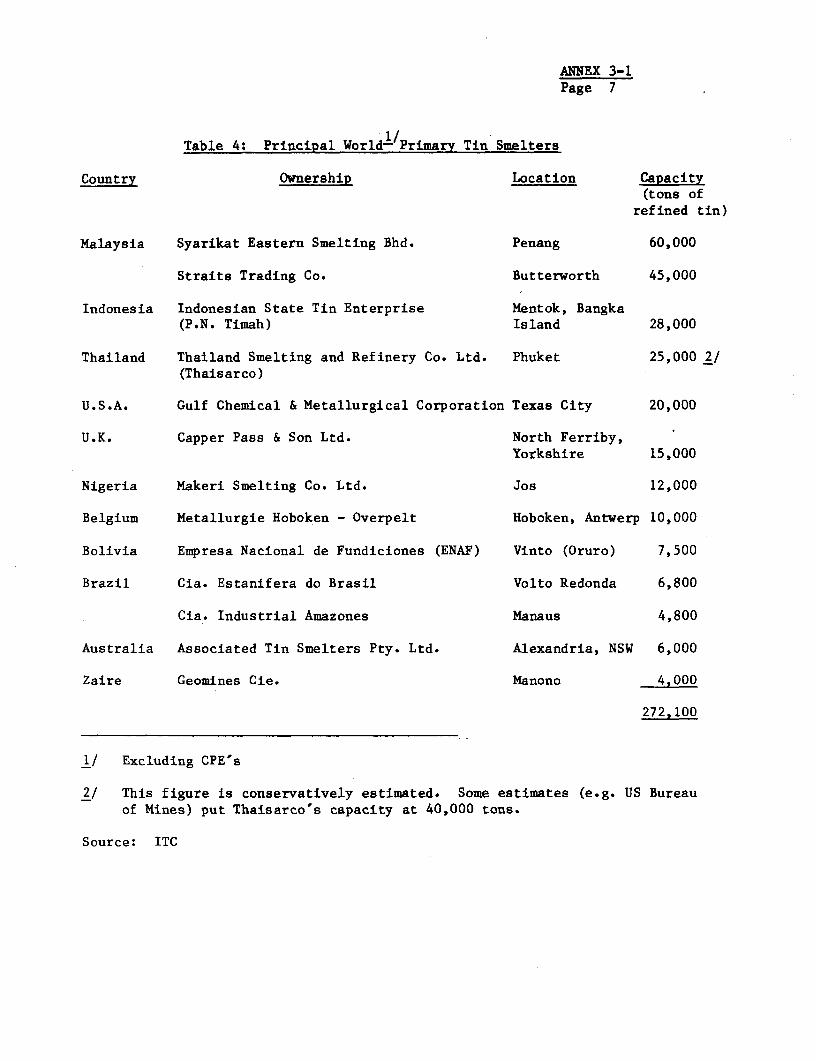
ANNEX 3-1Page 7
Table 4: Principal World-/Primary Tin Smelters
Country Ownership Location Capacity(tons of
refined tin)
Malaysia Syarikat Eastern Smelting Bhd. Penang 60,000
Straits Trading Co. Butterworth 45,000
Indonesia Indonesian State Tin Enterprise Mentok, Bangka(P.N. Timah) Island 28,000
Thailand Thailand Smelting and Refinery Co. Ltd. Phuket 25,000 2/(Thaisarco)
U.S.A. Gulf Chemical & Metallurgical Corporation Texas City 20,000
U.K. Capper Pass & Son Ltd. North Ferriby,Yorkshire 15,000
Nigeria Makeri Smelting Co. Ltd. Jos 12,000
Belgium Metallurgie Hoboken - Overpelt Hoboken, Antwerp 10,000
Bolivia Empresa Nacional de Fundiciones (ENAF) Vinto (Oruro) 7,500
Brazil Cia. Estanifera do Brasil Volto Redonda 6,800
Cia. Industrial Amazones Manaus 4,800
Australia Associated Tin Smelters Pty. Ltd. Alexandria, NSW 6,000
Zaire Geomines Cie. Manono 4,000
272,100
1/ Excluding CPE's
2/ This figure is conservatively estimated. Some estimates (e.g. US Bureauof Mines) put Thaisarco's capacity at 40,000 tons.
Source: ITC
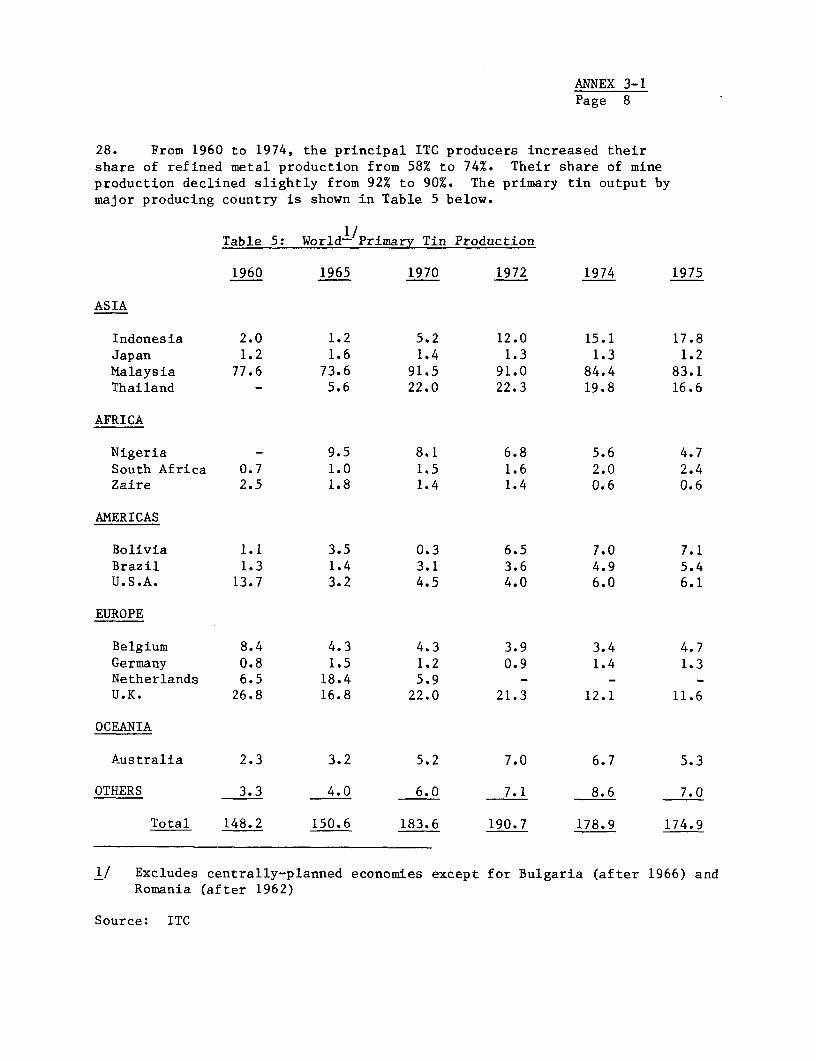
ANNEX 3-1Page 8
28. From 1960 to 1974, the principal ITC producers increased theirshare of refined metal production from 58% to 74%. Their share of mineproduction declined slightly from 92% to 90%. The primary tin output bymajor producing country is shown in Table 5 below.
Table 5: World-/Primary Tin Production
1960 1965 1970 1972 1974 1975
ASIA
Indonesia 2.0 1.2 5.2 12.0 15.1 17.8Japan 1.2 1.6 1.4 1.3 1.3 1.2Malaysia 77.6 73.6 91.5 91.0 84.4 83.1Thailand - 5.6 22.0 22.3 19.8 16.6
AFRICA
Nigeria - 9.5 8.1 6.8 5.6 4.7South Africa 0.7 1.0 1.5 1.6 2.0 2.4Zaire 2.5 1.8 1.4 1.4 0.6 0.6
AMERICAS
Bolivia 1.1 3.5 0.3 6.5 7.0 7.1Brazil 1.3 1.4 3.1 3.6 4.9 5.4U.S.A. 13.7 3.2 4.5 4.0 6.0 6.1
EUROPE
Belgium 8.4 4.3 4.3 3.9 3.4 4.7Germany 0.8 1.5 1.2 0.9 1.4 1.3Netherlands 6.5 18.4 5.9 - - -U.K. 26.8 16.8 22.0 21.3 12.1 11.6
OCEANIA
Australia 2.3 3.2 5.2 7.0 6.7 5.3
OTHERS 3.3 4.0 6.0 7.1 8.6 7.0
Total 148.2 150.6 183.6 190.7 178.9 174.9
1/ Excludes centrally-planned economies except for Bulgaria (after 1966) andRomania (after 1962)
Source: ITC
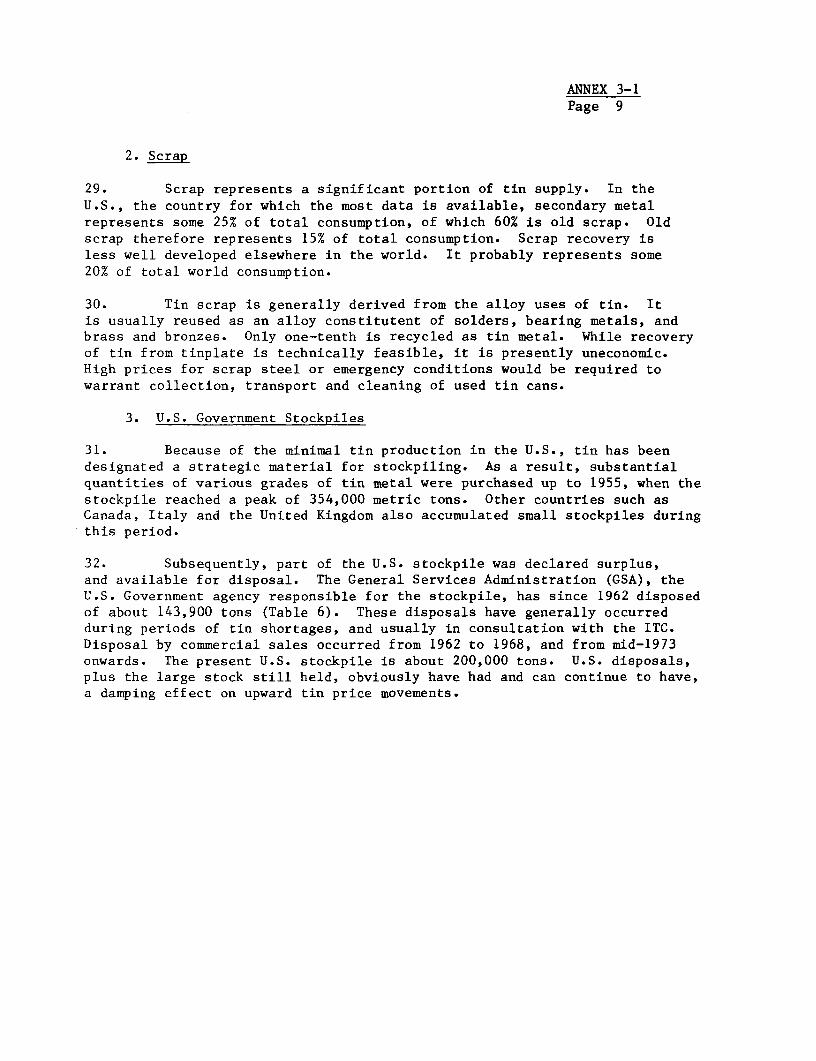
ANNEX 3-1Page 9
2. Scrap
29. Scrap represents a significant portion of tin supply. In theU.S., the country for which the most data is available, secondary metalrepresents some 25% of total consumption, of which 60% is old scrap. Oldscrap therefore represents 15% of total consumption. Scrap recovery isless well developed elsewhere in the world. It probably represents some20% of total world consumption.
30. Tin scrap is generally derived from the alloy uses of tin. Itis usually reused as an alloy constitutent of solders, bearing metals, andbrass and bronzes. Only one-tenth is recycled as tin metal. While recoveryof tin from tinplate is technically feasible, it is presently uneconomic.High prices for scrap steel or emergency conditions would be required towarrant collection, transport and cleaning of used tin cans.
3. U.S. Government Stockpiles
31. Because of the minimal tin production in the U.S., tin has beendesignated a strategic material for stockpiling. As a result, substantialquantities of various grades of tin metal were purchased up to 1955, when thestockpile reached a peak of 354,000 metric tons. Other countries such asCanada, Italy and the United Kingdom also accumulated small stockpiles duringthis period.
32. Subsequently, part of the U.S. stockpile was declared surplus,and available for disposal. The General Services Administration (GSA), theU.S. Government agency responsible for the stockpile, has since 1962 disposedof about 143,900 tons (Table 6). These disposals have generally occurredduring periods of tin shortages, and usually in consultation with the ITC.Disposal by commercial sales occurred from 1962 to 1968, and from mid-1973onwards. The present U.S. stockpile is about 200,000 tons. U.S. disposals,plus the large stock still held, obviously have had and can continue to have,a damping effect on upward tin price movements.

ANNEX 3-1Page 10
Table 6: Disposals from U.S. Government Tin Stockpile(metric tons)
% of Annual WorldYear Amount Mine Production
1962 1,422 1.01963 10,797 7.51964 31,647 22.11965 22,081 14.71966 16,537 10.51967 6,245 3.51968 3,551 1.91969 2,081 1.11970 3,087 1.71971 1,764 0.91972 367 0.21973 20,269 11.01974 23,508 13.11975 584 0.3
Total 143,940
F. INTERNATIONAL TIN AGREEMENTS
33. Tin is unique, not only amongst metals but equally amongst allcommodities in that the market is regulated by an international body ofproducers and consumers which operates a system designed to limit the highestand lowest prices reached on the market. Whilst commentators disagree on theextent to which the International Tin Agreement is successful, it is probablethat the fall in prices for copper, lead, and zinc which accompanied the recentworld economic decline were lessened, in the case of tin, by buffer stockmanipulation. The results have been more marked than other, less cohesive,producer price support actions and the Fifth InternaLiunal riin Agreement seeksto improve the effectiveness of the Tin Council's monitoring activities.
34. The Fifth International Tin Agreement, which came into force on July 1,1976 and is in the process of being ratified by its member governments,is the latest such market arrangement governing tin, with the history ofproducer/consumer agreements and producer restraints and agreements going backto 1930, following a drastic slide in the tin price in the late 1920's. Aseries of voluntary production restraints and producer agreements involvingthe major producer nations evolved during the 1930's. In the mid-thirties,the first buffer stock was set up, and in the late thirties, consumer partici-pation commenced on the International Tin Committee. During and after WorldWar II, there were no real controls operating, and the First Post-War TinAgreement came into effect in 1956.
ANNEX 3-1Page 11
35. The objectives of the 1956 Agreement were:
i) to prevent or alleviate unemployment, and other seriousdifficulties resulting from imbalances between supply anddemand;
ii) to prevent excessive price fluctuations, and to strivefor stability which would yield long-term supply/demandequilibrium;
iii) to ensure adequate supplies at reasonable prices;
iv) to promote economic tin production and prevent uneconomicuse of tin resources.
36. The provisions of the 1956 Agreement were:
i) creation of an International Tin Council composed ofconsuming and producing countries, both with equal votes;
ii) development of an export control system among the producingcountries, with duration of controls and quantities ofexports to be decided by the Council;
iii) creation of a buffer stock to stabilize prices by buyingand selling tin within price ranges established by theCouncil;
iv) initiation of concerted action in the event of a tinshortage.
The First Tin Agreement contained many of the features tried in the earliertin agreements, but also removed some of the weaknesses of these agreements.A buffer stock and export quotas were integral parts of the Agreement. Sub-sequent agreements were negotiated and ratified covering the periods1961 - 1966, 1966 - 1971, 1971 - 1976. While certain refinements were
incorporated into these agreements, the basic provisions and objectiveshave remained unchanged. An example of the refinements was the givingof authority to the buffer stock manager.
37. With the Fifth Tin Agreement, covering the period 1976 - 1981,the United States has joined for the first time. Under the Fourth Interna-tional Tin Agreement (1971 - 1976) the Tin Council member-governments were asfollows:

ANNEX 3-1Page 12
Producing Countries: Australia Malaysia ZaireBolivia NigeriaIndonesia Thailand
Consuming Countries: Austria Fed. Rep. Germany PolandBelgium/Luxembourg Hungary Romania
Bulgaria India SpainCanada Rep. Ireland TurkeyCzechoslovakia Italy United KingdomDenmark Japan U.S.S.R.France Rep. of Korea Yugoslavia
Neterlands
Both groups have 1,000 votes on the Council distributed in proportion to themember country's volume of production or consumption respectively.
38. By using its buffer stock, which is contributed on a compulsorybasis by producers, and on a voluntary basis by consumers, and, with the coopera-tion of the producing countries' governments controlling exports, the worldtin price can be influenced in relation to the floor and ceiling prices set bythe Council. The Tin Council does not aim to control the market but rather toreduce the amplitude of potentially violent price fluctuations.
39. The ceiling price agreed in May, 1976 was M$1,200 per picul and thefloor price M$1,000 per picul. Buffer stock operating rules oblige the BufferStock Manager, who is elected by the Council, to always sell tin when themarket price reaches the ceiling and always buy when it reaches the floor.Within these price limits are three price sectors: Between M$1,200 and 1,135the Manager may buy or sell but must always remain a net seller, betweenM$1,065 and 1,135 may take no action, and between M$1,065 and 1,000 hemay buy or sell but must always remain a net buyer.
40. Assessment of the success of the Tin Agreements depends on thecriteria used in the evaluation. In terms of the stated objectives ofthe Agreement, it cannot be regarded as a total success. To the extentthat export controls are imposed on the producing countries, their foreignexchange earnings are reduced at least for a time, since earnings are afunction of both price and volume. Unemployment also tends to be created.On the other hand, while absolute price stability has not been achieved,price fluctuations are probably less than for many other metals. Figure 1 onpage 16a shows past LME price movements in relation to the Penang floor andceiling prices used to quide the buffer stock operations.
41. Some countries have, no doubt, benefited more than others. High-cost producers, such as Bolivia, have enjoyed greater stability than theyotherwise might have had. Since the ITC has generally succeeded in protectingthe floor price, more producers have been able to stay in operation. Drops inprices would have had a greater effect on high-cost producers and would also have
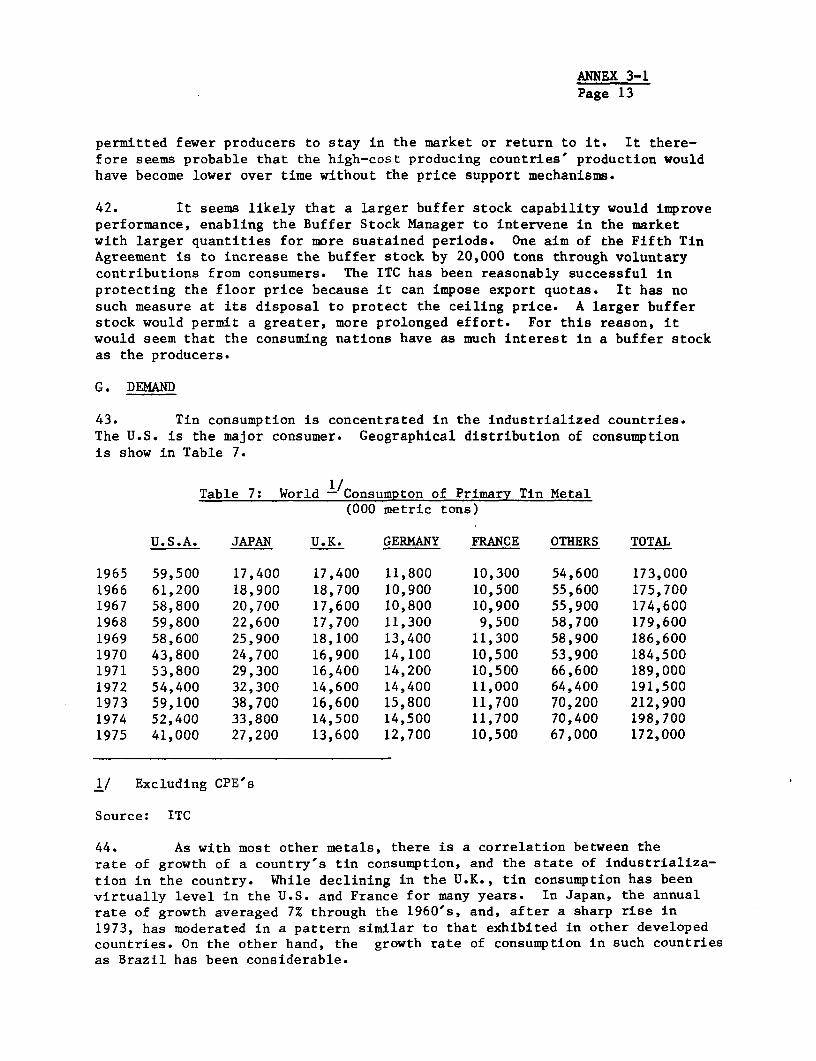
ANNEX 3-1Page 13
permitted fewer producers to stay in the market or return to it. It there-fore seems probable that the high-cost producing countries' production wouldhave become lower over time without the price support mechanisms.
42. It seems likely that a larger buffer stock capability would improveperformance, enabling the Buffer Stock Manager to intervene in the marketwith larger quantities for more sustained periods. One aim of the Fifth TinAgreement is to increase the buffer stock by 20,000 tons through voluntarycontributions from consumers. The ITC has been reasonably successful inprotecting the floor price because it can impose export quotas. It has nosuch measure at its disposal to protect the ceiling price. A larger bufferstock would permit a greater, more prolonged effort. For this reason, itwould seem that the consuming nations have as much interest in a buffer stockas the producers.
G. DEMAND
43. Tin consumption is concentrated in the industrialized countries.The U.S. is the major consumer. Geographical distribution of consumptionis show in Table 7.
Table 7: World -/Consumpton of Primary Tin Metal(000 metric tons)
U.S.A. JAPAN U.K. GERMANY FRANCE OTHERS TOTAL
1965 59,500 17,400 17,400 11,800 10,300 54,600 173,0001966 61,200 18,900 18,700 10,900 10,500 55,600 175,7001967 58,800 20,700 17,600 10,800 10,900 55,900 174,6001968 59,800 22,600 17,700 11,300 9,500 58,700 179,600
1969 58,600 25,900 18,100 13,400 11,300 58,900 186,6001970 43,800 24,700 16,900 14,100 10,500 53,900 184,5001971 53,800 29,300 16,400 14,200 10,500 66,600 189,0001972 54,400 32,300 14,600 14,400 11,000 64,400 191,5001973 59,100 38,700 16,600 15,800 11,700 70,200 212,9001974 52,400 33,800 14,500 14,500 11,700 70,400 198,7001975 41,000 27,200 13,600 12,700 10,500 67,000 172,000
1/ Excluding CPE's
Source: ITC
44. As with most other metals, there is a correlation between therate of growth of a country's tin consumption, and the state of industrializa-tion in the country. While declining in the U.K., tin consumption has beenvirtually level in the U.S. and France for many years. In Japan, the annualrate of growth averaged 7% through the 1960's, and, after a sharp rise in1973, has moderated in a pattern similar to that exhibited in other developedcountries. On the other hand, the growth rate of consumption in such countriesas Brazil has been considerable.
ANNEX 3-1Page 14
45. Unlike most metals, the overall rate of growth in tin consumptionhas been low, of the order of 1.3% over the past twenty years. As an indus-trial metal, and as noted above, tin is seldom used in its pure state but isusually combined in various proportions with other metals. The low growth hastherefore come partly because of substitution in products where tin is aconstituent, and partly because of more efficient use of tin. This trend isexpected to continue.
H. TIN PRICES
1. The Tin Market
46. Tin is traded on the Penang Market, the London Metal Exchange (LME),and the New York Commodity Exchange (COMEX). Although the LME has been regardedas the world market, the Penang Market has gained in importance in recent years.One of the reasons is that Penang is strictly a physical market. The pricein Penang (quoted in Malaysian Dollars per picul) is determined daily by balanc-ing the quantities of tin concentrates offered to the smelters against the bidsreceived for purchases of tin metal. Deliveries of purchased tin are made afterthe concentrates have been smelted, usually within forty-five days of the sale.The price therefore, is based on actual physical supply and demand.
47. On the other hand, LME sales may be for immediate or future delivery.As a result, many transactions are for the purpose of hedging. While hedgingplays a useful role in permitting consumers to protect their positions inpurchases of a commodity, speculation also results. The LME does play auseful role in commodities trading since it reflects expectations for theparticular commodities and the world economic situation in general. However,price fluctuations can be exaggerated.
48. Some of the international trade is at Penang prices, and some atthe LME price (Pounds Sterling per metric ton). The LME price is usuallyslightly higher than the Penang price, reflecting transportation costs,although the difference fluctuates according to a number of factors,including exchange rate variations, with the annual average differentialranging from US$0.02 to US$0.16 per pound in recent years. LME pricequoations are for Standard Tin (99.75% tin), although High-grade tin(99.85% tin) is also traded.
2. Historical International Supply/Demand and Price Movements
49. The latter part of the 1950's was characterized by the end of theU.S. purchasing program for stockpiling purposes and by the existence ofthe First International Tin Agreement under which severe export controls wereenforced for a relatively long period (15th December, 1957 to 30th September,1960). As a result of export controls, which imposed an initial exportcutback of some 45%, world production dropped by about one-third, to some120,000 tons in 1958 from about 175,000 tons in 1953 (the highest level forthe decade). Also, during the late 1950's, and despite the slump in the demandfor tin, the USSR sold substantial tonnages of tin in the Western market.This had a depressive effect on the tin price.
ANNEX 3-1Page 15
50. Although 1960 was still a year of export control (January to Sep-tember inclusive) tin production improved slightly from the low of 1958 dueto the more cooperative attitude of the USSR whose supplies of tin to themarket were curtailed dramatically. It took, however, more than a year forproduction to regain the lost ground while the demand for tin was runningahead of production. At the time, a great proportion of the deficit ofproduction was met by the substantial sales of tin metal from the U.S.strategic stockpile and, to a lesser extent, by sales from the ITC bufferstock and from the strategic stockpiles of Canada, Italy and the UnitedKingdom.
51. Tin production recovered in the second half of the 1960's.The exceptionally high tin price which ruled during 1964 and 1965 stemmedlargely from the Malaysia-Indonesia confrontation and stimulated invest-ments in the tin industry. As a result, a comparatively higher productiongrowth was experienced in the years 1967 and 1968 when mine output of tin-in-concentrates rose from 174,200 tons to 184,100 tons (+ 5.7%). Duringthe late 1960's, however, the demand for tin was unable to maintain thesame rate of expansion as tin supplies, and a change occurred from aproduction deficit to a position of surplus. This had a depressive effecton prices and the ITC decided to enforce a mild form of export control forfive successive periods from September 1968 to the end of December 1969,(initial cutback about 4%) which, together with purchases on buffer stockaccount again strengthened the tin price.
52. Export controls caused world production of tin-in-concentratesto fall slightly in 1969 but it recovered in 1970 and 1971 to marginallyhigher levels. In 1972 world output of tin-in-concentrates rose to 194,100tons, which was the highest level for over a quarter of a century and showedan increase of 4.1% on the previous year. Again, this had a depressiveeffect on the price of tin and in 1973 the Council had to reintroduce exportcontrol (although in a less severe form than on previous occasions), fromJanuary to September, with a consequent drop in mine production to approxi-mately the same level of two years earlier. The last quarter of 1973 wasfree from export control and saw a series of events which later provedto have far-reaching effects on the tin industry and particularly on tintrading.
53. The Arab-Israeli war in October 1973 ended with the oil crisiswhich caused steep rises in the prices of all raw materials includingtin. In the same period, the liquidation of the Williams, Harvey smelterin the United Kingdom had serious implications for the flow of tin; tradechannels between Bolivia and Europe were affected and the search for newoutlets for the Bolivian concentrates disrupted the regular flow of tinmetal into the market during a period in which the demand for tin was risingat an unprecedented rate. Another important feature of this eventful periodwas the resumption of major GSA commercial sales in June 1973.
54. In 1973 consumption of primary tin metal reached a record level ofsome 213,000 tons (21,400 tons, or 11% higher than consumption in 1972). Thiswas met by heavy sales from the ITC buffer stock (some 11,500 tons during
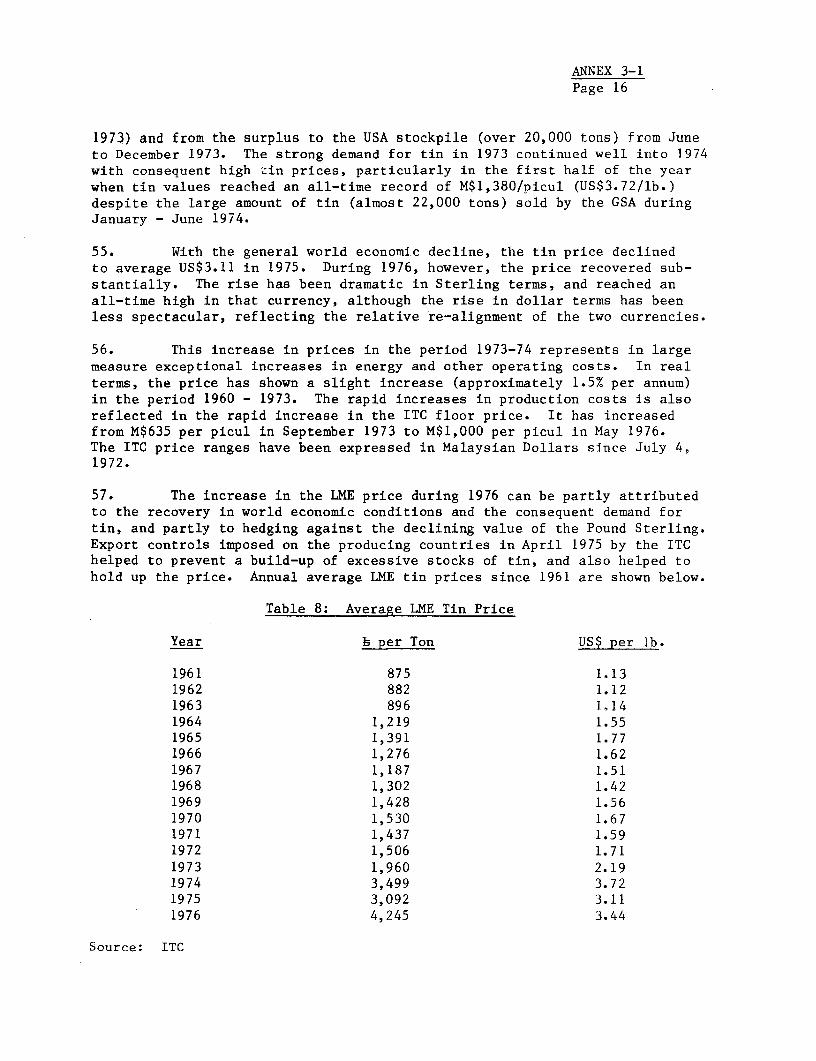
ANNEX 3-1Page 16
1973) and from the surplus to the USA stockpile (over 20,000 tons) from Juneto December 1973. The strong demand for tin in 1973 continued well into 1974with consequent high Lin prices, particularly in the first half of the yearwhen tin values reached an all-time record of M$1,380/picul (US$3.72/lb.)despite the large amount of tin (almost 22,000 tons) sold by the GSA duringJanuary - June 1974.
55. With the general world economic decline, the tin price declinedto average US$3.11 in 1975. During 1976, however, the price recovered sub-stantially. The rise has been dramatic in Sterling terms, and reached anall-time high in that currency, although the rise in dollar terms has beenless spectacular, reflecting the relative re-alignment of the two currencies.
56. This increase in prices in the period 1973-74 represents in largemeasure exceptional increases in energy and other operating costs. In realterms, the price has shown a slight increase (approximately 1.5% per annum)in the period 1960 - 1973. The rapid increases in production costs is alsoreflected in the rapid increase in the ITC floor price. It has increasedfrom M$635 per picul in September 1973 to M$1,000 per picul in May 1976.The ITC price ranges have been expressed in Malaysian Dollars since July 4,1972.
57. The increase in the LME price during 1976 can be partly attributedto the recovery in world economic conditions and the consequent demand fortin, and partly to hedging against the declining value of the Pound Sterling.Export controls imposed on the producing countries in April 1975 by the ITChelped to prevent a build-up of excessive stocks of tin, and also helped tohold up the price. Annual average LME tin prices since 1961 are shown below.
Table 8: Average LME Tin Price
Year L per Ton US$ per lb.
1961 875 1.131962 882 1.121963 896 1.141964 1,219 1.551965 1,391 1.771966 1,276 1.621967 1,187 1.511968 1,302 1.421969 1,428 1.561970 1,530 1.671971 1,437 1.591972 1,506 1.711973 1,960 2.191974 3,499 3.721975 3,092 3.111976 4,245 3.44
Source: ITC
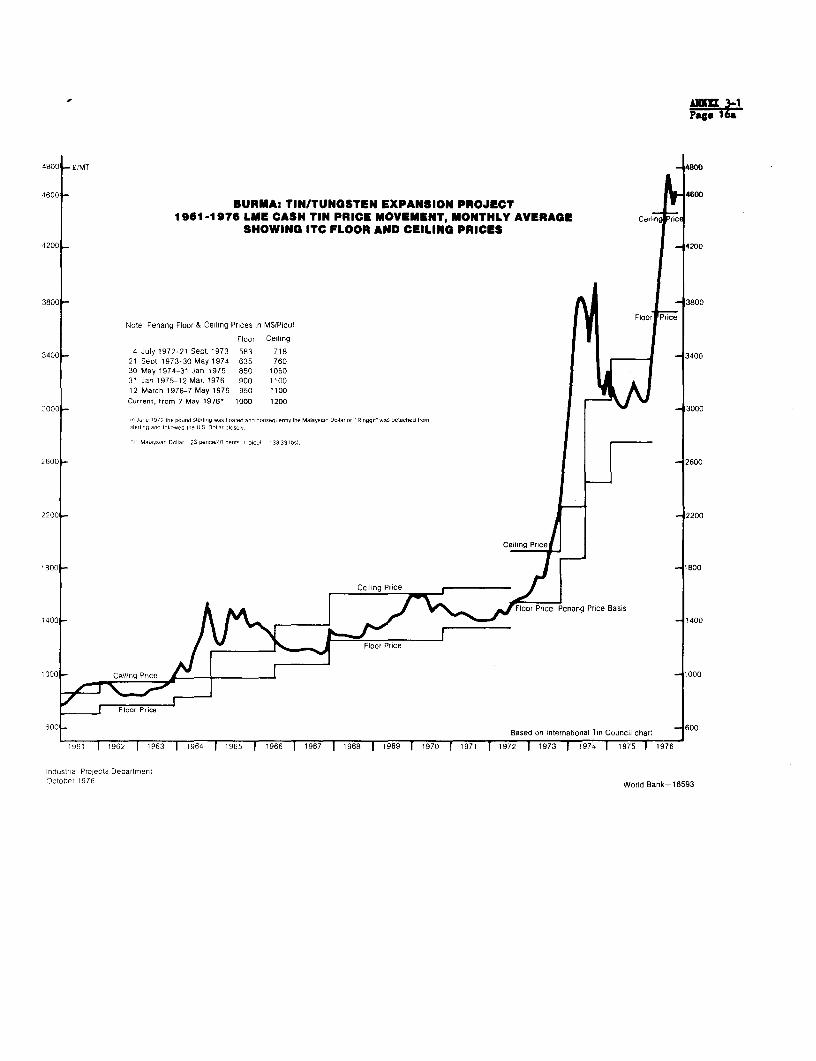
4800 £1 4800
46500 48t00BURMA: TIN/TUNGSTEN EXPANSION PROJECT |
1961-1976 LME CASH TIN PRICE MOVEMENT, MONTHLY AVERAGE Ceiln rcSHOWING ITC FLOOR AND CEILING PRICES
41200 - 4200
3800 -3800
FloorP riceNote Penang Floor & Ceiling Prices in MSfPicul
Floor Ceiling
3400 4 July 1972-21 Sept. 1973 583 718 340021 Sept 1973-30 May 1974 635 76030 May 1974-31 Jan. 1975 850 105031 Jan 1975-12 Mar. 1976 900 110012 March 1976-7 May 1976 950 1100
Current, from 7 Mav 1976' 1000 1200 30003000 3000
onJne 372 te pound Mte ins as t aten and consequent, the Malayntan Dollator' eteaat" wan atachna tore ntntt eg and retsowed rn US DDt at cleselyt
1t Meruesran Oct at<3 penceeluOcanto t picul = t 33331tbst.|
2600 - 2600
2200 2200
Ceiling Price
1800 - - ~~~~~~~~~~~~~~~~~~~~~~~~~~~~~~~~~~~~1600
or Prim Penang Price Basis
1400 -v [ _ 1400
/ ~~~~~~~~~~~~Floor Price
1900 Ceiling Pr_ce 1000
600o Based on International Tin Counc,i chart 600
1961 | 1962 | 1P63 | 1964 | 1965 1966 | 1967 1968 1969 | 1970 1 t971 | 1972 | 1973 | 1974 | 1975 1 1976
Industria Projects DepartmentOctober 1976 World Bank-16593
ANNEX 3-1Page 17
I. DEMAND/SUPPLY/PRICE OUTLOOK
1. Demand
58. Statistical analysis shows that the income elasticity of demandfor tin in developed countries is small -- of the order of 0.1 - 0.3 --particularly if compared with that of other metals. Estimated price elastic-ities of demand for tin are also low - around 0.2. Given the many subsitututematerials for tin - aluminum, glass, paper, plastics, tin-free steel incans and containers, aluminum and copper base alloys in bronze and otherindustrial uses - the statistical estimates are probably on the low side.However, technological factors appear to play an important role in the sub-stitution process.
58. Consumption will continue to depend to a large extent on tinplatefor containers. In developed countries the container industry is expected tocontinue growing steadily, but technological substitution in this industrywill probably allow only a modest growth in tin use. It is less likely,however, that substitution will occur as rapidly in the developing and centrallyplanned economies as in the developed countries. Changes in demand for tin inbronze, brass, solder and other alloys are expected to be quite uniformworldwide, but a more rapid increase in domestic demand is possible in develop-ing countries. Tin's greatest potential for growth is in chemicals, but,although the industry's forecasts of tin use in chemicals are very optimistic,chemical uses account for only a small proportion of total tin consumption,and thus the impact on world demand will only be slight.
60. World demand for tin is projected to increase at only 1.5% per annumbetween 1972-74 and 1985 (Table 9) and is expected to be below trend until theend of the 1970's. The sharp increase in tin prices during 1973 and 1974 hashurt tin consumption in developed countries, and full recovery is not expecteduntil the late 1970's and early 1980's, when the gradual price adjustment tolong-term trends will again stimulate demand growth.
2. Supply
61. World production of tin-in-concentrates is projected to grow atabout 1.0% per annum between 1972-1974 and 1980 (Table 9). Over the period,however, growth is expected to be positive until the late 1970's in responseto the relatively high prices of the past three years. A fall in world pro-duction of tin ore is projected in the mid-1980's in response to the fallin real prices projected for the early 1980's. These projections assume thatoverall production of tin ore will follow historical patterns in responseto price changes: mine production is expected to continue to react witha certain lag to the movements in real prices.
3. Price Outlook
62. Price movements through 1985 should continue to reflect thecyclical adjustment of consumption and production to market influences,including the effect of ITC actions (Table 10).
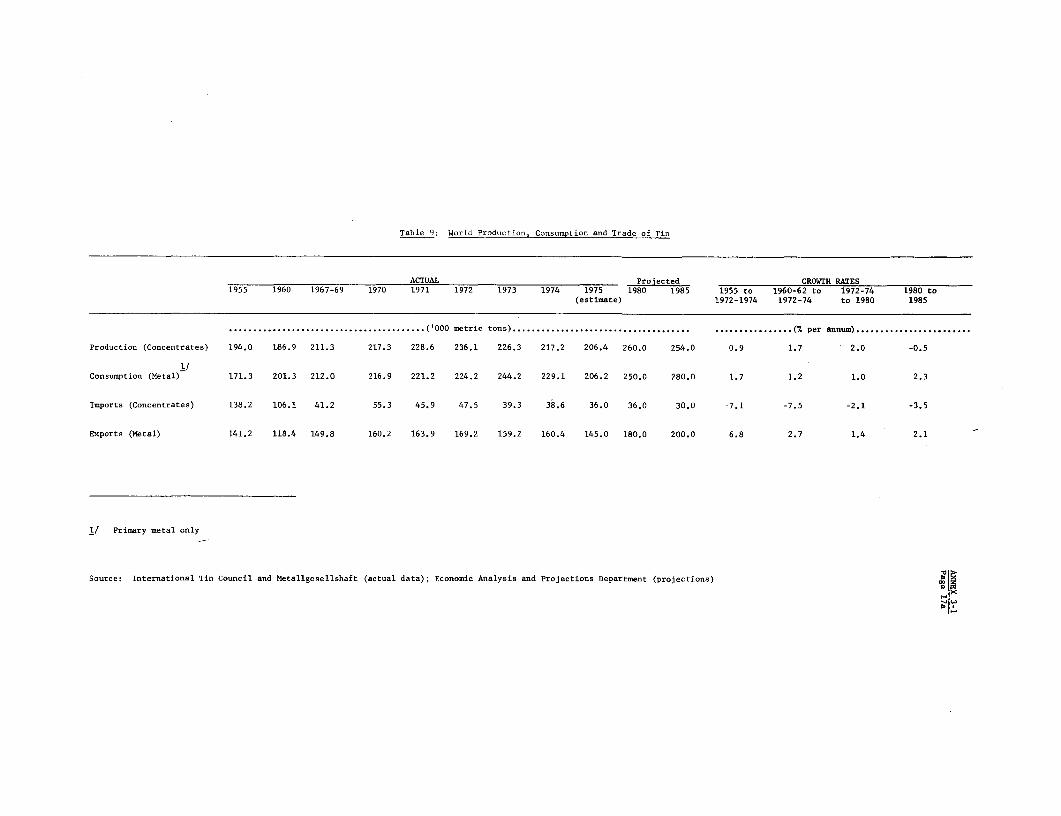
Table 9: World Production, Consumption and Trade of Tin
ACTUAL Projected GROWTH RATES
1955 1960 1967-69 1970 1971 1972 1973 1974 1975 1980 1985 1955 to 1960-62 to 1972-74 1980 to(estimate) 1972-1974 1972-74 to 1980 1985
.000 metric tons) .............................................................. (................ ................ ( per annum).
Production (Concentrates) 194.0 186.9 211.3 217.3 228.6 236.1 226.3 217.2 206.4 260.0 254.0 0.9 1.7 2.0 -0.5
'/Consumption (Metal) 171.3 201.3 212.0 216.9 221.2 224.2 244.2 229.1 206.2 250.0 280.0 1.7 1.2 1.0 2.3
Imports (Concentrates) 138.2 106.1 41.2 55.3 45.9 47.5 39.3 38.6 36.0 36.0 30.0 -7.1 -7.5 -2.1 -3.5
Exports (Metal) 141.2 118.4 149.8 160.2 163.9 169.2 159.2 160.4 145.0 180.0 200.0 6.8 2.7 1.4 2.1
1/ Primary metal only
Source: International Tin Council and Metallgesellshaft (actual data); Economic Analysis and Projections Department (projections)
lb

ANNEX 3-1Page 18
Table 10: Tin Price Projections
(US$ per pounds; LME)
Straight-lineTrend Projections Micro-Economic Model Projections
ConstantCurrent September 1976 Current Constant 1976
Year Dollars Dollars Dollars Dollars Deflator
1976 3.46 3.46 3.44 3.44 100.01977 3.72 3.43 3.70 3.41 108.41978 4.09 3.49 4.14 3.53 117.11979 4.47 3.55 4.39 3.49 125.81980 4.86 3.61 4.60 3.42 134.71981 5.36 3.671982 5.86 3.731983 6.36 3.791984 6.86 3.841985 7.37 3.90 7.37 3.90 188.9
63. In the short term, the real price of tin is expected to continue tobe lower than its 1974 peak level. A modest increase is projected to takeplace in 1977 and 1978 as world demand recovers from the 1974-75 slump. Anover-supply could develop in the late 1970's with the response of productionto the price increase of 1973 and 1974, and tin prices - in constant 1976dollars - could decline for a period, although the ITC's operations shouldminimize the effect. During the 1980-85 period, prices are expected to moveupward in real terms, reflecting the lagged response of mine production to thedownward price movement in the late 1970's.
4. Methodology
64. The projections of demand, supply and prices are based on an econo-metric model that relates: (a) mine production of tin to lagged prices andlagged production; (b) consumption to lagged tin prices, the price of aluminumand industrial production in OECD countries; and (c) tin prices to stocks andthe general inflation level in OECD countries.
65. In making the forecasts, it was assumed that the United States'strategic stockpile, which was reduced by 23,000 tons in 1974, will remainunchanged thereafter. Some disposals from the U.S. stockpile, however, arelikely in the early 1980's when real tin prices are expected to increasequite substantially. It is obviously impossible to speculate about futureU.S. stockpile disposals. One can expect that with the more direct participa-tion of the U.S. Government in the workings of the International Tin Council,a closer coordination between U.S. tin stockpile sales and ITC buffer stockoperations will evolve.
Industrial Project Department
January, 1977

ANNEX 3-2Page 1
BURMA
TIN/TUNGSTEN EXPANSION PROJECT
THE TUNGSTEN MARKET
A. INTRODUCTION
1. The unique properties of tungsten - a heavy, hard, heat resis-tant metal, seem likely to ensure continued growth in its major applica-tions. Substitution, even at increased prices, is not likely to modifytungsten usage significantly. However, uncertain supply tends to restrictexpansion of tungsten use.
2. The tungsten market is quite small, with world consumption ofthe order of 40,000 tons per annum. Statistical data on such a market isoften inaccurate, and invariably incomplete. Although available data mustbe treated with caution, it is possible to draw certain conclusions aboutthe future prospects for tungsten and likely price developments.
B. PROPERTIES
3. Tungsten has the highest melting point of all metals: 3400 C,three times that of copper and twice that of steel. It is one of theheaviest elements, about equal to gold. Above 1,650 C, tungsten outranksall metals in tensile strength. In addition, tungsten has good corrosionresistance, electrical and thermal conductivity, and a low thermal expan-sion coefficient.
4. Tungsten (chemical symbol: W) occurs in nature as wolframite-(Fe. Mn) W04; Scheelite-CaWO4; and less commonly as Ferbeite-FeWO4; andHeubenite-MnWO4. Tungsten is used in the form of metal powder, carbidepowder, ferrotungsten, and chemical compounds. A number of treatmentprocesses are employed to obtain the desired use form from the naturalmineral. The treatment processes vary with the source mineral. Initialtreatment usually involves concentration by gravity because of the miner-al's high density.
C. USES
5. Because of its desirable properties, tungsten is used in a num-ber of rapidly expanding advanced technology industries. Detailed infor-mation on use patterns is available only for the U.S., but can be con-sidered indicative of uses elsewhere, except for steel, which in other partsof the world, accounts for a somewhat larger part of the total consumption oftungsten.

ANNEX 3-2Page 2
6. The percent distribution of U.S. tungsten end use forms is asfollows:
Table 1: Tungsten End Use Forms
Uses %
Carbides 45Alloy Steels 25Tungsten Base Alloys 18Non Ferrous Alloys 11Chemicals 1
100
Source: USBM
7. Carbides are usually in the form of cemented tungsten carbide and,to a lesser extent, cast tungsten carbide. Their largest uses are for cut-ting edges on numerically controlled machine tools, and metal shaping andforming dies in metal working machinery. The high heat and wear resistanceof tungsten carbides makes it a preferred material in these applications.Substantial advantages are also realized in the mining and construction in-dustries through use of tungsten carbide inserts in rock bits. Other usesof carbides include ball point pen tips and gas turbines. A market fortungsten carbides which developed quickly in the 1960's was steel jacketedtire studs with carbide centers. This market accounted for one thirdof the tungsten consumed in transportation equipment or 6% of the totaltungsten consumption in the late 1960's. However the damage to road sur-faces prompted most jurisdictions to outlaw tire studs. Only a minutequantity of tungsten is consumed in studs today. Nonetheless, there areno satisfactory substitutes for tungsten carbides. Only titanium carbideand aluminum oxide have any comparable market acceptance.
8. The second important use of tungsten is in alloy steels. Hard-ness at elevated temperatures is the important property of tungsten highspeed steels, and die and hot work steels. They are used primarily in theworking of metals by high speed drilling, cutting and shaping of metal.Shock and wear resistant tungsten alloy steels are used in grader blades,in rock crusher jaws, and in teeth for bucket and wheel excavators. Hightemperature steels find application in rocket nozzles and other aerospaceequipment. Lesser quantities are used in high strength applications in auto-motive and railroad equipment and ships. Molybdenum, to a large extent, issubstituted for tungsten in tool steels. Molybdenum forms the same type ofdouble carbide with iron and carbon as does tungsten. However, the molyb-denum steels have a lower melting point, have 'Less red-hardness, and have atendency to decarburize.
ANNEX 3-2Page 3
9. The most visible use of tungsten metal is the filament in incan-descent electric lamps. Although this use is well known and important, itrepresents less than 6% of tungsten consumption. The filaments for more than10 million lamps can be made from one ton of tungsten. Improved technologyhas reduced filament thickness over time, and tungsten accounts for less than
0.1% of the average price of a light bulb. Although there is no satisfactorysubstitute for tungsten in lamps, fluorescent lighting has reduced the import-ance of this use over time.
10. Tungsten metal, alone or in alloys with copper or silver, is usedin the manufacture of electrical contact points in electrical circuits.Automotive electrical distributor points are small discs of pure tungstenrod because of the metal's high wear resistance and adequate electrical con-ductivity. An important application of the metal is in the manufacture ofelectrical tubes, such as X-ray, transmitter, receiver and cathode ray tubes.Tungsten wire is used to form cathodes for electron tubes. Tungsten rod isused to heat cathodes in transmitter tubes. Tungsten rod is also used forinert - arc welding of iron and steel, and other metals. The heavy weight oftungsten is utilized in counter-weights and balances in the horizontal andvertical stabilizers of aircraft.
11. Non ferrous tungsten alloys are used where the desirable charac-teristics of tungsten and another metal are required. For example, tungsten -
copper - silver alloys find application where high electrical conductivityis needed. Contacts in telephones, business, electric clocks and remotecontrol devices are typical uses. Copper infiltrated tungsten is used inpower tubes.
12. Tungsten chemicals are used in textile dyes, paints, enamels andglass manufacture. Sodium tungstate is used for the manufacture of othertungsten compounds for pigments, chemical analyses, and fireproofing textiles.Tungsten trioxide, of bright yellow color, is used in oil and water colors.Other tungsten compounds are luminescent and are used in luminescent pig-ments in X-ray screens, television picture tubes and fluorescent lighting.
13. The uses of tungsten are quite diverse. In most applications,other materials perform less satisfactorily. The cost of tungsten isusually a minor item in these uses. As a result, substitution for tungstenis not likely to be a significant factor in consumption patterns in the fore-seeable future.
D. WORLD TUNGSTEN RESERVES
14. Tungsten is commonly found in association with other metals, suchas tin, molybdenum, copper and bismuth. Most tungsten minerals occur inquartz veins associated with siliceous granitic rocks. To a lesser extent,tungsten minerals are found in contact metamorphic deposits at or near thecontact of limestone and granite intrusives. Other production has also comefrom replacement deposits and pegmatites, and from weathered surface depositsand placer deposits. The grade of tungsten in these deposits ranges from0.6% to 2.0%.
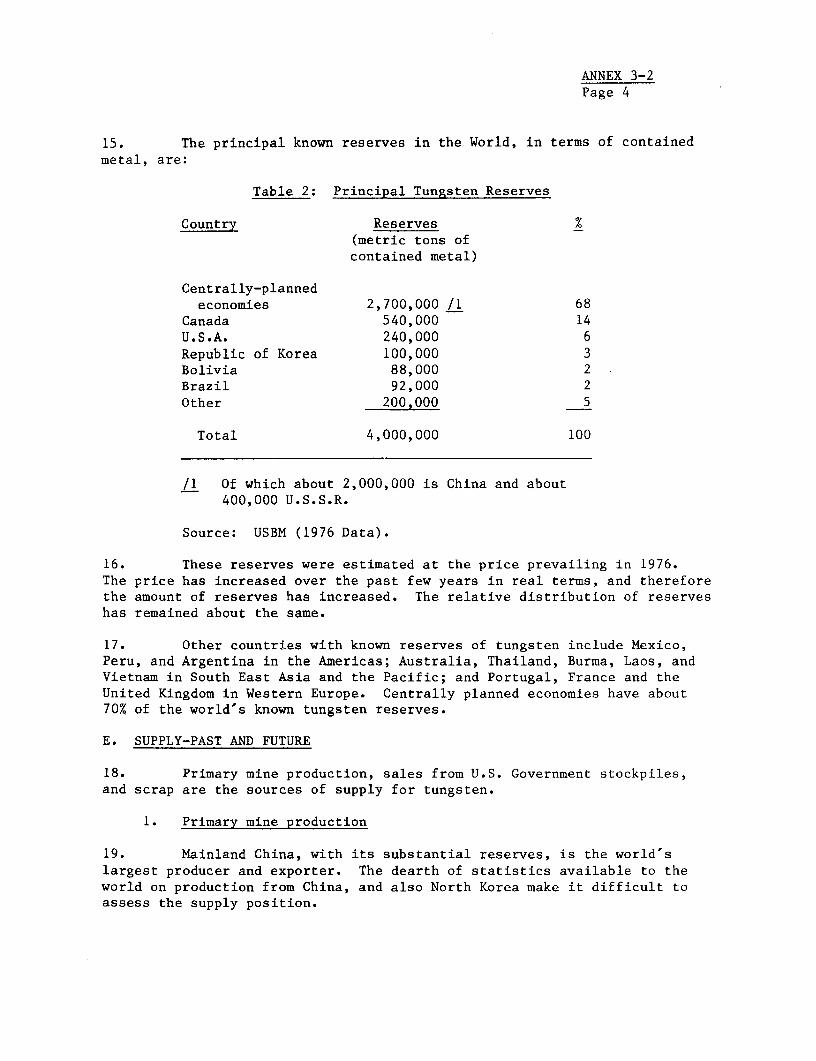
ANNEX 3-2Page 4
15. The principal known reserves in the World, in terms of containedmetal, are:
Table 2: Principal Tungsten Reserves
Country Reserves _(metric tons ofcontained metal)
Centrally-plannedeconomies 2,700,000 /1 68
Canada 540,000 14U.S.A. 240,000 6Republic of Korea 100,000 3Bolivia 88,000 2Brazil 92,000 2Other 200,000 5
Total 4,000,000 100
/1 Of which about 2,000,000 is China and about400,000 U.S.S.R.
Source: USBM (1976 Data).
16. These reserves were estimated at the price prevailing in 1976.The price has increased over the past few years in real terms, and thereforethe amount of reserves has increased. The relative distribution of reserveshas remained about the same.
17. Other countries with known reserves of tungsten include Mexico,Peru, and Argentina in the Americas; Australia, Thailand, Burma, Laos, andVietnam in South East Asia and the Pacific; and Portugal, France and theUnited Kingdom in Western Europe. Centrally planned economies have about70% of the world's known tungsten reserves.
E. SUPPLY-PAST AND FUTURE
18. Primary mine production, sales from U.S. Government stockpiles,and scrap are the sources of supply for tungsten.
1. Primary mine production
19. Mainland China, with its substantial reserves, is the world'slargest producer and exporter. The dearth of statistics available to theworld on production from China, and also North Korea make it difficult toassess the supply position.
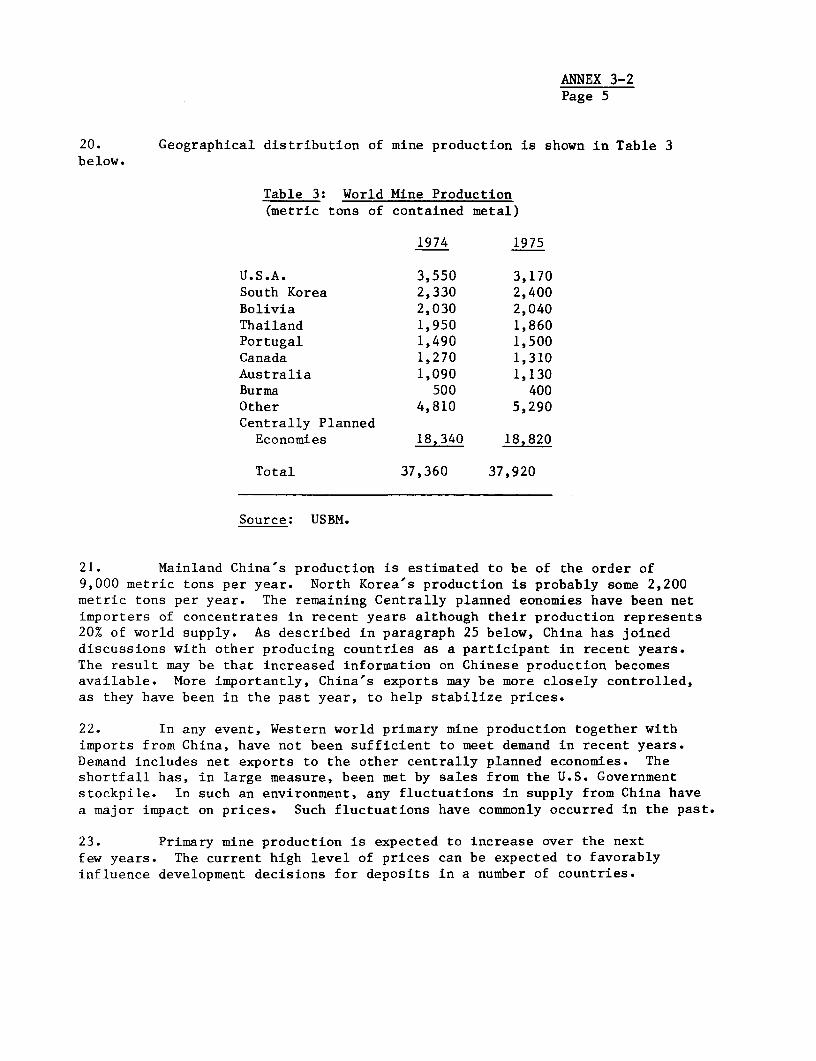
ANNEX 3-2Page 5
20. Geographical distribution of mine production is shown in Table 3below.
Table 3: World Mine Production(metric tons of contained metal)
1974 1975
U.S.A. 3,550 3,170South Korea 2,330 2,400Bolivia 2,030 2,040Thailand 1,950 1,860Portugal 1,490 1,500Canada 1,270 1,310Australia 1,090 1,130Burma 500 400Other 4,810 5,290Centrally PlannedEconomies 18,340 18,820
Total 37,360 37,920
Source: USBM.
21. Mainland China's production is estimated to be of the order of9,000 metric tons per year. North Korea's production is probably some 2,200metric tons per year. The remaining Centrally planned eonomies have been netimporters of concentrates in recent years although their production represents20% of world supply. As described in paragraph 25 below, China has joineddiscussions with other producing countries as a participant in recent years.The result may be that increased information on Chinese production becomesavailable. More importantly, China's exports may be more closely controlled,as they have been in the past year, to help stabilize prices.
22. In any event, Western world primary mine production together withimports from China, have not been sufficient to meet demand in recent years.Demand includes net exports to the other centrally planned economies. Theshortfall has, in large measure, been met by sales from the U.S. Governmentstockpile. In such an environment, any fluctuations in supply from China havea major impact on prices. Such fluctuations have commonly occurred in the past.
23. Primary mine production is expected to increase over the nextfew years. The current high level of prices can be expected to favorablyinfluence development decisions for deposits in a number of countries.
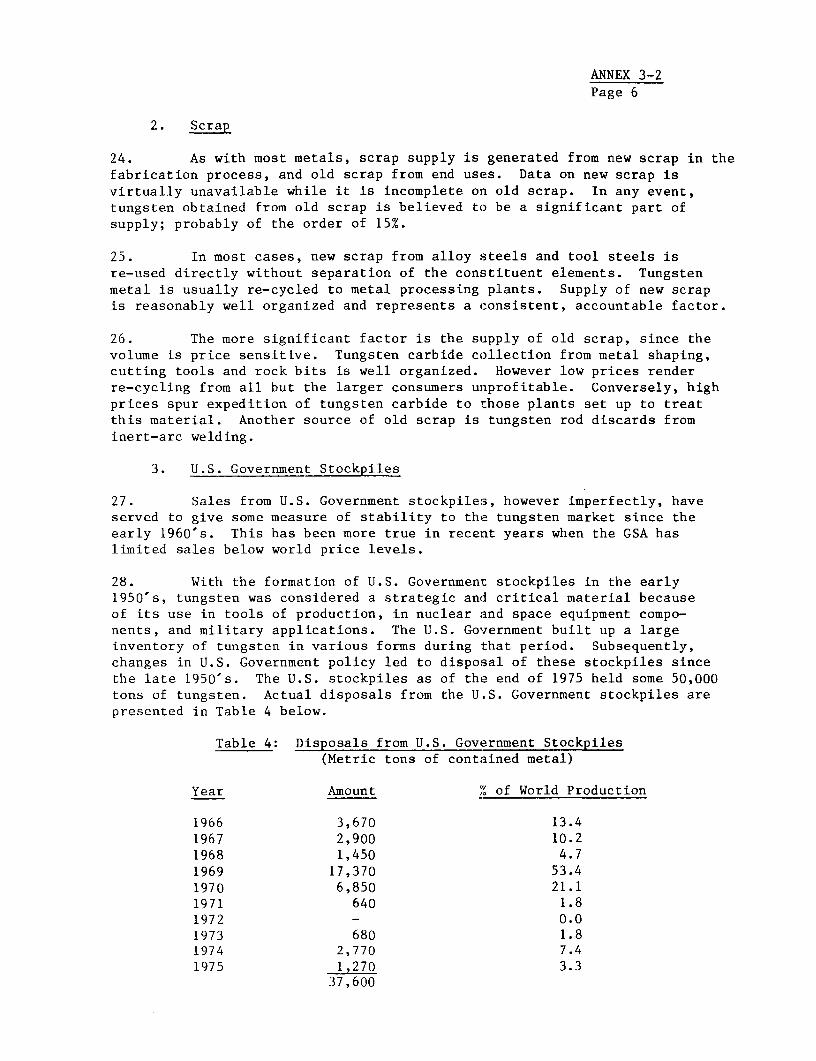
ANNEX 3-2
Page 6
2. Scrap
24. As with most metals, scrap supply is generated from new scrap in thefabrication process, and old scrap from end uses. Data on new scrap isvirtually unavailable while it is incomplete on old scrap. In any event,tungsten obtained from old scrap is believed to be a significant part ofsupply; probably of the order of 15%.
25. In most cases, new scrap from alloy steels and tool steels isre-used directly without separation of the constituent elements. Tungstenmetal is usually re-cycled to metal processing plants. Supply of new scrapis reasonably well organized and represents a consistent, accountable factor.
26. The more significant factor is the supply of old scrap, since thevolume is price sensitive. Tungsten carbide collection from metal shaping,cutting tools and rock bits is well organized. However low prices renderre-cycling from all but the larger consumers unprofitable. Conversely, highprices spur expedition of tungsten carbide to those plants set up to treatthis material. Another source of old scrap is tungsten rod discards frominert-arc welding.
3. U.S. Government Stockpiles
27. Sales from U.S. Government stockpiles, however imperfectly, haveserved to give some measure of stability to the tungsten market since theearly 1960's. This has been more true in recent years when the GSA haslimited sales below world price levels.
28. With the formation of U.S. Government stockpiles in the early1950's, tungsten was considered a strategic and critical material becauseof its use in tools of production, in nuclear and space equipment compo-nents, and military applications. The U.S. Government built up a largeinventory of tungsten in various forms during that period. Subsequently,changes in U.S. Government policy led to disposal of these stockpiles sincethe late 1950's. The U.S. stockpiles as of the end of 1975 held some 50,000tons of tungsten. Actual disposals from the U.S. Government stockpiles arepresented in Table 4 below.
Table 4: Disposals from U.S. Government Stockpiles(Metric tons of contained metal)
Year Amount % of World Production
1966 3,670 13.41967 2,900 10.21968 1,450 4.71969 17,370 53.41970 6,850 21.11971 640 1.81972 - 0.01973 680 1.81974 2,770 7.41975 1,270 3.3
37,600
ANNEX 3-2Page 7
29. Disposals from the U.S. Government stockpiles have helped, in large
measure, to fill the supply gap in the Western World. Since 1970, there hasbeen a negative net balance between production and consumption, even with GSAdisposals. The disposals have not been without criticism from both consumersand producers, particularly in 1975. However, it would seem that the disposalshave served a useful purpose in that they have helped to meet the supply gapwhich otherwise would have resulted.
F. PRODUCERS ASSOCIATION
30. In 1963, Bolivia and South Korea asked the United Nations to takemeasures in stabilizing tungsten prices after a sharp drop in prices hadresulted when China released large quantities into the market. An ad hoccommittee under the United Nations Conference on Trade and Development (UNCTAD)was formed as a result. The ad hoc committee and its working group, however,served principally as a forum for discussion.
31. In 1974, new pressures were exerted to catalyze action on pricestabilization. The UNCTAD working group in its August 1974 meeting in Geneva,re-affirmed the need to improve the quality and volume of information ontungsten. Among other things, the group sought a comprehensive survey of theactual prices at which tungsten was traded. These proposals were submitted tothe ad hoc committee at the November 1974 UNCTAD meeting on commodities. Peruand Bolivia led the developing nations in pressing for affirmative action onthe proposals. China, for the first time, attended the meeting as a participant.
32. In April 1975, parallel meetings of major producing companies,and government representatives of producing countries were held in La Paz,Bolivia. The producing companies formed the Primary Tungsten Association(PTA). Founding members included Mineroperu, Beralt Tin and Wolfram ofPortugal, Peko-Wallsend of Australia, the Societe Miniere d'Anglade ofFrance, and Comibol and private sector companies of Bolivia. China wasa participant in the government meetings convened by Bolivia.
33. Tentative agreement was reached by the PTA to set upper and lowerlimits of respectively E 45 and L 35 per metric ton unit of 65% minimum W03tungsten concentrate, but this has had little or no effect. A headquartersfor the PTA was also established in London.
34. The price limits were submitted to the Tungsten Committee of theUNCTAD on which 29 producing and consuming countries are represented. Whiletentative agreement was reportedly reached on establishment of price limits,a decision was made to postpone substantive discussions until 1976. Thisdecision was made to give time to resolve the technical problems.
35. These problems revolve mainly around the fact that tungstenis not traded as a homogeneous product. For this reason the Committee con-cluded that a buffer stock would be impractical. It was also felt that therewould have to be an agreed price relationship between all the forms in which
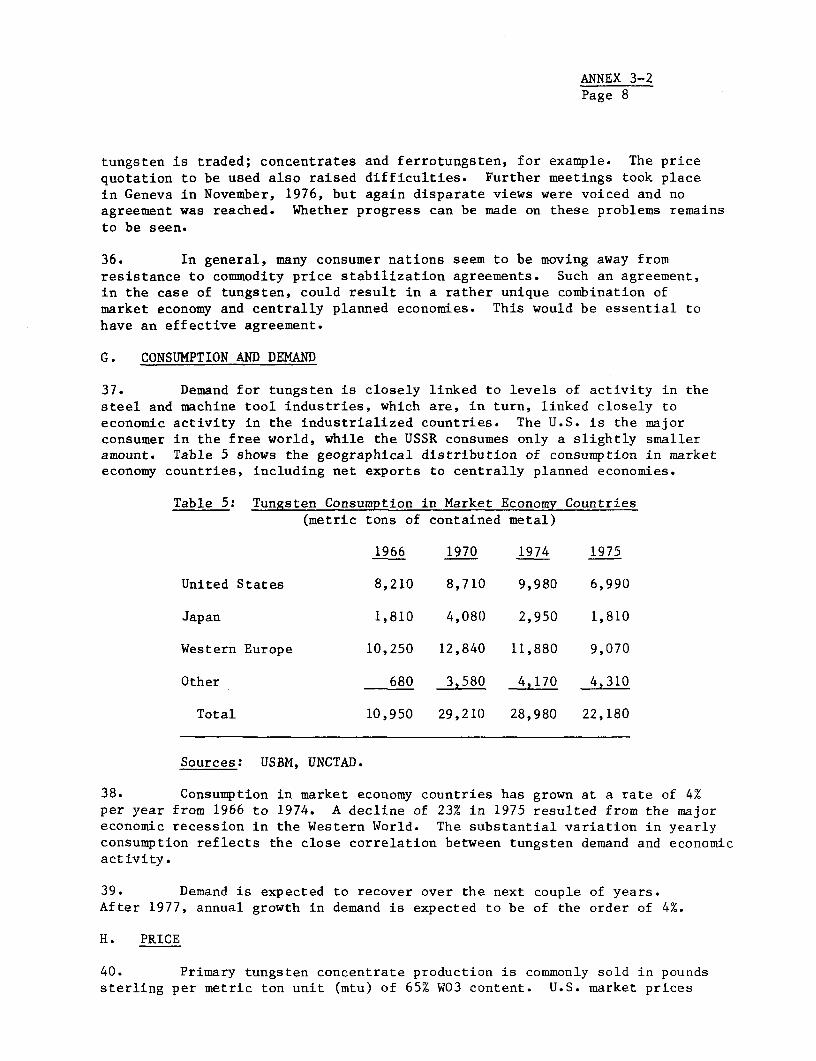
ANNEX 3-2Page 8
tungsten is traded; concentrates and ferrotungsten, for example. The pricequotation to be used also raised difficulties. Further meetings took placein Geneva in November, 1976, but again disparate views were voiced and noagreement was reached. Whether progress can be made on these problems remainsto be seen.
36. In general, many consumer nations seem to be moving away fromresistance to commodity price stabilization agreements. Such an agreement,in the case of tungsten, could result in a rather unique combination ofmarket economy and centrally planned economies. This would be essential tohave an effective agreement.
G. CONSUMPTION AND DEMAND
37. Demand for tungsten is closely linked to levels of activity in thesteel and machine tool industries, which are, in turn, linked closely toeconomic activity in the industrialized countries. The U.S. is the majorconsumer in the free world, while the USSR consumes only a slightly smalleramount. Table 5 shows the geographical distribution of consumption in marketeconomy countries, including net exports to centrally planned economies.
Table 5: Tungsten Consumption in Market Economy Countries(metric tons of contained metal)
1966 1970 1974 1975
United States 8,210 8,710) 9,980 6,990
Japan 1,810 4,080 2,950 1,810
Western Europe 10,250 12,840 11,880 9,070
Other 680 3,580 4,170 4,310
Total 10,950 29,210 28,980 22,180
Sources: USBM, UNCTAD.
38. Consumption in market economy countries has grown at a rate of 4%per year from 1966 to 1974. A decline of 23% in 1975 resulted from the majoreconomic recession in the Western World. The substantial variation in yearlyconsumption reflects the close correlation between tungsten demand and economicactivity.
39. Demand is expected to recover over the next couple of years.After 1977, annual growth in demand is expected to be of the order of 4%.
H. PRICE
40. Primary tungsten concentrate production is commonly sold in poundssterling per metric ton unit (mtu) of 65% W03 content. U.S. market prices
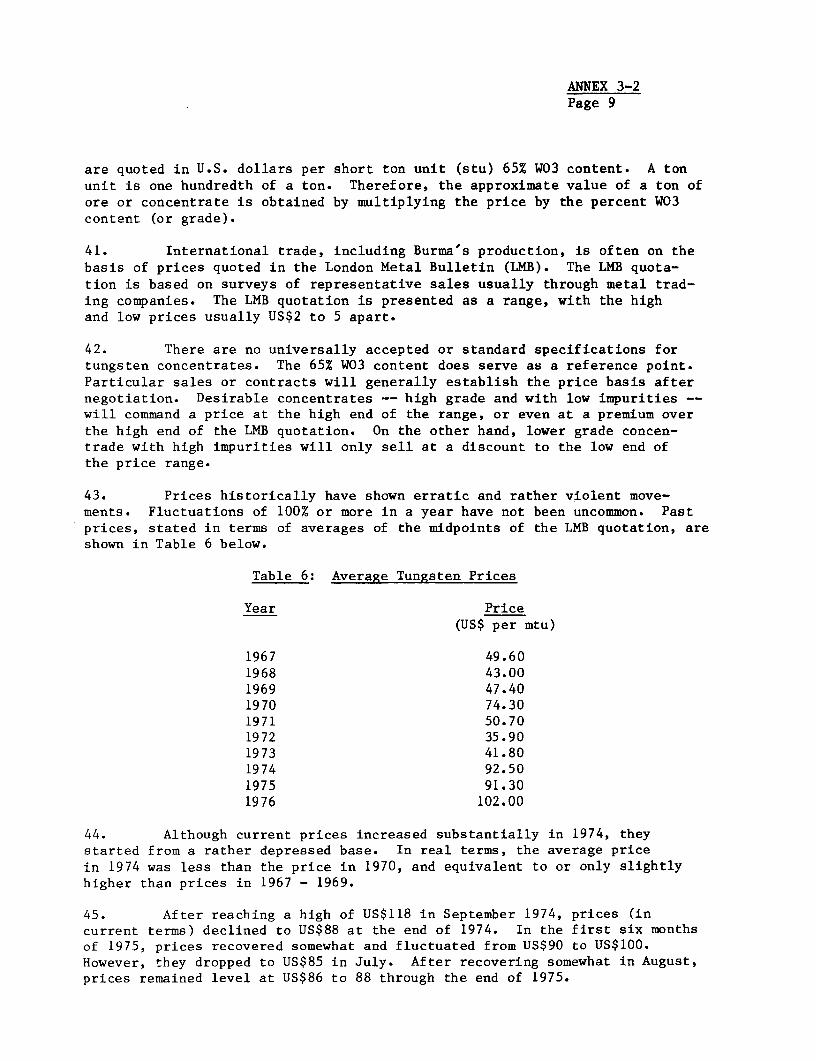
ANNEX 3-2Page 9
are quoted in U.S. dollars per short ton unit (stu) 65% W03 content. A tonunit is one hundredth of a ton. Therefore, the approximate value of a ton ofore or concentrate is obtained by multiplying the price by the percent W03content (or grade).
41. International trade, including Burma's production, is often on thebasis of prices quoted in the London Metal Bulletin (LMB). The LMB quota-tion is based on surveys of representative sales usually through metal trad-ing companies. The LMB quotation is presented as a range, with the highand low prices usually US$2 to 5 apart.
42. There are no universally accepted or standard specifications fortungsten concentrates. The 65% W03 content does serve as a reference point.Particular sales or contracts will generally establish the price basis afternegotiation. Desirable concentrates -- high grade and with low impurities --will command a price at the high end of the range, or even at a premium overthe high end of the LMB quotation. On the other hand, lower grade concen-trade with high impurities will only sell at a discount to the low end ofthe price range.
43. Prices historically have shown erratic and rather violent move-ments. Fluctuations of 100% or more in a year have not been uncommon. Pastprices, stated in terms of averages of the midpoints of the LMB quotation, areshown in Table 6 below.
Table 6: Average Tungsten Prices
Year Price(US$ per mtu)
1967 49.601968 43.001969 47.401970 74.301971 50.701972 35.901973 41.801974 92.501975 91.301976 102.00
44. Although current prices increased substantially in 1974, theystarted from a rather depressed base. In real terms, the average pricein 1974 was less than the price in 1970, and equivalent to or only slightlyhigher than prices in 1967 - 1969.
45. After reaching a high of US$118 in September 1974, prices (incurrent terms) declined to US$88 at the end of 1974. In the first six monthsof 1975, prices recovered somewhat and fluctuated from US$90 to US$100.However, they dropped to US$85 in July. After recovering somewhat in August,prices remained level at US$86 to 88 through the end of 1975.
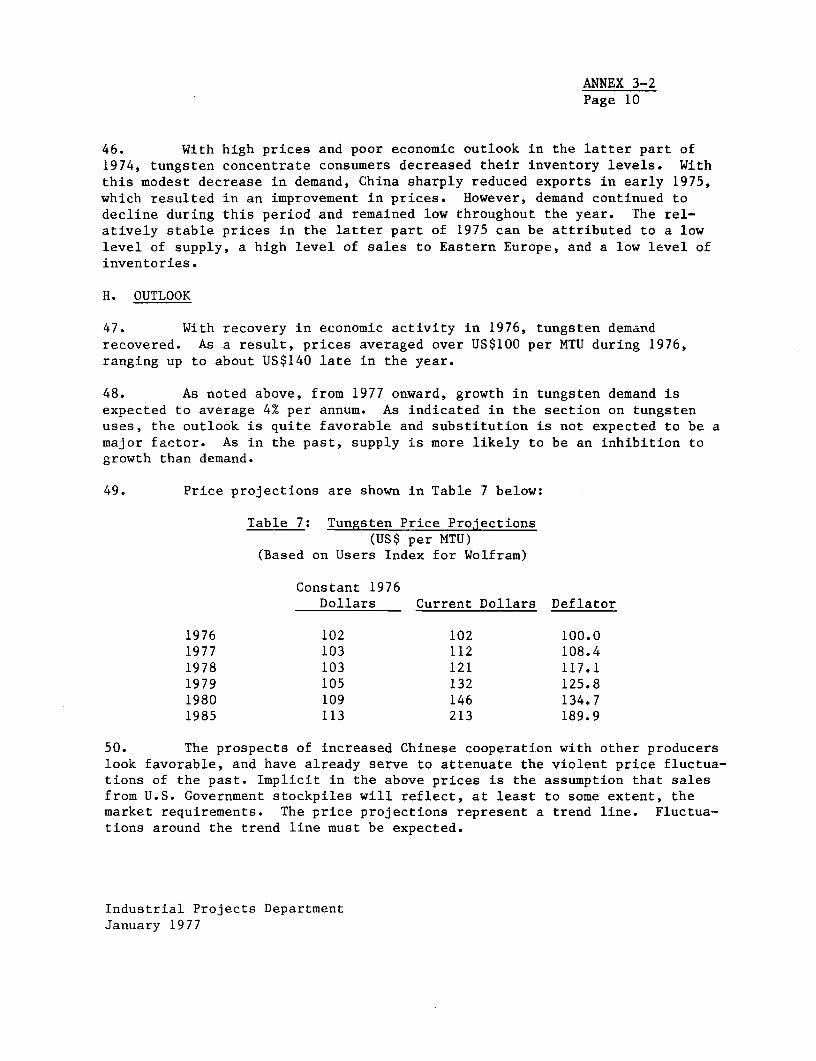
ANNEX 3-2Page 10
46. With high prices and poor economic outlook in the latter part of1974, tungsten concentrate consumers decreased their inventory levels. Withthis modest decrease in demand, China sharply reduced exports in early 1975,which resulted in an improvement in prices. However, demand continued todecline during this period and remained low throughout the year. rhe rel-atively stable prices in the latter part of 1975 can be attributed to a lowlevel of supply, a high level of sales to Eastern Europe, and a low level ofinventories.
H. OUTLOOK
47. With recovery in economic activity in 1976, tungsten demandrecovered. As a result, prices averaged over US$100 per MTU during 1976,ranging up to about US$140 late in the year.
48. As noted above, from 1977 onward, growth in tungsten demand isexpected to average 4% per annum. As indicated in the section on tungstenuses, the outlook is quite favorable and substitution is not expected to be amajor factor. As in the past, supply is more likely to be an inhibition togrowth than demand.
49. Price projections are shown in Table 7 below:
Table 7: Tungsten Price Projections(US$ per MTU)
(Based on Users Index for Wolfram)
Constant 1976Dollars Current Dollars Deflator
1976 102 102 100.01977 103 112 108.41978 103 121 117.11979 105 132 125.81980 109 146 134.71985 113 213 189.9
50. The prospects of increased Chinese cooperation with other producerslook favorable, and have already serve to attenuate the violent price fluctua-tions of the past. Implicit in the above prices is the assumption that salesfrom U.S. Government stockpiles will reflect, at least to some extent, themarket requirements. The price projections represent a trend line. Fluctua-tions around the trend line must be expected.
Industrial Projects DepartmentJanuary 1977

ANNEX 4-1Page 1
BURMA
TIN/TUNGSTEN EXPANSION PROJECT
NO. 2 MINING CORPORATION:DESCRIPTION OF OPERATIONS
A. INTRODUCTION
1. The No. 2 Mining Corporation (MC2) presently produces approximately1,500 LTPY of tin, tungsten and mixed tin/tungsten concentrates. Ore is minedin two principal regions of the country (Map IBRD 12322).
(a) Tenasserim Division
This area in the extreme south-eastern part of Burma producesaround 1,000 LTPY of tin, tungsten and tin/tungsten concentrates.Operating units comprise a few small MC2 mines and a multitudeof tribute operations.
(b) Mawchi and Pyinmana Area
Both Pyinmana and Mawchi are separate tin/tungsten centerslying north and north-east of Rangoon respectively. Thisarea produces around 500 LTPY of tin/tungsten mixed concen-trates, almost all of which come from tribute operations.
2. In both the Tenasserim and Mawchi/Pyinmana regions, the quantityand quality of the reserves remaining to be worked have, in most cases,not been thoroughly proved and prospecting records are incomplete. Theassessment of ore sources conducted by the consultants, Osborne and Chappel,is therefore based partly on such historic information as is available andon verbal advice from MC2 officials. While this situation is not entirelysatisfactory, the statements recorded are considered a realistic assessment,particularly in view of Burma's history as a major tin/tungsten producer andthe multitude of operating units, both big and small, which are known to haveexisted in the past. In this respect, it should be noted that current produc-tion levels are only 10% of those recorded some 40 years ago.
3. A summary of estimated ore reserves and current production levelsat MC2's various mining centers is given in Table 1 below. More detailedinformation on historical production is provided in Annex 4-2, page 3.
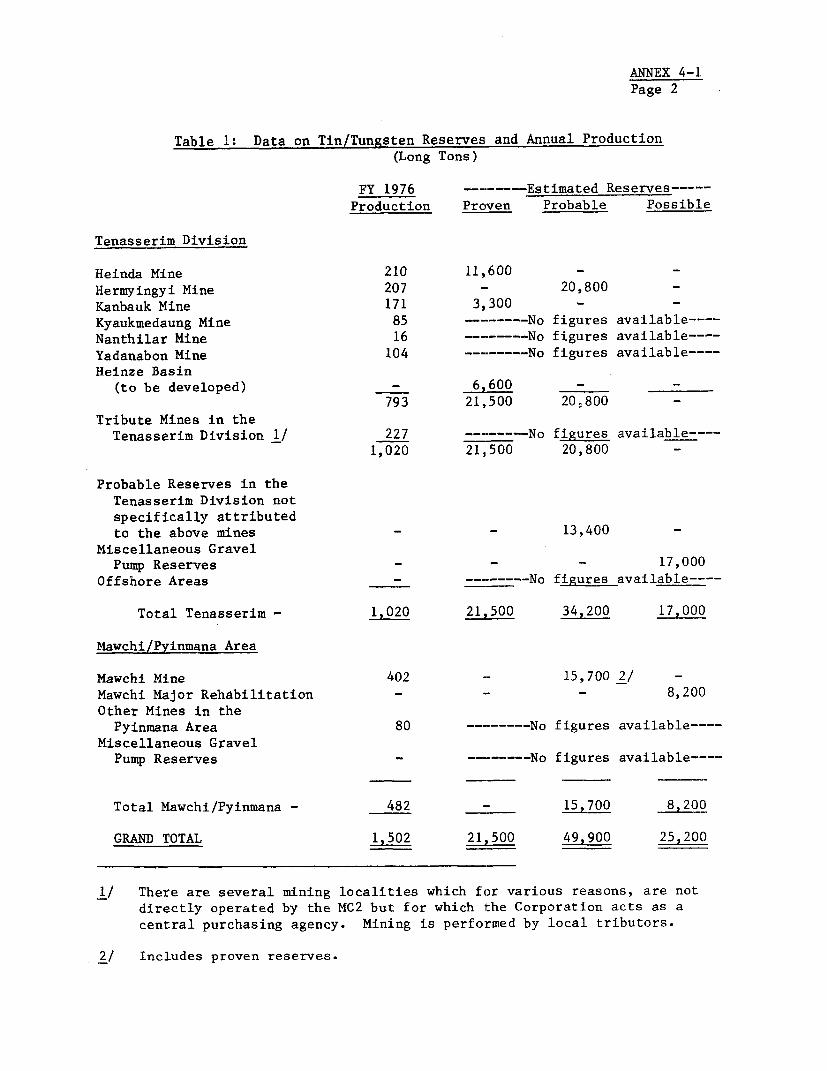
ANNEX 4-1Page 2
Table 1: Data on Tin/Tungsten Reserves and Annual Production(Long Tons)
FY 1976 ---- Estimated Reserves-----Production Proven Probable Possible
Tenasserim Division
Heinda Mine 210 11,600 - -
Hermyingyi Mine 207 - 20,800 -
Kanbauk Mine 171 3,300 - -
Kyaukmedaung Mine 85 --------No figures available----Nanthilar Mine 16 ------ No figures available----Yadanabon Mine 104 --------No figures available----Heinze Basin
(to be developed) 6,600 - -
793 21,500 20.800 -
Tribute Mines in theTenasserim Division 1/ 227 ------ No figures available----
1,020 21,500 20,800 -
Probable Reserves in theTenasserim Division notspecifically attributedto the above mines 13,400 -
Miscellaneous GravelPump Reserves - 17,000
Offshore Areas - --------No figures available----
Total Tenasserim - 1,020 21,500 34,200 17,000
Mawchi/Pyinmana Area
Mawchi Mine 402 - 15,700 2/ -Mawchi Major Rehabilitation -- - 8,200Other Mines in thePyinmana Area 80 --------No figures available----
Miscellaneous GravelPump Reserves - -------No figures available----
Total Mawchi/Pyinmana - 482 - 15,700 8,200
GRAND TOTAL 1,502 21,500 49,900 25,200
1/ There are several mining localities which for various reasons, are notdirectly operated by the MC2 but for which the Corporation acts as acentral purchasing agency. Mining is performed by local tributors.
2/ Includes proven reserves.

ANNEX 4-1Page 3
4. Overall, MC2 operates 7 mines and 8 small concentrators, withassociated facilities such as warehouses and workshops. However, over 75%of the concentrates produced are from ores purchased from independent tributeminers, who work individually or in small groups under the loose supervisionof Corporation staff. The tributors upgrade their production on site toabout 65% tin-ore/wolfram content by rudimentary means, with MC2's variousmines acting as purchasing and storage depots for tributor production. Adescription of MC2's mining and concentrating operations is given in SectionsB and C below.
B. MINING OPERATIONS
1. Heinda Mine
5. Background: Operations at this locality commenced in 1926 and havecontinued uninterrupted to the present day. In 1955, the original expatriatemining company joined with the Burmese Government to form the Anglo-BurmaCompany Limited. In 1963, the company was entirely bought out by the Govern-ment.
6. Mineral production is almost entirely tin at an average of 72%Sn. Mineralisation occurs in the form of an alluvial placer deposit, theaverage grade of the reserves having been assessed at 0.69 kg/cu.m. A WestGerman team (Grundstoffberatung E.V.) carried out studies on the Heindamine between August and October 1970. The statement of reserves shown inTable I is based on the German estimate updated to account for ground workedin the intervening period and adjusted for metallurgical recovery.
7. Existing Facilities: Currently, MC2 conducts mining operationsutilising ground sluicing methods with the final recovery being achieved byhand cleaning in palongs. Pre-blasting of selected ground is undertaken priorto ground sluicing by monitors. Palong concentrates are upgraded in a separ-ate treatment plant possessing a shaking table, screen, one magnetic separatorand several lanchutes. Equipment is generally in fair to good operatingcondition. The grade of the final concentrate is in the order of 72% Sn and nofurther upgrading is carried out in Tavoy, the concentrate being shipped toRangoon for sale.
8. Future Development: A new mining system is presently being imple-mented (with start-up scheduled for early 1977) based on a Federal Republic ofGermany survey, utilizing open pit methods and earthmoving equipment. Theforeign exchange costs of the project (US$8.9 million of total project cost ofUS$12.9 million) are being financed by a KfW credit and German technical aid.Pre-blasting will continue with the new system but hydraulic mining methodswill be terminated. The open pit has been designed to utilize benches of 7.5meters and the spoil will be hauled by eleven 18-ton dump trucks to thecentral mill; loading will be by front-end loaders.

ANNEX 4-1Page 4
9. A new concentrating mill is also being constructed, with Kruppof West Germany supervising the work. This new mill will treat run-of-mineore using trommel washers and vibrating screens for disintegration and sizing,hammer-mills for reduction of oversize, jigs for primary concentration andshaking tables for secondary clean-up. The final concentrate will be producedwith limited secondary stage concentration equipment after magnetic separationof the table concentrates. The designed capacity of the new mill is 600tons/hour. Production from the new facilities is projected to be 1000 LTPY oftin concentrates, an increase of about 800 LTPY over present output.
10. Although Krupp claims the new mill will produce a final concentrateassaying 72% Sn minimum with a recovery of 90%, Osborne and Chappel feelthat the attainment of a high grade for the final concentrate without unaccep-table losses is likely to present problems with the proposed flowsheet andequipment currently being installed. Such problems would be overcome bythe installation of additional equipment, or by final stage-upgrading atthe Tavoy concentrator to be built in association with the proposed IDAproject.
2. Hermyingyi Mine
11. Background: Operations, which included both underground and openpit working, were conducted by an expatriate mining company from 1913 to 1943.Between 1946 and 1962, only tribute operations took place because most of theoriginal machinery was destroyed during the war. In 1966, the Mineral Develop-ment Corporation took over operational control of the mine which was fullynationalized in 1971.
12. Mineralization is associated with a primary deposit occuring asnumerous veins in the rock together with the occurrence of quartz veins. Asurvey of reserves was undertaken by Mineral Development Corporation geologistsbetween 1966 and 1970. The results of the survey, however, were considered tobe far too optimistic and, with Federal German aid, the work is currentlybeing undertaken once more. The full results of this survey have yet to bepublished. What is conclusive, however, is that the rich reserves have beenalmost exhausted and only large tonnage methods of working the remaining lowergrades will enable the mine to be viable. The figures quoted in Table 1 forHermyingyi reserves are those contained in the preliminary report of theGermany study team.
13. Existing Facilities: Current working methods are conducted entirelyby tributors, using adit methods and shallow pitting of surface deposits.Facilities comprise only a lanchute and drier. All tributors' production issent to Tavoy for separation of wolfram-ore from tin-ore. The tributorsthemselves upgrade mine production to 65% wolfram-ore/tin-ore content bypanning and sluicing. Raw ore is crushed by sledge hammer and manual grindingis effected by rolling a cement filled steel pipe over a curved metal sheet.As no facilities exist in Tavoy for wet separation, various non-magneticand middlings fractions from the magnetic separators are returned to Hermyingyifor fuirther washing.

ANNEX 4-1Page 5
14. Future Development: Following development work by both the MDCand the German consultants over the last three years, proposals are beingcompiled for a further study into exploiting the underground reserves on alarge scale. Based on the preliminary exploration and survey of ore reserves,expansion potential has been assessed at 500 tons per annum each of tin andtungsten. Conceivably, a mine could be on-stream by the early to mid-1980's.This deposit would be worked directly by MC2 although current tribute opera-tions would still continue simultaneously at their present level on a portionof the reserves. Ore from an expansion project at the mine could be easilyupgraded at the proposed new Tavoy concentrator.
3. Kanbauk Mines
15. Background: Mining operations date back to 1911 when they werestarted by an expatriate mining company and continued as such until 1926.After this date, local companies participated in the mining venture until itwas nationalized in 1971. In 1974, following the completion of a UNDP-assisted exploration program, a gravel pump mine was established at Kanbankwith UNDP assistance and equipment. The UNDP facilities were handed over toMC2 in February 1975.
16. Tin, tungsten and a mixed ore concentrate comprise the mineralsproduced, which occur in alluvial placer deposits and as a primary minerali-zation in veins in the surrounding rock. Between 1967 and 1972, the MDCcarried out a pitting and boring program over approximately 2,000 hectares inthe vicinity of Kanbauk Mines. Based on this exploration work, reserves werecalculated. A subjective assessment of the recoverable ore content remainingin these reserves was done by Osborne & Chappel in 1975 and is the basis forthe figures in Table 1.
17. Existing Facilities: MC2 conducts hydraulic gravel pump operationsin the alluvial deposits, while tribute operations are confined to the primarylode mineralization. Some primitive ground sluicing operations are conductedby tributors during the wet season.
18. There are two upgrading plants at Kanbauk Mines. One, which aftertrials has never been used, was constructed by the UNDP at the time theydeveloped a third opencast mine on the Kanbauk reserves. The ex-UNDP planthas shaking tables for primary concentration with clean-up by lanchutes.Middlings containing refractory and magnetic minerals are to be separated in adry section comprising magnetic and H.T. separators. All equipment is new,and had not as yet been used by MC2 due to a shortage of equipment for thewater supply connection and some deterioration in supervisory control follow-ing the departure of UNDP personnel. The other plant treats primary palongconcentrates from the three opencast pits, including the ex-UNDP mine, andalso carries out, from time to time, some upgrading of the wolfram-ore producedby tributers in the Kanbauk area. Apart from magnetic separation, whereequipment is in poor condition and very antiquated, concentration in thisplant is by manual methods. All the primary concentrates from MC2's ownoperations are upgraded to selling grade in this plant. Tributors' productionconsisting mostly of wolfram-ore is usually upgraded at Tavoy before shipment.to Rangoon.

ANNEX 4-1Page 6
19. Future Development: Since the Kanbauk Mines are less than 10kilometers from the proposed shore complex for the Heinze Basin dredgingproject, the most reliable method of improving these mining operations wouldbe by complete integration of Kanbauk operations with those of the HeinzeBasin project. This would result in immediate improvement in infrastructure,
transportation, communication, workshop and mineral dressing facilities, andlabor skills, together with supervision by trained management from a strongbase. The concentrating facilities proposed for Heinze would be used toupgrade the rough concentrates from the palongs at Kanbauk mines. Integrationof Kanbauk mines with the Heinze Basin complex is further discussed in Annex5-1.
4. Kyaukmedaung Mine
20. Background: Intensive mining operations took place at this localityprior to the last war when three bucket ladder dredges were in operation.Dredging ceased in 1973 on apparent exhaustion of viable reserves. In February1972, it was decided to attempt gravel pump methods of mining and these havecontinued since that date. Mineral production consists of tin-ore occurringas an alluvial deposit. No information is available on the extent or grade ofremaining reserves.
21. Existing Facilities: Production is obtained from MC2 gravel pumpoperations and tributors. The MC2 mine consists of one pumping unit, groundcutting being effected by monitors. Tribute operations, such as groundsluicing, take place in the alluvial deposit as well as tunnels and adits inprimary deposits occurring in the neighbouring hills. These operationsproduce tin and mixed tin/tungsten concentrates. Since no mechanized equipmentis available, processing of MC2's gravel-pump mine palong concentrates andtributors' production consists solely of lanchute washing and drying. Finalseparation is carried out in Tavoy.
5. Nanthilar Mine
22. Background: Small scale operations have taken place at this locality
for some years, and in 1970 the mine came under the jurisdiction of theMineral Development Corporation. Mineral production consists entirely of tinoccurring as a primary deposit associated with iron and copper sulphides. Thedeposit consists of widely irregular veins and lenses. One assessment ofworkable reserves was attempted when approximately 600 feet of explorationtunnels were driven. This survey, however, was inconclusive and MC2 proposesconducting an extensive review of reserves in the near future. Productionwill be temporarily halted while the deposit is being further investigated.
23. Existing Facilities: Current production is confined to one MC2-operated mine utilizing adits and drifts from the surface. The ore is roastedto remove pyrite. There are no records of equipment installed, and furtherprocessing is apparently entirely manual.

ANNEX 4-1Page 7
6. Yadanabon Mine
24. Background: The mine commenced operations in the early 1950's andwas eventually taken over by the Burmese Government in 1954. Mineralisationoccurs as an alluvial placer deposit with wolfram, the main ore, being assoc-iated with bismuthinite, monazite and pyrite. Ore reserves are not known andhave not yet been assessed.
25. Existing Facilities: There are three actual working sites utilizingconventional gravel pump methods, working in conjunction with palongs. Pre-blasting is resorted to in exceptionally hard ground which is then cut bymonitors. The treatment plant contains a shaking table, magnetic separatorand vibrating screen. Due to its remote location the plant was not visited byOsborne and Chappel and no comment can be made on the condition of its equipment.
7. Heinze Basin
26. A UNDP study team carried out a comprehensive boring program overthe whole area between 1971 and 1974 and the reserves were valued in thesubsequent feasibility study carried out by Osborne & Chappel in 1975. Detailedinformation on the proposed project for the Heinze Basin is given in Annex5-1.
8. Mawchi Mine
27. Background: Production at this mine commenced in 1915, and in thepre-war period it was one of the world's largest primary lode producers oftungsten. In 1939, production reached over 3,000 LTPY of tin concentrates andover 2,700 LTPY of tungsten concentrates. The mine operated throughoutthe Japanese occupation, but production ceased altogether in 1949. In1963, the Government established a joint venture company with the originalowners and took over operational control. Administration eventually passed tothe Mineral Development Corporation in 1962.
28. Mineralization is associated with black mica, tourmaline, calciteand quartz veins. Cassiterite, wolfram and scheelite are the chief oresproduced. There are numerous mineral veins--70 separate veins have beenidentified. The reserves remaining in the Mawchi Mine were assessed bya team from the USSR between 1969 and 1974. The ore presently being workedby the tributors, from whom almost all current production is now derived,is recovered from the vicinity of the old Mawchi Mine. Such productionis thus outside the stated reserves given in Table 1.
29. Existing Facilities: Current production is obtained largely fromtribute operations. Conventional underground methods are utilised usingshrinkage stopes in the extraction process. Because of the security situa-tion, it was not possible for Osborne & Chappel or IDA staff to vist Mawchi,and no detailed comments are available on the concentrating facilities at themine site or on the condition of installed plant. However, from discussion

ANNEX 4-1Page 8
with MC2 officials, it was ascertained that a large mill was built at themine before World War II. This mill incorporated gravity and flotationcircuits for the production of bulk mixed concentrates. Apparently, nomagnetic or high tension separation facilities ever existed, and mixed con-centrates of cassiterite, wolfram and scheelite components are sold withoutfurther treatment.
30. Future Development: A Soviet technical aid mission commencedinvestigations in 1969 to assess the feasibility of a full scale rehabilita-tion program and to recalculate ore reserves. Due to insurgency problems,this aid program was terminated in January 1974 and the program of rehabilita-tion temporarily suspended. The proposed rehabilitation program envisaged atotal output of 1,000 tons per annum, 500 tons from the mine and 500 tons fromtribute operations. It further envisaged the progressive replacement ofsome existing equipment such as crushers, hydrosizers, ventilation equipment,battery locomotives and mine cars and an immediate upgrading of the hydro-electric plant with the installation of new turbines, generators and trans-formers. Mlore experienced technicians were also called for and it was sugges-ted that the existing mill equipment needed immediate replacement. Thisprogram could be resumed if insurgency problems were brought under controland new financing found. While the timing of this is uncertain, the Corporationis hopeful, and there have been recent indications that the security situationmay be improving.
9. Miscellaneous Gravel Pump Reserves
31. A multitude of small operations were carried out in the past,but only a few of these are currently in operation. From historic records,MC2 have tentatively identified about six separate accessible areas wheremining could commence using vertical gravel pumps. It is believed that thereare sufficient reserves for ten pumps to be installed and that these wouldgive a total annual production of 500 tons of tin-ore and/or wolfram. Thetotal reserves were assessed at 17,000 tons (Table 1). While Osborne &Chappel were unable to substantiate these figures, there is no reason to doubtthat MC2's report fairly reflects the potential of these reserves. A limitedstart to recommencing gravel pump operations at one or two of these potentialsites forms part of the proposed project (Annex 5-1).
10. Offshore Areas
32. An offshore exploration project is currently in progress in theMergui Area. This has a good chance of success, as the prospecting areais a logical extension of tin-bearing areas worked in Thailand. Osborne &Chappel consider this project, which is UNDP financed, well-conceived andsuccess would add a new source of ore and provide a logical extension to theHeinze Project, as the area of likely mineable deposits are at moderate depthsin sheltered areas. It will probably be at least late 1977 before firstindications of potential are known, although sonar soundings have identifiedpromising areas.

ANNEX 4-1Page 9
C. CONCENTRATING FACILITIES
1. Facilities at the Mine Sites
33. As described in the previous section, existing tin/tungsten concen-trating facilities at the mine sites are generally primitive with only aminimum of mechanization. Equipment is antiquated and often in poor runningorder. The only new equipment available is that installed under a UNDPproject at Kanbauk (para. 18).
34. The equipment installed in existing plants consists of a varietyof driers, vibrating screens, magnetic separators, shaking tables and variouscrushing machines. MC2 presently uses only three shaking tables throughoutthe Tenasserim Division and nearly all gravity separation is performed manuallyin palongs, lanchutes or by panning. No attempt is made to remove sulphidecontaminants or refractory minerals from the concentrates, except possibly atNanthilar, where the flowhseet indicates the presence of a roaster for sulphideremoval. With regard to the Mawchi ores, no attempt is made to split themixed concentrates into tin and tungsten, and only the more penal contaminantsare removed.
35. The tributors upgrade their production on site to a minimum of65% tin-ore/wolfram content by rudimentary means. MC2's various mine treatmentplants act as purchasing and storage depots for tributors' production which isfurther upgraded at facilities at the mines or in Tavoy.
2. Other Concentrating Facilities
36. Tavoy Separation Plants: In addition to the concentrating facilitiesat the various mines, there are two up-grading plants in Tavoy which are usedto separate wolfram from cassiterite in the bulk concentrates produced byvarious mines in both the Tavoy and Mergui areas. Both plants are onlyconcerned with magnetic separation of wolfram-ore and other magnetic impuritiesfrom tin-ore. Feed to the separators is prepared using vibrating screens androll crushers when required. No gravity separation facilities are availableat either plant and all processing is carried out dry. Equipment at bothplants is very old (1930's vintage) and in poor operating condition. Combinedaverage throughput is 46 tons/month.
37. Rangoon Separation Plant: This plant treats Upper Burma concentratesand, occasionally, concentrates from Mergui. Equipment is in poor condition.Plant capacity is given as 25 tons/month, but it is used sporadically.
3. Future Developments
38. Due to antiquated and inefficient concentrating equipment, it isnot possible for MC2 to realize the full value of the ores currently produced.No financially viable case can be made for improving existing concentratingfacilities at the mine sites, or those at Tavoy and Rangoon. As a result, the
ANNEX 4-1Page 10
proposed IDA project includes a new centralized concentrator at Tavoy to treatall of MC2's production of tin, tungsten, and mixed concentrates. This isdescribed in detail in Annex 5-1.
D. TRANSPORTATION FACILITIES
1. Tenasserim Division
39. Tavoy (population 40,000) is one of the largest towns in the Tenas-serim Division and is considered the commercial center of the area. It isalso the administrative center of the Division.
40. Both the Kanbauk/Heinze and the Heinda/Kyaukmedaung/Hermyingyiareas are connected to Tavoy by road, part sealed and part dirt. The condi-tion of these roads is poor in places and, in the wet season, sections becomeimpassable for several days at a time due to flooding. Bridge loadings aregenerally restricted to 3 to 5 tons on roads in the Tavoy area with theexception of the bridges on the Tavoy to Heinda road where maximum permissibleloads may reach 10 tons. Washed concentrates from the Kanbauk, Hermyingyi,Heinda, and Kyaukmedaung areas are delivered to Tavoy by local bus. Delaysare frequent due to the necessity of organising a military escort for securityreasons. From Tavoy, concentrates are delivered to Rangoon by boat.
41. Connections between Tenasserim/Yadanabon and Tavoy are by sea, orby sea to Mergui and then by tar-sealed road to Tavoy. MC2 utilizes itsown schooner for collection of concentrates from Yadanabon. From here,concentrates are sent to either Tavoy or Rangoon for upgrading.
2. Mawchi/Pyinmana Area
42. Pyinmana lies on the main Rangoon-Mandalay railroad in the SittangRiver valley 350 kms north of Rangoon. The town is utilised as a localadministrative center by MC2 for the collection of tribute ores. To thesouth-east, at a distance of 160 kms, lies the mining center of Mawchi, asmall town lying just to the west of the Salween River valley.
43. Pyinmana is well served by both rail and road communication, andlies astride the main north-south rail and road links between Rangoon andUpper Burma. There are little or no restrictions on the type of vehiclesutilizing the road, the condition of which is generally good throughoutthe year. Rail connections are also excellent. Communications betweenMawchi and Rangoon are difficult only because of the security situation.The area is well served by a tar-sealed road. At present, the connectionbetween Rangoon and Mawchi is accomplished by a circuitous road/rail route,adding a further 500 kms to the journey.
Industrial Projects DepartmentNovember, 1976
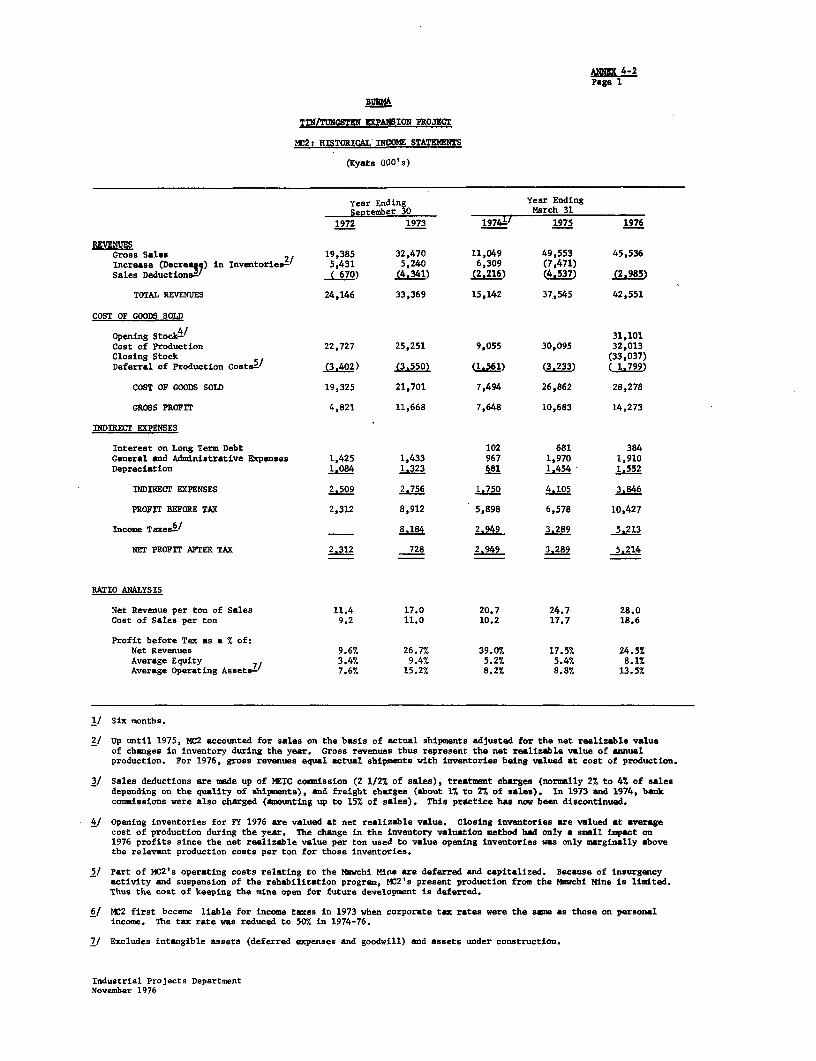
AiNN1X 4-2Page 1
BUSA
TIN/TUNG8TEN EXPANSION PROJECT
MC2: HISTORICAL INCOME STATEMT8
(Kyats 000's)
Year Ending Year EndingSeptember 30 March 31
1972 1973 19741- 1975 1976
REVENUESGross Sales 2/ 19,385 32,470 11,049 49,553 45,536Increase (Decrea3,) in Inventories- 5,431 5,240 6,309 (7,471)Sales Deductions-' ( 670) (4.341) (2.216) (4,537) (2.985)
TOTAL REVENUES 24,146 33,369 15,142 37,545 42,551
COST OF GOODS SOLD
Opening StockV' 31,101Cost of Production 22,727 25,251 9,055 30,095 32,013Closing Stock (33,037)Deferral of Production Costs5/ (3,402) (3.550) (1561) (3233) ( 1799)
COST OF GOODS SOLD 19,325 21,701 7,494 26,862 28,278
GROSS PROFIT 4,821 11,668 7,648 10,683 14,273
INDRECr EXPENSES
Interest on Long Term Debt 102 681 384General and Administrative Expenses 1,425 1,433 967 1,970 1,910Depreciation 1.084 1.323 681 1.454 1.552
INDIRECT EXPENSES 2.509 2.756 1.750 4.105 3.846
PROF1T BEFORE TAX 2,312 8,912 5,898 6,578 10,427
Income Taxes-6/ 8184 2,949 3-289 5 213
NET PROFIT AFTER TAX 22312 728 2.949 3.289 5 214
RATIO ANALYSIS
Net Revenue per ton of Sales 11.4 17.0 20.7 24.7 28.0Cost of Sales per ton 9.2 11.0 10.2 17.7 18.6
Profit before Tax as a % of:Net Revenues 9.6% 26.7% 39.07 17.5% 24.5%Average Equity 3.4% 9.47 5.27 5.4% 8.1%Average Operating Assets7/ 7.6% 15.2% 8.2% 8.8% 13.5%
1/ Six months.
2/ Up until 1975, MC2 accounted for sales on the basis of actual shipments adjusted for the net realizable valueof changes in inventory during the year. Gross revenues thus represent the net realizable value of annualproduction. For 1976, gross revenues equal actual shipments with inventories being valued at cost of production.
3/ Sales deductions are made up of NEIC commission (2 1/2% of sales), treatment charges (normally 2% to 4% of salesdepending on the quality of shipments), and freight charges (about 1% to 2% of sales). In 1973 end 1974, bankcommissions were also charged (amounting up to 15% of sales). This practice has now been discontinued.
4/ Opening inventories for FT 1976 are valued at net realizable value. Closing inventories are valued at averagecost of production during the year. The change in the inventory valuation method had only a small impact on1976 profits since the net realizable value per ton used to value opening inventories was only marginally abovethe relevant production costs per ton for those inventories.
5/ Part of MC21s operating costs relating to the Mawchi Mine are deferred and capitalized. Because of insurgencyactivity and suspension of the rehabilitation program, 1SC2's present production from the Mawchi Mine is limited.Thus the cost of keeping the mine open for future development is deferred.
6/ MC2 first became liable for income taxes in 1973 when corporate tax rates were the same as those on personalincome. The tax rate was reduced to 50% in 1974-76.
7/ Excludes intangible assets (deferred expenses end goodwill) and assets under construction.
Industrial Projects DepartmentNovember 1976
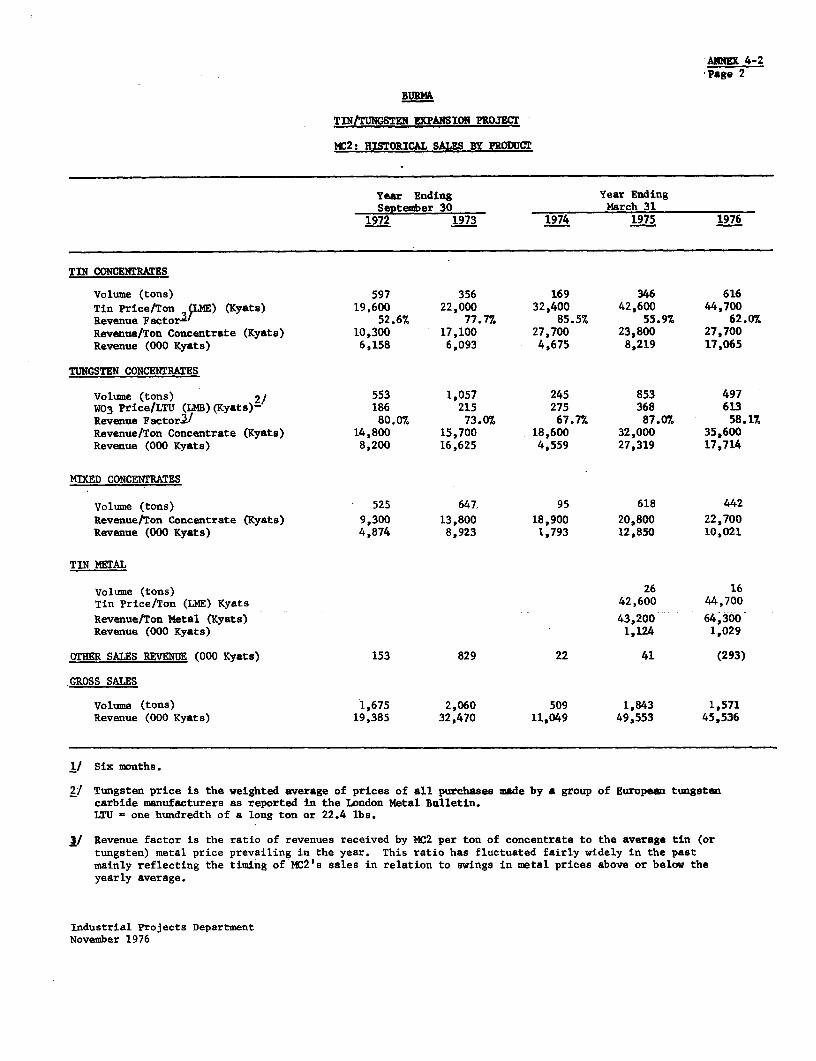
AM=EX 4-2Page 2
BURMA
TINITUNGSTEN PANSION PROJECT
MC2: HISTORICAL SAIES BY PRODUCT
Year Ending Year EndingSeptember 30 March 31
1972 1973 1974 1975 1976
TIN CONCENTRATES
Volume (tons) 597 356 169 346 616Tin Price/Ton (TLE) (Kyats) 19,600 22,000 32,400 42,600 44,700Revenue Factora! 52.6% 77.77% 85.5% 55.9% 62.07.
Revenue/Ton Concentrate (Kyats) 10,300 17,100 27,700 23,800 27,700Revenue (000 Kyats) 6,158 6,093 4,675 8,219 17,065
TUNGSTEN CONCENTRATES
Volume (tons) 2/ 553 1,057 245 853 497W03 Price/LTU (LMB)(Kyats)- 186 215 275 368 613Revenue Factorl/ 80.07% 73.0% 67.7% 87.0% 58.1%
Revenue/Ton Concentrate (Kyats) 14,800 15,700 18,600 32,000 35,600Revenue (000 Kyats) 8,200 16,625 4,559 27,319 17,714
MIED CONCENTRATES
Volume (tons) 525 647- 95 618 442
Revenue/Ton Concentrate (Kyats) 9,300 13,800 18,900 20,800 22,700Revenue (000 Kyats) 4,874 8,923 1,793 12,850 10,021
TIN MTAL
volume (tons) 26 16Tin Price/Ton (LME) Kyats 42,600 44,700
Revenue/Ton Metal (Kyats) 43,200 64,300Revenue (000 Kyats) 1,124 1,029
OTHER SALES REVENUE (000 Kyats) 153 829 22 41 (293)
GROSS SALES
volume (tons) 1,675 2,060 509 1,843 1,571Revenue (000 Kyats) 19,385 32,470 11,049 49,553 45,536
1/ Six months.
21 Tungsten price is the weighted average of prices of all purchases made by a group of European tungstencarbide manufacturers as reported in the London Metal Bulletin.LTU = one hundredth of a long ton or 22.4 lbs.
}/ Revenue factor is the ratio of revenues received by MC2 per ton of concentrate to the average tin (or
tungsten) metal price prevailing in the year. This ratio has fluctuated fairly widely in the pastmainly reflecting the timing of MC2's sales in relation to swings in metal prices above or below the
yearly average.
Industrial Projects DepartmentNovember 1976
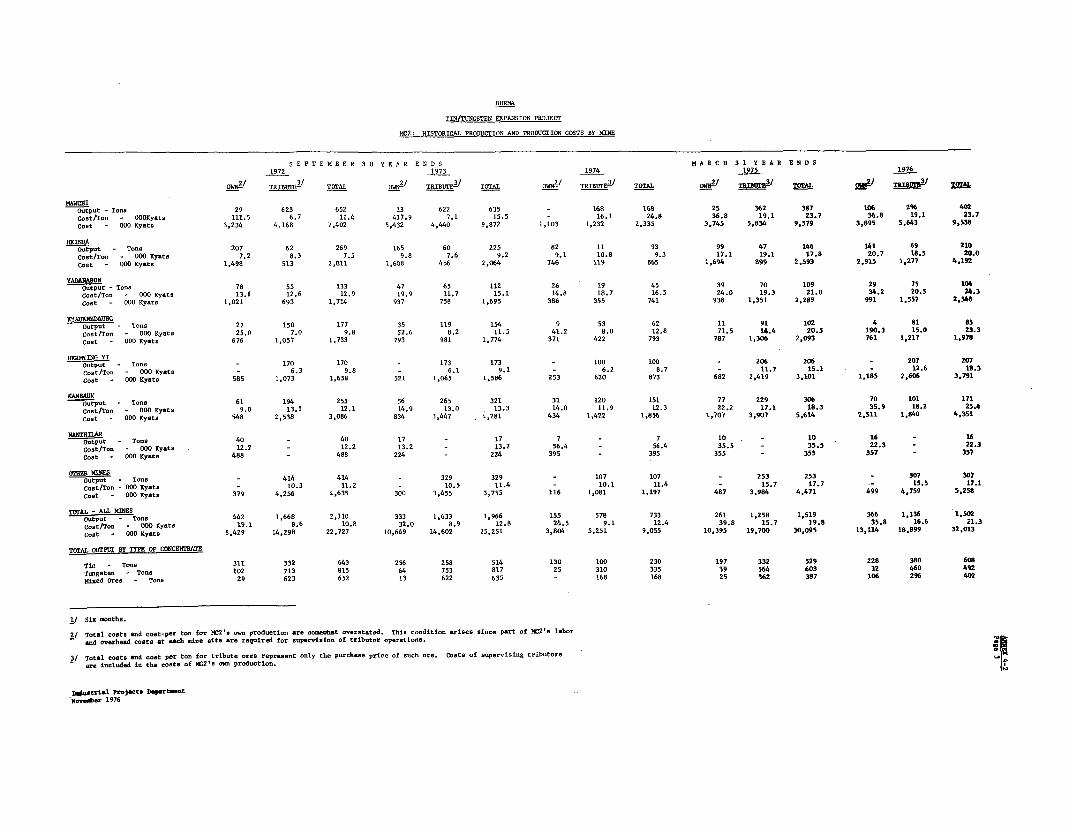
BURMA
TIN/TUNGSTEN EXPANSION PROJECT
MC2: HISTORICAL PRODUCTION AND PRODUCTION COSTS BY MINE
S E P T E M B E R 3 0 Y E A R E N D S M A R C H 3 1 Y E A R E N D s1972 1973 1974 1975 1976
OWN-/ TRIBUTE2/ TOTAL OWN1 / TRIBUEE/ TOTAL OWH-/ TRIBUTE-/ TOTAL CMI/ 2 1BUTE3 3/ T2AL 0WNt- TalIVIE3 TOL.
MAWCHIOutpuc - Toss 29 623 652 13 622 635 _ 168 168 25 362 387 106 296 402CoGt/TBB - 0OKyOst 111.5 6.7 11.4 417.9 7.1 15.5 - 16.1 24.8 36.8 19.1 23.7 36.8 19.1 23.7Cost - BO Kysts 3,234 4.168 7,402 5,432 4,440 9,872 1,103 1,232 2,335 3.745 5,834 9,579 3,895 5,643 9,538
Output - T.o. 207 62 269 165 60 225 82 11 93 99 47 146 141 69 210Cost/Ton - 000 Kyst 7.2 8.3 7.5 9.8 7.6 9.2 9.1 10.8 9.3 17.1 19.1 17.8 20.7 18.5 20.0Cost - 000 'ysts 1,498 513 2,011 1,608 456 2,064 746 119 865 1,694 899 2,593 2,915 1,277 4,192
YADANA&80NOutput - T... 78 55 133 47 65 112 26 19 45 39 70 109 29 75 104CBot/T05 - 000 Kysts 13.1 12.6 12.9 19.9 11.7 15.1 14.8 18.7 16.5 24.0 19.3 21.0 34.2 20.5 24.3Co.t - 000 Kysts 1,021 693 1,714 937 758 1,695 386 355 741 938 1,351 2,289 991 1,557 2,368
rLPJ3EUSAU%G
Output - T-nB 27 150 177 35 119 154 9 53 62 11 91 102 4 81 83Cost/Ton 000 Kyats 25.0 7.0 9.8 22.6 8.2 11.5 41.2 8.0 12.8 71.5 14.4 20.3 190.3 15.0 23.3Co,t - 000 Kysts 676 1,057 1,733 793 981 1,774 371 422 793 787 1,306 2,093 761 1,217 1,978
ERIIYING YIOutput - Too. - 170 170 - 173 173 - 100 100 - 206 206 - 207 207Cost/Ton - 000 Kysts - 6.3 9.8 - 6.1 9.1 - 6.2 8.7 - 11.7 15.1 - 12.6 18.3Cost - 000 Kysts 585 1,073 1,658 521 1,065 1,586 253 620 873 682 2,419 3,101 1,185 2,606 3,791
KAK8AUK
output - To.s 61 194 255 56 265 321 31 120 151 77 229 306 70 101 171Cost/Ton - 000 KySts 9.0 13.1 12.1 14.9 13.0 13.3 14.0 11.9 12.3 22,2 17.1 18.3 35.9 18.2 25.4Cost - 000 Ky-ts 548 2,538 3,086 834 3,447 4,281 434 1,422 1,856 1,707 3,907 5,614 2,511 1,840 4,351
NAXlTglLAROutput - Tons 40 - 40 17 - 17 7 - 7 10 - 10 16 - 16Cost/Too - DO 'ysts 12.2 12.2 13.2 _ 13.2 56.4 5 56.4 35.5 - 3535 22.3 - 22.3Cost - 000 Kysts 488 488 224 - 224 395 - 395 355 - 355 357 - 357
OYR oMIsNE8 414 414 - 329 329 - 107 107 - 253 253 - 307 307Cost/Too - 00 Kysts - 10.3 11.2 - 10.5 11.4 - 10.1 11.4 - 15.7 17.7 - 15.5 17.1Cost - 000 Kysts 379 4,256 4,635 300 3,455 3,755 116 1,081 1,197 487 3,984 4,471 499 4,759 5,258
Output -L ons 442 1,668 2,110 333 1,633 1,966 155 578 733 261 1,258 1,519 366 1,136 1,502Cost/To - 000 Kysts 19.1 8.6 10.8 32.0 8.9 12.8 24.5 9.1 12.4 39.8 15.7 19.8 35.8 16.6 21.3Cost - OGO 'ysts8,429 14,298 22,727 10,649 14,602 25,251 3,804 5,251 9,055 10,395 19,700 30,095 13,114 18,899 32,013
TOTAL OOTPUT BY TYPE OF CONCENTRATE
Tf1 - To.s 311 332 643 256 258 514 130 100 230 197 332 529 228 380 608Toog9tos - Tons 102 713 815 64 753 817 25 310 335 39 564 603 32 460 492Mixed Ores - Toss 29 623 652 13 622 635 - 168 168 25 362 387 106 296 402
1/ Six months.
2/ Totol costs sod nost-psr too for I2tOs o-s produotion sre so-hst ov-rstatod. This nooditlon srises sinco part of M21 labor- sod overhead costs at eoh sioe site Oro rsquired for supervision of tributor op-rstioos.
3/ Total .osts sod .oot per too for tributs oros repressnt only the purch-so pri4o of o.ch ore. Costs of oupeovisiof tributorsors i*oluded in the costs of SC2's o- production.
Isoftrisl Projects De"rt-stNov_bsr 1976

AMNEX 4-2
BURMA Page 4
TIN/TUNGSTEN EXPANSION PROJECT
M2: HISTORICAL BALANCE SHEETS
(Kyats 000's)
Saptember 30 M a r c h 3 11972 1973 1974 1975 1976
ASSETS
CIIRRENT ASSeTS
Cash and Bank 522 945 1,621 1,355 1,508Receivables 2,541 13,282 12,205 9,066 14,318Inventories
Mineral Oresel' 27,023 32,263 38,572 31,101 33,037
Supplies 7,712 9,662 11,246 i4,010 15,012Other ReceivablesaY __ 5.821 5.314
TOTAL CuRRENT ASSETS 37,798 56,152 63,644 61,353 69,189
FIXED ASSETS
Gross Fixed Assets-3 21,590 23,546 38,697 56,006 67,513Accumulated Depreciation 10.340 11.663 12.344 13,976 15.519
NET FIXED ASSETS 11,250 11,883 26,353 42,030 51,994
OTHER ASSETS
Deferred 1;xpenditures4' 8,736 12,286 13,847 18,580 20,759
GoodwillS 34,227 34.227 14.227 34.227 34.227
TOTAL OTHER ASSETS 42.963 46.513 48,074 52.807 54,98
TOTAL ASSETS 92,011 114,548 138,071 156.190 176,169
LIABILITIES & EQUITY
CURRENT LIABILITIES
Accounts Payable 5,829 5,743 5,190 915 1,112Income Paxes Payable _ 9.927 11.667
TOTAL CURRENT LIABILITIES 5,829 5,743 5,190 10,842 12,779
OTHER LIABILITTIES61 2,214 2,243 2,243 2,243 2,243
LONG TERM DEBTZ/ 11,686 20,171 25,137
EQUIlTY
Retained Profits 7,062 7,790 10,739 14,028 19,242State Funds (Equity Capital)8/ 76.906 98.772 108.213 108.906 116,768
TOTAL EQUITY 83,968 106,562 118.952 122,934 136,010
TOTAL LIABILITIES & EQUITY 92.011 114.548 138,071 156,190 176.169
RATIO ANALYSIS
Current Ratio 6.5 9.8 12.3 5.7 5.4Debt/Equity Ratio 0:100 0:100 9:91 14:86 16:84
Average TurnoverReceivables 11.8 3.6 1.4 4.2 3.6Mineral Ores Inventory 1.6 1.1 0.9 1.1 1.0
1/ Inventories are valued at net realizable value 1972-75 and at average cost of production in 1976.
2/ Includes advances to employees and deposits with state agencies for telephone, insurance, customs duties, etc.
3/ Includes assets under construction; operating assets as of March 31, 1976 were about K25 million.
4/ Part of MC2's operating costs relating to the Mawchi Mine are deferred. Production at the mine is presentlylimited due to insurgency activities. Thus the cost of keeping the mine open for future development has beendeferred.
5/ Goodwill represents the excess of liabilities over assets acquired by MC2 fro. MDC in 1972.
i| Other liabilities represent asnunts owed by MC2 for nationalized mines (previously locally owned) taken over byGOB and transferred to the Corporation. It is unlikely this anount will ever be paid.
7/ Long term debt represents credits under the FRG loan for the Reinda Minie. Interest rate is 2½7.with principal repayable over 25 years cosmencing in 1980. The asount outstanding in Deutsche Marks has beenconverted to Kyats at the rate of 1DM - K 2.66
8/ As of March 31, 1976, MC2's balance with the UCF fund was converted to equity capital. This conversion hasbeen shown retroactively 1972-76 in the above Balance Sheet.
Industrial Projects DepartmentJanuary 1977
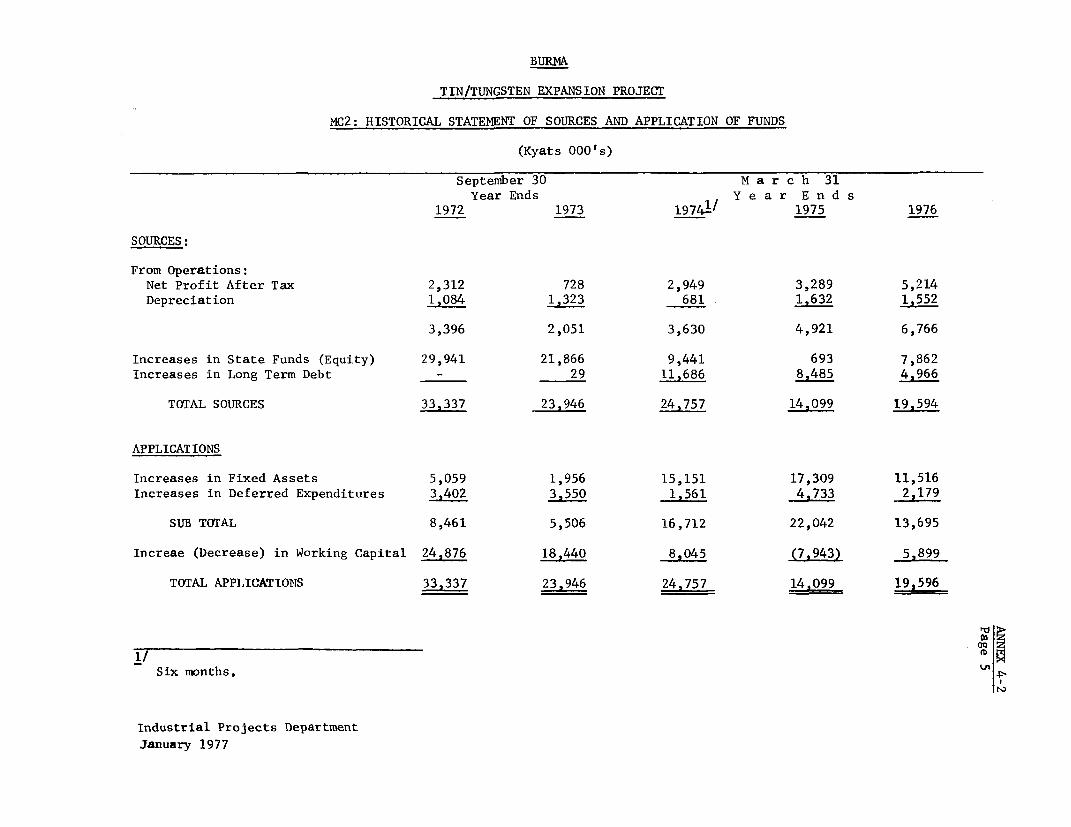
BURMA
TIN/TUNGSTEN EXPANSION PROJECT
MC2: HISTORICAL STATEMENT OF SOURCES AND APPLICATION OF FUNDS
(Kyats 000's)
September 30 M a r c h 31Year Ends Y e a r E n d s
1972 1973 19741/ 1975 1976
SOURCES:
From Operations:Net Profit After Tax 2,312 728 2,949 3,289 5,214Depreciation 1,084 1,323 681 1,632 1,552
3,396 2,051 3,630 4,921 6,766
Increases in State Funds (Equity) 29,941 21,866 9,441 693 7,862Increases in Long Term Debt - 29 11,686 8,485 4.966
TOTAL SOURCES 33,337 23,946 24,757 14,099 19,594
APPLICATIONS
Increases in Fixed Assets 5,059 1,956 15,151 17,309 11,516Increases in Deferred Expenditures 3,402 3,550 1,561 4,733 2,179
SUB TOTAL 8,461 5,506 16,712 22,042 13,695
Increae (Decrease) in Working Capital 24,876 18,440 8,045 (7,943) 5,899
TOTAL APPLICATIONS 339337 23,946 24,757 14,099 19,596
_ S
Six months. -n
Industrial Projects Department
January 1977

ANNEX 4-3Page 1
BURMA
TIN/TUNGSTEN EXPANSION PROJECT
NO. 2 MINING CORPORATIONORGANIZATION AND MANAGEMENT
1. The organizational structure of the Corporation is shown on page 3.Overall, MC2 employs some 2,700 persons and is composed of the followingmain divisions:
-------- Employees-------Head Office, Rangoon Officers Other Total
Administrative Division 6 53 59Accounts Division 5 42 47Production Division 10 57 67Planning and Projecting Division 8 29 37Engineering Division 7 114 121
Head Office Total 36 295 331
Mining Sites in the Districts
Heinda Mine 7 568 575Hermyingyi Mine 2 112 114Kanbauk Mine 3 192 195Kyaukmedaung Mine 4 37 41Nanthilar Mine 1 154 155Yadanabon Mine 5 185 190Mawchi Mine 14 689 703Other Mines 1/ ProjectPyinmana Region 1 43 44Tavoy Region - 3 3Mergui Region - 11 11
Gravel Pump Mines - 342 342
Mining Sites Total 37 2,336 2,373
Corporation Total 73 2,631 2,704
1/ Represents small mines worked by tributors who sell their ores to theCorporation.
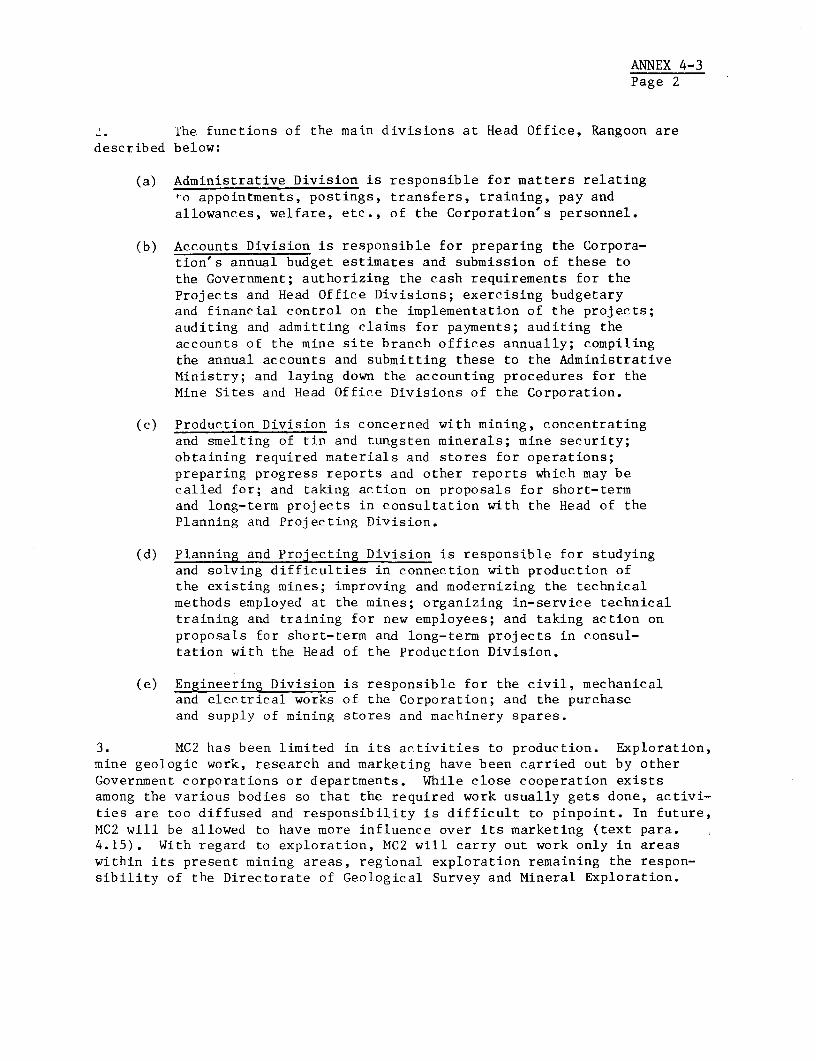
ANNEX 4-3Page 2
The functions of the main divisions at Head Office, Rangoon aredescribed below:
(a) Administrative Division is responsible for matters relating-o appointments, postings, transfers, training, pay andallowances, welfare, etc., of the Corporation's personnel.
(b) Accounts Division is responsible for preparing the Corpora-tion's annual budget estimates and submission of these tothe Government; authorizing the cash requirements for theProjects and Head Office Divisions; exercising budgetaryand financial control on the implementation of the projects;auditing and admitting claims for payments; auditing theaccounts of the mine site branch offices annually; compilingthe annual accounts and submitting these to the AdministrativeMinistry; and laying down the accounting procedures for theMine Sites and Head Office Divisions of the Corporation.
(c) Production Division is concerned with mining, concentratingand smelting of tin and tungsten minerals; mine security;obtaining required materials and stores for operations;preparing progress reports and other reports which may becalled for; and taking action on proposals for short-termand long-term projects in consultation with the Head of thePlanning and Projecting Division.
(d) Planning and Projecting Division is responsible for studyingand solving difficulties in connection with production ofthe existing mines; improving and modernizing the technicalmethods employed at the mines; organizing in-service technicaltraining and training for new employees; and taking action onproposals for short-term and long-term projects in consul-tation with the Head of the Production Division.
(e) Engineering Division is responsible for the civil, mechanicaland electrical works of the Corporation; and the purchaseand supply of mining stores and machinery spares.
3. MC2 has been limited in its activities to production. Exploration,mine geologic work, research and marketing have been carried out by otherGovernment corporations or departments. While close cooperation existsamong the various bodies so that the required work usually gets done, activi-ties are too diffused and responsibility is difficult to pinpoint. In future,MC2 will be allowed to have more influence over its marketing (text para.4.15). With regard to exploration, MC2 will carry out work only in areaswithin its present mining areas, regional exploration remaining the respon-sibility of the Directorate of Geological Survey and Mineral Exploration.
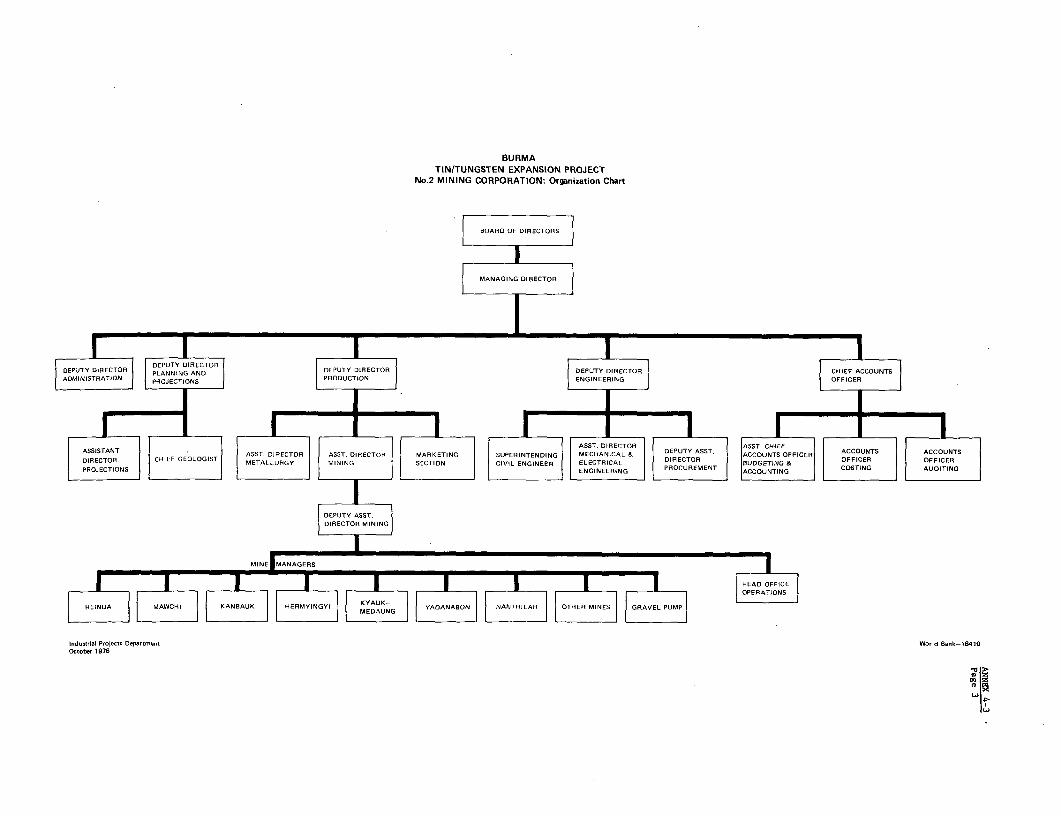
BURMATIN/TUNGSTEN EXPANSION PROJECT
No.2 MINING CORPORATION: Organization Chart
BOARD OF DIRECTORS
MANAGING DIRECTOR
DEPUTY DIRECTOR PLANNING AND DEPUTY DIRECTOR DEPUTY DIRECTOR CHIEF ACCOUNTSADMINISTRATION I PROECTLONS PRODUCTOND ENGINEERING OFFICER
ASST. DIRECTOR ASSTF CHIEFA ~~~~~~~~~ASST. DIRECTOR ASST DIRECTOR MARKETING SUPEFRNTENDN MECHANICAL & DIETRACCOUNTS OFFICER ACOFFICE ACOFFICE
DIRECTOR CHIEF GEOLOGIST METALLURGY MINING SECTION CIVIL ENGIN ELECTRICAL BUDGETING &IPROJECTIONS ENGINEERING ACUTN TNADTN
DEPUTY ASSTDIRECTOR MINING
MINE MANAGERS
A |WCH KANBAUK HERMYINGYI KAUK YANAO | NANTHIAR| OTE NES E UM
I.dusm.lAl PrO;er%S DeP.rtM"-t World BWnk-16410Outober 1976
L.a

ANNEX 5-1Page 1
BURMA
TIN-TUNGSTEN EXPANSION PROJECT
DESCRIPTION OF THE PROJECT
A. INTRODUCTION
1. The project aims at expanding production of tin through developmentof a dredging operation in the Heinze Basin. In addition, the quality ofexisting products will be improved through construction of a central concentratorin Tavoy to treat the output of all No. 2 Mining Corporation's (MC2) operations.Additional benefits are expected to be derived from improved control - produc-tion and financial, of the Corporation's operations. Integration of theadjacent Kanbauk mines in the Heinze Basin operation is an example of possibleimprovements. The proposed pilot gravel pump project will also serve to in-crease production substantially and yield high returns. A detailed descrip-tion of these three elements of the project follows below.
2. MC2, as with the remainder of the mineral sector, has suffered froma lack of capital investment. This has, in large measure, been the key factorin the decline of mineral production in Burma over the past couple of decades.Another important factor has been the excessive government control in allaspects of corporate operations. This has led to a bureaucratic lethargy inthe Corporation; a pattern displayed by virtually all the government corpora-tions.
3. The trend to "commercialization" within state owned corporationsmakes it an appropriate time to attempt some improvement in operationsin the mineral sector. The exact form of this trend is not yet known, andthere are indications that it may represent additional controls on top ofwhat are already excessive controls. IDA's involvement in the project willimprove the possibility of influencing the trend to commercialization favor-ably. At worst, the project being considered stands on its own and shouldprovide reasonable benefits to the economy. With effective project implemen-tation and start-up assistance, MC2 has the resources to ensure reasonableoperation of the facilities. The terms of reference for this assistance arecontained in Annex 6-2.
B. HEINZE BASIN DREDGE
1. Background
4. The Heinze Basin is located some 300 km. south east of Rangoon,and 50 km. north of Tavoy, in the Tenasserim Division of Burma (see IBRDMap 12322). The Basin is a T-shaped estuary, with the southern sectionsome 25 km. in length. The more favorable tin deposits lay at the extremeend of this southern section, and in the Onbinkwin Chaung, off the mainestuary.
ANNEX 5-1Page 2
5. Access to the Basin may be obtained by surfaced road from Tavoy,or Ye 60 km to the north. However load limits on the bridges is usuallyconfined to 5 tons. Insurgent activity also discourages frequent use ofthese roads. The Basin is also accessible by sea during the non-monsoonseason. The limitations of surface access will require transport of heavyand bulk materials for the project by sea.
6. The climate is tropical monsoon, with the monsoon lasting fromMay to October. Rainfall during the monsoon usually exceeds 500 cm, whilerain is almost non-existent during the dry season.
7. Vegetation in the area is tropical. Mangrove swamps and low for-ested hills border the Basin. Secondary scrubland forests occur on the lowelevated hills near the coast. Some teak and other hardwoods are also found,together with numerous bamboo thickets.
8. A portion of the Heinze Basin was successfully dredged prior toWorld War II by a British owned company, Tavoy Tin Dredging Corp. In addi-tion, intermittent dredging operations were also carried out by Heinze BurmaTin Syndicate Ltd. west of the Basin near Onbinkwin. The latter operationwas terminated in 1952.
9. Subsequently, a UNDP financed, UN executed program undertook exten-sive borings in the Basin from 1972 to 1975. Following this, UNDP financedthe execution of a feasibility study for mining of the deposits. This studywas completed by Osborne and Chappel, a Malaysian consulting firm in mid-1975.
1. Geology and Ore Reserves
10. The deposit is almost entirely alluvial with some eluvial deposi-tion in the south-western areas. The alluvium has probably been derivedfrom the valleys south and west of the Heinze and Onbinkwin Chaungs. Thealluvium consists of free sandy wash interspersed with clays of varyingtenacity.
11. Tin values occur in both the free wash and clays. Higher tin val-ues are found to the south and west, the supposed sources of mineralization.However, the clays predominate in these areas, and become tougher in con-sistency. These clays adversely affect dredging throughput and recoveries.The tin mineralization is quite coarse, about 50% of + 52 mesh.
12. The previous dredging was centered on the junction of the Heinzeand Onbinkwin Chaungs. Boring by the U.N. identified certain limited areaswhich could be reworked. The economic values remain at a depth of about10 meters.
ANNEX 5-1Page 3
13. Mineable ore reserves in the Heinze Basin have been estimated at32.9 million cu.m. containing 0.20 kg/cu.m. of 76% tin concentrate. Therecoverable concentrate would therefore be 6,640 tons. The southern areacontains 13.9 million cu.m. with a grade of 0.31 kg/cu.m. The northern areacontains 19.0 million cu.m. at 0.12 kg/cu.m.
14. Rather than utilize conventional arithmetic averaging methods incalculation of ore reserves, Osborne and Chappel used a "Horizon Method"which considers volume recovery and value recovery. This type of approachhas wide acceptance for evaluation of alluvial deposits.
15. A correction factor ranging from 100% to 0% was applied to thevolume for bedrock configuration. Irregular bedrock, particularly wherelimestone is the bedrock, results in a tendency to overvalue the volume andvalue of tin-ore recovered. The correction factors are applied to successivehorizons below which bedrock is likely to be encountered. Slope correctionsmay also be applied where dredging depth is greater than 30 meters by reducingthe peripheral area factors in successive horizons.
16. Correction factors are also applied to tin values for each of thefour categories of ground types. Ninety five percent recovery is estimatedfor tin values in free sandy wash; 75% in soft clays; 25% in medium clays;and 0% in tough clays. Incorporated in these factors are allowances forlosses in recovery of fine grained tin in the jig plant.
17. In addition, the correction factor for physical assays as comparedto chemical assays was not applied. The effect would have been to increasetin-ore values by 8%. Losses in tin concentrator and other factors compen-sate for this correction, so that a net 2% increase might result. This netresult was not considered significant enough to apply.
18. A cut-off grade of 0.10 kg/cu.m. was used in the calculation ofore reserves. Anomalous values in the bore holes were corrected by weightaveraging values in adjacent areas.
19. The resultant ore reserve figures must be considered conservative.The corrections applied are appropriate for the type of deposits. The orereserves are sufficient for 19 years at the proposed rate of mining.
20. In addition to these ore reserves, there are large areas in theBasin which are presently sub-economic. These reserves contain 40 millioncu.m. with a grade of 0.05 kg/cu.m. While they are low grade their statusshould be kept under review during the life of the project.
3. Main Production Facilities
21. Mining: The proposal to use dredging as the mining method is afairly obvious one. Nonetheless, thorough site investigations and objectiveassessment of the technical data were undertaken in the selection of themining method.

ANNEX 5-1Page 4
22. Dredging enables 40% of the current economic reserves inthe Basin to be mined. Other methods, particularly in the deeper northernsection, could not achieve this extraction. Even in the shallower southernportion, extensive earthworks would be required for open pit methods. Thesecould not be justified economically.
23. Selection of dredge size was based on two main sets of factors,operational and economic. The operational factors were mainly conditionsapplicable to the locality. Stiff clays and mangrove swamps present in theBasin limit the minimum pontoon draught. Maneuverability of the dredge isalso a limiting factor within the constraints of the deposits in the Basin.In addition, the lack of dredging experience in Burma was a factor sincelarger dredges require a high degree of skill in operation and maintenance.As a result of this assessment of operational factors, the maximum size dredgewas considered to be with 0.43 cu.m. buckets and the minimum 0.17 cu.m.buckets.
24. Within these operational limits, an economic study was undertakenon four different dredge sizes. Combinations of two different sized dredgeswere also examined.
25. Such factors as reserves mined, capital costs, operating costs,and net cash flow were determined for each alternative. The smaller dredgecould not mine at depth in excess of 12 m., reducing the reserves. Thelarger dredge could not negotiate the shallower ground, also reducing thereserves. As a result, the 0.35 cu.m. dredge was shown to be the optimumsize.
26. The dredge selected would be a conventional bucket line dredgewith 0.35 cu.m. buckets and a jig treatment plant. The dredge would havethe capacity to dig to 16 m. during the first eight years operation in theshallower southern portion. In this area, a draught of 2.3 m. would benecessary, as well as wide pontoons and a low profile to ensure stability.The dredge would be modified in year nine to adapt it for operation in thedeeper northern portion of the deposits. The main modifications would beextension of the pontoons and ladder to increase the digging depth to 27 m.At the same time, an overburden chute and scuttle wouldbe installed tofacilitate overburden removal.
27. The dredging sequence has been carefully selected to maximize tothe extent possible the present value of the cash flow. The higher gradesouthern portion is mined in the earlier years.
28. Annual production is estimated at 1.4 million cu.m. in the earlyyears increasing to 2.0 million cu.m. after the tenth year of production,as shown in Table 1. These production estimates are 51% and 74% of theoret-ical capacity, respectively. The lower production in the first two yearsis due to operator inexperience and dredging conditions. From the thirdyear of production through to the ninth year production varies from 1.6 to1.8 million cu.m. depending on the dredging conditions. The production esti-mates reflect the operating conditions and other factors. They are consideredto be realistic.
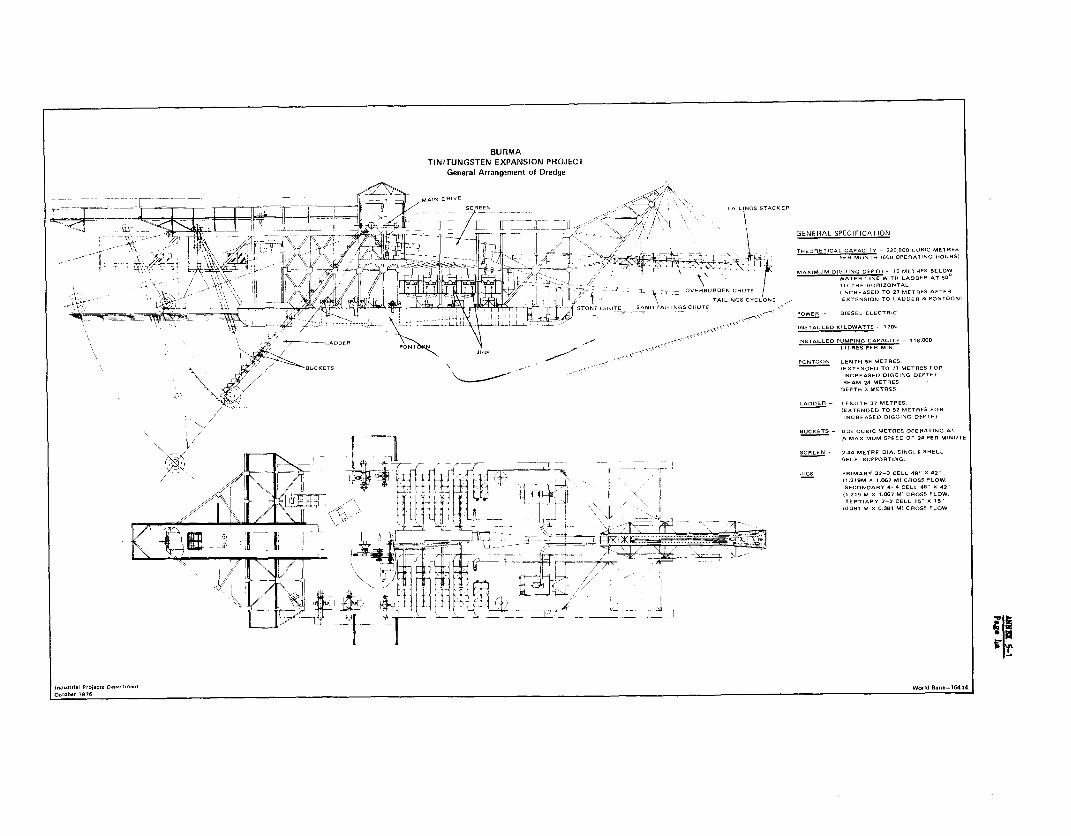
BURMATIN/TUNGSTEN EXPANSION PROJECT
General Arrangement of Dredge
MAIN DRIVE
:S"5 S 0C SE TLGS STACKERis
GEN \ L ADDER <, JIGS / r;~>t>' INSTAL SPECIFICATIONT I,
T -GS X i j
6 K T H EO R E T IC A L C A P A C IT Y S d MC IC E T R
-- .2 7> lI/t# MAITMOM DIGGING DEPTH - 1E MR B.1 W~~~~~~~~~~~~~~~~~~~~~~~~~~~~~~~~~~~~ATER LNE WIT. LARDER AT SO'
-T r IT/ (I N C R E A S E D T O 2 M E =T S D E T ETAILINGS CYCLONE .6 T -ETENSION TO LSHER O PER MOONUSTONE COTE SAN TAILINGS CHULTE~~~~~~ ~~~~~~~~~
.<~~~~~~~~~~~~~~~~~>Y ~~~~~~~~~~~~ POWER -- DIESEL ELECTIC.
INSTALLED KILOWATTS - 170R
.4 PORT Y~~~~~~~~~~~~~~~~~~~~~~~~T< I~~~~~~~~NSTALLED PUMPIINO CAPACI ST - 1 1R,DRR
ROCKETS ~~~~~~~~~~~~~~~~~~~~~~~~~~~~~~PONTOON -LENT. ISR METRES
lEATENOED 01 METRES FORINCREASED RIDGING DEPTO)BEAM 21 METRES Bn
LADDER - EN.RI. -7 METRES.IEATENCED TO 52 METRES I0
INCREASE DIGOIN.O DPTRI
ROCKETS a-..5 GORIG METRES OPERATING AT
A MA-IMOM RPEED OF D PER MNINTE
SCREEN 2.44METIRE DIA. SINGLE -HELLSELF- SOP P-1Y-d
T- I~~~~~~~~~~~~~~~IGS - PRIMARY 32-3 CELL 4R-AI1l2iRM x 1.12MI CRO-SS FLOW.SEENOART 4-4 CELL IR- 4`x 0,~~~~~~~~~~~~~~(.19 M R 1.W1162 -CRSS FOW.44 ~ ~~~~~~~~~~~~~~~~~~~~~~~~~~~~~~~TERTARY 2-2 CELL 15' X IN
I031 M 0 D31 CI ERSS ELOW.
OE1DSBE 111711 161614 RBRk-l
114 14~~~~~~~~~~~~~~~~~~~~~~~~~~~~~~~~~~~~~~~~~~WIdB.k161
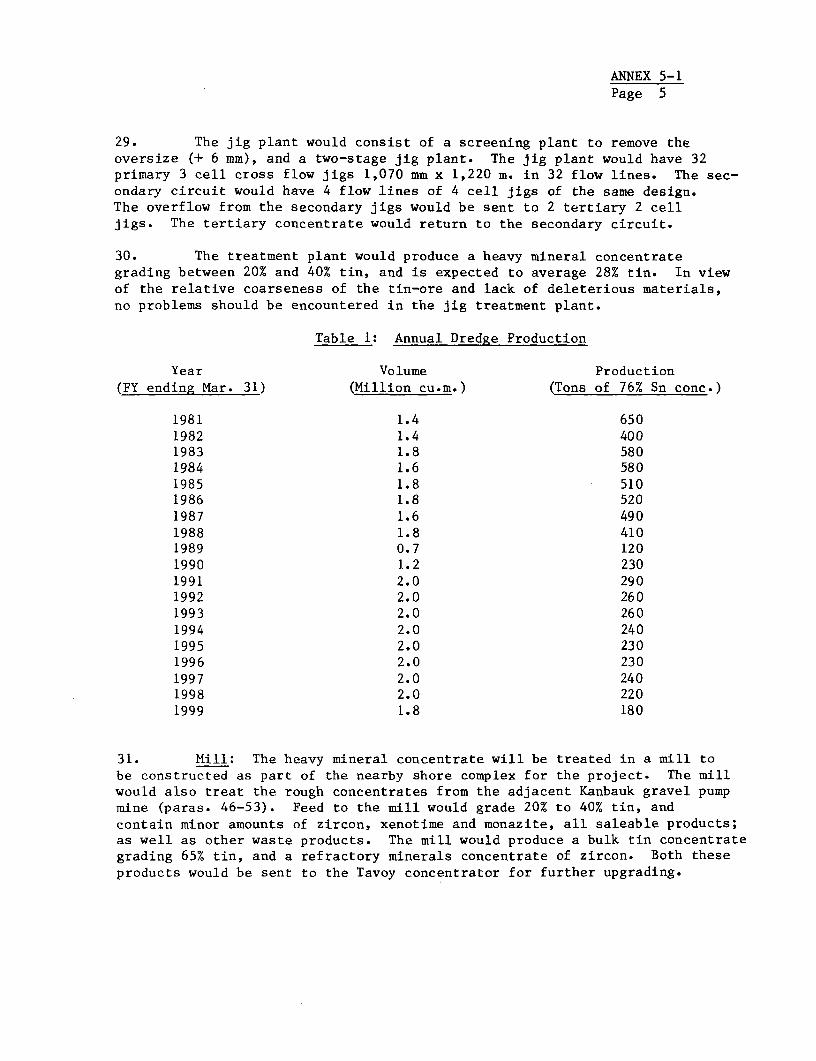
ANNEX 5-1Page 5
29. The jig plant would consist of a screening plant to remove theoversize (+ 6 mm), and a two-stage jig plant. The jig plant would have 32primary 3 cell cross flow jigs 1,070 mm x 1,220 m. in 32 flow lines. The sec-ondary circuit would have 4 flow lines of 4 cell jigs of the same design.The overflow from the secondary jigs would be sent to 2 tertiary 2 celljigs. The tertiary concentrate would return to the secondary circuit.
30. The treatment plant would produce a heavy mineral concentrategrading between 20% and 40% tin, and is expected to average 28% tin. In viewof the relative coarseness of the tin-ore and lack of deleterious materials,no problems should be encountered in the jig treatment plant.
Table 1: Annual Dredge Production
Year Volume Production(FY ending Mar. 31) (Million cu.m.) (Tons of 76% Sn conc.)
1981 1.4 6501982 1.4 4001983 1.8 5801984 1.6 5801985 1.8 5101986 1.8 5201987 1.6 4901988 1.8 4101989 0.7 1201990 1.2 2301991 2.0 2901992 2.0 2601993 2.0 2601994 2.0 2401995 2.0 2301996 2.0 2301997 2.0 2401998 2.0 2201999 1.8 180
31. Mill: The heavy mineral concentrate will be treated in a mill tobe constructed as part of the nearby shore complex for the project. The millwould also treat the rough concentrates from the adjacent Kanbauk gravel pumpmine (paras. 46-53). Feed to the mill would grade 20% to 40% tin, andcontain minor amounts of zircon, xenotime and monazite, all saleable products;as well as other waste products. The mill would produce a bulk tin concentrategrading 65% tin, and a refractory minerals concentrate of zircon. Both theseproducts would be sent to the Tavoy concentrator for further upgrading.

BURMATIN TUNGSTEN EXPANSION PROJECT
HEINZE BASIN CONCENTRATORIDEALIZED FLOWSHEET
HEAVY MINERALCONCENTRATEFROM DREDGE
STORAGE
~YBIN
2 SCREEN
MAGNETITEITO TAILINGS) MGEI
)S EPAR ATOR
XSCREEN
- w t ~~~~GRINDING
1 4M~~~~~~ILL
TABLES
_ _ _~~~~-0 TAILINGS
WILLOUGHBYBOX
DEWATERINGCONE
DEWATERINGCONE
DRYER
DRYER -0 tELECTROSTATIC
PRECIPITATOR
HI-TENSION - N ILMENITEMAGNETICSEPAAATOR
TIN REFRACTORYCONCENTRATE MINERAL
CONCENTRATE
World Bank-16415Industrial Projects DepartmentOctber 1976
ANNEX 5-1Page 6
32. The flowsheet for the mill would consist of initial screening toremove the oversize (+10 mesh) waste. This wou:Ld be followed by a magneticscalper to remove the small amount of magnetic minerals in the ore, mostlymagnetite. The ore will then be classified and treated on Wilfey tables toproduce a tin rich concentrate, a middling product, and sand waste. The tinconcentrate, grading 65% Sn, would pass through a fresh water wash, and thenwould be dewatered, and dried.
33. Then it would be treated on high intensity magnetic separators.The non-conducive portion would be the refractory mineral concentrate, mostlyzircon. The conducive portion would be treated on a twin disc magnetic sepa-rator to remove ilmenite. The non-magnetic portion would then be combinedwith the concentrate. Both the tin and the refractory concentrate would be
sent to Tavoy for further upgrading.
34. The mill flowsheet has been thoroughly tested by the consultants,Osborne and Chappel. This type of ore is quite common in South East Asia,and the flowsheet is conventional for the ore. The equipment proposed isstandard and widely used in alluvial tin concentrators.
4. Industrial and Social Infrastructure
35. The total lack of infrastructure in the Heinze Basin requires thatextensive facilities be supplied for the project. The remote location alsodictates a need for complete facilities, particularly in terms of maintenanceand support facilities.
36. Dredge Support will be provided by several water craft. The majoritem is a 450 c.v. tugboat which will provide assistance during importantmoves of the dredge, movement of barges, and transshipment of oil and othermaterials. The tug will be sea-going and capable of emergency trips toRangoon for spares. A 70 c.v. workboat will be responsible for movementof all barges in the Heinze Basin, particularly to and from the dredge.Three 30 c.v. personnel boats with a capacity of 25 people each will assurepersonnel movement. Also included will be 3 - 20 ton tin-ore barges formovement of concentrate from the dredge to the shore complex; four 55,000litre capacity oil barges; and one 20 ton capacity material barge.
37. Power for the dredge will be supplied by five on-board dieselgenerator sets each rated at 345 KW. Four generators will meet normalpower requirements of the dredge with the fifth set acting as a spare.The spare will be able to operate independently in case problems occur onthe common electrical bus-bar or synchronising gear. Total installed poweron the dredge will be 1,650 KW. The power requirements while operating onore are estimated at 1,015 KW.
38. Electrical energy for the shore complex will be supplied by one345 KW diesel generator, the same size units as will supply power on thedredge, plus an auxiliary 150 KW generator. Total estimated power load forthe shore complex is 330 KW.
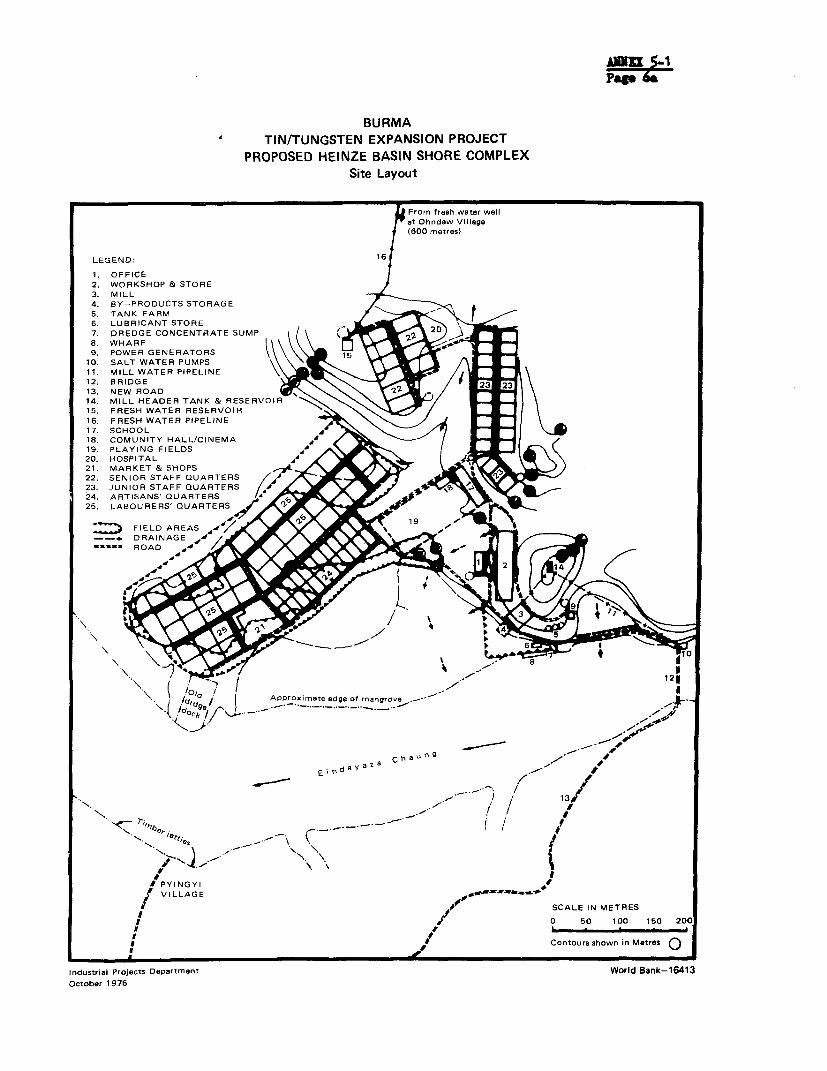
Pag 6&
BURMATIN/TUNGSTEN EXPANSION PROJECT
PROPOSED HEINZE BASIN SHORE COMPLEXSite Layout
From fresh water wellat Ohndaw VillageI600 metres)
LEGEND: 16
1. OFFICE2. WORKSHOP & STORE3. MILL4. BY-PRODUCTS STORAGE5. TANK FARM6. LUBRICANT STORE7. DREDGE CONCENTRATE SUMPS. WHARF9. POWER GENERATORS10. SALT WATER PUMPS11. MILL WATER PIPELINE12. BRIDGE13. NEW RO0AD14. MILL HEADER TANK & RESERVOIR "'.\
15. FRESH WATER RESERVOIR \16. FRESH WATER PIPELINE17. SCHOOL 4\/ 5 18. COMUNITY HALL/CINEMA19. PLAYING FIELDS20. HOSPITAL21. MARKET & SHOPS22. SENIOR STAFF QUARTERS A23. JUNIOR STAFF QUARTERS A24. ARTISANS' QUARTERS 4
25. LABOURERS' QUARTERS p,"'
FIELD AREAS-. DRAINAGE 4-
ROAD
1\~~~~~~~~~~~~~~~~~~~~~~~~~~~~~~2\\ ( !oi<, ApProximate edge of rnangroue--'
el ------- ,d5V az5
C' -
I PYINGYIVILLAGE --------
t # SCALE IN METRESI 1+ 0 50 100 150 200
I 8 Contours shown in Metres o
Industrial Projects Department World Bank-16413October 1976
ANNEX 5-1Page 7
39. Direct driven diesel generators and pumps would be the power andwater supply for Kanbauk. This would replace the antiquated hydro plant. Theexisting dam will be used as a water supply for the gravel pump operations.Since most of the mining equipment is diesel operated, power requirements forKanbauk are quite low.
40. Water for the mill will be sea water from the Chaung. The millrequires the bulk of the water requirements. The final portion of the wetcircuit in the mill will be a fresh water wash. Fresh water for the socialinfrastructure will be supplied from wells at Ohndaw 0.6 km. from the shorecomplex.
41. Industrial infrastructure will also include workshops, offices,and a warehouse. The workshops would be capable of performing all routinemaintenance for the dredge, mill, and auxiliary shore plant. There willbe five main sections in the shops:
(a) Automatic welding shop(b) Machine shop(c) Sheet metal working shop(d) Motor transport and diesel repair shop(e) Electrical maintenance shop
42. The automatic welding shop would be capable of extensive rehabil-itation of the dredge heavy wear parts. Bucket bases, pins and tumblers,and ladder rollers would all be rebuilt in the shop.
43. The workshop would not carry out heavy engineering, or special-ized electrical rewinds. These would have to be carried out in Rangoon,or elsewhere, if required.
44. A new town will be constructed close to the shore complex. Thistownsite would include 237 houses for all the employees. All houses willbe provided with electric, water, and sanitary facilities, and built tostandard Government designs.
45. The townsite will also include a school for 200 children, a com-munity hall/cinema, a sixteen bed hospital, a market, and playing field.
5. Integration of Kanbauk Mine
46. The existing Kanbauk gravel pump mine is described in Annex 4-1.Operational performance results has been poor. Constraints on the operationsinclude: lack of water for sluicing and for power generation; lack of effectivemaintenance on the hydro-electric station, water supply pipelines and flumesand other plant and equipment; and lack of investment in all phases of theoperation. Labor supply has also been a problem owing to the seasonal natureof the operations. As a result, the mine has produced less than a third ofthe output of a comparable operation elsewhere, given the same conditions.

ANNEX 5-1Page 8
47. Integration of the operation with the Heinze Basin project shouldincrease output substantially with a minimal investment cost. The benefits,in effect, would be derived more from improved operational control. Theinfrastructure, workshops, mill, and particularly supervision of the HeinzeBasin project could all be effectively used for the Kanbauk mine.-
48. Recoverable ore reserves in the gravel pump mine are estimated at3,400 tons of cassiterite. At the projected rate of output, these would besufficient for 17 years operation. The average grade of the reserves is ofthe order of 0.31 Kg./per cu.m.
49. A considerable amount of Banka drilling and test pitting was doneover an area of some 2,000 hectares by the Mineral Development Corporation(MDC) from 1969 to 1972. This work proved the existence and extent of thedeposit. However, additional work, including some check boring, will berequired to determine more accurately those reserves which are recoverable.The Mineral Development Corporation did not attempt to separate the reservesinto recoverable and non-recoverable. The recoverable reserves shown abovewere estimated by Osborne and Chappel from MDC's work. The estimate isbelieved to be conservative.
50. Mining is presently carried out in three pits, including one whichwas developed under a UNDP financed UN executed project. This UN projectwas undertaken to demonstrate more modern mining techviquer. Pir:-.-tion, asa result, was expanded from 40 tons to 100 tons per year. More importantly,the gravel pump operations are equipped with sufficient, satisfactorymachinery for the integration.
51. The UN project included a concentrator with shaking tables, Wil-loughby boxes, vibrating screens, magnetic separators, and high tensionseparators. Although the UN turned the concentrator over to the Corpora-tion, the Corporation has not operated it. The Corporation should utilizethis concentrator until required for the project. The equipment would thenbe incorporated into the Heinze Basin mill. Any equipment not required forthe Heinze Basin mill might be utilized in the Tavoy concentrator or else-where.
52. In order to improve the efficiency of Kanbauk operations, a smallamount of capital investment is required. The two key items would be im-provement of the supplies of electric power and water. Additional dieseldriven pumping and power capacity would be installed.
53. Improvement of the storage dam and pipeline would be required toprovide make-up water for the gravel pump mining. Since water for the miningoperation would be stored and recycled, only small quantities are requiredfor make-up.

ANNEX 5-1Page 9
B. CENTRAL CONCENTRATOR AT TAVOY
1. Background
54. MC2's concentrating facilities, as outlined in Annex 4-1, areantiquated and inefficient. As a result, most of the products the Corporationsells are sub-standard. These products sell at a substantial discount toprices for standard grade concentrates. This is particularly true for themixed tin-tungsten concentrates presently sold by the Corporation.
55. MC2 had prepared a proposal for construction of a small centralconcentrator at Tavoy, to permit production of clean tin concentrates. On thebasis of this proposal, the Bank undertook to finance a small study of variousalternatives open to the Corporation, and prepare a preliminary flowsheet forthe selected option. Osborne and Chappel Sdn. Berhad of Ipoh, Malaysia, thesame firm which prepared the feasibility study for the Heinze Basin project,was retained to undertake this study. The consultants carried out their studyfrom February to May 1976.
2. Alternative Studies
56. Concentrating facilities at each of the Corporation's existing andfuture operations were reviewed. For a number of reasons, it was not prac-tical to improve the Corporation's existing facilities. There are a largenumber of small operations which could not support modern concentratinginstallations. The existing facilities are too primitive to consider improve-ment. In addition, much of the Corporation s ore comes from tribute opera-tions, which are basically artisanal, or family operations.
57. As a first step in the study of possible alternatives, six pos-sible combinations of new plants were compared on a net present value basisof the required capital and operating cost expenditures. Since the increasedrevenue was the same for each of the combinations, such an approach is valid.As a result of this comparison, three of the combinations were eliminatedsince the net present value was 30% higher than for the other alternatives.
58. Therefore, three alternatives remained which merited more thoroughinvestigation. These alternatives were:
(a) A large central concentrator at Tavoy to treatall the Corporation's output.
(b) Concentrator as in (a) but sited at Rangoon.
(c) A concentrator at Toungoo to treat the mixedtin-tungsten ores from the Mawchi-Pyinminaarea; together with a smaller central concen-trator at Tavoy to treat all the productionin the Tenasserim area of Southern Burma.
ANNEX 5-1Page 10
59. Discounted cash flows were prepared for each of the three alterna-tives. All three yielded high rates of return. In alternative (c), theToungoo plant had a high return while the Tavoy plant had a return whichwas acceptable.
60. Justification could be made for selection of any one of the threealternatives. The economic rates of return were all within three percentagepoints. These central concentrators permit production of concentrates of aconsistent, high quality. A centralized concentrator would have a lowerinvestment cost per unit of throughput than the alternative of constructingnew plants at each of the Corporation's mines and collection points. Theoperating costs per unit of throughput are also lower, and more than offsetany increased transport costs. Better supervision and control is alsoachieved in a central plant.
61. The large central concentrator at Tavoy is considered to providesignificant unquantifiable benefits in addition to the high rate of return.The potential for increasing tin and tungsten production exists in theTenasserim division, of which Tavoy is the centre. The existence of a mod-ern concentrator could provide impetus for this development. The concen-trator could provide a strong base for coordinating and managing activitiesin the area. The close contact which the concentrator would have with theproducing mines would permit a measure of operational control over theseoperations. While the concentrator would be capable of treating all of theCorporation's output, sufficient flexibility remains to construct concentrat-ing facilities which might be required in development of new large mines.
62. A few disadvantages of a plant in Tavoy are evident. The plantin Tavoy requires its own power generating equipment, increasing the capi-tal costs slightly. In addition, exports of concentrates are at presentpermitted only from Rangoon. However, output of the plant would be suffi-cient to justify direct exports from Tavoy. The advantages of the plant atTavoy far outweigh the disadvantages; particularly if exports are permitteddirectly from Tavoy.
3. Description of Concentrator
63. The primary concentrating facilities available at the Corporation'svarious mines are satisfactory to upgrade production to 65% tin - wolframcontent. The tribute miners also upgrade their production to a 65% content.Upgrading to this level presents no undue problems, since removal of lightgangue minerals only is required. This practice would be continued afterstart-up of the central concentrator. Therefore, the feed to the Tavoyconcentrator would consist of a rough concentrate grading approximately65% heavy minerals.
ANNEX 5-1Page 11
64. The multitude of types and sources of these concentrates requirea fairly complex circuit in the concentrator to treat them effectively. Inaddition to a primary circuit for wolfram rich and mixed ores, a separateprimary circuit is provided for wolfram-free tin concentrates. Each ofthese two primary circuits is also equipped to dry those ores which arereceived wet; and for crushing coarse ores to permit liberation of the val-uable constituents.
65. In the wolfram circuit, following drying and crushing, the ore istreated by low intensity magnetic separators. The highly magnetic mineralsare removed and discarded. The ore is then screened into three size frac-tions to permit separate treatment of these fractions. The oversize (+10mesh or +2 mm) is returned to the crushers. The separate treatment of thethree size fractions is necessary because the mineral constituents of eachfraction differ requiring different treatment processes.
66. Following screening, the ore is treated on high intensity electro-static precipitators to split off the non-conductive portion. The conductiveportion is then treated on high intensity magnetic separators to split offthe tin ore from wolfram. The tin ore which is the non-magnetic product ofthe high intensity magnetic separators is recycled to various stages of thetin circuit for recovery.
67. The preliminary wolfram concentrate is then treated by wet gravityseparation on tables and then Willoughby boxes for clean-up. Following dry-ing, this product is further treated on high intensity magnetic separatorsto yield the final wolfram concentrate.
68. The tin circuit is essentially similar. Following drying, crush-ing and screening, the tin ore is also treated by high tension electro-staticprecipitators. The conductive portion passes directly to wet gravity sepa-ration on tables and then Willoughby boxes for clean-up. Following drying,this product is treated on high intensity magnetic separators to yield thefinal tin concentrate.
69. In addition to producing high quality wolfram concentrates andtin concentrates, the concentrator will also produce sheelite concentrates;and recover xenotime, monazite and zircon as by-products. The exact quanti-ties recovered of these by-products will, of course, depend on the sourceof the tin ore. The average content of these products in the tin ore feedis approximately 2.5%. These by-products will provide a small but signifi-cant revenue for the Corporation. These revenues have not been included inthe benefit streams for the concentrator.
70. The design of the flowsheet for the concentrator was based onpreliminary bench testing of ore samples collected by Corporation officialsand the Consultants. Mineralogical analyses were undertaken to determinethe mineral constituents of the various ores. In addition, screen analyseswere done on the samples to determine the distribution of tin, wolfram andother minerals in the different size fractions of the ores. The screenanalyses indicate that most of the mineral constituents are generally free,with what interlocking that does occur being generally confined to the plus10 mesh fraction.
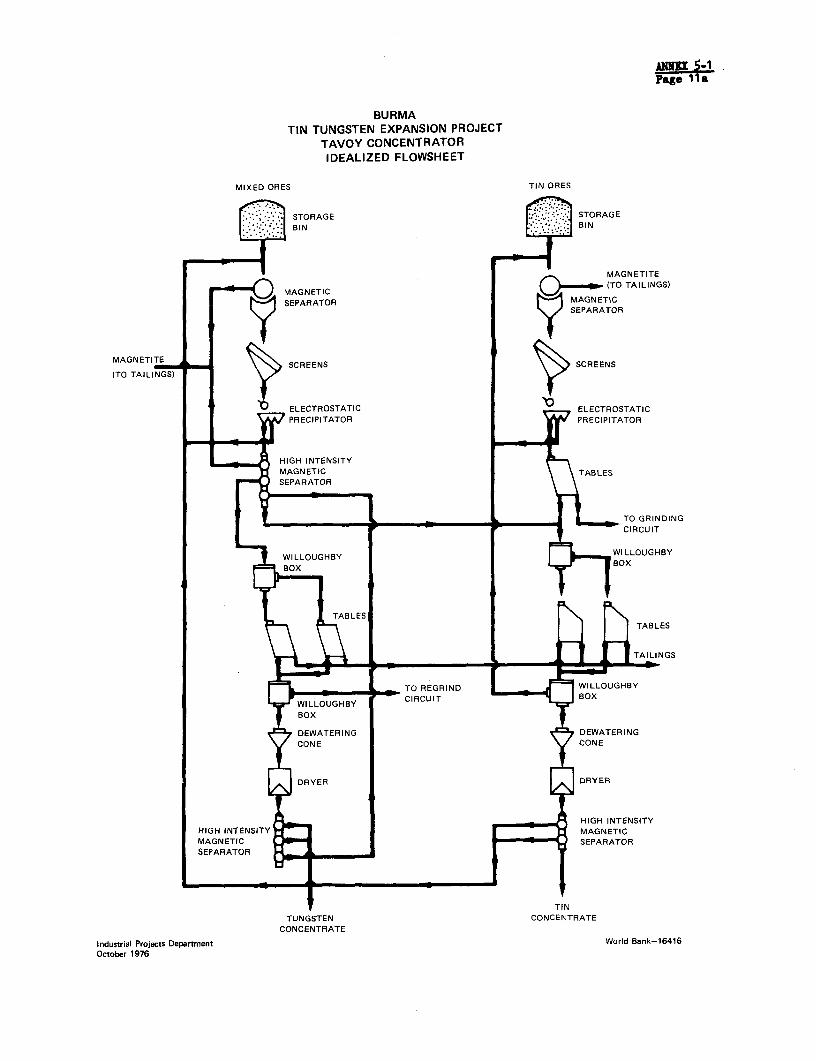
Page 1 a
BURMATIN TUNGSTEN EXPANSION PROJECT
TAVOY CONCENTRATORIDEALIZED FLOWSHEET
MIXED ORES TIN ORES
* STORAGE STORAGE
BIN B3IN
MAGNETITE
-- O MAGNETIC CQ-((TO TAILINGS)
SEPARATOR MAGNETICSEPARATOR
MAGN ETITE \X\ N MAGNETAILINGS _ \I) SCREENS \ SCREENSITO TAILINGS)rr
b ELECTROSTATIC ELECTROSTATIC
PRECIPITATOR PRECIPITATOR
HIGH INTENSITYMAGNETIC TABLES
SEPARATOR
TO GRINDING
7 ~~~~~~~~~~~~~~~WILLOUGHBY_rCIUT
WILLOUGHBY WLOGB
BOX BOX
i y~~ABLES > > TBE
W A n n ~~~~~~~~~~~~~~TAILINGS
W x _ _ ~~~TO REGRIND ._WILLOUGHBY
WI L H ~~CIRCUIT -BOX
BOX
DEWATERING DEWATERING
CONE CONE
DRYER DRYER
HIGH INTENSITYHIGH INTENSITY MAGNETICMAGNETIC SEPARATOR
SEPARATOR~~~~~~~~~~~~SPRAO
TUNGSTEN CONCENTRATE
CONCENTRATE
Industrial Projects Department World Bank-16416
October 1976
ANNEX 5-1Page 12
71. As a result of these tests, the main treatment phases were iden-tified. It is unlikely that any of the treatment phases will cause majordifficulties. However, further metallurgical testing will be required duringengineering design to confirm the ores' amenability to treatment by the pro-cesses proposed; and to verify that all identified treatment problems canbe overcome. The testing would also ensure selection of the most suitableprocessing equipment where alternatives are available. This additionaltesting is estimated to require 20 man weeks of work and cost US$20,000.
72. While additional metallurgical testing will be required, it isnot expected that the final concentrator flowsheet will differ appreciablyfrom the flowsheet prepared by the Consultant, and outlined above. The oresare similar to ores found elsewhere in South East Asia. The treatment pro-cesses proposed are commonly used for treatment of these ores. The equipmentproposed is standard and widely used in concentrators of this type.
4. Infrastructure
73. Selection of the specific site for the concentrator will be under-taken at the time of engineering design, with the assistance of the projectengineering firm. The Corporation has conducted a preliminary site investi-gation to narrow the choice of sites to three. This preliminary selectionconsidered, inter alia, the general specifications outlined below. A finalsite will be chosen with the consultants' assistance and acquired as acondition of credit effectiveness.
74. General specifications for the site require a land area of 0.5hectares with a slight slope, ideally I in 5. In addition, 5 to 6 hectaresof adjacent ground would be needed for tailings disposal, and water storageand recirculation. A source of fresh water is also necessary.
75. Water requirements for the concentrator are estimated at 12,000litres per minute. The water should be fresh water, and it must be neutral.With a suitable site and retention dams, some 80% of the water requiredcould be recirculated. The make-up water required would be 2,500 litresper minute.
76. Electrical energy requirements for the concentrator cannot bemet by the Electric Power Corporation with existing facilities in Tavoy.The diesel generating plant, with a total capacity of 868 KW, does notmeet existing needs. In view of this, independent power generating facil-ities have been included in the project. Two 345 KW diesel generators, thesame type specified for the Heinze Basin, will provide power. Estimatedrequirements are 613 KW maximum, and 368 KW normal usage. The two gen-erators would have the capacity to supply the plant on full load and wouldhave sufficient spare capacity for possible additions or alterations tothe plant. Two units are utilized rather than one since it permits stan-dardization with the Heinze basin, and enables the plant to operate, albeitat reduced capacity, if one unit breaks down.
ANNEX 5-1Page 13
77. Transport facilities (trucks) are required to carry the concentratesof the various mines to the central concentrator. These trucks would alsotake the clean concentrates to the shipping point. Since no adequate alter-native seems to exist in Tavoy (loel buses are presently used), 5 six-tontrucks have been included in the project.
78. Export of the clean concentrates would be on small schooners whichregularly serve Rangoon, if present practice is maintained. However, thevolume of output from the plant at Tavoy would be sufficient for coastalvessels to call at the port of Tavoy. Establishment of a monthly serviceto the tin smelters at Phuket in Thailand or Penang in Malaysia should befeasible.
C. PILOT GRAVEL PUMP PROJECT
1. Background
79. As indicated in Annex 2, the mineral sector in general and tin-tungsten mining in particular are operating considerably below their poten-tial. Production in 1938/39 of over 10,000 tons of tin and tungsten hasdeclined to only 1,500 tons in 1975/76. Whereas before the war, 6 dredgeswere operating, there are none now; and whereas there were 21 gravel pumpoperations, there is only I now.
80. While the Heinze basin project would provide a basis for restor-ing dredging in Burma, a pilot gravel pump could be the first stage of re-building production from those deposits suitable for gravel pumping. Themodest scale recommended for this pilot project recognizes the constraintsimposed by the available managerial and technical know-how, capital invest-ment, and insurgency.
81. The Corporation prepared a preliminary study from historicalrecords on gravel pump mining. Records are still available from some ofthe earlier operations, although in many cases they are incomplete. Theserecords have served to indicate some seven separate areas with high poten-tial. These areas would include the following locations: Wagon, Kalonta,and Phachaung - Khechaung in Tavoy District; and Manoron in Mergui District.A number of other areas are also considered to be attractive.
2. Description of Project
82. Geology and ore reserves: The deposits are alluvial, and arederived from erosion of nearly primary occurrences. During transportation ofthe erosion products, the heavier metal minerals may be concentrated due tolocal conditions. These deposits commonly occur in sand and gravel althoughclay is commonly present. Cassiterite (a tin oxide - SnO2) is the ore mineral
most commonly found. In the northern part of the Tenasserim division, wolframite(an iron tungstate - Fe, MnWX ) is also found.
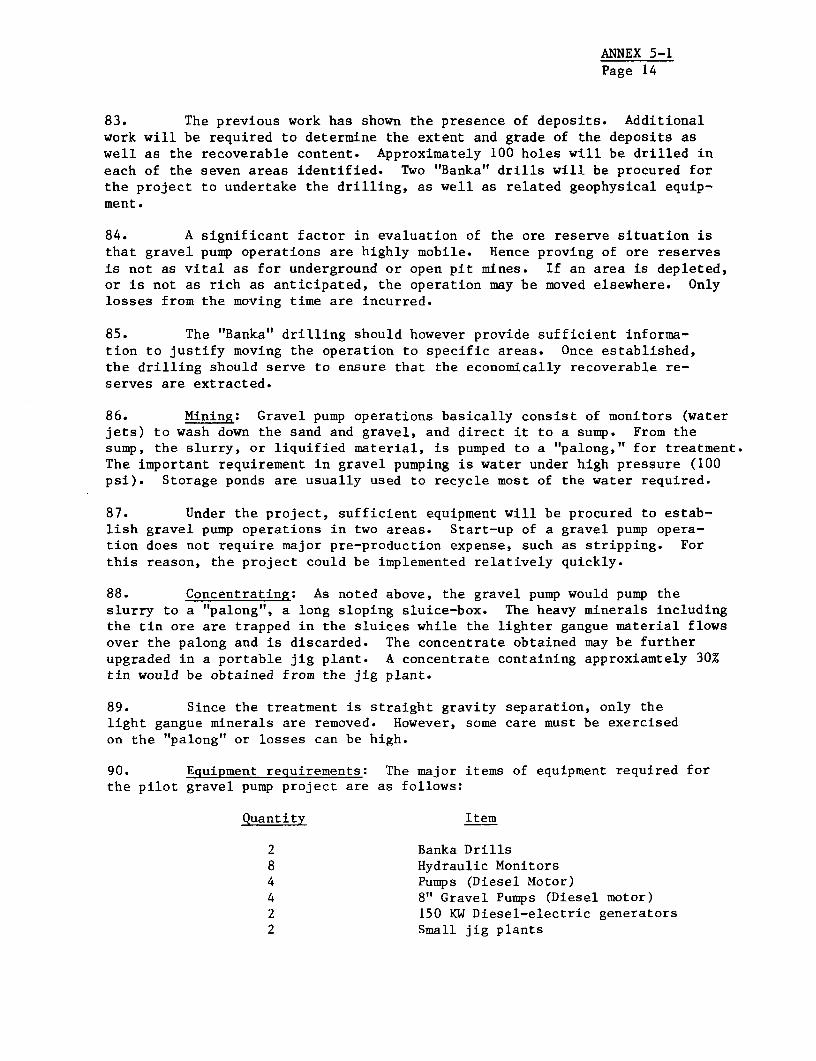
ANNEX 5-1Page 14
83. The previous work has shown the presence of deposits. Additionalwork will be required to determine the extent and grade of the deposits aswell as the recoverable content. Approximately 100 holes will be drilled in
each of the seven areas identified. Two "Banka" drills will be procured forthe project to undertake the drilling, as well as related geophysical equip-ment.
84. A significant factor in evaluation of the ore reserve situation isthat gravel pump operations are highly mobile. Hence proving of ore reservesis not as vital as for underground or open pit mines. If an area is depleted,or is not as rich as anticipated, the operation may be moved elsewhere. Onlylosses from the moving time are incurred.
85. The "Banka" drilling should however provide sufficient informa-tion to justify moving the operation to specific areas. Once established,the drilling should serve to ensure that the economically recoverable re-serves are extracted.
86. Mining: Gravel pump operations basically consist of monitors (waterjets) to wash down the sand and gravel, and direct it to a sump. From thesump, the slurry, or liquified material, is pumped to a "palong," for treatment.The important requirement in gravel pumping is water under high pressure (100psi). Storage ponds are usually used to recycle most of the water required.
87. Under the project, sufficient equipment will be procured to estab-lish gravel pump operations in two areas. Start-up of a gravel pump opera-tion does not require major pre-production expense, such as stripping. Forthis reason, the project could be implemented relatively quickly.
88. Concentrating: As noted above, the gravel pump would pump theslurry to a "palong", a long sloping sluice-box. The heavy minerals includingthe tin ore are trapped in the sluices while the lighter gangue material flowsover the palong and is discarded. The concentrate obtained may be furtherupgraded in a portable jig plant. A concentrate containing approxiamtely 30%tin would be obtained from the jig plant.
89. Since the treatment is straight gravity separation, only thelight gangue minerals are removed. However, some care must be exercisedon the "palong" or losses can be high.
90. Equipment requirements: The major items of equipment required forthe pilot gravel pump project are as follows:
Quantity Item
2 Banka Drills8 Hydraulic Monitors4 Pumps (Diesel Motor)4 8" Gravel Pumps (Diesel motor)2 150 KW Diesel-electric generators2 Small jig plants

ANNEX 5-1Page 15
91. This would be sufficient for two operations. Other miscellaneousmaterial such as piping and electric cable will also be required.
3. Technical Assistance
92. Technical assistance would be provided by the engineering firmfor the pilot gravel pump project. The assistance would cover all phases.The drilling program would be laid out in consultation with the firm; theactual drilling would be carried out with supervision by the firm; aswould calculation of recoverable ore reserves.
93. Technical assistance would also be provided for the gravel pumpoperations. Selection of the locations would follow the early drillingresults. Start-up and early operations of the mines would be under thesupervision of the engineering firm.
94. It is estimated that assistance would cover a minimum of twoyears.
Industrial Projects DepartmentJanuary 1977
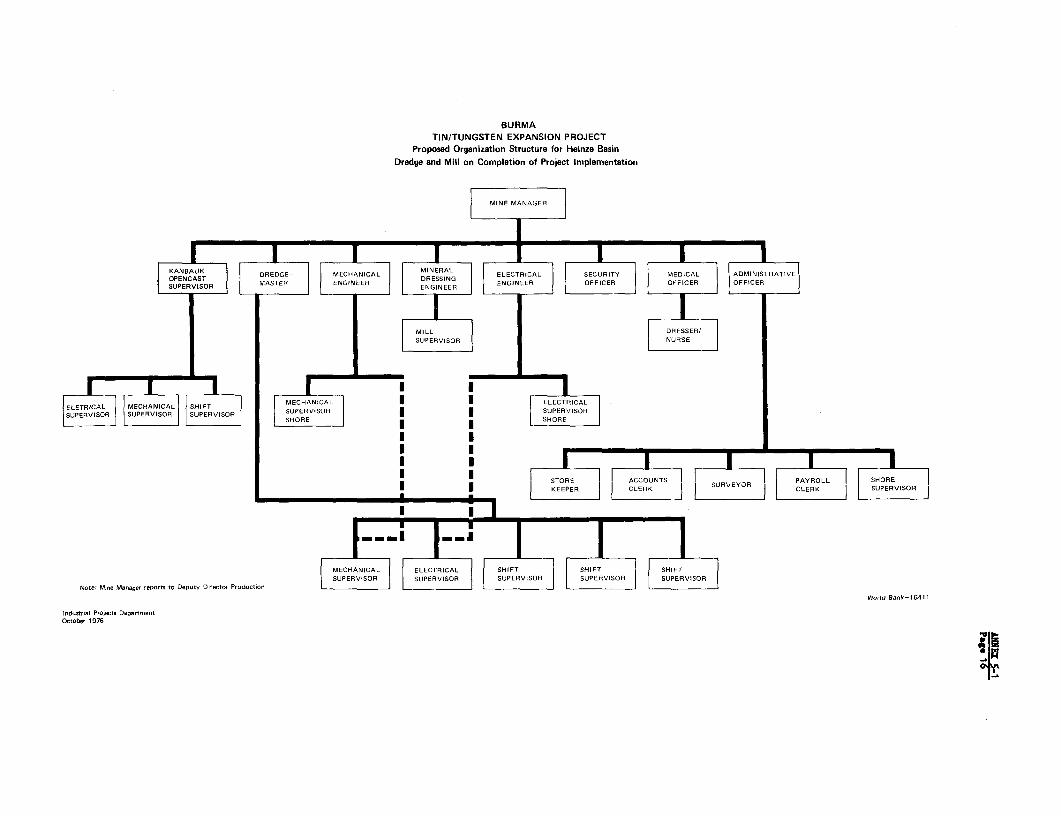
BURMATIN/TUNGSTEN EXPANSION PROJECT
Proposed Organization Structure for Heinze BasinDredge and Mill on Completion of Project Implementation
MINE MANAGER
+ | ~~~~DREDGE- | |MECANICAL |E<l-T . SECRIT MEDICAL ADINSTATV
| S P F/SR MASTER ENGNEE ENGINEE OFFCE OFFICER OFFICER
SUPERVISPEVIOROR NRS
SHORE I | SHORE
I I
-ORE Ar.C PAYROLLS.R* | KEEPER CLERK Su R CLEFRK SUPERVISOR
FJP7Thv II|L M ECH NICAL | | ELECTRICAL l l SHIFT l l SHIFT SHIFT
SUPERVISOR SUPERVISOR SUPERVISOR SUPERVISOR SUPERVISORNote: Mme Manager reports to DOepty Director Production
World Sa-k-t1&411
Industrial Projects DepanmentOctober 1 976

BURMA: TIN/TUNGSTEN EXPANSION PROJECTTAVOY CONCENTRATOR
PROPOSED ORGANIZATIONAL STRUCTURE ON COMPLETION OF PROJECT IMPLEMEN-TATION
| Concentrator l| Superintendent |
[ | ~~~Administration|| Officer |
Mech. Eng. Elect. Chemist Security1<~~~~~~Eg Plan Clerks2(Maintenaince) (Maintenance) Frmn(Sampling) Officer
FittersMechanics Chargemen Asst. Foremen rWatchmenB/MakersWelders
|Plant Operators|
Note: Concentrator Superintendent reports to Deputy Director Production.
Industrial Projects DepartmentOctober 1976 World Bank-16592
_ v
ANNEX 5-2Page 1
BURMA
TIN TUNGSTEN EXPANSION PROJECT
CAPITAL COST ESTIMATES
A. Effective Date of Estimates
1. The original estimates for the Heinze Basin dredge and mill wereprepared during March and April 1975 and reflected prices as at 31st March,1975. The original estimates for the other project components and revisedestimates for the Heinze Basin components reflect March 31, 1976 prices. Thecapital costs are detailed in full in two feasibility studies prepared byOsborne & Chappel Sdn. Bhd., tin mining consultants of Ipoh, Malaysia. Thereports are as follows:
(1) Comprehensive Feasibility Studies for Mining PlacerTin-Ore in the Heinze Basin; August 1975 (with up-dated costs contained in a further report: FinalRevised Summaries of the Capital Cost Estimates forImplementation of the Heinze Basin Project; April1976.
(2) Review of Existing and Projected Facilities for Tin/Tungsten Concentration in the Tenasserim Division andat Mawchi including Recommendations for their Improve-ment; July, 1976.
The costs for the project are summarized by component in Table 1.
B. Method of Estimation
2. The cost estimates were prepared based on the equipment specifiedand on the assumption that all new equipment would be used, and without thebenefit of completed design engineering. The estimated cost of individualitems were either prepared within the consultants' firm or obtained as in-formal or formal quotations from the various Burmese Government corporationsconcerned, e.g. Construction Corporation. The costs were estimated on thebasis that equipment would be procured on a components basis under inter-national competitive bidding and assembled by other contractors under thesupervision of an engineering firm i.e. rather than turnkey contracts forcomplete items such as the dredge.

ANNEX 5-2Page 2
3. With regard to Osborne & Chappel's own estimates, four separatebases were employed:
- actual quotations obtained from suppliers againstspecifications submitted
- informal advice obtained from suppliers againstspecifications submitted.
- the updating and adjusting of prices of similar itemsrecently purchased within Osborne & Chappel's ownorganization.
- the objective assessment of costs of fabrication andcomponents, using quoted basic Malaysian prices, or,where applicable, the domestic rates quoted by therelevant Burmese Government Corporation.
4. To assess the reliability of prices quoted by the GovernmentConstruction Corporation, the consultants compared a number of the quota-tions received with their own estimation of the cost of similar work ifexecuted in Malaysia. In most cases they found the Corporation quotedcompetitive rates.
C. Freight, Insurance and Related Charges
Calculation of Port Charges and Handling Charges to Transit Godown
Port Charges
5. Port charges have been calculated at 2% of CIF Rangoon costs.
Handling Charge
6. This varies depending on the item being handled but for budgettingpurposes the charges have been calculated as follows:
Steelwork, hardware and all materials US$1.50 per tonne (10 kyats)Machinery, equipment and parts thereof US$6.00 " " (40 kyats)
Calculation of Freight and Insurance Charges
Foreign Freight
7. All foreign costs have been obtained on the basis of CIF Butterworth,Malaysia. The cost of shipping from Butterworth to Rangoon is about US$22 pertonne (M$55).
ANNEX 5-2Page 3
Local Freight
8. It has been assumed that all machinery, spares and parts will betranshipped at Rangoon and transported by sea to the Heinze Basin. Localfreight costs are based on landing craft charter which are about US$10 pertonne (69 kyats) from Rangoon to Heinze Basin.
Insurance During Carriage and Transit
9. This has been taken at 1% of the basic cost and is assessed inforeign currency. Insurance during towage of the dredge was estimated at2% of construction costs.
D. Procurement and Project Management Assistance
10. The cost of consultants (excluding engineering, training, and tech-nical assistance covered below) provides for 50 man-months for personnel inBurma, together with comprehensive back-up services from the consultants' homeoffice facilities and staff. The cost per man-year, including travel andother expenses associated with this assistance, has been estimated at aboutUS$84,000 equivalent.
E. Design Engineering
11. The specifications included in the report only form a basis forthe subsequent engineering design required. Some of this design work canbe competently executed by the Construction Corporation in Burma. Otherwork such as the design of the dredge, will have to be executed overseas.
12. The estimate for design engineering work has therefore beenallocated between domestic and foreign currency in accordance with the local!foreign split of the equipment and construction costs. The basis for thecalculations involved in estimating design expenses are given in the tablebelow:
Percentage ofBasic Capital Cost
Item %
Dredge 7-1/2Heinze Mill, Tavoy Concentrator 10Auxiliary Equipment & Facilities 10Workshops, Stores, Offices, Housing, etc. 10
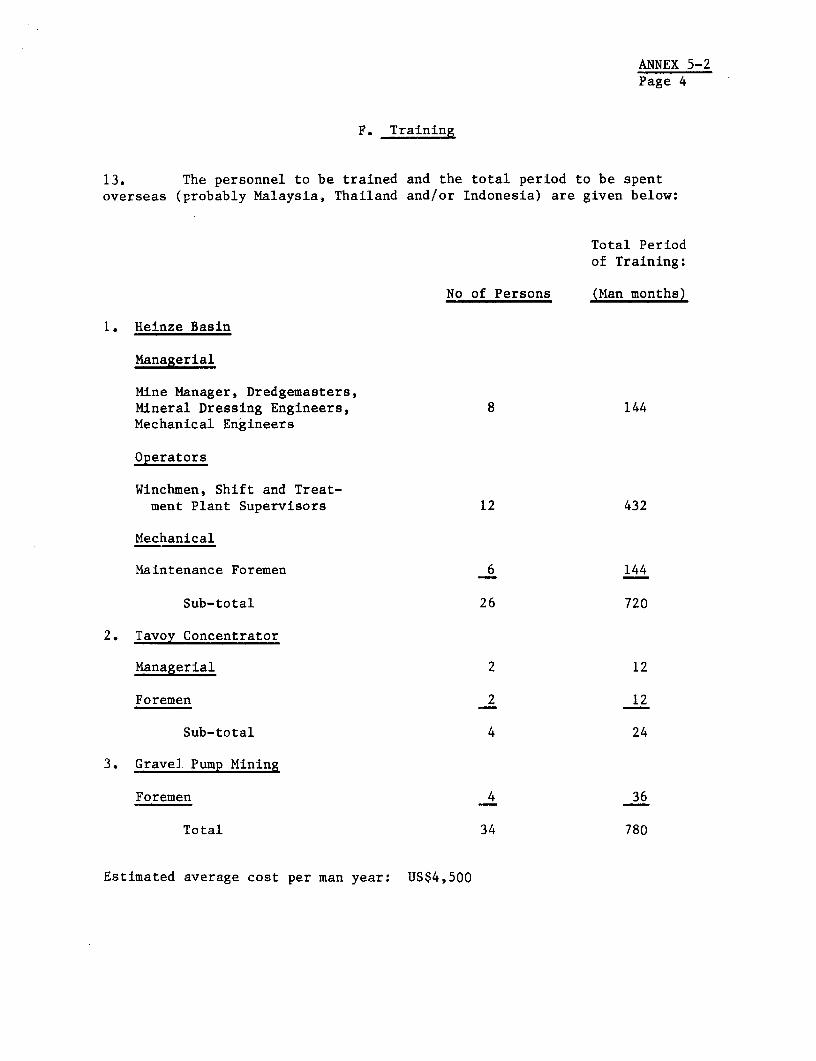
ANNEX 5-2Page 4
F. Training
13. The personnel to be trained and the total period to be spentoverseas (probably Malaysia, Thailand and/or Indonesia) are given below:
Total Periodof Training:
No of Persons (Man months)
1. Heinze Basin
Managerial
Mine Manager, Dredgemasters,Mineral Dressing Engineers, 8 144Mechanical Engineers
Operators
Winchmen, Shift and Treat-ment Plant Supervisors 12 432
Mechanical
Maintenance Foremen 6 144
Sub-total 26 720
2. Tavoy Concentrator
Managerial 2 12
Foremen 2 12
Sub-total 4 24
3. Gravel. Pump Mining
Foremen 4 36
Total 34 780
Estimated average cost per man year: US$4,500
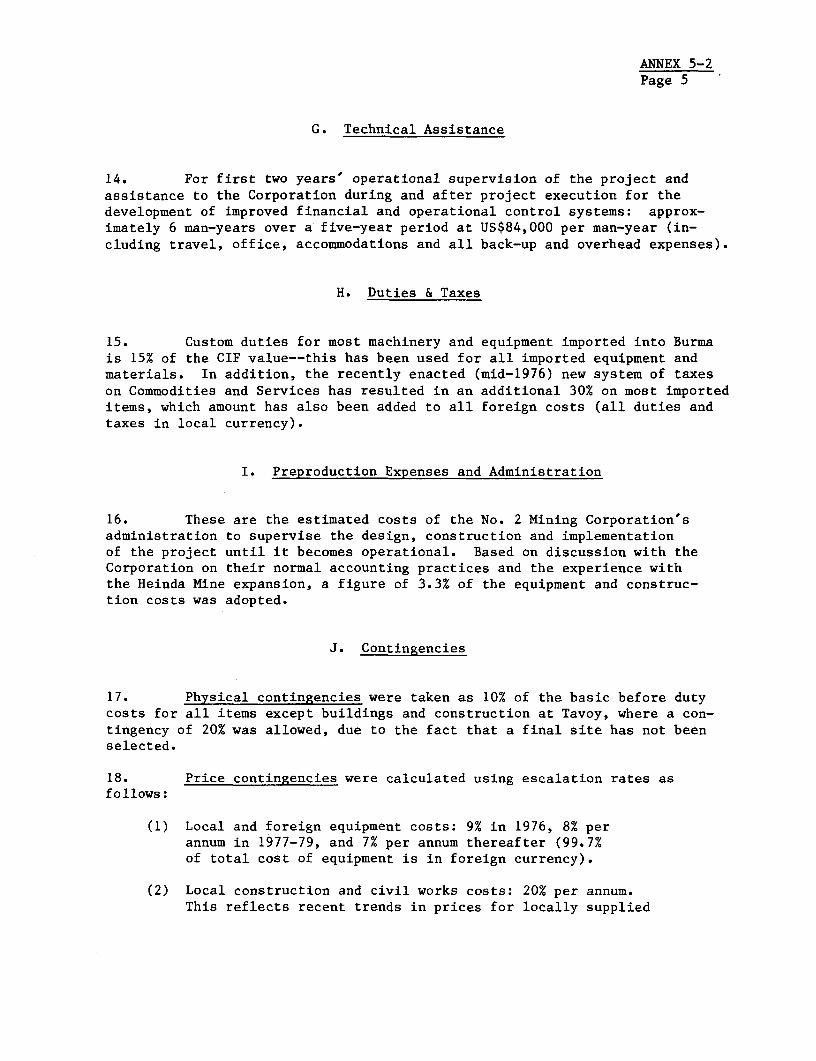
ANNEX 5-2Page 5
G. Technical Assistance
14. For first two years' operational supervision of the project andassistance to the Corporation during and after project execution for thedevelopment of improved financial and operational control systems: approx-imately 6 man-years over a five-year period at US$84,000 per man-year (in-cluding travel, office, accommodations and all back-up and overhead expenses).
H. Duties & Taxes
15. Custom duties for most machinery and equipment imported into Burmais 15% of the CIF value--this has been used for all imported equipment andmaterials. In addition, the recently enacted (mid-1976) new system of taxeson Commodities and Services has resulted in an additional 30% on most importeditems, which amount has also been added to all foreign costs (all duties andtaxes in local currency).
I. Preproduction Expenses and Administration
16. These are the estimated costs of the No. 2 Mining Corporation'sadministration to supervise the design, construction and implementationof the project until it becomes operational. Based on discussion with theCorporation on their normal accounting practices and the experience withthe Heinda Mine expansion, a figure of 3.3% of the equipment and construc-tion costs was adopted.
J. Contingencies
17. Physical contingencies were taken as 10% of the basic before dutycosts for all items except buildings and construction at Tavoy, where a con-tingency of 20% was allowed, due to the fact that a final site has not beenselected.
18. Price contingencies were calculated using escalation rates asfollows:
(1) Local and foreign equipment costs: 9% in 1976, 8% perannum in 1977-79, and 7% per annum thereafter (99.7%of total cost of equipment is in foreign currency).
(2) Local construction and civil works costs: 20% per annum.This reflects recent trends in prices for locally supplied

ANNEX 5-2Page 6
construction materials, particularly timber and cement.These trends are expected to continue into the constructionperiod.
(3) Engineering, training and administration costs: 7% perannum for both local and foreign costs.
K. Working Capital
19. Normal and insurance spares have been included under cost ofequipment and spares respectively. Other working capital needs (inven-tory, receivables, etc.) are estimated as being negligible with respectto the project cost as improvements in product quality and marketing effi-ciency resulting from the project will permit a reduction in receivablesand inventories sufficient to offset the additional requirements thatwould otherwise result from increased output.
L. Interest During Construction
20. This item is based on interest charged in local currency on theon-lent and outstanding portion of the proceeds of the credit during projectexecution at 10% per annum.
Industrial Projects DepartmentNovember, 1976

bURMA,
TIN/TUNGSTEN EXPANSION PROJECT
Table 1. SUMHIART OF CAPITAL COSTS BY PEOJECT CIENONENT
Reaite B-Si Dredge T-wyand Mill (inc1. Kanbasdol Concentrates Gravel Pu p Projact Technical Ansi-t Tatal1
Local Fon-ion Total Loeni Fe Total Lc..l Ferei"e Total Local Perele Total Locl Frpien Total
EqoipE-nt 26 5820 58461/ 1085 10852/ 852 8523/ 26 7757 7783
Spares - 732 732 122 122 - 288 288 - 1142 1142
Cet-nsetin &Civil Warks 1351 331 1682-/ 177 147 3242/ 104 12 1162/ 3- - 490 2122
Freight & Insorance 45 204 249 35 30 65 25 25 50 - - - 105 259 364
Eagteneretin, ProjectManagaeent &Ta=hnical Assist- 52 997 1049 14 259 273 7 133 140 19 352 371 92 1741 1833
Training - 257 257 - 12 12 - 24 24 - - - - 293 293
Ad snietratien &Pra-pr-d-ctien 300 - 300 23 - 23 40 - 40 - - - 363 - 363
Tlane & Datins 3250 - 3250 641 - 641 581 -81 1 - _ - 4472 - 4472
Tot.1 B.e. CSnt 5024 8341 13365 890 1655 2545 757 1334 2891 19 352 371 6690 11682 18372
Phyoieal Centin- 430 636 1066 105 141 246 68 90 158 - - - 603 867 1470
Price Contingencies 2134 2338 4472 387 509 896 184 290 474 6 122 128 _2711 3259 5970
Pr-jeet Bace Cent 7588 11315 18903 SI82 2305 3687 1009 1714 2723 25 474 499 10004 15808 25812
Cecreesennal
Woeking Capital - - - - - - - - - - -
Int-reat during
Cenetrustien 1301 - 1301 247 - 247 257 - 257 12 - 12 1817 _ 1817
Total FinancingR.qsttnd 8889 11315 20804 1629 2305 3934 1266 1714 2980 37 474 511 11821 15808 27629
1/ Sea Tabla 2 fio detailsIsdsetrial Poajeatn Dept. / See Table 3 for d anils
Nevbestr, 1976 3/ Sen Table 4 for details
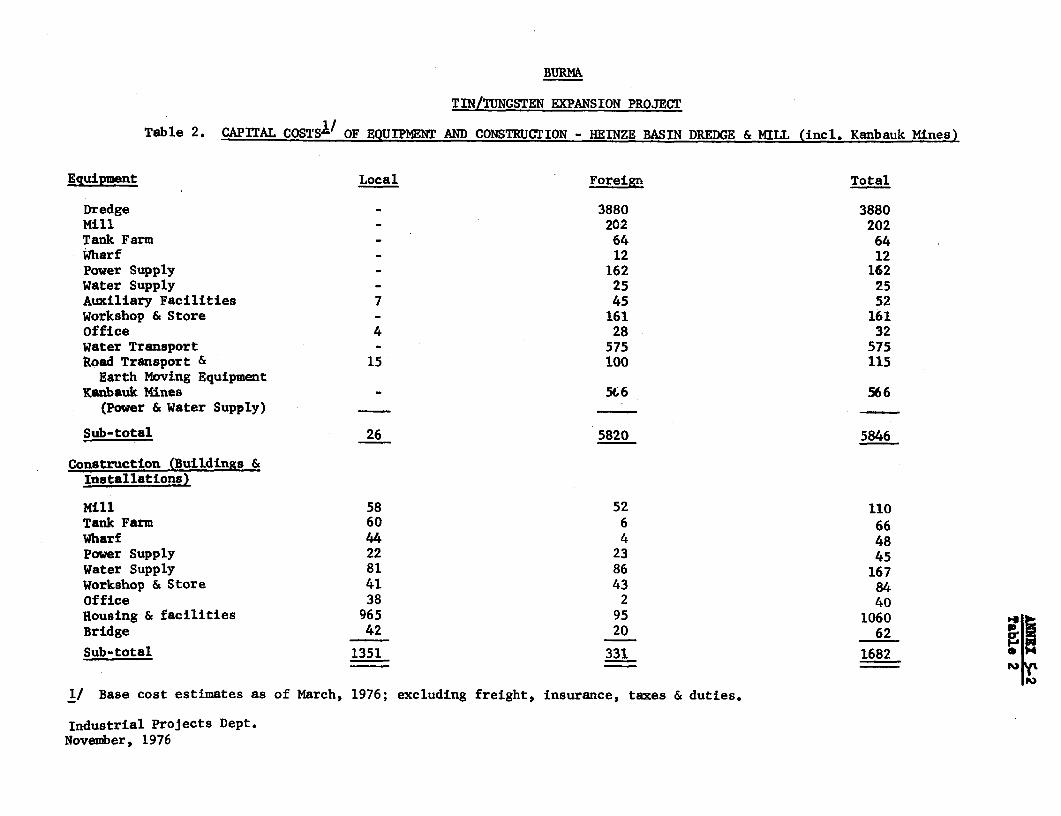
BIJRMb
TIN/TUNGSTEN EXPANSION PROJECT
Table 2. CAPITAL COSTSI/ OF EQUIPMENT AND CONSTRUCTION - HEINZE BASIN DREDGE & MILL (incl. Kanbauk Mines)
Equipment Local Foreign Total
Dredge - 3880 3880Mill - 20-2 202Tank Farm - 64 64Wharf - 12 12Power Supply - 162 162Water Supply - 25 25Auxiliary Facilities 7 45 52Workshop & Store - 161 161Office 4 28 32Water Transport _ 575 575Road Transport & 15 100 115Earth Moving Equipment
Kanbauk Mines - 566 566(Power & Water Supply)
Sub-total 26 5820 5846
Construction (Buildings &Installations)
Mill 58 52 110Tank Farm 60 6 66Wharf 44 4 48Power Supply 22 23 45Water Supply 81 86 167Workshop & Store 41 43 84Office 38 2 40Rousing & facilities 965 95 1060 '4
Bridge 42 20 62 C.Sub-total 1351 331 1682
_~~~~~~' Y,
1/ Base cost estimates as of March, 1976; excluding freight, insurance, taxes & duties.
Industrial Projects Dept.November, 1976
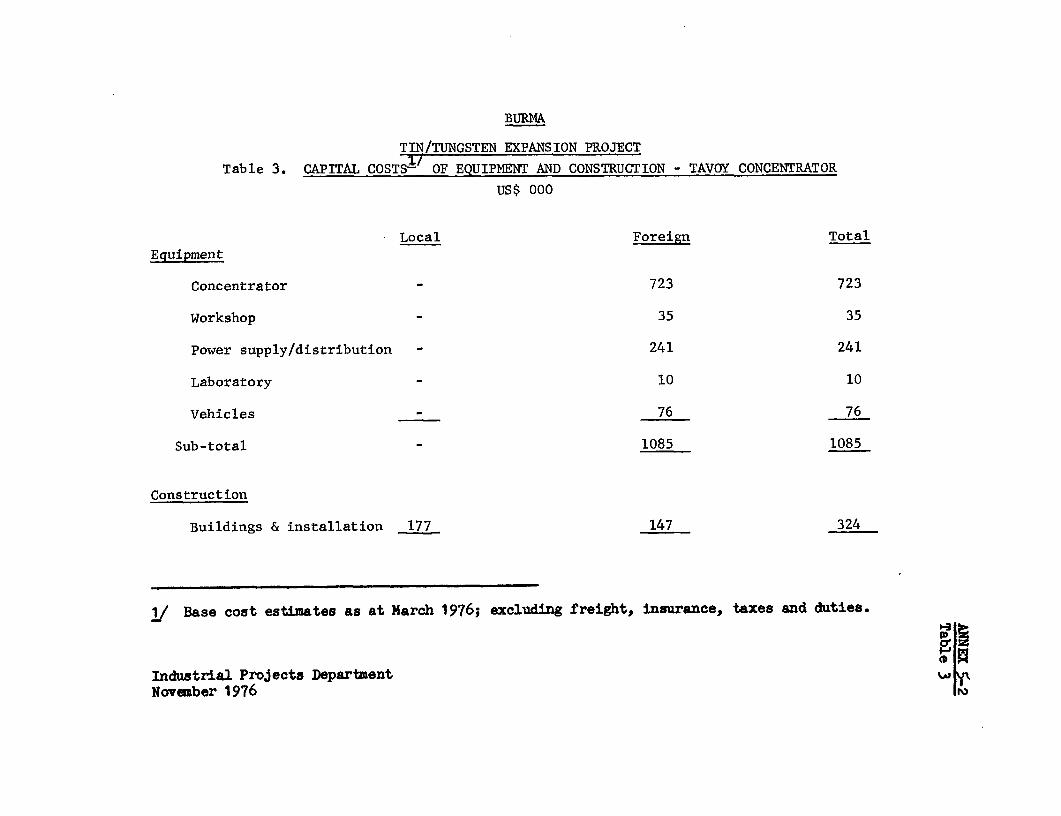
BURMA
TIN/TUNGSTEN EXPANSION PROJECT
Table 3. CAPITAL COSTS- OF EQUIPMENT AND CONSTRUCTION - TAVOY CONCENTRATOR
US$ 000
Local Foreign Total
Equipment
Concentrator - 723 723
Workshop - 35 35
Power supply/distribution - 241 241
Laboratory - 10 10
Vehicles - 76 76
Sub-total - 1085 1085
Construction
Buildings & installation 177 147 324
1/ Base cost estimates as at March 1976; excluding freight, insurance, taxes and duties.
Industrial Projects Department ANovember 1976 Jy
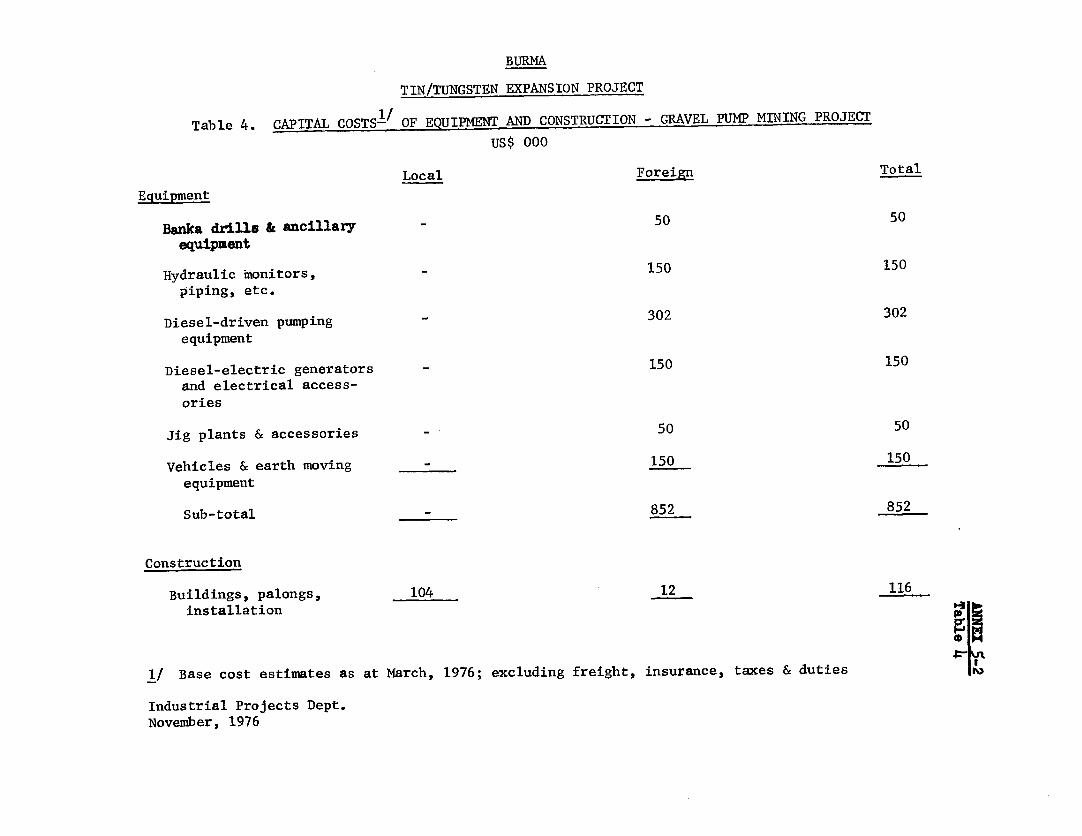
BURMA
TIN/TUNGSTEN EXPANSION PROJECT
Table 4. CAPITAL COSTS-/ OF EQUIPMENT AND CONSTRUCTION - GRAVEL PUMP MINING PROJECT
US$ 000
Local Foreign TotalEquipment
Banka drill8 & ancillary - 50 50equipment
Hydraulic monitors, - 150 150piping, etc.
Diesel-driven pumping - 302 302equipment
Diesel-electric generators - 150 150and electrical access-ories
Jig plants & accessories - 50 50
Vehicles & earth moving - 150 150equipment
Sub-total _ _- 852 852
Construction
Buildings, palongs, 104 12 116installation
t %n1/ Base cost estimates as at March, 1976; excluding freight, insurance, taxes & duties
Industrial Projects Dept.November, 1976
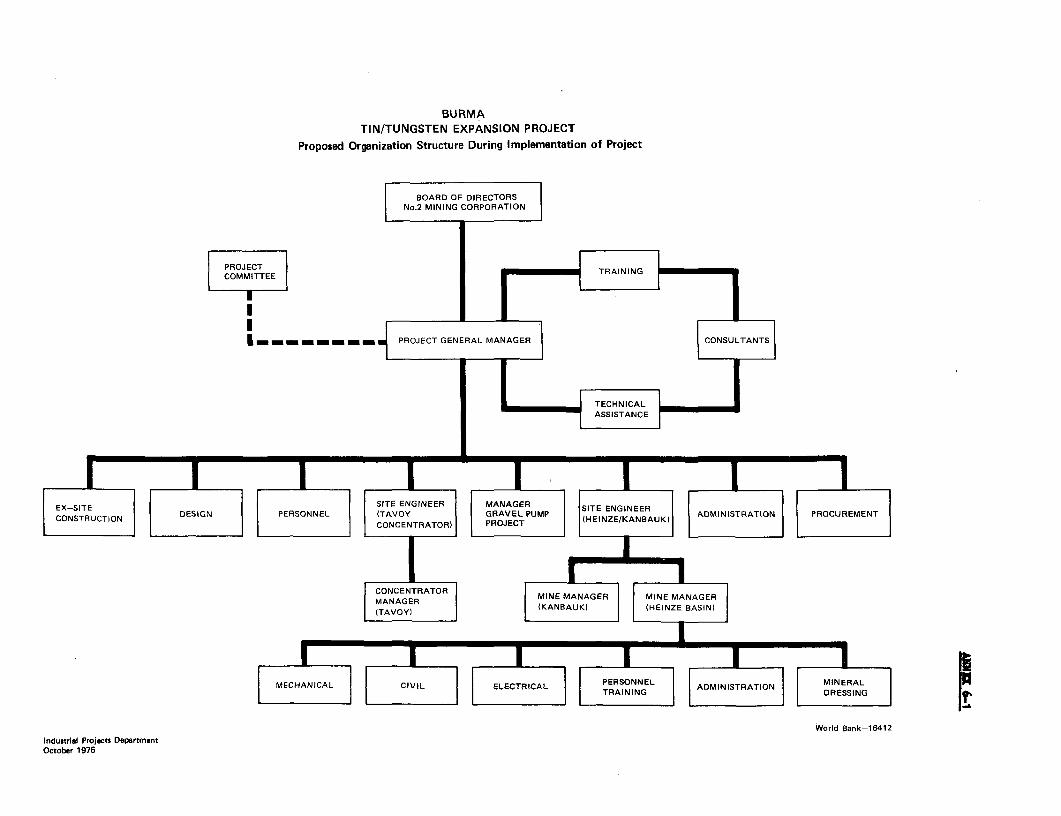
BURMATIN/TUNGSTEN EXPANSION PROJECT
Proposed Organization Structure During Implementation of Project
BOARD OF DIRECTORSNo.2 MINING CORPORATION
PROJECTCOMMITTEE TANN
I _n _-_ _ _ _ __ - PROJECT GENERAL MANAGER CONSULTANTS
ASS ISTANC
EX-SITE DEINPRONL SITE ENGINEER MANAGERSIENGERCONSTRUCTION DEINPRONL(TAVOY GRAVEL PUMP SITESTRAENGINEERMEN
CONCENTRATOR) PROJECT (HEINZE/KANBAUK DIITAIO RCRMN
-+ 1 4 = ~~~~~~~~~~A A G E MIN M A N M iN A A E
(TAVOY) (KANB~~~~~~ (HEINZE BASIN)|
MECHANICAL CIVIL ELECTRICAL PERSONNEL ADMINISTRATIONMIEA
World Bank-164
12
Industrial Projects DepartmentOctober 1976
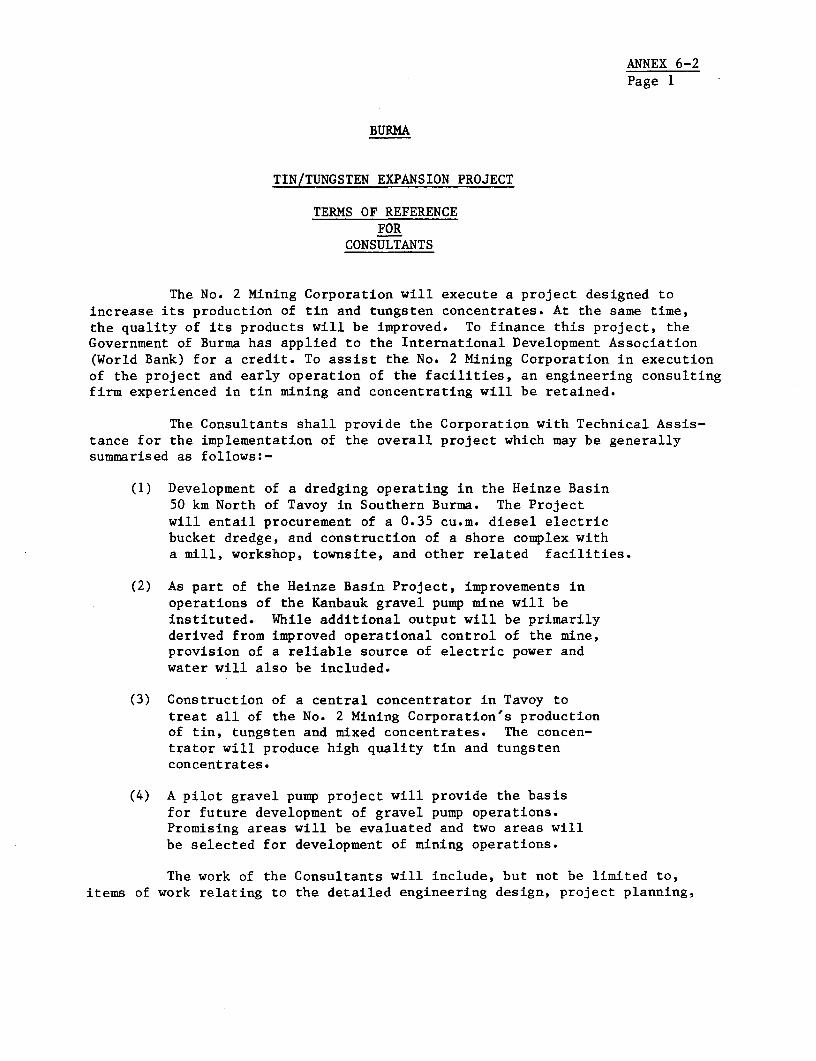
ANNEX 6-2Page 1
BURMA
TIN/TUNGSTEN EXPANSION PROJECT
TERMS OF REFERENCEFOR
CONSULTANTS
The No. 2 Mining Corporation will execute a project designed toincrease its production of tin and tungsten concentrates. At the same time,the quality of its products will be improved. To finance this project, theGovernment of Burma has applied to the International Development Association(World Bank) for a credit. To assist the No. 2 Mining Corporation in executionof the project and early operation of the facilities, an engineering consultingfirm experienced in tin mining and concentrating will be retained.
The Consultants shall provide the Corporation with Technical Assis-tance for the implementation of the overall project which may be generallysummarised as follows:-
(1) Development of a dredging operating in the Heinze Basin50 km North of Tavoy in Southern Burma. The Projectwill entail procurement of a 0.35 cu.m. diesel electricbucket dredge, and construction of a shore complex witha mill, workshop, townsite, and other related facilities.
(2) As part of the Heinze Basin Project, improvements inoperations of the Kanbauk gravel pump mine will beinstituted. While additional output will be primarilyderived from improved operational control of the mine,provision of a reliable source of electric power andwater will also be included.
(3) Construction of a central concentrator in Tavoy totreat all of the No. 2 Mining Corporation's productionof tin, tungsten and mixed concentrates. The concen-trator will produce high quality tin and tungstenconcentrates.
(4) A pilot gravel pump project will provide the basisfor future development of gravel pump operations.Promising areas will be evaluated and two areas willbe selected for development of mining operations.
The work of the Consultants will include, but not be limited to,items of work relating to the detailed engineering design, project planning,

ANNEX 6-2Page 2
site selection for the Tavoy concentrator and implementation of the projecttogether with implementation of training programmes and improvement of infor-mation services within the No. 2 Mining Corporation. Inter alia, the Consul-tant shall complete the metallurgical testing for the Tavoy Concentrator inaccordance with the recommendations outlined in the feasibility report of July1976 prepared by Osborne & Chappel, Sdn. Berhad of Ipoh, Malaysia. Theprincipal services will consist of:
Designs, Plans and Specifications
After a thorough study of all available information including thefeasibility reports undertaken (Heinze Basin, Tavoy Central Concentrator andsuch other records as available), with the exception of housing and othergeneral types of buildings, the Consultants shall draw up detailed workingdrawings for civil engineering construction, electrical and mechanical instal-lations, and specifications, flowsheets and site layout plans for all equipmentand facilities covered by the project together with any modifications to anyexisting plant as may be necessary to enable existing facilities to be integra-ted into those proposed.
Procurement and Supplies
The Consultants shall prepare for the Corporation the invitation oftenders for the plant and equipment required and shall prepare the tenderdocuments based on general conditions of tender to be supplied by the Corpora-tion in accordance with the International Development Association's guidelineson Procurement. Conditions of tender shall include instructions to thetenderers to identify separately the foreign cost component of each tender.
After all tenders have been received by the Corporation, the Consul-tant shall analyse and report in detail on them, and forward them to theCorporation together with evaluations of all the tenders received.
The Consultants shall, if required by the Corporation, assist theCorporation in any negotiations which may be conducted by the Corporation withsuch tenderers.
After the acceptance of a tender or tenders by the Corporation, theConsultants shall assist and advise on the technical content of contractdocuments including the finalising of the contracts.
A general description of the goods and works to be procured andconstructed is given below:
(1) Dredge (excluding power generator)
(2) Heinze Basin shore complex (excluding power generator)
(3) Tavoy central concentrator & Heinze concentrator(excluding power)
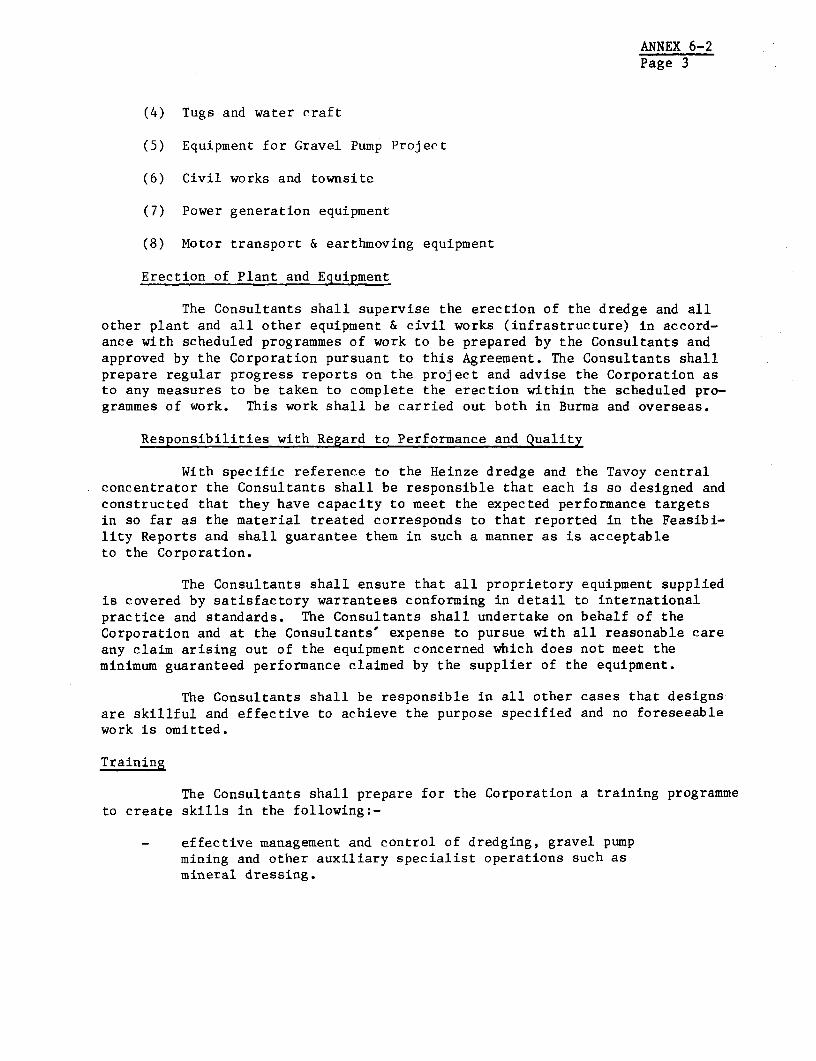
ANNEX 6-2Page 3
(4) Tugs and water craft
(5) Equipment for Gravel Pump Project
(6) Civil works and townsite
(7) Power generation equipment
(8) Motor transport & earthmoving equipment
Erection of Plant and Equipment
The Consultants shall supervise the erection of the dredge and allother plant and all other equipment & civil works (infrastructure) in accord-ance with scheduled programmes of work to be prepared by the Consultants andapproved by the Corporation pursuant to this Agreement. The Consultants shallprepare regular progress reports on the project and advise the Corporation asto any measures to be taken to complete the erection within the scheduled pro-grammes of work. This work shall be carried out both in Burma and overseas.
Responsibilities with Regard to Performance and Quality
With specific reference to the Heinze dredge and the Tavoy centralconcentrator the Consultants shall be responsible that each is so designed andconstructed that they have capacity to meet the expected performance targetsin so far as the material treated corresponds to that reported in the Feasibi-lity Reports and shall guarantee them in such a manner as is acceptableto the Corporation.
The Consultants shall ensure that all proprietory equipment suppliedis covered by satisfactory warrantees conforming in detail to internationalpractice and standards. The Consultants shall undertake on behalf of theCorporation and at the Consultants' expense to pursue with all reasonable careany claim arising out of the equipment concerned which does not meet theminimum guaranteed performance claimed by the supplier of the equipment.
The Consultants shall be responsible in all other cases that designsare skillful and effective to achieve the purpose specified and no foreseeablework is omitted.
Training
The Consultants shall prepare for the Corporation a training programmeto create skills in the following:-
- effective management and control of dredging, gravel pumpmining and other auxiliary specialist operations such asmineral dressing.

ANNEX 6-2Page 4
operations of the dredge and mill.
maintenance of plant peculiar to a dredge.
The programme will be implemented by the Consultants both in Burmaand in either Malaysia, Thailand or Indonesia, where many dredges operate.
The personnel who should be trained and the total period to be spentoverseas are given below:
Total periodNo. of of trainingpersons in man-months
Managerial 8 144Operators 12 432Mechanical 6 144
It will be necessary for inter-Government arrangements to be made tofacilitate this training and the Consultants will use their best endeavours tosee that this is implemented.
Besides the services indicated the Consultants shall advise theCorporation and make recommendations to the Corporation for-
- production and supervisory personnel required for theexpanded operation.
- the setting up of a central workshop to meet theCorporation's requirements for the expanded plant;
- the setting up of a central control laboratory; and
- the development of repair and maintenance routines.
Operational Facilities
Commissioning of the Plant. Without prejudice to their responsibi-lities as referred to under performance and quality, the Consultants shallsupervise the carrying out of test runs of each of the individual items ofequipment, the dredge, and the concentrators and they shall be responsible forthe evaluation of the test results, and shall act in the interest of theCorporation in all commissioning and performance guarantee tests. In the caseof equipment which does not meet the minimum guaranteed performance claimed bythe suppliers of equipment, the Consultants shall furnish a Certificateindicating the respects in which such equipment does not meet the necessaryrequirements. The Consultants shall furnish a Certificate of Acceptancefor each item of equipment which does comply with the contract specifications.

ANNEX 6-2Page 5
Operational Supervision
The Consultants shall also provide technical assistance for the safeand efficient operation of all plant after it has been commissioned for aperiod of not less than two years and shall report quarterly to the Corporationon the performance of all plants concerned throughout the said period.
Gravel Pump Mining
The responsibility of the Consultants with regard to this section ofthe project shall include the examination and evaluation of all historicrecoveries and the undertaking of field investigations in order to classifythe overall tin tungsten mining potential of target sites. The Consultantsshall select two or more areas as suitable for development.
Thereafter their responsibilities shall be as previously outlinedwith regard to engineering, design, procurement, training and commissioningetc.
Other Responsibilities
Besides those responsibilities outlined in the previous sectionthe Consultants shall have the responsibilities of advising the Corporationon the improvement of the Corporation structure and reporting systems. Theywill recommend accounting and financial reporting requirements and evaluatethe division of responsibilities to fulfill the Corporation's objectives,including allocation of responsibilities on a functional basis.
In addition, the Consultants shall be responsible for advising theCorporation on modern techniques for cost control, project evaluation andallied subjects.
The consultants shall also assist the Corporation to prepare a man-power plan, including steps to establish employee levels consistent withchanges in output and profitability at its various operating locations. Theplan will also include a system of bonuses, incentive schemes and specialallowances to augment wages where appropriate.
Assistance will also be given to improve the physical export of con-centrates, including study of the direct export of concentrates from Tavoy ratherthan via Rangoon as at present.
Consultants' Personnel
The Consultants shall provide for the performance of the servicesuitably qualified and experienced personnel. Details of number of personsby professional qualification and respective man-months of required work areto be provided by the Consultants when submitting the contract proposal.
Industrial Projects DepartmentJanuary, 1977

BURMA: TIN/TUNGSTEN EXPANSION PROJECTPROJECT IMPLEMENTATION SCHEULE
1977 1978 1979 1980
J-M A-J J-S O-D J-M A-J J-S O-D J-M A-J J-S O-D J-M A-J J-S O-D
HEINZE BASIN DREDGE AND MILLDesign Engineering _Tenders - - -Delivery of Components _ - -_ -Construction & Installation - - _ - -Operational Trials & Towing
TAVOY CONCENTRATORSite Selection _,Design Engineering
(incl. Metallurgical testing) _1Tenders _cDelivery of Components - -_Construction & Installation I _ _ _Operational Trials _ i
KANBAUK MINE & GRAVEL PUMP PROJECT 4I
Design EngineeringTendersDelivery of Components . _ - PConstruction & InstallationOperational Trials
Industrial Projects DepartmentOctober 1976
World Ban k-16594 193
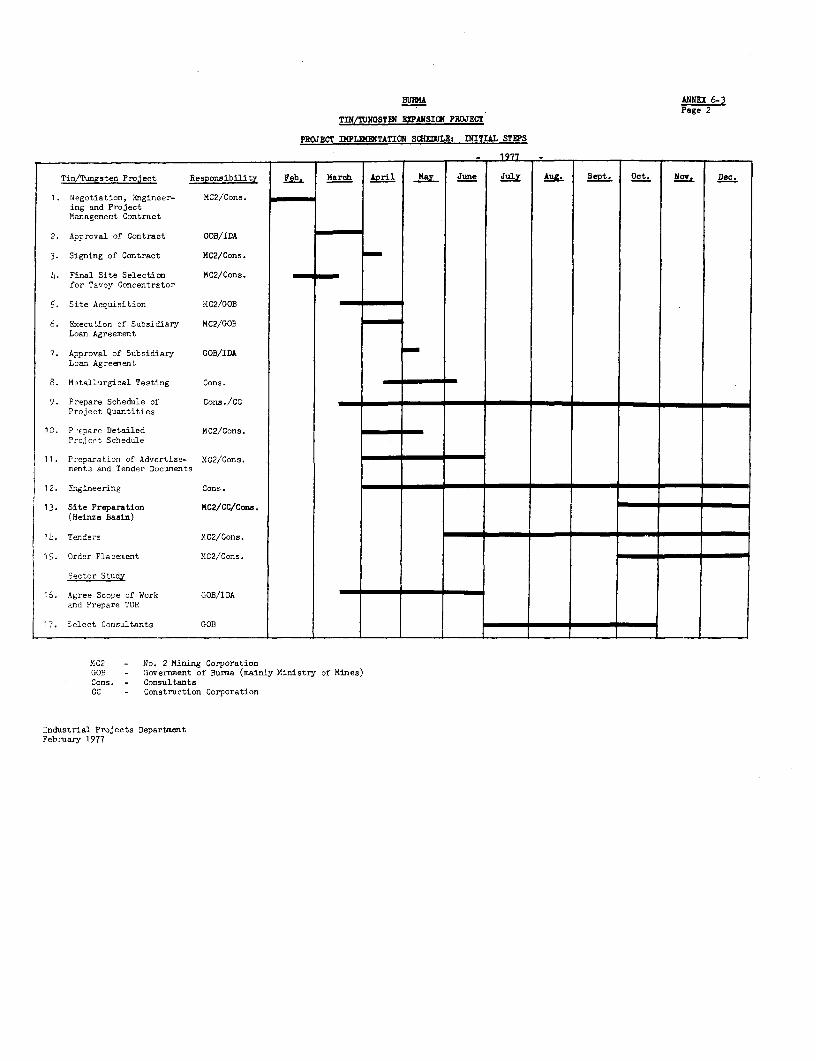
BU1fA ANNEX 6-3Page 2
TIN/TUNGSTD EXPANSICQ PROJECT
PROJECT IKPLEKENTATION SC}DIXLEs INITIAL STEPS
Tin/Tungsten ProJect Responsibility Feb. Marci April _ June July _ Sept. Oct. Nov. Dec.
1. Negotiation, Engineer- MC2/Cons.ing and ProjectManagement Contract
2. Apnroval of Contract GOB/IDA
3. Signing of Contract MC2/Cons.
Is. Final Site Selecticn MC2/Cons.for Tavoy Concentrator
5. Site Acquisition 11C2/GOB
6. Execution of Subsidiary MC2/GOBLoan Agreement
7. Approval of Subsidiary GOB/IDALoan Agreement
8. Metallurgical Testing Cons.
9. Prepare Schedule of Cons./CCProject Quantities
10. Pepare Detailed MC2/Cons.Projcot Schedule
11. Prenaration of Advertise- MC2/Cons.ments and Tender Documents
12. Engineering Cons.
13. Site Preparation KC2/CC/Cons.(Heinze Basir)
14. Tenders MC2/Cons.
15. Order Placement MC2/Cons.
Sector Study
16. Agree Scope of Work GOB/IDAand Prepare TOR
17, Select Consultants GOB
MC2 - No. 2 Mining CorporationGOB - Government of Burma (mainly Ministry of Mines)Cons. - ConsultantsCC - Construction Corporation
Industrial Projects DepartmentFebruary 1977

ANNEX 6-4
BURMA: TIN/TUNGSTEN EXPANSION PROJECT
ALLOCATION OF IDA CREDIT
Amount of the % ofCredit Expenditures
Allocated to be(US$ Million) Financed
1. Equipment and Supplies for and 6.0 100%Construction of Bucket LadderDredge-Heinze Basin (includingspare parts and foreign freight)
2. Equipment and supplies for 1.5 100% ofTin/Tungsten Concentrating foreignFacilities - Heinze Basin & Tavoy expenditures(including spare parts and foreignfreight)
3. Equipment and Supplies for Gravel 1.5 100% ofPump Tin Mining (including spare foreignparts and foreign freight) expenditures
4. Transport and Earthmoving Equipment 1.5 100%- Earthmovers, Tug, Barges, Boatsand Vehicles (including spare partsand foreign freight)
5. Ancillary Equipment and Supplies for 2.0 100% ofOffices, Laboratories, Workshops, foreignPower and Water Supply, Housing and expendituresAuxiliary Buildings (including spareparts and foreign freight)
6. Engineering, Project Management 1.5 100% ofAssistance, Operational Supervision, foreignand Training expenditures
7. Sector Study 0.2 100 offoreignexpenditures
8. Unallocated 1.8
16.0
Industrial Projects DepartmentJanuary, 1977
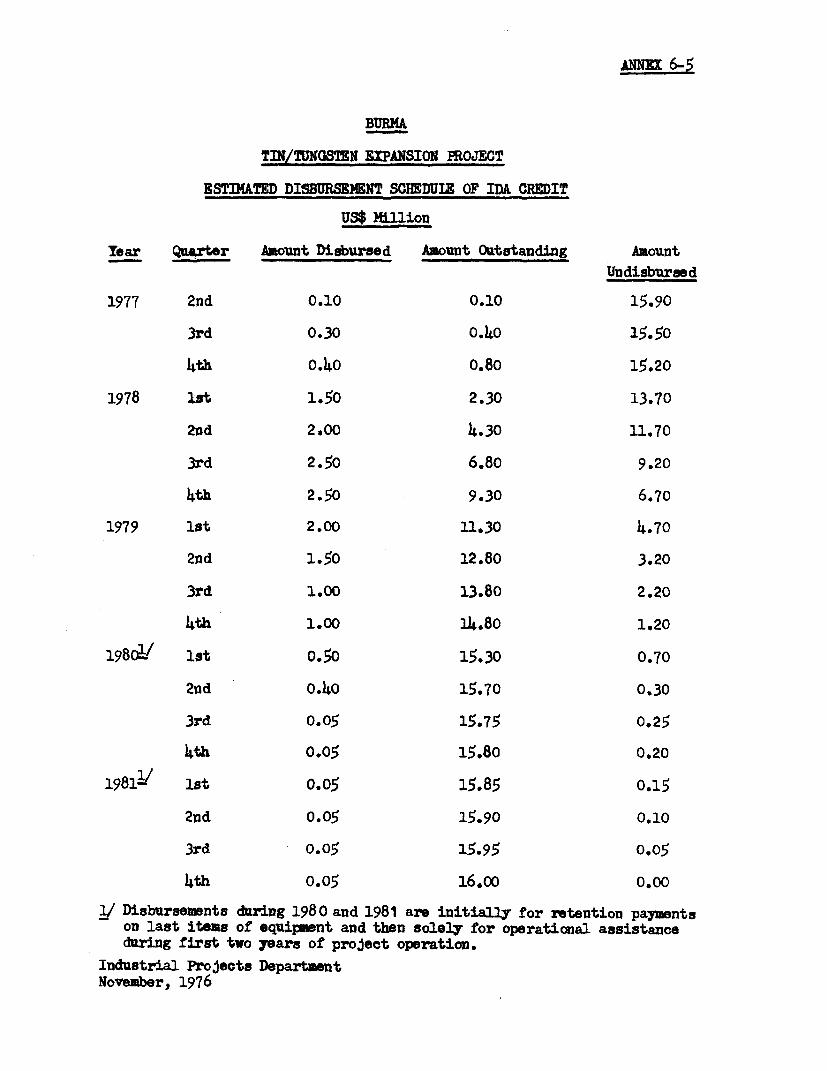
ANNE 6-5
BMR(
TIN/TUNGSTIN EXPANSION HPOJECT
ESTIATED DISBURSEIENT SCHEDULE OF IDA CREDIT
US$ Million
Toar Quaer Amount Disbursed Amount Outstanding Amount-Undisbursed
1977 2nd 0.10 0.10 15.90
3rd 0.30 0.40 15.50
4th 0.40 0.80 15.20
1978 lit 1.50 2.30 13.70
2ad 2.00 4.30 11.70
3rd 2.50 6.80 9.20
4th 2.50 9.30 6.70
1979 1st 2.00 11.30 4.70
2nd 1.50 12.80 3.20
3rd 1.00 13.80 2.20
4th 1.00 14.80 1.20
98cig / lot 0.50 15.30 0.70
2nd 0.40 15.70 0.30
3rd 0.05 15.75 0.25
4th 0.05 15.80 0.20
19812/ lot 0.05 15.85 0.15
2nd 0.05 15.90 0.10
3rd 0.05 15.95 0.05
4th 0.05 16.00 0.00
V Disbursements during 1980 and 1981 are initially for retention payxentson last items of equipment and then solely for operational assistanceduring first two years of project operation.
Industrial Projects DepartmentNovember, 1976

ANNEX 7-1Page 1
BURMA
TIN/TUNGSTEN EXPANSION PROJECT
OPERATING COSTS
A. General
1. The estimated annual operating costs for each of the projectcomponents are summarized in Table 1. the estimates are based on the feasi-bility studies prepared by the consultants Osborne & Chappel, which wereprepared with due consideration of the factors outlined below.
B. Labour
2. Labour costs are directly dependent upon the manpower requirementsand wage rates applicable. The complement of labour required to operatethe dredge and other project components is based on Osborne & Chappel'sknowledge of the normal requirement for similar operations in Malaysia andincreased to compensate for the lack of experienced labour in Burma (3 shiftsper day for the dredge, one per day for other facilities).
3. The proposed manpower establishment for the major project compo-nents, Heinze Basin and the Tavoy concentrator, are given in Tables 2 and 3.The Government grades applicable to each classification of employee is giventogether with the standard Government wage rate. No provision has been madefor bonuses and other social benefits in these tables, but allowance have beenmade for these in the summarized costs in Table 1 (10% of wages for bonuses,8% for welfare fund).
C. Price Estimation
4. The estimation of the cost of fuels and materials required has beenbased on currently quoted Burmese Government rates or, where items are notdomestically available, on the quoted net prices in Malaysia. The latterhave been used as Malaysia is the world's major market for dredging sparesand a major producer of many items.
5. Replacement spares, maintenance materials and some freight andinsurance charges are the only items which would be purchased in foreigncurrency. This amounts to 31% of the total operating costs for the project.
ANNEX 7-1Page 2
D. Materials Consumption
6. The following approach has been used in the estimation of consump-tion of materials, fuels and spare parts:
Fuel and Other Consumable Materials
7. The consumption of these items is directly dependent on the charac-teristics of the machinery specified and/or its application. These itemsare not influenced by local conditions and therefore may be accurately esti-mated by reference to historic records of similar operations.
Maintenance Materials Including Machinery Replacements
8. The consumption of these items is influenced by working conditionsappertaining to the locality where the dredge or other plant operates in addi-tion to the normal operational factors such as wear and tear.
9. The estimate of usage of these items presents some problems as itrequires the estimation of abnormal rates of wear due to abrasive ground orcorrosion. In formulating estimates of replacements required, subjectiveadjustments of Osborne & Chappel's own records have been made after a reviewof dredge operations in similar conditions.
E. Freight and Port Charges Including Insurance In Carriage
10. These have been estimated in the same manner as those for capitalcosts given in Annex 5-2.
F. Import Duties and Commodity Taxes
11. Import duty has been charged on imported materials at 15% and com-modity tax at 30%.
G. Insurance
12. This has been calculated at a quoted rate of 1-1/2% of the valueof items being covered. This information was based on informal advice fromthe Savings and Insurance Division of the People's Bank of the Union of Burmaand provides for all risks cover.
Industrial Projects DepartmentNovember, 1976
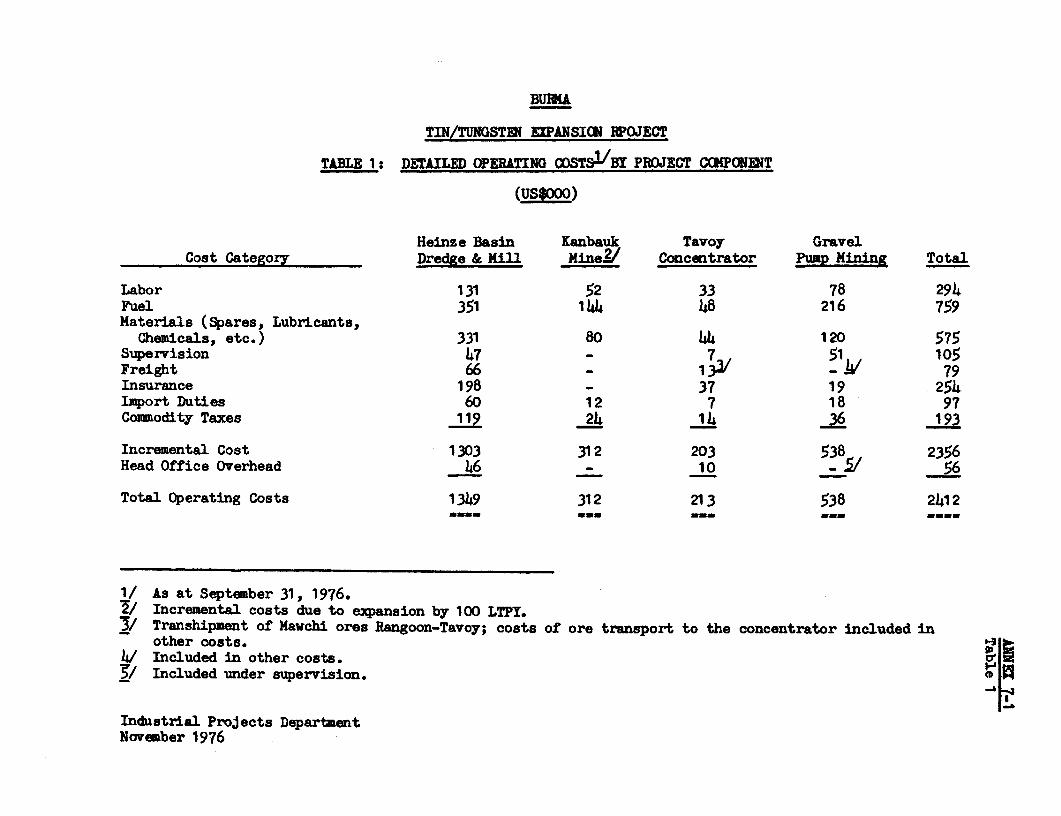
BUMA
TIN/TUNGSTEN EXPANSICI RPOJECT
TABLE 1: DETAILED OPERATING OOSTS"/BY PROJECT CCNPORiNT
(uS$Ooo)
Heinze Basin Kanbauk Tavoy GravelCost Category Dredge & Mill mine / Concentrator Pump Mining Total
Labor 131 52 33 78 294Fuel 351 144 48 216 759Materials (Spares, Lubricants,
Chemicals, etc.) 331 80 144 120 575Supervision 47 - 7 51 105Freight 66 - 1 1 - Jv 79Insurance 198 - 37 19 254Import Duties 60 12 7 18 97Comodity Taxes 119 24 14 36 193
Incremental Cost 1303 312 203 538 2356Head Office Overhead 46 _ 10 - / 56
Total Operating Costs 1349 312 213 538 2412mm== mm= mwm==wm w
1/ As at September 31, 1976.2/ Incremental costs due to expansion by 100 LTPY.3/ Transhipmnt of Mawhoi ores Rangoon-Tavoy; costs of ore transport to the concentrator included in
other costs.4/ Included in other costs.§/ Included under supervision.
Induatrial Projects DepartmentNovember 1976

Table 2
?m1 BN0m WAIW NJCTsy mus rac PIM
TAME 2: lE UMxIM AND KILL
nmiJa O IADR 1R WI
O 2Z t HNo. Graf Wase
1 m
tLectrical
Shift Ohargmn 3 SL 330Relief 1 SL 330
MechaDiCal
Supervisor 1 JhI 700Had Sheet Metal Worker 1 AY 400Head Fitter 1 AY 400Eead Welder 1 AU 400Head Kechanic 1 AP 400Head BlackFith 1 AF 1400Sheet Metal Workers 3 SL 330Asistant Sheet Metal Workw} 3 SL 250Fitters 3 SL 330Assitant Fitters 2 SL 250Welders 2 SL 330Machinist. 2 SL 330Blackmith 1 SL 330Motor mech nica 1 SL 330Carpenters 1 SL 300Painters 3 SL 250
Crew
Shift supervisora 4 aM 700Winchen 4 F 500Oreaser 4 SL 250Rngine Attendants 4 SL 330Bucket Attudants 8 L 180Intake Attendants 6 L 180Screen AttendantB 3 L 180Jig Attendants 15 L 180Relief Workers 6 L 180
2. SHOlil. OUIL'Z & OPOUIID
Shore Supervisor 1 dMI 700Drivers (tractors, lorries,
land-rovers) 8 SL 250Carpenters 4 SL 300Cpoud Foreman 1 F 450Crpomd labourers 8 L 150Painters 2 SL 250Grasa-cutters 3 SL 250Outside gang 8 L 200Outside Foren 1 F 450
3. WATER TRANSPORT - SLDINS PUMPS
Supervisor 1 JMI 700Tug Pilots 3 AU 400Psssenger apan & barge
attendants 12 L 200Fuel & stores handling 4 L 150Store gang toreman 1 AP 350Concentrate handling 4 L 150Ore geng foresan 1 AF 350Slimes pump attendants 8 L 180
4. SHoUa UoRxSHOP
Supervisor (Mechanical) 1 JIU 700Head Welder I AU h4Head Blacksnith 1 Al 400Head Sheet metal worker 1 Al 400Head Mechanic 1 Al 400Head Fitter 1 AI 400Head ChargmAn I Al h400Welders 1 SL 330Asoistant Welders 4 SL 250Machinists 2 SL 330Blackmiths 1 SL 330Motor sechnics 2 SL 330Assistant echcanics 3 SL 250Shoet me*tl worker. 2 In 330Assistant Sheot worker. 2 SL 250Superisor (ELectrical) 1 .INI 700Charge_n I SS 330Fitters 2 SL 330Assistant Fitters SL 350
2/-

CI-. 2 _ -
iao. Oradb
5. MILL
Spervisor 1 au 700H"d Fitter 1 AU I40Sampler Y 400Operators 5 L 300R.l±f Workers 1 S 300
6. DSIUL 51M511! O&OlmlCUS
Seurity Officer 1 iN -- 700Security guards
dred4e 6 SL 330shore 6 SL 330relf 4 SL 330
Radio operators JI4I 500
7. Sll 51PICR
SurrVeor 1 iNI 700Assistants 2 .IN 500
8. CLEICAL
Miet Clerk 1 DilI 800P=roll & Acoounts Clerks 2 JEll 500Storekeeper 1 JIl 600Store Assistants 2 SL 250Typist 1 SL 250
9. DCAL-
Dresser/Nurse 1 JIUI 5001
10. SIOR 9 SALLaID TAFA
Kni rNer 1 K 1,I400Dre_temaser 1 y 1,300Kechanicl Engineer 1 S9 1,200ILoctrical hgineer 1 SK 1,200dnoeral Dredsing Igineer 1 DK 1,200AAmnistrative Officer 1 8K 1,200Doctor 1 Sl 1,200
SWIR
Categories No. Cost(lYats/IXaoth)
Senlor Maagamenut 7 8,700Jvnior Nae_gent I 13 9,200Junior ma1agaenut II 10 5,100Formu 6 2,900Assistant Forem 18 7,100Skilld Labourrs 98 28,810Laborer 82 146&o
Total I 7
Iote, IN - enior ammagerialJ - Jnior _mg eriel (Or. I-n)J - forwanAl a asdistant formen5L - eilled labourer, - labour
Instrial i*oss DepartmtNovember 196
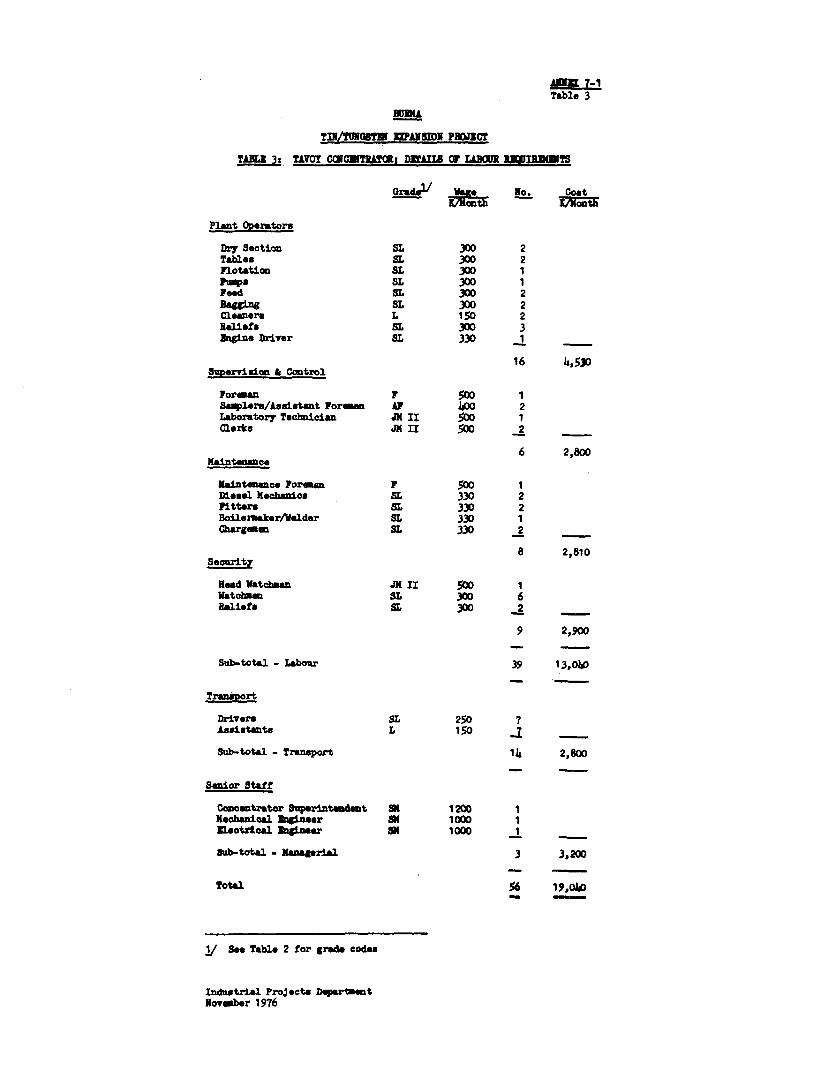
A 7-iTable 3
BUllU
TIN/TCN0BU WAPJISION Pll RCT
TA4N 3: TATOr CWCNITRA!TCt DITAIL C LABOUR IInIITS
Grade2' Wg No. CoatIMmonth
Plant Operators
Dry Section SL 300 2Tables Si 300 2Flotation SL 300 1imp. SL 300 1Fe"d SL 300 2Baging SL 300 2Cleaners L 150 2Reliesa SL 300 3Bagine Driver SL 330 1
16 h1,5j0Supervisio & Cotrol
Foran F 500 1Samlers/Assistant Foreman Al 40o 2Laboratory Technician Ji n 500 1Cle r. JN II 500 2
Maintenance 6 2,800
Mainatnance Foran F 500 1Diosel Mechanica SL 330 2Fitters SL 330 23cdleraker/Welder SL 330 1Qhargm_n SL 330 2
8 2,810Security
Head Watchman J II 5°0 1Watebumn SL 300 6Reliefa SL 300 2
9 2,900
Sub-total - Labour 39 13,040
Trananort
Drivers SL 250 7Assistanta L 150 z
Sub-total - Transport 14 2,8o0
Senior Staff
Conaentrator SuperinteDdent SK 1200 1Mechanical ingineer 3K 1000 1Alectrical Bagineer ON 1000 1
8ub-total - Managerial 3 3,200
Total 56 19,040
/ Se Table 2 for grade cod e
Industrial ProJecta DepartmentNovember 1976
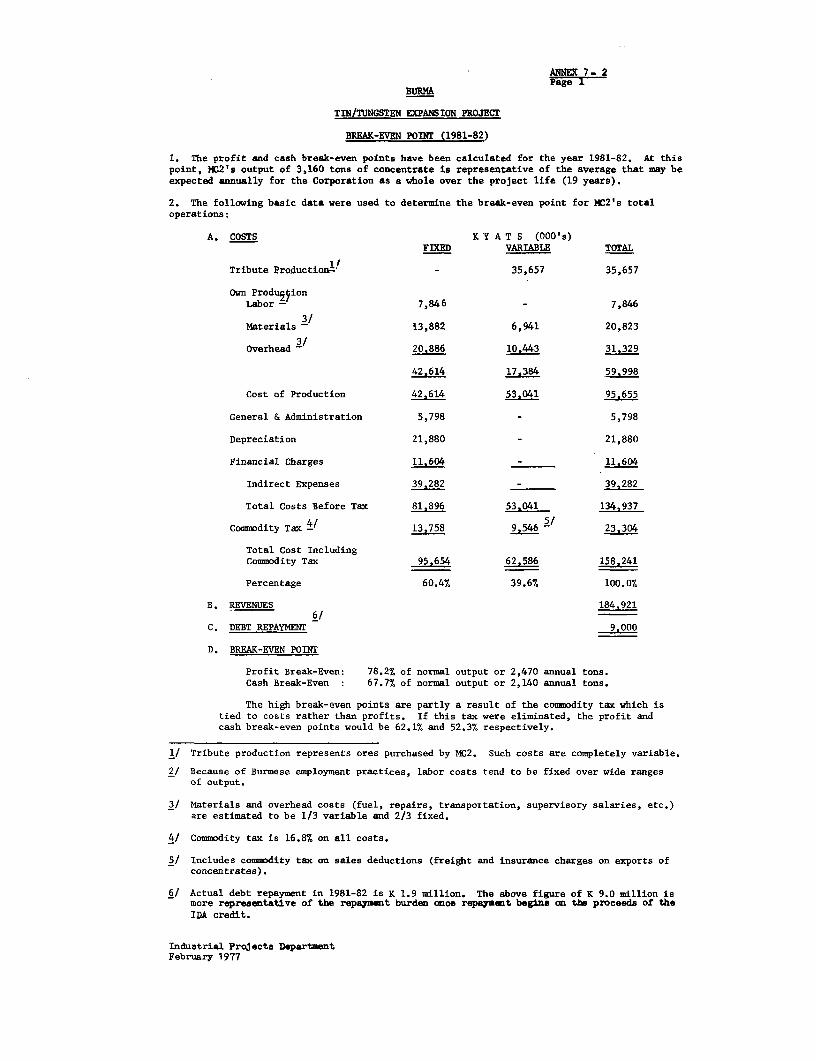
ANNEX 7- 2Page 1-
BURMA
TIN/TUNGSTEN EXPANSION PROJECT
BREAK-EVEN POINT (1981-82)
1. The profit and cash break-even points have been calculated for the year 1981-82. At thispoint, MC2's output of 3,160 tons of concentrate is representative of the average that may beexpected annually for the Corporation as a whole over the project life (19 years).
2. The following basic data were used to determine the break-even point for MC2's totaloperations:
A. COSTS K Y A T S (000's)FIXED VARIABLE TOTAL
Tribute Production-t - 35,657 35,657
Own Produ5 ionLabor - 7,846 - 7,846
Materials - 13,882 6,941 20,823
Overhead 3 20.886 10.443 31,329
42.614 17.384 59.998
Cost of Production 42,614 53.041 95.655
General & Administration 5,798 - 5,798
Depreciation 21,880 - 21,880
Financial Charges 11,604 - 11.604
Indirect Expenses 39.282 - 39,282
Total Costs Before Tax 81,896 53.041 134,937
Commodity Tax 4/ 13,758 9,546 - 23,304
Total Cost IncludingCommodity Tax 95.654 62.586 158.241
Percentage 60.4% 39.6% 100.0%
B, REVENUES 184.9216/
C. DEBT REPAYMENT 9,000
D. BREAK-EVEN POINT
Profit Break-Even: 78.2% of normal output or 2,470 annual tons.Cash Break-Even : 67.7% of normal output or 2,140 annual tons.
The high break-even points are partly a result of the commodity tax which istied to costs rather than profits. If this tax were eliminated, the profit andcash break-even points would be 62.1% and 52.3% respectively.
1/ Tribute production represents ores purchased by MC2. Such costs are completely variable.
2/ Because of Burmese employment practices, labor costs tend to be fixed over wide rangesof output.
3/ Materials and overhead costs (fuel, repairs, transportation, supervisory salaries, etc.)are estimated to be 1/3 variable and 2/3 fixed.
4/ Commodity tax is 16.8% on all costs.
5/ Includes commodity tax on sales deductions (freight and insurance charges on exports ofconcentrates).
6/ Actual debt repayment in 1981-82 is K 1.9 million. The above figure of K 9.0 million ismore representative of the repayment burden once repayment begins on the proceeds of theIDA credit.
Industrial Projects DepartmentFebruary 1977

ANNEX 7-2Page 2
BURMA
TIN/TUNGSTEN EXPANSION PROJECT
BREAK-EVEN POINT (1981-82)
Kyats (000's)
200
Break-EvenPoint/
100 ixed Costs
0~~~~~~~~~~~~~~~~~~~~~~~~~~~~~~</ ~~~~~~~~~~~~~~~~~~~~~~~~~~I
/ ~~~~~~~~~~~~~~~~~~~~~~~~~~I
2470 3,160
Tons of Output
Industrial Projects Departsent
October 1976
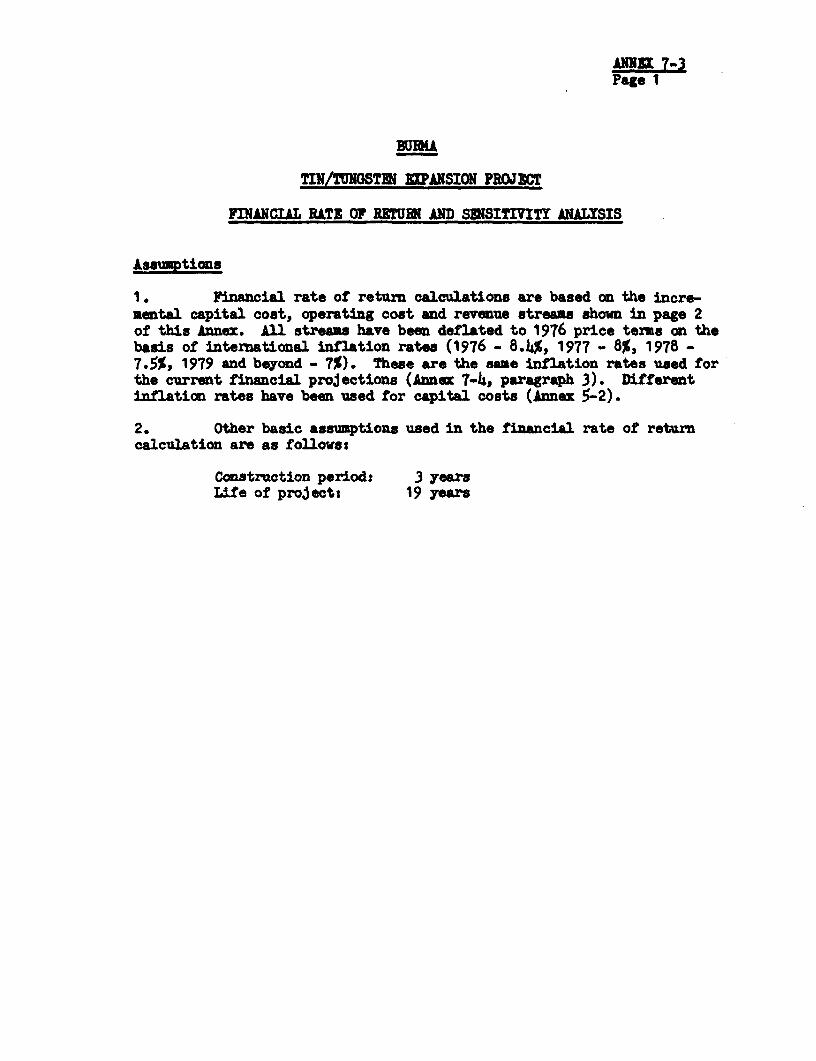
ANNEX 7-3Page I
BURKA
TIN/TUNGST$N UPANSION PROJECT
FINANCI RATS OF RETURN AND SENSITIVIfT ANALYSIS
Assumptions
1. Financial rate of return calculations are based on the incre-mental capital cost, operating cost and revenue streams shown in page 2of this Annex. All streams have been deflated to 1976 price terms on thebasis of international inflation rates (1976 - 8.4J%, 1977 - 8%, 1978 -7.5%, 1979 and beyond - 7%). These are the same inflation rates used forthe current firancial projections (Annex 7-4., paragraph 3). Differentinflation rates have been used for capital costs (Annex 5-2).
2. Other basic assumptions used in the financial rate of returncalculation are as follows:
Construction period: 3 yearsLife of projectt 19 years
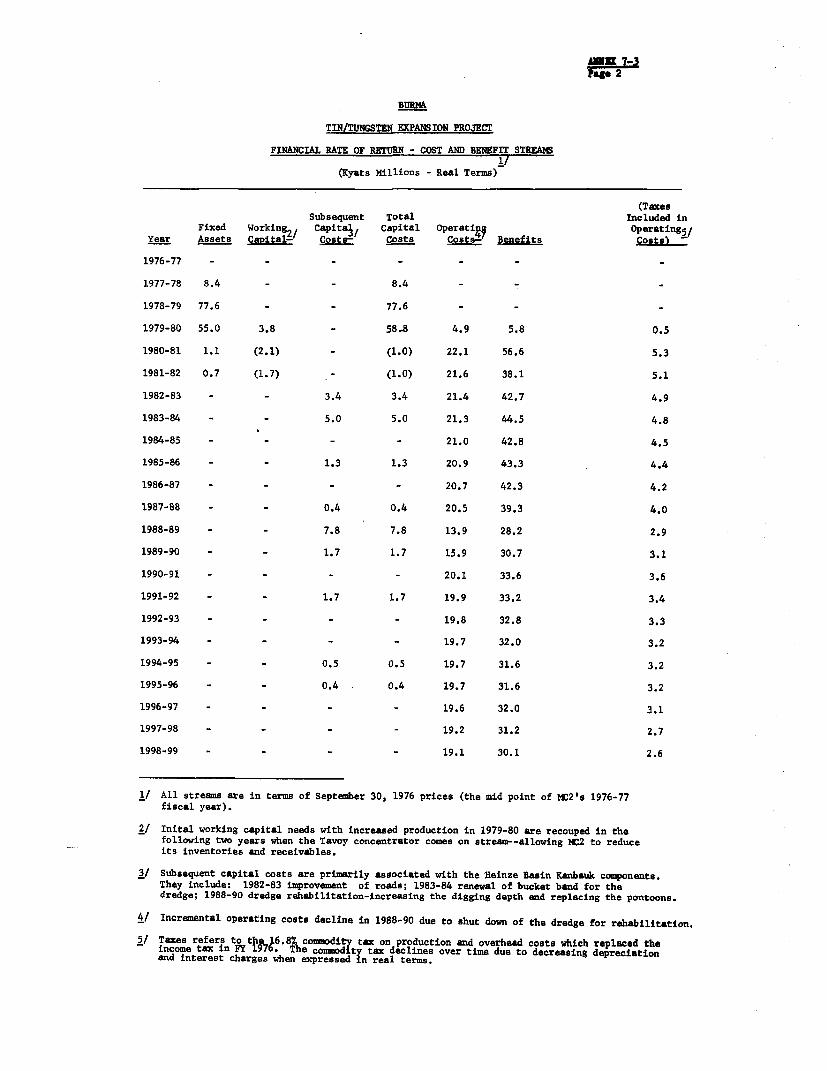
AMUX 7-3Pagl 2
BURMA
TIN/TUNGSTEN EXPANSION PROJECT
FINANCIAL RATE OF RETURN - COST AND BENEFIT STREAMS1/
(Kyats Millions - Real Terms)
(TaxesSubsequent Total Included in
Fixed Working2/ Capital/ Capital Operatigg Operating5/Year Assets Capital- Costs- Costs Costs- Benefits Costs) -
1976-77 - - - - - -
1977-78 8.4 - - 8.4 -
1978-79 77.6 - - 77.6 - -
1979-80 55.0 3.8 - 58.8 4.9 5.8 0.5
1980-81 1.1 (2.1) - (1.0) 22.1 56.6 5.3
1981-82 0.7 (1.7) - (1.0) 21.6 38.1 5.1
1982-83 - - 3.4 3.4 21.4 42.7 4.9
1983-84 - - 5.0 5.0 21.3 44.5 4.8
1984-85 - - - - 21.0 42.8 4.5
1985-86 - - 1.3 1.3 20.9 43.3 4.4
1986-87 - - - - 20.7 42.3 4.2
1987-88 - - 0.4 0.4 20.5 39.3 4.0
1988-89 - - 7.8 7.8 13.9 28.2 2.9
1989-90 - - 1.7 1.7 15.9 30.7 3.1
1990-91 - - - - 20.1 33.6 3.6
1991-92 - - 1.7 1.7 19.9 33.2 3.4
1992-93 - - - - 19.8 32.8 3.3
1993-94 - - - - 19.7 32.0 3.2
1994-95 - - 0.5 0.5 19.7 31.6 3.2
1995-96 - - 0.4 0.4 19.7 31.6 3.2
1996-97 - - - - 19.6 32.0 3.1
1997-98 - - - - 19.2 31.2 2.7
1998-99 - - - - 19.1 30.1 2.6
1/ All streams are in terms of September 30, 1976 prices (the mid point of MC2's 1976-77fiscal year).
2/ Inital working capital needs with increased production in 1979-80 are recouped in thefollowing two years when the Tavoy concentrator comes on stream--allowing MC2 to reduceits inventories and receivables.
3 Subsequent capital costs are primarily associated with the Heinze Basin Kanbauk components.They include: 1982-83 improvement of roads; 1983-84 renewal of bucket band for thedredge; 1988-90 dredge rehabilitation-increasing the digging depth and replacing the pontoons.
4/ Incremental operating costs decline in 1988-90 due to shut down of the dredge for rebabilitation.
5/ Taxes refers to t$716.8commodity tax on production and overhead costs which replaced theincome tax in IYi T e commodity tax declines over time due to decreasing depreciationand interest charges when expressed in real terms.
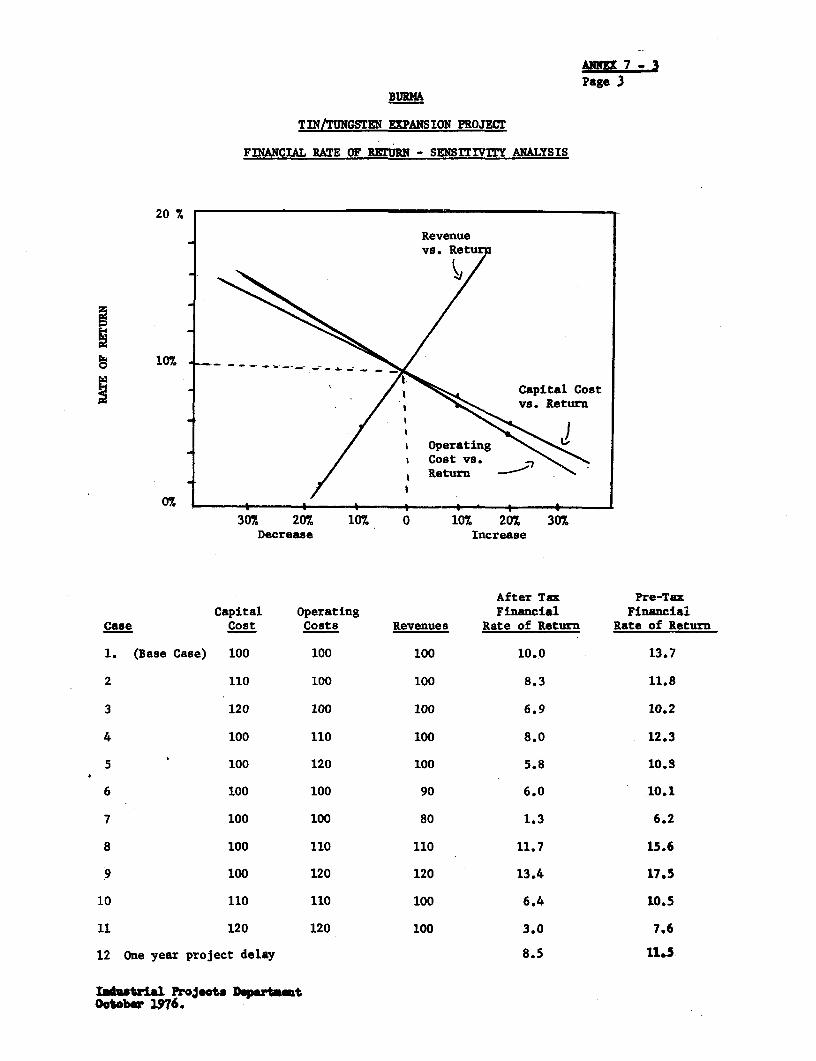
ANNEX 7Paes 3
BURNA
TIN/TUNGSTEN EXPANSION PROJECT
FINANCIAL RATE OF REIURN - SENSITIVTY ANALYSIS
20 %7
Revenue
107.
. ~ ~ ~ ~ ~ ~ ~ ~~~~~s Returen
/ "~~ Olperatin/ C Cost vs. ap C
. / \ ~~~~~~Return . -
0% 1307 20% 10% 0 10% 207 30%
Decrease Increase
After Tax Pre-TaxCapital Operating Financial Financial
Case Cost Costs Revenues Rate of Return Rate of Return
1. (Base Case) 100 100 100 10.0 13.7
2 110 100 100 8.3 11.8
3 120 100 100 6.9 10.2
4 100 110 100 8.0 12.3
5 100 120 100 5.8 10.8
6 100 100 90 6.0 10.1
7 100 100 80 1.3 6.2
8 100 110 110 11.7 15.6
9 100 120 120 13.4 17.5
10 110 110 100 6.4 10.5
11 120 120 100 3.0 7.6
12 One year project delay 8.5 11.5
InalJtr1l ProJeota DspartmtOotobw2 1976.
ANNEX 7-14Page 1
BURKA
TIN/TUNGSTEN MAPANSION PROJECT
ISSUMPTIONS USED IN FINANCIAL PRIJECTIONS
A. INOCKE STATEMUNT
1. Gross Sales
(a) Tonnage
Tonnage sales by type of concentrate are based on theProjected Output by Mine table (Annex 7-8). Also, tonnagesales are affected by changes in inventory levels eachyear. Assumpticas on inventory levels are given inparagraph 7 (c) of this Annex.
(b) Selling Prices
Prices for tin and tungsten concentrates are based onforecast setal prices prepared by the Comodities andExport Projections Divisimn (Annexes 3-1 and 3-2)Details on the "revenue factor" used to calculaterevenues to MC2 as a percentage of the forecast metalprice are given in Annex 7-6.
2. Sales Deductions
Freight, insurance, MEIC comission, and furthw treatment chargesare deducted from XC2'a gross sales. In the past, these have averaged 6%to 7% of sales revenues. Thia is expected to decline to 4% during F177-80with the replacement of MIEC (which charges a 239 comission) by themarketing committee. Once the Tavoy concentrator comes on stream treat-ment charges will be eliminated (presently about 2% of gross aales 5 reduc-ing sales deductions to 2% in PY81 and beyond.
3. Cost of Production
Costs of production by mine are given in Annex 7-7. Informationon operating costs of the project components (Heinze Basin, Gravel Pumps,Tavoy Concentrator) is provided in Annex 7-1. For existing mines, pro-duction cost forecasts are based on the followings
(a) Tonnage output by mine for both tributor and Coxporationoperations as detailed in Annex 7-8.
ANNEX 7-hPage 2
(b) Total production costs reprosents the cost of MC2's ownoutput as well as tb cost of purchased ores from tribu-tore.
(c) The cost of purchased ores is equal to tribute outputtimes the relevant tribute rates by mine. It is assmedprices paid for tribute ore will remain constant in realterse over the forecast period.
(d) Costa by nine of KC2as own production are based on FY76costs with adjustment to reflect the present situation.Labor costs have been increased 25% in FY77. This takesinto account the 10% cost of living adjustment grantedto workers in July 1976, plus bonuses and the socialsecurity scheae introduced by the Government in 1976 whichwill raise labor costs a further 15%. In addition, costsof imported materials included in operating costs havebeen raised 30% to reflect the new commodity tax on suchimports. Overall, the effect of tbese changes is to raisecosts of MC2's own production by 20-25% at each mine site.It is assmed that, over the balance of the forecastperiod, costs of WC2's ow production will rmain constantin real terms, except where affected by expansion ormodernization projecta (Heinda and the IDA project).
(e) Costs at the Hinda mdne are expected to rise substantiallyover the next three years. In addition to the factors'mentioned in (d), this is the result of the expansion ofmining activities at this site in connection with thecurrent rehabilitation program due to come on stream in1977. Based on discussions with the Corporation andanalysea of existing data, C2' s productiom costs atHeinda are forecast to rise (in constant terms) at 70% ofthe rate of increase in output over the Fr76-79 period(output risea from 140 to 940 tons or 6.7 times, own pro-duction costs rise from K2.9 to K13.7 million or 4.7 times).
(f) Output and production coats at the Kanbauk mine increasein 7I80 as a result of closer supervision of these opera-tions as implementation of the Heinse Basin project pro-ceeds. Increrental operating costs are obtained from thevariable Coat compoents of the Gravel Pump operatingcost table in Annex 7-1.
4. Inlation of Costs and Revenues
It is assumed that escalation of both costs and revenues willapproximate world inflation rates as forecast by the Bank (1976 - 8.4t,1977 - 8%, 1978 - 7.5%, 1979 and beyond - 7%). This assumption is basedan the following factors:

ANEX 7-4Page 3
(a) All of MC2's revenues and about 30% of production costsare in foreign exchange or are foreign exchange reated(i.e. duties and couodity taxes an imported materials).
(b) With respect to local production costs (70% of the total),the majority of these are made up of labor (10% of totalproduction costs) and ores purchased from tributors (50%of total production costs). Based on MC21s past experience,these costs should be largely set by the Corporation'sability to pay - i.e. the prices it receives for its out-put - and thus may be reasonably assumed to follow inter-national inflation rates.
While devaluation of the kyat over the forecast period is possible,such an occurence would lead to a proportionately greater increase inrevenues than in costs. This would result in an improvement in cash flowsand financial rate of return above those presently projected.
5. Indirect Expenses
(a) Interest
Interest on onlending of the IDA credit from GOB to KC2is assumed at 10%. Interest on other loans (FRG loanfor the Heinda mine) is about 2¼% annually.
(b) General and Administration
These costs are projected at 6% of annual produstioncosts. This is in line with MC2's experience over theFY72-76 period.
(c) Depreciation
Depreciation is forecast at 7.5% of operating assets atyear end.
6. Comodity Tax
A 16.8% commodity tax on cost of sales, overhead, interest anddepreciation costs incurred in the year replaces the 50% income tax,beginning FY77. This is based on a 15% tax on the sum of total operatilngcosts plus a 12% nominal profit.
B. BALANCE SHEET
7. Current Assets
(a) Cash and Bank
Forecast at 5% of production costs.

ANNEM 7-4Page 4
(b) Receivables
Receivables are projected to decline from 33% of salesin FY76, to 25% in FY77, and to 16.7% over the Fr78-80period. This improvement will be achieved through areduction in the delays in transmission of cash receiptsto KC2 after the Marketing Committee assumed control ofthe Corporation's sales in late 1976. A further reduct-ion in receivables to 8.3% of sales in forecast for Fr81and beyond once the Tavoy ooacentrator comes on streamand MC2 can enter into long term smelter contracts forits production.
(a) Mineral Ores Inventory
Inventories of mineral ores are expected tp decline from103% of production coats in 7176 to 70% in F717. In factmost of this reduction has already been achieved. At theend of Auguat 1976 MC2's inventories of mineral ore were35% below year-end levels. Closer control over inventorylevels in future should allow a reduction to 60% of pro-ductimn coats in F778, and to 33% over the F779-80 period.In F781, with the start-up of the Tavoy concentrator,elimination of the need to process and re-process poorquality concentrates, and the establishment of smeltercontracts, a further redoution in inventories to 16.7% ofproduction costs is possible.
(d) Supplies Inventory
Inventories of supplies are forecast at 40% of productioncosts in FY77, 35% in Fr78, and 30% thereafter.
(e) Other Receivables
Forecast at 15% of production costs.
8. Current Liabilities
(a) Accounts Payable
MC21s purchases are conducted almost entirely on a cashbasis. Accounts payable are thus forecast at 5% of pro-duction costs.

ANNIZ 7-4
(b) Tames Payable
It in ewpected 3C2 wil1 rmit the accusulated incame taxpayable by the end of FY77. Comodity tax.s are to betranitted to the Goverment as sales are made, thus itis unmikely that a significant payable in this respectwill arise.
Indnstrial Projects DepartmentJanuary 1977
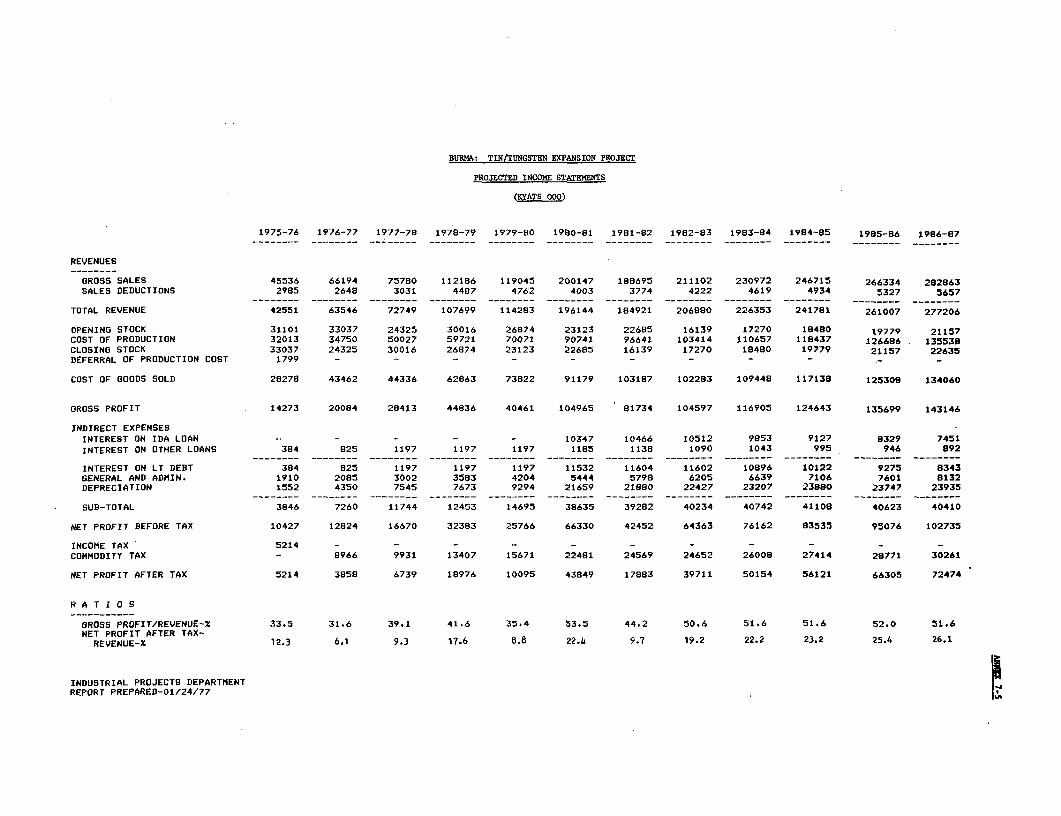
BURMA: TIN/TUNGSTEN EXPANSION PROJECT
PROJECTED INCOME STATEMENTS
(ICATS 000)
1975-76 1976-77 1977-78 1978-79 1979-80 1980-81 1981-82 1982-83 1983-84 1984-85 1985-86 1986-87
REVENUES
GROSS SALES 45536 66194 75780 112186 119045 200147 188695 211102 230972 246715 266334 282863SALES DEDUCTIONS 2985 2648 3031 4487 4762 4003 3774 4222 4619 4934 5327 5657
TOTAL REVENUE 42551 63546 72749 107699 114283 196144 184921 206880 226353 241781 261007 277206
OPENING STOCK 31101 33037 24325 30016 26874 23123 22685 16139 17270 18480 19779 21157COST OF PRODUCTION 32013 34750 50027 59721 70071 90741 96641 103414 110657 118437 126686 135538CLOSING STOCK 33037 24325 30016 26874 23123 22685 16139 17270 18480 19779 21157 22635DEFERRAL OF PRODUCTION COST 1799 - - - - - - - - -
COST OF GOODS SOLD 28278 43462 44336 62863 73822 91179 103187 102283 109448 117138 125308 134060
GROSS PROFIT 14273 20084 28413 44836 40461 104965 81734 104597 116905 124643 135699 143146
INDIRECT EXPENSESINTEREST ON IDA LOAN - - - - - 10347 10466 10512 9853 9127 9329 7451
INTEREST ON OTHER LOANS 384 825 1197 1197 1197 1185 1138 1090 1043 995 946 892
INTEREST ON LT DEBT 384 825 1197 1197 1197 11532 11604 11602 10896 10122 9275 8343GENERAL AND ADMIN. 1910 2085 3002 3583 4204 5444 5798 6205 6639 7106 7601 8132DEPRECIATION 1552 4350 7545 7673 9294 21659 21880 22427 23207 23880 23747 23935
SUB-TOTAL 3846 7260 11744 12453 14695 38635 39282 40234 40742 41108 40623 40410
NET PROFIT BEFORE TAX 10427 12824 16670 32383 25766 66330 42452 64363 76162 83535 95076 102735
INCOME TAX 5214 - - - - - - - - - - -
COMMODITY TAX - 8966 9931 13407 15671 22481 24569 24652 26008 27414 28771 30261
NET PROFIT AFTER TAX 5214 3858 6739 18976 10095 43849 17883 39711 50154 56121 66305 72474
R A T I O S
GROSS PROFIT/REVENUE-X 33.5 31.6 39.1 41.6 35.4 53.5 44.2 50.6 51.6 51.6 52.0 51.6NET PROFIT AFTER TAX-
REVENUE-Z 12.3 6.1 9.3 17.6 8.8 22.4 9.7 19.2 22.2 23.2 25.4 26.1
INDUSTRIAL PROJECTS DEPARTMENTREPORT PREPARED-01/24/77

BURMA: TIN/TUNGSTEN ESPASSION PROJECT
GROSS SALES
(STATS 000)
1975-76 1976-77 1977-78 1978-79 1979-80 t980-81 1981-82 1982-83 1983-84 1984-85 1985-86 1986-87_ _ _ _ _ _ _ _ _ _ _ _ _ _ _ _ _ _ _ - - -- _- - - - - - -- _ _ _ _ - - _-- - _ _- - _- - - - _ _ _ _ _ _ _ _ _ _ _ _ _ _ _ _ _ _ _ _ _ _ _ _ _ _
GROSS SALES
TIN CDNCENTRATES
VOLUME (000 TONS) 616.0 840.0 975.0 1490.0 151s.0 2675.0 2375.0 2480.0 2510.0 2450.0 2450.0 2425,0TIN PRlCE/TON ILMEP-KYATS 44673.0 51233.0 52146.0 53058.0 53970.0 54883.0 55794.0 56707.0 57619.0 58684.0 59290.0 59290.0REVENUE FACTOR .X .620 .650 .650 .650 .650 .695 .695 .695 .695 .695 .695 .695REV/TON OF CONCENTRATE 27697.0 33301.0 33895.0 34488.0 35081.0 38144.0 38777.0 39411.0 40045.0 40785.0 41207.0 41207.0REVENUE-O0O KYATS 17065.0 27973.0 33048.0 51387.0 53147.0 102034.0 92095.0 97740.0 100513.0 99924.0 100956.0 99926.0
TUNGSTEN CONCENTRATES
VOLUME (000 TONS) 497.0 595.0 670.0 650.0 580.0 880.0 8030.00 830.0 830. 0 830.0 830.0W03 PRICE/LTU (LMB)-KYATS 613.0 703.0 712.0 712.0 726.0 749.0 755.0 761.0 767.0 773.0 778.0 778.0REVJENUE FACTOR 2/ 58.100 59.500 59.500 59.500 59.500 62.000 62.000 62.000 62.000 62.000 62.000 62.000REV/ON OF CONCENTRATE 35615.0 41829.0 42364.0 42364.0 43197.0 46438.0 46810.0 47182.0 47554.0 47926.0 48236.0 48236.0REVENUE-O0O KYATS 17714.0 24888.0 28384.0 27537.0 25054.0 40865.0 38852.0 39161.0 39470.0 39779.0 40036.0 40036,0
MIXES CONCENTRATES
VOLUME (000 TONS) 442.0 350.0 345.0 680.0 650.0 220. o _ _ _REV/TON OF CONCENTRATE 22597.0 24187,0 24569.0 24824.0 25276.0 25853.0 _ - - _REVENUE-OOO KYATS 10021.0 8466.0 8476.0 16880.0 16429.0 5688.0 -
TIN METAL
VOLUME (000 TONS) 16.0 95.0 - - -TIN PRICE/TON (LME)-KYATS 44673.0 51233,0 -REVENUE FACTOR 1.440 1.000 - - -REV/TON OF METAL 64329.1 51233.0 - - -REVENUE-000 KYATS 1029.0 4867.1 - - -
OTHER SALES REVENUE (293.0) - - -
TOTAL SALES
VOLUME (000 TONS) 1571.0 1880.0 1990.0 2820.0 2745.0 3775.0 3205.0 3310.0 3340.0 32fO.0 3280.0 3255.0REVENUE-000 KYATS 45536.0 66193.8 69907.7 95803.8 94630.4 148587.5 130947.3 136901.2 139983.3 139702.8 140991.9 139961.8
INFLATION FACTOR 1.000 1.000 1.084 1.171 1.258 1.347 1.441 1.542 1.650 1.766 1.889 2.021
SALES-000 KYATS 45536.0 66194.0 75780.0 112186.0 119045.0 200147.0 188695.0 211102.0 230972.0 246705,0 266334.0 282863.0
j/ Based onen slyaia of sles contracts sd assay fEgoree for rsere prodoelioc, IC2 ceo be e-pected tore-lS1s the follo1iog retaUns on itc sales of coscestrateo over the 1976-80 period: tcn .oocentratec--65% of the124E price; ttogatan coocestrstea--59.5% of the pre.vilieg karket price; need cotceorr,t--28% of the LHE tic price
ad142 of th- pr-tLlins price for tungote. Once the Tw-yo co-centr.t.r come ou ttte Ln l9dO-81, irprowe-et inahipct gradee od rsoaovl of -ootiseno bhoold allo tche Corpoartiooo iprove It re-ra oo exititug sed project-aas.iated production to - average of 69.5% for ti and 62% for tssg.tsc.
Indnatrial Projects DprtnestOctober 1976

BURMKA: TIN/TUNGSTEN EXPANSION PROJECT
MINERAL CORPORATION NO. 2
PRODUCTION COSTS
(KYATS 000)
1975-76 1976-771' 1977-78 1978-79 1979-80 1980-81 1981-82 1982-83 1983-84 1984-85 1985-86 1986-87
MINES
HEINZEOUTPUT-TONS -- 650.0 400.0 580.0 580.0 510,0 '520.0 490.0COUrPTN-TAN894 - - 13331.0 21663.0 190.0 14940.0 16990.0 16663.0 17684.0COST-0OG KYATS - - 8665.0 8665.0 8665.0 8665.0 8665.0 8665.0 8665.0
MAUCHIOUTPUT-TONS 402.0 350.0 SOO5O 650.0 650.0 525.02/ 525.0 525.0 525.0 525.0 525.0 525.0COST/TON-KYATS 23726.0 29714.0 26800.0 23692.0 23692.0 29333.0 29333.0 29333.0 29333.0 29333.0 29333.0 29333.0COST-Oo KYATS 9538.0 10400.0 13400.0 15400.0 15400.0 15400.0 15400.0 15400.0 15400.0 15400.0 15400.0 15400.0
HEINDAOUTPUT-TONS 210.0 300.0 750.0 1000.0 1000.0 1000.0 1000.0 1000.0 1000.0 1000.0 1000.0 1000.0COST/TON-KYATS 19962.0 20667.0 16267.0 14800.0 14800.0 14800.0 14800.0 14800.0 14800.0 14800.0 14800.0 14800.0COST-Ooo KYATS 4192.0 6200.0 12200.0 14800.0 14800.0 14800.0 14800.0 14800.0 14800.0 14800.0 14800.0 14800.0
YADANABONOUTPUT-TONS 104.0 75.0 100.0 135.0 135.0 135.0 135.0 135.0 135.0 135.0 135.0 135.0COST/TON-KYATS 24500.0 33333.0 28000.0 23704.0 23704.0 23704.0 23704.0 23704.0 23704,0 23704.0 23704.0 23704.0COST-000 EYATS 2548.0 2500,0 2800.0 3200.0 3200.0 3200.0 3200.0 3200.0 3200.0 3200.0 3200.0 3200.0
KYAUKMEDAUNGOUTPUT-TONS 85.0 80.0 100.0 120.0 150.0 150.0 150.0 150.0 1500. 150.0 150.0 150.0COST/TONS-KYATS 23271.0 25000.0 21000.0 20000.0 19333.0 19333.0 19333.0 19333.0 19333.0 19333.0 19333.0 -193*.0'COST-O0O 1978.0 2000.0 2100.0 2400.0 2900;0 2900.0 2900.0 2900.0 2900.0 2900.0 2900.0 29e8.0
NERMYlNGYYOUTPUT-TONS 207.0 160.0 200.0 200.0 200.0 200.0 200.0 200.0 200.0 200.0 200.0 200.0COST/TON-KYATS 18309.0 21875.0 20000.0 20000.0 20000.0 20000.0 20000.0 20000.0 20000.0 20000.0 20000.0 20000.0COST-00o KYATS 3790.0 3500.0 4000.0 4000.0 4000.0 4000.0 4000.0 4000.0 4000.0 4000.0 4000.0 4000.0
KAN8AUKOUTPUT-TONS 171,0 170,0 250.0 250.0 350.0 350.0 350.0 350.0 350,0 350,0 350.0 350.0COST/TON-0KATS 25439.0 29412.0 26000.0 26000.0 24571.0 24571.0 24571.0 24571.0 24571,0 24571,0 24571.0 24571.0COST-000 KYATS 4350.0 5000.0 6500.0 6500.0 8600.0 8600.0 8600.0 8600.0 8600.0 8600.0 9600.0 9600.0
NANTHILAROUTPUT-TONS 16.0 15.0 15.0 - - - - - -COST/TON-KYATS 22313.0 30000.0 30000.0 - - -COST-OO KYATS 357.0 450.0 450.0 - - - - - - - -
OTHER NINESOUTPUT-TONS 307.0 250.0 250.0 250.0 250.0 250.0 250. 0 250.0 250.0 250.0 250.0 250.0COST/TON-KYATS 17134.0 18800.0 18800.0 18800.0 18800.0 18800.0 18800.0 18800.0 18800.0 18800.0 18800.0 18800.0COST-O00 KYATS 5260.0 4700.0 4700.0 4700.0 4700.0 4700.0 4700.0 4700.0 4700.0 4700.0 4700.0 4700.0
GRAVEL PUMPSOUTPUT-TONS - - - - 75.0 150.0 150.0 150.0 150.0 150.0 150.0 150.0CDST/TONS-RYATS - 28000.0 24000.0 24000.0 24000.0 24000.0 24000.0 24000.0 24000.0COST-000 EYATS -2100.0 3600.0 3600.0 3600.0 3600.0 3600.0 3600.0 3600.0
NEW CONCENTRATOR (INCR. COST) 1200.0 1200.0 1200.0 1200.0 1200.0-000 KYATS - - 1500.0 1200.0 10. 200 10. 20010.
TOTAL OUTPUT-TONS 1502.0 1400.0 2165.0 2605.0 2B10.0 3410.0 3160.0 3340.0 3340.0 3270.0 3290.0 3250.0AVERAGE COST/TON-KYATS 21313.6 24821.4 21316.4 19577.7 19822.1 19755.1 21223.1 20079.3 20079.3 20509.2 20446.6 20635.4TOTAL COST-00G KYATS 32013.0 34750.0 46150.0 51000.0 55700.0 67365.0 67065.0 67065.0 67065.0 67065.0 67065.0 67065.0
INFLATION FACTOR 1.000 1.000 1.084 1.171 1.258 1.347 1.441 1.542 1.650 1.766 1.89 2.021TOTAL PRODUCTION COsN
-000 KYATS 32013.0 34750.0 50026.6 59721.0 70070.6 90740.7 96640.7 - 103414.2 110657.3 118436.8 126685.8 135538.4
A/ e result of seourity problees an transportation bottleneks involving shipents of diesel oil, MC2's output i. expected to d eline atsat aim sites in 1976-77. These problsa are presently being reolved and 1977-78 produotion sould be at mrssl levels.
Separation of 650 tons of sixed coneontrates into their ole n oomponents yields 525 tons of separated ores.
Iwstrial Projects Depert.entOctober 1976
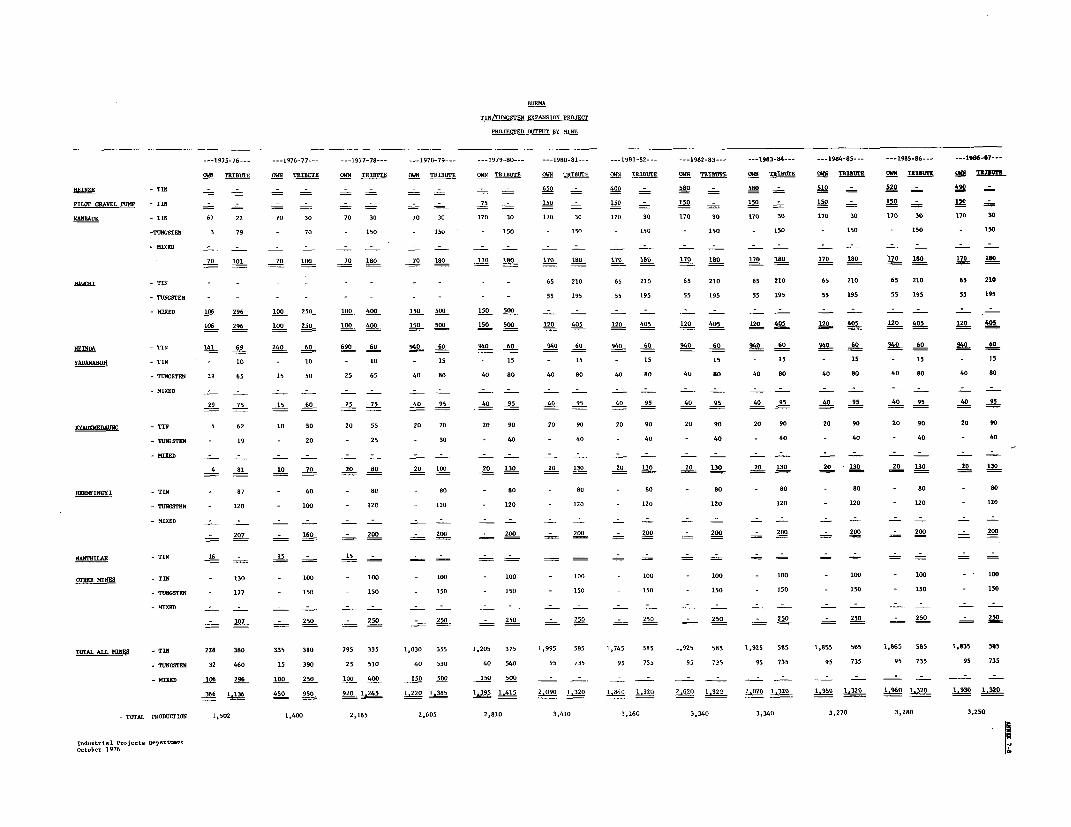
BURMA
TIN/TUNCSTEN EXPA9SION PROJECT
PROJECTED 00PUT bY 14INE
--- 1975-76___ --- 1976-77--- --- 1977-78--- --- I97879--- --- 1979-80--- --- 1980-U-- --- _1981-82--- --- 1982-83 --- -1983-4--- - 1984-85-- --- 1985-8--- --- 19B6-87---
OUR TRIBUIE OWN TRIB.TE OWN TRIBUtE OWN TRIBUTE OWN TRIBUTE OWN TRIBUIE OWN TRIBUSE 0M5N TRIBUTE owN TRIBUIE OWN TRIbUTE (MI TRIBUTE r! TUIE
REISZE -TIN _ 650 - 0 - 580 _ 580 - 510 _ 20 _ -
PIlW GRAVEL PUP -TIN _ _ _ _ _ = _ 75 - 150 - 150 - 50 150 - 150 _ - 150 -IO
KANNLAUK -TIN 67 22 70 30 70 30 70 30 170 30 170 30 170 30 170 '0 170 30 170 30 170 30 170 30
-TUNGSTEN 3 79 - 70 - 150 - ISO - 150 - 150 - 150 - 150 -150 - 150 - 158 - 15O
-MIXED - - - - - --- -
70 101 70 100 70 180 70 180 170 180 170 180 170 180 170 180 170 a80 170 180 170 ISO 170 180
mI -TIN - - - - - - - - - - 65 210 65 210 65 210 65 210 65 210 65 210 65 210
-TUNGSTEN - - - - - - - - - - 55 195 55 195 55 195 55 195 55 195 55 195 55 195
-MNXED 106 296 100 250 100 400 150 50U 150 500 - -150 50- - -0 - - - - _
106 296 100 250 100 400 150 5UE 150 500 120 405 120 405 120 405 120 405 120 128 405 120 405
HEINA -TIN 141 69 240 60 690 60 940 60 940 60 940 60 940 60 940 60 940 60 940 60 940 60 940 80
YADANABON -TIN - 10 - 10 - 10 - 15 - 15 - 15 - 15 - 15 - 15 - 15 - 15 - 15
-TUNGSTEN 29 65 15 50 25 65 40 80 40 80 40 80 40 8o 40 80 40 80 40 80 40 80 40 80
-IM2ED - - _ - _ - _ - _ -- - - -- - - - -- - - - -
29 75 15 60 25 75 40 95 40 95 40 95 40 95 40 95 40 95 40 95 40 95 40 95
KYAUIIKIM - TIN 4 62 10 50 20 55 20 70 20 90 20 90 20 90 20 90 20 90 20 90 20 90 20 90
-TUIBISTEN - 19 - 20 - 25 - 30 - 40 - 40 - 40 - 40 - 40 - 40 - 40 - 40
-MIXED - _ - - - - - - - - - - - _ _ _ _ - - - - - - -
4 81 10 70 20 80 20 10 20 130 20 130 20 130 20 130 20 130 20 130 20 130 20 130
HERYINY7 YI - TIN - 87 - 60 - 8g o 80 80 - 80 - 80 - 80 - 80 - 80 - 80 - 80
-TUlNGSTEN - 120 - 100 - 120 - 120 - 120 - 120 - 120 - 120 - 120 - 120 - 120 - 120
_MIXED - - - - - - - - - - - - - - - - - - - - - - -
- 207 - 160 - 200 - 200 - 280 - 200 - 200 - 200 - 20 200 - 200 - 20
NANITHLAR - TIN 16 _ 15 _ 15 - _ _ _ _
CT8ERM KE -TIN - 130 - 100 - 100 - 100 - 100 _ 100 - 100 - 100 - 100 - 100 100 I 100
-TUNGSTEN - 177 _ 150 - 150 - 150 - 150 - 150 - 150 - 150 - 150 - 150 - 150 - 150
-IXED - _ _ _ - _ - -_ - _ _ - - _:._ - - -_
- 307 - 250 - 250 5 250 250 250 - 250 _ 250 - 250 - 250 - 250 - 250
TOTAL ALL MINES - TIN 228 380 335 310 795 335 1,030 355 1,205 375 1,995 585 1,745 585 1,925 585 1,925 585 1,055 585 1,865 581 1,835 585
- TUNGSIEN 32 460 15 390 25 510 40 530 40 540 95 235 95 735 9. 735 95 735 95 735 95 735 95 735
- MIXED 106 296 100 250 100 400 150 500 150 500 - - - _ _- _ _ - - - -
36 1136 4505 0 0 920 1.245 1.220 1.35 1.395 1.415 2.090 1.320 1.40 1.320 2.020 1.32 2.020 1,320 1.950 1.320 1_960 1,320 1.930 1.320
- T00AL RODUCSION 1,502 1,400 2,165 2,605 2,810 3,410 3,160 3,340 3,340 3,270 3,280 3,250
1.dut.NiN- P1o9e76 I 0eo.tw.ntOctober 1976
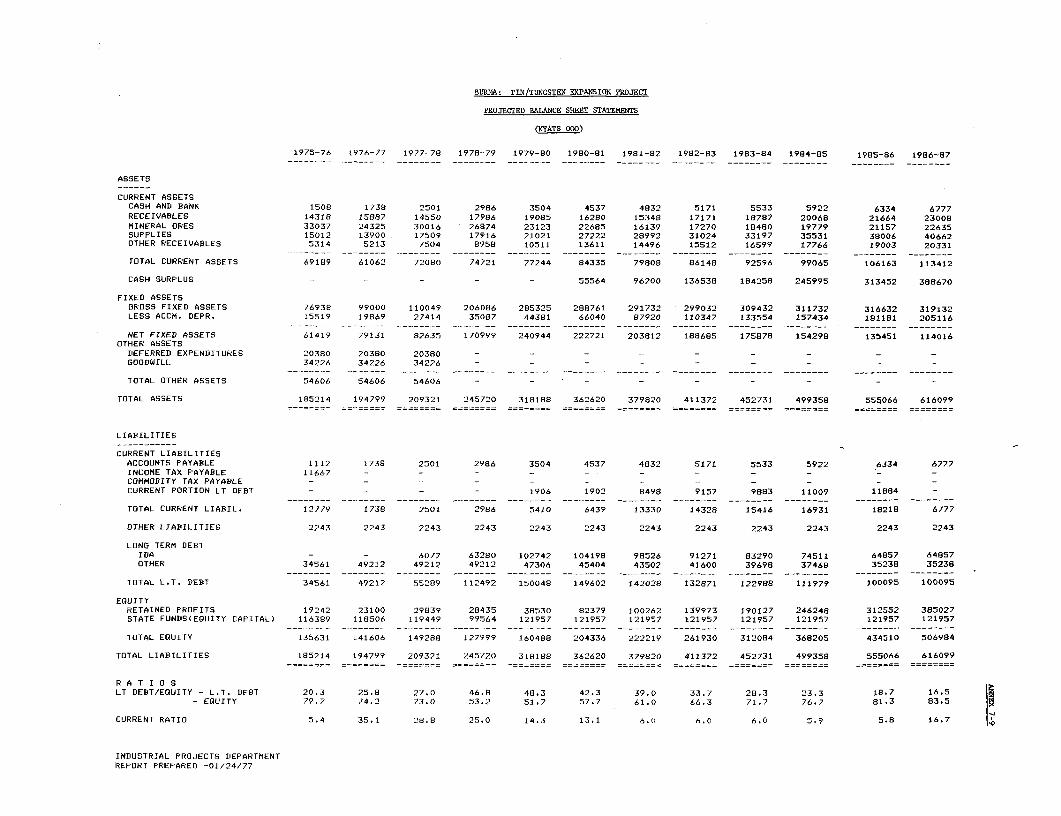
BUJMNA: TIN/TUNGSTEN EXPANSION PROJECT
PROJECTED BALANCE SHEET STATEMENTS
(KYATS 000)
1975-76 1976-71 1977-78 1978-79 1979-80 1980-81 1981-82 1982-83 1983-84 1984-85 1985-86 1986-87
ASSETS
CURRENT ASSETSCASH AND BANK 1508 1738 2501 2986 3504 4537 4832 5171 5533 5922 6334 6777RECEIVABLES 14318 15887 14550 17986 19085 16280 15348 17171 18787 20068 21664 23008MINERAL ORES 33037 24325 30016 26874 23123 22685 16139 17270 18480 19779 21157 22635SUPPLIES 15012 13900 1/509 17916 21021 27222 28992 31024 33197 35531 38006 40662OTHER RECEIVABLES 5314 5213 7504 8958 10511 13611 14496 15512 16599 17766 19003 20331
TOTAL CURRENT ASSETS 69189 61062 72080 74721 77244 84335 79808 86148 92596 99065 106163 113412
CASH SURPLUS - - - - - 55564 96200 136538 184258 245995 313452 388670
FIXED ASSETSGROSS FIXED ASSETS 76938 99000 110049 206086 285325 288761 291732 299032 309432 311732 316632 319132LESS ACCM. DEPR. 15519 19869 27414 35087 44381 66040 87920 110347 133554 157434 lS1lal 205116
NET FIXED ASSETS 61419 79131 82635 170999 240944 222721 203812 188685 175878 154298 135451 114016OTHER ASSETS
DEFERRED EXPENDITURES 20380 20380 20380 - - - - - - - - -GOODWILL 34226 34226 34226 - -
TOTAL OTHER ASSETS 54606 54606 54606 - - - - - - - - -
TOTAL ASSETS 185214 194799 209321 245720 318188 362620 379820 411372 452731 499358 555066 616099
ILIABILITIES
CURRENT LIABILITIESACCOUNTS PAYABLE 1112 1738 2501 2986 3504 4537 4832 5171 5533 5922 6334 6777INCOME TAX PAYABLE 11667 -- - - - - - - - -COMMODITY TAX PAYABLE - - - - - - - -- - - - -CURRENT PORTION LT DEBT - - - - 1906 1902 8498 9157 9883 11009 11884 -
TOTAL CURRENT LIABIL. 12779 1738 2501 2986 5410 6439 13330 14328 15416 16931 18218 6777
OTHER LIABILITIES 2243 2243 2243 2243 2243 2243 2243 2243 2243 2243 2243 2243
LONG TERM DEBTIDA - - 6077 63280 102742 104198 98526 91271 83290 74511 64857 64857OTHER 34561 49212 49212 49212 47306 45404 43502 41600 39698 37468 35238 35238
TOTAL L.T. DEBT 34561 49212 '5289 112492 150048 149602 142028 132871 122988 111979 100095 100095
EGUITYRETAINED FROFITS 19242 23100 29839 28435 38530 82379 100262 139973 190127 246248 312552 385027STATE FUNDS(EQUITY CAPITAL) 116389 118506 119449 99564 121957 121957 121957 121957 121957 121957 121957 121957
TOTAL EOUITY 135631 141606 149288 127999 160488 204336 222219 261930 312084 368205 434510 506984
TOTAL LIABILITIES 185214 194799 209321 245720 318188 362620 379820 411372 452731 499358 555066 616099
R A T I O SLT DEBT/EQUITY - L.T. DEBT 20.3 25.8 27.0 46.8 48.3 42.3 39.0 33.7 28.3 23.3 18.7 16.5
- EQUITY 79.7 74.2 73.0 53.2 51.7 57.7 61.0 66.3 71.7 76.7 81.3 83,5
CURRENT RATIO 5.4 35.1 28.8 25.0 14.3 13.1 6.0 6.0 6.0 5.9 5.8 i6.7 '9
INDUSTRIAL PROJECTS DEPARTMENTIREPORT PREPARED -01/24/77

BURNA: TIN/TUNGSTEN EXPANSION PROJECT
PROJECTED SOURCES AND APPLICATIONS OF FUNDS
(KYATS 000)
1975-76 t976-77 1977-78 1978-79 1979-80 1980-81 1981-82 1982-83 1983-84 1984-85 1985-86 1986-87
SOURCES
FROM OPERATIONSNET PROFIT AFrER TAX 5214 3858 6739 18976 10095 43849 17883 39711 50154 56121 66305 72474.DEPRECIATION 1552 4350 7545 7673 9294 21659 21880 22427 23207 23880 23747 23935
SUB-TOTAL-CASH GENERATION 6766 8208 14284 26649 19389 65508 39763 62138 73361 80001 90052 96409
IDA LOAN - - 6077 57203 39462 1456 924 - - - - -
OTHER FOREIGN LOANS 14390 14651 - - -
LOCAL LOANS
TOTAL LOANS 14390 14651 6077 57203 39462 1456 924 - - - - _
STATE FUND (EOUITY CAPITAL) 7484 2117 943 14341 22393 - - - - - - -
TOTAL SOURCES 28640 24976 21304 98t93 81245 66964 40687 62138 73361 80001 90052 96409
APPLICATIONS
FIXED ASSETS (INC.IDC)HEINZE BASIN/KANBAUK - - 8465 63467 62423 - - - - - - -TAVOY - - 984 11777 13400 - - - - -GRAVEL PUMPS - - - 18680 1137 - - - - - - -TECHNICAL ASSISTANCE - - - 413 479 1536 971 - - - - -HEINDA 20942 22062 - - - - - - - - -OTHER - - 1600 1700 1800 1900 2000 7300 10400 2300 4900 2500
SUB-TOTAL -FIXED ASSETS 20942 22062 11049 96037 79239 3436 2971 7300 10400 2300 4900 2500
DEFERRED EXPENSES 1799 - -- - - - - -
REPAYMENTSIDA LOAN - _- - 6596 7255 7981 8779 9654OTHER LOANS - - - - - 1906 1902 1902 1902 1902 2230 2230
SUB-TOTAL -- - - -- 1906 1902 8498 9157 9883 11009 11884
WORKING CAPITALINCREASE/DECREASE 5899 2914 10255 2156 2006 6058 (4823) 6002 6085 6081 6685 6807
TOTAL APPLICATIONS 28640 24976 21304 98193 81245 11400 50 21800 25642 18264 22594 21191
CASH SURPLUS - - - 55563 40637 40338 47719 61737 67457 75219ACCUMULATED CASH SURPLUS - - - - - 55564 96200 136538 184258 245995 313452 388670
R A T I ODEBT SERVICE RATIO 18.6 10.9 12.9 23.3 17.2 5.7 3.8 3.7 4.2 4.5 4.9 5.2
INDUSTRIAL PROJECTS DEPARTMENTREPORT PREPARED - 01/24/77
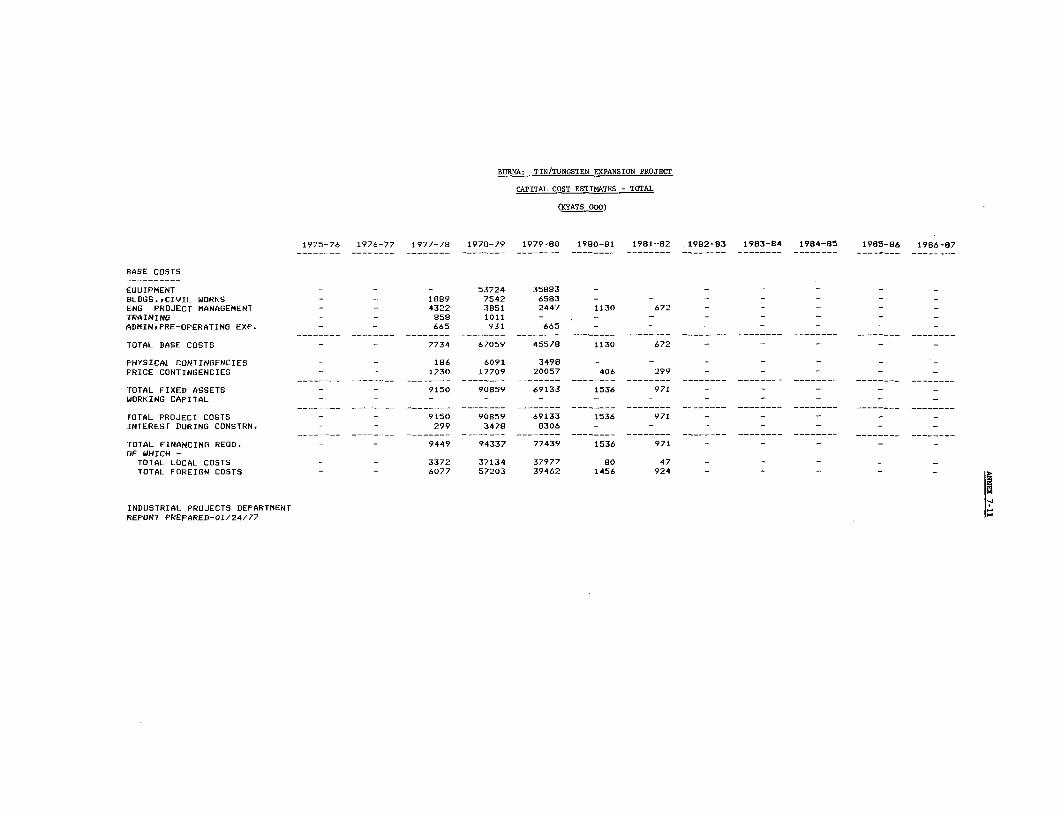
BURMA: TIN/TUNGSTEN EXPANSION PROJECT
CAPITAL COST ESTIMATES - TOTAL
(KYATS 000)
1975-76 1976-77 1977-78 1978-79 1979-60 1980-S1 1981-62 1982-83 1983-84 1984-85 1985-86 1986-87________ -------- -------- -------- -------- -- --- -_ _ _---- _-- - ------- - ------- ------- -------- --------
BASE COSTS
EQUIPMENT - - - 53724 35883 - - -BLDGS.,CIVIL WORKS - - 1889 7542 6583 - - - - - -ENG PROJECT MANAGEMENT - - 4322 3851 2447 1130 672 - - - -TRAINING - - 858 1011 - - - - - -ADMIN,PRE-OPERATING EXP. - - 665 931 665 - - - - - -
________ -------- -------- _______- _ ___-- -------- - - ---- -- - --- -------- ------- - ----- ------ -_ --------
TOTAL BASE COSTS - - 7734 67059 45578 1130 672 - - - -
PHYSICAL CONTINGENCIES - - 186 6091 3498 - - - - -PRICE CONTINGENCIES - - 1230 17709 20057 406 299 -__ - -
TOTAL FIXED ASSETS - - 9150 90859 69133 1536 971 - - - -WORKING CAPITAL - - - - - - - -
___._____ ---- --- __ __ _ __-__ __ _ ___--- -------- -- ---- -- - --- ----- -- -- ----- -- - - - - - --- ------- __ -_______
TOTAL PROJECT COSTS - - 9150 90859 69133 1536 971 - - -
INTEREST DURING CONSTRN. - - 299 3478 8306 - - _________ -- - -- - -- - - - - - - - - - - - -- -- - -- - - -- -- --- - - - - - - - - - - - - - - - --- -- - -- - - - - - - - - - - - - - - - - - - - - -
TOTAL FINANCING REOD. - - 9449 94337 77439 1536 971 - _Of WHICH -
TOTAL LOCAL COSTS -- - 3372 37134 37977 80 47 - - -TOTAL FOREIGN COSTS - - 6077 57203 39462 1456 924 - - - -
INDUSTRIAL PROJECTS DEPARTMENTREPORT PREPARED-01/24/77
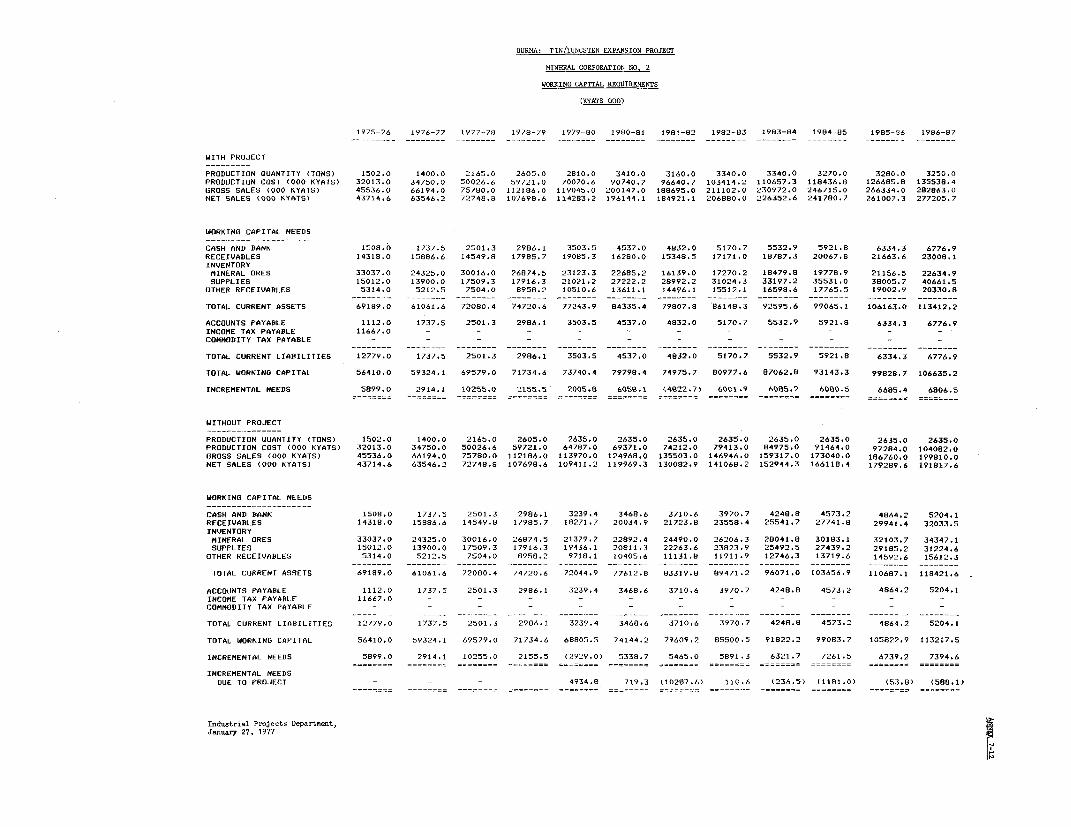
BUREA: TIN/TUNGSTEN EXPANSION PROJECT
MINERAL CORPORATION NO. 2
WORING CAPITAL REQUIREMENTS
(KYATS 000)
1975-76 19Z6-77 1977--7't 1978-/9 1979-80 1980-81 1981-82 1982-83 1983-84 1984-85 1985-36 1986-87
WITH PROJECT
PRODUCTION QUANTITY (TONS) 1502.0 1400.0 2165.0 2605.0 2810.0 3410.0 3160.0 3340.0 3340.0 3270.0 3280.0 3250.0PRODUCTION COST (000 KYATS) 32013.0 34750.0 50026.6 59721.0 70070.6 90740.7 96640.7 103414.2 110657.3 118436.8 126685.8 135538.4GROSS SALES (000 KYATS) 45536.0 66194.0 75780.0 112186.0 119045.0 200147.0 188695.0 211102.0 230972.0 246715.0 266334.0 282863.0NET SALES (000 KYATS) 43714.6 63546.2 72748.8 107698.6 114283.2 196144.1 184921.1 206880.0 226352.6 241780.7 261007.3 277205.7
WORKING CAPITAL NEEDS
CASH AND BANK 1508.0 1737.5 2501.3 2986.1 3503.5 4537.0 4832.0 5170.7 5532.9 5921.8 6334.3 6776.9RECEIVABLES 14318.0 15886.6 14549.8 17985.7 19085.3 16280.0 15348.5 17171.0 18787.3 20067.8 21663.6 23008.1INVENTORY
MINERAL ORES 33037.0 24325.0 30016.0 26874.5 23123.3 22685.2 16139.0 17270.2 18479.8 19778.9 21156.5 22634.9SUPPLIES 15012.0 13900.0 17509.3 17916.3 21021.2 27222.2 28992.2 31024.3 33197.2 35531.0 38005.7 40661.5
OTHER RECEIVABLES 5314.0 5212.5 7504.0 8958.2 10510.6 13611.1 14496.1 15512.1 16598.6 17765.5 19002.9 20330.8
TOTAL CURRENT ASSETS 69189.0 61061.6 72080.4 74720.6 77243.9 84335.4 79807.8 86148.3 92595.6 99065.1 106163.0 113412.2
ACCOUNTS PAYABLE 1112.0 1737.5 2501.3 2986.1 3503.5 4537.0 4832.0 5170.7 5532.9 5921.8 6334.3 6776.9INCOME TAX PAYABLE 11667.0 - - - - - - - - - - -CONMODITY TAX PAYABLE - - - - - - - - - - _ -
TOTAL CURRENT LIABILITIES 12779.0 1737.5 2501.3 2986.1 3503.5 4537.0 4832.0 5170.7 5532.9 5921.8 6334.3 6776.9
TOTAL WORKING CAPITAL 56410.0 59324.1 69579.0 71734.6 73740.4 79798.4 74975.7 80977.6 87062.8 93143.3 99828.7 106635.2
INCREMENTAL NEEDS 5899.0 2914.1 10255.0 2155.5 2005.8 605a.1 (4822.7) 6001.9 6085.2 6080.5 6685.4 6806.5
WITHOUT PROJECT
PRODUCTION QUANTITY (TONS) 1502.0 1400.0 2165.0 2605.0 2635.0 2635.0 2635.0 2635.0 2635.0 2635.0 2635.0 2635.0PRODUCTION COST (000 KYATS) 32013.0 34750.0 50026.6 59721.0 64787.0 69371.0 74212.0 79413.0 84975.0 91464.0 97284.0 104082.0GROSS SALES (000 KYATS) 45536.0 66194.0 75780.0 112186.0 113970.0 124968.0 135503.0 146946.0 159317.0 173040.0 186760.0 199810.0NET SALES (000 KYATS) 43714.6 63546.2 72748.8 107698.6 109411.2 119969.3 130082.9 141068.2 152944.3 166118.4 179289.6 191817.6
WORKING CAPITAL NEEDS
CASH AND BANK 1508.0 1737.5 2501.3 2986.1 3239.4 3468.6 3710.6 3970.7 4248.8 4573.2 4864.2 5204.1RECEIVABLES 14318.0 15886.6 14549.8 17985.7 18271.7 20034.9 21723.8 23558.4 25541.7 27741.8 29941.4 32033.5INVENTORY
MINERAL ORES 33037.0 24325.0 30016.0 26874.5 21379.7 22892.4 24490.0 26206.3 28041.8 30183.1 32103.7 34347.1SUPPLIES 15012.0 13900.0 17509.3 17916.3 19436.1 20811.3 22263.6 23823.9 25492.5 27439.2 29185.2 31224.6
OTHER RECEIVABLES 5314.0 5212.5 7504.0 8958.2 9718.1 10405.6 11131.8 11911.9 12746.3 13719.6 14592.6 15612.3
TOTAL CURRENT ASSETS 69189.0 61061.6 72080.4 74720.6 72044.9 77612.8 83319.8 89471.2 96071.0 103656.9 110687.1 118421.6
ACCOUNTS PAYABLE 1112.0 1737.5 2501.3 2986.1 3239.4 3468.6 3710.6 3970.7 4248.8 4573.2 4864.2 5204.1INCOME TAX PAYABLE 11667.0 - - - - - - - - - - -COMMODITY TAX PAYABLE - - - - - - - -
TOTAL CURRENT LIABILITIES 12779.0 1737.5 2501.3 2986.1 3239.4 3468.6 3710.6 3970.7 4248.8 4573.2 4864.2 5204.1
TOTAL WORKING CAPITAL 56410.0 59324.1 69579.0 71734.6 68805.5 74144.2 79609.2 85500.5 91822.2 99083.7 105822.9 113217.5
INCREMENTAL NEEDS 5899.0 2914.1 10255.0 2155.5 (2929.0) 5338.7 5465.0 5891.3 6321.7 7261.5 6739.2 7394.6
INCREMENTAL NEEDSDUE TO PROJECT - - - 4934.8 719.3 (10287.6) 110.6 (236.5) (1181.0) (53.8) (588.1)
Industrial Projects Departmit,Januanr 27, 1977
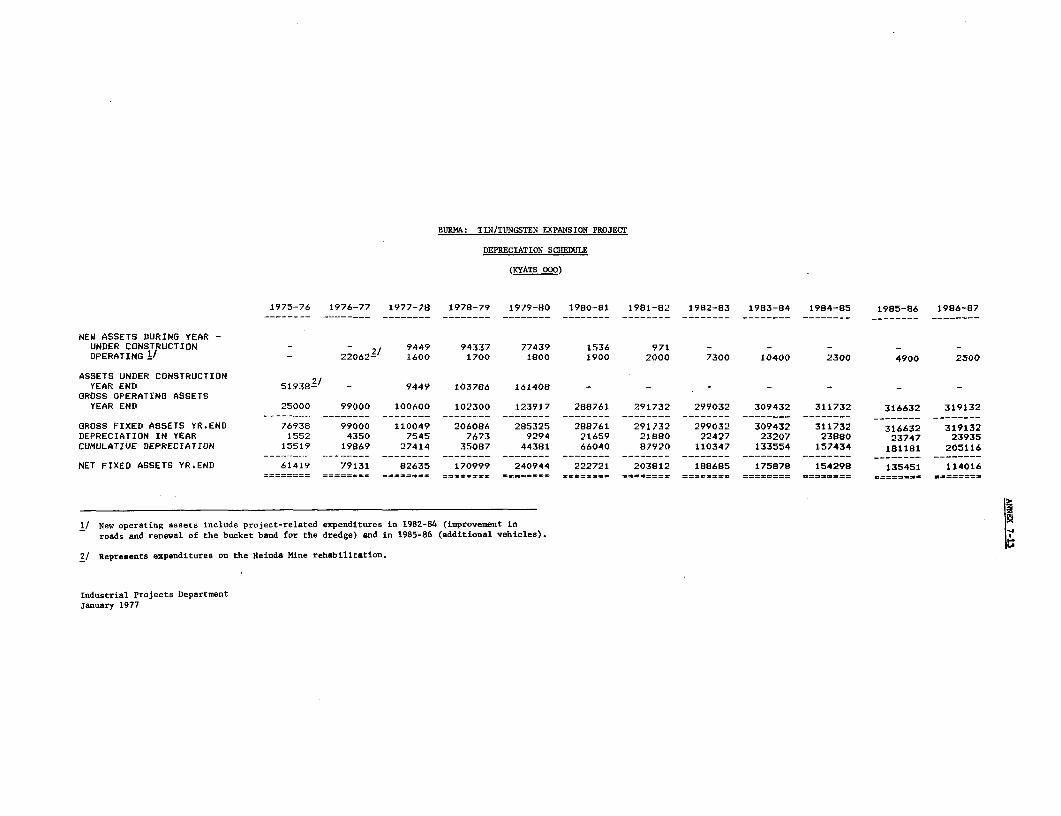
BURMA: TIN/TUNGSTEN EXPANSION PROJECT
DEPRECIATION SCHEDULE
(KYATS 000)
1975-76 1976-77 1977-78 1978-79 1979-80 1980-81 1981-82 1982-83 1983-84 1984-85 1985-86 1986-87
NEW ASSETS DURING YEAR -UNDER CONST-UCTION - - 2/ 9449 94337 77439 1536 971 - - - - -
OPERATING / - 22062- 1600 1700 1800 1900 2000 7300 10400 2300 4900 2500
ASSETS UNDER CONSTRUCTION 2/YEAR END 51938- - 9449 103786 161408 - - - - -
GROSS OPERATING ASSETSYEAR END 25000 99000 100600 102300 123917 288761 291732 299032 309432 311732 316632 319132
GROSS FIXED ASSETS YR.END 76938 99000 110049 206086 285325 288761 291732 299032 309432 311732 316632 319132DEPRECIATION IN YEAR 1552 4350 7545 7673 9294 21659 21880 22427 23207 23880 23747 23935CUMULATIVE DEPRECIATION 15519 19869 27414 35087 44381 66040 87920 110347 133554 157434 181181 205116
NET FIXED ASSETS YR.END 61419 79131 82635 170999 240944 222721 203812 188685 175878 154298 135451 114016
1/ New operating assets include project-related expenditures in 1982-84 (improvement inroads and renewal of the bucket band for the dredge) and in 1985-86 (additional vehicles).
2/ Represents expenditures on the Heinda Mine rehabilitation.
Industrial Projects DepartmentJanuary 1977

BURN1: TIN/TUNGSTEN EXPANSION PROJECT
DEBT REPAYMENT SCHEDULE
(KYATS 000)
1975-76 1976-77 1977-78 1978-79 1979-80 1980-81 1981-82 1982-83 1983-84 1984-85 1985-86 1986-87
IDA LOANS
DISBURSEMENTS IN YEAR - - 6077 57203 39462 1456 924 - - - -1ANNUITY REPAYMENT - - - - - - - 17108 17108 17108 17108 17108INTEREST REPAYMENT - - 10347 10466 10512 9853 9127 8329 7451PRINCIPAL REPAYMENT - - - - 6596 7255 7981 8779 9654
DEBT OUTSTANDING YEAR END - - 6077 63280 102742 104198 105122 98526 91271 83290 74511 64857OF WHICH S.T. PORTION - - - - - - 6596 7255 7981 8779 9654 -
OTHER FOREIGN LOANS
DISBURSEMENTS IN YEAR 14390 14651 - - - - - - - -
ANNUITY REPAYMENT - - -
INTEREST PAYMENT 384 825 1197 1197 1197 1185 1138 1090 1043 995 946 892PRINCIPAL REPAYMENT - - - 1906 1902 1902 1902 1902 2230 2230
DEBT OUTSTANDING YEAR END 34561 49212 49212 49212 49212 47306 45404 43502 41600 39698 37468 35238OF WHICH S.T. PORTION - - - - 1906 1902 1902 1902 1902 2230 2230 -
Industrial Projects Depa.tment,January 27, 1977
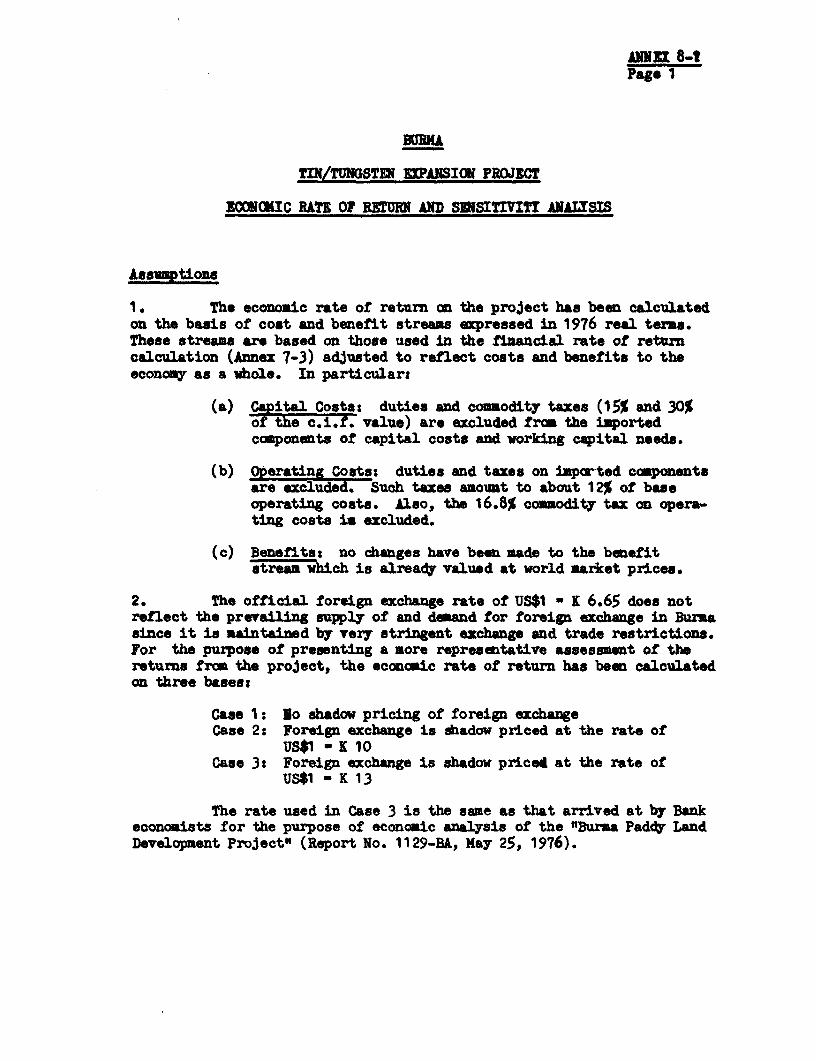
ANNElX 8-tPage 1
TIN/TUNGSTEN EPANSION PROJCT
oCONoaKIC RATE OF RETURN AND SDISIVITT ANALYSIS
Aisuiitionlb
1. The econmic rate of return an the project has been calculatedon the basis of cost and benefit streas expressed in 1976 real tems.These streams are based on those used in the financial rate of returncalculation (Annex 7-3) adJusted to reflect costs and benefits to theeconomy as a whole. In particulars
(a) Cpiti Costa: duties and commodity taxes (15% and 30%of the c.i.f value) are excluded from the importedeomponents of capital costs and working capital needs.
(b) Oorating Costs: duties and taxes on ioported componentsare excluded. Such taxes amount to about 12% of baseoperating costs. Also, the 16.8% commodity tax on opera-ting costs is excluded.
(c) Benefitss no changes have been made to the benefitstrea which is already valued at world market prices.
2. The official foreign exchange rate of US$1 - K 6.65 does notreflect the prevailing supply of and demand for foreign exchange in Burmasince it is maintained by very stringent exchange and trade restrictions.For the purpose of presenting a more representative assessment of thereturns from the project, the ecmnoaic rate of return has been calculatedon three bases:
Case 1: No shadow pricing of foreign exchangeCase 2: Foreign exchange is shadow priced at the rate of
US$1 - K 10Case 3: Foreign exchange is shadow priced at the rate of
US$1 - K 13
The rate used in Case 3 is the same as that arrived at by Bankeconomists for the purpose of economic analysis of the "Burma Paddy LandDevelopment Project" (Report No. 1129-BA, May 25, 1976).
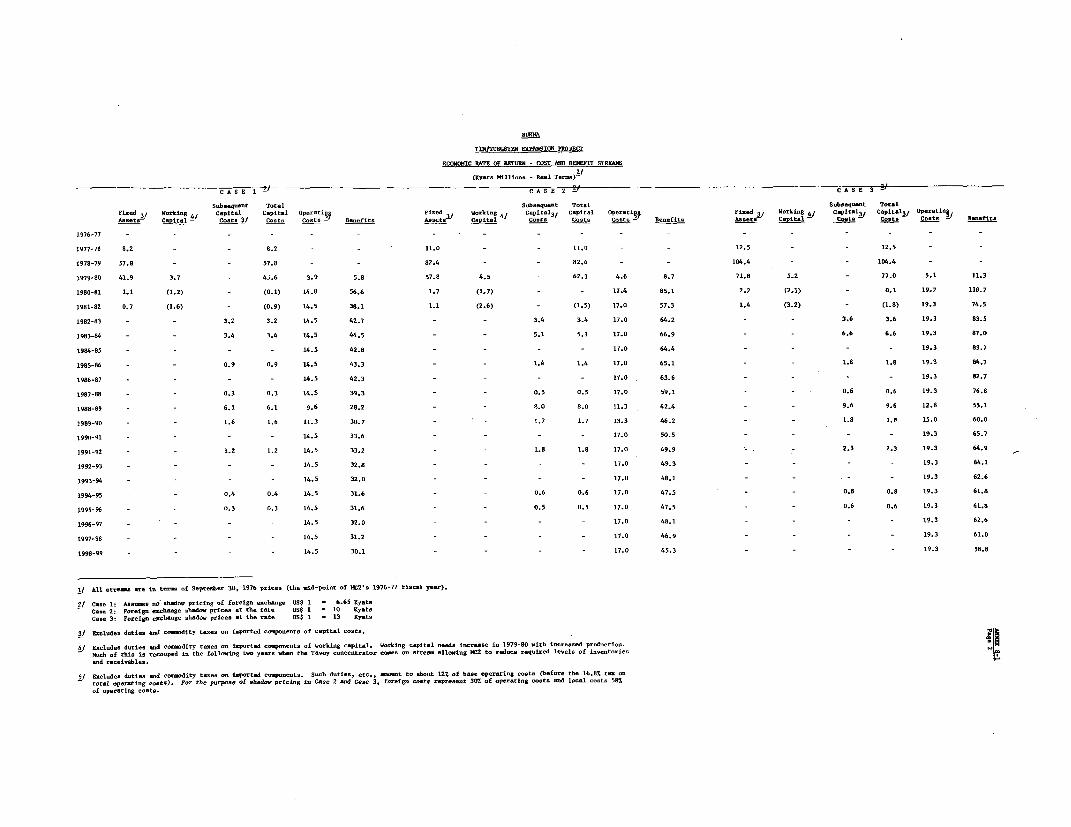
BURMA
TRIS/TBN BEXPANSION PRiJECT
ECONOMIC RATE OF RETtR8 - COST AND BENEFIT STREAMS
(Ky.tE Millio - R-1 Ters)i
C A SeC A S E 2 C A S e 3
S.aheqosot Total OShoeqoant Total Sboeqoant TotalAFd WCakital CapitRe C_pit.l ope-ti_g F a"t Capital CCosta13/ CPosts Co-ic Fosolila Mata WC-kitg - CaPst-ll/ CaP t 3 Cots - escaflts
1976-77 - - - - -- - -
1977-78 8.2 - - 8.2 - _ 11.0 - - 11.0 - - 12.5 - - 12.5 - -
1978-79 57.8 - - 57.8 - - 82.4 - - 82.4 - - 104.4 - - 104.4 - -
1979-80 41.9 3.7 - 4j.6 3.9 5.8 57.8 4.5 - 62.3 4.6 8.7 71.8 5.2 - 77.0 9.1 11.3
1980-SE 1.1 (1.2) - (0.1) 14.8 56.6 1.7 (1.7) - - 17.4 85.1 2.2 (2.1) - B. 19.7 110.7
1981-82 0.7 (1.6) - (0.9) 14.5 38.1 1.1 (2.6) - (1.5) 17.0 57.3 1.4 (3.2) - (1.8) 19.3 74.5
1982-83 - _ 3.2 3.2 14.5 42.7 - - 3.4 3.4 17.0 64.2 - - 3.6 3.6 19.3 83.5
1983-84 - - 3.4 3.4 14.5 44.5 - - 5.1 5.1 17.0 66.9 - - 6.6 6.6 19.3 87.0
1984-85 - - - - 14.5 42.8 - - - - 17.0 64.4 - - - - 19.3 83.7
1985-86 - - 0.9 0.9 14.5 43.3 _ _ 1.4 1.4 17.0 65.1 - - 1.8 1.8 19.3 84.7
1986-87 - - - - 14.5 42.3 - - - - 17.0 63.6 - - - - 19.3 82.7
1987-88 - - 0.3 0.3 14.5 39.3 - - 0.5 0.5 17.0 59.1 _ _ 0.6 0.6 19.3 76.8
1988-89 - _ 6.1 6.1 9.6 28.2 - 8.0 8.0 11.3 42.4 - _ 9.6 9.6 12.8 55.1
1989-90 - _ 1.6 1.6 11.3 30.7 - - 1.7 1.7 13.3 46.2 _ 1.8 1.8 15.0 60.0
1990-91 _- - 14.5 33.6 - - 17.0 50.5 - - - - 19.3 65.7
1991-92 - _ 1.2 1.2 14.5 33.2 _ _ 1.8 1.8 17.0 49.9 _ 2.3 2.3 19.3 64.9
1992-93 -- - 14.5 32.8 - - 27.0 49.3 - - 19.3 64.1
1993-94 - - - - 14.5 32.0 - - - - 17.0 48.1 - - - - - 19.3 62.6
1994-95 - - 0.4 0.4 14.5 31.6 - - 0.6 0.6 17.0 47.5 - - 0.8 0.8 19.3 61.8
1995-96 - - 0.3 0.3 14.5 31.6 - - 0.5 0.5 17.0 47.5 - - 0.6 0.6 19.3 61.8
1996-97 _- - 14.5 32.0 - - - - 17.0 48.1 - - - - 19.3 62.6
1997-98 - _ _ 14.5 31_2 - - - - 17.0 46.9 _ _ _ - 19.3 61.0
1998-99 - - - - 14.5 30.1 - - - - 17.0 45.3 _ _ _ - 19.3 58.8
1/ A11 trr re to tera sf Septreser 30, 1976 prices (tho id-poist of 1417'a 1976-77 ilacaI year).
2/ C.e 1: Ass.-ee 0o shadow pricisg of fCeeig oe.haoge U1$ 1 - 6.65 KyatsC.sa 2: Fo-aige cechago shadow prices at the r-te US$ 1 - 10 gyatoCase 3: Fo-eigo eZch1OEO shadow prices at the rate 170$ 1 13 Kyata
E3/ Cerlode dotie cod coeo,dity ta-es as lp-ort-d cosposeots of .,apitl costs.
4/ Eseladoa dotis and co-odity tI ismo -t.orled coapocots of -orkiog capital. W-rkiog c-pital .eede it-rease is 1979-80 wLth i-ora-oed prodoctio. Moch of 1hi0 Ic recesped io the followiog two y- -r aSee the T-voy cooc- otr-tor ems on tErea lloa,Ig YC2 to red-ce roqitred levels of i-ovetoriessod rossi-abloa.
5/ ftclodos dotios ad c-sadity tIa so Isported eossoPotos . Snoh doties, aet. 5> r55t to boot 121 of bhse opcrotig costa (bhfore the 16.8 tIn sototal operstiEg c-ste). For the porpose of BhOdow priolcg Os Case 2 Sd Case 3, foreign -sts represent 307. of op-rtiog cols. arid local co.ts 58%of operating costa.
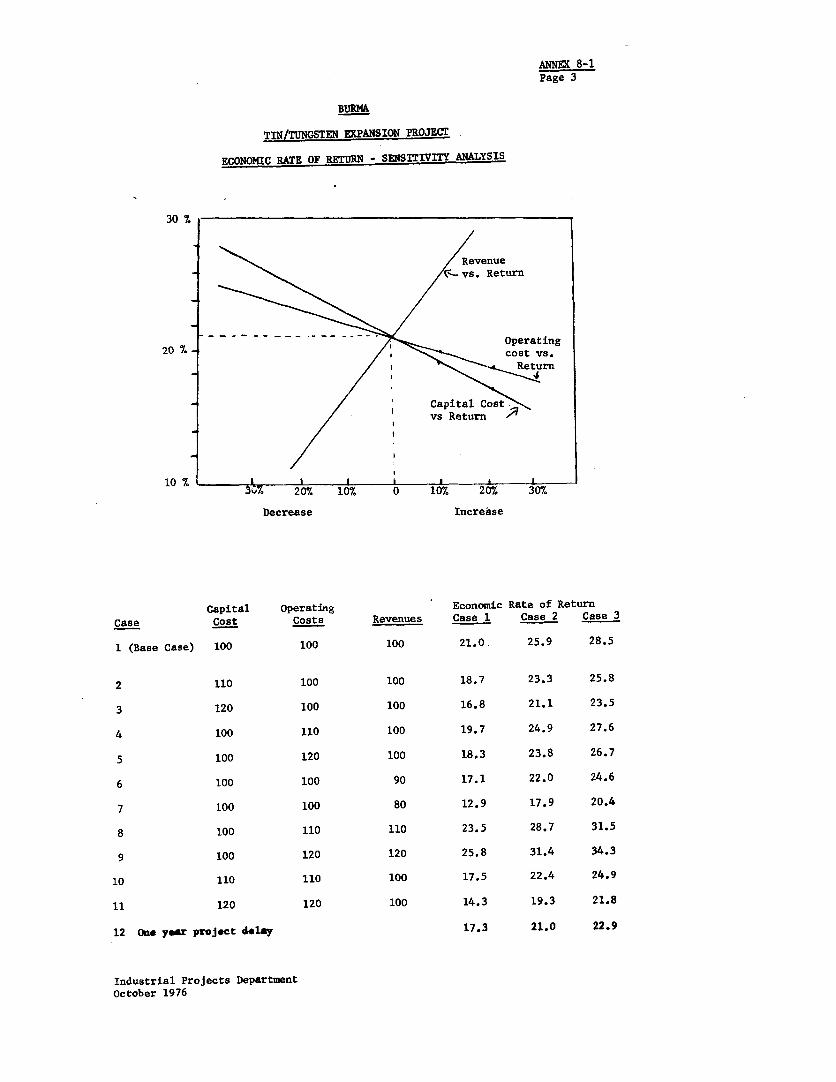
ANNE( 8-1Page 3
BURMA
TIN/TUNGSTEN EXPANSION PROJEC.
ECONOMIC RATE OF RETURN - SENSITIVITY ANALYSIS
30 %.
. \ /Reve~~~~~~~~nue\ /6 ~~~~~~vs. Return
207. Operating20 %_ / co~~~~~~~~~~~st vs.
_ / | \ u~ ~~~~~~~~retr
_ / | ~~~~~~Capital Cos/ o ~~~vs Return X
10 7.10v-.t 20% 107 0 101% 207. 30%/
Decrease Increase
Capital Operating Economic Rate of ReturnCase Cost Costs Revenues Case 1 Case 2 Case 3
1 (Base Case) 100 100 100 21.0 25.9 28.5
2 110 100 100 18.7 23.3 25.8
3 120 100 100 16.8 21.1 23.5
4 100 110 100 19.7 24.9 27.6
5 100 120 100 18.3 23.8 26.7
6 100 100 90 17.1 22.0 24.6
7 100 100 80 12.9 17.9 20.4
8 100 110 110 23.5 28.7 31.5
9 100 120 120 25.8 31.4 34.3
10 110 110 100 17.5 22.4 24.9
11 120 120 100 14.3 19.3 21.8
12 One yer project delay 17.3 21.0 22.9
Industrial Projects DepartmentOctober 1976
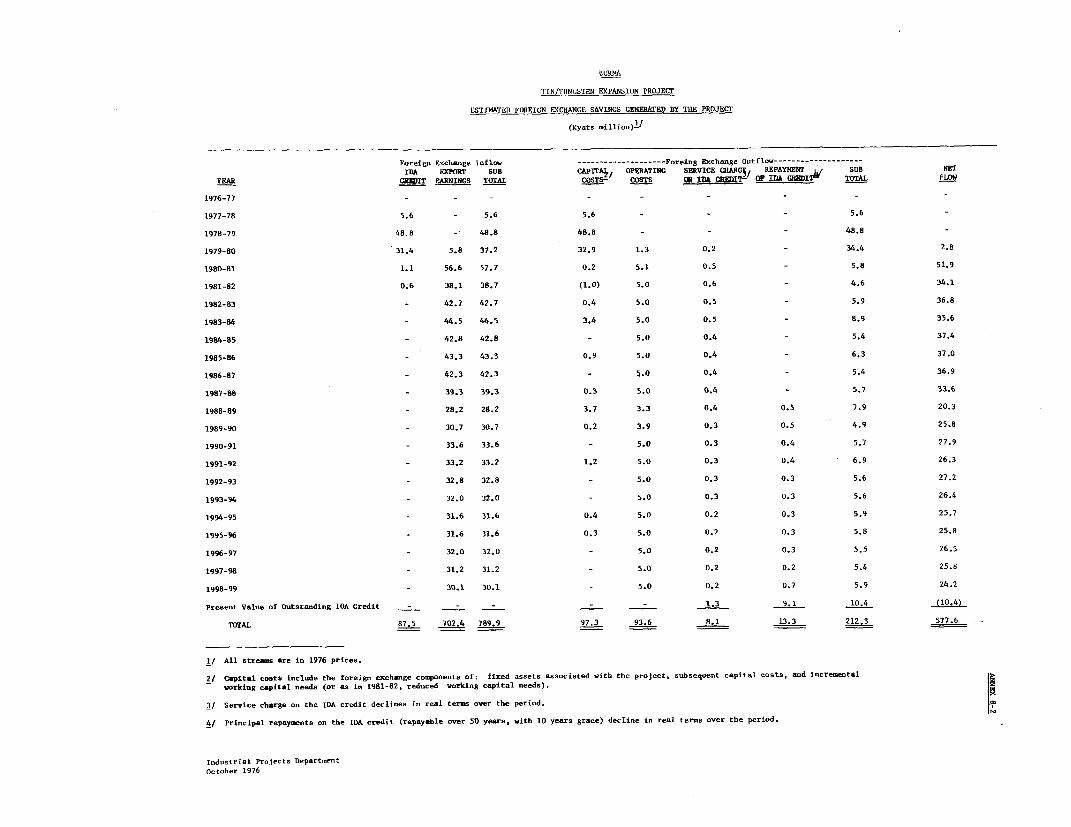
bIURMA
ILN/T[INGSTEN EXPANSION PROJECT
ESTIMATED FOREIGN EXCtANGE SAVINGS GENERATED BY THE PROJECT
(Kyats million)!/
Foreign Exchange ifl. -------------- -Foreing Exchange O utflow--------------------
IDA EXPORT SUB CAPIT* OPERATING SERVICE CHARG§ REPAYMENT 2 SUB NETYEAR CRIT EARNINGS TOTAL COSTS- COSTS ON Im T- QF IDA CRt31 TOTAL PLOW
1976-77 - - - - _
1977-78 5.6 - 5.6 5.6 - _ - 5.6 _
1978-79 48.8 -- 48.8 48.8 - -- 48.8 -
1979-80 31.4 5.8 37.2 32.9 1.3 0.2 - 34.4 2.8
1980-81 1.1 56.6 57.7 0.2 5.1 0.5 - 5.8 51.9
1981-82 0.6 38.1 38.7 (1.0) 5.0 0.6 - 4.6 34.1
1982-83 - 42.7 42.7 0.4 5.0 0.5 - 5.9 36.8
1983-84 - 44.5 44.5 3.4 5.0 0.5 - 8.9 35.6
1984-85 - 42.8 42.8 - 5.0 0.4 - 5.4 37.4
1985-86 - 43.3 43.3 0.9 5.0 0.4 - 6.3 37.0
1986-87 - 42.3 42.3 - 5.0 0.4 - 5.4 36.9
1987-88 - 39.3 39.3 0.3 5.0 0.4 - 5.7 33.6
1988-89 - 28.2 28.2 3.7 3.3 0.4 0.5 7.9 20.3
1989-90 - 30.7 30.7 0.2 3.9 0.3 0.5 4.9 25.8
1990-91 - 33.6 33.6 - 5.0 0.3 0.4 5.7 27.9
1991-92 - 33.2 33.2 1.2 5.0 0.3 0.4 6.9 26.3
1992-93 - 32.8 32.8 - 5.0 0.3 0.3 5.6 27.2
1993-94 - 32.0 32.0 - 5.0 0.3 0.3 5.6 26.4
1994-95 - 31.6 31.6 0.4 5.0 0.2 0.3 5.9 25.7
1995-96 - 31.6 31.6 0.3 5.0 0.2 0.3 5.8 25.8
1996-97 - 32.0 32.0 - 5.0 0.2 0.3 5.5 26.5
1997-98 - 31.2 31.2 - 5.0 0.2 0.2 5.4 25.8
1998-99 - 30.1 30.1 - 5.0 0.2 0.7 5.9 24.2
Present Value of Outstanding IOA Credit - - 1.3 9.1 10.4 (10.4)
TOTAL 87.5 702.4 789.9 97.3 93.6 8.1 13.3 212.3 577.6
1/ All streams are in 1976 prices.
2/ Capital costs include the foreign exchange components of: fixed assets associated with the project, subsequent capital costs, and incrementalworking capital needs (or as in 1981-82, reduced working capital needs).
3/ Service charge on the IDA credit declines in real terms over the period.
4/ Principal repayments on the IDA credit (repayable over 50 years, with 10 years grace) decline in real terms over the period.
Industrial Projects Department
October 1976

e noW /' ClcIE
TIA/TIAGE$N EPNIN PROJETer.x sk-+'w;5 ;, ut
9 ~ ~ ~ ~ /~ Moyo MaSW SA Af C5E -t
--- IV] DIRR R.
_ S!Ni;LE TRACK RAILWAYSvo|<hodb eg Tre
ARyob0~~~~~~~~
BAa aT | | Az o Z t'E
_ .- ITERNAIOPIA BOUNDRIESATE I
-10°~~~~~~~~~~~~~~~~~~~~~- -V0°
'n 5ea~~~~~~~~~~~~~~~Pypn-
BURMAZO 30 40 t fA GA
GIRT ROADS An`a moo %.PNO4-4
SNG~~~R TRACK RAILWAYS5 T
OJETAK RALWY s o a
.C VIS ONAL ROLNCARLE
O O10 050 200 2 50 ASS o
0~~~z 50g lE IRE 200 250
MOos~~~~~~~~~~~~~~~~y.,
___ __ ___ __ __ ___ __ -- C--v--_s__ -n'
020 RR~~~~~~~~~~~ Mr ~~~~~~~~ IRE~~~~~~~~ -3~~~~

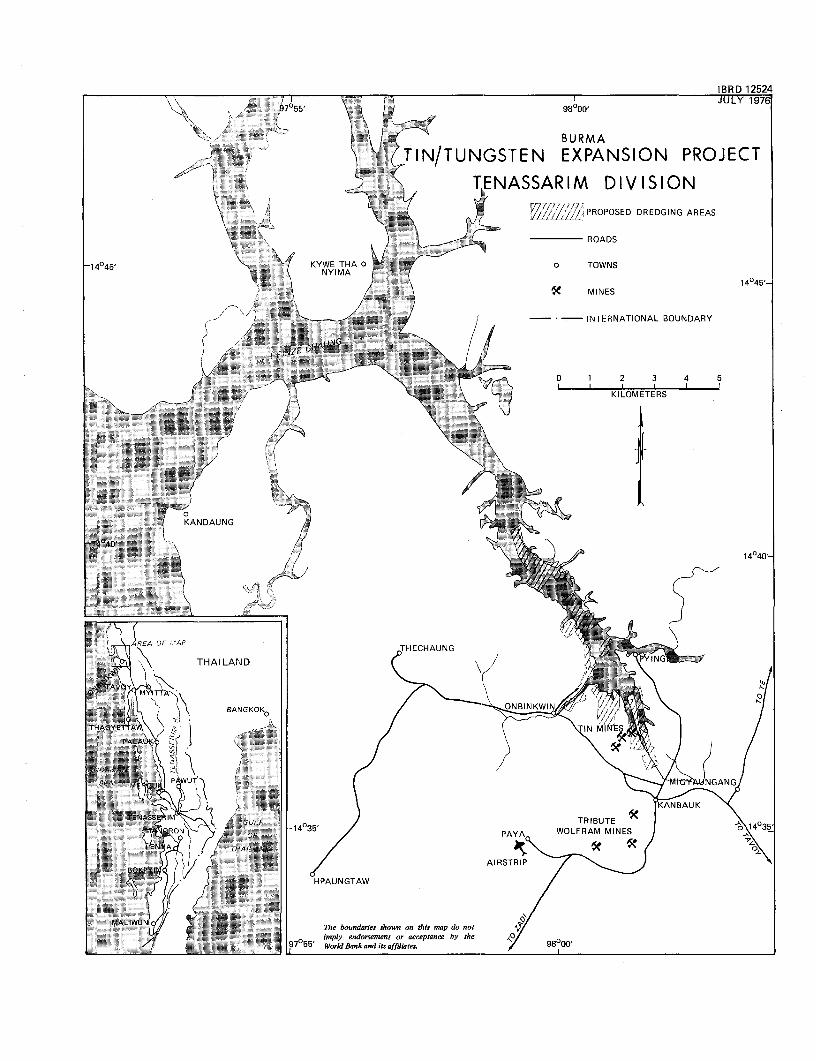
IBRD 12524
*a X ,. ;7155- \ t t.,) 2z 98°00' JULY 1976
BURMA
TIN/TUNGSTEN EXPANSION PROJECT
TENASSARIM DIVISIONPROPOSED DREDGING AREAS
C- ROADS
14045' K KYWE THA 00 TOWNS
14045'-7 .- MINES
-' - -- 2 / INTERNATIONAL BOUNDARY
// 7// gff jZE ' //
0 1, 2 3 4 5
j g/-^ -1-% < - t ; KILOMETERS
KANDAUNG <1 ,%
144040
AREA OFTHCAN
THAILAND
MTf'
> ~~~~BANGKOK0 NINW
TNAGY I
P !(
IA .N G
S,:S ttPiUT 1 ' \ N A
.. % s ........... TRIBUTE 2ABU
F 14035' PAYA WOLFRAM MINES
WKPf 9 2 3 / ~~~~~~~~~~~~AIRSTRIP /
HPAUNGTAW
MALIWU2 @ 7 The boundaries shown on this rap do notimply endorsement or acceptance by the
97055' World Bank and its afffilates. 90