Applying whole-water samples directly to fish cell cultures in order to evaluate the toxicity of...
12
Water Research 36 (2002) 3727–3738 Applying whole-water samples directly to fish cell cultures in order to evaluate the toxicity of industrial effluent Vivian R. Dayeh a , Kristin Schirmer b , Niels C. Bols a, * a Department of Biology, University of Waterloo, Waterloo, Ont., Canada N2L 3G1 b Department of Chemical Ecotoxicology, UFZ-Centre for Environmental Research, Permoserstr, 15, 04318, Leipzig, Germany Received 1 October 2001; accepted 1 February 2002 Abstract Methodology was developed for presenting to fish cells in culture whole-water samples without extraction and used to evaluate the toxicity to a rainbow trout gill cell line, RTgill-W1, of more than 30 whole-water samples collected from a paper mill over approximately a year of operation. Presentation to cells was achieved by adding to water samples the amounts of salts, galactose and sodium pyruvate, as solids, that were necessary to give concentrations and osmolality of the basal growth medium, Leibovitz’s L-15. Cell viability was measured with three fluorescent indicator dyes: alamar Blue t for metabolism, 5-carboxyfluorescein diacetate acetoxymethyl ester (CFDA-AM) for membrane function, and neutral red for lysosomal activity. Eighteen samples were tested with the Daphnia lethality bioassay and 11 of these were toxic. None of these were judged cytotoxic to RTgill-W1. Sixteen samples were tested with the rainbow trout lethality bioassay and only one was toxic. This sample was also the only sample that was cytotoxic to RTgill-W1. Therefore, these methods for presenting water samples and measuring their cytotoxicity to RTgill-W1 are a promising substitute for toxicity tests of industrial effluent with rainbow trout but not with Daphnia. r 2002 Elsevier Science Ltd. All rights reserved. Keywords: In vitro toxicity testing; Cell viability; Fish cell lines; Paper mill effluent; Whole effluent testing 1. Introduction Animal cell lines have been considered periodically as an alternate technology to the use of whole animals in testing water quality [1]. Tests with cell lines could potentially be less expensive but performed more rapidly. They would also satisfy a societal desire to reduce the use of whole animals in toxicity testing. Two different strategies have been used to present water samples to cells in culture [2,3]. One is to extract organic contaminants from water in order to concen- trate them, and to add the extracts to cultures in carrier solvents, such as dimethyl sulfoxide (DMSO) [4,5]. The other strategy is to make up culture medium with sample water, which has been done in two different ways. One is to add sample water to 2X tissue culture medium, making the highest water sample concentration 50% [1,3]. Alternatively, the sample water is added to the solid (powdered) components of culture medium to reconstitute complete growth medium [2,6]. In this way, cells can be exposed to different concentrations of a whole-water sample, including 100%. Testing whole-water samples on cells offers several important advantages, particularly for routine screening of many environmental samples. Applying the whole sample to cultures assures that little or no toxicant is lost in any processing steps. As well, the total toxicity of the sample, encompassing all potential synergistic, antag- onistic and additive interactions, is measured. The cost and time of testing is reduced because labor-intensive extraction procedures with expensive organic solvents are eliminated. Costs can also be lowered for other *Corresponding author. Tel.: +1-519-885-1211x3993; fax: +1-519-746-0614. E-mail address: [email protected] (N.C. Bols). 0043-1354/02/$ - see front matter r 2002 Elsevier Science Ltd. All rights reserved. PII:S0043-1354(02)00078-7
-
Upload
independent -
Category
Documents
-
view
2 -
download
0
Transcript of Applying whole-water samples directly to fish cell cultures in order to evaluate the toxicity of...

Water Research 36 (2002) 3727–3738
Applying whole-water samples directly to fish cell cultures inorder to evaluate the toxicity of industrial effluent
Vivian R. Dayeha, Kristin Schirmerb, Niels C. Bolsa,*aDepartment of Biology, University of Waterloo, Waterloo, Ont., Canada N2L 3G1
bDepartment of Chemical Ecotoxicology, UFZ-Centre for Environmental Research, Permoserstr, 15, 04318, Leipzig, Germany
Received 1 October 2001; accepted 1 February 2002
Abstract
Methodology was developed for presenting to fish cells in culture whole-water samples without extraction and used
to evaluate the toxicity to a rainbow trout gill cell line, RTgill-W1, of more than 30 whole-water samples collected from
a paper mill over approximately a year of operation. Presentation to cells was achieved by adding to water samples the
amounts of salts, galactose and sodium pyruvate, as solids, that were necessary to give concentrations and osmolality of
the basal growth medium, Leibovitz’s L-15. Cell viability was measured with three fluorescent indicator dyes: alamar
Bluet for metabolism, 5-carboxyfluorescein diacetate acetoxymethyl ester (CFDA-AM) for membrane function, and
neutral red for lysosomal activity. Eighteen samples were tested with the Daphnia lethality bioassay and 11 of these
were toxic. None of these were judged cytotoxic to RTgill-W1. Sixteen samples were tested with the rainbow trout
lethality bioassay and only one was toxic. This sample was also the only sample that was cytotoxic to RTgill-W1.
Therefore, these methods for presenting water samples and measuring their cytotoxicity to RTgill-W1 are a promising
substitute for toxicity tests of industrial effluent with rainbow trout but not with Daphnia.r 2002 Elsevier Science Ltd.
All rights reserved.
Keywords: In vitro toxicity testing; Cell viability; Fish cell lines; Paper mill effluent; Whole effluent testing
1. Introduction
Animal cell lines have been considered periodically as
an alternate technology to the use of whole animals in
testing water quality [1]. Tests with cell lines could
potentially be less expensive but performed more
rapidly. They would also satisfy a societal desire to
reduce the use of whole animals in toxicity testing.
Two different strategies have been used to present
water samples to cells in culture [2,3]. One is to extract
organic contaminants from water in order to concen-
trate them, and to add the extracts to cultures in carrier
solvents, such as dimethyl sulfoxide (DMSO) [4,5]. The
other strategy is to make up culture medium with sample
water, which has been done in two different ways. One is
to add sample water to 2X tissue culture medium,
making the highest water sample concentration 50%
[1,3]. Alternatively, the sample water is added to the
solid (powdered) components of culture medium to
reconstitute complete growth medium [2,6]. In this way,
cells can be exposed to different concentrations of a
whole-water sample, including 100%.
Testing whole-water samples on cells offers several
important advantages, particularly for routine screening
of many environmental samples. Applying the whole
sample to cultures assures that little or no toxicant is lost
in any processing steps. As well, the total toxicity of the
sample, encompassing all potential synergistic, antag-
onistic and additive interactions, is measured. The cost
and time of testing is reduced because labor-intensive
extraction procedures with expensive organic solvents
are eliminated. Costs can also be lowered for other
*Corresponding author. Tel.: +1-519-885-1211x3993; fax:
+1-519-746-0614.
E-mail address: [email protected] (N.C. Bols).
0043-1354/02/$ - see front matter r 2002 Elsevier Science Ltd. All rights reserved.
PII: S 0 0 4 3 - 1 3 5 4 ( 0 2 ) 0 0 0 7 8 - 7

reasons. The cost of shipping large volumes of effluent
water samples from distant sources to central toxicity
testing facilities is reduced because relatively small
volumes are needed for testing. Finally, whole-water
samples are more analogous to the protocol used to test
the toxicity of water to fish.
Although mammalian cell lines have been used to
monitor water quality [2–4,6,7], fish cell lines have
additional advantages. Fish rather than mammalian
cells are a more logical substitute for fish, which are used
to test water quality. Cell lines from fish are easier to
maintain than those from mammals, as they can be
grown without the need for an incubator or frequent
renewals of the culture medium [8]. In addition, fish cells
tolerate being maintained in culture for a day or two in a
simple exposure medium, which contains only salts,
pyruvate and galactose [9]. The simplicity favors
expression of cellular responses to toxicants because
many protective molecules such as antioxidants are
absent. As well, the medium is much less expensive than
complete cell culture medium.
The goals of this study were four fold. The first was to
develop a routine methodology for applying whole-
water samples in a concentration series to fish cell
cultures. As many biological processes that are studied
in vitro are sensitive to the quality of water [10], the
second goal was to check whether whole-water samples
that were not toxic to rainbow trout elicited cytotoxic
responses in cell cultures of a fish gill cell line, RTgill-
W1. The third goal was to determine whether RTgill-W1
cultures identified whole-water samples that had been
spiked with common organic toxicants, abietic acid and
pentachlorophenol, as being toxic. The final goal was to
evaluate the overall methodology by applying whole-
water samples taken over the span of 1 year of a paper
mill operation to RTgill-W1 cultures and measuring
their ability to cause cytotoxicity. These in vitro toxicity
results were compared with the results obtained on the
same whole-water samples by conventional in vivo
toxicity tests with rainbow trout and Daphnia magna.
2. Materials and methods
2.1. Cell line and culture media
RTgill-W1 is a cell line from gills of rainbow trout
(Oncorhynchus mykiss) [11], and available from the
American Type Culture Collection (ATCC # CRL
2523). Cells were cultured routinely in 75 cm2 culture
flasks at 211C in Leibovitz’s L-15 culture medium, with
10% fetal bovine serum (FBS) and 2% penicillin
streptomycin (100mg/mL streptomycin, 100 IU/mL pe-
nicillin) (Gibco/BRL, Burlington, ON). L-15 osmolality
ranges from 300 to 340mOsmkg�1, depending on the
lot. Exposure of RTgill-W1 cells to potential toxic
solutions was conducted at 211C in the dark for 24 h in
wells of 48 well Falcon plates (Becton Dickinson,
Franklin Lakes, NY). These microwell cultures were
initiated by removing cells from confluent flasks and
adding to each well 30,000 cells in 500mL L-15 with FBS.
Three days later the cultures were confluent and used.
2.2. Whole-water samples
Whole-water samples from an unidentified paper mill
were tested routinely by BEAK International (Bramp-
ton, ON) for toxicity, as required by Canadian Legisla-
tion for the pulp and paper industry [12]. Toxicity was
determined by exposing either rainbow trout or D.
magna to the samples according to proscribed proce-
dures [13,14]. The whole-water samples were of receiving
water (RW), secondary effluent (SEC), final effluent
(FE) and clearwater bypass (CWB). Within 48–72 h of
collection, portions (100–1000ml) of the whole-water
samples were transported to this laboratory in order to
evaluate their cytotoxicity. All in vitro testing was
conducted prior to any knowledge of the results of
toxicity testing with rainbow trout or D. magna.
2.3. Whole-water samples/ex
The whole-water samples were processed so that they
could be applied to fish cell cultures (Fig. 1). Usually,
this began immediately after they were received,
although in a few cases samples were stored in the dark
at 4–81C for 1 to 2 weeks prior to testing. Sample
processing began by determining the pH and osmolality,
measured with a Westcor 5001B vapor pressure osm-
ometer (Westcor, Logan, Utah). Osmolality was well
below the osmolality typically required by animal cells
(Table 1). For the 23 samples with osmolality values
below 90mOsmkg�1, solid amounts of salts, galactose,
and pyruvate were dissolved in the whole-water samples
to give the concentrations that are found in L-15. For
the 8 samples with osmolality values above
90mOsmkg�1, solid amounts of salts, galactose, and
pyruvate were dissolved in the whole-water samples to
give the concentrations that are 80% of those found in
L-15. The osmolality of these solutions was measured
and found to range between 290 and 360mOsmkg�1
(Table 1). Portions of these solutions, as well as
solutions of model toxicants (see below), were filtered
through a 0.2mm membrane filter (Gelman Sciences,
Ann Arbor, MI) in a glass- filter apparatus. These
solutions are referred to as unfiltered and filtered whole-
water samples/ex, where ex abbreviates exposure.
In seven cases, whole-water samples were chosen at
random and examined for microbial contamination by
standard methods agar. Whole-water samples were
diluted in water in a ratio of 1:9 respectively. 100mLwas distributed across the surface of the agar and
V.R. Dayeh et al. / Water Research 36 (2002) 3727–37383728

incubated at room temperature for 24 h after which
colonies were counted.
Whole-water samples/ex were applied to RTgill-W1
cell cultures over a range of concentrations (0%, 15%,
30%, 45%, 60%, 75%, 90%, and 100% (v/v)). The 0%
(control) was L-15/exposure (L-15/ex), which consisted
of L-15 salts, galactose and pyruvate dissolved in
commercial tissue culture water (Gibco/BRL). The
intermediate values (o100%) were obtained by diluting
whole-water samples/ex in L-15/ex. After exposures of
24 h, the viability of RTgill-W1 cultures was measured.
2.4. Model toxicants
Pentachlorophenol (98% purity) was purchased from
Sigma Chemical Co. (St. Louis, MO), abietic acid (85%
purity), from Acros Organics through Fisher Scientific
(Nepean, ON). The chemicals were dissolved in 100%
DMSO (BDH Inc., Toronto, ON) to yield stock
solutions in the following concentrations: pentachlor-
ophenol, 30mg/mL and abietic acid, 1mg/mL. Serial
dilutions of each compound were made in L-15/ex and
in whole-water sample/ex, and both serial dilutions were
tested for their effect on cell viability.
2.5. Cell viability
Three fluorescent indicator dyes, alamar Blue (Med-
icorp, Montreal, PQ), 5-carboxyfluorescein diacetate
acetoxymethyl ester (CFDA-AM) (Molecular Probes,
Eugene, OR) and neutral red (Sigma Chemical Co) were
used to evaluate cell viability in RTgill-W1 cultures. The
dyes were chosen because they were relatively easy to use
and inexpensive. A decline in alamar Blue and CFDA-
AM readings indicate respectively a reduction in cell
metabolism and a loss of cell membrane integrity. The
neutral red assay provides a measure of lysosomal
function. Alamar Blue and CFDA-AM were used as
recently described in a detailed step-by-step format [15].
The neutral red assay was done as described by Schirmer
et al. [9]. Fluorescence units were read with the
CytoFluor series 4000 microplate reader after 30min.
Fig. 1. Schematic of L-15/ex and whole-water sample/ex preparation. Tissue culture salts were dissolved into commercial tissue culture
water to give L-15/ex. L-15/ex was the control in all of the following figures. Tissue culture salts were dissolved in a whole-water sample
to give whole-water sample/ex. Filtration was done through a 0.2 mm Gelman filter. These solutions were used to dose confluent
monolayers of the rainbow trout gill epithelial cell line, RTgill-W1, in wells of 48 well microplates.
V.R. Dayeh et al. / Water Research 36 (2002) 3727–3738 3729
Excitation and emission wavelengths were 530 and
595 nm for alamar Blue, 485 and 530 nm for CFDA-
AM, and 530 and 645 nm for neutral red.
2.6. Data analysis
Raw data from cell viability assays were compiled and
analyzed using Excel (Microsoft Corporation, Red-
mond, WA). The values of the control water sample/ex
and spiked water sample/ex concentrations were ex-
pressed as a percentage of the average fluorescent
readings of the respective L-15/ex control. These values
were averaged for each concentration and their standard
deviations were calculated. The averages and standard
deviations were plotted using SigmaPlot 2000 (SPSS
Inc., Chicago, IL). EC50 values were determined using
the logistic function option in SigmaPlot for dose-
response curves falling below 50% of the control. To test
for significant difference of the experimental values from
the L-15/ex control a one-way ANOVA with Dunnett’s
test (a ¼ 0:05) was conducted in GraphPad Prism
(GraphPad Software Inc., San Diego, CA). These points
are indicated on the graphs with an asterisk (*). An
unpaired t-test (a ¼ 0:05) was conducted to determine if
the spiked water sample/ex yielded fluorescence units
significantly different from the non-spiked water sample/
ex control. These points are indicated on the graphs with
a cross (w).
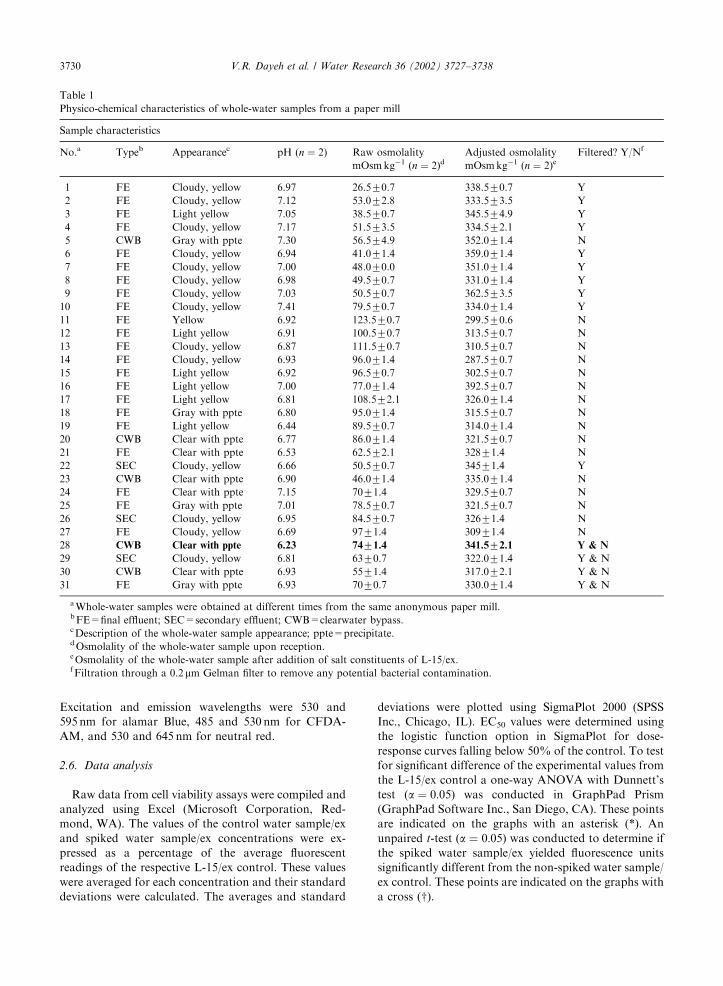
Table 1
Physico-chemical characteristics of whole-water samples from a paper mill
Sample characteristics
No.a Typeb Appearancec pH (n ¼ 2) Raw osmolality
mOsmkg�1 (n ¼ 2)dAdjusted osmolality
mOsmkg�1 (n ¼ 2)eFiltered? Y/Nf
1 FE Cloudy, yellow 6.97 26.570.7 338.570.7 Y
2 FE Cloudy, yellow 7.12 53.072.8 333.573.5 Y
3 FE Light yellow 7.05 38.570.7 345.574.9 Y
4 FE Cloudy, yellow 7.17 51.573.5 334.572.1 Y
5 CWB Gray with ppte 7.30 56.574.9 352.071.4 N
6 FE Cloudy, yellow 6.94 41.071.4 359.071.4 Y
7 FE Cloudy, yellow 7.00 48.070.0 351.071.4 Y
8 FE Cloudy, yellow 6.98 49.570.7 331.071.4 Y
9 FE Cloudy, yellow 7.03 50.570.7 362.573.5 Y
10 FE Cloudy, yellow 7.41 79.570.7 334.071.4 Y
11 FE Yellow 6.92 123.570.7 299.570.6 N
12 FE Light yellow 6.91 100.570.7 313.570.7 N
13 FE Cloudy, yellow 6.87 111.570.7 310.570.7 N
14 FE Cloudy, yellow 6.93 96.071.4 287.570.7 N
15 FE Light yellow 6.92 96.570.7 302.570.7 N
16 FE Light yellow 7.00 77.071.4 392.570.7 N
17 FE Light yellow 6.81 108.572.1 326.071.4 N
18 FE Gray with ppte 6.80 95.071.4 315.570.7 N
19 FE Light yellow 6.44 89.570.7 314.071.4 N
20 CWB Clear with ppte 6.77 86.071.4 321.570.7 N
21 FE Clear with ppte 6.53 62.572.1 32871.4 N
22 SEC Cloudy, yellow 6.66 50.570.7 34571.4 Y
23 CWB Clear with ppte 6.90 46.071.4 335.071.4 N
24 FE Clear with ppte 7.15 7071.4 329.570.7 N
25 FE Gray with ppte 7.01 78.570.7 321.570.7 N
26 SEC Cloudy, yellow 6.95 84.570.7 32671.4 N
27 FE Cloudy, yellow 6.69 9771.4 30971.4 N
28 CWB Clear with ppte 6.23 7471.4 341.572.1 Y & N
29 SEC Cloudy, yellow 6.81 6370.7 322.071.4 Y & N
30 CWB Clear with ppte 6.93 5571.4 317.072.1 Y & N
31 FE Gray with ppte 6.93 7070.7 330.071.4 Y & N
aWhole-water samples were obtained at different times from the same anonymous paper mill.bFE=final effluent; SEC=secondary effluent; CWB=clearwater bypass.cDescription of the whole-water sample appearance; ppte=precipitate.dOsmolality of the whole-water sample upon reception.eOsmolality of the whole-water sample after addition of salt constituents of L-15/ex.fFiltration through a 0.2 mm Gelman filter to remove any potential bacterial contamination.
V.R. Dayeh et al. / Water Research 36 (2002) 3727–37383730

3. Results
3.1. Paper mill whole-water sample characteristics
For most samples, pH values were between 6.8 and
7.0 (Table 1). Even the extremes, 6.23 and 7.30, would
not be expected to unduly stress fish cells in culture [16].
Although only seven samples were tested for microbes,
they were always present and their numbers varied 150
fold between sample types (Table 2). Filtering samples
through a 0.2mm filter completely eliminated contam-
ination. All 31 samples had an osmolality of less than
125mOsmkg�1, but addition of L-15 salts to these
samples brought the osmolality to between 290 and
360mOsmkg�1 (Fig. 1).
3.2. Effect of osmolality on cell viability
RTgill-W1 remained viable for at least 24 h in L-15/ex
in which the osmolality ranged from B150 to
400mOsmkg�1. Without the addition of L-15 salts to
the whole-water samples, viability was reduced by
B90% (Fig. 2 Panel A). Viability increased as the
osmolality was increased and reached or was higher than
the value of untreated whole-water samples by
150mOsmkg�1 (Fig. 2 Panel A). As the osmolality of
cultures was increased above the values in control
cultures (32979.6mOsmkg�1; n ¼ 31), viability showed
little sign of significant diminishment until
400mOsmkg�1 and only with neutral red (Fig. 2 Panel
B). Within the 150–400mOsmkg�1 range, some mea-
sures of cell viability were stimulated slightly in cultures
in which the osmolality was either higher or lower than
the control cultures. This stimulation was never more
than 25% (Fig. 2).
3.3. Effect of % whole-water sample on cell viability
As the concentration of common constituents in
whole-water samples could potentially have a detrimen-
tal effect on the viability of cells in culture but not on the
viability of whole organisms, increasing percentages of
whole-water samples, including receiving water, that had
been shown previously not to be toxic to Daphnia and
rainbow trout were applied to RTgill-W1 cultures for
24 h and cell viability measured. Cell viability remained
undiminished (Fig. 3), suggesting that false positives
were unlikely. Whole-water samples in many cases
increased readings in cell viability assays, most com-
monly with unfiltered samples and the alamar Blue
assay. Although the elevation did not consistently occur
at the same % of whole-water sample, the mean increase
for alamar Blue was 43%724 (n ¼ 16).
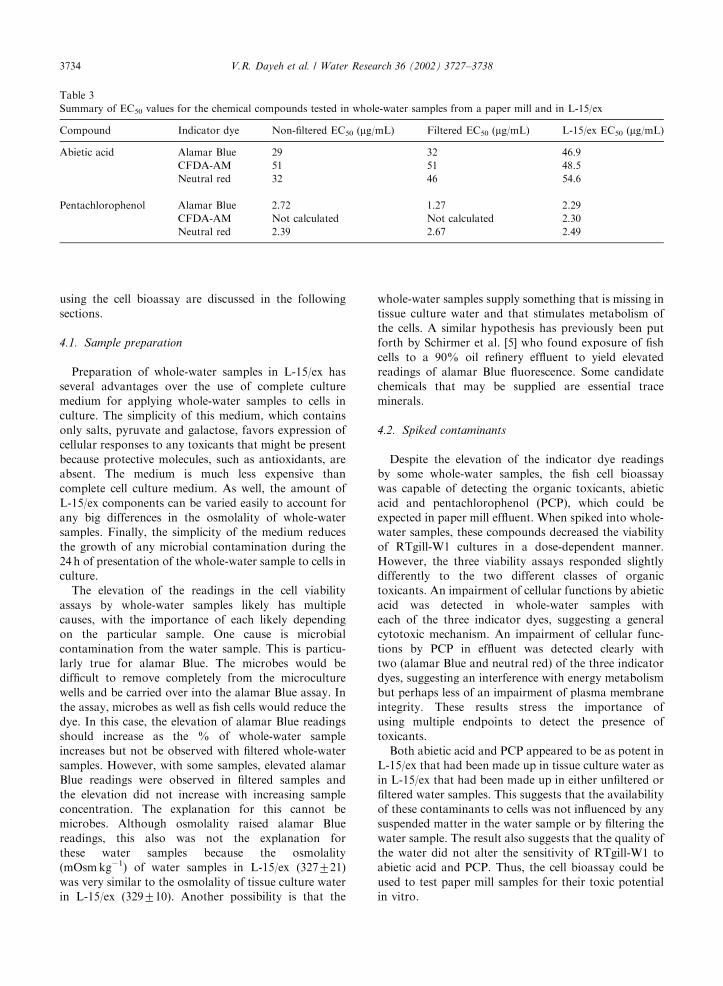
3.4. Effect of abietic acid-spiked whole-water samples on
cell viability
A 24 h exposure to increasing concentrations of
abietic acid in either non-filtered or filtered whole-water
sample caused a progressive decline in RTgill-W1
viability (Fig. 4). The shapes of dose-response curves
and the EC50 values were comparable for filtered and
non-filtered water samples (Table 3).
3.5. Effect of pentachlorophenol-spiked whole-water
samples on cell viability
A 24h exposure to increasing concentrations of
pentachlorophenol in either non-filtered or filtered
whole-water samples caused a progressive decline in
RTgill-W1 viability as measured with two indicator dyes,
Table 2
Microbial contamination of selected whole-water samples from a paper mill
Sample characteristics
Typea Appearanceb pH (n ¼ 2) Osmolality mOsmkg�1 Microbial population CFU/mLe
Raw (n ¼ 2)c Adjusted (n ¼ 2)d
SEC Light yellow 6.87 2870.7 30170.7 4� 10273� 101
SEC Cloudy, yellow 6.79 6470.7 32072.1 3.1� 10471� 103
CWB Clear with ppte 6.85 5770.7 31771.4 2.6� 10371� 102
CWB Clear with ppte 6.88 2471.4 30471.4 3� 10276� 101
FE Gray with ppte 6.93 7070.7 33071.4 2.4� 10372� 102
FE Cloudy, yellow 6.89 2970.7 30171.4 2� 10271� 101
RW Clear with ppte 6.88 5272.8 32971.4 1.1� 10275� 100
aSEC=secondary effluent; CWB=clearwater bypass; FE=final effluent; RW=receiving water.bDescription of the whole-water sample appearance; ppte=precipitate.cOsmolality of the whole-water sample upon reception.dOsmolality of the whole-water sample after addition of salt constituents of L-15/ex.eMicrobial colony forming units (CFU/mL) after 24 h enumerated using standard methods agar; the microbial population was
completely eliminated upon filtration of the whole-water sample through a 0.2mm filter.
V.R. Dayeh et al. / Water Research 36 (2002) 3727–3738 3731

alamar Blue and neutral red (Fig. 5 and Table 3). CFDA-
AM did not yield a dose response relationship in either the
non-filtered or filtered spiked water sample treatments.
3.6. Effect of paper mill whole-water samples on cell
viability
As RTgill-W1 cells could detect toxicants that had
been spiked into whole-water samples, 31 whole-water
samples taken over the span of 1 year of paper mill
operation were evaluated for toxicity with the fish cell
bioassay. Only one sample (# 28), which was clearwater
bypass (CWB), was toxic to RTgill-W1 (Fig. 6). The
dose-response curve for this sample was more distinct
when the sample had been filtered (Fig. 6 Panel B),
except for the neutral red assay, which no longer
registered a loss of viability.
3.7. Comparison of fish cell and D. magna bioassays
The toxicity of 18 whole-water samples from the
paper mill was evaluated with both D. magna and fish
cells. Eleven were toxic to D. magna, but none were toxic
to RTgill-W1 cells. Therefore, the fish cell bioassay was
not able to identify paper mill water samples that were
toxic to D. magna.
3.8. Comparison of fish cell and rainbow trout bioassays
The toxicity of 16 whole-water samples from the
paper mill was evaluated with both rainbow trout and
050100150200250300
% Whole-water sample0 20 40 60 80 100 120
% o
fL-1
5/ex
Con
trol
0
20
40
60
80
100
120
140
160
alamar BlueCFDA-AMNeutral Red
**
*
***
**
*
*
**
*
**
Osmolality (mOsmkg-1)
300 320 340 360 380 400 420
KCl (mg/mL)0 1 2 4 5 7 83 6
% o
fL-1
5/ex
Con
trol
0
20
40
60
80
100
120
140
160
alamar BlueCFDA-AMNeutral Red
* * *
* *
*
A
B
Osmolality (mOsmkg-1)
Fig. 2. Viability of RTgill-W1 cultures after 24 h in hypoosmo-
tic and hyperosmotic whole-water samples. In panel A, L-15/ex
was mixed with a whole-water sample to create a dosage range
from approximately 15% to 100% water sample (275–
50mOsmkg�1). In panel B, L-15/ex was mixed with KCl to
create a dosage range from approximately 320 to
400mOsmkg�1. Cell viability was assessed with alamar Blue
(closed circles), CFDA-AM (open squares), and neutral red
(closed triangles). The results were expressed as a percentage of
the readings in control cultures in L-15/ex alone. The values are
mean of five culture wells with standard deviation. Asterisks
denote values that were significantly different from control
(one-way ANOVA followed by Dunnett’s Test, a ¼ 0:05). Inpanel A the EC50 values were 103.7mOsmkg�1 for alamar
Blue, 86.27mOsmkg�1 for CFDA-AM and 109.2mOsmkg�1
for neutral red.
% Whole-water sample/ex
0 20 40 60 80 100 120
% o
f L-1
5/ex
Con
trol
0
20
40
60
80
100
120
140
alamar BlueCFDA-AMNeutral Red
******
Fig. 3. Viability of RTgill-W1 cultures after 24 h in a whole-
water sample that was not toxic to rainbow trout in 96 h
lethality test. Cell viability was assessed with three indicator
dyes as described in Fig. 2. Asterisks denote values that were
significantly different from the control (one-way ANOVA
followed by Dunnett’s Test, a ¼ 0:05).
V.R. Dayeh et al. / Water Research 36 (2002) 3727–37383732

the fish cells. Only one of these samples was toxic
to rainbow trout in the 96 h lethality test, and this
was the same sample (#28) that was toxic to RTgill-W1
cells. Therefore, the rainbow trout lethality test and
cell bioassay were in agreement for this type of
effluent.
4. Discussion
A methodology was developed for applying to fish
cells in culture whole-water samples with only a limited
number of preparatory steps, none of which included
extraction. The strengths, weaknesses, and future of
2D Graph 4
Abietic Acid (µg/mL)
2D Graph 4
Abietic Acid (µg/mL)
0
20
40
60
80
100
120
140
Non-Filtered
0 20 40 60 80 100 120
% o
fL-1
5/ex
Con
trol
0
20
40
60
80
100
120
140Filtered
0
20
40
60
80
100
120
140alamar Blue
CFDA-AM
% Whole-water sample/ex
0
20
40
60
80
100
120
140Neutral Red
% Whole-water sample/ex
% o
fL-1
5/ex
Con
trol
0
20
40
60
80
100
120
140Neutral Red
% o
fL-1
5/ex
Con
trol
0
20
40
60
80
100
120
140CFDA-AM
alamar Blue
****
* *
**
***
*
*
***
****
*
**
*
*
*****
*
*
*
**
*
†
†
†
† † † †
†
† †
*† † † †
† † †
†
†
†
† † † †
†
†
† †
† †
† † †
† †
†
† † † †
0 20 40 60 80 100 120
0 20 40 60 80 100 120 0 20 40 60 80 100 120
0 20 40 60 80 100 120 0 20 40 60 80 100 120
0 20 40 60 80 100 120 0 20 40 60 80 100 120
Fig. 4. Viability of RTgill-W1 cultures after 24 h in abietic acid. A non-toxic whole-water sample was spiked either with 100 mg/mL
abietic acid in DMSO (closed symbols) or with DMSO alone (open symbols) and either filtered (right panels) or not (left panels).
Abietic acid in L-15/ex was tested simultaneously (shaded symbols). Whole-water sample preparations were mixed in culture wells with
various volumes of L-15/ex in order to obtain a dose-range of abietic acid-spiked whole-water sample/ex (closed symbols) or
appropriate DMSO control (open symbols). Cell viability was assessed with three indicator dyes as described in Fig. 2. Asterisks denote
the % of abietic acid-spiked whole-water sample/ex that resulted in fluorescence units different from those in L-15/ex controls (one-
way ANOVA followed by Dunnett’s test, a ¼ 0:05). The w symbol indicates the % abietic acid-spiked whole-water sample/ex that
yielded fluorescence unit readings significantly different from DMSO-spiked control (unpaired t-test, a ¼ 0:05).
V.R. Dayeh et al. / Water Research 36 (2002) 3727–3738 3733
using the cell bioassay are discussed in the following
sections.
4.1. Sample preparation
Preparation of whole-water samples in L-15/ex has
several advantages over the use of complete culture
medium for applying whole-water samples to cells in
culture. The simplicity of this medium, which contains
only salts, pyruvate and galactose, favors expression of
cellular responses to any toxicants that might be present
because protective molecules, such as antioxidants, are
absent. The medium is much less expensive than
complete cell culture medium. As well, the amount of
L-15/ex components can be varied easily to account for
any big differences in the osmolality of whole-water
samples. Finally, the simplicity of the medium reduces
the growth of any microbial contamination during the
24 h of presentation of the whole-water sample to cells in
culture.
The elevation of the readings in the cell viability
assays by whole-water samples likely has multiple
causes, with the importance of each likely depending
on the particular sample. One cause is microbial
contamination from the water sample. This is particu-
larly true for alamar Blue. The microbes would be
difficult to remove completely from the microculture
wells and be carried over into the alamar Blue assay. In
the assay, microbes as well as fish cells would reduce the
dye. In this case, the elevation of alamar Blue readings
should increase as the % of whole-water sample
increases but not be observed with filtered whole-water
samples. However, with some samples, elevated alamar
Blue readings were observed in filtered samples and
the elevation did not increase with increasing sample
concentration. The explanation for this cannot be
microbes. Although osmolality raised alamar Blue
readings, this also was not the explanation for
these water samples because the osmolality
(mOsmkg�1) of water samples in L-15/ex (327721)
was very similar to the osmolality of tissue culture water
in L-15/ex (329710). Another possibility is that the
whole-water samples supply something that is missing in
tissue culture water and that stimulates metabolism of
the cells. A similar hypothesis has previously been put
forth by Schirmer et al. [5] who found exposure of fish
cells to a 90% oil refinery effluent to yield elevated
readings of alamar Blue fluorescence. Some candidate
chemicals that may be supplied are essential trace
minerals.
4.2. Spiked contaminants
Despite the elevation of the indicator dye readings
by some whole-water samples, the fish cell bioassay
was capable of detecting the organic toxicants, abietic
acid and pentachlorophenol (PCP), which could be
expected in paper mill effluent. When spiked into whole-
water samples, these compounds decreased the viability
of RTgill-W1 cultures in a dose-dependent manner.
However, the three viability assays responded slightly
differently to the two different classes of organic
toxicants. An impairment of cellular functions by abietic
acid was detected in whole-water samples with
each of the three indicator dyes, suggesting a general
cytotoxic mechanism. An impairment of cellular func-
tions by PCP in effluent was detected clearly with
two (alamar Blue and neutral red) of the three indicator
dyes, suggesting an interference with energy metabolism
but perhaps less of an impairment of plasma membrane
integrity. These results stress the importance of
using multiple endpoints to detect the presence of
toxicants.
Both abietic acid and PCP appeared to be as potent in
L-15/ex that had been made up in tissue culture water as
in L-15/ex that had been made up in either unfiltered or
filtered water samples. This suggests that the availability
of these contaminants to cells was not influenced by any
suspended matter in the water sample or by filtering the
water sample. The result also suggests that the quality of
the water did not alter the sensitivity of RTgill-W1 to
abietic acid and PCP. Thus, the cell bioassay could be
used to test paper mill samples for their toxic potential
in vitro.
Table 3
Summary of EC50 values for the chemical compounds tested in whole-water samples from a paper mill and in L-15/ex
Compound Indicator dye Non-filtered EC50 (mg/mL) Filtered EC50 (mg/mL) L-15/ex EC50 (mg/mL)
Abietic acid Alamar Blue 29 32 46.9
CFDA-AM 51 51 48.5
Neutral red 32 46 54.6
Pentachlorophenol Alamar Blue 2.72 1.27 2.29
CFDA-AM Not calculated Not calculated 2.30
Neutral red 2.39 2.67 2.49
V.R. Dayeh et al. / Water Research 36 (2002) 3727–37383734

4.3. Paper mill whole-water samples
The cell bioassay detected toxicant(s) in only 1 (# 28)
of the 31 whole-water samples from the paper mill. As
evaluated with alamar Blue and CFDA-AM, this sample
was toxic even after having been filtered. However, the
neutral red results were complex and difficult to explain.
Firstly, no cytotoxicity was detected with neutral red for
the filtered sample 28. Thus the toxicant(s) in the filtered
sample must be less damaging to lysosomes than to cell
membrane integrity or metabolic activity. Secondly, in
the unfiltered sample 28, cytotoxicity was more pro-
nounced with neutral red than with alamar Blue and
CFDA-AM. Although the expectation would be that
Pentachlorophenol (µ(µ g/mL)Pentachlorophenol g/mL)0 1 2 3 4 5 0 1 2 3 4 5
% o
f L-1
5/ex
Con
trol
0
20
40
60
80
100
120
140
0
20
40
60
80
100
120
140
Non-Filtered
0 20 40 60 80 100 120 0 20 40 60 80 100 120
0 20 40 60 80 100 120 0 20 40 60 80 100 120
0 20 40 60 80 100 120 0 20 40 60 80 100 120
% o
f L-1
5/ex
Con
trol
0
20
40
60
80
100
120
140Filtered
0
20
40
60
80
100
120
140alamar Blue
CFDA-AM
% Whole-water sample/ex
0
20
40
60
80
100
120
140Neutral Red
% Whole-water sample/ex
% o
f L-1
5/ex
Con
trol
0
20
40
60
80
100
120
140Neutral Red
CFDA-AM
alamar Blue
*
***
****
****
*
****
** *
**
*
**
**
***
* * *
* * * *
* *
*
† †
† †
†
† †
†
† † *† † † †
† † † † † †
†
† † † † †
† †
† † † †
† † †
† †
†
† † † †
Fig. 5. Viability of RTgill-W1 cultures after 24 h in pentachlorophenol (PCP). A non-toxic whole-water sample was spiked either with
4.4mg/mL PCP (closed symbols) or with DMSO alone (open symbols) and either filtered (right panels) or not (left panels). PCP in L-
15/ex was tested simultaneously (shaded symbols). Whole-water sample preparations were mixed in culture wells with various volumes
of L-15/ex in order to obtain a dose-range of PCP-spiked whole-water sample/ex (closed symbols) or appropriate DMSO control (open
symbols). Cell viability was assessed with three indicator dyes as described in Fig. 2. Asterisks denote % of PCP-spiked whole-water
sample/ex that resulted in fluorescence units different from those in L-15/ex controls (one-way ANOVA followed by Dunnett’s test,
a ¼ 0:05). The w symbol indicates the % PCP-spiked whole-water sample/ex yielded fluorescence unit readings significantly different
from DMSO-spiked control (unpaired t-test, a ¼ 0:05).
V.R. Dayeh et al. / Water Research 36 (2002) 3727–3738 3735

any microbial contamination would not interfere with
the neutral red assay because prokaryotic microbes lack
lysosomes, microbes could have caused lower neutral
red readings in at least two ways. They could have
metabolized the neutral red making less available for the
fish cells to accumulate or they could have produced
something that specifically impaired lysosomal func-
tions. An alternative explanation for the lower neutral
red readings in the unfiltered sample is the presence in
sample 28 of a filterable toxicant that is specific for
lysosomes. This problem with the neutral red assay and
sample 28 suggests two recommendations for future
screens of industrial effluent. Firstly, more than one
endpoint of cell viability should be tested. Secondly,
both filtered and unfiltered sample should be tested, if
possible.
4.4. Comparison of fish cell and D. magna bioassays
RTgill-W1 appeared less sensitive than D. magna to
toxicant(s) in the water samples as 11 samples were toxic
to D. magna but not to the gill cell line. This might be
because Daphnia are more generally sensitive to
toxicants or more sensitive to specific classes of toxicants
than cells in culture. In a study of 19 metals, D. magna
was more sensitive than the cells of the fathead minnow
cell line (FHM) [17]. This was most pronounced for very
toxic heavy metals, such as mercury and silver. D. magna
was also more sensitive to surfactants than hepatocytes
and gill epithelial cells from rainbow trout [18]. Thus in
vitro tests with RTgill-W1 or other fish cells are unlikely
to replace Daphnia tests, which are inexpensive, not
subject to criticism on ethical grounds, and the back-
bone of environmental safety testing.
4.5. Comparison of fish cell and rainbow trout bioassays
Despite the complexity of the neutral red results, the
fish cell bioassay identified the only sample that was
toxic to rainbow trout. However, the rainbow trout
appeared to have been more sensitive than the RTgill-
W1 cells to the toxicant(s) in sample 28. All 10 rainbow
trout died in the 96 h lethality test, whereas the viability
of the cell cultures was reduced at the most only by
about 55%. One possible explanation for this difference
is that the toxicant(s) require more time than the 24 h of
the in vitro tests to elicit their full toxicity. Exposing
RTgill-W1 cultures to samples for a longer period could
test this. However, as a routine practice, this is not
desirable because microbial contamination is more likely
to appear and overwhelm the fish cell cultures. Another
possibility is that the particular toxicant(s) in this sample
are more potent at the organismal level than the cellular
level. Toxicants that target specific organ systems, such
as the nervous system, might fit into this category.
The reason(s) why sample 28 was toxic to both cells
and rainbow trout is unknown and was not the focus of
this study. However, the normal industrial process was
not the source of toxicant(s) because sample 28 was from
the ‘clearwater bypass’. This is water that is used in
cooling of the plant and eventually will receive effluent,
but a sample of ‘clearwater bypass’ has not yet received
effluent. Therefore, the toxicant(s) could have arisen
from some temporary change in the piping such as a
high concentration of antiscalant.
Using fish cell lines to evaluate effluent toxicity has
several advantages over the standard rainbow trout 96-h
Non-Filtered
% Whole-water sample/ex
0 20 40 60 80 100 120
% o
f L-1
5/ex
Con
trol
0
20
40
60
80
100
120 alamar BlueCFDA-AMNeutral Red
**
***
*
*
****
***
** *
* * *
Filtered
% Whole-water sample/ex
% o
f L-1
5/ex
Con
trol
0
20
40
60
80
100
120
alamar BlueCFDA-AMNeutral Red
*
*
**
****
**
**
0 20 40 60 80 100 120
B
A
Fig. 6. Viability of RTgill-W1 cultures after 24 h in whole-
water sample 28 from the paper mill. The sample had been
filtered in Panel B but not in Panel A. Cell viability was assessed
with three indicator dyes as described in Fig. 2. Asterisks denote
the % of whole-water sample/ex that resulted in fluorescence
units different those in L-15/ex controls (one-way ANOVA
followed by Dunnett’s test, a ¼ 0:05).
V.R. Dayeh et al. / Water Research 36 (2002) 3727–37383736

lethality bioassay. One is cost. This method requires
milliliters instead of hundreds of liters of effluent, which
reduces the cost of shipping samples from distant
industrial sites to central testing facilities. Once estab-
lished as a routine procedure fish cell cultures could be
less expensive than the routine purchase of rainbow
trout. The exposure time is only 24 h as opposed to 96 h,
which could reduce the cost of labor but more
importantly allow decisions to be made more rapidly.
Another advantage is that the use of fish cell cultures
satisfies a societal goal to reduce the use of animals in
toxicity testing.
Yet, additional studies should be considered to further
show the reliability of the RTgill-W1 bioassay as a
replacement for the rainbow trout 96-h lethality test.
More samples that are toxic to rainbow trout need to be
evaluated in vitro, as well the feasibility of applying
whole water samples from different industries to fish
cells needs to be explored. Also how salts might
influence cytotoxicity could contribute to understanding
the reliability of the in vitro tests. Eventually, enough
results could be obtained to allow a correlation between
in vivo and in vitro toxicity to be established more
generally. Once this has been done, whole-water samples
could be applied to fish cells to routinely screen
industrial effluents for the purpose of quickly identifying
episodic events of high toxicity.
5. Conclusions
Based on the analysis of the results obtained from this
study, the following conclusions can be drawn:
(I) A methodology was developed for presenting to
fish cells in culture unextracted samples of
industrial effluent (whole-water samples).
(II) Exposure of the rainbow trout cell line, RTgill-
W1, to some whole-water samples from a paper
mill for 24 h caused no change in cell viability as
measured with three fluorescent indicator dyes:
alamar Blue for metabolism, CFDA-AM for
membrane integrity and neutral red for lysosomal
activity.
(III) However, the toxicity of whole-water samples
could be detected by these methods because
spiking these samples with abietic acid or penta-
chlorophenol did cause a dose-dependent decline
in cell viability.
(IV) When whole-water samples from over a year of
routine monitoring of a paper mill were evaluated
for their toxicity with RTgill-W1, rainbow trout,
and D. magna, some samples were toxic to D.
magna, but none of these were toxic to RTgill-W1.
(V) Only 1 of the 31 paper mill samples was toxic to
RTgill-W1, and this was also the only sample toxic
to rainbow trout.
(VI) These results suggest that presenting whole-water
samples to fish cells in culture can be used to
evaluate the toxicity of industrial effluents and can
serve potentially as a replacement for rainbow
trout but not D. magna in routine toxicity testing.
Acknowledgements
This research was supported by Center for Research
in Earth & Space Technologies (CRESTech). We would
like to thank Dennis G. Farara of BEAK International
Inc. and Dr. Jim Barker of the University of Waterloo
for their support and encouragement as well as Dr.
Ulysses Klee, Julie Schroeder and Serena Maki at
BEAK International Inc. for coordinating effluent
shipments from the paper mill and the helpful discus-
sions.
References
[1] Ahne W. Use of fish cell cultures for toxicity determination
in order to reduce and replace the fish tests. Zentralbl
Bakteriol Mikrobiol Hyg [B] 1985;180(5–6):480–504.
[2] Mochida K. Aquatic toxicity evaluated using human and
monkey cell culture assays. Bull Environ Contam Toxicol
1986;36(4):523–6.
[3] Richardson D, Dorris TC, Burks S, Browne RH, Higgins
ML, Leach FR. Evaluation of a cell culture assay
for determination of water quality of oil-refinery effluents.
Bull Environ Contam Toxicol 1977;18:683–90.
[4] Maruoka S. Estimation of toxicity using cultured mam-
malian cells of organic pollutants recovered from Lake
Biwa. Water Res 1978;12:371–5.
[5] Schirmer K, Tom DJ, Bols NC, Sherry JP. Ability of
fractionated petroleum refinery effluent to elicit cyto-and
photocytotoxic responses and to induce 7-ethoxyresorufin-
o-deethylase activity in fish cell lines. Sci Total Environ
2001;127:129–41.
[6] Kfir R, Prozesky OW. Detection of toxic substances in
water by means of a mammalian cell culture technique.
Water Res 1981;15:553–9.
[7] VanDoren SR, Hall MS, Frazier LB, Leach FR. A rapid-
cell culture assay of water quality. Bull Environ Contam
Toxicol 1984;32(2):220–6.
[8] Bols NC, Lee LEJ. Cell lines: availability, propagation and
isolation. In: Hochachka PW, Mommsen TP, editors.
Biochemistry and molecular biology of fishes, vol. 3.
Amsterdam: Elsevier Science, 1994. p. 145–9.
[9] Schirmer K, Chan AGJ, Greenberg BM, Dixon DG, Bols
NC. Methodology for demonstrating and measuring the
photocytotoxicity of fluoranthene to fish cells in culture.
Toxicol In vitro 1997;11:107–19.
[10] Wiemer KE, Anderson A, Stewart B. The importance of
water quality for media preparation. Hum Reproduction
1998;13:166–72.
V.R. Dayeh et al. / Water Research 36 (2002) 3727–3738 3737

[11] Bols NC, Barlian A, Chirino-Trejo M, Caldwell SJ,
Goegan P, Lee LEJ. Development of a cell line from
primary cultures of rainbow trout, Oncorhynchus mykiss
(Walbaum), gills. J Fish Dis 1994;17:601–11.
[12] Environment Canada. The development document for the
effluent monitoring regulation for the pulp and
paper sector. Queen’s Printer for Ontario, Environment
Ontario, 1989. p. 1–55.
[13] Environment Canada. Biological test method: acute
lethality test using rainbow trout. EPS 1/RM/9, Ottawa,
Canada, Environment Canada, Environmental Protection
Series, 1990. p. 1–51.
[14] Environment Canada. Biological test method: reference
method for determining acute lethality of effluents to Daphnia
magna. EPS 1/RM/14, Ottawa, Canada, Environment
Canada, Environmental Protection Series, 1990. p. 1–18.
[15] Ganassin RC, Schirmer K, Bols NC. Methods for the use
of fish cell and tissue cultures as model systems in basic and
toxicology research. In: Ostrander GK, editor. The
laboratory fish. San Diego, CA: Academic Press, 2000.
p. 631–51.
[16] Wolf K, Ahne W. Fish cell culture. Adv Cell Cult
1982;2:305–28.
[17] Dierickx PJ, Brendael-Rozen E. Correlation between the in
vitro cytotoxicity of inorganic metal compounds to
cultured fathead minnow fish cells and the toxicity to
Daphnia magna. Bull Environ Contam Toxicol
1996;57:107–10.
[18] Sandbaka M, Christianson I, Isomaa B. The acute
toxicity of surfactants on fish cells, Daphnia magna
and fish—a comparative study. Toxicol In vitro
2000;14:61–8.
V.R. Dayeh et al. / Water Research 36 (2002) 3727–37383738