Applying IUCN Red List criteria at a small regional level: A test case with butterflies in Flanders...
9
Applying IUCN Red List criteria at a small regional level: A test case with butterflies in Flanders (north Belgium) Dirk Maes a,⇑ , Wouter Vanreusel b , Ilf Jacobs b , Koen Berwaerts c , Hans Van Dyck d a Research Institute for Nature and Forest (INBO), Kliniekstraat 25, B-1070 Brussels, Belgium b Natuurpunt, Coxiestraat 11, B-2800 Mechelen, Belgium c Vlinderwerkgroep Natuurpunt, Coxiestraat 11, B-2800 Mechelen, Belgium d Biodiversity Research Centre, Earth and Life Institute, Université catholique de Louvain, Croix du Sud 4, B-1348 Louvain-la-Neuve, Belgium article info Article history: Received 23 August 2011 Received in revised form 31 October 2011 Accepted 27 November 2011 Available online 2 January 2012 Keywords: Distribution Extinction Hotspots Threatened species Population trend abstract Red Lists are used to assess the extinction risk of species based on quantitative IUCN criteria. For the com- pilation of a new Red List of butterflies in Flanders (north Belgium), we collated ca 800,000 distribution records and applied the IUCN Red List criteria to this small region (ca 135,00 km 2 ). We also explored the effect of spatial resolution on the outcome of the Red List assessment by alternatively using 1 1 km 2 and 5 5 km 2 grid cells for geographic range size and trend calculations. We determined conservation hot spots in Flanders based on the Red List status of the species composition in each grid cell. The new Red List classified 20 butterflies (out of 68 resident species) as Regionally Extinct, six as Critically Endan- gered, five as Endangered, seven as Vulnerable and seven as Near Threatened. The remaining 23 species were classified as Least Concern. Using coarse instead of fine grain grid cells would have classified ten spe- cies in a lower Red List category. Compared with the previous Red List, nine species were classified in a lower and 12 in a higher threat category. In total, 218 1 1 km 2 grid cells were considered as (very) high butterfly conservation priority sites. The application of the new IUCN criteria in a small region such as Flanders resulted in a Red List that offered challenging opportunities for the conservation of butterflies in particular and biodiversity in general. Ó 2011 Elsevier Ltd. All rights reserved. 1. Introduction Red Lists assess the extinction risk of species (Mace et al., 2008) and are often used in conservation planning (Keller and Bollmann, 2004; Miller et al., 2006). In the past, Red Lists were usually com- piled using subjective (‘‘expert opinion’’) and/or qualitative criteria (Mace and Collar, 1995; Mace and Lande, 1991). Already in 1991, the International Union for Conservation of Nature (IUCN) agreed upon the use of quantitative criteria for the classification of species in threat categories on a global level (Mace and Lande, 1991). These criteria were, however, repeatedly revised and eventually adopted by the IUCN Council in 2000 (IUCN, 2001). In 2003, these criteria were adapted to the regional (non-global) level (Gärdenfors et al., 2001; IUCN, 2003). We recently adopted the IUCN criteria in Flan- ders (Maes et al., 2011), one of the three administrative regions of Belgium, and tested how they could be applied in this small geo- graphical region (ca 13,500 km 2 ). The regional Flemish government is responsible for most aspects of nature conservation policy and it is, therefore, more appropriate to compile a regional Flemish Red List than to assess species on a federal Belgian level. Butterflies are often used as indicators of both environmental quality and biodiversity in general (Brereton et al., 2011). Since they are useful early warning organisms and appealing to the pub- lic, butterflies are suitable ambassadors for conservation actions and policy making (Fleishman and Murphy, 2009). Especially in re- gions under high human pressure, butterflies recently declined strongly and many species became regionally extinct (The Nether- lands – Bos et al., 2006; Wallonia (south Belgium) – Fichefet et al., 2008; UK – Fox et al., 2011). A previous analysis pointed out that Flanders was one of the regions with the highest butterfly diversity loss in Europe (Maes and Van Dyck, 2001). The strong decline in butterfly diversity was explained by the high degree of fragmenta- tion of semi-natural biotopes (caused by building and road con- struction – Peymen et al., 2005) and by the declining habitat quality due to increased nitrogen deposition (mainly caused by both intensive farming, industry and households – Schneiders et al., 2007). At first, only specialized species of rare and threatened biotopes appeared to be affected, but recently also several of the species previously classified as common generalists showed equally strong declines in Flanders and in The Netherlands (Van Dyck et al., 2009). 0006-3207/$ - see front matter Ó 2011 Elsevier Ltd. All rights reserved. doi:10.1016/j.biocon.2011.11.021 ⇑ Corresponding author. Tel.: +32 2 525 02 72; fax: +32 2 525 03 00. E-mail addresses: [email protected] (D. Maes), wouter.vanreusel@natuurpunt. be (W. Vanreusel), [email protected] (I. Jacobs), [email protected] (K. Berwaerts), [email protected] (H. Van Dyck). Biological Conservation 145 (2012) 258–266 Contents lists available at SciVerse ScienceDirect Biological Conservation journal homepage: www.elsevier.com/locate/biocon
-
Upload
natuurpunt -
Category
Documents
-
view
2 -
download
0
Transcript of Applying IUCN Red List criteria at a small regional level: A test case with butterflies in Flanders...

Biological Conservation 145 (2012) 258–266
Contents lists available at SciVerse ScienceDirect
Biological Conservation
journal homepage: www.elsevier .com/locate /b iocon
Applying IUCN Red List criteria at a small regional level: A test casewith butterflies in Flanders (north Belgium)
Dirk Maes a,⇑, Wouter Vanreusel b, Ilf Jacobs b, Koen Berwaerts c, Hans Van Dyck d
a Research Institute for Nature and Forest (INBO), Kliniekstraat 25, B-1070 Brussels, Belgiumb Natuurpunt, Coxiestraat 11, B-2800 Mechelen, Belgiumc Vlinderwerkgroep Natuurpunt, Coxiestraat 11, B-2800 Mechelen, Belgiumd Biodiversity Research Centre, Earth and Life Institute, Université catholique de Louvain, Croix du Sud 4, B-1348 Louvain-la-Neuve, Belgium
a r t i c l e i n f o a b s t r a c t
Article history:Received 23 August 2011Received in revised form 31 October 2011Accepted 27 November 2011Available online 2 January 2012
Keywords:DistributionExtinctionHotspotsThreatened speciesPopulation trend
0006-3207/$ - see front matter � 2011 Elsevier Ltd. Adoi:10.1016/j.biocon.2011.11.021
⇑ Corresponding author. Tel.: +32 2 525 02 72; fax:E-mail addresses: [email protected] (D. Maes), w
be (W. Vanreusel), [email protected] (I. Jaco(K. Berwaerts), [email protected] (H. Van D
Red Lists are used to assess the extinction risk of species based on quantitative IUCN criteria. For the com-pilation of a new Red List of butterflies in Flanders (north Belgium), we collated ca 800,000 distributionrecords and applied the IUCN Red List criteria to this small region (ca 135,00 km2). We also explored theeffect of spatial resolution on the outcome of the Red List assessment by alternatively using 1 � 1 km2
and 5 � 5 km2 grid cells for geographic range size and trend calculations. We determined conservationhot spots in Flanders based on the Red List status of the species composition in each grid cell. The newRed List classified 20 butterflies (out of 68 resident species) as Regionally Extinct, six as Critically Endan-gered, five as Endangered, seven as Vulnerable and seven as Near Threatened. The remaining 23 specieswere classified as Least Concern. Using coarse instead of fine grain grid cells would have classified ten spe-cies in a lower Red List category. Compared with the previous Red List, nine species were classified in alower and 12 in a higher threat category. In total, 218 1 � 1 km2 grid cells were considered as (very) highbutterfly conservation priority sites. The application of the new IUCN criteria in a small region such asFlanders resulted in a Red List that offered challenging opportunities for the conservation of butterfliesin particular and biodiversity in general.
� 2011 Elsevier Ltd. All rights reserved.
1. Introduction
Red Lists assess the extinction risk of species (Mace et al., 2008)and are often used in conservation planning (Keller and Bollmann,2004; Miller et al., 2006). In the past, Red Lists were usually com-piled using subjective (‘‘expert opinion’’) and/or qualitative criteria(Mace and Collar, 1995; Mace and Lande, 1991). Already in 1991,the International Union for Conservation of Nature (IUCN) agreedupon the use of quantitative criteria for the classification of speciesin threat categories on a global level (Mace and Lande, 1991). Thesecriteria were, however, repeatedly revised and eventually adoptedby the IUCN Council in 2000 (IUCN, 2001). In 2003, these criteriawere adapted to the regional (non-global) level (Gärdenfors et al.,2001; IUCN, 2003). We recently adopted the IUCN criteria in Flan-ders (Maes et al., 2011), one of the three administrative regions ofBelgium, and tested how they could be applied in this small geo-graphical region (ca 13,500 km2). The regional Flemish governmentis responsible for most aspects of nature conservation policy and it
ll rights reserved.
+32 2 525 03 [email protected]), [email protected]).
is, therefore, more appropriate to compile a regional Flemish RedList than to assess species on a federal Belgian level.
Butterflies are often used as indicators of both environmentalquality and biodiversity in general (Brereton et al., 2011). Sincethey are useful early warning organisms and appealing to the pub-lic, butterflies are suitable ambassadors for conservation actionsand policy making (Fleishman and Murphy, 2009). Especially in re-gions under high human pressure, butterflies recently declinedstrongly and many species became regionally extinct (The Nether-lands – Bos et al., 2006; Wallonia (south Belgium) – Fichefet et al.,2008; UK – Fox et al., 2011). A previous analysis pointed out thatFlanders was one of the regions with the highest butterfly diversityloss in Europe (Maes and Van Dyck, 2001). The strong decline inbutterfly diversity was explained by the high degree of fragmenta-tion of semi-natural biotopes (caused by building and road con-struction – Peymen et al., 2005) and by the declining habitatquality due to increased nitrogen deposition (mainly caused byboth intensive farming, industry and households – Schneiderset al., 2007). At first, only specialized species of rare and threatenedbiotopes appeared to be affected, but recently also several of thespecies previously classified as common generalists showedequally strong declines in Flanders and in The Netherlands (VanDyck et al., 2009).

D. Maes et al. / Biological Conservation 145 (2012) 258–266 259
Here, we present one of the first cases of the application of thenew IUCN criteria for insects in a relatively small region such asFlanders (north Belgium) (but see Cardoso et al., 2011 and Fitzpa-trick et al., 2007), and discuss the applicability to other inverte-brate groups and the implications for policy. We compared thepresent Red List with the previous one by applying the new criteriato the data of the previous Red List (Maes and Van Dyck, 1999). Toassess the effect of spatial resolution on the eventual Red List cat-egorization, we also compared the use of fine (i.e., 1 � 1 km2) andcoarse (i.e., 5 � 5 km2) grid cell sizes for calculating species trendsand distribution areas. Finally, we determined conservation hot-spots by using the threat status of the different species and suggestmeasures for the conservation and management of butterflies inFlanders.
2. Material and methods
2.1. Study area and data
Since the publication of the previous butterfly atlas in Flanderscovering the period 1901–1999 (Maes and Van Dyck, 1999), manynew records (e.g., observations, monitoring data, garden butterflycounts, systematic grid cell surveys) have been collected in theperiod 2001–2010, mostly by citizen-science projects. Recentobservations are made by skilled volunteers using an online datasubmission system (http://waarnemingen.be). Although this on-line recording system is only in use since 2008, it was responsiblefor almost 1/3 of all butterfly observations in Flanders. Monitoringdata are gathered on about 100 transects since 1991 in Flanders(van Swaay et al., 1997). In 2007, the largest private nature organi-sation in Flanders (Natuurpunt vzw) started a project in which 19common butterflies are counted monthly in gardens (Bartels andVanreusel, 2011). Finally, between 2007 and 2009, skilled volun-teers collected semi-quantitative data on all butterfly species inso called systematic grid cell surveys by visiting the different bio-tope types in a random selection of 585 grid cells of 1 � 1 km2 dur-ing 1 h. In total, 778,226 records were collated for this analysis ofwhich 64% came from the period 2001–2010 (Table 1).
2.2. The IUCN criteria
The IUCN distinguishes 11 categories for listing species in regio-nal Red Lists (IUCN Standards and Petitions Working Group, 2010).Three categories refer to extinct species: Extinct (EX – globally ex-tinct species), Extinct in the Wild (EXW – species for which popula-tions are only present in captivity) and Regionally Extinct (RE –species that are extinct in the focal region). Five categories are usedto classify species in different extinction risk categories: CriticallyEndangered (CR), Endangered (EN), Vulnerable (VU), Near Threatened(NT) and Least Concern (LC). The three remaining categories areData Deficient (DD – species for which insufficient data are avail-able to classify them in one of the Red List categories, e.g., crypticor inconspicuous species), Not Applicable (NA – species for whichthe Red List criteria do not apply, e.g., introduced species) and
Table 1Number of records per record type and the number of surveyed grid c
Record type Before 200
Occasional observations 214,891Butterfly monitoring 65,743Garden butterfly counts –Systematic grid cell surveys –
Total number of records 280,634 (3
Number of 5 � 5 km2 surveyed grid cells 616 (96%)Number of 1 � 1 km2 surveyed grid cells 4575 (32%)
Not Evaluated (NE – species that were not yet evaluated againstthe Red List criteria, e.g., migrant species). We will refer to Red Listspecies as those species belonging to the categories Regionally Ex-tinct, Critically Endangered, Endangered, Vulnerable or Near Threa-tened. Five criteria are used to classify species in the categoriesCritically Endangered, Endangered and Vulnerable (Mace et al.,2008): (A) population reduction during the last 10 years, (B) geo-graphic range, (C) small population size and decline, (D) very smallor restricted population and (E) quantitative analysis of extinctionrisk (Mace et al., 2008).
2.3. Applying IUCN criteria to Flanders (north Belgium)
For the Red List classification of butterflies in Flanders, we onlyused IUCN criteria A, B and E. Table 2 gives an overview of the thresh-olds used to classify species as Critically Endangered, Endangered, Vul-nerable or Near Threatened in Flanders. Species not assigned to one ofthese categories were classified as Least Concern. If testing againstdifferent criteria resulted in different categories, the species wasclassified in the highest of the obtained threat categories (Maceet al., 2008). IUCN Criteria C and D could not be used because abso-lute population numbers are not readily available for butterflies andother invertebrates. These criteria are more tailored for long-livedorganisms than for other smaller and less conspicuous organisms(e.g., Hallingbäck et al., 1995; Regnier et al., 2009). To correctly com-pare the new Red List with the previous one, we also applied themethod presented here to the data of the previous Red List.
2.3.1. Criterion A2c: population reductionSince Flanders does not have an extensive butterfly monitoring
network as the UK (Botham et al., 2009) or the Netherlands (vanSwaay et al., 2008), we were unable to estimate changes in thenumber of individuals during the last 10 years. Instead, we calcu-lated the changes in distribution area between the periods 1991–2000 and 2001–2010 by counting the number of 1 � 1 km2 gridcells in which a species occurred in each period. Since the secondperiod was much better surveyed than the first period (Table 1),we limited the analysis to the grid cells that were surveyed in bothperiods and in which at least five species were observed in bothperiods (N = 1614 grid cells – Fig. 1). For each species, we subse-quently calculated a relative distribution area per period. Again,to account for the more complete survey in the second period,we divided the number of grid cells by the grid cell sum in eachperiod (20,317 and 23,614 in the period 1991–2000 and 2001–2010, respectively – cf. Desender and Turin, 1989). We subse-quently calculated the trend giving the change in distribution areain 1 � 1 km2 grid cells between the period 2001–2010 and the per-iod 1991–2000, using the following formula:
Trend ¼ 100� ðrel:dist 2001—2010Þ � ðrel:dist 1991—2000Þðrel:dist 1991—2000Þ
To assess the effect of spatial resolution on the classification ofspecies, we also calculated a change in distribution area using thesame formula but with a relative distribution based on 5 � 5 km2
ells before and since 2001.
1 2001–2010 Total
416,711 631,602 (81%)29,877 95,620 (12%)38,193 38,193 (5%)12,811 12,811 (2%)
6%) 497,592 (64%) 778 226
636 (99%) 638 (99%)9708 (68%) 10,667 (74%)

Table 2IUCN criteria used to classify butterflies in the different IUCN Red List categories in Flanders. ‘�’: the criterion is not used.
Red List category Criticallyendangered
Endangered Vulnerable Near threatened
Criterion A2c: Population reductionDecline in area of occupancy (AOO) P80% 50–80% 30–50% 20–30%
Criterion B2: Geographic range size AOO<10 km2 10–500 km2 500–2000 km2 2000–3000 km2
And at least two of the three subcriteria (a)–(c)a (i) Severely fragmented or
(ii) Number of locations 1 2–5 6–10 –b (ii) Decline in AOO
(iii) Decline in area, extent and/or quality of the habitatc (iv) Extreme fluctuations in the number of mature individuals
Criterion E: Quantitative analysis of extinction risk (based on the Climatic Risk Atlas of European butterflies – Settele et al., 2008)Predicted decline in AOO of – – – P95%
Fig. 1. Grid cells of 1 � 1 km2 in Flanders used to calculate changes in distribution area between the periods 1991–2000 and 2001–2010. These grid cells were surveyed inboth periods and in all grid cells at least five species were observed in both periods. The background shows the five major ecoregions (i.e., regions with similar geological,geomorphological, ground and surface water characteristics).
260 D. Maes et al. / Biological Conservation 145 (2012) 258–266
instead of 1 � 1 km2 grid cells. Apart from a recent populationtrend, we also calculated a historical trend by comparing the distri-bution area in the period 2001–2010 with that in the period 1951–2000. Due to the less accurate mapping in the period 1951–2000,we used grid cells of 5 � 5 km2 for the historical trend calculationinstead of 1 � 1 km2 grid cells. The 10-year trend for all speciesusing both 1 � 1 km2 and 5 � 5 km2 grid cells is given in the Sup-plementary Appendix A.
2.3.2. Criterion B2: geographic rangeWe used the number of 1 � 1 km2 grid cells in which each spe-
cies was observed in the period 2001–2010 as the area of occu-pancy (AOO). Additionally, we used subcriterion b(iii) for speciesof nutrient-poor grasslands and heathlands, two of the most threa-tened biotopes in Flanders that show a declining habitat qualitydue to a high pressure of atmospheric nitrogen deposition(Schneiders et al., 2007; Van Landuyt, 2002). Subcriterion c(iv)was used for species with extreme fluctuations in the number ofindividuals, e.g., Vanessa atalanta (a partial migrant in Flanders –see further) and for Nymphalis polychloros and N. antiopa, twohighly mobile species that can be observed in highly variable num-bers from year to year. We classified species as Near Threatened un-der criterion B2 if it had an AOO of 2000–3000 km2 and if two ofthe three subcriteria were fulfilled or when it had an AOO of lessthan 2000 km2 but only one of the three subcriteria of criterionB2 was fulfilled (Mace et al., 2008). When using 5 � 5 km2 gridcells, the AOO was calculated as the total area of the occupied grid
cells 5 � 5 km2 (e.g., a species occurring in 25 grid cells of5 � 5 km2 would have an AOO of 625 km2).
2.3.3. Criterion E: quantitative analysis indicating the probability ofextinction
The distribution of butterflies is relatively well known in Europe(Kudrna, 2002). Recently, European distribution data were used tocompile a Climatic Risk Atlas of European Butterflies in whichpotential climate change induced shifts in distributions weremodelled (Settele et al., 2008). We considered species as NearThreatened if a decline in distribution area of at least 95% was pre-dicted in Belgium (Table 2 – cf. van Swaay et al., 2011) in a scenariosimilar to the IPCC A1FI climate change scenario (a mean temper-ature increase of 4.1 �C in 2080 – Spangenberg et al., 2012).
2.3.4. Downgrading and upgrading of Red List categoriesIn a first step, regional Red List classifications were carried out
using the IUCN criteria described above. A similar approach wasused for the new Red List of British butterflies in the UK (Foxet al., 2011) and for the European Red List of butterflies (van Swaayet al., 2011). But, according to the IUCN criteria for regional levels(IUCN, 2003), the resulting IUCN Red List category from this assess-ment should be downgraded by one category if populations inneighbouring regions can exert a rescue effect on the Flemish pop-ulations. Since Flanders is a relatively small region (ca 13,500 km2)surrounded by regions/countries with a similar butterfly fauna,this rescue effect is possible for a number of species. To take thepossible rescue effect into account, we also checked the Red List

D. Maes et al. / Biological Conservation 145 (2012) 258–266 261
status of the species in (one of) the neighbouring regions (theNetherlands – Bos et al., 2006 and Wallonia (south Belgium) –
Table 3IUCN criteria used to classify butterflies in the new Red List of Flanders (north Belgium).
Regionally extinct (between brackets the last year of observation in Flanders)
Aporia crataegi (1965) Coenonympha tullia (Argynnis adippe (1947) Euphydryas aurinia (Argynnis aglaja (1971) Heteropterus morpheArgynnis niobe (1977) Hipparchia statilinusBoloria euphrosyne (1949) Leptidea reali (probaBoloria selene (1995) Limenitis populi (196Coenonympha hero (1912) Melanargia galathea
Criterion A2c Criterion B2 CriE
Critically Endangered (CR)Melitaea cinxia NT [20–30%] EN [10–500 km2, a(i)b(ii,iii)] –Nymphalis antiopa LC [<20%] CR [<10 km2, a(ii)c(iv)] –Nymphalis polychloros VU [30–50%] EN [10–500 km2, b(ii,iii)c(iv)] –Phengaris alcon VU [30–50%] EN [10–500 km2, a(i)b(ii,iii) –Pyrgus malvae LC[ (<20%] EN [10–500 km2, a(i)b(iii)] NTSatyrium ilicis EN [50–80%] EN [10–500 km2, a(i)b(ii,iii)] –
Endangered (EN)Apatura iris VU [30–50%] EN [10–500 km2, a(i)b(ii)] –Hesperia comma NT [20–30%] EN [10–500 km2, a(i)b(ii,iii)] –Hipparchia semele LC [<20%] EN [10–500 km2, a(i)b(iii)] –Lasiommata megera EN [50–80%] EN [10–500 km2, a(i)b(ii,iii)] –Plebejus argus LC [<20%] EN [10–500 km2, a(i)b(iii)] –
Vulnerable (VU)Callophrys rubi LC [<20%] EN [10–500 km2 km2, a(i)b(iii)] –Cyaniris semiargus LC [<20%] NT [10–500 km2, b(iii)] –Erynnis tages LC [<20%] NT [10–500 km2, b(iii)] –Lycaena tityrus LC [<20%] NT [10–500 km2, b(iii)] –Satyrium w-album LC [<20%] EN [10–500 km2, a(i)b(iii)] –Thymelicus lineola VU [30–50%] NT [500–2000 km2, b(ii,iii)] –Thymelicus sylvestris EN [50–80%] EN [10–500 km2, a(i)b(ii,iii)] –
Near Threatened (NT)Aglais urticae VU [30–50%] NT [2000–3000 km2, b(ii)] NTCarterocephalus palaemon LC [<20%] NT [10–500 km2, a(i)] –Cupido minimus LC [<20%] NT [10–500 km2, b(iii)] –Gonepteryx rhamni VU [30–50%] NT [2000–3000 km2, b(iii,iii)] –Issoria lathonia LC [<20%] NT [10–500 km2, b(iii)] –Leptidea sinapis LC [<20%] NT [10–500 km2, b(iii)] –Limenitis camilla LC [<20%] NT [10–500 km2, a(i)] –
Least Concern (LC)Aglais io LC [<20%] LC [>3000 km2] –Anthocharis cardamines LC [<20%] LC [2000–3000 km2] –Aphantopus hyperantus LC [<20%] LC [500–2000 km2] NTAraschnia levana NT (20–30%] NT [500–2000 km2, b(ii)] –Argynnis paphia LC [<20%] LC [10–500 km2] –Aricia agestis LC [<20%] LC [500–2000 km2] –Carcharodus alceae – LC [10–500 km2] –Celastrina argiolus LC [<20%] LC [>3000 km2] –Coenonympha pamphilus LC [<20%] NT [500–2000 km2, b(iii)] –Favonius quercus LC [<20%] LC [500–2000 km2] –Lycaena phlaeas LC [<20%] LC [2000–3000 km2] –Maniola jurtina LC [<20%] LC [>3000 km2] –Ochlodes sylvanus LC [<20%] LC [500–2000 km2] –Papilio machaon LC [<20%] LC [2000–3000 km2] –Pararge aegeria LC [<20%] LC [>3000 km2] –Pieris brassicae LC [<20%] LC [>3000 km2] –Pieris napi NT (20–30%] LC [>3000 km2, b(ii)] –Pieris rapae LC [<20%] LC [>3000 km2] –Polygonia c-album LC [<20%] LC [>3000 km2] –Polyommatus icarus LC [<20%] LC [>3000 km2] –Pyronia tithonus LC [<20%] LC [>3000 km2] –Thecla betulae LC [<20%] NT [500–2000 km2, b(iii)] –Vanessa atalanta LC [<20%] LC [>3000 km2] –
Criterion A2c, B2 and E represent the IUCN criteria used to compile the Flemish Red List (sthe criteria are given between square brackets; ‘–’ means that none of the criteria were mlower than 50% it is indicated with ‘–’. RLC Wal and RLC NL are the Red List status in Walbetween brackets, the distance to the nearest Flemish populations is considered too far tofrom the region or in the country. The comments indicate whether a species was up- oraccording to Fauna Europaea (http://www.faunaeur.org/).
Fichefet et al., 2008). If a species was not threatened (Least Concern)in the neighbouring regions or in the region from which the rescue
1994) Melitaea athalia (1968)1959) Melitaea diamina (1954)us (1995) Phengaris teleius (1980)(1902) Plebejus idas (1984)bly late 1950s) Pyrgus armoricanus (1952)7) Spialia sertorius (1937)(2003)
terion Historicaltrend
RLCWal
RLCNL
Rescueeffect
Comments
>50% (LC) CR – Upgraded (historical decline)– EN RE –>50% LC CR – Upgraded (historical decline)>50% – EN – Upgraded (historical decline)>50% VU EN – Upgraded (historical decline)>50% (CR) EN – Upgraded (historical decline)
– LC CR –– (CR) EN –– (CR) NT –>50% LC LC Y– (VU) NT –
– (NT) LC Y Downgraded (rescue effect)>50% NT (RE) – Upgraded (historical decline)>50% NT CR – Upgraded (historical decline)>50% LC VU – Upgraded (historical decline)– LC (CR) Y Downgraded (rescue effect)– NT LC –– LC LC Y Downgraded (rescue effect)
– LC LC Y Downgraded (rescue effect)– (LC) VU –– EN (RE) –– LC LC Y Downgraded (rescue effect)– (LC) VU –– LC NT –– LC EN –
– LC LC Y– LC LC Y– LC LC Y Downgraded (rescue effect)– LC LC Y Downgraded (rescue effect)– LC (RE) Y– LC NT –– LC – Y– LC LC Y– LC LC Y Downgraded (rescue effect)– NT LC –– LC LC Y– LC LC Y– LC NT –– LC LC Y– LC LC Y– LC LC Y– LC LC Y– LC LC Y– LC LC Y– LC LC Y– LC LC Y– LC (EN) Y Downgraded (rescue effect)– NE NE Y
ee Table 2); if a species meets one of the criteria, the resulting Red List category andet; the highest threat category per species is given in bold. If the historical decline islonia (south Belgium) and the Netherlands respectively; if the threat status is givenexert a rescue effect from that region or country; ‘–’ means that the species is absentdown-graded to obtain the final Red List category for Flanders. Species names are

Table 4Percentage decline at 1 � 1 km2 and at 5 � 5 km2 resolution and the differencebetween both (calculated as 100 � [(1 � (5 km/1 km)] – Thomas and Abery, 1995) fordeclining common and rare species in Flanders.
Species Utm1 km Utm5 km %difference
Common species (occurring in P 500 1 � 1 km2 grid cells)Aglais io �8 �4 50Araschnia levana �20 �11 45Pieris napi �20 �11 45Pararge aegeria �7 �4 43Pieris rapae �10 �6 40Thymelicus lineola �31 �20 35Aglais urticae �48 �31 35Gonepteryx rhamni �30 �22 27
262 D. Maes et al. / Biological Conservation 145 (2012) 258–266
is most likely, we downgraded the species by one Red List categoryaccording to the IUCN criteria. But, if the species was classified asCritically Endangered, Endangered, Vulnerable or Near Threatened in(one of) the neighbouring regions or in the region from whichthe rescue is most likely, we retained the initially obtained Red Listcategory.
On the other hand, if the historical trend was strongly negative,we upgraded the Red List category of a species with one category.In our case, we arbitrarily used the threshold of a 50% decline indistribution area as a strong historical decline which correspondswith the IUCN criterion A2 for the Red List category Endangered(Fox et al., 2011)
Mean 40
Rare species (occurring in < 500 1 � 1 km2 grid cells)Apatura iris �46 �22 52Cupido minimus �14 �10 29Melitaea cinxia �28 �21 25Thymelicus sylvestris �53 �45 15Lasiommata megera �69 �67 3Satyrium ilicis �60 �68 �13Coenonympha pamphilus �19 �22 �16Phengaris alcon �47 �57 �21Hesperia comma �29 �40 �38Hipparchia semele �18 �27 �50Mean �1
2.4. Conservation priority sites
To determine conservation priority sites, we assigned numericvalues to the different Red List categories that correspond withthe trend in distribution area criterion (criterion A2): Least Concernspecies were assigned a value of 1 (very small extinction risk), NearThreatened species a value of 20 (low extinction risk – correspond-ing with the threshold value of a 20% decline to classify for the NearThreatened category), Vulnerable species a value of 30, Endangeredspecies a value of 50 and Critically Endangered species a value of80 (highest extinction risk). Subsequently, we summed these val-ues to obtain an extinction risk value (ERV) per 1 � 1 km2 grid celland differentiated between grid cells with a very high (i.e.,ERV P 200), a high (ERV 150–199), a low (ERV 100–149) and avery low conservation priority (ERV < 100).
3. Results
Applying the new IUCN criteria and their subcriteria to the 68resident butterfly species in Flanders resulted in 20 Regionally Ex-tinct species, six Critically Endangered species, five Endangered spe-cies and seven Vulnerable species (Table 3). A further seven specieswere considered Near Threatened and the remaining 23 specieswere assessed as Least Concern. In total, 66% of the butterfly speciesin Flanders were considered extinct or threatened. Compared withthe neighbouring countries or regions, Flanders and the Nether-lands have a similarly high proportion of Red List species (66–68%) while Wallonia and the UK have lower numbers of threatenedspecies (55–59%).
Compared with the previous Red List (but applying the methodpresented here), a similar percentage (68% vs. 66%) was classifiedas Near Threatened or higher in both the previous and the actualRed List. Twelve species were classified in a higher (i.e., morethreatened) Red List category compared to the previous Red List:Melanargia galathea (last observation in 2003), Heteropterus mor-pheus (1995), Boloria selene (1995) and Coenonympha tullia (1994)became Regionally Extinct, four species were already classified asEndangered in the previous Red List but were now assessed as Crit-ically Endangered: Satyrium ilicis, Melitaea cinxia, N. polychloros andPhengaris alcon and four, previously Least Concern species werenow classified as Endangered (Lasiommata megera), Vulnerable(Thymelicus lineola) or Near Threatened (Aglais urticae and Gonep-teryx rhamni). Nine species were now considered less threatenedthan in the previous Red List: the previously Regionally ExtinctErynnis tages (now Vulnerable) and Nymphalis antiopa (now Criti-cally Endangered) re-colonized Flanders in 2002, Argynnis paphia,Coenonympha pamphilus and Thecla betulae used to be Vulnerableor Near Threatened but are now considered Least Concern and fourspecies were classified in a lower Red List category but are stillconsidered threatened: Lycaena tityrus and Satyrium w-album (low-ered from Critically Endangered to Vulnerable), Cyaniris semiargus
(lowered from Endangered to Vulnerable), Issoria lathonia (loweredfrom Vulnerable to Near Threatened).
Using 5 � 5 km2 grid cells to calculate distribution areas andchanges therein would have classified ten species in a lower RedList category: N. polychloros would have been classified asEndangered instead of Critically Endangered, Hipparchia semele andPlebejus argus as Vulnerable instead of Endangered, Callophrys rubi,S. w-album, T. lineola and T. sylvestris as Near Threatened insteadof Vulnerable and Carterocephalus palaemon, G. rhamni and I. latho-nia as Least Concern instead of Near Threatened. Table 4 gives thedifference in trends when using 5 � 5 km2 instead of 1 � 1 km2
grid cells. For common species (present in > 500 1 � 1 km2 gridcells), the average difference in trend between 1 � 1 km2 grid cellsand 5 � 5 km2 grid cells was 40% (cf. Thomas and Abery, 1995). Forrare species (<500 grid cells), however, this difference is no longerconsistent and trends can even be stronger using 5 � 5 km2 gridcells than when using 1 � 1 km2 grid cells. Four species with anopposite trend between 1 � 1 km2 and 5 � 5 km2 grid cell trendcalculation are typical heathland species in Flanders with a veryclustered distribution.
In total, 84 grid cells were assessed as very high priority sites forthe conservation of butterflies, 134 as high conservation prioritysites and a further 332 as low conservation priority sites. Apartfrom some isolated sites, most of the (very) high conservation pri-ority grid cells are situated in the north eastern part of Flandersand along the coast (Fig. 2). Grid cells with a (very) high conserva-tion priority had, on average, a significantly larger area of Natu-ra2000 sites than low or very low conservation priority sites(ANOVA F = 260.83, p < 0.0001 – Fig. 3).
4. Discussion
The fine grain Red List in Flanders using the new IUCN criteriarevealed that 30% of the 68 indigenous butterfly species are Region-ally Extinct and a further 36% are either Critically Endangered,Endangered, Vulnerable or Near Threatened. The use of 5 � 5 km2
grid cells would have classified ten species in a lower Red List cat-egory. Compared with the previous Red List, 12 species are morethreatened and nine species fared better. Based on the Red List sta-tus of the species composition per 1 � 1 km2 grid cell, 218 grid
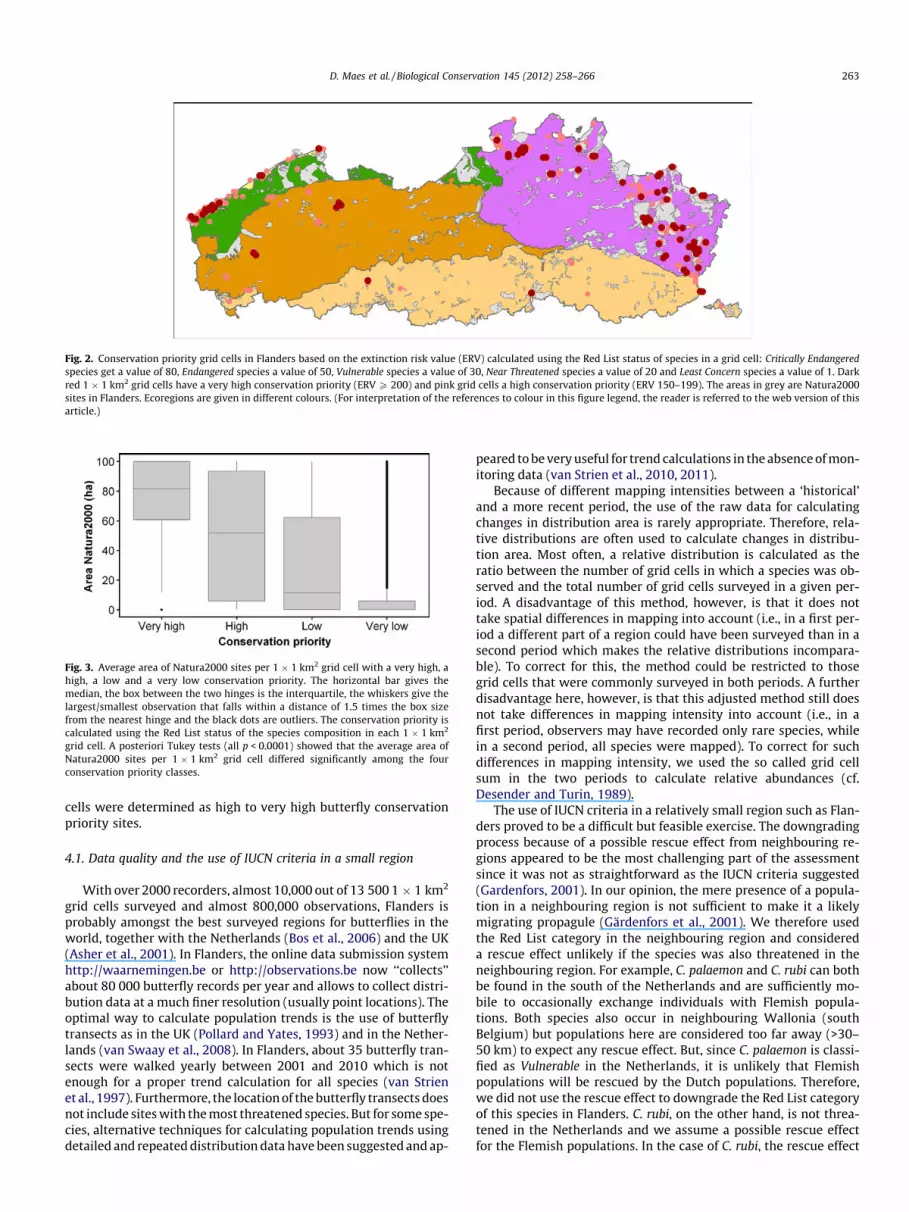
Fig. 3. Average area of Natura2000 sites per 1 � 1 km2 grid cell with a very high, ahigh, a low and a very low conservation priority. The horizontal bar gives themedian, the box between the two hinges is the interquartile, the whiskers give thelargest/smallest observation that falls within a distance of 1.5 times the box sizefrom the nearest hinge and the black dots are outliers. The conservation priority iscalculated using the Red List status of the species composition in each 1 � 1 km2
grid cell. A posteriori Tukey tests (all p < 0.0001) showed that the average area ofNatura2000 sites per 1 � 1 km2 grid cell differed significantly among the fourconservation priority classes.
Fig. 2. Conservation priority grid cells in Flanders based on the extinction risk value (ERV) calculated using the Red List status of species in a grid cell: Critically Endangeredspecies get a value of 80, Endangered species a value of 50, Vulnerable species a value of 30, Near Threatened species a value of 20 and Least Concern species a value of 1. Darkred 1 � 1 km2 grid cells have a very high conservation priority (ERV P 200) and pink grid cells a high conservation priority (ERV 150–199). The areas in grey are Natura2000sites in Flanders. Ecoregions are given in different colours. (For interpretation of the references to colour in this figure legend, the reader is referred to the web version of thisarticle.)
D. Maes et al. / Biological Conservation 145 (2012) 258–266 263
cells were determined as high to very high butterfly conservationpriority sites.
4.1. Data quality and the use of IUCN criteria in a small region
With over 2000 recorders, almost 10,000 out of 13 500 1 � 1 km2
grid cells surveyed and almost 800,000 observations, Flanders isprobably amongst the best surveyed regions for butterflies in theworld, together with the Netherlands (Bos et al., 2006) and the UK(Asher et al., 2001). In Flanders, the online data submission systemhttp://waarnemingen.be or http://observations.be now ‘‘collects’’about 80 000 butterfly records per year and allows to collect distri-bution data at a much finer resolution (usually point locations). Theoptimal way to calculate population trends is the use of butterflytransects as in the UK (Pollard and Yates, 1993) and in the Nether-lands (van Swaay et al., 2008). In Flanders, about 35 butterfly tran-sects were walked yearly between 2001 and 2010 which is notenough for a proper trend calculation for all species (van Strienet al., 1997). Furthermore, the location of the butterfly transects doesnot include sites with the most threatened species. But for some spe-cies, alternative techniques for calculating population trends usingdetailed and repeated distribution data have been suggested and ap-
peared to be very useful for trend calculations in the absence of mon-itoring data (van Strien et al., 2010, 2011).
Because of different mapping intensities between a ‘historical’and a more recent period, the use of the raw data for calculatingchanges in distribution area is rarely appropriate. Therefore, rela-tive distributions are often used to calculate changes in distribu-tion area. Most often, a relative distribution is calculated as theratio between the number of grid cells in which a species was ob-served and the total number of grid cells surveyed in a given per-iod. A disadvantage of this method, however, is that it does nottake spatial differences in mapping into account (i.e., in a first per-iod a different part of a region could have been surveyed than in asecond period which makes the relative distributions incompara-ble). To correct for this, the method could be restricted to thosegrid cells that were commonly surveyed in both periods. A furtherdisadvantage here, however, is that this adjusted method still doesnot take differences in mapping intensity into account (i.e., in afirst period, observers may have recorded only rare species, whilein a second period, all species were mapped). To correct for suchdifferences in mapping intensity, we used the so called grid cellsum in the two periods to calculate relative abundances (cf.Desender and Turin, 1989).
The use of IUCN criteria in a relatively small region such as Flan-ders proved to be a difficult but feasible exercise. The downgradingprocess because of a possible rescue effect from neighbouring re-gions appeared to be the most challenging part of the assessmentsince it was not as straightforward as the IUCN criteria suggested(Gardenfors, 2001). In our opinion, the mere presence of a popula-tion in a neighbouring region is not sufficient to make it a likelymigrating propagule (Gärdenfors et al., 2001). We therefore usedthe Red List category in the neighbouring region and considereda rescue effect unlikely if the species was also threatened in theneighbouring region. For example, C. palaemon and C. rubi can bothbe found in the south of the Netherlands and are sufficiently mo-bile to occasionally exchange individuals with Flemish popula-tions. Both species also occur in neighbouring Wallonia (southBelgium) but populations here are considered too far away (>30–50 km) to expect any rescue effect. But, since C. palaemon is classi-fied as Vulnerable in the Netherlands, it is unlikely that Flemishpopulations will be rescued by the Dutch populations. Therefore,we did not use the rescue effect to downgrade the Red List categoryof this species in Flanders. C. rubi, on the other hand, is not threa-tened in the Netherlands and we assume a possible rescue effectfor the Flemish populations. In the case of C. rubi, the rescue effect

264 D. Maes et al. / Biological Conservation 145 (2012) 258–266
was, therefore, used to downgrade the threat status by one Red Listcategory. Contrary to the IUCN criteria, we also used the possibilityof upgrading a species by one Red List category if a strong declinetook place longer than 10 years ago (Maes et al., 2011). Althoughthis ‘historical’ decline does not necessarily affect the immediateextinction risk of a species, it offers the opportunity to include for-merly typical species for a reference situation or period (Keller andBollmann, 2004; Miller et al., 2006). One of the difficulties whenapplying the IUCN criteria to butterflies is the 10-year period forwhich declines should be calculated. Since butterflies, and mostother invertebrates, have one or more generations per year andare usually more sensitive to environmental factors, their popula-tions fluctuate much more than long-lived animals (Thomas,1994) that can more easily lead to extinctions. To differentiate be-tween short term population fluctuations and genuine declines inthe distribution and numbers of butterflies and other inverte-brates, comparing the short term trend with the historical trendthat spans longer time series (e.g., 20–25 years) would be advisableto adjust the trend criterion A of the IUCN (van Swaay et al., 2011).Monitoring data in the UK and in the Netherlands clearly show rel-atively short term fluctuations in species abundance (e.g., Celastri-na argiolus). Depending of being on the increase or the decreaseside of such fluctuations, species could be classified in differentRed List categories even if the long term trend is relatively stable.On the other hand, species that showed their strongest declinelonger than 10 years ago, would not qualify for a Red List categoryif they are not sufficiently rare at present. That is why we, but alsothe UK (Fox et al., 2011), used both a recent and a ‘historical’ trendto up- or downgrade the obtained Red List category if appropriate.
Although less long then the Netherlands and the UK, Flandershas a strong tradition in mapping insects. The use of online datasubmission systems such as http://waarnemingen.be in Flanderswill surely increase both the number and the resolution of distribu-tion data. This will enable us the compilation of IUCN Red Lists forsome of the other relatively well-mapped insect groups (e.g., drag-onflies, grasshoppers, ground beetles) and use them in conservationpolicy (Cardoso et al., 2011). Although based on a relatively limitedamount of data and a smaller number of surveyed grid cells, wedemonstrated that the use of other sets of IUCN (sub)criteria thanin butterflies (e.g., using extent of occurrence (EOO) instead of areaof occupancy (AOO) as a measure of geographic range) resulted in a‘credible’ Red List of ladybirds in Flanders (Adriaens et al., in prep.).
4.2. Comparison with previous Red List
Compared with the previous list, three more species were as-sessed in the present Red List: V. atalanta, Leptidea reali and Car-charodus alceae. V. atalanta is observed overwintering yearlysince 1990 and is, therefore, now considered as a resident species.Leptidea sinapis was recently split into three cryptic species (Dincaet al., 2011) but the (historical) presence of these species in Flan-ders is unclear. Since L. reali occurred in the calcareous regions inthe south of the Netherlands until 1958 (Bos et al., 2006), it is likelythat L. reali was also present in the neighbouring calcareous regionin Flanders. C. alceae colonized Flanders in 2009 (from neighbour-ing sites in Wallonia – Fichefet et al., 2008) and now has about 25well established populations.
The present Red List revealed that the decline of some, both spe-cialist and formerly common, species has not been stopped in Flan-ders. General reasons for their continuing decline are: (i) theeutrophication and high atmospheric deposition mostly from inten-sive agriculture leading to a lower habitat quality (loss of foodplants, colder microclimate – WallisDeVries and van Swaay, 2006),(ii) the strong decline of nectar sources (WallisDeVries et al., 2010)and (iii) a lowered exchange of individuals among populations in
an increasingly fragmented Flemish landscape (Van Dyck et al.,2009).
Out of the nine species that became less threatened, five ofthem are fairly mobile and probably benefited from a relativelywarm period during the last 10 years (Klok and Tank, 2009) to col-onize suitable sites. For four less mobile species (E. tages, L. tityrus,S. w-album and T. betulae) local species action plans and a more di-rected search method resulted in a lower Red List status. Especiallyfor T. betulae and S. w-album, the previous extinction risk and con-sequent Red List status might have been overestimated becausethe adult butterflies are difficult to observe. Using specific observa-tion methods (i.e., searching for overwintering eggs on BlackthornPrunus spinosa for T. betulae and inspecting tops of Elm trees Ulmussp. with binoculars for S. w-album), we now have a much betteridea of the distribution area of both species. This enabled us to as-sign them to a more appropriate category in the present Red List.
4.3. Spatial resolution
Using 5 � 5 km2 instead of 1 � 1 km2 grid cells would have re-sulted in 42 instead of 45 Red List species. The use of coarse reso-lution grid cells is unable to detect declines or losses of 1 � 1 km2
grid cells within a 5 � 5 km2 grid cell (Cowley et al., 1999; Thomasand Abery, 1995). Additionally, the use of coarse grid cells is be-lieved to strongly overestimate the area of occupancy of species(van Swaay et al., 2011). Here, we showed that this is the casefor common and widespread species (Table 4), but that this isnot necessarily true for rare species with a clustered distributionpattern. It is, therefore, not appropriate to suppose that trendsare equally overestimated by a same percentage (35% as suggestedby Thomas and Abery, 1995) for all species when relatively coarsegrained grid cells are used. Whenever possible, we therefore rec-ommend the use of the smallest available scale to calculate distri-bution areas and trends (e.g., 1 � 1 km2 or smaller).
4.4. Butterfly and biodiversity conservation and policy
Red Lists are widely recognized as important tools for conserva-tion as they help to prioritize species conservation (Miller et al.,2006). In this vein, the new Red List of butterflies will be an impor-tant tool for future conservation policy at the regional Flemish le-vel. As butterflies are increasingly used to inform conservationpolicy in different European countries, this new information willalso serve to explore wider patterns of changes in the butterfly fau-na within Europe (van Swaay et al., 2011). Databases used for suchanalyses are good examples of the significance of citizen-scienceprojects within the context of conservation (Schmeller et al.,2009; Snäll et al., 2011).
However, the translation of different Red List categories intospecies action plans may also require other sources of importantinformation. Although the factors causing general declines in but-terflies are fairly well known (see above), the understanding of themechanisms behind these patterns requires detailed and addi-tional research. Policy makers tend to give a higher priority tothe most endangered species but there is controversy about givingpriority to cost-effective actions or focusing on the most endan-gered species (Wilson et al., 2011). It may indeed be more success-ful and cost-effective if we start conservation programs long beforeorganisms (and their biotopes) fall within the most threatened RedList categories. The observation that several widespread speciesdeclined significantly during the last decennium in Flanders andin the Netherlands (Van Dyck et al., 2009) requires a different ap-proach for conservation planning than classical species actionplans (e.g., a relatively widespread but strongly declining speciessuch as G. rhamni vs. a localised habitat specialist such as Phengarisalcon – Maes et al., 2004). This information should be integrated in

D. Maes et al. / Biological Conservation 145 (2012) 258–266 265
several more holistic biodiversity programs to restore differentecological resources at different scales (habitat, biotope and land-scape) both within nature reserves but also across the wider land-scape (functional connectivity) outside nature reserves. Althoughsuch programs do not necessarily aim to restore the conditionsof single species, the information on the resource-based habitatprofiles of individual species may help to develop such approaches(Dennis et al., 2006).
The grid cells with the highest conservation priority sites for but-terflies show a very clustered pattern with concentrations in thecoastal dune ecoregion in the west and the Campine ecoregion inthe northeast of Flanders (Fig. 2). Both ecoregions still have rem-nants of semi-natural sites with dry and wet heathlands (with typi-cal and threatened species such as Hesperia comma, H. semele,Phengaris alcon (Maes et al., 2004), P. argus and S. ilicis) and nutri-ent-poor grasslands (with the threatened species M. cinxia andI. lathonia). The few grid cells with a high conservation priority out-side the coastal dune and the Campine ecoregion have relativelylarge areas of deciduous forests with typical and threatened speciessuch as Apatura iris, A. paphia, Limenitis camilla and N. antiopa. Addi-tionally, grid cells with the highest conservation priority for butter-flies in Flanders had a significantly higher area of Natura2000 sites(Fig. 3). Since there are currently no butterflies present in Flandersthat are listed in the annexes of the Habitat Directive, the Natu-ra2000 sites in Flanders were designated for the presence of biotopetypes of Annex I of the Habitat Directive or other listed organismssuch as amphibians, the Stag beetle (Thomaes et al., 2008) and birdsof the Bird Directive. Despite their designation for threatened bio-topes and other organisms of European interest, the Natura2000 leg-islation should also be significant for the conservation of butterfliesin Flanders (cf. Klorvuttimontara et al., 2011; Maes et al., 2005; Tus-habe et al., 2006). Our analyses indeed suggest a large potential ofthe Natura2000 sites, but integrating specific needs of differentregionally threatened butterfly species into the management planswould require further consideration (Louette et al., 2011).
For Flanders, we are only at the very beginning of developingsound biodiversity policies outside nature reserves, but the successwill strongly impact on the extent to which European and interna-tional biodiversity targets will be met by 2020. Only a generalimprovement of landscape quality in both anthropogenic (includ-ing agricultural land) and semi-natural landscapes can help to sus-tainably recover butterfly diversity in a strongly degradedenvironment. To do so, specific programs need to be developedto restore essential ecological resources (consumables and condi-tions) across the landscape matrix (Shreeve and Dennis, 2011).Additionally, the more traditional approach of specific species ac-tion programs in nature reserves and other protected areas needfurther intensification. This can be illustrated by the ongoing de-cline of habitat specialist species such as H. semele in many NWEuropean countries (van Strien et al., 2011).
Although Flanders was already one of the worst case scenariosfor butterfly diversity loss in Europe (Maes and Van Dyck, 2001),we observed that some species (among which formerly commonones) have declined even further. Only a couple of (very) mobilespecies expanded their range and are now faring better. To haltthe further loss of biodiversity in Flanders, we argue that the inclu-sion of butterflies into a more general biodiversity conservation ac-tion plan, would add complementary information to the oftenbiotope focused policy and management, a strategy that also holdsfor many other regions or countries elsewhere in Europe (Maes andVan Dyck, 2005).
Acknowledgments
First of all, we would like to thank the many volunteers whocollected the large number of data for this analysis. We also thank
Chris van Swaay (Dutch Butterfly Conservation) and Maurice Hoff-mann (INBO) for commenting on an earlier version of this manu-script. Thierry Onkelinx was very helpful with statistics. Thisresearch was partly funded by the Conservation Agency of theFlemish Regional Government (Agentschap voor Natuur en Bos).Three reviewers gave very useful comments on a previous versionof the manuscript.
Appendix A. Supplementary material
Supplementary data associated with this article can be found, inthe online version, at doi:10.1016/j.biocon.2011.11.021.
References
Asher, J., Warren, M., Fox, R., Harding, P., Jeffcoate, G., Jeffcoate, S., 2001. TheMillennium Atlas of Butterflies in Britain and Ireland. Oxford University Press,Oxford.
Bartels, A., Vanreusel, W., 2011. Resultaten Tuinvlindertelling 2007–2010.Bos, F., Bosveld, M., Groenendijk, D., van Swaay, C.A.M., Wynhoff, I., De
Vlinderstichting, 2006. De dagvlinders van Nederland. Verspreiding enbescherming (Lepidoptera: Hesperioidea, Papilionoidea). NationaalNatuurhistorisch Museum Naturalis; KNNV Uitgeverij; European InvertebrateSurvey, Leiden.
Botham, M.S., Brereton, T.M., Middlebrook, I., Cruickshanks, K.L., Zannese, A., Roy,D.B., 2009. United Kingdom Butterfly Monitoring Scheme Report for 2009.Centre for Ecology & Hydrology, Wallinford.
Brereton, T., Roy, D.B., Middlebrook, I., Botham, M., Warren, M., 2011. Thedevelopment of butterfly indicators in the United Kingdom and assessmentsin 2010. J. Insect Conserv. 15, 139–151.
Cardoso, P., Borges, P.A.V., Triantis, K.A., Ferrández, M.A., Martín, J.L., 2011. Adaptingthe IUCN Red List criteria for invertebrates. Biol. Conserv. 144, 2432–2440.
Cowley, M.J.R., Thomas, C.D., Thomas, J.A., Warren, M.S., 1999. Flight areas of Britishbutterflies: assessing species status and decline. P. Roy. Soc. B-Biol. Sci. 266,1587–1592.
Dennis, R.L.H., Shreeve, T.G., Van Dyck, H., 2006. Habitats and resources: the needfor a resource-based definition to conserve butterflies. Biodivers. Conserv. 16,1943–1966.
Desender, K., Turin, H., 1989. Loss of habitats and changes in the composition of theGround and Tiger beetle fauna in four West European Countries since 1950(Coleoptera: Carabidae, Cicindelidae). Biol. Conserv. 48, 277–294.
Dinca, V., Lukhtanov, V.A., Talavera, G., Vila, R., 2011. Unexpected layers of crypticdiversity in wood white Leptidea butterflies. Nat. Commun. 2, 324.
Fichefet, V., Barbier, Y., Baugnée, J.-Y., Dufrêne, M., Goffart, P., Maes, D., Van Dyck, H.,2008. Papillons de jour de Wallonie (1985–2007). Groupe de TravailLépidoptères Lycaena, Département de l’Etude du Milieu Naturel et Agricole(SPW/DGARNE), Gembloux.
Fitzpatrick, U., Murray, T.E., Paxton, R.J., Brown, M.J.F., 2007. Building on IUCNregional red lists to produce lists of species of conservation priority: a modelwith Irish bees. Conserv. Biol. 21, 1324–1332.
Fleishman, E., Murphy, D.D., 2009. A realistic assessment of the indicator potentialof butterflies and other charismatic taxonomic groups. Conserv. Biol. 23, 1109–1116.
Fox, R., Warren, M.S., Brereton, T.M., Roy, D.B., Robinson, A., 2011. A new Red List ofBritish butterflies. Insect Conserv. Diver. 4, 159–172.
Gardenfors, U., 2001. Classifying threatened species at national versus global levels.Trends Ecol. Evol. 16, 511–516.
Gärdenfors, U., Hilton-Taylor, C., Mace, G.M., Rodríguez, J.P., 2001. The application ofIUCN Red List criteria at regional levels. Conserv. Biol. 15, 1206–1212.
Hallingbäck, T., Hodgetts, N.G., Urmi, E., 1995. How to apply the new IUCN Red Listcategories to Bryophytes. Species 24, 37–41.
IUCN, 2001. IUCN Red List Categories and Criteria: Version 3.1. IUCN SpeciesSurvival Commission, Gland, Switzerland/Cambridge, UK.
IUCN, 2003. Guidelines for Application of IUCN Red List Criteria at Regional Levels:Version 3.0. IUCN Species Survival Commission, IUCN, Gland, Switzerland andCambridge, UK.
Keller, V., Bollmann, K., 2004. From red lists to species of conservation concern.Conserv. Biol. 18, 1636–1644.
Klok, E.J., Tank, A.M.G.K., 2009. Updated and extended European dataset of dailyclimate observations. Int. J. Climatol. 29, 1182–1191.
Klorvuttimontara, S., McClean, C.J., HILL, J.K., 2011. Evaluating the effectiveness ofProtected Areas for conserving tropical forest butterflies of Thailand. Biol.Conserv. 144, 2534–2540.
Kudrna, O., 2002. The distribution atlas of European butterflies. Oedippus 20, 1–342.Louette, G., Adriaens, D., Adriaens, P., Anselin, A., Devos, K., Sannen, K., Van Landuyt,
W., Paelinckx, D., Hoffmann, M., 2011. Bridging the gap between the Natura2000 regional conservation status and local conservation objectives. J. Nat.Conserv. 19, 224–235.
Mace, G.M., Collar, N.J., 1995. Extinction risk assessment for birds throughquantitative criteria. IBIS 137, 240–246.

266 D. Maes et al. / Biological Conservation 145 (2012) 258–266
Mace, G.M., Lande, R., 1991. Assessing extinction threats: toward a re-evaluation ofIUCN threatened species categories. Conserv. Biol. 5, 148–157.
Mace, G.M., Collar, N.J., Gaston, K.J., Hilton-Taylor, C., Akcakaya, H.R., Leader-Williams, N., Milner-Gulland, E.J., Stuart, S.N., 2008. Quantification of extinctionrisk: IUCN’s system for classifying threatened species. Conserv. Biol. 22, 1424–1442.
Maes, D., Van Dyck, H., 1999. Dagvlinders in Vlaanderen – Ecologie, verspreiding enbehoud. Stichting Leefmilieu i.s.m. Instituut voor Natuurbehoud en VlaamseVlinderwerkgroep, Antwerpen/Brussel.
Maes, D., Van Dyck, H., 2001. Butterfly diversity loss in Flanders (north Belgium):Europe’s worst case scenario? Biol. Conserv. 99, 263–276.
Maes, D., Van Dyck, H., 2005. Habitat quality and biodiversity indicatorperformances of a threatened butterfly versus a multispecies group for wetheathlands in Belgium. Biol. Conserv. 123, 177–187.
Maes, D., Vanreusel, W., Talloen, W., Van Dyck, H., 2004. Functional conservationunits for the endangered Alcon Blue butterfly Maculinea alcon in Belgium(Lepidoptera, Lycaenidae). Biol. Conserv. 120, 229–241.
Maes, D., Bauwens, D., De Bruyn, L., Anselin, A., Vermeersch, G., Van Landuyt, W., DeKnijf, G., Gilbert, M., 2005. Species richness coincidence. Conservation strategiesbased on predictive modelling. Biodivers. Conserv. 14, 1345–1364.
Maes, D., Decleer, K., De Bruyn, L., Hoffmann, M., 2011. Nieuwe Rode-Lijstcategorieën en -criteria voor Vlaanderen. Een aanpassing aan deinternationale IUCN standaarden. Natuur. focus 10, 54–61.
Miller, R.M., Rodriguez, J.P., Aniskowicz-Fowler, T., Bambaradeniya, C., Boles, R.,Eaton, M.A., Gärdenfors, U., Keller, V., Molur, S., Walker, S., Pollock, C., 2006.Extinction risk and conservation priorities. Science 313, 441.
Peymen, J., Monden, S., Honnay, O., Jacquemyn, H., Piessens, K., 2005. Versnippering.In: Instituut voor Natuurbehoud (Ed.), Natuurrapport 2005. Toestand van denatuur in Vlaanderen. Cijfers voor het beleid Instituut voor Natuurbehoud,Brussels, pp. 232–245.
Pollard, E., Yates, T.J., 1993. Monitoring Butterflies for Ecology and Conservation.The British Butterfly Monitoring Scheme. Chapman & Hall, London.
Regnier, C., Fontaine, B., Bouchet, P., 2009. Not knowing, not recording, not listing:numerous unnoticed mollusk extinctions. Conserv. Biol. 23, 1214–1221.
Schmeller, D.S., Henry, P.-Y., Julliard, R., Gruber, B., Clobert, J., Dziock, F., Lengyel, S.,Nowicki, P., Déri, E., Budrys, E., Kull, T., Tali, K., Bauch, B., Settele, J., van Swaay,C.A.M., Kobler, A., Babij, V., Papastergiadou, E., Henle, K., 2009. Advantages ofvolunteer-based biodiversity monitoring in Europe. Conserv. Biol. 23, 307–316.
Schneiders, A., Hens, M., Van Landuyt, W., Overloop, S., Ronse, A., Herremans, M.,Van den Broeck, D., 2007. Vermesting. In: Dumortier, M., De Bruyn, L., Hens, M.,Peymen, J., Schneiders, A., Van Daele, T., Van Reeth, W. (Eds.), Natuurrapport2007. Toestand van de natuur in Vlaanderen; cijfers voor het beleid Instituutvoor Natuur-en BosOnderzoek (INBO), Brussels, pp. 75–95.
Settele, J., Kudrna, O., Harpke, A., Kühn, I., van Swaay, C.A.M., Verovnik, R., Warren,M., Wiemers, M., Hanspach, J., Hickler, T., Kühn, E., van Halder, I., Veling, K.,Vliegenthart, A., Wynhoff, I., Schweiger, O., 2008. Climatic risk atlas of Europeanbutterflies. BioRisk 1, 1–710.
Shreeve, T.G., Dennis, R.L.H., 2011. Landscape scale conservation: resources,behaviour, the matrix and opportunities. J. Insect Conserv. 15, 179–188.
Snäll, T., Kindvall, O., Nilsson, J., Pärt, T., 2011. Evaluating citizen-based presencedata for bird monitoring. Biol. Conserv. 144, 804–810.
Spangenberg, J.H., Bondeau, A., Carter, T.R., Fronzek, S., Jaeger, J., Jylhä, K., Kühn, I.,Omann, I., Paul, A., Reginster, I., Rounsevell, M., Schweiger, O., Stocker, A., Sykes,M.T., Settele, J., 2012. Scenarios for investigating risks to biodiversity. GlobalEcol. Biogeogr. 21, 5–18.
IUCN Standards and Petitions Working Group, 2010. Guidelines for Using the IUCNRed List Categories and Criteria. Version 8.1. Prepared by the Standards andPetitions Subcommittee in March 2010. IUCN, Gland, Switzerland andCambridge, UK.
Thomaes, A., Kervyn, T., Maes, D., 2008. Applying species distribution modelling forthe conservation of the threatened saproxylic Stag Beetle (Lucanus cervus). Biol.Conserv. 141, 1400–1410.
Thomas, J.A., 1994. Why small cold-blooded insects pose different conservationproblems to birds in modern landscapes. IBIS 137, 112–119.
Thomas, C.D., Abery, J.C.G., 1995. Estimating rates of butterfly decline fromdistribution maps: the effect of scale. Biol. Conserv. 73, 59–65.
Tushabe, H., Kalema, J., Byaruhanga, A., Asasira, J., Ssegawa, P., Balmford, A.,Davenport, T., Fjeldsa, J., Friis, I., Pain, D., Pomeroy, D., Williams, P., Williams, C.,2006. A nationwide assessment of the biodiversity value of Uganda’s importantbird areas network. Conserv. Biol. 20, 85–99.
Van Dyck, H., van Strien, A.J., Maes, D., van Swaay, C.A.M., 2009. Declines incommon, widespread butterflies in a landscape under intense human use.Conserv. Biol. 23, 957–965.
Van Landuyt, W., 2002. Zeldzaamheid en bedreigingstoestand van een reeksecotopen in Vlaanderen: Rekenen met floragegevens. Natuur. Focus 1, 56–60.
van Strien, A.J., van de Pavert, R., Moss, D., Yates, T.J., van Swaay, C.A.M., Vos, P.,1997. The statistical power of two butterfly monitoring schemes to detecttrends. J. Appl. Ecol. 34, 817–828.
van Strien, A.J., Termaat, T., Groenendijk, D., Mensing, V., Kéry, M., 2010. Site-occupancy models may offer new opportunities for dragonfly monitoring basedon daily species lists. Basic Appl. Ecol. 11, 495–503.
van Strien, A.J., van Swaay, C.A.M., Kéry, M., 2011. Metapopulation dynamics in thebutterfly Hipparchia semele changed decades before occupancy declined in theNetherlands. Ecol. Appl. 21, 2510–2520.
van Swaay, C.A.M., Maes, D., Plate, C., 1997. Monitoring butterflies in TheNetherlands and Flanders: the first results. J. Insect Conserv. 1, 81–88.
van Swaay, C.A.M., Nowicki, P., Settele, J., van Strien, A.J., 2008. Butterfly monitoringin Europe: methods, applications and perspectives. Biodivers. Conserv. 17,3455–3469.
van Swaay, C.A.M., Maes, D., Collins, S., Munguira, M.L., Šašic, M., Settele, J.,Verovnik, R., Warren, M.S., Wiemers, M., Wynhoff, I., Cuttelod, A., 2011.Applying IUCN criteria to invertebrates: how red is the Red List of Europeanbutterflies? Biol. Conserv. 144, 470–478.
WallisDeVries, M.F., van Swaay, C.A.M., 2006. Global warming and excess nitrogenmay induce butterfly decline by microclimatic cooling. Glob. Change Biol. 12,1620–1626.
WallisDeVries, M.F., van Swaay, C.A.M., Plate, C.L., 2010. Verbanden tussen deachteruitgang van dagvlinders en bloemenrijkdom. De Levende Natuur 111,125–129.
Wilson, H.B., Joseph, L.N., Moore, A.L., Possingham, H.P., 2011. When should we savethe most endangered species? Ecol. Lett. 14, 886–890.