Southern - IUCN Portal
63
Southern 137 AFRICAN ELEPHANT STATUS REPORT 2016 SOUTHERN AFRICA
-
Upload
khangminh22 -
Category
Documents
-
view
2 -
download
0
Transcript of Southern - IUCN Portal

137
Southern13
7
A F R I C A N E L E P H A N T S T A T U S R E P O R T 2 0 1 6 S O U T H E R N A F R I C A

138
C U R R E N T I S S U E S
Southern Africa
S O U T H E R N A F R I C A
SO
UT
HE
RN
AF
RIC
A
R E G I O N
E S T I M A T E D T O T A L E L E P H A N T S G E N E R A L S T A T I S T I C S
G U E S S E S
293,447 ± 16,682
15,157 - 16,672
Southern Africa continues to hold by far the largest number of elephants on the continent, and nearly 75% of southern Africa’s elephants occur as part of a single population in the Kavango Zambezi Transfrontier Conservation Area (KAZA TFCA), some 520,000 km² in extent. Whereas conservation challenges associated with high elephant densities in large protected areas were common in the region a decade ago, contemporary elephant conservation in southern Africa is now also faced with the emergence of a growing poaching threat (UNEP et al., 2013). While over-all, poaching has not had the same impact in Southern Africa as in other regions, it has severely affected populations in Zimbabwe, Angola, Mozambique, and to a lesser extent, Zambia.
As human population growth has often not been matched by regional economic growth, many un-employed people either remain at or have returned to their rural homes from urban areas (Taylor, 2009). These communally owned unprotected areas have previously provided up to 60% or more of elephant range (Blanc et al., 2007; Cumming & Jones, 2005). However, habitat encroachment and transformation, together with ivory poaching, growing human-wildlife conflict and unsustain-able bushmeat harvesting increasingly threaten the survival of elephant populations in these areas (Ripple et al., 2015). Poor governance could become potentially threatening for the long-term sur-vival of elephants in southern Africa (CITES Secretariat, 2014).
Under the Convention on International Trade in Endangered Species of Fauna and Flora (CITES), there are ten sites in Southern Africa for Monitoring the Illegal Killing of Elephants (MIKE). El-ephant carcass data from these sites can be used to calculate the Proportion of Illegally Killed Elephants (PIKE). For Southern Africa between 2007 and 2015 the PIKE values show an increasing
Region Area
Range Area
Protected Range
Information Quality Index (IQI)
5,973,020 km2
1,325,998 km2 (22%)
23 %
0.50
A F R I C A N E L E P H A N T S T A T U S R E P O R T 2 0 1 6

139
trend, with a spike of 0.5 in 2011. PIKE levels above 0.5 (i.e. where half of dead elephants found are deemed to have been illegally killed) are considered to be unsustainable and Southern Africa is the only region whose overall PIKE values have not risen above 0.5 since 2003 (Figure 1) (CITES Secretariat, 2016).
In response to the challenge of increased poaching of elephants, rhinos and other wildlife, in 2015 the Southern African Development Community (SADC) ministers responsible for environment and natural resources approved the SADC Law Enforcement and Anti-Poaching Strategy 2016-2021 (SADC, 2015). The 2005 Southern Africa Regional Elephant Conservation and Management Strat-egy (SADC, 2007) is in need of revision.
In recent analyses of seizure data from the Elephant Trade Information System (ETIS), prepared for CITES, a number of countries in Southern Africa have been identified as having a worrying involvement in illegal ivory trade (CITES, 2012; Milliken et al., 2013, 2016). Angola and Mozambique have been requested to prepare and implement National Ivory Action Plans.
Whereas all populations of the African elephant have been listed in CITES Appendix I since 1989, those of Botswana, Namibia and Zimbabwe were transferred to Appendix II in 1997 and South Africa’s was transferred in 2000. In 2008, these four elephant range states conducted a one-off legal sale of 101,766 kg of raw ivory to approved trading partners in China and Japan (CITES, 2009; Wijnstekers, 2011) (Table 1) .
S O U T H E R N A F R I C A
C U R R E N T I S S U E S
C O N T .
SO
UT
HE
RN
AF
RIC
A
Botswana
Namibia
South Africa
Zimbabwe
Japan
China
43,153
7,503
47,346
3,764
39,434
62,333
$7,093,551
$1,147,369
$6,702,695
$487,162
$6,545,374
$8,990,622
Weight (kg) Price USD
Buye
rsSe
llers
0.8
0.6
0.4
0.2
0.0'03 '04 '06 '08 '10 '12 '14'05 '07 '09 '11 '13 '15
1.0
F I G U R E 1 : Southern African PIKE trends with 95% confidence intervals (CITES Secretariart, 2016)
T A B L E 1 : Ivory sales in 2008 (Wijnstekers, 2011)
A F R I C A N E L E P H A N T S T A T U S R E P O R T 2 0 1 6

140
S O U T H E R N A F R I C A
SO
UT
HE
RN
AF
RIC
A
The estimated number of elephants in areas surveyed in the last ten years in Southern Africa is 293,447 ± 16,682 at the time of the last survey for each area. There may be an additional 15,157 to 16,672 elephants in areas not systematically surveyed. These guesses likely represent a mini-mum number, and actual numbers could be higher than those reported. Together, this estimate and guess apply to 734,824 km², which is 55% of the estimated known and possible elephant range. There remains an additional 45% of range for which no elephant population estimates are available.
Between the AESR 2007 and this report, elephant numbers in Southern Africa have declined by almost 30,000, on the basis of updated estimates for sites where comparable survey techniques were employed. However, some populations have been surveyed for the first time and this has led to an increase of approximately 3,000 in the ‘new population’ category. The result is that the current total number of elephants from surveyed populations represents a smaller estimated re-duction of about 27,000 elephants. Although there have been real declines in Mozambique and Zimbabwe, the main contributor to this decline is a reduction in the estimate for Botswana, which may be the result of uncounted elephants, range expansion, increased poaching or methodologi-cal differences between surveys.
Southern Africa has a relatively high reliability and quantity of elephant information, especially for the larger populations. Although overall survey coverage has increased since 2007, largely as a result of the Great Elephant Census carried out in 2014-2015, there is still wide variation amongst countries.
One population was recorded as having been lost from Angola.
The proportion of elephant range for which elephant estimates are available currently stands at 55%, an increase from 53% in the previous report. The overall quality of information, as measured by the IQI, has increased from 0.48 to 0.50.
There is reliable information available for Botswana, Namibia, Swaziland, South Africa, Zambia and Zimbabwe. In Angola, only the south east region of the country has been surveyed, and one pop-ulation in the Bongola area on the Angola-Namibia international border has been reported as lost (Vaz Pinto & Verissimo, pers. comm., 2014). Detailed nationwide surveys of elephant abundance and distribution are urgently needed in Angola. Surveys in Mozambique, although improved, have been spatially and temporarily variable and have used different techniques, apart from in the Nias-sa ecosystem in the north. Malawi with its high human population and small fragmented elephant population has relied mostly on total counts or informed guesses.
Southeast Angolan and southwest Zambian elephant populations continue to experience losses to poaching (Chase & Schlossberg, 2016; DNPW, 2016). Population trends from repeat surveys in northern Botswana remain equivocal. Mozambique’s elephant population has been reduced by an estimated 25%, mostly in the north due to severe poaching.
In Namibia the elephant population has increased, notably in the north-east Kavango and Zam-bezi Regions. South Africa’s elephant population, mostly contained within Kruger National Park, is
N U M B E R S A N D D I S T R I B U T I O N
A F R I C A N E L E P H A N T S T A T U S R E P O R T 2 0 1 6

141
S O U T H E R N A F R I C A
N U M B E R S A N D D I S T R I B U T I O N
C O N T .
SO
UT
HE
RN
AF
RIC
A
increasing, with small but growing numbers of elephants in other provincial and private reserves. Zambia’s elephant population appears to be relatively stable apart from losses in the south-west of the country which amount to approximately 2% of the overall population. Zimbabwe’s elephant population has declined due to reductions in two populations, partially compensated by increases in two other populations.
The current range area for Southern Africa is 1,325,998 km², a slight increase from the 1,305,000 km² recorded in the AESR 2007, and the percentage of this which is known range has increased from 53% to 60%. There has been no major loss of elephant range, and one notable expansion of range in Botswana where elephants were observed in large groups for the first time in the Central Kalahari Game Reserve (DWNP, 2016). Other changes result from improved information, particu-larly in Angola.
A F R I C A N E L E P H A N T S T A T U S R E P O R T 2 0 1 6

142
S O U T H E R N A F R I C A
SO
UT
HE
RN
AF
RIC
A
S U M M A R Y T O TA L S
I N T E R P R E TAT I O N O F C H A N G E S I N E S T I M AT E S F R O M P R E V I O U S R E P O R T
A R E A O F R A N G E C O V E R E D B Y E A C H DATA C AT E G O R Y
S U R V E Y C A T E G O R Y E S T I M A T E S F R O M S U R V E Y S
E S T I M A T E F R O M± 9 5 % C L T O P E R C E N T ( % ) A R E A ( km² )
G U E S S E S K N O W N A N D P O S S I B L E R A N G E
Aerial Total Counts
Ground Total Counts
Individual Registrations
Aerial Sample Counts
Informed Guesses
Other Guesses
Degraded Data
Totals 2015
Totals 2006
Assessed Range
Unassessed Range
Total Range
21,937
133
39
270,769
569
—
—
293,447
320,690
—
—
—
16,683
—
—
—
16,682
23,132
—
—
—
—
9,514
5,371
272
15,157
11,197
—
—
—
—
9,824
6,576
272
16,672
13,253
2 %
0 %
0 %
36 %
5 %
12 %
0 %
55 %
45 %
100 %
29,142
136
22
471,590
73,310
158,161
2,462
734,824
591,174
1,325,998
R E A S O N F O R C H A N G E E S T I M A T E S F R O M S U R V E Y S
E S T I M A T E F R O M± 9 5 % C L T O P E R C E N T ( % ) A R E A ( km² )
G U E S S E S K N O W N A N D P O S S I B L E R A N G E
Repeat Survey
New Population
Different Technique
Different Area
New Guess
Population Lost
Data Degraded
Totals
-29,913
+2,978
+3,292
+1,004
-4,551
0
-53
-27,243
±28,372
±1,398
±1,194
±2,255
±92
0
0
±28,520
-56
+787
-6,847
-3
+10,094
-60
+53
+3,968
-56
+802
-8,557
+36
+11,209
-60
+53
+3,427
28 %
5 %
4 %
4 %
14 %
0 %
0 %
55 %
377,379
66,100
49,760
50,641
188,481
0
0
734,824
D A T A C A T E G O R Y K N O W N R A N G E ( km²) P O S S I B L E R A N G E ( km²) T O T A L R A N G E ( km²)
Aerial or Ground Total Counts
Direct Sample Reliable Dung
Informed Guesses
Other Guesses
Unassessed Range
Totals
26,963
410,768
61,375
130,779
166,452
796,337
2,338
60,822
11,935
29,844
424,722
529,661
29,301
471,590
73,310
160,623
591,174
1,325,998
A F R I C A N E L E P H A N T S T A T U S R E P O R T 2 0 1 6

143
S O U T H E R N A F R I C A
* R A N G E O F I N F O R M E D G U E S S
SO
UT
HE
RN
AF
RIC
A
E L E P H A N T E S T I M AT E S
3,396
131,626
1,307
10,884
22,754
18,841
42
21,967
82,630
293,447
1,562
12,508
0
2,229
4,306
0
0
4,704
8,589
16,683
96
0
398
4,299
90
8,425
0
214
1,635
15,157
111
0
398
5,519
90
8,435
0
314
1,805
16,672
323,270
228,073
7,789
320,402
164,069
30,651
50
170,466
81,228
1,325,998
24 %
17 %
1 %
24 %
12 %
2 %
0 %
13 %
6 %
100 %
13 %
56 %
72 %
82 %
51 %
92 %
100 %
62 %
97 %
55 %
1
1
3
1
1
2
5
1
2
1
.09
.52
.55
.48
.43
.64
.00
.50
.86
.50
Angola
Botswana
Malawi
Mozambique
Namibia
South Africa
Swaziland
Zambia
Zimbabwe
Totals
# O F E L E P H A N T S G U E S S E S R A N G E P F S I Q I
E S T I M A T E ± 9 5 % C L M I N M A X A R E A ( km²) % R E G I O N A L % A S S E S S E D
C O U N T R Y
A F R I C A N E L E P H A N T S T A T U S R E P O R T 2 0 1 6
DA: Different Area; DD: Data Degraded; DT: Different Technique; NA: New Analysis;
NG: New Guess; NP: New population; PL: Population Lost; RS: Repeat Survey (RS
denotes a repeat survey that is not statistically comparable for reasons such as
different season);
― : No Change
AS: Aerial Sample Count; AT: Aerial Total Count; DC: Dung Count; GD: Genetic
Dung Count; GS: Ground Sample Count; GT: Ground Total Count; IG: Informed
Guess; IR: Individual Registration; OG: Other Guess. Survey Reliability is keyed A-E
(best to worst).
Priority for Future Surveys (PFS) is ranked from 1 to 5 (highest to lowest). Based
on the precision of estimates and the proportion of national range accounted
for by the site in question, PFS is a measure of the importance and urgency for
future population surveys. All areas of unassessed range have a priority of 1. See
Introduction for details on how the PFS is derived.
1 K E Y T O R E A S O N S F O R C H A N G E
2 K E Y T O S U R V E Y R E P O R T
3 P F S

LUAN DA
K I NSHA S A
BR A Z Z AV I LLE
LUS AKA
HAR AR E
LI LONGWE
NAI ROBI
DAR E S S AL A AM
G ABORON E
WI N DHOEK
PR E TOR IA( T SHWAN E )
M B AB AN E MAPU TO
DEMOCR ATIC R EPU BLICOF CONG O
CONG OG ABON
ANG OL A
Z AM BIA
MAL AWI
MOZ AM BIQ U E
TANZ AN IA
K ENYA
UG AN DA
R WAN DA
BU RU N DI
Z I M B ABWE
NAM I BIA BOT SWANA
SO U TH AF R ICA
LE SOTHO
SWA Z I L AN D
0 200 400 600 800 1000 1200 km
30°S 30°S
20°S 20°S
10°S 10°S
0° 0°
20°E
20°E
30°E
30°E
40°E
40°E
A F R I C A N E L E P H A N T S T A T U S R E P O R T 2 0 1 6 S O U T H E R N A F R I C A
Southern Africa
Int'l Boundaries
Rivers & Lakes
Towns
Protected Areas
Input Zones
Known
Possible
Doubtful
Sighting
E L E P H A N T R A N G E0 2 0 0 4 0 0 6 0 0 8 0 0 1 0 0 0 1 2 0 0 k m
See Appendix III for map abbreviations and acronyms.
© 2016 African Elephant Specialist Group
A B B R E V I AT I O N S A N D A C R O N Y M S
00
014
4

145
Although elephant conservation and monitoring started in Angola after the end of the civil war in 2002, it has concentrated largely in the south-east of the country. A detailed nationwide study of elephant distribution and density is urgently required. Threats include poaching, illegal wildlife trade, human population expansion and settlement together with subsistence agriculture, fire and logging activities. There are weak incentives for elephant conservation and law enforcement is poor due to limited staff and capacity.
Wildlife legislation in Angola is limited largely due to the challenges of rebuilding administrative and governmental infrastructure after decades of conflict. Angola published an elephant conserva-tion plan in 1991, although this is now seriously out of date (Instituto de Desenvolvimento Florestal, 1991). The development of a new plan was underway as of June 2016.
A study in Luanda in 2006 (Milliken et al., 2006) exposed a large and unregulated domestic ivory market in Luanda and eight years later this market was still flourishing with over 10,000 recently carved and illegal ivory items reported (Svensson et al., 2014; Vigne & Martin, 2014). It is believed that the majority of this ivory comes from forest elephants in countries such as the DRC. The increased demand for worked ivory was believed to be linked to the rising number of Chinese citizens working in Angola. In recent analyses of seizure data in ETIS, prepared for CITES, Angola has been identified as a country with a worrying involvement in illegal ivory trade (CITES Secretariat, 2012; Milliken et al.,
C U R R E N T I S S U E S
Angola
S O U T H E R N A F R I C A ― A N G O L A
AN
GO
LA
C O U N T R Y
E S T I M A T E D T O T A L E L E P H A N T S G E N E R A L S T A T I S T I C S
G U E S S E S
Country Area
Range Area
Protected Range
Information Quality Index (IQI)
CITES Appendix
Listing Year
1,246,700 km²
323,270 km² (26%)
15 %
0.09
I
2013 (year of accession)
3,396 ± 1,562
96 - 111
A F R I C A N E L E P H A N T S T A T U S R E P O R T 2 0 1 6

146
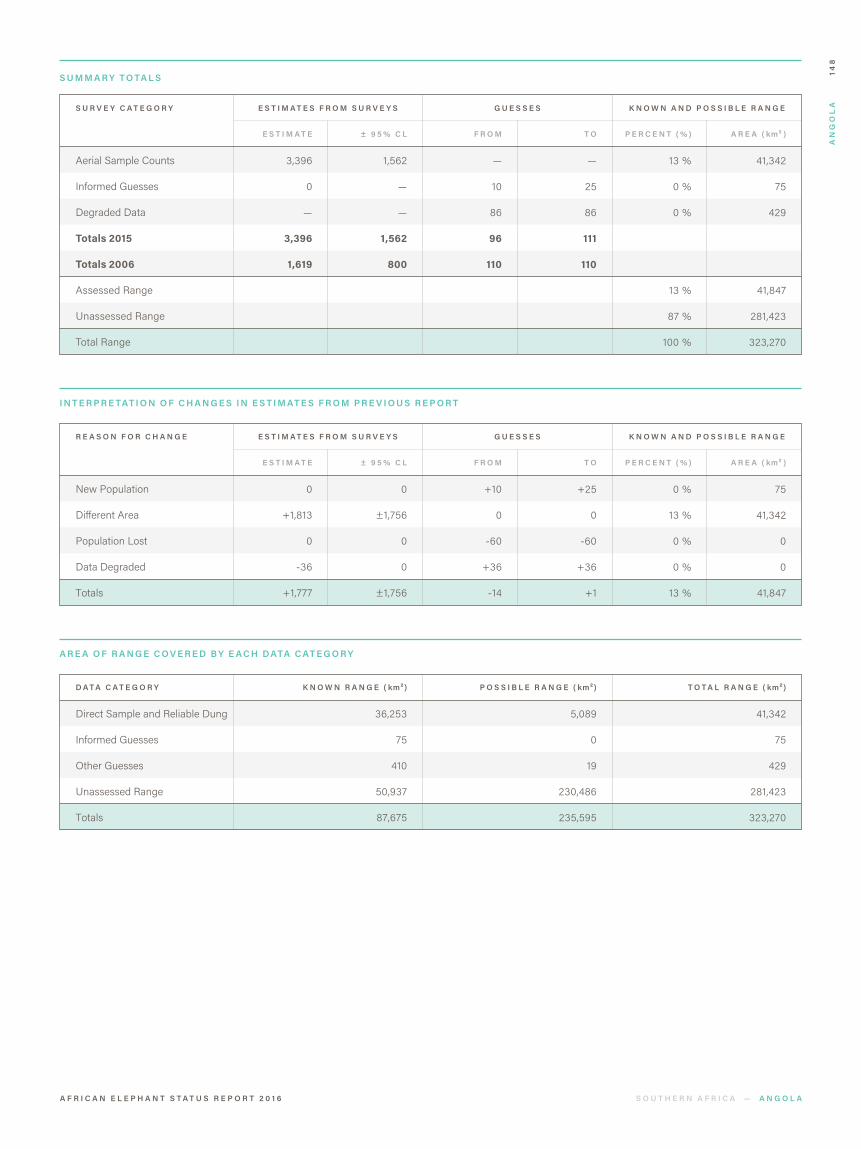
The estimated number of elephants in areas surveyed in the last ten years in Angola is 3,396 ± 1,562 at the time of the last survey for each area. There may be an additional 96 to 111 elephants in areas not systematically surveyed in Angola. These guesses likely represent a minimum number, and actual numbers could be higher than those reported. Together, this estimate and guess apply to 41,847 km², which is 13% of the estimated known and possible elephant range. There remains an additional 87% of the estimated range for which no elephant population estimates are available.
The national totals show an increase of nearly 2,000 in estimated numbers. However, this is a result of a larger proportion of the main elephant population being covered than in earlier surveys, rather than a real increase.
Elephants are believed to be present in the far north and far south of the country, with forest elephants in the north-west and savanna elephants in the north-east and south (Enock, pers. comm., 2002), although the genetic status of these elephants has not been confirmed.
In 2015 an aerial sample count survey was carried out between the Kwando and Cuito-Kavango rivers in the south-east of Angola (Chase & Schlossberg, 2016). Elephants in this area form part of the KAZA transboundary population. The survey gave an overall estimate of 3,396 ± 1,562 elephants. This replaced an estimate of 1,827 ± 598 from the Luiana Partial Reserve in 2005 (Chase & Griffin, 2011). The 2015 survey expanded the range covered to include Cubango Game Reserve in the west and Mavinga on the Kwando to the north (though no elephants were sighted there). Data extracted by Chase and Schlossberg (Chase & Schlossberg, 2016) from their 2015 dataset for Luiana PR only, provided a comparable estimate of 1,437 ± 600 elephants, which although lower than the 2005 results, was not significantly so. The overall carcass ratio from the 2015 survey was 30%, suggesting a high level of mortality.
Thirty two elephants from South Africa were introduced to the Quiçama National Park by the Kissama Foundation in 2000 and 2001 and put into a 10,000-hectare, fenced, “soft release” area in the north of the park. In a 2015 survey 89 elephants were counted in the release area (Carmignani, 2015), and there were believed to be another 50 individuals in the rest of the park in 2002 (Vaz Pinto, pers. comm., 2003).
There is a small population of perhaps 10-25 elephants living on the escarpment to the east of Luanda in the Kambondo forest (Hines, pers. comm. 2015) and sightings of these elephants are marked as point records.
Reports were received in 2012 of more than 20 elephants moving across the border from Angola, spending time in the south-western part of Congo (Mbende et al., 2012) and this area is marked as known range.
N U M B E R S A N D D I S T R I B U T I O N
S O U T H E R N A F R I C A ― A N G O L A
AN
GO
LA
2013, 2016). Angola, a Party to CITES since 2013, was requested by the CITES Standing Commit-tee to prepare a National Ivory Action Plan which it submitted in February 2015 (CITES, n.d.-a). Commencing in May 2016, the Government of Angola enacted a ban on domestic trade of ivory (Hungerford, 2016).
C U R R E N T I S S U E S
C O N T .
A F R I C A N E L E P H A N T S T A T U S R E P O R T 2 0 1 6

147
In the AESR 2007 there was an estimate of 60 elephants in the Bongola area on the Namibia border from 1992, but since this is no longer marked as elephant range, it has been removed and this is recorded as a lost population.
There is also a small area of elephant range in the Cabinda Enclave, a separate section of Angola surrounded by DRC and the Republic of Congo (Heffernan, 2005) but there is no estimate for this area.
Substantial changes have been made to the range map (Vaz Pinto & Verissimo, pers. comm., 2014). These include the removal of a large area of possible range in the dry south-west part of the country, the addition of a new area of possible range on the Zambian border, and a more defined range, including some known range, both east of Luanda and on the border with the DRC.
S O U T H E R N A F R I C A ― A N G O L A
AN
GO
LA
N U M B E R S A N D D I S T R I B U T I O N
C O N T .
A F R I C A N E L E P H A N T S T A T U S R E P O R T 2 0 1 6
148
AN
GO
LA
S U M M A R Y T O TA L S
I N T E R P R E TAT I O N O F C H A N G E S I N E S T I M AT E S F R O M P R E V I O U S R E P O R T
A R E A O F R A N G E C O V E R E D B Y E A C H DATA C AT E G O R Y
S U R V E Y C A T E G O R Y E S T I M A T E S F R O M S U R V E Y S
E S T I M A T E F R O M± 9 5 % C L T O P E R C E N T ( % ) A R E A ( km² )
G U E S S E S K N O W N A N D P O S S I B L E R A N G E
Aerial Sample Counts
Informed Guesses
Degraded Data
Totals 2015
Totals 2006
Assessed Range
Unassessed Range
Total Range
3,396
0
—
3,396
1,619
1,562
—
—
1,562
800
—
10
86
96
110
—
25
86
111
110
13 %
0 %
0 %
13 %
87 %
100 %
41,342
75
429
41,847
281,423
323,270
R E A S O N F O R C H A N G E E S T I M A T E S F R O M S U R V E Y S
E S T I M A T E F R O M± 9 5 % C L T O P E R C E N T ( % ) A R E A ( km² )
G U E S S E S K N O W N A N D P O S S I B L E R A N G E
New Population
Different Area
Population Lost
Data Degraded
Totals
0
+1,813
0
-36
+1,777
0
±1,756
0
0
±1,756
+10
0
-60
+36
-14
+25
0
-60
+36
+1
0 %
13 %
0 %
0 %
13 %
75
41,342
0
0
41,847
D A T A C A T E G O R Y K N O W N R A N G E ( km²) P O S S I B L E R A N G E ( km²) T O T A L R A N G E ( km²)
Direct Sample and Reliable Dung
Informed Guesses
Other Guesses
Unassessed Range
Totals
36,253
75
410
50,937
87,675
5,089
0
19
230,486
235,595
41,342
75
429
281,423
323,270
S O U T H E R N A F R I C A ― A N G O L AA F R I C A N E L E P H A N T S T A T U S R E P O R T 2 0 1 6

149
AN
GO
LA
E L E P H A N T E S T I M AT E S
17.3˚S
9.3˚S
9.1˚S
9.8˚S
17.0˚S
17.6˚E
13.3˚E
14.7˚E
13.6˚E
21.3˚E
1,505
9,500
75
9,500
41,542
2014
2002
2015
2002
2015
D
E
D
E
B
O
IR
O
O
AS
3
3
4
2
1
PL
-
NP
-
DA
Bongola Area
Cáua Camp
Kambondo Forest
Quiçama National Park
Southeast Angola
15*
1,562
0
36
10
50
3,396
M A P L O C A T I O NA R E AS U R V E Y D E T A I L S P F S
L A T .L O N .( km²)Y E A RR E L I A B .T Y P E
REASON
FOR
CHANGE
I N P U T Z O N E S O U R C E# O F E L E P H A N T S
± 9 5% C LE S T I M AT E
Vaz Pinto & Verissimo, pers. comm., 2014
Vaz Pinto, pers. comm., 2003
Hines, pers. comm., 2015
Vaz Pinto, pers. comm., 2003
Chase & Schlossberg, 2016
* R A N G E O F I N F O R M E D G U E S S
S O U T H E R N A F R I C A ― A N G O L AA F R I C A N E L E P H A N T S T A T U S R E P O R T 2 0 1 6
DA: Different Area; DD: Data Degraded; DT: Different Technique; NA: New Analysis;
NG: New Guess; NP: New population; PL: Population Lost; RS: Repeat Survey (RS
denotes a repeat survey that is not statistically comparable for reasons such as
different season);
― : No Change
AS: Aerial Sample Count; AT: Aerial Total Count; DC: Dung Count; GD: Genetic
Dung Count; GS: Ground Sample Count; GT: Ground Total Count; IG: Informed
Guess; IR: Individual Registration; OG: Other Guess. Survey Reliability is keyed A-E
(best to worst).
Priority for Future Surveys (PFS) is ranked from 1 to 5 (highest to lowest). Based
on the precision of estimates and the proportion of national range accounted
for by the site in question, PFS is a measure of the importance and urgency for
future population surveys. All areas of unassessed range have a priority of 1. See
Introduction for details on how the PFS is derived.
1 K E Y T O R E A S O N S F O R C H A N G E
2 K E Y T O S U R V E Y R E P O R T
3 P F S

A F R I C A N E L E P H A N T S T A T U S R E P O R T 2 0 1 6 S O U T H E R N A F R I C A ― A N G O L A
Cuango
Cuango
CongoCongo
CuandoCuando
Cubango
Cubango
Okavango
Okavango
Zambeze
Zambeze
Zambezi
Zambezi
Cuan
zaCu
anza
Cassa
i
Cassa
i
MalangeMalange
CabindaCabinda
Pointe-NoirePointe-Noire
SibitiSibiti
SaurimoSaurimo
LuenaLuena
HuamboHuamboBenguelaBenguela
LubangoLubango
NamibeNamibe
MalengueMalengue
MonguMongu
MaunMaun
TsumebTsumeb
OtjiwarongoOtjiwarongo
K I NSHA S A
LUAN DA
BR A Z Z AV I LLE
BOT SWANA
ANG OL A
DEMOCR ATIC R EPU BLICOF CONG O
CONG O
G ABON
Z AM BIA
NAM I BIA
0 90 180 270 360 450 540 km
20°S 20°S
19°S 19°S
18°S 18°S
17°S 17°S
16°S 16°S
15°S 15°S
14°S 14°S
13°S 13°S
12°S 12°S
11°S 11°S
10°S 10°S
9°S 9°S
8°S 8°S
7°S 7°S
6°S 6°S
5°S 5°S
4°S 4°S
12°E
12°E
13°E
13°E
14°E
14°E
15°E
15°E
16°E
16°E
17°E
17°E
18°E
18°E
19°E
19°E
20°E
20°E
21°E
21°E
22°E
22°E
23°E
23°E
24°E
24°E
Bongola
Southeast Angola
Quiçama NP
Cáua CampKambondo
Forest
Swa Kibula
BushimaeHZ
Conkouati-Douli
NP
West Zambezi
Sioma Ngwezi
NP
NorthernBotswana
Khaudum-Kvango
Nyae NyaeConservancy
Mangetti GREtosha NP
Kunene
ZambeziRegion
Iona NP
MoçâmedesPartial
Reserve
Bufalo Partial Reserve
Chimalavera RegionalNature Park
Bikuar NP
Mupa NP
Mucusso GR Luiana NP
Mavinga Partial Reserve
Dimonika BR
Moremi GR
KhaudomGP
Hobatere CA
SkeletonCoast NP
Bwabwata NP
Angola
Int'l Boundaries
Rivers & Lakes
Towns
Protected Areas
Input Zones
Known
Possible
Doubtful
Sighting
E L E P H A N T R A N G E0 9 0 1 8 0 2 7 0 3 6 0 4 5 0 5 4 0 k m
See Appendix III for map abbreviations and acronyms.
© 2016 African Elephant Specialist Group
A B B R E V I AT I O N S A N D A C R O N Y M S
150
151
Botswana has by far the largest elephant population of any country in Africa. The vast majori-ty occur in the north of Botswana within the Kavango-Zambezi Transfrontier Conservation Area (KAZA TFCA), shared by Botswana, Namibia, Zambia, Zimbabwe and Angola, and elephants move between these countries.
Poaching of elephants by armed gangs has become an increasing threat in northern Botswana. Anti-poaching is undertaken by the Department of Wildlife and National Parks (DWNP), the Bo-tswana Defence Force (BDF) and the Botswana Police (KAZA Secretariat, 2014a). DWNP has recently produced an approved National Anti-Poaching Strategy (Blackbeard, pers. comm., 2014).
The National Policy and Strategy for the Conservation and Management of the African Elephant was published in 2003 (DG Ecological Consulting, 2003). It is now outdated and in need of revision.
In 2008, Botswana undertook an approved one-off sale of 43,153 kg of ivory to Japan and China, at a total price of USD $7,093,551 (Wijnstekers, 2011).
Botswana declared an export quota of 600 tusks and other hunting trophies in 2007. The annual export quota for tusks and other hunting trophies fluctuated from 600 to 800 between 2009 and 2014. However, in 2014 a ban was placed on trophy hunting in the country and in 2015 a zero quota for exports of elephant hunting trophies was declared (CITES, n.d.-a).
C U R R E N T I S S U E S
Botswana
S O U T H E R N A F R I C A ― B O T S W A N A
BO
TS
WA
NA
C O U N T R Y
E S T I M A T E D T O T A L E L E P H A N T S G E N E R A L S T A T I S T I C S
G U E S S E S
Country Area
Range Area
Protected Range
Information Quality Index (IQI)
CITES Appendix
Listing Year
600,370 km²
228,073 km² (38%)
16 %
0.52
II
1997
131,626 ± 12,508
0 - 0
A F R I C A N E L E P H A N T S T A T U S R E P O R T 2 0 1 6

152
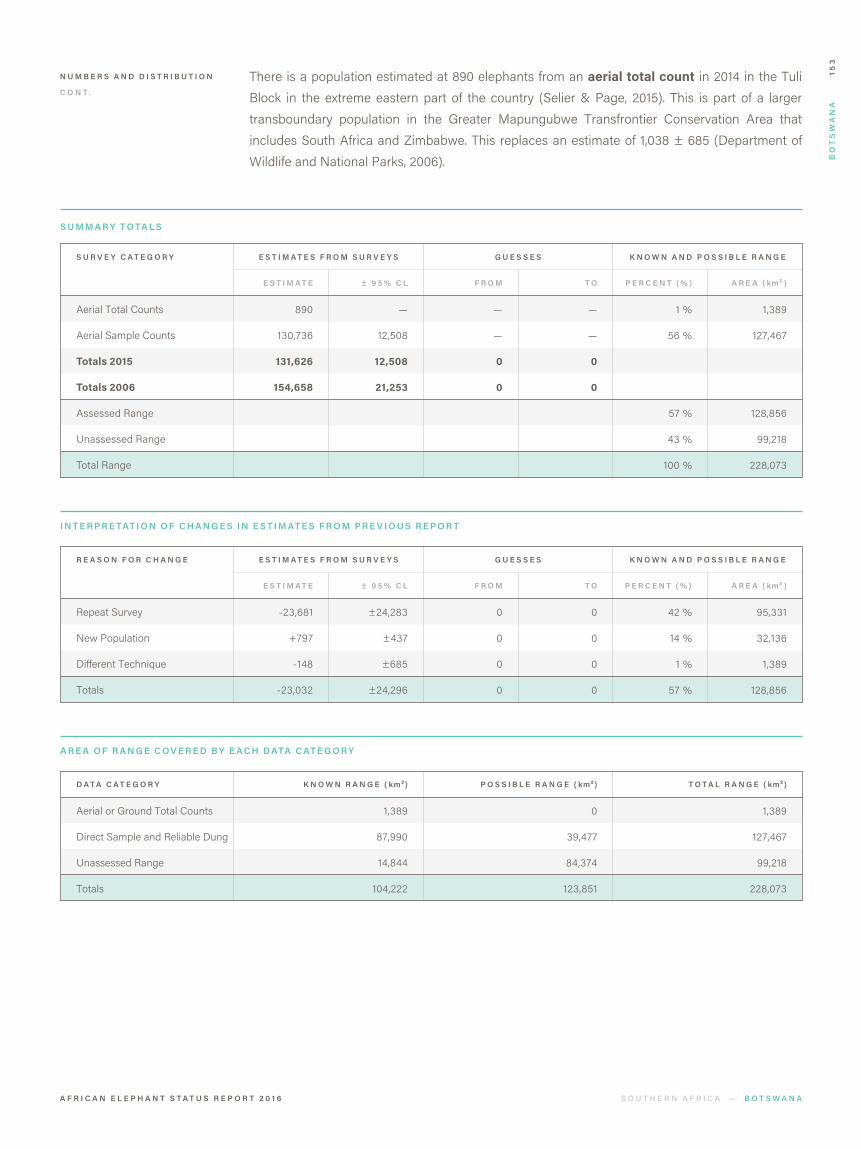
The estimated number of elephants in areas surveyed in the last ten years in Botswana is 131,626 ± 12,508 at the time of the last survey for each area. This estimate applies to 128,856 km², which is 57% of the estimated known and possible elephant range. There remains an additional 43% of the estimated known and possible elephant range for which no elephant population estimates are available.
The movement of elephants between northern Botswana and neighbouring countries requires that coordinated, simultaneous surveys are conducted to avoid the possibility of double counting or of missing animals entirely (KAZA Secretariat, 2014b). Counts flown of contiguous range in neighbouring countries were not synchronized with the 2014 Botswana survey.
The Botswana elephant population appeared to increase substantially from about 50,000 in 1990 to over 150,000 in 2006. However, this increase has been disputed (Junker et al., 2008). The estimate used in the AESR 2007 was the previously accepted national total of 154,658 ± 21,253 (Department of Wildlife and National Parks, 2006). More recent surveys have provided incompatible results. In 2010 and 2014 aerial sample counts of northern Botswana were undertaken by Elephants without Borders (Chase et al., 2015; Songhurst & Chase, 2010) and in 2012 and 2013 surveys were conducted by DWNP (DWNP, 2012). Results from the 2013 survey have not been released. The other surveys gave estimates of 128,340 ± 9,938 (2010), 207,545 ± 21,771 (2012) and 129,939 ± 12,501 (2014). These differences are so great that they are more likely to result from differences in survey technique or calculations rather than real population change or elephant movements.
Although a new total of 129,939 ± 12,501 from the Great Elephant Census in 2014 (Chase et al., 2015) has been included in the AED, this result raises questions with respect to the 2010 and 2012 surveys. It indicates no significant change since 2010 although a population that shows no evidence of serious poaching, excessive natural mortality or high levels of net emigration would be expected to show some increase. Compared to the 2012 survey results, the 2014 estimate would indicate a marked decline that is unlikely in the absence of any other indicators. Given that the KAZA TFCA transboundary population is the largest elephant population in Africa, of which the majority is within Botswana, it remains of the highest priority to carry out a simultaneous and coordinated count of the entire population.
The 2014 survey report gave a carcass ratio of 7% for northern Botswana (Chase et al., 2015), which is not considered exceptionally high, as carcass ratios of up to 8% are considered typical of a stable or increasing elephant population (Douglas-Hamilton & Burrill, 1991). However, it shows a notable increase over the earlier carcass ratio of 2% in 2010 and 2012.
Botswana is one of the few countries in Africa with confirmed elephant range expansion for elephants. In recent years the range has increased to the west towards Namibia (Songhurst, pers. comm. 2016) as well as southwards with large herds sighted for the first time in the Central Kalahari Game Reserve (CKGR) (Mokhandla, pers. comm., 2016). The 2015 dry season aerial sample count in Ghanzi District estimated 797 ± 437 (DWNP, 2016) of which 411 ± 252 were in CKGR. This is the first time that elephants have been counted in this area.
N U M B E R S A N D D I S T R I B U T I O N
S O U T H E R N A F R I C A ― B O T S W A N A
BO
TS
WA
NA
A F R I C A N E L E P H A N T S T A T U S R E P O R T 2 0 1 6
153
There is a population estimated at 890 elephants from an aerial total count in 2014 in the Tuli Block in the extreme eastern part of the country (Selier & Page, 2015). This is part of a larger transboundary population in the Greater Mapungubwe Transfrontier Conservation Area that includes South Africa and Zimbabwe. This replaces an estimate of 1,038 ± 685 (Department of Wildlife and National Parks, 2006).
S O U T H E R N A F R I C A ― B O T S W A N A
BO
TS
WA
NA
N U M B E R S A N D D I S T R I B U T I O N
C O N T .
S U M M A R Y T O TA L S
I N T E R P R E TAT I O N O F C H A N G E S I N E S T I M AT E S F R O M P R E V I O U S R E P O R T
A R E A O F R A N G E C O V E R E D B Y E A C H DATA C AT E G O R Y
S U R V E Y C A T E G O R Y E S T I M A T E S F R O M S U R V E Y S
E S T I M A T E F R O M± 9 5 % C L T O P E R C E N T ( % ) A R E A ( km² )
G U E S S E S K N O W N A N D P O S S I B L E R A N G E
Aerial Total Counts
Aerial Sample Counts
Totals 2015
Totals 2006
Assessed Range
Unassessed Range
Total Range
890
130,736
131,626
154,658
—
12,508
12,508
21,253
—
—
0
0
—
—
0
0
1 %
56 %
57 %
43 %
100 %
1,389
127,467
128,856
99,218
228,073
R E A S O N F O R C H A N G E E S T I M A T E S F R O M S U R V E Y S
E S T I M A T E F R O M± 9 5 % C L T O P E R C E N T ( % ) A R E A ( km² )
G U E S S E S K N O W N A N D P O S S I B L E R A N G E
Repeat Survey
New Population
Different Technique
Totals
-23,681
+797
-148
-23,032
±24,283
±437
±685
±24,296
0
0
0
0
0
0
0
0
42 %
14 %
1 %
57 %
95,331
32,136
1,389
128,856
D A T A C A T E G O R Y K N O W N R A N G E ( km²) P O S S I B L E R A N G E ( km²) T O T A L R A N G E ( km²)
Aerial or Ground Total Counts
Direct Sample and Reliable Dung
Unassessed Range
Totals
1,389
87,990
14,844
104,222
0
39,477
84,374
123,851
1,389
127,467
99,218
228,073
A F R I C A N E L E P H A N T S T A T U S R E P O R T 2 0 1 6

154
BO
TS
WA
NA
S O U T H E R N A F R I C A ― B O T S W A N A
E L E P H A N T E S T I M AT E S
23.7˚S
19.2˚S
22.3˚S
22.5˚E
24.0˚E
28.9˚E
51,269
98,387
1,456
2015
2014
2014
B
B
A
AS
AS
AT
1
1
2
NP
RS
DT
437
12,501
797
129,939
890
M A P L O C A T I O NA R E AS U R V E Y D E T A I L S P F S
L A T .L O N .( km²)Y E A RR E L I A B .T Y P E
REASON
FOR
CHANGE
I N P U T Z O N E S O U R C E# O F E L E P H A N T S
± 9 5% C LE S T I M AT E
DWNP, 2016
Chase et al., 2015
Selier & Page, 2015
Ghanzi District
Northern Botswana
Tuli Game Reserve
* R A N G E O F I N F O R M E D G U E S S
A F R I C A N E L E P H A N T S T A T U S R E P O R T 2 0 1 6
DA: Different Area; DD: Data Degraded; DT: Different Technique; NA: New Analysis;
NG: New Guess; NP: New population; PL: Population Lost; RS: Repeat Survey (RS
denotes a repeat survey that is not statistically comparable for reasons such as
different season);
― : No Change
AS: Aerial Sample Count; AT: Aerial Total Count; DC: Dung Count; GD: Genetic
Dung Count; GS: Ground Sample Count; GT: Ground Total Count; IG: Informed
Guess; IR: Individual Registration; OG: Other Guess. Survey Reliability is keyed A-E
(best to worst).
Priority for Future Surveys (PFS) is ranked from 1 to 5 (highest to lowest). Based
on the precision of estimates and the proportion of national range accounted
for by the site in question, PFS is a measure of the importance and urgency for
future population surveys. All areas of unassessed range have a priority of 1. See
Introduction for details on how the PFS is derived.
1 K E Y T O R E A S O N S F O R C H A N G E
2 K E Y T O S U R V E Y R E P O R T
3 P F S

A F R I C A N E L E P H A N T S T A T U S R E P O R T 2 0 1 6 S O U T H E R N A F R I C A ― B O T S W A N A
Marico
Marico
Limpopo
Limpopo
Olif
ants
Olif
ants
Vaal
Vaal
OrangeOrange
Okavango
Okavango
ZambeziZambezi
Cuando
Cuando
CubangoCubango
KafueKafue
KaribaKariba
LivingstoneLivingstone
Victoria FallsVictoria Falls
KasaneKasane
MaunMaun
GhanziGhanzi
FrancistownFrancistown
BulawayoBulawayo
PietersburgPietersburg
LobatseLobatse
JohannesburgJohannesburg
BloemfonteinBloemfontein
MonguMonguLUS AKA
G ABORON E
PR E TOR IA( T SHWAN E )
BOT SWANA
Z I M B ABWE
NAM I BIA
LE SOTHO
Z AM BIA
ANG OL A
SO U TH AF R ICA
0 70 140 210 280 350 420 km
28°S 28°S
27°S 27°S
26°S 26°S
25°S 25°S
24°S 24°S
23°S 23°S
22°S 22°S
21°S 21°S
20°S 20°S
19°S 19°S
18°S 18°S
17°S 17°S
16°S 16°S
20°E
20°E
21°E
21°E
22°E
22°E
23°E
23°E
24°E
24°E
25°E
25°E
26°E
26°E
27°E
27°E
28°E
28°E
29°E
29°E
Ghanzi District Tuli GR
Northern Botswana
Khaudum-Kvango
Nyae NyaeConservancy
ZambeziRegion
Southeast Angola Kafue GMAs
Kafue NP
West Zambezi
Sioma Ngwezi
NP
Lower ZambeziGMAs
Hwange NP
FullerForest Land
Nakavango
Matetsi SCMzolo
Forest Land
Sijarira FA
Chirisa SA
Chizarira NP
Binga Communal Lands
Kariba CAsChete SA
Rest of Zambezi
Valley
ShanganiRanch
MangweDam
MambaliCommunal
Lands
Bubiana
BubyeValley
Gwaai, Bembesi, & Umguza
Forest Lands
Mapungubwe
Marakele NPAtherstonePNR
Madikwe PRPilanesberg
PR
MakgadikgadiNP
Khutse GR
Central Kalahari GR
Nxai Pan NP
Moremi GR
Chobe NPKhaudom
GP
Bwabwata NP MudumoNP
Mamili NP
Mucusso GR Luiana NP
Mavinga PR
InsezeForest Land
WelgevondenPGR
Botswana
Int'l Boundaries
Rivers & Lakes
Towns
Protected Areas
Input Zones
Known
Possible
Doubtful
Sighting
E L E P H A N T R A N G E0 7 0 1 4 0 2 1 0 2 8 0 3 5 0 4 2 0 k m
See Appendix III for map abbreviations and acronyms.
© 2016 African Elephant Specialist Group
A B B R E V I AT I O N S A N D A C R O N Y M S
155

156
Because of the country’s high human population density, Malawi's elephants are almost entirely confined to protected areas. As a consequence, elephant populations in Malawi are small and fragmented. Human-elephant conflict is prevalent as a result, and poaching for meat and ivory is believed to be further reducing certain populations.
In an attempt to manage these populations a number of translocations have taken place in the last ten years. In 2006, 70 elephants were moved into Majete Wildlife Reserve from Liwonde National Park and a further 64 were moved in 2008 (Macpherson, 2012). In 2009, 83 elephants were moved into Majete WR from Phirilongwe Forest (Cunliffe, 2010).
Co-management of protected areas in Malawi is well established with the African Parks Network taking contractual responsibility for the management of Majete WR in 2003, and Liwonde NP and Nkhotakota Game Reserve in 2015.
In 2015, as part of the Elephant Protection Initiative, Malawi developed a draft 10-year national action plan for elephant management. This strategy is still under review. In addition Malawi is undertaking a review of the national wildlife policy (Ministry of Information, Tourism and Culture, 2014) as well as an illegal wildlife trade assessment (Lewis & Clark Law School, 2014).
In recent analyses of seizure data in ETIS, prepared for CITES, Malawi has been identified as a country with a worrying involvement in illegal ivory trade (CITES Secretariat, 2012; Milliken et al.,
C U R R E N T I S S U E S
Malawi
S O U T H E R N A F R I C A ― M A L A W I
MA
LA
WI
C O U N T R Y
E S T I M A T E D T O T A L E L E P H A N T S G E N E R A L S T A T I S T I C S
G U E S S E S
Country Area
Range Area
Protected Range
Information Quality Index (IQI)
CITES Appendix
Listing Year
118,480 km²
7,789 km² (7%)
89 %
0.55
I
1990
1,307 ± 0
398 - 398
A F R I C A N E L E P H A N T S T A T U S R E P O R T 2 0 1 6

157
The estimated number of elephants in areas surveyed in the last ten years in Malawi is 1,307 at the time of the last survey for each area. There may be an additional 398 elephants in areas not systematically surveyed. These guesses likely represent a minimum number, and actual numbers could be higher than those reported. Together, this estimate and guess apply to 5,616 km², which is 72% of the estimated known and possible elephant range. There remains an additional 28% of the estimated range for which no elephant population estimates are available.
An aerial total count was conducted by helicopter in Nyika National Park in 2013 in which 47 elephants were seen (Macpherson, 2013c). However, because elephants occur in heavily wooded and rugged country, it is likely that some were missed. This replaces a sample count estimate of 339 ± 239 from 1997 (Gibson, 1997). A ground survey in 2005 in part of the Nyika NP resulted in a zero estimate (Ferreira et al., 2005) and a total aerial count in 2009 also gave a zero estimate (WCS Flight Programme, 2009), showing the difficulty of carrying out surveys in Nyika NP. Since elephants were observed in the south-west of the park in the 2013 survey, an additional area of known range was added. This population extends a short distance into Zambia (Macpherson, 2013c).
In Vwaza Marsh Wildlife Reserve to the south-west of Nyika NP 310 elephants were observed during an aerial total count in 2013 (Macpherson, 2013d). This replaces a guess of 270 (Ferreira et al., 2005) based on an uncompleted survey. A lower intensity total count was carried out in 2009 with 151 elephants observed (WCS Flight Programme, 2009).
Kasungu National Park used to hold Malawi’s largest elephant population. However, in 2014, only 40 elephants were counted in Kasungu NP during an aerial total count (Macpherson, 2015a) which was part of the Great Elephant Census. Elephants now only occur in the immediate vicinity of the park headquarters and the area of known range has been adjusted accordingly. This replaces an estimate from 2005 of 58 ± 218 (Ferreira et al., 2005).
A ground sample count of Nkhotakota Wildlife Reserve in 2013 provided an estimate of 92 elephants, compared to 169 in 2011 (Sichali & Mkumbwa, 2014). The 2013 estimate replaces one of 1,037 ± 1,511 from a sample block count in 1995 (Japan Overseas Forestry Consultants Association & Pasco International Incorporated, 1997). There are doubts as to the validity of the 1995 numbers, since even in the 1980s there were thought to be no more than 300 elephants in the reserve. The northern section has been changed to doubtful range (Macpherson, 2013b).
The Thuma and Dedza-Salima Forest Reserves lie on the escarpment between Lilongwe and Lake Malawi. In 2015 a minimum of 133 elephants were observed during a ground total count (Clifford, 2016). This replaces a guess of 30-50 from 1998 (Munthali, pers. comm., 1998). The area of known range has been refined to fit the actual distribution.
N U M B E R S A N D D I S T R I B U T I O N
S O U T H E R N A F R I C A ― M A L A W I
MA
LA
WI
2013, 2016). Malawi has formed an Inter-Agency Committee to Combat Wildlife Crime (The Times Group, 2016) and in 2013, suspended its domestic ivory trade. In March 2016, following a national ivory inventory, Malawi destroyed approximately 2.6 tonnes of ivory (Reuters, 2016).
C U R R E N T I S S U E S
C O N T .
A F R I C A N E L E P H A N T S T A T U S R E P O R T 2 0 1 6

158
It is believed that six elephant remained in the Phirilongwe Forest after the translocation exercise (Kaunga-Nyirenda, pers. comm., 2014). This replaces a guess of 50 elephants from 1998 (Munthali, pers. comm., 1998).
Liwonde NP on the Shire River close to Lake Malawi holds Malawi’s largest population. Seven hundred and seventy seven elephants were observed in an aerial total count in 2014, which was part of the Great Elephant Census (Macpherson, 2015b). This replaces a guess of 530 from 2006 (African Parks Foundation, 2006). Aerial surveys were carried out on an annual basis from 2007 to 2012, giving estimates from 404 to 696 (Macpherson, 2015b). This increase in numbers has taken place despite 134 elephants being translocated out of Liwonde. Variations in numbers may be due to seasonal movements to the north-east into the Mangochi Forest Reserve, which has been changed to known range (Macpherson, pers. comm., 2015c).
All of the elephants in the Majete WR were believed to have been exterminated by 2002. Two hundred seventeen elephants were translocated into the reserve between 2006 and 2009. A total aerial survey was carried out in 2012 during which 163 elephants were counted (Macpherson, 2012), but there are currently believed to be about 300 (Fearnhead, pers. comm., 2015), which seems more reasonable given the number brought in, and the limited amount of poaching. This guess replaces one of 70 from 2006 (African Parks Foundation, 2006). The known range has been expanded to cover the whole reserve, since the fenced elephant release area has been extended to include the whole reserve.
S O U T H E R N A F R I C A ― M A L A W I
MA
LA
WI
N U M B E R S A N D D I S T R I B U T I O N
C O N T .
A F R I C A N E L E P H A N T S T A T U S R E P O R T 2 0 1 6

159
MA
LA
WI
S O U T H E R N A F R I C A ― M A L A W I
S U M M A R Y T O TA L S
I N T E R P R E TAT I O N O F C H A N G E S I N E S T I M AT E S F R O M P R E V I O U S R E P O R T
A R E A O F R A N G E C O V E R E D B Y E A C H DATA C AT E G O R Y
S U R V E Y C A T E G O R Y E S T I M A T E S F R O M S U R V E Y S
E S T I M A T E F R O M± 9 5 % C L T O P E R C E N T ( % ) A R E A ( km² )
G U E S S E S K N O W N A N D P O S S I B L E R A N G E
Aerial Total Counts
Ground Total Counts
Informed Guesses
Totals 2015
Totals 2006
Assessed Range
Unassessed Range
Total Range
1,174
133
0
1,307
508
—
—
—
0
323
—
—
398
398
1,876
—
—
398
398
1,896
49 %
2 %
21 %
72 %
28 %
100 %
3,842
136
1,637
5,616
2,173
7,789
R E A S O N F O R C H A N G E E S T I M A T E S F R O M S U R V E Y S
E S T I M A T E F R O M± 9 5 % C L T O P E R C E N T ( % ) A R E A ( km² )
G U E S S E S K N O W N A N D P O S S I B L E R A N G E
Different Technique
New Guess
Totals
+869
-70
+799
±323
0
±323
-1,734
+256
-1,478
-1,754
+256
-1,498
60 %
12 %
72 %
4,706
910
5,616
D A T A C A T E G O R Y K N O W N R A N G E ( km²) P O S S I B L E R A N G E ( km²) T O T A L R A N G E ( km²)
Aerial or Ground Total Counts
Informed Guesses
Unassessed Range
Totals
1,641
1,637
1,716
4,994
2,338
0
457
2,795
3,979
1,637
2,173
7,789
A F R I C A N E L E P H A N T S T A T U S R E P O R T 2 0 1 6

160
MA
LA
WI
S O U T H E R N A F R I C A ― M A L A W I
E L E P H A N T E S T I M AT E S
M A P L O C A T I O NA R E AS U R V E Y D E T A I L S P F S
L A T .L O N .( km²)Y E A RR E L I A B .T Y P E
REASON
FOR
CHANGE
I N P U T Z O N E S O U R C E# O F E L E P H A N T S
± 9 5% C LE S T I M AT E
Macpherson, 2015a
Macpherson, 2015b
Fearnhead, pers. comm., 2015
Sichali & Mkumbwa, 2014
Macpherson, 2013c
Kaunga-Nyirenda, pers. comm., 2014
Clifford, 2016
Macpherson, pers. comm., 2013c
12.9˚S
14.9˚S
15.9˚S
13.0˚S
10.6˚S
14.5˚S
14.0˚S
11.0˚S
33.1˚E
35.3˚E
34.6˚E
34.1˚E
33.8˚E
35.0˚E
34.3˚E
33.4˚E
2,316
675
860
747
1,679
640
418
978
2014
2014
2015
2013
2013
2009
2015
2013
A
A
D
D
A
D
A
A
AT
AT
O
GS
AT
O
GT
AT
1
1
1
1
1
1
1
1
DT
DT
NG
DT
DT
NG
DT
DT
40
777
300
92
47
6
133
310
Kasungu National Park
Liwonde National Park
Majete Wildlife Reserve
Nkhotakota Wildlife Reserve
Nyika National Park
Phirilongwe Forest Reserve
Thuma and Dedza Salima Forest Reserves
Vwaza Marsh Wildlife Reserve
* R A N G E O F I N F O R M E D G U E S S
A F R I C A N E L E P H A N T S T A T U S R E P O R T 2 0 1 6
DA: Different Area; DD: Data Degraded; DT: Different Technique; NA: New Analysis;
NG: New Guess; NP: New population; PL: Population Lost; RS: Repeat Survey (RS
denotes a repeat survey that is not statistically comparable for reasons such as
different season);
― : No Change
AS: Aerial Sample Count; AT: Aerial Total Count; DC: Dung Count; GD: Genetic
Dung Count; GS: Ground Sample Count; GT: Ground Total Count; IG: Informed
Guess; IR: Individual Registration; OG: Other Guess. Survey Reliability is keyed A-E
(best to worst).
Priority for Future Surveys (PFS) is ranked from 1 to 5 (highest to lowest). Based
on the precision of estimates and the proportion of national range accounted
for by the site in question, PFS is a measure of the importance and urgency for
future population surveys. All areas of unassessed range have a priority of 1. See
Introduction for details on how the PFS is derived.
1 K E Y T O R E A S O N S F O R C H A N G E
2 K E Y T O S U R V E Y R E P O R T
3 P F S

A F R I C A N E L E P H A N T S T A T U S R E P O R T 2 0 1 6 S O U T H E R N A F R I C A ― M A L A W I
L. Cabora BassaL. Cabora Bassa
Luan
gwa
Luan
gwa
Ruyuma
Ruyuma
L. Malawi
L. Malawi
Luge
nda
Luge
nda
ShireShire
MzuzuMzuzu
SongeaSongea
ChipataChipata
ZombaZomba
BlantyreBlantyre
TeteTete
LI LONGWE
MAL AWI
Z I M B ABWE
MOZ AM BIQ U E
Z AM BIA
TANZ AN IA
0 40 80 120 160 200 240 km
17°S 17°S
16°S 16°S
15°S 15°S
14°S 14°S
13°S 13°S
12°S 12°S
11°S 11°S
10°S 10°S
32°E
32°E
33°E
33°E
34°E
34°E
35°E
35°E
36°E
36°E
37°E
37°E
Kasungu NP
Liwonde NP
Nkhota-KotaWR
Vwaza Marsh WR
PhirilongweFR
Thuma FR andDedza Salima FR
Nyika NP
Majete WR
LuambeNP
LukusuziNP
South LuangwaNP
North LuangwaNP
LuangwaGMAs
NyatanaWMA
Cabora Bassa North
Magoe District
ChipanjeChetu
Niassa AdjacentBlocks
NiassaEcosystem
RuahaRungwa
Ecosystem
Mangochi FR
Malawi
Int'l Boundaries
Rivers & Lakes
Towns
Protected Areas
Input Zones
Known
Possible
Doubtful
Sighting
E L E P H A N T R A N G E0 4 0 8 0 1 2 0 1 6 0 2 0 0 2 4 0 k m
See Appendix III for map abbreviations and acronyms.
© 2016 African Elephant Specialist Group
A B B R E V I AT I O N S A N D A C R O N Y M S
161

162
Mozambique has been severely affected by the recent upsurge in elephant poaching. This has been particularly striking in the country’s largest population in the Niassa ecosystem (WCS, 2015b).
The Wildlife Conservation Society (WCS) co-manages Niassa National Reserve with the National Administration of Conservation Areas (ANAC) (WCS, 2015b). Considerable effort has gone into the rehabilitation of Gorongosa National Park, under joint venture arrangements with a private sector partner and foreign investor (Wilson, 2013).
In 2014 a new Biodiversity Law, which criminalises poaching, imposes deterrent sentences, and allows asset seizure, was signed into law (WCS, 2015b).
A five year strategy and action plan for the conservation and management of elephants in Mozam-bique was developed in 2010 (National Directorate of Conservation Areas, 2010).
Sport hunting of elephants is permitted in Mozambique. From 2007 to 2010, Mozambique’s de-clared annual export quota increased from 80 (tusks as hunting trophies from 40 animals) to 200 (tusks as hunting trophies from 100 animals). The annual export quota of 200 remained from 2010 to 2015 (CITES, n.d.-b).
In recent analyses of seizure data in ETIS, prepared for CITES, Mozambique has been identified as a country with a worrying involvement in illegal ivory trade (CITES Secretariat, 2012; Millik-en et al., 2013, 2016). Mozambique was requested by the CITES Standing Committee, at its 65th
C U R R E N T I S S U E S
Mozambique
S O U T H E R N A F R I C A ― M O Z A M B I Q U E
MO
ZA
MB
IQU
E
C O U N T R Y
E S T I M A T E D T O T A L E L E P H A N T S G E N E R A L S T A T I S T I C S
G U E S S E S
Country Area
Range Area
Protected Range
Information Quality Index (IQI)
CITES Appendix
Listing Year
801,590 km²
320,402 km² (40%)
17 %
0. 48
I
1990
10,884 ± 2,228
4,299 - 5,519
A F R I C A N E L E P H A N T S T A T U S R E P O R T 2 0 1 6
163
The estimated number of elephants in areas surveyed in the last ten years in Mozambique is 10,884 ± 2,228 at the time of the last survey for each area. There may be an additional 4,299 to 5,519 elephants in areas not systematically surveyed. These guesses likely represent a minimum number, and actual numbers could be higher than those reported. Together, this estimate and guess apply to 261,669 km², which is 82% of the estimated known and possible elephant range. There remains an additional 18% of the estimated range for which no elephant population estimates are available.
A country-wide aerial survey was carried out in 2008 (Agreco, 2008) and while it was undertaken at a low sampling intensity and did not cover all areas, it provided an important baseline. The country’s most important population is in the far north, in and around the Niassa NR. Smaller populations occur in the west and centre of the country in Tete and Sofala Provinces and in the south in Gaza Province. The range map has been substantially altered using the information from the 2008 survey. Because surveys have been conducted using a variety of different techniques, it is not easy to compare the national estimates with those from the AESR 2007. The number of elephants estimated from systematic surveys in Mozambique has declined by about 4,000. However, this includes elephants in some areas that had not been previously surveyed, and there has actually been a decrease of about 9,000 in populations which have been surveyed using comparable techniques. There has also been a decline of about 3,000 in the guessed number of elephants.
An aerial sample count was conducted in the Niassa Ecosystem in 2014 as part of the Great Elephant Census, giving an estimate of 4,441 ± 1,360 (Grossman et al., 2014d), which replaces an estimate of 12,477 ± 2,111 from 2004 (Craig & Gibson, 2004). In 2009 and 2011 aerial sample count estimates of 20,118 ± 2,701 and 12,029 ± 2,531 were obtained (Craig, 2011a, 2009). There appears to have been a substantial population decline, which is supported by a carcass ratio of 42% in 2014. The 2009 result may have been an over-estimate (Booth & Dunham, 2014) or the result of elephants having moved into the area due to disturbance elsewhere (Craig, 2009).
The 2008 national elephant census (Agreco, 2008) indicated that there were elephants just to the south of Niassa. An additional 1,015 ± 591 elephants were counted in an extension zone on the southern boundary of Niassa in 2014 (Grossman et al., 2014d). In 2011 an aerial sample count gave an estimate of 333 ± 309 in the Chipanje Chetu area to the west of the Niassa Reserve, which was not counted in 2014 (Craig, 2012a).
The Quirimbas National Park to the south-east of Niassa was surveyed in 2011, in 2013 (Craig, 2012b, 2013) and in 2014 as part of the Great Elephant Census (Grossman et al., 2014c) giving estimates of 555 ± 448, 560 ± 460 and 328 ± 361 elephants respectively. The 2014 estimate replaces a guess of 2,000 from 2005 (Cumming & Jones, 2005). Estimates in a corridor linking Quirimbas NP to Niassa NR were 294 ± 231 and 306 ± 365 elephants respectively in 2013 and 2014 (Craig, 2013; Grossman et al., 2014c). The estimate for the Palma area of the Quirimbas ecosystem was 58 ± 83 (Craig, 2012b). The confidence limits associated with all these elephant estimates are too wide to draw
N U M B E R S A N D D I S T R I B U T I O N
S O U T H E R N A F R I C A ― M O Z A M B I Q U E
MO
ZA
MB
IQU
E
meeting, to prepare a National Ivory Action Plan. Mozambique’s plan was submitted in January 2015 (CITES, n.d.-a). In July 2015, Mozambique destroyed 2.4 tonnes of ivory from its national stock-pile (Vaughan, 2015).
C U R R E N T I S S U E S
C O N T .
A F R I C A N E L E P H A N T S T A T U S R E P O R T 2 0 1 6

164
any conclusions about changes in numbers. However the carcass ratios were very high at 15% in 2011, 49% in 2013 and 45% in 2014, indicating an unsustainable offtake.
A ground survey of Gilé National Reserve was carried out in 2011-12 (Ntumi et al., 2012) which gave an informed guess of 21-166 elephants. This replaces a guess of 15-33 from 2002 (Ntumi, pers. comm., 2003).
Gorongosa National Park lost most of its large mammals during the civil conflict of 1977-1992. There were believed to be 2,000 elephants before the war compared to about 200 in 1994 (Cumming et al., 1994). An aerial total count in 2014 covering 50% of Gorongosa NP estimated at least 535 elephants (Stalmans et al., 2014), replacing an estimate of 22 from 2004 (Dunham, 2004), which suggests that numbers may be increasing (WCS, 2015).
A series of total counts, carried out in Marromeu Game Reserve since the mid-1960s (Bento et al., 2010), had been previously overlooked and thus no estimate was provided in the AESR 2007. In 2014, an aerial sample count was carried out as part of the Great Elephant Census, a few weeks after a helicopter count. The aerial sample count gave an estimate of 606 ± 634, which serves as the estimate for Marromeu GR, compared to 350 from the helicopter count (Grossman et al., 2014a).
An aerial sample count, which was part of the Great Elephant Census, estimated the elephant population in the Magoe area south of Lake Cahora Bassa in 2014 at 1,051 ± 721 and that of southern Tete Province further east at 604 ± 431 (Grossman et al., 2014b). These estimates replace an estimate of 1,628 ± 794 from 2003 (Dunham, 2004) and a guess of 2,260 to 3,910 from 1998 (Direcção Nacional de Florestas e Fauna Bravia, 1999) respectively. The 2014 survey had a high carcass ratio of 15%. Another aerial sample count in 2010 gave an estimate of 1,985 ± 1,102 (Dunham, 2010), suggesting that there had been no significant change between 2010 and 2014. No elephants were observed in the area north-west of Lake Cahora Bassa in 2014, compared to 90 in 2003 (Dunham, 2004). Note that the AESR 2007 incorrectly recorded an estimate of 1,718 elephants in this area. The 2014 survey did not cover the area between Lake Cahora Bassa and the Zambian border to the north, but there is recent evidence for the continued survival of elephants here (Jacobson, pers. comm., 2015) and the map shows the revised range based on this information.
An aerial sample count of Limpopo National Park and a southern extension along the South African border was carried out in 2014 as part of the Great Elephant Census (Grossmann et al., 2014e). This survey covered the entire national park and gave an estimate of 1,081 ± 641 elephants, which replaces an estimate of 630 (Whyte & Swanepoel, 2006) from a survey that covered only a section of the park. A further 173 ± 259 were estimated in the southern extension in 2014. There was a high carcass ratio of 17%. Fixed wing surveys were carried out in 2010 and 2013 but the results were considered unreliable (Grossmann et al., 2014e). A 2010 helicopter survey (Swanepoel, 2010) gave a minimum count of 1,007 elephants.
There are new records of elephants from the area north-east of the Limpopo Transfrontier Conservation Area, which includes Banhine National Park. In the AESR 2007, Banhine NP was shown as non-range with an estimate of zero. Five elephants were seen in an aerial total count of Banhine NP in 2012 (Stalmans, pers. comm., 2012) and further evidence of the survival of elephants
S O U T H E R N A F R I C A ― M O Z A M B I Q U E
MO
ZA
MB
IQU
E
N U M B E R S A N D D I S T R I B U T I O N
C O N T .
A F R I C A N E L E P H A N T S T A T U S R E P O R T 2 0 1 6
165
in this area was collected during the course of predator surveys (Andresen, pers. comm., 2015), so the area of known range has been modified accordingly. The numbers are likely to be low, however, as the 2014 Great Elephant Census survey of Gonarezhou in Zimbabwe covered the adjoining Massangena West area in Mozambique and no elephants were seen there (Dunham & van der Westhuizen, 2015).
Helicopter based counts were carried out in the Maputo Special Reserve in 2004, 2006, 2008, 2011 and 2012. During this period the maximum number counted was 348 in 2008 (Matthews, 2008) with a minimum of 80 in 2004. Although Bodasing and Cumbane (2013) counted 264 elephants in 2012, the authors considered that there were at least 400 elephants in the population (Bodasing & Cumbane, 2013). This count also included the Futi Corridor extension to Tembe Elephant Park in South Africa. The 2008 figure has been used in the report, since it is considered to be closer to the true number.
Some areas surveyed in 2008 have not been surveyed more recently, and a figure for the rest of Mozambique of 4,278 has been extracted from this dataset (Agreco, 2008). However, because of the uncertain overlaps in time and space with the other surveys this has been treated as an informed guess.
S O U T H E R N A F R I C A ― M O Z A M B I Q U E
MO
ZA
MB
IQU
E
N U M B E R S A N D D I S T R I B U T I O N
C O N T .
A F R I C A N E L E P H A N T S T A T U S R E P O R T 2 0 1 6

166
MO
ZA
MB
IQU
E
S O U T H E R N A F R I C A ― M O Z A M B I Q U E
S U M M A R Y T O TA L S
I N T E R P R E TAT I O N O F C H A N G E S I N E S T I M AT E S F R O M P R E V I O U S R E P O R T
A R E A O F R A N G E C O V E R E D B Y E A C H DATA C AT E G O R Y
S U R V E Y C A T E G O R Y E S T I M A T E S F R O M S U R V E Y S
E S T I M A T E F R O M± 9 5 % C L T O P E R C E N T ( % ) A R E A ( km² )
G U E S S E S K N O W N A N D P O S S I B L E R A N G E
Aerial Total Counts
Aerial Sample Counts
Informed Guesses
Other Guesses
Totals 2015
Totals 2006
Assessed Range
Unassessed Range
Total Range
883
9,996
5
—
10,884
14,847
—
2,229
—
—
2,228
2,260
—
—
21
4,278
4,299
7,149
—
—
166
5,353
5,519
9,072
1 %
29 %
5 %
47 %
82 %
18 %
100 %
2,422
93,274
16,336
149,636
261,669
58,732
320,402
R E A S O N F O R C H A N G E E S T I M A T E S F R O M S U R V E Y S
E S T I M A T E F R O M± 9 5 % C L T O P E R C E N T ( % ) A R E A ( km² )
G U E S S E S K N O W N A N D P O S S I B L E R A N G E
Repeat Survey
New Population
Different Technique
Different Area
New Guess
Totals
-8,613
+2,127
+2,608
-90
+5
-3,963
±2,730
±1,326
±918
±149
0
±3,175
0
0
-5,130
0
+2,280
-2,850
0
0
-6,830
0
+3,277
-3,553
14 %
6 %
12 %
1 %
50 %
82 %
43,933
19,581
37,099
2,195
158,861
261,669
D A T A C A T E G O R Y K N O W N R A N G E ( km²) P O S S I B L E R A N G E ( km²) T O T A L R A N G E ( km²)
Aerial or Ground Total Counts
Direct Sample and Reliable Dung
Informed Guesses
Other Guesses
Unassessed Range
Totals
2,422
90,528
15,708
121,485
53,243
283,387
0
2,746
628
28,151
5,489
37,014
2,422
93,274
16,336
149,636
58,732
320,402
A F R I C A N E L E P H A N T S T A T U S R E P O R T 2 0 1 6

167
MO
ZA
MB
IQU
E
S O U T H E R N A F R I C A ― M O Z A M B I Q U E
E L E P H A N T E S T I M AT E S
22.8˚S
15.9˚S
15.9˚S
15.9˚S
16.6˚S
18.9˚S
23.7˚S
23.7˚S
26.5˚S
18.7˚S
21.7˚S
12.3˚S
12.2˚S
12.2˚S
12.5˚S
12.5˚S
12.0˚S
18.3˚S
32.9˚E
31.7˚E
31.7˚E
31.7˚E
38.4˚E
34.4˚E
32.0˚E
32.0˚E
32.8˚E
35.9˚E
32.1˚E
35.2˚E
37.3˚E
37.3˚E
39.6˚E
39.6˚E
39.6˚E
35.8˚E
6,510
3,028
2,290
14,500
2,456
1,832
3,240
11,971
827
2,307
1,574
6,641
6,697
42,168
3,605
11,298
3,816
333,225
2012
2014
2014
2014
2012
2014
2014
2014
2008
2014
2014
2011
2014
2014
2014
2014
2011
2008
D
D
B
B
D
A
B
B
A
B
B
B
B
B
B
B
B
E
O
AS
AS
AS
O
AT
AS
AS
AT
AS
AS
AS
AS
AS
AS
AS
AS
O
2
2
2
1
2
3
2
2
3
2
3
2
2
1
2
2
2
1
NG
DA
RS
DT
NG
DT
NP
DT
DT
NP
NP
NP
NP
RS
DT
DT
DT
NG
Banhine National Park
Cahora Bassa
Cahora Bassa North
Magoe District
Tete Province-South
Gilé National Reserve
Gorongosa National Park
Limpopo
Limpopo Extension
Limpopo National Park
Maputo Elephant Reserve
Marromeu Game Reserve
Massangena West
Northern
Chipanje Chetu
Niassa Adjacent Blocks
Niassa Ecosystem
Quirimbas Corridor
Quirimbas National Park
Palma
Rest of Mozambique range
721
431
145*
259
641
634
309
591
1,360
365
361
83
1,075*
5
0
1,051
604
21
535
173
1,081
348
606
0
333
1,015
4,441
306
328
58
4,278
M A P L O C A T I O NA R E AS U R V E Y D E T A I L S P F S
L A T .L O N .( km²)Y E A RR E L I A B .T Y P E
REASON
FOR
CHANGE
I N P U T Z O N E S O U R C E# O F E L E P H A N T S
± 9 5% C LE S T I M AT E
Stalmans, pers. comm., 2012
Grossmann et al., 2014b
Grossmann et al., 2014b
Grossmann et al., 2014b
Ntumi et al., 2012
Stalmans et al., 2014
Grossman et al., 2014e
Grossman et al., 2014e
Matthews, 2008
Grossmann et al., 2014a
Dunham & van der Westhuizen, 2015
Craig, 2012a
Grossman et al., 2014d
Grossman et al., 2014d
Grossmann, et al. 2014c
Grossmann, et al. 2014c
Craig, 2012b
Agreco, 2008
* R A N G E O F I N F O R M E D G U E S S
A F R I C A N E L E P H A N T S T A T U S R E P O R T 2 0 1 6
DA: Different Area; DD: Data Degraded; DT: Different Technique; NA: New Analysis;
NG: New Guess; NP: New population; PL: Population Lost; RS: Repeat Survey (RS
denotes a repeat survey that is not statistically comparable for reasons such as
different season);
― : No Change
AS: Aerial Sample Count; AT: Aerial Total Count; DC: Dung Count; GD: Genetic
Dung Count; GS: Ground Sample Count; GT: Ground Total Count; IG: Informed
Guess; IR: Individual Registration; OG: Other Guess. Survey Reliability is keyed A-E
(best to worst).
Priority for Future Surveys (PFS) is ranked from 1 to 5 (highest to lowest). Based
on the precision of estimates and the proportion of national range accounted
for by the site in question, PFS is a measure of the importance and urgency for
future population surveys. All areas of unassessed range have a priority of 1. See
Introduction for details on how the PFS is derived.
1 K E Y T O R E A S O N S F O R C H A N G E
2 K E Y T O S U R V E Y R E P O R T
3 P F S

A F R I C A N E L E P H A N T S T A T U S R E P O R T 2 0 1 6 S O U T H E R N A F R I C A ― M O Z A M B I Q U E
Ruvuma
Ruvuma
Luge
nda
Luge
nda
ShireShire
SabiSabi
Olif
ants
Olif
ants
VaalVaal
Kom
ati
Kom
ati
L. Cabora BassaL. Cabora Bassa
Ingomati
Ingomati
MzuzuMzuzu
SongeaSongea
TunduruTunduru
PembaPemba
NampulaNampula
ZombaZomba
BlantyreBlantyre
ChipataChipata
TeteTete
MutareMutare
BeiraBeira
SitekiSitekiKubutaKubuta
MalomaMaloma
PietersburgPietersburg
HAR AR E
LI LONGWE
M B AB AN EMAPU TO
Z AM BIA
MAL AWI
DEMOCR ATICR EPU BLICOF CONG O
TANZ AN IA
MOZ AM BIQ U E
Z I M B ABWE
SO U TH AF R ICA
SWA Z I L AN D
0 80 160 240 320 400 480 km
26°S 26°S
25°S 25°S
24°S 24°S
23°S 23°S
22°S 22°S
21°S 21°S
20°S 20°S
19°S 19°S
18°S 18°S
17°S 17°S
16°S 16°S
15°S 15°S
14°S 14°S
13°S 13°S
12°S 12°S
11°S 11°S
30°E
30°E
31°E
31°E
32°E
32°E
33°E
33°E
34°E
34°E
35°E
35°E
36°E
36°E
37°E
37°E
38°E
38°E
39°E
39°E
40°E
40°E
41°E
41°E
Cahora Bassa North
Tete Province-South
ChipanjeChetu
Magoe District
Gilé GR
Niassa Ecosystem
Niassa AdjacentBlocks
QuirimbasCorridor
Quirimbas NP
Palma
Gorongosa NP Marromeu GR
Limpopo Extension
Maputo ElephantReserve
Limpopo NP
Banhine NP
Rest ofMozambique
MassangenaWest
ChegutuSA
Nyatana WMA
SaveValley
ChiredziRiverBubiana
BubyeValley
Tuli, Maramani,Sentinel,Nottingham
Mapungubwe
Balule,TimbavatiUmbabat
& Klaserie
Kruger NP
Letaba PNR
Maremani NR
ManyeletiGR
SongimveloGR
HlaneRoyal NP
Mkhaya NR
MavuradonhaWA
Chewore
Doma SA
Rest of Zambezi
Valley
Luano
SouthLuangwa
NP
NorthLuangwa
NP
LukusuziNP
Bangweulu System
LuambeNP
Luangwa GMAs
Nkhota-Kota
WR
VwazaMarsh
WR
Nyika NP
KasungaNP
PhirilongweFR
Thuma and DedzaSalima FR
LiwondeNP
Majete WR
Zinave NP
UmfuliRP
ChipingeSA
Manjirenji
Sabi SandGR
Isangano NP
MangochiFR
Niassa GR
Mozambique
Int'l Boundaries
Rivers & Lakes
Towns
Protected Areas
Input Zones
Known
Possible
Doubtful
Sighting
E L E P H A N T R A N G E0 8 0 1 6 0 2 4 0 3 2 0 4 0 0 4 8 0 k m
See Appendix III for map abbreviations and acronyms.
© 2016 African Elephant Specialist Group
A B B R E V I AT I O N S A N D A C R O N Y M S
168

169
Namibia’s elephants occur across the northern region of the country, mostly in national parks and community areas. Their range encompasses a wide variety of habitats, from the extremely arid north-west Kunene Region to the well-watered Zambezi (formerly Caprivi) Region, where the elephants form part of the KAZA transfrontier population. Although poaching has increased in the Zambezi Region in the past ten years, it is not seen as a significant threat in Etosha National Park or for populations in Khaudum National Park and Kunene Region.
Elephant hunting takes place in Namibia, and the revenue generated provides significant income to community conservancies (Naidoo et al., 2006). From 2007 to 2015, Namibia declared an annual export quota of elephant hunting trophies of 180, defined as tusks from 90 animals (CITES, n.d.-a).
Namibia’s elephant management plan was published in 2007 (Ministry of Environment and Tour-ism, 2007).
In 2008, Namibia undertook an approved one-off sale of 7,503 kg of ivory to Japan and China, at a price of USD $1,147,369 (Wijnstekers, 2011).
C U R R E N T I S S U E S
Namibia
S O U T H E R N A F R I C A ― N A M I B I A
NA
MIB
IA
C O U N T R Y
E S T I M A T E D T O T A L E L E P H A N T S G E N E R A L S T A T I S T I C S
G U E S S E S
Country Area
Range Area
Protected Range
Information Quality Index (IQI)
CITES Appendix
Listing Year
825,418 km²
164,069 km² (20%)
18 %
0.43
II
1997
22,754 ± 4,305
90 - 90
A F R I C A N E L E P H A N T S T A T U S R E P O R T 2 0 1 6

170
The estimated number of elephants in areas surveyed in the last ten years in Namibia is 22,754 ± 4,305 at the time of the last survey for each area. There may be an additional 90 elephants in areas not systematically surveyed. These guesses likely represent a minimum number, and actual numbers could be higher than those reported. Together, this estimate and guess apply to 84,283 km², which is 52% of the estimated known and possible elephant range. There remains an additional 48% of the estimated range for which no elephant population estimates are available.
The elephant population of Namibia has continued to increase although, with wide confidence limits in aerial surveys and elephants moving across international borders, it is not possible to be precise about how great the increase in the national population has been.
There are four main populations, the transfrontier population (with Zambia, Angola, Botswana and Zimbabwe) in the Zambezi Region, in Khaudum National Park in the north-east, the Etosha National Park population, and the Kunene population in the north-west which includes the “desert” elephants.
There has been an increasing trend in elephant numbers in the Zambezi Region since surveys started in the 1980s. This is likely to have been a result of both natural growth and movement from neighbouring countries. Aerial sample counts were carried out in 2007, 2011, 2013, 2014, and 2015, giving estimates of 8,380, 10,847 ± 3,580, 9,165 ± 2,016, 14,097 ± 2,678 and 13,116 ± 3,413 (Chase, 2007; Craig & Gibson, 2013b, 2014; Craig, 2011b; Gibson & Craig, 2015a). The previous estimate in the AESR 2007 was 8,725 ± 2,206 (Kolberg, 2004). There was also a total count carried out in 2007 (Chase, 2007) and a sample count in 2008 (Kolberg, 2008). However the latter was carried out with an inexperienced crew and the results were thought to be a considerable underestimate (Kolberg, 2008).
The elephant population of Khaudum NP and the neighbouring community conservancies of Nyae Nyae and N≠a Jaqna have been established since the 1980s, with the provision of artificial water and movements across the border from Botswana. Three aerial sample counts were carried out in 2011, 2013 and 2015 giving estimates of 4,731 ± 1,940, 3,638 ± 1,164, and 6,413 ± 2,566 (Craig & Gibson, 2013a; Gibson & Craig, 2015b; MET, 2012). The 2015 figure replaces an estimate of 3,758 ± 2,289 for Khaudum, 61 ± 115 for N#a Jaqna (Kolberg, 2004) and 967 ± 481 for Nyae Nyae (Stander, 2004). None of these are significant differences.
There is a limited movement of elephants between Angola and the Kavango region to the north-west of Khaudum (Terblanche, 2016).
There is a small elephant population in the Mangetti area between Khaudum and Etosha. The AESR 2007 indicated that they occupy the Mangetti Game Reserve, whereas their range is actually concentrated around the Mangetti Cattle Ranch to the west, and also probably extends into the Ukwuangali communal area to the north. Ninety individuals were observed in Mangetti in 2015 (Lindeque, pers. comm., 2016). This informed guess replaces one of 20 from 2005 (Ministry of Environment and Tourism, 2005).
N U M B E R S A N D D I S T R I B U T I O N
S O U T H E R N A F R I C A ― N A M I B I A
NA
MIB
IA
A F R I C A N E L E P H A N T S T A T U S R E P O R T 2 0 1 6

171
Etosha National Park in northern Namibia has an increasingly isolated elephant population, since the perimeter fencing has been upgraded in recent years. There has been a gradual increase in elephant numbers, moderated by deaths from anthrax and poaching. Aerial sample counts were carried out in 2011 and 2012, giving estimates of 3,378 ± 1,756 and 2,810 (confidence limits not available) (Kolberg, 2012; MET, 2012). The most recent aerial sample count from 2015 gave an estimate of 2,911 ± 637 (Kilian, 2015) and replaces an estimate of 2,057 ± 598 from 2004 (Kilian & Kolberg, 2004).
It is technically very difficult to count the widely scattered elephant population in the Kunene Region, which includes the ‘desert elephants’ in the dry, western extremity of the range and there has been controversy about the numbers in this area. A combined sample block count and aerial total count was carried out by helicopter in 2011, giving an estimate of 314 ± 154 (MET, 2012). This replaces an estimate of 210 ± 157 from a 2005 survey (Ministry of Environment and Tourism, 2005). It should be noted that the count did not include the extreme northern part of the range around Opuwo, nor the farms to the south of Etosha. There has been some range expansion to both the south and north, with elephants now being resident in the Ugab river basin and about ten elephants resident in the northern Etanga area (Owen-Smith, pers. comm., 2014). The area of known range has been changed, and the Etanga group is shown as a point record on the map. The Kunene population appears to have been increasing in numbers and range, despite evidence that the ‘desert elephant’ sub-population in the Houanib and Houarusib dry riverbeds reduced from 42 to 31 between 2002 and 2015 (Ramey & Brown, 2015).
There are occasional sightings of elephants in livestock ranching areas to the south of their normal range in the area north and east of Windhoek. These are shown as point records on the range map (Hartman, 2014; The Namibian, 2014).
S O U T H E R N A F R I C A ― N A M I B I A
NA
MIB
IA
N U M B E R S A N D D I S T R I B U T I O N
C O N T .
A F R I C A N E L E P H A N T S T A T U S R E P O R T 2 0 1 6

172
NA
MIB
IA
S O U T H E R N A F R I C A ― N A M I B I A
S U M M A R Y T O TA L S
I N T E R P R E TAT I O N O F C H A N G E S I N E S T I M AT E S F R O M P R E V I O U S R E P O R T
A R E A O F R A N G E C O V E R E D B Y E A C H DATA C AT E G O R Y
S U R V E Y C A T E G O R Y E S T I M A T E S F R O M S U R V E Y S
E S T I M A T E F R O M± 9 5 % C L T O P E R C E N T ( % ) A R E A ( km² )
G U E S S E S K N O W N A N D P O S S I B L E R A N G E
Aerial Sample Counts
Informed Guesses
Totals 2015
Totals 2006
Assessed Range
Unassessed Range
Total Range
22,754
0
22,754
15,807
4,306
—
4,305
3,276
—
90
90
20
—
90
90
20
42 %
10 %
52 %
48 %
100 %
68,121
16,162
84,283
79,786
164,069
R E A S O N F O R C H A N G E E S T I M A T E S F R O M S U R V E Y S
E S T I M A T E F R O M± 9 5 % C L T O P E R C E N T ( % ) A R E A ( km² )
G U E S S E S K N O W N A N D P O S S I B L E R A N G E
Repeat Survey
New Guess
Totals
+6,947
0
+6,947
±5,410
0
±5,410
0
+70
+70
0
+70
+70
50 %
2 %
52 %
81,727
2,556
84,283
D A T A C A T E G O R Y K N O W N R A N G E ( km²) P O S S I B L E R A N G E ( km²) T O T A L R A N G E ( km²)
Direct Sample and Reliable Dung
Informed Guesses
Unassessed Range
Totals
65,438
15,903
31,130
112,471
2,683
259
48,655
51,598
68,121
16,162
79,786
164,069
A F R I C A N E L E P H A N T S T A T U S R E P O R T 2 0 1 6

173
NA
MIB
IA
S O U T H E R N A F R I C A ― N A M I B I A
E L E P H A N T E S T I M AT E S
19.0˚S
19.3˚S
20.0˚S
18.6˚S
19.3˚S
17.9˚S
15.8˚E
20.7˚E
14.1˚E
18.5˚E
20.7˚E
23.5˚E
18,549
5,843
40,887
2,558
7,001
17,473
2015
2015
2011
2015
2015
2015
B
B
B
D
B
B
AS
AS
AS
O
AS
AS
1
2
1
2
2
1
RS
RS
RS
NG
RS
RS
Etosha National Park
Khaudum-Kavango
Kunene
Mangetti Area
Nyae Nyae Conservancy
Zambezi Region
637
1,864
154
1,729
3,413
2,911
4,149
314
90
2,264
13,116
M A P L O C A T I O NA R E AS U R V E Y D E T A I L S P F S
L A T .L O N .( km²)Y E A RR E L I A B .T Y P E
REASON
FOR
CHANGE
I N P U T Z O N E S O U R C E# O F E L E P H A N T S
± 9 5% C LE S T I M AT E
Kilian, 2015
MET, 2012
Gibson & Craig, 2015b
Lindeque, pers. comm., 2016
Gibson & Craig, 2015b
Gibson & Craig, 2015a
* R A N G E O F I N F O R M E D G U E S S
A F R I C A N E L E P H A N T S T A T U S R E P O R T 2 0 1 6
DA: Different Area; DD: Data Degraded; DT: Different Technique; NA: New Analysis;
NG: New Guess; NP: New population; PL: Population Lost; RS: Repeat Survey (RS
denotes a repeat survey that is not statistically comparable for reasons such as
different season);
― : No Change
AS: Aerial Sample Count; AT: Aerial Total Count; DC: Dung Count; GD: Genetic
Dung Count; GS: Ground Sample Count; GT: Ground Total Count; IG: Informed
Guess; IR: Individual Registration; OG: Other Guess. Survey Reliability is keyed A-E
(best to worst).
Priority for Future Surveys (PFS) is ranked from 1 to 5 (highest to lowest). Based
on the precision of estimates and the proportion of national range accounted
for by the site in question, PFS is a measure of the importance and urgency for
future population surveys. All areas of unassessed range have a priority of 1. See
Introduction for details on how the PFS is derived.
1 K E Y T O R E A S O N S F O R C H A N G E
2 K E Y T O S U R V E Y R E P O R T
3 P F S

A F R I C A N E L E P H A N T S T A T U S R E P O R T 2 0 1 6 S O U T H E R N A F R I C A ― N A M I B I A
Zam
beze
Zam
beze
Zambezi
Zambezi
Orang
eOra
nge
Vaal
Vaal
Cubango
Cubango
Okavango
Okavango
Cuanza
Cuanza
CuandoCuando
HuamboHuambo
MalengueMalengue
TsumebTsumeb
OtjiwarongoOtjiwarongo
SwakopmundSwakopmund
LuderitzLuderitzKeetmanshoopKeetmanshoop
GhanziGhanzi
MaunMaun
MonguMongu
KasaneKasane
LubangoLubangoNamibeNamibe
BenguelaBenguela
WI N DHOEK
SO U TH AF R ICA
Z AM BIA
NAM I BIA BOT SWANA
ANG OL A
0 90 180 270 360 450 540 km
30°S 30°S
29°S 29°S
28°S 28°S
27°S 27°S
26°S 26°S
25°S 25°S
24°S 24°S
23°S 23°S
22°S 22°S
21°S 21°S
20°S 20°S
19°S 19°S
18°S 18°S
17°S 17°S
16°S 16°S
15°S 15°S
14°S 14°S
13°S 13°S
12°S 12°S
12°E
12°E
13°E
13°E
14°E
14°E
15°E
15°E
16°E
16°E
17°E
17°E
18°E
18°E
19°E
19°E
20°E
20°E
21°E
21°E
22°E
22°E
23°E
23°E
24°E
24°E
25°E
25°E
Etosha NP
ZambeziRegion
Kunene
Mangetti Area
Khaudum-Kavango
Nyae NyaeConservancy
Bongola
Southeast Angola
Ghanzi District
NorthernBotswana
Kafue GMA
Kafue NP
SiomaNgwezi NP
WestLunga NP
Bwabwata NPMudumo NP
Mamili NP
Chobe NP
National WestCoast Tourist
RA
SkeletonCoast NP
KhaudumNP
MangettiNP
Bikuar NP
Mupa NP
Mucusso GR Luiana NP
Mavinga PartialReserve
Iona NP
Moçâmedes PartialReserve
Bufalo PRChimalavera RNP
Khutse GR
Central Kalahari GR
MakgadikgadiNP
Nxai Pan NP
Moremi GR
Namibia
Int'l Boundaries
Rivers & Lakes
Towns
Protected Areas
Input Zones
Known
Possible
Doubtful
Sighting
E L E P H A N T R A N G E0 9 0 1 8 0 2 7 0 3 6 0 4 5 0 5 4 0 k m
See Appendix III for map abbreviations and acronyms.
© 2016 African Elephant Specialist Group
A B B R E V I AT I O N S A N D A C R O N Y M S
174

175
Apart from the large population of elephants in the Kruger National Park, most of South Africa’s elephant populations exist in relatively small fenced areas (Department of Environmental Affairs and Tourism, 2008), many of which are privately owned. In some places, local elephant overabun-dance has led to adverse impacts on other biodiversity and a number of management approaches have been undertaken. These include the use of immuno-contraception to control reproduction (Delsink et al., 2013).
Until 2008, there was little elephant poaching in South Africa. However this has recently changed, with increased poaching for ivory, particularly in Kruger National Park (AFP, 2014).
South Africa published a set of Norms and Standards for Managing African Elephants in 2008 (Department of Environmental Affairs and Tourism, 2008) and these were under review in 2014 (Department of Environmental Affairs, 2014).
In 2008, South Africa undertook an approved one-off sale of 47,346 kg of ivory to Japan and China, at a price of USD $6,702,695 (Wijnstekers, 2011). Trophy hunting of elephants is legal in South Afri-ca, and from 2007 to 2015, the declared annual quota increased from 200 tusks as hunting trophies (from 100 animals) to 300 (CITES, n.d.-b).
In recent analyses of seizure data in ETIS, prepared for CITES, South Africa has been identified as a country with a worrying involvement in illegal ivory trade (Milliken et al., 2013, 2016).
C U R R E N T I S S U E S
South Africa
S O U T H E R N A F R I C A ― S O U T H A F R I C A
SO
UT
H A
FR
ICA
C O U N T R Y
E S T I M A T E D T O T A L E L E P H A N T S G E N E R A L S T A T I S T I C S
G U E S S E S
Country Area
Range Area
Protected Range
Information Quality Index (IQI)
CITES Appendix
Listing Year
2,345,410 km²
30,651 km² (3%)
93 %
0.64
II
2000
18,841 ± 0
8,425 - 8,435
A F R I C A N E L E P H A N T S T A T U S R E P O R T 2 0 1 6
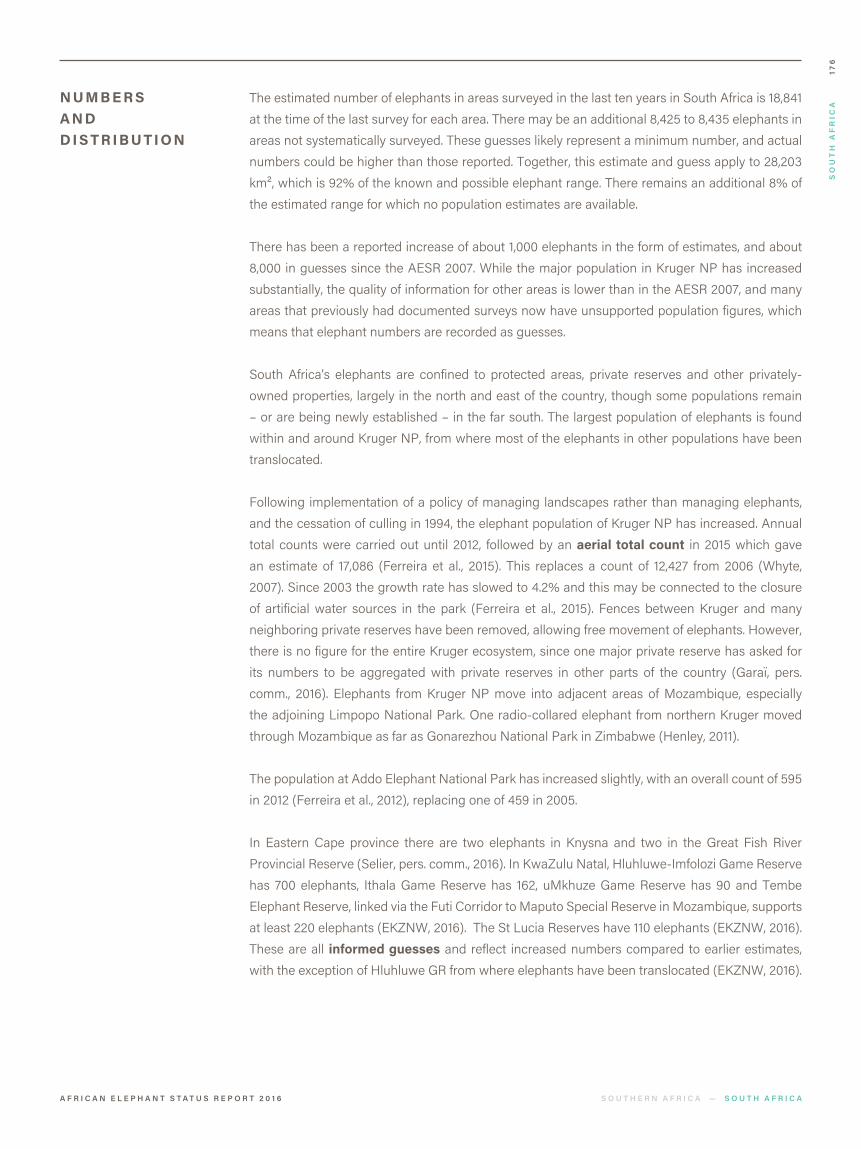
176
The estimated number of elephants in areas surveyed in the last ten years in South Africa is 18,841 at the time of the last survey for each area. There may be an additional 8,425 to 8,435 elephants in areas not systematically surveyed. These guesses likely represent a minimum number, and actual numbers could be higher than those reported. Together, this estimate and guess apply to 28,203 km², which is 92% of the known and possible elephant range. There remains an additional 8% of the estimated range for which no population estimates are available.
There has been a reported increase of about 1,000 elephants in the form of estimates, and about 8,000 in guesses since the AESR 2007. While the major population in Kruger NP has increased substantially, the quality of information for other areas is lower than in the AESR 2007, and many areas that previously had documented surveys now have unsupported population figures, which means that elephant numbers are recorded as guesses.
South Africa’s elephants are confined to protected areas, private reserves and other privately-owned properties, largely in the north and east of the country, though some populations remain – or are being newly established – in the far south. The largest population of elephants is found within and around Kruger NP, from where most of the elephants in other populations have been translocated.
Following implementation of a policy of managing landscapes rather than managing elephants, and the cessation of culling in 1994, the elephant population of Kruger NP has increased. Annual total counts were carried out until 2012, followed by an aerial total count in 2015 which gave an estimate of 17,086 (Ferreira et al., 2015). This replaces a count of 12,427 from 2006 (Whyte, 2007). Since 2003 the growth rate has slowed to 4.2% and this may be connected to the closure of artificial water sources in the park (Ferreira et al., 2015). Fences between Kruger and many neighboring private reserves have been removed, allowing free movement of elephants. However, there is no figure for the entire Kruger ecosystem, since one major private reserve has asked for its numbers to be aggregated with private reserves in other parts of the country (Garaï, pers. comm., 2016). Elephants from Kruger NP move into adjacent areas of Mozambique, especially the adjoining Limpopo National Park. One radio-collared elephant from northern Kruger moved through Mozambique as far as Gonarezhou National Park in Zimbabwe (Henley, 2011).
The population at Addo Elephant National Park has increased slightly, with an overall count of 595 in 2012 (Ferreira et al., 2012), replacing one of 459 in 2005.
In Eastern Cape province there are two elephants in Knysna and two in the Great Fish River Provincial Reserve (Selier, pers. comm., 2016). In KwaZulu Natal, Hluhluwe-Imfolozi Game Reserve has 700 elephants, Ithala Game Reserve has 162, uMkhuze Game Reserve has 90 and Tembe Elephant Reserve, linked via the Futi Corridor to Maputo Special Reserve in Mozambique, supports at least 220 elephants (EKZNW, 2016). The St Lucia Reserves have 110 elephants (EKZNW, 2016). These are all informed guesses and reflect increased numbers compared to earlier estimates, with the exception of Hluhluwe GR from where elephants have been translocated (EKZNW, 2016).
N U M B E R S A N D D I S T R I B U T I O N
S O U T H E R N A F R I C A ― S O U T H A F R I C A
SO
UT
H A
FR
ICA
A F R I C A N E L E P H A N T S T A T U S R E P O R T 2 0 1 6

177
In Mpumalanga Province, there are 57 elephants in the Mthetomusha Provincial Reserve and 105 in Songimvelo Game Reserve (Garaï, pers. comm., 2016); these are both informed guesses and represent increases on previous estimates.
In North West Province both Madikwe Provincial Nature Reserve (1,006 elephants) and Pilanesberg Provincial Nature Reserve (240 elephants) show increases based on informed guesses (Garaï, pers. comm., 2016). In Limpopo Province informed guesses indicate that Atherstone Provincial Nature Reserve holds 105 elephants, Letaba Provincial Nature Reserve 621, Makuya Provincial Nature Reserve nine (Garaï, pers. comm., 2016), and Manyeleti Game Reserve 222 (SANParks, 2009). Marakele National Park has 171 elephants (Ferreira et al., 2012).
As part of a total count survey of the Greater Mapungubwe Transfrontier Conservation Area (Selier & Page, 2015), 347 elephants were counted in Mapungubwe National Park and three in the surrounding area.
Information on elephants in private reserves and other privately-owned elephant properties has been obtained from the Elephant Management and Owners Association (Garaï, pers. comm., 2016). At the request of their owners, some private reserves are grouped under one overall estimate and are not shown on the map. This guess totals 2,482 elephants. Other private nature reserves for which numbers are available are Maremani (64), Kwandwe (57), Kariega (41) and Balule, Timbavati, Umbabat and Klaserie combined (2,772).
S O U T H E R N A F R I C A ― S O U T H A F R I C A
SO
UT
H A
FR
ICA
N U M B E R S A N D D I S T R I B U T I O N
C O N T .
A F R I C A N E L E P H A N T S T A T U S R E P O R T 2 0 1 6

178
SO
UT
H A
FR
ICA
S O U T H E R N A F R I C A ― S O U T H A F R I C A
S U M M A R Y T O TA L S
I N T E R P R E TAT I O N O F C H A N G E S I N E S T I M AT E S F R O M P R E V I O U S R E P O R T
A R E A O F R A N G E C O V E R E D B Y E A C H DATA C AT E G O R Y
S U R V E Y C A T E G O R Y E S T I M A T E S F R O M S U R V E Y S
E S T I M A T E F R O M± 9 5 % C L T O P E R C E N T ( % ) A R E A ( km² )
G U E S S E S K N O W N A N D P O S S I B L E R A N G E
Aerial Total Counts
Informed Guesses
Other Guesses
Totals 2015
Totals 2006
Assessed Range
Unassessed Range
Total Range
18,421
420
—
18,841
17,847
—
—
—
0
0
—
8,423
2
8,425
638
—
8,433
2
8,435
660
67 %
25 %
0 %
92 %
8 %
100 %
20,563
7,515
125
28,203
2,448
30,651
R E A S O N F O R C H A N G E E S T I M A T E S F R O M S U R V E Y S
E S T I M A T E F R O M± 9 5 % C L T O P E R C E N T ( % ) A R E A ( km² )
G U E S S E S K N O W N A N D P O S S I B L E R A N G E
Repeat Survey
New Population
Different Technique
Different Area
New Guess
Totals
+4,810
0
+231
+286
-4,333
+994
0
0
0
0
0
0
0
+64
+162
0
+7,561
+7,787
0
+64
+172
0
+7,539
+7,775
63 %
0 %
10 %
1 %
18 %
92 %
19,184
0
3,121
247
5,651
28,203
D A T A C A T E G O R Y K N O W N R A N G E ( km²) P O S S I B L E R A N G E ( km²) T O T A L R A N G E ( km²)
Aerial or Ground Total Counts
Informed Guesses
Other Guesses
Unassessed Range
Totals
20,563
7,515
125
2,448
30,651
0
0
0
0
0
20,563
7,515
125
2,448
30,651
A F R I C A N E L E P H A N T S T A T U S R E P O R T 2 0 1 6

179
SO
UT
H A
FR
ICA
S O U T H E R N A F R I C A ― S O U T H A F R I C A
E L E P H A N T E S T I M AT E S
24.5˚S
24.8˚S
24.4˚S
25.2˚S
33.3˚S
33.1˚S
33.5˚S
34.0˚S
33.1˚S
24.2˚S
24.3˚S
23.7˚S
22.6˚S
24.1˚S
22.4˚S
25.5˚S
26.0˚S
22.2˚S
28.3˚S
27.5˚S
27.9˚S
26.9˚S
27.7˚S
29.1˚S
26.8˚E
26.3˚E
27.7˚E
27.1˚E
25.5˚E
26.8˚E
26.7˚E
23.0˚E
26.6˚E
31.2˚E
31.5˚E
31.1˚E
30.9˚E
31.2˚E
30.2˚E
31.3˚E
31.0˚E
29.3˚E
31.9˚E
31.3˚E
32.5˚E
32.5˚E
32.3.˚E
24.6.˚E
240
605
380
491
1,250
450
190
126
158
1,666
19,073
420
165
228
400
72
490
279
965
297
539
285
380
2015
2015
2012
2015
2012
2015
2015
2015
2015
2015
2015
2015
2015
2009
2015
2015
2015
2014
2015
2015
2015
2015
2015
2015
D
D
A
D
A
D
D
E
D
D
A
D
D
A
D
D
D
A
D
D
D
D
D
D
O
O
AT
O
AT
O
O
O
O
O
AT
O
O
AT
O
O
O
AT
O
O
O
O
O
O
2
2
2
2
2
2
2
2
3
1
1
2
2
2
2
3
2
2
2
2
2
2
2
3
NG
NG
DT
NG
DT
NG
NG
NG
NG
NG
RS
NG
NG
RS
NP
NG
NG
DA
NG
DT
DT
DT
NG
NG
Central Highveld Populations
Atherstone Provincial Nature Reserve
Madikwe Provincial Reserve
Marakele National Park
Pilanesberg Provincial Reserve
Eastern Cape Populations
Addo Elephant National Park
Great Fish River Provincial Reserve
Kariega Private Game Reserve
Knysna Forest
Kwandwe Private Game Reserve
Eastern Lowveld Populations
Balule, Timbavati Umbabat and Klaserie
Kruger National Park
Letaba Provincial Nature Reserve
Makuya National Park
Manyeleti Game Reserve
Maremani
Mthetomusha Provincial Reserve
Songimvelo Game Reserve
Greater Mapungubwe Ecosystem
Mapungubwe Ecosystem
KwaZulu-Natal Populations
Hluhluwe Imfolozi Game Reserve
Ithala Game Reserve
St. Lucia Reserves
Tembe Elephant Park
uMkhuze Game Reserve
Other Private Reserves
Other Private Reserves
10*
105
1,006
171
240
595
2
41
2
57
2,772
17,086
621
9
222
64
57
105
347
700
162
110
220
90
2,482
M A P L O C A T I O NA R E AS U R V E Y D E T A I L S P F S
L A T .L O N .( km²)Y E A RR E L I A B .T Y P E
REASON
FOR
CHANGE
I N P U T Z O N E S O U R C E# O F E L E P H A N T S
± 9 5% C LE S T I M AT E
Garaï, pers. comm., 2016
Garaï, pers. comm., 2016
Ferreira et al., 2012
Garaï, pers. comm., 2016
Ferreira et al., 2012
Selier, pers. comm., 2016
Selier, pers. comm., 2016
Selier, pers. comm., 2016
Selier, pers. comm., 2016
Garaï, pers. comm., 2016
Ferreira et al., 2015
Garaï, pers. comm., 2016
Garaï, pers. comm., 2016
SANParks, 2009
Garaï, pers. comm., 2016
Garaï, pers. comm., 2016
Garaï, pers. comm., 2016
Selier & Page, 2015
EKZNW, 2016
EKZNW, 2016
EKZNW, 2016
EKZNW, 2016
EKZNW, 2016
Garaï, pers. comm., 2016
A F R I C A N E L E P H A N T S T A T U S R E P O R T 2 0 1 6

A F R I C A N E L E P H A N T S T A T U S R E P O R T 2 0 1 6 S O U T H E R N A F R I C A ― S O U T H A F R I C A
Cubango
Cubango
KafueKafueL. Cabora BassaL. Cabora Bassa
SabiSabi
Limpopo
Limpopo
Olif
ants
Olif
ants
Ingomati
Ingomati
VaalVaal
Orange
Orange
OtjiwarongoOtjiwarongo
TsumebTsumeb
MonguMongu
KaribaKariba
BulawayoBulawayo
MutareMutare
PietersburgPietersburg
JohannesburgJohannesburg
DurbanDurban
BloemfonteinBloemfontein
Port ElizabethPort Elizabeth
Cape TownCape Town
KeetmanshoopKeetmanshoop
LobatseLobatse
KubutaKubuta
SitekiSiteki
FrancistownFrancistown
MaunMaun
GhanziGhanzi
KasaneKasane
Victoria FallsVictoria Falls
LivingstoneLivingstone
LavumisaLavumisa
WI N DHOEK
LUS AKA
HAR AR E
G ABORON E
PR E TOR IA( T SHWAN E )
M B AB AN E
MAPU TO
BOT SWANA
Z I M B ABWE
ANG OL AZ AM BIA
MOZ AM BIQ U E
LE SOTHO
SO U TH AF R ICA
NAM I BIA
SWA Z I L AN D
0 100 200 300 400 500 600 km
37°S 37°S
36°S 36°S
35°S 35°S
34°S 34°S
33°S 33°S
32°S 32°S
31°S 31°S
30°S 30°S
29°S 29°S
28°S 28°S
27°S 27°S
26°S 26°S
25°S 25°S
24°S 24°S
23°S 23°S
22°S 22°S
21°S 21°S
20°S 20°S
19°S 19°S
18°S 18°S
17°S 17°S
16°S 16°S
15°S 15°S
16°E
16°E
17°E
17°E
18°E
18°E
19°E
19°E
20°E
20°E
21°E
21°E
22°E
22°E
23°E
23°E
24°E
24°E
25°E
25°E
26°E
26°E
27°E
27°E
28°E
28°E
29°E
29°E
30°E
30°E
31°E
31°E
32°E
32°E
33°E
33°E
Addo Elephant NP
Knysna Forest
Great FishRiver RC
KwandwePGR
Kariega PGR
AtherstonePNR
Madikwe PR
PilanesbergPR
Balule,TimbavatiUmbabat
& Klaserie
Mthetomusha PR
Songimvelo GR
Kruger NP
MapungubweEcosystem
Marakele NP
Maremani
Makuya NP
Letaba PGR
ManyeletiGR
Hluhluwe-Imfolozi
Park
St. LuciaReserves
Ithala GRMkuzi GR
Tembe EP
Other PR
Mangetti GR
Khaudum-Kvango
Nyae NyaeConservancy
Etosha NP
ZambeziRegion
HlaneRoyal
NP
Ghanzi District
NorthernBotswana
Tuli GR
Bongola
KafueGMAs
KafueNP
Lower ZambeziGMAs
WestZambezi
Sioma Ngwezi
NP
Mosi-oa-Tunya NP
Chegutu SA
Binga CLsNorth
GwokeCLs
Rest of Zambezi
ValleyMavuradonha
WA NyatanaWMA
SaveValleyChiredzi
RiverBubianaBubyeValley
Tuli, Maramani,Sentinel, Nottingham
Banhine NP
MaputER
PongolapoortNRiSimangalisoWetland Park
PhalaborwaMining Co. PR
Sabi Sand GR
WelgevondenPGR
MarakeleConcession
KhaudomGP
Bwabwata NPMudumo NP
Mamili NP
CentralKalahari GR
MakgadikgadiNP
Nxai Pan NP
Moremi GR
Chobe NP
MucussoGR
LuianaNP
Mavinga PR
UmfuliRP
ManjirenjiRP
Zinave NP
South Africa
Int'l Boundaries
Rivers & Lakes
Towns
Protected Areas
Input Zones
Known
Possible
Doubtful
Sighting
E L E P H A N T R A N G E0 1 0 0 2 0 0 3 0 0 4 0 0 5 0 0 6 0 0 k m
See Appendix III for map abbreviations and acronyms.
© 2016 African Elephant Specialist Group
A B B R E V I AT I O N S A N D A C R O N Y M S
180

181
Swaziland has only two small fenced populations of elephants and concerns have been raised about their impact on the biodiversity of these areas. In 2016, the U.S. Fish and Wildlife Service approved an application to import 18 African elephants from Swaziland to three zoos in the United States. In March 2016 the elephants were flown to the US despite a pending legal challenge to block the importation (Peters, 2016).
There is no current or past action plan or strategy for the management of African elephants in Swaziland.
The estimated number of elephants in areas surveyed in the last ten years in Swaziland is 42 at the time of the last survey for each area. This number applies to 50 km², which is 100% of the estimated known and possible elephant range in Swaziland.
Elephant distribution is well known in Swaziland, being mainly restricted to fenced enclosures within Hlane Royal National Park and Mkhaya Game Reserve. The enclosures only occupy a fraction of the reserves (6% and 19% respectively). Individual registration of all elephants is maintained for the Hlane Royal NP and Mkhaya GR populations. There were 25 elephants in Hlane in 2015 compared to 13 in 2005, and 14 in Mkhaya in 2015 compared to 15 in 2005 (Reilly, pers. comm., 2016).
C U R R E N T I S S U E S
Swaziland
S O U T H E R N A F R I C A ― S W A Z I L A N D
SW
AZ
ILA
ND
C O U N T R Y
N U M B E R S A N D D I S T R I B U T I O N
E S T I M A T E D T O T A L E L E P H A N T S G E N E R A L S T A T I S T I C S
G U E S S E S
Country Area
Range Area
Protected Range
Information Quality Index (IQI)
CITES Appendix
Listing Year
17,360 km²
50 km² (0%)
80 %
0
I
1997 (year of accession)
42 ± 0
0 - 0
A F R I C A N E L E P H A N T S T A T U S R E P O R T 2 0 1 6

182
Three elephants originating from the Songimvelo Game Reserve in South Africa are regularly seen in the Mololotja Nature Reserve in north-western Swaziland (Reilly, pers. comm., 2012). During 2014, two elephants, a cow and a sub-adult crossed from Mozambique into Swaziland at Lomahasha. Over a period of three days they traveled across Hlane Royal NP and west to the escarpment, west of eBuhleni, traversing communal areas. They then returned along a similar route, crossing Hlane Royal NP and Mlawula Nature Reserve, returning to Mozambique via the Umbuluzi river gorge (Reilly, pers. comm., 2016).
SW
AZ
ILA
ND
S U M M A R Y T O TA L S
I N T E R P R E TAT I O N O F C H A N G E S I N E S T I M AT E S F R O M P R E V I O U S R E P O R T
A R E A O F R A N G E C O V E R E D B Y E A C H DATA C AT E G O R Y
S U R V E Y C A T E G O R Y E S T I M A T E S F R O M S U R V E Y S
E S T I M A T E F R O M± 9 5 % C L T O P E R C E N T ( % ) A R E A ( km² )
G U E S S E S K N O W N A N D P O S S I B L E R A N G E
Individual Registrations
Informed Guesses
Totals 2015
Totals 2006
Assessed Range
Unassessed Range
Total Range
39
3
42
31
—
—
0
0
—
0
0
0
—
0
0
0
45 %
55 %
100 %
0 %
100 %
22
28
50
0
50
R E A S O N F O R C H A N G E E S T I M A T E S F R O M S U R V E Y S
E S T I M A T E F R O M± 9 5 % C L T O P E R C E N T ( % ) A R E A ( km² )
G U E S S E S K N O W N A N D P O S S I B L E R A N G E
Repeat Survey
New Guess
Totals
+11
0
+11
0
0
0
0
0
0
0
0
0
45 %
55 %
100 %
22
28
50
D A T A C A T E G O R Y K N O W N R A N G E ( km²) P O S S I B L E R A N G E ( km²) T O T A L R A N G E ( km²)
Aerial or Ground Total Counts
Informed Guesses
Unassessed Range
Totals
22
28
0
50
0
0
0
0
22
28
0
50
S O U T H E R N A F R I C A ― S W A Z I L A N DA F R I C A N E L E P H A N T S T A T U S R E P O R T 2 0 1 6

183
SW
AZ
ILA
ND
E L E P H A N T E S T I M AT E S
26.3˚S
26.1˚S
26.6˚S
31.9˚E
31.1˚E
31.7˚E
142
28
65
2015
2012
2015
A
D
A
IR
O
IR
1
1
1
RS
NG
RS
Hlane Royal National Park
Malolotja Nature Reserve
Mkhaya Nature Reserve
25
3
14
M A P L O C A T I O NA R E AS U R V E Y D E T A I L S P F S
L A T .L O N .( km²)Y E A RR E L I A B .T Y P E
REASON
FOR
CHANGE
I N P U T Z O N E S O U R C E# O F E L E P H A N T S
± 9 5% C LE S T I M AT E
Reilly, pers. comm., 2016
Reilly, pers. comm., 2012
Reilly, pers. comm., 2016
* R A N G E O F I N F O R M E D G U E S S
S O U T H E R N A F R I C A ― S W A Z I L A N DA F R I C A N E L E P H A N T S T A T U S R E P O R T 2 0 1 6
DA: Different Area; DD: Data Degraded; DT: Different Technique; NA: New Analysis;
NG: New Guess; NP: New population; PL: Population Lost; RS: Repeat Survey (RS
denotes a repeat survey that is not statistically comparable for reasons such as
different season);
― : No Change
AS: Aerial Sample Count; AT: Aerial Total Count; DC: Dung Count; GD: Genetic
Dung Count; GS: Ground Sample Count; GT: Ground Total Count; IG: Informed
Guess; IR: Individual Registration; OG: Other Guess. Survey Reliability is keyed A-E
(best to worst).
Priority for Future Surveys (PFS) is ranked from 1 to 5 (highest to lowest). Based
on the precision of estimates and the proportion of national range accounted
for by the site in question, PFS is a measure of the importance and urgency for
future population surveys. All areas of unassessed range have a priority of 1. See
Introduction for details on how the PFS is derived.
1 K E Y T O R E A S O N S F O R C H A N G E
2 K E Y T O S U R V E Y R E P O R T
3 P F S

A F R I C A N E L E P H A N T S T A T U S R E P O R T 2 0 1 6 S O U T H E R N A F R I C A ― S W A Z I L A N D
Kom
ati
Kom
ati
Ingomati
Ingomati
ManziniManzini
KubutaKubuta
MalomaMaloma
LavumisaLavumisa
SitekiSiteki
M B AB AN E
S WA Z I L A N D
SO U TH AF R ICA
MOZ AM BIQ U E
0 10 20 30 40 50 60 km
27°S 27°S
26°S 26°S
31°E
31°E
32°E
32°E
Hlane Royal NP
Mkhaya NR
Malolotja NR
Rest ofMozambique
Songimvelo GR
Ithala GR
uMkhuze GR
Pongolapoort NR
Swaziland
Int'l Boundaries
Rivers & Lakes
Towns
Protected Areas
Input Zones
Known
Possible
Doubtful
Sighting
E L E P H A N T R A N G E0 1 0 2 0 3 0 4 0 5 0 6 0 k m
See Appendix III for map abbreviations and acronyms.
© 2016 African Elephant Specialist Group
A B B R E V I AT I O N S A N D A C R O N Y M S
184

185
Zambia has a number of large protected areas, and much of the country is covered by game man-agement areas. However, wildlife densities are generally low. Elephant populations were badly affected by poaching in the late 1970s and poaching for ivory continues to be a problem (Nyirenda et al., 2015). The large size of the national parks and particularly of the game management areas makes it difficult to manage them effectively with limited resources (Lindsey et al., 2014).
The Bangweulu Wetlands are being co-managed by the African Parks Network and North Luang-wa National Park is being co-managed by the Frankfurt Zoological Society.
The Zambia Wildlife Act (1998), which established the parastatal Zambia Wildlife Authority, was repealed by the Zambia Wildlife Act (2015), which placed responsibility for wildlife management under the National Parks and Wildlife Department. Zambia published a national policy and action plan for elephant management in 2003 (Ministry of Tourism, 2003).
Trophy hunting of elephants is legal in Zambia. From 2007 to 2012, Zambia increased its annual export quota of elephant hunting trophies from 40 (tusks and other hunting trophies from 20 animals) to 160 (tusks and other trophies from 80 animals) (CITES, n.d.-b). Zambia declared a temporary suspension of elephant hunting in 2013, and the quota declared to CITES in 2013 and 2014 was zero. There appears to be some confusion about whether the suspension had been lifted in late 2014 (Kunda, 2014). The declared quota to CITES for 2015 and 2016 was 160 (CITES, n.d.-b).
C U R R E N T I S S U E S
Zambia
S O U T H E R N A F R I C A ― Z A M B I A
ZA
MB
IA
C O U N T R Y
E S T I M A T E D T O T A L E L E P H A N T S G E N E R A L S T A T I S T I C S
G U E S S E S
Country Area
Range Area
Protected Range
Information Quality Index (IQI)
CITES Appendix
Listing Year
752,610 km²
170,466 km² (23%)
27%
0.50
I
1990
21,967 ± 4,703
214 - 314
A F R I C A N E L E P H A N T S T A T U S R E P O R T 2 0 1 6
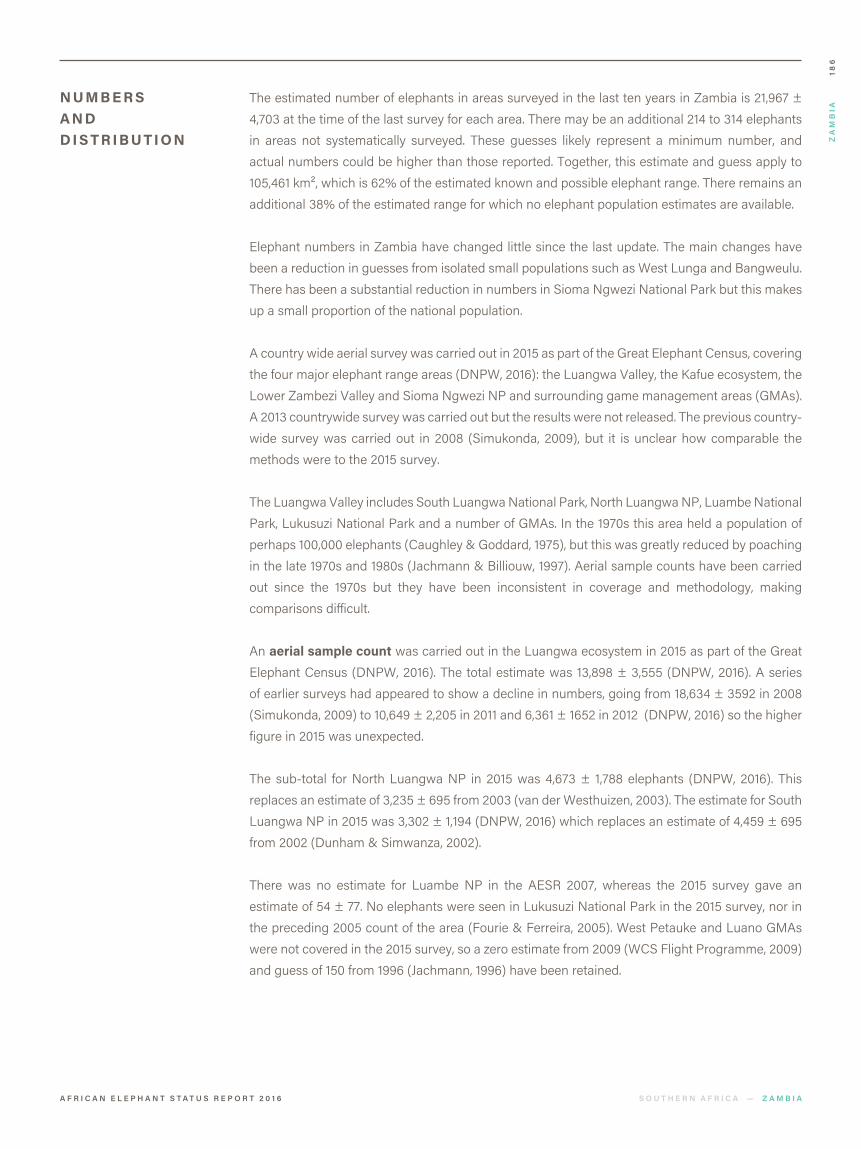
186
The estimated number of elephants in areas surveyed in the last ten years in Zambia is 21,967 ± 4,703 at the time of the last survey for each area. There may be an additional 214 to 314 elephants in areas not systematically surveyed. These guesses likely represent a minimum number, and actual numbers could be higher than those reported. Together, this estimate and guess apply to 105,461 km², which is 62% of the estimated known and possible elephant range. There remains an additional 38% of the estimated range for which no elephant population estimates are available.
Elephant numbers in Zambia have changed little since the last update. The main changes have been a reduction in guesses from isolated small populations such as West Lunga and Bangweulu. There has been a substantial reduction in numbers in Sioma Ngwezi National Park but this makes up a small proportion of the national population.
A country wide aerial survey was carried out in 2015 as part of the Great Elephant Census, covering the four major elephant range areas (DNPW, 2016): the Luangwa Valley, the Kafue ecosystem, the Lower Zambezi Valley and Sioma Ngwezi NP and surrounding game management areas (GMAs). A 2013 countrywide survey was carried out but the results were not released. The previous country-wide survey was carried out in 2008 (Simukonda, 2009), but it is unclear how comparable the methods were to the 2015 survey.
The Luangwa Valley includes South Luangwa National Park, North Luangwa NP, Luambe National Park, Lukusuzi National Park and a number of GMAs. In the 1970s this area held a population of perhaps 100,000 elephants (Caughley & Goddard, 1975), but this was greatly reduced by poaching in the late 1970s and 1980s (Jachmann & Billiouw, 1997). Aerial sample counts have been carried out since the 1970s but they have been inconsistent in coverage and methodology, making comparisons difficult.
An aerial sample count was carried out in the Luangwa ecosystem in 2015 as part of the Great Elephant Census (DNPW, 2016). The total estimate was 13,898 ± 3,555 (DNPW, 2016). A series of earlier surveys had appeared to show a decline in numbers, going from 18,634 ± 3592 in 2008 (Simukonda, 2009) to 10,649 ± 2,205 in 2011 and 6,361 ± 1652 in 2012 (DNPW, 2016) so the higher figure in 2015 was unexpected.
The sub-total for North Luangwa NP in 2015 was 4,673 ± 1,788 elephants (DNPW, 2016). This replaces an estimate of 3,235 ± 695 from 2003 (van der Westhuizen, 2003). The estimate for South Luangwa NP in 2015 was 3,302 ± 1,194 (DNPW, 2016) which replaces an estimate of 4,459 ± 695 from 2002 (Dunham & Simwanza, 2002).
There was no estimate for Luambe NP in the AESR 2007, whereas the 2015 survey gave an estimate of 54 ± 77. No elephants were seen in Lukusuzi National Park in the 2015 survey, nor in the preceding 2005 count of the area (Fourie & Ferreira, 2005). West Petauke and Luano GMAs were not covered in the 2015 survey, so a zero estimate from 2009 (WCS Flight Programme, 2009) and guess of 150 from 1996 (Jachmann, 1996) have been retained.
N U M B E R S A N D D I S T R I B U T I O N
S O U T H E R N A F R I C A ― Z A M B I A
ZA
MB
IA
A F R I C A N E L E P H A N T S T A T U S R E P O R T 2 0 1 6

187
Some changes have been made to the range map for the Luangwa ecosystem on the basis of these surveys. The southern GMA of West Petauke has been changed from known range to possible range as has much of the eastern part of the ecosystem.
Kafue National Park and adjoining GMAs hold the country’s second largest elephant population. The 2015 aerial sample count gave an estimate of 6,689 ± 1,418 (4,813 ± 2,265 in the NP and 1,876 ± 2,064 in the surrounding GMAs (DNPW, 2016). These replace a 2004 estimate of 6,306 ± 5,227 in the park only (Simwanza, 2004). The carcass ratio for Kafue NP was only 1% in 2008 and increased to 7% by 2015 (DNPW, 2016) giving some cause for concern, despite the apparent stability of the population. Minor changes have been made to the range map (Beattie, pers. comm., 2015).
The 2015 survey gave an estimate for the Lower Zambezi system, comprising the Lower Zambezi National Park and surrounding GMAs, of 973 ± 589 for the park and 153 ± 172 for the surrounding GMAs (DNPW, 2016). This replaces a 2003 estimate of 1,477 ± 744 for the park, and 45 ± 53 for the GMAs (Dunham, 2004). Another count in 2008 gave an estimate of 1,298 ± 438 (Simukonda, 2009). The elephants in Lower Zambezi NP are confined to a fairly small area along the Zambezi River below the escarpment and the area of known range has been reduced on the basis of sightings from aerial surveys and mortality records (Stevenson, pers. comm., 2015).
Sioma Ngwezi National Park is surrounded by GMAs in the south-west close to the Namibian and Angolan borders. The 2015 aerial sample count gave an estimate of 48 ± 78 for the park and a zero estimate for the GMAs (DNPW, 2016). This replaces an estimate of 385 ± 371 from 2005 (Chase & Griffin, 2005). There were also aerial sample counts in 2008 (Simukonda, 2009), 2009 and 2013 (Chase et al., 2013) which gave estimates of 2,433 ± 2,210, 400 (no confidence limits given) and 133 ± 149, respectively. The carcass ratio increased dramatically from 3% to 85% between 2008 and 2015 (DNPW, 2016) indicating either high levels of poaching and/or a seasonally varying population. Elephants move between Sioma Ngwezi, Namibia and Botswana (Chase et al., 2013).
There is a small population of elephants in the Mosi-oa-Tunya National Park next to Victoria Falls. An aerial total count of 31 in 2008 (Simukonda, 2009) replaces a guess of 306 from 2006 (Chase, 2006). No elephants were observed in the adjoining Kazungula ecosystem in an aerial sample count in 2008 (Simukonda, 2009). This area had not previously been surveyed.
There are only five resident elephants (Willems, pers. comm., 2016) in the Bangweulu Wetlands, contributing to an informed guess of 45 for the entire Bangweulu/Kasanka/Lavusha Manda system close to the DRC border. This replaces a series of old guesses amounting to 144 from the 1990s (Blanc et al., 2007). The area of known range has been increased.
There is a small isolated elephant population on the north bank of Lake Kariba, in the Kotakota area. An estimate of 19 animals from 1991 has been retained from the AESR 2007 (Tembo, pers. comm., 1993).
There are about 100 elephants in Nsumbu National Park (Tanganyika ecosystem) on the southern shores of Lake Tanganyika. In the past this was thought to be connected to the elephant population in Katavi and there was an annual migration to the southern region of the DRC but this has not
S O U T H E R N A F R I C A ― Z A M B I A
ZA
MB
IA
N U M B E R S A N D D I S T R I B U T I O N
C O N T .
A F R I C A N E L E P H A N T S T A T U S R E P O R T 2 0 1 6

188
taken place since 2007, after a major poaching incident on the border. The elephants are now restricted to part of the park and the area of known and possible range has been reduced accordingly (Zytkow, pers. comm., 2016).
West Lunga National Park is in the far west, close to the Angolan border. There were estimated to be over 500 elephants in 1996, but numbers appear to have dropped considerably since then. There were sightings of 21 individuals in 2014 as well as a number of other scattered recordings (Tilbury, pers. comm., 2015; ZAWA & WWF, 2014). The area of known range has been expanded to the area of these sightings.
S O U T H E R N A F R I C A ― Z A M B I A
ZA
MB
IA
N U M B E R S A N D D I S T R I B U T I O N
C O N T .
A F R I C A N E L E P H A N T S T A T U S R E P O R T 2 0 1 6

189
ZA
MB
IA
S O U T H E R N A F R I C A ― Z A M B I A
S U M M A R Y T O TA L S
I N T E R P R E TAT I O N O F C H A N G E S I N E S T I M AT E S F R O M P R E V I O U S R E P O R T
A R E A O F R A N G E C O V E R E D B Y E A C H DATA C AT E G O R Y
S U R V E Y C A T E G O R Y E S T I M A T E S F R O M S U R V E Y S
E S T I M A T E F R O M± 9 5 % C L T O P E R C E N T ( % ) A R E A ( km² )
G U E S S E S K N O W N A N D P O S S I B L E R A N G E
Aerial Total Counts
Aerial Sample Counts
Informed Guesses
Degraded Data
Totals 2015
Totals 2006
Assessed Range
Unassessed Range
Total Range
85
21,761
121
—
21,967
22,251
—
4,704
—
—
4,703
5,891
—
—
45
169
214
870
—
—
145
169
314
870
0 %
45 %
16 %
1 %
62 %
38 %
100 %
107
75,884
27,780
1,691
105,461
65,005
170,466
R E A S O N F O R C H A N G E E S T I M A T E S F R O M S U R V E Y S
E S T I M A T E F R O M± 9 5 % C L T O P E R C E N T ( % ) A R E A ( km² )
G U E S S E S K N O W N A N D P O S S I B L E R A N G E
Repeat Survey
New Population
Different Technique
Different Area
New Guess
Totals
+933
+54
-275
-1,025
+29
-284
±7,405
±76
0
±1,408
±92
±7,539
-56
0
0
0
-592
-648
-56
0
0
0
-492
-548
43 %
6 %
0 %
4 %
8 %
61 %
73,313
9,745
75
6,823
13,814
105,461
D A T A C A T E G O R Y K N O W N R A N G E ( km²) P O S S I B L E R A N G E ( km²) T O T A L R A N G E ( km²)
Aerial or Ground Total Counts
Direct Sample and Reliable Dung
Informed Guesses
Other Guesses
Unassessed Range
Totals
107
65,184
16,765
17
10,602
92,674
0
10,700
11,015
1,674
54,403
77,793
107
75,884
27,780
1,691
65,005
170,466
A F R I C A N E L E P H A N T S T A T U S R E P O R T 2 0 1 6

190
ZA
MB
IA
S O U T H E R N A F R I C A ― Z A M B I A
E L E P H A N T E S T I M AT E S
12.0˚S
17.4˚S
15.3˚S
15.3˚S
16.8˚S
14.0˚S
15.7˚S
14.0˚S
12.4˚S
14.8˚S
14.0˚S
14.0˚S
14.0˚S
12.6˚S
8.8˚S
12.8˚S
14.2˚S
17.9˚S
14.0˚S
17.0˚S
30.2˚E
27.5˚E
25.9˚E
25.9˚E
28.0˚E
29.7˚E
29.5˚E
29.7˚E
32.2˚E
29.6˚E
29.7˚E
29.7˚E
29.7˚E
32.1˚E
30.0˚E
24.8˚E
29.8˚E
25.8˚E
29.7˚E
23.7˚E
15,115
32
22,800
22,230
15
1,145
1,383
344
16,754
8,930
2,610
4,676
8,646
8,143
7,082
1,684
5,112
67
4,482
7,143
2015
2008
2015
2015
1991
2015
2015
2015
2015
1996
2015
2015
2015
2009
2016
2014
2008
2008
2015
2015
D
A
B
B
E
B
B
B
B
E
B
B
B
D
D
D
B
A
B
D
O
AT
AS
AS
AT
AS
AS
AS
AS
O
AS
AS
AS
AS
O
O
AS
AT
AS
O
1
4
1
1
4
2
2
3
1
1
2
2
2
2
2
2
2
4
2
2
NG
RS
RS
RS
-
RS
RS
NP
RS
-
RS
RS
RS
DA
NG
NG
NP
DT
RS
NP
Bangweulu System
Chete and Sekula Islands
Kafue Ecosystem
Kafue Game Management Areas
Kafue National Park
Kotakota Game Ranch
Lower Zambezi
Lower Zambezi National Park
Lower Zambezi Game Management Areas
Luangwa Ecosystem
Luambe National Park
Luangwa Game Management Areas
Luano
Lukusuzi National Park
North Luangwa National Park
South Luangwa National Park
West Petauke Game Management Area
Tanganyika Ecosystem
West Lunga National Park
West Zambezi
Kazungula Landscape
Mosi-oa-Tunya National Park
Sioma Ngwezi National Park
West Zambezi
2,064
2,265
589
172
77
3,108
1,788
1,194
100*
78
45
54
1,876
4,813
19
973
153
54
5,869
150
0
4,673
3,302
0
100
21
0
31
48
0
M A P L O C A T I O NA R E AS U R V E Y D E T A I L S P F S
L A T .L O N .( km²)Y E A RR E L I A B .T Y P E
REASON
FOR
CHANGE
I N P U T Z O N E S O U R C E# O F E L E P H A N T S
± 9 5% C LE S T I M AT E
Willems, pers. comm., 2016
Simukonda, 2009
DNPW, 2016
DNPW, 2016
Tembo, pers. comm., 1993
DNPW, 2016
DNPW, 2016
DNPW, 2016
DNPW, 2016
Jachmann, 1996
DNPW, 2016
DNPW, 2016
DNPW, 2016
WCS Flight Programme, 2009
Zytkow, pers. comm., 2016
Tilbury, pers. comm., 2016
Simukonda, 2009
Simukonda, 2009
WWF Zambia, 2016
DNPW, 2016
* R A N G E O F I N F O R M E D G U E S S
DA: Different Area; DD: Data Degraded; DT: Different Technique; NA: New Analysis;
NG: New Guess; NP: New population; PL: Population Lost; RS: Repeat Survey (RS
denotes a repeat survey that is not statistically comparable for reasons such as
different season);
― : No Change
AS: Aerial Sample Count; AT: Aerial Total Count; DC: Dung Count; GD: Genetic
Dung Count; GS: Ground Sample Count; GT: Ground Total Count; IG: Informed
Guess; IR: Individual Registration; OG: Other Guess. Survey Reliability is keyed A-E
(best to worst).
Priority for Future Surveys (PFS) is ranked from 1 to 5 (highest to lowest). Based
on the precision of estimates and the proportion of national range accounted
for by the site in question, PFS is a measure of the importance and urgency for
future population surveys. All areas of unassessed range have a priority of 1. See
Introduction for details on how the PFS is derived.
1 K E Y T O R E A S O N S F O R C H A N G E
2 K E Y T O S U R V E Y R E P O R T
3 P F S

A F R I C A N E L E P H A N T S T A T U S R E P O R T 2 0 1 6 S O U T H E R N A F R I C A ― Z A M B I A
Congo
Congo
RungwaRungwa
L. C
hisi
L. C
hisi
Kaf
ueK
afue
Zambeze
Zambeze
Cass
aiCa
ssai
Cuando
CuandoOkavango
Okavango
ZambeziZambezi
SabiSabi
L. Cabora BassaL. Cabora Bassa
Lomam
i
Lomam
i
Luan
gwa
Luan
gwa
TaboraTabora
MbeyaMbeya
LubumbashiLubumbashi
KaribaKariba
MutareMutare
BulawayoBulawayo
FrancistownFrancistown
MaunMaun
KasaneKasane
Victoria FallsVictoria Falls
LivingstoneLivingstone
MonguMongu
NdolaNdola
ChipataChipata
TeteTete
LUS AKA
LI LONGWE
HAR AR E
Z AM BIA
DEMOCR ATIC R EPU BLICOF CONG O
TANZ AN IA
MAL AWI
Z I M B ABWE
MOZ AM BIQ U E
ANG OL A
NAM I BIA
BOT SWANA
0 80 160 240 320 400 480 km
21°S 21°S
20°S 20°S
19°S 19°S
18°S 18°S
17°S 17°S
16°S 16°S
15°S 15°S
14°S 14°S
13°S 13°S
12°S 12°S
11°S 11°S
10°S 10°S
9°S 9°S
8°S 8°S
7°S 7°S
6°S 6°S
5°S 5°S
22°E
22°E
23°E
23°E
24°E
24°E
25°E
25°E
26°E
26°E
27°E
27°E
28°E
28°E
29°E
29°E
30°E
30°E
31°E
31°E
32°E
32°E
33°E
33°E
Bangweulu System
West Lunga NP
TanganyikaEcosystem
Ugala River
GRInyonga
GMA
KataviNP
KataviRukwa
(Outside)
RuahaRungwa
Ecosystem
LuambeNP
LukusuziNPSouth Luangwa
NP
NorthLuangwa
NP
LuangwaGMAs
Chete & SekulaIslands
KotakotaGR
KafueGMAs
Kazungula Landscape
West Zambezi
Mosi-oa-Tunya NP
Sioma Ngwezi
NP
Lower ZambeziEcosystem
West Petauke GMAs
Luano
LowerZambezi
GMAs
KafueNP
Cabora BassaNorth
Tete Province-South
MagoeDistrictChewore
I & III CheworeIIChewore IV
Doma SAProteaFarm
Chegutu SA
Binga Communal LandsKariba CAs
MatusadonaNP
Chete SA
Sijarira FA
Chirisa SAChizarira NPLusulu
Hwange NP
MatabelelandCommunal Areas
Matetsi SCFuller
Forest Land
Nakavango
Gwayi, Mbembesi, & Umgusa
Forest LandsGwampa/Lake Alice
Forest Lands
ShanganiRanch
BubianaConservancy
Save ValleyConservancy
Chiredzi RiverConservancy Mahenye
Ward
MavuradonhaWA Nyatana
WMA
Mangwe Dam
Upemba NP
BushimaeHZ
VwazaMarsh
WR
Nyika NP
NorthernBotswana
Isangano NP
LavushiManda NPKasanka
NP
Nsumbu NP
UmfuliRP
LowerZambezi NP
MzoloForest Land
Sekula Island
WS
Chete Island
WS
InsezeForest Land
ManjirenjiRP
ChipingeSA
MakgadikgadiNP
Nxai Pan NP
Moremi GR
Chobe NP
Central Kalahari GR
KundelunguNP
Zambia
Int'l Boundaries
Rivers & Lakes
Towns
Protected Areas
Input Zones
Known
Possible
Doubtful
Sighting
E L E P H A N T R A N G E0 8 0 1 6 0 2 4 0 3 2 0 4 0 0 4 8 0 k m
See Appendix III for map abbreviations and acronyms.
© 2016 African Elephant Specialist Group
A B B R E V I AT I O N S A N D A C R O N Y M S
191

192
Poaching of elephants for ivory has escalated in the past ten years and has become a major problem in Zimbabwe. A worrying recent development has been the emergence of poisoning as a poaching technique. Just over 100 elephants were killed in a single cyanide poisoning incident in Hwange National Park in late 2013 (Muboko et al., 2014). The impact of poaching has been highest in the north of the country, particularly in the Sebungwe Region to the south of Lake Kariba, and the Lower Zambezi Region (Dunham et al., 2015c). Although elephant numbers have increased in Gonarezhou National Park, it too experienced an increase in poaching in 2015 (Dunham & van der Westhuizen, 2015).
Concern has been expressed about the impact of high numbers of elephants on vegetation and other biodiversity in Zimbabwe’s protected areas. Despite the increase in poaching, this remains a problem in protected areas such as Hwange NP, where the provision of artificial water supplies has led to high elephant densities (ZPWMA, 2015).
Zimbabwe published a national elephant management plan covering the period 2015 to 2020 (ZPWMA, 2015).
In 2008, Zimbabwe undertook an approved one-off sale of 3,764 kg of ivory to Japan and China, at a price of USD $487,162 (Wijnstekers, 2011).
C U R R E N T I S S U E S
Zimbabwe
S O U T H E R N A F R I C A ― Z I M B A B W E
ZIM
BA
BW
E
C O U N T R Y
E S T I M A T E D T O T A L E L E P H A N T S G E N E R A L S T A T I S T I C S
G U E S S E S
Country Area
Range Area
Protected Range
Information Quality Index (IQI)
CITES Appendix
Listing Year
390,580 km²
81,228 km² (21%)
61 %
0.86
II
1997
82,630 ± 8,589
1,635 - 1,805
A F R I C A N E L E P H A N T S T A T U S R E P O R T 2 0 1 6
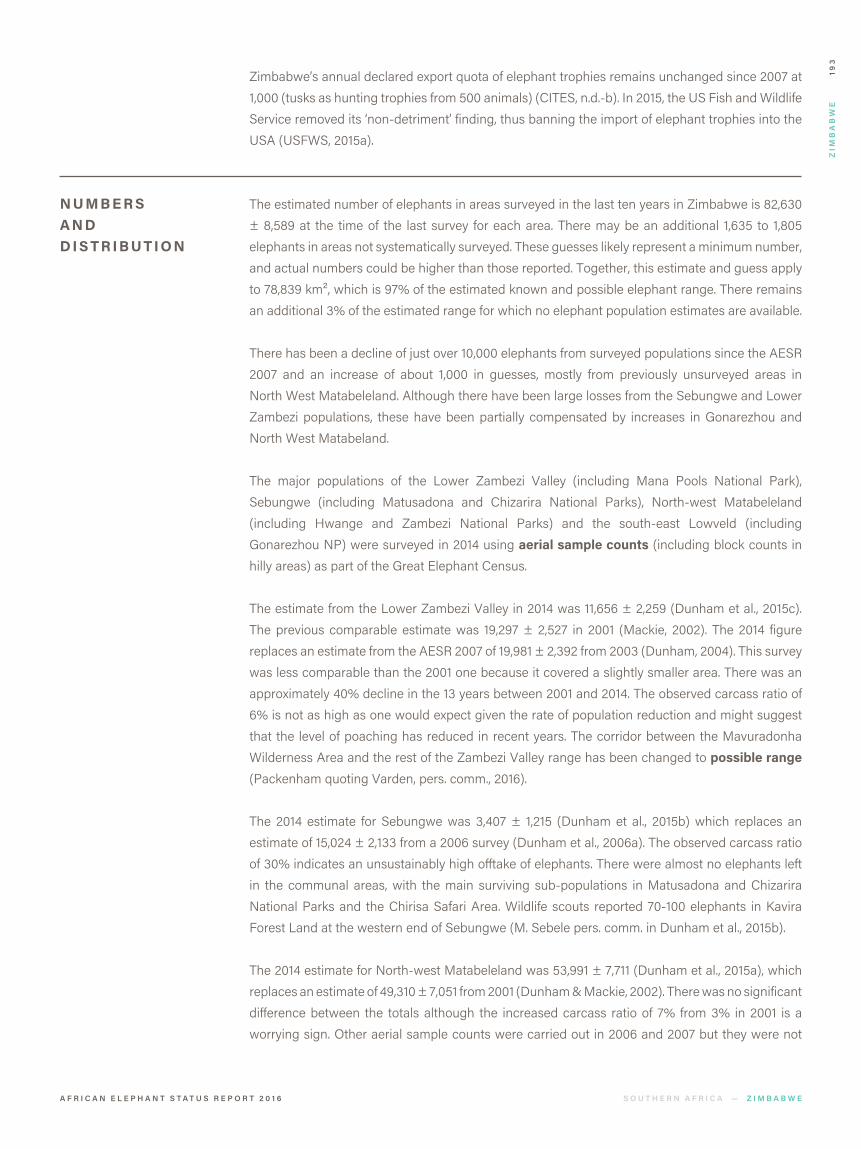
193
The estimated number of elephants in areas surveyed in the last ten years in Zimbabwe is 82,630 ± 8,589 at the time of the last survey for each area. There may be an additional 1,635 to 1,805 elephants in areas not systematically surveyed. These guesses likely represent a minimum number, and actual numbers could be higher than those reported. Together, this estimate and guess apply to 78,839 km², which is 97% of the estimated known and possible elephant range. There remains an additional 3% of the estimated range for which no elephant population estimates are available.
There has been a decline of just over 10,000 elephants from surveyed populations since the AESR 2007 and an increase of about 1,000 in guesses, mostly from previously unsurveyed areas in North West Matabeleland. Although there have been large losses from the Sebungwe and Lower Zambezi populations, these have been partially compensated by increases in Gonarezhou and North West Matabeland.
The major populations of the Lower Zambezi Valley (including Mana Pools National Park), Sebungwe (including Matusadona and Chizarira National Parks), North-west Matabeleland (including Hwange and Zambezi National Parks) and the south-east Lowveld (including Gonarezhou NP) were surveyed in 2014 using aerial sample counts (including block counts in hilly areas) as part of the Great Elephant Census.
The estimate from the Lower Zambezi Valley in 2014 was 11,656 ± 2,259 (Dunham et al., 2015c). The previous comparable estimate was 19,297 ± 2,527 in 2001 (Mackie, 2002). The 2014 figure replaces an estimate from the AESR 2007 of 19,981 ± 2,392 from 2003 (Dunham, 2004). This survey was less comparable than the 2001 one because it covered a slightly smaller area. There was an approximately 40% decline in the 13 years between 2001 and 2014. The observed carcass ratio of 6% is not as high as one would expect given the rate of population reduction and might suggest that the level of poaching has reduced in recent years. The corridor between the Mavuradonha Wilderness Area and the rest of the Zambezi Valley range has been changed to possible range (Packenham quoting Varden, pers. comm., 2016).
The 2014 estimate for Sebungwe was 3,407 ± 1,215 (Dunham et al., 2015b) which replaces an estimate of 15,024 ± 2,133 from a 2006 survey (Dunham et al., 2006a). The observed carcass ratio of 30% indicates an unsustainably high offtake of elephants. There were almost no elephants left in the communal areas, with the main surviving sub-populations in Matusadona and Chizarira National Parks and the Chirisa Safari Area. Wildlife scouts reported 70-100 elephants in Kavira Forest Land at the western end of Sebungwe (M. Sebele pers. comm. in Dunham et al., 2015b).
The 2014 estimate for North-west Matabeleland was 53,991 ± 7,711 (Dunham et al., 2015a), which replaces an estimate of 49,310 ± 7,051 from 2001 (Dunham & Mackie, 2002). There was no significant difference between the totals although the increased carcass ratio of 7% from 3% in 2001 is a worrying sign. Other aerial sample counts were carried out in 2006 and 2007 but they were not
N U M B E R S A N D D I S T R I B U T I O N
S O U T H E R N A F R I C A ― Z I M B A B W E
ZIM
BA
BW
E
Zimbabwe’s annual declared export quota of elephant trophies remains unchanged since 2007 at 1,000 (tusks as hunting trophies from 500 animals) (CITES, n.d.-b). In 2015, the US Fish and Wildlife Service removed its ‘non-detriment’ finding, thus banning the import of elephant trophies into the USA (USFWS, 2015a).
A F R I C A N E L E P H A N T S T A T U S R E P O R T 2 0 1 6

194
suitable for comparative purposes (Dunham et al., 2007; Dunham et al., 2006b). Since the 2014 Botswana survey was carried out a month earlier than the north-west Matabeleland survey there is a possibility of double-counting or missing animals that had moved from Hwange into Botswana. There was a surprisingly large number of elephants seen in the Ngwasho/Sepako stratum in Botswana adjoining the southern half of Hwange NP (estimate 11,744) (Chase et al., 2015) and evidence from radio-tracking shows that elephants do move out of Hwange into adjoining areas of Botswana (Chamaillé-Jammes, pers. comm., 2016; Ferguson & Chase, 2010).
Elephant range in North-west Matabeleland has probably increased. Water hole counts and scout reports indicated 308 elephants in the Fuller Forest Land, 165 in Gwaai, Bembezi and Umguza Forest Lands (which has been marked as new known range) and 150 in Gwampa/Lake Alice Forest Reserves (M. Sebele pers. comm in Dunham et al., 2015a) which are all recorded as new populations. I. Du Preez (pers. comm. in Dunham et al., 2015a) reported an informed guess of 36 elephants in the privately owned Stanley & Livingstone Game Reserve (Nakavango).
The estimate for Gonarezhou NP from the 2014 survey was 11,120 ± 2,709 (Dunham & van der Westhuizen, 2015). This replaces an estimate of 4,987 ± 1,577 from a comparable 2001 survey. Another survey in 2009 gave an estimate of 9,123 ± 1,898 (Dunham et al., 2010). The elephant population of Gonarezhou NP is continuing to increase, and is at its highest level since surveys started in 1980. There was a relatively low carcass ratio of 4%. There are limited movements of elephants from Gonarezhou into adjoining parts of Mozambique, and one radio-collared elephant moved from Kruger to Gonarezhou (Henley, 2011).
The 2014 survey of the south east Lowveld included some neighbouring areas. No elephants were observed in the Malapati Safari Area immediately south-west of Gonarezhou but there was an estimate of 332 ± 519 in the Mahenye communal land to the north-east of Gonarezhou, which replaces a zero estimate from the 2001 survey. The 2014 survey gave an estimate of 1,585 ± 1,295 for the Savé Valley Conservancy. This replaces an estimate of 527 ± 310 (Dunham, 2003). There is no statistical difference between the two results. Aerial total counts were carried out in 2013 and 2015 (Jooste & Lenton, 2015; Joubert & Joubert, 2013), which did not cover the entire area: 1,538 and 1,490 elephants were counted respectively. Sengwe, further to the south-west, adjoining the northern boundary of Kruger National Park in South Africa, was not counted in the 2014 survey, but there was an estimate of 35 ± 99 in 2013 (Dunham et al., 2013). In the Malilangwe Conservancy 272 elephants were counted using a helicopter in 2013 (Clegg, 2013). This replaces an estimate of 116 from an aerial total count in 2001 (Dunham, 2002). There was an estimate of 55 in 2014 for the Chiredzi River Conservancy (Warth in Dunham & van der Westhuizen, 2015) compared to 28 in 2001 (Dunham, 2002). Although Chipinge Safari Area is marked as possible elephant range, this is now highly unlikely.
There are a number of small isolated populations in other parts of Zimbabwe, which have updated estimates for 2014. There is an informed guess of 150 elephants for Chegutu Safari Area (Mwale, pers. comm. in Dunham, 2015), formerly Hartley Safari Area, west of Harare and this replaces a guess of 100 from 2001 (Dunham & Mackie, 2002). Some 30 elephants reportedly move from the Nyatana Wildlife Management Area in the north east of the country into Mozambique and this replaces a guess of 150 from 2001 (Dunham & Mackie, 2002).
S O U T H E R N A F R I C A ― Z I M B A B W E
ZIM
BA
BW
E
N U M B E R S A N D D I S T R I B U T I O N
C O N T .
A F R I C A N E L E P H A N T S T A T U S R E P O R T 2 0 1 6

195
Some 20 bull elephants were photographed, and there was a further unverified report of 40 elephants, near Mangwe Dam in the vicinity of Home Farm and Greystone Ranches, across the border from Francistown in Botswana (Robertson and Winch, pers. comm. in Dunham, 2015) replacing a guess of three from 2002 (Dunham & Mackie, 2002). A helicopter total count enumerated 174 elephants on Shangani Ranch near Bulawayo (Edwards, pers. comm. in Dunham, 2015) and this replaces a guess of 60 from 2001 (Dunham & Mackie, 2002).
There was a total aerial count of 212 elephants in 2014 in the Zimbabwe section of the Mapungubwe Transfrontier Conservation Area which includes Tuli Safari Area, Sentinel, Nottingham and River Ranches (Selier & Page, 2015). This replaces an estimate of 82 from 2001 (Dunham & Mackie, 2002).
There were informed guesses in 2014 of 500-600 in Bubye Valley (Leathem & English pers. comm. in Dunham, 2015), and 100 on Bubiana Conservancy (Drummond pers. comm. in Dunham, 2015) in the south of Zimbabwe, replacing guesses of 53 and 50 respectively (Dunham & Mackie, 2002). An old estimate of ten elephants in the Mambali Communal Lands on the Botswana border has been retained from the AESR 2007 (Dunham & Mackie, 2002). A report of 54 elephants on Nuanetsi Ranch is recorded as a new population.
S O U T H E R N A F R I C A ― Z I M B A B W E
ZIM
BA
BW
E
N U M B E R S A N D D I S T R I B U T I O N
C O N T .
A F R I C A N E L E P H A N T S T A T U S R E P O R T 2 0 1 6

196
ZIM
BA
BW
E
S O U T H E R N A F R I C A ― Z I M B A B W E
S U M M A R Y T O TA L S
I N T E R P R E TAT I O N O F C H A N G E S I N E S T I M AT E S F R O M P R E V I O U S R E P O R T
A R E A O F R A N G E C O V E R E D B Y E A C H DATA C AT E G O R Y
S U R V E Y C A T E G O R Y E S T I M A T E S F R O M S U R V E Y S
E S T I M A T E F R O M± 9 5 % C L T O P E R C E N T ( % ) A R E A ( km² )
G U E S S E S K N O W N A N D P O S S I B L E R A N G E
Aerial Total Counts
Aerial Sample Counts
Informed Guesses
Other Guesses
Degraded Data
Totals 2015
Totals 2006
Assessed Range
Unassessed Range
Total Range
484
82,126
20
—
—
82,630
93,122
—
8,589
—
—
—
8,589
7,068
—
—
527
1,091
17
1,635
534
—
—
567
1,221
17
1,805
625
1 %
81 %
5 %
10 %
0 %
97 %
3 %
100 %
819
65,502
3,777
8,399
342
78,839
2,389
81,228
R E A S O N F O R C H A N G E E S T I M A T E S F R O M S U R V E Y S
E S T I M A T E F R O M± 9 5 % C L T O P E R C E N T ( % ) A R E A ( km² )
G U E S S E S K N O W N A N D P O S S I B L E R A N G E
Repeat Survey
New Population
Different Technique
Different Area
New Guess
Data Degraded
Totals
-10,320
0
+7
+20
-182
-17
-10,492
±11,124
0
±99
0
0
0
±11,124
0
+713
-145
-3
+519
+17
+1,101
0
+713
-145
+36
+559
+17
+1,180
79 %
6 %
4 %
0 %
8 %
0 %
97 %
63,868
4,563
3,370
33
6,662
0
78,839
D A T A C A T E G O R Y K N O W N R A N G E ( km²) P O S S I B L E R A N G E ( km²) T O T A L R A N G E ( km²)
Aerial or Ground Total Counts
Direct Sample and Reliable Dung
Informed Guesses
Other Guesses
Unassessed Range
Totals
819
65,375
3,745
8,741
1,533
80,213
0
127
32
0
857
1,016
819
65,502
3,777
8,741
2,389
81,228
A F R I C A N E L E P H A N T S T A T U S R E P O R T 2 0 1 6

197
ZIM
BA
BW
E
S O U T H E R N A F R I C A ― Z I M B A B W E
E L E P H A N T E S T I M AT E S
17.9˚S
22.0˚S
16.1˚S
16.1˚S
16.1˚S
16.1˚S
16.1 S
16.1 S
16.5˚S
16.1 S
21.5˚S
20.7˚S
18.1˚S
19.3˚S
19.1˚S
18.8˚S
18.8˚S
18.8˚S
18.0˚S
18.8˚S
16.7˚S
17.4˚S
17.4˚S
17.4˚S
17.4˚S
17.4˚S
18.1˚S
17.4˚S
29.6˚E
29.4˚E
29.9˚E
29.9˚E
29.9˚E
29.9˚E
29.9˚E
29.9˚E
29.6˚E
29.9˚E
28.4˚E
28.1˚E
25.9˚E
28.0˚E
28.5˚E
26.4˚E
26.4˚E
26.4˚E
25.8˚E
26.4˚E
32.5˚E
28.2˚E
28.2˚E
28.2˚E
28.2˚E
28.2˚E
27.0˚E
28.2˚E
445
1,192
1,058
1,773
472
991
652
337
14
11,720
327
291
1,442
860
15,168
3,075
4,384
2,332
651
2,201
1,242
1,530
2,096
3,198
287
537
2014
2014
2014
2014
2014
2014
2014
2014
2001
2014
2001
2014
2014
2014
2014
2014
2014
2014
2014
2014
2014
2014
2014
2014
2014
2014
2014
2014
E
A
B
B
B
B
B
B
E
B
E
D
D
D
E
B
B
B
E
B
E
B
B
B
B
B
E
B
O
AT
AS
AS
AS
AS
AS
AS
O
AS
AT
O
O
O
O
AS
AS
AS
O
AS
O
AS
AS
AS
AS
AS
O
AS
2
2
2
2
3
2
2
3
4
1
2
3
3
2
2
1
2
1
3
2
2
2
2
2
2
2
2
2
NG
RS
RS
RS
RS
RS
RS
RS
-
RS
-
DA
NP
NP
NP
RS
RS
RS
NP
RS
NG
RS
RS
RS
RS
RS
NG
RS
Chegutu Safari Area
Greater Mapungubwe
Tuli, Maramani, Sentinel, Nottingham
Lower Zambezi Valley
Chewore II
Chewore I & III
Chewore IV
Doma Safari Area
Mavuradonha Wilderness Area
Mukwiche Area
Protea Farm
Rest of Zambezi valley
Mambali Communal Lands
Mangwe Dam
Northwest Matabeleland
Fuller Forest Land
Gwaai, Bembesi, and Umguza Forest Lands
Gwampa/Lake Alice Forest Lands
Hwange National Park
Matabeleland Communal areas
Matetsi Safari Complex
Nakavango
Ngamo & Sikumi Forest Areas
Nyatana Wildlife Management Area
Sebungwe
Binga Communal Lands
Chete Safari Area
Chirisa Safari Area
Chizarira National Park
Kariba Communal Areas
Kavira Forest Land
Lusulu
333
851
194
2,029
40*
6,244
3,062
2,968
993
162
222
755
767
364
30*
150
212
594
2,709
0
153
0
0
7
8,200
10
20
308
165
150
45,846
2,201
4,843
36
1,101
30
86
278
1,200
747
411
70
0
M A P L O C A T I O NA R E AS U R V E Y D E T A I L S P F S
L A T .L O N .( km²)Y E A RR E L I A B .T Y P E
REASON
FOR
CHANGE
I N P U T Z O N E S O U R C E# O F E L E P H A N T S
± 9 5% C LE S T I M AT E
Dunham, 2015
Selier & Page, 2015
Dunham et al., 2015c
Dunham et al., 2015c
Dunham et al., 2015c
Dunham et al., 2015c
Dunham et al., 2015c
Dunham et al., 2015c
Dunham et al., 2015c
Dunham & Mackie, 2002
Dunham & Mackie, 2002
Dunham, 2015
Dunham, 2015
Dunham, 2015
Dunham, 2015
Dunham et al., 2015a
Dunham et al., 2015a
Dunham et al., 2015a
Dunham, 2015
Dunham, 2015
Dunham et al., 2015b
Dunham et al., 2015b
Dunham et al., 2015b
Dunham et al., 2015b
Dunham et al., 2015b
Dunham et al., 2015b
Dunham et al., 2015b
Dunham et al., 2015a
A F R I C A N E L E P H A N T S T A T U S R E P O R T 2 0 1 6

198
ZIM
BA
BW
E
S O U T H E R N A F R I C A ― Z I M B A B W E
E L E P H A N T E S T I M AT E S (C O N T.)
17.4˚S
17.4˚S
17.4˚S
19.6˚S
21.1˚S
21.5˚S
20.8˚S
21.5˚S
21.5˚S
21.5˚S
21.1˚S
21.5˚S
21.6˚S
20.4˚S
21.6˚S
28.2˚E
28.2˚E
28.2˚E
29.3˚E
29.8˚E
30.1˚E
31.6˚E
31.9˚E
31.9˚E
31.9˚E
31.9˚E
31.7˚E
30.8˚E
32.1˚E
31.8˚E
1,366
3,096
261
628
1,772
2,895
895
4,941
221
177
425
400
3,496
2,488
2014
2014
2014
2014
2014
2014
2014
2014
2014
2014
2013
1996
2014
2014
2013
B
B
B
E
E
E
E
B
B
B
A
E
D
B
B
AS
AS
AS
O
O
O
O
AS
AS
AS
AT
AS
O
AS
AS
2
2
3
2
2
1
2
1
3
3
3
3
2
2
2
RS
RS
RS
NG
NG
NG
DT
RS
RS
RS
RS
-
NP
RS
DT
Matusadona National Park
North Gokwe Communal Lands
Sijarira Forest Area
Shangani Ranch
Southeast Lowveld
Bubiana Conservancy
Bubye Valley Conservancy
Chiredzi River Conservancy
Gonarezhou National Park
Mahenye Ward
Malapati Safari Area
Malilangwe Conservancy
Matibi II Communal Lands
Nuanetsi Ranch
Save Valley Conservancy
Sengwe Communal Land
251
21
100*
2,709
519
1,295
99
669
0
16
174
100
500
55
11,120
332
0
272
0
54
1,585
35
M A P L O C A T I O NA R E AS U R V E Y D E T A I L S P F S
L A T .L O N .( km²)Y E A RR E L I A B .T Y P E
REASON
FOR
CHANGE
I N P U T Z O N E S O U R C E# O F E L E P H A N T S
± 9 5% C LE S T I M AT E
Dunham et al., 2015b
Dunham et al., 2015b
Dunham et al., 2015b
Dunham, 2015
Dunham, 2015
Dunham, 2015
Dunham, 2015
Dunham & van der Westhuizen, 2015
Dunham & van der Westhuizen, 2015
Clegg, 2013
Dunham & van der Westhuizen, 2015
Davies et al., 1996
Dunham, 2015
Dunham et al., 2013
Dunham & van der Westhuizen, 2015
* R A N G E O F I N F O R M E D G U E S S
A F R I C A N E L E P H A N T S T A T U S R E P O R T 2 0 1 6
DA: Different Area; DD: Data Degraded; DT: Different Technique; NA: New Analysis;
NG: New Guess; NP: New population; PL: Population Lost; RS: Repeat Survey (RS
denotes a repeat survey that is not statistically comparable for reasons such as
different season);
― : No Change
AS: Aerial Sample Count; AT: Aerial Total Count; DC: Dung Count; GD: Genetic
Dung Count; GS: Ground Sample Count; GT: Ground Total Count; IG: Informed
Guess; IR: Individual Registration; OG: Other Guess. Survey Reliability is keyed A-E
(best to worst).
Priority for Future Surveys (PFS) is ranked from 1 to 5 (highest to lowest). Based
on the precision of estimates and the proportion of national range accounted
for by the site in question, PFS is a measure of the importance and urgency for
future population surveys. All areas of unassessed range have a priority of 1. See
Introduction for details on how the PFS is derived.
1 K E Y T O R E A S O N S F O R C H A N G E
2 K E Y T O S U R V E Y R E P O R T
3 P F S

A F R I C A N E L E P H A N T S T A T U S R E P O R T 2 0 1 6 S O U T H E R N A F R I C A ― Z I M B A B W E
Kafu
eKa
fue
Luan
gwa
Luan
gwa
SabiSabi
L. Cabora BassaL. Cabora Bassa
Zambezi
Zambezi
Limpopo
Limpopo
OlifantsOlifants
KaribaKariba
MutareMutare
BulawayoBulawayo
FrancistownFrancistown
PietersburgPietersburg
KasaneKasaneVictoria FallsVictoria Falls
LivingstoneLivingstone
ChipataChipata
HAR AR E
LUS AKA
Z I M B ABWE
OF CONG O
MAL AWI
MOZ AM BIQ U E
Z AM BIA
BOT SWANA
SO U TH AF R ICA
0 50 100 150 200 250 300 km
24°S 24°S
23°S 23°S
22°S 22°S
21°S 21°S
20°S 20°S
19°S 19°S
18°S 18°S
17°S 17°S
16°S 16°S
15°S 15°S
14°S 14°S
25°E
25°E
26°E
26°E
27°E
27°E
28°E
28°E
29°E
29°E
30°E
30°E
31°E
31°E
32°E
32°E
33°E
33°E
Binga CommunalLands
North GokweCommunal Lands
Chegutu SA
CheworeI & III
Chewore II
Kariba CAs
MatusadonaNP
Chewore IV
MukwicheArea
Doma SA
Save ValleyConservancy
Rest of Zambezi
Valley
ProteaFarm
MavuradonhaWA
Nyatana WMA
Chiredzi RiverConservancy
MalilangweConservancy
Lusulu
Hwange NP
Ngamo& Sikumi
FAs
MatabelelandCommunal
Areas
Chete SA
Sijarira FA
Chirisa SAKavira
Forest Land
Gwayi, Mbembesi, & Umgusa
Forest Lands ShanganiRanch
Gwampa/Lake AliceForest Lands
GonarezhouNP
SengweCL
Matibi II CL
MalapatiSA
MahenyeWard
FullerForest Land
Nakavango
Matetsi SC
Chizarira NP
BubianaConservancy
Tuli, Maramani,Sentinel, Nottingham
NuanetsiRanch
MangweDam
MambaliCommunal
Lands Bubye ValleyConservancy
Tuli GR
Northern Botswana
AtherstonePNR
Balule,TimbavatiUmbabat
& Klaserie
Kruger NP
MapungubweMaremani NR
Letaba PNR
ManyeletiGR
Kafue GMAs
Kafue NP
West Petauke GMAs
Luano
LowerZambezi
GMAs
South LuangwaNP
Cabora Bassa North
Magoe District
Tete Province-South
Banhine NP
MzoloForest Land
KazumaPan NP
Deka SA
UmfuliRP
ManaPools
NPHurungwe SA
ChararaSA
DandeSF
SapiSA
Zambezi NP
InsezeForest Land
ChipingeSA
ManjirenjiRP
Central Kalahari GR
WelgevondenPGR
PhalaborwaMining Co. PR
Sabi Sand GR
Zinave NP
Zimbabwe
Int'l Boundaries
Rivers & Lakes
Towns
Protected Areas
Input Zones
Known
Possible
Doubtful
Sighting
E L E P H A N T R A N G E0 5 0 1 0 0 1 5 0 2 0 0 2 5 0 3 0 0 k m
See Appendix III for map abbreviations and acronyms.
© 2016 African Elephant Specialist Group
A B B R E V I AT I O N S A N D A C R O N Y M S
199