Applying IUCN criteria to invertebrates: How red is the Red List of European butterflies
10
This article appeared in a journal published by Elsevier. The attached copy is furnished to the author for internal non-commercial research and education use, including for instruction at the authors institution and sharing with colleagues. Other uses, including reproduction and distribution, or selling or licensing copies, or posting to personal, institutional or third party websites are prohibited. In most cases authors are permitted to post their version of the article (e.g. in Word or Tex form) to their personal website or institutional repository. Authors requiring further information regarding Elsevier’s archiving and manuscript policies are encouraged to visit: http://www.elsevier.com/copyright
-
Upload
independent -
Category
Documents
-
view
3 -
download
0
Transcript of Applying IUCN criteria to invertebrates: How red is the Red List of European butterflies

This article appeared in a journal published by Elsevier. The attachedcopy is furnished to the author for internal non-commercial researchand education use, including for instruction at the authors institution
and sharing with colleagues.
Other uses, including reproduction and distribution, or selling orlicensing copies, or posting to personal, institutional or third party
websites are prohibited.
In most cases authors are permitted to post their version of thearticle (e.g. in Word or Tex form) to their personal website orinstitutional repository. Authors requiring further information
regarding Elsevier’s archiving and manuscript policies areencouraged to visit:
http://www.elsevier.com/copyright

Author's personal copy
Applying IUCN criteria to invertebrates: How red is the Red Listof European butterflies?
Chris van Swaay a,c, Dirk Maes b,c,⇑, Sue Collins c, Miguel L. Munguira c,d, Martina Šašic c,e, Josef Settele c,f,Rudi Verovnik c,g, Martin Warren c,h, Martin Wiemers c,i, Irma Wynhoff a,c, Annabelle Cuttelod j
a Dutch Butterfly Conservation, PO Box 506, NL-6700 AM Wageningen, The Netherlandsb Research Institute for Nature and Forest (INBO), Kliniekstraat 25, B-1070 Brussels, Belgiumc Butterfly Conservation Europe, PO Box 506, NL-6700 AM Wageningen, The Netherlandsd Departamento de Biología, Edificio de Biología, c/Darwin No. 2, Universidad Autónoma de Madrid, Cantoblanco, ES-28049-Madrid, Spaine Croatian Natural History Museum, Demetrova 1, HR-10000 Zagreb, Croatiaf UFZ – Helmholtz-Centre for Environmental Research, Department of Community Ecology, Theodor-Lieser-Str. 4, D-06120 Halle, Germanyg University of Ljubljana, Biotechnical Faculty, Department of Biology, Vecna pot 111, 1000 Ljubljana, Sloveniah Butterfly Conservation (UK), Manor Yard, East Lulworth, Dorset BH20 5QP, UKi University of Vienna, Department of Animal Biodiversity, Rennweg 14, A-1030 Vienna, Austriaj IUCN Species Programme, Red List Unit, 219c Huntingdon Road, Cambridge CB3 0DL, UK
a r t i c l e i n f o
Article history:Received 1 June 2010Received in revised form 14 September 2010Accepted 30 September 2010Available online 27 October 2010
Keywords:Conservation prioritiesDistribution dataIUCNMonitoringThreatened species
a b s t r a c t
The IUCN is the leading authority on assessing species’ extinction risks worldwide and introduced the useof quantitative criteria for the compilation of Red Lists of threatened species. Recently, we assessed thethreat status of the 483 European butterfly species, using semi-quantitative data on changes in distribu-tion and in population sizes provided by national butterfly experts. We corrected distribution trends forthe observation that coarse-scale grid cells underestimate actual population trends by 35%. To accountfor uncertainty, we included a 5% error margin on the distribution and population trends provided. Thenew Red List of European butterflies determined one species as Regionally Extinct, 37 species as threa-tened (Critically Endangered, Endangered or Vulnerable) and a further 44 as Near Threatened. The useof semi-quantitative data on distribution and population trends permitted us to use IUCN criteria tocompile a scientifically underpinned Red List of butterflies in Europe. However, a comparison of detailedmonitoring data for some grassland species showed that coarse-scale grid cell data and population trendsstrongly underestimate extinction risks, and the list should be taken as a conservative estimate of threat.Finally, combining the new Red List status with the data provided by the national butterfly experts,allowed us to determine simple criteria to delineate conservation priorities for butterflies in Europe, socalled SPecies of European conservation Concern (SPEC’s). Using European butterflies, our approach illus-trated how Red Listing can be performed when data are incomplete for some IUCN criteria or vary stronglyamong countries.
� 2010 Elsevier Ltd. All rights reserved.
1. Introduction
Since the 1950s, the International Union for Conservation ofNature (IUCN) has co-ordinated the compilation of global Red Lists,that aim to estimate the global extinction risk of each speciesassessed. The first Red Data Books were compiled for birds and
mammals (Fitter and Fitter, 1987). Initially, categorization wasbased on ‘‘best professional judgment” of experts, but since the1980s, the IUCN decided to use quantitative criteria (Mace andLande, 1991). In 1994, the first version of the criteria and categoriesfor compiling global Red Lists was accepted. The criteria were re-vised in 2001 to adapt to the needs of the various taxonomicgroups (IUCN, 2001; IUCN Standards and Petitions Working Group,2008; Mace et al., 2008). Birds were, again, the first group to whichthese quantitative criteria were applied (Collar et al., 1994), butsince then other taxonomic groups have been evaluated as well(Baillie et al., 2004; Vié et al., 2009). The application of the IUCNcriteria is, however, not always easy, especially for taxa for whichquantitative data are less accurate than for mammals or birds suchas bryophytes (Hallingbäck et al., 1995) or molluscs (Regnier et al.,2009). Additionally, the straightforward use of IUCN criteria on
0006-3207/$ - see front matter � 2010 Elsevier Ltd. All rights reserved.doi:10.1016/j.biocon.2010.09.034
⇑ Corresponding author at: Research Institute for Nature and Forest (INBO),Kliniekstraat 25, B-1070 Brussels, Belgium. Tel.: +32 2 525 02 72; fax: +32 2 558 1805.
E-mail addresses: [email protected] (C. van Swaay), [email protected] (D. Maes), [email protected] (S. Collins), [email protected](M.L. Munguira), [email protected] (M. Šašic), [email protected] (J. Settele),[email protected] (R. Verovnik), [email protected](M. Warren), [email protected] (M. Wiemers), [email protected] (I. Wynhoff), [email protected] (A. Cuttelod).
Biological Conservation 144 (2011) 470–478
Contents lists available at ScienceDirect
Biological Conservation
journal homepage: www.elsevier .com/locate /b iocon

Author's personal copy
sub-global levels (Gärdenfors et al., 2001) poses some problems,especially in small regions (Maes and van Swaay, 1997). This ledto the development of guidelines for the application of the IUCNRed List criteria on regional levels in 2003 (IUCN, 2003).
Butterflies are good indicators for the state of the environmentand due to their short life cycle, narrow niches and relatively lowmobility, they are more sensitive to land-use changes than long-lived animals such as birds and mammals (Thomas et al., 2004;Fleishman and Murphy, 2009). A further advantage of butterfliesis their attractiveness to the general public, making them suitableambassadors of biodiversity changes (Kühn et al., 2008; Schlegeland Rupf, 2010). Among the invertebrates, butterflies are one ofthe best studied insect groups for which both ecological and rela-tively good quantitative distribution data are available in Europe(Kudrna, 2002; van Swaay et al., 2010). The knowledge of butter-flies in Europe is fairly good compared to other parts of the world.However, differences in data quality and quantity among the dif-ferent European countries still remain. In general, the countriesin NW Europe usually have detailed and high quality information,but are poor in species, whereas species-rich countries in S and EEurope often have poor quality data and few people studying but-terflies. This impedes the straightforward application of quantita-tive IUCN criteria by simply amalgamating the information ofdifferent countries.
Here, we illustrate how we applied the IUCN criteria to compilethe new Red List of European butterflies. More precisely, wecompared the strict quantitative use of the IUCN criteria with anapproach that allows for uncertainty, correcting for underestimat-ing the decrease in populations from coarse-scaled grid cells(Akçakaya et al., 2000). We also assessed the Red List status of17 grassland butterflies for which detailed population data wereavailable from butterfly monitoring schemes and compared theoutcome with that of classical distribution data. Finally, based onthe Red List and the additional information on distribution andpopulation trends, we defined criteria to assess conservation prior-ity classes for all European butterflies, so called SPecies of Euro-pean conservation Concern (SPEC’s).
2. Materials and methods
2.1. Geographic scope
For the purpose of this Red List, Europe ranged from Iceland tothe Urals including the European parts of the Russian Federation,
but excluding the Caucasus region and from Franz Josef Land tothe Mediterranean, including the Canary Islands, Madeira and theAzores (Fig. 1). Apart from the analysis for Europe as defined above,we also assessed the threat status in the 27 countries of theEuropean Union (EU27 – Fig. 1). The taxonomy of European butter-flies was updated for the Red List (see Appendix A) and is in con-cordance with the Fauna Europaea database (version September2010).
2.2. IUCN criteria
The IUCN uses five criteria to assess the extinction risk of spe-cies (IUCN, 2001):
(A) a past, present and/or projected population reduction mea-sured over 10 years or 3 generations, whichever is longer;since all European butterflies have a generation time ofmaximum 2 years (Tolman and Lewington, 1997) we used10 years as a time period to estimate changes in populationsizes;
(B) geographic range size in combination with fragmentation,population decline or fluctuations;
(C) small population size in combination with decline orfluctuations;
(D) very small distribution range or restricted population size;(E) a quantitative analysis of extinction probability.
Species are assigned a threat category when satisfying any oneof the criteria A–E.
2.3. Regional assessment
To determine which species to assess for the European Red List,we used the species’ Range affinity, indicating the relationship be-tween the species’ European and global distribution (Kudrna,1986; van Swaay and Warren, 1999). Species for which Europe isat the margin of their distribution range or species having onlytemporary populations in Europe were not assessed (Range affinity1: 48 species – Table 1). As the IUCN Red List criteria are designedto be used at a global level, an adjustment is necessary to definethe European Red List category for species also occurring outsideEurope (IUCN, 2003). The preliminary Red List category of speciesfor which the global distribution area is equally situated withinand outside Europe (Range affinity 2) or mainly situated in Europe
Fig. 1. Quality of the distribution (left) and the trend (right) data as indicated by the national butterfly experts. Black = very good; dark grey = good; light grey = moderate;white = poor. The 27 countries of the European Union are hatched.
C. van Swaay et al. / Biological Conservation 144 (2011) 470–478 471

Author's personal copy
(Range affinity 3), can be downgraded by one category if the Euro-pean populations could be rescued by populations outside Europe.This criterion is only valid for migrant or vagrant butterfly speciessuch as Painted Lady (Vanessa cardui) or African Migrant (Catopsiliaflorella). Since all migrant species were categorized as Least Con-cern, there was no need for downgrading any of the species inthe European Red List. For European endemics (Range affinity 4),the European Red List assessment coincides with the global RedList status and no adjustments of the Red List category wereneeded.
2.4. Data sources for the European Red List
For the compilation of the Red List of European butterflies, weused four data sources.
First, national butterfly experts provided us with the distribu-tion area of each species in their country during the period1999–2008 either as a percentage of the total number of investi-gated squares (i.e., 1 � 1 km2, 5 � 5 km2 or 10 � 10 km2 dependingon the mapping resolution used in each country) or as semi-quan-titative distribution classes (<1%, 1–5%, 5–15%, >15%). For specieswith an Area of Occupancy (AOO) < 50,000 km2 in the previousRed Data Book of European butterflies (van Swaay and Warren,1999), additional information on the present AOO (i.e., the numberof 2 � 2 km2 grid cells), the number of sites, the number of individ-uals and the degree of fragmentation of the populations was asked.The experts also provided a distribution trend (changes in thenumber of grid cells) and, if available, a population trend (changesin the number of individuals) for each species for the period 1999–2008, either as an exact figure or as semi-quantitative trend classes(unknown, extinct, decrease 75–100%, decrease 50–75%, decrease25–50%, decrease 15–25%, stable, increase 125–200%, increase>200%). Finally, the experts were asked to give an estimate of thequality of their data (Very good, Good, Moderate, Poor – Fig. 1).
The second data source was again the previous Red Data Book ofEuropean Butterflies (van Swaay and Warren, 1999) for countrieswhere no updated information was available. Since trends in theprevious Red Data Book were based on a 25-year period, they wererecalculated for a 10-year period assuming a constant exponentialrate of change (i.e. constant proportional rate).
The third data source was the Climatic Risk Atlas of EuropeanButterflies by Settele et al. (2008) in which the projected changesin the distribution of climatic niches over the period 1980–2080
were assessed. For the purpose of this Red List, we used the pro-jected changes under the most severe (the IPCC A1FI) climatechange scenario with a mean expected temperature increase of4.1 �C by 2080, assuming full dispersal. There are indications, how-ever, that this scenario is still underestimating the negative effectsof climate change on species distributions (Rahmstorf et al., 2007).Assuming unlimited dispersal is certainly over-optimistic for mostbutterfly species. The use of these projections of the Climatic RiskAtlas can, therefore, be seen as a conservative approach that tendsto underestimate negative effects. Assuming a constant exponen-tial rate of change (i.e. constant proportional rate) between thepresent-day period (1970–2000) and the period 2051–2080, weconverted this projected trend into a 10-year trend to coincidewith the IUCN criteria. In consultation with the IUCN, the speciesthat were predicted to decline by 98% over 80 years (1970–2000to 2050–2080, equivalent to <30% decline over 10 years) were clas-sified as Near Threatened.
The final data source was the information obtained during twoRed List workshops. A first workshop with 50 national butterfly ex-perts (Laufen, Germany – January 2009) reviewed the preliminaryassessments in biogeographically based subgroups. New data wereadded to the species summaries and maps and provisional Red Listcategories were defined for each species. During a second work-shop (Ankara, Turkey – August 2009), we performed a sensitivityanalysis on the distribution trends by adding uncertainty levelswhen using distribution trends to estimate the extinction risk ofbutterflies (cf. Akçakaya et al., 2000, see Section 2.6). Following thismeeting, all butterfly assessments were reviewed and adjusted,where necessary, in consultation with the IUCN Red List Unit.The final IUCN Red List classifications can, therefore, be regardedas a product of scientific consensus through the application ofsemi-quantitative criteria to determine the extinction risk of allEuropean butterflies, supported by literature and expert datasources.
2.5. Estimating the geographic range of a species in Europe
For all European butterflies, we produced distribution rangemaps based on European distribution data (Kudrna, 2002), nationaland regional atlases and European field guides (Tolman andLewington, 1997; Lafranchis, 2004). From these maps, we calcu-lated the Extent of Occurrence (EOO) for all European butterflies.To obtain the Area of Occupancy (AOO), we subsequently calcu-lated the geographic range of all European species either byweighting the percentual distribution provided by the nationalexperts (based on grid square data) or by using the geometricmeans of the semi-quantitative distribution classes (<1%, 1–5%,5–15% and >15% become 0.1%, 2.24%, 8.66% and 38.73% respec-tively). The geographic range was calculated both for Europe as awhole and for the 27 countries of the European Union (EU27).
2.6. Estimating the European distribution trend
As mentioned above, we performed a sensitivity analysis on thedistribution trend by allowing for a certain level of uncertainty onthe national distribution trend provided by the national butterflyexperts. In consultation with the IUCN, we decided to apply aconservative uncertainty level of 5% for all species (Akçakayaet al., 2000). If no up-to-date information on distribution changeswas available, we converted the 25-year trend in the Red DataBook of European Butterflies (van Swaay and Warren, 1999) intoa 10-year trend assuming a constant exponential rate of change(i.e. constant proportional rate) for the period 1999–2008 to coin-cide with the IUCN criteria. If only trend classes were provided inthe previous Red Data Book (van Swaay and Warren, 1999), wetransformed these classes in the 25-year period classes into a 10-
Table 1The number of butterfly species (percentages in brackets) per IUCN Red List category inEurope as a whole and for the 27 countries of the European Union (EU27). Forcomparison, we also give the number of species in the previous Red List (RL1999 – vanSwaay and Warren, 1999). For Europe as a whole, results with and without uncertaintyclasses are given, while for the EU27 only the result with uncertainty is shown.Percentages do not take into account the species that were Not Assessed or NotEvaluated. The higher number of species assesses in the 1999 Red List is due to the factthat Asian Turkey was included in the analysis.
IUCN Category Europe EU27 RL1999
Withoutuncertainty
Withuncertainty
Regionally Extinct 1 (0.2) 1 (0.2) 2 (0.5) 1 (0.2)Critically Endangered 3 (0.7) 3 (0.7) 2 (0.5) 7 (1.2)Endangered 8 (1.8) 12 (2.8) 9 (2.1) 18 (3.1)Vulnerable 11 (2.5) 22 (5.1) 19 (4.5) 45 (7.8)Near Threatened 25 (5.7) 44 (10.1) 47 (11.2) 42 (7.3)Least Concern 383 (88.0) 349 (80.2) 337 (80.2) 463 (80.4)Data Deficient 4 (0.9) 4 (0.9) 4 (1.0) –Not Applicable or
Not Evaluated48 48 63 –
Species assessed 435 435 420 576
472 C. van Swaay et al. / Biological Conservation 144 (2011) 470–478

Author's personal copy
year period trend: a decrease of 75–100% over a 25-year periodwas transformed into a decrease of 40–100% in the 10-year period,a decrease of 50–75% into 23–40%, a decrease of 25–50% into 10–23%, a decrease of 15–25% into 6–10%, an increase of 125–200%into 109–130% and an increase of >200% into >130%. The Europeandistribution trend was then calculated as the mean trend of allcountries weighted by their area assuming that the Area Of Occu-pancy (AOO) within a country is proportional to the area of itscountry (van Swaay and Warren, 1999), except for the Ukrainewhere only the area for which data were available was used(Transcarpathia). The distribution trend was calculated both forEurope as a whole and for the EU27.
2.7. Estimating the European population trend
The procedure to establish the European population trend wassimilar to the distribution trend, using either the newly providednational population trends or semi-quantitative classes. Since theprevious Red Data Book did not contain population trends, we usedthe distribution trends to derive a population trend for those coun-tries where no such information was provided. In general, the useof 10 � 10 km2 grid cells (used in the previous Red Data Book)underestimates the decrease in population trends by about 35%compared to 2 � 2 km2 grid cells (Thomas and Abery, 1995; Cow-ley et al., 1999). Population trends are strongly correlated withtrends in changes in distribution based on 2 � 2 km2 grid cells(Warren et al., 2001). This resolution was also suggested by theIUCN as units for population trends (IUCN, 2001). The figure of35% was, therefore, used to correct for the reported populationtrends based on 10 � 10 km2 grid cells (Akçakaya et al., 2000). Adecline of 10% on a 10 � 10 km2 grid square basis in the previousRed Data Book, for example, was transformed into a population de-cline of 13.5% for the current trend calculations. The European pop-ulation trend was calculated in a similar way as the Europeandistribution trend, both for Europe as a whole and for the EU27.
2.8. Monitoring European grassland butterflies
Butterfly monitoring schemes are organised in different Euro-pean countries or regions (van Swaay and van Strien, 2008) andaim to assess regional and national trends per species by meansof standardized transect walks (Pollard and Yates, 1993). For 17grassland species, monitoring data were available from 12 coun-tries or regions: Catalunya (NE Spain), Estonia, Finland, Flanders(N Belgium), France, Germany, Jersey (Channel Islands), theNetherlands, Portugal, Argovia (N Switzerland), Transcarpathia(W Ukraine) and the United Kingdom. These data have alreadybeen used to produce the European Grassland indicator (vanSwaay and van Strien, 2008). To illustrate the effect of using de-tailed population data (Van Dyck et al., 2009), we also calculatedthe IUCN Red List category for this limited set of species and com-pared the outcome with the classical IUCN approach describedabove.
2.9. SPecies of European conservation Concern
Apart from compiling a Red List for European butterflies, wealso used the data to determine so called SPecies of Europeanconservation Concern (SPEC’s – van Swaay and Warren, 1999;Keller and Bollmann, 2004) based on the Red List status, endemic-ity and the strength of the decline (Possingham et al., 2002;Fitzpatrick et al., 2007). SPEC’s can be considered as useful toolsin policy making (Rodrigues et al., 2006), for example for the BernConvention (Europe) and/or for the Habitats Directive (in theEU27). Both forms of legislation aim to protect sites for the mostthreatened species and/or to protect species legally.
3. Results
Data quality, as indicated by the national butterfly experts dif-fered considerably over Europe (Fig. 1). Distribution data were,on average, estimated as relatively good (2.46 on a scale from 1very good to 4 poor), while, on average, trend data were qualifiedas moderate (average 2.89).
The strict quantitative use of the IUCN criteria would have clas-sified 23 butterflies as Regionally Extinct or threatened (CriticallyEndangered, Endangered or Vulnerable – Table 1). Allowing foruncertainty in the population trends resulted in the classificationof 38 species as Regionally Extinct or threatened (Table 1). Usingthe detailed population trends from the monitoring transectswould have placed six of the 17 grassland species in a higher andone in a lower threat category (Table 2). Although IUCN permitsthe use of the best information available to estimate extinctionrisks, we preferred to evaluate all species using distribution orpopulation trends, since monitoring data are biased towards NWEurope. The final IUCN Red List category of all 483 European spe-cies together with the IUCN criteria used to classify the speciescan be found in Appendix A.
In the new Red List of European butterflies, Anatolian FalseArgus (Aricia hyacinthus) is the only species classified as RegionallyExtinct. It was known only from SW Romania in the beginning ofthe 20th century (Székely, 2008) and the nearest present-day pop-ulations are in W Turkey (Hesselbarth et al., 1995). 37 species (9%)were classified as threatened and a further 44 species (10%) as NearThreatened (Table 1). The three Critically Endangered species inEurope are: Maderian Large White (Pieris wollastoni – restrictedto the island of Madeira, but probably extinct since it has notbeen observed since the 1980s), Siberian Brown (Coenonymphaphryne – only present in the Ukraine on two small virgin steppesin NE Crimea and in Russia reported as extremely rare) and Mace-donian Grayling (Pseudochazara cingovskii – known from only onelocation of less than 1.5 km2 in Macedonia).
In the EU27, two species were classified as Regionally Extinct:Anatolian False Argus and Nogel’s Hairstreak (Tomares nogelii),both reported only from Romania. Two species are CriticallyEndangered in the EU27: Maderian Large White (see above) andDanube Clouded Yellow (Colias myrmidone), the latter being oneof the most rapidly declining species in the region (Dolek et al.,2005; Konvicka et al., 2008). Thirty species (7%) were consideredthreatened and a further 47 (11%) Near Threatened (Table 1).
The most often used criteria to classify European butterflies intheir final Red List category were criterion A (declining populations
Table 2IUCN Red List category for 17 grassland butterflies using trends based on distributiondata and on monitoring data.
Distribution data Monitoring data
Anthocharis cardamines Least Concern Least ConcernCoenonympha pamphilus Least Concern Near ThreatenedCupido minimus Least Concern Least ConcernCyaniris semiargus Least Concern VulnerableErynnis tages Least Concern Near ThreatenedEuphydryas aurinia Least Concern Least ConcernLasiommata megera Least Concern Near ThreatenedLycaena phlaeas Least Concern Least ConcernManiola jurtina Least Concern Least ConcernOchlodes sylvanus Least Concern Least ConcernPhengaris arion Endangered Critically EndangeredPhengaris nausithous Near Threatened Least ConcernPolyommatus bellargus Least Concern Least ConcernPolyommatus coridon Least Concern Least ConcernPolyommatus icarus Least Concern Least ConcernSpialia sertorius Least Concern Least ConcernThymelicus acteon Near Threatened Vulnerable
C. van Swaay et al. / Biological Conservation 144 (2011) 470–478 473

Author's personal copy
– 47 times) and criterion B (restricted geographic range size, andfragmentation, decline or fluctuations – 22 times). Criterion C(small population size and decline) was only used for SpanishGreenish Black-tip (Euchloe bazae), an extremely local speciesoccurring only in Spain; criterion D (very small population or veryrestricted distribution) was used to classify six species: El HierroGrayling (Hipparchia bacchus), two locations on El Hierro in theCanary islands (Spain); La Palma Grayling (Hipparchia tilosi), fivelocations on La Palma in the Canary islands (Spain); Nevada Blue(Polyommatus golgus), nine locations with an Area Of Occupancy(AOO) of 16 km2 in Sierra Nevada and Sierra de la Sagra (Spain);Andalusian Anomalous Blue (Polyommatus violetae), a few loca-tions in the Sierras of Almijara, Tejeda, Cazorla and La Sagra
(Spain), Brown’s Grayling (Pseudochazara amymone), four locationsin NW Greece and Dils’ Grayling (Pseudochazara orestes), five loca-tions along the border between Greece and Bulgaria.
The SPecies of European conservation Concern with the highestconservation priority (SPEC1) are the Regionally Extinct andthreatened species (38 and 32 species in the whole of Europeand in the EU27 respectively – Tables 3a and 3b). A second conser-vation priority (SPEC2) concerns all Near Threatened species (44and 47 species in Europe and in the EU27 respectively – Tables3a and 3b). Additionally, species that are of Least Concern, butshow a declining population trend in at least 35% of the countries,consist a third (overall decline >10% – SPEC3) and fourth (overalldecline <10% – SPEC4) conservation priority (Tables 3a and 3b).
Table 3aConservation priority classes of the SPecies of European conservation Concern (SPEC’s) in the whole of Europe. The numbers shown in brackets is the numberof species in each conservation priority class. (II) = the species is already listed on the Bern Convention Annex II.
Regionally Extinct in Europe Near Threatened in Europe Decline in P35% of the European countries
Critically Endangered in Europe Decline > 10% Decline < 10%Endangered in EuropeVulnerable in Europe
Conservation priority
SPEC1 SPEC2 SPEC3 SPEC4
European endemics (22) European endemics (11) European endemics (3) European endemics (3)
Coenonympha orientalis Colias phicomone Erebia manto Melitaea parthenoidesErebia christi (II) Erebia claudina Hipparchia maderensis Plebejus hespericusErebia sudetica (II) Erebia epistygne Melitaea asteria Pseudophilotes batonEuchloe bazae Erebia flavofasciataGonepteryx cleobule Hipparchia fagi Non-endemics (19) Non-endemics (6)Gonepteryx maderensis Hipparchia leighebiHipparchia bacchus Hipparchia sbordonii Argynnis niobe Boloria friggaHipparchia tilosi Plebejus trappi Boloria freija Colias palaenoPararge xiphia Polyommatus nephohiptamenos Colias tyche Euphydryas aurinia (II)Pieris cheiranthi Polyommatus nivescens Erebia embla Oeneis borePieris wollastoni Pseudophilotes panoptes Glaucopsyche alexis Oeneis juttaPlebejus zullichi Hamearis lucina Plebejus sephirusPolyommatus galloi Non-endemics (33) Hesperia comma (II)Polyommatus golgus (II) Hyponephele lycaonPolyommatus humedasae (II) Archon apollinus Lycaena hippothoePolyommatus orphicus Aricia anteros Lycaena thersamonPolyommatus violetae Boloria chariclea Melanargia occitanicaPseudochazara amymone Boloria titania Neolycaena rhymnusPseudochazara cingovskii Carcharodus flocciferus Nymphalis vaualbumPseudochazara euxina Carcharodus lavatherae Papilio alexanorPseudochazara orestes Chazara briseis Phengaris alconPyrgus cirsii Colias hecla Pseudophilotes bavius
Cupido decoloratus Pyronia tithonusNon-endemics (16) Euphydryas desfontainii Satyrium ilicis
Euphydryas iduna Tomares callimachusAricia hyacinthus Hipparchia hermioneBoloria improba Hipparchia statilinusBoloria polaris Iolana iolasCoenonympha hero (II) Leptidea morseiCoenonympha oedippus (II) Maniola halicarnassusCoenonympha phryne Melitaea aureliaCoenonympha tullia Melitaea britomartisColias chrysotheme Muschampia cribrellumColias myrmidone Oeneis nornaEuphydryas maturna (II) Parnassius apollo (II)Lopinga achine (II) Parnassius mnemosyne (II)Lycaena helle Parnassius phoebusPhengaris arion (II) Phengaris nausithous (II)Phengaris teleius (II) Plebejus dardanusTomares nogelii Plebejus pylaonTuranana taygetica Polyommatus damon
Polyommatus dorylasPolyommatus erosPseudophilotes vicramaThymelicus acteonZegris euphemeZerynthia cerisy
474 C. van Swaay et al. / Biological Conservation 144 (2011) 470–478

Author's personal copy
4. Discussion
Despite regional differences in data quality, we managed toapply quantitative IUCN criteria to estimate the extinction risk ofEuropean butterflies. Allowing for uncertainty in data accuracy(Akçakaya et al., 2000) and applying the precautionary principle(Kriebel et al., 2001), we classified about 19% of all European but-terflies as threatened (i.e., Critically Endangered, Endangered orVulnerable) or Near Threatened. The use of detailed monitoringdata for a limited set of grassland species, however, showed thatcoarse-scale grid cell data and population trends strongly underes-
timate extinction risks. The new European Red List of butterfliesshould, therefore, be seen as rather conservative (i.e., only listingclearly threatened species). However, it is also an opportunity todemonstrate the rapid loss of European butterflies and the needfor urgent conservation action.
4.1. Data quality and the use of IUCN criteria for European butterflies
Data quality differed considerably among countries and also be-tween distribution and trend data. 53% of the European countriesestimated their distribution data as good, while only 21% estimated
Table 3bConservation priority classes of the SPecies of European conservation Concern (SPEC’s) in the 27 countries of the European Union (EU27). The figure shown in brackets isthe number of species in each conservation priority class. (II), (IV), (II/IV) = the species is already listed on the Habitat Directive Annexes II or IV or both.
Regionally Extinct in EU27 Near Threatened in EU27 Decline in P35% of the EU27 countries
Critically Endangered in EU27 Decline > 10% Decline < 10%Endangered in EU27Vulnerable in EU27
Conservation priority
SPEC1 SPEC2 SPEC3 SPEC4
European endemics (19) European endemics (10) European endemics (6) European endemics (2)
Erebia christi (II/IV) Colias phicomone Erebia manto Erebia nivalisErebia sudetica (II/IV) Erebia claudina Erebia melas Plebejus hespericusEuchloe bazae Erebia epistygne Hipparchia maderensisGonepteryx cleobule Erebia flavofasciata Hipparchia semele Non-endemics (17)Gonepteryx maderensis Hipparchia fagi Oeneis glacialisHipparchia bacchus Hipparchia leighebi Pyrgus warrenensis Argynnis aglajaHipparchia tilosi Hipparchia sbordonii Boloria euphrosynePararge xiphia Polyommatus nephohiptamenos Non-endemics (16) Boloria friggaPieris cheiranthi Polyommatus nivescens Boloria selenePieris wollastoni Pseudophilotes panoptes Boloria freija Colias palaenoPlebejus zullichi Boloria thore Colias tychePolyommatus galloi Non-endemics (37) Coenonympha oedippus Cyaniris semiargusPolyommatus golgus (IV) Erebia aethiops Erebia ligeaPolyommatus humedasae Argynnis laodice Erebia embla Erebia medusaPolyommatus orphicus Argynnis niobe Euphydryas maturna (II/IV) Erynnis tagesPolyommatus violetae Boloria chariclea Hesperia comma (II) Euphydryas aurinia (II)Pseudochazara amymone Carcharodus lavatherae Lycaena helle (II/IV) Hamearis lucinaPseudochazara orestes Chazara briseis Melanargia occitanica Lycaena virgaureaePyrgus cirsii Coenonympha tullia Melitaea aurelia Oeneis bore
Colias hecla Melitaea cinxia Oeneis juttaNon-endemics (13) Euphydryas desfontainii Parnassius mnemosyne (II/IV) Pyrgus centaureae
Euphydryas iduna Polyommatus admetus Pyrgus malvaeAricia hyacinthus Hipparchia hermione Polyommatus bellargusBoloria improba (II) Hipparchia statilinus Pyrgus armoricanusBoloria polaris Iolana iolas Satyrium ilicisCoenonympha hero (II/IV) Limenitis populiColias chrysotheme Lycaena alciphronColias myrmidone (II/IV) Lycaena hippothoeLeptidea morsei (II/IV) Maniola halicarnassusLopinga achine (IV) Melitaea britomartisNymphalis vaualbum (II/IV) Melitaea diaminaPhengaris arion (II/IV) Melitaea triviaPhengaris teleius (II/IV) Muschampia cribrellumTomares nogelii Nymphalis xanthomelasTuranana taygetica Oeneis norna
Parnassius apollo (II/IV)Parnassius phoebusPhengaris alconPhengaris nausithous (II/IV)Plebejus dardanusPolyommatus damonPolyommatus dorylasPolyommatus eros (II/IV)Polyommatus ripartiiPseudophilotes vicramaPyrgus serratulaeScolitantides orionThymelicus acteonZegris euphemeZerynthia cerisy
C. van Swaay et al. / Biological Conservation 144 (2011) 470–478 475
Author's personal copy
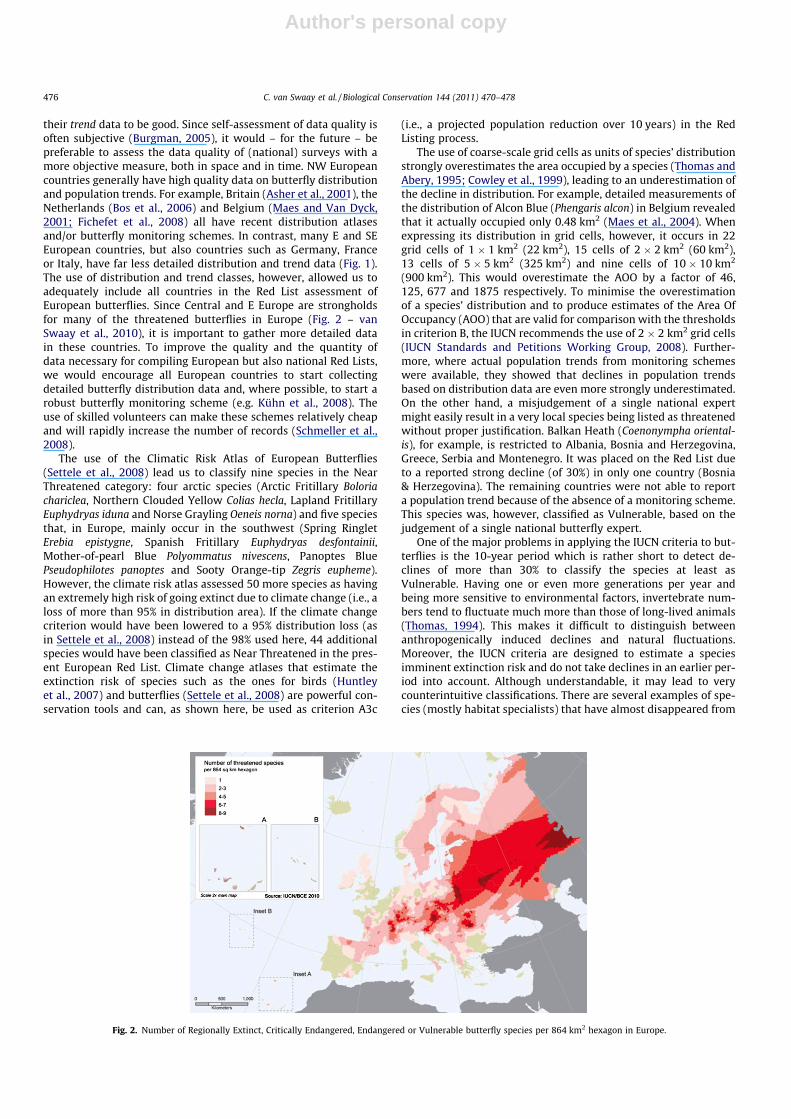
their trend data to be good. Since self-assessment of data quality isoften subjective (Burgman, 2005), it would – for the future – bepreferable to assess the data quality of (national) surveys with amore objective measure, both in space and in time. NW Europeancountries generally have high quality data on butterfly distributionand population trends. For example, Britain (Asher et al., 2001), theNetherlands (Bos et al., 2006) and Belgium (Maes and Van Dyck,2001; Fichefet et al., 2008) all have recent distribution atlasesand/or butterfly monitoring schemes. In contrast, many E and SEEuropean countries, but also countries such as Germany, Franceor Italy, have far less detailed distribution and trend data (Fig. 1).The use of distribution and trend classes, however, allowed us toadequately include all countries in the Red List assessment ofEuropean butterflies. Since Central and E Europe are strongholdsfor many of the threatened butterflies in Europe (Fig. 2 – vanSwaay et al., 2010), it is important to gather more detailed datain these countries. To improve the quality and the quantity ofdata necessary for compiling European but also national Red Lists,we would encourage all European countries to start collectingdetailed butterfly distribution data and, where possible, to start arobust butterfly monitoring scheme (e.g. Kühn et al., 2008). Theuse of skilled volunteers can make these schemes relatively cheapand will rapidly increase the number of records (Schmeller et al.,2008).
The use of the Climatic Risk Atlas of European Butterflies(Settele et al., 2008) lead us to classify nine species in the NearThreatened category: four arctic species (Arctic Fritillary Boloriachariclea, Northern Clouded Yellow Colias hecla, Lapland FritillaryEuphydryas iduna and Norse Grayling Oeneis norna) and five speciesthat, in Europe, mainly occur in the southwest (Spring RingletErebia epistygne, Spanish Fritillary Euphydryas desfontainii,Mother-of-pearl Blue Polyommatus nivescens, Panoptes BluePseudophilotes panoptes and Sooty Orange-tip Zegris eupheme).However, the climate risk atlas assessed 50 more species as havingan extremely high risk of going extinct due to climate change (i.e., aloss of more than 95% in distribution area). If the climate changecriterion would have been lowered to a 95% distribution loss (asin Settele et al., 2008) instead of the 98% used here, 44 additionalspecies would have been classified as Near Threatened in the pres-ent European Red List. Climate change atlases that estimate theextinction risk of species such as the ones for birds (Huntleyet al., 2007) and butterflies (Settele et al., 2008) are powerful con-servation tools and can, as shown here, be used as criterion A3c
(i.e., a projected population reduction over 10 years) in the RedListing process.
The use of coarse-scale grid cells as units of species’ distributionstrongly overestimates the area occupied by a species (Thomas andAbery, 1995; Cowley et al., 1999), leading to an underestimation ofthe decline in distribution. For example, detailed measurements ofthe distribution of Alcon Blue (Phengaris alcon) in Belgium revealedthat it actually occupied only 0.48 km2 (Maes et al., 2004). Whenexpressing its distribution in grid cells, however, it occurs in 22grid cells of 1 � 1 km2 (22 km2), 15 cells of 2 � 2 km2 (60 km2),13 cells of 5 � 5 km2 (325 km2) and nine cells of 10 � 10 km2
(900 km2). This would overestimate the AOO by a factor of 46,125, 677 and 1875 respectively. To minimise the overestimationof a species’ distribution and to produce estimates of the Area OfOccupancy (AOO) that are valid for comparison with the thresholdsin criterion B, the IUCN recommends the use of 2 � 2 km2 grid cells(IUCN Standards and Petitions Working Group, 2008). Further-more, where actual population trends from monitoring schemeswere available, they showed that declines in population trendsbased on distribution data are even more strongly underestimated.On the other hand, a misjudgement of a single national expertmight easily result in a very local species being listed as threatenedwithout proper justification. Balkan Heath (Coenonympha oriental-is), for example, is restricted to Albania, Bosnia and Herzegovina,Greece, Serbia and Montenegro. It was placed on the Red List dueto a reported strong decline (of 30%) in only one country (Bosnia& Herzegovina). The remaining countries were not able to reporta population trend because of the absence of a monitoring scheme.This species was, however, classified as Vulnerable, based on thejudgement of a single national butterfly expert.
One of the major problems in applying the IUCN criteria to but-terflies is the 10-year period which is rather short to detect de-clines of more than 30% to classify the species at least asVulnerable. Having one or even more generations per year andbeing more sensitive to environmental factors, invertebrate num-bers tend to fluctuate much more than those of long-lived animals(Thomas, 1994). This makes it difficult to distinguish betweenanthropogenically induced declines and natural fluctuations.Moreover, the IUCN criteria are designed to estimate a speciesimminent extinction risk and do not take declines in an earlier per-iod into account. Although understandable, it may lead to verycounterintuitive classifications. There are several examples of spe-cies (mostly habitat specialists) that have almost disappeared from
Fig. 2. Number of Regionally Extinct, Critically Endangered, Endangered or Vulnerable butterfly species per 864 km2 hexagon in Europe.
476 C. van Swaay et al. / Biological Conservation 144 (2011) 470–478

Author's personal copy
W and C Europe in the second half of the 20th century (resulting ina population decline of more than 80%), but the few remainingpopulations have been maintained and are either stable or showslow declines of less than 30% partly as a result of huge conserva-tion efforts. Examples include Moorland Clouded Yellow (Coliaspalaeno – Nilsson et al., 2008) and Cranberry Fritillary (Boloriaaquilonaris – Baguette and Schtickzelle, 2003) in peat bogs, FalseRinglet (Coenonympha oedippus – Lhonoré and Lagarde, 1999; Celiket al., 2009) and Violet Copper (Lycaena helle – Bauerfeind et al.,2009) in wetlands and Scarce Fritillary (Euphydryas maturna –Cizek and Konvicka, 2005) in coppiced woodlands. Because of astrong decline in the second half of the 20th century, False Ringlet,for example, was listed as one of the most threatened species in theprevious Red Data Book of European butterflies (van Swaay andWarren, 1999) but is now classified as Least Concern in theEU27. Most of these species used to be much more common andwidespread in Europe, and are thought to belong to the most threa-tened species by many butterfly experts. However, since they de-clined by less than 30% in the last 10 years, they were classifiedas non-threatened in the present Red List. The number of individ-uals in populations of these species may appear stable to expertsvisiting the sites on an irregular basis. Over several decades, how-ever, such species have often become extinct across large regions(even in nature reserves) due to gradual but permanent habitatdeterioration and natural fluctuations. Since such fluctuations areof much higher amplitude in insects than in vertebrates, they canmore easily lead to extinctions. Considering a longer time period(e.g., 25 years) to estimate extinction risks, would, therefore, beadvisable for butterflies and possibly also for other invertebrates.
A straightforward comparison of the Red Data Book (van Swaayand Warren, 1999) and the present Red List (van Swaay et al.,2010) is not possible due to differences in methodology, spatial ex-tent and time-scales used between both lists. Compared to the pre-vious Red List, a smaller number of species was now categorized asthreatened (Table 1). However, applying the methodology of 1999to the present data would have classified 112 species in a higherand 37 in a lower Red List category than with the latest IUCN meth-odology (analysis not shown but see van Swaay and Warren(1999)). Using the 1999 methodology, 19 (4%) more species wouldhave been classified in the present Red List as Regionally Extinct orthreatened (Critically Endangered, Endangered or Vulnerable) and49 (10%) as Near Threatened. The lower number of threatened spe-cies in the present list can, therefore, at least partly be attributed tothe more conservative new IUCN criteria. Other methodologicaldifferences, e.g. the fact that Asian Turkey was included in the pre-vious Red List, also make it impossible to compare both lists (Keithand Burgman, 2004).
4.2. Conservation and policy implications
With about 9% of the European butterflies classified as threa-tened and an additional 10% as Near Threatened, our results showthat declines in butterfly diversity have certainly not been halted.In total, we determined 113 and 120 SPEC’s for Europe and forthe EU27 respectively (Tables 3a and 3b). Twenty-two of these spe-cies are already on the Bern Convention or Habitat Directive An-nexes (Tables 3a and 3b). For all SPEC’s, we would recommendthe compilation of species action plans describing the causes of de-cline and the management and policy actions required (e.g., Mun-guira and Martín, 1999). An underpinned Red List and improvedlegislation protecting both suitable biotopes and species are, there-fore, both important to stimulate butterfly conservation in Europe.The protection of sites of the most threatened butterfly speciescould focus on so called Prime Butterfly Areas (PBA’s), that aredelineated on the basis of a target-species list of butterflies (Euro-pean importance, conservation priority, etc.). The list of SPEC’s pre-
sented here would be a good complement to the list of species thatwas used to delineate the present PBA’s because it involves morespecies (113 instead of 34), a larger variety of biotopes (e.g., tundra,subalpine meadows) and more biogeographical regions (especiallyN European species are under-represented in the present target-species PBA list). PBA’s have already been described for Europe(van Swaay and Warren, 2003), have recently been updated forBulgaria (Abadjiev and Beshkov, 2007) and Serbia (Jakšic, 2008)and a revision is being prepared for Turkey.
Acknowledgements
We thank all national and regional butterfly experts for provid-ing us with the distribution and trend data of their country: J. Dan-tart (Andorra), H. Höttinger (Austria), A. Kulak (Belarus), V. Fichefet(Belgium), S. Lelo (Bosnia & Herzegovina), S. Beshkov (Bulgaria), I.Mihoci (Croatia), E. John (Cyprus), M. Konvicka, J. Beneš, P. Kepka(Czech Republic), M. Kavin (Denmark), T. Tammaru (Estonia), J.Kullberg (Finland), L. Manil (France), C. Stettmer (Germany), K.Papapavlou (Greece), Á. K}orösi, S. Szabolcs (Hungary), E. Olafsson(Iceland), D. Nash (Ireland), E. Balletto, S. Bonelli, D. Patricelli(Italy), N. Savenkov (Latvia), E. Aistleitner (Liechtenstein), G. Svitra,D. Dapkus (Lithuania), M. Meyer (Luxembourg), B. Micevski (Mac-edonia), L. Cassar (Malta), C. Steel (Norway), M. Sielezniew (Po-land), P. Garcia-Pereira, E. Maravalhas (Portugal), S. Mihut(Romania), A.L. Devyatkin (Russia), P. Jakšic (Serbia), H. Kalivoda,M. Kulfan (Slovakia), H. Romo, E. García-Barros, C. Stefanescu(Spain), N. Ryrholm (Sweden), G. Dusej, G. Carron� (Switzerland),E. Karaçetin (Turkey), A.S. Popov (Ukraine). The European ButterflyAssessments were initiated and financed by the European Commis-sion (Service Contract No. 070307/2007/483305/MAR/B2). TheBayerische Akademie für Naturschutz (with support from theHelmholtz Centre for Environmental Research – UFZ) and the DogaKoruma Merkezi (Nature Conservation Centre) for organising andfinancing the two Red List workshops in Germany and Turkeyrespectively. We also thank H. Temple (IUCN) for co-ordinatingthe Red List project during the first year and R. Akçakaya (USA/Tur-key) for discussing and developing the ideas on how to take uncer-tainty into account. We thank two anonymous referees for usefulcomments on a previous version of the manuscript.
Appendix A. Supplementary material
Supplementary data associated with this article can be found, inthe online version, at doi:10.1016/j.biocon.2010.09.034.
References
Abadjiev, S., Beshkov, S., 2007. Prime Butterfly Areas in Bulgaria. Pensoft, Sofia.Akçakaya, H.R., Ferson, S., Burgman, M.A., Keith, D.A., Mace, G.M., Todd, C.R., 2000.
Making consistent IUCN classifications under uncertainty. Conservation Biology14, 1001–1013.
Asher, J., Warren, M., Fox, R., Harding, P., Jeffcoate, G., Jeffcoate, S., 2001. Themillennium atlas of butterflies in Britain and Ireland. Oxford University Press,Oxford.
Baguette, M., Schtickzelle, N., 2003. Local population dynamics are important to theconservation of metapopulations in highly fragmented landscapes. Journal ofApplied Ecology 40, 404–412.
Baillie, J.E.M., Hilton-Taylor, C., Stuart, S.N., 2004. A Global Species Assessment.IUCN, Gland, Switzerland and Cambridge, UK.
Bauerfeind, S.S., Theisen, A., Fischer, K., 2009. Patch occupancy in the endangeredbutterfly Lycaena helle in a fragmented landscape: effects of habitat quality,patch size and isolation. Journal of Insect Conservation 13, 271–277.
Bos, F., Bosveld, M., Groenendijk, D., van Swaay, C.A.M., Wynhoff, I., DeVlinderstichting, 2006. De dagvlinders van Nederland. Verspreiding enbescherming (Lepidoptera: Hesperioidea, Papilionoidea). NationaalNatuurhistorisch Museum Naturalis; KNNV Uitgeverij; European InvertebrateSurvey, Leiden.
Burgman, M.A., 2005. Risks and Decisions for Conservation and EnvironmentalManagement. Cambridge University Press, Cambridge, UK.
C. van Swaay et al. / Biological Conservation 144 (2011) 470–478 477

Author's personal copy
Celik, T., Vres, B., Seliskar, A., 2009. Determinants of within-patch microdistributionand movements of endangered butterfly Coenonympha oedippus (Fabricius,1787) (Nymphalidae: Satyrinae). Hacquetia 8, 115–128.
Cizek, O., Konvicka, M., 2005. What is a patch in a dynamic metapopulation?Mobility of an endangered woodland butterfly, Euphydryas maturna. Ecography28, 791–800.
Collar, N.J., Crosby, M.J., Stattersfield, A.J., 1994. Birds to Watch2 – the World List ofThreatened Birds. Birdlife International, Cambridge, UK.
Cowley, M.J.R., Thomas, C.D., Thomas, J.A., Warren, M.S., 1999. Flight areas of Britishbutterflies: assessing species status and decline. Proceedings of the RoyalSociety London B 266, 1587–1592.
Dolek, M., Freese, A., Geyer, A., Stetter, H., 2005. The decline of Colias myrmidone atthe western edge of its range and notes on its habitat requirements. Biologia 60,607–610.
Fichefet, V., Barbier, Y., Baugnée, J.-Y., Dufrêne, M., Goffart, P., Maes, D., Van Dyck, H.,2008. Papillons de jour de Wallonie (1985–2007). Groupe de TravailLépidoptères Lycaena, Département de l’Etude du Milieu Naturel et Agricole(SPW/DGARNE), Gembloux.
Fitter, R., Fitter, M., 1987. The Road to Extinction. IUCN, Gland, Switzerland.Fitzpatrick, U., Murray, T.E., Paxton, R.J., Brown, M.J.F., 2007. Building on IUCN
regional red lists to produce lists of species of conservation priority: a modelwith Irish bees. Conservation Biology 21, 1324–1332.
Fleishman, E., Murphy, D.D., 2009. A realistic assessment of the indicator potentialof butterflies and other charismatic taxonomic groups. Conservation Biology 23,1109–1116.
Gärdenfors, U., Hilton-Taylor, C., Mace, G.M., Rodríguez, J.P., 2001. The application ofIUCN Red List criteria at regional levels. Conservation Biology 15, 1206–1212.
Hallingbäck, T., Hodgetts, N.G., Urmi, E., 1995. How to apply the new IUCN Red Listcategories to Bryophytes. Species 24, 37–41.
Hesselbarth, G., van Oorschot, H., Wagener, S., 1995. Die Tagfalter der Türkei unterBerücksichtigung der angrenzenden Länder. Selbstverlag Sigbert Wagener,Bocholt.
Huntley, B., Green, R.E., Collingham, C., Willis, S., 2007. A Climate Atlas of EuropeanBreeding Birds. Durham University,The RSPB and Lynx Editions, Barcelona.
IUCN, 2001. IUCN Red List Categories and Criteria: Version 3.1. IUCN SpeciesSurvival Commission, Gland, Switzerland/Cambridge, UK.
IUCN, 2003. Guidelines for Application of IUCN Red List Criteria at Regional Levels:Version 3.0. IUCN Species Survival Commission, IUCN, Gland, Switzerland andCambridge, UK.
IUCN Standards and Petitions Working Group, 2008. Guidelines for Using the IUCNRed List Categories and Criteria. Version 7.0. Prepared by the Standards andPetitions Working Group of the IUCN SSC Biodiversity Assessments Sub-Committee. IUCN, Gland, Switzerland and Cambridge, UK.
Jakšic, P., 2008. Prime Butterfly Areas in Serbia. HabiProt, Beograd.Keith, D.A., Burgman, M.A., 2004. The Lazarus effect: can the dynamics of extinct
species lists tell us anything about the status of biodiversity? BiologicalConservation 117, 41–48.
Keller, V., Bollmann, K., 2004. From red lists to species of conservation concern.Conservation Biology 18, 1636–1644.
Konvicka, M., Benes, J., Cizek, O., Kopecek, F., Konvicka, O., Vitaz, L., 2008. How toomuch care kills species: Grassland reserves, agri-environmental schemes andextinction of Colias myrmidone (Lepidoptera: Pieridae) from its formerstronghold. Journal of Insect Conservation 12, 519–525.
Kriebel, D., Tickner, J., Epstein, P., Lemons, J., Levins, R., Loechler, E.L., Quinn, M.,Rudel, R., Schettler, T., Stoto, M., 2001. The precautionary principle inenvironmental science. Environmental Health Perspectives 109, 871–876.
Kudrna, O., 1986. Aspects of the conservation of butterflies in Europe. AULA-Verlag,Wiesbaden.
Kudrna, O., 2002. The distribution atlas of European butterflies. Oedippus 20, 1–342.Kühn, E., Feldmann, R., Harpke, A., Hirneisen, N., Musche, M., Leopold, P., Settele, J.,
2008. Getting the public involved in butterfly conservation: lessons learnedfrom a new monitoring scheme in Germany. Israel Journal of Ecology &Evolution 54, 89–103.
Lafranchis, T., 2004. Butterflies of Europe. New Field Guide and Key. Diatheo, Paris,France.
Lhonoré, J., Lagarde, M., 1999. Biogeography, ecology and conservation ofCoenonympha oedippus (Fab., 1787) (Lepidoptera: Nymphalidae: Satyrinae).Annales de La Société Entomologique de France 35, 299–307.
Mace, G.M., Lande, R., 1991. Assessing extinction threats: toward a re-evaluation ofIUCN threatened species categories. Conservation Biology 5, 148–157.
Mace, G.M., Collar, N.J., Gaston, K.J., Hilton-Taylor, C., Akçakaya, H.R., Leader-Williams, N., Milner-Gulland, E.J., Stuart, S.N., 2008. Quantification of extinctionrisk: IUCN’s system for classifying threatened species. Conservation Biology 22,1424–1442.
Maes, D., van Swaay, C.A.M., 1997. A new methodology for compiling nationalRed Lists applied on butterflies (Lepidoptera, Rhopalocera) in Flanders (N.-Belgium) and in The Netherlands. Journal of Insect Conservation 1, 113–124.
Maes, D., Van Dyck, H., 2001. Butterfly diversity loss in Flanders (north Belgium):Europe’s worst case scenario? Biological Conservation 99, 263–276.
Maes, D., Vanreusel, W., Talloen, W., Van Dyck, H., 2004. Functional conservationunits for the endangered Alcon Blue butterfly Maculinea alcon in Belgium(Lepidoptera, Lycaenidae). Biological Conservation 120, 229–241.
Munguira, M.L., Martín, J., 1999. Action plan for the Maculinea butterflies in Europe.Nature and Environment No. 97. Council of Europe, Strasbourg.
Nilsson, S.G., Franzen, M., Jonsson, E., 2008. Long-term land-use changes andextinction of specialised butterflies. Insect Conservation and Diversity 1, 197–207.
Pollard, E., Yates, T.J., 1993. Monitoring butterflies for ecology and conservation. TheBritish Butterfly Monitoring Scheme. Chapman & Hall, London.
Possingham, H.P., Andelman, S.J., Burgman, M.A., Medellín, R.A., Master, L.L., Keith,D.A., 2002. Limits to the use of threatened species lists. Trends in Ecology &Evolution 17, 503–507.
Rahmstorf, S., Cazenave, A., Church, J.A., Hansen, J.E., Keeling, R.F., Parker, D.E.,Somerville, R.C.J., 2007. Recent climate observations compared to projections.Science 316, 709.
Regnier, C., Fontaine, B., Bouchet, P., 2009. Not knowing, not recording, not listing:numerous unnoticed mollusk extinctions. Conservation Biology 23, 1214–1221.
Rodrigues, A.S.L., Pilgrim, J.D., Lamoreux, J.F., Hoffmann, M., Brooks, T.M., 2006. Thevalue of the IUCN Red List for conservation. Trends in Ecology & Evolution 21,71–76.
Schlegel, J., Rupf, R., 2010. Attitudes towards potential animal flagship species innature conservation: a survey among students of different educationalinstitutions. Journal for Nature Conservation 18, 278–290.
Schmeller, D.S., Henry, P.-Y., Julliard, R., Gruber, B., Clobert, J., Dziock, F., Lengyel, S.,Nowicki, P., D’Eri, E., Budrys, E., Kull, T., Tali, K., Bauch, B., Settele, J., van Swaay,C.A.M., Kobler, A., Babij, V., Papastergiadou, E., Henle, K., 2008. Advantages ofvolunteer-based biodiversity monitoring in Europe. Conservation Biology 23,307–316.
Settele, J., Kudrna, O., Harpke, A., Kühn, I., van Swaay, C., Verovnik, R., Warren, M.,Wiemers, M., Hanspach, J., Hickler, T., Kühn, E., van Halder, I., Veling, K.,Vliegenthart, A., Wynhoff, I., Schweiger, O., 2008. Climatic risk atlas of Europeanbutterflies. BioRisk 1, 1–710.
Székely, L., 2008. Fluturii de zi din România. Brasov County History Museum,Brasov.
Thomas, C.D., Abery, J.C.G., 1995. Estimating rates of butterfly decline fromdistribution maps: the effect of scale. Biological Conservation 73, 59–65.
Thomas, J.A., 1994. Why small cold-blooded insects pose different conservationproblems to birds in modern landscapes. Ibis 137, 112–119.
Thomas, J.A., Telfer, M.G., Roy, D.B., Preston, C.D., Fox, R., Clarke, R.T., Lawton, J.H.,2004. Comparative losses in British butterflies, birds, and plants and the globalextinction crisis. Science 303, 1879–1881.
Tolman, T., Lewington, R., 1997. Butterflies of Britain and Europe. HarperCollins,London.
Van Dyck, H., van Strien, A.J., Maes, D., van Swaay, C.A.M., 2009. Declines incommon, widespread butterflies in a landscape under intense human use.Conservation Biology 23, 957–965.
van Swaay, C.A.M., Warren, M.S., 1999. Red Data Book of European Butterflies(Rhopalocera), Nature and Environment No. 99. Council of Europe Publishing,Strasbourg.
van Swaay, C.A.M., Warren, M.S., 2003. Prime Butterfly Areas in Europe: PrioritySites for Conservation. National Reference Centre for Agriculture, Nature andFisheries, Ministry of Agriculture, Nature Management and Fisheries,Wageningen, The Netherlands.
van Swaay, C.A.M., van Strien, A.J., 2008. The European Butterfly Indicator forGrassland Species 1990–2007. De Vlinderstichting, Wageningen.
van Swaay, C.A.M., Cuttelod, A., Collins, S., Maes, D., Munguira, M.L., Sasic, M.,Settele, J., Verovnik, R., Verstrael, T., Warren, M.S., Wiemers, M., Wynhoff, I.,2010. European Red List of Butterflies. Publications Office of the EuropeanUnion, Luxembourg.
Vié, J.-C., Hilton-Taylor, C., Stuart, S.N., 2009. Wildlife in a Changing World – AnAnalysis of the 2008 IUCN Red List of Threatened Species. IUCN, Gland,Switzerland.
Warren, M.S., Hill, J.K., Thomas, J.A., Asher, J., Fox, R., Huntley, B., Roy, D.B., Telfer,M.G., Jeffcoate, S., Harding, P., Jeffcoate, G., Willis, S.G., Greatorex-Davies, J.N.,Moss, D., Thomas, C.D., 2001. Rapid responses of British butterflies to opposingforces of climate and habitat change. Nature 414, 65–69.
478 C. van Swaay et al. / Biological Conservation 144 (2011) 470–478