Applying Bio-Slow Sand Filtration for Water Treatment
10
Introduction Water-borne typhus, dysentery, viral hepatitis, diarrhoea, and other intestinal infectious diseases are the prevailing diseases in the rural areas in China. The harvested rainwater is easily contaminated by air pollution, surface run-off fertilizer and pesticides, solid waste and chips at the rainwater-harvesting surface (rubbish, animal faeces, etc.), and anthropogenic pollution. With the development of technology, products made of ceramic filters have been widely used in cities where tapwater is available. However, as a drawback, ceramic filters do not apply to those rural single- household families without access to water pressure. In addition, the filter has a certain service life, and it has to be frequently replaced if water quality is poor, which will burden water users with unbearable costs. Pol. J. Environ. Stud. Vol. 28, No. 4 (2019), 2243-2251 Original Research Applying Bio-Slow Sand Filtration for Water Treatment Laisheng Liu 1 *, Yicheng Fu 1 , Qingyong Wei 2 , Qiaomei Liu 2 , Leixiang Wu 1 , Jiapeng Wu 1 , Weijie Huo 1 1 State Key Laboratory of Simulation and Regulation of River Basin Water Cycle, China Institute of Water Resources and Hydropower Research, Beijing, China 2 River Engineering Management Department of Liaocheng, Liaocheng, Shandong Province, China Received: 11 February 2018 Accepted: 26 March 2018 Abstract Due to the shortage of water resources in China, the state has implemented a series of rainwater harvesting projects. The safety of water quality cannot be guaranteed due to the lack of an effective construction, running, and management system. Slow filters are low-maintenance systems that do not require special equipment. In order to improve the performance of SSF in terms of the removal of bacteria and solid granules, e.g., the microorganisms attached to the surface of a single grain of the filtering material under a scanning electron microscope (50×) have been studied. Based on the improvements of conventional slow sand filtration (SSF), the bio-slow sand filtration method has effectively mitigated and helps to remove bacteria and other microbiological contaminants, as well as heavy metals, ammonia, nitrogen, organic material, and turbidity of the harvested rainwater. The removal efficiency of bio- slow sand filtration was approximately 20-30% on particulate organic carbon, above 95% on ammonia- nitrogen, and better than 96%, 95%, 95%, 80%, 70%, and 60% on Cu 2+ , Cd 2+ , Fe 2+ , Zn 2+ , Mn 2+ , and Pb 2+ , respectively. The effluent quality meets the requirements of “standards for drinking water quality” in China. The result indicated the bio-slow sand filtration method could achieve better water quality results as an available water treatment technology. Keywords: water treatment, rainwater, bio-slow sand filtration, water quality *e-mail: [email protected] DOI: 10.15244/pjoes/89544 ONLINE PUBLICATION DATE: 2019-01-02
-
Upload
khangminh22 -
Category
Documents
-
view
0 -
download
0
Transcript of Applying Bio-Slow Sand Filtration for Water Treatment

Introduction
Water-borne typhus, dysentery, viral hepatitis, diarrhoea, and other intestinal infectious diseases are the prevailing diseases in the rural areas in China. The harvested rainwater is easily contaminated by air pollution, surface run-off fertilizer and pesticides, solid
waste and chips at the rainwater-harvesting surface (rubbish, animal faeces, etc.), and anthropogenic pollution. With the development of technology, products made of ceramic filters have been widely used in cities where tapwater is available. However, as a drawback, ceramic filters do not apply to those rural single-household families without access to water pressure. In addition, the filter has a certain service life, and it has to be frequently replaced if water quality is poor, which will burden water users with unbearable costs.
Pol. J. Environ. Stud. Vol. 28, No. 4 (2019), 2243-2251
Original Research
Applying Bio-Slow Sand Filtration for Water Treatment
Laisheng Liu1*, Yicheng Fu1, Qingyong Wei2, Qiaomei Liu2, Leixiang Wu1, Jiapeng Wu1, Weijie Huo1
1State Key Laboratory of Simulation and Regulation of River Basin Water Cycle, China Institute of Water Resources and Hydropower Research, Beijing, China
2River Engineering Management Department of Liaocheng, Liaocheng, Shandong Province, China
Received: 11 February 2018Accepted: 26 March 2018
Abstract
Due to the shortage of water resources in China, the state has implemented a series of rainwater harvesting projects. The safety of water quality cannot be guaranteed due to the lack of an effective construction, running, and management system. Slow filters are low-maintenance systems that do not require special equipment. In order to improve the performance of SSF in terms of the removal of bacteria and solid granules, e.g., the microorganisms attached to the surface of a single grain of the filtering material under a scanning electron microscope (50×) have been studied. Based on the improvements of conventional slow sand filtration (SSF), the bio-slow sand filtration method has effectively mitigated and helps to remove bacteria and other microbiological contaminants, as well as heavy metals, ammonia, nitrogen, organic material, and turbidity of the harvested rainwater. The removal efficiency of bio-slow sand filtration was approximately 20-30% on particulate organic carbon, above 95% on ammonia-nitrogen, and better than 96%, 95%, 95%, 80%, 70%, and 60% on Cu2+, Cd2+, Fe2+, Zn2+, Mn2+, and Pb2+, respectively. The effluent quality meets the requirements of “standards for drinking water quality” in China. The result indicated the bio-slow sand filtration method could achieve better water quality results as an available water treatment technology.
Keywords: water treatment, rainwater, bio-slow sand filtration, water quality
*e-mail: [email protected]
DOI: 10.15244/pjoes/89544 ONLINE PUBLICATION DATE: 2019-01-02

2244 Liu L., et al.
In recent years, more urban water users have begun to use small-scale integrated water purification equipment, including ceramic filters, PP cotton, activated carbon, and resin fibre as a media for filtering, as well as nanofiltration, microfiltration, reverse osmosis, and other deepprocessing techniques. Such devices have better effects but are costly and complex to operate, and the charges for water and electricity generated during operation and backwash hinder its application in rural areas. The technology of bio-slow sand filtration has been piloted in the rural areas of Hubei, Fujian, Sichuan, Guangxi, and other places in China, and has received recognition by the majority of water users because of its simple operation and maintenance and the low cost of the water system, and because such water can be safely drunk without applying chemical disinfection for the effluents.
The SSF method was born in Great Britain in 1804. James Simpson initially designed the SSF for treating the water of the Thames River for drinking. In the middle of the 19th century, SSF was introduced to Germany, Switzerland, Hungary, and other European countries. In the 1870s, SSF was introduced to the northeastern coastal area of United States of America, and at the end of the 19th century, 20 SSF water treatment plants were built in nine states of America. SSF has been widely adopted in India and South America, and its outstanding efficiency in water treatment has been confirmed sufficiently in these regions. In the beginning of the 20th century, SSF was gradually replaced by the emerging rapid filtration method because it required less area. This water supply technology, which integrates conventional flocculation, sedimentation, rapid sand filtration, and sterilization, was formed and is currently used. In the later part of the 20th century, the U.S. Environmental Protection Agency (EPA) required the removal of viruses, giardia spore cysts, cryptosporidium oocysts, and other pathogenic microorganisms during water treatment. However, the cryptosporidium oocysts and similar pathogenic microorganisms cannot be removed by the addition of chlorine. Therefore, ultraviolet disinfection, ozone disinfection, and membrane filtration are being used to
remove these pathogenic microorganisms. However, this suite of technical operations is complicated and costly and is not suitable for water treatment of middle- and small-sized villages and towns. Studies have revealed that SSF can effectively remove these pathogens [1-2]. SSFs showed a reduction in high phytophthora colony forming units (CFUs) after a simulated pump failure [3]. Therefore, SSF is once again favoured by a number of countries, especially developing ones. The World Health Organization (WHO), World Bank (WB), Canadian International Development Agency (CIDA), and other international organizations have popularized the SSF in developing countries.
Materials and Methods
SSF
SSF is a well-known process for drinking water treatment and is widely used for the production of biologically stable drinking water and particle removal [4]. After two centuries of improvement and perfection, the SSF has been characterized by the following advantages: 1) good removal efficiency of bacteria, viruses, and organic material; 2) simple structure that is easy to construct; 3) independence from the gravity-driven automatic inflow as only one mechanical piece of equipment, a water pump, is necessary – no other automatic or electronic equipment is required, making it easy to operate; and 4) it is not necessary to add any chemical agent, which avoids the risk of transportation and storage of chemical agents and avoids the production of by-products due to chemical disinfection (e.g., the production of chloramines due to the addition of chlorine for disinfection) [5-6].
The primary disadvantages of SSF include the following: 1) it removes turbidity, but then becomes clogged itself. Therefore, in the rainy season and when using surface water, pre-filtration is needed (e.g., up-flow filtration) to reduce the charge on the SSF; 2) although the purpose of the original design of SSF
Fig. 1. Schematic representation of the bio-slow sand filtration system.

2245Applying Bio-Slow Sand Filtration...
aimed to remove the turbidity and micro-organisms in water, as well as the pollutants in water, were relatively simple, the pollutants in water have become increasingly complex with economic development, for example diffused pollution, industrial air pollution, and mining-derived heavy metal pollution, and with the introduction of these new risks, the removal efficiency and functioning mechanism of SSF versus these pollutants are worth being studied; and 3) Hyun Gyu Hwang has evaluated the potential risk associated with schmutzdecke in biosand filters and its potential clinical impacts on human health in relation to diseases and infections, such that a solid guideline for the post-treatment of discarded schmutzdecke is necessary [7].
Bio-Slow Sand Filtration
To study and improve the conventional SSF, laboratory-scale SSF columns can be viewed as good surrogates for full-scale systems [8]. The technical flow chart of the SSF device designed especially for this experiment is shown in Fig. 1. The device includes three important components, i.e., an intake tank, a peristaltic pump, and a bio-slow sand filtration reactor. The reactor, which is made of organic glass, is the core of the experiment. The inner diameter of the reactor is 0.2 m, and the total height is 1.5 m. Three reactors are filled with quartz sand for this experiment. The grain size of quartz sand respectively is 0.15-0.3 mm, 0.3-0.9 mm, 0.9-1.35 mm, uniformity coefficient respectively is 1.6, 1.8, and 1.3, and effective size respectively is 0.18 mm,0.38 mm,0.98 mm, and grain porosity is 40.5, 43.2, and 42.3. The flow rate of influent is 0.2 m/h. The ambient temperature is 15-25ºC. We used chemical reagents to make up the water for this experiment in the intake tank, the water quality of influent for this experiment is shown in Table 1.
Results and discussion
Results Based on Bio-Slow Sand Filtration
Microorganisms in the bio-slow sand filtration reactor
After running for 150 days, a layer of schmutzdecke formed on the surface of the reactor (Fig. 2). The colour
of the schmutzdecke on the surface layer is obviously different from that on the lower layer (Fig. 2a). It is a brown, densely structured, filtering material that sticks together in bulk; no obvious gap is observed under the naked eye. The schmutzdecke has a certain toughness to the touch and cannot be easily broken. The structure of the filtering material in the lower layer is loose, and there is an obvious gap between grains of the filtering material. The thickness of the schmutzdecke is approximately 2 cm. The thickness of the schmutzdecke correlates with the grain size of the filtering material. The schmutzdecke with a grain size of 0.15-0.3 mm (Fig. 2b) and 0.3-0.9 mm (Fig. 2c) has covered the filtering material on the surface layer, which causes the filtering material to stick together tightly. The tightness of the schmutzdecke of grain size 0.9-1.35 mm (Fig. 2d) is poorer.
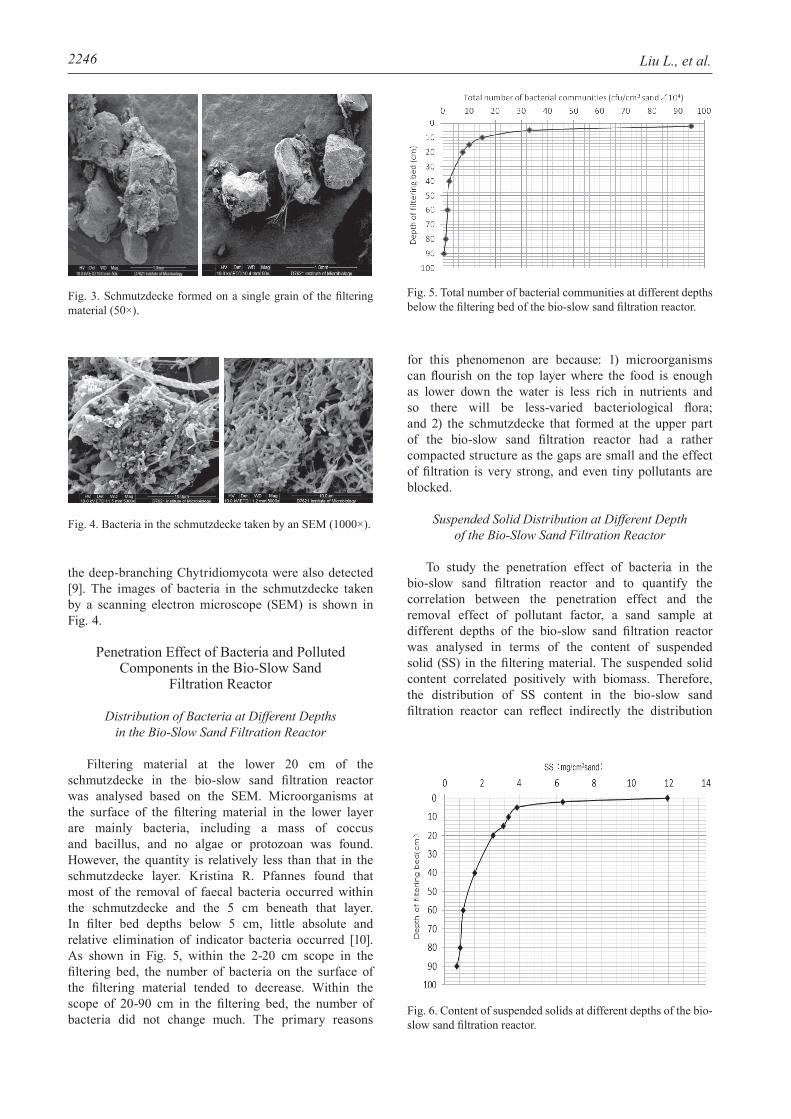
The microorganisms attached to the surface of a single grain of filtering material under a scanning electron microscope (50×) is shown in Fig. 3. A relatively thicker layer of schmutzdecke is attached to the surface of a single grain of the filtering material. S. Wakelin analysed the DNA of the biofilm (schmutzdecke) layer using a high-density microarray and rRNA library analysis. They found that the eukaryotic community was dominated by Cercozoa (Ebridd-type protists). Ciliate protozoa, green microalgae, stramenopiles, amoeboid protozoa, and fungi in the Phylum Ascomycota and
Fig. 2. Schmutzdecke formed on the surface of the filtering bed.
Parameters Concentration Parameters Concentration
Turbidity (NTU) 4.1-8.1 pH 6.89-7.52
Chroma 5-15 DO(mg/L) 7.28-11.78
NH4+-N (mg/L) 0.13-1.2 Conductivity(μg/cm) 670-920
CODMn (mg/L) 3.6-8.2 Coliform bacteria (CFU/100 mL) 44-151
NO3--N (mg/L) 0.5-1.2 Aerobic bacterial count (CFU/mL) 400-1600
Table 1. The quality of experimental water.
2246 Liu L., et al.
the deep-branching Chytridiomycota were also detected [9]. The images of bacteria in the schmutzdecke taken by a scanning electron microscope (SEM) is shown in Fig. 4.
Penetration Effect of Bacteria and Polluted Components in the Bio-Slow Sand
Filtration Reactor
Distribution of Bacteria at Different Depths in the Bio-Slow Sand Filtration Reactor
Filtering material at the lower 20 cm of the schmutzdecke in the bio-slow sand filtration reactor was analysed based on the SEM. Microorganisms at the surface of the filtering material in the lower layer are mainly bacteria, including a mass of coccus and bacillus, and no algae or protozoan was found. However, the quantity is relatively less than that in the schmutzdecke layer. Kristina R. Pfannes found that most of the removal of faecal bacteria occurred within the schmutzdecke and the 5 cm beneath that layer. In filter bed depths below 5 cm, little absolute and relative elimination of indicator bacteria occurred [10]. As shown in Fig. 5, within the 2-20 cm scope in the filtering bed, the number of bacteria on the surface of the filtering material tended to decrease. Within the scope of 20-90 cm in the filtering bed, the number of bacteria did not change much. The primary reasons
for this phenomenon are because: 1) microorganisms can flourish on the top layer where the food is enough as lower down the water is less rich in nutrients and so there will be less-varied bacteriological flora; and 2) the schmutzdecke that formed at the upper part of the bio-slow sand filtration reactor had a rather compacted structure as the gaps are small and the effect of filtration is very strong, and even tiny pollutants are blocked.
Suspended Solid Distribution at Different Depth of the Bio-Slow Sand Filtration Reactor
To study the penetration effect of bacteria in the bio-slow sand filtration reactor and to quantify the correlation between the penetration effect and the removal effect of pollutant factor, a sand sample at different depths of the bio-slow sand filtration reactor was analysed in terms of the content of suspended solid (SS) in the filtering material. The suspended solid content correlated positively with biomass. Therefore, the distribution of SS content in the bio-slow sand filtration reactor can reflect indirectly the distribution
Fig. 3. Schmutzdecke formed on a single grain of the filtering material (50×).
Fig. 4. Bacteria in the schmutzdecke taken by an SEM (1000×).
Fig. 5. Total number of bacterial communities at different depths below the filtering bed of the bio-slow sand filtration reactor.
Fig. 6. Content of suspended solids at different depths of the bio-slow sand filtration reactor.

2247Applying Bio-Slow Sand Filtration...
of biomass. The experimental results of the SS content at different depths of the bio-slow sand filtration reactor are shown in Fig. 6.
As shown in Fig. 6, the filtering material in the schmutzdecke adsorbed the most SS; the amount of SS decreased drastically from the schmutzdecke to the filtering material within the scope of 20 cm and decreased by 78.28%. The amount of SS decreased relatively slowly at 20 cm below the filtering bed. The amount of SS in the bio-slow sand filtration reactor tended to be consistent with the aerobic bacterial count.
Particulate Organic Carbon Distribution at Different Depths in the Bio-Slow Sand Filtration Reactor
Particulate organic carbon (POC) content in the bio-slow sand filtration reactor can reflect the content of organic material, which can supply energy to the activity of microorganisms. Therefore, the distribution of POC content in the bio-slow sand filtration reactor can also reflect indirectly the distribution of biomass. The results of POC measurements in the bio-slow sand filtration reactor are shown in Fig. 7.
In comparison, as shown in Figs. 6 and 7, the POC content and SS content at the surface of the filtering material is similar. The POC value in the schmutzdecke is the highest, while that in the filtering material decreased gradually along the direction of water flow. This result is consistent with the finding that there is a mass of microorganisms in the schmutzdecke. The results of SEM suggested there are plenty of bacteria, algae, and protozoans in the schmutzdecke.
The Penetration Effect of the Bacteria and Polluted Components in the Bio-Slow
Sand Filtration Reactor
Based on SEM, the number of microorganisms in the filtering material of the lower layer is clearly less than that in the surface layer. The aerobic bacterial count at different depths of the filtering layer further proves the
declining trend from the surface layer to the lower layer. The aerobic bacterial count at the depth of 90 cm is only 0.043% of that in the filtering material of the surface layer. The primary ingredient in the SS is mainly the insoluble inorganic material, organic material, sand, clay, and microorganisms. The blocking effect of the filtering bed against pollutants can be characterized by measuring the SS value at different depths of the filtering bed. The SS values decreased gradually with increasing depth, i.e., a majority of the pollutants are blocked by the schmutzdecke at the surface layer. The unblocked pollutants were filtered and blocked by the filtering layer gradually when penetrating downward with the water flow.
Biological Mechanism of Bio-Slow Sand Filtration
In summary, the mechanism of bio-slow sand filtration includes three components: 1) the sedimentation of particular material in the upper covering water, hydrolysis of organic chemicals, and photosynthesis of organic material, etc.; 2) the combined biochemical degradation and mechanical filtration and blocking and degradation of pollutants by the micro-ecological environment in the schmutzdecke at the surface of the filtering material; and 3) with increasing depth, the filtering bed further decomposes and transforms the pollutants and further blocks and filtres the particulate material. Taken together, the bio-slow sand filtration of pollutants includes two components, i.e., the adsorption of sediment and the biochemical mechanism. The adsorption of sediment occurs mainly in the upper covering water and at the surface layer of the filtering bed, and bacterial removal occurs in the upper half of the sand filter [11].
The formation of schmutzdecke makes the structure of the filtering material at the surface layer more compacted; the gaps decreased and the adsorptive and blocking capacity against SS in water increased. Therefore, the formation of schmutzdecke intensifies the effective adsorptive capacity to capture and degrade pollutants. In conclusion, our work evinces that the mechanism of bio-slow sand filtration is a combination of straining in the upper filter section, and a recent study using 13C-labelled E. coli highlighted the importance of protozoan predation in the trophic network of a model slow sand filter [12].
The thickness of schmutzdecke that formed on the surface of the filtering bed is approximately 2 cm. It is a benign food chain formed by microorganisms consisting of bacteria, algae, and protozoans (Fig. 8). Bacteria and algae grow by assimilating N, P, soluble organic carbon, and other nutrient salts in water. Meanwhile, the bacteria and algae were predated by the protozoans. The dead bacteria, algae, and protozoans were degraded and then became nutrients for newborn microorganisms.
Fig. 7. Content of granular organic carbon at different depths of the bio-slow sand filtration reactor.

2248 Liu L., et al.
The Results of Water Treatment
We have studied the effects of sand particle size and bed depth for the bio-slow sand filtration. The removal effect of pollutants in the rural water environment, such as heavy metal elements, organic substances, ammonia, and bacteria by bio-slow sand filtration, has also been investigated. The experimental results show that 1) the time needed for forming a steady and ripe schmutzdecke in the bio-slow sand filter has a positive relationship with sand particle size; 2) the removal efficiency of ammonia-nitrogen, CODMn, and turbidity has no relationship with sand particle size in the case where a steady and ripened schmutzdecke in the bio-
slow sand filter has been formed; and 3) the removal efficiency of bio-slow sand filtration was approximately 20-30% on particulate organic carbon, above 95% on ammonia-nitrogen, and better than 96%, 95%, 95%, 80%, 70%, and 60% on Cu2+, Cd2+, Fe2+, Zn2+, Mn2+, and Pb2+, respectively (Table 2). The effluent quality meets the requirements of “Standards for drinking water quality” (GB5749-2006) of China.
Application of Bio-Slow Sand Filtration for the Safety of Drinking Rainwater
The operation, functioning, and maintenance of bio-slow sand filtration are simple. The cost of constructing
Fig. 8. Food chain in the bio-slow sand filtration reactor.
Table 2. The quality of raw water and effluent water.
Parameters Raw water Effluent quality “Standards for drinking water quality” (GB5749-2006) Removal rate
Turbidity (NTU) 4-7 <1 1 >99
Chroma (mg/L) 10-15 <5 15 -
Ammonia-nitrogen (mg/L) 0.2-1.2 <0.1 0.5 95-99
CODMn (mg/L) 2-4.5 1.5-2.8 3 25-38
TOC (mg/L) 5-8 3.5-6 - 20-30
Cu2+ (mg/L) 0.79-2.74 0.01-0.074 1.0 96.6-98.8
Fe2+ (mg/L) 0.45-1.58 0.01-0.066 0.3 95.1-97.8
Zn2+ (mg/L) 1.25-4.8 0.25-0.65 1.0 80.0-88.7
Cd2+ (mg/L) 0.097-0.296 0.004-0.11 0.005 95.7-98.3
Mn2+ (mg/L) 0.44-1.85 0.06-0.55 0.1 70.3-86.4
Pb2+ (mg/L) 0.071-0.39 0.002-0.061 0.01 62.5-96.6
Aerobic bacterial count (CFU/mL) 200-1000 4-85 100 95%-99%
Coliform bacteria (CFU/100 mL) 0-650 0 0 100%

2249Applying Bio-Slow Sand Filtration...
and operating is low. Visscher states that the cost of maintenance and running the SSF is only one-fifth that of the conventional watertreatment process and that SSF has a significant advantage when used in rural areas [13]. Wegelin thought highly of SSF and said that among all of the surface watertreatment processes, SSF is the only one that could function well in physics, chemistry, and biology [14]. A serious technical obstacle of SSF is its restriction by the turbidity of intake water. SSF must be used in concert with raw filtration. Raw filtration can drastically reduce the load of turbidity of intake water and reduce its impact on the subsequent slow filtering process [15].
SSF was effective in removing pythiacious organisms from captured rainwater to prepare the water
for reuse in drinking. SSF represented an effective low-tech treatment technology for pathogen removal from water [16]. Based on a wealth of experimental studies, we optimized and improved the conventional SSF, developed a small family-based watertreatment facility of bio-slow sand filtration, and applied this in Gansu, Guizhou, Fujian, Hubei, and Sichuan provinces in China. The results of the outlet water indicated that the quality of outlet water after the treatment of family-based automatic bio-slow sand filtration facilities satisfies the water quality standard for drinking water of China [17-23].
The water treatment device of household automatic bio-slow sand filtration consists of four components (Fig. 10), i.e., an elevated water tank, a pre-arranged
Fig. 9. Technical process of household automatic bio-slow sand filtration water treatment device.
Fig. 10. Household automatic bio-slow sand filtration water treatment device.

2250 Liu L., et al.
Y-shaped filter, a bio-slow sand filtration reactor, and an automatic distribution box. The processing capacity of an individual device is 170-848 L/d (filtration rate is 0.1-0.5 m/h). The technical process of a household automatic bio-slow sand filtration water treatment device is shown in Fig. 9. The water treatment cost of the household automatic bio-slow sand filtration is 0.6 yuan/ton, which is less than nanofiltration, microfiltration, and reverse osmosis.
Elevated Water Tank
An elevated water tank can supply water at a constant rate for a bio-slow sand filtration reactor. A flow rate-invariable device is arranged in the elevated water tank to regulate the inlet flow at a constant rate (although it will decline at the end of the filter run, and the water will rise gradually from the filter bed. This is a sign to think about scraping the schmutzdecke off and starting a fresh cycle).
Pre-Arranged Y-Shaped Filter
A Y-shaped filter is used for raw filtration before water is fed into the elevated water tank (functionally, it corresponds to the pre-arranged raw filtration pool). To preliminarily remove the suspended particles, mud, sand, and other pollutants, and to decrease the subsequent probability of blockage of the bio-slow sand filtration reactor, a 100-well filtration mesh is arranged in the Y-shaped filter.
Bio-Slow Sand Filtration Reactor
By analysing the total amount of bacteria, SS, and POC in the filtering material at different depths of the bio-slow sand filtration reactor, it was found that microorganisms are mainly distributed within the 2 cm-thickness of the surface. A 90 cm-high filtering bed can guarantee the water quality of effluent water. Therefore, in the present study, the design of the filtering material layer in the bio-slow sand filtration reactor is 90 cm. In the present study, 1-2 mm-diameter quartz sand is filled in the water distributor, which preliminarily blocks the large-sized pollutant and decreases the probability of blockage of the filtering material.
Automatic Distribution Box
The present study sufficiently considers the community of water consumers and rural residents in remote mountain areas. A simple automatic control system is designed, which realizes the automatic on/off of the water-supplying pump by measuring the water level in the water tank. Automatic water feeding is realized at extremely low cost and the water consumer’s operational management is also simplified.
Conclusions
Its starting point is the solution to the safety of water quantity, and it rarely focuses on the corresponding watertreatment facilities of harvested rainwater in China. Water quality is critical to the health of people and is also a limiting factor that determines the achievement of the safety objective of drinking water. Bio-slow sand filtration has effectively mitigated and helps to remove pollutants from harvested rainwater. The removal efficiency of bio-slow sand filtration was approximately 20-30% on particulate organic carbon, above 95% on ammonia-nitrogen, and over 96%, 95%, 95%, 80%, 70%, and 60% on Cu2+, Cd2+, Fe2+, Zn2+, Mn2+, and Pb2+, respectively [24-25]. The effluent quality meets the requirements of “Standards for drinking water quality” of China. The collection of rainwater for drinking has critical significance in solving the problem of drinking water in areas with a shortage of water resources, such as the dry area in northwestern China, the southwestern rocky area, and the eastern coastal area. Bio-slow sand filtration has broad application prospects for the areas that harvest rainwater.
Acknowledgements
The study was financially supported by National Key R&D Program of China (NO.2018YFC0408100), The Major Science and Technology Program for Water Pollution Control and Treatment (NO.2017ZX07101004). The author appreciates the anonymous reviewers for their valuable comments and criticisms.
Conflict of Interest
The authors declare no conflict of interest.
References
1. STAUBER, C.E., ORTIZ, G.M., LOOMIS, D.P., SOBSEY, M.D. A Randomized Controlled Trial of the Concrete Biosand Filter and Its Impact on Diarrheal Disease in Bonao, Dominican Republic. Am. J. Trop. Med. Hyg. 80, 286, 2009.
2. SEEGER E.M., BRAECKEVELT M., REICHE N., MÜLLER J.A., KÄSTNER M. Removal of pathogen indicators from secondary effluent using slowsand filtration: Optimization. Ecological Engineering 95, 635, 2016.
3. LEE E., OKI L.R. Slow sand filters effectively reduce Phytophthora after a pathogen switch from Fusarium and a simulated pump failure. Water Research 47, 5121, 2013.
4. URFER D. Use of bauxite for enhanced removal of bacteria in slow sand filters. Water science and technology-water supply 17, 1007, 2017.
5. VAN DER KOOIJ D., VEENENDAAL H.R., VAN DER MARK E.J., DIGNUM M. Assessment of the
2251Applying Bio-Slow Sand Filtration...
microbial growth potential of slow sand filtrate with the biomass production potential test in comparison with the assimilable organic carbon method. Water Research 125, 270, 2017.
6. DE SOUZA F.H., MONDARDO R.I., SENS M.L. Drinking water treatment using upflow slow sand filtration systems in high density Cylindrospermopsis raciborskii cyanobacteria water. Desalination and water treatment 79, 1, 2017.
7. HAIG S.J., QUINCE C., DAVIES R.L., DOREA C.C., COLLINS G. Replicating the microbial community and water quality performance of fullscale slow sand filters in laboratory-scale filters. Water Res. 61, 141, 2014.
8. WAKELIN S., PAGE D., DILLON P., PAVELIC P., ABELL G.C.J., GREGG A.L., BRODIE E., DESANTIS T.Z., GOLDFARB K.C., ANDERSON G. Microbial community structure of a slow sand filter schmutzdecke: a phylogenetic snapshot based on rRNA sequence analysis. Water Science & Technology: Water Supply 11, 426, 2011.
9. KRISTINA R. PFANNES, KILIAN M.W. LANGENBACH, GIOVANNI PILLONI, TORBEN STÜHRMANN, KATHRIN EURINGER, TILLMANN LUEDERS, THOMAS R. NEU, JOCHEN A. MÜLLER, MATTHIAS KÄSTNER, RAINER U. MECKENSTOCK Selective elimination of bacterial faecal indicators in the Schmutzdecke of slow sand filtration columns. Appl Microbiol Biotechnol, 99, 10323, 2015.
10. D'ALESSIO M.,YONEYAMA B., KIRS M., KISAND V., RAY C. Pharmaceutically active compounds: Their removal during slow sand filtration and their impact on slow sand filtration bacterial removal. Science of the Total Environment, s524-525, 124-135. 2015.
11. HWANG H.G., KIM M.S., SHIN S.M., HWANG C.W. Risk assessment of the schmutzdecke of biosand filters:Identification of an opportunistic pathogen in schmutzdecke developed by an unsafe water source. Int. J. Environ. Res. Public Health 11, 2033, 2014.
12. HAIG S.J., SCHIRMER M., D’AMORE R., GIBBS J., DAVIES R.L., COLLINS G., QUINCE C. Stable-isotope probing and metagenomics reveal predation by protozoa drives E. coli removal in slow sand filters. ISME 9, 797, 2015.
13. VISSCHER J.T. Slow sand filtration: Design, operation, and maintenance. Journal American Water Works Association 82, 67, 1990.
14. WEGELIN M. Roughing gravel filters for suspended solids removal. In : Slow Sand Filtration: Recent Developments in Water Treatment Technology, Graham, N.J.D., Ellis Horwood Ltd., England. 1988.
15. NKWONTA O.,OCHIENG G. Roughing filter for water pre-treatment technology in developing countries: A review. International Journal of Physical Sciences 4, 455, 2009.
16. SEEGER E.M., BRAECKEVELT M., REICHE N., MULLER J.A., KASTNER M. Removal of pathogen indicators from secondary effluent using slow sand filtration: Optimization approaches. Ecological engineering 95, 635, 2016.
17. LIU L.S., ZHOU H.D., LIU L.H., WU L.X. Application of bio-slow sand filtration for the Safety of drinking rainwater in the village of northwest China. Water Resources and Hydropower Engineering 44, 131, 2013.
18. ZHOU X.Z., YANG X.D. Application of bio-slow sand filtration for the Safety of drinking rainwater in yichang of Hubei province. China Rural Water and Hydropower 12, 62, 2007.
19. WANG J.Q. Application of bio-slow sand filtration for the Safety of drinking rainwater in three gorges reservoir area of China. China Rural Water and Hydropower 24, 37, 2008.
20. CAO H., LIAO Q.Y. Application of bio-slow sand filtration for the Safety of drinking rainwater in northwest area of Hubei province. Journal of Anhui Agriculture Science 38, 12111, 2010.
21. YE H., ZHOU Y., YANG P. Study on treatment of shallow groundwater by bio-slow sand filtration in the hilly area of central Sichuan province. China Water Resources 19, 18, 2010.
22. ZHONG Q.R. Application of bio-slow sand filtration in tianzhushan forest parks of Fujian province. Fujian Architecture and Construction 12, 97, 2010.
23. YANG H., ZHANG G.Z., YANG X.N., WU F.P., LIU J.L. Application of rough and slow filtration techniques to treatment of water in rainwater harvesting pits. China Water and Wastewater 29, 47, 2013.
24. LIU L.H., ZHOU H.D., WANG W.H., LI W.Q. Study on bio-slow sand filtration for rural drinking water. Journal of Safety and environment 4, 12, 2004.
25. LIU L.S., ZHOU H.D., LIU L.H., WU L.X. Research on denitrification of bio-slow sand filtration. China Rural Water and Hydropower 5, 81, 2013.