Application of ultrasonication at different microbial growth ...
14
HAL Id: hal-03307488 https://hal.inrae.fr/hal-03307488 Submitted on 29 Jul 2021 HAL is a multi-disciplinary open access archive for the deposit and dissemination of sci- entific research documents, whether they are pub- lished or not. The documents may come from teaching and research institutions in France or abroad, or from public or private research centers. L’archive ouverte pluridisciplinaire HAL, est destinée au dépôt et à la diffusion de documents scientifiques de niveau recherche, publiés ou non, émanant des établissements d’enseignement et de recherche français ou étrangers, des laboratoires publics ou privés. Distributed under a Creative Commons Attribution - NonCommercial - NoDerivatives| 4.0 International License Application of ultrasonication at different microbial growth stages during apple juice fermentation by Lactobacillus plantarum: Investigation on the metabolic response Hongmei Wang, Yang Tao, Yiting Li, Shasha Wu, Dandan Li, Xuwei Liu, Yongbin Han, Sivakumar Manickam, Pau Loke Show To cite this version: Hongmei Wang, Yang Tao, Yiting Li, Shasha Wu, Dandan Li, et al.. Application of ultrasonica- tion at different microbial growth stages during apple juice fermentation by Lactobacillus plantarum: Investigation on the metabolic response. Ultrasonics Sonochemistry, Elsevier, 2021, 73, pp.105486. 10.1016/j.ultsonch.2021.105486. hal-03307488
-
Upload
khangminh22 -
Category
Documents
-
view
2 -
download
0
Transcript of Application of ultrasonication at different microbial growth ...
HAL Id: hal-03307488https://hal.inrae.fr/hal-03307488
Submitted on 29 Jul 2021
HAL is a multi-disciplinary open accessarchive for the deposit and dissemination of sci-entific research documents, whether they are pub-lished or not. The documents may come fromteaching and research institutions in France orabroad, or from public or private research centers.
L’archive ouverte pluridisciplinaire HAL, estdestinée au dépôt et à la diffusion de documentsscientifiques de niveau recherche, publiés ou non,émanant des établissements d’enseignement et derecherche français ou étrangers, des laboratoirespublics ou privés.
Distributed under a Creative Commons Attribution - NonCommercial - NoDerivatives| 4.0International License
Application of ultrasonication at different microbialgrowth stages during apple juice fermentation by
Lactobacillus plantarum: Investigation on the metabolicresponse
Hongmei Wang, Yang Tao, Yiting Li, Shasha Wu, Dandan Li, Xuwei Liu,Yongbin Han, Sivakumar Manickam, Pau Loke Show
To cite this version:Hongmei Wang, Yang Tao, Yiting Li, Shasha Wu, Dandan Li, et al.. Application of ultrasonica-tion at different microbial growth stages during apple juice fermentation by Lactobacillus plantarum:Investigation on the metabolic response. Ultrasonics Sonochemistry, Elsevier, 2021, 73, pp.105486.�10.1016/j.ultsonch.2021.105486�. �hal-03307488�
Ultrasonics Sonochemistry 73 (2021) 105486
Available online 4 February 20211350-4177/© 2021 The Author(s). Published by Elsevier B.V. This is an open access article under the CC BY-NC-ND license(http://creativecommons.org/licenses/by-nc-nd/4.0/).
Application of ultrasonication at different microbial growth stages during apple juice fermentation by Lactobacillus plantarum: Investigation on the metabolic response
Hongmei Wang a, Yang Tao a,*, Yiting Li a, Shasha Wu a, Dandan Li a, Xuwei Liu b, Yongbin Han a,*, Sivakumar Manickam c, Pau Loke Show d
a College of Food Science and Technology, Nanjing Agricultural University, Nanjing 210095, Jiangsu, China b INRAE, UMR408, Securite et Qualite des Produits d’Origine Vegetale (SQPOV), F-84000 Avignon, France c Petroleum and Chemical Engineering, Faculty of Engineering, Universiti Teknologi Brunei, Bandar Seri Begawan, BE1410, Brunei Darussalam d Department of Chemical and Environmental Engineering, Faculty of Science and Engineering, University of Nottingham Malaysia, Jalan Broga, Semenyih 43500, Selangor Darul Ehsan, Malaysia
A R T I C L E I N F O
Keywords: Ultrasonication Lactic acid fermentation Apple juice Lactobacillus plantarum Metabolic response
A B S T R A C T
In this work, low-intensity ultrasonication (58.3 and 93.6 W/L) was performed at lag, logarithmic and stationary growth phases of Lactobacillus plantarum in apple juice fermentation, separately. Microbial responses to soni-cation, including microbial growth, profiles of organic acids profile, amino acids, phenolics, and antioxidant capacity, were examined. The results revealed that obvious responses were made by Lactobacillus plantarum to ultrasonication at lag and logarithmic phases, whereas sonication at stationary phase had a negligible impact. Sonication at lag and logarithmic phases promoted microbial growth and intensified biotransformation of malic acid to lactic acid. For example, after sonication at lag phase for 0.5 h, microbial count and lactic acid content in the ultrasound-treated samples at 58.3 W/L reached 7.91 ± 0.01 Log CFU/mL and 133.70 ± 7.39 mg/L, which were significantly higher than that in the non-sonicated samples. However, the ultrasonic effect on microbial growth and metabolism of organic acids attenuated with fermentation. Moreover, ultrasonication at lag and logarithmic phases had complex influences on the metabolism of apple phenolics such as chlorogenic acid, caffeic acid, procyanidin B2, catechin and gallic acid. Ultrasound could positively affect the hydrolysis of chlorogenic acid to caffeic acid, the transformation of procyanidin B2 and decarboxylation of gallic acid. The metabolism of organic acids and free amino acids in the sonicated samples was statistically correlated with phenolic metabolism, implying that ultrasound may benefit phenolic derivation by improving the microbial metabolism of organic acids and amino acids.
1. Introduction
In the past decades, food products processed by lactic acid fermen-tation have received increasing attention owing to the enhanced nutri-tional and sensory properties and extended shelf-life [1,2]. A large variety of food matrix can be the media of growth of lactic acid bacteria, including meat, milk, soy, fruit, vegetable and others [3]. Among them, the majority of raw fruits and several vegetables are considered unfa-vorable for microorganisms due to the acidic environment, indigestible nutrients (e.g. fiber and inulin), low buffering capacity, antinutritional and inhibitory constitution (e.g. phenolic compounds) [1,4]. To over-come this problem, innumerous efforts have been attempted to develop
and apply autochthonous and allochthonous lactic acid bacterium starters to ferment various fruit and vegetable matrices [1,4,5].
In recent years, ultrasound, particularly at low-intensity level, has been labeled as an emerging technology to improve microorganism’s performance during food fermentation, for example, promoting micro-bial growth, accelerating fermentation process, and enhancing the yields of biomass and target metabolites [6–8]. Although the mechanism un-derlying the intensification of fermentation by low-intensity ultrasound has not yet been well clarified, the reported studies reveal that the ul-trasonic improvement of mass transfer and revisable cell structure modification play key roles. On the one hand, ultrasound can favor gas–liquid mass transfer (gas adsorption by liquid) and solid–liquid mass
* Corresponding authors. E-mail addresses: [email protected] (Y. Tao), [email protected] (Y. Han).
Contents lists available at ScienceDirect
Ultrasonics Sonochemistry
journal homepage: www.elsevier.com/locate/ultson
https://doi.org/10.1016/j.ultsonch.2021.105486 Received 16 August 2020; Received in revised form 25 January 2021; Accepted 28 January 2021

Ultrasonics Sonochemistry 73 (2021) 105486
2
transfer (solid dissolution in liquid) [9]. On the other hand, moderate ultrasound cavitation can provide repairable damage to microorganisms like dispersing the cells, increasing cell membrane permeability or even affecting cellular components and genetics [6]. All these factors allow the microbial utilization of nutrients and transfer of intracellular me-tabolites easier. Considering the beneficial effect of low-intensity ul-trasound on food fermentation, it can be a good idea to employ low- intensity ultrasonication during lactic acid fermentation in fruit and vegetable juices to help microorganisms adapt harsh environment pro-vided by fruits and vegetables. According to a comprehensive literature review, ultrasound technology has been rarely used in fruit and vege-table juice fermentation by lactic acid bacteria. Therefore, it is impor-tant to explore the influence of low-intensity ultrasonication on lactic acid fermentation of fruit and vegetable materials and optimize the process.
Lactobacillus plantarum is the most frequently used species of lactic acid bacteria in the fermentation of fruit and vegetable juices [10–12]. Thus, Lactobacillus plantarum can be a representative microbial strain to evaluate the effect of ultrasound on the lactic acid fermentation process. Meanwhile, to provide in-depth knowledge about the metabolic response of Lactobacillus plantarum in fruit and vegetable juices under ultrasonic fields, different investigations related to microbial growth, profiles of carbohydrates, organic acids, free amino acids, volatiles and phenolics are needed [4,5,13]. A series of studies conducted by Filanino et al. [4,5,13] revealed that the metabolic traits of these indices during lactic acid fermentation were highly correlated. A comprehensive survey about microbial growth, profiles of carbohydrates, organic acids, free amino acids and phenolics can help evaluate the ability of Lactobacillus plantarum to tolerate and metabolize fruit and vegetable components. Moreover, some studies found that the impact of ultrasound on fermentation is dependent on the period of the microbial growth phase. For example, Daccache et al. [9] reported that Hanseniaspora sp. yeast was more sensitive to ultrasound at lag phase than the logarithmic phase during cider production from Lebanese apples. Inversely, Huang et al. [7] claimed that ultrasonication at logarithmic phase benefited the fermentation of skim milk by Lactobacillus paracasei to produce peptides. Consequently, sonication time should be taken into account when studying the ultrasonic influence on the metabolic response of Lacto-bacillus plantarum during fruit and vegetable juice fermentation.
In this investigation, as a globally accepted fruit juice, apple juice was used as the experimental medium for the fermentation of Lactoba-cillus plantarum. The aim is to systematically explore the influence of low-intensity ultrasound at three microbial phases (lag, logarithmic and stationary phases) on the metabolic response of selected Lactobacillus plantarum strain during the fermentation of apple juice. The detailed changes in microbial growth, contents of specific sugars, organic acids, amino acids and phenolics, and antioxidant capacity in vitro throughout fermentation were monitored. Besides, the relationships between phenolic metabolism and metabolism of organic acids and amino acids were explored. The obtained results could enrich the fundamental knowledge about the application of ultrasound in lactic acid fermenta-tion of fruit and vegetable juices.
2. Materials and methods
2.1. Bacterial strains
Lactobacillus plantarum BNCC337796 isolated from cabbage were purchased from BeNa Culture Collection, Beijing, China. The freeze- dried bacterial powders were first activated in De Man-Rogosa-Sharpe (MRS) broth at 37 ◦C for 24 h. Then, the broth was stored at − 20 ◦C with the addition of 50% glycerinum at the ratio of 1:1 (v:v) for long- term preservation. Meanwhile, the broth was also incubated at − 4 ◦C on MRS agar slants medium for short-term preservation. Before fermentation, cultures on an ager slant medium were transferred into 50 mL of the sterile MRS medium and incubated at 37 ◦C for 24 h. The
microbial count was determined to be around 9.0 Log CFU/mL.
2.2. Preparation of apple juice
Apple juices were prepared according to the method of Liao et al. [14] with some modifications. Fresh mature apples “Malus Domestica cv. Fuji” were purchased from Suguo Supermarket in Nanjing. Apples with similar maturity were selected, washed, peeled, cored and cut into small pieces. To obtain apple pulps, apple pieces were pulped with distilled water at a ratio of 10:1 (w/w) in a domestic juicer (MJ-WBL2521H, Midea, Foshan, China), and 1.5‰ D-sodium erythorbate (w/w) was added simultaneously to prevent browning during juicing [15]. After-wards, the apple puree was first filtered through four-layer cheesecloth, and cloudy apple juice was then centrifuged at 4000 rpm (approxi-mately 2500 g) for 15 min. Total soluble solids and pH of the apple juice were adjusted to 13.0 oBrix and 6.0, respectively. Also, 0.3% yeast extract (w/w) was added to apple juice before fermentation. Apple juices were sterilized at 85 ◦C for 15 min [16].
2.3. Ultrasound-assisted fermentation of apple juice
Each 100 mL of apple juice was inoculated with a 2.0% (v/v) inoc-ulum, making the initial cell number reach around 7.0 Log CFU/mL. Inoculated juices were then incubated at 30 ◦C. During fermentation, a probe sonicator (20 kHz, VCX130, Sonics and Materials Inc., Newtown, USA) with a tip diameter of 10 mm was used to sonicate apple juices. Ultrasound probe was located at 1 cm depth from the surface of the medium. Energy input was controlled by setting the amplitude, and the actual ultrasonic power dissipated in the sample was determined by the calorimetric method [17]. The acoustic energy density (AED) in the system was obtained by dividing the measured power by the juice volume.
Sonication was performed at a pulse mode of 5 s on and 5 s off when the microbial growth was in lag, logarithmic, and stationary phases, respectively (after incubation for 0, 8 and 18 h). Two AED (58.3 and 93.6 W/L) levels were applied, which were selected according to the preliminary tests. The preliminary experiments indicated that neither higher nor lower AED levels could positively influence microbial growth. Ultrasound treatment lasted for 30 min at 30 ◦C in a water bath. Samples were collected for analysis before fermentation and after son-ication for 0, 2, 4, 6, 12, and 24 h.
2.4. Analytical methods
2.4.1. Growth curve of Lactobacillus plantarum The growth of Lactobacillus plantarum in apple juice at 30 ◦C was
monitored by measuring the optical density of juice at 600 nm for 25 h in a temperature-controlled microbial growth analyzer (FP-1100-C, Bio-screen, Finland) periodically [18]. Herein, the lag, logarithmic and stationary phases stayed from 0 to4th, 4th-14th and 14th-25th h of fermentation.
2.4.2. Viable cell counts The number of Lactobacillus plantarum was determined via the pour
plate method using MRS agar.
2.4.3. Total phenolic content The Folin-Ciocalteu method was used to determine the total phenolic
content in apple juice [19]. Gallic acid was used as a standard to construct the calibration curve. The results were expressed as mg gallic acid equivalents per liter juice.
2.4.4. Phenolic profile Individual phenolic compounds in the apple juice were first identi-
fied using an ultrahigh performance liquid chromatography (UHPLC, Nexera X2, SHIMADZU, Japan) system connected with a Triple-TOF-MS
H. Wang et al.

Ultrasonics Sonochemistry 73 (2021) 105486
3
system (TripleTOF 4600, AB SCIEX, USA) [20]. The contents of indi-vidual phenolics were measured in a Shimadzu LC-2010A HPLC system equipped with the column Inertsil ODS-3 (4.6 × 250 mm, 5 µm, GL Sciences, Japan), according to the methodology described by Zhang et al. [21] with minor modifications. The column temperature was maintained at 25 ◦C. The mobile phase consisted of deionized water with 1% acetic acid (solvent A) and methanol with 1% acetic acid (solvent B). Samples previously filtered through a 0.22 μm membrane were eluted at a flow rate of 0.6 mL/min with the following elution programme: 0–10 min, 90–74% A; 10–25 min, 74–60% A; 25–45 min, 60–35% A; 45–55 min, 35–5% A; 55–58 min, 5–90% A; 58–65 min, 90% A. The injection volume was 20 μL. The detected wavelength was at 280 nm. The content of each phenolic compound was quantified according to the calibration curve of the corresponding standard and expressed as mg/L.
2.4.5. Sugar profile The sugar profile was analyzed in an Agilent 1200 Series HPLC sys-
tem with an external Alltech 3300 evaporative light scattering detection detector (Grace, Deerfield, USA), based on the method of Vervoort et al. [22] with some modifications. The column was a Prevail carbohydrate ES column (250 mm × 4.6 mm, 5 μm, Alltech, USA) protected with a Prevail C18 guard cartridge of 7.5 mm × 4.6 mm diameter. The column temperature was set at 30 ◦C. Isocratic elution using acetonitrile:water (75:25, v/v) was performed, and the flow rate was 1.0 mL/min. The drift tube temperature was kept at 80 ◦C, and the applied nitrogen flow rate was 1.5 L/min. Moreover, the injection volume was 10 μL. For the quantification purpose, standard sugars were used to make the cali-bration curve, and the results were expressed as g/L.
2.4.6. Organic acid profile The contents of individual organic acids were determined using the
HPLC method described in our previous study [23].
2.4.7. Free amino acid profile The contents of free amino acids were measured according to the
method proposed by Li et al. [24]. Before analysis, the samples were mixed with 10% sulfosalicylic acid at a ratio of 1:1 (v:v) and then kept at 4 ◦C for 1 h. Samples were filtered through a 0.45 μm membrane and then analyzed by a fully automated amino acid analyzer (HITACHI L- 8900, Hitachi Ltd., Japan). The amounts of free amino acids in the apple juice were quantified using each standard’s calibration curves and expressed as mg/L.
2.4.8. Antioxidant activity in vitro Free radical scavenging activity of the apple juice was measured
using the 2,2′-azinobis-(3-ethylbenzothiazoline)-6-sulfonic acid (ABTS) method, while the ferric reducing antioxidant power (FRAP) assay was also utilized. The detailed procedures for ABTS and FRAP assays can be found in our previous study [25]. The results of ABTS and FRAP assays were expressed as Trolox equivalent antioxidant capacity (mmol of Trolox per liter of apple juice) and mmol of FeSO4 equivalents per liter of apple juice, respectively.
2.5. Statistical analysis
All experiments were replicated three times. The data were expressed as mean ± standard deviation. One-way analysis of variance was per-formed using SPSS Statistics 20.0 (IBM Corp., NY, USA). Significance was evaluated at p < 0.05, and independent t-test was used to separate the mean differences. Principal component analysis (PCA) was carried out using Minitab 17.1.0 (Minitab Inc., Coventry, UK).
3. Results and discussion
3.1. Effect of ultrasonication at the lag phase of Lactobacillus plantarum on the fermentation features of apple juice
3.1.1. Effect of ultrasonication at lag phase on the microbial growth The influence of ultrasound at the lag phase of Lactobacillus planta-
rum on their growth in apple juice is illustrated in Fig. 1a. As can be seen, the number of Lactobacillus plantarum in the sonicated apple juices increased faster than that in an un-sonicated apple juice, especially in the early stage of fermentation. After sonication for 0.5 h, the microbial count in the apple juices that were sonicated at 58.3, and 93.6 W/L increased from 7.48 to 7.91 and 7.82 Log CFU/mL, respectively. Instead, the number of Lactobacillus plantarum in the apple juice without soni-cation had no variations. This result implied that sonication shortened the duration of Lactobacillus plantarum staying in the lag phase. Similar results could be observed in the literature. For example, Shokri et al. [26] observed that subjecting to sonication every 2.5 h during fermen-tation of Lactococcus lactis subsp. Lactis in nutrient broth led to the increment of microbial count by 1.6 Log CFU/mL after incubation for 12.5 h. Ewe et al. [27] also reported that sonication of Lactobacillus fermentum parent cells promoted microbial growth in the subsequent fermentation in biotin-supplemented soymilk by 3–9%. Theoretically,
7.00
7.50
8.00
8.50
9.00
9.50
0 5 10 15 20 25 30 35 40 45
Via
ble
cells
(Log
CFU
/mL
)
Fermentation time (h)
c
7.00
7.50
8.00
8.50
9.00
9.50
0 5 10 15 20 25 30
Via
ble
cells
(Log
CFU
/mL
)
Fermentation time (h)
a
After 0.5-hultrasonication
7.50
8.00
8.50
9.00
9.50
0 5 10 15 20 25 30 35
Via
ble
cells
(Log
CFU
/mL
)
Fermentation time (h)
b
After 0.5-hultrasonication
After 0.5-hultrasonication
Fig. 1. Effect of ultrasonication on the quantity of Lactobacillus plantarum during fermentation of apple juice. a: sonication at lag phase; b: sonication at logarithmic phase; c: sonication at stationary phase.
H. Wang et al.

Ultrasonics Sonochemistry 73 (2021) 105486
4
sonication can loose the cell bunches of microbial culture, enhance cell membrane permeability, facilitate cellular transport of metabolites and nutrients, and promote microbial growth [6,18]. Moreover, the inten-sification of the growth of Lactobacillus plantarum attenuated once mi-crobial growth entered the stationary stage. A possible explanation of this phenomenon could be due to lactic acid accumulation [28] or nutrient deficiency that led to growth inhibition.
3.1.2. Effect of ultrasonication at lag phase on the sugar and organic acid profiles
Sugar is the major carbon source participating in microbial growth. The effect of sonication at lag phase on sugar profile in the fermented apple juice is shown in Table 1. Among all the detected sugars, glucose content decreased gradually during lactic acid fermentation. In contrast, there were no significant changes in sucrose and fructose contents in the whole 24.5-h of the fermentation process. In apple juices without soni-cation, glucose content decreased from 39.67 ± 3.03 to 29.90 ± 0.65 g/L at the end of fermentation. This result suggested that Lactobacillus plantarum preferentially used glucose among the three sugars. A similar phenomenon was referred to in the case of lactic acid fermentation of ginkgo kernel juice, and this phenomenon can be referred as carbon catabolite repression [29]. Moreover, sonication at lag phase did not affect the microbial utilization of sugar. The contents of all these three individual sugars in apple juices with and without sonication were the same throughout the whole fermentation period. Sugar evolutions in apple juice can be affected by both glycolysis and hydrolysis of oligo-saccharides during fermentation [30]. Thus, it was speculated both glycolysis and hydrolysis reactions could be influenced by sonication, resulting in the insignificant differences in sugar metabolism with and without sonication.
The influence of ultrasonication at lag phase on the organic acid profile of fermented apple juice was analyzed by principal component analysis (PCA). The PCA results are presented in Fig. 2a and 2b. Meanwhile, the original data about organic acid contents are listed in Supplementary Table 1. PC1 and PC2 explained 92.2% of the total
variance of apple juice samples, indicating that PCA well explored the effect of ultrasound treatment at lag phase on organic acid profile. Ac-cording to Fig. 2a, the apple juice samples fermented at different stages were distributed at different regions, implying that the organic profile changed markedly with fermentation. Unfermented apple juices and apple juices fermented for 0.5 h distributed on the negative side of PC2, while apple juices fermented for 6.5 and 12.5 h distributed on the pos-itive side of PC2. The variables corresponded to PC2 mainly include malic acid, lactic acid and pyruvic acid. Within 12.5 h of fermentation, the malic acid content decreased, and lactic acid content increased gradually. Taking fermentation without sonication for example, lactic acid content increased from 0 to 2570.49 ± 22.45 mg/L, and malic acid content declined by 86.5%. This phenomenon is widely recognized as malolactic fermentation, which biotransformed malic acid to lactic acid [31]. An increase in pyruvic acid content was associated with glycolysis and the product of which was pyruvic acid [29].
On the other hand, PC2 could separate apple juice samples fermented for 24.5 h from other samples. Compared with samples fermented for 12.5 h, apple juices fermented for 24.5 h were richer in lactic acid but contained less pyruvic acid. It was probably because pyruvic acid was an intermediate product in lactic acid fermentation, which can be further transformed to lactic acid and other products through homolactic fermentation, heterolactic fermentation and other metabolic pathways [32]. Besides, both citric acid and succinic acid contents experienced a first increase and then a declining trend throughout the 24.5 h of lactic acid fermentation. Citric acid and succinic acid are intermediate prod-ucts in the tricarboxylic acid cycle, and their contents usually stay in a dynamic change [33]. Pyruvic acid could be changed to citric acid if aerobic respiration played a dominant role, leading to increased citric acid [33]. Along with fermentation, citric acid can also be degraded by Lactobacillus plantarum to generate lactic acid, acetic acid and diacetyl [32].
Ultrasonication at lag phase affected the organic profile of apple juice significantly within the first 12.5 h of fermentation. The synthesis of lactic acid and bioconversion of malic acid were enhanced
Table 1 Concentrations (g/L) of specific sugars in the sonicated and un-sonicated apple juices during fermentation.
Sampling time after sonication (h)
Sample Sonication at lag phase (sonication at 0 h during fermentation)
Sonication at logarithmic phase (sonication at 8 h during fermentation)
Sonication at stationary phase (sonication at 18 h during fermentation)
Sucrose Glucose Fructose Sucrose Glucose Fructose Sucrose Glucose Fructose
Before fermentation
22.64 ±0.48a
39.67 ±3.03a
45.30 ±0.96abc
13.53 ±0.99a
54.00 ±1.80a
42.51 ±0.93a
10.22 ±0.23a
33.15 ±0.40a
27.05 ±0.12a
0 No sonication 22.20 ±0.18ab
40.03 ±1.36a
44.96 ±0.15abc
12.40 ±0.07b
48.76 ±0.17bcd
41.28 ±0.37ab
9.72 ±0.13b
29.42 ±1.69c
25.82 ±0.36bc
US at 58.3 W/L 22.26 ±0.14ab
39.31 ±3.18a
44.46 ±1.45bc
12.78 ±0.34ab
50.42 ±1.42b
41.62 ±0.03ab
9.60 ±0.29bc
30.89 ±1.24b
26.27 ±0.07b
US at 93.6 W/L 21.60 ±1.92ab
40.19 ±4.52a
46.24 ±0.17a
12.61 ±0.42b
49.72 ±2.30bc
41.69 ±0.74ab
9.62 ±0.01b
28.95 ±0.25 cd
25.75 ±0.53bc
6 No sonication 21.36 ±0.37b
36.71 ±1.78ab
45.21 ±0.18abc
12.86 ±0.50ab
46.35 ±0.42de
40.74 ±0.06b
9.29 ±0.02 cd
28.89 ±0.25 cd
25.74 ±0.12c
US at 58.3 W/L 21.98 ±0.04ab
35.81 ±1.59ab
45.10 ±0.31abc
12.68 ±0.39ab
47.87 ±2.00bcde
41.80 ±0.79ab
9.20 ±0.24de
28.17 ±0.01 cd
25.45 ±0.14cde
US at 93.6 W/L 22.01 ±0.08ab
35.91 ±0.13ab
46.06 ±0.51ab
12.47 ±0.06b
46.60 ±0.16cde
40.89 ±0.22ab
9.21 ±0.02de
28.72 ±0.10 cd
25.69 ±0.22 cd
12 No sonication 21.82 ±0.14ab
34.05 ±1.64bcd
45.08 ±0.77ab
12.47 ±0.14b
45.33 ±0.72e
40.52 ±0.70b
9.07 ±0.02de
28.03 ±0.54d
25.46 ±0.16cde
US at 58.3 W/L 21.62 ±0.01ab
34.44 ±0.53bc
44.96 ±1.75abc
12.62 ±0.09b
45.62 ±0.42de
40.47 ±0.98b
8.92 ±0.10e
28.11 ±0.18 cd
25.36 ±0.07cde
US at 93.6 W/L 21.25 ±0.17b
33.19 ±1.223bcd
45.05 ±0.76abc
12.66 ±0.49b
47.57 ±3.82bcde
41.80 ±2.13ab
8.97 ±0.14de
28.14 ±0.00 cd
25.19 ±0.31de
24 No sonication 21.68 ±0.03ab
29.90 ±0.65d
44.22 ±0.12c
12.67 ±0.08ab
45.20 ±0.40e
40.29 ±0.12b
8.91 ±0.05e
28.16 ±0.03 cd
25.21 ±0.23de
US at 58.3 W/L 21.22 ±0.39b
29.85 ±0.26d
44.74 ±0.16abc
12.38 ±0.01b
44.55 ±0.37e
40.32 ±0.46b
9.00 ±0.22de
27.70 ±0.45d
25.03 ±0.11e
US at 93.6 W/L 21.38 ±0.04b
31.09 ±1.99 cd
44.52 ±0.45bc
12.66 ±0.40ab
45.61 ±1.03de
40.42 ±0.41b
8.95 ±0.05e
28.09 ±0.16 cd
25.09 ±0.21e
Data are averages of different samples ± standard deviation; values followed by different letters in each column indicate significant differences (p < 0.05); US refers to ultrasonication.
H. Wang et al.

Ultrasonics Sonochemistry 73 (2021) 105486
5
immediately after sonication for 0.5 h. The contents of lactic acid and malic acid in the sonicated samples at 93.6 W/L were 28.84 mg/L higher and 42.12 mg/L lower than that in the un-sonicated samples, respec-tively. It was supposed that the malolactic fermentation-related me-tabolisms were promoted by ultrasound through facilitating microbial growth, enhancing cell membrane permeability, and accelerating intracellular and extracellular mass transfers [26,34]. In the meantime, the contents of citric acid and succinic acid in the ultrasound-treated apple juices were all significantly higher than that in the samples without sonication. It was deduced that tricarboxylic acid cycle in Lactobacillus plantarum was also influenced by sonication. More changes in the organic acid profile were found in the apple juices fermented for 6.5 h. At this stage, the difference in the lactic acid content between samples with and without sonication enlarged. Sonicated apple juices contained more pyruvic acid compared to un-sonicated samples. This phenomenon indicated that the glycolysis might also be intensified by ultrasound, leading to a higher pyruvic acid yield. Moreover, sonicated apple juices contained less citric acid than samples without ultrasound treatment, and the difference was statistically significant. The influence of ultrasound on the metabolism of organic acids was weakened with the increase of fermentation time. After fermentation for 12.5 h, the pyruvic acid content in apple juices sonicated at 93.6 W/L was slightly lower than that in the un-sonicated samples. In contrast, the differences in the contents of malic acid, citric acid and succinic acid between samples with and without sonication can be negligible. After fermentation for 24.5 h, all the samples were distributed together (Fig. 2a).
In summary, a series of metabolic pathways, including bioconversion of malic acid to lactic acid, glycolysis and the tricarboxylic acid cycle can be influenced or intensified by ultrasound. However, the influence of ultrasound got attenuated with the appearance of a new generation of lactic acid bacteria. Both Shokri et al. [26] and Hashemi et al. [34] also reported that ultrasound treatment stimulated Lactococcus lactis subsp. Lactis and Lactobacillus helveticus PTCC 1332 to synthesize lactic acid in the nutrient broth and date syrup, respectively. However, the knowledge about the ultrasonic influence on the detailed organic acid profile be-sides lactic acid during lactic acid fermentation is limited.
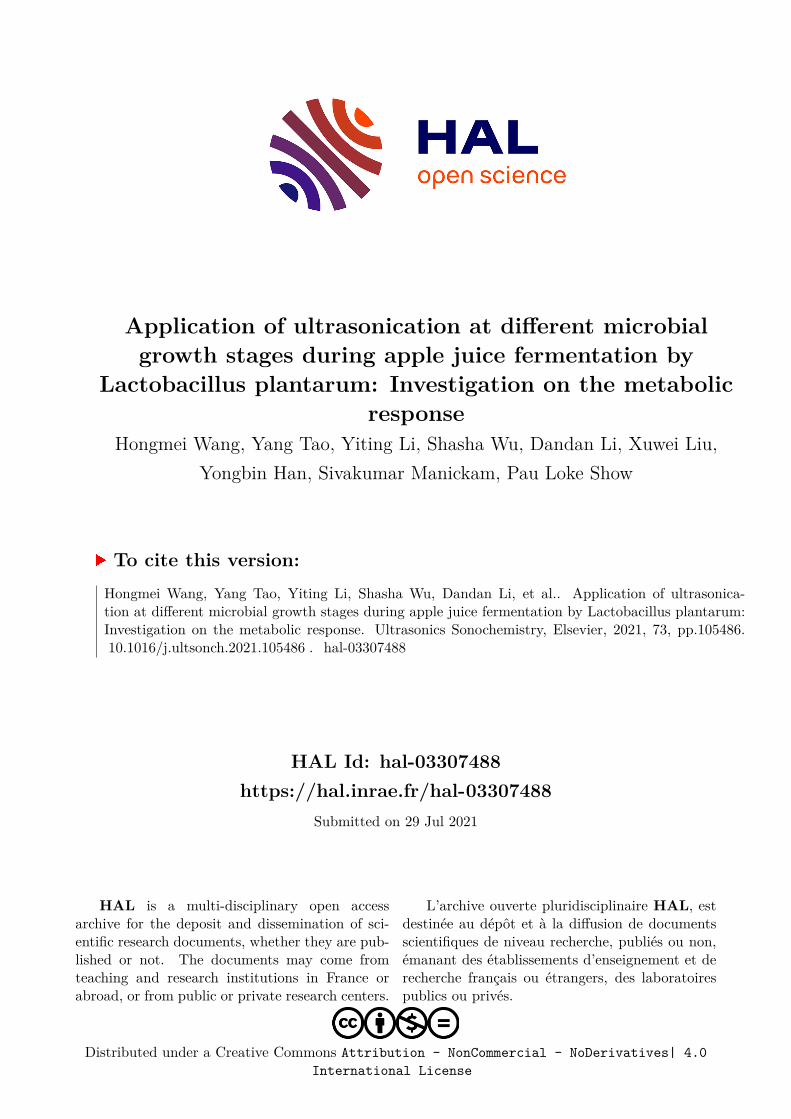
3.1.3. Effect of ultrasonication at lag phase on the amino acid profile In the applied apple cultivar, 15 amino acids were tentatively iden-
tified. Among them, Asp (234.79 ± 8.86 mg/L) had the highest content in the apple juice before fermentation, followed by Gly (81.18 ± 1.00 mg/L), Glu (73.26 ± 2.20 mg/L) and Ala (62.50 ± 1.24 mg/L). The amino acid profile changed with fermentation since apple juices fer-mented for different times located in different regions (Fig. 3a). Based on Fig. 3a and 3b, probiotic fermentation led to the decline of Ala, Tyr, Phe and Glu, as well as an increase in the contents of Pro, Gly, Val, Lys and Ile. The detailed data about amino acid profile are listed in Supple-mentary Table 2. All the amino acids stayed in dynamic changes throughout the whole fermentation process. After 24.5 h of fermenta-tion, the contents of Ala, Tyr, Phe and Glu in the un-sonicated samples were significantly decreased from 62.50 ± 1.24 to 39.39 ± 1.40 mg/L, 32.88 ± 0.67 to 21.10 ± 0.06 mg/L, 42.46 ± 0.11 to 30.89 ± 0.01 mg/L, 73.26 ± 2.20 to 59.56 ± 0.29 mg/L, respectively. Filannino et al. [35] also reported the decline of Tyr and Phe in the case of lactic acid fermentation of pomegranate juice. The decline of amino acid contents, as mentioned above, can be referred to the catabolism of amino acids, one mechanism for the microbial adaptation to juice environment [4]. For example, the participation of amino acids, such as Ala, Arg, Leu, Ile, His, etc. in the microbial mechanism can provide nitrogen nutrients for the microbial growth, generate energies by decarboxylation, enrich juice flavor through a series of conversions, and enhance acid resistance [36,37]. On the other hand, the contents of Pro, Gly, Val, Lys and Ile were slightly increased from 13.95 ± 0.26 to 16.52 ± 0.09 mg/L, 81.18 ± 1.00 to 84.41 ± 0.69 mg/L, 30.78 ± 0.25 to 35.34 ± 0.25 mg/L, 29.87 ± 0.31 to 32.11 ± 0.68 mg/L, and 27.31 ± 0.67 to 29.63 ± 0.14. The increases in the contents of these amino acids were all statistically sig-nificant. This could be because microbial death in the late stage of fermentation can lead to cell autolysis and release intracellular proteins, which may be further hydrolyzed to amino acids [38]. Instead, Filannino et al. [4] claimed that branched-chain amino acids such as Val, Ile and Leu decreased significantly during lactic acid fermentation of carrot and tomato juices. To date, the metabolism of amino acids during lactic acid fermentation of fruit and vegetable juices has been poorly studied, and more exploration in this topic is needed in the future.
Fig. 2. Principal component analysis based on organic acid contents in the apple juices during fermentation with ultrasonic assistance. a and b: score and loading plots for samples sonicated at lag phase (referring to sonication at 0 h during fermentation); c and d: score and loading plots for samples sonicated at logarithmic phase (referring to sonication at 8 h during fermentation); e and f: score and loading plots for samples sonicated at stationary phase (referring to sonication at 18 h during fermentation). The periods 0, 6, 12, 24 h meant sampling times after each ultrasound treatment during fermentation.
H. Wang et al.
Ultrasonics Sonochemistry 73 (2021) 105486
6
Compared to the fermented apple juices without sonication, soni-cation at 58.3 W/L at lag phase influenced the amino acid profile pro-foundly. Instead, fewer changes were observed in the sonicated apple juices at 93.6 W/L. According to the PCA score plot (Fig. 3a), the amino acid profile differences between sonicated and unsonicated samples mainly exist within the first 12.5 h of fermentation. In contrast, all the samples at the end of fermentation were distributed closely. This outcome is consistent with the results, as mentioned earlier about organic acid. After 0.5 h of sonication immediately, as well as sonication followed by another 6 h of incubation, ultrasound-treated samples at 58.3 W/L possessed lower amino acid contents than the samples without sonication. During this period, ultrasound, especially at 58.3 W/L, promoted the growth of Lactobacillus plantarum. Accordingly, the catabolism and bioconversion of amino acids may also be stimulated by ultrasound, resulting in a higher decline trend. On the contrary, soni-cated samples at 58.3 W/L with another 12 h of fermentation were featured by higher amino acid contents compared with un-sonicated samples. Since the microbial growth entered the stationary phase at this stage, ultrasound may also promote cell autolysis and hydrolysis of intracellular proteins, leading to an increase in the amino acid contents.
3.1.4. Effect of ultrasonication at lag phase on the phenolic profile and antioxidant capacity of apple juice
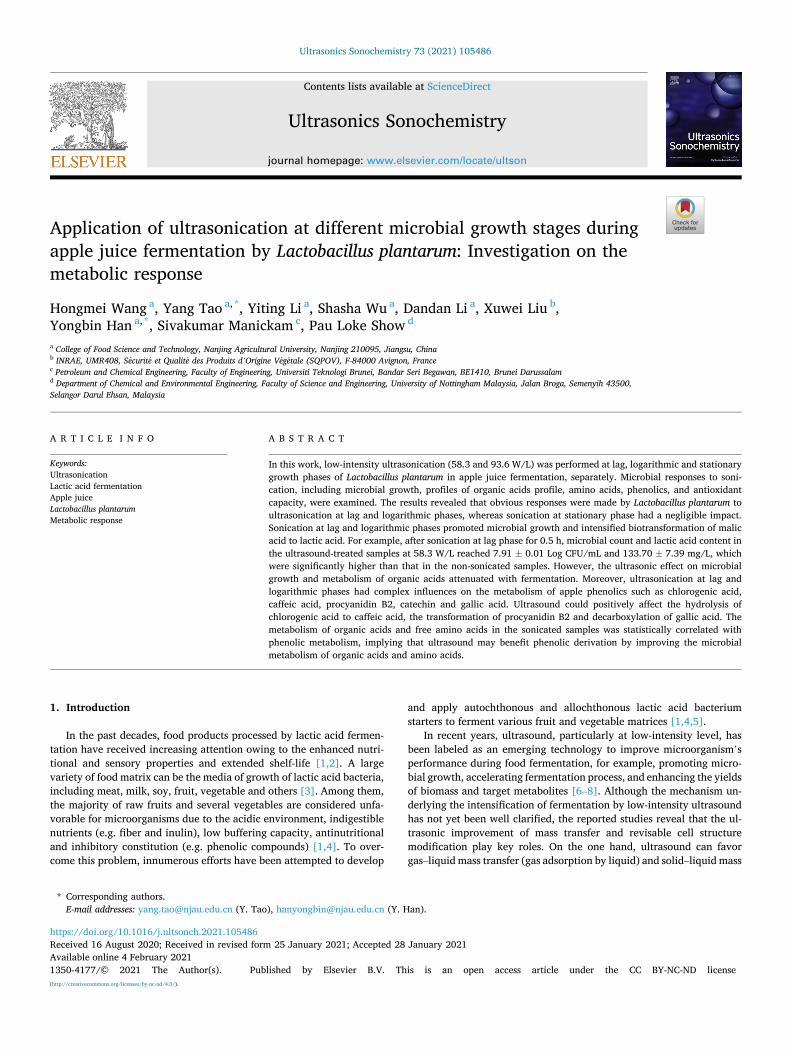
Based on Fig. 4a, probiotic fermentation led to the decline of total phenolic content in the apple juices. After 24.5 h of fermentation, the total phenolic content decreased from 918.85 ± 10.88 mg/L to approximately 860 mg/L. Meanwhile, there was only a statistically significant difference in the total phenolic content between sonicated and unsonicated samples after 12.5 h of fermentation. In contrast, the ultrasonic effect can be neglected at other stages of fermentation. Ankolekar et al. [39] and Hashemi et al. [40] also reported that the total phenolic contents in both apple and lemon juices decreased after lactic acid fermentation.
On the other hand, phenolics experienced complex conversions under the action of lactic acid bacteria, for example, decarboxylation, oxidation, reduction and epimerization [12]. The original data about the
evolutions of detailed phenolic profiles under fermentation with soni-cation at lag phase are listed in Supplementary Table 3, and PCA was employed to extract the data. Based on the distribution of samples and individual phenolics, as shown in Fig. 5a and b, the samples at different fermentation stages can be well separated according to the phenolic profile. Generally, catechin and phloretic acid contents exhibited an increasing trend, whereas the contents of chlorogenic acid, procyanidin B2, protocatechuic acid, ferulic acid, and gallic acid decreased with fermentation. Taking samples without sonication, for example, catechin and phloretic acid contents increased from 5.48 ± 0.20 to 14.23 ± 0.01 mg/L, and 2.32 ± 0.68 to 10.30 ± 0.62 mg/L at the end of fermentation. Chlorogenic acid and procyanidin B2 contents declined from 134.24 ±0.03 to 127.38 ± 0.20 mg/L, and 66.91 ± 2.13 to 61.51 ± 1.32 mg/L. Under lactic acid fermentation, chlorogenic acid can undergo a degra-dation process and be transformed into caffeic acid, leading to chloro-genic acid loss [5,41]. Meanwhile, caffeic acid can be further transformed into the corresponding derivatives by phenolic acid decarboxylase and reductase [12], resulting in an unclear change of caffeic acid content. The increase of gallic acid content at the early stage of fermentation can be attributed to the hydrolysis of gallic acid-related derivatives, such as hydrolyzable tannins, and gallic acid esters [42]. Gallic acid can also be decarboxylated to form pyrogallic acid, associ-ated with the loss of gallic acid [12]. Moreover, protocatechuic acid can also face a decarboxylation process, resulting in catechol formation [12,43]. Besides, according to the study of Rodríguez et al. [12] and Filannino et al. [4], phloretic acid and vinyl phenol can be formed due to the decarboxylation and reduction of p-coumaric acid under the action of lactic acid bacteria. Procyanidin B2, as a dimer of epicatechin, is not easily absorbed in the human gastrointestinal tract [44]. However, it can be broken down into catechin or epicatechin by colonic microbiota, including Lactobacillus [45], and catechin and epicatechin can be quickly absorbed in the upper part of the small intestine [44]. Procya-nidin B2 may also be converted into phenyl propionic acids, phenyl-acetic acid and benzoic acid derivatives without being depolymerized into monomers [44]. Rupasinghe et al. [46] found that the biotrans-formation of cranberry proanthocyanidins can produce more bioactive
Fig. 3. Principal component analysis based on free amino acid contents in the apple juices during fermentation with ultrasonic assistance. a and b: score and loading plots for samples sonicated at lag phase (referring to sonication at 0 h during fermentation); c and d: score and loading plots for samples sonicated at logarithmic phase (referring to sonication at 8 h during fermentation); e and f: score and loading plots for samples sonicated at stationary phase (referring to sonication at 18 h during fermentation). The periods 0, 6, 12, 24 h meant sampling times after each ultrasound treatment during fermentation.
H. Wang et al.
Ultrasonics Sonochemistry 73 (2021) 105486
7
substances and enhance pharmacological activity in the fermentation by Lactobacillus rhamnosus. Overall, several reactions have been identified in the phenolic metabolism during probiotic fermentation, and the changes of phenolics can affect the quality and nutritional values of fermented products profoundly [47,48].
Sonication at lag phase can somewhat affect the metabolism of phenolic compounds in the probiotic fermentation of apple juice. Ac-cording to Fig. 5a, the scores of ultrasound-treated samples on PC1 were lower than that of un-sonicated samples throughout the entire fermen-tation, except the samples fermented for 12.5 h. For sonicated samples, their scores on PC1 decreased with the increase of acoustic energy density. Thus, PC1 was the contributor to distinguish samples with and without sonication. Chlorogenic acid, epicatechin, procyanidin B2, protocatechuic acid, ferulic acid, gallic acid were located on the positive side of PC1. In contrast, catechin, phloretic acid, caffeic acid and p- coumaric acid were distributed on the negative side of PC1. Therefore, sonication can enhance the contents of caffeic acid and catechin in the apple juice, as well as lower the contents of chlorogenic acid, procya-nidin B2 and gallic acid, despite that these changes were in a small scale. It could be noted from Supplementary Table 3 that after 0.5 h of soni-cation without further incubation, the contents of procyanidin B2 declined by 1.79 mg/L at 58.3 W/L and 5.57 mg/L at 93.6 W/L, respectively. Gallic acid contents in the sonicated samples were always
lower than those in the un-sonicated samples at all the sampling points, although some were insignificant. The catechin contents in both the sonicated samples after fermentation for 6.5 h were slightly higher than the unsonicated samples. Accordingly, the bioconversions mentioned above among phenolics like decarboxylation, oxidation and reduction, can be affected by ultrasound, which may impact the quality and nutritional value of the fermented products.
The influence of ultrasonication at lag phase on the antioxidant ca-pacities of fermented apple juice in vitro is illustrated in Fig. 6a and b. Lactic acid fermentation led to the slight enhancement of ABTS•+ radical scavenging capacity of apple juice. According to Fig. 6a, the ABTS•+
radical scavenging capacity of all the fermented samples were signifi-cantly higher than that of unfermented samples.
Similarly, Kwaw et al. [49] reported that the ABTS•+ radical scav-enging capacity of mulberry juice increased by 10.9%, 22.3% and 19.6% after 36 h of fermentation by Lactobacillus plantarum, Lactobacillus aci-dophilus and Lactobacillus paracasei, respectively. The free radical scav-enging capacity of fermented products is dependent on several factors, like microbial strains, pH, temperature, fermentation time, dissolved oxygen, etc. [50]. Meanwhile, lactic acid bacteria itself has the antiox-idant ability [51]. Moreover, the above bioconversions of phenolics may also have connections with the increase of ABTS•+ radical scavenging capacity. Instead, the ferric reducing power of apple juice exhibited a declining trend with fermentation, although the change was small. Gao et al. [52] also reported that the reducing power of Momordica charantia juice fermented by Lactobacillus plantarum was lower than that of fresh juice. Also, sonication at lag phase had an unclear influence on the antioxidant capacity of fermented apple juice, and these changes could be neglected.
3.2. Effect of ultrasonication at logarithmic phase of Lactobacillus plantarum on the fermentation features of apple juice
3.2.1. Effect of ultrasonication at logarithmic phase on the microbial growth
According to Fig. 1b, sonication at the logarithmic phase also somewhat promoted the growth of Lactobacillus plantarum in the apple juice. After 0.5 h of sonication at 93.6 W/L immediately referring to fermentation for 8.5 h, the microbial count was 8.86 Log CFU/mL, which was 3.6% higher than that in the non-sonicated sample. The ul-trasonic influence on the microbial growth attenuated with the pro-longation of fermentation. After fermentation for 20.5 h, there was no noteworthy difference in the microbial count between sonicated and non-sonicated apple juices. Inversely, Shi et al. [53] and Huang et al. [7] reported that sonication at the logarithmic phase could exert persistent influence on the subsequent growth of Saccharomyces cerevisiae and Lactobacillus paracasei, resulting in the acceleration of fermentation and enhancement of biomass. This result can be explained by the difference in the sensitivity of Lactobacillus plantarum at different growth stages to ultrasonic stimulation since the structure and physiological properties of microorganism change dynamically with their growth [53]. Overall, the stimulation of microbial growth under sonication at logarithmic phase was weaker than that under sonication at lag phase.
3.2.2. Effect of ultrasonication at logarithmic phase on the sugar and organic acid profiles
Similar to the results presented in Section 3.1.2, the data on the effect of ultrasonication at logarithmic phase on the sugar profile also implied that glucose was better utilized by Lactobacillus plantarum than sucrose and fructose, and sonication at logarithmic phase had negligible influ-ence on the evolution of sugar contents during fermentation (Table 1).
The evolutions of organic acid contents after sonication at logarith-mic phase are exhibited in Supplementary Table 4. Meanwhile, PCA plots about the effect of sonication at logarithmic phase on the organic acid profile are illustrated in Fig. 2c and 2d. According to Fig. 2c, the sample points were scattered after 0.5 h of sonication immediately. After
Fig. 4. Effect of ultrasonication on the total phenolic content during lactic acid fermentation of apple juice. a: sonication at lag phase (referring to sonication at 0 h during fermentation); b: sonication at logarithmic phase (referring to son-ication at 8 h during fermentation); c: sonication at stationary phase (referring to sonication at 18 h during fermentation).
H. Wang et al.

Ultrasonics Sonochemistry 73 (2021) 105486
8
that, the samples with and without sonication assembled with the progress of fermentation. This result is consistent with the influence of sonication at logarithmic phase on the microbial phase. The contents of malic acid and succinic acid in the fermented apple juices just after sonication at 93.6 W/L were 418.65 ± 26.18 and 278.46 ± 23.82 mg/L, respectively, which were 178.81 and 86.59 mg/L lower than the coun-terparts in the fermented juices without sonication. Correspondingly, the lactic acid content was 232.91 mg/L higher than that in the non- sonicated fermented juices. Moreover, the amount of malic acid in the samples immediately after sonication at 58.3 W/L was also significantly lower than that in the non-sonicated samples. These data implied that sonication at the logarithmic phase could intensify the transformation from malic acid to lactic acid, and affect the tricarboxylic acid cycle during lactic acid fermentation.
The attenuation of ultrasonic impact on the subsequent microbial metabolism and organic acid evolution could probably be related to the growth of the new generation of microorganism. The study of Yeo et al. [54] reported that although ultrasound processing promoted the growth of Lactobacillus casei, the biotransformation of isoflavones and cholate- tolerance, ultrasound could not affect the subsequent passages of cells continuously. Both the results about sonication at lag and logarithmic
phases indicated that previous ultrasonication had no significant influ-ence on the profile of organic acids when the microbial growth moved to the stationary phase. It was supposed that the accumulation of lactic acid and nutrient deficiency in the apple juice could inhibit the meta-bolism of organic acids when the fermentation entered the stationary phase [28].
3.2.3. Effect of ultrasonication at logarithmic phase on the amino acid profile
The changes of amino acid contents in the apple juices after ultra-sonication at logarithmic phase are listed in Supplementary Table 5. And the PCA score and loading plots are shown in Fig. 3c and 3d. As can be seen, the amino acid profile in the non-sonicated samples evolved similarly to that previously discussed in Section 3.1.3. Meanwhile, sonication at logarithmic phase exerted continuous influences on the metabolism of amino acids in the subsequent fermentation process. According to Fig. 3c and 3d, all the ultrasound-treated samples were located on the right side of samples without sonication at each sampling time. All the individual amino acids had positive values on PC1. Thus, it can be deduced that compared to fermented apple juices without soni-cation, ultrasound-treated counterparts possessed higher contents of
c
0 h
6 h
12 h
24 h
catechin
ferulic acid
d
phloretic acidprotocatechuic
acidp-coumaric
acidgallic acid
procyanidin B2
epicatechin
chlorogenic acid
caffeic acid
p-coumaric
acidprotocatechuic
acidepicatechin
gallic acidchlogenic acid
procyanidin B2ferulic acid
catechin
caffeic acid
phloretic acid
b
12 h
0 h
6 h
24 h
a
Fig. 5. Principal component analysis based on individual phenolic contents in the apple juices during fermentation with ultrasonic assistance. a and b: score and loading plots for samples sonicated at lag phase (referring to sonication at 0 h during fermentation); c and d: score and loading plots for samples sonicated at logarithmic phase (referring to sonication at 8 h during fermentation); e and f: score and loading plots for samples sonicated at stationary phase (referring to sonication at 18 h during fermentation). The periods 0, 6, 12, 24 h meant sampling times after each ultrasound treatment during fermentation.
H. Wang et al.

Ultrasonics Sonochemistry 73 (2021) 105486
9
free amino acids. The data in Supplementary Table 5 validate this. As previously discussed in Section 3.1.3, it was found that sonication (58.3 W/L) at lag phase led to higher utilization of amino acids by lactic acid bacteria accompanied by lower amino acid contents in the apple juices. In contrast, sonication at logarithmic phase seemed to inhibit the utili-zation of amino acid due to higher amino acid contents in the juices. This phenomenon could be because sonication accelerated the microbial growth, making the transition from the logarithmic phase to the sta-tionary phase earlier. In stationary phase, microorganisms tend to autolyse and release and hydrolyze intracellular proteins [38]. Besides, amino acid metabolism by lactic acid bacteria can also become weaker in the stationary phase. Accordingly, higher amino acid contents in the apple juices were observed during the subsequent fermentation process after sonication at the logarithmic phase.
3.2.4. Effect of ultrasonication at logarithmic phase on the phenolic profile and antioxidant capacity of apple juice
In line with Fig. 4a, the results illustrated in Fig. 4b also show a declining trend in the total phenolic content during lactic acid fermen-tation. Referring to individual phenolics shown in Fig. 5c and 5d and
Supplementary Table 6, the evolutions of chlorogenic acid, procyanidin B2, caffeic acid, gallic acid, catechin, protocatechuic acid, epicatechin and phloretic acid in the control sample were also similar to that in the counterparts shown in Fig. 5a and 5b and Supplementary Table 3. Generally, the contents of chlorogenic acid, procyanidin B2, proto-catechuic acid and gallic acid in the apple juices declined gradually, whereas the contents of catechin and phloretic acid showed an increasing trend.
According to Fig. 4b, ultrasonication at the logarithmic phase had an ignorable effect on the total phenolic content in the fermented apple juices. However, ultrasound treatment at logarithmic phase exerted some influences on the specific phenolic compounds, including chloro-genic acid, caffeic acid, procyanidin B2, catechin and gallic acid. As shown in Fig. 5c, the loading values of ultrasound-treated samples on PC1 at different fermentation periods were always lower than that of control samples. Chlorogenic acid, procyanidin B2 and gallic acid had high values on PC1, while caffeic acid and catechin possessed lower values on PC1 (Fig. 5d). Thus, it can be deduced that sonication at logarithmic phase decreased the amounts of chlorogenic acid, procya-nidin B2 and gallic acid, and increased the amounts of caffeic acid and
Fig. 6. Effects of ultrasonication on ABTS•+ radical scavenging capacity (a, c and e) and ferric reducing power (b, d and f) of apple juice during fermentation. a and b: sonication at lag phase (referring to sonication at 0 h during fermentation); c and d: sonication at logarithmic phase (referring to sonication at 8 h during fermentation); e and f: sonication at stationary phase (referring to sonication at 18 h during fermentation).
H. Wang et al.

Ultrasonics Sonochemistry 73 (2021) 105486
10
catechin in the apple juices during lactic acid fermentation. In Supple-mentary Table 6, the chlorogenic acid content in the ultrasound-treated samples was always lower than that in the non-ultrasound treated samples throughout fermentation. After fermentation for 32.5 h, the chlorogenic acid content in the control sample declined by 3.89%, whereas 13.29% of chlorogenic acid was lost or hydrolyzed in the son-icated samples at 93.6 W/L. As the product derived from chlorogenic acid hydrolysis [41], caffeic acid content increased significantly from 0.75 mg/L to 4.52 mg/L immediately after 0.5 h of sonication at 93.6 W/ L with respect to 8.5 h of fermentation. Moreover, the content of pro-cyanidin B2 in the fermented samples just after sonication at 93.6 W/L was significantly lower than that in the samples without sonication.
In comparison, catechin content was significantly higher than that in the control samples. Besides, gallic acid contents in the ultrasound- processed samples at both 58.3 and 93.6 W/L were always lower than that in the control samples in the subsequent fermentation following sonication. Together with sonication at lag phase, sonication at loga-rithmic phase can also change the bioconversion of phenolics during lactic acid fermentation, such as the hydrolysis of chlorogenic acid to form caffeic acid [41] and transformation of procyanidin B2 [44], and decarboxylation of gallic acid [12].
The influence of ultrasonication at the logarithmic phase on the antioxidant capacity of fermented apple juices is plotted in Fig. 6c and 6d. It can be seen that sonication at logarithmic phase strengthened the ABTS•+ radical scavenging capacity of apple juice throughout fermen-tation. At the end of fermentation, ABTS•+ radical scavenging capacity of juice sample previously sonicated at 93.6 W/L was 36.7 mmol Trolox/ L, which was 17% higher than that of the non-sonicated counterpart. Similarly, sonication at logarithmic phase also intensified the ferric reducing power of fermented apple juice. After fermentation for 32.5 h, the ferric reducing power of sonicated apple juice at 93.6 W/L (6.87 mmol Fe2+/L) was 8.1% higher than that of the control sample (6.35 mmol Fe2+/L). Combined with the phenolic profile results, it was sup-posed that ultrasonication at logarithmic phase influenced the biocon-version and derivation of phenolics during lactic acid fermentation, thus promoting the enhancement of antioxidant capacity of juice sample in vitro. However, the results mentioned above in Section 3.1.4 revealed that sonication at lag phase also changed the phenolic profile, whereas the antioxidant capacity was less affected. More investigations are needed to study the detailed chemical reactions among phenolics during lactic acid fermentation in an ultrasonic field.
3.3. Effect of sonication at stationary phase of Lactobacillus plantarum on the fermentation features of apple juice
3.3.1. Effect of sonication at stationary phase on the microbial growth, profiles of sugar, organic acids and amino acids
According to Fig. 1c and Table 1, ultrasonication at the stationary phase could not influence the microbial growth and sugar utilization in the subsequent fermentation period. The differences in the microbial count and sugar contents between sonicated and non-sonicated samples were all insignificant (p > 0.05) Similarly, Shi et al. [53] reported that sonication at stationary phase did not influence the growth of Saccha-romyces cerevisiae. Moreover, no exact impact of sonication at stationary phase on the organic acid profile was observed based on Fig. 2e and 2f. The malic acid content in the fermented apple juices just after sonication was markedly lower than that of non-sonicated samples, whereas other changes in the organic profile could be ignored (Supplementary Table 7). The results above also clarified that the effects of sonication at both lag and logarithmic phases on the microbial growth, sugar and organic acid profiles attenuated when fermentation moved to stationary phase. Considering these results, it can be deduced that ultrasound could not exert marked influence on the microbial growth and metabolism of organic acid in the stationary phase of Lactobacillus plantarum.
On the other hand, fermented apple juices just after sonication at 58.3 W/L possessed lower amino acid contents like Asp, Glu, Leu, Lys
and others than the non-sonicated samples. After sonication for 6, 12 and 24 h, the effect of sonication at both 58.3 and 93.6 W/L on the amino acid profile of all the fermented apple juices were not significant (Fig. 3e, 3f and Supplementary Table 8).
3.3.2. Effect of ultrasonication at stationary phase on the total phenolic content, phenolic profile and antioxidant capacity
According to Fig. 4c, sonicated apple juices at 58.3, and 93.6 W/L possessed higher amounts of total phenolics than unsonicated juices in the subsequent fermentation process, although the differences were small. Simultaneously, sonicated apple juices also exhibited a stronger ability to reduce ferric to ferrous ion (Fig. 6f). However, phenolic profile data (Fig. 5e and 5f and Supplementary Table 9) revealed that sonication at stationary phase had an ignorable influence on the specific phenolic compounds listed. As previously discussed, complex reactions may occur among phenolics under the action of lactic acid bacteria, and some of the resulting phenolic derivatives such as pyrogallic acid transferred from gallic acid and dihydrocaffeic acid transferred from caffeic acid possess strong antioxidant capacity than their phenolic substrates [12,55]. The slight enhancement of ferric reducing power may be associated with phenolic derivations. A comprehensive analysis of phenolic profile is needed in the next step to clarify the reactions among phenolics.
Taking microbial growth and detailed juice composition changes into consideration, it was found that ultrasonication at lag and loga-rithmic phases can exert more profound influences on microbial meta-bolism and juice composition than ultrasound treatment at stationary phase throughout the fermentation of apple juices by Lactobacillus plantarum.
3.4. Correlation between phenolic composition and profiles of organic acids and amino acids
The phenolic composition is the key factor determining the quality of fermented apple juice, and the metabolism of organic acid and amino acid has implicative connections with phenolic bioconversion [4,5]. To understand the relationship between phenolic profile and composition of organic acids and amino acids under ultrasound-assisted fermenta-tion, Pearsons’ correlation coefficients were calculated using the data on the samples sonicated at lag and logarithmic phases. As shown in Table 2, the relationship between phenolic profile and organic acid profile for the samples sonicated at lag phase was similar to that of samples sonicated at the logarithmic phase, except the relationship be-tween ferulic acid and organic acids. For example, lactic acid content had a significant correlation with chlorogenic acid, protocatechuic acid, procyanidin B2, catechin, gallic acid, phloretic acid and epicatechin. Meanwhile, malic acid content was significantly correlated with the contents of chlorogenic acid, protocatechuic acid, procyanidin B2, catechin, gallic acid, phloretic acid and epicatechin. As mentioned previously, the contents of chlorogenic acid, procyanidin B2 and gallic acid decreased under ultrasound-assisted fermentation. In contrast, the amounts of caffeic acid and catechin increased, which could be associ-ated with the hydrolysis of chlorogenic acid to caffeic acid, and the transformation of procyanidin B2 and decarboxylation of gallic acid. Considering these statistical relationships between organic acids and phenolics, it was deduced that ultrasonic intensification of biotransfor-mation of malic acid to lactic acid promoted the bioconversions of phenolics. The study of Filannino et al. [4] also reported that the decarboxylation of malic acid and the generation of lactic acid directly affected the bioconversion of phenolic compounds.
Table 3 shows the relationship between phenolic profile (including chlorogenic acid, protocatechuic acid, procyanidin B2, catechin, gallic acid, phloretic acid and epicatechin) and amino acid profile for the sonicated samples at lag phase was close to that of samples sonicated at log phase. Taking His and Tyr for example, their contents were posi-tively correlated with chlorogenic acid, procyanidin B2 and gallic acid contents, and negatively correlated with catechin content during
H. Wang et al.

Ultrasonics Sonochemistry 73 (2021) 105486
11
fermentation with ultrasonic assistance at lag phase. The study of Filannino et al. [4] claimed that the catabolism of His and Tyr could assist Lactobacillus plantarum to regulate intracellular pH and stimulate its growth in an acid environment, indirectly interfering phenolic bioconversion. According to the exhibited relationship between phe-nolics and amino acids, it can be found that the catabolism of free amino acids in the apple juices under an ultrasonic field also has a profound influence on the metabolism of phenolic compounds during Lactobacillus plantarum fermentation.
Additionally, the current study demonstrated that the metabolism of phenolics organic acids and amino acids had weak connections with sugar changes under ultrasound-assisted fermentation. The results, as mentioned above, showed ultrasound did not affect the metabolism of individual sugars. Generally, the reactions about organic acids, amino acids and phenolics are closely related to the composition of substrates, intermediate products and final products, and enzymatic activity like
phenolic acid decarboxylase, esterase, glycosidase, etc. [2,12,36]. Sugars were not the key component affecting the metabolic pathways of these bioreactions. As a result, sugar changes may not interfere the evolutions of organic acids, amino acids and phenolics directly under an ultrasonic field.
4. Conclusions
The current study demonstrated that low-intensity ultrasonication at lag and logarithmic phases of Lactobacillus plantarum exerted compli-cated influences on the microbial metabolism in the apple juices, particularly sonication at lag phase. On the contrary, no distinct meta-bolic responses of Lactobacillus plantarum were observed when ultra-sonication was applied in the stationary phase. The microbial number was increased by 0.51 and 0.31 Log CFU/mL immediately after soni-cation at the lag phase (58.3 W/L) and the logarithmic phase (93.6 W/
Table 2 Pearson’s correlation coefficients between the phenolic profile and organic acid profile.
*Correlation is significant at p < 0.05; **Correlation is significant at p < 0.01; data marked in red color indicate that the relationship for samples sonicated at lag phase is similar to that for samples sonicated at logarithmic phase.
Table 3 Pearson’s correlation coefficients between the phenolic profile and amino acid profile.
*Correlation is significant at p < 0.05; **Correlation is significant at p < 0.01; data marked in red color indicate that the relationship for samples sonicated at lag phase was similar to that for samples sonicated at logarithmic phase.
H. Wang et al.
Ultrasonics Sonochemistry 73 (2021) 105486
12
L), respectively. Meanwhile, the biotransformation of malic acid to lactic acid was enhanced by sonication at both lag and logarithmic phases. More importantly, sonication at both lag and logarithmic phases seemed to assist the hydrolysis of chlorogenic acid to caffeic acid, the transformation of procyanidin B2 and decarboxylation of gallic acid. Correlation analysis revealed that ultrasound treatment strengthened the bonds between the metabolism of organic acids and free amino acids and phenolic derivations. It was speculated that ultrasound intensified both biosyntheses of lactic acid and catabolism of free amino acids by Lactobacillus plantarum, consequently regulating the derivations of phenolics in the apple juices. This study guides the adaptability of lactic acid bacteria in the production of fruit and vegetable juices. More fundamental studies are needed in the future to explore the mechanism of the ultrasonic enhancement of lactic acid fermentation in fruit and vegetable materials.
CRediT authorship contribution statement
Hongmei Wang: Methodology, Investigation, Data curation, Soft-ware, Writing - original draft. Yang Tao: Conceptualization, Method-ology, Investigation, Writing - original draft, Writing - review & editing, Supervision. Yiting Li: Investigation. Shasha Wu: Investigation. Dan-dan Li: Writing - review & editing. Xuwei Liu: Writing - review & editing. Yongbin Han: Writing - review & editing, Supervision. Siva-kumar Manickam: Writing - review & editing. Pau Loke Show: Writing - review & editing.
Declaration of Competing Interest
The authors declare that they have no known competing financial interests or personal relationships that could have appeared to influence the work reported in this paper.
Acknowledgements
This work was sponsored by the National Natural Science Founda-tion of China (No. 31701616); Natural Science Foundation of Jiangsu, China (No. BK20170714); Fundamental Research Funds for the Central Universities, China (No. KJQN201824); and Jiangsu Agricultural Sci-ence and Technology Innovation Fund (No. CX(19)3076).
Appendix A. Supplementary data
Supplementary data to this article can be found online at https://doi. org/10.1016/j.ultsonch.2021.105486.
References
[1] R. Di Cagno, R. Coda, M. De Angelis, M. Gobbetti, Exploitation of vegetables and fruits through lactic acid fermentation, Food. Microbiol. 33 (1) (2013) 1–10.
[2] C. Wu, T. Li, J. Qi, T. Jiang, H. Xu, H. Lei, Effects of lactic acid fermentation-based biotransformation on phenolic profiles, antioxidant capacity and flavor volatiles of apple juice, LWT – Food Sci. Technol. 122 (2020), 109064.
[3] F. Leroy, L.D. Vuyst, Lactic acid bacteria as functional starter cultures for the food fermentation industry, Trends Food Sci. Tech. 15 (2004) 67–78.
[4] P. Filannino, G. Cardinali, C.G. Rizzello, S. Buchin, M. De Angelis, M. Gobbetti, R. Di Cagno, M.J. Pettinari, Metabolic responses of Lactobacillus plantarum strains during fermentation and storage of vegetable and fruit juices, Appl. Environ. Microb. 80 (7) (2014) 2206–2215.
[5] P. Filannino, Y. Bai, R. Di Cagno, M. Gobbetti, M.G. Ganzle, Metabolism of phenolic compounds by Lactobacillus spp. during fermentation of cherry juice and broccoli puree, Food Microbiol. 46 (2015) 272–279.
[6] G. Huang, S. Chen, C. Dai, L. Sun, W. Sun, Y. Tang, F. Xiong, R. He, H. Ma, Effects of ultrasound on microbial growth and enzyme activity, Ultrason. Sonochem. 37 (2017) 144–149.
[7] G. Huang, S. Chen, Y. Tang, C. Dai, L. Sun, H. Ma, R. He, Stimulation of low intensity ultrasound on fermentation of skim milk medium for yield of yoghurt peptides by Lactobacillus paracasei, Ultrason. Sonochem. 51 (2019) 315–324.
[8] K.S. Ojha, T.J. Mason, C.P. O’Donnell, J.P. Kerry, B.K. Tiwari, Ultrasound technology for food fermentation applications, Ultrason. Sonochem. 34 (2017) 410–417.
[9] M.A. Daccache, M. Koubaa, D. Salameh, R.G. Maroun, N. Louka, E. Vorobiev, Ultrasound-assisted fermentation for cider production from Lebanese apples, Ultrason. Sonochem. 63 (2020), 104952.
[10] R. Di Cagno, R.F. Surico, S. Siragusa, M. De Angelis, A. Paradiso, F. Minervini, L. De Gara, M. Gobbetti, Selection and use of autochthonous mixed starter for lactic acid fermentation of carrots, French beans or marrows, Int. J. Food Microbiol. 127 (3) (2008) 220–228.
[11] P. Filannino, A.Z.A. Tlais, K. Morozova, I. Cavoski, M. Scampicchio, M. Gobbetti, R. D. Cagno, Lactic acid fermentation enriches the profile of biogenic fatty acid derivatives of avocado fruit (Persea americana Mill.), Food Chem. 317 (2020), 126384.
[12] H. Rodríguez, J.A. Curiel, J.M. Landete, B. de las Rivas, F.L.S. de Felipe, C. Gomez- Cordoves, J.M. Mancheno, R. Munoz, Food phenolics and lactic acid bacteria, Int. J. Food Microbiol. 132 (2009) 79–90.
[13] P. Filannino, R.D. Cagno, C. Crecchio, C.D. Virgilio, M.D. Angelis, M. Gobbetti, Transcriptional reprogramming and phenotypic switching associated with the adaptation of Lactobacillus plantarum C2 to plant niches, Sci. Rep. 6 (2016) 27392–27392.
[14] H. Liao, L. Jiang, Y. Cheng, X. Liao, R. Zhang, Application of nisin-assisted thermosonication processing for preservation and quality retention of fresh apple juice, Ultrason. Sonochem. 42 (2018) 244–249.
[15] M.O. Ramírez-Sucre, E. Gastelum-Martínez, T.R. Ayora-Talavera, N.A. Pacheco- Lopez, M.A. Sanchez-Contreras, I.M. Rodríguez-Buenfil, 9 - Process and impact of the addition of biocompounds on the development of pasteurized healthy juices, Preserv. Preserv. Appr. Beverages 2019 (2019) 273–307.
[16] R. Di Cagno, R.F. Surico, G. Minervini, C.G. Rizzello, R. Lovino, M. Servili, A. Taticchi, S. Urbani, M. Gobbetti, Exploitation of sweet cherry (Prunus avium L.) puree added of stem infusion through fermentation by selected autochthonous lactic acid bacteria, Food Microbiol. 28 (5) (2011) 900–909.
[17] B.K. Tiwari, K. Muthukumarappan, C.P. O’Donnell, P.J. Cullen, Effects of sonication on the kinetics of orange juice quality parameters, J. Agr. Food Chem. 56 (2008) 2423–2428.
[18] K.S. Ojha, J.P. Kerry, C. Alvarez, D. Walsh, B.K. Tiwari, Effect of high intensity ultrasound on the fermentation profile of Lactobacillus sakei in a meat model system, Ultrason. Sonochem. 31 (2016) 539–545.
[19] V.L. Singleton, J.A. Rossi, Colorimetry of total phenolics with phosphomolybdic- phosphotungstic acid reagents, Am. J. Enol. Viticul. 16 (1965) 144–158.
[20] Y. Tao, Y. Wang, M. Pan, S. Zhong, Y. Wu, R. Yang, Y. Han, J. Zhou, Combined ANFIS and numerical methods to simulate ultrasound-assisted extraction of phenolics from chokeberry cultivated in China and analysis of phenolic composition, Sep. Purif. Technol. 178 (2017) 178–188.
[21] W. Zhang, F. Han, J. He, C. Duan, HPLC-DAD-ESI-MS/MS analysis and antioxidant activities of nonanthocyanin phenolics in mulberry (Morus alba L.), J. Food Sci. 73 (2008) C512-C518.
[22] L. Vervoort, I. Van Der Plancken, T. Grauwet, R.A.H. Timmermans, H.C. Mastwijk, A.M. Matser, M.E. Hendrickx, A. Van Loey, Comparing equivalent thermal, high pressure and pulsed electric field processes for mild pasteurization of orange juice: Part II: Impact on specific chemical and biochemical quality parameters, Innov. Food Sci. Emerg. 12 (2011) 466–477.
[23] Y. Wu, Y. Han, Y. Tao, S. Fan, D.T. Chu, X. Ye, M. Ye, G. Xie, Ultrasound assisted adsorption and desorption of blueberry anthocyanins using macroporous resins, Ultrason. Sonochem. 48 (2018) 311–320.
[24] X. Li, T. Feng, F. Zhou, S. Zhou, Y. Liu, W. Li, R. Ye, Y. Yang, Effects of drying methods on the tasty compounds of Pleurotus eryngii, Food Chem. 166 (2015) 358–364.
[25] Y. Tao, P. Wang, Y. Wang, S.U. Kadam, Y. Han, J. Wang, J. Zhou, Power ultrasound as a pretreatment to convective drying of mulberry (Morus alba L.) leaves: Impact on drying kinetics and selected quality properties, Ultrason. Sonochem. 31 (2016) 310–318.
[26] S. Shokri, S.S. Shekarforoush, S. Hosseinzadeh, Stimulatory effects of low intensity ultrasound on the growth kinetics and metabolic activity of Lactococcus lactis subsp Lactis, Process Biochem. 89 (2020) 1–8.
[27] J.A. Ewe, W.N. Wan-Abdullah, A.K. Alias, M.T. Liong, Effects of ultrasound on growth, bioconversion of isoflavones and probiotic properties of parent and subsequent passages of Lactobacillus fermentum BT 8633 in biotin-supplemented soymilk, Ultrason. Sonochem. 19 (2012) 890–900.
[28] L.C. McDonald, H.P. Fleming, H.M. Hassan, Acid tolerance of Leuconostoc mesenteroides and Lactobacillus plantarum, Appl. Environ. Microbiol. 56 (1990) 2120–2124.
[29] Y. Wang, Y. Tao, X. Zhang, S. Shao, Y. Han, D.T. Chu, G. Xie, X. Ye, Metabolic profile of ginkgo kernel juice fermented with lactic acid bacteria: a potential way to degrade ginkgolic acids and enrich terpene lactones and phenolics, Process Biochem. 76 (2019) 25–33.
[30] Y.-C. Wang, R.-C. Yu, H.-Y. Yang, C.-C. Chou, Sugar and acid contents in soymilk fermented with lactic acid bacteria alone or simultaneously with bifidobacteria, Food Microbiol. 20 (3) (2003) 333–338.
[31] Y. Oguro, T. Nishiwaki, R. Shinada, K. Kobayashi, A. Kurahashi, Metabolite profile of koji amazake and its lactic acid fermentation product by Lactobacillus sakei UONUMA, J. Biosci. Bioeng. 124 (2) (2017) 178–183.
[32] S. Skeie, A. Kieronczyk, S. Eidet, M. Reitan, K. Olsen, H. Østlie, Interaction between starter bacteria and adjunct Lactobacillus plantarum INF15D on the degradation of citrate, asparagine and aspartate in a washed-curd cheese, Int. Dairy J. 18 (2008) 169–177.
[33] T. Zotta, E. Parente, A. Ricciardi, Aerobic metabolism in the genus Lactobacillus: impact on stress response and potential applications in the food industry, J. Appl. Microbiol. 122 (2017) 857–869.
H. Wang et al.
Ultrasonics Sonochemistry 73 (2021) 105486
13
[34] S.M.B. Hashemi, A. Mousavi Khaneghah, J.A. Saraiva, A.R. Jambrak, F.J. Barba, M. J. Mota, Effect of ultrasound on lactic acid production by Lactobacillus strains in date (Phoenix dactylifera var. Kabkab) syrup, Appl. Microbiol. Biot. 102 (2018) 2635–2644.
[35] P. Filannino, L. Azzi, I. Cavoski, O. Vincentini, C.G. Rizzello, M. Gobbetti, R. Di Cagno, Exploitation of the health-promoting and sensory properties of organic pomegranate (Punica granatum L.) juice through lactic acid fermentation, Int. J. Food Microbiol. 163 (2-3) (2013) 184–192.
[36] Y. Ardo, Flavour formation by amino acid catabolism, Biotechnol. Adv. 24 (2) (2006) 238–242.
[37] S.D. Nsogning, S. Fischer, T. Becker, Investigating on the fermentation behavior of six lactic acid bacteria strains in barley malt wort reveals limitation in key amino acids and buffer capacity, Food Microbiol. 73 (2018) 245–253.
[38] O. Martínez-Pinilla, Z. Guadalupe, Z. Hernandez, B. Ayestaran, Amino acids and biogenic amines in red varietal wines: the role of grape variety, malolactic fermentation and vintage, Eur. Food Res. Technol. 237 (2013) 887–895.
[39] B. Ankolekar, K. Johnson, M. Pinto, D. Johnson, R.G. Labbe, D. Greene, K. Shetty, Fermentation of whole apple juice using Lactobacillus acidophilus for potential dietary management of hyperglycemia, hypertension, and modulation of beneficial bacterial responses, J. Food. Biochem. 36 (2011) 718–738.
[40] S.M.B. Hashemi, A. Mousavi Khaneghah, F.J. Barba, Z. Nemati, S. Sohrabi Shokofti, F. Alizadeh, Fermented sweet lemon juice (Citrus limetta) using Lactobacillus plantarum LS5: Chemical composition, antioxidant and antibacterial activities, J. Funct. Foods 38 (2017) 409–414.
[41] C. Fritsch, V. Heinrich, R.F. Vogel, S. Toelstede, Phenolic acid degradation potential and growth behavior of lactic acid bacteria in sunflower substrates, Food Microbiol. 57 (2016) 178–186.
[42] J.A. Curiel, D. Pinto, B. Marzani, P. Filannino, G.A. Farris, M. Gobbetti, C. G. Rizzello, Lactic acid fermentation as a tool to enhance the antioxidant properties of Myrtus communis berries, Microb. Cell Fact. 14 (2015) 1–10.
[43] A.F. Sanchez-Maldonado, A. Schieber, M.G. Ganzle, Structure-function relationships of the antibacterial activity of phenolic acids and their metabolism by lactic acid bacteria, J. Appl. Microbiol. 111 (2011) 1176–1184.
[44] K. Ou, L. Gu, Absorption and metabolism of proanthocyanidins, J. Funct. Foods. 7 (2014) 43–53.
[45] W. Tao, Y. Zhang, X. Shen, Y. Cao, J. Shi, X. Ye, S. Chen, Rethinking the mechanism of the health benefits of proanthocyanidins: absorption, metabolism, and interaction with gut microbiotas, Compr. Rev. Food Sci. F. 18 (4) (2019) 971–985.
[46] H.P.V. Rupasinghe, I. Parmar, S.V. Neir, Biotransformation of cranberry proanthocyanidins to probiotic metabolites by Lactobacillus rhamnosus enhances their anticancer activity in HepG2 cells in vitro, Oxid. Med. and Cell. Longev. 2019 (2019) 1–14.
[47] D. Zhao, N.P. Shah, Lactic acid bacterial fermentation modified phenolic composition in tea extracts and enhanced their antioxidant activity and cellular uptake of phenolic compounds following in vitro digestion, J. Funct. Foods. 20 (2016) 182–194.
[48] G. Baeza, E.-M. Bachmair, S. Wood, R. Mateos, L. Bravo, B. de Roos, The colonic metabolites dihydrocaffeic acid and dihydroferulic acid are more effective inhibitors of in vitro platelet activation than their phenolic precursors, Food. Funct. 8 (3) (2017) 1333–1342.
[49] E. Kwaw, Y. Ma, W. Tchabo, M.T. Apaliya, M. Wu, A.S. Sackey, L. Xiao, H.E. Tahir, Effect of lactobacillus strains on phenolic profile, color attributes and antioxidant activities of lactic-acid-fermented mulberry juice, Food Chem. 250 (2018) 148–154.
[50] S.J. Hur, S.Y. Lee, Y.-C. Kim, I. Choi, G.-B. Kim, Effect of fermentation on the antioxidant activity in plant-based foods, Food Chem. 160 (2014) 346–356.
[51] B.G. Spyropoulos, E.P. Misiakos, C. Fotiadis, C.N. Stoidis, Antioxidant properties of probiotics and their protective effects in the pathogenesis of radiation-induced enteritis and colitis, Digest. Dis. Sci. 56 (2) (2011) 285–294.
[52] H. Gao, J.J. Wen, J.L. Hu, Q.X. Nie, H.H. Chen, S.P. Nie, T. Xiong, M.Y. Xie, Momordica charantia juice with Lactobacillus plantarum fermentation: chemical composition, antioxidant properties and aroma profile, Food Biosci. 29 (2019) 62–72.
[53] L. Shi, B. Wang, Z. Li, C. Duan, C. Dai, A. Sakanishi, The research into the influence of low-intensity ultrasonic on the growth of S. cerevisiae, Colloid Surface 30 (2003) 43–49.
[54] S.-K. Yeo, M.-T. Liong, Effect of ultrasound on bioconversion of isoflavones and probiotic properties of parent organisms and subsequent passages of Lactobacillus, LWT – Food Sci. Technol. 51 (1) (2013) 289–295.
[55] G. Okcu, K. Ayhan, E. Gunes, N. Vural, E.S. Poyrazoglu, Determination of phenolic acid decarboxylase produced by lactic acid bacteria isolated from shalgam (salgam) juice using green analytical chemistry method, LWT – Food Sci. Technol. 66 (2016) 615–621.
H. Wang et al.