Growth, photosynthesis and fertility of Chara aspera under different light and salinity conditions
22
Aquatic Botany 76 (2003) 213–234 Growth, photosynthesis and fertility of Chara aspera under different light and salinity conditions Irmgard Blindow ∗ , Jana Dietrich, Nils Möllmann, Hendrik Schubert 1 Biological Station of Hiddensee, University of Greifswald, D-18565 Kloster, Hiddensee, Germany Received 8 May 2002; received in revised form 30 January 2003; accepted 17 March 2003 Abstract The main aim of this study was to investigate if the wide salinity range of Chara aspera C.L. Willdenow is caused by acclimation capabilities alone, or if freshwater and brackish water popula- tions have different salinity optima. In an outdoor experiment, plants collected from one freshwater and one brackish water site (about 8 PSU) in southern Sweden were incubated under different con- ditions of salinity and light. Elongation rate, final biomass, photosynthesis parameters, pigment composition as well as development of gametangia were determined. Plants collected from freshwater all died at the highest salinity condition tested (20 PSU) possi- bly due to salinity stress. For most parameters tested, these plants performed best at low salinity. Thus, maximum photosynthetic rate in the absence of photoinhibition (P max ) and onset of light saturation and index of light acclimation (E k )were higher at 0 PSU compared to 5 and 10 PSU. The number of gametangia tended to decrease with increasing salinity. In contrast, plants col- lected from brackish water performed best at intermediate salinities. Thus, final ash-free dry weight (AFDW) was lower at 20 PSU compared to all other salinity conditions and tended to be lower at 0 PSU compared to 5 and 10 PSU. P max and E k as well as the number of gametan- gia had maximum values at intermediate salinities (5 and 10 PSU). Also pigment composition was influenced by salinity. In both groups, chlorophyll a/chlorophyll b quotients increased with increasing salinity. Chlorophyll a/carotenoid quotients decreased with increasing salinity in the freshwater population, but had maximum values at intermediate salinities in the brackish water population. Apart from salinity, light influenced the physiological performance of both populations. As ex- pected, P max , E k and chlorophyll a/chlorophyll b quotients increased with increasing irradiance during the incubation in both populations, while chlorophyll a/carotenoid quotients decreased. Shoot elongation increased with decreasing irradiance in both populations. This effect was less pronounced at higher salinities, indicating that shoot elongation may be hampered in brackish water. ∗ Corresponding author. Tel.: +49-38300-50251. E-mail address: [email protected] (I. Blindow). 1 Present address: University of Rostock, Institut für Aquatische Ökologie, Albert-Einstein-St. 3, D-18051 Rostock. 0304-3770/03/$ – see front matter © 2003 Elsevier Science B.V. All rights reserved. doi:10.1016/S0304-3770(03)00053-6
Transcript of Growth, photosynthesis and fertility of Chara aspera under different light and salinity conditions
Aquatic Botany 76 (2003) 213–234
Growth, photosynthesis and fertility ofChara asperaunder different light and salinity conditions
Irmgard Blindow∗, Jana Dietrich, Nils Möllmann, Hendrik Schubert1
Biological Station of Hiddensee, University of Greifswald, D-18565 Kloster, Hiddensee, Germany
Received 8 May 2002; received in revised form 30 January 2003; accepted 17 March 2003
Abstract
The main aim of this study was to investigate if the wide salinity range ofChara asperaC.L.Willdenow is caused by acclimation capabilities alone, or if freshwater and brackish water popula-tions have different salinity optima. In an outdoor experiment, plants collected from one freshwaterand one brackish water site (about 8 PSU) in southern Sweden were incubated under different con-ditions of salinity and light. Elongation rate, final biomass, photosynthesis parameters, pigmentcomposition as well as development of gametangia were determined.
Plants collected from freshwater all died at the highest salinity condition tested (20 PSU) possi-bly due to salinity stress. For most parameters tested, these plants performed best at low salinity.Thus, maximum photosynthetic rate in the absence of photoinhibition (Pmax) and onset of lightsaturation and index of light acclimation (Ek)were higher at 0 PSU compared to 5 and 10 PSU.The number of gametangia tended to decrease with increasing salinity. In contrast, plants col-lected from brackish water performed best at intermediate salinities. Thus, final ash-free dryweight (AFDW) was lower at 20 PSU compared to all other salinity conditions and tended tobe lower at 0 PSU compared to 5 and 10 PSU.Pmax andEk as well as the number of gametan-gia had maximum values at intermediate salinities (5 and 10 PSU). Also pigment compositionwas influenced by salinity. In both groups, chlorophyll a/chlorophyll b quotients increased withincreasing salinity. Chlorophyll a/carotenoid quotients decreased with increasing salinity in thefreshwater population, but had maximum values at intermediate salinities in the brackish waterpopulation.
Apart from salinity, light influenced the physiological performance of both populations. As ex-pected,Pmax, Ek and chlorophyll a/chlorophyll b quotients increased with increasing irradianceduring the incubation in both populations, while chlorophyll a/carotenoid quotients decreased.Shoot elongation increased with decreasing irradiance in both populations. This effect was lesspronounced at higher salinities, indicating that shoot elongation may be hampered in brackishwater.
∗ Corresponding author. Tel.:+49-38300-50251.E-mail address:[email protected] (I. Blindow).
1 Present address: University of Rostock, Institut für Aquatische Ökologie, Albert-Einstein-St. 3, D-18051Rostock.
0304-3770/03/$ – see front matter © 2003 Elsevier Science B.V. All rights reserved.doi:10.1016/S0304-3770(03)00053-6

214 I. Blindow et al. / Aquatic Botany 76 (2003) 213–234
Our results indicate thatC. asperagrowing in freshwater has optimum conditions at 0 PSU,while plants collected from brackish water have their optimum at 5–10 PSU. As all parameterswere recorded after several weeks of incubation, we suggest that genetic differences between thepopulations rather than physiological acclimation to the field conditions are responsible for thesedifferent salinity optima.© 2003 Elsevier Science B.V. All rights reserved.
Keywords:Charophyta; Salinity; Light; Photosynthesis; Growth
1. Introduction
Plants adapted to brackish water are able to regulate their turgor according to thesalinity conditions. Among characeans, this ability is widespread; most ancestors ofmodern characeans are suggested to have been adapted to conditions of higher salin-ity (Schudack, 1993). This is supported by observations that the same mechanism ofturgor pressure regulation (K+ accumulation) occurs in different taxa of euryhalinecharaceans (Lamprothamnium, Chara, Tolypella), suggesting that this mechanism alreadyexisted before the main lineages of modern charophytes separated (Winter et al., 1996).Charophytes thus belong to the group of K+ algae, while Na+ accumulation is an al-ternative mechanism of turgor pressure regulation among algae (Kirst and Bisson,1979).
Possibly, recent brackish water species among charophytes originate from euryhalinespecies but lost their ability for complete turgor regulation (Winter et al., 1996). Plantsbelonging to this group of mesohaline species regulate their turgor by accumulation of bothions (mainly Na+, K+, Cl−) and sucrose, but are not able to keep pace with Na+ increase athigher salinities. Thus, these species are restricted to about 15–20 PSU (Winter and Kirst,1992; Winter et al., 1996). Chara aspera, together withChara canescensLois, apply this“incomplete” turgor regulation (Winter and Kirst, 1991, 1992). In the laboratory,C. asperaregulated its turgor perfectly at salinities up to 8 PSU. At salinities between 8 and 18 PSU,turgor pressure as well as K+:Na+ ratio decreased slightly (Winter and Kirst, 1992). Inthe Baltic Sea, this species can be found at salinities of up to 20 PSU. In Denmark,C.asperahas been found in localities where the salinity at least temporarily reaches levels of11,000 mg l−1 Cl− (about 20 PSU;Olsen, 1944). Along the west coast of Sweden,C. asperahas regularly been found at salinities of up to 15 PSU and occasionally at localities wherethe salinity probably exceeds 20 PSU at least temporarily (Blindow, 2000). However, thespecies can also be found in low-salinity conditions in the innermost parts of the Bothnianand Finnish Bays. Furthermore,C. asperais common in freshwater where it mainly occursin calcium-rich water, but also in oligotrophic soft-water lakes (Hasslow, 1931; Stålberg,1939; Blindow, 2000). In the Baltic Sea region,C. asperacovers the widest salinity rangeamong charophytes (Blindow, 2000).
Generally, the taxonomy of characeans has been subject to considerable debate andchanges (Wood, 1962, 1965; Proctor, 1975). Until today, very little is known about thenumber of “biological species” behind the single taxonomic entities described. Repro-ductive isolation among different populations has been found within several “species”.
I. Blindow et al. / Aquatic Botany 76 (2003) 213–234 215
Consequently, these taxonomic entities have been defined as “species complexes” (Proctor,1971; Grant and Proctor, 1972). There are some indications thatC. asperamay representsuch a “species complex”. Thus, reproductive isolation has been found between geographi-cally distant populations ofC. aspera(Croy, 1982). Furthermore, fresh- and brackish-waterforms of C. asperaare morphologically different from each other and have been distin-guished as “f. stagnales” and “f. marinae”, respectively (Hasslow, 1931). The main aim ofour study was thus to investigate if the wide salinity range ofC. asperais caused by ac-climation capabilities alone, or if freshwater and brackish water populations have differentsalinity optima which would indicate genetic differences between these populations.
Charophytes can form dense vegetation both in freshwater lakes (Blindow, 1992a; van denBerg et al., 1998) and sheltered brackish water bays (Munsterhjelm, 1997), but disappearduring eutrophication (Kohler et al., 1971; Lindner, 1978; Lang, 1981). Charophytes aremore sensitive to increased nutrient loading than most other submerged macrophytes andhave thus been used as bio-indicators for oligo- to mesotrophic conditions (Krause, 1981).Light limitation by microalgae is the most probable factor responsible for the decline ofcharophytes in nutrient-enriched water (Blindow, 1992b). In shallow water ecosystems, thisdecline is not gradual, but occurs rapidly at a certain critical turbidity (Scheffer et al., 1993).As turgor regulation inC. asperais partly reached by increased intracellular sucrose concen-trations (Winter and Kirst, 1992), increasing salinity may be connected to increased energydemand. This should theoretically cause a higher light compensation point for growth andthus a lower critical turbidity in brackish water compared to freshwater ecosystems. Ac-cording to our knowledge, however, this relationship has not been studied yet for submergedmacrophytes.
In order to compare the physiological performances of freshwater and brackish waterpopulations ofC. asperaand to investigate the combined effect of light and salinity onthese plants, growth and photosynthesis as well as development of gametangia of plantscollected from one freshwater and one brackish water site were measured under differentconditions of light and salinity in an outdoor experiment.
2. Material and methods
2.1. Site description
C. asperawas collected in mesotrophic, calcium-rich Lake Krankesjön, south Sweden(55◦42′N, 13◦29′E) in a monospecific, dense mat at about 35 cm depth during 13 May2001. The plants were about 5 cm long and still sterile. For information on morphometryand water chemistry of Lake Krankesjön, seeBlindow et al. (2000).
In Höllviken, a bay of the Baltic Sea in south Sweden (55◦25′N, 12◦56′E), C. asperawas collected on 11 and 12 June 2001. The plants grew scattered in a mixed vegetationtogether withC. balticaBruz.,C. canescens, Tolypella nidificav. Leonh andZannichelliamajor Boenn on 50–100 cm depth. During the sampling occasion,C. asperaplants wereabout 5 cm long. Most plants were sterile, but single fertile plants, both males and females,were found. The salinity was 8.3 PSU. The distance between the two sampling sites is about50 km.
216 I. Blindow et al. / Aquatic Botany 76 (2003) 213–234
2.2. Description of the experiment
In the laboratory, apices ofC. asperawere cut 1–2 days after the sampling some millime-tre below an internode to a length of about 3 cm. Each apex was planted in a 400 ml beakercontaining 1 cm of sediment from Lake Krankesjön (mixed and sieved, 2.5 mm mesh size)and water. For freshwater treatments, filtered (63�m mesh size) water of Lake Krankesjönwas used. For the salinity treatments, NaCl, Na2SO4, MgCl2, MgSO4, CaCl2 and KClwere added to water from Lake Krankesjön corresponding to the composition of macrocon-stituents in natural seawater (containing per l:19.8 g Cl−, 11.0 g Na+, 2.8 g SO4
2−, 1.3 gMg2+, 0.43 g Ca2+, 0.41 g K+) and to the salinity condition in question. In total, 96 apiceswere planted (6 replicates for each of the 4 salinity and the 4 light conditions). To avoiddamage of the plants which were used for the experiments, an additional 30 apices werecut for the determination of fresh weight, dried externally by means of household tissue.
After 3–6 days of precultivation in the laboratory (room temperature, low light), the startlength of each plant was measured, and the beakers were transferred to an outdoor exper-imental set-up. For each light condition, all 24 beakers were placed in one compartment.Three of the four compartments were covered with “neutral density” foils which reducedthe incoming light equally for the whole PAR and UV spectrum to 7, 14 and 56% of incidentsolar irradiance, respectively. The compartment for the 100% light treatment was left un-covered or covered with a transparent plastic foil during rainy conditions, respectively. Allfour compartments were connected with each other and filled with water which was mixedby pumps during sunny conditions to avoid temperature differences among the treatments.
Every day during the experiment, the length of each plant was measured, and all beakers ineach compartment were rotated to avoid different shading conditions related to the positionin the compartments. Once per day, the water level in each beaker was filled up with distilledwater to replace losses due to evaporation.
The experiments were terminated 30–33 days (plants collected from freshwater) and20–23 days (plants from brackish water), respectively, after the start of the incubation. For allfertile plants, the number of gametangia was counted under a stereomicroscope. The plantswere divided into two groups. For each salinity and light condition, three plants were usedfor measurement of photosynthesis main parameters and pigment concentrations. The otherthree plants were used for the determination of dry and ash-free dry weight. Fresh weightof all plants was determined after the termination of the photosynthesis measurements asdescribed above. Dry weight was determined after 4 h at 105◦C, ash weight after 1 h ashingat 525◦C. Elongation rate was calculated as daily length increase for the period of lineargrowth (4–14 days) during the experiment. For plants originating from freshwater, ash-freedry weight (AFDW) data of the 7 and 14% light treatments were combined (“low light”) aswell as values of the 56 and 100% light treatments (“high light”) because of the low samplesizes due to some missing values.
2.3. Photosynthesis measurements
Net oxygen exchange rates at nine increasing light intensities from 0 to approximately2000�mol photons m−2 s−1 for each of the 16 irradiance-salt treatments were determinedby using a computer-controlled Light Dispensation System (MK2, ILLUMINOVA, Sweden,

I. Blindow et al. / Aquatic Botany 76 (2003) 213–234 217
described inWolfstein and Hartig, 1998). Temperature was set according to the respectivetemperature in the beaker. Photosynthetic parameters maximum photosynthetic rate in theabsence of photoinhibition (Pmax), α (light dependency of photosynthesis at limiting irra-diances) andβ (slope of decay of photosynthesis rates at oversaturating intensities) werederived by a fitting procedure using an iterative exponential regression with the equationgiven inWalsby (1997). Ek, the onset of light saturation and index of light adaptation, wascalculated by dividingPmax byα (Talling, 1957). Several investigations have shown thatEkcan be used to describe the photoacclimation status of algae (Talling, 1957; Henley, 1993;Falkowski and Raven, 1997).
2.4. Determination of pigment concentrations
The chlorophyll and carotenoid contents of the algae were determined spectrophotomet-rically after extraction in 3 ml of DMF (N,N-dimethylformamide) in darkness at 4◦C forca. 12 h. Absorption was measured with an UV-Vis spectrophotometer (Specord M42, CarlZeiss Jena, Germany). Pigment contents (�g ml−1) of the extracts were calculated fromabsorbance spectra according to the equations derived byPorra et al. (1989).
2.5. Statistical analysis
All data sets were transformed to achieve non-significant heteroscedasticity (F-test).Transformations used were ln (Y) for AFDW, Pmax and Ek, ln (Y + 1) for chlorophylla/chlorophyll b, chlorophyll a/carotenoid and number of gametangia, ln (Y + 0.01) forelongation rate and arcsin (rootY) for proportion of ash weight in total dry weight. Apart fromthe occasions when homoscedasticity could not be achieved even after a transformation, atwo-way analysis of variance (ANOVA) was performed on each transformed data set. Factorsanalysed were salinity and light. Scheffe’s post hoc tests were used to determine differencesbetween groups. Confidence intervals given inFig. 5andFigs. 7–10are calculated by theTC3D software (Jandel).
3. Results
3.1. Growth
All plants from the brackish water population survived until the end of the experiment.However, all plants originating from freshwater that were exposed to 20 PSU died withinthe first days of the experiment, possibly due to salinity shock. Furthermore, one plantexposed to 5 PSU and one plant exposed to 10 PSU did not survive. Overall weight gain(fresh weight) during the cultivation period was about 56 and 110% for plants collectedfrom freshwater and brackish water, respectively.
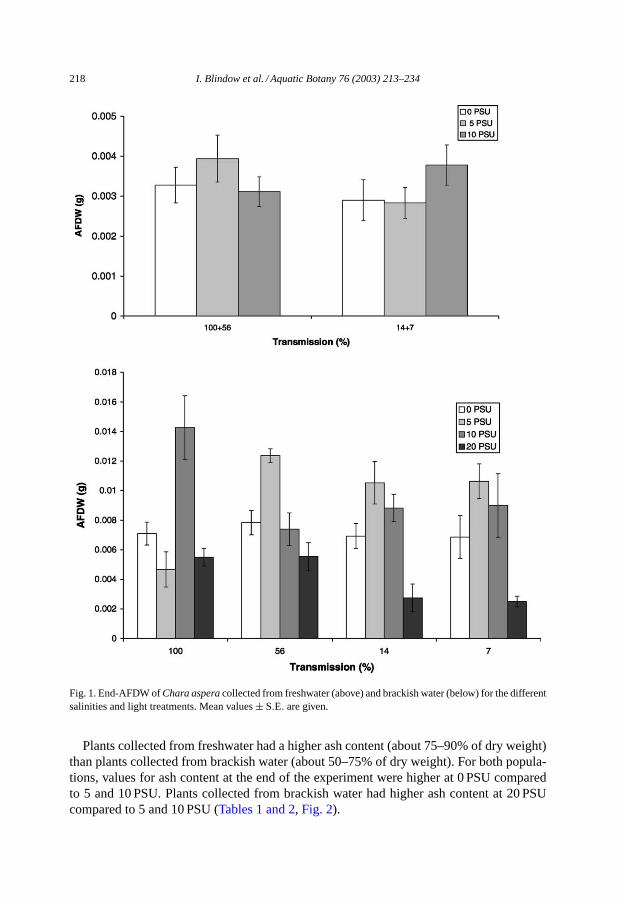
End-AFDW of plants collected from freshwater did not differ significantly among theindividual salinity and light treatments. Plants collected from brackish water had theirhighest end-AFDW at 5 and 10 PSU, while AFDW was significantly lower at 20 PSU andhad a tendency to be lower at 0 PSU (Fig. 1, Tables 1 and 2).
218 I. Blindow et al. / Aquatic Botany 76 (2003) 213–234
Fig. 1. End-AFDW ofChara asperacollected from freshwater (above) and brackish water (below) for the differentsalinities and light treatments. Mean values± S.E. are given.
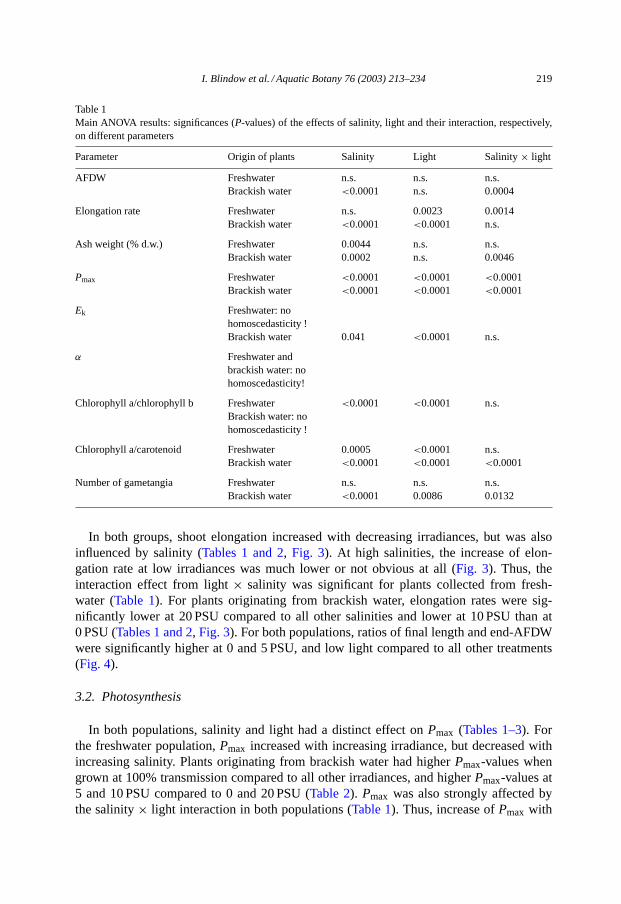
Plants collected from freshwater had a higher ash content (about 75–90% of dry weight)than plants collected from brackish water (about 50–75% of dry weight). For both popula-tions, values for ash content at the end of the experiment were higher at 0 PSU comparedto 5 and 10 PSU. Plants collected from brackish water had higher ash content at 20 PSUcompared to 5 and 10 PSU (Tables 1 and 2, Fig. 2).
I. Blindow et al. / Aquatic Botany 76 (2003) 213–234 219
Table 1Main ANOVA results: significances (P-values) of the effects of salinity, light and their interaction, respectively,on different parameters
Parameter Origin of plants Salinity Light Salinity× light
AFDW Freshwater n.s. n.s. n.s.Brackish water <0.0001 n.s. 0.0004
Elongation rate Freshwater n.s. 0.0023 0.0014Brackish water <0.0001 <0.0001 n.s.
Ash weight (% d.w.) Freshwater 0.0044 n.s. n.s.Brackish water 0.0002 n.s. 0.0046
Pmax Freshwater <0.0001 <0.0001 <0.0001Brackish water <0.0001 <0.0001 <0.0001
Ek Freshwater: nohomoscedasticity !Brackish water 0.041 <0.0001 n.s.
α Freshwater andbrackish water: nohomoscedasticity!
Chlorophyll a/chlorophyll b Freshwater <0.0001 <0.0001 n.s.Brackish water: nohomoscedasticity !
Chlorophyll a/carotenoid Freshwater 0.0005 <0.0001 n.s.Brackish water <0.0001 <0.0001 <0.0001
Number of gametangia Freshwater n.s. n.s. n.s.Brackish water <0.0001 0.0086 0.0132
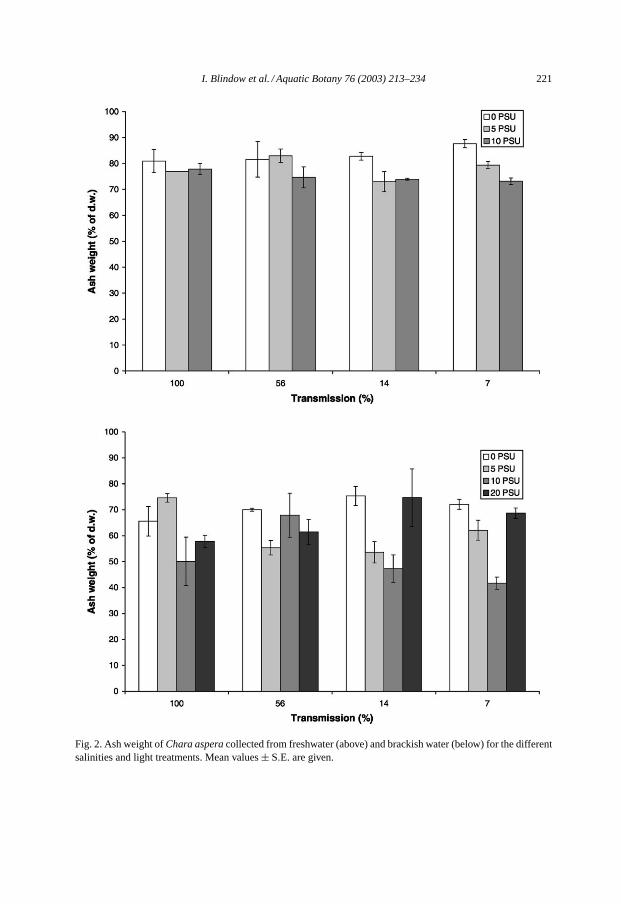
In both groups, shoot elongation increased with decreasing irradiances, but was alsoinfluenced by salinity (Tables 1 and 2, Fig. 3). At high salinities, the increase of elon-gation rate at low irradiances was much lower or not obvious at all (Fig. 3). Thus, theinteraction effect from light× salinity was significant for plants collected from fresh-water (Table 1). For plants originating from brackish water, elongation rates were sig-nificantly lower at 20 PSU compared to all other salinities and lower at 10 PSU than at0 PSU (Tables 1 and 2, Fig. 3). For both populations, ratios of final length and end-AFDWwere significantly higher at 0 and 5 PSU, and low light compared to all other treatments(Fig. 4).
3.2. Photosynthesis
In both populations, salinity and light had a distinct effect onPmax (Tables 1–3). Forthe freshwater population,Pmax increased with increasing irradiance, but decreased withincreasing salinity. Plants originating from brackish water had higherPmax-values whengrown at 100% transmission compared to all other irradiances, and higherPmax-values at5 and 10 PSU compared to 0 and 20 PSU (Table 2). Pmax was also strongly affected bythe salinity× light interaction in both populations (Table 1). Thus, increase ofPmax with

220I.B
lind
ow
eta
l./Aq
ua
ticB
ota
ny
76
(20
03
)2
13
–2
34
Table 2Results of Scheffe’s post hoc tests
Ash content AFDW Ash weight Shoot elongation Pmax Ek Chlorophyll a/chlorophyll b
Chlorophyll a/carotenoid
Number ofgametangia
Fresh Brackish Fresh Brackish Fresh Brackish Fresh Brackish Fresh Brackish Fresh Brackish Fresh Brackish Fresh Brackish
Light7–14% n.s. n.s. n.s. n.s. n.s. n.s. ∗∗∗ n.s. – ∗∗∗ n.s. – ∗∗∗ ∗∗∗ n.s. n.s.7–56% n.s. n.s. n.s. n.s. n.s. ∗∗∗ ∗∗∗ n.s. – ∗∗∗ ∗∗∗ – ∗∗∗ ∗∗∗ n.s. n.s.7–100% n.s. n.s. n.s. n.s. n.s. ∗∗∗ ∗∗∗ ∗∗∗ – ∗∗∗ ∗∗∗ – ∗∗∗ ∗∗∗ n.s. n.s.14–56% n.s. n.s. n.s. n.s. ∗ ∗∗∗ ∗∗∗ n.s. – ∗∗∗ ∗∗∗ – ∗∗∗ ∗∗∗ n.s. n.s.14–100% n.s. n.s. n.s. n.s. n.s. ∗∗∗ ∗∗∗ ∗∗∗ – ∗∗∗ ∗∗∗ – ∗∗∗ ∗∗∗ n.s. n.s.56–100% n.s. n.s. n.s. n.s. n.s. ∗∗ ∗∗∗ ∗∗∗ – ∗∗∗ ∗ – ∗∗∗ ∗∗∗ n.s. ∗∗
Salinity0–5 PSU n.s. n.s. n.s. n.s. n.s. n.s. ∗∗∗ ∗∗∗ – ∗ n.s. – ∗∗∗ ∗∗∗ n.s. n.s.0–10 PSU n.s. n.s. ∗∗ ∗∗∗ n.s. ∗∗∗ ∗∗∗ ∗∗ – ∗∗∗ ∗∗∗ – ∗∗∗ ∗∗∗ n.s. n.s.0–20 PSU – ∗∗∗ – n.s. – ∗∗∗ – n.s. – ∗∗∗ – – – n.s. – ∗∗∗5–10 PSU n.s. n.s. n.s. n.s. n.s. n.s. ∗∗∗ n.s. – ∗ ∗∗∗ – n.s. n.s. n.s. n.s.5–20 PSU – ∗∗∗ – n.s. – ∗∗∗ – ∗∗∗ – n.s. – – – ∗∗∗ – ∗∗∗10–20 PSU – ∗∗∗ – ∗ – ∗∗∗ – ∗∗∗ – n.s. – – – ∗∗∗ – ∗∗∗
The tests were performed for all possible combinations of light and salinity conditions, respectively, when ANOVA showed a significant effect of thisfactor. n.s.: test not performed or not significant (P > 0.05);∗: P < 0.05;∗∗: P < 0.01;∗∗∗: P < 0.001; –: missing value, or ANOVA not performed.
I. Blindow et al. / Aquatic Botany 76 (2003) 213–234 221
Fig. 2. Ash weight ofChara asperacollected from freshwater (above) and brackish water (below) for the differentsalinities and light treatments. Mean values± S.E. are given.

222 I. Blindow et al. / Aquatic Botany 76 (2003) 213–234
Fig. 3. Shoot elongation (centimetre per day) forChara asperacollected from freshwater (above) and brackishwater (below) for the different salinities and light treatments.
increasing irradiance was most distinct at higher salinities (10 PSU for plants originatingfrom freshwater, 20 PSU for plants collected from brackish water) (Table 3).
In all treatments except for the 10 PSU treatment of plants originating from freshwater,the increase of irradiance was accompanied by a decreasing value ofα (Table 3). In con-trast toPmax andα-values, the dependency of values forEk (the light saturation point ofphotosynthesis) on treatment conditions differed considerably between plants originatingfrom freshwater and brackish water, respectively. For plants originating from freshwater,Ek-values were influenced by both irradiance and salinity. WhileEk-values increased with
I. Blindow et al. / Aquatic Botany 76 (2003) 213–234 223
Fig. 4. Final length/AFDW quotient ofChara asperacollected from freshwater (above; mean values± S.E. aregiven) and brackish water (below) for the different salinities and light treatments.
increasing irradiance in the 0 and 5 PSU treatments, they were low in all 10 PSU treatments(Fig. 5). For the brackish water group irradiance was the main determinant forEk, whichincreased with increasing irradiance of the treatments (Tables 1 and 2, Fig. 5). Also salinityhad a significant effect onEk-values of the brackish water population with the highest valuesrecorded at 5 and 10 PSU and the lowest at 0 PSU.
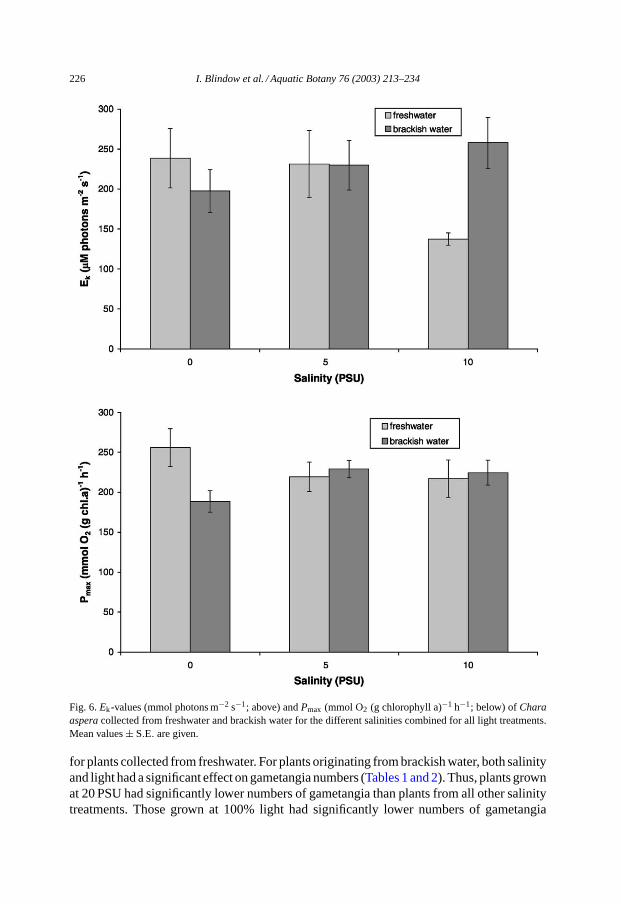
When all light treatments were combined, plants collected from freshwater had signif-icantly (P = 0.0190, Mann–WhitneyU-test) higherPmax at 0 PSU than plants collectedfrom freshwater. For the other salinities tested,Pmax did not differ significantly betweenpopulations. For determinations ofEk, there was a non-significant tendency for higher val-ues at 0 PSU among the plants collected from freshwater. At 10 PSU, plants collected fromfreshwater had significantly (P = 0.0022, Mann–WhitneyU-test) lowerEk than plantscollected from brackish water (Fig. 6).
224 I. Blindow et al. / Aquatic Botany 76 (2003) 213–234
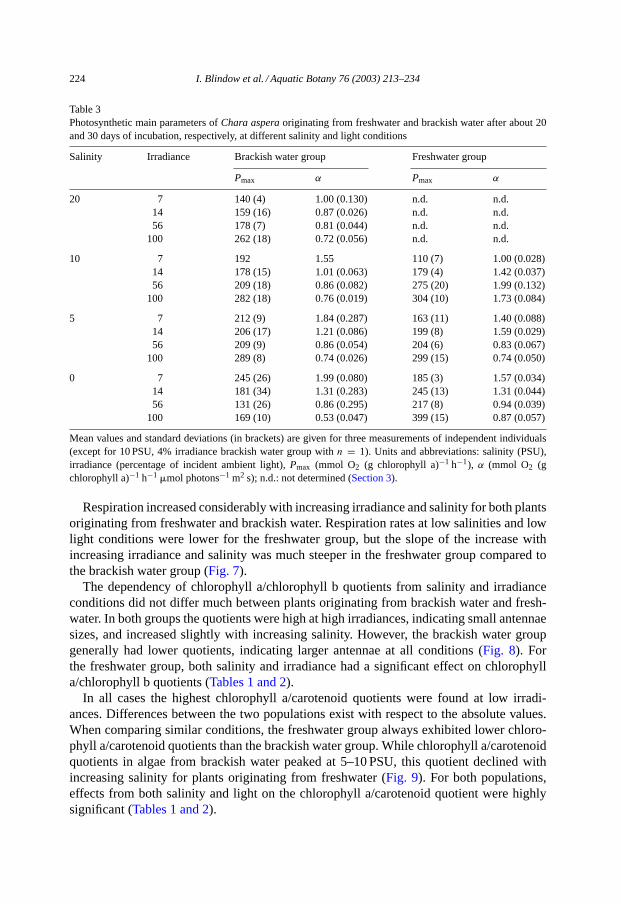
Table 3Photosynthetic main parameters ofChara asperaoriginating from freshwater and brackish water after about 20and 30 days of incubation, respectively, at different salinity and light conditions
Salinity Irradiance Brackish water group Freshwater group
Pmax α Pmax α
20 7 140 (4) 1.00 (0.130) n.d. n.d.14 159 (16) 0.87 (0.026) n.d. n.d.56 178 (7) 0.81 (0.044) n.d. n.d.
100 262 (18) 0.72 (0.056) n.d. n.d.
10 7 192 1.55 110 (7) 1.00 (0.028)14 178 (15) 1.01 (0.063) 179 (4) 1.42 (0.037)56 209 (18) 0.86 (0.082) 275 (20) 1.99 (0.132)
100 282 (18) 0.76 (0.019) 304 (10) 1.73 (0.084)
5 7 212 (9) 1.84 (0.287) 163 (11) 1.40 (0.088)14 206 (17) 1.21 (0.086) 199 (8) 1.59 (0.029)56 209 (9) 0.86 (0.054) 204 (6) 0.83 (0.067)
100 289 (8) 0.74 (0.026) 299 (15) 0.74 (0.050)
0 7 245 (26) 1.99 (0.080) 185 (3) 1.57 (0.034)14 181 (34) 1.31 (0.283) 245 (13) 1.31 (0.044)56 131 (26) 0.86 (0.295) 217 (8) 0.94 (0.039)
100 169 (10) 0.53 (0.047) 399 (15) 0.87 (0.057)
Mean values and standard deviations (in brackets) are given for three measurements of independent individuals(except for 10 PSU, 4% irradiance brackish water group withn = 1). Units and abbreviations: salinity (PSU),irradiance (percentage of incident ambient light),Pmax (mmol O2 (g chlorophyll a)−1 h−1), α (mmol O2 (gchlorophyll a)−1 h−1 �mol photons−1 m2 s); n.d.: not determined (Section 3).
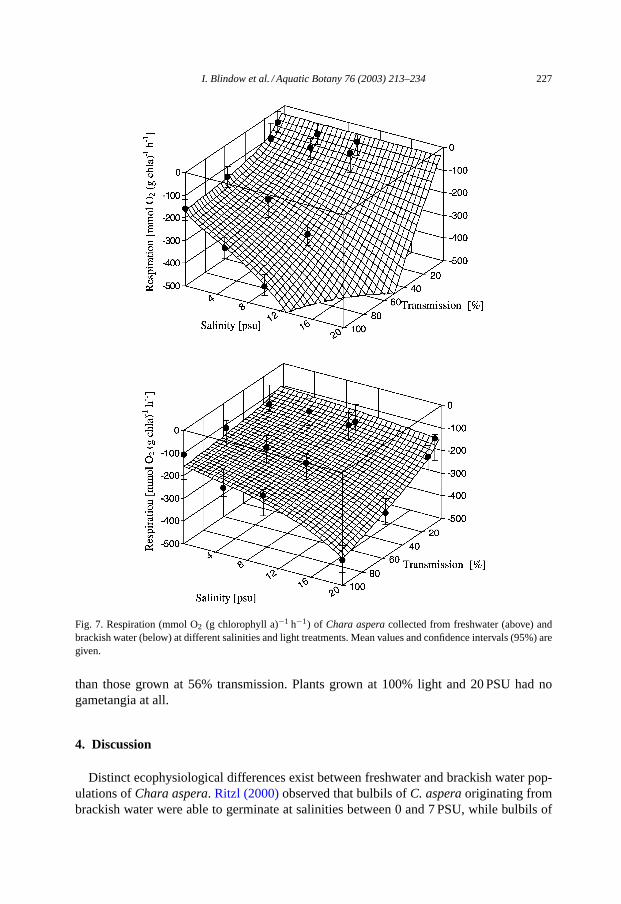
Respiration increased considerably with increasing irradiance and salinity for both plantsoriginating from freshwater and brackish water. Respiration rates at low salinities and lowlight conditions were lower for the freshwater group, but the slope of the increase withincreasing irradiance and salinity was much steeper in the freshwater group compared tothe brackish water group (Fig. 7).
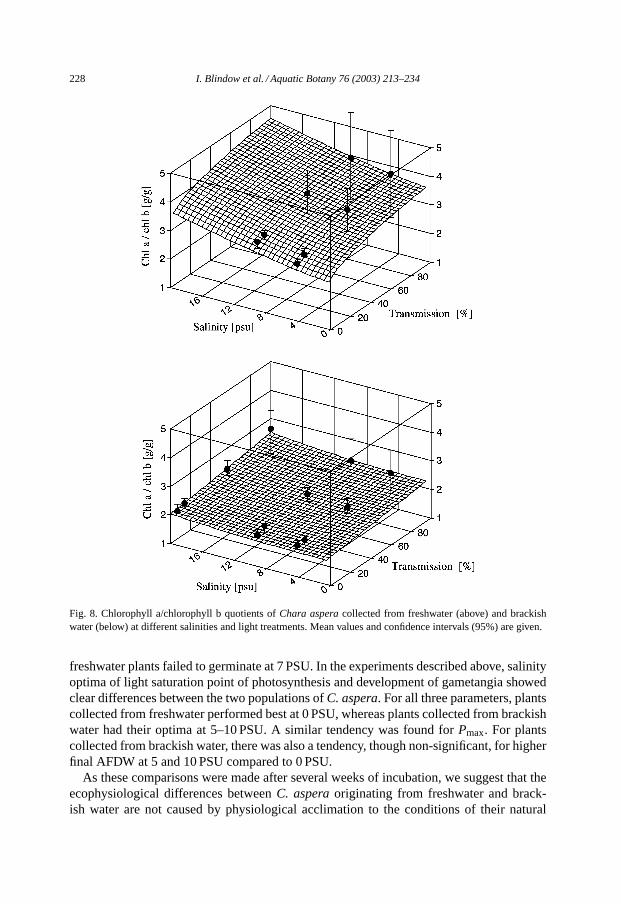
The dependency of chlorophyll a/chlorophyll b quotients from salinity and irradianceconditions did not differ much between plants originating from brackish water and fresh-water. In both groups the quotients were high at high irradiances, indicating small antennaesizes, and increased slightly with increasing salinity. However, the brackish water groupgenerally had lower quotients, indicating larger antennae at all conditions (Fig. 8). Forthe freshwater group, both salinity and irradiance had a significant effect on chlorophylla/chlorophyll b quotients (Tables 1 and 2).
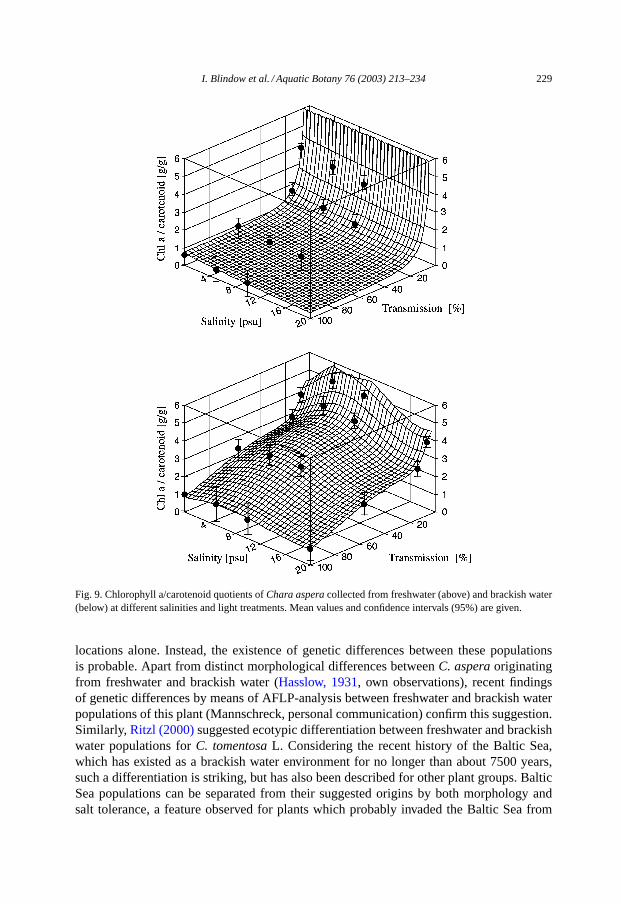
In all cases the highest chlorophyll a/carotenoid quotients were found at low irradi-ances. Differences between the two populations exist with respect to the absolute values.When comparing similar conditions, the freshwater group always exhibited lower chloro-phyll a/carotenoid quotients than the brackish water group. While chlorophyll a/carotenoidquotients in algae from brackish water peaked at 5–10 PSU, this quotient declined withincreasing salinity for plants originating from freshwater (Fig. 9). For both populations,effects from both salinity and light on the chlorophyll a/carotenoid quotient were highlysignificant (Tables 1 and 2).

I. Blindow et al. / Aquatic Botany 76 (2003) 213–234 225
Fig. 5.Ek-values (�mol photons m−2 s−1) of Chara asperacollected from freshwater (above) and brackish water(below) at different salinities and light treatments. Mean values and confidence intervals (95%) are given.
3.3. Development of gametangia
By the end of both experiments, most plants were fertile. For none of the populations,a significant difference in number of gametangia between females and males could befound (Mann–WhitneyU-test,P > 0.05). Therefore, data for male and female plants werecombined in the following analysis.
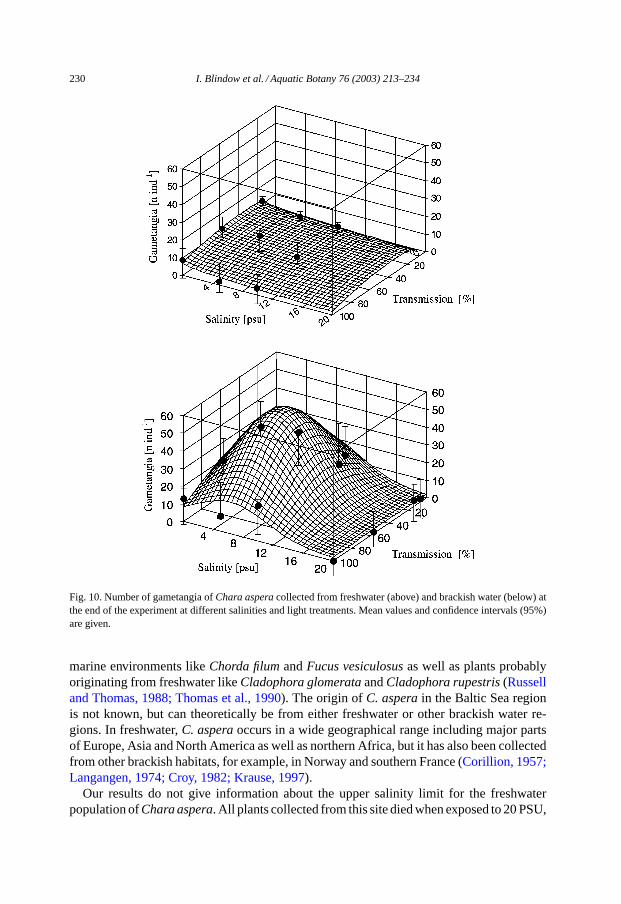
The number of gametangia per plant was highest at 0 PSU for plants collected fromfreshwater, but highest at 5–10 PSU for plants collected from brackish water. For bothpopulations, gametangia developed best at 56% light transmission (Fig. 10). However,effects of salinity and light as well as the interaction effect salinity×light were not significant
226 I. Blindow et al. / Aquatic Botany 76 (2003) 213–234
Fig. 6.Ek-values (mmol photons m−2 s−1; above) andPmax (mmol O2 (g chlorophyll a)−1 h−1; below) ofCharaasperacollected from freshwater and brackish water for the different salinities combined for all light treatments.Mean values± S.E. are given.
for plants collected from freshwater. For plants originating from brackish water, both salinityand light had a significant effect on gametangia numbers (Tables 1 and 2). Thus, plants grownat 20 PSU had significantly lower numbers of gametangia than plants from all other salinitytreatments. Those grown at 100% light had significantly lower numbers of gametangia
I. Blindow et al. / Aquatic Botany 76 (2003) 213–234 227
Fig. 7. Respiration (mmol O2 (g chlorophyll a)−1 h−1) of Chara asperacollected from freshwater (above) andbrackish water (below) at different salinities and light treatments. Mean values and confidence intervals (95%) aregiven.
than those grown at 56% transmission. Plants grown at 100% light and 20 PSU had nogametangia at all.
4. Discussion
Distinct ecophysiological differences exist between freshwater and brackish water pop-ulations ofChara aspera. Ritzl (2000)observed that bulbils ofC. asperaoriginating frombrackish water were able to germinate at salinities between 0 and 7 PSU, while bulbils of
228 I. Blindow et al. / Aquatic Botany 76 (2003) 213–234
Fig. 8. Chlorophyll a/chlorophyll b quotients ofChara asperacollected from freshwater (above) and brackishwater (below) at different salinities and light treatments. Mean values and confidence intervals (95%) are given.
freshwater plants failed to germinate at 7 PSU. In the experiments described above, salinityoptima of light saturation point of photosynthesis and development of gametangia showedclear differences between the two populations ofC. aspera. For all three parameters, plantscollected from freshwater performed best at 0 PSU, whereas plants collected from brackishwater had their optima at 5–10 PSU. A similar tendency was found forPmax. For plantscollected from brackish water, there was also a tendency, though non-significant, for higherfinal AFDW at 5 and 10 PSU compared to 0 PSU.
As these comparisons were made after several weeks of incubation, we suggest that theecophysiological differences betweenC. asperaoriginating from freshwater and brack-ish water are not caused by physiological acclimation to the conditions of their natural
I. Blindow et al. / Aquatic Botany 76 (2003) 213–234 229
Fig. 9. Chlorophyll a/carotenoid quotients ofChara asperacollected from freshwater (above) and brackish water(below) at different salinities and light treatments. Mean values and confidence intervals (95%) are given.
locations alone. Instead, the existence of genetic differences between these populationsis probable. Apart from distinct morphological differences betweenC. asperaoriginatingfrom freshwater and brackish water (Hasslow, 1931, own observations), recent findingsof genetic differences by means of AFLP-analysis between freshwater and brackish waterpopulations of this plant (Mannschreck, personal communication) confirm this suggestion.Similarly, Ritzl (2000)suggested ecotypic differentiation between freshwater and brackishwater populations forC. tomentosaL. Considering the recent history of the Baltic Sea,which has existed as a brackish water environment for no longer than about 7500 years,such a differentiation is striking, but has also been described for other plant groups. BalticSea populations can be separated from their suggested origins by both morphology andsalt tolerance, a feature observed for plants which probably invaded the Baltic Sea from
230 I. Blindow et al. / Aquatic Botany 76 (2003) 213–234
Fig. 10. Number of gametangia ofChara asperacollected from freshwater (above) and brackish water (below) atthe end of the experiment at different salinities and light treatments. Mean values and confidence intervals (95%)are given.
marine environments likeChorda filumandFucus vesiculosusas well as plants probablyoriginating from freshwater likeCladophora glomerataandCladophora rupestris(Russelland Thomas, 1988; Thomas et al., 1990). The origin ofC. asperain the Baltic Sea regionis not known, but can theoretically be from either freshwater or other brackish water re-gions. In freshwater,C. asperaoccurs in a wide geographical range including major partsof Europe, Asia and North America as well as northern Africa, but it has also been collectedfrom other brackish habitats, for example, in Norway and southern France (Corillion, 1957;Langangen, 1974; Croy, 1982; Krause, 1997).
Our results do not give information about the upper salinity limit for the freshwaterpopulation ofChara aspera. All plants collected from this site died when exposed to 20 PSU,
I. Blindow et al. / Aquatic Botany 76 (2003) 213–234 231
but as the plants were not gradually adapted to increasing salinities, this mortality may havebeen caused by salinity shock. Plants collected from brackish water survived at 20 PSU,but reduced weight gain, photosynthesis and gametangia production, all indicate that suchhigh salinities are a considerable stress factor for the plants. As the plants were not grownaxenically, bacteria may have contributed considerably to the respiration values measuredby us. Nevertheless, the distinct increase of the respiration rate at 20 PSU is another indicatorfor considerable salinity stress of the plants. Twenty PSU coincides with the upper salinitylimit at whichC. asperacan be found in the field (Olsen, 1944; Langangen, 1974; Blindow,2000), and with the upper end of the physiological tolerance range of this species (Winter andKirst, 1992). Additionally, charophytes can be restricted from high salinities by a reductionof fertility. In the laboratory, the euryhalineT. nidifica formed gametangia at salinities ashigh as 12 PSU, but no ripe oospores (Winter et al., 1996). ForC. aspera, salinity dependenceof oospore formation has not been studied yet, but the lower numbers of gametangia formedat 20 PSU indicate that fertility indeed may be reduced at high salinity.
For plants originating from both freshwater and brackish water, photosynthetic charac-teristics as well as pigment concentrations varied among light conditions as expected. Thedependencies of the main photosynthesis parameters on irradiance indicate a “classical” ir-radiance acclimation. Thus,Pmaxincreased with increasing irradiance, whereasαdecreased.Comparable absolute values ofPmax, α andEk indicate similar overall photosynthetic ca-pacities between freshwater and brackish water plants.
Interestingly, the highestPmax values were measured for the freshwater plants at 0 PSU.At this salinity, plants collected from brackish water had significantly lowerPmax. Thesame tendency was observed forEk. Our results thus support the CSR-model proposed byGrime (1979). According to this model, stress-tolerant plants are poor competitors understress-free conditions as the achievement of stress-tolerance is connected with additionalphysiological costs.
Pigmentation reflects photosynthetic properties of phototrophic organisms. In particu-lar, the chlorophyll a/chlorophyll b quotient indicates the relative size of light-harvestingcomplexes, and the chlorophyll a/carotenoid quotient is correlated with the capacity oflight-protecting mechanisms. These quotients are useful parameters for comparisons withinone species on a relative base. In both populations, lower chlorophyll a/chlorophyll b quo-tients and higher chlorophyll a/carotenoid quotients were observed at low irradiances in-dicating larger antennae and lower capacity for light protection under these conditions.Quotients of pigment concentration varied considerably between populations. Plants origi-nating from freshwater generally had higher chlorophyll a/chlorophyll b quotients and lowerchlorophyll a/carotenoid quotients than plants originating from brackish water indicatingsmaller antennae and higher demand or capacity for light protection.
Apart from higher ash content at 20 PSU in the brackish water population, which mostprobably reflected higher intracellular salt concentrations, the relative ash content generallydecreased with increasing salinities. Higher calcium carbonate precipitation under lowersalinities is the most probable explanation for this difference. Indeed, ash contents of charo-phytes originating from freshwater and brackish water seem to differ considerably. WhileChara tomentosacollected from three calcium-rich lakes in Sweden had ash contents ofabout 60–70% of d.w., only 15–20% of ash content were found in a brackish water popu-lation (unpublished data). Low marl incrustation in brackish water compared to freshwater
232 I. Blindow et al. / Aquatic Botany 76 (2003) 213–234
forms of bothC. tomentosaandC. asperawas mentioned also byHasslow (1931)and maybe explained by high of brackish water in combination with high concentrations of Mg2+buffer capacity compared to Ca2+. By the end of our experiments, plants collected fromfreshwater generally had higher ash content than plants collected from brackish water. Thismay be explained by the fact that freshwater plants already were incrusted with calciumcarbonate at the start of the experiments. This assumption is supported by differences incolour between the populations, which was greyish in the freshwater plants and fresh greenin the brackish water plants. However, this incrustation seems not to have influenced thephotosynthetic capacity of the freshwater plants, nor was the demand for light protectionreduced by this cover.
The decrease of bothEk andPmax with increasing salinity in plants collected from fresh-water was especially pronounced at low light intensities. This supports our assumption thatenhanced energy demand due to turgor regulation may cause a higher light compensationpoint. As a consequence, these plants can be expected to decline at a lower critical turbiditywhen exposed to higher salinities. Considering the optimum values for bothEk andPmaxat 5 and 10 PSU, plants collected from brackish water behaved like facultative halophytes(Larcher, 1994) which are stimulated by salt at low concentrations. However, shoot elonga-tion as a response to low light conditions occurred in both populations only at low salinities.Decreased turgor at higher salinities could have caused this suppression of shoot elongation.Similarly, shoot elongation was reduced inChara vulgarisL. when salinity was increasedto about 6 PSU in a laboratory experiment (Winter and Kirst, 1990). It is possible that shootelongation generally is suppressed under high salinity conditions inC. asperaand possiblyother species of charophytes. Such a behaviour could theoretically cause an exclusion ofthese plants from turbid water under higher salinities.
Acknowledgements
We thank M. Schudack, U. Winter and two anonymous reviewers for valuable contribu-tions to the manuscript.
References
Blindow, I., 1992a. Long- and short-term dynamics of submerged macrophytes in two shallow eutrophic lakes.Freshwater Biol. 28, 15–27.
Blindow, I., 1992b. Decline of Charophyta during eutrophication: a comparison to angiosperms. Freshwater Biol.28, 9–14.
Blindow, I., 2000. Distribution of charophytes along the Swedish coast in relation to salinity and eutrophication.Int. Rev. Hydrobiol. 85, 707–717.
Blindow, I., Hargeby, A., Wagner, B.M.A., Andersson, G., 2000. How important is the crustacean plankton forthe maintenance of water clarity in shallow lakes with abundant submerged vegetation? Freshwater Biol. 44,185–197.
Corillion, R., 1957. Les Charophycées de France et d’Europe Occidentale. Imprimerie Bretonne, Rennes.Croy, C.D., 1982.Chara aspera(Charophyta). Breeding pattern in the northern hemisphere. Phycologia 21, 243–
246.Falkowski, P.G., Raven J.A., 1997. Aquatic Photosynthesis. Blackwell Scientific, Malden, MA.
I. Blindow et al. / Aquatic Botany 76 (2003) 213–234 233
Grant, M.C., Proctor, V.W., 1972.Chara vulgarisandC. contraria: patterns of reproductive isolation for twocosmopolitan species complexes. Evolution 26, 267–281.
Grime, J.P., 1979. Plant Strategies and Vegetation Processes. Wiley, Chichester.Hasslow, O.J., 1931. Sveriges characéer. Botaniska Notiser 1931, 63–136.Henley, W.J., 1993. Measurement and interpretation of photosynthetic light-response curves in algae in the context
of photoinhibition and diel changes. J. Phycol. 29, 729–739.Kirst, G.O., Bisson, M.A., 1979. Regulation of turgor pressure in marine algae: ions and low-molecular-weight
organic compounds. Aust. J. Plant Physiol. 6, 539–556.Kohler, A., Vollrath, H., Beisl, E., 1971. Zur Verbreitung, Vergesellschaftung und Ökologie der
Gefäss-Makrophyten in Fliessgewässer Moosach (Münchener Ebene). Arch. Hydrobiol. 69, 333–365.Krause, W., 1981. Characeen als Bioindikatoren für den Gewässerzustand. Limnologica 13, 399–418.Krause, W., 1997. Charales (Charophyceae). In: Ettl, H., Gärtner, G., Heynig, H., Mollenhauer, D. (Eds.),
Süsswasserflora von Mitteleuropa, vol. 18. Gustav Fischer, Jena.Lang, G., 1981. Die submersen Makrophyten des Bodensees—1978 im Vergleich mit 1967. Int.
Gewässerschutzkomm. für den Bodensee, Bericht Nr. 26.Langangen, A., 1974. Ecology and distribution of Norwegian charophytes. Norw. J. Bot. 21, 31–52.Larcher, W., 1994. Ökophysiologie der Pflanzen, 5th ed. Ulmer, Stuttgart.Lindner, A., 1978. Soziologisch-ökologische Untersuchungen an der submersen Vegetation in der Boddenkette
südlich des Darß und des Zingst (südliche Ostsee). Limnologica 11, 229–305.Munsterhjelm, R., 1997. The aquatic macrophyte vegetation of flads and gloes, sea coast of Finland. Acta Bot.
Fennica 157, 1–68.Olsen, S., 1944. Danish Charophyta. Kgl. Danske Vid. Selsk., Biol. Skr. 3. Copenhagen.Porra, R.J., Thompson, W.A., Kriedemann, P.E., 1989. Determination of accurate extinction coefficients and
simultaneaous equations for assaying chlorophylls a and b extracted with four different solvents: verificationof the concentration of chlorophyll standards by atomic absorption spectroscopy. Biochim. Biophys. Acta 975,384–394.
Proctor, V.W., 1971.Chara globularisThuillier (= C. fragilis Desvaux): breeding patterns within a cosmopolitancomplex. Limnol. Oceanogr. 16, 422–436.
Proctor, V.W., 1975. The nature of charophyte species. Phycologia 14, 97–113.Ritzl, C., 2000. Salt Tolerance in Freshwater and Brackish-waterChara tomentosaand Chara aspera. M.Sc.
Thesis, Uppsala University.Russell, G., Thomas, D.N., 1988. The Baltic Sea: a cradle of plant evolution? Plants Today May–June, 77–82.Scheffer, M., Hosper, S.H., Meijer, M.-L., Moss, B., Jeppesen, E., 1993. Alternative equilibria in shallow lakes.
Trends Evol. Ecol. 8, 275–279.Schudack, M., 1993. Die charophyten in Oberjura und Unterkreide Westeuropas, mit einer phylogenetischen
analyse der gesamtgruppe. Berliner Geowissenschaftliche Abhandlungen (E) 8, 1–209.Stålberg, N., 1939. Lake Vättern. Outlines of its natural history, especially its vegetation. Acta Phytogeographica
Suecica XI, Uppsala.Talling, J.F., 1957. The phytoplankton population as a compound photosynthetic system. New Phytol. 56, 133–149.Thomas, D.N., Collins, J.C., Russell, G., 1990. Interpopulation differences in the salt tolerance of twoCladophora
species. Estuarine Coastal Shelf Sci. 30, 201–206.van den Berg, M.S., Coops, H., Meijer, M.-L., Scheffer, M., Simons, J., 1998. Clear water associated with a dense
Charavegetation in the shallow and turbid Lake Veluwemeer, The Netherlands. In: Jeppesen, E., Søndergaard,Ma., Søndergaard, Mo., Christoffersen, K. (Eds.), The Structuring Role of Submerged Macrophytes in Lakes.Springer, New York, pp. 339–352.
Walsby, A.E., 1997. Numerical integration of phytoplankton photosynthesis through time and depth in a watercolumn. New Phytol. 136, 189–209.
Winter, U., Kirst, G.O., 1990. Salinity response of a freshwater charophyte,Chara vulgaris. Plant Cell Environ.13, 123–134.
Winter, U., Kirst, G.O., 1991. Partial turgor pressure regulation inChara canescensand its implications for ageneralized hypothesis of salinity response in charophytes. Botanica Acta 104, 37–46.
Winter, U., Kirst, G.O., 1992. Turgor pressure regulation inChara aspera: the role of sucrose accumulation infertile and sterile plants. Phycologia 31, 240–245.

234 I. Blindow et al. / Aquatic Botany 76 (2003) 213–234
Winter, U., Soulié-Märsche, I., Kirst, G.O., 1996. Effects of salinity on turgor pressure and fertility inTolypella(Characeae). Plant Cell Environ. 19, 869–878.
Wolfstein, K., Hartig, P., 1998. The photosynthetic light dispensation system: application to microphytobenthicprimary production measurements. Mar. Ecol. Prog. Ser. 166, 63–71.
Wood, R.D., 1962. New combinations and taxa in the revision of Characeae. Taxon 11, 7–25.Wood, R.D., 1965. Monograph of the Characeae. In: Wood, R.D., Imahori, K. (Eds.), A Revision of the Characeae.
J. Cramer., Weinheim.