Application of the CSM-CERES-Rice model for evaluation of plant density and irrigation management of...
16
ORIGINAL PAPER Application of the CSM-CERES-Rice model for evaluation of plant density and irrigation management of transplanted rice for an irrigated semiarid environment Shakeel Ahmad • Ashfaq Ahmad • Hakoomat Ali • Abid Hussain • Axel Garcia y Garcia • Muhammad Azam Khan • Muhammad Zia-Ul-Haq • Mirza Hasanuzzaman • Gerrit Hoogenboom Received: 23 August 2011 / Accepted: 1 February 2012 / Published online: 23 February 2012 Ó Springer-Verlag 2012 Abstract The objectives of this study were to evaluate the performance of the Cropping System Model (CSM)- CERES (Crop-Environment Resource Synthesis)-Rice for simulating growth and yield of rice under irrigated condi- tions for a semiarid environment in Pakistan and to deter- mine the impact of plant density and irrigation regime on grain yield and economic returns. The crop simulation model was evaluated with experimental data collected in 2000 and 2001 in Faisalabad, Punjab, Pakistan. The experiment utilized a randomized complete block design with three replications and included three plant densities (one seedling hill -1 , PD 1 ; two seedlings hill -1 , PD 2 ; and three seedlings hill -1 , PD 3 ) and five irrigation regimes (625 mm, I 1 ; 775 mm, I 2 ; 925 mm, I 3 ; 1075 mm, I 4 ; and 1225 mm, I 5 ). To determine the most appropriate combi- nation of plant densities and irrigation regimes, four plant densities from one seedling hill -1 to four seedlings hill -1 and 17 irrigation regimes ranging from 0 to 1600 mm, for a total of 68 different scenarios, were simulated for 35 years of historical daily weather data. The evaluation of CSM- CERES-Rice showed that the model was able to accurately simulate growth and yield of rice for irrigated semiarid conditions, with an average error of 11% between simu- lated and observed grain yield. The results of the bio- physical analysis showed that the combination of the two seedlings hill -1 plant density and the 1,300 mm irrigation regime produced the highest yield compared to all other scenarios. Furthermore, the economic analysis through the Mean-Gini Dominance (MGD) also showed the superiority of this treatment compared to the other treatment combi- nations. The mean monetary return ranged from -47 to 1,265 $ ha -1 among all 68 scenarios. However, to be able to furnish the demand of rice grain for local consumption and to increase export, there is a need to expand this technology among the rice growers of other rice producing areas in Pakistan through extension workers. Introduction Irrigated agriculture is the largest freshwater-consumption sector but it faces competing demands from other sectors, such as industry and domestic use (Zwart and Bastiaanssen 2004). Agriculture uses 70% of all freshwater worldwide Communicated by S. Azam-Ali. S. Ahmad H. Ali Department of Agronomy, Bahauddin Zakariya University, Multan 60800, Pakistan A. Ahmad A. Hussain Agro-climatology Lab, University of Agriculture, Faisalabad 38040, Pakistan A. Garcia y Garcia Department of Plant Sciences, University of Wyoming, Powell, WY 82435-9135, USA M. A. Khan Executive District Officer Agriculture, Chiniot, Punjab 35400, Pakistan M. Zia-Ul-Haq Department of Pharmacognosy, University of Karachi, Karachi 75270, Pakistan M. Hasanuzzaman (&) Department of Agronomy, Faculty of Agriculture, Sher-e-Bangla Agricultural University, Dhaka 1207, Bangladesh e-mail: [email protected] G. Hoogenboom AgWeatherNet Program, Washington State University, Prosser, WA 99350-8694, USA 123 Irrig Sci (2013) 31:491–506 DOI 10.1007/s00271-012-0324-6
Transcript of Application of the CSM-CERES-Rice model for evaluation of plant density and irrigation management of...

ORIGINAL PAPER
Application of the CSM-CERES-Rice model for evaluationof plant density and irrigation management of transplanted ricefor an irrigated semiarid environment
Shakeel Ahmad • Ashfaq Ahmad • Hakoomat Ali • Abid Hussain •
Axel Garcia y Garcia • Muhammad Azam Khan • Muhammad Zia-Ul-Haq •
Mirza Hasanuzzaman • Gerrit Hoogenboom
Received: 23 August 2011 / Accepted: 1 February 2012 / Published online: 23 February 2012
� Springer-Verlag 2012
Abstract The objectives of this study were to evaluate
the performance of the Cropping System Model (CSM)-
CERES (Crop-Environment Resource Synthesis)-Rice for
simulating growth and yield of rice under irrigated condi-
tions for a semiarid environment in Pakistan and to deter-
mine the impact of plant density and irrigation regime on
grain yield and economic returns. The crop simulation
model was evaluated with experimental data collected
in 2000 and 2001 in Faisalabad, Punjab, Pakistan. The
experiment utilized a randomized complete block design
with three replications and included three plant densities
(one seedling hill-1, PD1; two seedlings hill-1, PD2; and
three seedlings hill-1, PD3) and five irrigation regimes
(625 mm, I1; 775 mm, I2; 925 mm, I3; 1075 mm, I4; and
1225 mm, I5). To determine the most appropriate combi-
nation of plant densities and irrigation regimes, four plant
densities from one seedling hill-1 to four seedlings hill-1
and 17 irrigation regimes ranging from 0 to 1600 mm, for a
total of 68 different scenarios, were simulated for 35 years
of historical daily weather data. The evaluation of CSM-
CERES-Rice showed that the model was able to accurately
simulate growth and yield of rice for irrigated semiarid
conditions, with an average error of 11% between simu-
lated and observed grain yield. The results of the bio-
physical analysis showed that the combination of the two
seedlings hill-1 plant density and the 1,300 mm irrigation
regime produced the highest yield compared to all other
scenarios. Furthermore, the economic analysis through the
Mean-Gini Dominance (MGD) also showed the superiority
of this treatment compared to the other treatment combi-
nations. The mean monetary return ranged from -47 to
1,265 $ ha-1 among all 68 scenarios. However, to be able
to furnish the demand of rice grain for local consumption
and to increase export, there is a need to expand this
technology among the rice growers of other rice producing
areas in Pakistan through extension workers.
Introduction
Irrigated agriculture is the largest freshwater-consumption
sector but it faces competing demands from other sectors,
such as industry and domestic use (Zwart and Bastiaanssen
2004). Agriculture uses 70% of all freshwater worldwide
Communicated by S. Azam-Ali.
S. Ahmad � H. Ali
Department of Agronomy, Bahauddin Zakariya University,
Multan 60800, Pakistan
A. Ahmad � A. Hussain
Agro-climatology Lab, University of Agriculture,
Faisalabad 38040, Pakistan
A. Garcia y Garcia
Department of Plant Sciences, University of Wyoming,
Powell, WY 82435-9135, USA
M. A. Khan
Executive District Officer Agriculture, Chiniot,
Punjab 35400, Pakistan
M. Zia-Ul-Haq
Department of Pharmacognosy, University of Karachi,
Karachi 75270, Pakistan
M. Hasanuzzaman (&)
Department of Agronomy, Faculty of Agriculture,
Sher-e-Bangla Agricultural University, Dhaka 1207, Bangladesh
e-mail: [email protected]
G. Hoogenboom
AgWeatherNet Program, Washington State University,
Prosser, WA 99350-8694, USA
123
Irrig Sci (2013) 31:491–506
DOI 10.1007/s00271-012-0324-6

(Kunimitsu 2009), while rice (Oryza sativa L.) production
consumes about 30% (Peng et al. 2006). In Asia, rice
consumes more than 45% of total freshwater (Barker et al.
1999). To meet the rising demand for food security due to
the increase in population and economic development, rice
yield should increase by more than 1.2% per year world-
wide (Normile 2008). However, the scarcity of freshwater
resources has threatened the production of flooded rice
(IWMI 2000). It is expected that by 2025, 15 out of 75
million ha of Asia’s flooded rice will experience water
shortage (Tuong and Bouman 2003). Therefore, there is
increasing pressure to reduce freshwater use in irrigated
agriculture through alternative conservation practices. A
major challenge for agronomists across the world is the
development of technologies for increased and sustained
rice productivity with the currently available water
resources (Zeigher and Puckridge 1995). Anaerobic
(flooded ? puddled) and aerobic (non-flooded and non-
puddled) are two common rice production systems in the
world, including in Asia. There is substantial water savings
in the production of aerobic rice compared to anaerobic
rice due to lower losses through seepage, percolation, and
evaporation (Bouman et al. 2002; Tuong et al. 2005; Peng
et al. 2006). Therefore, many water-saving management
technologies have been developed for flooded rice to
reduce water losses and to increase water productivity.
These water-saving practices include saturated soil culture
(Borell et al. 1997; Bouman and Tuong 2001), alternate
wetting and drying (Li 2001; Bouman and Tuong 2001;
Tabbal et al. 2002; Soundharajan and Sudheer 2009), and
ground cover systems (Lin et al. 2002; Feng et al. 2007).
The amount of irrigation water saved and the yield that can
be obtained using water-saving technologies vary greatly
among climate, soil type, hydrological conditions, and rice
production systems (Cabangon et al. 2004; Yang et al.
2005; Feng et al. 2007; Soundharajan and Sudheer 2009).
Irrigation water conservation technologies are applica-
ble and effective only when there is an assured supply of
irrigation water. In Pakistan, the water availability for
canals is shrinking due to decreasing storage capacity of
dams and decreasing rainfall. In addition, farmers lack
access to water for irrigation on their individual farms as
the management of surface irrigation is based on weekly
turns. In addition, the present system lacks consideration of
rainfall or droughts and continues to deliver the same
amount of water as scheduled (Choudhary 2008). Even
during a farmer’s turn, water is only available depending
upon the area of their land holding rather than the actual
amount of water required for a particular crop or area to be
irrigated (GOP 2008). The allocated water times usually
vary from 30 to 55 min ha-1 depending upon distance
from the distributary canal, minor canals, or water courses
(GOP 2009). The alternative to canal water is groundwater,
which is not sustainable for resource-poor farmers due to
the increasing prices of electric power and diesel that are
required to operate the pumps.
In Pakistan, rainfall is not only scarce but also unevenly
distributed (GOP 2007, 2009). Most of the rainfall occurs
during the monsoon season in July and August with heavy
floods after drought conditions have occurred. In Pakistan
and other countries in the region, rainfall is barely suffi-
cient to support a one-season rice crop (GOP 2009).
Therefore, production relies heavily on surface and ground
water (Bouman and Tuong 2001; Geng et al. 2001; Feng
et al. 2007). The only option, therefore, is to grow irrigated
rice in Pakistan. In this study, irrigated rice refers to the
non-flooded lowland rice with supplemental irrigation. The
primary potential threat to rice productivity in Pakistan is
water shortage. However, optimum plant population should
be ensured to achieve higher yields. A plant density either
below or above the optimum affects yield due to a smaller
number of plants per unit area or inter-plant competition at
higher plant densities (Ahmad et al. 2011). However,
judicious use of water with respect to the time and rate of
application according to the need of the crop is very
important. Irrigated rice in Pakistan is an imperative target
for water conservation when compared to other crops
having less water requirements.
Crop simulation models linked to decision support sys-
tems have been used successfully for a wide range of
applications in many countries around the world to assess
alternative crop management options (Tsuji et al. 1994,
1998; Jones et al. 2003; Hoogenboom et al. 2010). The
Decision Support System for Agro-technology Transfer
(DSSAT) is a widely used decision support system that
includes the Cropping System Model (CSM) (Jones et al.
2003; Hoogenboom et al. 2010). CSM is a process-ori-
ented, dynamic crop simulation model that stimulates crop
growth, development, and yield for 27 food and other
crops, including rice (Jintrawet 1995; Ritchie et al. 1998;
Cheyglinted et al. 2001; St’astna et al. 2002; Gungula et al.
2003; Kumar and Sharma 2004; Sarkar and Kar 2006;
Ahmad et al. 2011). The CSM-CERES-Rice model simu-
lates growth and development from either sowing or
transplanting to harvest maturity and is based on the
physiological processes that describe the response of rice to
local soil and weather conditions. Potential growth is
dependent upon photosynthetically active radiation, light
interception, and light conversion efficiency, where as
biomass production on any day is constrained by crop
management, suboptimal temperature, soil water deficit,
nitrogen deficiency, and their respective interactions. The
input data required to run the DSSAT models include daily
weather data, i.e., maximum and minimum temperature,
rainfall, and solar radiation; soil characterization data, e.g.,
physical, chemical, and morphological properties for each
492 Irrig Sci (2013) 31:491–506
123
soil horizon; genetic information through cultivar coeffi-
cients; and crop management information such as trans-
planting date, age of nursery-transplanted seedlings, row
and plant spacing, rates, dates and amounts of fertilizer and
irrigation application. The model calculates the soil water
balance of the rice crop on a daily basis as a function of
precipitation, irrigation, soil surface runoff and drainage
from the bottom of the profile, and transpiration and soil
evaporation (Ritchie 1998). The model also calculates the
soil nitrogen balance as a function of a range of soil
nitrogen transformation processes as well as nitrogen
uptake by the plant (Godwin and Singh 1998; Ahmad et al.
2011).
Most of the studies during the past decade have used
crop simulation models with single or multiple factors but
without considering the economic impact for growers
(Cheyglinted et al. 2001; Kropff et al. 2001; Timsina and
Connor 2001; St’astna et al. 2002; Timsina and Humphreys
2006; Arora 2006; Soler et al. 2007a, b; Banterng et al.
2010). Limited scientific information is available regarding
the application of the CSM-CERES-Rice for the interaction
of multiple crop management factors such as plant density
and irrigation regime for irrigated conditions in a semiarid
environment. The overall goal of this study, therefore, was
to identify the optimum management practices for rice
using a combination of field experiments and crop simu-
lation models. The specific objectives of this study
included (1) to evaluate of the performance of the CSM-
CERES-Rice model for plant density and irrigation man-
agement under semiarid conditions and (2) to determine the
best management options for increasing rice productivity
for local conditions in Pakistan.
Materials and methods
Experimental location and design
The CSM-CERES-Rice model of DSSAT Version 4.5
(Jones et al. 2003; Hoogenboom et al. 2010), including the
improved soil water model (Ritchie et al. 2009), was
evaluated with experimental data that were collected in
Faisalabad, Pakistan. The observed data were obtained
from two experiments conducted at the University of
Agriculture, Faisalabad, Pakistan in 2000 and 2001. A
randomized complete block design (RCBD) was employed
with three replications. An aromatic variety, i.e., Basmati-
385, was grown during both years of the experiment. Daily
weather records for the experimental site (just at 200
meters distance) were obtained from the Department of
Crop Physiology, University of Agriculture Faisalabad
(UAF), (36.25� lat N, 73.09� long E, and 184.4 m altitude
from sea level) Pakistan. The soil was a Lyallpur clay loam
(aridisol-fine-silty, mixed, hyperthermic Ustalfic, Hap-
larged [USDA classification] and Haplic Yermosols [FAO
classification]). The soil was silt–clay loam in nature with
soil texture of sand 51.31%, silt 21.04%, and clay 27.65%
at 0–15 cm, while respective values for 16–30 cm were
52.05, 20.83 and 27.12, respectively. During both years,
the previous crop was wheat. Prior to sowing, soil analysis
at a depth of 0–15 cm showed a pH of 7.8, total soluble
salts at 0.22%, organic matter at 0.76%, total nitrogen at
0.046%, available phosphorus at 6.19 ppm, and available
potassium at 193 ppm. The values for 16–30 cm were 7.9,
0.23, 0.73, 0.048, 6.11, and 192, respectively.
Experimental procedures
Thirty-day-old seedlings were transplanted manually in a
puddled field in standing water at a plant distance of
22.5 cm and a row distance of 22.5 cm for both years.
Nitrogen was applied in two equal splits through urea.
The first dose (75 kg N ha-1) was applied during pud-
dling on July 4, 2000 and July 3, 2001 prior to the final
cultivation. The second dose (75 N kg ha-1) was applied
at 22 days after transplanting (DAT) on July 26, 2000 and
July 25, 2001. In addition, phosphorus and potassium
(P2O5 and K2O; 65 kg ha-1 each) in the form of single
super phosphate (SSP), and potassium sulfate and zinc at
a rate of 25 kg ha-1 were also applied during puddling
prior to final cultivation. All other agronomic practices
such as weeding and plant protection measures were
standard and uniform for all the treatments. Additional
details on crop management, plant sampling and obser-
vations can be found in Ahmad et al. (2005a, b, 2008,
2009a, b, 2011).
For irrigation, water was applied at fixed weekly inter-
vals by adding the approximately 77 mm of water. This
fixed amount was applied regardless of rainfall, because
during the rice growing season, the temperature is very
high in this region and rainfall is highly unpredictable in
terms of intensity and the amount of rain. In addition,
farmers do not have their own tube well and the farmers’
turn from the canal source is weekly and is independent of
local rainfall as was explained in the introduction. To
emulate these local restrictions, we applied water on a
weekly basis. The experimental plots were irrigated
according to the different irrigation treatments. Water in
the amount specified by each treatment was applied using a
cutthroat flume (90 cm 9 20 cm). The duration for each
irrigation application was calculated using the following
Eq. 1
T ¼ A� d=Q; ð1Þ
where T is the time required for application of irrigation
water to an area (A) to be irrigated at depth (d); and Q is
Irrig Sci (2013) 31:491–506 493
123
discharge or flow rate. The experiment included the
following treatment combinations: three plant densities,
viz., one seedling hill-1 (PD1), two seedlings hill-1
(PD2), and three seedlings hill-1 (PD3) and five irrigation
regimes, viz., 625 mm (eight irrigations, I1), 775 mm
(ten irrigations, I2), 925 mm (twelve irrigations, I3),
1075 mm (fourteen irrigations, I4), and 1225 mm (six-
teen irrigations; I5). For all irrigation treatments, water
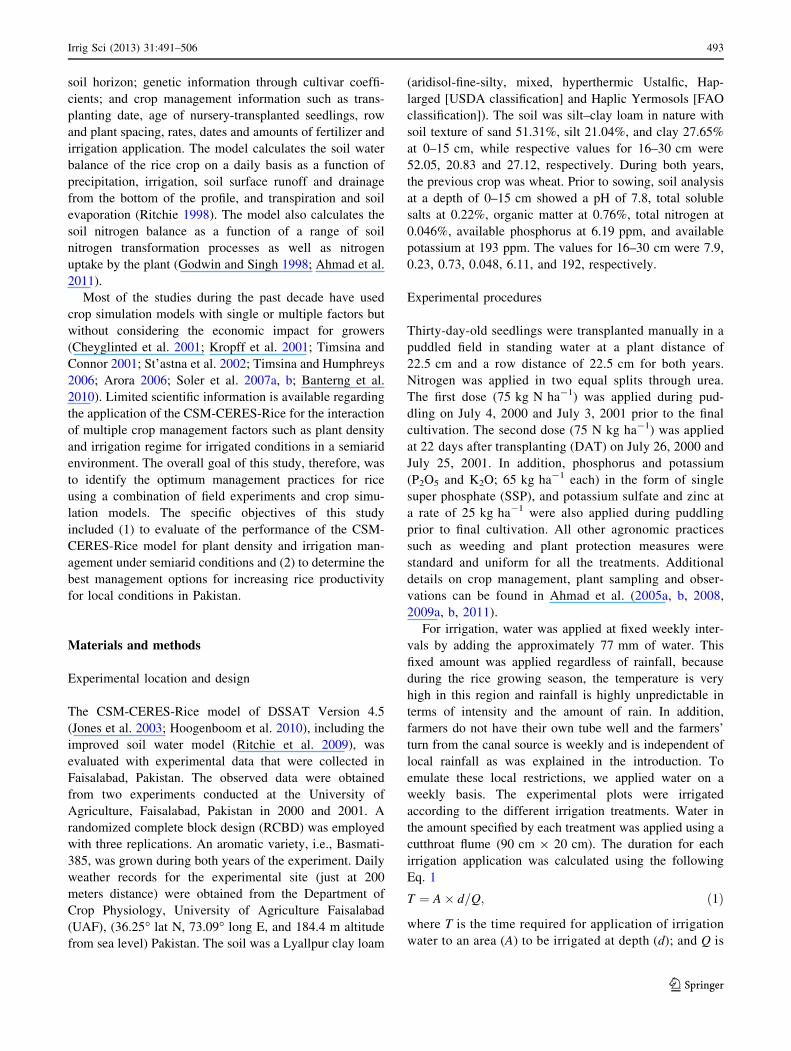
Table 1 Genetic coefficients of the CSM-CERES-Rice model for the fine rice cultivar Basmati-385
Cultivar traits Genetic coefficients Unit Value
Vegetative growth
1. Time from seed emergence to the end of juvenile phase P1 Photothermal day 126.0
2. Extent to which development is delayed for each hour increase
in photoperiod above the longest photoperiod
P2O h 250.0
3. Extent to which phasic development from vegetative to panicle
initiation is delayed for each hour increase in photoperiod above P2O, i.e. 12.5 h
P2R Photothermal day 500.0
Reproductive growth
4. Time starting from grain filling to physical maturity P5 Photothermal day 10.9
5. Maximum spikelet number coefficient G1 – 52.0
6. Maximum possible single grain size G2 g 0.0235
7. Scalar vegetative growth coefficient for tillering relative to IR64 G3 – 1.03
8. Temperature tolerance scalar coefficient G4 – 0.90
Source: Ahmad et al. (2011)
a
Tem
pera
ture
(° C
)
0
10
20
30
40
50b
d
140 160 180 200 220 240 260
Sol
ar r
adia
tion
(M
J m
-2 d
ay-1
)
0
5
10
15
20
25
30
Maximum temperatureMinimum temperature
c
Day of year
140 160 180 200 220 240 260
Pre
cipi
tati
on (
mm
)
0
20
40
60
PrecipitationSolar radiation
2000 2001
Fig. 1 Daily weather
conditions for Faisalabad,
Pakistan, during a typical rice
growing season; maximum and
minimum air temperature for
2000 (a) and 2001 (b) and solar
radiation and precipitation for
2000 (c) and 2001 (d)
494 Irrig Sci (2013) 31:491–506
123

was applied weekly but irrigation was ended at different
dates. For 2002, these irrigation termination dates were
23 August, 6 September, 20 September, 4 October, and
18 October for the irrigation regimes I1, I2, I3, I4, and I5,
respectively. For 2001, these dates were 22 August, 5
September, 19 September, 3 October, and 17 October,
respectively.
Calibration and evaluation of the CSM-CERES-Rice
model
The CSM-CERES-Rice model was calibrated with the data
obtained from the 2000 field experiment for the treatment
that consisted of a plant density of two seedlings hill-1 and
a irrigation regime of 1225 mm as it had the best perfor-
mance. The cultivar coefficients of the variety Basmati-385
are presented in Table 1. The performance of the model,
including its response to irrigation, was evaluated with the
data obtained from the remainder of the treatments of the
2000 and 2001 field experiments. As part of the evaluation
process, the simulated data for LAI, above-ground bio-
mass, and final grain yield were compared with the
observed values from both experiments. The statistical
indices that were used for model evaluation included the
root mean square error (RMSE) (Wallach and Goffinet
1987) and the index of agreement (d-stat) (Willmott 1982;
Willmott et al. 1985). The RMSE was calculated according
to Eq. 2
Root mean square errorðRMSEÞ ¼
ffiffiffiffiffiffiffiffiffiffiffiffiffiffiffiffiffiffiffiffiffiffiffiffiffiffiffi
P
n
i¼1
Pi� Oið Þ2
n
v
u
u
u
t
2
6
6
6
4
3
7
7
7
5
;
ð2Þ
where Pi and Oi refer to the predicted and observed values
for the studied variables, respectively, e.g., leaf area index,
total biomass, and grain yield, and n is the mean of the
observed variables. Normalized RMSE (RMSEn) gives a
measure (%) of the relative difference of simulated versus
observed data. The RMSEn was calculated following Eq. 3
Normalized root mean square error ¼ RMSE� 100
O
� �
ð3ÞThe index of agreement (d) proposed by Willmott et al.
(1985) was estimated using Eq. 4
Index of agreement dð Þ ¼ 1�
P
n
i¼1
Pi� Oið Þ2
P
n
i¼1
ð P0ij j þ O0ij jÞ2
2
6
6
4
3
7
7
5
;
0� d� 1;
ð4Þ
where n is the number of observations, Pi the predicted
observation, Oi is a measured observation and P0i = Pi -
M and O0i = Oi - M (M is the mean of the observed
variable). The percentage deviations (PD) were also
Table 2 Average simulated (S) and observed (O) phenology, root
mean square error and d-value for growth characteristics from CSM-
CERES-Rice model calibration (2000) and evaluation (2001) for the
fine rice cultivar Basmati-385 with three plant densities and five
irrigation levels (n = 15)
Transplanting date Crop characteristics
Phenology S (DAT) O (DAT
July 5, 2000 Anthesis date 72 72
Maturity date 102 103
Growth RMSE d-value
July 5, 2000 LAI (m2 m-2) 1.12 0.95
Top weight (kg ha-1) 365 0.97
Phenology S (DAT) O (DAT
July 4, 2001 Anthesis date 73 72
Maturity date 103 103
Growth RMSE d-value
July 4, 2001 LAI (m2 m-2) 1.29 0.96
Top weight (kg ha-1) 385 0.98
DAT, days after transplanting; LAI, leaf area index
Irrig Sci (2013) 31:491–506 495
123
calculated. The computed values of RMSE and d determine
the degree of agreement between the predicted values with
their respective observed values. A low value for RMSE
and a d-value that approaches 1 are desirable.
Model application
Biophysical analysis
The CSM-CERES-Rice model was used for long-term
simulations of the aromatic rice cultivar Basmati-385. The
CERES-Rice model includes an automatic irrigation
management option that applies irrigation when certain soil
moisture conditions are met. This includes an irrigation
threshold value that sets the available soil moisture for a
certain depth; both can be defined by the user. The simu-
lations were conducted for 35 years using observed daily
weather data starting in 1974 and ending in 2008. The
seasonal analysis program of DSSAT v.4.5 was used to
evaluate and compare different combinations of crop
management practices (Thornton and Hoogenboom 1994;
Thornton et al. 1998; Hoogenboom et al. 2010). The
overall goal was to determine the best management option
for a rice crop grown under irrigated semiarid conditions
similar to the environment of Faisalabad, Pakistan. The
scenarios that were evaluated included combinations of
a
0.0
0.5
1.0
1.5
2.0
2.5b c
02000400060008000100001200014000
d
0.0
0.5
1.0
1.5
2.0
2.5e f
02000400060008000100001200014000
g
LAI (
m2
m-2
)
0.0
0.5
1.0
1.5
2.0
2.5h i
Bio
mas
s (kg
dm
ha-1
)
02000400060008000100001200014000
j
0.0
0.5
1.0
1.5
2.0
2.5k l
02000400060008000100001200014000
m
0 20 40 60 80 1000.0
0.5
1.0
1.5
2.0
2.5
Observed LAI Simulated LAIObserved biomass Simulated biomass
n
Days after transplanting0 20 40 60 80 100
o
0 20 40 60 80 10002000400060008000100001200014000
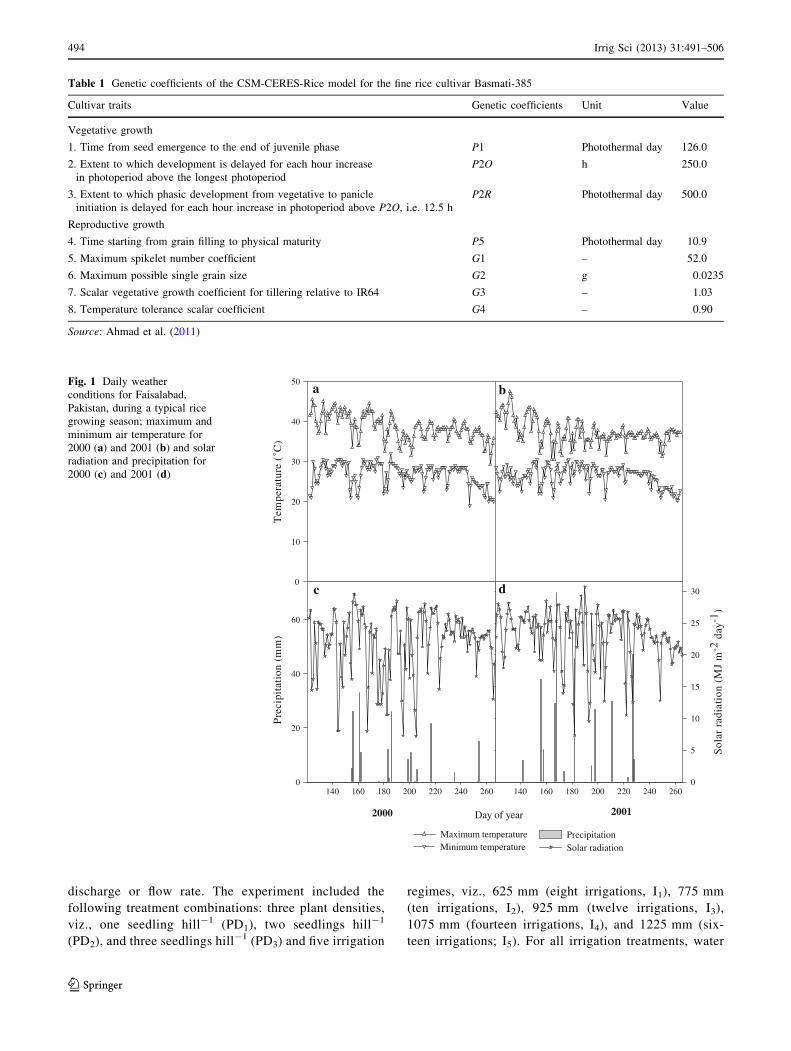
Fig. 2 Simulated (continuousand dotted lines) and observed
(triangular and round symbols)
leaf area index and biomass of
rice Basmati-385 at variable
plant densities and irrigation
levels; PD1 ? I1 (a), PD2 ? I1
(b), PD3 ? I1 (c), PD1 ? I2 (d),
PD2 ? I2 (e), PD3 ? I2 (f),PD1 ? I3 (g), PD2 ? I3 (h),
PD3 ? I3 (i), PD1 ? I4 (j),PD2 ? I4 (k), PD3 ? I4 (l),PD1 ? I5 (m), PD2 ? I5 (n) and
PD3 ? I5 (o) under irrigated
semiarid conditions at
Faisalabad, Pakistan, for 2000
(see the ‘‘Materials and
methods’’ section for the
definition of the individual
treatment combinations)
496 Irrig Sci (2013) 31:491–506
123

four plant densities and 17 irrigation regimes for a total of
68 scenarios (treatment combinations). The simulation
results were analyzed using the strategy analysis program
of DSSAT (Thornton et al. 1995, 1998) and comparing
percentile distributions for grain yield and water use.
Economic analysis
The results of each strategy, i.e., each combination of plant
density and irrigation regimes, were also evaluated using the
Mean-Gini Dominance Analysis (Buccola and Subaei 1984;
Fawcett and Thornton 1989), an evaluation procedure of the
seasonal analysis program that calculates the monetary return
for each treatment combination and identifies the most dom-
inant treatment based on the highest economic return (Gini
coefficient) and comparing percentile distributions for mon-
etary return. The gross margin ($ ha-1) for each of treatment
was determined using the following equation
GM ¼ Y � P� I � C � V ð5Þ
a
0.0
0.5
1.0
1.5
2.0
2.5b c
0
2000
4000
6000
8000
10000
12000
14000
d
0.0
0.5
1.0
1.5
2.0
2.5e f
0
2000
4000
6000
8000
10000
12000
14000
g
LA
I (m
2 m-2
)
0.0
0.5
1.0
1.5
2.0
2.5h i
Bio
mas
s (k
g dm
ha-
1 )
0
2000
4000
6000
8000
10000
12000
14000
j
0.0
0.5
1.0
1.5
2.0
2.5k l
0
2000
4000
6000
8000
10000
12000
14000
m
0 20 40 60 80 1000.0
0.5
1.0
1.5
2.0
2.5
Observed LAI Simulated LAIObserved biomass Simulated biomass
n
Days after transplanting0 20 40 60 80 100
o
0 20 40 60 80 1000
2000
4000
6000
8000
10000
12000
14000
Fig. 3 Simulated (continuousand dotted lines) and observed
(triangular and round symbols)
leaf area index and biomass of
rice Basmati-385 at variable
plant densities and irrigation
levels, i.e., PD1 ? I1 (a),
PD2 ? I1 (b), PD3 ? I1 (c),
PD1 ? I2 (d), PD2 ? I2 (e),
PD3 ? I2 (f), PD1 ? I3 (g),
PD2 ? I3 (h), PD3 ? I3 (i),PD1 ? I4 (j), PD2 ? I4 (k),
PD3 ? I4 (l), PD1 ? I5 (m),
PD2 ? I5 (n) and PD3 ? I5
(o) under irrigated semiarid
conditions at Faisalabad,
Pakistan, for 2001 (see the
‘‘Materials and methods’’
section for the definition of the
individual treatment
combinations)
Irrig Sci (2013) 31:491–506 497
123
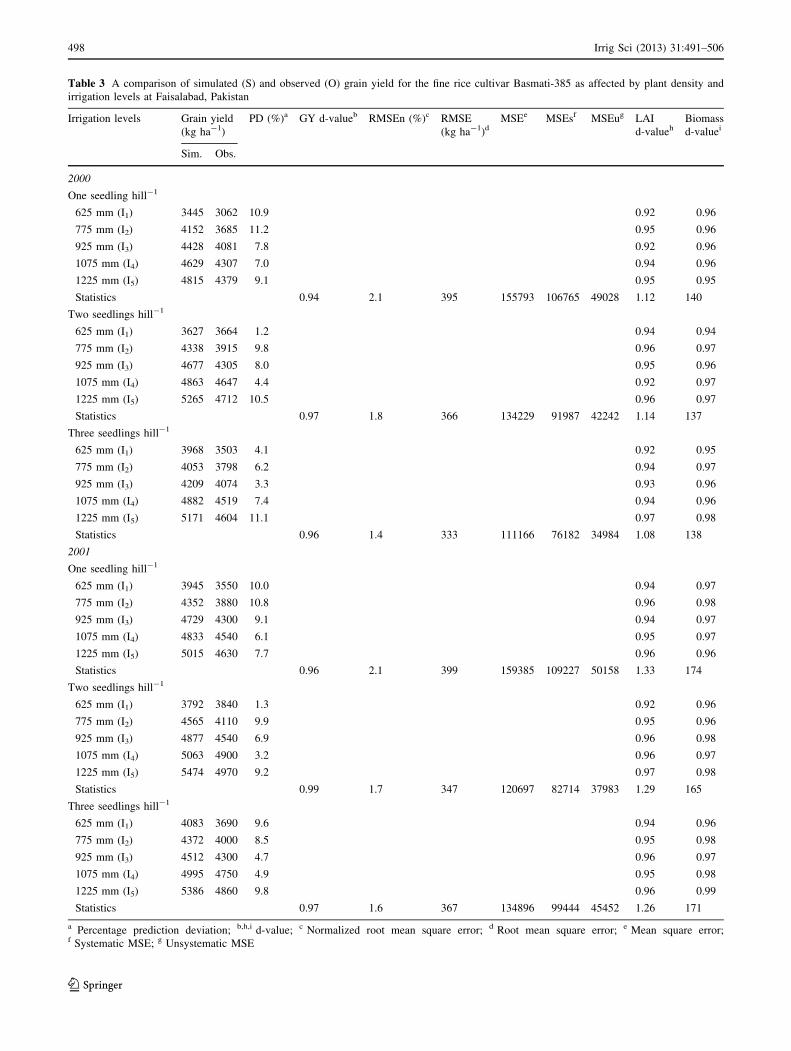
Table 3 A comparison of simulated (S) and observed (O) grain yield for the fine rice cultivar Basmati-385 as affected by plant density and
irrigation levels at Faisalabad, Pakistan
Irrigation levels Grain yield
(kg ha-1)
PD (%)a GY d-valueb RMSEn (%)c RMSE
(kg ha-1)dMSEe MSEsf MSEug LAI
d-valuehBiomass
d-valuei
Sim. Obs.
2000
One seedling hill-1
625 mm (I1) 3445 3062 10.9 0.92 0.96
775 mm (I2) 4152 3685 11.2 0.95 0.96
925 mm (I3) 4428 4081 7.8 0.92 0.96
1075 mm (I4) 4629 4307 7.0 0.94 0.96
1225 mm (I5) 4815 4379 9.1 0.95 0.95
Statistics 0.94 2.1 395 155793 106765 49028 1.12 140
Two seedlings hill-1
625 mm (I1) 3627 3664 1.2 0.94 0.94
775 mm (I2) 4338 3915 9.8 0.96 0.97
925 mm (I3) 4677 4305 8.0 0.95 0.96
1075 mm (I4) 4863 4647 4.4 0.92 0.97
1225 mm (I5) 5265 4712 10.5 0.96 0.97
Statistics 0.97 1.8 366 134229 91987 42242 1.14 137
Three seedlings hill-1
625 mm (I1) 3968 3503 4.1 0.92 0.95
775 mm (I2) 4053 3798 6.2 0.94 0.97
925 mm (I3) 4209 4074 3.3 0.93 0.96
1075 mm (I4) 4882 4519 7.4 0.94 0.96
1225 mm (I5) 5171 4604 11.1 0.97 0.98
Statistics 0.96 1.4 333 111166 76182 34984 1.08 138
2001
One seedling hill-1
625 mm (I1) 3945 3550 10.0 0.94 0.97
775 mm (I2) 4352 3880 10.8 0.96 0.98
925 mm (I3) 4729 4300 9.1 0.94 0.97
1075 mm (I4) 4833 4540 6.1 0.95 0.97
1225 mm (I5) 5015 4630 7.7 0.96 0.96
Statistics 0.96 2.1 399 159385 109227 50158 1.33 174
Two seedlings hill-1
625 mm (I1) 3792 3840 1.3 0.92 0.96
775 mm (I2) 4565 4110 9.9 0.95 0.96
925 mm (I3) 4877 4540 6.9 0.96 0.98
1075 mm (I4) 5063 4900 3.2 0.96 0.97
1225 mm (I5) 5474 4970 9.2 0.97 0.98
Statistics 0.99 1.7 347 120697 82714 37983 1.29 165
Three seedlings hill-1
625 mm (I1) 4083 3690 9.6 0.94 0.96
775 mm (I2) 4372 4000 8.5 0.95 0.98
925 mm (I3) 4512 4300 4.7 0.96 0.97
1075 mm (I4) 4995 4750 4.9 0.95 0.98
1225 mm (I5) 5386 4860 9.8 0.96 0.99
Statistics 0.97 1.6 367 134896 99444 45452 1.26 171
a Percentage prediction deviation; b,h,i d-value; c Normalized root mean square error; d Root mean square error; e Mean square error;f Systematic MSE; g Unsystematic MSE
498 Irrig Sci (2013) 31:491–506
123

, where Y is the simulated rice grain yield (kg ha-1), P is
the price of rice ($ t-1) (average for the past 3 years,
2007–2009), I is the irrigation application rate ($ applica-
tion-1) as per treatment, C is the cost of irrigation
($ mm-1), and V is the base production cost ($ ha-1) for
all treatments during 2009. The price (297 $ t-1), cost of
irrigation (0.47 $ mm-1), and base production cost
(275 $ ha-1) for rice was used in this study. The base
production cost for rice was obtained from the Department
of Agriculture Extension, Punjab, Pakistan (unpublished
data). The rice prices were obtained from the Economic
Survey of Pakistan, Finance Division (available online)
(GOP 2009).
Weather conditions for Faisalabad
The climate of the experimental site is semiarid with an
average annual maximum and minimum temperature of
31.2 and 17.2�C, respectively, and annual rainfall that
ranges from 400 to 800 mm. However, during the rice
growing season which lasts from May through October,
the average seasonal maximum and minimum air tem-
peratures are 37.1 and 24.3�C, respectively. Overall, 75%
of the annual precipitation occurs during the rice growing
season (GOP 2009). The monthly average solar radiation
during the rice growing season ranges from 20 to
24.5 MJ m-2 d-1. A summary of the weather data for the
two rice cropping seasons of 2000 and 2001 are presented
in Fig. 1.
Results and discussion
Model calibration and evaluation
The CSM-CERES-Rice model was calibrated with the data
obtained from the 2000 field experiment for the treatment
that consisted of a plant density of two seedlings hill-1 and
a nitrogen application of 200 kg N ha-1 as it had the best
performance. The cultivar coefficients for the rice cultivar
Basmati-385 were estimated through trial and error and a
comparison between model-simulated and experimental
data. The final values for the eight cultivar coefficients that
determine vegetative (P1, P2O, and P2R) and reproductive
(P5, G1, G2, G3, and G4) growth and development are
presented in Table 1. After the calibration of the cultivar
coefficients, the accuracy of the model was checked with
observed data for the remaining 14 treatments for 2000. As
part of the calibration and evaluation process, the simulated
data for anthesis date, maturity date, grain yield, and total
biomass were compared with the observed values. A close
agreement was obtained between observed and simulated
values for rice phenology. For 2000, the model predicted
the dates from transplanting to anthesis and transplanting to
maturity with a zero difference between observed and
simulated dates for cultivar Basmati-385 (Table 2). The
simulated and observed values were in good agreement for
LAI and total above-ground biomass at different pheno-
logical stages for the different combinations of plant den-
sity and nitrogen rates (Fig. 2). The average index of
agreement (d-value) across all treatments for LAI was 0.95,
while the RMSE was 1.12 m2 m-2 (Table 2). The d-value
for above-ground biomass was 0.97, while the RMSE was
365 kg ha-1 (Table 2). The experimental data collected in
2001 were used for independent model evaluation. For
2001, the model predicted flowering 1 day late, while the
simulated maturity date was predicted on the same date as
the observed maturity. The d-value for LAI was 0.96 and
for top weight was 0.98, slightly better than the statistics
for the calibration, while the RMSE values were 1.29
1.12 m2 m-2 for LAI and 385 kg ha-1 for top weight,
slightly higher than the statistics for the calibration. The
lower values for RMSE and higher d-values close to 1
reflected that the model predicted LAI and above-ground
biomass quite well. The regression line between simulated
and observed grain yield had a value of 0.97 for R2 for the
15 treatment combinations of plant density and irrigation
rates (Fig. 4), showing the ability of model to simulate rice
growth and development in response to different irrigation
levels for a semiarid environment.
The simulated and observed values for the individual
treatments were in good agreement for LAI and total
above-ground biomass at different growth stages for the
different combinations of plant density and irrigation levels
Sim
ulat
ed r
ice
grai
n yi
eld
(kg
ha-1
)
3000
3500
4000
4500
5000
5500
6000
2000 2001
Observed rice grain yield (kg ha-1)
500035003000 000600540004 5500
Fig. 4 Observed and simulated rice grain yields for the fine rice
cultivar-385 at Faisalabad, Pakistan, during 2000 and 2001
Irrig Sci (2013) 31:491–506 499
123
for 2000 and 2001 (Figs. 2, 3). The d-value for LAI ranged
from 0.92 to 0.97 for both years, while RMSE ranged from
1.08 to 1.14 m2 m-2 for 2000 and from 1.26 to
1.33 m2 m-2 for 2001 (Table 3). The d-value for above-
ground biomass ranged from 0.94 to 0.98 for 2000 and
from 0.96 to 0.99 for 2001, while the RMSE ranged from
a-One seedling hill-1
3000
3500
4000
4500
5000
5500
c-Two seedlings hill-1
Sim
ulat
ed a
nd o
bser
ved
rice
gra
in y
ield
(kg
ha-1
)
3000
3500
4000
4500
5000
5500
e-Three seedlings hill-1
Irrigation regimes (mm)
3000
3500
4000
4500
5000
5500
b- One seedling hill-1
d-Two seedlings hill-1
f-Three seedlings hill-1
800 1000 1200 1400 1600
Observed 2000 and 2001Simulated 2000 and 2001
Observed 2000 and 2001Simulated 2000 and 2001
Observed 2000 and 2001Simulated 2000 and 2001
800 1000 1200 1400 1600
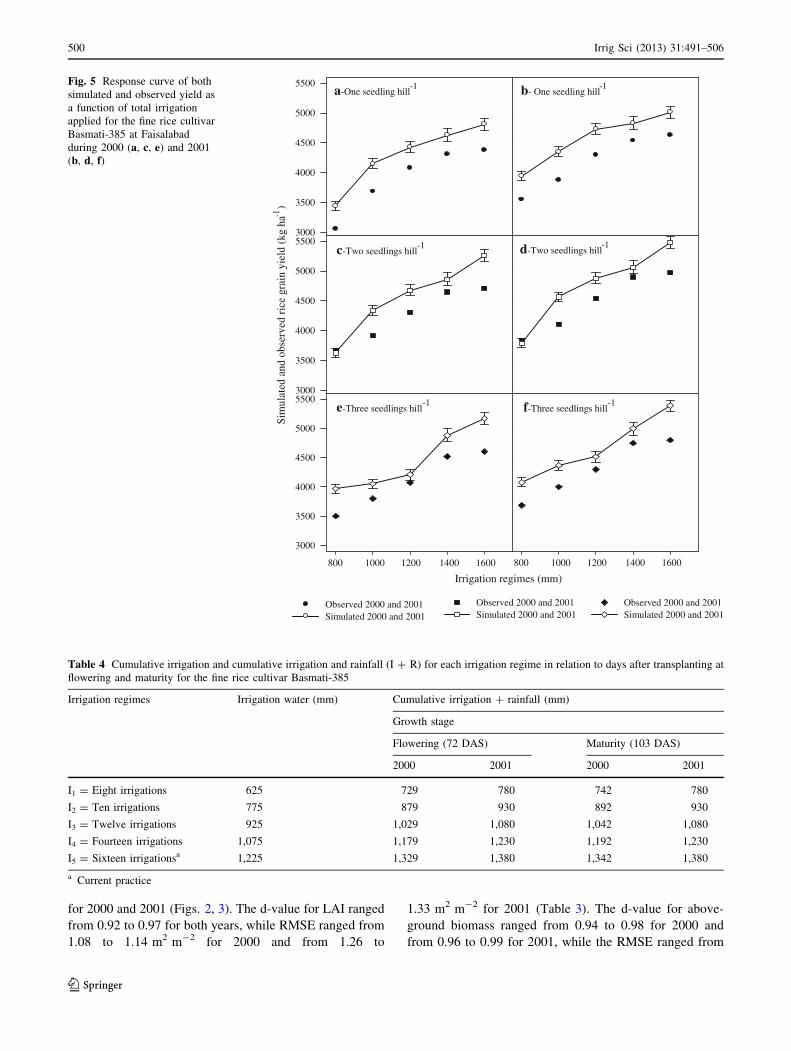
Fig. 5 Response curve of both
simulated and observed yield as
a function of total irrigation
applied for the fine rice cultivar
Basmati-385 at Faisalabad
during 2000 (a, c, e) and 2001
(b, d, f)
Table 4 Cumulative irrigation and cumulative irrigation and rainfall (I ? R) for each irrigation regime in relation to days after transplanting at
flowering and maturity for the fine rice cultivar Basmati-385
Irrigation regimes Irrigation water (mm) Cumulative irrigation ? rainfall (mm)
Growth stage
Flowering (72 DAS) Maturity (103 DAS)
2000 2001 2000 2001
I1 = Eight irrigations 625 729 780 742 780
I2 = Ten irrigations 775 879 930 892 930
I3 = Twelve irrigations 925 1,029 1,080 1,042 1,080
I4 = Fourteen irrigations 1,075 1,179 1,230 1,192 1,230
I5 = Sixteen irrigationsa 1,225 1,329 1,380 1,342 1,380
a Current practice
500 Irrig Sci (2013) 31:491–506
123

137 to 140 kg ha-1 for 2000 and from 165 to 174 kg ha-1
for 2001 (Table 3). The lower values of RMSE and higher
d-values close to 1 reflected that the model predicted both
LAI and above-ground biomass fairly accurately. At final
harvest, the simulated values were also in good agreement
with the observed values, and the differences for above-
ground biomass ranged from 1.56 to 15% for 2000 and
2001. The RMSE for grain yield at final harvest ranged
from 333 to 395 kg ha-1 for 2000 and from 347 to
399 kg ha-1 for 2001 (Table 3). The normalized RMSE
varied from 1.4 to 2.1% for 2000 and from 1.6 to 2.1% for
2001, while the d-value ranged from 0.94 to 0.97 for 2000
and 0.96 to 0.99 for 2001 (Table 3). The simulated yield
values were within 11% of observed values. The slight
disparities between observed and simulated values may
have been due to factors other than those considered by the
model, including weeds, diseases, and pests. However,
there differences were not significant and the model was
able to successfully simulate grain yield during both
growing seasons. The regression line between simulated
and observed grain yield had high values for r2 for 2000,
e.g., 0.97 and for 2001, e.g., 0.95, for the 15 treatment
combinations of plant density and irrigation regimes
(Fig. 4). This demonstrated that the model was able to
simulate rice growth, development, and yield under irri-
gated conditions for a semiarid environment quite
0 020 2040 4060 6080 80 100100
a
0200
400
600
800
1000
1200
1400
c
0200
400
600
800
1000
1200
1400
e
Sim
ulat
ed E
T a
nd c
umul
ativ
e ir
riga
tion
+ p
reci
pita
tion
0200
400
600
800
1000
1200
1400
g
0200
400
600
800
1000
12001400
i
0
200
400
600
800
1000
1200
1400
b
d
f
h
j
Days after transplanting
Cummulative irrigation + precipitationSimulated ET
Fig. 6 Cumulative simulated evapotranspiration (ET) and cumulative irrigation plus rain as a function of days after transplanting for irrigation
regimes, i.e., I1 (a), I2 (c), I3 (e), I4 (g) and I5 (i) for 2000 and I1 (b), I2 (d), I3 (f), I4 (h) and I5 (j) for 2001
Irrig Sci (2013) 31:491–506 501
123
accurately. The response curve for yield as a function of
the amount of water applied for irrigation showed a very
similar response for both the measured and simulated
values for both years. It increased linearly with the increase
in the amount of water that was applied (Fig. 5). The water
deficit trend was recorded in the order of the I5 treatments
having the highest water stress followed by I4, I3, I2 and I1,
resulting in a simulated yield decrease from 5171 to
3445 kg ha-1 for 2000 and from 5386 to 3945 kg ha-1 for
2001(Fig. 5). The year 2001 was comparatively wetter than
2000 in terms of total amount of rainfall as total precipi-
tation during years 2000 and 2001 was 117 and 165 mm,
respectively. However, during both years, rainfall was
concentrated only during the vegetative phase of the rice
crop. In 2000, total precipitation was 64, 25 and 28 mm
during the months of July, August and September,
respectively, while in 2001, the amount of rainfall was 108
and 57 mm during the months of July and August, with no
rain in September. The daily global solar radiation ranged
from 7.2 to 28.4 MJ m-2 during vegetative phase and 13.1
to 23.8 MJ m-2 during reproductive phase in 2000, and
respective values for respective phases in 2001 were 7.4 to
30.7 MJ m-2 and 15.3 to 22.1 MJ m-2. However, the
mean daily solar radiation was 21.4 and 21.1 MJ m-2
during years 2000 and 2001, respectively. Cumulative
irrigation and cumulative irrigation ? rainfall (I ? R) for
each irrigation regime in relation to days after transplanting
with key growth stages of flowering and maturity are
presented in Table 4. Cumulative simulated evapotranspi-
ration (ET) and cumulative irrigation ? rainfall against
days after transplanting for years 2000 and 2001 are pre-
sented in Fig. 6, showing the differences between irrigation
treatments and years.
Model application
An analysis to identify the optimum combination of plant
density and irrigation regime for rice production under
irrigated conditions for a semiarid environment in Pakistan
using a systems analysis approach was conducted. The
CSM-CERES-Rice model was used to simulate grain yield
for 68 different scenarios, including combinations of four
plant densities and 17 irrigation regimes for irrigated
conditions for a semiarid environment for 35 years using
One seedling hill-1
0
1000
2000
3000
4000
5000
6000
7000 Two seedlings hill-1
Four seedlings hill-1
Irrigation regimes (mm)
0 200 400 600 800 1000 1200 1400 1600
Three seedlings hill-1
Sim
ulat
ed r
ice
grai
n yi
eld
(kg
ha-1
)
0
1000
2000
3000
4000
5000
6000
7000
0 200 400 600 800 1000 1200 1400 1600
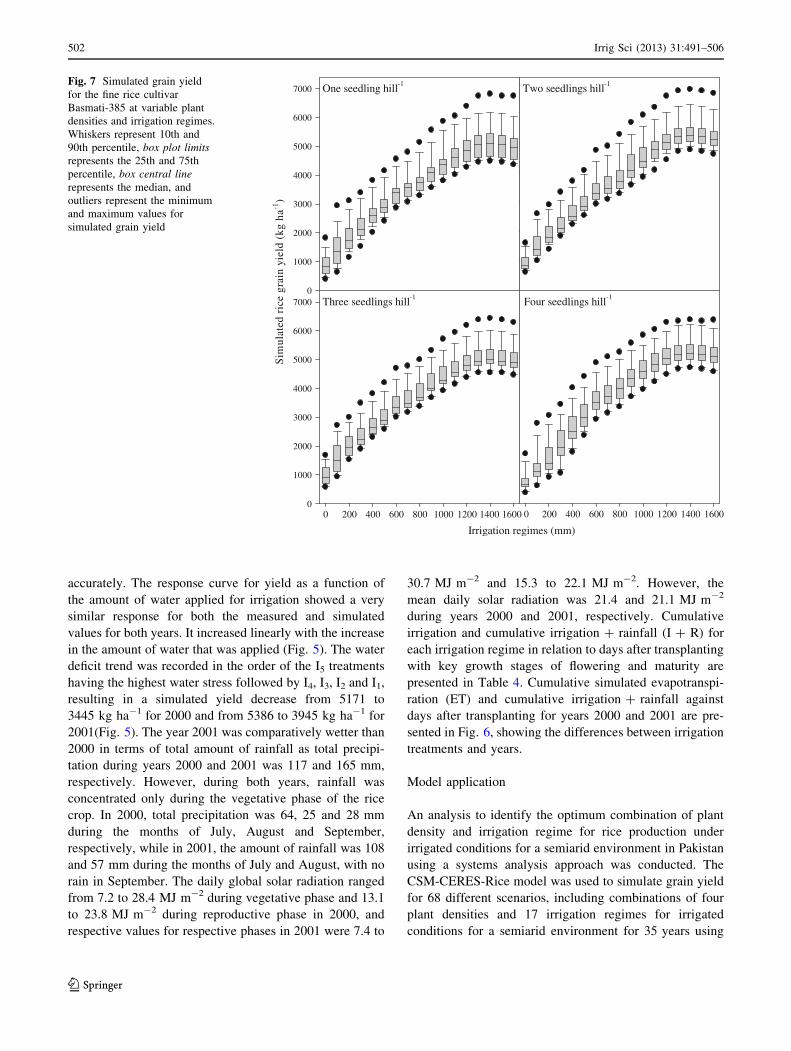
Fig. 7 Simulated grain yield
for the fine rice cultivar
Basmati-385 at variable plant
densities and irrigation regimes.
Whiskers represent 10th and
90th percentile, box plot limitsrepresents the 25th and 75th
percentile, box central linerepresents the median, and
outliers represent the minimum
and maximum values for
simulated grain yield
502 Irrig Sci (2013) 31:491–506
123

historical daily weather data from 1974 to 2008. The plant
densities ranged from one seedling hill-1 to four seedlings
hill-1 and the 17 irrigation regimes ranging from 0 to
1600 mm. The irrigation regimes consisted of different
irrigation applications, ranging from no irrigation (0) to 16
irrigations (16) at weekly intervals. For each irrigation
application, the same amount of water was applied, which
was 100 mm. The main goal was to determine whether
irrigation applications could be eliminated, especially
during the end of the growing season within the current
limitations of the Warabandi system. The simulated rice
yield for the 68 scenarios ranged from 392 to
6821 kg ha-1, showing the range for the lowest of the
lowest and highest of the highest simulated yield. The
simulated rice grain yield for all 68 scenarios is depicted in
Fig. 7, showing the minimum, 10th, 25th percentile,
median, 75th, 90th percentile, and maximum values. The
highest median grain yield was obtained for a plant density
of two seedlings hill-1 and an irrigation regime of
1300 mm with a variation (standard deviation; S.D.) of
1233 kg ha-1. The treatment having interaction of plant
density of two seedlings hill-1 and 1225 mm is now gen-
erally recommended by the local extension department for
rice production for the Faisalabad district. For this treat-
ment, the range of the yield around the median for this
treatment was also smaller than for all other scenarios.
The simulated irrigation water productivity for 68 scenar-
ios that were simulated ranged from 0.25 to 1.17 kg m-3,
showing the range for the lowest of the lowest and highest of
the highest simulated water productivity. The simulated water
productivity for rice for all 68 scenarios is depicted in Fig. 8,
showing the minimum, 10th, 25th percentile, median, 75th,
90th percentile, and maximum values. The highest median
water productivity was obtained for a plant density of two
seedlings hill-1 and an irrigation regime of 1300 mm with a
variation (Standard Deviation; S.D.) of 0.12 kg m-3. The
trends of our study are in line with another study that applied
the ORYZA model (Arora 2006); this study showed that the
mean water-input-based and ET-based productivities ranged
from 0.32 to 1.01 kg m-3 for an irrigated semiarid subtropical
environment in India. Our simulated water productivity for
simulated scenarios values was also similar to the measured
values of water productivity for rice that have been reported
for different countries in south Asia, including 0.39 to
0.64 kg m-3 for Bangladesh (Rashid et al. 2009) and 0.20 to
0.91 kg m-3 for Japan (Kato et al. 2009).
a-One seedling hill-1
Wat
er p
rodu
ctiv
ity
(kg
m-3
)0.2
0.4
0.6
0.8
1.0
1.2
1.4b-Two seedlings hill-1
d-Four seedlings hill-1
0 200 400 600 800 1000 1200 1400 1600
c-Three seedlings hill-1
Irrigation regimes (mm)0 200 400 600 800 1000 1200 1400 1600
0.2
0.4
0.6
0.8
1.0
1.2
1.4
Fig. 8 Simulated water
productivity for the fine rice
cultivar Basmati-385 at variable
plant density and irrigation
regimes. Whiskers represent the
10th and 90th percentile, boxlimits represent the 25th and
75th percentiles, box centralline represents the median, and
outliers represent the minimum
and maximum values for
simulated water productivity
Irrig Sci (2013) 31:491–506 503
123

The monetary return ranged from -483 to 2260 $ ha-1
for the minimum of the lowest and the maximum of the
highest return of simulated scenarios that were simulated.
The monetary return for the 68 scenarios is presented in
Fig. 9. The treatment combination that included two
seedlings hill-1 and an irrigation regime of 1300 mm
showed to be dominant based on the Mean-Gini Domi-
nance Analysis (Buccola and Subaei 1984; Fawcett and
Thornton 1989) among the scenarios that were simulated.
However, the median of these simulated scenarios was very
similar because the difference of the irrigation amount was
only 100 mm among the consecutive scenarios. The min-
imum, 10th, 25th, median, 75th, 90th, and maximum
monetary return ha-1 for this dominant treatment combi-
nation were -12, 297, 844, 1175, 1601, 2027, and 2235 $
ha-1, respectively. The monetary return increased with the
increase in the number of irrigations up to 14 and after that
decreases with the increase in the number of irrigations.
However, the minimum monetary return also remained
negative for first nine irrigation scenarios ranging from
zero (no irrigation) to eight irrigation applications. The
application of system analysis that combines both experi-
mental field research and crop modeling to determine the
most advantageous farming practices for different envi-
ronments has become common. For instance, Sarkar and
Kar (2006) used the CSM-CERES-Rice model to deter-
mine the optimum nitrogen application rates for rice in
India. Arora (2006) used the ORYZA2000 model to
determine the optimum combination of puddling intensities
and irrigation regimes for rice in India.
Conclusions
The model evaluation showed a good agreement for sim-
ulated development and growth parameters for the rice
cultivar Basmati-385 with their respective observed data
obtained from two field experiments having treatment
combinations of irrigation regimes and plant density for
irrigated rice conducted in Faisalabad, Pakistan. This study
illustrated the potential for the application of a decision
support system and crop simulation model to determine
One seedling hill-1
Mon
etar
y re
turn
s ($
ha-1
)
-500
0
500
1000
1500
2000
Two seedlings hill-1
Four seedlings hill-1
Irrigation regimes (mm)0 200 400 600 800 1000 1200 1400 1600
Three seedlings hill-1
-500
0
500
1000
1500
2000
0 200 400 600 800 1000 1200 1400 1600
Fig. 9 Monetary return
($ ha-1) percentile for rice
Basmati-385 at variable plant
density and irrigation regimes.
Whiskers represent 10th and
90th percentile, box plot limitsrepresents the 25th and 75th
percentile, box central linerepresents the median, and
outliers represent the minimum
and maximum values for
monetary returns
504 Irrig Sci (2013) 31:491–506
123

suitable management strategies for rice production in the
Faisalabad district of the Punjab Province of Pakistan.
Although the current Warabandi system for irrigation
management has a lot of limitations with respect to when
and how much water a farmer can apply, this study showed
that there is potential to reduce the number of irrigation
applications, especially toward the end of the growing
season when the crop requires less water. However, further
evaluation of these recommended practices is needed under
field conditions. Based on the results from this study, it can
be concluded that the CSM-CERES-Rice model could
potentially be used as a decision aid to provide alternate
and integrated management options to resource-poor
farmers who grow irrigated rice under semiarid conditions
in different arid or semiarid regions across the world.
Acknowledgments The research was supported in part by the Post
Doctorate Fellowship Program of the Higher Education Commission
(HEC), Islamabad, Pakistan, for the first author of this paper. The
author also appreciates the approval of study leave by the adminis-
tration of Bahauddin Zakariya University (BZU), Multan, Pakistan.
References
Ahmad S, Hussain A, Ali H, Ashfaq A (2005a) Transplanted fine rice
(Oryza sativa L.) productivity as affected by plant density and
irrigation regimes. Intl J Agric Biol 7:445–447
Ahmad S, Hussain A, Ali H, Ahmad A (2005b) Grain yield of
transplanted rice (Oryza sativa L.) as influenced by plant density
and nitrogen fertilization. J Agric Soc Sci 1:212–215
Ahmad S, Zia-ul-Haq M, Ali H, Shad SA, Ahmad A, Maqsood M,
Khan MB, Mehmood S, Hussain A (2008) Water and radiation
use efficiencies of transplanted rice (Oryza sativa L.) at different
plant density and irrigation regimes under semi-arid environ-
ment. Pak J Bot 40:199–209
Ahmad S, Ahmad A, Zia-ul-Haq M, Ali H, Khaliq T, Anjum MA,
Khan MA, Hussain A, Hoogenboom G (2009a) Resources use
efficiency of field grown transplanted rice (Oryza sativa L.)
under irrigated semiarid environment. J Food Agric Environ
7:487–492
Ahmad S, Zia-ul-Haq M, Ali H, Ahmad A, Khan MA, Khaliq T,
Husnain Z, Hussain A, Hoogenboom G (2009b) Morphological
and quality parameters of Oryza sativa L. as affected by
population dynamics, nitrogen fertilization and irrigation
regimes. Pak J Bot 41:1259–1269
Ahmad S, Ahmad A, Soler CMT, Ali H, Zia-ul-Haq M, Anothai J,
Hussain A, Hoogenboom G, Hasanuzzaman M (2011) Applica-
tion of the CSM-CERES-rice model for evaluation of plant
density and nitrogen management of fine transplanted rice for an
irrigated semiarid environment. Precision Agric. doi:10.1007/
s11119-011-9238-1
Arora VK (2006) Application of a rice growth and water balance
model in an irrigated semi-arid subtropical environment. Agric
Water Manage 83:51–57
Banterng P, Hoogenboom G, Patannothai A, Singh P, Wani SP,
Pathak P, Tongpoonpol S, Atichart S, Srihaban P, Bur-
anaviriyakul S, Jintrawet A, Nguyen TC (2010) Application of
the cropping system model (CSM)-CROPGRO-Soybean for
determining optimum management strategies for soybean in
tropical environments. J Agron Crop Sci 196:231–242
Barker R, Dawe D, Tuong TP, Bhuiyan SI, Guerra LC (1999) The
outlook for water resources in the year 2020: challenges for
research on water management in rice production. In: Assess-
ment and orientation towards the 21st century. Proceedings of
19th session of the international rice commissions, Food,
Agriculture Organization, Cairo, Egypt, 7–9 September 1998,
pp 96–109
Borell A, Garside A, Shu FK (1997) Improving efficiency of water for
irrigated rice in a semi-arid tropical environment. Field Crops
Res 52:231–248
Bouman BAM, Tuong TP (2001) Field water management to save
water and increase its productivity in irrigated rice. Agric Water
Manage 49:11–30
Bouman BAM, Shaobing P, Xiaoguang Y, Huaqi W (2002) Aerobic
rice: challenges and opportunities: the price of water-reducing
water requirements in rice production through aerobic system.
In: Paper presented at the international rice congress on
innovation, impact, and livelihood, International Rice Research
Institute, Beijing, September 16–20 (abstract pp 88)
Buccola ST, Subaei A (1984) Mean-Gini analysis, stochastic
efficiency and weak risk aversion. Aust J Agric Econ 28:77–86
Cabangon RJ, Tuong TP, Castillo EG, Bao LX, Lu G, Wang GH, Cui
L, Bouman BAM, Li Y, Chen C, Wang J (2004) Effect of
irrigation method and N-fertilizer management on rice yield,
water productivity and nutrient-use efficiencies in typical
lowland rice conditions in China. Paddy Water Environ
2:195–206
Cheyglinted S, Ranamukhaarachchi SL, Singh G (2001) Assessment
of the CERES-Rice model for rice production in the Central
Plain of Thailand. J Agric Sci 137:289–298
Choudhary MR (2008) A text book of irrigation and drainage:
practices for agriculture, study aid foundation for excellence
(SAFE). Islamabad, Pakistan, pp 32–35
Fawcett RH, Thornton PK (1989) Mean-Gini dominance in decision
analysis. IMA J Math Appl Bus Ind 2:309–317
Feng L, Bouman BAM, Toung TP, Cabangon RJ, Li Y, Lu G, Feng Y
(2007) Exploring options to grow rice using less water in
northern China using a modeling approach I. Field experiments
and model evaluation. Agric Water Manage 88:1–13
Geng S, Zhou Y, Zhang M, Smallwood SK (2001) A sustainable agro-
ecological solution to water shortage in the North China Plain
(Huabei Plain). J Environ Manage 44:345–355
Godwin DC, Singh U (1998) Nitrogen balance and crop response to
nitrogen in upland and lowland cropping systems. In: Tsuji GY,
Hoogenboom G, Thornton PK (eds) Understanding options for
agricultural production. Kluwer Academic, Dordrecht, pp 55–78
GOP (Government of Pakistan) (2007) Economic survey of Pakistan
2006–2007. Finance Division, Economic Advisory Wing,
Finance Division, Government of Pakistan, pp 15–33
GOP (Government of Pakistan) (2008) Economic survey of Pakistan
2007–2008. Economic Advisory Wing, Finance Division, Gov-
ernment of Pakistan, pp 17–36
GOP (Government of Pakistan) (2009) Economic survey of Pakistan
2008–2009. Economic Advisory Wing, Finance Division, Gov-
ernment of Pakistan, pp 17–37
Gungula DT, Kling JG, Togun AO (2003) CERES-maize predictions
of maize phenology under nitrogen-stressed conditions in
Nigeria. Agron J 95:892–899
Hoogenboom G, Jones JW, Wilkens PW, Porter CH, Boote KJ, Hunt
LA, Singh U, Lizaso JL, White JW, Uryasev O, Royce FS,
Ogoshi R, Gijsman AJ, Tsuji GY (2010) Decision support
system for agrotechnology transfer version 4.5 [CD-ROM].
University of Hawaii, Honolulu, Hawaii
IWMI (International Water Management Institute) (2000) IWMI:
global water scarcity study. International Water Management
Institute Colombo, Sri Lanka
Irrig Sci (2013) 31:491–506 505
123
Jintrawet A (1995) A decision support system for rapid assessment of
lowland rice-based cropping alternatives in Thailand. Agric Syst
47:245–258
Jones JW, Hoogenboom G, Porter CH, Boote KJ, Batchelor WD,
Hunt LA, Wilkens PW, Singh U, Gijsman AJ, Ritchie JT (2003)
The DSSAT cropping system model. Eur J Agron 18:235–265
Kato Y, Okami M, Katsura K (2009) Yield potential and water use
efficiency of aerobic rice (Oryza sativa L.) in Japan. Field Crops
Res 113:328–334
Kropff MJ, Bouma J, Jones JW (2001) Systems approaches for the
design of sustainable agro-ecosystems. Agric Syst 70:369–393
Kumar R, Sharma HL (2004) Simulation and validation of CERES-
rice (DSSAT) model in north-western Himalayas. Indian J Agric
Sci 74:133–137
Kunimitsu Y (2009) Measuring the implicit value of paddy irrigation
water: application of RPML model to the contingent choice
experiment data in Japan. Paddy Water Environ 7:177–185
Li Y (2001) Research and practice of water saving irrigation for rice
in China. In: Barker R, Loeve R, Li Y, Tuong TP (eds)
Proceedings of the international workshop on water-saving
irrigation for rice, March 23–25, Wuhan, China. International
Water Management Institute, Colombo, Sri Lanka, pp 135–144
Lin S, Dittert K, Sattelmacher B (2002) The Ground Cover Rice
Production Systems (GCRPS)—a successful new approach to
save water and increase nitrogen fertilizer efficiency? In:
Bouman BAM, Hengsdijk H, Hardy B, Bindraban PS, Tuong
TP, Ladha JK (eds) Water-wise rice production, 8–11 April
2002, LosBanos, Philippines. International Rice Research Insti-
tute, Los Banos, Philippines, pp 187–196
Normile D (2008) Reinventing rice to feed the world. Science
321:330–333
Peng S, Bouman B, Visperas RM, Castaneda A, Nie L, Park H (2006)
Comparison between aerobic and flooded rice in the tropics:
agronomic performance in an eight-season experiment. Field
Crops Res 96:252–259
Rashid MH, Alam MM, Khan MAH, Ladha JK (2009) Productivity
and resource use of direct-(drum)-seeded and transplanted rice in
puddled soils in rice–rice and rice–wheat ecosystems. Field
Crops Res 113:274–281
Ritchie JT (1998) Soil water balance and plant stress. In: Tsuji GY,
Hoogenboom G, Thornton PK (eds) Understanding options for
agricultural production. Kluwer Academic, Dordrecht, pp 41–54
Ritchie JT, Singh U, Godwin DC, Bowen WT (1998) Cereal growth,
development and yield. In: Tsuji GY, Hoogenboom G, Thornton
PK (eds) Understanding options for agricultural production.
Kluwer Academic, Dordrecht, pp 79–98
Ritchie JT, Porter CH, Judge J, Jones JW, Suleiman AA (2009)
Extension of an existing model for soil water evaporation and
redistribution under high water content conditions. Soil Sci Soc
Am J 73:792–801
Sarkar R, Kar S (2006) Evaluation of management strategies for
sustainable rice-wheat cropping system, using DSSAT seasonal
analysis. J Agric Sci 144:421–434
Soler CMT, Hoogenboom G, Sentelhas PC, Duarte AP (2007a)
Growth analysis of maize grown off-season in a subtropical
environment under rainfed and irrigated conditions. J Agron
Crop Sci 193:247–261
Soler CMT, Sentelhas PC, Hoogenboom G (2007b) Application of the
CSM-CERES-Maize model for planting date evaluation and
yield forecasting for maize grown off-season in a subtropical
environment. Eur J Agron 27:165–177
Soundharajan B, Sudheer KP (2009) Deficit irrigation management
for rice using crop growth simulation model in an optimization
framework. Paddy Water Environ 7:135–149
St’astna M, Trnka M, Kren J, Dubrovsky M, Zalud Z (2002)
Evaluation of the CERES models in different production regions
of the Czech Republic. Rostlina Vyroba 48:125–132
Tabbal DF, Bouman BAM, Bhuiyan SI, Sibayan EB, Sattar MA
(2002) On-farm strategies for reducing water input in irrigated
rice; case studies in the Philippines. Agric Water Manage
56:93–112
Thornton PK, Hoogenboom G (1994) A computer program to analyze
single-season crop model outputs. Agron J 86:860–868
Thornton PK, Hoogenboom G, Wilkens PW, Bowen WT (1995) A
computer program to analyze multiple-season crop model
outputs. Agron J 87:131–136
Thornton PK, Hoogenboom G, Wilkens PW, Jones JW (1998)
Seasonal analysis. In: Tsuji GY, Uehara G, Balas S (eds) DSSAT
version 3, vol 3–2. University of Hawaii, Honolulu, pp 1–65
Timsina J, Connor DJ (2001) Productivity and management of rice-
wheat cropping systems: issues and challenges. Field Crops Res
69:93–132
Timsina J, Humphreys E (2006) Performance of CERES-rice and
CERES-wheat models in rice-wheat systems: a review. Agric
Sys 90:5–31
Tsuji GY, Jones JW, Hoogenboom G, Hunt LA, Thornton PK (1994)
Introduction. In: Tsuji G, Uehara Y, Balas GS (eds) DSSAT v3,
Decision support system for agrotechnology transfer, vol 1.
University of Hawaii, Honolulu, p 284
Tsuji GY, Hoogenboom G, Thornton PK (1998) Understanding
options for agricultural production. Systems approaches for
sustainable agricultural development. Kluwer Academic Pub-
lishers, Dordrecht
Tuong TP, Bouman BAM (2003) Rice production in water-scarce
environments. In: Proceedings of water productivity workshop,
12–14 November 2001, Colombo, Sri Lanka. International
Water Management Institute, Colombo, Sri Lanka
Tuong TP, Bouman BAM, Mortimer M (2005) More rice, less water-
integrated approaches for increasing water productivity in
irrigated rice-based systems in Asia. Plant Prod Sci 8:231–241
Wallach D, Goffinet B (1987) Mean squared error of prediction in
models for studying ecological and agronomic systems. Biomet-
rics 43:561–573
Willmott CJ (1982) Some comments on the evaluation of model
performance. Bull Am Meteorol Soc 63:1309–1313
Willmott CJ, Akleson GS, Davis RE, Feddema JJ, Klink KM, Legates
DR, Odonnell J, Rowe CM (1985) Statistics for the evaluation
and comparison of models. J Geophys Res 90:8995–9005
Yang X, Bouman BAM, Wang H, Wang Z, Zhao J, Chen B (2005)
Performance of temperate aerobic rice under different water
regimes in North China. Agric Water Manage 74:107–122
Zeigler RS, Puckridge DW (1995) Improving sustainable productivity
in rice based rainfed lowland systems of South and South-East
Asia. GeoJournal 35:307–324
Zwart SJ, Bastiaanssen WGM (2004) Review of measured crop water
productivity values for irrigated wheat, rice, cotton and maize.
Agric Water Manage 69:115–133
506 Irrig Sci (2013) 31:491–506
123