Application of Statistical Mechanics to Analysis Of ...
12
Application of Statistical Mechanics to Analysis Of Degradation of Aggregates F. MOA VENZADEH and W. H. GOETZ Respectively, Assistant Professor, Department of Civil Engineering, The Ohio State University, and Professor of Highway Engineering and Research Engineer, Joint Highway Research Project, Purdue University The problems encountered in the formulation of a theory of degra- dation of aggregates are indicated and a general equation based on principles of statistical mechanics is developed. The equation is based on the assumption that in a heterogeneous mass (such as ag- gregate) cracks, flaws and planes of weakness are normally dis- tributed in each fraction. This equation relates the reduction in size to the original size and surface energy of the aggregate and explains the limitations of existing comminution hypotheses such as those of Rittinger, Kick and Bond. The experimental results obtainedfrom the compaction of one- sized and combinations of different sizes of aggregate in a gyratory machine show that the kind of aggregate, gradation, maximum size, presence or absence of asphalt, and degree of compaction do not affect the pattern of degradation of each fraction. It is found that these variables will only alter the magnitude of the breakage energy received by e~ch fraction during the compaction process. •ONE OF the important objectives of highway engineering is the prediction of the per- formance of highway materials during construction and the life of the highway. Aggre- gate is one of the most commonly usedroad-buildingmaterials. A review of the litera- ture concerning aggregate qualities shows that many methods have been used to deter- mine the suitability of aggregates for road-building purposes. This can be traced as far back as 1819 when John MacAdam stated that the workmen determined the proper size of stone by measuring them with their fists (1). Testing of road materials, including aggregates, started in the United States about 1890 (2) and has developed steadily since that time. Much work has been done to re- late the results of mechanical tests on road stones to the life and performance of the . roads in which they were used as aggregates (3). In bituminous roads, forces due to traffic tend to cause degradation. Macnaughton (4) states that one of the features which has to be considered in the design of bituminous mixtures is the matter of degradation of aggregates during the process of compaction. He further states that this degradation is due to considerable pressure developed at points of contact between particles and to continual shifting and rearrangement of par- ticles as they gradually attempt to occupy the least possible space. Workers in the Road Research Laboratory of England (5) have substantiated the orientation of particles in bituminous roads by stating, "The orientation of the aggregate in a section of road carpet is largely determined by the boundaries. In the carpet most of the aggregate particles are arranged with their long axis horizontal." Increase of pressure and re- orientation of particles produce a grinding effect that tends to round off corners and Paper sponsored by Committee on Characteristics of Aggregates and Fillers for Bituminous Construction. ll2
-
Upload
khangminh22 -
Category
Documents
-
view
3 -
download
0
Transcript of Application of Statistical Mechanics to Analysis Of ...

Application of Statistical Mechanics to Analysis Of Degradation of Aggregates F. MOA VENZADEH and W. H. GOETZ
Respectively, Assistant Professor, Department of Civil Engineering, The Ohio State University, and Professor of Highway Engineering and Research Engineer, Joint Highway Research Project, Purdue University
The problems encountered in the formulation of a theory of degradation of aggregates are indicated and a general equation based on principles of statistical mechanics is developed. The equation is based on the assumption that in a heterogeneous mass (such as aggregate) cracks, flaws and planes of weakness are normally distributed in each fraction. This equation relates the reduction in size to the original size and surface energy of the aggregate and explains the limitations of existing comminution hypotheses such as those of Rittinger, Kick and Bond.
The experimental results obtainedfrom the compaction of onesized and combinations of different sizes of aggregate in a gyratory machine show that the kind of aggregate, gradation, maximum size, presence or absence of asphalt, and degree of compaction do not affect the pattern of degradation of each fraction. It is found that these variables will only alter the magnitude of the breakage energy received by e~ch fraction during the compaction process.
•ONE OF the important objectives of highway engineering is the prediction of the performance of highway materials during construction and the life of the highway. Aggregate is one of the most commonly usedroad-buildingmaterials. A review of the literature concerning aggregate qualities shows that many methods have been used to determine the suitability of aggregates for road-building purposes. This can be traced as far back as 1819 when John MacAdam stated that the workmen determined the proper size of stone by measuring them with their fists (1).
Testing of road materials, including aggregates, started in the United States about 1890 (2) and has developed steadily since that time. Much work has been done to relate the results of mechanical tests on road stones to the life and performance of the . roads in which they were used as aggregates (3).
In bituminous roads, forces due to traffic tend to cause degradation. Macnaughton (4) states that one of the features which has to be considered in the design of bituminous mixtures is the matter of degradation of aggregates during the process of compaction. He further states that this degradation is due to considerable pressure developed at points of contact between particles and to continual shifting and rearrangement of particles as they gradually attempt to occupy the least possible space. Workers in the Road Research Laboratory of England (5) have substantiated the orientation of particles in bituminous roads by stating, "The orientation of the aggregate in a section of road carpet is largely determined by the boundaries. In the carpet most of the aggregate particles are arranged with their long axis horizontal." Increase of pressure and reorientation of particles produce a grinding effect that tends to round off corners and
Paper sponsored by Committee on Characteristics of Aggregates and Fillers for Bituminous Construction.
ll2

113
edges, thus permitting the particles to fit more closely together. This process may proceed so far that aggregate void space is materially reduced and the stability of the mixture is impaired by the presence of an excess of liquid (4).
Smith (7) states: 11 ••• some mixes of adequate internal friction and cohesion at the
time of construction became over-lubricated due to densification under traffic. As the result of this densification, the stability properties (internal friction in particular) of the mix as measured by the triaxial test were greatly reduced. 11 Pauls and Carpenter (8) have concluded that the principal cause of degradation is the rolling operation, and excessive degradation of the aggregate in bituminous concrete under the roller may cause raveling, excessive absorption of water, and progressive deterioration. Benson (9) considers that the relocation of particles occurs as soon as the friction between the particles is overcome, and bituminous materials assist in the action by acting as a friction reducer. He states, 11
••• within a bitumen-aggregate structure, one of the main roles of bitumen is that it permits a re-establishment of the original resistance to deformation when the bitumen-aggregate structure is deformed by excessive stress and is then compacted by further action of traffic. " H. L. Day of the Idaho Department of Highways reports (10) that construction records in that State indicate a pavement built with a shale aggregate failed before construction was completed and had to be reconstructed before being put into service.
Compaction is an energy-consuming process resulting from the application of forces to the mixture. The mixture withstands these forces in many ways, such as by interlock, by frictional resistance, and by viscous or flow resistance. When applied forces have a component in any direction less than that required to cause failure but greater than the resistance of the mat, the material moves and shifts around until a more stable position is attained. This rearrangement of the material, especially the aggregate phase, causes a closer packing of particles , a new internal arrangement or structure, and a higher unit weight.
The energy required for the relocation or rearrangement of particles is provided by contact pressure, and the particles while adjusting to their new locations are subjected to forces that cause breakage and wear at the points of contact. This phenomenon , called degradation, reduces the size of particles and changes the gradation of aggregate, which in turn causes a reduction in void volume and an increase in density. Any change in the gradation of the aggregate in a mix causes an associated change in the basic properties of stability and durability of the bituminous mixture.
ANALYSIS OF MECHANISM OF DEGRADATION
Most civil engineers concerned with degradation of aggregate believe that the process involves energy and that particles reduce in size by virtue of work done by the forces that develop at contact points (11). However , a careful review of the existing literature seems to indicate that no one has tried to analyze the problem using either the principles of energy consumption or fracture or breakage of solid pieces, and no attempt has been made to evaluate the factors affecting this process. It is interesting to note, however, that a vast amount of information predicated on this principle is available in the mining and metallurgical fields, especially in literature dealing with ore treatment processes where crushing and grinding is frequently the major item of cost.
Most comminution theories are concerned with the relationship between the cause and effect of particle size reduction. Of the many theories in the mining and metallurgical fields suggested for the relation between input energy (cause) and reduction in particle size of materials (effect) those of Rittinger , Kick, and Bond are of special interest (12).
Rittinger in 1867 postulated that the energy required for size reduction of a solid is proportional to the new surface area created during the size reduction. Kick in 1885 suggested that equivalent amounts of energy should result in equivalent geometrical changes in the size of the pieces of solid. Holmes (12) notes that Rittinger's theory is related to the energy required for the rupture of chemical and physical bonds, whereas Kick' s theory refers to the energy required to deform the particle to its elastic limit.
114
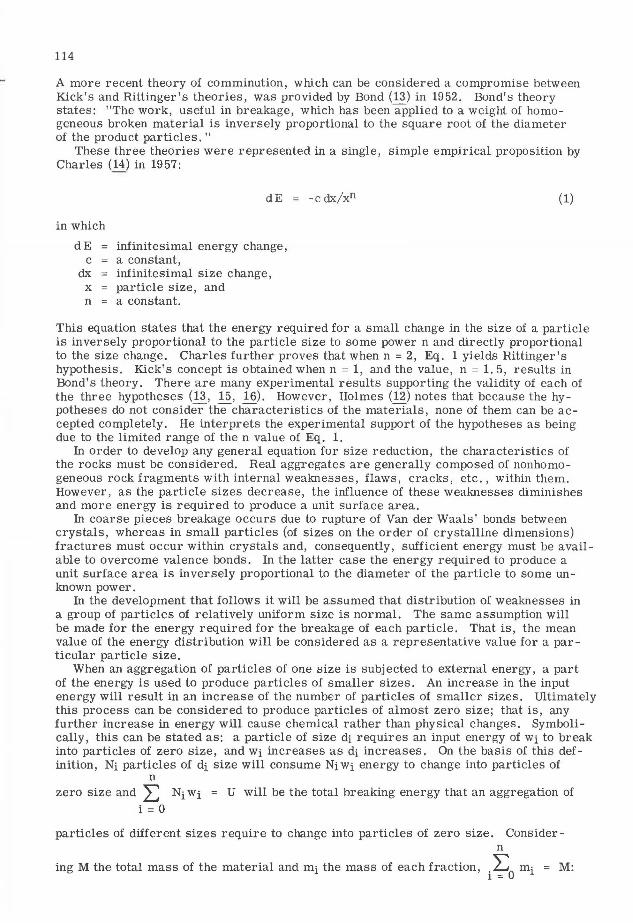
A more recent theory of comminution, which can be considered a compromise between Kick's and Rittinger's theories, was provided by Bond (13) in 1952. Bond's theory states: "The work, useful in breakage, which has been applied to a weight of homogeneous broken material is inversely proportional to the square root of the diameter of the product particles. "
These three theories were represented in a single, simple empirical proposition by Charles (14) in 1957:
dE -C dx/xn (1)
in which
d E infinitesimal energy change, c a constant,
dx = infinitesimal size change, x particle size, and n a constant.
This equation states that the energy required for a small change in the size of a particle is inversely proportional to the particle size to some power n and directly proportional to the size change. Charles further proves that when n = 2, Eq. 1 yields Rittinger's hypothesis. Kick' s concept is obtained when n = 1, and the value, n = 1. 5, results in Bond's theory. There are many experimental results supporting the validity of each of the three hypotheses (13, 15, 16). However, Holmes (12) notes that because the hypotheses do not consider the characteristics of the materials, none of them can be accepted completely. He interprets the experimental support of the hypotheses as being due to the limited range of the n value of Eq. 1.
In order to develop any general equation for size reduction, the characteristics of the rocks must be considered. Real aggregates are generally composed of nonhomogeneous rock fragments with internal weaknesses, flaws, cracks, etc., within them. However, as the particle sizes decrease, the influence of these weaknesses diminishes and more energy is required to produce a unit surface area.
In coarse pieces breakage occurs due to rupture of Van der Waals' bonds between crystals, whereas in small particles (of sizes on the order of crystalline dimensions) fractures must occur within crystals and, consequently, sufficient energy must be available to overcome valence bonds. In the latter case the energy required to produce a unit surface area is inversely proportional to the diameter of the particle to some unknown power.
In the development that follows it will be assumed that distribution of weaknesses in a group of particles of relatively uniform size is normal. The same assumption will be made for the energy required for the breakage of each particle. That is, the mean value of the energy distribution will be considered as a representative value for a particular particle size.
When an aggregation of particles of one size is subjected to external energy, a part of the energy is used to produce particles of smaller sizes. An increase in the input energy will result in an increase of the number of particles of smaller sizes. Ultimately this process can be considered to produce particles of almost zero size; that is, any further increase in energy will cause chemical rather than physical changes. Symbolically, this can be stated as: a particle of size di requires an input energy of Wi to break into particles of zero size, and Wi increases as di increases. On the basis of this definition, Ni particles of di size will consume Ni Wi energy to change into particles of
n zero size and L Ni Wi = U will be the total breaking energy that an aggregation of
i = 0
particles of different sizes require to change into particles of zero size. Considern
ing M the total mass of the material and mi the mass of each fraction, i~O mi = M:

115
we shall define Pi = (mi / M) 100 as the percentage of material of size di, in which n L Pi = 100. For simplicity, assuming spherical particles
i = 0
mi (2) - --1T 3 6 di p
in which i ct/ is the volume of the particle and p is the density of the material. For
nonspherical particles the volume can be considered Ad/, in which A is a shape factor. The total breaking energy now can be written
(3)
If the value of Wi is used for unit surface area of the particle rather than the particle as a whole, the relationship between the internal energy, Wi, of a particle of size di and the energy per unit surface area, Ei, is
(4)
which, when substituted into Eq. 3 yields
u (5)
The point of interest to those concerned with degradation is to predict the gradation of degraded aggregate after certain energy consumption. It is highly desirable to know what would be the values of Pi for various sizes, that is, the most probable distribution of values of Pi for each size di when Pi may take any value from zero to 100 percent. The number of combinations of Pi is given by the permutation formula
w P! rr Pi !
(6)
in which P is total percentage of material smaller than the largest size considered, which is generally 100 percent, and rr Pi ! is the product of the values of Pi ! , W is a term similar to that used in statistical mechanics for "thermodynamic probability" giving the number of microstates corresponding to a given macrostate. In statistical mechanics, the macrostate corresponds to the specification of how many molecules are in each energy level and the microstate to that of which molecules are in which energy level.
In the degradation process, W can be considered the degradation probability, the macrostate the number of particles in each fraction and the microstate which particles are in which fraction. For this purpose the most probable combination of Pi' s which in turn will correspond to a maximum Wis sought.
After application of an input energy, Eq. 5 is equal to a constant, and due to conservation of mass !:pi = P
O = constant. Differentiating to obtain the maximum W
results in

116
in which a and ,Bare constants. From ~Pi = P0 is obtained
a = (exp ,B E0 I Do) - 1
in which D0 is maximum size of particles. Substituting a in Eq. 7 fo·r Pi yields
Pi exp (3 E- / d,
Po ,B i l
(exp f3Eo/D0 ) - 1
Consequently, the total percent passing any size may be expressed as
Pi =
or
Pi = P0 [(exp,SEi/di) -1]
(exp ,SE0 /D0 ) - 1
(7)
(8)
(9)
(10a)
(lOb)
Finally, if the values of exp tl Ei / di and exp (3 Eo / Do are much larger than unity and - 1 may be ignored, the percent of material Pi finer than size di after the application of a certain amount of energy is
RELATION OF EXPERIMENT AND THEORY
Materials, Equipment and Procedure
(11)
To check the validity of Eq. 11, a series of tests was performed on three kinds of mineral a ggi·egates. The details of quality and specific characteristics of the aggr egates along with the tests performed on them are discussed elsewhere (18, 19). Tables 1 and 2 summarize data on origin, specific gravity, Los Angeles value,compressive strength, and petrographic analysis results for the materials used. An 85 to 100 penetration asphalt cement was used in the study.
Compaction was accomplished by a gyratory testing machine, which incorporates horizontal forces and applies shear to the specimen throughout its depth. Because the materials in the field are under similar loading conditions, the specimens produced in this machine should have a similar structure to that produced from the same mixture
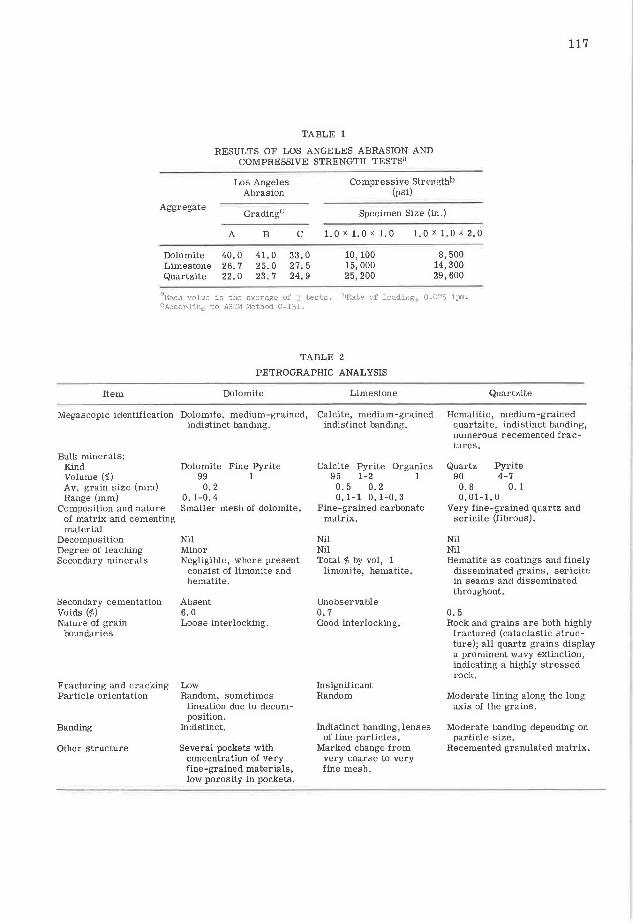
TABLE 1
RESULTS OF LOS ANGELES ABRASION AND COMPRESSIVE STRENGTH TESTsa
117
Los Angeles Compressive Strengthb Abrasion (psi)
Aggregate Gradingc Specimen Size (in.)
A B C 1.ox1.ox1.o 1.ox1.ox2.o
Dolomite 40.0 41. 0 33.0 10, 100 8,500 Limestone 26. 7 25. 0 27.5 15,000 14,300 Quartzite 22.0 23.7 24.9 25,200 29,600
8Each value is the average of 3 tests. bRate of loading, 0.025 ipm . c According to ASTM Method C-l3l.
TABLE 2
PETROGRAPHIC ANALYSIS
Item Dolomite
Megascopic identification Dolomite, medium-grained, indistinct banding.
Bulk minerals: Kind Volume(%) Av. grain size (mm) Range (mm)
Composition and nature of matrix and cementing material
Decomposition Degree of leaching Secondary minerals
Secondary cementation Voids (%) Nature of grain
boundaries
Fracturing and cracking Particle orientation
Banding
Other structure
Dolomite 99
0.2 0. 1-0.4
Fine Pyrite 1
Smaller mesh of dolomite.
Nil Minor Negligible, where present
consist of limonite and hematite.
Absent 6.0 Loose interlocking.
Low Random, sometimes
lineation due to decomposition.
Indistinct.
Several pockets with concentration of very fine-grained materials, low porosity in pockets.
Limestone
Calcite, medium-grained indistinct banding.
Calcite Pyrite Organics 95 1-2 1
0. 5 0. 2 0.1-1 0.1-0.3
Fine-grained carbonate matrix.
Nil Nil Total % by vol, 1
limonite, hematite.
Unobservable 0.7 Good interlocking.
Insignificant Random
Indistinct banding, lenses of fine particles.
Marked change from very coarse to very fine mesh.
Quartzite
Hematitic, medium-grained quartzite, indistinct banding, numerous recemented fractures.
Quartz 90
Pyrite 4-7
0.1 0.8 0.01-1.0
Very fine-grained quartz and sericite (fibrous).
Nil Nil Hematite as coatings and finely
disseminated grains, sericite in seams and disseminated throughout.
0.5 Rock and grains are both highly
fractured (cataclastic structure); all quartz grains display a prominent wavy extinction, indicating a highly stressed rock.
Moderate lining along the long axis of the grains.
Moderate banding depending on particle size.
Recemented granulated matrix.
118
in the field. With this machine the compactive effort could be changed in magnitude of load and repetition of load.
Results
The results of degradation produced on the aggregates tested are shown by gradation curves of percent smaller than certain sizes on log-log plots. All tests were performed using a constant angle of gyration of 1 ° with a fixed roller.
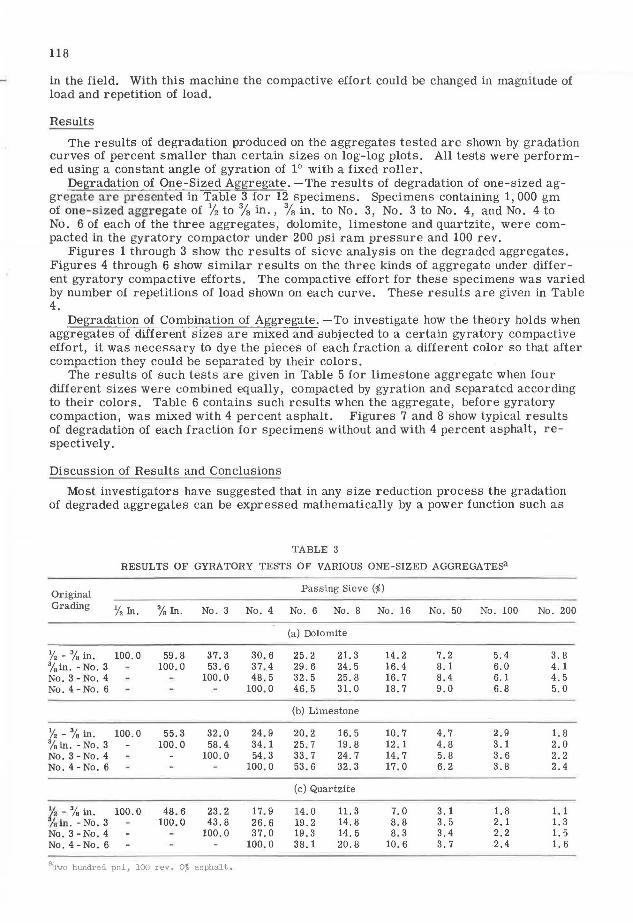
Degradation of One-Sized Aggregate. -The results of degradation of one-sized aggregate are presented in Table 3 for 12 specimens. Specimens containing 1, 000 gm of one- sized aggregate of % to % in., % in. to No. 3, No. 3 to No. 4, and No. 4 to No. 6 of each of the three aggregates, dolomite, limestone and quartzite, were compacted in the gyratory compactor under 200 psi ram pressure and 100 rev.
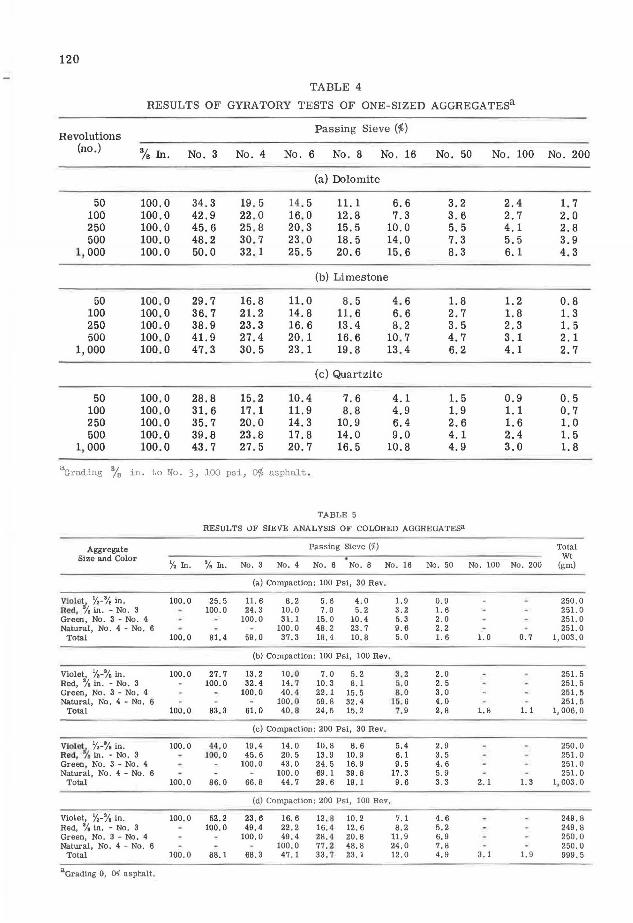
Figures 1 through 3 show the results of sieve analysis on the degraded aggregates. Figures 4 through 6 show similar results on the three kinds of aggregate under different gyratory compactive efforts. The compactive effort for these specimens was varied by number of repetitions of load shown on each curve. These results are given in Table 4.
Degradation of Combination of Aggregate. -To investigate how the theory holds when aggregates of different sizes are mixed and subjected to a certain gyratory compactive effort, it was necessary to dye the pieces of each fraction a different color so that after compaction they could be separated by their colors.
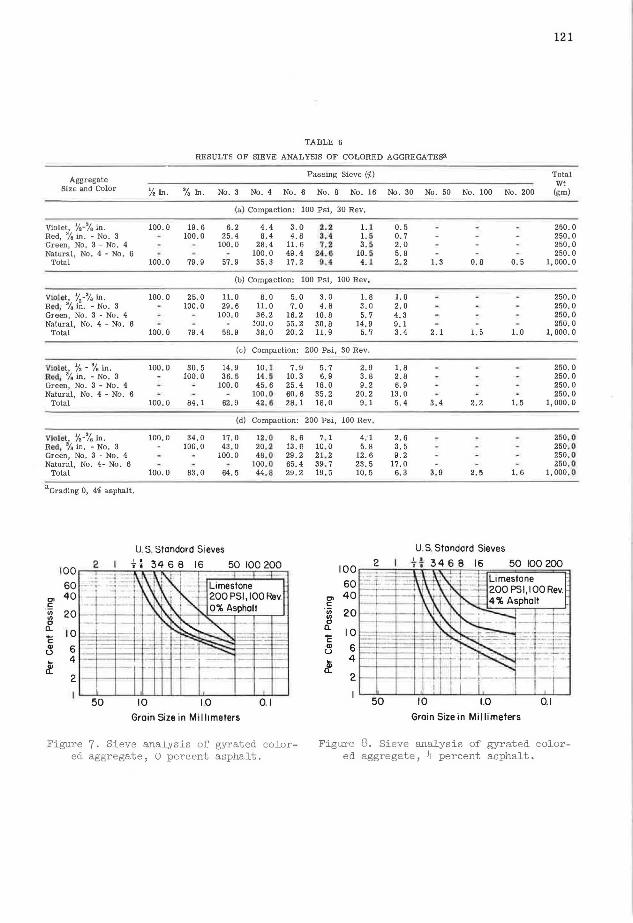
The results of such tests are given in Table 5 for limestone aggregate when four different sizes were combined equally, compacted by gyration and separated according to their colors. Table 6 contains such results when the aggregate, before gyratory compaction, was mixed with 4 percent asphalt. Figures 7 and 8 show typical results of degradation of each fraction for specimens without and with 4 percent asphalt, respectively.
Discussion of Results and Conclusions
Most investigators have suggested that in any size reduction process the gradation of degraded aggregates can be expressed mathematically by a power function such as
TABLE 3
RESULTS OF GYRATORY TESTS OF VARIOUS ONE-SIZED AGGREGATE&l
Original Passing Sieve (%)
Grading ½ In. 3/.In. No. 3 No. 4 No. 6 No. 8 No. 16 No. 50 No. 100 No. 200
(a) Dolomite
1/2 - % in. 100.0 59. 8 37.3 30.6 25.2 21. 3 14.2 7.2 5.4 3.8 3/.in. -No. 3 100.0 53. 6 37 . 4 29.6 24.5 16.4 8.1 6.0 4. 1 No. 3-No. 4 100. 0 48 . 5 32.5 25.8 16.7 8.4 6. 1 4.5 No.4-No.6 100 . 0 46.5 31. 0 18.7 9.0 6.8 5.0
(b) Limestone
½ - % in. 100.0 55.3 32.0 24.9 20.2 16. 5 10. 7 4.7 2.9 1.8 3/.in.-No.3 100. 0 58.4 34 . 1 25.7 19. 8 12. 1 4.8 3.1 2.0 No. 3-No. 4 100. 0 54.3 33.7 24.7 14.7 5.8 3.6 2.2 No. 4-No. 6 100 . 0 53 . 6 32.3 17. 0 6.2 3.8 2.4
( c) Quartzite
t •;. . 100.0 48.6 23.2 17 . 9 14.0 11. 3 7. 0 3.1 1.8 1. 1 i - em. %in. -No. 3 - 100.0 43.8 26. 6 19.2 14. 8 8. 8 3.5 2.1 1. 3 No. 3-No. 4 100.0 37.0 19.3 14. 5 8. 3 3.4 2.2 1. 5 No. 4-No. 6 100. 0 38.1 20.8 10.6 3.7 2.4 1. 6
"':rwo hundred psi, 100 rev. O'f, asphalt .

U.S. Standard Sieves
100 2 ti 34 6 8 16 50 100200
60
"' 40 C Cl> 20 Cl> C
; <-
Dolomite
·' 200 PSl,IOORev. I I'!.: ...... 0% Asphalt ....._
a. 10 e
~
Q) 6 (.) ... 4 Q) a.
2 I I
50 10 1.0 01
Groin Size in Millimeters
Fi gure l . Sieve analysis of gyrated doloroi t e aggregat e .
100 2
60 ,_ -"'
40 C
Cl> 20 Cl> C a.
10 e Q) 6 (.)
'= I== - --... 4
Q)
a. 2
- 1--
50
-
U.S. Standard Sieves
½ ¾ 34 6 8 16 ,- \
50 100200
- --- A Li mestone
~' fJ\ I\ - H 200PSl,100Rev.
' -- ~ 10% Asoholt -:-,,.'-~ ~ -·
I- --=-~~ ,-- --~
~~ I-- - . I-- I-
10 I.O 0.1
Groin Size in Mi 11 i meters
Figure 3. Sieve analysis of gyrat ed lime stone aggregate.
100 2
60 - --"'
40 C
·;;; 20 Cl> C a.
10 e Q) 6 (.)
t 4 a.
2
50
U.S.Stondord Sieves
½ ¼ 34 6 8 16 50 100200
- -v - = Dolomite l _ f-•3, IOOPSI
0% Asphalt ~:,..;: ~ ,,...i,..., ~l,OOORev.-
~ 500 = -------- ,,___ r-
....... ----·~ 50" ..... -.,, "-.
100~ I 5q___..._
10 1.0 0.1 Groin Size in Mil Ii meters
Figure 5. Sieve analys i s of gyrat e d one sized dolomite aggregate .
100
60 "' 40 C
"iii Cl>
11. C: Q)
u ... "' a.
20
10
6 4
2
119
U.S. Standard Sieves
2 t ¾ 34 6 8 16 50 100 200 - --I\ ' \ t '--:--~ ,_ ...= c:IQuortzite
~
1200PSl,I00Rev. 1-f- - \" ' 10% Asoholt ,_ - ,-
- , ..... ~~ ::-·--- - ,-... - .....
• t-- ··- ...... ~-,_ 1--· - ~,._
~ 50 10 1.0 0.1
Groin Size in Millimeters
Figure 2 . Si eve analysis of gyrated quartzite aggregate.
100 2
60
"' 40 - >--
.!:: Cl> 20 Cl> C a.
10 -C:
"' 6 (.)
4 ~
2
50
U.S. Standard Sieves
H 34 6 e 16 50 100 200
- Limestone !"-•3,IOOPSI
~ 0% Asoholt -'" ~~ ~ l,OOORt~
~500 -- 250 - -- 100= '" .................
' '-" .:'J
50-?'-. ~ 10 1.0 0 .1
Groin Size in Mil Ii meters
Figure 4. Sieve analys i s of gyrated one s i zed lunest one aggr egate .
100 2
60
"' 40 - I-- -C
·;;; 20 Cl> C a.
10 -C:
"' 6 (.)
~ 4 - ....._
a. 2 - I-
50
U.S. Standard Sieves
H 34 6 B 16 50 100200
- Quartzite !"-•3, IOOPSI
,. 0% Asphalt ·-~ /: 1,000Re~~
. 500 - - / 250
- ,... ~~ ..... -- 100 -~ ..._}' ~, 50 -~ '7
10 1.0 0.1
Groin Size in Millimeters
Figure 6. Sieve analsyi s of gyrated one s ized quartzite aggregate .
120
TABLE 4
RESULTS OF GYRATORY TESTS OF ONE-SIZED AGGREGATESa
Revolutions Passing Sieve (%}
(no.) % In. No. 3 No. 4 No. 6 No. 8 No. 16 No. 50 No. 100 No . 200
(a) Dolomite
50 100.0 34. 3 19 .5 14. 5 11. 1 6.6 3. 2 2.4 1. 7 100 100.0 42.9 22. 0 16.0 12.8 7.3 3.6 2. 7 2.0 250 100.0 45.6 25 .8 20.3 15 . 5 10.0 5. 5 4. 1 2.8 500 100.0 48.2 30.7 23 . 0 18 . 5 14.0 7. 3 5. 5 3.9
1, 000 100.0 50.0 32 .1 25.5 20.6 15.6 8.3 6. 1 4.3
(b) Limestone
50 100 . 0 29.7 16.8 11. 0 8. 5 4. 6 1. 8 1. 2 0.8 100 100,0 36.7 21. 2 14.8 11. 6 6. 6 2.7 1.8 1. 3 250 100.0 38.9 23.3 16.6 13 . 4 8. 2 3.5 2.3 1.5 500 100. 0 41. 9 27.4 20.1 16.6 10. 7 4.7 3.1 2.1
1,000 100. 0 47. 3 30. 5 23 . 1 19 . 8 13 . 4 6.2 4. 1 2.7
(c) Quartzite
50 100. 0 28.8 15 . 2 10. 4 7.6 4.1 1. 5 0.9 0.5 100 100.0 31.6 17. 1 11 . 9 8. 8 4.9 1. 9 1.1 0.7 250 100 . 0 35.7 20 . 0 14.3 10. 9 6. 4 2.6 1. 6 1.0 500 100.0 39.8 23 . 8 17.8 14 . 0 9.0 4.1 2.4 1. 5
1, 000 100.0 43.7 27 . 5 20.7 16.5 10. 8 4.9 3.0 1. 8
8 Grading % in. to No. 3, 100 psi, 0% asphalt .
TABLE 5
RESULTS vF SIEVE ANALYSIS OF COLORED AGGREGATEsa
Aggregate Passing Sieve (%) Total Size and Color . Wt
½ In. ¼ In. No. 3 No. 4 No. 6 No . 8 No. 16 No. 50 No. 100 No. 200 (gm)
(a) Compaction: 100 Psi, 30 Rev,
V!~lot,, ~,-¼ in. 100. 0 25. 5 11.6 8.2 5. 6 4.0 1. 9 0. 9 250. 0 Red, 1/, 1n. - No. 3 100.0 24. 3 10.0 7. 0 5. 2 3.2 1. 6 251. 0 Green, No. 3 - No. 4 100.0 31. l 15. 0 10.4 5.3 2. 0 251. 0 Natural, No. 4 - No. 6 100.0 48. 2 23 . 7 9.6 2. 2 251. 0
Total 100. 0 81. 4 59. 0 37.3 18. 4 10. 8 5.0 1. 6 1.0 0. 7 1,003.0
(b) Compaction: 100 Psi, 100 Rev.
Violet, ½-¼ in. 100,0 27 . 7 13 . 2 10 . 0 7. 0 5. 2 3.2 2.0 251. 5 Red, ¼ in. - No. 3 100.0 32.4 14 . 7 10. 3 6. 1 5.0 2.5 251. 5 Green, No. 3 - No. 4 100.0 40. 4 22. 1 15. 5 6.0 3. 0 251. 5 Natural, No. 4 - No. 6 100,0 59. 8 32. 4 15.6 4. 0 251. 5
Total 100. 0 83. 3 61. 0 40 . 8 24. 5 15. 2 7.9 2. 8 1.8 1.1 1,006.0
(c) Compaction: 200 Psi, 30 Rev.
Violet., ½-¼ in. 100. 0 4~.o 19 . 4 14. 0 10. 8 8. 6 5.4 2. 9 250. 0 Rod, 1/0 In. - No. 3 100.0 45, 6 20. 5 13. 9 10. 9 6. 1 3. 5 251. 0 Green, No. 3 - No. 4 100 . 0 43. 0 24. 5 16. 9 9 . 5 4.6 251. 0 Natural, No. 4 - No. 6 100.0 69. 1 39. 8 17 . 3 5. 9 251. 0
Total 100.0 86. 0 66. 8 44. 7 29. 6 19.1 9.6 3. 3 2. 1 1. 3 1,003.0
(d) Compaction: 200 Psi, 100 Rev.
Violet, ½-¼ in. 100. 0 52.2 23. 6 16. 6 12. 8 10. 2 7.1 4. 6 249. 8 Red, '!, in. - No. 3 100. 0 49. 4 22. 2 16. 4 12. 6 8.2 5.2 249. 8 Green, No. 3 - No. 4 100. 0 49.4 28.4 20 . 8 11. 9 6. 9 250. 0 Natural, No. 4 - No. 6 100.0 77. 2 48. 8 24.0 7.8 250 . 0
Total 100. 0 88. l 68. 3 47. 1 33 . 7 23. 1 12. 0 4. 9 3. 1 1.9 999. 5
aGrading 0, Di asphalt.
Aggregate Size and Color
Violet, ½-% In . Red, 3/e in . - No. 3 Green, No . 3 - No. 4 Natural, No. 4 - No. 6
Total
Viole t, 1/,·'I. in. Red, 'la in. - No . 3 Green, No . 3 - No. 4 Natural, No. 4 - No. 6
Total
Viole\, ½ - 'I, in. Red, 1/, m. - No . 3 Green, No. 3 - No, 4 Natural , No. 4 - No . 6
Tota l
Violet,' ½-3/, in. Red, 1/, m. - No. 3 Green, No . 3 - No. 4 Natural, No. 4- No. 6
Total
"Grading 0, 4% asphalt.
121
TABLE 6
RESULTS OF SIEVE ANALYSIS OF COLORED AGGREGATEsa
Passing Sieve (%) Total Wt
1/, In. % In. No . 3 No. 4 No. 6 No, 8 No. 16 No . 30 No. 50 No. 100 No. 200 (gm)
(a) Compaction: 100 Psi, 30 Rev.
100. 0 19. 6 6. 2 4 . 4 3. 0 2. 2 1. I 0. 5 250 . 0 100.0 25.4 8. 4 4. 8 3 . 4 1. 5 0 . 7 250. 0
100. 0 28 . 4 11. 6 7. 2 3 . 5 2. 0 250 . 0 100. 0 49.4 24 . 6 10. 5 5. 8 250 . 0
100. 0 79. 9 57. 9 35. 3 17. 2 9. 4 4.l 2. 2 1. 3 o. 8 o. 5 1, 000 . 0
(b) Compaction: 100 Psi, 100 Rev.
100, 0 25. 0 11.0 8. 0 5. 0 3. 0 1.8 1, 0 250 . 0 100. 0 29. 6 11. 0 7. 0 4. 8 3. 0 2. 0 250 . 0
100. 0 36.2 16. 2 10. 8 5. 7 4,3 250 . 0 100. 0 55. 2 30, 8 14, 9 9.1 250, 0
100. 0 79. 4 58 . 9 38. O 20. 2 11. 9 5, 7 3 . 4 2.1 1. 5 1.0 1,000.0
(c) Compaction : 200 Psi, 30 Rev,
100. 0 30. 5 14. 9 10 . l 7. 9 5. 7 2. 9 1, 8 250. 0 100. 0 36. 5 14 . 5 10. 3 6. 9 3. 8 2. 8 250 . 0
100. 0 45. 6 25. 4 18. 0 9. 2 6. 9 250 . 0 100.0 60 , 6 35. 2 20 . 2 13 . 0 250. 0
100 , 0 84 . 1 62 . 9 42 . 6 28 . 1 18, 0 9 . 1 5. 4 3 . 4 2.2 1. 5 1, 000 . 0
(d) Compaction: 200 Psi, 100 Rev.
100. 0 34,0 17. 0 12 , 0 8. 6 7. 1 4: 1 2 . 6 250 . 0 100.0 43. 0 20. 2 13. 6 10, 0 5. 8 3 . 5 250 , 0
100. 0 48, 0 29. 2 21 . 2 12. 6 9. 2 250.0 100. 0 65.4 39 , 7 23. 5 17. 0 250, 0
100. 0 83, 0 64 . 5 44. 8 29. 2 19 . 5 10, 5 6. 3 3. 9 2. 5 1. 6 1,000. 0
U. S. Standard Sieves U.S. Standard Sieves
I 00 r----:2-===i::n:::t"":r.:T_ lr.:6:.===5=0==10=0=200=-===;:i
.... C: Q)
u
cf 6 1--+-------1- .+-1
4 I---+--+--+ -+-- f--1---il--+-
2 1----+--+---t-+-++-t--4
50 10 1.0 0.1
Groin Size in Millimeters Grain Size in Millimeters
Figure 7. Sieve analysis of gyrat ed colored aggregate, O percent asphalt.
Figure 8. Sieve analysis of gyrated colored aggregate , 4 percent asphalt.
122
p (~)n o Do
{12)
in which
Pi total percent of material smaller than size di, Po = total percent of material smaller than size Do, Do maximum size of degraded aggregate or the size such that P0 80 percent, and
n a constant whose value depends on the crushing device and type of mineral.
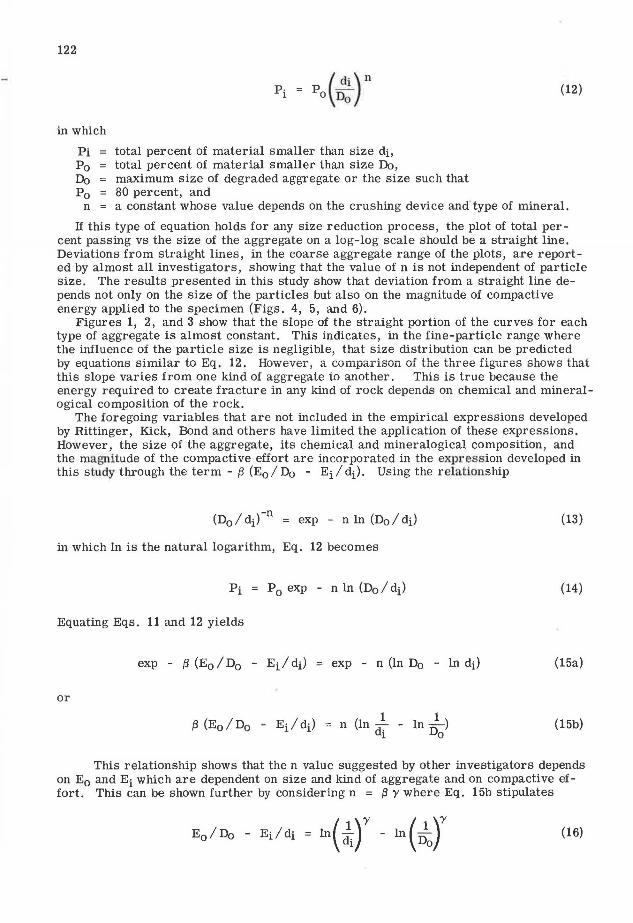
If this type of equation holds for any size reduction process, the plot of total percent passing vs the size of the aggregate on a log-log scale should be a straight line. Deviations from straight lines, in the coarse aggregate range of the plots, are reported by almost all investigators, showing that the value of n is not independent of particle size. The results presented in this study show that deviation from a straight line depends not only on the size of the particles but also on the magnitude of compactive energy applied to the specimen (Figs. 4, 5, and 6).
Figures 1, 2, and 3 show that the slope of the straight portion of the curves for each type of aggregate is almost constant. This indicates, in the fine-particle range where the influence of the particle size is negligible, that size distribution can be predicted by equations similar to Eq. 12. However, a comparison of the three figures shows that this slope varies from one kind of aggregate to another. This is true because the energy required to create fracture in any kind of rock depends on chemical and mineralogical composition of the rock.
The foregoing variables that are not included in the empirical expressions developed by Rittinger, Kick, Bond and others have limited the application of these expressions. However, the size of the aggregate, its chemical and mineralogical composition, and the magnitude of the compactive effort are incorporated in the expression developed in this study through the term - /3 (E0 / Do - Ei /di). Using the relationship
(D0 / di)-n = exp - n ln (Do/ di)
in which ln is the natural logarithm, Eq. 12 becomes
Equating Eqs. 11 and 12 yields
or
/3 (Eo / D0 - E1· / d1·) = n {ln _!_ - ln __!__) di Do
(13)
(14)
(15a)
(15b)
This relationship shows that the n value suggested by other investigators depends on E0 and Ei which are dependent on size and kind of aggregate and on compactive effort. This can be shown further by considering n = f3 y where Eq. 15b stipulates
(16)
123
This shows clearly that y is a function of E0 , Ei, D0 , and di. Whereas E0 and D0 are constants for any size and type of aggregate, y must be a function of breakage energy Ei and particle size di.
REFERENCES
1. Shelburne, T. E., "Crushing Resistance of Surface Treatment Aggregates." Eng. Bull., Purdue Univ., 24 (5) (Sept. 1940).
2. Page, L. W., and Cushman, A. S., "The United States Road Material Laboratory: Its Aims and Methods." Proc. ASTM 6th Ann. Meeting, 3 (1903).
3. Shergold, F. A., "A Review of Available Information on the Significance of Roadstone Tests." Road Res. Lab., London, Tech. Paper 10 (April 1948).
4. Macnaughton, M. F., "Physical Changes in Aggregates in Bituminous Mixtures Under Compaction." Proc. Assoc. of Asphalt Paving Tech., 8 (Jan. 1937).
5. Cook, F. C., "Report of the Road Research Board." Dept. of Sci. and Ind. Res., London, England (1935).
6. Goetz, W. H., "Flexible Pavement Test Sections for Studying Pavement Design." Proc. 37th Ann. Purdue Road School (1952).
7. Smith, V. R., "Application of the Triaxial Test to Bituminous Mixtures." ASTM Spec. Tech. Publ. 106 (1950).
8. Pauls, J. T., and Carpenter, C.A., "Mineral Aggregates for Bituminous Construction." ASTM Spec. Tech. Publ. 83 (1948).
9. Benson, J. R., "The Grading of Aggregates for Bituminous Construction." ASTM Spec. Tech. Publ. 83 (1948).
10. Day, H. L., "A Progress Report on Studies of Degrading Basalt Aggregate Bases." Proc. HRB, 41 (1962).
11. Sher gold, F. A., "A Study of the Granulators Used in the Production of Roadmaking Aggregates." Road Res. Lab., London, Tech. Paper 44 (1959).
12. Holmes, J.A., "A Contribution to the Study of Comminution." Trans. Amer. Inst. of Chem. Eng., 35 (1957).
13. Bond, F. C., "The Third Theory of Comminution." Trans. Amer. Inst. of Mining Eng., 193 (1952).
14. Charles, R.J., "Energy-Size Reduction Relationships in Comminution." Trans. Amer. Inst. of Mining Eng., 208 (1957).
15. Gross, J., and Zimmerlgy, S.R., "Crushing and Grinding." Trans. Amer. Inst. of Mining Eng., 87 (1930).
16. Rothgery, L. J., "Los Angles Rattler Test." Rock Prod., 34 (Dec. 1936). 17. Sweet, H. S., "Physical and Chemical Tests of Mineral Aggregates and Their
Significance." ASTM Spec. Tech. Publ. 83 (1948). 18. Moa venzadeh, F. , "A Laboratory Study of the Degradation of Aggregates in Bi
tuminous Mixes." Ph.D. Thesis, Purdue Univ. (unpubl. ). 19. Moavenzadeh, F., and Goetz, W. H., "Aggregate Degradation in Bituminous Mix
tures." Highway Res. Record 24, pp. 106-137 (1963).