Application of remote-sensing data to groundwater exploration: A case study of the Cross River...
11
Hydrogeology Journal (1998) 6 : 394–404 Q Springer-Verlag Received, August 1994 Revised, March 1996, June 1996 Accepted, October 1996 A.E. Edet (Y) 7 C.S. Okereke 7 E.O. Esu Department of Geology, University of Calabar P.M.B. 1115, Calabar, Nigeria S.C. Teme Institute of Geosciences and Space Technology, Rivers State University of Science and Technology, Port-Harcourt, Nigeria Application of remote-sensing data to groundwater exploration: A case study of the Cross River State, southeastern Nigeria A.E. Edet 7 C.S. Okereke 7 S.C. Teme 7 E.O. Esu Abstract The Cross River State, Nigeria, is underlain by the Precambrian-age crystalline basement complex and by rocks of Cretaceous to Tertiary age. The explo- ration for groundwater in this area requires a systema- tic technique in order to obtain optimum results, but the non-availability of funds and facilities has made it ex- tremely difficult to carry out site investigations prior to the drilling of water wells. Therefore, the failure rate is as high as 80%. In order to delineate areas that are ex- pected to be suitable for future groundwater develop- ment, black and white radar imagery and aerial photo- graphs were used to define some hydrological and hy- drogeological features in parts of the study area. Linea- ment and drainage patterns were analysed using length density and frequency. Lineament-length density ranges from 0.04–1.52; lineament frequency is 0.11–5.09; drainage-length density is 0.17–0.94, and the drainage frequency is 0.16–1.53. These range of values reflect the differences in the probability of groundwater potentials. Results were then used to delineate areas of high, medium, and low groundwater potential. Study results also indicate that correlations exist between lin- eament and drainage patterns, lithology, water tem- perature, water conductivity, well yield, transmissivity, longitudinal conductance, and the occurrence of groundwater. Résumé La géologie de l’Etat de Cross River (Nigé- ria) est constituée d’un socle cristallin d’âge précam- brien et de roches datées du Crétacé au Tertiaire. Dans cette région, l’exploration des eaux souterraines néces- site une analyse systématique pour obtenir les meilleurs résultats ; cependant le manque de moyens a rendu par- ticulièrement difficile les recherches de sites de forage destinés au captage de l’eau. C’est pourquoi le taux d’échec a atteint 80%. Afin de délimiter les zones sus- ceptibles de permettre la future mise en valeur des eaux souterraines, des images radar et des photos aé- riennes en noir et blanc ont été utilisées pour mettre en évidence certains phénomènes hydrologiques et hydro- géologiques en certains points de la région étudiée. L’analyse des réseaux de linéaments et de drainage a porté sur la densité de leurs longueurs et sur leur fré- quence. La densité de longueur des linéaments s’étend de 0,04 à 1,52 et la fréquence des linéaments de 0,11 à 5,09 ; la densité des longueurs de drainage est comprise entre 0,17 et 0,94, et la fréquence du drainage entre 0,16 et 1,53. Ces gammes de valeurs rendent compte des différences dans la probabilité des potentiels en eau souterraine. Ces résultats ont ensuite été utilisés pour délimiter les zones à potentiel en eau souterraine fort, moyen et faible. Les résultats de l’étude indiquent aussi qu’il existe des corrélations entre les réseau de linéa- ments et de drainage, la lithologie, la température de l’eau, la conductivité de l’eau, le rendement des puits, la transmissivité, la conductance longitudinale et la pré- sence d’eau souterraine. Resumen Bajo el Estado de Cross River, Nigeria, sub- yace un complejo basal cristalino del Precámbrico, así como rocas de edad entre Cretácica y Terciaria. La ex- ploración hidrogeológica en esta área requiere una téc- nica sistemàtica para poder alcanzar resultados ópti- mos, pero la falta de medios y de infraestructura ha he- cho extremadamente difícil el poder realizar investiga- ciones previas a la perforación de los pozos, de manera que el porcentaje de fallos se eleva al 80%. Para poder delinear las áreas adecuadas para el posterior desarrol- lo hidrogeológico, se han usado imágenes de radar en blanco y negro y fotografías aéreas, con el objetivo de definir algunos rasgos hidrológicos e hidrogeológicos en partes del área de estudio. Se analizaron los esque- mas de lineamiento y drenaje usando densidad y fre- cuencia de longitudes. La densidad de longitudes de li- neamiento oscila entre 0.04–1.52 y la frecuencia entre 0.11–5.09. La densidad de longitud de drenaje oscila entre 0.17–0.94 y su frecuencia entre 0.16–1.53. Estos rangos de valores reflejan las diferencias en el grado potencial de extracción de aguas subterráneas, que se dibuja en unos mapas siguiendo la clasificación de po- tencial alto, medio o bajo. Los resultados del estudio
Transcript of Application of remote-sensing data to groundwater exploration: A case study of the Cross River...

Hydrogeology Journal (1998) 6 :394–404 Q Springer-Verlag
Received, August 1994Revised, March 1996, June 1996Accepted, October 1996
A.E. Edet (Y) 7 C.S. Okereke 7 E.O. EsuDepartment of Geology, University of Calabar P.M.B. 1115,Calabar, Nigeria
S.C. TemeInstitute of Geosciences and Space Technology, Rivers StateUniversity of Science and Technology, Port-Harcourt, Nigeria
Application of remote-sensing data to groundwater exploration:
A case study of the Cross River State, southeastern Nigeria
A.E. Edet 7 C.S. Okereke 7 S.C. Teme 7 E.O. Esu
Abstract The Cross River State, Nigeria, is underlainby the Precambrian-age crystalline basement complexand by rocks of Cretaceous to Tertiary age. The explo-ration for groundwater in this area requires a systema-tic technique in order to obtain optimum results, but thenon-availability of funds and facilities has made it ex-tremely difficult to carry out site investigations prior tothe drilling of water wells. Therefore, the failure rate isas high as 80%. In order to delineate areas that are ex-pected to be suitable for future groundwater develop-ment, black and white radar imagery and aerial photo-graphs were used to define some hydrological and hy-drogeological features in parts of the study area. Linea-ment and drainage patterns were analysed using lengthdensity and frequency. Lineament-length densityranges from 0.04–1.52; lineament frequency is0.11–5.09; drainage-length density is 0.17–0.94, and thedrainage frequency is 0.16–1.53. These range of valuesreflect the differences in the probability of groundwaterpotentials. Results were then used to delineate areas ofhigh, medium, and low groundwater potential. Studyresults also indicate that correlations exist between lin-eament and drainage patterns, lithology, water tem-perature, water conductivity, well yield, transmissivity,longitudinal conductance, and the occurrence ofgroundwater.
Résumé La géologie de l’Etat de Cross River (Nigé-ria) est constituée d’un socle cristallin d’âge précam-brien et de roches datées du Crétacé au Tertiaire. Danscette région, l’exploration des eaux souterraines néces-site une analyse systématique pour obtenir les meilleursrésultats ; cependant le manque de moyens a rendu par-ticulièrement difficile les recherches de sites de foragedestinés au captage de l’eau. C’est pourquoi le taux
d’échec a atteint 80%. Afin de délimiter les zones sus-ceptibles de permettre la future mise en valeur deseaux souterraines, des images radar et des photos aé-riennes en noir et blanc ont été utilisées pour mettre enévidence certains phénomènes hydrologiques et hydro-géologiques en certains points de la région étudiée.L’analyse des réseaux de linéaments et de drainage aporté sur la densité de leurs longueurs et sur leur fré-quence. La densité de longueur des linéaments s’étendde 0,04 à 1,52 et la fréquence des linéaments de 0,11 à5,09 ; la densité des longueurs de drainage est compriseentre 0,17 et 0,94, et la fréquence du drainage entre0,16 et 1,53. Ces gammes de valeurs rendent comptedes différences dans la probabilité des potentiels en eausouterraine. Ces résultats ont ensuite été utilisés pourdélimiter les zones à potentiel en eau souterraine fort,moyen et faible. Les résultats de l’étude indiquent aussiqu’il existe des corrélations entre les réseau de linéa-ments et de drainage, la lithologie, la température del’eau, la conductivité de l’eau, le rendement des puits,la transmissivité, la conductance longitudinale et la pré-sence d’eau souterraine.
Resumen Bajo el Estado de Cross River, Nigeria, sub-yace un complejo basal cristalino del Precámbrico, asícomo rocas de edad entre Cretácica y Terciaria. La ex-ploración hidrogeológica en esta área requiere una téc-nica sistemàtica para poder alcanzar resultados ópti-mos, pero la falta de medios y de infraestructura ha he-cho extremadamente difícil el poder realizar investiga-ciones previas a la perforación de los pozos, de maneraque el porcentaje de fallos se eleva al 80%. Para poderdelinear las áreas adecuadas para el posterior desarrol-lo hidrogeológico, se han usado imágenes de radar enblanco y negro y fotografías aéreas, con el objetivo dedefinir algunos rasgos hidrológicos e hidrogeológicosen partes del área de estudio. Se analizaron los esque-mas de lineamiento y drenaje usando densidad y fre-cuencia de longitudes. La densidad de longitudes de li-neamiento oscila entre 0.04–1.52 y la frecuencia entre0.11–5.09. La densidad de longitud de drenaje oscilaentre 0.17–0.94 y su frecuencia entre 0.16–1.53. Estosrangos de valores reflejan las diferencias en el gradopotencial de extracción de aguas subterráneas, que sedibuja en unos mapas siguiendo la clasificación de po-tencial alto, medio o bajo. Los resultados del estudio
395
Hydrogeology Journal (1998) 6 :394–404 Q Springer-Verlag
Fig. 1 Location of study areashowing geographical features
indican que existen correlaciones entre los esquemas delineamiento y drenaje, litología, temperatura y conduc-tividad del agua, descenso en el pozo, transmisividad,conductancia longitudinal y la presencia de agua sub-terránea.
Key words Nigeria 7 remote sensing 7 groundwaterdevelopment 7 lineaments
Introduction
The state of Cross River, Nigeria, covers an area ofabout 23,000 km2and is inhabited by approximately 1.8million people, or about 2% of Nigeria’s population. Alarge percentage of the population resides in the ruralareas with no direct access to potable water for domes-tic use or to water for agricultural purposes. Locationsare shown in Figure 1.

396
Hydrogeology Journal (1998) 6 :394–404 Q Springer-Verlag
Fig. 2 Simplified geology andcoverage of aerial photo-graphs and radar imagery,Cross River State, Nigeria
The State Government, with assistance from theWorld Bank and UNICEF, has in recent decades un-dertaken several programmes for rural water supply,based on drilling of wells. Despite these efforts, the sit-uation has not noticeably improved. Some of the wellsdrilled under the various programmes have either gonedry or they continue to diminish in yield. In some rurallocalities, the failure rate is as high as 80% (Edet 1993).The main reason is the lack of adequate geological andhydrogeological surveys prior to the drilling of wells. Asystematic approach to groundwater exploration wasoutlined by Zall and Russel (1979). In this approach,initially a reconnaissance hydrogeological map showingareas of high groundwater potential is compiled fromsatellite imagery data. These target areas are thenchecked using aerial photographs and further investi-gated by surface geophysical surveys and geologicalmapping prior to exploratory drilling.
The present investigation was principally aimed atdelineating groundwater target areas within the CrossRiver State, based on available radar imagery and aer-ial photographs. Secondly, some derived parameters
and groundwater data were used to assess the ground-water potentials of these target areas. The results areexpected to guide the future groundwater developmentin the area, even though extensive field geological map-ping has not been carried out.
Study Area
Cross River State is located between longitudes 7749band 9728b East and latitudes 4749b and 6756b North.Simplified geology is shown in Figure 2.
The region is dominated by three geomorphologicalunits (Figure 1):1. The Oban massif and Obudu plateau (150–2000 m
a.s.l.), which are underlain by the Precambrian-agebasement complex (Figure 2).
2. The Cross River Plain (30–120 m a.s.l.) and its east-erly extension, the Ikom depression, underlain byCretaceous-age sediments.
3. The Calabar Coastal Plain (less than 100 m in eleva-tion), marked by swamps and estuaries and under-lain by loose deposits of Tertiary-age sands.

397
Hydrogeology Journal (1998) 6 :394–404 Q Springer-Verlag
The area is drained mainly by the Cross, Aya, Afi,and Okpauku Rivers in the northern part, and by theGreat Kwa, Calabar, and Akpa Yafe Rivers in thesouthern parts (Figure 1). These rivers are mostly den-dritic and flow southward in accordance with the maindirection of jointing and foliation in the basement.
Climatic conditions in the study area include highprecipitation, high humidity, and a high rate of evapo-ration. The mean annual rainfall varies considerably:1800 mm in the northern part, around Ogoja; 2018 mmin Obubra; and 3063 mm in the southern part, aroundCalabar (Figure 1). The mean annual temperature inthe study area ranges from 22.4 7C at Ogoja to 30.1 7Cat Calabar.
The basement complex rocks that underlie the Obanmassif and Obudu plateau are predominantly phyllite,schist, gneiss, and amphibolite. These are intruded bybasic, intermediate, and acidic rocks, including pegma-tite, granite, granodiorite, diorite, tonalite, monzonite,charnokite, and dolerite.
The sedimentary deposits consist mainly of con-glomerate, sandstone, shale, siltstone, mudstone, limes-tone, marl, clay, and loose sand; these range in agefrom Cretaceous to Tertiary.
Method of Investigation
Black and white radar imagery (1 :100,000) and verticalpanchromatic aerial photographs (1 :10,000 and1 :5000) covering various localities within the CrossRiver State were employed in this study (Figure 2).
The interpretations of aerial photograph and image-ry were augmented by analysis of topographic, geo-logic, and planimetric maps, all on scales of 1 :250,000.Visual interpretations were carried out both stereoscop-ically (aerial photographs) and monoscopically (radarimagery), utilising a light table and magnifiers.
Geologically, aerial photographs and radar imageryhave complementary roles. Information contained inthe photographs has high spatial resolution, which al-lows the recognition of fine textural and structural de-tails. Radar imagery, on the other hand, depends moreon the spectral sensitivity and large-scale pattern varia-tions. The appropriate use of these data is, therefore,largely a function of scale (Greenbaum 1985, 1989).
Lineament and photogeological maps were pro-duced for some localities on the basis of available im-agery and aerial photographs (Edet 1993). Typical exam-ples are described in the next section. Parameters thatwere evaluated include lineament (lineament-lengthdensity and lineament frequency) and drainage (drain-age-length density and drainage frequency) patterns.These parameters are defined as follows:1. Lineament-length density (Ld) is the total length of
all recorded lineaments divided by the area underconsideration (Greenbaum 1985):
Ldp
ipn
Aip1
Li
A(mP1) (1)
where ipn
Aip1
ptotal length of all lineaments (m) and
Aparea (m2).2. Lineament frequency (Lf) is the number of visible
lineaments per unit area (Greenbaum 1985):
Lfp
ipn
Aip1
Ln
A(mP2) (2)
where ipn
Aip1
Lnptotal length of all lineaments and
Aparea (m2).3. Drainage-length density (Dd) is the ratio of cumula-
tive length of streams to the size of the area underconsideration (Greenbaum 1985):
Ddp
ipn
Aip1
Si
A(mP1) (3)
where ipn
Aip1
Sipcumulative length of all streams (m)
and Aparea (m2).4. Drainage frequency (Df) is the ratio of cumulative
number of streams to the size of the area under con-sideration (Greenbaum 1985):
Dfp
ipn
Aip1
Sn
A(mP2) (4)
where ipn
Aip1
Snptotal number of streams and Aparea
(m2).Many of the lineaments observed on radar imagery
are difficult to recognize on aerial photographs, andvice versa. This difficulty is attributed to the effect ofscale and resolution (Edet 1993). However a strong re-lationship exists between the strike directions of the lin-eaments obtained from both imagery and air photo-graphs.
Hydrogeomorphic features such as meanderingstreams, relics of oxbow lakes, and abandoned riverchannels were better delimited from aerial photographsthan from imagery.
Results
A typical lineament map derived from radar imageryon a scale of 1 :100,000 for Ikom is shown in Figure 3.Four such maps were produced, representing the majorareas covered by the imagery. These localities are Ban-sara, Bamba, Ikom, and Oban (Figure 2).

398
Hydrogeology Journal (1998) 6 :394–404 Q Springer-Verlag
Fig. 3 Lineaments mapped onthe Ikom (315) sheet (shownin Figure 2), derived from rad-ar imagery. (After Edet 1993)
Fig. 4a–b Statistics of lineaments mapped on Ikom (315) sheet.a, Histogram of lineament length. b, Rose diagram showing direc-tional frequency
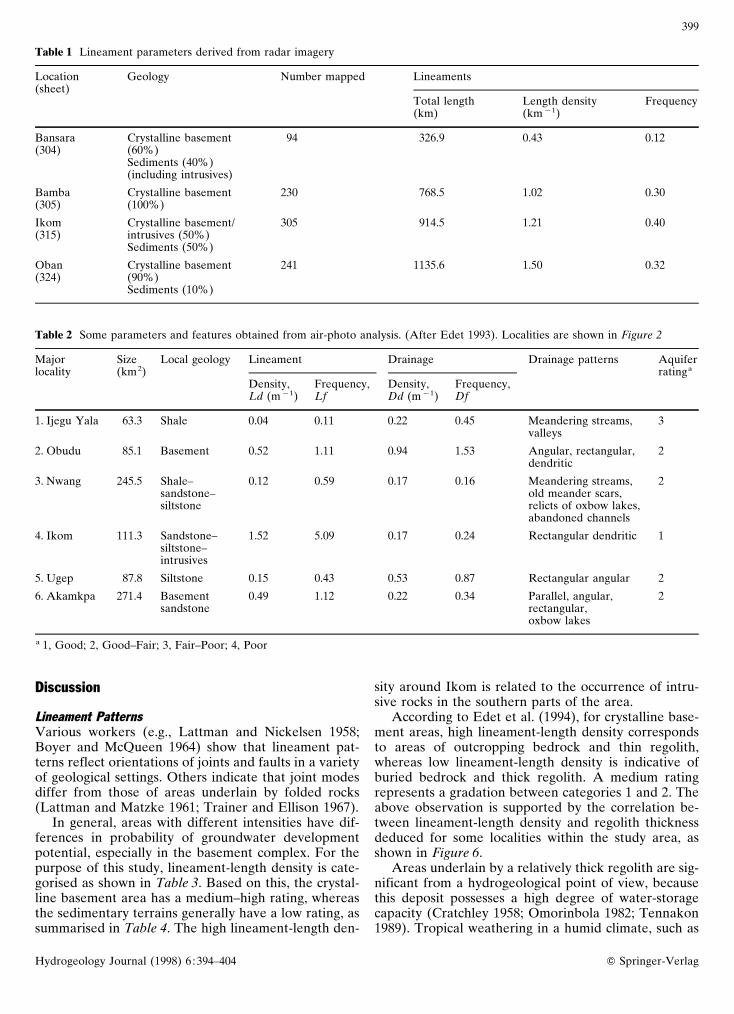
As deduced from radar imagery, lineaments range inlength from about 100 m to about 15,000 m and averageabout 3600 m, as shown in Figure 4. Most of the linea-ments trend N20–607W and N40–507E. As summarizedin Table 1, lineament-length density and frequency aregreater around Bamba, Oban, and Ikom than near
Bansara. These differences in lineament intensity prob-ably reflect differences in the geology between thethree areas and Bansara.
On the basis of air-photo interpretation, lineamentdirections are mostly in NE/SW, N/S, and NW/SE, withminor variations in the E/W direction. Lineamentlengths range from about 100 to about 1000 m; meanlength ranges from 200 to about 500 m. The lineament-length density ranges from 0.04–1.52; lineament fre-quency is 0.11–5.09. Results are given in Table 2.
The drainage patterns observed from aerial photo-graphs are mostly dendritic, rectangular, angular, andanastomosing. Also observed were meanderingstreams, relics of oxbow lakes, and abandoned riverchannels. Examples from Nwang are shown in Fig-ure 5.
An analysis of drainage patterns was carried outbased on two parameters, the drainage-length density,Dd, and drainage frequency, Df. The values of theseparameters are summarised in Table 2. The greatestvalues of Dd and Df (0.95 and 1.53) were obtained inthe Obudu area, whereas the smallest values (0.17 and0.16) were recorded at Nwang. The latter values areconsistent with the relatively low value of Ld and thelocal geology.
399
Hydrogeology Journal (1998) 6 :394–404 Q Springer-Verlag
Table 1 Lineament parameters derived from radar imagery
Location Geology Number mapped Lineaments(sheet)
Total length(km)
Length density(kmP1)
Frequency
Bansara(304)
Crystalline basement(60%)
94 326.9 0.43 0.12
Sediments (40%)(including intrusives)
Bamba(305)
Crystalline basement(100%)
230 768.5 1.02 0.30
Ikom(315)
Crystalline basement/intrusives (50%)Sediments (50%)
305 914.5 1.21 0.40
Oban(324)
Crystalline basement(90%)Sediments (10%)
241 1135.6 1.50 0.32
Table 2 Some parameters and features obtained from air-photo analysis. (After Edet 1993). Localities are shown in Figure 2
Major Size Local geology Lineament Drainage Drainage patterns Aquiferlocality (km2) ratinga
Density,Ld (mP1)
Frequency,Lf
Density,Dd (mP1)
Frequency,Df
1. Ijegu Yala 63.3 Shale 0.04 0.11 0.22 0.45 Meandering streams,valleys
3
2. Obudu 85.1 Basement 0.52 1.11 0.94 1.53 Angular, rectangular,dendritic
2
3. Nwang 245.5 Shale–sandstone–siltstone
0.12 0.59 0.17 0.16 Meandering streams,old meander scars,relicts of oxbow lakes,abandoned channels
2
4. Ikom 111.3 Sandstone–siltstone–intrusives
1.52 5.09 0.17 0.24 Rectangular dendritic 1
5. Ugep 87.8 Siltstone 0.15 0.43 0.53 0.87 Rectangular angular 2
6. Akamkpa 271.4 Basementsandstone
0.49 1.12 0.22 0.34 Parallel, angular,rectangular,oxbow lakes
2
a 1, Good; 2, Good–Fair; 3, Fair–Poor; 4, Poor
Discussion
Lineament Patterns
Various workers (e.g., Lattman and Nickelsen 1958;Boyer and McQueen 1964) show that lineament pat-terns reflect orientations of joints and faults in a varietyof geological settings. Others indicate that joint modesdiffer from those of areas underlain by folded rocks(Lattman and Matzke 1961; Trainer and Ellison 1967).
In general, areas with different intensities have dif-ferences in probability of groundwater developmentpotential, especially in the basement complex. For thepurpose of this study, lineament-length density is cate-gorised as shown in Table 3. Based on this, the crystal-line basement area has a medium–high rating, whereasthe sedimentary terrains generally have a low rating, assummarised in Table 4. The high lineament-length den-
sity around Ikom is related to the occurrence of intru-sive rocks in the southern parts of the area.
According to Edet et al. (1994), for crystalline base-ment areas, high lineament-length density correspondsto areas of outcropping bedrock and thin regolith,whereas low lineament-length density is indicative ofburied bedrock and thick regolith. A medium ratingrepresents a gradation between categories 1 and 2. Theabove observation is supported by the correlation be-tween lineament-length density and regolith thicknessdeduced for some localities within the study area, asshown in Figure 6.
Areas underlain by a relatively thick regolith are sig-nificant from a hydrogeological point of view, becausethis deposit possesses a high degree of water-storagecapacity (Cratchley 1958; Omorinbola 1982; Tennakon1989). Tropical weathering in a humid climate, such as

400
Hydrogeology Journal (1998) 6 :394–404 Q Springer-Verlag
Fig. 5 Photogeology of partsof Nwang (shown in Figure 2),Cross River State, Nigeria

401
Hydrogeology Journal (1998) 6 :394–404 Q Springer-Verlag
Table 3 Categorisation of lineament-length density
Category Lineament-lengthdensity, Ld(mP1)
Rating
1 1 1.00 High2 0.50–1.00 Medium3 ~0.50 Low
Table 4 Ratings of areas forgroundwater potential, basedon lineament-length density
Location Geology Lineament-lengthdensity (mP1)
Rating
Bansara Shale–basement 0.43 LowBamba Basement 1.02 HighIkom Intrusive/sandstone 1.21 HighOban Basement 1.50 HighIjegu Yala Shale 0.04 LowObudu Basement 0.52 MediumNwang Sandstone–siltstone–shale 0.12 LowIkom Sandstone–siltstone 1.52 HighUgep Siltstone 0.15 LowAkamkpa Basement–sandstone 0.49 Medium
Fig. 6 Relation between lineament-length density and regoliththickness for some localities within Cross River State, Nigeria
occurs in the study area, is the principal requirementfor the production of a thick regolith. According toThomas (1966) and Greenbaum (1985), other factorsbeing equal, the formation of a thick regolith is also fa-voured by structural anisotropy, such as the presence offaults, joints, and fissures in the crystalline basement.These fractures tend to increase the permeability ofthick regoliths.
Obscured and buried structures may be reflected atthe surface by structurally controlled rivers, as ob-served in some aerial photographs. These structuresgenerally appear as lineaments. In addition, most of thestructurally controlled streams occur in valleys filledwith thick sand and gravel, which are potentially excel-lent aquifers. Moreover, the channels can act as con-duits for the migration of groundwater from deepaquifers to shallow aquifers (Greenbaum 1985). Someof these are variously named as low-sinuosity, mean-dering, oxbow-lake, and overbank aquifers (Edet1993).
On the basis of lineament studies, hydrotectonicmodels were developed for the crystalline-basementarea of Cross River State. These models include:1. Areas of thick regolith, generally associated with
major lineament boundaries. Most of these zonesare capable of storing and transmitting large quanti-ties of water. However, permeability is low wherethe regolith consists mostly of fine-grained materi-als.
2. Major lineament zones. These areas provide bettertargets for groundwater than joints because of theirgreater widths, greater lengths, and better intercon-nections with other fractures.These models can be used as a basis for subsequent
field work on structural geology of the area.
Drainage Patterns
Drainage pattern is one of the most important indica-tors of hydrogeological features, because drainage pat-tern, texture, and density are controlled in a fundamen-tal way by the underlying lithology (Charon 1974). Inaddition, the stream pattern is a reflection of the ratethat precipitation infiltrates compared with the surfacerunoff. The infiltration/runoff relationship is controlledlargely by permeability, which is in turn a function ofthe rock type and fracturing of the underlying rock orsurface bedrock. When comparing two terrain types,the one that contains the greatest drainage density isusually less permeable.
Four categories of permeability were used to de-scribe the groundwater potential of the different litho-logies in the area. The potentials range from poor togood, as shown in the last column of Table 2. Most ofthe rock groups in the project area are in category 2(Good to Fair groundwater potential).
In combination, drainage-length density and drai-nage frequency reflect rock permeability. Thus the data
402
Hydrogeology Journal (1998) 6 :394–404 Q Springer-Verlag
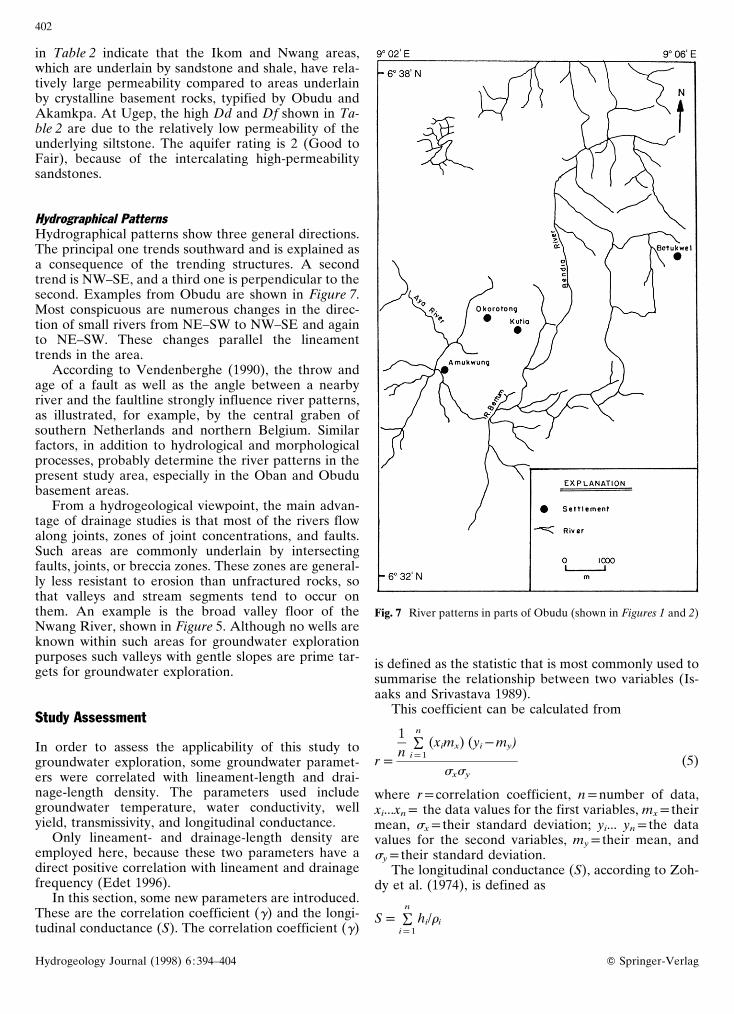
Fig. 7 River patterns in parts of Obudu (shown in Figures 1 and 2)
in Table 2 indicate that the Ikom and Nwang areas,which are underlain by sandstone and shale, have rela-tively large permeability compared to areas underlainby crystalline basement rocks, typified by Obudu andAkamkpa. At Ugep, the high Dd and Df shown in Ta-ble 2 are due to the relatively low permeability of theunderlying siltstone. The aquifer rating is 2 (Good toFair), because of the intercalating high-permeabilitysandstones.
Hydrographical Patterns
Hydrographical patterns show three general directions.The principal one trends southward and is explained asa consequence of the trending structures. A secondtrend is NW–SE, and a third one is perpendicular to thesecond. Examples from Obudu are shown in Figure 7.Most conspicuous are numerous changes in the direc-tion of small rivers from NE–SW to NW–SE and againto NE–SW. These changes parallel the lineamenttrends in the area.
According to Vendenberghe (1990), the throw andage of a fault as well as the angle between a nearbyriver and the faultline strongly influence river patterns,as illustrated, for example, by the central graben ofsouthern Netherlands and northern Belgium. Similarfactors, in addition to hydrological and morphologicalprocesses, probably determine the river patterns in thepresent study area, especially in the Oban and Obudubasement areas.
From a hydrogeological viewpoint, the main advan-tage of drainage studies is that most of the rivers flowalong joints, zones of joint concentrations, and faults.Such areas are commonly underlain by intersectingfaults, joints, or breccia zones. These zones are general-ly less resistant to erosion than unfractured rocks, sothat valleys and stream segments tend to occur onthem. An example is the broad valley floor of theNwang River, shown in Figure 5. Although no wells areknown within such areas for groundwater explorationpurposes such valleys with gentle slopes are prime tar-gets for groundwater exploration.
Study Assessment
In order to assess the applicability of this study togroundwater exploration, some groundwater paramet-ers were correlated with lineament-length and drai-nage-length density. The parameters used includegroundwater temperature, water conductivity, wellyield, transmissivity, and longitudinal conductance.
Only lineament- and drainage-length density areemployed here, because these two parameters have adirect positive correlation with lineament and drainagefrequency (Edet 1996).
In this section, some new parameters are introduced.These are the correlation coefficient (g) and the longi-tudinal conductance (S). The correlation coefficient (g)
is defined as the statistic that is most commonly used tosummarise the relationship between two variables (Is-aaks and Srivastava 1989).
This coefficient can be calculated from
rp
1n
n
Aip1
(ximx) (yiPmy)
sxsy
(5)
where rpcorrelation coefficient, npnumber of data,xi...xnp the data values for the first variables, mxptheirmean, sxptheir standard deviation; yi... ynpthe datavalues for the second variables, myptheir mean, andsyptheir standard deviation.
The longitudinal conductance (S), according to Zoh-dy et al. (1974), is defined as
Spn
Aip1
hi/ri
403
Hydrogeology Journal (1998) 6 :394–404 Q Springer-Verlag
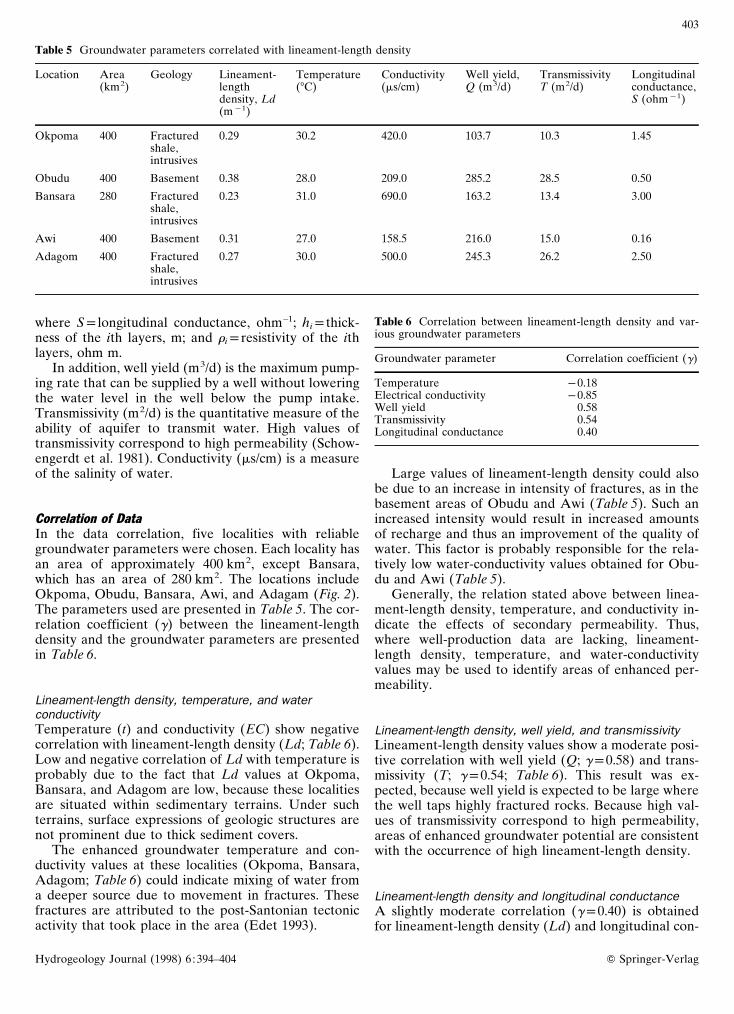
Table 5 Groundwater parameters correlated with lineament-length density
Location Area(km2)
Geology Lineament-lengthdensity, Ld(mP1)
Temperature(7C)
Conductivity(ms/cm)
Well yield,Q (m3/d)
TransmissivityT (m2/d)
Longitudinalconductance,S (ohmP1)
Okpoma 400 Fracturedshale,intrusives
0.29 30.2 420.0 103.7 10.3 1.45
Obudu 400 Basement 0.38 28.0 209.0 285.2 28.5 0.50
Bansara 280 Fracturedshale,intrusives
0.23 31.0 690.0 163.2 13.4 3.00
Awi 400 Basement 0.31 27.0 158.5 216.0 15.0 0.16
Adagom 400 Fracturedshale,intrusives
0.27 30.0 500.0 245.3 26.2 2.50
where Splongitudinal conductance, ohm–1; hipthick-ness of the ith layers, m; and ripresistivity of the ithlayers, ohm m.
In addition, well yield (m3/d) is the maximum pump-ing rate that can be supplied by a well without loweringthe water level in the well below the pump intake.Transmissivity (m2/d) is the quantitative measure of theability of aquifer to transmit water. High values oftransmissivity correspond to high permeability (Schow-engerdt et al. 1981). Conductivity (ms/cm) is a measureof the salinity of water.
Correlation of Data
In the data correlation, five localities with reliablegroundwater parameters were chosen. Each locality hasan area of approximately 400 km2, except Bansara,which has an area of 280 km2. The locations includeOkpoma, Obudu, Bansara, Awi, and Adagam (Fig. 2).The parameters used are presented in Table 5. The cor-relation coefficient (g) between the lineament-lengthdensity and the groundwater parameters are presentedin Table 6.
Lineament-length density, temperature, and waterconductivityTemperature (t) and conductivity (EC) show negativecorrelation with lineament-length density (Ld; Table 6).Low and negative correlation of Ld with temperature isprobably due to the fact that Ld values at Okpoma,Bansara, and Adagom are low, because these localitiesare situated within sedimentary terrains. Under suchterrains, surface expressions of geologic structures arenot prominent due to thick sediment covers.
The enhanced groundwater temperature and con-ductivity values at these localities (Okpoma, Bansara,Adagom; Table 6) could indicate mixing of water froma deeper source due to movement in fractures. Thesefractures are attributed to the post-Santonian tectonicactivity that took place in the area (Edet 1993).
Table 6 Correlation between lineament-length density and var-ious groundwater parameters
Groundwater parameter Correlation coefficient (g)
Temperature P0.18Electrical conductivity P0.85Well yield 0.58Transmissivity 0.54Longitudinal conductance 0.40
Large values of lineament-length density could alsobe due to an increase in intensity of fractures, as in thebasement areas of Obudu and Awi (Table 5). Such anincreased intensity would result in increased amountsof recharge and thus an improvement of the quality ofwater. This factor is probably responsible for the rela-tively low water-conductivity values obtained for Obu-du and Awi (Table 5).
Generally, the relation stated above between linea-ment-length density, temperature, and conductivity in-dicate the effects of secondary permeability. Thus,where well-production data are lacking, lineament-length density, temperature, and water-conductivityvalues may be used to identify areas of enhanced per-meability.
Lineament-length density, well yield, and transmissivityLineament-length density values show a moderate posi-tive correlation with well yield (Q; gp0.58) and trans-missivity (T; gp0.54; Table 6). This result was ex-pected, because well yield is expected to be large wherethe well taps highly fractured rocks. Because high val-ues of transmissivity correspond to high permeability,areas of enhanced groundwater potential are consistentwith the occurrence of high lineament-length density.
Lineament-length density and longitudinal conductanceA slightly moderate correlation (gp0.40) is obtainedfor lineament-length density (Ld) and longitudinal con-

404
Hydrogeology Journal (1998) 6 :394–404 Q Springer-Verlag
ductance (S). Thus, high S values indicate high Ld val-ues and vice versa. Edet (1993) indicates that the en-hanced groundwater potentials are consistent with highLd (see the last section of this article), and becausehigh Ld correlates with high S, localities with high Svalues are relatively favourable for siting productivewater wells. In some localities, however, high Ld-low Smay be related to highly resistive aquifer materials,such as basement rocks or any sand and gravel.
Drainage-length density and transmissivityDrainage-length density (Dd) shows a strong negativecorrelation (–0.76) with aquifer transmissivity (T). Thisis to be expected, because, according to Salman (1983)and Greenbaum (1985), areas with high drainage-length density are usually underlain by rocks of lowpermeability/transmissivity.
Conclusions
Analyses of lineament (lineament-length density andfrequency) and drainage (drainage-length density andfrequency) patterns are expected to serve as usefulguides for identifying areas that are suitable forgroundwater exploration, especially in the crystalline-basement complex of the study area.
Lineament studies allow the delineation of two hy-drotectonic models within basement areas. These in-clude thick regolith areas and major lineament zones.
Hydrogeomorphological features (low sinuosity,meandering, oxbow, and overbank deposits) are recog-nisable from aerial photographs with varying degrees ofconfidence, depending on the surface expression. Areaswithout aerial photographs but with similar featuresidentified on the basis of field mapping can be qualita-tively related.
A qualitative association exists between drainagechannels, lithology, and lineament-length density, per-mitting target areas of high groundwater potential to beidentified.
Relations between lineament-length density,groundwater temperature, water conductivity, wellyield, transmissivity, and longitudinal conductance, andbetween drainage-length density and transmissivityshow the effects of secondary permeability. Thus,where well-production data are lacking, other ground-water data may be used to identify areas of enhancedpermeability and potentially good aquifer zones.
Acknowledgments Thanks are given to Sigma Xi, the ScientificResearch Society, USA, and to the University of Calabar for pro-viding research grants to the first author during the period of thisstudy.
References
Boyer RF, McQueen JE (1964) Comparison of mapped rock frac-tures and air photo linear features. Photogramm Eng30 :630–635
Charon JE (1974) Hydrogeological applications of ERTS satelliteimagery. In: Proc UN/FAO Regional seminar on remote sens-ing of earth resources and environment, Cairo. Common-wealth Science Council, pp 439–456
Cratchley CR (1958) Memorandum of the water supplies of Kan-kara town and district, Katsina provinces. Report of NigeriaGeological Survey, 7 pp
Edet AE (1993) Hydrogeology of parts of Cross River State, Ni-geria: evidence from aerogeological and surface resistivitystudies: PhD Dissertation, University of Calabar, Calabar, Ni-geria, 316 pp
Edet AE (1996) Evaluation of borehole sites based on air photoderived parameters. Bull Int Assoc Eng Geol 54 :71–76
Edet AE, Teme SC, Okereke CS, Esu EO (1994) Lineamentanalysis for groundwater exploration in Precambrian Obanmassif and Obudu plateau, SE Nigeria. J Mining Geol30 :87–95
Greenbaum D (1985) Review of remote sensing applications togroundwater exploration in basement and regolith. BritishGeological Survey Report OD 85/8, 36 pp
Greenbaum D (1989) Hydrogeological applications of remotesensing in areas of crystalline basement. In: Proc GroundwaterExploration and Development in Crystalline Basement Aquif-ers, Zimbabwe, vol 1. Commonwealth Science, London, pp333–350
Isaaks EH, Srivastava RM (1989) An introduction to appliedgeostatistics. Oxford University Press, Oxford
Lattman LH, Nickelsen RP (1958) Photographic fracture-tracemapping in Appalachian, Plateau. Am Asso Petrol Geol42 :2238–2245
Lattman LH, Matzke RH (1961) Geological significance of frac-ture-trace mapping in Appalachian Plateau. Am Assoc PetrolGeol 27 (3) : 435–440
Omorinbola EO (1982) Verification of geohydrological implica-tions of deep weathering in the basement complex of Nigeria.J Hydrol 56 :347–368
Salman AAB (1983) Using landsat imagery interpretation for un-derground water prospection around Qena Province, Egypt.Int J Remote Sensing 4 :179–189
Schowengerdt R, Babcock EM, Ethridge L, Glass CE (1981) Cor-relation of geologic structure inferred from computer en-hanced landsat imagery with underground water supplies inArizona. In: Deutsch M, Wiesnet DR, Rango A (eds) Satellitehydrology. Proc 5th W.T. Pecora Memorial Symposium onRemote Sensing, Sioux Falls. American Water Resouces As-sociation, pp 387–397
Tennakon TMTB (1989) The study of the relationship betweenwell yields and relevant hydrogeological phenomenon in crys-talline basement rocks in northwestern dry zone of Sri Lanka.In: Proc Groundwater Exploration and Development in Crys-talline Basement Aquifers, Zimbabwe, vol 2. CommonwealthScience, London, pp 235–247
Thomas M (1966) Some geomorphological implications of deepweathering patterns in crystalline rocks in Nigeria. Trans InstBr Geog 40 :173–193
Trainer FW, Ellison RL (1967) Fracture traces in the ShenandoahValley, Virginia. Photogramm Eng 33 :190–199
Vandenberghe J (1990) Morphological effects of Pleistocenefaulting in unconsolidated sediments (Central Graben, Ne-therlands). Z Geomorph WF 34 (1) : 113–124
Zall L, Russel O (1979) Groundwater exploration programs inAfrica. In: Deutsch M, Wiesnet R, Rango A (eds) Satellitehydrology. Proc 5th W.T. Pecora Memorial Symposium onRemote Sensing, Sioux Falls. American Water Resources As-sociation, pp 416–425
Zohdy AAR, Eaton GP, Mabey DR (1974) Application of sur-face geophysics to groundwater investigation. United StatesGeological Survey Book 2, Chapter D1, 116 pp