The potential of flow cytometry in the study of Bacillus cereus
Upload
independentCategory
view
0download
0
Application of Polychromatic Flow Cytometry to Identify NovelSubsets of Circulating Cells with Angiogenic Potential
Myka L. Estes1,2,§, Julie A. Mund1,2,3,§, Laura E. Mead1,2, Daniel N. Prater1,2, ShanbaoCai1,2, Haiyan Wang1,2, Karen E. Pollok1,2,3, Michael P. Murphy4, Caroline S.T. An5, EdwardF. Srour1,2,3,6, David A. Ingram Jr.1,2,3,7, and Jamie Case1,2,3
1 Department of Pediatrics, Indianapolis, Indiana, USA2 Herman B Wells Center for Pediatric Research, Indianapolis, Indiana, USA3 Indiana University Melvin and Bren Simon Cancer Center, Indianapolis, Indiana, USA4 Department of Surgery, Clarian Health Partners – IU/Methodist/Riley, Indianapolis, Indiana,USA5 Department of Pathology, Clarian Health Partners – IU/Methodist/Riley, Indianapolis, Indiana,USA6 Department of Microbiology and Immunology, Indiana University School of Medicine,Indianapolis, Indiana, USA7 Department of Biochemistry and Molecular Biology, Indiana University School of Medicine,Indianapolis, Indiana, USA
AbstractDefining whether human circulating pro-angiogenic cells represent a subset of the hematopoieticsystem and express CD45 or are hematopoietic derivatives that do not express CD45 (and arecalled endothelial progenitor cells) remains controversial. We have previously developed apolychromatic flow cytometry (PFC) protocol to isolate subsets of hematopoietic cells and wenow identify the circulating pool of CD34+CD45dim cells representing functional circulatinghematopoietic stem and progenitor cells (CHSPCs) that can be separated on the basis of AC133expression and report that the AC133+ subset of the CHSPCs enhances the growth of tumor bloodvessels in vivo in immunodeficient mice. In addition, the ratio of AC133+ pro-angiogenic CHSPCsto AC133− non-angiogenic CHSPCs unambiguously correlates with the severity of the clinicalstate of patients with peripheral arterial disease. In sum, a PFC protocol validated via in vitro andin vivo analyses, can be used to interrogate the roles of human hematopoietic elements in thegrowth and maintenance of the vasculature.
Key TermsPolychromatic flow cytometry; circulating progenitor cells; endothelial progenitor cells;angiogenesis; peripheral arterial disease
Corresponding Author: Jamie Case, Ph.D, Department of Pediatrics, Indiana University School Of Medicine, 1044 West Walnut St,R4-470, Indianapolis, IN, 46202, USA, Telephone: +1 317 278-7928, Fax: +1 317 274 8679, [email protected]. David A. Ingram, MD.Department of Pediatrics, Indiana University School Of Medicine, 1044 West Walnut St, R4-470, Indianapolis, IN, 46202, USA,Telephone:- +1 317 278-4738, Fax: +1 317 274 8679, [email protected].§These authors contributed equally to this work.
NIH Public AccessAuthor ManuscriptCytometry A. Author manuscript; available in PMC 2011 September 1.
Published in final edited form as:Cytometry A. 2010 September ; 77(9): 831–839. doi:10.1002/cyto.a.20921.
NIH
-PA Author Manuscript
NIH
-PA Author Manuscript
NIH
-PA Author Manuscript

INTRODUCTIONThough a powerful technique, conventional flow cytometric protocols are highly susceptibleto and in fact require the operator to make subjective decisions in the process of dataacquisition and interpretation [1,2]. As additional fluorescence values are increasingly addedto define more cell parameters, the advent of polychromatic flow cytometry (PFC) emergedto implement the rigorous controls and standards necessary to discriminate multi-parametricdata (for more detailed information on the technical advances, see the supportinginformation and Table S1) [1]. Nowhere is this level of scrutiny of greater concern than inrare and dim event analysis where great care must be taken to ensure the reliability ofcollected data [3]. Besides occurring in frequencies on the cusp of reproducible detection(0.001–0.1%), cells of endothelial and hematopoietic origin proposed to be engaged inangiogenesis are often discriminated using a combination of antigens with low, dull, or acontinuum of cell surface expression [4,5]. Limitations of conventional flow cytometry,compounded by antigen promiscuity between the endothelial and hematopoietic lineages hasnecessitated consideration of the newer methods and approaches of PFC in defining thevarious circulating cell subsets involved in neoangiogenesis [6–10]. For example, currentdebate often centers on CD45 expression in putative endothelial progenitor cell (EPC)subsets [11,12]. Previously, the distinction between a CD34+ progenitor cell that expressedCD45 versus one that was CD34+ and CD45− was deemed critical for the discrimination ofmyeloid cells that mimicked endothelial morphology in culture (colony forming unit-Hill;CFU-Hill) versus bona fide endothelial cells found in blood that form vessels uponimplantation following in vitro expansion (endothelial colony forming cells; ECFCs). Whilethe original putative EPCs were first described as CD45−CD34+AC133+KDR+ cells, recentuse of flow cytometers with more channels of resolution have since revealed that the EPCsdescribed as CD45− may in fact be CD45dim [11]. However, these debates exist because theconventional flow cytometry methods employed to analyze these cell populations havelacked the controls necessary to accurately depict the rare event and low antigen expressionprofiles desired [13].
A PFC protocol was applied to discriminate previously undetected phenotypic andfunctional heterogeneity within the commonly referenced circulating progenitor cells(CPCs)[14]. Our PFC profile utilized a panel of antigens including rodent monoclonalantibodies to human CD45, CD34, CD31, and AC133, reagents to exclude false positiveevents, and methods to improve data analysis. Using PFC, the CPC subset identified asCD45dimCD34+CD31+ and heterogeneous in AC133 expression is now reported to becomprised of circulating hematopoietic stem and progenitor cells (CHSPCs) that engraft inNOD/SCID mice of which a subset display pro-angiogenic tumor growth promoting activityin vivo. Thus, the application of PFC techniques and approaches to the EPC field havepermitted clarification of the cells involved in neoangiogenesis and may now permit broaderapplication of these cells to therapeutic and diagnostic applications.
MATERIALS AND METHODSBlood Samples
Peripheral blood (PB) samples (16–32mls) were collected from 20 healthy adult donors (10male and 10 female, age range 20–40 years) and umbilical cord blood (CB) samples (20–100mls) were collected from 15 full-term newborns. The Institutional Review Board at theIndiana University School of Medicine approved all protocols, informed consent wasobtained from adult donors, and cord blood collection was deemed exempt. Granulocytecolony stimulating factor (G-CSF) mobilized peripheral blood (mPB) CD34+ cells werekindly provided through a Program of Excellence in Gene Therapy grant from ShellyHeimfeld at the Fred Hutchinson Cancer Research Centre, Seattle, WA, USA.
Estes et al. Page 2
Cytometry A. Author manuscript; available in PMC 2011 September 1.
NIH
-PA Author Manuscript
NIH
-PA Author Manuscript
NIH
-PA Author Manuscript

Clinical Samples and Subject CharacteristicsPB samples (16mls) were collected from 9 patients (pts) with peripheral artery disease(PAD) (6 male and 3 female, age range 50–81) along with age and gender matched controls.PAD pts ranged in Rutherford class 1–6, with co-morbidity related to coronary arterydisease (CAD) in 4 patients and chronic obstructive pulmonary disease (COPD) in 3 pts.
Isolation of Mononuclear CellsBlood was diluted 2:1 with phosphate buffered saline without calcium or magnesium (PBS,Invitrogen, Grand Island, NY, USA) and underlaid with Ficoll (GE Healthcare, USA).Mononuclear cells (MNCs) were isolated by centrifuging blood at 740g for 30 minutes atroom temperature. The MNCs were removed and washed two times in PBS without calciumor magnesium (Invitrogen, Grand Island, NY, USA) with 2% fetal bovine serum (FBS,Hyclone, Logan, UT, USA). Cells were counted on a hemacytometer.
Antibodies and Staining ReagentsIn order to resolve the rare and/or dim populations of interest, specific antigen andfluorochrome conjugate coupling was optimized for the six-antibody plus viability markerstaining panel described below as previously described [1,14–16]. The following primaryconjugated monoclonal antibodies were used: anti-human CD31 fluoroscein isothyocyanate(FITC, BD Pharmingen, San Diego, CA, USA, cat. no. 555445), anti-human CD34phycoerythrin (PE, BD Pharmingen, cat. no. 550761), anti-human AC133 allophycocyanin(APC, Miltenyi Biotec, Auburn, CA, USA, cat. no. 130-090-826), anti-human CD14PECy5.5 (Abcam, Cambridge, MA, USA, cat. no. ab25395), anti-human CD45 APC-AlexaFluor (AF) 750 (Invitrogen, cat. no. MHCD4527), anti-human CD235a (glyA, R&DSystems, Minneapolis, MN, USA, cat. no. MAB1228) conjugated to Pacific Blue (PacB,Invitrogen), anti-human CD3 FITC (BD Pharmingen, cat. no. 555339), anti-human CD4FITC (BD Pharmingen, cat. no. 555346), anti-human CD7 FITC (BD Pharmingen, cat. no.555360), anti-human CD8 FITC (BD Pharmingen, cat. no. 555634), anti-human CD10 FITC(BD Biosciences, cat. no. 340925), anti-human CD11b PECy7 (BD Pharmingen, cat. no.557743), anti-human CD13 (BD Pharmingen, cat. no. 558744), anti-human CD19 PE (BDPharmingen, cat. no. 555413), anti-human CD33 APC (BD Pharmingen, cat. no. 551378),anti-human CD34 PECy7 (BD Biosciences, cat. no. 348791) anti-human CD41a APC (BDPharmingen, cat. no. 559777), CD45RA FITC (BD Pharmingen, cat. no. 555488), CD56CD71 HLA-DR FITC (BD Pharmingen, cat. no. 555811) IgG FITC (BD Pharmingen, cat.no. 555748), IgG PE (BD Pharmingen, cat. no. 555749), IgG APC (BD Pharmingen, cat. no.555751), IgG PECy5.5 (Invitrogen, cat. no. MG118), IgG APC-AF750 (Invitrogen, cat. no.MG127), IgG PacB (Invitrogen, cat. no. S-11222), the amine reactive viability dye, ViViD(Invitrogen), and DAPI (Invitrogen).
PFC ImmunostainingA total of 107 PB MNCs were suspended in 720μl PBS with 2% FBS and incubated for 10minutes at 4°C with 180μl human Fc blocking reagent (Miltenyi Biotec). Cells werealiquoted into 9 tubes and stained with the following antibodies. Subsequently, 100μl of thecell suspension was distributed into nine sample tubes with the following pre-titeredantibodies: (1) unstained; (2) Isotypes: 4μl IgG FITC, 15μl IgG PE, 10μl IgG APC, 10μl IgGPECy5.5, 5μl IgG APC-AF750 and 4μl IgG PacB; (3) FITC FMO: 15μl CD34 PE, 10μlAC133 APC, 10μl CD14 PECy5.5, 5μl CD45 APC-AF750, 4μl glyA PacB and 1μl ViViD;(4) PE FMO: 4μl CD31 FITC, 10μl AC133 APC, 10μl CD14 PECy5.5, 5μl CD45 APC-AF750, 4μl glyA PacB and 1μl ViViD; (5) APC FMO: 4μl CD31 FITC, 15μl CD34 PE,10μl CD14 PECy5.5, 5μl CD45 APC-AF750, 4μl glyA PacB and 1μl ViViD; (6) PECy5.5FMO: 4μl CD31 FITC, 15μl CD34 PE, 10μl AC133 APC, 5μl CD45 APC-AF750, 4μl glyA
Estes et al. Page 3
Cytometry A. Author manuscript; available in PMC 2011 September 1.
NIH
-PA Author Manuscript
NIH
-PA Author Manuscript
NIH
-PA Author Manuscript

PacB and 1μl ViViD; (7) APC-AF750 FMO: 4μl CD31 FITC, 15μl CD34 PE, 10μl AC133APC, 10μl CD14 PECy5.5, 4μl glyA PacB and 1μl ViViD; (8) V450 Channel FMO: 4μlCD31 FITC, 15μl CD34 PE, 10μl AC133 APC, 10μl CD14 PECy5.5, and 5μl CD45 APC-AF750; and (9) full panel: 4μl CD31 FITC, 15μl CD34 PE, 10μl AC133 APC, 10μl CD14PECy5.5, 5μl CD45 APC-AF750, 4μl glyA PacB and 1μl ViViD (six-antibody/viabilitymarker panel). Table S2 is included in the supporting information to better illustrate thestaining panel. Cells were incubated with antibodies for 30 minutes at 4°C, washed twice inPBS with 2% FBS, and fixed in 300μl 1% paraformaldehyde (Sigma Aldrich, St. Louis,MO, USA). Additionally, anti-mouse Ig BD CompBeads (BD Biosciences, Bedford, MA,USA) were stained with each of the individual test antibodies to serve as single-colorcompensation controls. Prior to use, each lot of antibody was individually titered aspreviously described [17] to determine the optimal staining concentration. In someexperiments, cells were incubated with either glyA PacB or ViViD to determine theindividual contribution of RBCs or dead/apoptotic cells, respectively.
Flow Cytometry Acquisition and SortingStained fixed MNC samples were acquired on a BD LSRII flow cytometer (BD, FranklinLakes, NJ, USA) equipped with a 405nm violet laser, 488nm blue laser and 633nm red laser(for filter specifications see Table S3) [14]. Prior to acquiring any data, photomultiplier tube(PMT) voltages were calibrated to the highest signal to background ratio as previouslydescribed [18]. At least 300,000 events were acquired for each sample. Data was acquireduncompensated, exported as FCS 3.0 files and analyzed using FlowJo software, version8.7.3 (Tree Star, Inc., Ashland, OR, USA).
For sorting, unfixed MNC samples were run on a BD FACSAria flow cytometer (BD)equipped with a 407nm violet laser, 488nm blue laser and 630nm red laser. PMT voltageswere also calibrated and using single stained compensation beads a compensation matrixwas created. Cells were collected into sterile PBS supplemented with 2% FBS. Data wasexported as FCS 3.0 files and also analyzed using FlowJo software, version 8.7.3 (TreeStar).
Colony AssaysTo assess the hematopoietic progenitor colony forming potential ofCD31+CD34brightCD45dimCD133+ cells from PB, 500 freshly sorted cells or 10,000 MNCswere suspended in 0.66% to 1.0% agar (Becton Dickinson) in the presence of 1000U/mlhuman interleukin (IL)-1α, 200U/ml human IL-3, 100ng/ml human macrophage colonystimulating factor (M-CSF), and 100ng/ml human stem cell factor (SCF) (all fromPeprotech, Rocky Hill, NJ, USA) as previously described [19]. Cells were plated in 35mmPetri dishes in triplicate and scored for low proliferative potential – colony forming cells(LPP) and high proliferative potential – colony forming cells (HPP-CFCs) on day 14. Sortedsub-populations were also assayed for the presence of multi-potential granulocyte, erythroid,macrophage, megakaryocyte progenitors (i.e. CFU-GEMMs) using MethoCult® GF H4434,Complete Methylcellulose Kit (StemCell Technologies, Vancouver, BC, Canada) accordingto the manufacturer’s protocol.
Matrigel Tube Forming AssaysTo assess the presence of functional endothelial cells within sub-populations of PB, freshlysorted CD31+CD34brightCD45dimCD133+ cells (3,500–5,000 per well) were seeded ontoMatrigel-coated (BD Biosciences) 96-well plates as previously described [6,20]. Wells wereexamined by visual microscopy every two hours for capillary-like tube formation. Earlypassage cultured CB ECFCs were used as a positive control.
Estes et al. Page 4
Cytometry A. Author manuscript; available in PMC 2011 September 1.
NIH
-PA Author Manuscript
NIH
-PA Author Manuscript
NIH
-PA Author Manuscript
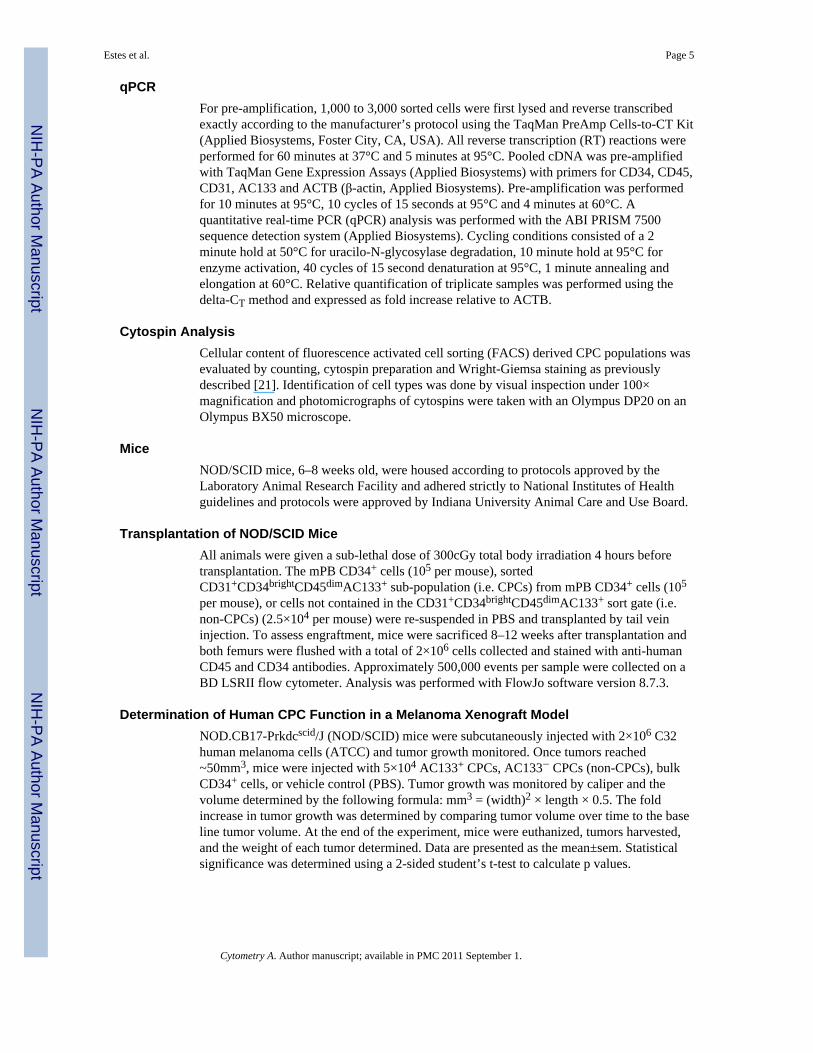
qPCRFor pre-amplification, 1,000 to 3,000 sorted cells were first lysed and reverse transcribedexactly according to the manufacturer’s protocol using the TaqMan PreAmp Cells-to-CT Kit(Applied Biosystems, Foster City, CA, USA). All reverse transcription (RT) reactions wereperformed for 60 minutes at 37°C and 5 minutes at 95°C. Pooled cDNA was pre-amplifiedwith TaqMan Gene Expression Assays (Applied Biosystems) with primers for CD34, CD45,CD31, AC133 and ACTB (β-actin, Applied Biosystems). Pre-amplification was performedfor 10 minutes at 95°C, 10 cycles of 15 seconds at 95°C and 4 minutes at 60°C. Aquantitative real-time PCR (qPCR) analysis was performed with the ABI PRISM 7500sequence detection system (Applied Biosystems). Cycling conditions consisted of a 2minute hold at 50°C for uracilo-N-glycosylase degradation, 10 minute hold at 95°C forenzyme activation, 40 cycles of 15 second denaturation at 95°C, 1 minute annealing andelongation at 60°C. Relative quantification of triplicate samples was performed using thedelta-CT method and expressed as fold increase relative to ACTB.
Cytospin AnalysisCellular content of fluorescence activated cell sorting (FACS) derived CPC populations wasevaluated by counting, cytospin preparation and Wright-Giemsa staining as previouslydescribed [21]. Identification of cell types was done by visual inspection under 100×magnification and photomicrographs of cytospins were taken with an Olympus DP20 on anOlympus BX50 microscope.
MiceNOD/SCID mice, 6–8 weeks old, were housed according to protocols approved by theLaboratory Animal Research Facility and adhered strictly to National Institutes of Healthguidelines and protocols were approved by Indiana University Animal Care and Use Board.
Transplantation of NOD/SCID MiceAll animals were given a sub-lethal dose of 300cGy total body irradiation 4 hours beforetransplantation. The mPB CD34+ cells (105 per mouse), sortedCD31+CD34brightCD45dimAC133+ sub-population (i.e. CPCs) from mPB CD34+ cells (105
per mouse), or cells not contained in the CD31+CD34brightCD45dimAC133+ sort gate (i.e.non-CPCs) (2.5×10⁴ per mouse) were re-suspended in PBS and transplanted by tail veininjection. To assess engraftment, mice were sacrificed 8–12 weeks after transplantation andboth femurs were flushed with a total of 2×10⁶ cells collected and stained with anti-humanCD45 and CD34 antibodies. Approximately 500,000 events per sample were collected on aBD LSRII flow cytometer. Analysis was performed with FlowJo software version 8.7.3.
Determination of Human CPC Function in a Melanoma Xenograft ModelNOD.CB17-Prkdcscid/J (NOD/SCID) mice were subcutaneously injected with 2×10⁶ C32human melanoma cells (ATCC) and tumor growth monitored. Once tumors reached~50mm3, mice were injected with 5×10⁴ AC133+ CPCs, AC133− CPCs (non-CPCs), bulkCD34+ cells, or vehicle control (PBS). Tumor growth was monitored by caliper and thevolume determined by the following formula: mm3 = (width)2 × length × 0.5. The foldincrease in tumor growth was determined by comparing tumor volume over time to the baseline tumor volume. At the end of the experiment, mice were euthanized, tumors harvested,and the weight of each tumor determined. Data are presented as the mean±sem. Statisticalsignificance was determined using a 2-sided student’s t-test to calculate p values.
Estes et al. Page 5
Cytometry A. Author manuscript; available in PMC 2011 September 1.
NIH
-PA Author Manuscript
NIH
-PA Author Manuscript
NIH
-PA Author Manuscript

Statistical AnalysisStatistical analysis was performed using GraphPad Prism software, version 5.01 forWindows (GraphPad Software, San Diego, CA, USA). Data was tested for normality usingthe D’Agostino-Pearson normality test (alpha=0.05), and normal data sets were comparedusing two-tailed Student’s t test or one-way ANOVA.
RESULTSFrequency Analysis and Characterization of CD31+CD34brightCD45dimAC133+ cells (CPCs)
We performed a similar methodological comparison of the flow cytometry methods toenumerate the CD31+CD34brightCD45dimAC133+ putative CPCs [4,5,12,14,22]. We initiallyisolated PB MNC samples from 10 healthy, young adult volunteers and stained the cellswith the six monoclonal antibodies (CD34, CD45, CD31, AC133, glyA, and CD14) and theviability marker (ViViD) with ‘fluorescence minus one’ (FMO) controls or isotype controlsas described [4,14]. Stained samples were acquired on a digital BD LSRII flow cytometerand assessed for CD31+CD34brightCD45dimAC133+ (CPCs) events using two differentanalysis schemas as shown in Figure 1. First, stained MNCs were analyzed in conventionallogarithmic dot plots (Fig. 1a–d) [4] and CPC identification was determined by placement ofpopulation gates, which were based on isotype controls exactly as previously described forconventional flow cytometry (Fig. 1a–d) [4]. Data were manually compensated using singlystained cell controls as reported [4]. In contrast, MNCs from the same donor were analyzedin bi-exponential contour plots to identify CD31+CD34brightCD45dimAC133+ cells afterexclusion of contaminating monocytes, red blood cells (RBCs) and dead cells (Fig. 1e–i)[14]. Prior to analysis, automated compensation was applied based on single-color beadcontrols. To objectively identify CPCs, regional gates were applied based on the use ofproper FMO gating controls as previously described [14].
To compare the reproducibility and margin of error between the two methods, PB MNCswere harvested, and CPCs were identified utilizing the methods outlined in Figure 1. Insamples analyzed using the four-antibody panel and logarithmic dot plots (Fig. 1a–d),0.290±0.218% (mean±s.d., n=10, range 0.170–0.900) of gated MNCs wereCD31+CD34brightCD45dimAC133+. In comparison, when cell preparations from the samedonors were analyzed using bi-exponential contour plots and FMO gating controls with theexclusion of monocytes, RBCs, and dead/apoptotic cells (Fig. 1e–i),CD31+CD34brightCD45dimAC133+ cells constituted only 0.134±0.0347% (mean±s.d., n=10,range 0.0800–0.200; logarithmic method vs. bi-exponential method, p=0.0380 by two-tailed,unpaired Student’s t test) of viable glyA−CD14− cells. Examination of Figure 1g reveals adistinct CD31+CD34brightCD45dimAC133− population that is nearly indistinguishable fromthe neighboring CD31+CD34brightCD45dimAC133+ population in Figure 1b. Exclusion ofthe unwanted myelo-erythroid events, the use of contour plots and bi-exponential display fordata depiction, and selection of an antigen panel for maximal resolution of dull populationshas culminated in the enhanced resolution depicted in Figure 1g, facilitating the detection ofpreviously unreported heterogeneity within the putative CPC population [14]. Moreover,Figure 1c depicts a CD45bright population (dark blue) due to monocyte and dead cellcontamination that has been eliminated in the equivalent PFC plot (Fig. 1h). FMO gatingcontrol analysis provides the only objective means of distinguishing between a broadnegative population and an adjacent dull positive subset and in this case, confirms thevisually apparent demarcation of AC133 expression [14]. The combined frequencies of theCD31+CD34brightCD45dimAC133− and CD31+CD34brightCD45dimAC133+ populationsillustrated in Figure 1g, confirm the observed frequency gated by conventional methodologyin Figure 1b, 0.310±0.024% (mean±s.d., n=10, range 0.270–0.400; logarithmic method vs.bi-exponential method, p=0.7973 by two-tailed, unpaired Student’s t test). To confirm the
Estes et al. Page 6
Cytometry A. Author manuscript; available in PMC 2011 September 1.
NIH
-PA Author Manuscript
NIH
-PA Author Manuscript
NIH
-PA Author Manuscript
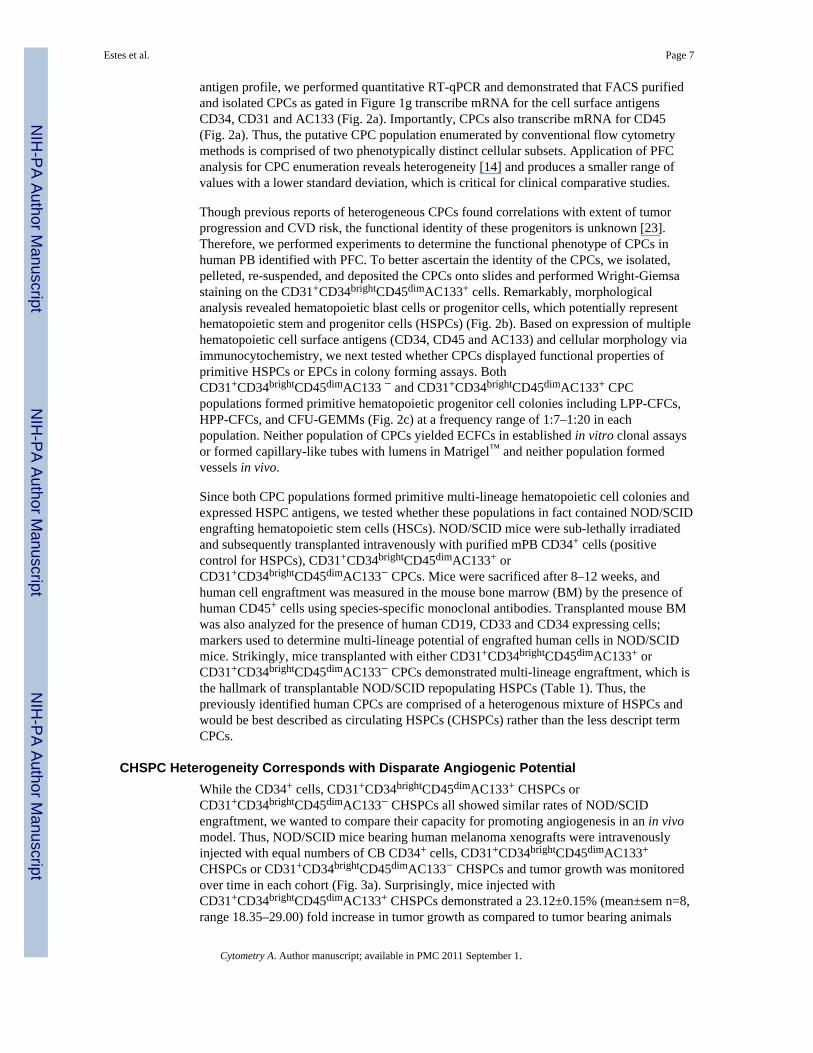
antigen profile, we performed quantitative RT-qPCR and demonstrated that FACS purifiedand isolated CPCs as gated in Figure 1g transcribe mRNA for the cell surface antigensCD34, CD31 and AC133 (Fig. 2a). Importantly, CPCs also transcribe mRNA for CD45(Fig. 2a). Thus, the putative CPC population enumerated by conventional flow cytometrymethods is comprised of two phenotypically distinct cellular subsets. Application of PFCanalysis for CPC enumeration reveals heterogeneity [14] and produces a smaller range ofvalues with a lower standard deviation, which is critical for clinical comparative studies.
Though previous reports of heterogeneous CPCs found correlations with extent of tumorprogression and CVD risk, the functional identity of these progenitors is unknown [23].Therefore, we performed experiments to determine the functional phenotype of CPCs inhuman PB identified with PFC. To better ascertain the identity of the CPCs, we isolated,pelleted, re-suspended, and deposited the CPCs onto slides and performed Wright-Giemsastaining on the CD31+CD34brightCD45dimAC133+ cells. Remarkably, morphologicalanalysis revealed hematopoietic blast cells or progenitor cells, which potentially representhematopoietic stem and progenitor cells (HSPCs) (Fig. 2b). Based on expression of multiplehematopoietic cell surface antigens (CD34, CD45 and AC133) and cellular morphology viaimmunocytochemistry, we next tested whether CPCs displayed functional properties ofprimitive HSPCs or EPCs in colony forming assays. BothCD31+CD34brightCD45dimAC133 − and CD31+CD34brightCD45dimAC133+ CPCpopulations formed primitive hematopoietic progenitor cell colonies including LPP-CFCs,HPP-CFCs, and CFU-GEMMs (Fig. 2c) at a frequency range of 1:7–1:20 in eachpopulation. Neither population of CPCs yielded ECFCs in established in vitro clonal assaysor formed capillary-like tubes with lumens in Matrigel™ and neither population formedvessels in vivo.
Since both CPC populations formed primitive multi-lineage hematopoietic cell colonies andexpressed HSPC antigens, we tested whether these populations in fact contained NOD/SCIDengrafting hematopoietic stem cells (HSCs). NOD/SCID mice were sub-lethally irradiatedand subsequently transplanted intravenously with purified mPB CD34+ cells (positivecontrol for HSPCs), CD31+CD34brightCD45dimAC133+ orCD31+CD34brightCD45dimAC133− CPCs. Mice were sacrificed after 8–12 weeks, andhuman cell engraftment was measured in the mouse bone marrow (BM) by the presence ofhuman CD45+ cells using species-specific monoclonal antibodies. Transplanted mouse BMwas also analyzed for the presence of human CD19, CD33 and CD34 expressing cells;markers used to determine multi-lineage potential of engrafted human cells in NOD/SCIDmice. Strikingly, mice transplanted with either CD31+CD34brightCD45dimAC133+ orCD31+CD34brightCD45dimAC133− CPCs demonstrated multi-lineage engraftment, which isthe hallmark of transplantable NOD/SCID repopulating HSPCs (Table 1). Thus, thepreviously identified human CPCs are comprised of a heterogenous mixture of HSPCs andwould be best described as circulating HSPCs (CHSPCs) rather than the less descript termCPCs.
CHSPC Heterogeneity Corresponds with Disparate Angiogenic PotentialWhile the CD34+ cells, CD31+CD34brightCD45dimAC133+ CHSPCs orCD31+CD34brightCD45dimAC133− CHSPCs all showed similar rates of NOD/SCIDengraftment, we wanted to compare their capacity for promoting angiogenesis in an in vivomodel. Thus, NOD/SCID mice bearing human melanoma xenografts were intravenouslyinjected with equal numbers of CB CD34+ cells, CD31+CD34brightCD45dimAC133+
CHSPCs or CD31+CD34brightCD45dimAC133− CHSPCs and tumor growth was monitoredover time in each cohort (Fig. 3a). Surprisingly, mice injected withCD31+CD34brightCD45dimAC133+ CHSPCs demonstrated a 23.12±0.15% (mean±sem n=8,range 18.35–29.00) fold increase in tumor growth as compared to tumor bearing animals
Estes et al. Page 7
Cytometry A. Author manuscript; available in PMC 2011 September 1.
NIH
-PA Author Manuscript
NIH
-PA Author Manuscript
NIH
-PA Author Manuscript

treated with CD31+CD34brightCD45dimAC133− CHSPCs (7.20±0.15% mean±sem n=8,range 5.31–9.87), the parental population of CD34+ cells (5.98±0.23% mean±sem n=8,range 4.99–7.59) and PBS control (9.17±0.14% mean±sem n=8, range 5.30–11.96; AC133+
CHSPCs vs. PBS, p=0.001 by two-tailed, unpaired Student’s t test). When the explantedtumors were removed from the host mice in each cohort and weighed, animals injected withthe CD31+CD34brightCD45dimAC133+ CHSPCs tumors were significantly heavier(0.89±0.04g mean±sem n=8) than the tumors removed from animals that were injected withPBS (0.51±0.06g mean±sem n=8) or CD34+ cells (0.53±0.06g mean±sem n=8; AC133+
CHSPCs vs. PBS or CD34+ cells, p<0.001) (Fig. 3b). Furthermore, it was apparent that theanimals injected with the CD31+CD34brightCD45dimAC133+ CHSPCs displayed a greatertumor vasculature that may be the most plausible explanation for the enhanced tumorvolume measured in this group of animals. Though the transplantedCD31+CD34brightCD45dimAC133+ CHSPCs promoted tumor angiogenesis and tumorgrowth, we found no evidence of human CD31, CD33 or CD34 expressing cells/endothelium in the murine tumor vessels. Thus, CD31+CD34brightCD45dimAC133+
CHSPCs are pro-angiogenic and accelerate tumor growth in a statistically significantmanner and are functionally distinct from the non-angiogenicCD31+CD34brightCD45dimAC133− CHSPCs. Moreover, lineage phenotyping of pro-angiogenic and non-angiogenic CHSPCs revealed further heterogeneity (Fig. 3c). Pro-angiogenic CHSPCs expressed a preponderance of myeloid cell surface markers (CD11b,CD13, CD33) while the non-angiogenic CHSPCs displayed more lymphoid cell surfacemarkers (CD3, CD4, CD7, CD10, CD56) (Fig. 3c). This data demonstrates that both pro-angiogenic and non-angiogenic CHSPCs are not ECFCs or CPCs with endothelial potentialbut are comprised of hematopoietic progenitor cells, myeloblasts, and HSCs with NOD/SCID repopulating ability.
Ratio of Circulating Progenitor Subsets Denotes Disease State in Peripheral ArterialDisease Patients
The disparate angiogenic potential of the two CHSPC subsets (as functionally determined inthe tumor xenograft model) observed within the putative CPC population led us tohypothesize that these two progenitor fractions may regulate different aspects of vascularhomeostasis. To test this hypothesis, we measured the frequency of the pro-angiogenicCHSPCs versus the non-angiogenic CHSPCs in a patient population with vasculardysfunction leading to PAD. In patients with diagnosed PAD we have identified asignificant decrease in the ratio of pro-angiogenic CHSPCs to non-angiogenic CHSPCs(0.79±0.16050% mean±sem, n=9, range 0.140–1.52) as compared to age and gendermatched control subjects (1.81±0.09433% mean±sem, n=9, range 1.231–2.130; healthy vs.PAD, p=0.0001 by two-tailed, unpaired Student’s t test) (Fig. 4a–c). Interestingly, patientswith PAD and healthy controls were indistinguishable when the total CHSPC population(CD31+CD34brightCD45dimAC133+/−) was enumerated and compared. These data suggestthat future studies to define biologic changes in the pro-angiogenic fraction of CHSPCs maybe informative as to deficiencies they may exhibit in vascular repair in subjects with PAD.
DISCUSSIONA PFC protocol [14] was utilized to isolate certain putative hematopoietic subsets nowfound to be comprised of CHSPCs which are defined by cell surface antigen expression,colony assay, morphologic analysis, and in vivo function. The circulating hematopoieticcells identified are validated herein as cells that function in neoangiogenesis and serve aspotential biomarkers of CVD or tumor progression. Another reported protocol for CPCenumeration that correlates with tumor progression risk is now clarified to identifyhematopoietic progenitor cells, myeloblasts and engrafting HSCs [4]. Thus, we present data
Estes et al. Page 8
Cytometry A. Author manuscript; available in PMC 2011 September 1.
NIH
-PA Author Manuscript
NIH
-PA Author Manuscript
NIH
-PA Author Manuscript

that provides an analytical method for enumerating circulating blood cells that participate innew blood vessel formation at homeostasis and in subjects with abnormal cardiovascularhealth.
Confusion around the function of, EPCs, circulating endothelial progenitors (CEPs), andCPCs in vascular repair and regeneration at homeostasis or in response to injury or disease islinked to lack of consensus regarding quantitative measures to isolate each cell type using invitro colony assays, immunomagnetic separation (IMS), or conventional flow cytometryapproaches [11,24,25]. More recently, the heterogeneous nature of EPC populations (toinclude non-endothelial precursors) has been recognized (reviewed in [24]) and an evenbroader term, CPC, is now used to encompass circulating cells with pro-angiogenic activity[4,26]. Use of the term CPC, without functional validation of the cell types comprising thisfraction has not been helpful in understanding the mechanisms of cellular action purportedto emerge from these flow cytometry “events”. It is widely recognized that a new approachin defining the parameters and properties of cells involved in neoangiogenesis is required forthe field to make advancements in clinical treatments [12].
Many different proposals for using conventional flow cytometry approaches to identifyEPCs, and CPCs are published (reviewed in [24]). The CPC population identified using theconventional flow cytometry approach [4] and the novel CHSPC population isolated usingthe PFC protocol [14] are now demonstrated to be comprised of hematopoietic cells atdifferent stages of differentiation. All observed cells belong to the HSPC pool, a significantproportion of which display in vitro hematopoietic colony forming cell activity and othersengraft in immunodeficient mice. Hematopoietic cells are known to participate inangiogenesis [27]. Consistent with their biological function, it is not surprising then thatincreased concentrations of CPCs correlate with risk for tumor recurrence and patientresponsiveness to anti-angiogenic therapies [23].
Use of the PFC protocol has permitted a clear distinction between CHSPCs with pro-angiogenic function and those lacking in angiogenic supportive activity, based upon AC133expression[14]. AC133 is proposed as a marker for circulating EPCs and has been used incombination with CD34 and/or CD31 and/or KDR as a biomarker in patients with CVD,cancer, sepsis, or renal failure [28,29]. The PFC approach [14] permits isolation of CHSPCsubsets based upon AC133 expression and only the CD31+CD34brightCD45dimAC133+
CHSPC subset possesses pro-angiogenic activity in promoting angiogenesis and humanmelanoma tumor growth in an immunodeficient mouse explant model system. Thisparticular CHSPC subset was enriched in cells displaying a variety of myeloid cell surfaceantigens in addition to displaying in vitro and in vivo HSPC functions. This subset did notdisplay any vasculogenic ability in vivo when examined for the presence of humanendothelium within the explanted human tumors within the immunodeficient mice. Thus, thepro-angiogenic CHSPC appears to be enriched in pro-angiogenic functions but lackspostnatal vasculogenic activity. Future examination of these cells to identify the specificmolecular pathways for promoting tumor angiogenesis may be insightful and permit a betterunderstanding of mechanisms for blocking tumor angiogenesis. It will also be important tounderstand whether the CHSPCs are specifically recruited to the tumor site and differentiateinto myeloid cells such as Tie2+ monocytes that are known to promote tumor angiogenesis[10].
An interesting insight into the variance of circulating concentrations of pro-angiogenic andnon-angiogenic CHSPCs was observed in patients with PAD. A significant decrease in theratio of pro-angiogenic to non-angiogenic CHSPCs was measured in the bloodstream ofpatients with PAD as compared to healthy control subjects. Future studies to evaluatepotential differences in the gene expression and function of the CHSPCs in normal subjects
Estes et al. Page 9
Cytometry A. Author manuscript; available in PMC 2011 September 1.
NIH
-PA Author Manuscript
NIH
-PA Author Manuscript
NIH
-PA Author Manuscript

and those with PAD at various stages of their disease may permit a new insight into whetheror not this cell population contributes to PAD disease progression.
In summary our PFC method has now been shown to identify subsets of circulating cells inhuman PB which promote angiogenesis. Use of this method for prospective identification ofthese cells should facilitate human clinical studies and functional biological characteristicsof each defined cellular subset.
Supplementary MaterialRefer to Web version on PubMed Central for supplementary material.
AcknowledgmentsWe thank Janice Walls for her expert administrative assistance in preparation of this article. We acknowledge theassistance and state-of-the-art facilities from Sue Rice at the Flow Cytometry Core at the Indiana University SimonCancer Center. Grant support: NIH P50 NS052606 (D.A.I.); Department of Defense NF073122 (D.A.I.); RileyChildren’s Foundation (D.A.I.)
Abbreviations
PFC polychromatic flow cytometry
EPC endothelial progenitor cell
CPC circulating progenitor cell
ECFC endothelial colony forming cell
CFU-Hill colony forming unit – Hill
CHSPCs circulating hematopoietic stem and progenitor cell
BM bone marrow
CFU-GEMM colony forming unit – granulocyte erythroid macrophage megakaryocyte
PB peripheral blood
CB cord blood
mPB mobilized peripheral blood
PAD peripheral artery disease
CAD coronary artery disease
COPD chronic obstructive pulmonary disease
PBS phosphate buffered saline
MNC mononuclear cells
FBS fetal bovine serum
PMT photomultiplier tube
IL-1α interleukin 1 alpha
M-CSF macrophage-colony stimulating factor
SCF stem cell factor
LPP-CFC low proliferative potential-colony forming cells
HPP-CFC high proliferative potential-colony forming cells
Estes et al. Page 10
Cytometry A. Author manuscript; available in PMC 2011 September 1.
NIH
-PA Author Manuscript
NIH
-PA Author Manuscript
NIH
-PA Author Manuscript

RT-qPCR real time quantitative polymerase chain reaction
FACS fluorescence activated cell sorting
FMO fluorescence minus one
RBC red blood cell
HSPC hematopoietic stem and progenitor cell
CEP circulating endothelial progenitor
IMS immunomagnetic separation
References1. Baumgarth N, Roederer M. A practical approach to multicolor flow cytometry for
immunophenotyping. J Immunol Methods. 2000; 243(1–2):77–97. [PubMed: 10986408]2. Herzenberg LA, Tung J, Moore WA, Herzenberg LA, Parks DR. Interpreting flow cytometry data: a
guide for the perplexed. Nat Immunol. 2006; 7(7):681–5. [PubMed: 16785881]3. Perfetto SP, Chattopadhyay PK, Roederer M. Seventeen-colour flow cytometry: unravelling the
immune system. Nat Rev Immunol. 2004; 4(8):648–55. [PubMed: 15286731]4. Duda DG, Cohen KS, Scadden DT, Jain RK. A protocol for phenotypic detection and enumeration
of circulating endothelial cells and circulating progenitor cells in human blood. Nat Protoc. 2007;2(4):805–810. [PubMed: 17446880]
5. Urbich C, Dimmeler S. Endothelial progenitor cells: characterization and role in vascular biology.Circ Res. 2004; 95(4):343–53. [PubMed: 15321944]
6. Case J, Mead LE, Bessler WK, Prater D, White HA, Saadatzadeh MR, Bhavsar JR, Yoder MC,Haneline LS, Ingram DA. Human CD34+AC133+VEGFR-2+ cells are not endothelial progenitorcells but distinct, primitive hematopoietic progenitors. Exp Hematol. 2007; 35(7):1109–18.[PubMed: 17588480]
7. Rehman J, Li J, Orschell CM, March KL. Peripheral blood “endothelial progenitor cells” are derivedfrom monocyte/macrophages and secrete angiogenic growth factors. Circulation. 2003; 107(8):1164–9. [PubMed: 12615796]
8. Roederer M. Spectral compensation for flow cytometry: visualization artifacts, limitations, andcaveats. Cytometry. 2001; 45(3):194–205. [PubMed: 11746088]
9. Rohde E, Malischnik C, Thaler D, Maierhofer T, Linkesch W, Lanzer G, Guelly C, Strunk D. Bloodmonocytes mimic endothelial progenitor cells. Stem Cells. 2006; 24(2):357–67. [PubMed:16141361]
10. De Palma M, Venneri MA, Galli R, Sergi Sergi L, Politi LS, Sampaolesi M, Naldini L. Tie2identifies a hematopoietic lineage of proangiogenic monocytes required for tumor vessel formationand a mesenchymal population of pericyte progenitors. Cancer Cell. 2005; 8(3):211–26. [PubMed:16169466]
11. Bertolini F, Shaked Y, Mancuso P, Kerbel RS. The multifaceted circulating endothelial cell incancer: towards marker and target identification. Nat Rev Cancer. 2006; 6(11):835–45. [PubMed:17036040]
12. Kerbel RS. Tumor angiogenesis. N Engl J Med. 2008; 358(19):2039–49. [PubMed: 18463380]13. Parks DR, Roederer M, Moore WA. A new “Logicle” display method avoids deceptive effects of
logarithmic scaling for low signals and compensated data. Cytometry A. 2006; 69A(6):541–51.[PubMed: 16604519]
14. Estes ML, Mund JA, Ingram DA, Case J. Identification of endothelial cells and progenitor cellsubsets in human peripheral blood. Curr Protoc Cytom. Chapter 9(Unit 9):33, 1–11.
15. Mahnke YD, Roederer M. Optimizing a multicolor immunophenotyping assay. Clin Lab Med.2007; 27(3):469–85. v. [PubMed: 17658403]
Estes et al. Page 11
Cytometry A. Author manuscript; available in PMC 2011 September 1.
NIH
-PA Author Manuscript
NIH
-PA Author Manuscript
NIH
-PA Author Manuscript

16. Tung JW, Heydari K, Tirouvanziam R, Sahaf B, Parks DR, Herzenberg LA, Herzenberg LA.Modern flow cytometry: a practical approach. Clin Lab Med. 2007; 27(3):453–68. v. [PubMed:17658402]
17. Collino CJ, Jaldin-Fincati JR, Chiabrando GA. Statistical criteria to establish optimal antibodydilution in flow cytometry analysis. Cytometry B Clin Cytom. 2007; 72B(3):223–6. [PubMed:17420983]
18. Perfetto SP, Ambrozak D, Nguyen R, Chattopadhyay P, Roederer M. Quality assurance forpolychromatic flow cytometry. Nat Protoc. 2006; 1(3):1522–30. [PubMed: 17406444]
19. Haneline LS, Marshall KP, Clapp DW. The highest concentration of primitive hematopoieticprogenitor cells in cord blood is found in extremely premature infants. Pediatr Res. 1996; 39(5):820–5. [PubMed: 8726235]
20. Ingram DA, Mead LE, Tanaka H, Meade V, Fenoglio A, Mortell K, Pollok K, Ferkowicz MJ,Gilley D, Yoder MC. Identification of a novel hierarchy of endothelial progenitor cells utilizinghuman peripheral and umbilical cord blood. Blood. 2004; 104(9):2752–60. [PubMed: 15226175]
21. Mucenski ML, McLain K, Kier AB, Swerdlow SH, Schreiner CM, Miller TA, Pietryga DW, ScottWJ Jr, Potter SS. A functional c-myb gene is required for normal murine fetal hepatichematopoiesis. Cell. 1991; 65(4):677–89. [PubMed: 1709592]
22. Bertolini F, Paul S, Mancuso P, Monestiroli S, Gobbi A, Shaked Y, Kerbel RS. Maximumtolerable dose and low-dose metronomic chemotherapy have opposite effects on the mobilizationand viability of circulating endothelial progenitor cells. Cancer Res. 2003; 63(15):4342–6.[PubMed: 12907602]
23. Duda DG, Jain RK, Willett CG. Antiangiogenics: the potential role of integrating this noveltreatment modality with chemoradiation for solid cancers. J Clin Oncol. 2007; 25(26):4033–42.[PubMed: 17827451]
24. Hirschi KK, Ingram DA, Yoder MC. Assessing identity, phenotype, and fate of endothelialprogenitor cells. Arterioscler Thromb Vasc Biol. 2008; 28(9):1584–95. [PubMed: 18669889]
25. Widemann A, Sabatier F, Arnaud L, Bonello L, Al-Massarani G, Paganelli F, Poncelet P, Dignat-George F. CD146-based immunomagnetic enrichment followed by multiparameter flowcytometry: a new approach to counting circulating endothelial cells. J Thromb Haemost. 2008;6(5):869–76. [PubMed: 18284598]
26. Chavakis E, Urbich C, Dimmeler S. Homing and engraftment of progenitor cells: a prerequisite forcell therapy. J Mol Cell Cardiol. 2008; 45(4):514–22. [PubMed: 18304573]
27. Popa ER, Harmsen MC, Tio RA, van der Strate BW, Brouwer LA, Schipper M, Koerts J, DeJongste MJ, Hazenberg A, Hendriks M, van Luyn MJ. Circulating CD34+ progenitor cellsmodulate host angiogenesis and inflammation in vivo. J Mol Cell Cardiol. 2006; 41(1):86–96.[PubMed: 16780869]
28. Khan SS, Solomon MA, McCoy JP Jr. Detection of circulating endothelial cells and endothelialprogenitor cells by flow cytometry. Cytometry B Clin Cytom. 2005; 64B(1):1–8. [PubMed:15668988]
29. Peichev M, Naiyer AJ, Pereira D, Zhu Z, Lane WJ, Williams M, Oz MC, Hicklin DJ, Witte L,Moore MA, Rafii S. Expression of VEGFR-2 and AC133 by circulating human CD34(+) cellsidentifies a population of functional endothelial precursors. Blood. 2000; 95(3):952–8. [PubMed:10648408]
Estes et al. Page 12
Cytometry A. Author manuscript; available in PMC 2011 September 1.
NIH
-PA Author Manuscript
NIH
-PA Author Manuscript
NIH
-PA Author Manuscript

Figure 1. Frequency analysis of CD31+CD34brightCD45dimAC133+ cellsTwo strategies for frequency analysis of CD31+CD34brightCD45dimAC133+ cells from aficoll MNC preparation of PB stained with the six-antibody/viability panel are shown. In thefirst strategy (a–d), manually compensated data collected on a digital flow cytometer werevisualized in plots with logarithmic scaling. MNCs (red gate in a) were identified on a FSC/SSC plot and sub-gated onto a bi-variant antigen plot to identify CD34brightAC133+ cells(dark blue gate in b). CD34brightAC133+ MNCs were further sub-gated to identify theCD45dim sub-population (light blue gate in c). CD31 expression on the resultingCD34brightCD45dimAC133+ MNCs was confirmed on a CD31 histogram (d). In the firststrategy (a–d), gate boundaries were set using Boolean gating and negative isotype controls.In the second strategy (e–i), uncompensated data was collected on a digital flow cytometer,compensated after acquisition by using software, and visualized in plots with bi-exponentialscaling. MNCs (red gate in a) were identified on FSC/SSC plot and then CD14− cells(orange gate in e) were identified. All CD14− cells were then assessed for viability and glyAexpression (f). CD14−glyA−ViViD− cells (pink gate in f) were sub-gated onto a bi-variantantigen plot to identify CD14−glyA−ViViD−CD34brightAC133+ cells (dark blue gate in g).Viable CD14−glyA−CD34brightAC133+ cells are further sub-gated to identify the CD45dim
sub-population (light blue gate in h). CD31 expression on the resulting viableCD14−glyA−CD34brightCD45dimAC133+ cells was confirmed on a CD31 histogram (i). Inthe second strategy (e–i), FMO gating controls were used to set gate boundaries.
Estes et al. Page 13
Cytometry A. Author manuscript; available in PMC 2011 September 1.
NIH
-PA Author Manuscript
NIH
-PA Author Manuscript
NIH
-PA Author Manuscript

Figure 2. Characterization of CD31+CD34brightCD45dimAC133+ cells(a) Semi-quantitative RT-PCR analysis of CD34, CD45, CD31 and AC133 expression in PBMNCs (■) and sorted CD31+CD34brightCD45dimAC133+ cells (□). (b) Representativephotomicrographs of cytospin from FACS CD31+CD34brightCD45dimAC133+ cells stainedwith Wright-Giemsa. Original magnification, 100×. (c) Representative photomicrographs ofCFU-GEMM colonies derived from culture of sorted PB CD31+CD34brightCD45dimAC133+
cells plated in CFU-GEMM colony assays. Scale bar represents 200μm. For allcharacterization assays, similar results were seen in 3 independent experiments using cellsfrom different donors.
Estes et al. Page 14
Cytometry A. Author manuscript; available in PMC 2011 September 1.
NIH
-PA Author Manuscript
NIH
-PA Author Manuscript
NIH
-PA Author Manuscript

Figure 3. CPC heterogeneity corresponds with disparate angiogenic potential and lineagemarkers(a) Intravenous injection of purified CPCs results in significant increases in melanomaxenograft growth. NOD/SCID mice bearing human melanoma xenografts wereintravenously injected with CD31+CD34brightCD45dimAC133+ CPCs,CD31+CD34brightCD45dimAC133− CPCs, bulk CD34+ cells or PBS control (n=8 per cohort)and tumor growth monitored over time in each cohort. The fold increase in tumor growthwas determined by comparing tumor volume over time to base line tumor volume.*p<0.001, CD31+CD34brightCD45dimAC133+ CPC versusCD31+CD34brightCD45dimAC133−CPC, CD34 or PBS control. (b) At the end of the study,tumors from each cohort of mice were harvested and weighed. *p<0.001,CD31+CD34brightCD45dimAC133+ CPC versus bulk CD34+ cells or PBS control. (c)CD31+CD34brightCD45dimAC133+ CPCs (■) and CD31+CD34brightCD45dimAC133− CPCs(□) were assessed for percent expression of lymphoid (CD3, CD4, CD7, CD8, CD10, CD19and CD45RA) and myeloid lineage markers (CD11b, CD13, CD33 and CD71).
Estes et al. Page 15
Cytometry A. Author manuscript; available in PMC 2011 September 1.
NIH
-PA Author Manuscript
NIH
-PA Author Manuscript
NIH
-PA Author Manuscript
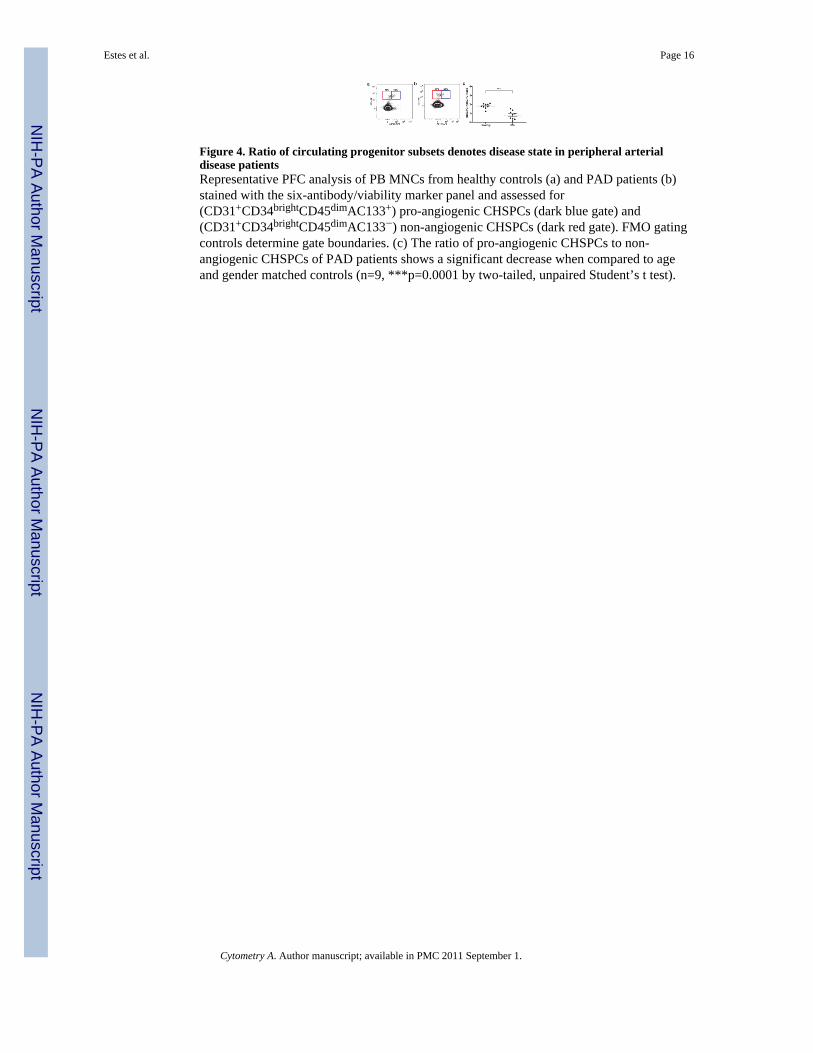
Figure 4. Ratio of circulating progenitor subsets denotes disease state in peripheral arterialdisease patientsRepresentative PFC analysis of PB MNCs from healthy controls (a) and PAD patients (b)stained with the six-antibody/viability marker panel and assessed for(CD31+CD34brightCD45dimAC133+) pro-angiogenic CHSPCs (dark blue gate) and(CD31+CD34brightCD45dimAC133−) non-angiogenic CHSPCs (dark red gate). FMO gatingcontrols determine gate boundaries. (c) The ratio of pro-angiogenic CHSPCs to non-angiogenic CHSPCs of PAD patients shows a significant decrease when compared to ageand gender matched controls (n=9, ***p=0.0001 by two-tailed, unpaired Student’s t test).
Estes et al. Page 16
Cytometry A. Author manuscript; available in PMC 2011 September 1.
NIH
-PA Author Manuscript
NIH
-PA Author Manuscript
NIH
-PA Author Manuscript

NIH
-PA Author Manuscript
NIH
-PA Author Manuscript
NIH
-PA Author Manuscript
Estes et al. Page 17
Table 1
Engraftment analysis of NOD/SCID mice transplanted with mPB CD34+ cells, sorted CPCs or sorted non-CPCs.
% CD45+% of CD45+ cells that are
CD34+% of CD45+ cells that are
CD33+% of CD45+ cells that are
CD19+
CPC Mouse 1 6.00 10.7 12.9 14.4
CPC Mouse 2 4.12 18.6 12.6 17.4
CPC Mouse 3 4.78 9.22 13.2 14.2
non-CPC Mouse 1 6.03 10.9 15.7 17.3
non-CPC Mouse 2 6.85 12.0 15.3 16.7
mPB CD34+ Mouse 1 4.66 15.5 15.6 13.8
mPB CD34+ Mouse 2 4.35 15.2 13.2 14.1
mPB CD34+ Mouse 3 3.74 22.3 19.7 27.2
mPB CD34+ Mouse 4 3.83 11.3 16.1 18.5
Cytometry A. Author manuscript; available in PMC 2011 September 1.
Copyright © 2022 FDOKUMEN